Texture of Rotary-Friction-Welded from Dissimilar Medium ...
Upload
khangminh22Category
view
2download
0
U.S. International Trade CommissionPublication 5175 April 2021
Washington, DC 20436
Standard Steel Welded Wire Mesh from Mexico
Investigation No. 701-TA-653 (Final)

U.S. International Trade Commission
COMMISSIONERS
Jason E. Kearns, Chair Randolph J. Stayin, Vice Chair
David S. Johanson Rhonda K. Schmidtlein
Amy A. Karpel
Catherine DeFilippo
Staff assigned
Address all communications to Secretary to the Commission
United States International Trade Commission Washington, DC 20436
Director of Operations
Julie Duffy, Investigator Tyler Berard, Investigator
Karl Tsuji, Industry Analyst Pamela Davis, Economist Zahra Bekkal, Accountant Charles Yost, Accountant
Cynthia Payne, Statistician John Henderson, Attorney
Douglas Corkran, Supervisory Investigator

U.S. International Trade CommissionWashington, DC 20436
www.usitc.gov
Publication 5175 April 2021
Standard Steel Welded Wire Mesh from Mexico
Investigation No. 701-TA-653 (Final)

CONTENTS Page
i
Determination ............................................................................................................................... 1 Views of the Commission ............................................................................................................. 3
Introduction ................................................................................................................ I‐1
Background ............................................................................................................................. I‐1
Statutory criteria ..................................................................................................................... I‐2
Organization of report ............................................................................................................. I‐4
Market summary ..................................................................................................................... I‐4
Summary data and data sources ............................................................................................. I‐5
Previous and related investigations ......................................................................................... I‐5
Nature and extent of subsidies and sales at LTFV .................................................................... I‐9
Subsidies .............................................................................................................................. I‐9
Sales at LTFV ...................................................................................................................... I‐10
The subject merchandise ....................................................................................................... I‐11
Commerce’s scope ............................................................................................................. I‐11
Tariff treatment ................................................................................................................. I‐15
The product ........................................................................................................................... I‐17
Description and applications ............................................................................................. I‐17
Manufacturing processes................................................................................................... I‐24
Domestic like product issues ................................................................................................. I‐26
Physical characteristics and uses ....................................................................................... I‐28
Interchangeability .............................................................................................................. I‐28
Channels of distribution ..................................................................................................... I‐29
Customer and producer perceptions ................................................................................. I‐30
Manufacturing facilities and production employees ......................................................... I‐30
Price ................................................................................................................................... I‐32

CONTENTS Page
ii
Part II: Conditions of competition in the U.S. market........................................................... II-1
U.S. market characteristics....................................................................................................... II-1
U.S. purchasers ......................................................................................................................... II-2
Channels of distribution ........................................................................................................... II-3
Geographic distribution ........................................................................................................... II-3
Supply and demand considerations ......................................................................................... II-4
U.S. supply ............................................................................................................................ II-4
U.S. demand ......................................................................................................................... II-7
Substitutability issues ............................................................................................................. II-10
Lead times .......................................................................................................................... II-11
Knowledge of country sources ........................................................................................... II-11
Factors affecting purchasing decisions............................................................................... II-11
Comparisons of domestic products, subject imports, and nonsubject imports ................ II-15
Comparison of U.S.-produced and imported standard wire mesh .................................... II-16
Elasticity estimates ................................................................................................................. II-18
U.S. supply elasticity ........................................................................................................... II-18
U.S. demand elasticity ........................................................................................................ II-18
Substitution elasticity ......................................................................................................... II-19
Part III: U.S. producers’ production, shipments, and employment ...................................... III-1
U.S. producers ......................................................................................................................... III-1
U.S. production, capacity, and capacity utilization ................................................................. III-7
Alternative products .......................................................................................................... III-13
U.S. producers’ U.S. shipments and exports ......................................................................... III-15
U.S. producers’ inventories ................................................................................................... III-18
U.S. producers’ imports and purchases ................................................................................ III-19
U.S. employment, wages, and productivity .......................................................................... III-22

CONTENTS Page
iii
Part IV: U.S. imports, apparent U.S. consumption, and market shares ............................... IV-1
U.S. importers.......................................................................................................................... IV-1
U.S. imports ............................................................................................................................. IV-2
Negligibility .............................................................................................................................. IV-7
Apparent U.S. consumption and U.S. market shares .............................................................. IV-8
Part V: Pricing data ............................................................................................................. V-1
Factors affecting prices ............................................................................................................ V-1
Raw material costs ............................................................................................................... V-1
Transportation costs to the U.S. market .............................................................................. V-3
U.S. inland transportation costs ........................................................................................... V-4
Pricing practices ....................................................................................................................... V-4
Pricing methods .................................................................................................................... V-4
Sales terms and discounts .................................................................................................... V-5
Price leadership .................................................................................................................... V-5
Price data .................................................................................................................................. V-6
Price trends ......................................................................................................................... V-19
Price comparisons .............................................................................................................. V-20
Lost sales and lost revenue .................................................................................................... V-22

CONTENTS Page
iv
Part VI: Financial experience of U.S. producers .................................................................. VI-1
Background .............................................................................................................................. VI-1
Operations on standard wire mesh ........................................................................................ VI-1
Net sales ............................................................................................................................ VI-13
Cost of goods sold and gross profit or loss ........................................................................ VI-15
SG&A expenses and operating income or loss .................................................................. VI-20
All other expenses and net income or loss ....................................................................... VI-20
Variance analysis ............................................................................................................... VI-21
Capital expenditures and research and development expenses .......................................... VI-21
Assets and return on assets .................................................................................................. VI-23
Capital and investment ......................................................................................................... VI-25
Threat considerations and information on nonsubject countries .......................... VII-1
The industry in Mexico ........................................................................................................... VII-3
Changes in operations ........................................................................................................ VII-4
Operations on standard wire mesh .................................................................................... VII-4
Alternative products ........................................................................................................... VII-7
Exports ................................................................................................................................ VII-9
U.S. inventories of imported merchandise .......................................................................... VII-11
U.S. importers’ outstanding orders ...................................................................................... VII-12
Antidumping or countervailing duty orders in third-country markets ................................ VII-12
Information on nonsubject countries .................................................................................. VII-12
CONTENTS Page
v
Appendixes
A. Federal Register notices .................................................................................................. A-1
B. List of hearing witnesses ................................................................................................. B-1
C. Summary data ................................................................................................................. C-1
D. U.S. producers’ comparisons of standard wire mesh and engineered wire mesh ......... D-1
E. Engineered wire mesh and standard wire mesh trade data .......................................... E-1
F. Engineered wire mesh and standard wire mesh financial data ..................................... F-1
G. U.S. purchasers identified in producer and importer customer identification lists ....... G-1
Note.—Information that would reveal confidential operations of individual concerns may not be published. Such information is identified by brackets in confidential reports and is deleted and replaced with asterisks (***) in public reports.


UNITED STATES INTERNATIONAL TRADE COMMISSION
Investigation No. 701‐TA‐653 (Final)
Standard Steel Welded Wire Mesh from Mexico
DETERMINATION
On the basis of the record1 developed in the subject investigation, the United States International Trade Commission (“Commission”) determines, pursuant to the Tariff Act of 1930 (“the Act”), that an industry in the United States is materially injured by reason of imports of standard steel welded wire mesh from Mexico, provided for in subheadings 7314.20.00 and 7314.39.00 of the Harmonized Tariff Schedule of the United States, that have been found by the U.S. Department of Commerce (“Commerce”) to be subsidized by the government of Mexico.2
BACKGROUND
The Commission instituted this investigation effective June 30, 2020, following receipt of petitions filed with the Commission and Commerce by Insteel Industries Inc., Mount Airy, North Carolina; Mid‐South Wire Company, Nashville, Tennessee; National Wire LLC, Conroe, Texas; Oklahoma Steel & Wire Co., Madill, Oklahoma; and Wire Mesh Corp., Houston, Texas. The Commission scheduled the final phase of the investigation following notification of a preliminary determination by Commerce that imports of standard steel welded wire mesh from Mexico were being subsidized within the meaning of section 703(b) of the Act (19 U.S.C. 1671b(b)). Notice of the scheduling of the final phase of the Commission’s investigation and of a public hearing to be held in connection therewith was given by posting copies of the notice in the Office of the Secretary, U.S. International Trade Commission, Washington, DC, and by publishing the notice in the Federal Register of December 16, 2020 (85 FR 81487). In light of the restrictions on access to the Commission building due to the COVID–19 pandemic, the
1 The record is defined in § 207.2(f) of the Commission’s Rules of Practice and Procedure (19 CFR 207.2(f)).
2 85 FR 78124 (December 3, 2020).
1

Commission conducted its hearing through written testimony and video conference on February 12, 2021. All persons who requested the opportunity were permitted to participate.
2

3
Views of the Commission
Based on the record in the final phase of this investigation, we determine that an industry in the United States is materially injured by reason of imports of standard steel welded wire mesh (“standard wire mesh”) from Mexico found by the U.S. Department of Commerce (“Commerce”) to be subsidized by the government of Mexico.
I. Background
Parties to the Investigation. Insteel Industries, Inc. (“Insteel”), Mid-South Wire Company (“Mid-South”), National Wire LLC (“National”), Oklahoma Steel & Wire Co. (“Oklahoma Steel”), and Wire Mesh Corp. (“WMC”), domestic producers of standard wire mesh, filed petitions on June 30, 2020, seeking imposition of antidumping and countervailing duties on imports of standard wire mesh from Mexico. The investigation schedules became staggered when Commerce did not align its countervailing duty investigation with its antidumping duty investigation.1 As a result, the Commission must make an earlier determination in the countervailing duty investigation than in the antidumping duty investigation. Pursuant to the statutory provision on staggered investigations, the record for each of these investigations will be the same except that prior to the Commission’s determination in the antidumping duty investigation, the Commission shall include in the record the final Commerce dumping determinations and the parties’ final comments concerning those determinations.2
Representatives of petitioners appeared at the hearing accompanied by counsel.3 Petitioners also submitted prehearing and posthearing briefs and final comments.
One respondent group participated actively in the final phase of this investigation. Representatives and counsel for Deacero S.A.P.I. de C.V., a Mexican producer and exporter of standard wire mesh, and Deacero USA, Inc., a U.S. importer of standard wire mesh, appeared at
1 Confidential Report INV-TT-034 (“CR”) at I-9 n.8 (Mar. 5, 2021), Public Report (“PR”) at I-9 n.8.
Commerce will align antidumping and countervailing duty investigations filed on the same day and for the same product when the petitioner requests such an alignment. See 19 U.S.C. § 1671d (a)(1); see also 19 C.F.R. § 351.210(b)(4)(i). Petitioners did not request an alignment of these investigations. Compare Standard Steel Welded Wire Mesh From Mexico: Preliminary Affirmative Determination of Sales at Less Than Fair Value, Postponement of Final Determination, and Extension of Provisional Measures, 86 Fed. Reg. 7710, 7712 (Feb. 1, 2021) (“Commerce Preliminary AD Determination”) with Standard Steel Welded Wire Mesh From Mexico: Preliminary Affirmative Countervailing Duty Determination, 85 Fed. Reg. 78124 (Dec. 3, 2020).
2 See 19 U.S.C. 1677(7)(G)(iii). Commerce is currently scheduled to issue its final determinations no later than June 16, 2021. See Commerce Preliminary AD Determination, 86 Fed. Reg. at 7712.
3 In light of the restrictions on access to the Commission building due to the COVID-19 pandemic, the Commission conducted its hearing through a video teleconference held on February 12, 2021, as set forth in procedures provided to the parties on February 8, 2021 (EDIS Document No. 733279).
4
the hearing accompanied by counsel and submitted prehearing and posthearing briefs and final comments.
Data Coverage. U.S. industry data are based on questionnaire responses of one former
producer and eleven current producers that accounted for a large majority of U.S. production of standard wire mesh during 2019.4 U.S. import data are based on questionnaire responses of six U.S. importers, accounting for a large majority of U.S. imports of standard wire mesh from Mexico in 2019.5 Data concerning the subject industry are based on questionnaire responses from four Mexican producers/exporters that accounted for *** of Mexican production of standard wire mesh in 2019 as well as *** exports of standard wire mesh to the United States from Mexico in 2019.6
II. Domestic Like Product
A. In General
In determining whether an industry in the United States is materially injured or threatened with material injury by reason of imports of subject merchandise, the Commission first defines the “domestic like product” and the “industry.”7 Section 771(4)(A) of the Tariff Act of 1930, as amended (“the Tariff Act”), defines the relevant domestic industry as the “producers as a whole of a domestic like product, or those producers whose collective output of a domestic like product constitutes a major proportion of the total domestic production of the product.”8 In turn, the Tariff Act defines “domestic like product” as “a product which is like, or in the absence of like, most similar in characteristics and uses with, the article subject to an investigation.”9
By statute, the Commission’s “domestic like product” analysis begins with the “article subject to an investigation,” i.e., the subject merchandise as determined by Commerce.10 Therefore, Commerce’s determination as to the scope of the imported merchandise that is subsidized and/or sold at less than fair value is “necessarily the starting point of the Commission’s like product analysis.”11 The Commission then defines the domestic like product
4 CR/PR at I-5, III-1. 5 CR/PR at I-5, IV-1. 6 CR/PR at I-5 VII-3. 7 19 U.S.C. § 1677(4)(A). 8 19 U.S.C. § 1677(4)(A). 9 19 U.S.C. § 1677(10). 10 19 U.S.C. § 1677(10). The Commission must accept Commerce’s determination as to the
scope of the imported merchandise that is subsidized and/or sold at less than fair value. See, e.g., USEC, Inc. v. United States, 34 Fed. App’x 725, 730 (Fed. Cir. 2002) (“The ITC may not modify the class or kind of imported merchandise examined by Commerce.”); Algoma Steel Corp. v. United States, 688 F. Supp. 639, 644 (Ct. Int’l Trade 1988), aff’d, 865 F.3d 240 (Fed. Cir.), cert. denied, 492 U.S. 919 (1989).
11 Cleo Inc. v. United States, 501 F.3d 1291, 1298 (Fed. Cir. 2007); see also Hitachi Metals, Ltd. v. (Continued...)
5
in light of the imported articles Commerce has identified.12 The decision regarding the appropriate domestic like product(s) in an investigation is a factual determination, and the Commission has applied the statutory standard of “like” or “most similar in characteristics and uses” on a case-by-case basis.13 No single factor is dispositive, and the Commission may consider other factors it deems relevant based on the facts of a particular investigation.14 The Commission looks for clear dividing lines among possible like products and disregards minor variations.15
B. Product Description
Commerce defined the scope of the imported merchandise under investigation as follows:
(…Continued) United States, Case No. 19-1289, slip op. at 8-9 (Fed. Circ. Feb. 7, 2020) (the statute requires the Commission to start with Commerce’s subject merchandise in reaching its own like product determination).
12 Cleo, 501 F.3d at 1298 n.1 (“Commerce’s {scope} finding does not control the Commission’s {like product} determination.”); Hosiden Corp. v. Advanced Display Mfrs., 85 F.3d 1561, 1568 (Fed. Cir. 1996) (the Commission may find a single like product corresponding to several different classes or kinds defined by Commerce); Torrington Co. v. United States, 747 F. Supp. 744, 748–52 (Ct. Int’l Trade 1990), aff’d, 938 F.2d 1278 (Fed. Cir. 1991) (affirming the Commission’s determination defining six like products in investigations where Commerce found five classes or kinds).
13 See, e.g., Cleo Inc. v. United States, 501 F.3d 1291, 1299 (Fed. Cir. 2007); NEC Corp. v. Department of Commerce, 36 F. Supp. 2d 380, 383 (Ct. Int’l Trade 1998); Nippon Steel Corp. v. United States, 19 CIT 450, 455 (1995); Torrington Co. v. United States, 747 F. Supp. 744, 749 n.3 (Ct. Int’l Trade 1990), aff’d, 938 F.2d 1278 (Fed. Cir. 1991) (“every like product determination ‘must be made on the particular record at issue’ and the ‘unique facts of each case’”). The Commission generally considers a number of factors, including the following: (1) physical characteristics and uses; (2) interchangeability; (3) channels of distribution; (4) customer and producer perceptions of the products; (5) common manufacturing facilities, production processes, and production employees; and, where appropriate, (6) price. See Nippon, 19 CIT at 455 n.4; Timken Co. v. United States, 913 F. Supp. 580, 584 (Ct. Int’l Trade 1996).
14 See, e.g., S. Rep. No. 96-249 at 90-91 (1979). 15 Nippon, 19 CIT at 455; Torrington, 747 F. Supp. at 748-49; see also S. Rep. No. 96-249 at 90-91
(Congress has indicated that the like product standard should not be interpreted in “such a narrow fashion as to permit minor differences in physical characteristics or uses to lead to the conclusion that the product and article are not ‘like’ each other, nor should the definition of ‘like product’ be interpreted in such a fashion as to prevent consideration of an industry adversely affected by the imports under consideration.”).

6
The scope of this investigation covers uncoated standard welded steel reinforcement wire mesh (wire mesh) produced from smooth or deformed wire. Subject wire mesh is produced in square and rectangular grids of uniformly spaced steel wires that are welded at all intersections. Sizes are specified by combining the spacing of the wires in inches or millimeters and the wire cross-sectional area in hundredths of square inch or millimeters squared. Subject wire mesh may be packaged and sold in rolls or in sheets.
Subject wire mesh is currently produced to ASTM specification A1064/A1064M, which covers carbon-steel wire and welded wire reinforcement, smooth and deformed, for concrete in the following seven styles:
1. 6X6 W1.4/W1.4 or D1.4/D1.4 2. 6X6 W2.1/W2.1 or D2.1/D2.1 3. 6X6 W2.9/W2.9 or D2.9/D2.9 4. 6X6 W4/W4 or D4/D4 5. 6X12 W4/W4 or D4/D4 6. 4X4 W2.9/W2.9 or D2.9/D2.9 7. 4X4 W4/W4 or D4/D4
The first number in the style denotes the nominal spacing between the longitudinal wires and the second number denotes the nominal spacing between the transverse wires. In the first style listed above, for example, “6 X 6” denotes a grid size of six inches by six inches. “W” denotes the use of smooth wire, and “D” denotes the use of deformed wire in making the mesh. The number following the W or D denotes the nominal cross-sectional area of the transverse and longitudinal wires in hundredths of a square inch (i.e., W1.4 or D1.4 is .014 square inches). Smooth wire is wire that has a uniform cross-sectional diameter throughout the length of the wire. Deformed wire is wire with indentations or raised transverse ribs, which results in wire that does not have a uniform cross-sectional diameter throughout the length of the wire. Rolls of subject wire mesh are produced in the following styles and nominal width and length combinations: Style: 6 X 6 W1.4/W1.4 or D1.4/D1.4 (i.e., 10 gauge) Roll Sizes: 5' X 50'
5' X 150' 6' X 150'

7
5' X 200' 7' X 200' 7.5' X 200'
Style: 6 X 6 W2.1/W2.1 or D2.1/D2.1 (i.e., 8 gauge) Roll Sizes: 5' X 150' Style: 6 X 6 W2.9/W2.9 or D2.9/D2.9 (i.e., 6 gauge) Roll Sizes: 5' X 150'
7' X 200' All rolled wire mesh is included in scope regardless of length. Sheets of subject wire mesh are produced in the following styles and nominal width and length combinations: Style: 6 X 6 W1.4/W1.4 or D1.4/D1.4 (i.e., 10 gauge) Sheet Size: 3'6" X 7'
4' X 7' 4' X 7'6" 5' X 10' 7' X 20' 7'6" X 20' 8' X 12'6" 8' X 15' 8' X 20'
Style: 6 X 6 W2.1/W2.1 or D2.1/D2.1 (i.e., 8 gauge) Sheet Size: 5' X 10'
7' X 20' 7'6" X 20' 8' X 12'6" 8' X 15' 8' X 20'
Style: 6 X 6 W2.9/W2.9 or D2.9/D2.9 (i.e., 6 gauge) Sheet Size: 3'6" X 20'
5' X 10' 7' X 20' 7'6" X 20' 8' X 12'6" 8' X 15' 8' X 20'
Style: 6 X 12 W4/W4 or D4/D4 (i.e., 4 gauge)

8
Sheet Size: 8' X 20'
Style: 4 X 4 W2.9/W2.9 or D2.9/D2.9 (i.e., 6 gauge) Sheet Size: 5' X 10'
7' X 20' 7'6" X 20' 8' X 12'6" 8' X 12'8" 8' X 15' 8' X 20'
Style: 4 X 4 W4/W4 or D4/D4 (i.e., 4 gauge) Sheet Size: 5' X 10'
8' X 12'6" 8' X 12'8" 8' X 15' 8' X 20'
Any product imported, sold, or invoiced in one of these size combinations is within the scope. ASTM specification A1064/A1064M provides for permissible variations in wire gauges, the spacing between transverse and longitudinal wires, and the length and width combinations. To the extent a roll or sheet of welded wire mesh falls within these permissible variations, it is within this scope. ASTM specification A1064/A1064M also defines permissible oversteeling, which is the use of a heavier gauge wire with a larger cross-sectional area than nominally specified. It also permits a wire diameter tolerance of ± 0.003 inches for products up to W5/D5 and ± 0.004 for sizes over W5/D5. A producer may oversteel by increasing smooth or deformed wire diameter up to two whole number size increments on Table 1 of A1064. Subject wire mesh has the following actual wire diameter ranges, which account for both oversteeling and diameter tolerance: W/D No. Maximum
Oversteeling No. Diameter Range (inch)
1.4 (i.e., 10 gauge) 3.4 0.093 to 0.211 2.1 (i.e., 8 gauge) 4.1 0.161 to 0.231 2.9 (i.e., 6 gauge) 4.9 0.189 to 0.253 4.0 (i.e., 4 gauge) 6.0 0.223 to 0.280 To the extent a roll or sheet of welded wire mesh falls within the permissible variations provided above, it is within this scope.

9
In addition to the tolerances permitted in ASTM specification A1064/A1064M, wire mesh within this scope includes combinations where:
1. A width and/or length combination varies by ± one grid size in any direction, i.e., ± 6 inches in length or width where the wire mesh's grid size is “6 X 6”; and/or
2. The center-to-center spacing between individual wires may vary by
up to one quarter of an inch from the nominal grid size specified.
Length is measured from the ends of any wire and width is measured between the center-line of end longitudinal wires. Additionally, although the subject wire mesh typically meets ASTM A1064/ A1064M, the failure to include certifications, test reports or other documentation establishing that the product meets this specification does not remove the product from the scope. Wire mesh made to comparable foreign specifications (e.g., DIN, JIS, etc.) or proprietary specifications is included in the scope. Excluded from the scope is wire mesh that is galvanized (i.e., coated with zinc) or coated with an epoxy coating. In order to be excluded as galvanized, the excluded welded wire mesh must have a zinc coating thickness meeting the requirements of ASTM specification A641/A641M. Epoxy coating is a mix of epoxy resin and hardener that can be applied to the surface of steel wire. Merchandise subject to this investigation are classified under Harmonized Tariff Schedule of the United States (HTSUS) categories 7314.20.00000 and 7314.39.0000. While HTSUS subheadings are provided for convenience and customs purposes, the written description of the scope of this investigation is dispositive.16
Standard wire mesh consists of longitudinal and transverse steel wires of uniform size that are welded together at the perpendicular intersections to form grids of uniform dimensions throughout the sheet or roll. The input material for standard wire mesh is low-carbon steel wire rod that is drawn or rolled down to the required wire size. Standard wire mesh is ultimately sold as sheets or rolls to end users in the construction, agricultural, horticultural, industrial, mining, transportation, and other industries. With its strong and stable
16 Standard Steel Welded Wire Mesh From Mexico: Final Affirmative Countervailing Duty
Determination, 86 Fed. Reg. 10034, 10036-37 (Feb. 18, 2021).

10
structure, standard wire mesh is utilized for internal reinforcement and framing of concrete construction in these industries. 17
The first sentence of Commerce’s scope definition states that it covers “uncoated standard welded steel reinforcement wire mesh,” indicating that the scope does not include engineered wire mesh. Commerce’s decision memorandum accompanying its final determination in the countervailing duty investigation rejected Deacero’s argument that Commerce should amend the scope definition explicitly to exclude engineered wire mesh from the scope. The decision memorandum stated that Deacero’s proposed amendments were “unnecessary, redundant, and in some cases, counterproductive to the effectiveness of the order that may result from this investigation,” adding that “{n}o party to this investigation disagrees that engineered wire mesh is excluded from the scope.”18
In the preliminary determinations, the Commission defined a single domestic like product consisting of standard wire mesh coextensive with the scope. Respondents argued that the Commission should consider in any final phase of these investigations whether the domestic like product should include engineered wire mesh products outside the scope definition. In the preliminary determinations, the Commission assessed whether to include engineered wire mesh in the domestic like product based on the available data, which it acknowledged in some respects were limited, and declined to do so. The Commission found that notwithstanding some general overlap between engineered wire mesh and standard wire mesh in terms of physical characteristics, the record overall indicated clear dividing lines in terms of end uses, production process and facilities in the United States, channels of distribution, and producer and customer perceptions.19
C. Arguments of the Parties
Petitioners’ Arguments. Petitioners argue that the Commission should define the domestic like product to consist of standard wire mesh, contending that there are clear dividing lines between standard wire mesh and engineered wire mesh with respect to each of the six like product factors.20 They assert that standard wire mesh has a uniform grid size and uniform wire sizes whereas engineered wire mesh does not. They contend that standard wire mesh is used in lightweight building and construction applications to prevent concrete from cracking, while engineered wire mesh is used in primary reinforcement applications and has load-bearing
17 CR/PR at I-17 to I-20. 18 Issues and Decision Memorandum for the Final Determination of the Countervailing Duty
Investigation of Standard Steel Wire Mesh from Mexico, February 10, 2021, Department of Commerce memorandum from James Maeder to Christian Marsh at 17 (EDIS Document No. 735646) (“Commerce Decision Memorandum”).
19 Standard Steel Welded Wire Mesh from Mexico, Inv. Nos. 701-TA-653 and 731-TA-1527 (Preliminary), USITC Pub. 5109 at 10-12 (Aug. 2020) (“Preliminary Determinations”).
20 Petitioners’ Prehearing Brief at 4-14; Petitioners’ Posthearing Brief at 15, and Exh. 1, Response to Commissioner Questions, at 46-59.

11
characteristics.21 Petitioners contend that it is undisputed that standard wire mesh and engineered wire mesh are not interchangeable.22 They state that nearly all standard wire mesh is sold to distributors, while the substantial majority of engineered wire mesh is sold to end users.23 Petitioners argue that the production processes, equipment, and production employees for standard wire mesh and engineered wire mesh are different.24 They contend that U.S. producers and purchasers perceive standard wire mesh and engineered wire mesh to be separate products.25 Petitioners state that engineered wire mesh is more costly to produce and higher priced than standard wire mesh.26
Respondents’ Arguments. Respondents argue that the Commission should define a single domestic like product that includes out-of-scope engineered steel wire mesh as well as in-scope standard wire mesh. They assert that, despite some differences, there is overlap between engineered wire mesh and standard wire mesh with respect to all six of the Commission’s like product factors such that the products represent a continuum.27 They assert that standard wire mesh and engineered wire mesh share similar physical characteristics, generally meet the same ASTM specifications, and are used for the same functional purpose of reinforcing concrete for standard building and construction applications. They acknowledge that because of its customized nature, engineered wire mesh is not usually used interchangeably with standard wire mesh, but assert that this limited interchangeability is not dispositive and also exists with respect to different styles and sizes of standard wire mesh.28 Respondents contend that engineered wire mesh and standard wire mesh have overlapping channels of distribution, stating that while engineered wire mesh is typically sold directly to end-users and standard wire mesh to distributors, both types of mesh are sold to both end users and distributors and are offered for sale by U.S. producers on the same brochures and websites.29 Respondents assert that customers and producers perceive both types of mesh to be within the same category of wire mesh products used in construction and structural applications. They state that standard wire mesh and engineered wire mesh share manufacturing facilities, production processes, and production employees, although they acknowledge slight differences in manufacturing equipment (e.g., standard wire mesh is
21 Petitioners’ Prehearing Brief at 7; Petitioners’ Posthearing Brief, Exh.1, Response to
Commissioner Questions, at 48-50. 22 Petitioners’ Prehearing Brief at 8; Petitioners’ Posthearing Brief, Exh. 1, Response to
Commissioner Questions, at 50. 23 Petitioners’ Prehearing Brief at 8-9; Petitioners’ Posthearing Brief, Exh. 1, Response to
Commissioner Questions, at 49-50. 24 Petitioners’ Prehearing Brief at 9-10; Petitioners’ Posthearing Brief, Exh. 1, Response to
Commissioner Questions, at 47-50. 25 Petitioners’ Prehearing Brief at 6, 10; Petitioners’ Posthearing Brief, Exh. 1, Response to
Commissioner Questions, at 50. 26 Petitioners’ Prehearing Brief at 11; Petitioners’ Posthearing Brief, Exh. 1, Response to
Commissioner Questions, at 50. 27 Respondents’ Prehearing Brief at 35-41; Respondents’ Posthearing Brief at 14-15. 28 Respondents’ Prehearing Brief at 36-38. 29 Respondents’ Prehearing Brief at 38-39.

12
produced using higher-speed machines). Respondents acknowledge that engineered wire mesh tends to be more expensive than standard wire mesh on average, but state that there is a broad range of pricing among all wire mesh.30
D. Domestic Like Product Analysis
Based on the record, we define a single domestic like product consisting of standard wire mesh that is coextensive with Commerce’s scope.
Physical Characteristics and Uses. Engineered wire mesh shares some characteristics with standard wire mesh, including assembly from steel wires welded together in a grid pattern and compliance with ASTM International (“ASTM”) industry standard A1064 or equivalent specifications.31 However, there are differences in physical characteristics, in that engineered wire mesh often consists of non-uniform or heavier wires, non-uniform grid sizes, or longer or broader sheet dimensions.32
While standard wire mesh and engineered wire mesh are both used in construction projects and concrete reinforcement, there are differences in their end uses. Standard wire mesh is used in construction projects to control concrete cracking, while engineered wire mesh is custom-tailored for specific applications as a primary reinforcement that has load-bearing characteristics, and thus has a structural purpose beyond controlling cracking.33
Manufacturing Facilities, Production Processes, and Employees. Standard wire mesh is produced from a single wire gauge with uniform grid spacing throughout the sheet or roll, and manufacturing it is therefore a high-speed and highly automated process. The high degree of product standardization enables standard wire mesh producers to set up their manufacturing machinery to produce common specification runs and stock standard wire mesh in inventory.34 By contrast, engineered wire mesh is custom-designed for specific end uses and customers, and therefore is less uniform in terms of wire gauges and sizing. Thus, the manufacturing process for engineered wire mesh is slower, less automated, and more labor-intensive than the process for standard wire mesh.35 Due to the different production processes and equipment involved, employees who produce engineered wire mesh require more training and different skills than those who operate standard wire mesh machinery.36
Seven domestic firms reported producing both standard wire mesh and engineered wire mesh, but *** of these firms, ***, reported being capable of producing engineered wire mesh and standard wire mesh with the same equipment and employees, subject to ***.37 *** U.S.
30 Respondents’ Prehearing Brief at 39-41. 31 CR/PR at I-19 to I-20. 32 CR/PR at I-20; Transcript of Hearing (“Hearing Tr.”) at 18-20 (Wagner). 33 CR/PR at I-21; Hearing Tr. at 20 (Wagner), 115-116 (Woltz). 34 CR/PR at I-24; Hearing Tr. at 18-19 (Wagner), 26-27 (Barrenechea). 35 CR/PR at I-20; Hearing Tr. at 19 (Wagner). 36 Hearing Tr. at 19 (Wagner). 37 CR/PR at I-20, I-30, III-13, Table I-6; Hearing Tr. at 19 (Wagner).

13
producers that manufacture both engineered wire mesh and standard wire mesh report that they cannot produce them using the same equipment and personnel.38
Channels of Distribution. The parties agree that engineered wire mesh, being a custom- designed product, is generally sold directly to end users rather than to distributors.39 By contrast, standard wire mesh is primarily sold to distributors that stock standard sizes.40 The vast majority (over 95 percent) of U.S. producers’ U.S. shipments of standard wire mesh during the January 2017-September 2020 period of investigation (“POI”) went to distributors, while a substantial majority (over *** percent) of U.S. producers’ U.S. shipments of engineered wire mesh went to end users.41 However, over *** percent of U.S. producers’ U.S. shipments of engineered wire mesh went to distributors during the POI, indicating some overlap with respect to this channel.42 A relatively small share (between *** and *** percent during each year and interim period of the POI) of U.S. producers’ U.S. shipments of standard wire mesh went to end users, indicating limited overlap with respect to this channel.43
Interchangeability. Petitioners and respondents agree that due to its customized nature, engineered wire mesh is generally not interchangeable with standard wire mesh.44
Producer and Customer Perceptions. The record indicates that producers and customers generally perceive standard wire mesh and engineered wire mesh to be different products, with different customers, and with domestic producers accordingly using different sales staffs and different sales practices for each.45 Petitioners note that a substantial percentage of standard wire mesh purchasers responding to the Commission’s questionnaire reported that they were not familiar with engineered wire mesh, which further indicates that the two are different products with different customers.46 While respondents have presented excerpts from websites and brochures of U.S. producers marketing both standard wire mesh and engineered wire mesh, a Deacero U.S.A. representative testified that standard wire mesh and engineered wire mesh sell to different channels with different types of purchasers for different types of projects.47 Furthermore, in its request to Commerce to exclude engineered wire mesh
38 CR/PR at I-29 to I-30, Tables I-6 and D-1. An Insteel witness testified that domestic producers do not produce standard wire mesh and engineered wire mesh on the same equipment or with the same employees. Hearing Tr. at 19 (Wagner).
39 CR/PR at I-20 to I-21; Hearing Tr.at 20-21 (Wagner); Respondents’ Prehearing Brief at 38. 40 CR/PR at I-28; Hearing Tr. at 20-21 (Wagner). 41 CR/PR at Table I-5. 42 CR/PR at Table I-5. 43 CR/PR at Table I-5. 44 CR/PR at I-27; Respondents’ Prehearing Brief at 38; Petitioners’ Prehearing Brief at 8; Hearing
Tr. at 21, 118 (Wagner), 119 (Barrenechea). 45 Hearing Tr. at 21 (Wagner). 46 Petitioners’ Prehearing Brief at 6. While 18 purchasers provided usable questionnaire
responses in this investigation, the questions on domestic like product factors with respect to engineered wire mesh and standard wire mesh elicited only five to seven purchaser responses, indicating that most purchasers were not knowledgeable about both products. See CR/PR at Tables I-4 and D-2, II-2.
47 Hearing Tr. at 199-200 (Abascal)

14
from the scope, Deacero argued that engineered wire mesh is custom made and designed for a specific project and customer, while standard wire mesh is considered an “off the shelf” product that is widely available and ordered by customers in specific styles and dimensions.48
Price. The parties agree that engineered wire mesh tends to be more expensive than standard wire mesh.49 During the POI, the average unit value (“AUV”) of U.S. producers’ U.S. shipments of engineered wire mesh was consistently higher than the AUV of their U.S. shipments of standard wire mesh, with the difference in the AUVs ranging between $*** and $*** per short ton, constituting a price premium for engineered wire mesh ranging from *** to *** percent over the period of investigation.50
Conclusion. We define the domestic like product to be standard wire mesh, coextensive with the scope. As the discussion above indicates, while engineered wire mesh and standard wire mesh are both assembled from steel wires welded together in a grid pattern and are produced to comply with common ASTM specifications, they have distinct physical characteristics and are used differently in construction projects. They are not interchangeable and engineered wire mesh is priced higher. There are also differences in the manufacturing processes due to engineered wire mesh being custom made, with the process for producing standard wire mesh being faster and more automated, and the process for engineered wire mesh being slower, less automated, more labor-intensive, and requiring greater training for workers to operate the machinery, and minimal overlap in manufacturing equipment and machinery. Finally, the record indicates that engineered wire mesh and standard wire mesh are generally perceived by producers and customers to be separate products with different customers.
Thus, the record indicates that, notwithstanding some overlap in physical characteristics and limited overlap in channels of distribution, there is a clear dividing line between standard wire mesh and engineered wire mesh. Accordingly, we define a single domestic like product that is coextensive with the scope and consisting of standard wire mesh.
III. Domestic Industry
The domestic industry is defined as the domestic “producers as a whole of a domestic like product, or those producers whose collective output of a domestic like product constitutes a major proportion of the total domestic production of the product.”51 In defining the domestic industry, the Commission’s general practice has been to include in the industry producers of all domestic production of the like product, whether toll-produced, captively consumed, or sold in the domestic merchant market.
48 See Commerce Decision Memorandum at 16-17 (summarizing Deacero’s argument) (EDIS
Document No. 735646). 49 Respondents’ Prehearing Brief at 40; Petitioners’ Prehearing Brief at 11; Hearing Tr. at 21
(Wagner). 50 CR/PR at Table I-7. 51 19 U.S.C. § 1677(4)(A).

15
We must determine whether any producer of the domestic like product should be excluded from the domestic industry pursuant to section 771(4)(B) of the Tariff Act. This provision allows the Commission, if appropriate circumstances exist, to exclude from the domestic industry producers that are related to an exporter or importer of subject merchandise or which are themselves importers.52 Exclusion of such a producer is within the Commission’s discretion based upon the facts presented in each investigation.53
Four domestic producers (***) are subject to the related parties provision because they imported subject merchandise during the POI. 54 Additionally, *** are related to exporters of subject merchandise.55 Petitioners argue that *** should be excluded from the domestic industry under the related parties provision, but that the other firms should not be excluded.56 Respondents argue that the circumstances do not warrant exclusion of *** from the domestic industry.57
We next consider whether appropriate circumstances exist to exclude any of the related party producers from the domestic industry.
***. *** accounted for *** percent of U.S. production of standard wire mesh in 2019, and was the *** largest of the 11 reporting U.S. producers that year in terms of U.S. production volume.58 It *** the petition.59 Its imports of subject merchandise during the POI were *** short tons in 2017, *** short tons in 2018, *** short tons in 2019, *** short tons in January-September (“interim”) 2019, and *** short tons in interim 2020.60 *** indicates that it
52 See Torrington Co. v. United States, 790 F. Supp. 1161, 1168 (Ct. Int’l Trade 1992), aff’d
without opinion, 991 F.2d 809 (Fed. Cir. 1993); Sandvik AB v. United States, 721 F. Supp. 1322, 1331-32 (Ct. Int’l Trade 1989), aff’d mem., 904 F.2d 46 (Fed. Cir. 1990); Empire Plow Co. v. United States, 675 F. Supp. 1348, 1352 (Ct. Int’l Trade 1987).
53 The primary factors the Commission has examined in deciding whether appropriate circumstances exist to exclude a related party include the following:
(1) the percentage of domestic production attributable to the importing producer; (2) the reason the U.S. producer has decided to import the product subject to investigation
(whether the firm benefits from the LTFV sales or subsidies or whether the firm must import in order to enable it to continue production and compete in the U.S. market);
(3) whether inclusion or exclusion of the related party will skew the data for the rest of the industry;
(4) the ratio of import shipments to U.S. production for the imported product; and (5) whether the primary interest of the importing producer lies in domestic production or
importation. Changzhou Trina Solar Energy Co. v. USITC, 100 F. Supp.3d 1314, 1326-31 (Ct. Int’l. Trade 2015); see also Torrington Co. v. United States, 790 F. Supp. at 1168.
54 CR/PR at III-19, Table III-10. 55 CR/PR at Tables III-2, VII-1; *** Foreign Producer Questionnaire Response at II-8, EDIS Doc.
***. 56 Petitioners’ Prehearing Brief at 15-17. 57 Respondents’ Posthearing Brief at 14, QR-30 to QR-31. 58 CR/PR at Table III-1. 59 CR/PR at Table III-1. 60 CR/PR at Table III-10.

16
imported subject merchandise because of ***.61 The ratio of its subject imports to U.S. production was *** percent in 2017, *** percent in 2018, *** percent in 2019, *** percent in interim 2019, and *** percent in interim 2020.62
This firm’s consistently low ratio of subject imports to domestic production indicates its primary interest is in domestic production. In light of this, we find that appropriate circumstances do not exist to exclude *** from the domestic industry as a related party.
***. *** accounted for *** percent of U.S. production of standard wire mesh in 2019, and it was the *** largest reporting U.S. producer that year.63 It is a petitioner in this investigation.64 It imported *** short tons of subject merchandise in 2018 and *** short tons in interim 2020.65 *** indicates that its imports were ***.66 The ratio of its subject imports to U.S. production was *** percent in 2018, *** percent in interim 2020, and zero during 2017 and 2019.67
In view of the fact that this firm’s importation of subject merchandise was small in relation to its domestic production, and occurred only in 2018 and interim 2020, we view its primary interest to be in domestic production. In light of this, we find that appropriate circumstances do not exist to exclude *** from the domestic industry as a related party.
***. *** accounted for *** percent of U.S. production of standard wire mesh in 2019, and was the *** largest of the reporting U.S. producers that year.68 It *** the petition.69 Its imports of subject merchandise during the POI were *** short tons in 2017, *** short tons in 2018, *** short tons in 2019, *** short tons in interim 2019, and *** short tons in interim 2020.70 *** indicates that its reason for importing was ***.71 The record indicates, however, that *** had *** reported unused capacity throughout the POI even though its production and capacity utilization *** overall during the POI.72 The ratio of its subject imports to U.S.
61 CR/PR at Table III-10. 62 CR/PR at Table III-10. *** U.S. production of wire mesh was *** short tons in 2017, *** short
tons in 2018, *** short tons in 2019, *** short tons in interim 2019, and *** short tons in interim 2020. Id.
63 CR/PR at Table III-1. 64 CR/PR at Table III-1. 65 CR/PR at Table III-10. 66 CR/PR at Table III-10. 67 CR/PR at Table III-10. *** U.S. production of wire mesh was *** short tons in 2018 and ***
short tons in interim 2020. Id. 68 CR/PR at Table III-1. 69 CR/PR at Table III-1. 70 CR/PR at Table III-10. 71 CR/PR at Table III-10. In a confidential declaration included with respondents’ posthearing
brief, a *** stated that ***. This could indicate that *** imports of subject merchandise allow it to compete in certain areas of the country in which it would not otherwise be positioned to compete. See Respondents’ Posthearing Brief, Exh. 20, Statement of *** of *** at Paragraph 4.
72 The firm’s capacity utilization rate was *** percent in 2017, *** percent in 2018, *** percent in 2019, *** percent in interim 2019, and *** percent in interim 2020. CR/PR at Table III-4. Its U.S. production of wire mesh was *** short tons in 2017, *** short tons in 2018, *** short tons in 2019, *** short tons in interim 2019, and *** short tons in interim 2020. Id. Its unused capacity was *** short (Continued...)

17
production was *** percent in 2017, *** percent in 2018, *** percent in 2019, *** percent in interim 2019, and *** percent in interim 2020.73 *** was the *** importer of subject merchandise in 2019, accounting for over *** percent of subject imports.74 It reported *** capital expenditures during the POI.75
The record indicates that *** had a high ratio of subject imports to domestic production (over *** percent in each calendar year and interim period during the POI) even though it had *** reported unused capacity. It was the *** importer of subject merchandise in 2019, and its imports of subject merchandise *** in each calendar year during the POI, and were *** in interim 2020 than in interim 2019. In light of these facts, we conclude that its primary interest is in importation of subject merchandise. We consequently find that appropriate circumstances exist to exclude *** from the domestic industry as a related party.
***. *** accounted for *** percent of U.S. production of standard wire mesh in 2019, and was the *** largest of the reporting U.S. producers that year.76 It is a petitioner in this investigation.77 Its imports of subject merchandise during the POI were *** short tons in 2017 and *** short tons in 2018.78 *** indicates that its imports were ***.79 The ratio of its subject imports to U.S. production was *** percent in 2017 and *** percent in 2018, and zero in 2019 and interim 2020.80
The firm’s *** ratio of subject imports to domestic production indicates that its primary interest is in domestic production. Consequently, we find that appropriate circumstances do not exist to exclude *** from the domestic industry as a related party.
In light of the foregoing and our definition of the domestic like product, we define one domestic industry consisting of all domestic producers of standard wire mesh except for ***.
IV. Material Injury by Reason of Subject Imports
Based on the record in the final phase of this investigation, we find that an industry inthe United States is materially injured by reason of subsidized imports of standard wire mesh from Mexico.
(…Continued) tons in 2017, *** short tons in 2018, *** short tons in 2019, *** short tons in interim 2019, and *** short tons in interim 2020. Derived from CR/PR at Table III-4.
73 CR/PR at Table III-10. 74 CR/PR at Table IV-1. *** parent company is ***, which accounted for *** percent of reported
exports from Mexico to the United States in 2019. Id. at Tables III-2, VII-1. 75 CR/PR at Table VI-5. 76 CR/PR at Table III-1. 77 CR/PR at Table III-1. 78 CR/PR at Table III-10. 79 CR/PR at Table III-10. 80 CR/PR at Table III-10. *** U.S. production of wire mesh was *** short tons in 2017 and ***
short tons in 2018. Id.

18
A. Legal Standards
In the final phase of antidumping and countervailing duty investigations, the Commission determines whether an industry in the United States is materially injured or threatened with material injury by reason of the imports under investigation.81 In making this determination, the Commission must consider the volume of subject imports, their effect on prices for the domestic like product, and their impact on domestic producers of the domestic like product, but only in the context of U.S. production operations.82 The statute defines “material injury” as “harm which is not inconsequential, immaterial, or unimportant.”83 In assessing whether the domestic industry is materially injured by reason of subject imports, we consider all relevant economic factors that bear on the state of the industry in the United States.84 No single factor is dispositive, and all relevant factors are considered “within the context of the business cycle and conditions of competition that are distinctive to the affected industry.”85
Although the statute requires the Commission to determine whether the domestic industry is “materially injured or threatened with material injury by reason of” unfairly traded imports,86 it does not define the phrase “by reason of,” indicating that this aspect of the injury analysis is left to the Commission’s reasonable exercise of its discretion.87 In identifying a causal link, if any, between subject imports and material injury to the domestic industry, the Commission examines the facts of record that relate to the significance of the volume and price effects of the subject imports and any impact of those imports on the condition of the domestic industry. This evaluation under the “by reason of” standard must ensure that subject imports are more than a minimal or tangential cause of injury and that there is a sufficient causal, not merely a temporal, nexus between subject imports and material injury.88
81 19 U.S.C. §§ 1671d(b), 1673d(b). 82 19 U.S.C. § 1677(7)(B). The Commission “may consider such other economic factors as are
relevant to the determination” but shall “identify each {such} factor ... and explain in full its relevance to the determination.” 19 U.S.C. § 1677(7)(B).
83 19 U.S.C. § 1677(7)(A). 84 19 U.S.C. § 1677(7)(C)(iii). 85 19 U.S.C. § 1677(7)(C)(iii). 86 19 U.S.C. §§ 1671d(b), 1673d(b). 87 Angus Chemical Co. v. United States, 140 F.3d 1478, 1484-85 (Fed. Cir. 1998) (“{T}he statute
does not ‘compel the commissioners’ to employ {a particular methodology}.”), aff’g, 944 F. Supp. 943, 951 (Ct. Int’l Trade 1996).
88 The Federal Circuit, in addressing the causation standard of the statute, observed that “{a}s long as its effects are not merely incidental, tangential, or trivial, the foreign product sold at less than fair value meets the causation requirement.” Nippon Steel Corp. v. USITC, 345 F.3d 1379, 1384 (Fed. Cir. 2003). This was further ratified in Mittal Steel Point Lisas Ltd. v. United States, 542 F.3d 867, 873 (Fed. Cir. 2008), where the Federal Circuit, quoting Gerald Metals, Inc. v. United States, 132 F.3d 716, 722 (Fed. Cir. 1997), stated that “this court requires evidence in the record ‘to show that the harm occurred “by reason of” the LTFV imports, not by reason of a minimal or tangential contribution to material harm caused by LTFV goods.’” See also Nippon Steel Corp. v. United States, 458 F.3d 1345, 1357 (Fed. Cir. 2006); Taiwan Semiconductor Industry Ass’n v. USITC, 266 F.3d 1339, 1345 (Fed. Cir. 2001).
19
In many investigations, there are other economic factors at work, some or all of which may also be having adverse effects on the domestic industry. Such economic factors might include nonsubject imports; changes in technology, demand, or consumer tastes; competition among domestic producers; or management decisions by domestic producers. The legislative history explains that the Commission must examine factors other than subject imports to ensure that it is not attributing injury from other factors to the subject imports, thereby inflating an otherwise tangential cause of injury into one that satisfies the statutory material injury threshold.89 In performing its examination, however, the Commission need not isolate the injury caused by other factors from injury caused by unfairly traded imports.90 Nor does the “by reason of” standard require that unfairly traded imports be the “principal” cause of injury or contemplate that injury from unfairly traded imports be weighed against other factors, such as nonsubject imports, which may be contributing to overall injury to an industry.91 It is clear that the existence of injury caused by other factors does not compel a negative determination.92
89 Uruguay Round Agreements Act Statement of Administrative Action (SAA), H.R. Rep. 103-316,
vol. I at 851-52 (1994) (“{T}he Commission must examine other factors to ensure that it is not attributing injury from other sources to the subject imports.”); S. Rep. 96-249 at 75 (1979) (the Commission “will consider information which indicates that harm is caused by factors other than less-than-fair-value imports.”); H.R. Rep. 96-317 at 47 (1979) (“in examining the overall injury being experienced by a domestic industry, the ITC will take into account evidence presented to it which demonstrates that the harm attributed by the petitioner to the subsidized or dumped imports is attributable to such other factors;” those factors include “the volume and prices of nonsubsidized imports or imports sold at fair value, contraction in demand or changes in patterns of consumption, trade restrictive practices of and competition between the foreign and domestic producers, developments in technology and the export performance and productivity of the domestic industry”); accord Mittal Steel, 542 F.3d at 877.
90 SAA at 851-52 (“{T}he Commission need not isolate the injury caused by other factors from injury caused by unfair imports.”); Taiwan Semiconductor Industry Ass’n, 266 F.3d at 1345 (“{T}he Commission need not isolate the injury caused by other factors from injury caused by unfair imports ... . Rather, the Commission must examine other factors to ensure that it is not attributing injury from other sources to the subject imports.” (emphasis in original)); Asociacion de Productores de Salmon y Trucha de Chile AG v. United States, 180 F. Supp. 2d 1360, 1375 (Ct. Int’l Trade 2002) (“{t}he Commission is not required to isolate the effects of subject imports from other factors contributing to injury” or make “bright-line distinctions” between the effects of subject imports and other causes.); see also Softwood Lumber from Canada, Inv. Nos. 701-TA-414 and 731-TA-928 (Remand), USITC Pub. 3658 at 100-01 (Dec. 2003) (Commission recognized that “{i}f an alleged other factor is found not to have or threaten to have injurious effects to the domestic industry, i.e., it is not an ‘other causal factor,’ then there is nothing to further examine regarding attribution to injury”), citing Gerald Metals, 132 F.3d at 722 (the statute “does not suggest that an importer of LTFV goods can escape countervailing duties by finding some tangential or minor cause unrelated to the LTFV goods that contributed to the harmful effects on domestic market prices.”).
91 S. Rep. 96-249 at 74-75; H.R. Rep. 96-317 at 47. 92 See Nippon Steel Corp., 345 F.3d at 1381 (“an affirmative material-injury determination under
the statute requires no more than a substantial-factor showing. That is, the ‘dumping’ need not be the sole or principal cause of injury.”).

20
Assessment of whether material injury to the domestic industry is “by reason of” subject imports “does not require the Commission to address the causation issue in any particular way” as long as “the injury to the domestic industry can reasonably be attributed to the subject imports.”93 The Commission ensures that it has “evidence in the record” to “show that the harm occurred ‘by reason of’ the LTFV imports,” and that it is “not attributing injury from other sources to the subject imports.” 94 The Federal Circuit has examined and affirmed various Commission methodologies and has disavowed “rigid adherence to a specific formula.”95
The question of whether the material injury threshold for subject imports is satisfied notwithstanding any injury from other factors is factual, subject to review under the substantial evidence standard.96 Congress has delegated this factual finding to the Commission because of the agency’s institutional expertise in resolving injury issues.97
93 Mittal Steel, 542 F.3d at 876 &78; see also id. at 873 (“While the Commission may not enter
an affirmative determination unless it finds that a domestic industry is materially injured ‘by reason of’ subject imports, the Commission is not required to follow a single methodology for making that determination ... {and has} broad discretion with respect to its choice of methodology.”) citing United States Steel Group v. United States, 96 F.3d 1352, 1362 (Fed. Cir. 1996) and S. Rep. 96-249 at 75. In its decision in Swiff-Train v. United States, 793 F.3d 1355 (Fed. Cir. 2015), the Federal Circuit affirmed the Commission’s causation analysis as comporting with the Court’s guidance in Mittal.
94 Mittal Steel, 542 F.3d at 873 (quoting from Gerald Metals, 132 F.3d at 722), 877-79. We note that one relevant “other factor” may involve the presence of significant volumes of price-competitive nonsubject imports in the U.S. market, particularly when a commodity product is at issue. In appropriate cases, the Commission collects information regarding nonsubject imports and producers in nonsubject countries in order to conduct its analysis.
95 Nucor Corp. v. United States, 414 F.3d 1331, 1336, 1341 (Fed. Cir. 2005); see also Mittal Steel, 542 F.3d at 879 (“Bratsk did not read into the antidumping statute a Procrustean formula for determining whether a domestic injury was ‘by reason’ of subject imports.”).
96 We provide in our discussion below a full analysis of other factors alleged to have caused any material injury experienced by the domestic industry.
97 Mittal Steel, 542 F.3d at 873; Nippon Steel Corp., 458 F.3d at 1350, citing U.S. Steel Group, 96 F.3d at 1357; S. Rep. 96-249 at 75 (“The determination of the ITC with respect to causation is ... complex and difficult, and is a matter for the judgment of the ITC.”).

21
B. Conditions of Competition and the Business Cycle98
The following conditions of competition inform our analysis of whether there is material injury by reason of subject imports.
1. Demand Considerations
U.S. demand for standard wire mesh depends on demand for the U.S.-produced downstream products in which it is used. Reported end uses for standard wire mesh include concrete reinforcement and residential and non-residential concrete construction.99 The majority of responding U.S. producers (8 of 10), importers (4 of 6), and purchasers (9 of 15) reported either an increase or no change in U.S. demand for standard wire mesh during the POI.100
Apparent U.S. consumption of standard wire mesh declined by *** percent between 2017 and 2019, falling from *** short tons in 2017 to *** short tons in 2018 and *** short tons in 2019. Apparent U.S. consumption was *** short tons in interim 2019 and increased to *** short tons, in interim 2020.101
98 Pursuant to Section 771(24) of the Tariff Act, imports from a subject country of merchandise
corresponding to a domestic like product that account for less than 3 percent of all such merchandise imported into the United States during the most recent 12 months for which data are available preceding the filing of the petition shall generally be deemed negligible. 1677(24)(A)(i). The exceptions to this general rule are not applicable here.
For the period of June 2019 to May 2020, the 12-month period preceding the filing of the petition, subject imports of standard wire mesh from Mexico accounted for *** percent of total imports by quantity. CR/PR at Table IV-4. Thus, subject imports from Mexico exceed the pertinent negligibility threshold, and we accordingly find that imports from Mexico are not negligible.
99 CR/PR at II-7. 100 CR/PR at Table II-4. No market participant reported a decrease in U.S. demand over the POI,
though some did report that demand fluctuated. Id. The parties agree that the COVID-19 pandemic did not cause demand for standard wire mesh to decline in 2020. Hearing Tr. at 30-31 (Barrenechea), 100-01 (Woltz), 129 (Guerra), 139-40 (Olmos), 189 (Abascal); Petitioners’ Prehearing Brief at 19.
101 CR/PR at IV-8 and Table IV-5. We note that the apparent consumption data include data provided by WMC reflecting U.S. shipments by U.S. producer Gerdau SA (“Gerdau”) in 2017. Gerdau operated a standard wire mesh production facility in 2017 and January 2018 in Beaumont, TX, which WMC acquired in 2018. While WMC’s own questionnaire response does not include production and shipment data for 2017 when the facility was operated by Gerdau, WMC did provide a partially completed questionnaire response containing trade and production data for Gerdau. CR/PR at III-1 n.1. Respondents argue that we should not consider the data for Gerdau supplied by WMC, contending that those data are unreliable and would skew the record because they do not include financial or pricing data. Respondents’ Posthearing Brief at QR-14 to QR-15; Respondents’ Final Comments at 1-2.
We disagree with respondents’ contentions and have included the Gerdau data supplied by WMC in the record and have considered it in our analysis. In particular, the Commission staff evaluated the data provided by WMC against other data in the record and staff estimates concerning Gerdau’s operations. Staff made a series of inquiries to Gerdau representatives for information to help evaluate the reliability, accuracy, and reasonableness of the data supplied by WMC. See emails by Commission (Continued...)

22
2. Supply Considerations
The domestic industry was the largest supplier of the U.S. market during the POI, followed by subject imports, and excluded U.S. producer ***. Nonsubject imports were present in the U.S. market in limited quantities during only part of the POI.
The domestic industry’s capacity increased by *** percent between 2017 and 2019, increasing from *** short tons in 2017 to *** short tons in 2018 and *** short tons in 2019; it was *** short tons in interim 2019 and lower, at *** short tons, in interim 2020.102 The reported capacity of the domestic industry was *** apparent U.S. consumption throughout the POI, and domestic producers had unused capacity throughout the POI.103
There were several developments in the domestic industry during the POI that affected capacity and production. Mid-South opened a wire mesh plant and began production in 2018.104 Keysteel ***.105 National bought a new wire mesh machine, which arrived in ***.106 Tree Island ***.107 WMC acquired Gerdau’s wire mesh facility in Beaumont, TX in January 2018
(…Continued) staff to Gerdau representatives on January 15, 19, and 24, 2021 and responses by Gerdau personnel (EDIS Document No. 732363). Based on this evaluation, we find the trade and production data for Gerdau for 2017 supplied by WMC reasonable and generally consistent with other information available in the record. In one instance, the data WMC supplied regarding Gerdau’s capacity in 2017 differed from an estimate Gerdau supplied, but staff used the data WMC provided because it was consistent with other record information. See CR/PR at Table III-4 note (***).
We note that the data for Gerdau fill gaps in the record that the Commission specifically identified in the preliminary determinations as causing a likely understatement of apparent U.S. consumption in 2017, a likely understatement of domestic capacity for 2017, and a likely overstatement of the increase in domestic capacity between 2017 and 2019. See Preliminary Determinations, USITC Pub. 5109 at 20 n.88 (apparent U.S. consumption) and n.90 (capacity), 26 n.131 (capacity); Confidential Preliminary Determinations at 24 nn.88 and 90, 31-32 n.131 (EDIS Document No. 718004). Inclusion of the data enhances the thoroughness and accuracy of our analysis of trends in apparent U.S. consumption, domestic capacity, production, and employment during the POI, even in the absence of pricing and financial data for Gerdau for 2017.
102 Table Alt C-1 (EDIS Document No. 736430). The domestic industry’s capacity increase between 2017 and 2019 reflects ***. CR/PR at III-7. The lower capacity in interim 2020 than in interim 2019 reflects a reduction in *** capacity due to ***. Id. at III-7 n.6.
103 Table Alt C-1 (EDIS Document No. 736430). 104 CR/PR at II-7; Table III-3; Petitioners’ Prehearing Brief, Exh.6, Declaration of John T. Johnson
of Mid-South, at Paragraphs 1, 3. 105 CR/PR at Table III-3. 106 CR/PR at Table III-3; Hearing Tr, at 32-33 (Fisher) 107 CR/PR at Table III-3.

23
and began its own production there in 2018.108 Domestic producers Insteel, National, WMC, *** all reported prolonged production shutdowns or curtailments during the POI.109
The domestic industry’s share of the U.S. market by quantity declined from *** percent in 2017 to *** percent in 2018 and *** percent in 2019; it was *** percent in interim 2019, and higher, at *** percent, in interim 2020.110
The market share of subject imports increased from *** percent in 2017 to *** percent in 2018 and *** percent in 2019; it was *** percent in interim 2019, and lower, at *** percent, in interim 2020.111
There were *** reported nonsubject imports in 2017 and 2018, while the market share of nonsubject imports was *** percent in 2019, *** percent in interim 2019, and lower, at less than *** percent, in interim 2020.112
One of eleven responding producers, two of six responding importers, and six of 17 responding purchasers reported supply constraints.113
3. Substitutability and Other Conditions
The record indicates that there is a high degree of substitutability between domestically produced standard wire mesh and standard wire mesh imported from Mexico.114 Both domestically produced standard wire mesh and subject imports are produced to meet the requirements of ASTM A1064/A1064M.115 A majority or plurality of responding purchasers reported that domestic product and subject imports were “comparable” with respect to each of
108 CR/PR at III-1 n.1, Table III-3; Hearing Tr. at 26 (Barrenechea). 109 Hearing Tr. at 25 (Wagner); 29 (Barrenechea); 33 (Fisher); CR/PR at Table III-3. Generally, the
domestic producers that reported prolonged shutdowns or curtailments reported that the shutdowns/curtailments were prompted by ***. CR/PR at Table III-3.
110 Table Alt C-1 (EDIS Document No. 736430). The market share of excluded U.S. producer *** was *** percent in 2017, *** percent in 2018, *** percent in 2019, *** percent in interim 2019, and *** percent in interim 2020. Id.
111 CR/PR at Table IV-5. Respondent Deacero S.A.P.I. de C.V. accounted for *** percent of total Mexican exports to the United States in 2019, while *** accounted for *** percent and *** accounted for *** percent. Id. at Table VII-1.
112 CR/PR at Table IV-5. 113 CR/PR at II-6. Importer/*** reported that in 2018, due to increased demand, it placed some
customers on allocation to manage its pipeline based on production and availability. U.S. producer/importer *** reported supply constraints due to availability and price. Purchaser *** reported that it has had to cancel a number of orders due to suppliers’ inability to provide timely delivery, especially for U.S.-produced standard wire mesh. Purchaser *** reported that the domestic industry had reliability issues since it accepted too many orders before price increases. Purchaser *** reported that in 2020, U.S. producers would not take orders. Purchaser *** reported that COVID-19 constrained supply, and *** reported that Mexican producer Deacero had COVID-related production issues. Id.
114 CR/PR at II-10. 115 CR/PR at I-17.

24
17 purchasing factors.116 Majorities of responding US producers, importers, and purchasers also reported that subject imports and the domestic like product are “always” or “frequently” interchangeable.117
We find that price is an important factor in purchasing decisions for standard wire mesh. Purchasers most frequently identified price (16 firms), availability (12 firms), and quality (four firms) as among the top three factors in their purchasing decisions; price was the factor purchasers most frequently cited as the most important factor.118 Out of 18 responding purchasers, 15 purchasers rated price as a very important factor.119 Moreover, 12 of 17 purchasers indicated that they always or usually purchased the lowest priced product.120
Raw materials are the largest component of the total cost of goods sold (“COGS”) for standard wire mesh. The primary input used in the production of standard wire mesh is low-carbon steel wire rod.121 Wire rod, as a share of the domestic industry’s COGS, increased from *** percent in 2017 to *** percent in 2018 and *** percent in 2019, and was *** percent in interim 2019 and lower, at *** percent, in interim 2020.122
All eight responding U.S. producers and three of five responding importers reported that raw material costs increased since January 1, 2017.123 Wire rod prices increased throughout 2017 and into 2018, decreased in the second half of 2018 and the first half of 2019, and fluctuated in 2020.124 In March 2018, certain imports of wire rod became subject to additional 25 percent ad valorem duties under Section 232 of the Trade Expansion of 1962 (“Section 232 tariffs”).125 Eight of 11 responding U.S. producers and four of six responding U.S. importers reported that raw material costs for standard wire mesh had increased since the imposition of the Section 232 tariffs.126
116 CR/PR at Table II-9. A majority of responding purchasers reported that domestic product and
subject imports were comparable with respect to 15 of these 17 factors, while a plurality of responding purchasers responded that they were comparable with respect to two factors (delivery time and reliability of supply). Id.
117 CR/PR at Table II-10. 118 CR/PR at Table II-6. Price was cited most frequently as the first-most important factor (eight
firms), followed by availability (five firms); price and availability were the most frequently reported second-most important factor (six firms each). Id.
119 CR/PR at Table II-7. 120 CR/PR at II-12. 121 CR/PR at I-17, V-1. 122 Derived from CR/PR at Table VI-1 and *** U.S. Producer Questionnaire Response (EDIS
Document No. ***). 123 CR/PR at V-1. 124 CR/PR at V-1 and Figure V-1. 125 19 U.S.C. § 1862. Section 232 tariffs or quota limits have been imposed on steel wire rod
imports from numerous sources since March 2018, but have not been imposed on imports of standard wire mesh. CR/PR at I-15.
126 CR/PR at V-3.

25
All responding U.S. producers and importers reported setting prices using transaction-by-transaction negotiations.127 U.S. producers and importers reported selling the vast majority of their standard wire mesh in the spot market, with a small share being sold through short-term contracts.128 Three U.S. producers and one importer reported that prices were not renegotiated or indexed to raw material costs in short-term contracts, while eight purchasers reported that wire mesh prices were not indexed to raw material costs.129
U.S. producers and importers reported selling standard wire mesh to all regions in the contiguous United States during the POI. Out of five responding U.S. importers, all five shipped to the Southeast and Central Southwest regions, four shipped to the Mountain and Midwest regions, three shipped to the Pacific Coast region, two shipped to the Northeast region, while one shipped to all regions.130
Most responding U.S. producers (eight of 11) reported that there were no substitutes for standard wire mesh, while equal numbers of importers (two each) reported either that there were substitutes or there were no substitutes, and most responding purchasers (12 of 17) reported that there were substitutes. Eight purchasers that identified substitutes for standard wire mesh identified rebar as a substitute.131 However, the record contains information indicating that the decision to use rebar or standard wire mesh on a project is generally settled at the planning stage by the end user based on the project’s design, and that the price of rebar is not referenced or involved in the price negotiations between standard wire mesh producers and their distributor customers.132
C. Volume of Subject Imports
Section 771(7)(C)(i) of the Tariff Act provides that the “Commission shall consider whether the volume of imports of the merchandise, or any increase in that volume, either in absolute terms or relative to production or consumption in the United States, is significant.”133
The volume of subject imports rose by *** percent (*** short tons) between 2017 and 2019, increasing from *** short tons in 2017 to *** short tons in 2018, and then falling to *** short tons in 2019; it was *** short tons in interim 2019, and higher, at *** short tons, in
127 CR/PR at V-4, Table V-1. 128 CR/PR at V-4. U.S. producers reported selling *** percent of their U.S. commercial shipments
in spot sales, and *** percent in short-term contracts. Importers reported selling *** percent of their U.S. commercial shipments in spot sales, and *** percent in short-term contracts. Id. at Table V-2; Hearing Tr. at 34 (Fisher).
129 CR/PR at V-5; Hearing Tr. at 22 (Wagner); Petitioners’ Prehearing Brief, Exh. ***, Declaration of *** of *** at Paragraph ***.
130 CR/PR at Table II-2. 131 CR/PR at II-10. The parties disagree as to whether rebar is a substitute for standard wire
mesh. Petitioners’ Prehearing Brief at 34-36; Respondents’ Prehearing Brief at 10; Respondents’ Posthearing Brief at QR-11 to QR-13.
132 Petitioners’ Prehearing Brief, Exh. 5, Declaration of Richard T. Wagner of Insteel, at Paragraph 4.
133 19 U.S.C. § 1677(7)(C)(i).
26
interim 2020.134 The market share of subject imports increased from *** percent of apparent U.S. consumption in 2017 to *** percent in 2018 and *** percent in 2019; it was *** percent in interim 2019, and lower, at *** percent, in interim 2020.135
We find that the volume of subject imports and the increase in that volume are significant in absolute terms and relative to consumption in the United States.136
D. Price Effects of the Subject Imports
Section 771(7)(C)(ii) of the Tariff Act provides that, in evaluating the price effects of the subject imports, the Commission shall consider whether:
(I) there has been significant price underselling by the imported merchandise as compared with the price of domestic like products of the United States, and
(II) the effect of imports of such merchandise otherwise depresses prices to a significant degree or prevents price increases, which otherwise would have occurred, to a significant degree.137
As explained in section IV.B.3 above, the record indicates that the domestic like product and subject imports are highly substitutable and that price is an important factor in purchasing decisions for standard wire mesh.
The Commission requested U.S. producers and importers to provide quarterly data on the total quantity and f.o.b. value of six standard wire mesh products shipped to unrelated U.S. customers during the POI.138 Nine U.S. producers in the domestic industry and five importers
134 CR/PR at IV-2 and Table IV-2. 135 CR/PR at Table IV-5. 136 Respondents argue that the volume and market share of subject imports, and the increases
in these measures, were too small to have any significant effects on the domestic industry. Respondents’ Prehearing Brief at 15-17; Respondents’ Posthearing Brief at 2-3, QR-4. We disagree with respondents that the volume and market share of subject imports in this investigation were “too small” to have any significant effects. As elaborated in section IV.D below, subject imports engaged in significant underselling resulting in lost sales and market share for the domestic industry and price depression of domestic producer prices. Moreover, the legislative history and court decisions have made clear that there is no minimum threshold for the market share or increase in volume to be “significant” under the statute. See S. Rep. No. 96-249, at 88 (1979); Hynix Semiconductor, Inc. v. United States, 431 F. Supp. 2d 1302, 1308-09 (Ct. Int’l Trade 2006); Nippon Steel Corp. v. United States, 182 F. Supp. 2d 1330, 1335 (Ct. Int’l Trade 2001).
137 19 U.S.C. § 1677(7)(C)(ii). 138 CR/PR at V-6. The six pricing products are:
Product 1 -- 6x6, 10 gauge, W1.4, 5’ x 150’ rolls. Product 2 -- 6x6, 10 gauge, D1.4, 5’ x 150’ rolls. Product 3 -- 6x6, 10 gauge, W1.4, 8’ x 20’ sheets. Product 4 -- 6x6, 10 gauge, D1.4, 8’ x 20’ sheets. Product 5 -- 6x6, 6 gauge, D2.9, 8’ x 20’ sheets. (Continued...)

27
provided usable pricing data for sales of the requested products, although not all firms reported pricing for all products for all quarters.139 Pricing data reported by these firms accounted for approximately *** percent of the domestic industry’s U.S. commercial shipments of standard wire mesh and *** percent of U.S. commercial shipments of subject imports from Mexico in 2019.140
The pricing data show that subject imports undersold the domestic like product in *** of *** quarterly comparisons, with underselling margins ranging between *** percent and *** percent, and an average margin of underselling of *** percent.141 The data also reflect predominant underselling by volume, with *** short tons of subject imports associated with instances of underselling, as compared to *** short tons of subject imports associated with instances of overselling.142 Thus, *** percent of the quantity of subject imports covered by the Commission’s pricing data was sold during quarters in which the average price of these imports was less than that of the comparable domestic product sold by the domestic industry.
Moreover, eleven purchasers reported that they had purchased imported standard wire mesh from Mexico instead of U.S.-produced product during the POI. Seven of these purchasers reported that subject import prices were lower than U.S.-produced product, and six of these purchasers reported that price was a primary reason for the decision to purchase subject imports rather than U.S.-produced product. 143 The total quantity of subject imports purchased by these six purchasers instead of domestic product over the POI was *** short tons,144 which is greater than the entire volume of subject imports in the market in 2017 (*** short tons).145 Thus, the record indicates that the domestic industry lost sales to subject imports because of their lower prices. Further, the lower-priced subject imports gained *** percentage points of
(…Continued) Product 6 -- 6x6, 10 gauge, D1.4, 3.6’ x 7’ sheets. Id.
139 CR/PR at V-6. No Importer provided pricing data with respect to imports of product 3 from Mexico. Id. at V-6 n.8. The Commission also received pricing data from U.S. producer ***, but these data are not included in the analysis below in light of our exclusion of the firm from the domestic industry.
140 CR/PR at V-6. The coverage figure for the domestic industry accounts for the exclusion of *** from the domestic industry and was compiled from U.S. producers’ questionnaires.
141 Derived from CR/PR at Table V-10 and *** U.S. Producer Questionnaire Response (EDIS Document No. ***).
142 Derived from CR/PR at Table V-10 and *** U.S. Producer Questionnaire Response (EDIS Document No. ***).
143 CR/PR at V-22, Table V-12. 144 CR/PR at Table V-12. This quantity represented *** percent of total U.S. shipments of
subject imports during the POI and *** percent of apparent U.S. consumption during the POI. Derived from Table Alt C-1 (EDIS Document No. 736430). *** which reported that price was a primary reason for the decision to purchase subject imports rather than U.S.-produced product did not report quantities associated with *** purchases of subject imports. CR/PR at Table V-12.
145 CR/PR at Table IV-5.

28
market share between 2017 and 2019 at the expense of the domestic industry, which lost *** percentage points of market share during that period.146
Based on the foregoing, and given the high degree of substitutability and the importance of price in purchasing decisions for standard wire mesh, we find the underselling by subject imports to be significant. This underselling led to lost sales by the domestic industry and caused the subject imports to gain market share at the expense of the domestic industry.
Respondents contend that the underselling margins for subject imports were lower in 2019 and interim 2020 than in 2018 (a year in which the domestic industry’s financial condition improved), which they argue indicates that subject import underselling in 2019 and interim 2020 could not have been injurious to the domestic industry.147 While the average margin of underselling for subject imports was somewhat lower in 2019 (*** percent) and interim 2020 (*** percent) than in 2018 (*** percent),148 the underselling margins for 2019 and interim 2020 were still significant, particularly given the high degree of substitutability of subject imports and the domestic like product and the importance of price in purchasing decisions for standard wire mesh. We consequently do not agree with respondents that any changes in underselling margins during the POI serve to diminish the significance of the underselling. Moreover, as discussed below, the decline in underselling margins reflects the domestic industry lowering its prices to retain market share in light of competition from lower-priced subject imports.
We have also examined the data on price trends. The prices of U.S. producers’ U.S. shipments for all six pricing products reached their highest level during the POI in the third and fourth quarters of 2018, and declined in almost every quarter thereafter to the end of the POI in the third quarter of 2020.149 The price declines for the domestic industry between the fourth quarter of 2018 and the third quarter of 2020 ranged from *** percent to *** percent.150
146 Table Alt C-1 (EDIS Document No. 736430). 147 Respondents’ Prehearing Brief at 19-20; Respondents’ Posthearing Brief at 1, 8-9, QR-27 to
QR-29. We discuss respondents’ arguments about the domestic industry’s condition in 2018 further in section IV.E below.
148 Derived from CR/PR at Table V-10 and *** U.S. Producer Questionnaire Response (EDIS Document No. ***). Moreover, while the underselling margins generally declined after 2018 for pricing products ***), this was not the case for other pricing products. Product *** showed ***, and product *** showed ***). Derived from CR/PR at Tables V-3 to V-8 and *** U.S. Producer Questionnaire Response (EDIS Document No. ***).
149 Derived from CR/PR at Tables V-3 to V-8 and *** U.S. Producer Questionnaire Response (EDIS Document No. ***). Prices declined for all six pricing products for all seven quarters in the POI after the fourth quarter of 2018, except for upticks in the prices for products 2 and 5 in the first quarter of 2020 before declines in the second and third quarters of 2020, and upticks in the price for product 3 in the first and second quarters of 2020 before a decline in the third quarter of 2020. Id.
150 Prices declined for U.S. producers in the domestic industry between the fourth quarter of 2018 and the third quarter of 2020 by *** percent for product 1, *** percent for product 2, *** percent for product 3, *** percent for product 4, *** percent for product 5, and *** percent for product 6. Derived from CR/PR at Tables V-3 to V-8 and *** U.S. Producer Questionnaire Response (EDIS Document No. ***).

29
Of the eight responding purchasers who expressed knowledge one way or the other, four reported that U.S. producers had reduced prices during the POI in order to compete with lower-priced imports from Mexico, reporting price reductions ranging between *** and *** percent.151 Eight of ten responding U.S. producers reported that they either had to reduce prices (sometimes below their costs)152 or roll back announced price increases to meet price competition from subject imports in order to get orders from customers.153
The record also establishes that the sharp decline in the domestic industry’s prices in 2019 and interim 2020 caused a cost-price squeeze for the industry. Indeed, respondents concede that there was a “cost-price squeeze experienced by the domestic industry in 2019/20,” although they dispute that it was caused by subject imports.154 The domestic industry’s ratio of COGS to net sales fell from *** percent in 2017 to *** percent in 2018, and then rose to *** percent in 2019; it was *** percent in interim 2019 and higher, at *** percent, in interim 2020.155
In 2019, the domestic industry faced increased per unit COGS, including increased per unit raw material costs, but its per unit sales revenues declined.156 In interim 2020, the industry’s per unit COGS declined by *** percent from the interim 2019 period, but its net sales AUV declined at a greater rate, *** percent, resulting in an increase in the industry’s ratio of COGS to net sales to over *** percent.157 Moreover, the “spread” between the industry’s net sales AUV and its unit COGS, after increasing from $*** per short ton in 2017 to $*** per short ton in 2018, declined *** to only $*** per short ton in 2019; this spread was $*** per short ton in interim 2019 and was lower, at $*** per short ton in interim 2020.158
151 CR/PR at V-22 to V-23, Table V-13. Four purchasers reported that U.S. producers had not
reduced prices, and ten reported that they did not know. CR/PR at V-22. 152 CR/PR at V-22; see also Petitioners’ Prehearing Brief, Exh. 4, Declaration of Jordi Barrenechea
of WMC, at Paragraph 9.b and Attachment 2; Petitioners’ Posthearing Brief, Exh. 6, Declaration of Richard T. Wagner of Insteel, at Paragraphs 3, 5.b and Attachment 1; Hearing Tr. at 33-34 (Fisher).
153 CR/PR at V-22; see also Hearing Tr. at 24 (Wagner); 30 (Barrenechea); Petitioners’ Prehearing Brief, Exh. 4, Declaration of Jordi Barrenechea of WMC, at Paragraph 14 and Attachment 5; Petitioners’ Posthearing Brief, Exh. 7, Declaration of Jordi Barrenechea of WMC, at Paragraph 2 and Attachment 1; Exh. 8, Declaration of Perry Fisher of National, at Paragraphs 8-9.
154 Respondents’ Posthearing Brief at QR-6. 155 Table Alt C-1 (EDIS Document No. 736430). 156 From 2018 to 2019, the domestic industry’s unit raw material cost increased by *** percent
and its overall average unit COGS increased by *** percent, but its unit net sales AUV declined by *** percent. Derived from CR/PR at Table VI-2 (excluding data for *** as derived from *** U.S. Producer Questionnaire Response (EDIS Document No. ***). Prices for each of the domestically produced pricing products declined in 2019. Derived from CR/PR at Tables V-3 to V-8 (excluding data for *** as derived from *** U.S. Producer Questionnaire Response (EDIS Document No. ***).
157 Table Alt C-1 (EDIS Document No. 736430). The domestic industry’s unit COGS was $*** lower in interim 2020 than interim 2019, but its net sales unit AUV was $*** lower. Id.
158 Derived from Table Alt C-1 (EDIS Document No. 736430). The “spread” between the domestic industry’s net sales AUV and its unit wire rod raw material cost increased from $*** per short ton in 2017 to $*** per short ton in 2018, and then declined to $*** per short ton; it was $*** per short (Continued...)

30
The domestic industry had no way to pass through cost increases automatically, given the absence of indexing or other formal mechanism for standard wire mesh prices to increase when raw material costs increase.159 The record indicates that producers in the domestic industry tried to increase prices to cover their increased wire rod costs in 2019, but they were unsuccessful or only partially successful due to competition from low-priced subject imports.160
Moreover, while the domestic industry was able to raise prices in 2018 to cover its increased costs, it sacrificed market share to do so as it lost *** percentage points of market share that year to low-priced subject imports.161 In 2019, the domestic industry had to lower its prices notwithstanding increasing costs in an effort to avoid further market share loss to subject imports,162 which continued to undersell the domestic like product. As previously discussed, the combination of lower per unit revenues and higher per unit costs led to a cost-price squeeze.
Respondents contend that subject import competition did not cause the price declines and cost-price squeeze the domestic industry experienced in 2019 and interim 2020. They first argue that “a slight decline in demand” was one of the causes of the industry’s pricing problems.163 However, the record indicates that the domestic industry’s prices were not determined by or even correlated with demand trends during the POI. While apparent U.S. consumption declined by *** percent in 2018, the domestic industry’s prices for all six pricing products rose to their highest levels in the POI during the last two quarters of 2018.164 By
(…Continued) ton in interim 2019 and lower, at $*** per short ton, in interim 2020. Derived from CR/PR at Table VI-1 and *** U.S. Producer Questionnaire Response (EDIS Document No. ***).
159 U.S. producers reported selling *** percent of their U.S. commercial shipments in spot sales, and *** percent in short-term contracts. CR/PR at Table V-2. Three U.S. producers and one importer reported that prices were not renegotiated or indexed to raw material costs in short-term contracts, while eight purchasers reported that wire mesh prices were not indexed to raw material costs. CR/PR at V-5; Hearing Tr. at 22 (Wagner); Petitioners’ Prehearing Brief, Exh. ***, Declaration of *** of *** at Paragraph ***.
160 Hearing Tr. at 24 (Wagner); 30 (Barrenechea). WMC provided copies of formal price letters to its customers in 2019 stating its intention to raise its prices, but reported that these attempted price increases were not successful due to competition from low-priced subject imports. Petitioners’ Prehearing Brief, Exh. 4, Declaration of Jordi Barrenechea of WMC, at Paragraph 14 and Attachment 5; Petitioners’ Posthearing Brief, Exh. 7, Declaration of Jordi Barrenechea of WMC, at Paragraph 2 and Attachment 1; Exh. 8, Declaration of Perry Fisher of National, at Paragraphs 8-9.
161 Table Alt C-1 (EDIS Document No. 736430). Derived from CR/PR at Tables V-3 to V-8 and *** U.S. Producer Questionnaire Response (EDIS Document No. ***).
162 Petitioners’ Prehearing Brief, Exh. 4, Declaration of Jordi Barrenechea of WMC, at Paragraph 9 and Attachment 2; Petitioners’ Posthearing Brief, Exh. 6, Declaration of Richard T. Wagner of Insteel, at Paragraphs 3 and 5.b and Attachment 1; Hearing Tr. at 33-34 (Fisher).
163 Respondents’ Posthearing Brief at 4, QR-6. 164 Derived from CR/PR at Tables V-3 to V-8 and *** U.S. Producer Questionnaire Response (EDIS
Document No. ***). The domestic industry’s per unit net sales AUV increased from $*** per short ton in 2017 to $*** per short ton in 2018. Table Alt C-1 (EDIS Document No. 736430). The domestic industry’s per unit net sales AUV declined from $*** per short ton in 2018 to $*** per short ton in 2019. (Continued...)

31
contrast, while apparent U.S. consumption was *** percent higher in interim 2020 than in interim 2019, the domestic industry’s prices for all six pricing products continued to decline during interim 2020 (and the industry’s net sales AUV declined by a greater amount than the decline in unit COGS).165 In addition, no market participant responding to the question regarding changes in demand reported that demand decreased over the POI,166 which cuts against the notion that market participants were using any perceived decline in demand to achieve price decreases. Further, respondents acknowledge that “wire mesh pricing has not always trended closely with demand levels.”167 Thus, we find that demand trends do not explain the decline in the domestic industry’s prices in 2019 and interim 2020, or the cost-price squeeze it experienced.168
We also reject respondents’ contention that declines in wire mesh prices were mainly attributable to declines in wire rod prices.169 While the record indicates that U.S. wire rod prices declined in 2019,170 this decline did not cause a corresponding decline in the domestic industry’s per unit wire rod raw material costs, or its per unit COGS, which both increased that year (as did the industry’s ratio of COGS to net sales).171
Respondents also argue that “intra-industry competition” caused the domestic industry’s prices to decline, contending that domestic producers were the lowest-priced producers in the U.S. market and that *** increased competition in the market.172 However the Commission’s pricing data indicate that not only were subject imports priced lower overall
(…Continued) Table Alt C-1 (EDIS Document No. 736430). In 2019, apparent U.S. consumption declined and, despite increased per unit costs, the domestic industry’s pricing for all six pricing products also declined. Derived from CR/PR at Tables V-3 to V-8 and *** U.S. Producer Questionnaire Response (EDIS Document No. ***).
165 Derived from CR/PR at Tables V-3 to V-8 and *** U.S. Producer Questionnaire Response (EDIS Document No. ***). The domestic industry’s per unit net sales AUV was $*** per short ton in interim 2019 and lower, at $*** per short ton, in interim 2020. Table Alt C-1 (EDIS Document No. 736430).
166 CR/PR at Table II-4. As noted above, the majority of responding U.S. producers, importers, and purchasers reported that demand either increased or did not change. Id.
167 Respondents’ Posthearing Brief at QR-6. 168 For example, the substantial increase in the domestic industry’s COGS to net sales ratio of
*** percentage points between 2018 and 2019 is unlikely to be attributable solely to a *** percent decline in apparent U.S. consumption during that period. Derived from Table Alt C-1 (EDIS Document No. 736430).
169 Respondents’ Prehearing Brief at 6-8; Respondents’ Posthearing Brief at 3, QR-2. 170 CR/PR at V-1, Figure V-1. 171 Derived from CR/PR at Table VI-1 and *** U.S. Producer Questionnaire Response (EDIS
Document No. ***). The record indicates that there may be a time lag for wire rod price trends to affect the domestic industry’s raw material costs because of the need of domestic producers to maintain inventories of wire rod. The average number days of wire rod in inventory for domestic producers increased from approximately 68 days in 2017 to 72 days in 2018, and declined to 66 days in 2019; it was 68 days in interim 2019, and lower, at 64 days, in interim 2020. CR/PR at VI-16.
172 Respondents’ Prehearing Brief at 8-10; Respondents’ Posthearing Brief at 4-5.

32
than the domestic like product in *** of *** average quarterly comparisons,173 but importers of subject merchandise also had lower individual prices than the lowest-priced domestic producers in a majority (*** of ***) of quarterly comparisons for which there were reported price data for the domestic industry and subject imports.174 Thus, the record does not support respondents’ contention that domestic producers were the lowest-priced producers in the U.S. market, or that it was intra-industry competition that caused the decline in the domestic industry’s prices.
Respondents further contend that the record shows very similar price trends for all six pricing products, including product 1 (for which there was *** by subject imports) and product 3 (for which there are no subject import pricing data). Respondents argue that these price trends indicate that any declines in the domestic industry’s prices were not caused by subject import underselling.175 However, the record indicates that products 1 and 2 are highly similar products (with the difference being that product 1 is produced from smooth wire and product 2 is produced from deformed wire), as are products 3 and 4 (with product 3 produced from smooth wire and product 4 produced from deformed wire).176 Evidence in the record indicates that standard wire mesh meeting the same ASTM specifications, whether produced from smooth wire or deformed wire, generally sells for a similar price.177 Thus, pricing products 1 and 2 (and pricing products 3 and 4) compete against each other, and prices for each product likely affect the price for the other product in the pair. Thus, any underselling by subject imports of product 2 will likely affect the domestic industry’s prices for product 1, and any underselling by subject imports of product 4 will likely affect the domestic industry’s prices for
173 Derived from CR/PR at Table V-10 and *** U.S. Producer Questionnaire Response (EDIS
Document No. ***). 174 See Petitioners’ Final Comments at 5, Table 1; see also Petitioners’ Posthearing Brief at 4-5,
Exh. 1, Response to Commissioner Questions, at 13-16, and Exh. 5. We note that respondents’ analysis lists a domestic producer as the lowest-priced supplier in *** quarters in which there was no reported subject import competition, and compares individual domestic producer prices with an average subject import price, rather than with individual importer prices. Respondents’ Posthearing Brief at 4-5, QR-2 to QR-3, QR-23 to QR-24 and Exh. 2. Moreover, seven of the quarters in which domestic producers recorded the lowest prices were of pricing product 1 in quarters in which reported subject import competition was limited to *** quantities of fewer than *** short tons. CR/PR at Table V-3.
175 Respondents’ Posthearing Brief at 3. 176 In the preliminary phase of this investigation, the Commission’s first two pricing products
both included product produced from smooth wire and product produced from deformed wire within the same pricing products. However, in response to respondents’ comments on the Commission’s draft final phase questionnaires, the Commission separated those products into separate pricing products based on whether they were produced from smooth wire or deformed wire. Thus, the first pricing product from the preliminary phase of the investigation became pricing products 1 (smooth wire) and 2 (deformed wire) in the final phase of the investigation, while the second pricing product from the preliminary phase investigations became pricing products 3 (smooth wire) and 4 (deformed wire) in the final phase. CR/PR at V-6 n.5; Preliminary Determinations, USITC Pub. 5109 at 23 n.112; Deacero’s Comments on Draft Final Phase Questionnaires, Oct. 6, 2020, at 23-24 (EDIS Document No.721283).
177 Hearing Tr. at 23-24 (Wagner); Petitioners’ Final Comments at 6-7 n.5; see CR/PR at I-18 and n.31; III-16 (indicating *** percent cost savings with use of deformed wire rod).
33
product 3. Accordingly, we do not find that any absence of correlation between the margins of underselling for pricing products 1 and 3 and the domestic industry’s price trends for those products indicates that competition from low-priced subject imports did not cause prices for the domestic industry to decline.
We consequently do not agree with respondents that factors other than the subject imports can explain the magnitude of the domestic industry’s price declines, or its resulting cost-price squeeze, during 2019 and interim 2020. We therefore find that subject imports depressed prices of the domestic like product to a significant degree.
The record indicates that subject imports significantly undersold the domestic like product, gaining sales and market share from the domestic industry as a result. It further indicates that low-priced subject imports depressed domestic prices in 2019 and interim 2020,178 and suppressed prices in 2019, preventing the domestic industry from recouping increased costs. We consequently conclude that the subject imports had significant price effects.
E. Impact of the Subject Imports
Section 771(7)(C)(iii) of the Tariff Act provides that examining the impact of subject imports, the Commission “shall evaluate all relevant economic factors which have a bearing on the state of the industry.”179 These factors include output, sales, inventories, capacity utilization, market share, employment, wages, productivity, gross profits, net profits, operating profits, cash flow, return on investment, return on capital, ability to raise capital, ability to service debts, research and development, and factors affecting domestic prices. No single factor is dispositive and all relevant factors are considered “within the context of the business cycle and conditions of competition that are distinctive to the affected industry.”180
While the domestic industry’s capacity increased between 2017 and 2019, it experienced declines in production, capacity utilization, net sales quantity, U.S. shipments, market share, most employment indicators, and capital expenditures. Although the industry’s financial performance improved somewhat in 2018, it declined sharply in 2019. The domestic industry’s production, capacity utilization, U.S. shipments, net sales quantity, and market share all were higher in interim 2020 than in interim 2019, but its revenues and its financial condition were worse.
The domestic industry’s capacity rose by *** percent between 2017 and 2019, increasing from *** short tons in 2017 to *** short tons in 2018 and *** short tons in 2019; it
178 Commissioner Johanson does not join in the remainder of this sentence. 179 19 U.S.C. § 1677(7)(C)(iii); see also SAA at 851 and 885 (“In material injury determinations,
the Commission considers, in addition to imports, other factors that may be contributing to overall injury. While these factors, in some cases, may account for the injury to the domestic industry, they also may demonstrate that an industry is facing difficulties from a variety of sources and is vulnerable to dumped or subsidized imports.”).
180 19 U.S.C. § 1677(7)(C)(iii). This provision was amended by the Trade Preferences Extension Act of 2015, Pub. L. 114-27.

34
was *** short tons in interim 2019 and lower, at *** short tons, in interim 2020.181 Production decreased by *** percent from 2017 to 2019, falling from *** short tons in 2017 to *** short tons in 2018 and *** short tons in 2019; it was *** short tons in interim 2019 and higher, at *** short tons, in interim 2020.182 Capacity utilization declined from *** percent in 2017 to *** percent in 2018 and *** percent in 2019; it was *** percent in interim 2019 and higher, at *** percent, in interim 2020.183
Net sales quantity declined by *** percent from 2017 to 2019, increasing from *** short tons in 2017 to *** short tons in 2018, and then declining to *** short tons in 2019; it was *** short tons in interim 2019 and higher, at *** short tons, in interim 2020.184 U.S. shipments decreased by *** percent from 2017 to 2019, falling from *** short tons in 2017 to *** short tons in 2018 and *** short tons in 2019; they were *** short tons in interim 2019 and higher, at *** short tons, in interim 2020.185 The domestic industry’s share of apparent U.S. consumption fell from *** percent in 2017 to *** percent in 2018 and *** percent in 2019; it was *** percent in interim 2019 and higher, at *** percent, in interim 2020.186 Ending inventories rose by *** percent from 2017 to 2019, increasing from *** short tons in 2017 to *** short tons in 2018 and *** short tons in 2019; they were *** short tons in interim 2019 and lower, at *** short tons, in interim 2020.187
Employment declined by *** percent between 2017 and 2019, falling from *** production and related workers (PRWs) in 2017 to *** PRWs in 2018 and *** PRWs in 2019; there were *** PRWs in interim 2019 and fewer, *** PRWs, in interim 2020.188 Hours worked fell by *** percent from 2017 to 2019, declining from *** hours in 2017 to *** hours in 2018 and 2019; there were *** hours in interim 2019 and fewer, at *** hours, in interim 2020.189 Wages paid decreased by *** percent from 2017 to 2019, increasing from $*** in 2017 to $*** in 2018, and then falling to $*** in 2019; they were $*** in interim 2019 and higher, at $***, in interim 2020.190 Productivity in short tons per thousand hours rose by *** percent from 2017 to 2019, increasing from *** in 2017 to *** in 2018 and then falling to *** in 2019; it was *** in interim 2019 and higher, at ***, in interim 2020.191
Net sales value rose by *** percent from 2017 to 2019, increasing from $*** in 2017 to $*** in 2018 and then falling to $*** in 2019; they were $*** in interim 2019 and lower, at $***, in interim 2020.192 Total COGS rose by *** percent from 2017 to 2019, increasing from
181 Table Alt C-1 (EDIS Document No. 736430). As discussed above in section IV.B.2, the capacity
data reflect a combination of expansions and partial shutdowns in the domestic industry. 182 Table Alt C-1 (EDIS Document No. 736430). 183 Table Alt C-1 (EDIS Document No. 736430). 184 Table Alt C-1 (EDIS Document No. 736430). 185 Table Alt C-1 (EDIS Document No. 736430). 186 Table Alt C-1 (EDIS Document No. 736430). 187 Table Alt C-1 (EDIS Document No. 736430). 188 Table Alt C-1 (EDIS Document No. 736430). 189 Table Alt C-1 (EDIS Document No. 736430). 190 Table Alt C-1 (EDIS Document No. 736430). 191 Table Alt C-1 (EDIS Document No. 736430). 192 Table Alt C-1 (EDIS Document No. 736430).
35
$*** in 2017 to $*** in 2018, and then falling to $*** in 2019; it was $*** in interim 2019 and lower, at $***, in interim 2020.193 The industry’s ratio of COGS to net sales fell from *** percent in 2017 to *** percent in 2018, and then rose to *** percent in 2019; it was *** percent in interim 2019 and higher, at *** percent, in interim 2020.194
Measures of profitability increased from 2017 to 2018, declined in 2019 to a level below 2017, and were worse in interim 2020 than in interim 2019. The industry’s gross profit declined by *** percent between 2017 and 2019, increasing from $*** in 2017 to $*** in 2018, and then falling to $*** in 2019; it was $*** in interim 2019 and $*** in interim 2020.195 The industry had operating income of $*** in 2017, $*** in 2018, $*** in 2019, $*** in interim 2019, and $*** in interim 2020.196 The industry’s operating income margin was *** percent in 2017, *** percent in 2018, *** percent in 2019, *** percent in interim 2019, and *** percent in interim 2020.197 The industry’s net income was $*** in 2017, $*** in 2018, $*** in 2019, $*** in interim 2019, and $*** in interim 2020.198
Capital expenditures declined by *** percent between 2017 and 2019, increasing from $*** in 2017 to $*** in 2018, and then falling to $*** in 2019; they were $*** in interim 2019 and lower, at $***, in interim 2020.199 *** of the ten responding members of the domestic industry reported that the subject imports had negative effects on their investment and growth and development.200
Thus, the record indicates that the domestic industry’s condition, notwithstanding some improvements in 2018, sharply deteriorated in 2019 and interim 2020. After experiencing an operating *** in 2017, the domestic industry recorded an operating profit of $*** in 2018, as its revenues increased more than its costs. However, the industry lost market share in 2018, and recorded attendant declines in production, capacity utilization, and U.S. shipments.201 In 2019, the industry’s declines in production, capacity utilization, and U.S. shipments continued, and its revenues, prices, and per unit net sales AUVs declined while its unit COGS continued to increase,202 as subject imports suppressed the domestic industry’s prices, and prevented it from increasing its prices to cover its increased costs. The resulting cost-price squeeze caused a sharp deterioration in the domestic industry’s financial condition and an operating ***.203 Despite improvements in output indicators in interim 2020, the industry’s financial condition
193 Table Alt C-1 (EDIS Document No. 736430). 194 Table Alt C-1 (EDIS Document No. 736430). 195 Table Alt C-1 (EDIS Document No. 736430). 196 Table Alt C-1 (EDIS Document No. 736430). 197 Table Alt C-1 (EDIS Document No. 736430). 198 Table Alt C-1 (EDIS Document No. 736430). 199 Table Alt C-1 (EDIS Document No. 736430). The domestic industry had *** research and
development (“R&D”) expenses in 2017, but incurred R&D expenses of $*** in 2018, and $*** in 2019. R&D expenses were $*** in interim 2019, while there were *** R&D expenses in interim 2020. Id.
200 CR/PR at Table VI-8. 201 Table Alt C-1 (EDIS Document No. 736430). 202 Commissioner Johanson does not join in the remainder of this sentence. 203 Table Alt C-1 (EDIS Document No. 736430).

36
continued to deteriorate as its revenues declined more rapidly than its costs, and it suffered an operating *** in interim 2020, even worse than its operating *** in interim 2019.204
The record indicates that the increasing volume of low-priced subject imports engaged in significant underselling of the domestic like product and took sales and *** percentage points of market share from the domestic industry between 2017 and 2019.205 Consequently, the domestic industry’s output and revenues were lower than they would have been otherwise. Moreover, subject imports significantly depressed the domestic industry’s prices, as domestic producers lowered their prices in 2019 and interim 2020 to try to avoid losing further market share to low-priced subject imports, and these price reductions further lowered the industry’s revenues from what they would have been in the absence of competition by low-priced subject imports. The reduction in the domestic industry’s output in 2019 and downward trends in its revenues during both 2019 and interim 2020 led to the domestic industry’s poor financial performance during the latter portion of the POI.
We have considered respondents’ arguments that the decline in the domestic industry’s performance was not caused by subject imports but by other factors. Respondents argue that there was no correlation between the market behavior of subject imports and the performance of the domestic industry, asserting that in 2018 when subject imports gained market share and their margins of underselling were at their highest, the domestic industry’s financial condition improved, while later in the POI when subject import market share and margins of underselling declined, the domestic industry’s financial condition declined.206 We do not agree with respondents that the domestic industry was not adversely affected by the increase in low-priced subject imports in 2018. The domestic industry lost market share and its capacity utilization, production, and U.S. shipments declined in 2018.207 While increased prices helped the domestic industry’s financial performance to improve in 2018, the improvement was from a low baseline. The industry’s financial performance in 2017 included an operating ***, and its operating ratio improved from *** percent in 2017 to a modest level of *** percent in 2018.208
Moreover, subject imports maintained their presence in the market in 2019, gaining an additional *** percentage points of market share, and the domestic industry’s prices and financial condition *** deteriorated as the domestic industry decreased its prices in order to avoid losing additional market share to lower-priced subject imports.209 This price depression led to further deterioration in revenues and financial performance in interim 2020, notwithstanding a modest increase in the domestic industry’s market share, as subject imports continued to undersell domestically produced standard wire mesh and importers’ U.S. shipments of subject imports were higher in interim 2020 than in interim 2019.210 Thus,
204 Table Alt C-1 (EDIS Document No. 736430). 205 CR/PR at Table V-12; Table Alt C-1 (EDIS Document No. 736430). 206 Respondents’ Prehearing Brief at 22-24; Respondents’ Posthearing Brief at 1, 4-5. 207 Table Alt C-1 (EDIS Document No. 736430). 208 Table Alt C-1 (EDIS Document No. 736430). 209 Table Alt C-1 (EDIS Document No. 736430); Derived from CR/PR at Tables V-3 to V-8 and ***
U.S. Producer Questionnaire Response (EDIS Document No. ***). 210 Table Alt C-1 (EDIS Document No. 736430).

37
contrary to respondents’ argument, we find that the record indicates a causal link between the subject imports and adverse changes to the domestic industry’s condition throughout the POI.
As previously discussed in section IV.C above, we also disagree with respondents’ argument that the market share shift from the domestic industry to subject imports over the POI was too small to cause injury.211 Given the high degree of substitutability of subject imports and the domestic like product, and the importance of price in purchasing decisions, subject imports’ significant underselling led to lost sales and lost market share, which resulted in the domestic industry’s sales and revenues being lower than they otherwise would have been. Moreover, in 2019 and interim 2020, subject imports significantly depressed the domestic industry’s prices, as the industry lowered its prices to prevent further losses in market share to subject imports, which led to a severe deterioration in the industry’s financial position.
We also do not agree with respondents’ contention that the cause of the domestic industry’s injury was intra-industry competition from low-priced domestic producers.212 As previously explained in section IV.D above, the record indicates that subject import suppliers, and not domestic producers, were the lowest-priced suppliers in the U.S. market during the POI, and that intra-industry competition cannot explain the adverse price effects experienced by the domestic industry. Moreover, intra-industry competition cannot explain the sales that the domestic industry lost to subject imports during the POI, or the *** percentage points of market share that the domestic industry lost to subject imports between 2017 and 2019 as a result of the significant underselling by subject imports.213
We also find that demand conditions, including a *** percent decline in apparent U.S. consumption between 2017 and 2019,214 cannot explain the declines recorded by the domestic industry. As explained in section IV.D above, declines in demand during 2019 cannot explain the price depression and price suppression the domestic industry experienced that year.215 Declining demand also cannot explain the domestic industry’s loss of market share to subject imports.
We further find that the record does not support respondents’ contention that high freight costs limited subject producers’ ability to compete in the U.S. market other than in the southern and southwestern regions of the United States near the Mexican border, and that the effects of subject imports were therefore “contained” in those regions.216 As previously discussed in section IV.B.3 above, the record shows that both the domestic like product and subject imports were sold in all regions of the contiguous United States during the POI.217 U.S. producers reported competing with subject imports throughout the United States, not limited
211 Respondents’ Prehearing Brief a 15-17. 212 Respondents’ Posthearing Brief at 4-6. 213 CR/PR at Table V-12; Table Alt C-1 (EDIS Document No. 736430). 214 CR/PR at IV-8, Table IV-5. 215 Commissioner Johanson finds that the domestic industry experienced price depression in
2019. 216 Respondents’ Prehearing Brief at 11-13; Respondents’ Posthearing Brief at 8, QR-7 to QR-8;
Hearing Tr. at 133-34 (Abascal). 217 CR/PR at Table II-2.

38
to the south or southwest regions.218 Moreover, the record shows that *** percent of subject imports were shipped over 1,000 miles from their U.S. point of shipment,219 with ***, the largest importer of subject merchandise in 2019, shipping *** percent of its imports over 1,000 miles from its U.S. point of shipment.220 Furthermore, a majority of responding U.S. purchasers (nine of 13) reported that domestic product and subject imports were comparable with respect to U.S. transportation costs, indicating that transportation costs did not leave subject imports at a competitive disadvantage compared with the domestic like product.221 Thus, the record indicates that subject imports competed with the domestic like product throughout the U.S. market, and were not limited solely to regions near the Mexican border.
We also find that supply constraints in the domestic industry do not explain its loss of market share to subject imports. Respondents argue that domestic producers experienced supply shortfalls in 2018 and turned down orders, forcing purchasers to turn to subject suppliers, and thus leading to the market share shift.222 The record does not contain evidence supporting respondents’ contention that domestic producers turned down orders in 2018 as a result of supply constraints. Supply constraints were referenced by only a small number of responding market participants as reviewed above in section IV.B.2,223 and some of those participants listed supply constraints pertaining to ***.224 Further, the capacity of the domestic industry was *** apparent U.S. consumption throughout the POI, leaving the domestic industry ample capacity to supply the U.S. market.225 Moreover, respondents’ arguments about supply constraints are not consistent with their arguments about intra-industry competition, given that their intra-industry competition allegations were in part due to the ***, which added
218 Hearing Tr. at 21-22 (Wagner), 28 (Barrenechea), 33 (Fisher). 219 Importers sold *** percent of their U.S. shipments within 100 miles of their U.S. point of
shipment, *** percent between 101 and 1,000 miles, and *** percent over 1,000 miles. For U.S. producers, *** percent of sales were within 100 miles of their production facility, *** percent were between 101 and 1,000 miles, and *** percent were over 1,000 miles. CR/PR. at II-3.
220 *** Importer Questionnaire Response at III-9(c) (EDIS Document No. ***). *** accounted for *** percent of total subject imports in 2019. CR/PR at Table IV-1. Respondent Deacero U.S.A., which accounted for *** of total subject imports in 2019, reported shipping *** percent of its imports of standard wire mesh more than 1,000 miles from its U.S. point of shipment. Id. at II-3 n.7, Table IV-1. Thus, the data reported by Deacero and the information provided by its witnesses are not necessarily representative of the geographical concentration of all subject imports during the POI.
221 CR/PR at Table II-9. Transportation costs for standard wire mesh shipped from Mexico to the United States averaged 2.2 percent during 2019. Id. at V-3. U.S. producers reported that their U.S. inland transportation costs ranged from 4 to 9 percent, while U.S. importers reported higher costs of 6 to 10 percent. Id. at V-4.
222 Respondents’ Prehearing Brief at 4-5. 223 One of eleven responding U.S. producers, two of six responding importers, and six of 17
responding purchasers reported supply constraints. CR/PR at II-6. One purchaser reported that U.S. producers would not take orders in 2020. Id. Petitioners refute that there were any significant domestic industry capacity constraints. Hearing Tr. at 25 (Wagner), 74 (Cannon); Petitioners’ Posthearing Brief, Exh. 1, Response to Commission Questions, at 27-29.
224 CR/PR at II-6. 225 Table Alt C-1 (EDIS Document No. 736430).

39
capacity to the domestic industry and undermines the contention that there were supply constraints.
In our analysis, we have also considered the effects of nonsubject imports, which were present in the U.S. market during only a portion of the POI, and in very limited quantities.226 We find that the presence of nonsubject imports in the U.S. market was too limited to account for any of the injury to the domestic industry.227 We therefore conclude that subject imports have had a significant impact on the domestic industry.
V. Conclusion
For the reasons stated above, we determine that an industry in the United States is materially injured by reason of subject imports of standard wire mesh from Mexico that are subsidized by the government of Mexico.
226 There were *** reported nonsubject imports in 2017 and 2018, while the market share of
subject imports was *** percent in 2019, *** percent in interim 2019, and less than *** percent in interim 2020. CR/PR at Table IV-5.
227 We have also considered the effects of U.S. producer ***, which we excluded from the domestic industry pursuant to the related parties provision. We acknowledge that *** gained *** percentage points of market share between 2017 and 2019, reflecting the firm’s ***. CR/PR at Table III-4; Table Alt C-1 (EDIS Document No. 736430). Pricing data indicate that *** prices were *** than those for subject imports in *** of *** quarterly comparisons. Compare *** U.S. Producer Questionnaire Response at IV-2(B) (EDIS Document No. ***) with CR/PR at Tables V-3 to V-8. They were also *** the range of prices offered by other U.S. producers, with *** AUVs lower than those of all other U.S. producers in only *** of *** quarterly comparisons. Compare *** U.S. Producer Questionnaire Response at IV-2(B) (EDIS Document No. ***) with CR/PR at Tables V-3 to V-8 and Petitioners’ Posthearing Brief, Exh. 5. Because subject imports also undersold *** domestic production, the adverse price effects we have attributed to subject imports are distinct from any harm to the domestic industry that may have been caused by *** production during the POI.


I-1
Part I: Introduction
Background
These investigations result from petitions filed with the U.S. Department of Commerce (“Commerce”) and the U.S. International Trade Commission (“USITC” or “Commission”) by Insteel Industries Inc., Mount Airy, North Carolina; Mid-South Wire Company, Nashville, Tennessee; National Wire LLC, Conroe, Texas; Oklahoma Steel & Wire Co., Madill, Oklahoma; and Wire Mesh Corp., Houston, Texas on June 30, 2020, alleging that an industry in the United States is materially injured and threatened with material injury by reason of subsidized and less-than-fair-value (“LTFV”) imports of standard steel welded wire mesh (“standard wire mesh”)1 from Mexico. The following tabulation provides information relating to the background of these investigations.2 3
1 See the section entitled “The subject merchandise” in Part I of this report for a complete description of the merchandise subject in this proceeding.
2 Pertinent Federal Register notices are referenced in appendix A and may be found at the Commission’s website (www.usitc.gov).
3 Appendix B presents witnesses participating in the Commission’s hearing.

I‐2
Effective date Action
June 30, 2020 Petitions filed with Commerce and the Commission; institution of
Commission investigations (85 FR 40681, July 7, 2020)
July 20, 2020 Commerce’s notice of initiation (85 FR 45181, July 27, 2020; and
85 FR 45167, July 27, 2020)
August 14, 2020 Commission’s preliminary determinations (85 FR 51491, August
20, 2020)
December 3, 2020 Commerce’s preliminary countervailing duty determination
(85 FR 78124, December 3, 2020); scheduling of final phase of
Commission investigations (85 FR 81487, December 16, 2020)
February 1, 2021 Commerce’s preliminary antidumping duty determination
(86 FR 7710, February 1, 2021)
February 12, 2021 Commission’s hearing
February 18, 2021 Commerce’s final countervailing duty determination
(86 FR 10034, February 18, 2021)
March 17, 2021 Commission’s countervailing duty vote
April 5, 2021 Commission’s countervailing duty views
June 16, 2021 Scheduled date for Commerce’s final antidumping determination
Pending Scheduled date for the Commission’s antidumping duty vote
Pending Scheduled date for Commission’s antidumping duty views
Statutory criteria
Section 771(7)(B) of the Tariff Act of 1930 (the “Act”) (19 U.S.C. § 1677(7)(B)) provides that in making its determinations of injury to an industry in the United States, the Commission‐‐
shall consider (I) the volume of imports of the subject merchandise, (II) the effect of imports of that merchandise on prices in the United States for domestic like products, and (III) the impact of imports of such merchandise on domestic producers of domestic like products, but only in the context of production operations within the United States; and. . . may consider such other economic factors as are relevant to the determination regarding whether there is material injury by reason of imports.
Section 771(7)(C) of the Act (19 U.S.C. § 1677(7)(C)) further provides that‐‐4
4 Amended by PL 114‐27 (as signed, June 29, 2015), Trade Preferences Extension Act of 2015.

I-3
In evaluating the volume of imports of merchandise, the Commission shall consider whether the volume of imports of the merchandise, or any increase in that volume, either in absolute terms or relative to production or consumption in the United States is significant.. . .In evaluating the effect of imports of such merchandise on prices, the Commission shall consider whether. . .(I) there has been significant price underselling by the imported merchandise as compared with the price of domestic like products of the United States, and (II) the effect of imports of such merchandise otherwise depresses prices to a significant degree or prevents price increases, which otherwise would have occurred, to a significant degree.. . . In examining the impact required to be considered under subparagraph (B)(i)(III), the Commission shall evaluate (within the context of the business cycle and conditions of competition that are distinctive to the affected industry) all relevant economic factors which have a bearing on the state of the industry in the United States, including, but not limited to. . . (I) actual and potential decline in output, sales, market share, gross profits, operating profits, net profits, ability to service debt, productivity, return on investments, return on assets, and utilization of capacity, (II) factors affecting domestic prices, (III) actual and potential negative effects on cash flow, inventories, employment, wages, growth, ability to raise capital, and investment, (IV) actual and potential negative effects on the existing development and production efforts of the domestic industry, including efforts to develop a derivative or more advanced version of the domestic like product, and (V) in {an antidumping investigation}, the magnitude of the margin of dumping. In addition, Section 771(7)(J) of the Act (19 U.S.C. § 1677(7)(J)) provides that—5 (J) EFFECT OF PROFITABILITY.—The Commission may not determine that there is no material injury or threat of material injury to an industry in the United States merely because that industry is profitable or because the performance of that industry has recently improved.
5 Amended by PL 114-27 (as signed, June 29, 2015), Trade Preferences Extension Act of 2015.

I-4
Organization of report
Part I of this report presents information on the subject merchandise, subsidy/dumping margins, and domestic like product. Part II of this report presents information on conditions of competition and other relevant economic factors. Part III presents information on the condition of the U.S. industry, including data on capacity, production, shipments, inventories, and employment. Parts IV and V present the volume of subject imports and pricing of domestic and imported products, respectively. Part VI presents information on the financial experience of U.S. producers. Part VII presents the statutory requirements and information obtained for use in the Commission’s consideration of the question of threat of material injury as well as information regarding nonsubject countries.
Market summary
Standard wire mesh is generally used for internal reinforcement/framing for concrete construction. The leading U.S. producers of standard wire mesh are Insteel Wire Products (“Insteel”) and WMC Holdings LP (“WMC”), while the leading producer of standard wire mesh outside the United States is Deacero S.A.P.I. de C.V. (“Deacero”) of Mexico. The leading U.S. importers of standard wire mesh from Mexico are ***. U.S. imports of standard wire mesh from nonsubject sources (principally ***) are minimal. U.S. purchasers of standard wire mesh are primarily composed of distributors and retailers. Leading purchasers include ***.
Apparent U.S. consumption of standard wire mesh totaled approximately *** short tons ($***) in 2019. Eleven firms reported production of standard wire mesh in the United States in 2019. U.S. producers’ U.S. shipments of standard wire mesh totaled 296,954 short tons ($269.4 million) in 2019 and accounted for *** percent of apparent U.S. consumption by quantity and *** percent by value. U.S. imports from subject sources totaled *** short tons ($***) in 2019 and accounted for *** percent of apparent U.S. consumption by quantity and *** percent by value. U.S. imports from nonsubject sources totaled *** short tons ($***) in 2019 and accounted for *** percent of apparent U.S. consumption by quantity and *** percent by value.

I-5
Summary data and data sources
A summary of data collected in these investigations regarding standard wire mesh is presented in appendix C, table C-1. Table C-2 presents a summary of data including engineered steel welded wire mesh (“engineered wire mesh”) and standard wire mesh. Except as noted, U.S. industry data are based on questionnaire responses on behalf of one former and eleven current producers that accounted for a large majority of U.S. production of standard wire mesh during 2019. U.S. imports are based on questionnaire responses of six firms accounting for a large majority of U.S. imports of standard wire mesh. Data on the industry in Mexico are based on questionnaire response of four Mexican producers/exporters accounting for *** of Mexican production of standard wire mesh in 2019 as well as *** exports of standard wire mesh to the United States from Mexico.
Previous and related investigations
Standard wire mesh has been the subject of one prior antidumping duty investigation in the United States. On April 17, 1972, the Treasury Department found that welded-wire mesh from Belgium was being or was likely to be sold at LTFV in the United States.6 In July 1972, the Tariff Commission determined that an industry in the United States was not and was not likely to be injured, or prevented from being established, by reason of imports of welded wire mesh from Belgium.7
The Commission has conducted a number of previous import relief investigations on wire rod products or similar merchandise. Wire rod is a major input material used to produce standard wire mesh. Table I-1 presents data on previous and related antidumping and countervailing duty investigations regarding wire rod and similar merchandise.
6 37 FR 14444, July 20, 1972. 7 Welded-Wire Mesh from Belgium, Investigation AA1921-94, TC Publication 497, July 1972.

I-6
Table I-1 Wire rod: Previous and related title VII investigations
Original investigation First review Second review Third Review Current status Date1 Number Country Outcome Date1 Outcome Date1 Outcome Date1 Outcome
1982 731-TA-88 Venezuela Negative - - - - - - -
1982 731-TA-113 Brazil Affirmative - - - - - - ITA revoked 9/20/85
1982 731-TA-114 Trinidad & Tobago Affirmative - - - - - - ITA revoked
12/14/87
1982 701-TA-148 Brazil Affirmative2 - - - - - - Investigation terminated 8/21/85
1982 701-TA-149 Belgium Affirmative2 - - - - - - Petition withdrawn11/9/82
1982 701-TA-150 France Affirmative2 - - - - - - Petition withdrawn 11/9/82
1983 701-TA-209 Spain Affirmative - - - - - - ITA revoked 9/11/85
1983 731-TA-157 Argentina Affirmative 1998 Negative - - - - -
1983 731-TA-158 Mexico Negative2 - - - - - - -
1983 731-TA-159 Poland Negative - - - - - - -
1983 731-TA-160 Spain Affirmative - - - - - - ITA revoked 9/16/85
1984 731-TA-205 E. Germany Affirmative2 - - - - - - Petition withdrawn
8/1/85
1985 701-TA-243 Portugal Negative2 - - - - - - -
1985 701-TA-244 Venezuela Affirmative2 - - - - - - Petition withdrawn 7/24/85
1985 731-TA-256 Poland Affirmative2 - - - - - - Petition withdrawn 9/10/85
1985 731-TA-257 Portugal Affirmative2 - - - - - - Petition withdrawn 11/20/85
1985 731-TA-258 Venezuela Affirmative2 - - - - - - Petition withdrawn 8/30/85
1992 701-TA-314 Brazil Affirmative 1999 - - - - - ITA revoked 11/15/99
1992 701-TA-315 France Affirmative 1999 - - - - - ITA revoked 11/15/99
1992 701-TA-316 Germany Affirmative 1999 - - - - - ITA revoked 11/15/99
1992 701-TA-317 United Kingdom Affirmative 1999 - - - - - ITA revoked
11/15/99
1992 731-TA-552 Brazil Affirmative 1999 - - - - - ITA revoked 11/15/99
1992 731-TA-553 France Affirmative 1999 - - - - - ITA revoked 11/15/99
1992 731-TA-554 Germany Affirmative 1999 - - - - - ITA revoked 11/15/99
1992 731-TA-555 United Kingdom Affirmative 1999 - - - - - ITA revoked
11/15/99
1992 731-TA-572 Brazil Negative - - - - - - - Table continued on next page.

I-7
Table I-1—Continued Wire rod: Previous and related title VII investigations
Original investigation First review Second review Third Review
Current status Date1 Number Country Outcome Date1 Outcome Date1 Outcome Date1 Outcome
1993 731-TA-646 Brazil Negative - - - - - - -
1993 731-TA-647 Canada Affirmative2 - - - - - - Petition withdrawn 4/18/94
1993 731-TA-648 Japan Negative - - - - - - -
1993 731-TA-649 Trinidad & Tobago Negative2 - - - - - - -
1994 701-TA-359 Germany Negative2 - - - - - - -
1994 731-TA-686 Belgium Affirmative2 - - - - - - Petition withdrawn 7/7/94
1994 731-TA-687 Germany Negative2 - - - - - - -
1997 701-TA-368 Canada Negative - - - - - - -
1997 701-TA-369 Germany Negligible3 - - - - - - -
1997 701-TA-370 Trinidad & Tobago Negative - - - - - - -
1997 701-TA-371 Venezuela Negative - - - - - - -
1997 731-TA-763 Canada Negative - - - - - - -
1997 731-TA-764 Germany Negative - - - - - - -
1997 731-TA-765 Trinidad & Tobago Negative - - - - - - -
1997 731-TA-766 Venezuela Negative - - - - - - -
2001 701-TA-417 Brazil Affirmative 2007 Affirmative 2013 Affirmative 2019 Affirmative Order continued
2001 701-TA-418 Canada Affirmative - - - - - - ITA revoked 1/23/04
2001 701-TA-419 Germany Negative - - - - - - -
2001 701-TA-420 Trinidad & Tobago Negative4 - - - - - - -
2001 701-TA-421 Turkey Negative4 - - - - - - -
2001 731-TA-953 Brazil Affirmative 2007 Affirmative 2013 Affirmative 2019 Affirmative Order continued
2001 731-TA-954 Canada Affirmative 2007 Negative - - - - -
2001 731-TA-955 Egypt Negligible3 - - - - - - -
2001 731-TA-956 Germany Negligible3 - - - - - - -
2001 731-TA-957 Indonesia Affirmative 2007 Affirmative 2013 Affirmative 2019 Affirmative Order continued
2001 731-TA-958 Mexico Affirmative 2007 Affirmative 2013 Affirmative 2019 Affirmative Order continued
2001 731-TA-959 Moldova Affirmative 2007 Affirmative 2013 Affirmative 2019 Affirmative Order continued
2001 731-TA-960 South Africa Negligible3 - - - - -
2001 731-TA-961 Trinidad & Tobago Affirmative 2007 Affirmative 2013 Affirmative 2019 Affirmative Order continued
2001 731-TA-962 Ukraine Affirmative 2007 Affirmative 2013 Negative - - -
2001 731-TA-963 Venezuela Negligible3 - - - - - - -
2005 731-TA-1099 China Negative2 - - - - - - -
2005 731-TA-1100 Germany Negative2 - - - - - - - Table continued on next page.

I-8
Table I-1—Continued Wire rod: Previous and related title VII investigations
Original investigation First review Second review Third review
Current status Date1 Number Country Outcome Date1 Outcome Date1 Outcome Date1 Outcome
2005 731-TA-1101 Turkey Negative2 - - - - - - -
2014 701-TA-512 China Affirmative 2019 Affirmative - - - - Order continued
2014 731-TA-1248 China Affirmative 2019 Affirmative - - - - Order continued
2017 701-TA-573 Italy Affirmative - - - - - - Order in effect 5/21/18
2017 701-TA-574 Turkey Affirmative - - - - - - Order in effect 5/21/18
2017 731-TA-1349 Belarus Affirmative - - - - - - Order in effect 1/24/18
2017 731-TA-1350 Italy Affirmative - - - - - - Order in effect 5/21/18
2017 731-TA-1351 Korea Affirmative - - - - - - Order in effect 5/21/18
2017 731-TA-1352 Russia Affirmative - - - - - - Order in effect 1/24/18
2017 731-TA-1353 South Africa Affirmative - - - - - - Order in effect
3/14/18
2017 731-TA-1354 Spain Affirmative - - - - - - Order in effect 5/21/18
2017 731-TA-1355 Turkey Affirmative - - - - - - Order in effect 5/21/18
2017 731-TA-1356 Ukraine Affirmative - - - - - - Order in effect 3/14/18
2017 731-TA-1357
United Arab Emirates Affirmative
- - - - - - Order in effect 1/24/18
2017 731-TA-1358 United Kingdom Affirmative - - - - - - Order in effect
5/21/18 1 “Date” refers to the year in which the investigation or review was instituted by the Commission. 2 Preliminary determination. 3 The Commission found subject imports to be negligible, and its investigation was thereby terminated. 4 The Department of Commerce made a negative determination. Source: U.S. International Trade Commission publications.

I-9
Nature and extent of subsidies and sales at LTFV
Subsidies8
On February 18, 2021, Commerce published a notice in the Federal Register of its final determination of countervailable subsidies for producers and exporters of standard wire mesh from Mexico.9 Table I-2 presents Commerce’s findings of subsidization of standard wire mesh in Mexico. Table I-2 Standard wire mesh: Commerce’s subsidy determination with respect to imports from Mexico
Entity Preliminary countervailable subsidy
rate (percent) Final countervailable subsidy
rate (percent) Aceromex S.A. de C.V 1.02 1.03
Deacero S.A.P.I. de C.V 102.09 102.10
All others 1.02 1.03
Source: 85 FR 78124, December 3, 2020; and 86 FR 10034, February 18, 2021.
Commerce found one program to be countervailable: the Eighth Rule Permit Program. Deacero did not respond to Commerce’s countervailing duty questionnaire. Therefore, using adverse inferences for its final determination, Commerce also matched 15 programs (some with sub-programs) to the same or similar programs from other Mexico countervailing proceedings.10
8 Commerce did not align its final countervailing duty determination for its investigation on standard
wire mesh with its final antidumping duty determination for its investigation on standard wire mesh. 9 86 FR 10034, February 18, 2021. 10 Decision Memorandum for the Final Determination in the Countervailing Duty Investigation of
Standard Steel Welded Wire Mesh from Mexico, February 10, 2021 (identifies the countervailable and matched programs).
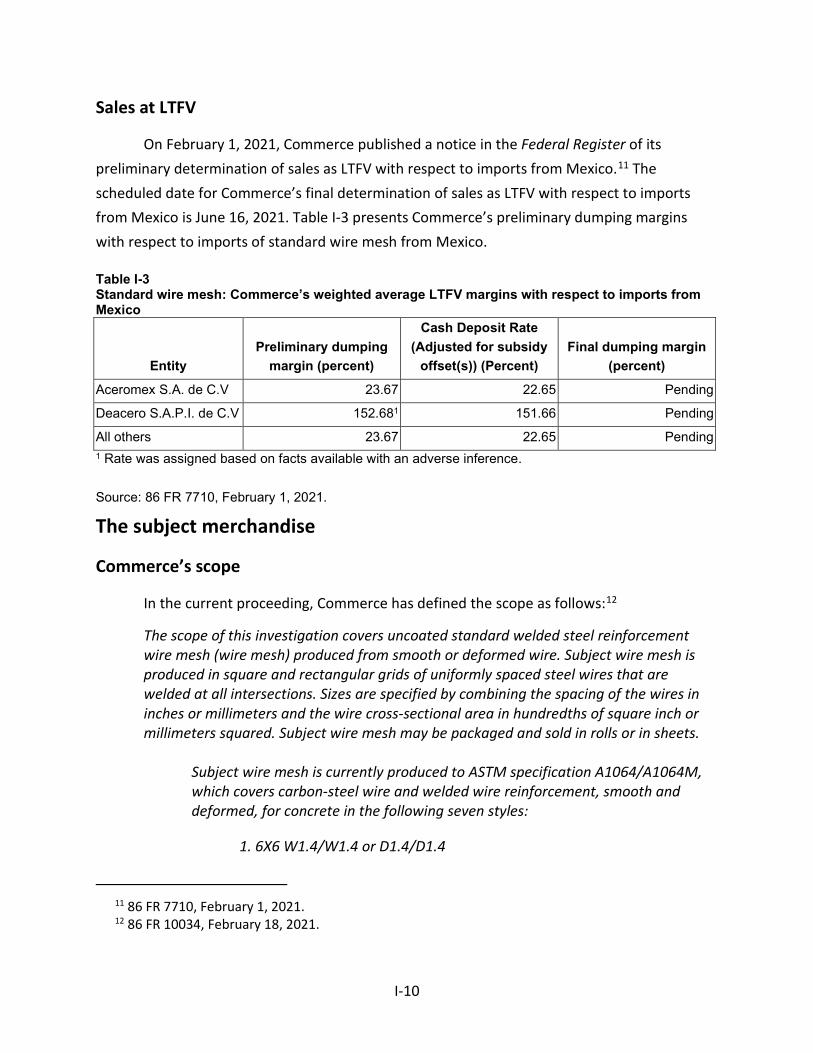
I-10
Sales at LTFV
On February 1, 2021, Commerce published a notice in the Federal Register of its preliminary determination of sales as LTFV with respect to imports from Mexico.11 The scheduled date for Commerce’s final determination of sales as LTFV with respect to imports from Mexico is June 16, 2021. Table I-3 presents Commerce’s preliminary dumping margins with respect to imports of standard wire mesh from Mexico. Table I-3 Standard wire mesh: Commerce’s weighted average LTFV margins with respect to imports from Mexico
Entity Preliminary dumping
margin (percent)
Cash Deposit Rate (Adjusted for subsidy
offset(s)) (Percent) Final dumping margin
(percent)
Aceromex S.A. de C.V 23.67 22.65 Pending
Deacero S.A.P.I. de C.V 152.681 151.66 Pending
All others 23.67 22.65 Pending 1 Rate was assigned based on facts available with an adverse inference. Source: 86 FR 7710, February 1, 2021.
The subject merchandise
Commerce’s scope
In the current proceeding, Commerce has defined the scope as follows:12
The scope of this investigation covers uncoated standard welded steel reinforcement wire mesh (wire mesh) produced from smooth or deformed wire. Subject wire mesh is produced in square and rectangular grids of uniformly spaced steel wires that are welded at all intersections. Sizes are specified by combining the spacing of the wires in inches or millimeters and the wire cross-sectional area in hundredths of square inch or millimeters squared. Subject wire mesh may be packaged and sold in rolls or in sheets.
Subject wire mesh is currently produced to ASTM specification A1064/A1064M, which covers carbon-steel wire and welded wire reinforcement, smooth and deformed, for concrete in the following seven styles:
1. 6X6 W1.4/W1.4 or D1.4/D1.4
11 86 FR 7710, February 1, 2021. 12 86 FR 10034, February 18, 2021.

I-11
2. 6X6 W2.1/W2.1 or D2.1/D2.1 3. 6X6 W2.9/W2.9 or D2.9/D2.9 4. 6X6 W4/W4 or D4/D4 5. 6X12 W4/W4 or D4/D4 6. 4X4 W2.9/W2.9 or D2.9/D2.9 7. 4X4 W4/W4 or D4/D4
The first number in the style denotes the nominal spacing between the longitudinal wires and the second number denotes the nominal spacing between the transverse wires. In the first style listed above, for example, “6 X 6” denotes a grid size of six inches by six inches. “W” denotes the use of smooth wire, and “D” denotes the use of deformed wire in making the mesh. The number following the W or D denotes the nominal cross-sectional area of the transverse and longitudinal wires in hundredths of a square inch (i.e., W1.4 or D1.4 is .014 square inches). Smooth wire is wire that has a uniform cross-sectional diameter throughout the length of the wire. Deformed wire is wire with indentations or raised transverse ribs, which results in wire that does not have a uniform cross-sectional diameter throughout the length of the wire. Rolls of subject wire mesh are produced in the following styles and nominal width and length combinations: Style: 6 X 6 W1.4/W1.4 or D1.4/D1.4 (i.e., 10 gauge) Roll Sizes: 5' X 50'
5' X 150' 6' X 150' 5' X 200' 7' X 200' 7.5' X 200'
Style: 6 X 6 W2.1/W2.1 or D2.1/D2.1 (i.e., 8 gauge) Roll Sizes: 5' X 150' Style: 6 X 6 W2.9/W2.9 or D2.9/D2.9 (i.e., 6 gauge) Roll Sizes: 5' X 150'
7' X 200' All rolled wire mesh is included in scope regardless of length.

I-12
Sheets of subject wire mesh are produced in the following styles and nominal width and length combinations: Style: 6 X 6 W1.4/W1.4 or D1.4/D1.4 (i.e., 10 gauge) Sheet Size: 3'6" X 7'
4' X 7' 4' X 7'6" 5' X 10' 7' X 20' 7'6" X 20' 8' X 12'6" 8' X 15' 8' X 20'
Style: 6 X 6 W2.1/W2.1 or D2.1/D2.1 (i.e., 8 gauge) Sheet Size: 5' X 10'
7' X 20' 7'6" X 20' 8' X 12'6" 8' X 15' 8' X 20'
Style: 6 X 6 W2.9/W2.9 or D2.9/D2.9 (i.e., 6 gauge) Sheet Size: 3'6" X 20'
5' X 10' 7' X 20' 7'6" X 20' 8' X 12'6" 8' X 15' 8' X 20'
Style: 6 X 12 W4/W4 or D4/D4 (i.e., 4 gauge) Sheet Size: 8' X 20'
Style: 4 X 4 W2.9/W2.9 or D2.9/D2.9 (i.e., 6 gauge) Sheet Size: 5' X 10'
7' X 20' 7'6" X 20' 8' X 12'6" 8' X 12'8" 8' X 15' 8' X 20'

I-13
Style: 4 X 4 W4/W4 or D4/D4 (i.e., 4 gauge) Sheet Size: 5' X 10'
8' X 12'6" 8' X 12'8" 8' X 15' 8' X 20'
Any product imported, sold, or invoiced in one of these size combinations is within the scope. ASTM specification A1064/A1064M provides for permissible variations in wire gauges, the spacing between transverse and longitudinal wires, and the length and width combinations. To the extent a roll or sheet of welded wire mesh falls within these permissible variations, it is within this scope. ASTM specification A1064/A1064M also defines permissible oversteeling, which is the use of a heavier gauge wire with a larger cross-sectional area than nominally specified. It also permits a wire diameter tolerance of ± 0.003 inches for products up to W5/D5 and ± 0.004 for sizes over W5/D5. A producer may oversteel by increasing smooth or deformed wire diameter up to two whole number size increments on Table 1 of A1064. Subject wire mesh has the following actual wire diameter ranges, which account for both oversteeling and diameter tolerance: W/D No. Maximum
Oversteeling No. Diameter Range (inch)
1.4 (i.e., 10 gauge) 3.4 0.093 to 0.211 2.1 (i.e., 8 gauge) 4.1 0.161 to 0.231 2.9 (i.e., 6 gauge) 4.9 0.189 to 0.253 4.0 (i.e., 4 gauge) 6.0 0.223 to 0.280 To the extent a roll or sheet of welded wire mesh falls within the permissible variations provided above, it is within this scope. In addition to the tolerances permitted in ASTM specification A1064/A1064M, wire mesh within this scope includes combinations where:
1. A width and/or length combination varies by ± one grid size in any direction, i.e., ± 6 inches in length or width where the wire mesh's grid size is “6 X 6”; and/or
2. The center-to-center spacing between individual wires may vary by up
to one quarter of an inch from the nominal grid size specified.

I-14
Length is measured from the ends of any wire and width is measured between the center-line of end longitudinal wires. Additionally, although the subject wire mesh typically meets ASTM A1064/ A1064M, the failure to include certifications, test reports or other documentation establishing that the product meets this specification does not remove the product from the scope. Wire mesh made to comparable foreign specifications (e.g., DIN, JIS, etc.) or proprietary specifications is included in the scope. Excluded from the scope is wire mesh that is galvanized (i.e., coated with zinc) or coated with an epoxy coating. In order to be excluded as galvanized, the excluded welded wire mesh must have a zinc coating thickness meeting the requirements of ASTM specification A641/A641M. Epoxy coating is a mix of epoxy resin and hardener that can be applied to the surface of steel wire.
Tariff treatment
Based upon the scope set forth by Commerce, information available to the Commission indicates that the merchandise subject to these investigations is imported under the following subheadings of the Harmonized Tariff Schedule of the United States (“HTSUS” or “HTS”): 7314.20.0013 and 7314.39.00.14 The 2021 general rate of duty is “Free” for both HTS subheadings 7314.20.00 and 7314.39.00.15 Decisions on the tariff classification and treatment of imported goods are within the authority of U.S. Customs and Border Protection (“CBP”).16
13 HTS 7314.20.00: Grill, netting and fencing, welded at the intersection, of iron or steel wire not
plated or coated with zinc, with a maximum cross-sectional dimension of 3 mm (0.12 inches) or more and having a mesh size of 100 square centimeters (15.5 square inches) or more.
14 HTS 7314.39.00: Grill, netting and fencing, welded at the intersection, of iron or steel wire not plated or coated with zinc, of other dimensions and mesh sizes.
15 HTSUS (2021) Preliminary Revision 3, USITC publication 5161, February 2021, p. 73-28. 16 Although imports of this product from China are subject to additional duties of 25 percent under
Section 301 of the Trade Act of 1974, as amended (19 U.S.C. § 2411), as discussed in greater detail in Part IV, China is not a substantial source of U.S. imports of in-scope standard wire mesh. Carbon and certain alloy steel wire rod (the primary raw material input for standard wire mesh) from China, while subject to the same additional duties, also is subject to antidumping and countervailing duty orders in the United States, and has accounted for less than 0.10 percent of U.S. wire rod import quantities during January 2017 to December 2020. HTS 7213.91.3093: Other bars and rods, hot-rolled, in irregularly wound coils, of iron or nonalloy steel, of circular cross section measuring less than 14 mm in diameter, not tempered, not treated and not partly manufactured, other than of tire-cord, cold-heading, or welding quality. USITC, DataWeb database, https://dataweb.usitc.gov/, retrieved March 1, 2021.

I-15
Standard wire mesh within the scope definition is not and has not been subject to additional duties under Section 232.17 The nonalloy (carbon) steel wire rod, classifiable under applicable HTS headings of chapter 72, that is used as a raw material to produce standard wire mesh, was included in the enumeration of iron and steel articles (imported on or after March 23, 2018) that became subject to the additional 25 percent ad valorem Section 232 duties.18 At this time, imports of steel wire rod originating in Australia, Canada, and Mexico are exempt from duties or quota limits; imports of nonalloy and alloy (other than stainless) steel wire rod originating in Argentina (201 short tons in 2020), Brazil (104,221 short tons), and Korea (62,253 short tons) are exempt from duties but instead are subject to annual quota limits;19 and imports of steel wire rod originating in all other countries are subject to the 25 percent additional duties.20 See also U.S. notes 16(a), 16(b), and 16(e) in subchapter III of HTS chapter
17 Section 232 of the Trade Expansion Act of 1962, as amended (19 U.S.C. 1862), authorizes the President, on advice of the Secretary of Commerce, to adjust the imports of an article and its derivatives that are being imported into the United States in such quantities or under such circumstances as to threaten to impair the national security.
18 Imports of steel mill products originating in Canada and Mexico were initially exempted from these duties, as of March 23, 2018. Adjusting Imports of Steel Into the United States, Presidential Proclamation 9705, March 8, 2018, 83 FR 11625, March 15, 2018.
19 Quota ID 9903.80.46: Bars and rods, hot-rolled, in irregularly wound coils. See the CBP quota bulletin No. QB-20-604-2020, September 4, 2020, at https://www.cbp.gov/trade/quota/bulletins/qb-20-604-2020-absolute-quota-steel-mill-articles-argentina-brazil-and-south-korea for a full list of productgroups as well as their specified quotas and HTS definitions.
20 The President also issued subsequent Proclamations to exempt or adjust these duties for selected U.S. trade partners:
• Presidential Proclamation 9711, March 22, 2018, 83 FR 13361, March 28, 2018, exempted ironand steel mill products originating in Argentina, Australia, Brazil, Canada, the European Union(“EU”) member countries, Korea, and Mexico, as of March 23, 2018.
• Presidential Proclamation 9740, April 30, 2018, 83 FR 20683, May 7, 2018, continued the dutyexemptions for Argentina, Australia, Brazil, but with annual import quota limits on iron and steelmill products originating in Korea, as of May 1, 2018; and did not continue the duty exemptionson iron and steel mill products originating in Canada, Mexico, and the EU member countries, asof June 1, 2018.
• Presidential Proclamation 9759, May 31, 2018, 83 FR 25857, June 5, 2018, continued the dutyexemptions but with annual import quota limits on iron and steel mill products originating inArgentina, Brazil, and Korea, as of June 1, 2018.
• Presidential Proclamation 9772, August 10, 2018, 83 FR 40429, August 15, 2018, continued theduty exemptions on iron and steel mill products originating in Australia, and continued the dutyexemptions with annual import quota limits on iron and steel mill products originating in
(continued...)
I-16
99.21 On March 19, 2018, Commerce’s Bureau of Industry and Security (“BIS”) announced its determination to grant certain product exclusion requests.22 Petitioner Insteel filed tariff-exclusion requests in 2018 for imports of wire rod, but its requests were denied.23
The product
Description and applications24
Standard wire mesh— also referred to as “welded wire cloth,” “welded wire fabric,” or “welded wire reinforcement”— consists of longitudinal and transverse steel wires of uniform size that are welded together at the perpendicular intersections to form grids of uniform dimensions throughout the sheet or roll (figure I-1). U.S. producers reported that they shipped their standard wire mesh predominantly as sheets (81.5 percent of the total) rather than as rolls (18.5 percent) in 2019 (table III-8).25 The individual steel wires in standard wire mesh are either smooth (“plain”), deformed (with a transversely indented or ribbed surface), or even a
(…continued)
Argentina, Brazil, and Korea, as of June 1, 2018; but doubled the duty rate to 50 percent on such imported products originating in Turkey, as of August 13, 2018.
• Presidential Proclamation 9886, May 16, 2019, 84 FR 23421, May 21, 2019, restored the original additional duty rate of 25 percent on steel mill products originating from Turkey, as of May 21, 2019.
• Presidential Proclamation 9894, May 19, 2019, 84 FR 23987, May 23, 2019, restored the duty exemptions on steel mill products originating in Canada and Mexico, as of May 20, 2019.
21 HTSUS (2021) Preliminary Revision 3, USITC publication 5161, February 2021, pp. 99-III-5 to 99-III-7, 99-III-230, and 99-III-236.
22 In Presidential Proclamation 9705, March 8, 2018, that established the Section 232 tariffs, the President also authorized the Secretary of Commerce, in consultation with other appropriate federal agency heads, to provide relief from the additional duties for any steel articles determined “not to be produced in the United States in a sufficient and reasonably available amount or of a satisfactory quality and is also authorized to provide such relief based upon specific national security considerations. Such relief shall be provided for any article only after a request for exclusion is made by a directly affected party located in the United States.” 83 FR 11625, March 15, 2018.
For further information about the procedures for requesting exclusions from the Section 232 steel tariffs, see: 83 FR 12106, March 19, 2018; 83 FR 46026, September 11, 2018; 84 FR 26751 2019, June 10, 2019; and 85 FR 81060, December 14, 2020. See also BIS, “Section 232 National Security Investigation of Steel Imports Information on the Exclusion Process,” June 18, 2019, https://www.bis.doc.gov/index.php/232-steel.
23 Petitioners’ posthearing brief, exh. 6: Declaration of Richard T. Wagner, para. 6. 24 Unless referenced otherwise, information in this section is compiled from the petition, pp. 1, 5-8,
and 16. 25 For further information, see the “U.S. producers’ U.S. shipments and exports” section of Part III.

I-17
combination of both. The subject standard wire mesh is neither galvanized nor epoxy-coated either before or after welding (“uncoated standard wire mesh”).
Figure I-1 Standard wire mesh: Rolls and sheets
Standard wire mesh in rolls (rear) with each fastened from unrolling and sheets (front) bundled together with steel strapping.
Stacks of standard wire mesh in sheets bundled together with steel strapping.
A stack of standard wire mesh in rolls with each fastened from unrolling by steel strapping.
Source: Petition, p. 7.
The input material for standard wire mesh is low-carbon steel wire rod that is drawn or rolled down to the required wire size, which is specified by its cross-sectional diameter or cross-sectional area (“gauge”). Standard wire mesh is produced to meet the requirements of American Society for Testing and Materials (“ASTM”) industry standard ASTM A1064/A1064M,26 in a certain number of common “styles” (wire gauges and grid sizes)27 and dimensions (length and width of a roll or sheet).28 Common wire gauges for manufacturing standard wire mesh are:
26 ASTM A1064 replaced the previous ASTM A185 and ASTM A497 standards. Petition, pp. 5-6. 27 The grid sizes and wire gauges listed in the scope collectively define “standard steel welded wire
mesh.” Petition, p. 5. 28 Petitioner’s conference exh. 6.

I-18
• 10 gauge (“W1.4/D1.4” or 0.014 square inch),
• 8 gauge (“W2.1/D2.1” or 0.021 square inch),
• 6 gauge (“W2.9/D2.9” or 0.029 square inch), and
• 4 gauge (“W4/D4” or 0.040 square inch).29 Wire gauge is commonly designated in terms of its cross-sectional area in hundredths of
a square inch. For example, 10-gauge wire having a cross-sectional area of 0.014 square inches is designated as “W1.4.” The letter “W” denotes smooth wire, while “D” would denote deformed wire. The most common grid sizes are 4-inch x 4-inch and 6-inch x 6-inch. Producers and end users generally measure finished standard wire mesh in terms of the cross-sectional area per foot of width, based on the cross-sectional area of the wire and the grid spacing. For example, W4 wire on 6-inch grids (“centers”) consists of two wires per foot with a total cross-sectional area of 0.080 square inch per foot of width.30
Petitioners contend that, due to the cost advantage31 and perceived bonding and anchoring advantages,32 the majority of standard wire mesh produced and sold in the United States consists of deformed wires (72.8 percent of the total in 2019) rather than smooth wires (27.2 percent) (table III-8).33 While both wire types can be used in most standard wire mesh applications (as long as the tensile, yield, and weld sheer strength requirements, and the steel area per foot or meter requirements are met), there are still some applications for which deformed standard wire mesh would not be suitable, including certain special seismic systems and spiral (piling and poles) reinforcement applications.34 Respondents Deacero and Deacero
29 In the past, Mexican producers sold non-standard wire mesh with a thinner wire gauge of 10.5
(0.093-inch diameter) in the U.S. market. Petition, p. 6; exh. GEN-1: Declaration of Jordi Barrenechea, p. 2; and Pyromation, “Standard Wire Gauge Conversions,” no date, https://www.pyromation.com/Catalog/W03.pdf, retrieved July 24, 2020.
30 Another common industry dimensional designation for standard wire mesh is, for example, “6, 6, 6, 6 standard mesh” which is produced with 6-gauge wire in both the longitudinal and transverse directions spaced to form 6-inch by 6-inch grids. Hearing transcript, p. 20 (Wagner).
31 By deforming the wire, producers typically can save up to about *** percent in wire rod costs to achieve the same surface area of steel. Petitioners’ postconference brief, p. 1; exh. 1; and exh. 6.
32 Reportedly, many customers are confident that deformed standard wire mesh may achieve better reinforcement bonding to concrete because it also offers additional positive mechanical anchorage points along its entire surface for the concrete to bond to the steel, whereas smooth standard wire mesh provides reinforcement bonds to concrete only by the positive mechanical anchorage at each welded wire intersection. Petitioners’ postconference brief, pp. 1-2; exh. 6; and exh. 16.
33 Petitioners’ postconference brief, p. 2. For further information, see the “U.S. producers’ U.S. shipments and exports” section of Part III.
34 Petitioners’ postconference brief, exh. 1; and exh. 16.

I-19
USA observe that purchasing preferences are regionalized in the U.S. market, with purchasers in California prefer smooth standard wire mesh while those in other states prefer deformed standard wire mesh, attributable in-part to historical availability of products in each region.35
Standard wire mesh is ultimately sold as sheets36 or rolls to end users in the construction, agricultural, horticultural, industrial, mining, transportation, and other industries. With its strong and stable structure, standard wire mesh is utilized for internal reinforcement and framing of concrete construction in these industries.37 The high strength and uniform distribution of smaller gauge wires in standard wire mesh provide effective control of cracking in concrete slabs and walls by distributing stresses more evenly.38 Standard wire mesh that is not galvanized or epoxy-coated is most suitable for concrete structures or industrial use where corrosion-resistance is not required. Petitioners and respondents characterize standard wire mesh as a “commodity product”39 that is highly standardized to established specifications for “styles” (the combination of the wire size and the spacing between the wires) and “dimensions” (the length and width of the roll or sheet);40 and highly interchangeable regardless of the source.41
Petitioners and respondents differ about the extent to which (1) engineered wire mesh, and (2) concrete reinforcing bar are interchangeable with the subject standard wire mesh; and in response to a question from Commission staff, petitioners also addressed like-product issues pertaining to (3) coated wire mesh (excluded from Commerce’s scope):
(1) Engineered wire mesh (also referred to as “structural mesh”) shares similar characteristics with standard wire mesh, including assembly from steel wires welded together in a grid pattern, compliance with ASTM A1064 or equivalent specifications, and designed to
35 Respondents’ postconference brief, exh. 1. 36 The three most common sheet sizes for standard wire mesh are 8-feet x 20-feet, 8-feet x 15-feet,
and 7-feet x 20-feet, but the most common size requested by customers varies by geographic region. Other sheet sizes have smaller sales volumes. Email from ***, January 28, 2021.
37 Respondents claimed that standard wire mesh also can be a stand-alone product in certain other end uses. For example, standard wire mesh is utilized in the agricultural sector to provide structural support for crops or plants, and more generally for fencing and decorative uses. Respondents’ postconference brief, exh. 1.
38 See also hearing transcript, p. 20 (Wagner), p. 26 (Barrenechea), pp. 113 and 118 (Morey), and p. 115 (Woltz).
39 Hearing transcript, pp. 19 and 21 (Wagner), p. 27 (Barrenechea), pp. 32-34 (Fisher), and p. 42 (Cannon); and hearing transcript, p. 138 (Olmos).
40 Hearing transcript, pp. 19-20 (Wagner) and p. 27 (Barrenechea). 41 Hearing transcript, p. 21 (Wagner) and p. 27 (Barrenechea).

I-20
reinforce concrete.42 Being custom designed for specific end uses and customers, engineered wire mesh is produced in sheet rather than rolled form,43 often consisting of non-uniform or heavier wires, non-uniform grid sizes, or longer or broader sheet dimensions.44 Hence, the manufacturing process for engineered wire mesh is slower,45 less automated, and more labor intensive than for standard wire mesh.46 Petitioners further argue that employees require more training and different production skills due to the different processes and equipment for manufacturing engineered wire mesh.47 Among the seven domestic firms producing standard and engineered wire mesh, *** reported being capable of producing engineered wire mesh with the same equipment and employees for producing standard wire mesh, subject to ***.48 Both petitioners and respondents concurred that engineered wire mesh, being a
42 Conference transcript, p. 2 (Abascal); respondents’ postconference brief, p. 22; and hearing
transcript, p. 136 (Abascal). 43 *** producer questionnaire response, section V-1. 44 See also hearing transcript, p. 20 (Wagner). Petitioners offered two examples: (1) concrete reinforced pipes, which require much heavier gauge
wires and much longer-length sheets than available with standard wire mesh and (2) concrete reinforced box culverts, which require several different wire gauges and grid sizes throughout the sheet that will match the specific shape and size of the box culvert. Petitioners’ postconference brief, pp. 5 and 8; exh. 6; and respondents’ postconference brief, p. 22.
Sheet sizes of engineered wire mesh are unique to the end use, being based on the project design, ranging up to ***. Email from ***, January 28, 2021.
45 More specifically, Insteel’s equipment can weld approximately *** cross wires per minute for standard wire mesh but only approximately *** cross wires per minute for engineered wire mesh. Petitioners’ posthearing brief, exh. 6: Declaration of Richard T. Wagner, para. 8.
46 Due to this lack of uniform wire and grid sizes, petitioners also claimed that engineered wire mesh cannot be produced on the same highly automated, high-speed manufacturing equipment for standard wire mesh, because the different wire sizes must be manually switched and the nonuniform grid sizes cannot be welded continuously at high speed. Petitioners’ postconference brief, pp. 5-6 and 10; and exh. 6.
Respondents claimed that Deacero can produce both engineered and standard wire mesh on 1 of its 22 machines. Conference transcript, p. 2 (Abascal) and pp. 2-3 (Guerra); respondents’ postconference brief, p. 23; and petitioners’ postconference brief, pp. 6 and 10-11.
47 Hearing transcript, p. 19 (Wagner). 48 ***. *** final phase producer questionnaire response, sections II-4(c) and II-4(d). Moreover, *** reported limited ability to switch production between standard wire mesh and mine
mesh. Final phase producer questionnaire responses, sections II-4(a) and II-4(b). For further information, see the “Substitute products” section of Part II.
I-21
custom designed product,49 is generally sold directly to end users rather than to distributors,50 for specific applications as primary reinforcement to provide load-bearing characteristics to the concrete-steel matrix.51 A concrete project site can contain a mix of both standard and engineered wire mesh,52 but due to its greater cost, engineered wire mesh is not utilized where standard wire mesh will otherwise suffice.53 Petitioners claim that engineered wire mesh is not interchangeable with standard wire mesh,54 and dispute any characterization of the product as a “customized form” of standard wire mesh due to the differences in production processes, end-use applications, and customers.55 Conversely, respondents argued further that interchangeability is also limited and that there are also price variations among different styles and sizes of standard wire mesh;56 and that there are also overlapping characteristics between standard and engineered wire mesh.57
(2) Concrete reinforcing bar (“rebar”) is considered by respondents to be interchangeable with standard wire mesh for reinforcing concrete in almost all cases,58 but it is more costly to fabricate and install rebar. Although standard wire mesh tends to cost more than
49 Hearing transcript, pp. 19 and 112 (Wagner), and p. 118 (Morey); and hearing transcript, p. 136
(Abascal). More specifically, the customer provides drawings from which an engineer calculates the necessary
reinforcement product design, which is submitted to the factory for fabricating a custom-manufactured product. Hearing transcript, p. 112 (Wagner).
50 Petitioners’ postconference brief, pp. 7 and 12; exh. 6; respondents’ postconference brief, p. 22; and hearing transcript, pp. 20-21 (Wagner) and p. 118 (Morey).
51 Hearing transcript, p. 20 (Wagner) and pp. 115-116 (Woltz). 52 Respondents’ postconference brief, p. 22. 53 Petitioners’ postconference brief, p. 8; and exh. 6. 54 Petitioners’ postconference brief, p. 11; exh. 6; conference transcript, pp. 2-3 (Abascal) and pp. 3-4
(Guerra); and hearing transcript, pp. 18-21 (Wagner) and p. 39 (Cannon). 55 Petitioners’ posthearing brief, exh. 1: Index to questions of the Commission, question 14, pp. 46-
47. 56 Conference transcript, pp. 2-3 (Abascal); respondents’ postconference brief, pp. 22-23; and hearing
transcript, pp. 136-137 (Abascal). 57 Conference transcript, p. 3 (Abascal); hearing transcript, pp. 136 and 217 (Abascal), and p. 218
(Jeong); and Respondents’ posthearing brief, p. 14. 58 Conference transcript, p. 2 (Abascal); and respondents’ postconference brief, p. 4; and exh. 7.
Moreover, respondents note that both the Concrete Reinforcing Steel Institute (“CRSI”) and the Wire Reinforcement Institute (“WRI”) publish various guidelines allowing for the substitutability between rebar and standard wire mesh in reinforced concrete slab construction. Respondents’ posthearing brief, Responses to Commissioner Questions, question 6, pp. QR-11 – QR-14; exh. 6: CRSI, Reinforcing Steel in Slabs-on-Grade, Engineering Data Report Number 37; exh. 7: WRI, High-Strength Welded Wire Reinforcement (WWR) Compared with Rebar; exh. 8: WRI, Design Aids for Structural Welded Wire Reinforcement; and exh. 9: WRI, Manual of Standard Practice 2021.

I-22
rebar on a per-unit basis, the cost is counterbalanced by savings on the additional time and labor needed to fabricate and install.59 In the preliminary phase of these investigations, petitioners did not consider rebar to be a substitute for,60 but rather a supplement to, standard wire mesh in some projects.61 In the final phase of these investigations, three domestic producers reported that rebar can be substituted for standard wire mesh in concrete reinforcement, but that changes in rebar prices *** the price of standard wire mesh.62 Selection of standard wire mesh versus rebar for a concrete construction project is decided at the design and engineering stages.63 Any subsequent ***.64 Hence, switching from standard wire mesh to rebar imposes both significant increased amount of reinforcement material and increased time and labor costs.65
(3) Coated wire mesh is considered by petitioners as a separate product than uncoated standard wire mesh for different end uses that require corrosion resistance, especially to preserve the surface appearance of the concrete or where the concrete is regularly exposed to salt water.66 Coated wire mesh undergoes the additional galvanizing (coating with zinc) or
59 Conference transcript, pp. 3-4 (Abascal). For example, selecting standard wire mesh over small-size rebar to reinforce a concrete slab saves
time and money on labor by not having to cut and bend the rebar to length and shape or to tie-down the intersections. Moreover, since standard wire mesh consists of higher-grade steel than rebar, less steel is needed to provide the equivalent reinforcement strength. Conference transcript, pp. 172-173 (Abascal).
60 Petitioners noted that most *** U.S. producers and *** U.S. importers did not report standard wire mesh and rebar as substitute products in their preliminary phase questionnaire responses. Petitioners’ postconference brief, p. 5.
61 For example, to reinforce a concrete wall with a door or window cut-out spaces, rebar can be selected to reinforce the door or window frames as the dimensions of standard wire mesh would not permit its use in those parts of the wall. Petitioners’ postconference brief, p. 6; and exh. 10.
62 Final phase producer questionnaire responses, section IV-13. Conversely, purchaser *** claimed that if the price of rebar falls enough below that of mesh, then
mesh prices need to be adjusted or rebar will be used instead. *** final phase purchaser questionnaire response, section III-6. For further information, see the “Substitute products” section of Part II.
63 Petitioners’ postconference brief, p. 5; and exh. 6. Purchaser *** further commented that rebar is more readily available and offers greater versatility.
*** final phase purchaser questionnaire response, section III-6. For further information, see the “Substitute products” section of Part II.
64 Petitioners’ postconference brief, pp. 5-6; exh. 10; and *** preliminary phase producer questionnaire response, section IV-13.
65 Petitioners’ postconference brief, p. 6; and exh. 10. 66 Petitioners’ postconference brief, pp. 5, 18, and 20; and exh. 6.

I-23
epoxy-coating process at separate, specialized facilities that coat a variety of products.67 The additional processing substantially increases the value of both68 galvanized wire mesh (almost twice as expensive as uncoated standard wire mesh) and epoxy-coated wire mesh (even more expensive than galvanized wire mesh)69 to render them prohibitively expensive where uncoated standard wire mesh is otherwise suitable.70 Although sold mostly to distributors,71 coated wire mesh is not considered “standard” by the industry or its domestic customers, according to petitioners, but is only purchased for specific end uses and is not typically stocked in the same manner as uncoated standard wire mesh.72
Purchasers identified fiberglass rebar, synthetic or steel fibers, and post-tension steel strand as substitutes for standard wire mesh for reinforcing concrete, but *** reported that fiberglass rebar does not have a large enough share of the reinforcement market to have an effect.73
Manufacturing processes74
Because all subject standard wire mesh is produced from a single wire gauge with uniform grid spacing throughout the sheet or roll, manufacturing is a high-speed and highly automated process.75 The high degree of product standardization enables standard wire mesh producers to set up their manufacturing machinery and equipment to produce common specification (i.e., a “continuous-run product”) runs and stock standard wire mesh in inventory.76 Conversely, to switch from one mesh size or style to another requires halting production to change all machine settings, which could take up to a full day depending on the
67 Conference transcript, pp. 2-3 (Wagner); petitioners’ postconference brief, pp. 6, 19, 20; and exh.
6. 68 Petitioners’ postconference brief, p. 18. 69 Petitioners’ postconference brief, pp. 19-21; and exh. 6. 70 Petitioners’ postconference brief, p. 20. 71 Petitioners’ postconference brief, pp. 7 and 21. 72 Petitioners’ conference exh. 6. 73 Final phase purchaser questionnaires, section III-6. For further information, see the “Substitute
products” section of Part II. 74 Unless referenced otherwise, information in this section is compiled from the petition, pp. 8-9, and
16-17. 75 Conference transcript, p. 5 (Guerra); petitioners’ conference exh. 5 and exh. 6; and hearing
transcript, p. 19 (Wagner) and p. 27 (Barrenechea). 76 Petitioners’ conference exh. 6 and exh. 10; and hearing transcript, pp. 19-20 (Wagner) and p. 27
(Barrenechea).

I-24
specific machine(s).77 According to petitioners,78 there are no significant differences in the manufacturing process in the United States, Mexico, and elsewhere. Likewise, respondents stated that the process in Mexico is largely the same as that described in the petition.79
The manufacturing process begins with cold drawing or cold rolling of hot-rolled, low-carbon steel wire rod down to the required size of smooth or deformed wire, respectively.80 For the subject standard wire mesh, the wire is not galvanized or coated prior to welding.
An automatic feeder conveys the wire in longitudinal, parallel rows into a welding machine. As the rows move through the welding machine, a second automatic feeder places a transverse wire on top of and perpendicular to the parallel rows to create equally spaced rectangles or squares. At the intersections of the longitudinal and transverse wires, the welding machine joins the intersections together, typically with electrical resistance welds.81 The weld heats the steel to produce high-strength bonds, thereby setting the wires in their proper positions. The pressure, intensity, and duration of the electrical current of the weld are controlled for the specific product. After each row of welds, the parallel wires are pulled ahead by the machine to the next appropriate interval, where another perpendicular transverse wire is applied and welded at intersections with the parallel rows. This repetitive process creates a uniformly gridded sheet as the welding machine allows for precise dimensional control.
After the finished standard wire mesh reaches the desired length, it is cut by machine into panels or sheets of the dimensions specified by the customer. A separate bending machine coils the finished standard wire mesh into roll form. Standard wire mesh in sheets or rolls is
77 Conference transcript, p. 2 (Guerra). 78 Petition, pp. 16-17; petitioners’ postconference brief, exh. 1. 79 A notable difference is the descaling process to clean the surface of the wire rod, either
mechanically with rolls and brushes or chemically by coating. Deacero relies on a mechanical descaling while other producers, including ***, instead rely on chemical descaling. Chemical descaling is the costlier process, which can add approximately *** per metric ton (*** per short ton) to the price of the finished standard wire mesh. Respondents’ postconference brief, exh. 1.
80 Hearing transcript, p. 18 (Wagner). Among domestic standard wire mesh producers, *** own input wire rod. ***. All of the others
purchase from outside steel mills. Petitioners’ postconference brief, exh. 1; final phase producer questionnaire responses, section III-4b and III-7. Deacero produces all the input wire rod for its production of standard wire mesh. Respondents’ postconference brief, exh. 1; U.S. producer questionnaires, response to III-7; e-mail from ***, July 24, 2020. For further information about domestic standard wire mesh producers’ procurement arrangements for wire rod, see the “Cost of goods sold and gross profit or loss” section of Part VI.
81 Hearing transcript, p. 18 (Wagner).
I-25
bundled together with steel strapping (see figure I-1). If requested by the customer, the bundles are strapped to wood boards for ease of transport and handling. Most customers are distributors that stock the standard styles and dimensions, but some are end users that purchase standard products for construction projects directly from the standard wire mesh producers. Domestic producers sell standard wire mesh on a transaction basis rather than relying on either contracts or supply agreements.82
Domestic like product issues
The Commission’s decision regarding the appropriate domestic product(s) that are “like” the subject imported product is based on a number of factors including: (1) physical characteristics and uses; (2) interchangeability; (3) channels of distribution; (4) common manufacturing facilities, production processes, and production employees; (5) customer and producer perceptions; and (6) price. Information regarding these factors is discussed below.
In the preliminary phase of these investigations the petitioners contended that the Commission should define a single domestic like product co-extensive with the scope of these investigations encompassing only standard wire mesh.83 For the purpose of a preliminary determination, respondents agreed with a single domestic like product,84 but contended that the Commission should consider whether the domestic like product should include engineered wire mesh in the event of a final phase investigation.85 Petitioners also contended that Respondents’ arguments to the Commission were inconsistent with their position before Commerce, where Respondents argued that engineered mesh should be excluded from the scope.86
In the preliminary phase the Commission defined a single domestic like product consisting of standard wire mesh coextensive with the scope.87 The Commission stated that notwithstanding some general overlap between engineered mesh and wire mesh in terms of physical characteristics, the record overall indicated clear dividing lines in terms of end uses,
82 Petitioners’ conference exh. 10. 83 Petitioners’ postconference brief, p. 3. 84 Respondents’ opening remarks and witness testimony, in opposition of the petition, p. 3; and
Respondents’ postconference brief, p. 24. 85 Respondents’ postconference brief, p. 21. 86 Petitioners’ Postconference Brief, Exh. 1 and Exh. 5 87 Standard Steel Welded Wire Mesh from Mexico, Inv. Nos. 701-TA-653 and 731-TA-1527
(Preliminary), USITC Publication 5109, August 2020, (“Preliminary Publication”) p. 12.

I-26
production processes and facilities in the United States, channels of distribution, and producer and customer perceptions.88
In their comments on draft questionnaires Respondents requested that the Commission collect data on engineered wire mesh to render a determination finding engineered wire mesh as part of the same domestic like product as standard wire mesh.89
The Commission asked U.S. producers and purchasers to comment on the comparability of engineered wire mesh and standard wire mesh, based on the Commission’s six like product factors. As shown in table I-4, the majority of responding U.S. producers reported “somewhat” or “never” for all six like product factors while responses from U.S. purchasers were mixed. For additional information on responses from U.S. producers and U.S. purchasers see Appendix D. Table I-4 Standard wire mesh vs. engineered wire mesh: U.S. producers' and U.S. purchasers' comparisons of standard wire mesh and engineered wire mesh
Factor U.S. producers U.S. purchasers
F M S N F M S N Count of firms In-scope Standard wire mesh vs. engineered wire mesh-- Physical characteristics --- --- 1 9 --- 3 3 1
Interchangeability --- --- 1 9 --- 1 3 3 Channels --- --- 2 8 3 1 1 1 Manufacturing --- --- 3 7 1 --- 3 1 Perceptions --- --- --- 10 --- 1 2 2 Price --- --- --- 9 --- --- 5 1
Note: F=Fully comparable, M=Mostly comparable, S=Somewhat comparable, N=Never or not-at-all comparable. Source: Compiled from data submitted in response to Commission questionnaires.
88 Preliminary Publication p. 12. 89 Respondents comments on draft questionnaires, October 6, 2020, p. 2.

I-27
Physical characteristics and uses
The petitioners state that standard wire mesh has uniform wire and grid sizes and that engineered wire mesh is custom tailored to each specific project and that producers do not preproduce or stock engineered wire mesh.90 Additionally, petitioners reported that standard wire mesh is used in building and construction projects and generally serves to control concrete cracking whereas, engineered wire mesh is used as primary reinforcement.91 Petitioners contend that there is no overlap with respect to end uses of engineered wire mesh and standard wire mesh.92
Respondents state that engineered wire mesh and standard wire mesh share similar characteristics and that engineered wire mesh is steel welded wire mesh that is custom-made for specific projects.93 Although engineered wire mesh is often made from heavier gauge wire with grid styles, Respondents report that engineered wire mesh and standard wire mesh may be produced from the same wire gauge.94 Finally, Respondents argue that engineered wire mesh and standard wire mesh are both used in construction and concrete reinforcement.95
Interchangeability
Petitioners and Respondents agree that, on account of its customized nature, engineered wire mesh is not usually interchangeable with standard wire mesh.96 However, respondents contend that there is limited interchangeability between different styles and sizes of standard wire mesh.97
90 Hearing transcript, p. 26 (Wagner). 91 Hearing transcript, p. 25 (Wagner). 92 Hearing transcript, p. 131 (Morey). 93 Respondents’ prehearing brief, pp. 36-37. 94 Respondents’ prehearing brief, p. 37. 95 Ibid. 96 Petitioners’ posthearing brief, p. 50; and Respondents comments on draft questionnaires,
October 6, 2020, p. 4. 97 Hearing transcript, p. 252 (Jeong).

I-28
Channels of distribution
Petitioners state that due to standard styles and dimensions, standard wire mesh is continuously sold to distributors who stock standard sizes whereas engineered wire mesh is often sold directly to end-users.98
Respondents report that engineered wire mesh is often sold directly to end-users and standard wire mesh is often sold to distributors.99 Nevertheless, respondents contend that engineered wire mesh may be sold to both distributors and end-users, and both engineered wire mesh and standard wire mesh are used by end-users.100 Furthermore, respondents note that engineered wire mesh and standard wire mesh are marketed by U.S. producers on the same brochures and websites.101
Table I-5 presents U.S. producers’ shipments of engineered wire mesh and standard wire mesh by channels of distribution. During the period for which data were collected, more than *** percent of U.S. producers’ U.S. shipments of standard wire mesh were to distributors, while more than *** percent of U.S. producers’ U.S. shipments of engineered wire mesh were to end-users. Table I-5 Standard wire mesh and engineered wire mesh: U.S. producers' channels of distribution by product type
Item Calendar year January to September
2017 2018 2019 2019 2020 Share of U.S. shipments (percent) U.S. producers' U.S. shipments of standard wire mesh.-- to Distributors *** *** *** *** ***
to End-users *** *** *** *** *** U.S. producers' U.S. shipments of engineered wire mesh.-- to Distributors *** *** *** *** ***
to End-users *** *** *** *** *** Source: Compiled from data submitted in response to Commission questionnaires.
98 Hearing transcript, p. 26 (Wagner). 99 Respondents’ prehearing brief, p. 39. 100 Ibid. 101 Ibid.

I-29
Customer and producer perceptions
Petitioners contend that customers perceive all standard welded wire mesh to be a single product and other types of mesh to be a different product.102 Additionally, they report nearly no overlap in customers for engineered wire mesh and standard wire mesh.103 Petitioners testified that sales staff and sale practices differ amongst engineered wire mesh and standard wire mesh.104
Respondents contend that customers perceive engineered wire mesh and standard wire mesh to be within the same category of wire mesh products used in construction applications.105 Although customers do not perceive engineered wire mesh and standard wire mesh to be interchangeable, respondents report that customers do not perceive standard wire mesh in different dimensions and styles to be interchangeable.106
Manufacturing facilities and production employees
Petitioners report that standard wire mesh is produced using the same high-speed highly automated production process and engineered wire mesh cannot be produced on the same equipment due its physical characteristics.107
Respondents report engineered wire mesh and standard wire mesh share manufacturing facilities, production processes, and employees.108
***, reported that the process to produce engineered wire mesh and standard wire mesh ***.109 The petitioners report, ***.110 *** further indicates that ***
102 Petitioners’ postconference brief, p. 7. 103 Ibid. 104 Hearing transcript, p. 26 (Wagner). 105 Respondents’ prehearing brief, pp. 39-40. 106 Ibid. 107 Petitioners’ prehearing brief, pp. 9-10. 108 Respondents’ prehearing brief, p. 40. 109 Email from ***, January 28, 2021. 110 Email from ***, January 28, 2021

I-30
.111 As shown in table I-6, *** reported producing engineered wire mesh on the same
equipment used to produce standard wire mesh and *** firms reported producing engineered wire mesh on separate equipment.112 Table I-6 Standard wire mesh and engineered wire mesh: U.S. producers' manufacturing facilities, 2019
Number of firms
(count) Production: Standard wire mesh ***
Engineered wire mesh: On same equipment and machinery used to produce standard wire mesh *** On different equipment ***
Note: In 2019, *** reported producing both standard wire mesh and engineered wire mesh on the same equipment. In that year, *** accounted for *** percent of standard wire mesh production and *** percent of engineered wire mesh production. Source: Compiled from data submitted in response to Commission questionnaires.
111 *** U.S. producer questionnaire response, section V-1. 112 ***. Emails from ***, January 24, 2021; and ***, January 25, 2021; and Staff telephone interview
with ***, January 25, 2021.

I-31
Price
Petitioners contend that all standard wire mesh is priced similar in range, and that engineered wire mesh and wire mesh that have been galvanized or epoxy coated are higher priced.113
Respondents report that engineered wire mesh is generally more expensive than standard wire mesh.114 Nevertheless, respondents contend there is a broad range of prices and higher-end standard wire mesh could be priced *** than lower-end engineered wire mesh.115
Table I-7 presents the average unit value of U.S. producers’ U.S. shipments of standard wire mesh and engineered wire mesh. During 2017-19, January-September 2019, and January-September 2020 the average unit value of U.S. producers’ U.S. shipments of engineered wire mesh was between $*** per short ton and $*** per short ton higher than the average unit value of their U.S. shipments of standard wire mesh.
Table I-7 Standard wire mesh and engineered wire mesh: U.S. producers’ U.S. shipments average unit value of standard wire mesh and engineered wire mesh
Item Calendar year January to September
2017 2018 2019 2019 2020 Unit Value (dollars per short ton)
U.S. producers U.S. shipments.-- Standard wire mesh *** 973 907 927 766
Engineered wire mesh *** *** *** *** *** Source: Compiled from data submitted in response to Commission questionnaires.
113 Petitioners’ postconference brief, p. 7. 114 Respondents’ prehearing brief, pp. 40-41. 115 Ibid.


II‐1
Part II: Conditions of competition in the U.S. market
U.S. market characteristics
Standard wire mesh is a metal wire screen made from low carbon steel wire rod that is drawn or rolled into smooth or deformed wire and welded into a sheet or roll of uniformly‐sized grids. These grids are then welded at the intersections of the parallel and perpendicular wires. Most standard wire mesh sold in the United States is in sheet form and composed of deformed wire.
Standard wire mesh can be made to ASTM standards,1 although other specifications exist in the market. Standard wire mesh is commonly sold in 4X4 and 6X6 inch dimensions.2
Standard wire mesh is used in a variety of downstream products, primarily in the construction, agricultural, horticultural, industrial, mining, and transportation industries. Standard wire mesh provides internal reinforcement/framing for concrete construction, and helps distribute stress in concrete slab and walls to prevent cracks.3
Apparent U.S. consumption, in terms of quantity, of standard wire mesh in 2019 was *** percent lower than in 2017. Apparent U.S. consumption was *** percent higher in January‐September 2020 than in January‐September 2019.
1 ASTM Specification A1064/A1064M. 2 Petition, pp. 5‐7. 3 Petition, pp. 7‐8.

II‐2
U.S. purchasers
The Commission received 18 usable questionnaire responses from firms that have purchased standard wire mesh since January 1, 2017.4 5 Fifteen responding purchasers are distributors, one is a non‐distributor supplier, one is a retailer, and one is a wholesaler‐broker. In general, responding U.S. purchasers were located in the Central Southwest, Midwest, and Southeast regions.6 Large purchasers of standard wire mesh include ***.
4 The following firms provided purchaser questionnaire responses: ***. 5 Of the 18 responding purchasers, 15 purchased the domestic standard wire mesh, 10 purchased
imports of the subject merchandise from Mexico, and 2 purchased imports of standard wire mesh from other sources.
6 U.S. producers and importers were asked to identify purchasers and their locations. For more information, please refer to Appendix G.

II-3
Channels of distribution
As presented in table II-1, U.S. producers and importers sold mainly to distributors. In
2019, more than 95 percent of all U.S. shipments of standard wire mesh were to distributors.
Table II-1 Standard wire mesh: U.S. producers’ and importers’ U.S. shipments, by sources and channels of distribution, 2017-19, January-September 2019, and January-September 2020
Item
Period
Calendar year January-
September
2017 2018 2019 2019 2020
Share of reported shipments (percent)
U.S. producers: Distributors *** *** *** *** ***
End users *** *** *** *** ***
U.S. importers: Mexico Distributors *** *** *** *** ***
End users *** *** *** *** ***
U.S. importers: Nonsubject Distributors *** *** *** *** ***
End users *** *** *** *** ***
U.S. importers: All sources Distributors *** *** *** *** ***
End users *** *** *** *** ***
Source: Compiled from data submitted in response to Commission questionnaires.
Geographic distribution
U.S. producers and importers reported having sold standard wire mesh to all regions in
the contiguous United States since January 1, 2017 (table II-2). For U.S. producers, *** percent
of sales were within 100 miles of their production facility, *** percent were between 101 and
1,000 miles, and *** percent were over 1,000 miles. Importers sold *** percent within 100
miles of their U.S. point of shipment, *** percent between 101 and 1,000 miles, and ***
percent over 1,000 miles. Deacero, which accounted for *** percent of imports from Mexico in
2019, contends that it is constrained from serving geographic markets aside from southern
border states in the United States due to the prohibitive costs of freight shipping.7
7 Hearing transcript, p. 128 (Guerra). Deacero reported shipping *** percent of its imports of
standard wire mesh more than 1,000 miles from its U.S. point of shipment. Deacero Importer Questionnaire, III-9.

II‐4
Table II-2 Standard wire mesh: Geographic market areas in the United States served by U.S. producers and importers
Region U.S. producers Subject U.S. importers
Northeast 4 2 Midwest 7 4 Southeast 9 5 Central Southwest 7 5 Mountain 8 4 Pacific Coast 6 3 Other --- --- All regions (except Other) 1 1 Reporting firms 11 5 Note: All other U.S. markets, including AK, HI, PR, and VI. Source: Compiled from data submitted in response to Commission questionnaires.
Supply and demand considerations
U.S. supply
Table II‐3 provides a summary of the supply factors regarding standard wire mesh from U.S. producers and from Mexico. Responding Mexican producers reported higher capacity utilization than domestic producers, as domestic producers reported approximately *** the production capacity of Mexican producers. Both U.S. producers and Mexican producers reported serving primarily their home markets with very few shipments to countries other than the United States or Mexico.
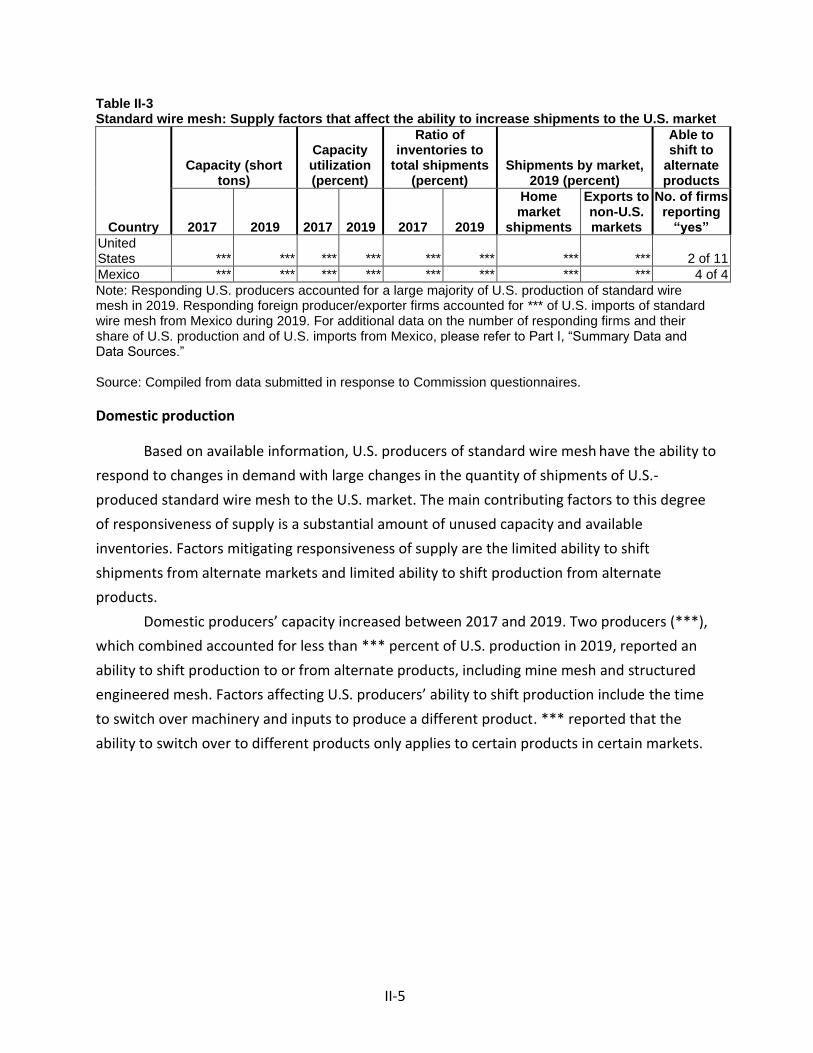
II-5
Table II-3 Standard wire mesh: Supply factors that affect the ability to increase shipments to the U.S. market
Country
Capacity (short tons)
Capacity utilization (percent)
Ratio of inventories to
total shipments (percent)
Shipments by market, 2019 (percent)
Able to shift to
alternate products
2017 2019 2017 2019 2017 2019
Home market
shipments
Exports to non-U.S. markets
No. of firms reporting
“yes”
United States *** *** *** *** *** *** *** *** 2 of 11
Mexico *** *** *** *** *** *** *** *** 4 of 4
Note: Responding U.S. producers accounted for a large majority of U.S. production of standard wire mesh in 2019. Responding foreign producer/exporter firms accounted for *** of U.S. imports of standard wire mesh from Mexico during 2019. For additional data on the number of responding firms and their share of U.S. production and of U.S. imports from Mexico, please refer to Part I, “Summary Data and Data Sources.” Source: Compiled from data submitted in response to Commission questionnaires.
Domestic production
Based on available information, U.S. producers of standard wire mesh have the ability to
respond to changes in demand with large changes in the quantity of shipments of U.S.-
produced standard wire mesh to the U.S. market. The main contributing factors to this degree
of responsiveness of supply is a substantial amount of unused capacity and available
inventories. Factors mitigating responsiveness of supply are the limited ability to shift
shipments from alternate markets and limited ability to shift production from alternate
products.
Domestic producers’ capacity increased between 2017 and 2019. Two producers (***),
which combined accounted for less than *** percent of U.S. production in 2019, reported an
ability to shift production to or from alternate products, including mine mesh and structured
engineered mesh. Factors affecting U.S. producers’ ability to shift production include the time
to switch over machinery and inputs to produce a different product. *** reported that the
ability to switch over to different products only applies to certain products in certain markets.

II‐6
Subject imports from Mexico
Based on available information, producers of standard wire mesh from Mexico have the ability to respond to changes in demand with moderate changes in the quantity of shipments of standard wire mesh to the U.S. market. The main contributing factors to this degree of responsiveness of supply are the availability of unused capacity, the ability to shift production from alternate products, and possibly some ability to shift shipments from the Mexican market to the U.S. market.
Unlike the domestic industry, reported capacity in Mexico decreased between 2017 and 2019. All responding Mexican producers reported an ability to produce other products using the same equipment as standard wire mesh, including engineering mesh and column reinforcement. Factors affecting foreign producers’ ability to shift production include change‐over time, machinery parts, and client commitments.
Imports from nonsubject sources
Imports of standard wire mesh from nonsubject sources accounted for *** percent of total U.S. imports in 2019. Imports from *** accounted for all such imports.
Supply constraints
One of eleven responding producers, two of six importers, and six of eighteen purchasers reported supply constraints. *** reported that in 2018, due to increased demand, it placed some customers on allocation to manage its pipeline based on production and availability. U.S. producer/importer *** reported supply constraints due to availability and price. Purchaser *** reported that it has had to cancel a number of orders due to suppliers’ inability to provide timely delivery, especially for U.S.‐produced standard wire mesh. Purchaser *** reported that the domestic industry had reliability issues since it accepted too many orders before price increases. Purchaser *** reported that in 2020, U.S. producers would not take orders. Purchaser *** reported that COVID‐19 constrained supply, and *** reported that Mexican producer Deacero had COVID‐related production issues.

II‐7
New suppliers
Mid‐South began production of standard wire mesh in 2018. Two of eighteen purchasers indicated that new suppliers entered the U.S. market since January 1, 2017. *** reported that Peninsula Steel was a new supplier, and *** reported that Alabama Wire was a recent entrant into the market.8
U.S. demand
Based on available information, the overall demand for standard wire mesh is likely to experience moderate changes in response to changes in price. The main contributing factors are the small cost share of standard wire mesh in most of its end‐use products and some ability to use substitute products for the same applications in which standard wire mesh is used.
End uses and cost share
U.S. demand for standard wire mesh depends on the demand for U.S.‐produced downstream products. Reported end uses include concrete reinforcement and residential and non‐residential concrete construction.
Standard wire mesh accounts for a very small share of the cost of the end‐use products in which it is used. Two firms (U.S. producers ***) reported cost shares of 0.5 to 1.0 percent in concrete construction.
8 This firm is not believed to produce or import standard wire mesh at this time. See email from ***, January 28, 2021.

II‐8
Business cycles
Eight of 11 responding U.S. producers, 4 of 6 importers, and nine of 18 purchasers indicated that the market was subject to business cycles or distinct conditions of competition. A number of firms reported that weather/seasonality was a condition of competition.9 Similarly, U.S. producer *** reported that concrete can only be poured at certain times of the year. Two of 11 producers, 1 of 6 importers, and 3 of 18 purchasers reported that standard wire mesh was subject to distinct conditions of competition. Purchasers *** reported that standard wire mesh demand depends on construction trends. Producers *** and *** reported that increased imports were a distinct condition, and producer *** reported that there is a rush in standard wire mesh demand in the spring and fall seasons. One of 10 producers, 2 of 5 importers, and 7 of 15 purchasers reported that there had been changes to business cycles or conditions of competition since January 1, 2017. Purchaser *** reported that weather, construction demand, and machine availability had changed, while purchasers *** and *** reported COVID‐19 as a change.
Construction spending generally experienced year‐over year increases during peak months (figure II‐1).
9 These firms included U.S. producers ***, ***, ***, producer/importers *** and ***, importer ***, and purchasers ***.

II‐9
Figure II-1 Total U.S. construction spending, by month, January 2017-November 2020
Source: U.S. Census Bureau, https://www.census.gov/econ/currentdata/dbsearch?program=VIP&startYear=2002&endYear=2021&categories=AXXXX&dataType=T&geoLevel=US&adjusted=1¬Adjusted=0&errorData=0 (accessed January 25, 2021).
Demand trends
Pluralities of U.S. producers and importers reported an increase in U.S. demand for standard wire mesh since January 1, 2017, while a plurality of purchasers reported U.S. demand for standard wire mesh fluctuates (table II‐4). A majority of responding U.S. producers reported a decrease in demand outside the United States, while two importers each reported a decrease or a fluctuation in such demand, and two purchasers each reported that such demand fluctuated or did not change.
Table II-4 Standard wire mesh: Firms’ responses regarding U.S. demand and demand outside the United States
Item Increase No change Decrease Fluctuate Demand in the United States U.S. producers 5 3 --- 2 Importers 3 1 --- 2 Purchasers 5 4 --- 6 Demand outside the United States U.S. producers 1 --- 4 1 Importers 1 --- 2 2 Purchasers --- 2 --- 2
Source: Compiled from data submitted in response to Commission questionnaires.

II‐10
Substitute products
Most U.S. producers (8 of 11) reported that there were no substitutes for standard wire mesh, while equal numbers of importers (two each) reported that there either were substitutes or there were no substitutes, and most purchasers (12 of 17) reported that there were substitutes. While respondents contended that wire mesh is a substitute for rebar, they reported that “customers would have to expend more cost to fabricate and install rebar”.10 Eight purchasers that identified substitutes for standard wire mesh identified rebar as a substitute.11 Purchaser *** reported that rebar is a more readily available commodity with increased versatility, while *** reported that if the price of rebar falls enough below that of mesh, then “mesh prices need to be adjusted or people will use rebar instead.” Two purchasers reported that like wire mesh, rebar also follows scrap steel price trends. Purchasers also identified fiber/steel fiber and prestressed concrete strand as substitutes; however, purchaser *** reported that fiberglass rebar does not make up a large enough percentage of the reinforcement market to have an effect.
Substitutability issues
The degree of substitution between domestic and imported standard wire mesh depends upon such factors as relative prices, quality (e.g., grade standards, defect rates, etc.), and conditions of sale (e.g., price discounts/rebates, lead times between order and delivery dates, reliability of supply, product services, etc.). Based on available data, staff believes that there is a high degree of substitutability between domestically produced standard wire mesh and standard wire mesh imported from Mexico.
10 Conference transcript, p. 4 (Abascal). 11 See also Steel Concrete Reinforcing Bar from Mexico and Turkey, Investigation Nos. 701‐TA‐502
and 731‐TA‐1227 (Review), USITC Publication 5122, October 2020, p. I‐25 (“According to industry representatives, welded wire mesh made from deformed steel wire can substitute for rebar in certain applications. According to some industry estimates, 80 percent of the U.S. rebar market is in sizes that could potentially be replaced by welded wire mesh products.”) and p. II‐23 (“Wire mesh was the most frequently mentioned substitutes for rebar…”).
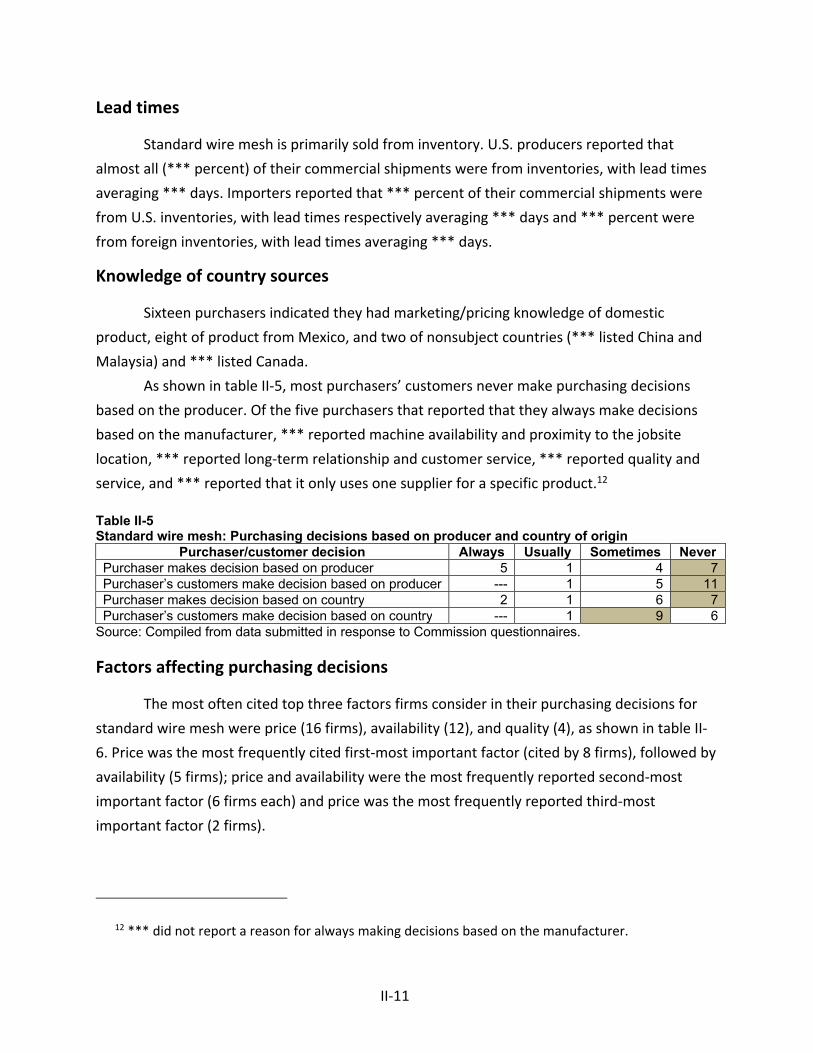
II‐11
Lead times
Standard wire mesh is primarily sold from inventory. U.S. producers reported that almost all (*** percent) of their commercial shipments were from inventories, with lead times averaging *** days. Importers reported that *** percent of their commercial shipments were from U.S. inventories, with lead times respectively averaging *** days and *** percent were from foreign inventories, with lead times averaging *** days.
Knowledge of country sources
Sixteen purchasers indicated they had marketing/pricing knowledge of domestic product, eight of product from Mexico, and two of nonsubject countries (*** listed China and Malaysia) and *** listed Canada.
As shown in table II‐5, most purchasers’ customers never make purchasing decisions based on the producer. Of the five purchasers that reported that they always make decisions based on the manufacturer, *** reported machine availability and proximity to the jobsite location, *** reported long‐term relationship and customer service, *** reported quality and service, and *** reported that it only uses one supplier for a specific product.12 Table II-5 Standard wire mesh: Purchasing decisions based on producer and country of origin
Purchaser/customer decision Always Usually Sometimes Never Purchaser makes decision based on producer 5 1 4 7 Purchaser’s customers make decision based on producer --- 1 5 11 Purchaser makes decision based on country 2 1 6 7 Purchaser’s customers make decision based on country --- 1 9 6
Source: Compiled from data submitted in response to Commission questionnaires.
Factors affecting purchasing decisions
The most often cited top three factors firms consider in their purchasing decisions for standard wire mesh were price (16 firms), availability (12), and quality (4), as shown in table II‐6. Price was the most frequently cited first‐most important factor (cited by 8 firms), followed by availability (5 firms); price and availability were the most frequently reported second‐most important factor (6 firms each) and price was the most frequently reported third‐most important factor (2 firms).
12 *** did not report a reason for always making decisions based on the manufacturer.

II‐12
Table II-6 Standard wire mesh: Ranking of factors used in purchasing decisions as reported by U.S. purchasers, by factor
Factor First Second Third Total Price 8 6 2 16 Availability 5 6 1 12 Quality 2 1 1 4 All other factors 3 4 9 NA
Note: Other factors include payment terms, reliability, service, and location. Source: Compiled from data submitted in response to Commission questionnaires.
Eight of 17 purchasers reported that they usually purchase the lowest‐priced product, five reported they sometimes do, and four reported always purchasing the lowest‐priced product.
Importance of specified purchase factors
Purchasers were asked to rate the importance of 17 factors in their purchasing decisions (table II‐7). The factors rated as very important by more than half of responding purchasers were availability and quality meets industry standards (17 purchasers each); product consistency and reliability of supply (16); delivery time and price (15), delivery terms and U.S. transportation costs (10). A majority of responding purchasers rated minimum quantity requirements as not important in their purchasing decisions. Table II-7 Standard wire mesh: Importance of purchase factors, as reported by U.S. purchasers, by factor
Factor Very
important Somewhat important
Not important
Availability 17 1 --- Delivery terms 10 8 --- Delivery time 15 3 --- Discounts offered 5 10 3 Durability 7 7 4 Minimum quantity requirements 1 6 11 Packaging 6 12 --- Payment terms 8 8 2 Price 15 3 --- Product consistency 16 2 --- Product range 2 13 3 Quality meets industry standards 17 1 --- Quality exceeds industry standards 5 10 3 Reliability of supply 16 2 --- Steel alloy 3 8 7 Technical support/service 4 10 4 U.S. transportation costs 10 7 1 Source: Compiled from data submitted in response to Commission questionnaires.

II‐13
Supplier certification
Only two of seventeen responding purchasers require their suppliers to become certified or qualified to sell standard wire mesh to their firm. No purchaser reported that a domestic or foreign supplier had failed in its attempt to qualify standard wire mesh or had lost its approved status since 2017.

II‐14
Changes in purchasing patterns
Purchasers were asked about changes in their purchasing patterns from different sources since 2017; responses were mixed (table II‐8). A reason a purchaser increased purchases from a domestic producer was that it was its sole supplier. Reasons two purchasers decreased purchases of domestic product were prohibitive cost and lead time and more machine availability.
Five of 18 responding purchasers reported that they had changed suppliers since January 1, 2017. Purchaser *** reported that it had ***. *** reported that it had added *** as suppliers, while *** added ***. Table II-8 Standard wire mesh: Changes in purchase patterns from U.S., subject, and nonsubject countries
Source of purchases Did not
purchase Decreased Increased Constant Fluctuated United States 1 3 8 1 3 Mexico 5 2 5 1 2 Other 9 --- 1 --- 1
Source: Compiled from data submitted in response to Commission questionnaires.
Importance of purchasing domestic product
Sixteen purchasers reported that most or all of their purchases did not require purchasing U.S.‐produced product. Ten reported that domestic product was required by law (12.2 percent of overall reported purchases), seven reported it was required by their customers (8.8 percent), and two reported other preferences for domestic product (1.3 percent).

II‐15
Comparisons of domestic products, subject imports, and nonsubject imports
Purchasers were asked a number of questions comparing standard wire mesh produced in the United States, subject countries, and nonsubject countries. First, purchasers were asked for a country‐by‐country comparison on the same 17 factors (table II‐9) for which they were asked to rate the importance.
Most purchasers reported that U.S.‐produced standard wire mesh and standard wire mesh from Mexico were comparable on all factors. Most purchasers reported that U.S. and nonsubject standard wire mesh were comparable on all factors except for delivery time (an equal number of purchasers, three each, found U.S.‐produced standard wire mesh to be superior or comparable).
Table II-9 Standard wire mesh: Purchasers’ comparisons between U.S.-produced and imported product
Factor U.S. vs. Mexico
U.S. vs. nonsubject
Mexico vs. nonsubject
S C I S C I S C I Availability 4 7 2 1 5 --- 2 1 --- Delivery terms 3 9 1 1 5 --- 2 1 --- Delivery time 3 6 3 3 3 --- 2 1 --- Discounts offered 1 12 --- --- 6 --- --- 3 --- Durability 1 12 --- --- 6 --- --- 3 --- Minimum quantity requirements 2 11 --- --- 6 --- --- 3 --- Packaging 1 11 1 1 5 --- 1 2 --- Payment terms 1 11 --- --- 6 --- --- 3 --- Price --- 9 4 --- 5 1 --- 3 --- Product consistency 2 11 --- --- 6 --- --- 3 --- Product range 3 10 --- 1 5 --- 1 2 --- Quality meets industry standards 4 10 --- --- 6 --- --- 3 --- Quality exceeds industry standards 3 9 --- 1 5 --- --- 3 --- Reliability of supply 4 6 3 2 4 --- 2 1 --- Steel alloy 1 11 --- --- 5 --- --- 3 --- Technical support/service 3 8 1 1 3 1 2 1 --- U.S. transportation costs 4 9 --- --- 4 2 --- 3 ---
Note: A rating of superior means that price/U.S. transportation cost is generally lower. For example, if a firm reported “U.S. superior,” it meant that the U.S. product was generally priced lower than the imported product. Note: S=first listed country’s product is superior; C=both countries’ products are comparable; I=first list country’s product is inferior. Source: Compiled from data submitted in response to Commission questionnaires.

II‐16
Comparison of U.S.‐produced and imported standard wire mesh
In order to determine whether U.S.‐produced standard wire mesh can generally be used in the same applications as imports from Mexico, U.S. producers, importers, and purchasers were asked whether the product can always, frequently, sometimes, or never be used interchangeably. As shown in table II‐10, most producers reported that standard wire mesh from all sources can always be used interchangeably. A majority of importers and purchasers reported that domestic standard wire mesh can always or frequently be used interchangeably with standard wire mesh imports from Mexico. Half of responding importers reported that domestic standard wire mesh was interchangeable with nonsubject imports, while an equal number of importers reported that standard wire mesh imports from Mexico were interchangeable with nonsubject imports. Half of purchasers reported that U.S.‐produced standard wire mesh can always be used interchangeably with nonsubject standard wire mesh, and a majority of purchasers reported that standard wire mesh imported from Mexico can either always or never be used interchangeably with nonsubject standard wire mesh, although there were a limited number of observations. Table II-10 Standard wire mesh: Interchangeability between standard wire mesh produced in the United States, Mexico, and nonsubject countries, by country pair
Country pair Number of U.S.
producers reporting Number of U.S.
importers reporting Number of
purchasers reporting
A F S N A F S N A F S N U.S. vs. subject countries: U.S. vs. Mexico 8 1 1 --- 2 1 1 1 3 5 4 1 Nonsubject countries comparisons: U.S. vs. nonsubject 8 1 1 --- 2 1 1 --- 2 --- 1 1
Mexico vs. nonsubject 7 2 1 --- 2 2 1 --- 2 --- --- 1 Note: A=Always, F=Frequently, S=Sometimes, N=Never. Source: Compiled from data submitted in response to Commission questionnaires.
As can be seen from table II‐11, most responding purchasers reported that domestic and subject imported standard wire mesh always met minimum quality specifications.

II‐17
Table II-11 Standard wire mesh: Ability to meet minimum quality specifications, by source
Source Always Usually Sometimes Rarely or
never
United States 14 3 --- ---
Mexico 7 3 --- ---
Other countries 2 1 --- --- Note: Purchasers were asked how often domestically produced or imported standard wire mesh meets minimum quality specifications for their own or their customers’ uses. Source: Compiled from data submitted in response to Commission questionnaires.
In addition, U.S. producers, importers, and purchasers were asked to assess how often differences other than price were significant in sales of standard wire mesh from the United States, Mexico, or nonsubject countries. As seen in table II‐12, the vast majority of producers reported that differences other than price between sources were never significant, while half of responding importers reported that differences other than price between domestic standard wire mesh and standard wire mesh from nonsubject sources. Seven purchasers reported that differences other than price between domestic and Mexican standard wire mesh were sometimes or never significant. Five purchasers reported that such differences were always significant. Differences identified were quality and quick turnaround.

II‐18
Table II-12 Standard wire mesh: Significance of differences other than price between standard wire mesh produced in the United States and in other countries, by country pair
Country pair Number of U.S.
producers reporting Number of U.S.
importers reporting Number of
purchasers reporting
A F S N A F S N A F S N
U.S. vs. subject countries: U.S. vs. Mexico 2 --- --- 8 1 1 1 2 5 --- 5 3
Nonsubject countries comparisons: U.S. vs. nonsubject 1 --- --- 8 1 1 --- 2 --- --- 1 3
Mexico vs. nonsubject 1 1 --- 7 1 1 --- 3 --- --- --- 3 Note: A = Always, F = Frequently, S = Sometimes, N = Never. Source: Compiled from data submitted in response to Commission questionnaires.
Elasticity estimates
This section discusses elasticity estimates. No parties provided comments on these estimates in their prehearing or posthearing briefs.
U.S. supply elasticity
The domestic supply elasticity for standard wire mesh measures the sensitivity of the quantity supplied by U.S. producers to changes in the U.S. market price of standard wire mesh. The elasticity of domestic supply depends on several factors including the level of excess capacity, the ease with which producers can alter capacity, producers’ ability to shift to production of other products, the existence of inventories, and the availability of alternate markets for U.S.‐produced standard wire mesh. Analysis of these factors above indicates that the U.S. industry has the ability to greatly increase or decrease shipments to the U.S. market; an estimate in the range of 6 to 10 is suggested.
U.S. demand elasticity
The U.S. demand elasticity for standard wire mesh measures the sensitivity of the overall quantity demanded to a change in the U.S. market price of standard wire mesh. This estimate depends on factors discussed above such as the existence, availability, and commercial viability of substitute products, as well as the component share of the standard wire mesh in the production of any downstream products. Based on the available information, the aggregate demand for standard wire mesh is likely to be moderately inelastic; a range of ‐0.5 to ‐1.0 is suggested.

II‐19
Substitution elasticity
The elasticity of substitution depends upon the extent of product differentiation between the domestic and imported products.13 Product differentiation, in turn, depends upon such factors as quality (e.g., chemistry, appearance, etc.) and conditions of sale (e.g., availability, sales terms/discounts/promotions, etc.). Based on available information, the elasticity of substitution between U.S.‐produced standard wire mesh and imported standard wire mesh is likely to be in the range of 4 to 7.
13 The substitution elasticity measures the responsiveness of the relative U.S. consumption levels of the subject imports and the domestic like products to changes in their relative prices. This reflects how easily purchasers switch from the U.S. product to the subject products (or vice versa) when prices change.


III‐1
Part III: U.S. producers’ production, shipments, and employment
The Commission analyzes a number of factors in making injury determinations (see 19 U.S.C. §§ 1677(7)(B) and 1677(7)(C)). Information on the subsidies and dumping margins were presented in Part I of this report and information on the volume and pricing of imports of the subject merchandise is presented in Part IV and Part V. Information on the other factors specified is presented in this section and/or Part VI and (except as noted) is based on the questionnaire responses of twelve firms that accounted for the large majority of U.S. production of standard wire mesh during 2019 and throughout the period for which data were collected.
U.S. producers
The Commission issued a U.S. producer questionnaire to fifteen firms based on information contained in the petition, and received questionnaires on behalf of one former and eleven current U.S. producers of standard wire mesh.1 Staff believes that these responses represent the large majority of U.S. production of standard wire mesh.2
Table III‐1 lists U.S. producers of standard wire mesh, their production locations, positions on the petition, and shares of total production in 2019 and figure III‐1 presents a map of U.S. producers’ production locations.
1 Gerdau SA (“Gerdau”) operated a standard wire mesh facility in 2017 and January 2018. In January 2018, WMC acquired the standard wire mesh facility in Beaumont, Texas. ***.
2 Two additional firms, ***. Staff telephone interview with ***, February 26, 2021; and Email from ***, July 15, 2020.

III‐2
Table III-1 Standard wire mesh: U.S. producers of standard wire mesh, their positions on the petition, production locations, and shares of reported production, 2019
Firm Position
on petition Production location(s)
Share of production (percent)
Davis *** Irwindale, CA Kent, WA ***
Insteel Petitioner
Jacksonville, FL Mt. Airy, NC Hazleton, PA Hickman, KY ***
Keysteel *** New Caney, TX ***
Liberty ***
Warren, OH Las Cruces, NM Upper Sandusky, OH ***
Mid-South Petitioner Nashville, TN ***National Petitioner Conroe, TX ***
Nucor ***
Charlotte, NC South Brigham City, UT Wallingford, CT ***
Oklahoma Petitioner Madill, OK Centerville, IA ***
Peninsula *** Plant City, FL *** Tree Island *** Rancho Cucamonga, CA ***
WMC Petitioner
Jacksonville, FL Lathrop, CA Beaumont, TX (formerly Gerdau) Oglesby, IL New Salem, P A ***
Total 100.0 Source: Compiled from data submitted in response to Commission questionnaires.

III‐3
Figure III-1 Standard wire mesh: U.S. producers of standard wire mesh, locations, 2019
* * * * * * *
Note: Deacero has reported that it is currently making arrangements to move all of its U.S. standard wire mesh market production to ***, with production to start in the second quarter of 2021 and its facilities to be fully established by 2022. Respondent Deacero’s prehearing brief, pp. 25-26; and hearing transcript, p. 148 (Guerra). Source: Compiled from data submitted in response to Commission questionnaires.

III‐4
Table III‐2 presents information on U.S. producers’ ownership, related and/or affiliated firms.
Table III-2 Standard wire mesh: U.S. producers’ ownership, related and/or affiliated firms, 2019
Item / Firm Firm Name Affiliated/Ownership Ownership: *** *** *** *** *** *** *** *** *** *** *** *** *** *** *** *** *** *** Related importers/exporters: *** *** *** *** *** *** Related producers: *** *** *** *** *** *** *** *** *** *** *** *** *** *** *** *** *** ***
Source: Compiled from data submitted in response to Commission questionnaires.

III‐5
As indicated in table III‐2, *** are related to *** producers/exporters of standard wire mesh, and *** are related to *** producers of standard wire mesh. *** are related to exporters of standard wire mesh. In addition, as discussed in greater detail below, *** directly import the subject merchandise and *** directly imports nonsubject merchandise from ***.
Table III‐3 presents U.S. producers’ reported changes in operations since January 1, 2017. One firm reported a plant opening, one firm reported a plant closing, two firms reported an expansion, two firms reported acquisitions,3 six firms reported shutdowns/curtailments, and one firm reported a revised labor agreement. In addition, Deacero has reported that it has committed significant time and financial resources to making arrangements to move all of its U.S. standard wire mesh market production to ***, with production to start in the second quarter of 2021 and its facilities to be fully established by 2022.4
3 In 2018, Gerdau sold its Beaumont wire rod mill and two downstream facilities (Beaumont Wire Products and Carrollton Wire Products) to Optimus Steel. In the agreement, WMC, a separate entity from Optimus Steel, agreed to operate the downstream facilities. American Metal Market, Gerdau sells Beaumont Mill to Optimus Steel, January 31, 2018.
In December 2018, GFG Alliance’s Liberty Steel USA acquired Keystone Consolidated Industries Inc., which included three welded wire reinforcement mesh facilities. Recycling Today, Liberty Steel USA acquires Keystone EAF mill, December 3, 2018.
4 Respondent Deacero’s prehearing brief, pp. 25‐26; hearing transcript, p. 148 (Guerra); and Respondent Deacero’s posthearing brief, p. 11.

III‐6
Table III-3 Standard wire mesh: U.S. producers’ reported changes in operations, since January 1, 2017
Item / Firm Reported changed in operations Plant openings: *** *** Plant closings: *** *** Expansions: *** *** *** *** Acquisitions: *** *** *** *** Prolonged shutdowns or curtailments: *** *** *** *** *** *** *** *** *** *** *** *** Revised labor agreements: *** *** Other: *** *** *** ***
Source: Compiled from data submitted in response to Commission questionnaires.

III‐7
U.S. production, capacity, and capacity utilization
Table III‐4 and figure III‐2 present U.S. producers’ production, reported capacity, and capacity utilization. U.S. producers’ reported capacity increased by *** percent (*** short tons) during 2017‐19. During 2017‐19, *** reported capacity increased by *** percent (*** short tons), *** percent (*** short tons), and *** percent (*** short tons), respectively. ***. In addition, ***.5 U.S. producers’ reported capacity was 10,302 short tons lower in the 2020 January‐September interim period (“interim”) compared to interim 2019.6
U.S. producers’ production increased by *** percent from 2017 to 2018 then decreased by 4.8 percent from 2018 to 2019.7 Overall, during 2017‐19, U.S. producers’ production decreased by *** percent. U.S. producers’ production was higher in interim 2020 than in interim 2019 by 5.4 percent. During 2017‐19, U.S. producers’ capacity utilization decreased by *** percentage points. Capacity utilization was 2.8 percentage points higher in interim 2020 compared to interim 2019.
5 Email from ***, January 14, 2021. 6 ***. Email from ***, January 19, 2021. 7 ***. *** importer questionnaire response, section II‐4. In addition, ***. *** U.S. producer
questionnaire response, section III‐4b. ***. *** U.S. producer questionnaire response, section III‐4b.

III‐8
Table III-4 Standard wire mesh: U.S. producers’ production, capacity, and capacity utilization, 2017-19, January-September 2019, and January-September 2020
Item Calendar year January to September
2017 2018 2019 2019 2020 Capacity (short tons) Davis *** *** *** *** *** Gerdau *** *** *** *** *** Insteel *** *** *** *** *** Keysteel *** *** *** *** *** Liberty *** *** *** *** *** Mid-South *** *** *** *** *** National *** *** *** *** *** Nucor *** *** *** *** *** Oklahoma *** *** *** *** *** Peninsula *** *** *** *** *** Tree Island *** *** *** *** *** WMC *** *** *** *** ***
All firms *** 736,593 788,843 591,619 581,317 Production (short tons) Davis *** *** *** *** *** Gerdau *** *** *** *** *** Insteel *** *** *** *** *** Keysteel *** *** *** *** *** Liberty *** *** *** *** *** Mid-South *** *** *** *** *** National *** *** *** *** *** Nucor *** *** *** *** *** Oklahoma *** *** *** *** *** Peninsula *** *** *** *** *** Tree Island *** *** *** *** *** WMC *** *** *** *** ***
All firms *** 318,263 302,928 229,487 241,898 Table continued on next page.

III‐9
Table III-4—Continued Standard wire mesh: U.S. producers’ production, capacity, and capacity utilization, 2017-19, January-September 2019, and January-September 2020
Item Calendar year January to September
2017 2018 2019 2019 2020 Capacity utilization (percent) Davis *** *** *** *** *** Gerdau *** *** *** *** *** Insteel *** *** *** *** *** Keysteel *** *** *** *** *** Liberty *** *** *** *** *** Mid-South *** *** *** *** *** National *** *** *** *** *** Nucor *** *** *** *** *** Oklahoma *** *** *** *** *** Peninsula *** *** *** *** *** Tree Island *** *** *** *** *** WMC *** *** *** *** ***
All firms *** 43.2 38.4 38.8 41.6 Share of production (percent) Davis *** *** *** *** *** Gerdau *** *** *** *** *** Insteel *** *** *** *** *** Keysteel *** *** *** *** *** Liberty *** *** *** *** *** Mid-South *** *** *** *** *** National *** *** *** *** *** Nucor *** *** *** *** *** Oklahoma *** *** *** *** *** Peninsula *** *** *** *** *** Tree Island *** *** *** *** *** WMC *** *** *** *** ***
All firms 100.0 100.0 100.0 100.0 100.0 Note: Capacity is defined as the level of production that your establishment(s) could reasonably have expected to attain during the specified periods. Assume normal operating conditions (i.e. using equipment and machinery in place and ready to operate; normal operating levels (hours per week/weeks per year) and time for downtime, maintenance, repair, and cleanup; and a typical or representative product mix). Note: U.S. producers’ capacity calculation methodology appears in table III-5. Note: WMC reported that Gerdau’s 2017 capacity was *** short tons. Gerdau estimated in 2017 its standard wire mesh production capacity was approximately *** short tons. WMC’s U.S producer questionnaire response for Gerdau, section II-7. Emails from ***, January 19, 2021; and February 18, 2021. Source: Compiled from data submitted in response to Commission questionnaires.
III‐10
Figure III-2 Standard steel welded wire mesh: U.S. producers’ production, capacity, and capacity utilization, 2017-19, January-September 2019, and January-September 2020
* * * * * * *
Source: Compiled from data submitted in response to Commission questionnaires.
As shown in Table III‐4, U.S. producers never collectively utilized as much as half of their reported capacity during the period for which data were collected. U.S. producers’ reported capacity exceeded apparent U.S. consumption by a ratio of greater than *** throughout the period for which data were collected. Moreover, U.S. producers’ reported capacity exceeded all U.S. imports by a ratio of greater than *** throughout the period for which data were collected. Table III‐5 presents U.S. producers’ methodology to calculate their overall production capacity on equipment used to produce standard wire mesh and capacity to produce standard wire mesh.

III‐11
Table III-5 Standard wire mesh and engineered wire mesh: U.S. producers' capacity calculation methodology
Item / Firm Narrative Overall production *** *** *** *** *** *** *** *** *** *** *** *** *** *** *** *** *** ***
*** *** *** *** *** *** In-scope production
Hours per week
Weeks per year Calculation methodology
*** *** *** *** *** *** *** *** *** *** *** ***
*** *** *** *** *** *** *** *** *** *** *** ***
*** *** *** *** *** *** *** *** *** *** *** *** *** *** *** ***
*** *** *** *** *** *** *** ***
Notes continued on next page.

III‐12
Table III-5—Continued Standard wire mesh and engineered wire mesh: U.S. producers' capacity calculation methodology Note: *** reported production of other products on the same equipment used to produce standard wire mesh. Note: ***. *** U.S. producer questionnaire response, section II-2a; and email from ***, January 18, 2021. Note: ***. Email from ***, January 19, 2021. Note: *** Email from ***, January 12, 2021. Source: Compiled from data submitted in response to Commission questionnaires.

III‐13
Alternative products
As shown in table III-6, more than *** percent of the product produced on the same equipment during 2017‐19, January‐September 2019, and January‐September 2020 by U.S. producers was standard wire mesh. *** reported producing *** and *** reported producing *** on the same machinery used to produce standard wire mesh.8 In addition, six firms *** reported producing engineered wire mesh on separate equipment from equipment used to produce standard wire mesh.9
8 *** U.S. producer questionnaire responses, section II‐3a. 9 Overall, in 2019, U.S. producers’ capacity and production of engineered wire mesh were *** short
tons and *** short tons, respectively. *** engineered wire mesh production reported was produced on equipment not used in the production of standard wire mesh.

III‐14
Table III-6 Standard wire mesh: U.S. producers’ overall capacity and production on the same equipment as subject production, 2017-19, January-September 2019, and January-September 2020
Item Calendar year January to September
2017 2018 2019 2019 2020Quantity (short tons)
Overall capacity *** *** *** *** ***
Production: Standard wire mesh *** 318,263 302,928 229,487 241,898
Out of scope production: Engineered wire mesh *** *** *** *** ***
Other products *** *** *** *** ***Out-of-scope
production *** *** *** *** ***Total production on
same machinery *** *** *** *** ***Ratios and shares (percent)
Overall capacity utilization *** *** *** *** ***
Share of production: Standard wire mesh *** *** *** *** ***
Share of out of scope production: Engineered wire mesh *** *** *** *** ***
Other products *** *** *** *** ***Out-of-scope
production *** *** *** *** ***Total production on
same machinery 100.0 100.0 100.0 100.0 100.0Note: Shares and ratios shown as "0.0" represent values greater than zero, but less than "0.05" percent.
Note: Overall production capacity is defined as the level of production your establishment(s) could reasonably have expected to attain during the specified periods. Assume normal operating conditions (i.e., using equipment and machinery in place and ready to operate; normal operating levels (hours per week/weeks per year) and time for downtime, maintenance, repair, and cleanup).
Note: U.S. producers’ capacity calculation methodology appears in table III-5.
Source: Compiled from data submitted in response to Commission questionnaires.

III‐15
U.S. producers’ U.S. shipments and exports
Table III‐7 presents U.S. producers’ U.S. shipments (including transfers to related firms and internal consumption), export shipments, and total shipments. More than *** percent of U.S. producers’ total shipments were U.S. commercial shipments. Table III-7 Standard wire mesh: U.S. producers’ U.S. shipments, exports shipments, and total shipments, 2017-19, January-September 2019, and January-September 2020
Item Calendar year January to September
2017 2018 2019 2019 2020 Quantity (short tons) U.S. shipments *** 309,147 296,954 227,761 261,131 Export shipments *** *** *** *** ***
Total shipments *** *** *** *** *** Value (1,000 dollars) U.S. shipments *** 300,780 269,429 211,096 199,911 Export shipments *** *** *** *** ***
Total shipments *** *** *** *** *** Unit value (dollars per short ton) U.S. shipments *** 973 907 927 766 Export shipments *** *** *** *** ***
Total shipments *** *** *** *** *** Share of quantity (percent) U.S. shipments *** *** *** *** *** Export shipments *** *** *** *** ***
Total shipments 100.0 100.0 100.0 100.0 100.0 Share of value (percent) U.S. shipments *** *** *** *** *** Export shipments *** *** *** *** ***
Total shipments 100.0 100.0 100.0 100.0 100.0 Source: Compiled from data submitted in response to Commission questionnaires.
Overall, U.S. producers’ U.S. shipments, in terms of quantity, decreased by *** percent during 2017‐19. During 2017‐18, U.S. producers’ U.S. shipments, in terms of value, increased by *** percent, then decreased by 10.4 percent from 2018 to 2019. Overall, U.S. producers’ U.S. shipments, in terms of value, increased by *** percent during 2017‐19. During interim 2020 compared to interim 2019, U.S. producers’ U.S. shipments, based on quantity, were 14.7 percent higher, but were 5.3 percent lower based on value.
Overall, the average unit value of U.S. producers’ U.S. shipments increased by *** percent during 2017‐19. The unit value of U.S. producers’ U.S. shipments was 17.4 percent lower in interim 2020 compared to interim 2019.
In 2019, transfers to related firms, in terms of quantity, accounted for *** percent of U.S. producers’ shipments and export shipments accounted for *** percent of U.S. producers’

III‐16
shipments.10 *** reported export shipments to ***. *** reported transfers to related firms. *** reported *** short tons of internal consumption in 2019.
Table III‐8 and figure III‐3 present data on U.S. producers’ U.S. shipments by product type in 2019. In 2019, 81.5 percent of U.S. producers’ U.S. shipments were sold in sheets and 72.8 percent of U.S. producers’ U.S. shipments of wire mesh was deformed. The petitioners note, “by using deformed wire mesh producers typically can save up to about *** in wire rod costs to achieve the same surface area of steel.”11 Additionally, deformed wire mesh may bond better to concrete.12 Petitioners note that, because of its cost advantage and perceived advantage, in bond and anchorage, most wire mesh produced and sold in the United States is deformed wire; however there are certain applications where deformed wire would not be appropriate including “certain special seismic systems and spiral reinforcement applications.”13 Respondents report no considerable performance and application advantages between deformed and smooth wire mesh.14
10 Regarding exports of standard wire mesh, petitioners testified: “the Mexican market, which the channels of distribution are so different that the infrastructure that would be required for us to serve the Mexican market is just impossible for us to establish. It's just a different way of doing business in Mexico. We have, in certain times, shipped north of the border, but there are currency issues there, and just it's just not a very attractive proposal. We have certainly researched and analyzed both of those opportunities, Canada and Mexico, however, because of the capacity that's available.” Hearing transcript, p. 120 (Woltz).
11 Petitioners’ postconference brief, exh. 1. 12 Petitioners’ postconference brief, exh. 6. 13 Petitioners’ postconference brief, exh. 1. 14 Respondent’s postconference brief, exh. 1.

III‐17
Table III-8 Standard wire mesh: U.S. producers' U.S. shipments, by product type, 2019
Item Smooth Deformed All types
Quantity (short tons)
U.S. producers' U.S. shipments.-- Sold in sheets 62,074 180,085 242,159
Sold in rolls 18,701 36,094 54,795 All product types 80,775 216,179 296,954
Share across (percent)
U.S. producers' U.S. shipments.-- Sold in sheets 25.6 74.4 100.0
Sold in rolls 34.1 65.9 100.0 All product types 27.2 72.8 100.0
Share down (percent)
U.S. producers' U.S. shipments.-- Sold in sheets 76.8 83.3 81.5
Sold in rolls 23.2 16.7 18.5 All product types 100.0 100.0 100.0
Source: Compiled from data submitted in response to Commission questionnaires. Figure III-3 Standard wire mesh: U.S. producers' U.S. shipments, by product type, 2019
Source: Compiled from data submitted in response to Commission questionnaires.

III‐18
U.S. producers’ inventories
Table III‐9 presents U.S. producers’ end‐of‐period inventories and the ratio of these inventories to U.S. producers’ production, U.S. shipments, and total shipments. During 2017‐19, U.S. producers’ end‐of‐period inventories increased by *** percent. End‐of‐period inventory increases during 2017‐19 were largely driven by ***, whose end‐of‐period inventories increased by *** short tons during 2017‐19.15 End‐of‐period inventories were 34.8 percent lower in interim 2020 compared to interim 2019. Lower end‐of‐period inventories in interim 2020 were driven by ***, whose end‐of‐period inventories decreased by *** short tons in interim 2020 compared to interim 2019.16
During 2017‐19, U.S. producers’ end‐of‐period inventories as a ratio to U.S. production, U.S. shipments, and total shipments increased during 2017‐19 by *** percentage points, *** percentage points, and *** percentage points, respectively. U.S. producers’ end‐of‐period inventories as a ratio to U.S. production, U.S. shipments, and total shipments were all lower in interim 2020 compared to interim 2019.
Table III-9 Standard wire mesh: U.S. producers’ inventories, 2017-19, January-September 2019, and January-September 2020
Item Calendar year January to September
2017 2018 2019 2019 2020 Quantity (short tons) U.S. producers’ end-of-period inventories *** 46,316 50,660 46,689 30,441 Ratio (percent)
Ratio of inventories to.-- U.S. production *** 14.6 16.7 15.3 9.4
U.S. shipments *** 15.0 17.1 15.4 8.7 Total shipments *** *** *** *** ***
Source: Compiled from data submitted in response to Commission questionnaires.
15 ***. Emails from ***, January 14, 2021 and January 22, 2021. 16 ***. Email from ***, February 22, 2021.
III‐19
U.S. producers’ imports and purchases
U.S. producers’ imports and purchases of standard wire mesh are presented in table III‐10. Five U.S. producers accounting for more than *** of the average production capacity reported by all responding U.S. producers are themselves importers of standard wire mesh. *** U.S. producers (***) imported standard wire mesh from Mexico and *** U.S. producer, ***, imported standard wire mesh from *** during the period for which data were collected. Collectively, these U.S. producers accounted for *** of U.S. imports of standard wire mesh in 2017, 2018, and 2019.
*** reported imports (***) of standard wire mesh from Mexico during the period for which data were collected due to ***. During 2018 and interim 2020, *** reported imports (***) of standard wire mesh from Mexico due to ***. ***. ***. ***. During 2017‐18, *** reported imports (***) of standard wire mesh from Mexico to ***.17
17 Of these five firms, *** operated at the highest level of capacity utilization in 2017 and 2018, while *** operated at the highest level of capacity utilization in 2019 and interim 2020.

III‐20
Table III-10 Standard wire mesh: U.S. producers’ imports, 2017-19, January-September 2019, and January-September 2020
* * * * * * *

III‐21
Table III-10—Continued Standard wire mesh: U.S. producers’ imports, 2017-19, January-September 2019, and January-September 2020
* * * * * * *

III‐22
U.S. employment, wages, and productivity
Table III‐11 shows U.S. producers’ employment‐related data for 2017‐19, January‐September 2019, and January‐September 2020. During 2017‐19, production and related workers (“PRWs”) decreased by *** percent. There were 10 fewer PRWs during the 2020 interim period compared to the 2019 interim period. During 2017‐19 wages paid, hourly wages, and unit labor costs fluctuated while total hours worked decreased by *** percent. Hourly wages and productivity were higher in the 2020 interim period compared to the 2019 interim period, while total hours worked, hours worked by PRWs, wages, and unit labor costs were all lower in the 2020 interim period compared to the 2019 interim period.
Table III-11 Standard wire mesh: Average number of production and related workers, hours worked, wages paid to such employees, hourly wages, productivity, and unit labor costs, 2017-19, January-September 2019, and January-September 2020
Item Calendar year January to September
2017 2018 2019 2019 2020 Production and related workers (PRWs) (number) *** 542 515 517 507 Total hours worked (1,000 hours) *** 1,257 1,224 944 904 Hours worked per PRW (hours) *** 2,319 2,377 1,826 1,783 Wages paid ($1,000) *** 31,463 28,804 22,352 22,267 Hourly wages (dollars per hour) $*** $25.03 $23.53 $23.68 $24.63 Productivity (short tons per 1,000 hour) *** 253 247 243 268 Unit labor costs (dollars per short tons) $*** $98.86 $95.09 $97.40 $92.05
Note: ***. *** U.S. producer questionnaire responses, section II-11; and Emails from ***, January 15, 2021 and March 1, 2021. Note: ***. Email from ***, March 2, 2021. Note: ***. *** U.S. producer questionnaire response, section II-11 Email from ***, January 19, 2021. Source: Compiled from data submitted in response to Commission questionnaires.

IV‐1
Part IV: U.S. imports, apparent U.S. consumption, and market shares
U.S. importers
The Commission issued questionnaires to 54 firms identified as potential importers and all known U.S. producers of standard wire mesh and engineered wire mesh.1 Usable questionnaire responses were received from six companies, representing a majority of U.S. imports from Mexico in 2019 under HTS subheadings 7314.20.0000 and 7314.39.0000, (subheadings that include grill, netting, and fencing either standard, plated, or coated with zinc).2 Table IV‐1 lists the six U.S. importers of standard wire mesh from Mexico and other sources,3 their locations, and their shares of U.S. imports, in 2019. Five firms, accounting for *** of imports in 2019, produce standard wire mesh in the United States.
1 The Commission issued questionnaires to those firms identified in the petition, along with firms that, based on a review of data provided by U.S. Customs and Border Protection (“Customs”), may have accounted for more than one percent of total imports under HTS subheadings 7314.20.0000 and 7314.39.0000 in 2019.
2 The petition listed 25 potential importers of standard wire mesh from Mexico. Petition, June 29, 2020, exh. GEN‐8. Six firms indicated importation and provided the Commission with importer questionnaire submissions. Six firms listed in the petition provided questionnaire responses indicating that they had not imported standard wire mesh or engineered wire mesh from any source since January 1, 2017. Of the remaining thirteen firms, only two (***) appeared on data provided by Customs, accounting for *** percent of U.S. imports from Mexico in 2019 under HTS subheadings 7314.20.0000 and 7314.39.0000. Petition, June 29, 2020, exh. GEN‐8. The Commission did not receive a response from Grupo Villacero / Lamina y Placa S.A. de C.V., estimated to account for less than *** percent of U.S. imports of standard wire mesh from Mexico during January 2017 – September 2020 (based on quantities reported by ***.
3 Petitioners identified ***. ***. Petitioners also identified small trial imports of wire mesh from Turkey. Petitioners’ postconference brief, exh. 1; and *** Importer questionnaire response, section II‐5.

IV-2
Table IV-1 Standard wire mesh: U.S. importers by source, 2019
Firm Headquarters
Share of imports by source (percent)
Mexico Nonsubject
sources All import sources
Deacero USA Houston, TX *** *** *** Keysteel New Caney, TX *** *** *** National Conroe, TX *** *** *** Peninsula Plant City, FL *** *** *** Tree Island Rancho Cucamonga, CA *** *** *** WMC The Woodlands, TX *** *** ***
Total 100.0 100.0 100.0 Source: Compiled from data submitted in response to Commission questionnaires.
U.S. imports
Table IV-2 and figure IV-1 present data for U.S. imports of standard wire mesh from Mexico and all other sources. Imports of standard wire mesh from Mexico accounted for *** imports of standard wire mesh in 2017-18. *** reported imports from *** in 2019, January-September 2019, and January-September 2020, which accounted for *** percent of imports of standard wire mesh, in terms of quantity (*** percent in terms of value) in 2019.
U.S. imports of standard wire mesh from Mexico, in terms of quantity, increased by *** percent (*** short tons) between 2017 and 2018 and then decreased by *** percent (*** short tons) from 2018 to 2019, for an overall increase of *** percent (*** short tons) during 2017-19. U.S. imports of standard wire mesh from Mexico, in terms of quantity, were *** percent (*** short tons) greater during interim 2020 compared to interim 2019. U.S. imports of standard wire mesh from Mexico, in terms of value, increased by *** percent between 2017 and 2018 and then decreased by *** percent from 2018 to 2019, for an overall increase of *** percent during 2017-19. U.S. imports of standard wire mesh from Mexico, in terms of value, were *** percent lower during interim 2020 compared to interim 2019. U.S. producers accounted for *** of U.S. imports from Mexico and from *** in 2017, 2018, and 2019.
The average unit values of U.S. imports of standard wire mesh from Mexico increased by $*** per short ton from 2017 to 2018, then decreased by $*** per short ton from 2018 to 2019. Overall, during 2017-19, the average unit value of U.S. imports of standard wire mesh from Mexico increased by $*** per short ton to $*** per short ton in 2019. The average unit value of U.S. imports of standard wire mesh from Mexico was $*** per short ton lower in the 2020 interim period compared to the 2019 interim period.

IV-3
Overall, as a ratio to U.S. production, imports from Mexico increased from *** percent in 2017 to *** percent in 2018, then decreased to *** percent in 2019. As a ratio to U.S. production, imports from Mexico were *** percent in interim 2019 and *** percent in interim 2020. Table IV-2 Standard wire mesh: U.S. imports by source, 2017-19, January-September 2019, and January-September 2020
Item Calendar year January to September
2017 2018 2019 2019 2020 Quantity (short tons) U.S. imports from.-- Mexico *** *** *** *** ***
Nonsubject sources *** *** *** *** *** All import sources *** *** *** *** ***
Value (1,000 dollars) U.S. imports from.-- Mexico *** *** *** *** ***
Nonsubject sources *** *** *** *** *** All import sources *** *** *** *** ***
Unit value (dollars per short ton) U.S. imports from.-- Mexico *** *** *** *** ***
Nonsubject sources *** *** *** *** *** All import sources *** *** *** *** ***
Share of quantity (percent) U.S. imports from.-- Mexico *** *** *** *** ***
Nonsubject sources *** *** *** *** *** All import sources 100.0 100.0 100.0 100.0 100.0
Share of value (percent) U.S. imports from.-- Mexico *** *** *** *** ***
Nonsubject sources *** *** *** *** *** All import sources 100.0 100.0 100.0 100.0 100.0
Ratio to U.S. production U.S. imports from.-- Mexico *** *** *** *** ***
Nonsubject sources *** *** *** *** *** All import sources *** *** *** *** ***
Note: Shares and ratios shown as "0.0" represent values greater than zero, but less than "0.05" percent. According to ***. Source: Compiled from data submitted in response to Commission questionnaires.

IV-4
Figure IV-1 Standard wire mesh: U.S. import quantities and average unit values, 2017-19, January-September 2019, and January-September 2020
* * * * * * *
Source: Compiled from data submitted in response to Commission questionnaires.
Table IV-3 and figure IV-2 present U.S. importers’ U.S. shipments of imports of standard wire mesh by product type during 2019. In 2019, *** percent of U.S. shipments of imports of standard wire mesh from Mexico were sold in sheets and *** percent of U.S. shipments of imports of standard wire mesh from Mexico were deformed. In 2019, *** percent of U.S. shipments of imports of standard wire mesh from nonsubject sources were sold in rolls and *** U.S. shipments of imports of standard wire mesh from nonsubject sources were smooth.

IV-5
Table IV-3 Standard wire mesh: U.S. importers' U.S. shipments, by product type, 2019
Item Smooth Deformed All types Quantity (short tons)
U.S. imports from Mexico.-- Sold in sheets *** *** ***
Sold in rolls *** *** *** All product types *** *** ***
U.S. imports from nonsubject sources.-- Sold in sheets *** *** ***
Sold in rolls *** *** *** All product types *** *** ***
U.S. imports from all import sources.-- Sold in sheets *** *** ***
Sold in rolls *** *** *** All product types *** *** ***
Share across (percent) U.S. imports from Mexico.-- Sold in sheets *** *** ***
Sold in rolls *** *** *** All product types *** *** ***
U.S. imports from nonsubject sources.-- Sold in sheets *** *** ***
Sold in rolls *** *** *** All product types *** *** ***
U.S. imports from all import sources.-- Sold in sheets *** *** ***
Sold in rolls *** *** *** All product types *** *** ***
Share down (percent) U.S. imports from Mexico.-- Sold in sheets *** *** ***
Sold in rolls *** *** *** All product types *** *** ***
U.S. imports from nonsubject sources.-- Sold in sheets *** *** ***
Sold in rolls *** *** *** All product types *** *** ***
U.S. imports from all import sources.-- Sold in sheets *** *** ***
Sold in rolls *** *** *** All product types *** *** ***
Source: Compiled from data submitted in response to Commission questionnaires.

IV-6
Figure IV-2 Standard wire mesh: Share of U.S. importers U.S. shipments, by source and product type, 2019
* * * * * * * Source: Compiled from data submitted in response to Commission questionnaires.
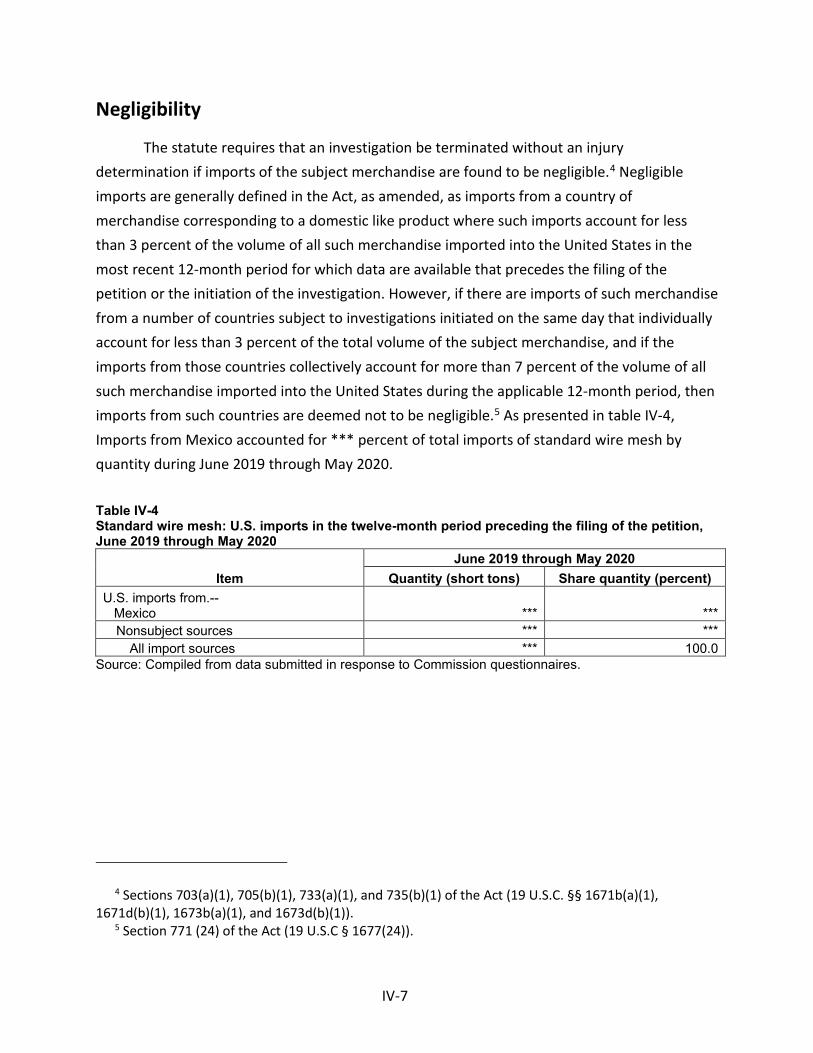
IV-7
Negligibility
The statute requires that an investigation be terminated without an injury determination if imports of the subject merchandise are found to be negligible.4 Negligible imports are generally defined in the Act, as amended, as imports from a country of merchandise corresponding to a domestic like product where such imports account for less than 3 percent of the volume of all such merchandise imported into the United States in the most recent 12-month period for which data are available that precedes the filing of the petition or the initiation of the investigation. However, if there are imports of such merchandise from a number of countries subject to investigations initiated on the same day that individually account for less than 3 percent of the total volume of the subject merchandise, and if the imports from those countries collectively account for more than 7 percent of the volume of all such merchandise imported into the United States during the applicable 12-month period, then imports from such countries are deemed not to be negligible.5 As presented in table IV-4, Imports from Mexico accounted for *** percent of total imports of standard wire mesh by quantity during June 2019 through May 2020.
Table IV-4 Standard wire mesh: U.S. imports in the twelve-month period preceding the filing of the petition, June 2019 through May 2020
Item June 2019 through May 2020
Quantity (short tons) Share quantity (percent) U.S. imports from.-- Mexico *** ***
Nonsubject sources *** *** All import sources *** 100.0
Source: Compiled from data submitted in response to Commission questionnaires.
4 Sections 703(a)(1), 705(b)(1), 733(a)(1), and 735(b)(1) of the Act (19 U.S.C. §§ 1671b(a)(1), 1671d(b)(1), 1673b(a)(1), and 1673d(b)(1)).
5 Section 771 (24) of the Act (19 U.S.C § 1677(24)).

IV-8
Apparent U.S. consumption and U.S. market shares
Table IV-5 and figure IV-3 present data on apparent U.S. consumption and U.S. market shares for standard wire mesh. From 2017 to 2018, apparent U.S. consumption decreased, in terms of quantity, by *** percent while apparent U.S. consumption, in terms of value, increased by *** percent. From 2018 to 2019, apparent U.S. consumption decreased, in terms of quantity, by *** percent (*** percent by value). Overall, during 2017-19, apparent U.S. consumption decreased, in terms of quantity, by *** percent while apparent U.S. consumption, in terms of value, increased by *** percent. Apparent U.S. consumption, based on quantity, was *** percent higher in interim 2020 compared to interim 2019. Apparent U.S. consumption, based on value, was *** percent lower in interim 2020 compared to interim 2019.
Measured by quantity, U.S. shipments of standard wire mesh produced in the United States accounted for *** percent of apparent U.S. consumption in 2017; *** percent in 2018; *** percent in 2019; *** percent in interim 2019; and *** percent in interim 2020. Measured by value, U.S. shipments of standard wire mesh produced in the United States accounted for *** percent of apparent U.S. consumption in 2017; *** percent in 2018; *** percent in 2019; *** percent in interim 2019; and *** percent in interim 2020.
Measured by quantity, U.S. shipments of standard wire mesh imported from Mexico accounted for *** percent of apparent U.S. consumption in 2017; *** percent in 2018; *** percent in 2019; *** percent in interim 2019; and *** percent in interim 2020. Measured by value, U.S. shipments of standard wire mesh imported from Mexico accounted for *** percent of apparent U.S. consumption in 2017; *** percent in 2018; *** percent in 2019; *** percent in interim 2019; and *** percent in interim 2020. U.S. shipments of imports from *** never accounted for more than *** percent of apparent U.S. consumption during 2017-19 or in either interim period measured by both quantity and value.

IV-9
Table IV-5 Standard wire mesh: Apparent U.S. consumption, 2017-19, January-September 2019, and January-September 2020
Item Calendar year January to September
2017 2018 2019 2019 2020 Quantity (short tons) U.S. producers' U.S. shipments *** 309,147 296,954 227,761 261,131 U.S. importers' U.S. shipments from.-- Mexico *** *** *** *** ***
Nonsubject sources *** *** *** *** *** All import sources *** *** *** *** ***
Apparent U.S. consumption *** *** *** *** *** Value (1,000 dollars) U.S. producers' U.S. shipments *** 300,780 269,429 211,096 199,911 U.S. importers' U.S. shipments from.-- Mexico *** *** *** *** ***
Nonsubject sources *** *** *** *** *** All import sources *** *** *** *** ***
Apparent U.S. consumption *** *** *** *** *** Share of quantity (percent) U.S. producers' U.S. shipments *** *** *** *** *** U.S. importers' U.S. shipments from.-- Mexico *** *** *** *** ***
Nonsubject sources *** *** *** *** *** All import sources *** *** *** *** ***
Share of value (percent) U.S. producers' U.S. shipments *** *** *** *** *** U.S. importers' U.S. shipments from.-- Mexico *** *** *** *** ***
Nonsubject sources *** *** *** *** *** All import sources *** *** *** *** ***
Note: Shares and ratios shown as "0.0" represent values greater than zero, but less than "0.05" percent. Source: Compiled from data submitted in response to Commission questionnaires.

IV-10
Figure IV-3 Standard wire mesh: Apparent U.S. consumption, 2017-19, January-September 2019, and January-September 2020
* * * * * * *
Source: Compiled from data submitted in response to Commission questionnaires.
The Commission collected monthly data on U.S. producers’ and U.S. importers’ monthly shipments of standard wire mesh during 2019-20. As presented in table IV-6, during 2019-20, U.S. shipments of standard wire mesh produced in the United States accounted for between *** percent and *** percent of apparent U.S. consumption, while U.S. shipments of standard wire mesh imported from Mexico accounted for between *** percent and *** percent of apparent U.S. consumption. U.S. shipments of standard wire mesh from *** were present in the market *** out of 24 months and accounted for between *** percent and *** percent of apparent U.S. consumption during these months. Figure IV-4 and figure IV-5 present U.S. producers’ and importers’ monthly U.S shipments during 2019-20 by quantity and by share, respectively.

IV-11
Table IV-6 Standard wire mesh: U.S. shipments, by quantity and share of total, monthly, 2019-20
Item
U.S. producer'
U.S. shipments
U.S. importers' U.S. shipments from.--
Apparent U.S.
consumption Mexico Nonsubject
sources
All import
sources Quantity (short tons) U.S. shipments: 2019: January 18,936 *** *** *** ***
February 17,771 *** *** *** *** March 22,690 *** *** *** *** April 29,088 *** *** *** *** May 27,546 *** *** *** *** June 27,694 *** *** *** *** July 28,138 *** *** *** *** August 27,401 *** *** *** *** September 28,497 *** *** *** *** October 28,414 *** *** *** *** November 21,065 *** *** *** *** December 19,714 *** *** *** ***
Total 296,954 *** *** *** *** 2020: January 27,275 *** *** *** ***
February 20,214 *** *** *** *** March 27,359 *** *** *** *** April 25,257 *** *** *** *** May 29,113 *** *** *** *** June 33,833 *** *** *** *** July 34,784 *** *** *** *** August 31,080 *** *** *** *** September 32,216 *** *** *** *** October 33,894 *** *** *** *** November 27,116 *** *** *** *** December 27,265 *** *** *** ***
Total 349,406 *** *** *** *** Table continued on next page.

IV-12
Table IV-6--Continued Standard wire mesh: U.S. shipments, by quantity and share of total, monthly, 2019-20
Item
U.S. producer'
U.S. shipments
U.S. importers' U.S. shipments from.--
Apparent U.S.
consumption Mexico Nonsubject
sources
All import
sources Share of quantity (percent)
U.S. shipments: 2019: January *** *** *** *** 100.0
February *** *** *** *** 100.0 March *** *** *** *** 100.0 April *** *** *** *** 100.0 May *** *** *** *** 100.0 June *** *** *** *** 100.0 July *** *** *** *** 100.0 August *** *** *** *** 100.0 September *** *** *** *** 100.0 October *** *** *** *** 100.0 November *** *** *** *** 100.0 December *** *** *** *** 100.0
Total *** *** *** *** 100.0 2020: January *** *** *** *** 100.0
February *** *** *** *** 100.0 March *** *** *** *** 100.0 April *** *** *** *** 100.0 May *** *** *** *** 100.0 June *** *** *** *** 100.0 July *** *** *** *** 100.0 August *** *** *** *** 100.0 September *** *** *** *** 100.0 October *** *** *** *** 100.0 November *** *** *** *** 100.0 December *** *** *** *** 100.0
Total *** *** *** *** 100.0 Source: Compiled from data submitted in response to Commission questionnaires.

IV-13
Figure IV-4 Standard wire mesh: U.S. shipments, by quantity, monthly, 2019-20
* * * * * * *
Source: Compiled from data submitted in response to Commission questionnaires.

IV-14
Figure IV-5 Standard wire mesh: U.S. shipments, by share, monthly, 2019-20
* * * * * * *
Source: Compiled from data submitted in response to Commission questionnaires. During the three most-recently completed calendar years, apparent U.S. consumption
increased from *** short tons in 2018 to *** short tons in 2020. The share accounted for by standard wire mesh produced in the United States increased, in terms of quantity, by *** percentage points during these three years, while the share of apparent U.S. consumption accounted for by imports of standard wire mesh from Mexico decreased, in terms of quantity, by *** percentage points.

V-1
Part V: Pricing data
Factors affecting prices
Raw material costs
The primary input used in the production of standard wire mesh is wire rod, which is
drawn into wire. Either smooth or deformed wire can be used in the production of standard
wire mesh. As discussed in greater detail in Part VI, raw materials are the largest component of
total cost of goods sold (“COGS”) for wire mesh. Wire rod, as a share of COGS, ranged between
*** percent (in 2017) and *** percent (in 2019), and was *** percent in January–September
2019 and *** percent in January-September 2020. Prices for wire mesh tended to fluctuate
closely with published wire rod prices.
All eight responding U.S. producers and 3 of 5 importers reported that raw material
costs increased since January 1, 2017. According to ***, wire mesh prices increased due to
global wire rod, scrap, and wire shortages.1 As shown in figure V-1, wire rod prices increased
throughout 2017, decreased in the second half of 2018 and the first half of 2019, and fluctuated
in 2020.2
*** reported that prices for standard wire mesh fluctuate with scrap prices. Steel scrap
prices increased throughout 2017 and into 2018, reached a peak at the end of 2018, decreased
before stabilizing at the end of 2019, and then increased in 2020 (figure V‐2).
1 Respondent posthearing brief, Exhibit 11, p. 175, “Deacero Customer Email Number 1”, Monday, December 7, 2020.
2 Wire rod is subject to duties under Section 232 of the Trade Expansion Act of 1962, as amended
(U.S.C. 1862) and, as discussed in greater detail in Part I, is subject to antidumping and countervailing duty orders in the United States (including orders issued in the first half of 2018).

V-2
Figure V-1 Wire rod: U.S. domestic prices, monthly, January 2017–December 2020
* * * * * * *
Source: ***, various monthly issues, compiled January 6, 2021.

V-3
Figure V-2
Ferrous scrap: U.S. prices, monthly, January 2017–December 2020
* * * * * * * Source: ***, retrieved January 6, 2021
Eight of 11 U.S. producers and 4 of 6 responding U.S. importers reported that since the
implementation of Section 232 tariffs on steel imports, raw material costs for standard wire
mesh had increased.3 Producer *** reported that costs increased by about 25 percent. The
remaining three U.S. producers and two U.S. importers reported that raw material costs
fluctuated.
Transportation costs to the U.S. market
Transportation costs for standard wire mesh shipped from Mexico to the United States
averaged 2.2 percent during 2019. This estimate was derived from official import data and
represents the transportation and other charges on imports.4
3 See Part I for additional information on the Section 232 tariffs. 4 The estimated transportation costs were obtained by subtracting the customs value from the c.i.f.
value of the imports for 2019 and then dividing by the customs value based on the HTS subheadings 7314.20.0000 and 7314.39.0000.

V-4
U.S. inland transportation costs
Eleven responding U.S. producers and six importers reported that they typically arrange
transportation to their customers. U.S. producers reported that their U.S. inland transportation
costs ranged from 4 to 9 percent; 5 percent was the most frequently reported estimate. U.S.
importers reported higher costs of 6 to 10 percent.
Pricing practices
Pricing methods
All responding U.S. producers and importers reported setting prices using transaction-
by-transaction negotiations. One U.S. producer/importer each reported using contracts (***)
and set price lists (***) (table V-1).
Table V-1 Standard wire mesh: U.S. producers’ and importers’ reported price setting methods, by number of responding firms
Method U.S. producers Importers
Transaction-by-transaction 10 6
Contract --- 1
Set price list --- 1
Other --- ---
Responding firms 10 6
Note: The sum of responses down may not add up to the total number of responding firms as each firm was instructed to check all applicable price setting methods employed.
Source: Compiled from data submitted in response to Commission questionnaires.
U.S. producers and importers reported selling the vast majority of their standard wire
mesh in the spot market, with a small share being sold through short-term contracts (table V-2).
Table V-2 Standard wire mesh: U.S. producers’ and importers’ shares of U.S. commercial shipments by type of sale, 2019
Type of sale U.S. producers Importers
Long-term contracts *** ***
Annual contracts *** ***
Short-term contracts *** ***
Spot sales *** ***
Total *** ***
Note: Because of rounding, figures may not add to the totals shown.
Source: Compiled from data submitted in response to Commission questionnaires.
Two U.S. producers (***) reported that the average duration of a contract was 90 days
and one reported that it was 30 days. Three producers and one importer
V-5
reported fixing both price and quantity in their short-term contracts. Three producers and one
importer reported that prices were not renegotiated or indexed to raw materials.
Seventeen of eighteen purchasers reported that their purchases involve negotiations.
Purchaser *** reported that it negotiated price and delivery. Eight purchasers reported that
wire rod prices were not indexed to raw materials.
Four purchasers reported that they purchase product daily, nine purchase weekly, and
three purchase monthly. Fourteen of seventeen responding purchasers reported that their
purchasing frequency had not changed since 2017. *** reported that it had changed its
purchase frequency because of changing customer demand, and *** and *** reported more
frequent purchases because of business growth.
Seven of eighteen purchasers contact 1 to 3 suppliers before making a purchase; all
eighteen responding purchasers reported contacting no more than 5 suppliers.
Sales terms and discounts
Nine of 12 U.S. producers and all importers typically quote prices on a delivered basis.
Three U.S. producers offer quantity discounts, two total offer total volume discounts, and four
offer no discounts. Two importers offer quantity discounts, two offer total volume discounts,
and three do not offer discounts.
Price leadership
Ten of the 18 responding purchasers listed one or more price leaders in the U.S. market,
including U.S. producers Insteel, Nucor, and WMC and Mexican producer/importer Deacero.
*** listed WMC, Nucor, and Insteel; *** listed Insteel; *** listed Deacero; *** listed WMC; ***
listed Nucor; *** listed Villacero; New South and Whitecap listed ***; and *** listed WMC.
Purchaser *** reported that Insteel’s national presence allows it to implement price changes
throughout the United States and *** reported that Insteel initiates price changes that impact
the overall market. Purchaser *** reported that Deacero cuts prices in order to hold the
market.

V-6
Price data
The Commission requested U.S. producers and importers to provide quarterly data for
the total quantity and f.o.b. value of the following standard wire mesh products shipped to
unrelated U.S. customers during January 2017–September 2020.5
Product 1 .‐‐ 6x6, 10 gauge, W1.4 W1.4, 5’ x 150’ rolls.
Product 2 .‐‐ 6x6, 10 gauge, D1.4 D1.4, 5’ x 150’ rolls.
Product 3.‐‐ 6x6, 10 gauge, W1.4 W1.4, 8’ x 20’ sheets.
Product 4.‐‐ 6x6, 10 gauge, D1.4 D1.4, 8’ x 20’ sheets.
Product 5 .‐‐ 6x6, 6 gauge, D2.9 D2.9, 8’ x 20’ sheets.
Product 6.‐‐ 6x6, 10 gauge, D1.4 D1.4, 3.6’ x 7’ sheets.
Ten U.S. producers and five importers provided usable pricing data for sales of the
requested products, although not all firms reported pricing for all products for all quarters.6
Pricing data reported by these firms accounted for approximately 57.8 percent of U.S.
producers’ U.S. shipments of standard wire mesh and *** percent of U.S. shipments of subject
imports from Mexico in 2019.7 8
Price data for products 1-6 are presented in tables V-3 to V-8 and figures V-3 to V-8.
5 During the preliminary phase of these investigations, the Commission requested data on the following pricing products: Product 1.-- 6x6, 10 gauge, W/D1.4 W/D1.4, 5’ x 150’ rolls; Product 2.-- 6x6, 10 gauge, W/D1.4 W/D1.4, 8’ x 20’ sheets; Product 3.-- 6x6, 6 gauge, W/D2.9 W/D2.9, 8’ x 20’ sheets; and Product 4.-- 6x6, 8 gauge, W/D2.1 W/D2.1, 8’ x 20’ sheets. During the final phase of these investigations, pricing products were separated into smooth and deformed wire for pricing products 1 and 2 from the preliminary phase, pricing product 3 from the preliminary phase was changed to deformed wire only and became final pricing product 5, pricing product 4 from the preliminary phase was removed, and final pricing product 6 was added.
6 Per-unit pricing data are calculated from total quantity and total value data provided by U.S. producers and importers. The precision and variation of these figures may be affected by rounding, limited quantities, and producer or importer estimates.
7 Pricing coverage is based on U.S. shipments reported in questionnaires. 8 No importers reported price data for product 3 from Mexico.

V-7
Table V-3 Standard wire mesh: Weighted-average f.o.b. prices and quantities of domestic and imported product 1 and margins of underselling/(overselling), by quarter, January 2017–September 2020
Period
United States Mexico
Price (dollars per short
ton) Quantity
(short tons)
Price (dollars per short ton)
Quantity (short tons)
Margin (percent)
2017: Jan.-Mar. *** *** *** *** ***
Apr.-June *** *** *** *** ***
July-Sept. *** *** *** *** ***
Oct.-Dec. *** *** *** *** ***
2018: Jan.-Mar. *** *** *** *** ***
Apr.-June *** *** *** *** ***
July-Sept. *** *** *** *** ***
Oct.-Dec. *** *** *** *** ***
2019: Jan.-Mar. *** *** *** *** ***
Apr.-June *** *** *** *** ***
July-Sept. *** *** *** *** ***
Oct.-Dec. *** *** *** *** ***
2020: Jan.-Mar. *** *** *** *** ***
Apr.-June *** *** *** *** ***
July-Sept. *** *** *** *** ***
Note: Product 1: 6x6, 10 gauge, D1.4 D1.4, 5’ x 150’ rolls. Note: Product 1 October-December 2018 reflects ***. Source: Compiled from data submitted in response to Commission questionnaires.

V-8
Figure V-4 Standard wire mesh: Weighted-average f.o.b. prices and quantities of domestic and imported product 2 and margins of underselling/(overselling), by quarter, January 2017–September 2020
Period
United States Mexico
Price (dollars per short
ton) Quantity
(short tons)
Price (dollars per short ton)
Quantity (short tons)
Margin (percent)
2017: Jan.-Mar. *** *** *** *** ***
Apr.-June *** *** *** *** ***
July-Sept. *** *** *** *** ***
Oct.-Dec. *** *** *** *** ***
2018: Jan.-Mar. *** *** *** *** ***
Apr.-June *** *** *** *** ***
July-Sept. *** *** *** *** ***
Oct.-Dec. *** *** *** *** ***
2019: Jan.-Mar. *** *** *** *** ***
Apr.-June *** *** *** *** ***
July-Sept. *** *** *** *** ***
Oct.-Dec. *** *** *** *** ***
2020: Jan.-Mar. *** *** *** *** ***
Apr.-June *** *** *** *** ***
July-Sept. *** *** *** *** ***
Note: Product 2: 6x6, 10 gauge, W1.4 W1.4, 5’ x 150’ rolls. Source: Compiled from data submitted in response to Commission questionnaires.

V-9
Table V-5 Standard wire mesh: Weighted-average f.o.b. prices and quantities of domestic and imported product 3 and margins of underselling/(overselling), by quarter, January 2017–September 2020
Period
United States Mexico Price
(dollars per short ton)
Quantity (short tons)
Price (dollars per short ton)
Quantity (short tons)
Margin (percent)
2017: Jan.-Mar. *** *** *** *** ***
Apr.-June *** *** *** *** ***
July-Sept. *** *** *** *** ***
Oct.-Dec. *** *** *** *** ***
2018: Jan.-Mar. *** *** *** *** ***
Apr.-June *** *** *** *** ***
July-Sept. *** *** *** *** ***
Oct.-Dec. *** *** *** *** ***
2019: Jan.-Mar. *** *** *** *** ***
Apr.-June *** *** *** *** ***
July-Sept. *** *** *** *** ***
Oct.-Dec. *** *** *** *** ***
2020: Jan.-Mar. *** *** *** *** ***
Apr.-June *** *** *** *** ***
July-Sept. *** *** *** *** ***
Note: Product 3: 6x6, 10 gauge, W/D1.4 W/D1.4, 8’ x 20’ sheets Source: Compiled from data submitted in response to Commission questionnaires.

V-10
Table V-6 Standard wire mesh: Weighted-average f.o.b. prices and quantities of domestic and imported product 4 and margins of underselling/(overselling), by quarter, January 2017–September 2020
Period
United States Mexico Price
(dollars per short ton)
Quantity (short tons)
Price (dollars per short ton)
Quantity (short ton)
Margin (percent)
2017: Jan.-Mar. *** *** *** *** ***
Apr.-June *** *** *** *** ***
July-Sept. *** *** *** *** ***
Oct.-Dec. *** *** *** *** ***
2018: Jan.-Mar. *** *** *** *** ***
Apr.-June *** *** *** *** ***
July-Sept. *** *** *** *** ***
Oct.-Dec. *** *** *** *** ***
2019: Jan.-Mar. *** *** *** *** ***
Apr.-June *** *** *** *** ***
July-Sept. *** *** *** *** ***
Oct.-Dec. *** *** *** *** ***
2020: Jan.-Mar. *** *** *** *** ***
Apr.-June *** *** *** *** ***
July-Sept. *** *** *** *** ***
Note: Product 4: 6x6, 10 gauge, D1.4 D1.4, 3.6’ x 7’ sheets. Source: Compiled from data submitted in response to Commission questionnaires.

V-11
Table V-7 Standard wire mesh: Weighted-average f.o.b. prices and quantities of domestic and imported product 5 and margins of underselling/(overselling), by quarter, January 2017–September 2020
Period
United States Mexico Price
(dollars per short ton)
Quantity (short tons)
Price (dollars per short ton)
Quantity (short tons)
Margin (percent)
2017: Jan.-Mar. *** *** *** *** ***
Apr.-June *** *** *** *** ***
July-Sept. *** *** *** *** ***
Oct.-Dec. *** *** *** *** ***
2018: Jan.-Mar. *** *** *** *** ***
Apr.-June *** *** *** *** ***
July-Sept. *** *** *** *** ***
Oct.-Dec. *** *** *** *** ***
2019: Jan.-Mar. *** *** *** *** ***
Apr.-June *** *** *** *** ***
July-Sept. *** *** *** *** ***
Oct.-Dec. *** *** *** *** ***
2020: Jan.-Mar. *** *** *** *** ***
Apr.-June *** *** *** *** ***
July-Sept. *** *** *** *** ***
Note: Product 5: 6x6, 10 gauge, W1.4 W1.4, 7’ x 20’ sheets Source: Compiled from data submitted in response to Commission questionnaires.

V-12
Table V-8 Standard wire mesh: Weighted-average f.o.b. prices and quantities of domestic and imported product 6 and margins of underselling/(overselling), by quarter, January 2017–September 2020
Period
United States Mexico Price
(dollars per short ton)
Quantity (short tons)
Price (dollars per short ton)
Quantity (short tons)
Margin (percent)
2017: Jan.-Mar. *** *** *** *** ***
Apr.-June *** *** *** *** ***
July-Sept. *** *** *** *** ***
Oct.-Dec. *** *** *** *** ***
2018: Jan.-Mar. *** *** *** *** ***
Apr.-June *** *** *** *** ***
July-Sept. *** *** *** *** ***
Oct.-Dec. *** *** *** *** ***
2019: Jan.-Mar. *** *** *** *** ***
Apr.-June *** *** *** *** ***
July-Sept. *** *** *** *** ***
Oct.-Dec. *** *** *** *** ***
2020: Jan.-Mar. *** *** *** *** ***
Apr.-June *** *** *** *** ***
July-Sept. *** *** *** *** ***
Note: Product 6: 6x6, 10 gauge, D1.4 D1.4, 3.6’ x 7’ sheets. Source: Compiled from data submitted in response to Commission questionnaires.
V-13
Figure V-3 Standard wire mesh: Weighted-average prices and quantities of domestic and imported product 1, by quarter, January 2017–September 2020
* * * * * * * Product 1: 6x6, 10 gauge, D1.4 D1.4, 5’ x 150’ rolls. Source: Compiled from data submitted in response to Commission questionnaires.

V-14
Figure V-4 Standard wire mesh: Weighted-average prices and quantities of domestic and imported product 2, by quarter, January 2017–September 2020
* * * * * * * Product 2: 6x6, 10 gauge, W1.4 W1.4, 5’ x 150’ rolls. Source: Compiled from data submitted in response to Commission questionnaires.

V-15
Figure V-5 Standard wire mesh: Weighted-average prices and quantities of domestic and imported product 3, by quarter, January 2017–September 2020
* * * * * * * Product 3: 6x6, 10 gauge, W/D1.4 W/D1.4, 8’ x 20’ sheets. Source: Compiled from data submitted in response to Commission questionnaires.

V-16
Figure V-6 Standard wire mesh: Weighted-average prices and quantities of domestic and imported product 4, by quarter, January 2017–September 2020
* * * * * * * Product 4: 6x6, 10 gauge, D1.4 D1.4, 3.6’ x 7’ sheets. Source: Compiled from data submitted in response to Commission questionnaires.

V-17
Figure V-7 Standard wire mesh: Weighted-average prices and quantities of domestic and imported product 5, by quarter, January 2017–September 2020
* * * * * * *
Product 5: 6x6, 10 gauge, W1.4 W1.4, 7’ x 20’ sheets.
Source: Compiled from data submitted in response to Commission questionnaires.
V-18
Figure V-8 Standard wire mesh: Weighted-average prices and quantities of domestic and imported product 6, by quarter, January 2017–September 2020
* * * * * * * Note: Product 6: 6x6, 10 gauge, D1.4 D1.4, 3.6’ x 7’ sheets. Source: Compiled from data submitted in response to Commission questionnaires.

V-19
Price trends
In general, prices for products 1, 3, and 4 decreased during January 2017–September
2020, while prices for products 2, 5, and 6 increased. Table V-9 summarizes the price trends, by
country and by product. Prices increased from January-September 2018, and then declined
thereafter. Correlations between average quarterly prices presented in figure V-1 (***) and
the quarterly prices of the six domestic pricing products presented later in Part V ranged
between *** and ***. As shown in the table, domestic price decreases ranged from ***
percent for products 1, 3, and 4 during January 2017–September 2020 and price increases for
products 2, 5, and 6 ranged from *** to *** percent. Import prices for products 2 and 5
increased by *** and *** percent, respectively, and import prices for product 1 and 4
decreased by *** and *** percent, respectively.
Table V-9 Standard wire mesh: Summary of weighted-average f.o.b. prices for products 1-6 from the United States and Mexico
Item
Number of quarters
Low price (dollars per short tons)
High price (dollars per short tons)
Change in price
(percent)
Product 1: United States *** *** *** ***
Mexico *** *** *** ***
Product 2: United States *** *** *** ***
Mexico *** *** *** ***
Product 3: United States *** *** *** ***
Mexico *** *** *** ***
Product 4: United States *** *** *** ***
Mexico *** *** *** ***
Product 5: United States *** *** *** ***
Mexico *** *** *** ***
Product 6: United States *** *** *** ***
Mexico *** *** *** ***
Note: Percentage change from the first quarter in which data were available to the last quarter in which price data were available.
Source: Compiled from data submitted in response to Commission questionnaires.

V-20
Price comparisons
As shown in table V-10, prices for product imported from Mexico were below those for
U.S.-produced product in 55 of 69 instances (57,391 short tons); margins of underselling ranged
from 3.0 to 30.5 percent. In the remaining 14 instances (3,827 short tons), prices for product
from Mexico were between 0.2 and 18.0 percent above prices for the domestic product.

V-21
Table V-10 Standard wire mesh: Instances of underselling/overselling and the range and average of margins, by country, January 2017–September 2020
Product
Underselling
Number of quarters
Quantity (short tons)
Average margin
(percent)
Margin range (percent)
Min Max
Product 1 *** *** *** *** ***
Product 2 *** *** *** *** ***
Product 3 *** *** *** *** ***
Product 4 *** *** *** *** ***
Product 5 *** *** *** *** ***
Product 6 *** *** *** *** ***
Total, underselling 55 57,391 11.1 3.0 30.5
2017 12 *** 11.0 3.2 30.5
2018 17 *** 12.8 4.2 24.7
2019 16 *** 11.1 5.9 22.7
Jan-Sept 2020 10 *** 8.5 3.0 16.4
Total, underselling 55 57,391 11.1 3.0 30.5
Product
(Overselling)
Number of quarters
Quantity1 (short tons)
Average margin
(percent)
Margin range (percent)
Min Max
Product 1 *** *** *** *** ***
Product 2 *** *** *** *** ***
Product 3 *** *** *** *** ***
Product 4 *** *** *** *** ***
Product 5 *** *** *** *** ***
Product 6 *** *** *** *** ***
Total, overselling 14 3,827 (11.9) (0.2) (18.0) 2017 2 *** (15.1) (12.7) (17.5)
2018 3 *** (7.6) (0.2) (13.4)
2019 4 *** (16.1) (12.6) (18.0)
Jan-Sept 2020 5 *** (9.9) (0.3) (17.9)
Total, overselling 14 3,827 (11.9) (0.2) (18.0)
Note: These data include only quarters in which there is a comparison between the U.S. and subject product. There were no comparisons available for Product 3.
Source: Compiled from data submitted in response to Commission questionnaires.

V-22
Lost sales and lost revenue
In the preliminary phase of the investigations, the Commission requested that U.S.
producers of standard wire mesh report purchasers with which they experienced instances of
lost sales or revenue due to competition from imports of standard wire mesh from Mexico
during January 2017–March 2020. Five U.S. producers submitted lost sales and lost revenue
allegations. The five responding U.S. producers identified 46 firms with which they lost sales or
revenue (20 consisting of lost sales allegations, 1 consisting of lost revenue allegations, and 41
consisting of both types of allegations). Most of the reported lost sales and/or lost revenues
were individual sales/RFQ bids.
In the final phase of the investigations, of the ten responding U.S. producers, eight
reported that they had to either reduce prices or roll back announced price increases, and
seven firms reported that they had lost sales.
Staff sent questionnaires to 61 purchasers and received responses from eighteen
purchasers.9 Responding purchasers reported purchasing 426,893 short tons of standard wire
mesh during January 2017–September 2020.10
Of seventeen responding purchasers, eleven reported that, since 2017, they had
purchased imported standard wire mesh from Mexico instead of U.S.-produced product. Seven
of these purchasers reported that subject import prices were lower than U.S.-produced
product, and six of these purchasers reported that price was a primary reason for the decision
to purchase imported product rather than U.S.-produced product. Three purchasers estimated
the quantity of standard wire mesh from Mexico purchased instead of domestic product;
quantities ranged from *** short tons to *** short tons (table V-12). Purchasers identified
availability, size of the supplier, packaging, service, and on-time delivery as non-price reasons
for purchasing imported rather than U.S.-produced product.
Of the eighteen responding purchasers, four reported that U.S. producers had reduced
prices in order to compete with lower-priced imports from Mexico, four reported that U.S.
producers had not reduced prices, and ten reported that they did not know (table V-13).
9 One purchaser, ***, submitted a lost sales lost revenue survey response in the preliminary phase, but did not submit a purchaser questionnaire response in the final phase.
10 Purchasers reported purchasing *** short tons of domestic standard wire mesh during the same period; this represents *** percent of U.S. producers’ U.S. shipments. Purchasers reported purchasing *** short tons of standard wire mesh from Mexico between January 2017 and September 2020; this represents *** percent of reported imports from Mexico.

V-23
Purchasers *** reported price reductions of *** percent, respectively.
Table V-11 Standard wire mesh: Purchasers’ reported purchases and imports, January 2017-September 2020
Purchaser
Purchases and imports in January 2017–September 2020
(short tons) Change in
domestic share (pp, 2017-19)
Change in subject country share (pp, 2017-19) Domestic Subject All other
*** *** *** *** *** ***
*** *** *** *** *** ***
*** *** *** *** *** ***
*** *** *** *** *** ***
*** *** *** *** *** ***
*** *** *** *** *** ***
*** *** *** *** *** ***
*** *** *** *** *** ***
*** *** *** *** *** ***
*** *** *** *** *** ***
*** *** *** *** *** ***
*** *** *** *** *** ***
*** *** *** *** *** ***
*** *** *** *** *** ***
*** *** *** *** *** ***
*** *** *** *** *** ***
*** *** *** *** *** ***
*** *** *** *** *** ***
Total *** *** *** *** ***
Note: All other includes all other sources and unknown sources. Note: Percentage points (pp) change: Change in the share of the firm’s total purchases of domestic and/or subject country imports between first and last years. Note: ***. Source: Compiled from data submitted in response to Commission questionnaires.

V-24
Table V-12 Standard wire mesh: Purchasers’ responses to purchasing subject imports instead of domestic product
Purchaser
If purchased imports instead of domestic,
was price a primary reason
Purchased imports
instead of domestic
(Y/N)
Imports priced lower (Y/N)
Y/N
If Yes, quantity
purchased instead of domestic
(short tons) If No, non-price
reason
*** *** *** *** *** ***
*** *** *** *** *** ***
*** *** *** *** *** *** *** *** *** *** *** ***
*** *** *** *** *** *** *** *** *** *** *** ***
*** *** *** *** *** *** *** *** *** *** *** *** *** *** *** *** *** ***
*** *** *** *** *** ***
*** *** *** *** *** ***
*** *** *** *** *** *** *** *** *** *** *** ***
*** *** *** *** *** *** *** *** *** *** *** ***
*** *** *** *** *** *** *** *** *** *** *** ***
*** *** *** *** *** ***
Total Yes--11; No--6 Yes--7; No--4
Yes--6; No--5 ***
Source: Compiled from data submitted in response to Commission questionnaires.
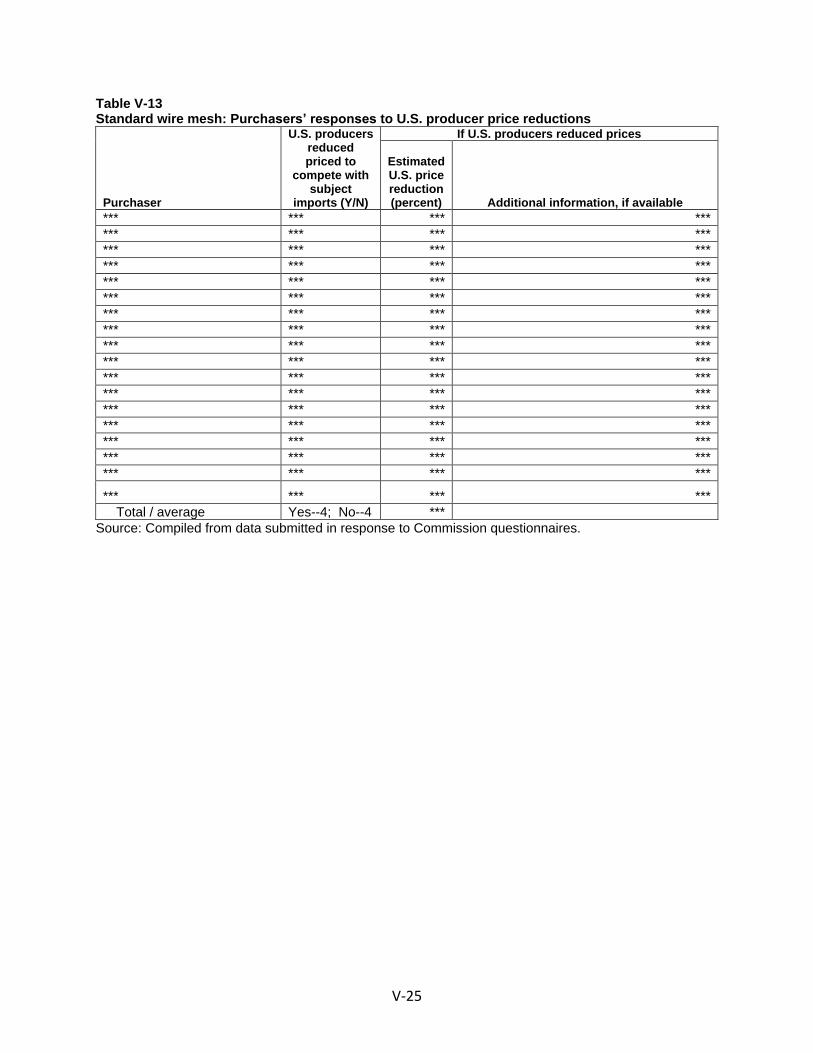
V-25
Table V-13 Standard wire mesh: Purchasers’ responses to U.S. producer price reductions
Purchaser
U.S. producers reduced priced to
compete with subject
imports (Y/N)
If U.S. producers reduced prices
Estimated U.S. price reduction (percent) Additional information, if available
*** *** *** ***
*** *** *** ***
*** *** *** *** *** *** *** ***
*** *** *** *** *** *** *** ***
*** *** *** ***
*** *** *** *** *** *** *** *** *** *** *** ***
*** *** *** ***
*** *** *** ***
*** *** *** ***
*** *** *** *** *** *** *** *** *** *** *** ***
*** *** *** ***
*** *** *** ***
Total / average Yes--4; No--4 *** Source: Compiled from data submitted in response to Commission questionnaires.


VI-1
Part VI: Financial experience of U.S. producers
Background
The following U.S. producers provided usable financial results on their standard wire mesh operations: Davis, Insteel, Keysteel, Liberty, Mid-South, National, Nucor, Oklahoma, Peninsula, Tree Island, and WMC. The responding U.S. producers provided their results on the basis of U.S. generally accepted accounting principles (“GAAP”), with the exception of ***. The responding producers reported their financial results on a calendar-year basis.1 2
Operations on standard wire mesh
Figure VI-1 presents each responding firm’s share of the total reported net sales, by quantity, in 2019. Table VI-1 presents aggregated data on U.S. producers’ operations in relation to standard wire mesh during 2017-19, January-September 2019, and January-September 2020. Table VI-2 presents changes in the average unit value (“AUV”) data for the data presented in table VI-1, while table VI-3 presents selected company-specific financial data.
1 As noted earlier, the U.S. industry’s standard wire mesh operations reflect several notable events. First, the entry of a new producer, ***. Second, a facility acquisition by ***. Lastly, ***. 2 Staff conducted a verification of the financial data, and selected elements of the trade data, of *** U.S. producer questionnaire. Data changes pursuant to verification are reflected in the trade and financial sections of this report, including the shipment and financial sections in appendixes E and F for engineered wire mesh.

VI-2
Figure VI-1 Standard wire mesh: Share of net sales quantity, by firm, 2019
* * * * * * *
Source: Compiled from data submitted in response to Commission questionnaires.

VI-3
Table VI-1 Standard wire mesh: Results of operations of U.S. producers, 2017-19, January-September 2019, and January-September 2020
Item Calendar year January to September
2017 2018 2019 2019 2020 Quantity (short tons) Total net sales *** *** *** *** *** Value (1,000 dollars) Total net sales *** *** *** *** *** Cost of goods sold.-- Wire rod *** *** *** *** ***
Direct labor *** *** *** *** *** Other factory costs *** *** *** *** ***
Total COGS *** *** *** *** *** Gross profit *** *** *** *** *** SG&A expense *** *** *** *** *** Operating income or (loss) *** *** *** *** *** Interest expense *** *** *** *** *** All other expenses *** *** *** *** *** All other income *** *** *** *** *** Net income or (loss) *** *** *** *** *** Depreciation/amortization *** *** *** *** *** Cash flow *** *** *** *** *** Ratio to net sales (percent) Cost of goods sold.-- Wire rod *** *** *** *** ***
Direct labor *** *** *** *** *** Other factory costs *** *** *** *** ***
Average COGS *** *** *** *** *** Gross profit 4.4 8.8 (0.4) (0.1) (0.3) SG&A expense *** *** *** *** *** Operating income or (loss) (3.5) 1.3 (8.0) (7.6) (8.5) Net income or (loss) (4.3) 0.8 (8.7) (8.4) (9.2)
Table continued on next page.

VI-4
Table VI-1--Continued Standard wire mesh: Results of operations of U.S. producers, 2017-19, January-September 2019, and January-September 2020
Item Calendar year January to September
2017 2018 2019 2019 2020 Ratio to total COGS (percent)
Cost of goods sold.-- Wire rod *** *** *** *** ***
Direct labor *** *** *** *** *** Other factory costs *** *** *** *** ***
Average COGS *** *** *** *** *** Unit value (dollars per short ton)
Commercial sales *** *** *** *** *** Internal consumption *** *** *** *** *** Transfers to related firms *** *** *** *** ***
Total net sales *** *** *** *** *** Cost of goods sold.-- Wire rod *** *** *** *** ***
Direct labor *** *** *** *** *** Other factory costs *** *** *** *** ***
Average COGS *** *** *** *** *** Gross profit 34 86 (4) (1) (2) SG&A expense *** *** *** *** *** Operating income or (loss) (27) 12 (73) (70) (65) Net income or (loss) (33) 8 (79) (78) (71)
Number of firms reporting Operating losses *** *** *** *** *** Net losses *** *** *** *** *** Data *** *** *** *** ***
Source: Compiled from data submitted in response to Commission questionnaires.
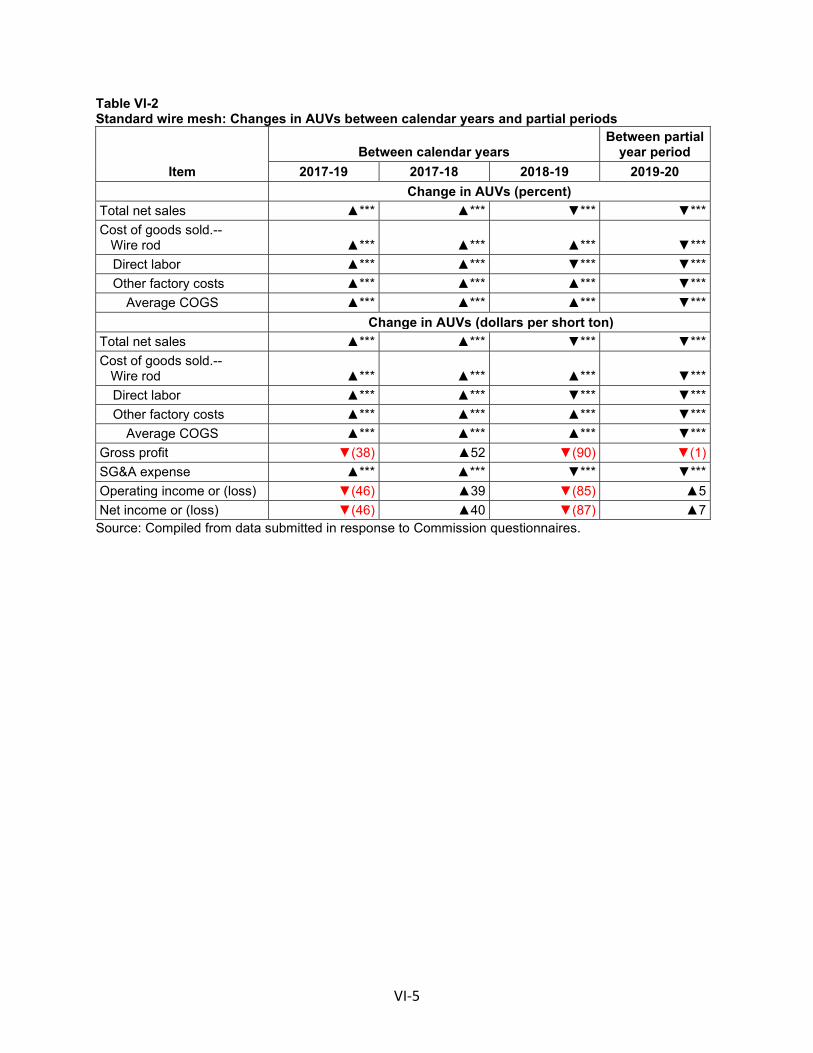
VI-5
Table VI-2 Standard wire mesh: Changes in AUVs between calendar years and partial periods
Item Between calendar years
Between partial year period
2017-19 2017-18 2018-19 2019-20 Change in AUVs (percent)
Total net sales ▲*** ▲*** ▼*** ▼*** Cost of goods sold.-- Wire rod ▲*** ▲*** ▲*** ▼***
Direct labor ▲*** ▲*** ▼*** ▼*** Other factory costs ▲*** ▲*** ▲*** ▼***
Average COGS ▲*** ▲*** ▲*** ▼*** Change in AUVs (dollars per short ton)
Total net sales ▲*** ▲*** ▼*** ▼*** Cost of goods sold.-- Wire rod ▲*** ▲*** ▲*** ▼***
Direct labor ▲*** ▲*** ▼*** ▼*** Other factory costs ▲*** ▲*** ▲*** ▼***
Average COGS ▲*** ▲*** ▲*** ▼*** Gross profit ▼(38) ▲52 ▼(90) ▼(1) SG&A expense ▲*** ▲*** ▼*** ▼*** Operating income or (loss) ▼(46) ▲39 ▼(85) ▲5 Net income or (loss) ▼(46) ▲40 ▼(87) ▲7
Source: Compiled from data submitted in response to Commission questionnaires.

VI-6
Table VI-3 Standard wire mesh: Select results of operations of U.S. producers, by company, 2017-19, January-September 2019, and January-September 2020
Item Calendar year January to September
2017 2018 2019 2019 2020 Total net sales (short tons) Davis *** *** *** *** *** Insteel *** *** *** *** *** Keysteel *** *** *** *** *** Liberty *** *** *** *** *** Mid-South *** *** *** *** *** National *** *** *** *** *** Nucor *** *** *** *** *** Oklahoma *** *** *** *** *** Peninsula *** *** *** *** *** Tree Island *** *** *** *** *** WMC *** *** *** *** ***
All firms *** *** *** *** *** Total net sales (1,000 dollars) Davis *** *** *** *** *** Insteel *** *** *** *** *** Keysteel *** *** *** *** *** Liberty *** *** *** *** *** Mid-South *** *** *** *** *** National *** *** *** *** *** Nucor *** *** *** *** *** Oklahoma *** *** *** *** *** Peninsula *** *** *** *** *** Tree Island *** *** *** *** *** WMC *** *** *** *** ***
All firms *** *** *** *** *** Cost of goods sold (1,000 dollars) Davis *** *** *** *** *** Insteel *** *** *** *** *** Keysteel *** *** *** *** *** Liberty *** *** *** *** *** Mid-South *** *** *** *** *** National *** *** *** *** *** Nucor *** *** *** *** *** Oklahoma *** *** *** *** *** Peninsula *** *** *** *** *** Tree Island *** *** *** *** *** WMC *** *** *** *** ***
All firms *** *** *** *** *** Table continued on next page.

VI-7
Table VI-3--Continued Standard wire mesh: Select results of operations of U.S. producers, by company, 2017-19, January-September 2019, and January-September 2020
Item Calendar year January to September 2017 2018 2019 2019 2020 Gross profit or (loss) (1,000 dollars) Davis *** *** *** *** *** Insteel *** *** *** *** *** Keysteel *** *** *** *** *** Liberty *** *** *** *** *** Mid-South *** *** *** *** *** National *** *** *** *** *** Nucor *** *** *** *** *** Oklahoma *** *** *** *** *** Peninsula *** *** *** *** *** Tree Island *** *** *** *** *** WMC *** *** *** *** ***
All firms *** *** *** *** *** SG&A expenses (1,000 dollars) Davis *** *** *** *** *** Insteel *** *** *** *** *** Keysteel *** *** *** *** *** Liberty *** *** *** *** *** Mid-South *** *** *** *** *** National *** *** *** *** *** Nucor *** *** *** *** *** Oklahoma *** *** *** *** *** Peninsula *** *** *** *** *** Tree Island *** *** *** *** *** WMC *** *** *** *** ***
All firms *** *** *** *** *** Operating income or (loss) (1,000 dollars) Davis *** *** *** *** *** Insteel *** *** *** *** *** Keysteel *** *** *** *** *** Liberty *** *** *** *** *** Mid-South *** *** *** *** *** National *** *** *** *** *** Nucor *** *** *** *** *** Oklahoma *** *** *** *** *** Peninsula *** *** *** *** *** Tree Island *** *** *** *** *** WMC *** *** *** *** ***
All firms *** *** *** *** *** Table continued on next page.

VI-8
Table VI-3--Continued Standard wire mesh: Select results of operations of U.S. producers, by company, 2017-19, January-September 2019, and January-September 2020
Item Calendar year January to September
2017 2018 2019 2019 2020 Net income or (loss) (1,000 dollars) Davis *** *** *** *** *** Insteel *** *** *** *** *** Keysteel *** *** *** *** *** Liberty *** *** *** *** *** Mid-South *** *** *** *** *** National *** *** *** *** *** Nucor *** *** *** *** *** Oklahoma *** *** *** *** *** Peninsula *** *** *** *** *** Tree Island *** *** *** *** *** WMC *** *** *** *** ***
All firms *** *** *** *** *** COGS to net sales ratio (percent)
Davis *** *** *** *** *** Insteel *** *** *** *** *** Keysteel *** *** *** *** *** Liberty *** *** *** *** *** Mid-South *** *** *** *** *** National *** *** *** *** *** Nucor *** *** *** *** *** Oklahoma *** *** *** *** *** Peninsula *** *** *** *** *** Tree Island *** *** *** *** *** WMC *** *** *** *** ***
All firms *** *** *** *** *** Gross profit or (loss) to net sales ratio (percent) Davis *** *** *** *** *** Insteel *** *** *** *** *** Keysteel *** *** *** *** *** Liberty *** *** *** *** *** Mid-South *** *** *** *** *** National *** *** *** *** *** Nucor *** *** *** *** *** Oklahoma *** *** *** *** *** Peninsula *** *** *** *** *** Tree Island *** *** *** *** *** WMC *** *** *** *** ***
All firms 4.4 8.8 (0.4) (0.1) (0.3) Table continued on next page.

VI-9
Table VI-3--Continued Standard wire mesh: Select results of operations of U.S. producers, by company, 2017-19, January-September 2019, and January-September 2020
Item Calendar year January to September
2017 2018 2019 2019 2020 SG&A expense to net sales ratio (percent) Davis *** *** *** *** *** Insteel *** *** *** *** *** Keysteel *** *** *** *** *** Liberty *** *** *** *** *** Mid-South *** *** *** *** *** National *** *** *** *** *** Nucor *** *** *** *** *** Oklahoma *** *** *** *** *** Peninsula *** *** *** *** *** Tree Island *** *** *** *** *** WMC *** *** *** *** ***
All firms *** *** *** *** *** Operating income or (loss) to net sales ratio (percent) Davis *** *** *** *** *** Insteel *** *** *** *** *** Keysteel *** *** *** *** *** Liberty *** *** *** *** *** Mid-South *** *** *** *** *** National *** *** *** *** *** Nucor *** *** *** *** *** Oklahoma *** *** *** *** *** Peninsula *** *** *** *** *** Tree Island *** *** *** *** *** WMC *** *** *** *** ***
All firms (3.5) 1.3 (8.0) (7.6) (8.5) Net income or (loss) to net sales ratio (percent) Davis *** *** *** *** *** Insteel *** *** *** *** *** Keysteel *** *** *** *** *** Liberty *** *** *** *** *** Mid-South *** *** *** *** *** National *** *** *** *** *** Nucor *** *** *** *** *** Oklahoma *** *** *** *** *** Peninsula *** *** *** *** *** Tree Island *** *** *** *** *** WMC *** *** *** *** ***
All firms (4.3) 0.8 (8.7) (8.4) (9.2) Table continued on next page.

VI-10
Table VI-3--Continued Standard wire mesh: Select results of operations of U.S. producers, by company, 2017-19, January-September 2019, and January-September 2020
Item Calendar year January to September
2017 2018 2019 2019 2020 Unit net sales value (dollars per short ton) Davis *** *** *** *** *** Insteel *** *** *** *** *** Keysteel *** *** *** *** *** Liberty *** *** *** *** *** Mid-South *** *** *** *** *** National *** *** *** *** *** Nucor *** *** *** *** *** Oklahoma *** *** *** *** *** Peninsula *** *** *** *** *** Tree Island *** *** *** *** *** WMC *** *** *** *** ***
All firms *** *** *** *** *** Unit wire rod (dollars per short ton) Davis *** *** *** *** *** Insteel *** *** *** *** *** Keysteel *** *** *** *** *** Liberty *** *** *** *** *** Mid-South *** *** *** *** *** National *** *** *** *** *** Nucor *** *** *** *** *** Oklahoma *** *** *** *** *** Peninsula *** *** *** *** *** Tree Island *** *** *** *** *** WMC *** *** *** *** ***
All firms *** *** *** *** *** Unit direct labor (dollars per short ton) Davis *** *** *** *** *** Insteel *** *** *** *** *** Keysteel *** *** *** *** *** Liberty *** *** *** *** *** Mid-South *** *** *** *** *** National *** *** *** *** *** Nucor *** *** *** *** *** Oklahoma *** *** *** *** *** Peninsula *** *** *** *** *** Tree Island *** *** *** *** *** WMC *** *** *** *** ***
All firms *** *** *** *** *** Table continued on next page.

VI-11
Table VI-3--Continued Standard wire mesh: Select results of operations of U.S. producers, by company, 2017-19, January-September 2019, and January-September 2020
Item Calendar year January to September
2017 2018 2019 2019 2020 Unit other factory costs (dollars per short ton) Davis *** *** *** *** *** Insteel *** *** *** *** *** Keysteel *** *** *** *** *** Liberty *** *** *** *** *** Mid-South *** *** *** *** *** National *** *** *** *** *** Nucor *** *** *** *** *** Oklahoma *** *** *** *** *** Peninsula *** *** *** *** *** Tree Island *** *** *** *** *** WMC *** *** *** *** ***
All firms *** *** *** *** *** Unit COGS (dollars per short ton) Davis *** *** *** *** *** Insteel *** *** *** *** *** Keysteel *** *** *** *** *** Liberty *** *** *** *** *** Mid-South *** *** *** *** *** National *** *** *** *** *** Nucor *** *** *** *** *** Oklahoma *** *** *** *** *** Peninsula *** *** *** *** *** Tree Island *** *** *** *** *** WMC *** *** *** *** ***
All firms *** *** *** *** *** Unit gross profit or (loss) (dollars per short ton) Davis *** *** *** *** *** Insteel *** *** *** *** *** Keysteel *** *** *** *** *** Liberty *** *** *** *** *** Mid-South *** *** *** *** *** National *** *** *** *** *** Nucor *** *** *** *** *** Oklahoma *** *** *** *** *** Peninsula *** *** *** *** *** Tree Island *** *** *** *** *** WMC *** *** *** *** ***
All firms 34 86 (4) (1) (2) Table continued on next page.

VI-12
Table VI-3--Continued Standard wire mesh: Select results of operations of U.S. producers, by company, 2017-19, January-September 2019, and January-September 2020
Item Calendar year January to September
2017 2018 2019 2019 2020 Unit SG&A expenses (dollars per short ton) Davis *** *** *** *** *** Insteel *** *** *** *** *** Keysteel *** *** *** *** *** Liberty *** *** *** *** *** Mid-South *** *** *** *** *** National *** *** *** *** *** Nucor *** *** *** *** *** Oklahoma *** *** *** *** *** Peninsula *** *** *** *** *** Tree Island *** *** *** *** *** WMC *** *** *** *** ***
All firms *** *** *** *** *** Unit operating income or (loss) (dollars per short ton) Davis *** *** *** *** *** Insteel *** *** *** *** *** Keysteel *** *** *** *** *** Liberty *** *** *** *** *** Mid-South *** *** *** *** *** National *** *** *** *** *** Nucor *** *** *** *** *** Oklahoma *** *** *** *** *** Peninsula *** *** *** *** *** Tree Island *** *** *** *** *** WMC *** *** *** *** ***
All firms (27) 12 (73) (70) (65) Table continued on next page.
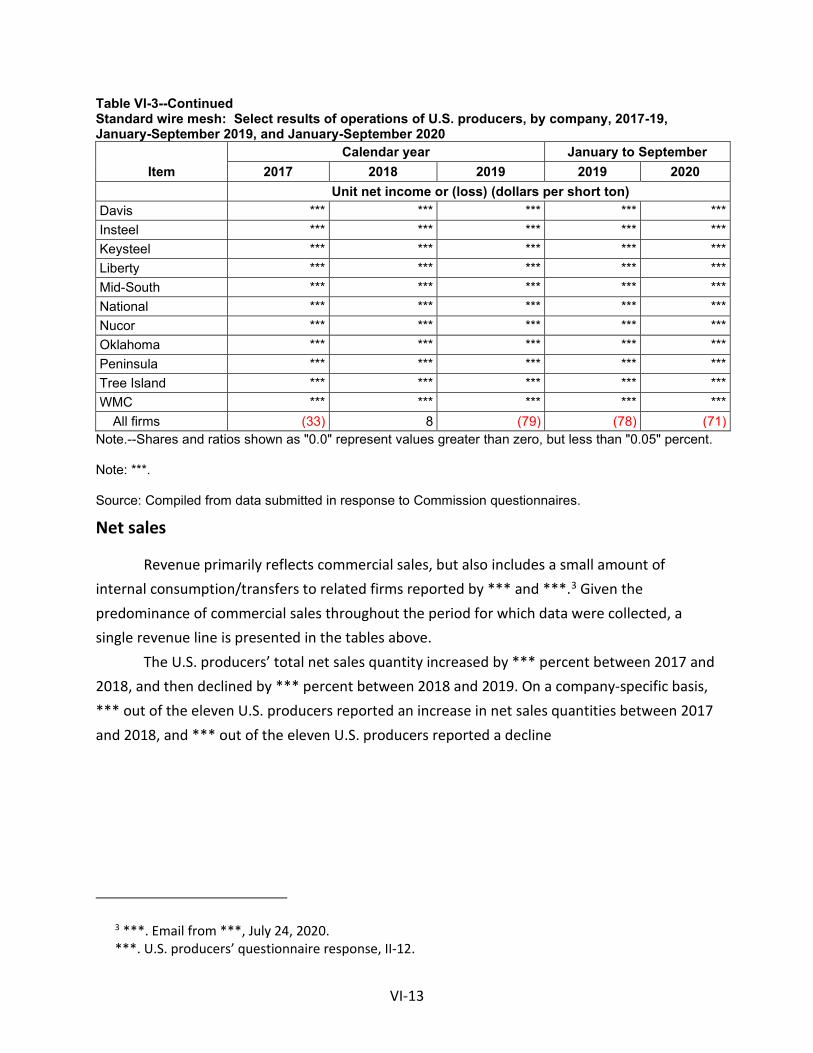
VI-13
Table VI-3--Continued Standard wire mesh: Select results of operations of U.S. producers, by company, 2017-19, January-September 2019, and January-September 2020
Item Calendar year January to September
2017 2018 2019 2019 2020 Unit net income or (loss) (dollars per short ton) Davis *** *** *** *** *** Insteel *** *** *** *** *** Keysteel *** *** *** *** *** Liberty *** *** *** *** *** Mid-South *** *** *** *** *** National *** *** *** *** *** Nucor *** *** *** *** *** Oklahoma *** *** *** *** *** Peninsula *** *** *** *** *** Tree Island *** *** *** *** *** WMC *** *** *** *** ***
All firms (33) 8 (79) (78) (71) Note.--Shares and ratios shown as "0.0" represent values greater than zero, but less than "0.05" percent. Note: ***. Source: Compiled from data submitted in response to Commission questionnaires.
Net sales
Revenue primarily reflects commercial sales, but also includes a small amount of internal consumption/transfers to related firms reported by *** and ***.3 Given the predominance of commercial sales throughout the period for which data were collected, a single revenue line is presented in the tables above.
The U.S. producers’ total net sales quantity increased by *** percent between 2017 and 2018, and then declined by *** percent between 2018 and 2019. On a company-specific basis, *** out of the eleven U.S. producers reported an increase in net sales quantities between 2017 and 2018, and *** out of the eleven U.S. producers reported a decline
3 ***. Email from ***, July 24, 2020. ***. U.S. producers’ questionnaire response, II-12.

VI-14
between 2018 and 2019. 4 Net sales quantity was *** percent higher in interim 2020 than in interim 2019. The value of total net sales followed a similar trend and increased by *** percent between 2017 and 2018 before declining by *** percent between 2018 and 2019. On a company-specific basis, the majority of U.S. producers reported an increase in net sales values between 2017 and 2018 and a decrease between 2018 and 2019.5 6 In interim 2020, however, net sales value was *** percent lower than in interim 2019. The total net sales AUV increased from $*** per short ton in 2017 to $*** per short ton in 2018, before declining to $*** per short ton in 2019. In interim 2020 the average per short ton value was lower, at $*** per short ton, compared to interim 2019 at $*** per short ton. On a company-specific basis, *** U.S. producers reported increases in average per short ton sales values between 2017 and 2018, while the majority reported declines between 2018 and 2019. In interim 2020 compared to interim 2019, *** U.S. producers reported lower average per short ton sales values.7
4 *** reported a decrease net sales quantity between 2017 and 2018. *** were the *** U.S. producers to report an increase in net sales quantities between 2018 and 2019. ***. Email from ***, January 15, 2021.
5 *** reported a decrease in net sales values between 2017 and 2018. *** was the *** U.S. producer to report an increase in net sales values between 2018 and 2019.
6 *** reported a noticeable increase in net sales values of *** percent in 2018, while its quantities only increased by *** percent in that same period. The firm explained that in 2017 its products were low priced, and it increased prices in 2018 out of ‘’absolute necessity’’. Email from ***, January 15, 2021.
7 The average per short ton values for commercial sales for *** varied widely from those for the other U.S. producers. *** explained that its high average per short ton values are due to increased raw material costs, which were affected by Section 232 tariffs. Email from ***, January 18, 2021. *** explained that its average per short ton value was higher due to rising raw material costs between 2017 and 2018. The firm later made the intentional decision to retain its high pricing despite the decrease in raw material costs, in an effort to improve margins and profitability. Email from ***, January 19, 2021. For more information on raw material costs and Section 232 tariffs, please see Part V.

VI-15
Cost of goods sold and gross profit or loss
Raw material costs, direct labor, and other factory costs accounted for ***, ***, and *** percent of total COGS, respectively, in 2019. Raw material costs, which are primarily composed of wire rod, increased irregularly from $*** in 2017 to $*** in 2019, but were lower in interim 2020 at $*** than in interim 2019 at $***. On an average per short ton basis, raw material costs increased between 2017 and 2019 from $*** per short ton to $*** per short ton, but were lower in interim 2020 at $*** per short ton than in interim 2019 at $*** per short ton. As a ratio to net sales, raw material costs also increased from *** percent in 2017 to a high of *** percent in 2019, but were lower in interim 2020 at *** than in interim 2019 at *** percent. Changes in wire rod costs may also be compared with sales on an AUV basis: the difference between the net sale AUV per short ton and that of wire rod costs increased from $*** in 2017 to $*** in 2018, but narrowed in 2019 to $***; the difference was $*** in interim 2019 and $*** in interim 2020.
On a company-specific basis, *** U.S. producers reported higher average per short ton wire rod costs between 2017 and 2018. While a number of U.S. producers continued to report higher average per short ton wire rod costs between 2018 and 2019, the pattern was directionally mixed. In interim 2020 *** U.S. producers reported lower average per short ton wire rod cost compared to interim 2019.8
Companies were requested to provide information on their procurement practices for steel wire rod. Firms reported that they purchase wire rod on a monthly basis, (purchases occur one month ahead of forecasted wire rod needs). Purchasing is at market prices, and while one firm stated there are no indexes to determine market price, others indicated that rod prices are based on the Chicago Shredded scrap index and market prices at the time of purchase.9 Several firms pointed out that domestic wire rod prices are affected by competing imports of wire rod and overall apparent demand for wire rod by domestic wire and wire products producers. Firms stated that they try to manage inventory quantity, increasing purchases in advance of projected price increases and reducing inventory purchases as prices are projected to decline. However,
8 ***. 9 ***, stated that the wire rod price is ***, and is tied to a scrap index. *** U.S. producers’
questionnaire response, III-4b. ***. *** U.S. producers’ questionnaire response, III-4b.

VI-16
most of the firms admitted that there is no way to control price fluctuations of rod, and that “the U.S. rod supply chain is limited to a small number of suppliers, which makes building inventory ahead of anticipated high costs difficult to hedge.”10
Firms were asked to estimate their average days of wire rod in inventory. 11 This number is calculated by dividing 365 days by the ratio of cost of goods sold (COGS) to average inventory, and measures the number of days it takes to turn inventory into sales. A lower number is considered better because it would translate to fewer days needed to turn inventory into cash.12 *** U.S. producers provided a response to this question, with the average days in inventory increasing from approximately 68 days in 2017 to 72 days in 2018, and falling back to 66 days in 2019. The ratio was lower in interim 2020 at 64 days compared with 68 days in interim 2019. Responses varied widely between reporting firms (table VI-4): For example, ***. The target ratio that firms wished to achieve was lower than that reported (***). ***.13 14
10 *** U.S. producers’ questionnaire response, III-4b. 11 U.S. producers’ questionnaire, III-4d. The Commission’s questionnaire asked specifically about steel
wire rod, which is the primary raw material input to manufacture standard wire mesh. 12 Bernstein, Leopold A. and Wild, John J., Analysis of Financial Statements (New York: McGraw-Hill,
2000 (5th Ed.), pp. 135-140. 13 Firm responses to U.S. producers’ questionnaire, III-4d. 14 ***. Email from ***, March 1, 2021.

VI-17
Table VI-4 Standard wire mesh: U.S. producers’ average days in inventory, by company, 2017-19, January-September 2019, and January-September 2020
Note.—***. Average calculated by dividing average number of days reported by the number of firms that provided data. Source: Compiled from data submitted in response to Commission questionnaires.
Firms were also requested to describe their inventory valuation methodology, or cost-flow assumption. Six of the ten responding U.S. firms stated that their inventory was accounted for using weighted average, and four firms reported using first-in-first-out (FIFO), ***. None reported using last-in-first out (LIFO) and one firm did not respond to the question.15
In the accounting records of the firm, the costs of goods available for sale are allocated between cost of goods sold (COGS) and ending inventory using one of these three cost-flow assumptions. COGS impact the income statement and ending inventory appears on the balance sheet. The effect of using each of the cost-flow assumptions is as follows: with FIFO, the oldest cost (in the order in which the costs were incurred) is assigned to units sold and used to calculate cost of goods sold; the remaining unit costs, which reflect more recently incurred
15 U.S. producers’ questionnaire, III-4c. In 2019, firms using the weighted average method accounted for *** percent of total net sales, by value; use of FIFO accounted for *** percent; and not reporting accounted for *** percent.
Item Calendar year January to September
2017 2018 2019 2019 2020 Average days in inventory Davis *** *** *** *** *** Insteel *** *** *** *** *** Keysteel *** *** *** *** *** Liberty *** *** *** *** *** Mid-South *** *** *** *** *** National *** *** *** *** *** Nucor *** *** *** *** *** Oklahoma *** *** *** *** *** Peninsula *** *** *** *** *** Tree Island *** *** *** *** *** WMC *** *** *** *** *** Average of firms providing data 68 72 66 68 64

VI-18
costs, are assigned to the units in ending inventory. With LIFO, unit costs are assigned in the reverse order in which they were incurred. The most recent, or last-in costs, are used to calculate cost of goods sold; the remaining unit costs, which reflect costs incurred earlier, are assigned to the units in ending inventory. Under weighted average (or average) cost, an average cost for all units in inventory is calculated and used to value the units in both cost of goods sold and ending inventory. Assuming rising prices of inputs and costs, the general rule is that LIFO produces the lowest gross profit because it produces the highest COGS, and lowest cost of ending inventory. FIFO produces the highest gross profit because it produces the lowest COGS (assuming past costs were lower than at present), and highest cost ending inventory. Average or weighted average is in the middle. 16 17
Other factory costs, the second largest component of COGS, followed the changes of net sales quantities and increased by *** percent between 2017 and 2018 before declining by *** percent in 2019. In interim 2020 other factory costs were *** percent higher than in interim 2019. On average per short ton basis, other factory costs continuously increased between 2017 and 2019, and were lower in interim 2020 compared to interim 2019.18 As a ratio to net sales, other factory costs decreased from *** percent in 2017 to *** percent in 2018, before increasing to *** percent in 2019, and were higher in interim 2020 (*** percent) compared to interim 2019 (*** percent).
Direct labor costs were also reflective of net sales quantity changes during the full year periods of 2017 to 2019, but were lower in interim 2020 than interim 2019 despite an increase
16 The primary objective in selecting an inventory costing method is to clearly reflect periodic income, i.e., to match the specific costs of an item sold to its related revenues. Since this is difficult in practice, the general acceptance of several inventory cost-flow assumptions, FIFO, LIFO, weighted average, has developed.
17 See, “Inventory Costing Methods,” https://www.principlesofaccounting.com/chapter-8/inventory-costing-methods, January 15, 2021; “Average costing method,” https://www.accountingformanagement.org/weighted-average-costing-method-of-inventory-valuation, January 15, 2021; and “Weighted average method,” https://www.accountingtools.com/articles/2017/5/13/weighted-average-method-weighted average-costing, January 15, 2021.
18 Other factory costs usually contain a large component of fixed costs. The unit value of other factory costs usually increases when sales volume falls because the pool of costs is spread over a smaller base. This is reflected in the data of ***; ***. Email from ***, July 24, 2020.

VI-19
in net sales quantities in interim 2020. On average per short ton basis, direct labor increased from $*** per short ton in 2017 to $*** per short ton in 2018 and declined to $*** per short ton in 2019. Direct labor costs per short ton value was at its lowest in interim 2020 at $*** per short ton compared to $*** per short ton in interim 2019. As a ratio to net sales, direct labor costs decreased continuously between 2017 (*** percent) and 2019 (*** percent) and were higher in interim 2020 at *** percent than in interim 2019 at *** percent.19 20
Changes in conversion costs (direct labor and other factory costs) may also be compared with sales on an AUV basis: the difference between the AUV per short ton of sales and that of conversion costs increased from $*** in 2017 to $*** in 2018, but fell to $*** in 2019; the difference was $*** in interim 2019 and $*** in interim 2020.
Overall total COGS increased to its highest level in 2018 ($***), was lower in 2019 ($***) than in 2018 but overall higher than 2017 ($***). It was also lower in interim 2020 at $*** than in interim 2019 $***, primarily due to the decrease in raw material and direct labor costs, despite an increase in net sales quantities. On an average per short ton basis, COGS increased from $*** per short ton in 2017 to $*** per short ton in 2019, and was lower in interim 2020 at $*** per short ton than in interim 2019 at $*** per short ton. As a ratio to net sales, COGS decreased from *** percent in 2017 to *** percent in 2018, before increasing to its highest level of *** percent in 2019 and was higher in interim 2020 at *** percent than in interim 2019 at *** percent.
The U.S. industry’s total gross profit increased to its highest level of $*** in 2018 before falling into a loss of $*** in 2019. In interim 2019 the gross losses were lower at $*** than in interim 2020 at $***. 21 On a company-specific basis, U.S. producers varied in terms of their gross profit results (table VI-3): some reported positive gross profit throughout the period, others reported intermittent gross profit and losses, and several reported gross losses for all or most of the period. The majority of U.S producers reported gross profits in 2017, and *** reported gross profits in 2018 except ***. A large number of losses were reported in 2019 and both interim periods.
19 ***. U.S. producer’s questionnaire, II-11. 20 See earlier explanation regarding ***. 21 *** reported the highest amount of losses in 2019, influencing the overall industry’s results. It
attributed its gross losses to ***. Email from ***, January 15, 2020.

VI-20
SG&A expenses and operating income or loss
As seen in table VI-1, the industry’s selling, general, and administrative (“SG&A”) expenses increased to their highest level in 2018 ($***), declined in 2019 ($***) and were higher in interim 2020 at $*** than in interim 2019 at $***, reflecting the pattern of net sales quantities. The corresponding SG&A expense ratio (total SG&A expenses divided by total sales value) declined continuously from 2017 (*** percent) to 2019 (*** percent) and was higher in interim 2020 at *** percent than in interim 2019 at *** percent. On a company-specific basis, *** accounted for the largest increase in SG&A expense in 2018 (*** percent).22 23
The U.S. producers’ operating losses increased irregularly from a loss in 2017 of $*** to a profit in 2018 of $*** to a loss in 2019 of $***. Operating losses were also higher in interim 2020 at $***, than in interim 2019, at $***. As a ratio to net sales, operating losses also increased between 2017 (3.5 percent) and 2019 (8.0 percent) and were higher in interim 2020 at 8.5 percent than in interim 2019 at 7.6 percent. On a company-specific basis, *** U.S. producer reported operating income throughout the entire period. In addition to sales volume, the majority of U.S. producers attributed their losses to sales values that did not recover increase in raw material costs.
All other expenses and net income or loss
The U.S producers’ total interest expense increased continuously between 2017 ($***) and 2019 ($***, than in interim 2019, at $***. The majority of interest expenses were reported by ***. All other expenses decreased between 2017 ($***) and 2018 ($***), then increased to $*** in 2019. All other expenses were lower in interim 2020 at $*** than in interim 2019 at $***. *** and *** accounted for the majority of reported other expenses. Other income rose from $*** in 2017 to $*** in 2019 and was higher in interim 2020 ($***) than in interim 2019 ($***). *** accounted for most of reported other income, with additional amounts reported by ***.
22 ***. Email from ***, January 19, 2021. 23 ***. Email for from ***, March 2, 2021.
VI-21
Given the changes in operating income described earlier and the net of other income and expenses, the U.S. industry reported increasing net losses from 2017 ($***) to 2019 ($***), and net losses were higher in interim 2020 at $***, than in interim 2019 at $***, with a single positive net income in 2018 ($***). The majority of U.S. producers reported net losses throughout the period for which data were collected. Five out of the eleven firms reported net income in 2018, with *** and *** reporting the largest positive incomes of $*** and $*** in that year, respectively. Cash flow followed the same trends as net income but was lower in interim 2020 than interim 2019. Depreciation charges fluctuated within the same range between 2017 and 2019 and were higher in interim 2020 than in interim 2019.
Variance analysis
A variance analysis is not being presented. A variance analysis relies on the consistency of data for product mix and costs. In these investigations, *** could not provide data for 2017: ***. The other firm, ***. Additionally, ***.
Capital expenditures and research and development expenses
Table VI-5 presents capital expenditures and research and development (“R&D”) expenses by firm. ***. Table VI-6 presents the firms’ narrative responses on the nature and focus of their capital expenditures.
The U.S. producers’ capital expenditures increased by *** percent between 2017 ($***) and 2018 ($***) before declining by *** percent between 2018 and 2019 ($***), and were lower by *** percent in interim 2020 at $*** than in interim 2019 at $***, *** accounted for the majority of the increase in 2018.

VI-22
Table VI-5 Standard wire mesh: Capital expenditures and R&D expenses of U.S. producers, 2017-19, January-September 2019, and January-September 2020
Item
Calendar year January to September 2017 2018 2019 2019 2020
Capital expenditures (1,000 dollars) Davis *** *** *** *** *** Insteel *** *** *** *** *** Keysteel *** *** *** *** *** Liberty *** *** *** *** *** Mid-South *** *** *** *** *** National *** *** *** *** *** Nucor *** *** *** *** *** Oklahoma *** *** *** *** *** Peninsula *** *** *** *** *** Tree Island *** *** *** *** *** WMC *** *** *** *** ***
Total *** *** *** *** *** Research and development expenses (1,000 dollars)
Research and development *** *** *** *** *** ***
Note.-- *** represents that no data was reported. Source: Compiled from data submitted in response to Commission questionnaires. Table VI-6 Standard wire mesh: Narrative descriptions of U.S. producers' capital expenditures, since January 1, 2017
Firm Narrative Davis *** Insteel *** Keysteel *** Liberty ***. Mid-South *** National *** Nucor *** Oklahoma *** Peninsula *** Tree Island ***. WMC ***
Source: Compiled from data submitted in response to Commission questionnaires.

VI-23
Assets and return on assets
Table VI-7 presents data on the U.S. producers’ total assets and their return on assets (“ROA”).24 The industry’s total net assets increased between 2017 and 2018 before declining in 2019, but increased overall from 2017 to 2019. The overall industry and the majority of U.S. producers reported a negative return on assets in 2017 and 2019. In 2018, the industry had a positive ROA of *** percent. Five of out of eleven firms had a positive ROA in 2018, with *** accounting for the majority of this increase.
24 The return on assets (“ROA”) is calculated as operating income divided by total assets. With respect to a firm’s overall operations, the total asset value reflects an aggregation of a number of assets which are generally not product specific. Thus, high-level allocations are generally required in order to report a total asset value for the subject product.

VI-24
Table VI-7 Standard wire mesh: U.S. producers’ total assets and return on assets, 2017-19
Firm Calendar years
2017 2018 2019 Total net assets (1,000 dollars)
*** *** *** *** *** *** *** *** *** *** *** *** *** *** *** *** *** *** *** *** *** *** *** *** *** *** *** *** *** *** *** *** *** *** *** *** *** *** *** *** Total net assets (1,000 dollars) *** *** ***
Operating return on assets (percent) *** *** *** *** *** *** *** *** *** *** *** *** *** *** *** *** *** *** *** *** *** *** *** *** *** *** *** *** *** *** *** *** *** *** *** *** *** *** *** *** Operating return on asset (percent) *** *** ***
Note: ROA was calculated for those firms providing both numerator and denominator data. ***. Source: Compiled from data submitted in response to Commission questionnaires.

VI-25
Capital and investment
The Commission requested U.S. producers of standard wire mesh to describe any actual or potential negative effects of imports of standard wire mesh from Mexico on their firms’ growth, investment, ability to raise capital, development and production efforts, or the scale of capital investments. Table VI-8 presents the number of firms reporting an impact in each category and table VI-9 provides the U.S. producers’ narrative responses. Table VI-8 Standard wire mesh: Actual and anticipated negative effects of imports on investment, growth, and development, since January 1, 2017
Item No Yes Negative effects on investment 2 9
Cancellation, postponement, or rejection of expansion projects
3 Denial or rejection of investment proposal 0 Reduction in the size of capital investments 1 Return on specific investments negatively
impacted 5 Other 5
Negative effects on growth and development 2 9 Rejection of bank loans
0 Lowering of credit rating 0 Problem related to the issue of stocks or bonds 0 Ability to service debt 2 Other 8
Anticipated negative effects of imports 2 9 Note.--***. Source: Compiled from data submitted in response to Commission questionnaires.

VI-26
Table VI-9 Standard wire mesh: Narratives relating to actual and anticipated negative effects of imports on investment, growth, and development, since January 1, 2017
Table continued on next page.
Item / Firm Narrative Cancellation, postponement, or rejection of expansion projects: *** *** *** *** *** *** Reduction in the size of capital investments: *** *** Return on specific investments negatively impacted: *** *** *** *** *** *** *** *** *** *** Other negative effects on investments: *** *** *** *** *** *** *** *** *** *** Ability to service debt: *** *** *** ***

VI-27
Table VI-9--Continued Standard wire mesh: Narratives relating to actual and anticipated negative effects of imports on Investment, growth, and development, since January 1, 2017
Source: Compiled from data submitted in response to Commission questionnaires.
Other effects on growth and development: *** *** *** *** *** *** *** *** *** *** *** *** *** *** *** *** Anticipated effects of imports: *** *** *** *** *** *** *** *** *** *** *** *** *** *** *** *** *** ***


VII-1
Part VII: Threat considerations and information on nonsubject countries
Section 771(7)(F)(i) of the Act (19 U.S.C. § 1677(7)(F)(i)) provides that—
In determining whether an industry in the United States is threatened with material injury by reason of imports (or sales for importation) of the subject merchandise, the Commission shall consider, among other relevant economic factors1--
(I) if a countervailable subsidy is involved, such information as may be presented to it by the administering authority as to the nature of the subsidy (particularly as to whether the countervailable subsidy is a subsidy described in Article 3 or 6.1 of the Subsidies Agreement), and whether imports of the subject merchandise are likely to increase,
(II) any existing unused production capacity or imminent, substantial increase in production capacity in the exporting country indicating the likelihood of substantially increased imports of the subject merchandise into the United States, taking into account the availability of other export markets to absorb any additional exports,
(III) a significant rate of increase of the volume or market penetration of imports of the subject merchandise indicating the likelihood of substantially increased imports,
(IV) whether imports of the subject merchandise are entering at prices that are likely to have a significant depressing or suppressing effect on domestic prices, and are likely to increase demand for further imports,
(V) inventories of the subject merchandise,
1 Section 771(7)(F)(ii) of the Act (19 U.S.C. § 1677(7)(F)(ii)) provides that “The Commission shall consider {these factors} . . . as a whole in making a determination of whether further dumped or subsidized imports are imminent and whether material injury by reason of imports would occur unless an order is issued or a suspension agreement is accepted under this title. The presence or absence of any factor which the Commission is required to consider . . . shall not necessarily give decisive guidance with respect to the determination. Such a determination may not be made on the basis of mere conjecture or supposition.”

VII-2
(VI) the potential for product-shifting if production facilities in the foreign country, which can be used to produce the subject merchandise, are currently being used to produce other products,
(VII) in any investigation under this title which involves imports of both a raw agricultural product (within the meaning of paragraph (4)(E)(iv)) and any product processed from such raw agricultural product, the likelihood that there will be increased imports, by reason of product shifting, if there is an affirmative determination by the Commission under section 705(b)(1) or 735(b)(1) with respect to either the raw agricultural product or the processed agricultural product (but not both),
(VIII) the actual and potential negative effects on the existing development and production efforts of the domestic industry, including efforts to develop a derivative or more advanced version of the domestic like product, and
(IX) any other demonstrable adverse trends that indicate the probability that there is likely to be material injury by reason of imports (or sale for importation) of the subject merchandise (whether or not it is actually being imported at the time).2
Information on the nature of the subsidies was presented earlier in this report;
information on the volume and pricing of imports of the subject merchandise is presented in
Parts IV and V; and information on the effects of imports of the subject merchandise on U.S. producers’ existing development and production efforts is presented in Part VI. Information on
inventories of the subject merchandise; foreign producers’ operations, including the potential for “product-shifting;” any other threat indicators, if applicable; and any dumping in third-
country markets, follows. Also presented in this section of the report is information obtained for consideration by the Commission on nonsubject countries.
2 Section 771(7)(F)(iii) of the Act (19 U.S.C. § 1677(7)(F)(iii)) further provides that, in antidumping investigations, “. . . the Commission shall consider whether dumping in the markets of foreign countries (as evidenced by dumping findings or antidumping remedies in other WTO member markets against the same class or kind of merchandise manufactured or exported by the same party as under investigation) suggests a threat of material injury to the domestic industry.”

VII‐3
The industry in Mexico
The Commission issued foreign producers’ or exporters’ questionnaires to 11 firms believed to produce and/or export standard wire mesh from Mexico.3 Usable responses to the Commission’s questionnaire were received from four firms: Aceromex SA de CV (“Aceromex”), Aceros Turia S.A. de C.V. (“Turia”), Aceros y Laminados Leal SA de CV (“Laminados Leal”), and Deacero S.A.P.I. de C.V. (“Deacero”).4 These firms’ exports to the United States were equivalent to virtually all reported U.S. imports of standard wire mesh from Mexico in 2019. According to estimates requested of the responding Mexican producers, the production of standard wire mesh in Mexico reported in questionnaires accounts for approximately one‐half of overall production of standard wire mesh in Mexico during 2019. Table VII‐1 presents information on the standard wire mesh operations of the responding producers and exporters in Mexico.
Table VII-1 Standard wire mesh: Summary data for producers in Mexico, 2019
Firm
Production (short tons)
Share of reported
production (percent)
Exports to the United States (short tons)
Share of reported exports to the United States
(percent)
Total shipments
(short tons)
Share of firm's total shipments exported
to the United States
(percent) Aceromex *** *** *** *** *** *** Deacero *** *** *** *** *** *** Laminados Leal *** *** *** *** *** *** Turia *** *** *** *** *** ***
All firms *** 100.0 *** 100.0 *** *** Source: Compiled from data submitted in response to Commission questionnaires.
3 These firms were identified through a review of information submitted in the petition and contained in *** records.
4 The Commission also received a response from ***, certifying that it had not produced or exported standard wire mesh from Mexico since January 1, 2017. The Commission did not receive a response from Grupo Villacero / Lamina y Placa S.A. de C.V., estimated to account for less than *** percent of exports of standard wire mesh from Mexico to the United States during January 2017 – September 2020.

VII-4
Changes in operations
As presented in table VII-2, producers in Mexico reported several operational and
organizational changes since January 1, 2017.
Table VII-2 Standard wire mesh: Reported changes in operations by producers in Mexico, since January 1, 2017
Item / Firm Reported changed in operations Plant openings: *** *** *** *** Plant closings: *** *** Relocations: *** *** Expansions: *** ***
Source: Compiled from data submitted in response to Commission questionnaires.
Operations on standard wire mesh
Table VII-3 presents information on the standard wire mesh operations of the
responding firms in Mexico. *** capacity *** from 2017 to 2019. During that same period, ***
capacity increased by *** percent, while *** reported capacity decreased by *** percent.5 Projections indicate that overall standard wire mesh capacity is expected to decrease by ***
percent from 2019 to 2020, but then increase by *** percent from 2020 to 2021, ultimately ending below 2019 levels.
5 ***. *** foreign producer questionnaire response, section II-8; and email from ***, January 14, 2021.

VII-5
Table VII-3 Standard wire mesh: Data on industry in Mexico, 2017-19, January-September 2019, January-September 2020, and projection calendar years 2020 and 2021
Item
Actual experience Projections
Calendar year January to September Calendar year
2017 2018 2019 2019 2020 2020 2021
Quantity (short tons)
Capacity *** *** *** *** *** *** ***
Production *** *** *** *** *** *** *** End-of-period inventories *** *** *** *** *** *** *** Shipments: Home market shipments: Internal consumption/ transfers *** *** *** *** *** *** ***
Commercial home market shipments *** *** *** *** *** *** ***
Total home market shipments *** *** *** *** *** *** ***
Export shipments to:
United States *** *** *** *** *** *** ***
All other markets *** *** *** *** *** *** ***
Total exports *** *** *** *** *** *** *** Total shipments *** *** *** *** *** *** ***
Ratios and shares (percent)
Capacity utilization *** *** *** *** *** *** ***
Inventories/production *** *** *** *** *** *** *** Inventories/total shipments *** *** *** *** *** *** *** Share of shipments: Home market shipments: Internal consumption/ transfers *** *** *** *** *** *** ***
Commercial home market shipments *** *** *** *** *** *** ***
Total home market shipments *** *** *** *** *** *** ***
Export shipments to:
United States *** *** *** *** *** *** ***
All other markets *** *** *** *** *** *** ***
Total exports *** *** *** *** *** *** *** Total shipments 100.0 100.0 100.0 100.0 100.0 100.0 100.0
Note: Shares and ratios shown as "0.0" represent values greater than zero, but less than "0.05" percent. Source: Compiled from data submitted in response to Commission questionnaires.

VII-6
Mexican producers’ standard wire mesh production decreased by *** percent from
2017 to 2018, but then increased by *** percent from 2018 to 2019, decreasing overall by *** percent during 2017-19. *** reported more production in 2019 than in 2017, while ***
reported less production. Standard wire mesh production was *** percent higher in interim 2020 than in interim 2019. It is projected to increase by *** percent from 2019 to 2020, but
then decrease by *** percent from 2020 to 2021, ultimately ending above 2019 levels.
Capacity utilization increased from *** percent in 2017 to *** percent in 2018 and then further increased to *** percent in 2019. Projections indicate that it is expected to fluctuate
but increase during 2020 and 2021, ending above 2019 levels. Mexican producers’ capacity utilization was *** percentage points higher in interim 2020 than in interim 2019.
Mexican producers’ commercial home market shipments of standard wire mesh fluctuated and decreased overall by *** percent during 2017-196 but were *** percent higher
in interim 2020 compared with interim 2019. Commercial home market shipments are
projected to decrease by *** percent from 2019 to 2020 and then increase by *** percent from 2020 to 2021.
Export shipments to the United States increased by *** percent from 2017 to 2018, but then decreased by *** percent from 2018 to 2019, ending *** percent higher in 2019 than in
2017. They were *** percent higher in interim 2020 than in interim 2019. Overall increases in
export shipments to the United States largely reflected growing exports by ***. Between 2017 and 2019, *** increased its exports of standard wire mesh to the United States by *** percent.
Projections indicate that Mexican producers’ export shipments to the United States are expected to increase by *** percent from 2019 to 2020, but then decrease by *** percent from
2020 to 2021.7 Deacero reported that it is currently making arrangements to move all of its U.S.
standard wire mesh market production to
6 Following the entry into effect of U.S. Section 232 national security import tariffs on steel products, the Government of Mexico implemented retaliatory duties on imports of certain products from the United States, including flat-rolled and tubular steel mill products. However, these duties did not apply to standard wire mesh or to its principal input, wire rod. Government of Mexico, Ministry of Economy, “Mexico Will Impose Equivalent Measures on Various Products in the face of US Protectionist Measures in Steel and Aluminum,” https://www.gob.mx/se/articulos/mexico-impondra-medidas-equivalentes-a-diversos-productos-ante-las-medidas-proteccionistas-de-ee-uu-en-acero-y-aluminio-158765?idiom=es, retrieved March 4, 2021.
7 The overall projected decrease in Mexican producers’ exports of standard wire mesh to the United States is driven by ***. *** projects that its exports to the United States will increase *** before decreasing ***. *** foreign producer questionnaire response, section II-8.

VII-7
***, with production to start in the second quarter of 2021 and its facilities fully established by
2022.8 ***, the only responding Mexican producer that reported exports of standard wire mesh to other markets during the period for which data were collected, identified these markets as
***.9
Alternative products
As shown in table VII-4, responding Mexican firms produced other products on the same equipment and machinery used to produce standard wire mesh. On the same equipment and
machinery used to produce standard wire mesh, ***.10
8 Respondents’ prehearing brief, pp. 25-26. Deacero contends it is committed to serving the U.S. market entirely from U.S. production and reports that it has ***. Ibid.
Deacero further contends it is committed to U.S. production as demonstrated by its previous investments in the United States. In 2006, Deacero purchased Stay-Tuff Fence Manufacturing, the largest U.S. producer of fixed knot fencing, based in New Braunfels, Texas. In 2007, Deacero purchased two U.S. wire rope facilities, which are operated by Deacero USA in Houston, Texas. In 2012, Deacero acquired Mid Continent Steel & Wire, the largest U.S. nail producer, based in Poplar Bluff, Missouri. Hearing transcript, p. 127 (Guerra).
9 *** foreign producer questionnaire response, section II-8. Exports to markets other than the United States accounted for *** percent of Mexican producers’ total shipments in each year during 2017-19.
10 *** foreign producer questionnaire response, section II-3a.

VII-8
Table VII-4 Standard wire mesh: Overall capacity and production on the same equipment as in-scope production by producers in Mexico, 2017-19, January-September 2019, and January-September 2020
Item Calendar year January to September
2017 2018 2019 2019 2020 Quantity (short tons) Overall capacity *** *** *** *** ***
Production: Standard wire mesh *** *** *** *** ***
Out of scope production: Engineered wire mesh *** *** *** *** ***
Other products *** *** *** *** *** Out-of-scope production *** *** *** *** ***
Total production on same machinery *** *** *** *** ***
Ratios and shares (percent) Overall capacity utilization *** *** *** *** ***
Share of production: Standard wire mesh *** *** *** *** ***
Share of out of scope production: Engineered wire mesh *** *** *** *** ***
Other products *** *** *** *** *** Out-of-scope production *** *** *** *** ***
Total production on same machinery 100.0 100.0 100.0 100.0 100.0
Source: Compiled from data submitted in response to Commission questionnaires.
Mexican producers’ overall capacity increased by *** percent during 2017-19 and was *** percent lower in interim 2020 than in interim 2019. *** of four responding Mexican
producers (***) reported producing engineered wire mesh on the same equipment and
machinery used to produce standard wire mesh.11 During 2017-19, standard wire mesh accounted for *** percent of total production, while engineered wire mesh accounted for ***
percent. During interim 2019 and interim 2020, standard wire mesh accounted for *** percent of total production, while engineered wire mesh accounted for *** percent.
11 Firms were asked about factors that affect the ability to shift production capacity between standard wire mesh and engineered wire mesh and the degree to which these factors enhance or constrain such shifts. *** explained that it is constrained by customer commitments and the time required to switch machinery specifications. *** reported customer commitments and lengthy and costly modification processes for changing production lines from one product to another as constraints on its ability to shift production capacity between production lines. *** foreign producer questionnaire response, section II-4.

VII-9
Exports
According to GTA, the leading export market for grill, netting and fencing of iron or steel
wire, welded at the intersection, and not galvanized or coated (including standard wire mesh)
from Mexico is the United States (table VII-5). Exports to the United States accounted for 99.6 percent of Mexico’s total exports of those products, by quantity, in 2019. In comparison,
Mexico’s next largest export markets, Belize and Colombia, accounted for 0.2 percent and 0.1 percent, respectively, of those exports in 2019. Table VII-5 Grill, netting and fencing of iron or steel wire, welded at the intersection, and not galvanized or coated: Exports from Mexico by destination market, 2017-19
Destination market Calendar year
2017 2018 2019 Quantity (short tons) United States 27,745 40,141 34,615 Belize 624 267 67 Colombia 176 243 52 Guatemala 36 143 16 Antigua & Barbuda --- 12 --- Canada 13 11 --- Chile 293 103 --- Costa Rica 136 33 --- Dominican Republic 0 --- --- All other destination markets 563 852 ---
All destination markets 29,586 41,805 34,750 Value (1,000 dollars) United States 18,916 34,639 36,879 Belize 365 220 56 Colombia 342 499 74 Guatemala 88 254 31 Antigua & Barbuda --- 14 --- Canada 21 4 --- Chile 704 253 --- Costa Rica 278 51 --- Dominican Republic 1 --- --- All other destination markets 996 1,343 ---
All destination markets 21,711 37,279 37,040 Table continued on next page.

VII-10
Table VII-5—Continued Grill, netting and fencing of iron or steel wire, welded at the intersection, and not galvanized or coated: Exports from Mexico by destination market, 2017-19
Destination market Calendar year
2017 2018 2019 Unit value (dollars per short ton) United States 682 863 1,065 Belize 585 823 846 Colombia 1,944 2,053 1,434 Guatemala 2,472 1,778 1,887 Antigua & Barbuda --- 1,184 --- Canada 1,590 403 --- Chile 2,402 2,464 --- Costa Rica 2,042 1,562 --- Dominican Republic 27,266 --- --- All other destination markets 1,770 1,576 ---
All destination markets 734 892 1,066 Share of quantity (percent) United States 93.8 96.0 99.6
Belize 2.1 0.6 0.2
Colombia 0.6 0.6 0.1 Guatemala 0.1 0.3 0.0
Antigua & Barbuda --- 0.0 --- Canada 0.0 0.0 ---
Chile 1.0 0.2 ---
Costa Rica 0.5 0.1 --- Dominican Republic 0.0 --- ---
All other destination markets 1.9 2.0 --- All destination markets 100.0 100.0 100.0
Note: Shares and ratios shown as "0.0" represent values greater than zero, but less than "0.05" percent. United States is shown at the top, all remaining top export destinations shown in descending order of 2019 data. Source: Official exports statistics under HS subheading 7314.20 and 7314.39 as reported by the Government of Mexico's National Institute of Statistics and Geography (INEGI) in the Global Trade Atlas database, accessed January 6, 2021.

VII-11
U.S. inventories of imported merchandise
Table VII-6 presents data on U.S. importers’ reported inventories of standard wire mesh. *** responding U.S. importers reported inventories of imports from nonsubject sources, while
*** responding U.S. importers (***) reported inventories of imports from Mexico. U.S.
importers’ inventories of imports from Mexico fluctuated but increased by *** percent during 2017-19 and were *** percent greater during interim 2020 compared to interim 2019. The
observed growth in inventories was largely driven by U.S. importer ***, whose reported inventories of standard wire mesh increased by *** percent during 2017-19 and were ***
percent higher during interim 2020 than in interim 2019. The ratio of inventories of imports from Mexico to total shipments of imports increased by *** percentage points from 2017 to
2019 and was *** percentage points higher in interim 2020 than in interim 2019.
Table VII-6 Standard wire mesh: U.S. importers’ inventories, 2017-19, January-September 2019, and January-September 2020
Item Calendar year January to September
2017 2018 2019 2019 2020 Inventories (short tons); Ratios (percent)
Imports from Mexico Inventories *** *** *** *** *** Ratio to U.S. imports *** *** *** *** *** Ratio to U.S. shipments of imports *** *** *** *** ***
Ratio to total shipments of imports *** *** *** *** ***
Imports from nonsubject sources: Inventories *** *** *** *** *** Ratio to U.S. imports *** *** *** *** *** Ratio to U.S. shipments of imports *** *** *** *** ***
Ratio to total shipments of imports *** *** *** *** ***
Imports from all import sources: Inventories *** *** *** *** *** Ratio to U.S. imports *** *** *** *** *** Ratio to U.S. shipments of imports *** *** *** *** ***
Ratio to total shipments of imports *** *** *** *** *** Source: Compiled from data submitted in response to Commission questionnaires.

VII-12
U.S. importers’ outstanding orders
The Commission requested importers to indicate whether they imported or arranged for the importation of standard wire mesh from Mexico after September 30, 2020. *** responding
U.S. importers indicated they had arranged subject imports. These data are presented in table
VII-7. Table VII-7 Standard wire mesh: Arranged imports, October 2020 through September 2021
Item Period
Oct-Dec 2020 Jan-Mar 2021 Apr-Jun 2021 Jul-Sept 2021 Total Quantity (short tons)
Arranged U.S. imports from.-- Mexico *** *** *** *** ***
All other sources *** *** *** *** *** All import sources *** *** *** *** ***
Source: Compiled from data submitted in response to Commission questionnaires.
Antidumping or countervailing duty orders in third-country markets
According to both petitioners12 and respondents13 in the preliminary phase of these
investigations, standard wire mesh originating in Mexico is not currently subject to any antidumping or countervailing duty investigations or orders or safeguard investigations or
orders in third-country markets.14
Information on nonsubject countries
Although information about the global standard wire mesh industry is not readily
available, especially not country-specific production statistics,15 both petitioners and
respondents attempted to identify the largest nonsubject producing countries. According to the petitioners, standard wire mesh is produced in most countries where steel wire rod (the
principal input) is readily available and construction projects generate demand for standard
12 Petitioners’ postconference brief, exh. 1, p. 35. 13 Respondents’ postconference brief, exh. 1, p. 10. 14 In the final phase of these investigations, none of the petitioners, respondents, or questionnaire
recipients provided, nor did Commission staff find any further information about import-injury orders in third-country markets on wire mesh originating in Mexico. Rather, respondents argued that Mexican producers are not affected by “negative trends” in third-country export markets because prohibitive freight costs already limit their access to those markets. Respondents’ posthearing brief, pp. 2, 11, and 13-14.
15 Petitioners’ postconference brief, exh. 1, p. 35.

VII-13
wire mesh.16 According to respondents, standard wire mesh is more common than rebar for
reinforcing concrete in Deacero’s Latin American and European markets, and those regions have considerable standard wire mesh production. However, respondents claimed to have no
knowledge of standard wire mesh use or production in the Asian market due to Deacero’s lack of sales in that region.17
One firm reported importing standard wire mesh from nonsubject sources during the
period for which data were collected. *** reported importing nonsubject standard wire mesh in *** from *** located in ***.18
Table VII-8 presents data on global exports of grill, netting and fencing of iron or steel wire, welded at the intersection, and not galvanized or coated (including standard wire mesh)
during 2017-19. The Netherlands (17.9 percent of the total), Italy (16.5 percent), and Germany (15.0 percent) were the largest exporters (in terms of quantity) in 2019, and together
accounted for 49.4 percent of all global exports of these products that year.
16 Petitioners’ post conference brief, exh. 1, p. 35; and exh. 17, pp. IV-50 – IV-51. 17 Respondents’ postconference brief, exh. 1, pp. 10-11. 18 *** final phase importer questionnaire response, sections II-4 and II-6a. ***. ***.

VII-14
Table VII-8 Grill, netting and fencing of iron or steel wire, welded at the intersection, and not galvanized or coated: Global exports by supplying countries, 2017-19
Exporter Calendar year
2017 2018 2019 Quantity (short tons) United States 16,462 16,165 16,307 Mexico 29,586 41,805 34,750 Netherlands 542,166 570,703 547,924 Italy 490,243 504,779 503,745 Germany 497,046 494,576 457,884 Spain 184,054 225,699 203,219 Portugal 116,971 129,484 156,979 Bosnia & Herzegovina 105,825 110,108 142,404 Belgium 127,065 141,680 140,252 China 127,992 129,994 139,521 Czech Republic 150,468 152,974 130,956 Poland 92,977 93,972 113,741 All other exporters 482,744 500,468 467,509
All reporting exporters 2,963,597 3,112,407 3,055,189 Value (1,000 dollars) United States 24,815 25,220 26,266 Mexico 21,711 37,279 37,040 Netherlands 265,769 293,925 265,968 Italy 279,655 339,703 299,612 Germany 328,120 378,097 321,220 Spain 125,266 170,751 145,734 Portugal 69,996 85,080 94,564 Bosnia & Herzegovina 55,581 68,775 79,318 Belgium 119,965 138,724 132,012 China 134,740 158,241 167,948 Czech Republic 82,677 100,424 77,115 Poland 80,432 90,435 90,921 All other exporters 414,210 492,648 432,475
All reporting exporters 2,002,937 2,379,301 2,170,193 Table continued on next page.

VII-15
Table VII-8—Continued Grill, netting and fencing of iron or steel wire, welded at the intersection, and not galvanized or coated: Global exports by supplying countries, 2017-19
Exporter Calendar year
2017 2018 2019 Unit value (dollars per short ton) United States 1,507 1,560 1,611 Mexico 734 892 1,066 Netherlands 490 515 485 Italy 570 673 595 Germany 660 764 702 Spain 681 757 717 Portugal 598 657 602 Bosnia & Herzegovina 525 625 557 Belgium 944 979 941 China 1,053 1,217 1,204 Czech Republic 549 656 589 Poland 865 962 799 All other exporters 858 984 925
All reporting exporters 676 764 710 Share of quantity (percent) United States 3.4 0.5 0.5 Mexico 1.0 1.3 1.1 Netherlands 18.3 18.3 17.9 Italy 16.5 16.2 16.5 Germany 16.8 15.9 15.0 Spain 6.2 7.3 6.7 Portugal 3.9 4.2 5.1 Bosnia & Herzegovina 3.6 3.5 4.7 Belgium 4.3 4.6 4.6 China 4.3 4.2 4.6 Czech Republic 5.1 4.9 4.3 Poland 3.1 3.0 3.7 All other exporters 16.3 16.1 15.3
All reporting exporters 100.0 100.0 100.0 Note: Data reported under HS subheadings 7314.20 and 7314.39 include some merchandise outside of the scope of this investigation. Source: Official exports statistics under HS subheadings 7314.20 and 7314.39 reported by various national statistical authorities in the Global Trade Atlas database, accessed February 24, 2021.


A-1
APPENDIX A
FEDERAL REGISTER NOTICES


A-3
The Commission makes available notices relevant to its investigations and reviews on its website, www.usitc.gov. In addition, the following tabulation presents, in chronological order, Federal Register notices issued by the Commission and Commerce during the current proceeding.
Citation Title Link 85 FR 40681, July 7, 2020
Standard Steel Welded Wire Mesh From Mexico; Institution of Anti-Dumping and Countervailing Duty Investigations and Scheduling of Preliminary Phase Investigations
https://www.govinfo.gov/content/pkg/FR-2020-07-07/pdf/2020-14537.pdf
85 FR 45181, July 27, 2020
Standard Steel Welded Wire Mesh From Mexico: Initiation of Countervailing Duty Investigation
https://www.govinfo.gov/content/pkg/FR-2020-07-27/pdf/2020-16186.pdf
85 FR 45167, July 27, 2020
Standard Steel Welded Wire Mesh from Mexico: Initiation of Less-Than-Fair-Value Investigation
https://www.govinfo.gov/content/pkg/FR-2020-07-27/pdf/2020-16185.pdf
85 FR 51491, August 20, 2020
Standard Steel Welded Wire Mesh From Mexico
https://www.govinfo.gov/content/pkg/FR-2020-08-20/pdf/2020-18212.pdf
85 FR 78124, December 3, 2020
Standard Steel Welded Wire Mesh From Mexico: Preliminary Affirmative Countervailing Duty Determination
https://www.govinfo.gov/content/pkg/FR-2020-12-03/pdf/2020-26628.pdf
85 FR 81487, December 16, 2020
Standard Steel Welded Wire Mesh From Mexico; Scheduling of the Final Phase of Countervailing Duty and Anti- Dumping Duty Investigations
https://www.govinfo.gov/content/pkg/FR-2020-12-16/pdf/2020-27653.pdf
Table continued on next page.

A-4
Citation Title Link 86 FR 7710, February 1, 2021
Standard Steel Welded Wire Mesh From Mexico: Preliminary Affirmative Determination of Sales at Less Than Fair Value, Postponement of Final Determination, and, Extension of Provisional Measures
https://www.govinfo.gov/content/pkg/FR-2021-02-01/pdf/2021-02079.pdf
86 FR 10034, February 18, 2021
Standard Steel Welded Wire Mesh From Mexico: Final Affirmative Countervailing Duty Determination
https://www.govinfo.gov/content/pkg/FR-2021-02-18/pdf/2021-03263.pdf

B-1
APPENDIX B
LIST OF HEARING WITNESSES


B-3
CALENDAR OF PUBLIC HEARING
Those listed below appeared in the United States International Trade Commission’s hearing via videoconference:
Subject: Standard Steel Welded Wire Mesh from Mexico
Inv. Nos.: 701-TA-653 and 731-TA-1527 (Final)
Date and Time: February 12, 2021 - 9:30 a.m.
OPENING REMARKS:
Petitioners (Kathleen W. Cannon, Kelley Drye & Warren LLP) Respondents (Rosa S. Jeong, Greenberg Traurig, LLP)
EMBASSY APPEARANCE:
Embassy of Mexico Washington, DC
Gerardo Lameda, Minister, Head of the Trade Office
In Support of the Imposition of Antidumping and Countervailing Duty Orders:
Kelley Drye & Warren LLP Washington, DC on behalf of
Insteel Industries, Inc. Mid-South Wire Company National Wire LLC Oklahoma Steel & Wire Company Wire Mesh Corporation
Jordi Barrenechea, President, Wire Mesh Corporation
Perry Fisher, Sales Manager, National Wire LLC
H.O. Woltz III, President and Chief Executive Officer, Insteel Industries, Inc.
Richard Wagner, Sr. Vice President and Chief Operating Officer, Insteel Industries, Inc.
Frankie Hatley, National Sales Manager, Insteel Industries, Inc.
Brad Hudgens, Economist, Georgetown Economic Services LLC

B-4
In Support of the Imposition of Antidumping and Countervailing Duty Orders (continued):
Gina E. Beck, Economist, Georgetown Economic Services LLC
Kathleen W. Cannon ) Paul C. Rosenthal ) R. Alan Luberda ) – OF COUNSEL Brooke M. Ringel ) Joshua R. Morey )
In Opposition to the Imposition of Antidumping and Countervailing Duty Orders:
Greenberg Traurig, LLP Washington, DC on behalf of
Deacero S.A.P.I. de C.V. (“Deacero”) Deacero USA, Inc. (“Deacero USA”)
Irwin P. Altschuler, Senior Advisor, International Affairs, Deacero
Antonio Guerra, Director of Market Strategy, Deacero
Rafael Abascal, Marketing & Sales Operations Manager, Construction Products, Deacero USA
George Olmos, Regional Territory Sales Manager, Hutchison Western
Brian C. Becker, Ph.D., President, Precision Economics LLC
Rosa S. Jeong ) – OF COUNSEL
REBUTTAL/CLOSING REMARKS:
Petitioners (Kathleen W. Cannon and Paul C. Rosenthal, Kelley Drye & Warren LLP) Respondents (Rosa S. Jeong, Greenberg Traurig, LLP)
-END-

C-1
APPENDIX C
SUMMARY DATA

Table C-1: Standard wire mesh: Summary data concerning the total U.S. market .................... C-3
Table C-2: Standard wire mesh and engineered wire mesh: Summary data concerning the U.S. market with expanded domestic like product: market .............................................................. C-5

Table C-1Standard wire mesh: Summary data concerning the U.S. market, 2017-19, January to September 2019, and January to September 2020
Jan-Sep2017 2018 2019 2019 2020 2017-19 2017-18 2018-19 2019-20
U.S. consumption quantity:Amount................................................................ *** *** *** *** *** ▼*** ▼*** ▼*** ▲*** Producers' share (fn1)......................................... *** *** *** *** *** ▼*** ▼*** ▼*** ▲*** Importers' share (fn1):
Mexico............................................................ *** *** *** *** *** ▲*** ▲*** ▲*** ▼*** Nonsubject sources......................................... *** *** *** *** *** ▲*** *** ▲*** ▼***
All import sources....................................... *** *** *** *** *** ▲*** ▲*** ▲*** ▼***
U.S. consumption value:Amount................................................................ *** *** *** *** *** ▲*** ▲*** ▼*** ▼*** Producers' share (fn1)......................................... *** *** *** *** *** ▼*** ▼*** ▼*** ▲*** Importers' share (fn1):
Mexico............................................................ *** *** *** *** *** ▲*** ▲*** ▲*** ▼*** Nonsubject sources......................................... *** *** *** *** *** ▲*** *** ▲*** ▼***
All import sources....................................... *** *** *** *** *** ▲*** ▲*** ▲*** ▼***
U.S. importers' U.S. shipments from:Mexico:
Quantity.......................................................... *** *** *** *** *** ▲*** ▲*** ▼*** ▲*** Value.............................................................. *** *** *** *** *** ▲*** ▲*** ▼*** ▼*** Unit value........................................................ *** *** *** *** *** ▲*** ▲*** ▼*** ▼*** Ending inventory quantity................................ *** *** *** *** *** ▲*** ▲*** ▼*** ▲***
Nonsubject sources:Quantity.......................................................... *** *** *** *** *** ▲*** *** ▲*** ▼*** Value.............................................................. *** *** *** *** *** ▲*** *** ▲*** ▼*** Unit value........................................................ *** *** *** *** *** ▲*** *** ▲*** ▼*** Ending inventory quantity................................ *** *** *** *** *** *** *** *** ***
All import sources:Quantity.......................................................... *** *** *** *** *** ▲*** ▲*** ▼*** ▲*** Value.............................................................. *** *** *** *** *** ▲*** ▲*** ▼*** ▼*** Unit value........................................................ *** *** *** *** *** ▲*** ▲*** ▼*** ▼*** Ending inventory quantity................................ *** *** *** *** *** ▲*** ▲*** ▼*** ▲***
U.S. producers':Average capacity quantity................................... *** 736,593 788,843 591,619 581,317 ▲*** ▲*** ▲7.1 ▼(1.7)Production quantity.............................................. *** 318,263 302,928 229,487 241,898 ▼*** ▲*** ▼(4.8) ▲5.4Capacity utilization (fn1)...................................... *** 43.2 38.4 38.8 41.6 *** ▼*** ▼(4.8) ▲2.8U.S. shipments:
Quantity.......................................................... *** 309,147 296,954 227,761 261,131 ▼*** ▼*** ▼(3.9) ▲14.7Value.............................................................. *** 300,780 269,429 211,096 199,911 ▲*** ▲*** ▼(10.4) ▼(5.3)Unit value........................................................ *** $973 $907 $927 $766 ▲*** ▲*** ▼(6.7) ▼(17.4)
Export shipments:Quantity.......................................................... *** *** *** *** *** ▲*** ▼*** ▲*** ▼*** Value.............................................................. *** *** *** *** *** ▲*** ▼*** ▲*** ▼*** Unit value........................................................ *** *** *** *** *** ▲*** ▲*** ▼*** ▼***
Ending inventory quantity.................................... *** 46,316 50,660 46,689 30,441 ▲*** ▲*** ▲9.4 ▼(34.8)Inventories/total shipments (fn1).......................... *** *** *** *** *** ▲*** ▲*** ▲*** ▼*** Production workers.............................................. *** 542 515 517 507 ▼*** ▼*** ▼(5.0) ▼(1.9)Hours worked (1,000s)........................................ *** 1,257 1,224 944 904 ▼*** ▼*** ▼(2.6) ▼(4.2)Wages paid ($1,000)........................................... *** 31,463 28,804 22,352 22,267 ▼*** ▲*** ▼(8.5) ▼(0.4)Hourly wages (dollars per hour)........................... *** $25.03 $23.53 $23.68 $24.63 ▲*** ▲*** ▼(6.0) ▲4.0Productivity (short tons per 1,000 hours)............. *** 253 247 243 268 ▲*** ▲*** ▼(2.3) ▲10.1Unit labor costs................................................... *** $98.86 $95.09 $97.40 $92.05 ▲*** ▲*** ▼(3.8) ▼(5.5)
Table continued.
C-3
(Quantity=short tons; Value=1,000 dollars; Unit values, unit labor costs, and unit expenses=dollars per short ton; Period changes=percent--exceptions noted)
Reported data Period changesCalendar year January to September Comparison years
Standard wire mesh

Table C-1--ContinuedStandard wire mesh: Summary data concerning the U.S. market, 2017-19, January to September 2019, and January to September 2020
Jan-Sep2017 2018 2019 2019 2020 2017-19 2017-18 2018-19 2019-20
U.S. producers:--ContinuedNet sales:
Quantity.......................................................... *** *** *** *** *** ▲*** ▲*** ▼*** ▲*** Value.............................................................. *** *** *** *** *** ▲*** ▲*** ▼*** ▼*** Unit value........................................................ *** *** *** *** *** ▲*** ▲*** ▼*** ▼***
Cost of goods sold (COGS)................................. *** *** *** *** *** ▲*** ▲*** ▼*** ▼*** Gross profit or (loss) (fn2)................................... *** *** *** *** *** ▼*** ▲*** ▼*** ▼*** SG&A expenses.................................................. *** *** *** *** *** ▲*** ▲*** ▼*** ▲*** Operating income or (loss) (fn2).......................... *** *** *** *** *** ▼*** ▲*** ▼*** ▼*** Net income or (loss) (fn2).................................... *** *** *** *** *** ▼*** ▲*** ▼*** ▼*** Unit COGS.......................................................... *** *** *** *** *** ▲*** ▲*** ▲*** ▼*** Unit SG&A expenses........................................... *** *** *** *** *** ▲*** ▲*** ▼*** ▼*** Unit operating income or (loss) (fn2).................... $(27) $12 $(73) $(70) $(65) ▼--- ▲--- ▼--- ▲---Unit net income or (loss) (fn2)............................. $(33) $8 $(79) $(78) $(71) ▼--- ▲--- ▼--- ▲---COGS/sales (fn1)................................................ *** *** *** *** *** ▲*** ▼*** ▲*** ▲*** Operating income or (loss)/sales (fn1)................. (3.5) 1.3 (8.0) (7.6) (8.5) ▼(4.5) ▲4.7 ▼(9.3) ▼(0.9)Net income or (loss)/sales (fn1)........................... (4.3) 0.8 (8.7) (8.4) (9.2) ▼(4.4) ▲5.1 ▼(9.5) ▼(0.8)Capital expenditures............................................ *** *** *** *** *** ▼*** ▲*** ▼*** ▼*** Research and development expenses................. *** *** *** *** *** ▲*** ▲*** ▼*** ▼*** Net assets........................................................... *** *** *** *** *** ▲*** ▲*** ▼*** ***
fn1.--Reported data are in percent and period changes are in percentage points.
Source: Compiled from data submitted in response to Commission questionnaires.
Note.--Shares and ratios shown as “0.0” percent represent non-zero values less than “0.05” percent (if positive) and greater than “(0.05)” percent (if negative). Zeroes, null values, and undefined calculations are suppressed and shown as “---“. Period changes preceded by a “▲” represent an increase, while period changes preceded by a “▼” represent a decrease.
fn2.--Percent changes only calculated when both comparison values represent profits; The directional change in profitability provided when one or both comparison values represent a loss.
C-4
(Quantity=short tons; Value=1,000 dollars; Unit values, unit labor costs, and unit expenses=dollars per short ton; Period changes=percent--exceptions noted)
Reported data Period changesCalendar year January to September Comparison years

Table C-2
Jan-Sep2017 2018 2019 2019 2020 2017-19 2017-18 2018-19 2019-20
U.S. consumption quantity:Amount................................................................ *** *** *** *** *** ▼*** ▲*** ▼*** ▲*** Producers' share (fn1)......................................... *** *** *** *** *** ▼*** ▼*** ▼*** ▲*** Importers' share (fn1):
Mexico............................................................ *** *** *** *** *** ▲*** ▲*** ▼*** ▼*** Nonsubject sources......................................... *** *** *** *** *** ▲*** ▲*** ▲*** ▲***
All import sources....................................... *** *** *** *** *** ▲*** ▲*** ▲*** ▼***
U.S. consumption value:Amount................................................................ *** *** *** *** *** ▲*** ▲*** ▼*** ▲*** Producers' share (fn1)......................................... *** *** *** *** *** ▼*** ▼*** ▼*** ▲*** Importers' share (fn1):
Mexico............................................................ *** *** *** *** *** ▲*** ▲*** ▼*** ▼*** Nonsubject sources......................................... *** *** *** *** *** ▲*** ▲*** ▲*** ▼***
All import sources....................................... *** *** *** *** *** ▲*** ▲*** ▲*** ▼***
U.S. importers' U.S. shipments from:Mexico:
Quantity.......................................................... *** *** *** *** *** ▲*** ▲*** ▼*** ▲*** Value.............................................................. *** *** *** *** *** ▲*** ▲*** ▼*** ▼*** Unit value........................................................ *** *** *** *** *** ▲*** ▲*** ▼*** ▼*** Ending inventory quantity................................ *** *** *** *** *** ▲*** ▲*** ▼*** ▲***
Nonsubject sources:Quantity.......................................................... *** *** *** *** *** ▲*** ▲*** ▲*** ▲*** Value.............................................................. *** *** *** *** *** ▲*** ▲*** ▲*** ▼*** Unit value........................................................ *** *** *** *** *** ▲*** ▲*** ▲*** ▼*** Ending inventory quantity................................ *** *** *** *** *** ▼*** ▼*** ▼*** ▼***
All import sources:Quantity.......................................................... *** *** *** *** *** ▲*** ▲*** ▼*** ▲*** Value.............................................................. *** *** *** *** *** ▲*** ▲*** ▼*** ▼*** Unit value........................................................ *** *** *** *** *** ▲*** ▲*** ▼*** ▼*** Ending inventory quantity................................ *** *** *** *** *** ▲*** ▲*** ▼*** ▲***
U.S. producers':Average capacity quantity................................... *** *** *** *** *** ▲*** ▲*** ▲*** ▼*** Production quantity.............................................. *** 484,218 472,733 356,322 402,419 ▲*** ▲*** ▼(2.4) ▲12.9 Capacity utilization (fn1)...................................... *** *** *** *** *** ▼*** ▼*** ▼*** ▲*** U.S. shipments:
Quantity.......................................................... *** *** *** *** *** ▼*** ▲*** ▼*** ▲*** Value.............................................................. *** *** *** *** *** ▲*** ▲*** ▼*** ▲*** Unit value........................................................ *** *** *** *** *** ▲*** ▲*** ▼*** ▼***
Export shipments:Quantity.......................................................... *** *** *** *** *** ▲*** ▼*** ▲*** ▼*** Value.............................................................. *** *** *** *** *** ▲*** ▼*** ▲*** ▼*** Unit value........................................................ *** *** *** *** *** ▲*** ▲*** ▼*** ▼***
Ending inventory quantity.................................... *** *** *** *** *** ▲*** ▲*** ▲*** ▼*** Inventories/total shipments (fn1).......................... *** *** *** *** *** ▲*** ▲*** ▲*** ▼*** Production workers.............................................. *** 850 838 835 857 ▼*** ▲*** ▼(1.4) ▲2.6 Hours worked (1,000s)........................................ *** *** *** *** *** ▲*** ▲*** ▲*** ▲*** Wages paid ($1,000)........................................... *** *** *** *** *** ▲*** ▲*** ▲*** ▲*** Hourly wages (dollars per hour)........................... *** *** *** *** *** ▲*** ▲*** ▼*** ▲*** Productivity (short tons per 1,000 hours)............. *** *** *** *** *** ▼*** ▲*** ▼*** ▲*** Unit labor costs................................................... *** *** *** *** *** ▲*** ▲*** ▲*** ▼***
Table continued.
Reported data Period changesCalendar year January to September Comparison years
C-5
Standard wire mesh and engineered wire mesh: Summary data concerning the U.S. market, 2017-19, January to September 2019, and January to September 2020
(Quantity=short tons; Value=1,000 dollars; Unit values, unit labor costs, and unit expenses=dollars per short ton; Period changes=percent--exceptions noted)
Expanded domestic like product

Table C-2--Continued
Jan-Sep2017 2018 2019 2019 2020 2017-19 2017-18 2018-19 2019-20
U.S. producers:--Continued
Standard wire mesh (SWM):SWM: Net sales:
SWM: Quantity............................................... *** *** *** *** *** ▲*** ▲*** ▼*** ▲*** SWM: Value.................................................... *** *** *** *** *** ▲*** ▲*** ▼*** ▼*** SWM: Unit value............................................. *** *** *** *** *** ▲*** ▲*** ▼*** ▼***
SWM: Cost of goods sold (COGS)...................... *** *** *** *** *** ▲*** ▲*** ▼*** ▼*** SWM: Gross profit or (loss) (fn2)......................... *** *** *** *** *** ▼*** ▲*** ▼*** ▼*** SWM: SG&A expenses....................................... *** *** *** *** *** ▲*** ▲*** ▼*** ▲*** SWM: Operating income or (loss) (fn2)............... *** *** *** *** *** ▼*** ▲*** ▼*** ▼*** SWM: Net income or (loss) (fn2)......................... *** *** *** *** *** ▼*** ▲*** ▼*** ▼*** SWM: Unit COGS............................................... *** *** *** *** *** ▲*** ▲*** ▲*** ▼*** SWM: Unit SG&A expenses................................ *** *** *** *** *** ▲*** ▲*** ▼*** ▼*** SWM: Unit operating income or (loss) (fn2)......... *** *** *** *** *** ▼*** ▲*** ▼*** ▲*** SWM: Unit net income or (loss) (fn2)................... *** *** *** *** *** ▼*** ▲*** ▼*** ▲*** SWM: COGS/sales (fn1)..................................... *** *** *** *** *** ▲*** ▼*** ▲*** ▲*** SWM: Operating income (loss)/sales (fn1).......... *** *** *** *** *** ▼*** ▲*** ▼*** ▼*** SWM: Net income or (loss)/sales (fn1)................ *** *** *** *** *** ▼*** ▲*** ▼*** ▼*** SWM: Capital expenditures................................. *** *** *** *** *** ▼*** ▲*** ▼*** ▼*** SWM: Research & development expenses.......... *** *** *** *** *** ▲*** ▲*** ▼*** ▼*** SWM: Net assets................................................ *** *** *** *** *** ▲*** ▲*** ▼*** ***
Engineered wire mesh (EWM):EWM: Net sales:
EWM: Quantity............................................... *** *** *** *** *** ▲*** ▲*** ▼*** ▲*** EWM: Value.................................................... *** *** *** *** *** ▲*** ▲*** ▲*** ▲*** EWM: Unit value............................................. *** *** *** *** *** ▲*** ▲*** ▲*** ▼***
EWM: Cost of goods sold (COGS)...................... *** *** *** *** *** ▲*** ▲*** ▲*** ▲*** EWM: Gross profit or (loss) (fn2)......................... *** *** *** *** *** ▼*** ▲*** ▼*** ▲*** EWM: SG&A expenses....................................... *** *** *** *** *** ▲*** ▲*** ▼*** ▲*** EWM: Operating income or (loss) (fn2)............... *** *** *** *** *** ▼*** ▼*** ▼*** ▲*** EWM: Net income or (loss) (fn2)......................... *** *** *** *** *** ▼*** ▼*** ▼*** ▲*** EWM: Unit COGS............................................... *** *** *** *** *** ▲*** ▲*** ▲*** ▼*** EWM: Unit SG&A expenses................................ *** *** *** *** *** ▲*** ▲*** ▼*** ▲*** EWM: Unit operating income or (loss) (fn2)......... *** *** *** *** *** ▼*** ▼*** ▼*** ▲*** EWM: Unit net income or (loss) (fn2)................... *** *** *** *** *** ▼*** ▼*** ▼*** ▲*** EWM: COGS/sales (fn1)..................................... *** *** *** *** *** ▲*** ▲*** ▲*** ▼*** EWM: Operating income or (loss)/sales (fn1)...... *** *** *** *** *** ▼*** ▼*** ▼*** ▲*** EWM: Net income or (loss)/sales (fn1)................ *** *** *** *** *** ▼*** ▼*** ▼*** ▲*** EWM: Capital expenditures................................. *** *** *** *** *** ▲*** ▲*** ▼*** ▲*** EWM: Research & development expenses.......... *** *** *** *** *** *** *** *** *** EWM: Net assets................................................ *** *** *** *** *** ▲*** ▲*** ▲*** ***
Table continued.
C-6
Standard wire mesh and engineered wire mesh: Summary data concerning the U.S. market, 2017-19, January to September 2019, and January to September 2020
(Quantity=short tons; Value=1,000 dollars; Unit values, unit labor costs, and unit expenses=dollars per short ton; Period changes=percent--exceptions noted)
Reported data Period changesCalendar year January to September Comparison years

Table C-2--Continued
Jan-Sep2017 2018 2019 2019 2020 2017-19 2017-18 2018-19 2019-20
U.S. producers:--Continued
Standard and engineered wire mesh (SWM & EWM):SWM & EWM: Net sales:
SWM & EWM: Quantity.................................. *** *** *** *** *** ▲*** ▲*** ▼*** ▲*** SWM & EWM: Value....................................... *** *** *** *** *** ▲*** ▲*** ▼*** ▲*** SWM & EWM: Unit value................................ *** *** *** *** *** ▲*** ▲*** ▼*** ▼***
SWM & EWM: Cost of goods sold (COGS)......... *** *** *** *** *** ▲*** ▲*** ▲*** ▼*** SWM & EWM: Gross profit or (loss) (fn2)............ *** *** *** *** *** ▼*** ▲*** ▼*** ▲*** SWM & EWM: SG&A expenses.......................... *** *** *** *** *** ▲*** ▲*** ▼*** ▲*** SWM & EWM: Operating income or (loss) (fn2).. *** *** *** *** *** ▼*** ▲*** ▼*** ▲*** SWM & EWM: Net income or (loss) (fn2)............ *** *** *** *** *** ▼*** ▲*** ▼*** ▲*** SWM & EWM: Unit COGS.................................. *** *** *** *** *** ▲*** ▲*** ▲*** ▼*** SWM & EWM: Unit SG&A expenses................... *** *** *** *** *** ▲*** ▲*** ▼*** ▼*** SWM & EWM: Unit operating income or (loss) *** *** *** *** *** ▼*** ▲*** ▼*** ▲*** SWM & EWM: Unit net income or (loss) (fn2)..... *** *** *** *** *** ▼*** ▲*** ▼*** ▲*** SWM & EWM: COGS/sales (fn1)........................ *** *** *** *** *** ▲*** ▼*** ▲*** ▼*** SWM & EWM: Operating income or (loss)/sales *** *** *** *** *** ▼*** ▲*** ▼*** ▲*** SWM & EWM: Net income or (loss)/sales (fn1)... *** *** *** *** *** ▼*** ▲*** ▼*** ▲*** SWM & EWM: Capital expenditures.................... *** *** *** *** *** ▼*** ▲*** ▼*** ▼*** SWM & EWM: R&D expenses............................. *** *** *** *** *** ▲*** ▲*** ▼*** ▼*** SWM & EWM: Net assets................................... *** *** *** *** *** ▲*** ▲*** ▲*** ***
fn1.--Reported data are in percent and period changes are in percentage points.
Source: Compiled from data submitted in response to Commission questionnaires.
Calendar year January to September Comparison years
Note.--Shares and ratios shown as “0.0” percent represent non-zero values less than “0.05” percent (if positive) and greater than “(0.05)” percent (if negative). Zeroes, null values, and undefined calculations are suppressed and shown as “---“. Period changes preceded by a “▲” represent an increase, while period changes preceded by a “▼” represent a decrease.
fn2.--Percent changes only calculated when both comparison values represent profits; The directional change in profitability provided when one or both comparison values represent a loss.
C-7
Standard wire mesh and engineered wire mesh: Summary data concerning the U.S. market, 2017-19, January to September 2019, and January to September 2020
(Quantity=short tons; Value=1,000 dollars; Unit values, unit labor costs, and unit expenses=dollars per short ton; Period changes=percent--exceptions noted)
Reported data Period changes


D-1
APPENDIX D
U.S PRODUCERS’ AND U.S. PURCHASERS’ COMPARISONS OF STANDARD WIRE MESH
AND ENGINEERED WIRE MESH


D-3
Table continued on next page.
Table D-1 Standard wire mesh and engineered wire mesh: U.S. producers' comparisons of standard wire mesh and engineered wire mesh by the like product factors Item / Firm Narrative
U.S. producers: Physical characteristics *** *** *** *** *** *** *** *** *** *** *** *** *** *** *** *** *** ***

D-4
Table continued on next page.
Table D-1—Continued Standard wire mesh and engineered wire mesh: U.S. producers' comparisons of standard wire mesh and engineered wire mesh by the like product factors Item / Firm Narrative U.S. producers: Interchangeability *** *** *** *** *** *** *** *** *** *** *** *** *** *** *** *** *** *** U.S. producers: Channels *** *** *** *** *** *** *** *** *** *** *** *** *** *** *** *** *** ***

D-5
Table continued on next page.
Table D-1—Continued Standard wire mesh and engineered wire mesh: U.S. producers' comparisons of standard wire mesh and engineered wire mesh by the like product factors Item / Firm Narrative U.S. producers: Manufacturing *** *** *** *** *** *** *** *** *** *** *** *** *** *** *** *** *** *** *** *** *** ***

D-6
Source: Compiled from data submitted in response to Commission questionnaires.
Table D-1—Continued Standard wire mesh and engineered wire mesh: U.S. producers’ comparisons of standard wire mesh and engineered wire mesh by the like product factors Item / Firm Narrative U.S. producers: Perceptions *** *** *** *** *** *** *** *** *** *** *** *** *** *** *** *** *** *** U.S. producers: Price *** *** *** *** *** *** *** *** *** *** *** *** *** *** *** *** *** ***
D-7
Table D-2 Standard wire mesh and engineered wire mesh: U.S. purchasers’ comparisons of standard wire mesh and engineered wire mesh by the like product factors
Item / Firm Narrative U.S. purchasers: Physical characteristics *** *** *** *** *** *** *** *** *** *** U.S. purchasers: Interchangeability *** *** *** *** *** *** *** *** *** *** *** *** *** *** U.S. purchasers: Channels *** *** *** *** *** *** *** *** U.S. purchasers: Manufacturing *** *** *** *** *** *** *** *** U.S. purchasers: Perceptions *** *** *** *** *** *** *** ***
Table continued on next page.

D-8
Table D-2—Continued Standard wire mesh and engineered wire mesh: U.S. purchasers’ comparisons of standard wire mesh and engineered wire mesh by the like product factors
Item / Firm Narrative U.S. purchasers: Price *** *** *** *** *** *** *** *** *** ***
Source: Compiled from data submitted in response to Commission questionnaires.

E-1
APPENDIX E
STANDARD WIRE MESH AND ENGINEERED WIRE MESH TRADE DATA


E-3
Table E-1 Standard wire mesh and engineered wire mesh: U.S. producers' capacity, production, and capacity utilization, 2017-19, January to September 2019, and January to September 2020
Item Calendar year January to September
2017 2018 2019 2019 2020 Capacity (short tons)
Standard wire mesh *** 736,593 788,843 591,619 581,317 Engineered wire mesh *** *** *** *** ***
All firms *** *** *** *** *** Production (short tons)
Standard wire mesh *** 318,263 302,928 229,487 241,898 Engineered wire mesh 156,019 165,955 169,805 126,835 160,521
All firms *** 484,218 472,733 356,322 402,419 Capacity utilization (percent)
Standard wire mesh *** 43.2 38.4 38.8 41.6 Engineered wire mesh *** *** *** *** ***
All firms *** *** *** *** *** Share of production (percent)
Standard wire mesh *** 65.7 64.1 64.4 60.1 Engineered wire mesh *** 34.3 35.9 35.6 39.9
All firms 100.0 100.0 100.0 100.0 100.0 Source: Compiled from data submitted in response to Commission questionnaires.

E-4
Table E-2 Standard wire mesh and engineered wire mesh: U.S. producers' U.S. shipments, export shipments, and total shipments, 2017-19, January to September 2019, and January to September 2020
Item Calendar year January to September
2017 2018 2019 2019 2020 Quantity (short tons)
U.S. shipments: Standard wire mesh *** 309,147 296,954 227,761 261,131
Engineered wire mesh *** *** *** *** *** Total U.S. shipments *** *** *** *** ***
Export shipments *** *** *** *** *** Total shipments *** *** *** *** ***
Value (1,000 dollars) U.S. shipments: Standard wire mesh *** 300,780 269,429 211,096 199,911
Engineered wire mesh *** *** *** *** *** Total U.S. shipments *** *** *** *** ***
Export shipments *** *** *** *** *** Total shipments *** *** *** *** ***
Unit value (dollars per short ton) U.S. shipments: Standard wire mesh *** 973 907 927 766
Engineered wire mesh *** *** *** *** *** Total U.S. shipments *** *** *** *** ***
Export shipments *** *** *** *** *** Total shipments *** *** *** *** ***
Share of quantity (percent) U.S. shipments: Standard wire mesh *** *** *** *** ***
Engineered wire mesh *** *** *** *** *** Total U.S. shipments *** *** *** *** ***
Export shipments *** *** *** *** *** Total shipments 100.0 100.0 100.0 100.0 100.0
Share of value (percent) U.S. shipments: Standard wire mesh *** *** *** *** ***
Engineered wire mesh *** *** *** *** *** Total U.S. shipments *** *** *** *** ***
Export shipments *** *** *** *** *** Total shipments 100.0 100.0 100.0 100.0 100.0
Source: Compiled from data submitted in response to Commission questionnaires.

E-5
Table E-3 Standard wire mesh and engineered wire mesh: U.S. producers' inventories, 2017-19, January to September 2019, and January to September 2020
Item Calendar year January to September
2017 2018 2019 2019 2020 Quantity (short tons) U.S. producers' end-of-period inventories *** *** *** *** *** Ratio (percent) Ratio of inventories to.-- U.S. production *** *** *** *** ***
U.S. shipments *** *** *** *** *** Total shipments *** *** *** *** ***
Source: Compiled from data submitted in response to Commission questionnaires. Table E-4 Standard wire mesh and engineered wire mesh: U.S. producers' employment related data, 2017-19, January to September 2019, and January to September 2020
Item Calendar year January to September
2017 2018 2019 2019 2020 Production and related workers (PRWs) (number) *** 850 838 835 857 Total hours worked (1,000 hours) *** *** *** *** *** Hours worked per PRW (hours) *** *** *** *** *** Wages paid ($1,000) *** *** *** *** *** Hourly wages (dollars per hour) *** *** *** *** *** Productivity (short tons per hour) *** *** *** *** *** Unit labor costs (dollars per short tons) *** *** *** *** ***
Source: Compiled from data submitted in response to Commission questionnaires.

E-6
Table E-5 Standard wire mesh and engineered wire mesh: U.S. producers’ and importers’ U.S. shipments, by sources and channels of distribution
Item Calendar year January to September
2017 2018 2019 2019 2020 Share of U.S. shipments (percent) U.S. producers' U.S. shipments of standard wire mesh.-- to Distributors *** *** *** *** ***
to End-users *** *** *** *** *** U.S. producers' U.S. shipments of engineered wire mesh.-- to Distributors *** *** *** *** ***
to End-users *** *** *** *** *** U.S. producers' U.S. shipments of standard and engineered wire mesh.-- to Distributors *** *** *** *** ***
to End-users *** *** *** *** *** U.S. importers' U.S. shipments of standard wire mesh.-- to Distributors *** *** *** *** ***
to End-users *** *** *** *** *** U.S. importers' U.S. shipments of engineered wire mesh.-- to Distributors *** *** *** *** ***
to End-users *** *** *** *** *** U.S. importers' U.S. shipments of standard and engineered wire mesh.-- to Distributors *** *** *** *** ***
to End-users *** *** *** *** *** Source: Compiled from data submitted in response to Commission questionnaires.

F-1
APPENDIX F
ENGINEERED WIRE MESH AND STANDARD WIRE MESH FINANCIAL DATA


F-3
Table F-1 Engineered wire mesh: Results of operations of U.S. producers, 2017-19, January-September 2019, and January-September 2020
Item Calendar year January to September
2017 2018 2019 2019 2020 Quantity (short tons) Total net sales *** *** *** *** *** Value (1,000 dollars) Total net sales *** *** *** *** *** Cost of goods sold.-- Wire rod *** *** *** *** ***
Direct labor *** *** *** *** *** Other factory costs *** *** *** *** ***
Total COGS *** *** *** *** *** Gross profit *** *** *** *** *** SG&A expense *** *** *** *** *** Operating income or (loss) *** *** *** *** *** Interest expense *** *** *** *** *** All other expenses *** *** *** *** *** All other income *** *** *** *** *** Other expense/ (income), net *** *** *** *** *** Net income or (loss) *** *** *** *** *** Depreciation/amortization *** *** *** *** *** Cash flow *** *** *** *** *** Ratio to net sales (percent) Cost of goods sold.-- Wire rod *** *** *** *** ***
Direct labor *** *** *** *** *** Other factory costs *** *** *** *** ***
Average COGS *** *** *** *** *** Gross profit *** *** *** *** *** SG&A expense *** *** *** *** *** Operating income or (loss) *** *** *** *** *** Net income or (loss) *** *** *** *** ***
Table continued on next page.

F-4
Table F-1—Continued Engineered wire mesh: Results of operations of U.S. producers, 2017-19, January-September 2019, and January-September 2020
Item Calendar year January to September
2017 2018 2019 2019 2020 Ratio to total COGS (percent) Cost of goods sold.-- Wire rod *** *** *** *** ***
Direct labor *** *** *** *** *** Other factory costs *** *** *** *** ***
Average COGS *** *** *** *** *** Unit value (dollars per short ton)
Total net sales *** *** *** *** *** Cost of goods sold.-- Wire rod *** *** *** *** ***
Direct labor *** *** *** *** *** Other factory costs *** *** *** *** ***
Average COGS *** *** *** *** *** Gross profit *** *** *** *** *** SG&A expense *** *** *** *** *** Operating income or (loss) *** *** *** *** *** Net income or (loss) *** *** *** *** *** Number of firms reporting Operating losses *** *** *** *** *** Net losses *** *** *** *** *** Data *** *** *** *** ***
Source: Compiled from data submitted in response to Commission questionnaires.
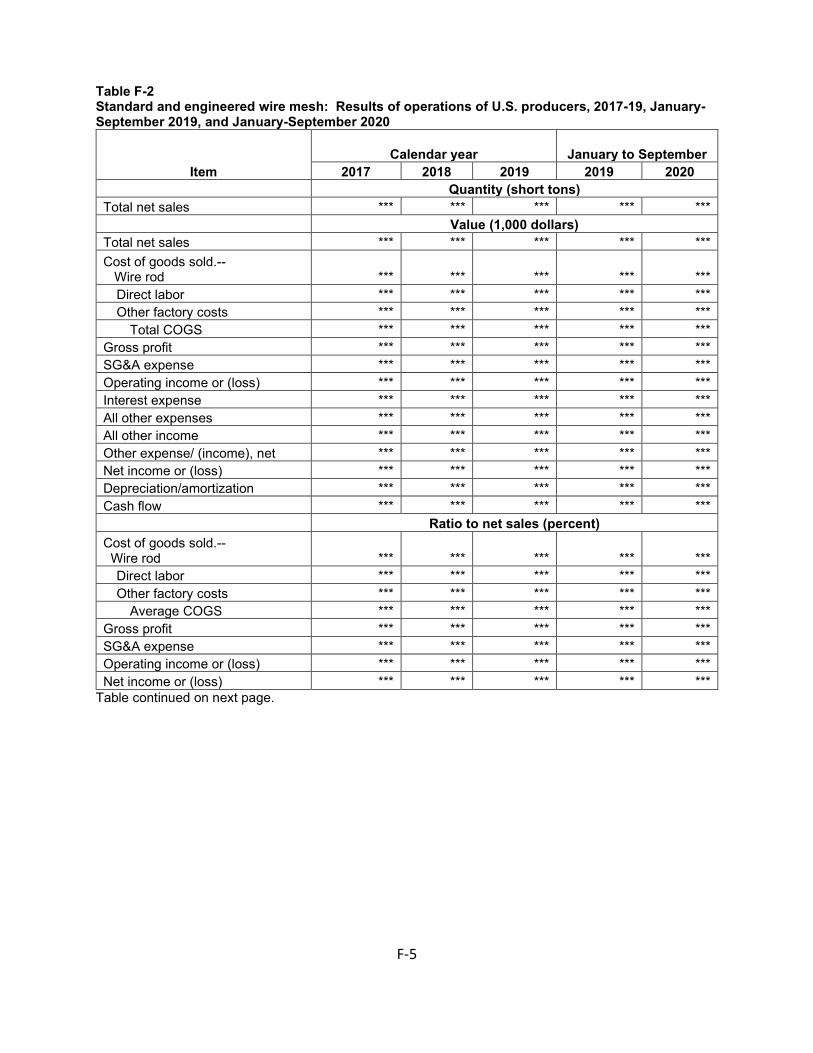
F-5
Table F-2 Standard and engineered wire mesh: Results of operations of U.S. producers, 2017-19, January-September 2019, and January-September 2020
Item Calendar year January to September
2017 2018 2019 2019 2020 Quantity (short tons) Total net sales *** *** *** *** *** Value (1,000 dollars) Total net sales *** *** *** *** *** Cost of goods sold.-- Wire rod *** *** *** *** ***
Direct labor *** *** *** *** *** Other factory costs *** *** *** *** ***
Total COGS *** *** *** *** *** Gross profit *** *** *** *** *** SG&A expense *** *** *** *** *** Operating income or (loss) *** *** *** *** *** Interest expense *** *** *** *** *** All other expenses *** *** *** *** *** All other income *** *** *** *** *** Other expense/ (income), net *** *** *** *** *** Net income or (loss) *** *** *** *** *** Depreciation/amortization *** *** *** *** *** Cash flow *** *** *** *** *** Ratio to net sales (percent) Cost of goods sold.-- Wire rod *** *** *** *** ***
Direct labor *** *** *** *** *** Other factory costs *** *** *** *** ***
Average COGS *** *** *** *** *** Gross profit *** *** *** *** *** SG&A expense *** *** *** *** *** Operating income or (loss) *** *** *** *** *** Net income or (loss) *** *** *** *** ***
Table continued on next page.

F-6
Table F-2--Continued Standard and engineered wire mesh: Results of operations of U.S. producers, 2017-19, January-September 2019, and January-September 2020
Item Calendar year January to September
2017 2018 2019 2019 2020 Ratio to total COGS (percent) Cost of goods sold.-- Wire rod *** *** *** *** ***
Direct labor *** *** *** *** *** Other factory costs *** *** *** *** ***
Average COGS *** *** *** *** *** Unit value (dollars per short ton)
Total net sales *** *** *** *** *** Cost of goods sold.-- Wire rod *** *** *** *** ***
Direct labor *** *** *** *** *** Other factory costs *** *** *** *** ***
Average COGS *** *** *** *** *** Gross profit *** *** *** *** *** SG&A expense *** *** *** *** *** Operating income or (loss) *** *** *** *** *** Net income or (loss) *** *** *** *** *** Number of firms reporting Operating losses *** *** *** *** *** Net losses *** *** *** *** *** Data *** *** *** *** ***
Source: Compiled from data submitted in response to Commission questionnaires.
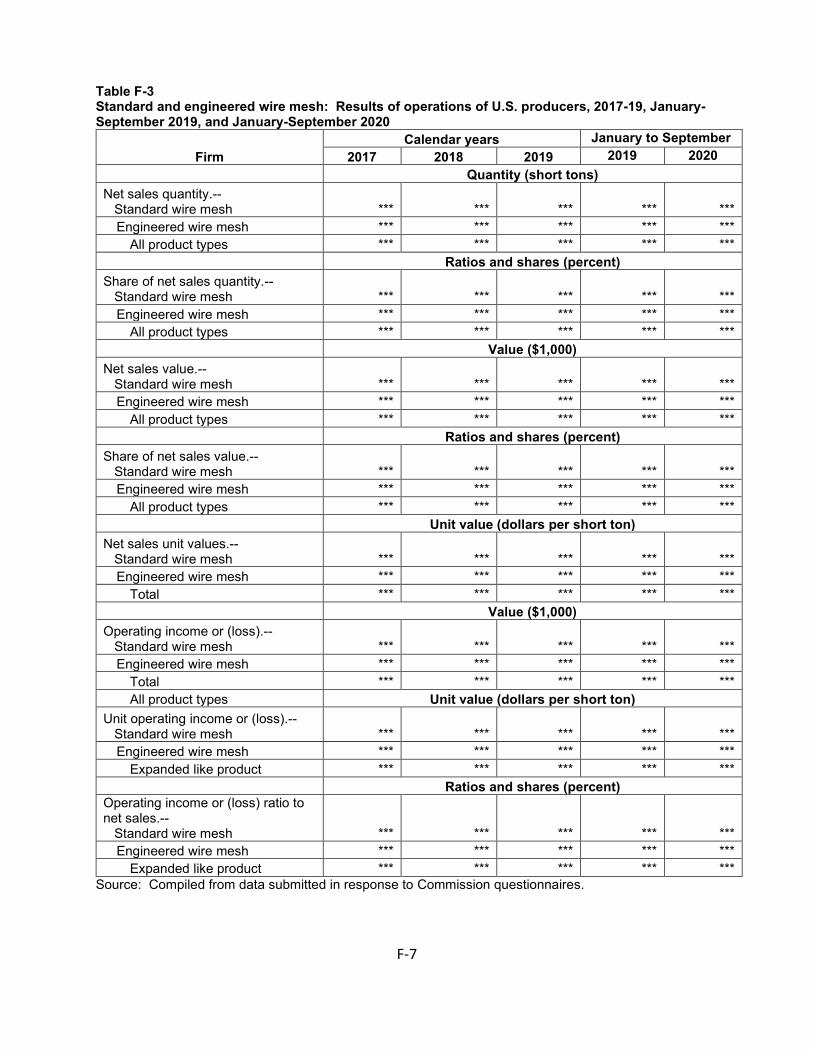
F-7
Table F-3 Standard and engineered wire mesh: Results of operations of U.S. producers, 2017-19, January-September 2019, and January-September 2020
Firm Calendar years January to September
2017 2018 2019 2019 2020 Quantity (short tons) Net sales quantity.-- Standard wire mesh *** *** *** *** ***
Engineered wire mesh *** *** *** *** *** All product types *** *** *** *** ***
Ratios and shares (percent) Share of net sales quantity.-- Standard wire mesh *** *** *** *** ***
Engineered wire mesh *** *** *** *** *** All product types *** *** *** *** ***
Value ($1,000) Net sales value.-- Standard wire mesh *** *** *** *** ***
Engineered wire mesh *** *** *** *** *** All product types *** *** *** *** ***
Ratios and shares (percent) Share of net sales value.-- Standard wire mesh *** *** *** *** ***
Engineered wire mesh *** *** *** *** *** All product types *** *** *** *** ***
Unit value (dollars per short ton) Net sales unit values.-- Standard wire mesh *** *** *** *** ***
Engineered wire mesh *** *** *** *** *** Total *** *** *** *** ***
Value ($1,000) Operating income or (loss).-- Standard wire mesh *** *** *** *** ***
Engineered wire mesh *** *** *** *** *** Total *** *** *** *** *** All product types Unit value (dollars per short ton)
Unit operating income or (loss).-- Standard wire mesh *** *** *** *** ***
Engineered wire mesh *** *** *** *** *** Expanded like product *** *** *** *** ***
Ratios and shares (percent) Operating income or (loss) ratio to net sales.-- Standard wire mesh *** *** *** *** ***
Engineered wire mesh *** *** *** *** *** Expanded like product *** *** *** *** ***
Source: Compiled from data submitted in response to Commission questionnaires.
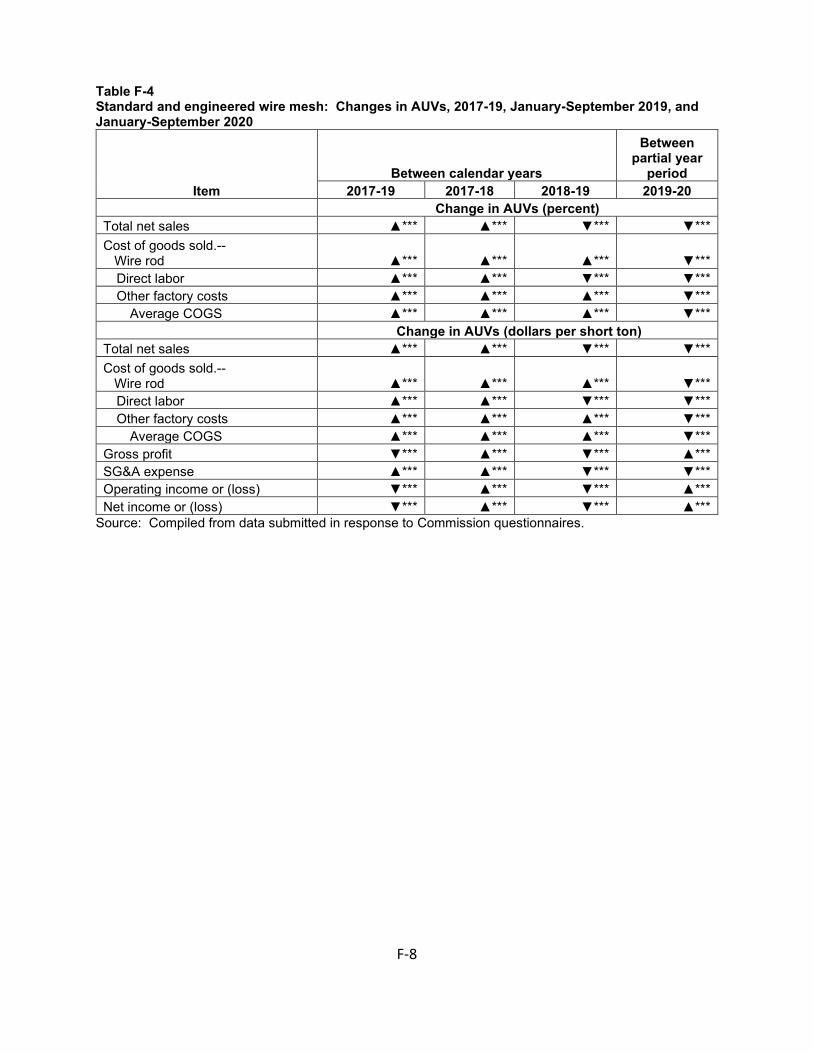
F-8
Table F-4 Standard and engineered wire mesh: Changes in AUVs, 2017-19, January-September 2019, and January-September 2020
Item Between calendar years
Between partial year
period 2017-19 2017-18 2018-19 2019-20
Change in AUVs (percent) Total net sales ▲*** ▲*** ▼*** ▼*** Cost of goods sold.-- Wire rod ▲*** ▲*** ▲*** ▼***
Direct labor ▲*** ▲*** ▼*** ▼*** Other factory costs ▲*** ▲*** ▲*** ▼***
Average COGS ▲*** ▲*** ▲*** ▼*** Change in AUVs (dollars per short ton)
Total net sales ▲*** ▲*** ▼*** ▼*** Cost of goods sold.-- Wire rod ▲*** ▲*** ▲*** ▼***
Direct labor ▲*** ▲*** ▼*** ▼*** Other factory costs ▲*** ▲*** ▲*** ▼***
Average COGS ▲*** ▲*** ▲*** ▼*** Gross profit ▼*** ▲*** ▼*** ▲*** SG&A expense ▲*** ▲*** ▼*** ▼*** Operating income or (loss) ▼*** ▲*** ▼*** ▲*** Net income or (loss) ▼*** ▲*** ▼*** ▲***
Source: Compiled from data submitted in response to Commission questionnaires.

F-9
Table F-5 Standard and engineered wire mesh: Capital expenditures and research and development expenses for U.S. producers, by firm, 2017-19, January-September 2019, and January-September 2020
Item
Calendar year January to September 2017 2018 2019 2019 2020
Capital expenditures (1,000 dollars) Standard wire mesh *** *** *** *** *** Engineered wire mesh *** *** *** *** ***
Total capital expenditures *** *** *** *** *** Research and development expenses (1,000 dollars) Standard wire mesh *** *** *** *** *** Engineered wire mesh *** *** *** *** ***
Total R&D expenses *** *** *** *** *** Source: Compiled from data submitted in response to Commission questionnaires. Table F-6 Standard and engineered wire mesh: Value of assets used in production, warehousing, and sales, and return on investment for U.S. producers by firm, 2017-19
Firm Fiscal years
2017 2018 2019 Total net assets (1,000 dollars) Standard wire mesh *** *** *** Engineered wire mesh *** *** ***
Total net assets *** *** *** Operating return on assets (percent) Standard wire mesh *** *** *** Engineered wire mesh *** *** ***
Average operating return on assets *** *** *** Source: Compiled from data submitted in response to Commission questionnaires.


G-1
APPENDIX G
U.S. PURCHASERS IDENTIFIED IN PRODUCER AND IMPORTER CUSTOMER IDENTIFICATION LISTS


G-3
Table G-1 Standard wire mesh: U.S. purchasers identified in producer and importer customer identification lists
U.S. purchasers Location(s) U.S. importers (MX/***)
U.S. producers
*** *** *** *** *** *** *** *** *** *** *** *** *** *** *** *** *** *** *** *** *** *** *** *** *** *** *** *** *** *** *** *** *** *** *** *** *** *** *** *** *** *** *** *** *** *** *** *** *** *** *** *** *** *** *** *** *** *** *** *** *** *** *** *** *** *** *** *** *** *** *** *** *** *** *** *** *** *** *** *** *** *** *** *** *** *** *** *** *** *** *** *** *** *** *** *** *** *** *** *** *** *** *** *** *** *** *** *** *** *** *** ***
Table continued on next page.

G-4
Table G-1--Continued Standard wire mesh: U.S. purchasers identified in producer and importer customer identification lists
U.S. purchasers Location(s) U.S. importers (MX/***)
U.S. producers
*** *** *** *** *** *** *** *** *** *** *** *** *** *** *** *** *** *** *** *** *** *** *** *** *** *** *** *** *** *** *** *** *** *** *** *** *** *** *** *** *** *** *** *** *** *** *** *** *** *** *** *** *** *** *** *** *** *** *** *** *** *** *** *** *** *** *** *** *** *** *** *** *** *** *** *** *** *** *** *** *** *** *** *** *** *** *** *** *** *** *** *** *** *** *** *** *** *** *** *** *** *** *** *** *** *** *** *** *** *** *** *** *** *** *** *** *** *** *** ***
Table continued on next page.

G-5
Table G-1--Continued Standard wire mesh: U.S. purchasers identified in producer and importer customer identification lists
U.S. purchasers Location(s) U.S. importers (MX/***)
U.S. producers
*** *** *** *** *** *** *** *** *** *** *** *** *** *** *** *** *** *** *** *** *** *** *** *** *** *** *** *** *** *** *** *** *** *** *** *** *** *** *** *** *** *** *** *** *** *** *** *** *** *** *** *** *** *** *** *** *** *** *** *** *** *** *** *** *** *** *** *** *** *** *** *** *** *** *** *** *** *** *** *** *** *** *** *** *** *** *** *** *** *** *** *** *** *** *** *** *** *** *** *** *** *** *** *** *** *** *** *** *** *** *** *** *** *** *** *** *** *** *** *** *** *** *** ***
Table continued on next page.
G-6
Table G-1--Continued Standard wire mesh: U.S. purchasers identified in producer and importer customer identification lists
U.S. purchasers Location(s) U.S. importers (MX/***)
U.S. producers
*** *** *** *** *** *** *** *** *** *** *** *** *** *** *** *** *** *** *** *** *** *** *** *** *** *** *** *** *** *** *** *** *** *** *** *** *** *** *** *** *** *** *** *** *** *** *** *** *** *** *** *** *** *** *** *** *** *** *** *** *** *** *** ***
Source: Compiled from data submitted in response to Commission questionnaires.
Note: A* designation indicates a U.S. producer that is also an importer of standard wire mesh from Mexico. A ** designation indicates a U.S. producer that is also an importer of standard wire mesh from ***.
Note: Some purchasers have multiple locations.
Copyright © 2022 FDOKUMEN