Gliosarcoma Stem Cells Undergo Glial and Mesenchymal Differentiation In Vivo
Upload
eastangliaCategory
view
1download
0
1 Ekonomou
Title page 1
Stage-specific changes in neurogenic and glial markers in Alzheimer’s disease 2
Antigoni Ekonomou1a*, George M. Savva2b, Carol Brayne2, Gill Forster3, Paul T. Francis1, Mary 3
Johnson4, Elaine K. Perry4, Johannes Attems4, Alyma Somani1, Stephen Minger1c, Clive Ballard1, on 4
behalf of The Medical Research Council Cognitive Function and Ageing Neuropathology Study 5
1 Wolfson Centre for Age-Related Diseases, King‟s College London, London, UK 6
2 Department of Public Health and Primary Care, University of Cambridge, Cambridge, UK 7
3 Sheffield Institute for Translational Neuroscience, Department of Neuroscience, University of Sheffield, 8
Sheffield, UK 9
4 Institute for Ageing and Health, Newcastle University, Newcastle Upon Tyne, UK 10
11
Present address: 12
a Department of Neuroimaging, King‟s College London, London, UK 13
b School of Nursing Sciences, University of East Anglia, Norwich Research Park, Norwich, UK 14
c GE Healthcare, Cardiff, UK 15
16
* Corresponding author: Antigoni Ekonomou 17
Department of Neuroimaging, Institute of Psychiatry, King‟s College London 18
125 Coldharbour Lane, London SE5 9NU, United Kingdom 19
e-mail: [email protected] 20
21
Key words: Alzheimer‟s disease; neurogenesis; neural progenitors; glia; human brain; tangles. 22
Word number (abstract): 250 23
Word number (article): 3,998 24
Number of tables: 4 25
Number of figures: 3 26
Supplementary information: methods and materials, 1 table, 2 figures27
*ManuscriptClick here to view linked References

2 Ekonomou
Abstract 28
Background: Reports of altered endogenous neurogenesis in people with Alzheimer‟s disease (AD) 29
and transgenic AD models have suggested that endogenous neurogenesis may be an important 30
treatment target, but there is considerable discrepancy between studies. We examined endogenous 31
neurogenesis and glia changes across the range of pathological severity of AD in people with/without 32
dementia to address this key question. 33
Methods: Endogenous neurogenesis and glia in the subventricular zone and dentate gyrus 34
neurogenic niches were evaluated using single and double immunohistochemistry and a validated 35
antibody selection for stage-and-type-specific markers in autopsy tissue from a representative cohort 36
of 28 participants in the MRC Cognitive Function and Ageing study (MRC CFAS). Immunopositive 37
cells were measured blinded to diagnosis, using brightfield and fluorescent microscopy. 38
Results: The number of newly-generated neurons significantly declined only in the dentate gyrus of 39
patients with severe tau pathology. No other changes in other neurogenic markers were observed in 40
either of the neurogenic niches. Interestingly, alterations in astrocytes and microglia were also 41
observed in the dentate gyrus across the different stages of tau pathology. No change in any of the 42
markers was observed in individuals who died with dementia compared to those who did not. 43
Conclusions: Alterations in endogenous neurogenesis appear to be confined to a reduction in the 44
generation of new neurons in the dentate gyrus of AD patients with severe neurofibrillary tangle 45
pathology and were accompanied by changes in the glia load. These data suggest that intervention 46
enhancing endogenous neurogenesis may be a potential therapeutic target in AD. 47
48
3 Ekonomou
Introduction 49
Dementia currently affects more than 34 million people worldwide, with estimations that more than 50
110 million people will be affected by dementia in 2050 (1). Alzheimer‟s disease (AD), the most 51
common form of dementia, causes enormous personal, social and financial burdens on the patients, 52
their caregivers and society. Current pharmacological treatments offer symptomatic benefits, thus 53
effective disease-modifying therapies are urgently needed. As AD is a neurodegenerative disease, 54
cell replacement strategies are a potential target for therapeutic intervention; such as promoting 55
endogenous neurogenesis. 56
Endogenous neurogenesis is evident in two areas of the brain: the hippocampal dentate gyrus (DG) 57
and the wall of the lateral ventricles (subventricular zone–SVZ) (2-5). In mammals, neural 58
progenitors at the base of the DG granular layer (subgranular layer, SGL) give rise to neurons that 59
can be functionally integrated in the granular cell layer, whereas the SVZ neural progenitors follow a 60
distinct pathway, the Rostral Migratory Stream (RMS), to the olfactory bulb (OB) where they create 61
interneurons. In the healthy adult brain, SVZ neurogenesis maintains cellular turnover in the OB, 62
contributing to olfactory adaptation and learning (6-8), whereas in DG endogenous neurogenesis is 63
crucial for the hippocampal-dependent spatial learning and memory throughout life (8-11). 64
Groundbreaking work over the last two decades has demonstrated the presence of the same 65
neurogenic niches in the adult human brain, including the temporal horn of the lateral ventricles, 66
located adjacent to the hippocampal formation (12-15). Consequently, there has been evolving 67
interest in the therapeutic potential of strategies that aim to enhance endogenous neurogenesis. Many 68
available compounds, of which some are already in clinical use, such as retinoid agonists, 69
cannabinoids, Selective Serotonin Reuptake Inhibitors (SSRIs), cholinesterase inhibitors and certain 70
hormones have a substantial positive impact on neurogenesis in animals, by either stimulating 71
proliferation of endogenous neural stem cells and/or increasing their differentiation into neurons (for 72
reviews see 16 and 17). 73
4 Ekonomou
However, the potential clinical relevance for AD patients is less clear, with contradictory results 74
from the small number of human autopsy studies that have been undertaken. Ziabreva et al. (2006) 75
and Perry et al. (2012) identified an increase at the proliferation stages of neurogenesis in the anterior 76
SVZ (18) and the temporal horn SVZ and DG (19) respectively, but a reduction in the early stage 77
neural progenitors in the SVZ of AD patients compared to age-matched controls (18). In a previous 78
study from our group foucssing on a different cohort of AD patients, including people with 79
concurrent cerebrovascular disease, no statistically significant difference was observed in early 80
neuronal marker immunoreactivity between AD and controls (19). In contrast, in another study 81
increased numbers of neural progenitors were detected in the DG of AD patients, which resulted in 82
an unsuccessful maturation to newly-generated neurons (20). In a report focusing on younger 83
patients with AD, increased glial proliferation was reported in the SGL, but no alteration in 84
neurogenesis was identified (21). Other studies suggested that both concurrent cerebrovascular 85
pathology (22-26) and the severity of cortical cholinergic system deficits (18, 19, 27) are likely to 86
represent key mediating factors in either increasing or decreasing endogenous neurogenesis, 87
respectively. Hence, the influence of age-associated neuropathological changes on neurogenesis is 88
not fully elucidated, in particular with respect to the early stages of the AD process. 89
Similar to the often contradictory data from studies on human tissue, studies investigating 90
neurogenesis in transgenic animal models carrying the human mutations for APP and/or PS1 or PS2 91
and/or tau proteins reported increased, decreased or unchanged progenitor activity (28-32). 92
To further elucidate the role of neurogenesis in AD, we examined post mortem brain tissue from a 93
subset of participants of the Medical Research Council Cognitive Function and Ageing Study (MRC 94
CFAS), including individuals who died with and without dementia, and who showed all 95
neuropathological stages of AD-associated tau pathology (i.e., Braak stages 0 to VI), without any 96
other neuropathology such as cerebrovascular disease. For the first time, the levels of astrocytic and 97
microglia cell numbers were also identified in the different Braak stages. Our study primarily aimed 98
5 Ekonomou
to identify alterations in the various phases of endogenous neurogenesis in relation to dementia and 99
AD-associated pathology. 100
101
Methods and Materials 102
Tissue was obtained from brains donated to the UK MRC CFAS. Details of the study have been 103
described elsewhere (33, 34) and can also be found at the website (www.cfas.ac.uk). In brief, MRC 104
CFAS included an initial cohort of 13,004 individuals, representative of the population aged 65 and 105
over recruited from general practice lists in five areas of England and Wales. The cohort for the 106
current study consists of 28 brain samples selected from those participants of the MRC CFAS who 107
agreed to donate their brain on death and among whom a successful autopsy was performed. At the 108
time of sampling, 456 brain donations had been made to the study, 114 of which were available and 109
had sufficient tissue for the current analysis (those from the Cambridgeshire and Newcastle centres). 110
Those who received a neuropathological diagnosis of „normal brain‟, „possible AD‟, „probable AD‟ 111
or „definite AD‟ were considered for selection into the study. Those with any diagnosis of Lewy 112
body disease, cerebrovascular disease or other neuropathology were excluded. Neurofibrillary tangle 113
(NFT) pathology was assessed using Braak staging (35-37) after histochemistry, by experienced 114
neuropathologists working in the MRC CFAS study, blinded to clinical findings (supplementary 115
figure S1). Neurofibrillary Braak stages are stated based on the topographical distribution of 116
neurofibrillary tangles and neuropil threads which are neuropathological hallmark lesions of AD; at 117
Braak stages I and II, NFTs are confined mainly to the transentorhinal region of the brain; at stages 118
III and IV they are also found in limbic regions such as the hippocampus, and at the severe stages V 119
and VI they are extensively located in other brain areas, including the neocortex (35, 36). The 120
neuropathological diagnosis of AD was done according to internationally accepted criteria that 121
include the assessment of amyloid-β pathology, which progresses spatially and temporally 122
differently than the tau pathology. Of note, similar to many other studies, we used Braak stages to 123
6 Ekonomou
indicate the overall severity of AD pathology, but not to directly compare the severity of tau 124
pathology with neurogenesis; in this study neither tau nor amyloid-β pathology was directly 125
compared with neurogenesis in the same topographic locations. 126
Diagnosis of dementia 127
Dementia status at death was determined based on interviews during the last years of life, including 128
the full GMS-AGECAT diagnostic algorithm that was equivalent to that in the Diagnostic and 129
Statistical Manual of Mental Disorders, third edition, revised (DSM-III-R), interviews with 130
informants after the respondent's death when this was possible and death certification (37). Of the 28 131
individuals included in the present study, 13 received a study diagnosis of dementia at death. 132
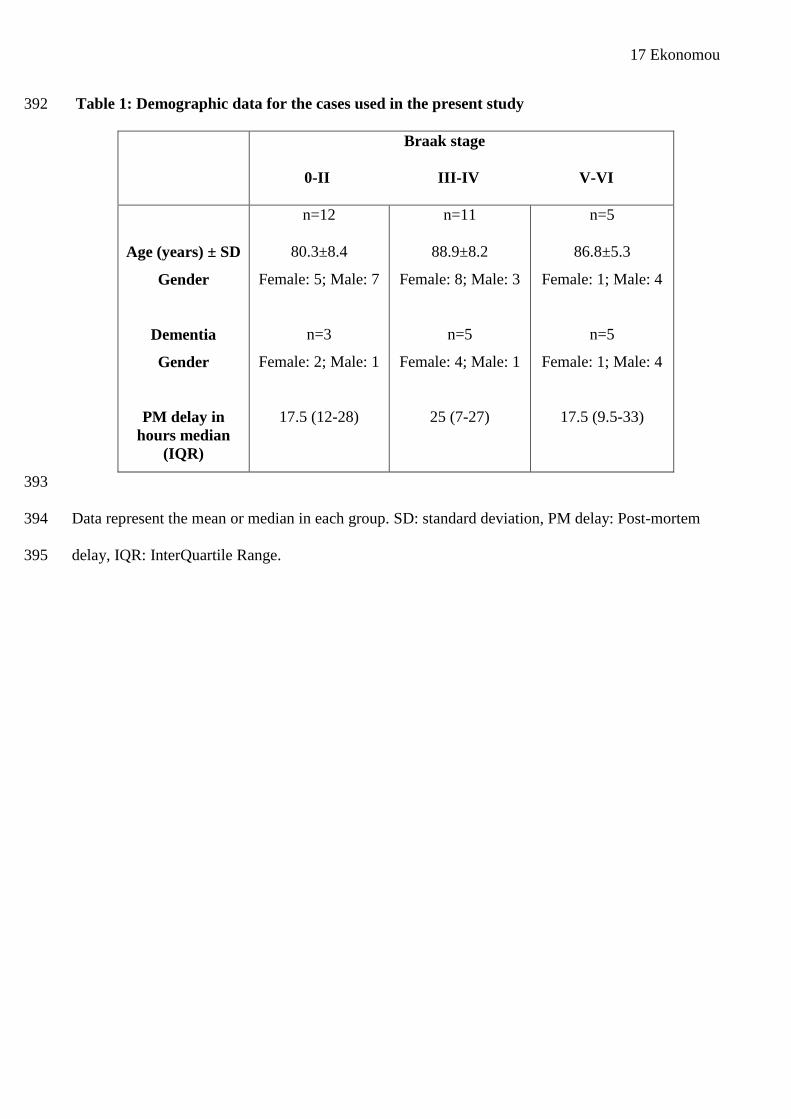
Demographic data are shown in table 1. 133
Immunohistochemistry 134
8m thick, paraffin- embedded sections were obtained at the level of basal ganglia, including the 135
anterior SVZ, and also at the level of hippocampus, including the temporal horn of the SVZ. Slides 136
were processed for immunohistochemistry and double immunofluorescence (described in 137
supplementary Methods and Materials), according to previously published procedures (22, 23, 26, 138
27). 139
Cell counts 140
Cell counting was performed twice, blind to the clinical and neuropathological diagnosis, using a 141
Nikon Eclipse E800 microscope and the NIS elements software for bright field microscopy (version. 142
2.3, both from Nikon Europe, Nederlands) and a Carl Zeiss Apotome Axioplan 2 microscope and the 143
AxioVision software for the immunofluorescence (version 4.7.2, all from Carl Zeiss, UK). The 144
length of the hippocampus and that of three areas of the SVZ and the neighbouring ependymal cell 145
layer in either the anterior ventricle horn or the temporal ventricle horn were measured on each slide 146
section under a very low magnification and using the relevant microscope software tools. Results 147

7 Ekonomou
were expressed as the number of immunopositive cells for each antibody/mm of length for all the 148
markers, in order to adjust for variances due to different lengths of the areas measured. 149
Statistical analysis 150
For all markers except doublecortin, negative binomial regression analysis was used to model the 151
difference in the number of immunopositive cells per mm length across groups defined by Braak 152
stage. Regression models were adjusted for age at death and for gender. Differences in cell counts 153
per mm between those with and without dementia at autopsy were assessed by negative binomial 154
regression adjusting for age at autopsy, gender and Braak stage. Negative binomial regression is a 155
count based regression model, and allows a number of events (immunopositive cells) to be modelled 156
in terms of covariates of interest (Braak stage and dementia diagnosis), as well as potentially 157
confounding covariates (age and sex), while also taking into account differences in an „exposure‟ 158
variable (length of tissue sample being examined). Negative binomial regression is a generalisation 159
of Poisson regression in that it allows for heterogeneity in the number of cells per mm across 160
individuals within a group. Poisson regression assumes an even distribution of immunopositive cells 161
across samples within groups and would lead to Type 1 errors since this assumption is highly 162
unlikely to be met. Negative binomial regression results in an estimate of „rate‟ (cells per mm) in 163
each group standardised to remove the effect of any differences in age and sex across groups and an 164
estimate of difference in terms of an „incident rate ratio‟ corresponding to the ratio of the rates across 165
groups, assuming all other covariates held constant. It should be noted that the rate estimate is very 166
similar to the raw count of cells/mm in each case, suggesting that the effect of any difference in age 167
and sex across groups in this analysis is minimal. 168
As a secondary albeit more conventional analysis, we conducted an analysis of variance (ANOVA) 169
across groups treating total cells per mm as a continuous outcome. This led to substantively similar 170
results, however it is likely that the outcome measure of cells per mm violates the assumptions of an 171

8 Ekonomou
ANOVA (normally distribution with equal variances across groups) and so we prefer the negative 172
binomial regression as the primary analysis. 173
The numbers of cells positive for doublecortin were too small for meaningful multivariate analysis or 174
analysis using a count-based regression model, and so for each brain area the proportion of cases 175
with any doublecortin positive cells was compared across groups using Fisher‟s exact tests. 176
An initial p value of p<0.05 was set for statistical significance, however owing to the large number 177
of hypotheses considered, we subsequently corrected for multiple testing using the method of 178
Benjamini and Hochberg (38) by setting a false discovery rate of q=0.05, leading to a revised critical 179
value of p<0.0016 for each individual hypothesis. Finally, Spearman‟s correlation coefficients were 180
estimated to identify any association between the detected changes. For the data analysis, IBM SPSS 181
(version 19) and STATA (version 12.1) statistical software were used. 182
183
Results 184
Demographic data for the cohort are presented in Table 1. Across the entire study cohort, the mean 185
age at death was 84.8 years (+/- 8.6, range 71-103) and 50% of the participants were female (for 186
details see table 1). Statistical analysis showed that the post mortem delay was not related either to 187
Braak Stage and dementia diagnosis (p>0.05 for both) or to the cell counts of any of the markers 188
examined (data not shown). 189
The pattern of immmunoreactivity of the neural stem/progenitor cells and their progeny were 190
consistent with our previous descriptions (22, 23). Nestin and doublecortin immunoreactivity was 191
observed in cellular somata and processes, although in the case of doublecortin, immunoreactivity in 192
the processes was rarely observed, possibly due to the post mortem delay, as described previously 193
(21). As doublecortin is also expressed in astrocytes (39), any doublecortin-positive cells with 194
astrocytic appearance (multiple processes) were excluded from counting. PCNA and HuC/D 195
immunoreactivity were detected in the cell nucleus. Figure 1 (A and B) shows the different cell 196
9 Ekonomou
types, as detected by DAB immunohistochemistry and double immunofluorescence in the 197
hippocampal DG and the subventricular zone. 198
199
Dentate gyrus 200
The estimated number of immunopositive cells per mm length in the DG and the estimated 201
frequency of cells across Braak stages, standardised to the average age at the time of autopsy and for 202
gender is shown in figure 2 (A and B) for both neurogenic markers and glia. There was a lower 203
number of HuC/D-positive post mitotic early neurons in the DG in individuals with Braak staging V-204
VI (severe neuropathology) compared to those with Braak staging 0-II (p=0.032, Figures 1B and 205
2A). 206
A significantly higher number of microglia cells, as identified by Iba1 immunohistochemistry, were 207
detected in individuals with Braak stage III-IV compared to the other two groups (p=0.033, Figures 208
2B and 3). However, the differences in early neurons and microglia cells detected were not 209
statistically significant after adjusting for multiple testing. 210
There was a significantly lower number of GFAP-positive cells (identifying both neural stem cells 211
and astrocytes) among those with Braak stage III-IV (IRR=0.6; 95% CI=0.4-0.9) compared to those 212
with Braak stage 0-II, but a higher number among those in those in Braak stage V-VI (IRR=1.9; 95% 213
CI=1.3-2.8), and this difference across Braak groups remained statistically significant after 214
correction for multiple testing (p<0.0001, Figures 2B and 3). 215
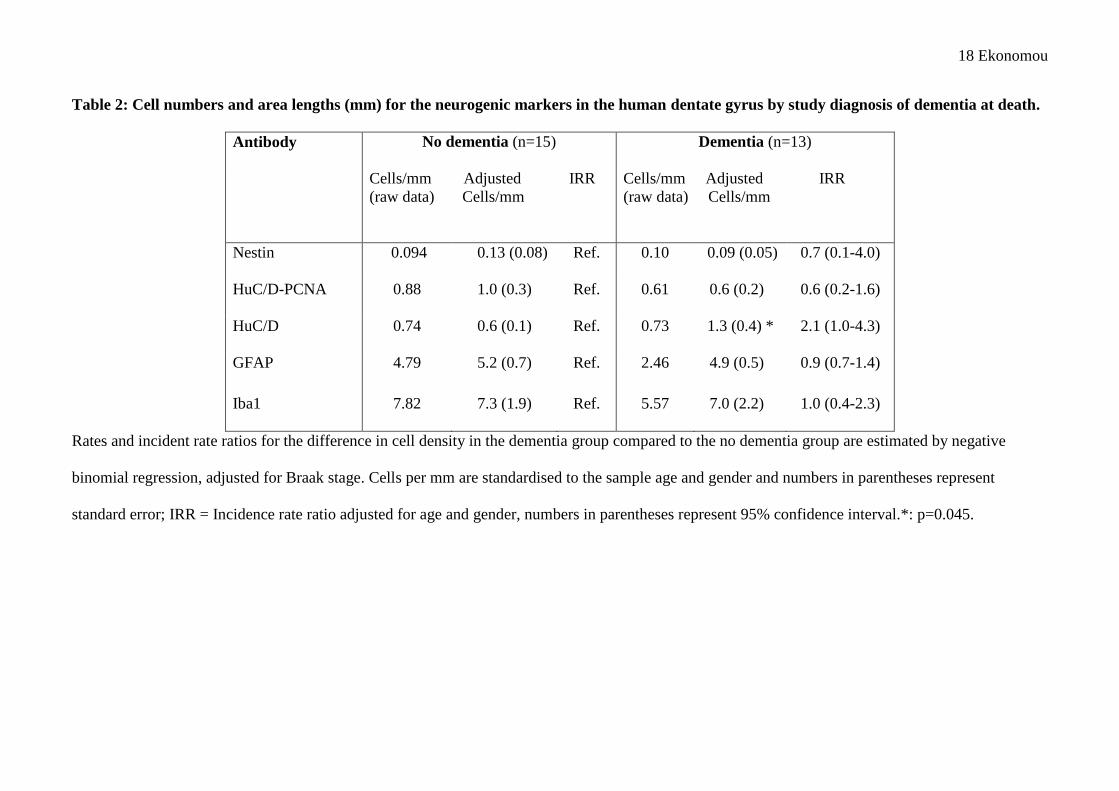
Table 2 shows the difference in cell numbers per mm between those with and without dementia, and 216
the rate ratio standardised for age, gender and Braak stage. There is some evidence of an increase in 217
HuC/D-positive cell numbers in those with dementia (adjusted IRR=2.1; 95% CI=1.0-4.3; p=0.05). 218
As the number of doublecortin-positive cells was very low in the DG, a different statistical analysis 219
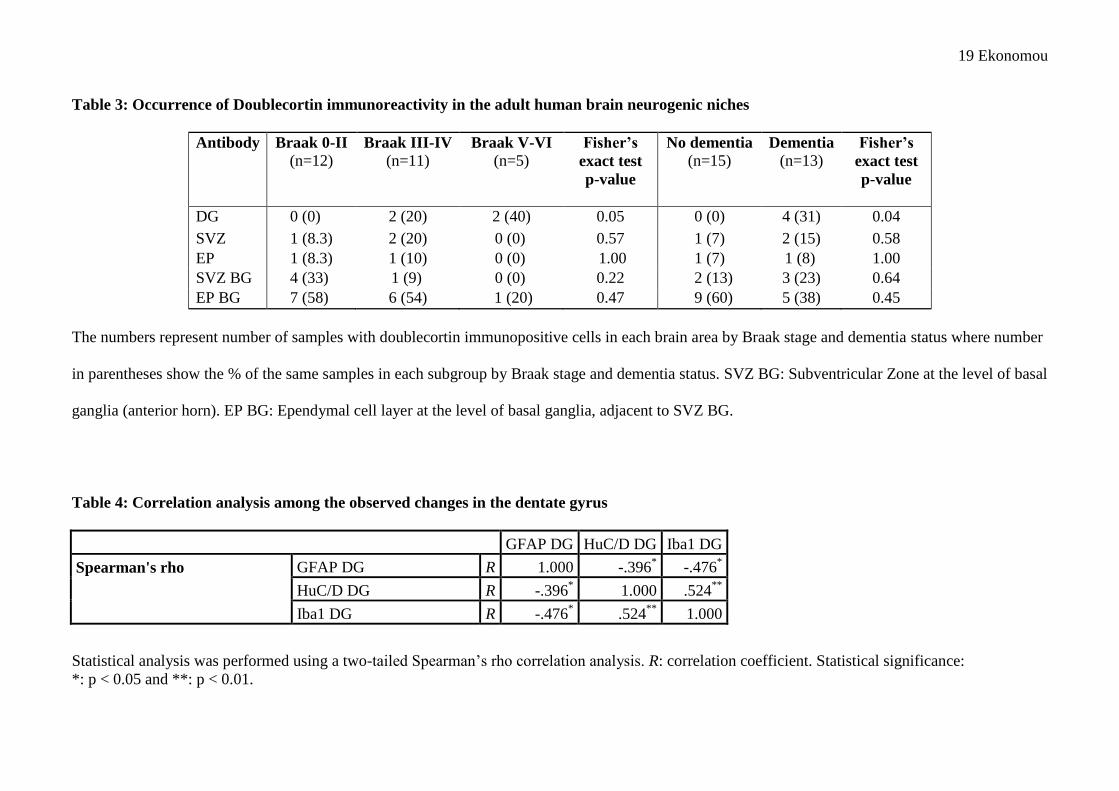
was performed, as described in Methods and Materials section. Table 3 shows the proportion of 220
cases with doublecortin-immunopositive cells in each brain area examined, with some evidence that 221
10 Ekonomou
these are more commonly found in the DG of those with higher Braak stages (Fisher‟s exact test 222
p=0.05). All of the samples with doublecortin immunopositive cells in the DG were from 223
participants who died with dementia (table 3, Fisher‟s exact test p=0.04), however owing to small 224
numbers of samples and the large number of hypotheses considered these findings should be treated 225
with caution. 226
In order to examine potential correlations between the neurogenic and glial markers we performed 227
Spearman‟s correlation (rho) analysis. There was a significant positive association between newly-228
generated neurons and the activated microglia (R=0.52, p=0.005), but negatively associated with the 229
changes of astrocytic cell numbers (R=-.396, p=0.045) in the DG (Table 4). 230
231
SVZ and ependymal cell layer (anterior and temporal horn) 232
The neurogenic markers remained unchanged at the anterior (at the level of basal ganglia) and 233
temporal (at the level of hippocampus) horns of the SVZ and the ependymal cell layer adjacent to 234
those when analysed by Braak stage and by the presence of dementia (supplemental table S1 and 235
table 3). PCNA-HuC/D double and HuC/D single immunolabelled cells were not detected in these 236
areas. 237
The astrocytic and microglia markers also remained unchanged in the SVZ neurogenic niche and 238
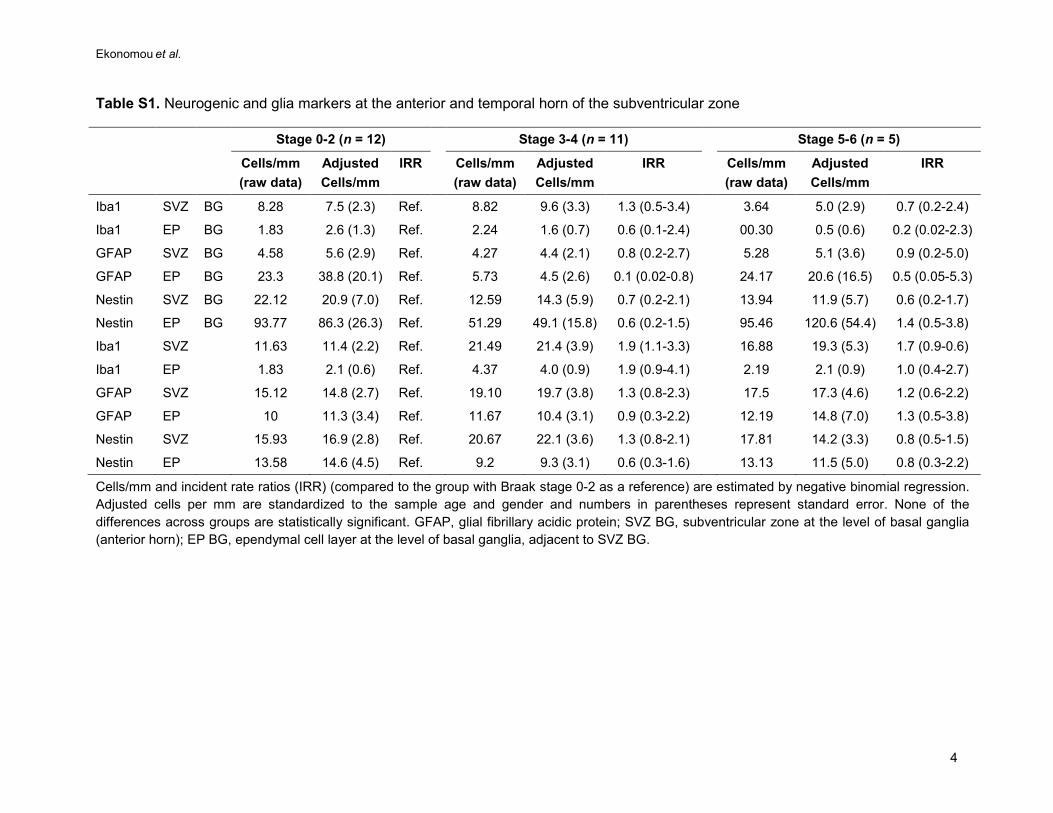
neighbouring ependymal cell layer in Braak stages 0 to VI (supplemental table S1). 239
240 Discussion 241
A detailed analysis of endogenous neurogenesis in both neurogenic niches at various stages of tau 242
pathology in 28 people with and without AD was undertaken from a representative community 243
cohort of patients followed to autopsy (MRC CFA Study). This is a population-based representative 244
pilot study of endogenous neurogenesis in AD using human autopsy tissue, and focuses on the full 245
range of pathological disease severity, the cognitive status and both neurogenic niches from each 246
individual, compared to our previous studies (18, 19). Furthermore, the study has the methodological 247
11 Ekonomou
advantage of excluding patients with concurrent cerebrovascular pathology, Lewy body disease and 248
any other pathology that have been found to affect adult endogenous neurogenesis (22-27, 40), as 249
opposed to previous studies of endogenous neurogenesis in AD (20, 21), including our previous 250
studies focussing on different patient cohorts (18, 19) where the percentage area of immunoreactivity 251
was measured rather than number of immunopositive cells. 252
There were limited but statistically significant changes in one of the markers used in this study in 253
individuals with dementia or at the different Braak stages. Specifically, we observed a significant 254
reduction in newly generated neurons, as determined by single HuC/D immunohistochemistry, but 255
not neural progenitors as determined by nestin, doublecortin and double PCNA-HuC/D 256
immunolabelling in people with severe tau pathology (Braak stage V and VI), compared to those 257
with no significant tau changes (Braak stage 0-II). Interestingly and consistent with other recent 258
studies about the role of microglia in modulating endogenous neurogenesis, there was a significant 259
relationship with activated microglia. 260
There were no changes in neural stem cells or progenitors in the anterior and temporal horn of the 261
SVZ, which is in contrast with the increased numbers of neural stem cells and progenitors observed 262
in the SVZ of patients suffering from stroke, vascular dementia, dementia with Lewy bodies and 263
small vessel disease, as our previous studies have shown (22, 23, 26, 27, 40). Markers of 264
neurogenesis did not vary between those with and without dementia after adjusting for Braak stage, 265
thus the reduced numbers of new neurons were specifically associated wih the severe Alzheimer 266
pathology. 267
Earlier studies examining endogenous neurogenesis in the course of AD have produced conflicting 268
results, possibly because of the predominant focus on more severe AD, variable concurrent vascular 269
changes and the limited focus on the later stages of neurogenesis, i.e. the newly-generated neurons. 270
The only other study to examine early neurons, as well as progenitors, reported a significant 271
12 Ekonomou
reduction on their maturation as marked by the the decreased levels of MAP2a and MAP2b isoforms 272
in the DG of AD patients (20), consistent with our current findings. 273
The present study exhibits some limitations, mainly due to methodology. As there are no reliable 274
and/or applicable markers to “visualise” and follow the fate of neural stem cells in the adult brain, it 275
is impossible to draw any conclusions about adult endogenous neurogenesis during the lifespan of 276
the participants in the study, so all our results represent adult neural stem cells and their progeny at a 277
single time point, that of autopsy. Optimistically, the development of new technologies will 278
facilitate this and clarify more the role of adult neurogenesis and its incolvement in cognitive decline 279
in ageing and AD. 280
As exclusion criteria were applied to the cases in reference to the presence of other 281
neurodegenerative diseases, our sample was modest (n=28), but it was a population-representative it 282
is pilot study of endogenous neurogenesis focussing upon “pure” AD in human autopsy tissue, 283
including individuals with different stages of AD pathology. 284
The use of antibodies as markers of endogenous neurogenesis on human autopsy tissue represents a 285
challenge, but we employed a validated battery of antibodies for the identification of progenitors and 286
newly-developed neurons at the various stages of neurogenesis in human autopsy tissue. Long post-287
mortem delay, quite common factor for obtaining human tissue, has been shown to alter but not 288
eliminate the immunostaining pattern for doublecortin, with similar overall levels of staining but 289
reduced staining within the soma. For example, Boekhoorn et al. (2006) have shown that post 290
mortem delay reduced immunoreactivity within the dendrites of doublecortin-positive neuroblasts 291
(21). A similar pattern was seen for doublecortin in our study, but importanly the changes in the 292
overall pattern of staining by dementia stage were similar for other markers of neuroblasts/immature 293
neurons (HuC/D with PCNA). As it has been suggested that DCX can also be expressed in astrocytes 294
(39) and in dormant cells in non neurogenic areas (41, 42), the use of HuC/D as an additional 295
marker for neuronal progenitors/early neurons is important and limits the possibility of over-296
13 Ekonomou
interpreting results obtained from DCX immunohistochemistry. In addition, post-mortem delay was 297
not significantly correlated with the overall level of staining. Many hypotheses were explored and 298
when a correction was applied to ensure a false discovery rate of less than 0.05 only the changes 299
detected in the numbers of GFAP-immunopositive cells in the DG remained still statistically 300
significant across groups. 301
As there is an age-related decline in neurogenesis observed also in humans (43), our estimates have 302
also been adjusted for age, which further confirms the validity of our results. Physical activity and 303
certain pharmacological treatments such as SSRIs (for a review see 16, 17 and references therein) 304
can have an impact on neurogenesis in rodent models (44-51 and for a review 16, 17). These were 305
not specifically examined in the current study, but it is unlikely that the magnitude of these effects 306
would be sufficient to confound the analysis. 307
The PCNA immunohistochemistry (Figure 1B) also revealed a number of cells that are not co-308
expressing the neuronal fate marker HuC/D (green only cells in figure 1B). Although these cells 309
were not counted for the study, we can speculate that they could represent astrocytic, microglial, or 310
endothelial cell proliferating progenitors or cells re-entering the cell cycle according to Yang et al. 311
(2003) (52), although that was not observed in the DG. 312
Our results still showed some evidence that although the early stages of endogenous neurogenesis 313
remained unchanged throughout the different Braak stages, severe AD pathology had a detrimental 314
effect on the numbers of newly-generated neurons in the DG of the affected individuals. In contrast, 315
endogenous neurogenesis at all stages and areas remained unchanged in individuals with dementia 316
compared to people without, suggesting that severe AD pathology impaired only the production of 317
new neurons. 318
We used Braak staging, a neurofibrillary tangle-based staging system, to describe the overall severity 319
of AD. Amyloid and tau pathology both increase with increasing disease severity, and many other 320
concurrent pathways related to a broad range of changes including inflammation and mitochondrial 321
14 Ekonomou
function are activated. The specific mechanisms associated with the reduced production of new 322
neurones in people with severe AD are therefore difficult to unravel from the results of the current 323
study. Previous work has however suggested that tau transgenic mice (29, 53) do have reduced 324
neurogenesis, supporting the potential role of tau pathology as a contributor to this effect. 325
There was a significant positive correlation between the cell numbers of activated microglia and 326
those of the newly-generated neurons in the DG, suggesting that the reduction in activated microglia 327
in people with Braak stage V- VI tangle pathology may be a key driver for the decline in the newly-328
produced neurons in these individuals, along with the presence of tangles. Microglia have an 329
important role in adult neurogenesis in the healthy brain, as it has been demonstrated to control the 330
numbers of newly-produced neuron in the hippocampus through apoptosis (54) and can have both 331
pro- and anti- neurogenic effects, finely “tuning” adult neurogenesis (for a review see 55). 332
For the first time, changes in GFAP-positive astrocytes have been examined at the various Braak 333
stages. Though we have no knowledge of the causal factors of these changes, one can hypothesize 334
that as astrocytes have a significant role in the support and protection of neurons in the healthy brain, 335
the decrease identified at Braak stage III-IV, below the levels seen in individuals with Braak stage 0-336
II, could be another contributing factor to the disease progression and pathology. The two-fold 337
increase above the levels observed in the healthy brain in astrocytes numbers in the Braak stage V-VI 338
could have a detrimental effect on the diseased brain, as it has been described for certain 339
neurodegenerative diseases, including dementia (for a review see 56). A separate study further 340
investigating this hypothesis could clarify that observation and the underlying mechanism(s). 341
Our study examined the fate of neuronal progenitors and their progeny at the DG and the anterior 342
and temporal horn SVZ and adjacent ependymal layers in various stages of AD, without any effect 343
from concurrent cerebrovascular or other neuropathology, and showed that specific and significant 344
reductions in newly-generated neurons were detected only in the DG of those with severe AD 345
pathology, and were associated to the microglial load of the area. Previous studies (57-59) 346
15 Ekonomou
identifying that abnormal endogenous neurogenesis relates to age-related learning impairment have 347
indicated that the manipulation of endogenous neurogenesis may be a potential treatment target in 348
people with AD. As a cross-sectional autopsy study, our results have to be interpreted cautiously, 349
but our findings do support the concept for an enhancement of aspects of endogenous neurogenesis, 350
as a possible treatment target in AD. 351
352
Acknowledgements 353
The authors would like to thank Mr Carl Hobbs and Dr David Howlett at the Wolfson Centre for 354
Age-Related Diseases, King‟s College London for technical assistance and advice with aspects of the 355
immunohistochemical procedures. This study was supported by Research Into Ageing-Age UK 356
through a Research Fellowship to A.E (Grant ref. no. 309). The CFAS study is supported by the 357
Department of Health and the Medical Research Council (grants MRC/G9901400 and MRC 358
U.1052.00.0013); the UKNIHR Biomedical Research Centre for Ageing and Age - related Disease 359
Award to the Newcastle up Tyne Hospitals Foundation Trust; the Cambridge Brain Bank is 360
supported by the NIHR Cambridge Biomedical Research Centre; The Cambridgeshire and 361
Peterborough NIHR CLAHRC; Nottingham University Hospitals NHS Trust; University of Sheffield 362
and the Sheffield Teaching Hospitals NHS Foundation Trust; The Thomas Willis Oxford Brain 363
Collection, supported by the Oxford Biomedical Research Centre; The Walton Centre NHS 364
Foundation Trust, Liverpool; and Brains for Dementia Research. . C.G.B. and P.T.F. would like to 365
thank the National Institute for Health Research (NIHR) Mental Health Biomedical Research Centre 366
and Dementia Unit at South London and Maudsley NHS Foundation Trust and [Institute of 367
Psychiatry] King‟s College London. We would like to acknowledge the essential contribution of the 368
liaison officers, the general practitioners, their staff, and nursing and residential home staff. We are 369
grateful to our respondents and their families for their generous gift to medical research, which has 370
made this study possible. 371

16 Ekonomou
372
Corporate CFAS authorship: Professor Carol Brayne (University of Cambridge); Dr. Thais Minett 373
(University of Cambridge); Dr. Fiona Matthews (University of Cambridge); Sally Hunter (University 374
of Cambridge), Dr Tuomo Polvikoski (Newcastle University); Professor Paul Ince (University of 375
Sheffield); Professor Steve Wharton (University of Sheffield); Gill Forster (University of Sheffield); 376
Dr. Cherie McCracken (University of Liverpool); Simon Harrison (Exeter); Dr. Hannah Keage 377
(University of South Australia). 378
379
380
Financial Disclosures 381
Within the last three years, Prof. Clive Ballard has received research grants from Lundbeck 382
pharmaceutical company and fees for consultancy or speaking from Lundbeck, Acadia, Bristol-Myer 383
Squibb, Bial and Novartis pharmaceutical companies. None of this work is however directly relevant 384
to the submitted manuscript. Within the last three years, Prof. Paul Francis has received research 385
grants from Lundbeck pharmaceutical company and fees for consultancy or speaking from Lundbeck 386
and Novartis pharmaceutical companies. He has also received payment related to expert witness 387
testimony related to cases involving Novartis and Janssen Alzheimer Immunotherapy. None of this 388
work is however directly relevant to the submitted manuscript. 389
All other authors report no biomedical financial interests or potential conflicts of interest. 390
391
17 Ekonomou
Table 1: Demographic data for the cases used in the present study 392
Braak stage
0-II III-IV V-VI
Age (years) ± SD
Gender
Dementia
Gender
PM delay in hours median
(IQR)
n=12
80.3±8.4
Female: 5; Male: 7
n=3
Female: 2; Male: 1
17.5 (12-28)
n=11
88.9±8.2
Female: 8; Male: 3
n=5
Female: 4; Male: 1
25 (7-27)
n=5
86.8±5.3
Female: 1; Male: 4
n=5
Female: 1; Male: 4
17.5 (9.5-33)
393
Data represent the mean or median in each group. SD: standard deviation, PM delay: Post-mortem 394
delay, IQR: InterQuartile Range.395
18 Ekonomou
Table 2: Cell numbers and area lengths (mm) for the neurogenic markers in the human dentate gyrus by study diagnosis of dementia at death.
Antibody No dementia (n=15) Dementia (n=13)
Cells/mm Adjusted IRR (raw data) Cells/mm
Cells/mm Adjusted IRR (raw data) Cells/mm
Nestin 0.094 0.13 (0.08) Ref. 0.10 0.09 (0.05) 0.7 (0.1-4.0)
HuC/D-PCNA 0.88 1.0 (0.3) Ref. 0.61 0.6 (0.2) 0.6 (0.2-1.6)
HuC/D 0.74 0.6 (0.1) Ref. 0.73 1.3 (0.4) * 2.1 (1.0-4.3)
GFAP 4.79 5.2 (0.7) Ref. 2.46 4.9 (0.5) 0.9 (0.7-1.4)
Iba1 7.82 7.3 (1.9) Ref. 5.57 7.0 (2.2) 1.0 (0.4-2.3)
Rates and incident rate ratios for the difference in cell density in the dementia group compared to the no dementia group are estimated by negative
binomial regression, adjusted for Braak stage. Cells per mm are standardised to the sample age and gender and numbers in parentheses represent
standard error; IRR = Incidence rate ratio adjusted for age and gender, numbers in parentheses represent 95% confidence interval.*: p=0.045.
19 Ekonomou
Table 3: Occurrence of Doublecortin immunoreactivity in the adult human brain neurogenic niches
Antibody Braak 0-II (n=12)
Braak III-IV (n=11)
Braak V-VI (n=5)
Fisher’s
exact test p-value
No dementia (n=15)
Dementia (n=13)
Fisher’s
exact test p-value
DG 0 (0) 2 (20) 2 (40) 0.05 0 (0) 4 (31) 0.04 SVZ 1 (8.3) 2 (20) 0 (0) 0.57 1 (7) 2 (15) 0.58 EP 1 (8.3) 1 (10) 0 (0) 1.00 1 (7) 1 (8) 1.00 SVZ BG 4 (33) 1 (9) 0 (0) 0.22 2 (13) 3 (23) 0.64 EP BG 7 (58) 6 (54) 1 (20) 0.47 9 (60) 5 (38) 0.45
The numbers represent number of samples with doublecortin immunopositive cells in each brain area by Braak stage and dementia status where number
in parentheses show the % of the same samples in each subgroup by Braak stage and dementia status. SVZ BG: Subventricular Zone at the level of basal
ganglia (anterior horn). EP BG: Ependymal cell layer at the level of basal ganglia, adjacent to SVZ BG.
Table 4: Correlation analysis among the observed changes in the dentate gyrus
GFAP DG HuC/D DG Iba1 DG
Spearman's rho GFAP DG R 1.000 -.396* -.476*
HuC/D DG R -.396* 1.000 .524**
Iba1 DG R -.476* .524** 1.000
Statistical analysis was performed using a two-tailed Spearman‟s rho correlation analysis. R: correlation coefficient. Statistical significance: *: p < 0.05 and **: p < 0.01.
20 Ekonomou
References
1. Alzheimer‟s Disease International: World Alzheimer report 2009.
http://www.alz.co.uk/research/world-report.
2. Lois C, Garcia-Verdugo JM , Alvarez-Buylla A (1996): Chain migration of neuronal
precursors. Science 271: 978-981.
3. Doetsch F, Garcia-Verdugo JM , Alvarez-Buylla A (1997): Cellular composition and three-
dimensional organization of the subventricular germinal zone in the adult mammalian brain. J
Neurosci 17: 5046-5061.
4. Palmer TD, Takahashi J , Gage FH (1997): The adult rat hippocampus contains primordial
neural stem cells. Mol Cell Neurosci 8: 389-404.
5. Ma DK, Bonaguidi MA, Ming GL , Song H (2009): Adult neural stem cells in the
mammalian central nervous system. Cell Res 19: 672-682.
6. Rochefort C, Gheusi G, Vincent JD , Lledo PM (2002): Enriched odor exposure increases the
number of newborn neurons in the adult olfactory bulb and improves odor memory. J
Neurosci 22: 2679-2689.
7. Magavi SS, Mitchell BD, Szentirmai O, Carter BS , Macklis JD (2005): Adult-born and
preexisting olfactory granule neurons undergo distinct experience-dependent modifications of
their olfactory responses in vivo. J Neurosci 25: 10729-10739.
8. Imayoshi I, Sakamoto M, Ohtsuka T, Takao K, Miyakawa T, Yamaguchi M, et al. (2008):
Roles of continuous neurogenesis in the structural and functional integrity of the adult
forebrain. Nat Neurosci 11: 1153-1161.
9. Ge S, Yang CH, Hsu KS, Ming GL , Song H (2007): A critical period for enhanced synaptic
plasticity in newly generated neurons of the adult brain. Neuron 54: 559-566.
21 Ekonomou
10. Kee N, Teixeira CM, Wang AH , Frankland PW (2007): Preferential incorporation of adult-
generated granule cells into spatial memory networks in the dentate gyrus. Nat Neurosci. 10:
355-362.
11. Tashiro A, Makino H , Gage FH (2007): Experience-specific functional modification of the
dentate gyrus through adult neurogenesis: a critical period during an immature stage. J
Neurosci. 27: 3252-3259.
12. Eriksson PS, Perfilieva E, Bjork-Eriksson T, Alborn AM, Nordborg C, Peterson DA et al.
(1998): Neurogenesis in the adult human hippocampus. Nat Med 4: 1313-1317.
13. Sanai N, Tramontin AD, Quinones-Hinojosa A, Barbaro NM, Gupta N, Kunwar S, et al.
(2004): Unique astrocyte ribbon in adult human brain contains neural stem cells but lacks
chain migration. Nature 427: 740-744.
14. Quinones-Hinojosa A, Sanai N, Soriano-Navarro M, Gonzalez-Perez O, Mirzadeh Z, Gil-
Perotin S, et al. (2006): Cellular composition and cytoarchitecture of the adult human
subventricular zone: a niche of neural stem cells. J Comp Neurol 494: 415-434.
15. Curtis MA, Kam M, Nannmark U, Anderson MF, Axell MZ, Wikkelso C, et al. (2007):
Human neuroblasts migrate to the olfactory bulb via a lateral ventricular extension. Science
315: 1243-1249.
16. Abrous DN, Koehl M , Le Moal M (2005): Adult neurogenesis: from precursors to network
and physiology. Physiol Rev 85: 523-569.
17. Vaidya VA, Vadodaria KC, Jha S (2007): Neurotransmitter regulation of adult neurogenesis:
putative therapeutic targets. CNS Neurol Disord Drug Targets 6(5): 358-74.
18. Ziabreva I, Perry E, Perry R, Minger SL, Ekonomou A, Przyborski S , Ballard C (2006):
Altered neurogenesis in Alzheimer's disease. J Psychosom Res 61: 311-316.
22 Ekonomou
19. Perry EK, Johnson M, Ekonomou A, Perry RH, Ballard C, Attems J (2012): Neurogenic
abnormalities in Alzheimer's disease differ between stages of neurogenesis and are partly
related to cholinergic pathology Neurobiol Dis 47(2): 155-162.
20. Li B, Yamamori H, Tatebayashi Y, Shafit-Zagardo B, Tanimukai H, Chen S, et al. (2008):
Failure of neuronal maturation in Alzheimer disease dentate gyrus. J Neuropathol Exp Neurol
67: 78-84.
21. Boekhoorn K, Joels M , Lucassen PJ (2006): Increased proliferation reflects glial and
vascular-associated changes, but not neurogenesis in the presenile Alzheimer hippocampus.
Neurobiol Dis 24: 1-14.
22. Ekonomou A, Ballard CG, Pathmanaban ON, Perry RH, Perry EK, Kalaria RN , Minger SL
(2011): Increased neural progenitors in vascular dementia. Neurobiol Aging 32: 2152-2161.
23. Ekonomou A, Johnson M, Perry RH, Perry EK, Kalaria RN, Minger SL, Ballard CG (2012):
Increased neural progenitors in individuals with cerebral small vessel disease. Neuropathol
Appl Neurobiol 38(4): 344-353.
24. Jin K, Wang X, Xie L, Mao XO, Zhu W, Wang Y, et al. (2006): Evidence for stroke-induced
neurogenesis in the human brain. Proc Natl Acad Sci USA 103: 13198-13202.
25. Macas J, Nern C, Plate KH , Momma S (2006): Increased generation of neuronal progenitors
after ischemic injury in the aged adult human forebrain. J Neurosci 26: 13114-13119.
26. Minger SL, Ekonomou A, Carta EM, Chinoy A, Perry RH , Ballard CG (2007): Endogenous
neurogenesis in the human brain following cerebral infarction. Regen Med 2: 69-74.
27. Johnson M, Ekonomou A, Hobbs C, Ballard CG, Perry RH , Perry EK (2011): Neurogenic
marker abnormalities in the hippocampus in dementia with Lewy bodies. Hippocampus 21:
1126-1136.
23 Ekonomou
28. Demars M, Hu YS, Gadadhar A , Lazarov O (2010): Impaired neurogenesis is an early event
in the etiology of familial Alzheimer's disease in transgenic mice. J Neurosci Res 88: 2103-
2117.
29. Hamilton LK, Aumont A, Julien C, Vadnais A, Calon F , Fernandes KJ (2010): Widespread
deficits in adult neurogenesis precede plaque and tangle formation in the 3xTg mouse model
of Alzheimer's disease. Eur J Neurosci 32: 905-920.
30. Jin K, Galvan V, Xie L, Mao XO, Gorostiza OF, Bredesen DE , Greenberg DA (2004):
Enhanced neurogenesis in Alzheimer's disease transgenic (PDGF-APPSw,Ind) mice. Proc
Natl Acad Sci U S A 101: 13363-13367.
31. Wen PH, Hof PR, Chen X, Gluck K, Austin G, Younkin SG, et al. (2004): The presenilin-1
familial Alzheimer disease mutant P117L impairs neurogenesis in the hippocampus of adult
mice. Exp Neurol 188: 224-237.
32. Ermini FV, Grathwohl S, Radde R, Yamaguchi M, Staufenbiel M, Palmer TD, Jucker M
(2008): Neurogenesis and alterations of neural stem cells in mouse models of cerebral
amyloidosis. Am J Pathol 172: 1520-1528.
33. Brayne C, McCracken C, Matthews FE (2006): Cohort profile: the Medical Research Council
Cognitive Function and Ageing Study (CFAS). Int J Epidemiol 35: 1140-1145.
34. Matthews FE, Brayne C, Lowe J, McKeith I, Wharton SB , Ince P (2009): Epidemiological
pathology of dementia: attributable-risks at death in the Medical Research Council Cognitive
Function and Ageing Study. PLoS Med 6: e1000180.
35. Braak, H. and Braak, E. (1991): "Neuropathological stageing of Alzheimer-related changes".
Acta Neuropathol 82 (4): 239–59.
36. Braak H, Alafuzoff I, Arzberger T, Kretzschmanr H, Del Tredici K. (2006): Staging of
Alzheimer disease-associated neurofibrillary pathology using paraffin sections and
immunohistochemistry. Acta Neuropathol 112: 389–404.
24 Ekonomou
37. Savva GM, Wharton SB, Ince PG, Forster G, Matthews FE, Brayne C; Medical Research
Council Cognitive Function and Ageing Study (2009): Age, neuropathology and dementia. N
Engl J Med 360(22): 2302-2309.
38. Benjamini Y and Hochberg Y (1995): Controlling the false discovery rate: A practical and
powerful approach to multiple testing. Journal of the Royal Statistical Society, Series B, 57:
289-300.
39. Verwer RW, Sluiter AA, Balesar RA, Baayen JC, Noske DP, Dirven CM, et al. (2007):
Mature astrocytes in the adult human neocortex express the early neuronal marker
doublecortin. Brain. 130(Pt 12):3321-35.
40. Ziabreva I, Ballard C, Johnson M, Larsen JP, McKeith I, Perry R, et al. (2007): Loss of
Musashi1 in Lewy body dementia associated with cholinergic deficit. Neuropathol Appl
Neurobiol 33(5): 586-590.
41. Kremer T, Jagasia R, Herrmann A, Matile H, Borroni E, Francis F, et al., (2013): Analysis of
adult neurogenesis: evidence for a prominent "non-neurogenic" DCX-protein pool in rodent
brain. PLoS One, 8(5):e59269
42. Martí-Mengual U, Varea E, Crespo C, Blasco-Ibáñez JM, Nacher J. (2013): Cells expressing
markers of immature neurons in the amygdala of adult humans. Eur J Neurosci. 37(1):10-22.
43. Kempermann G, Gast D, Gage FH (2002): Neuroplasticity in old age: sustained fivefold
induction of hippocampal neurogenesis by long-term environmental enrichment. Ann Neurol
52(2): 135-43.
44. van Praag H, Shubert T, Zhao C, Gage FH. (2005): Exercise enhances learning and
hippocampal neurogenesis in aged mice. J Neurosci. 25(38): 8680-5.
45. Leem YH, Lim HJ, Shim SB, Cho JY, Kim BS, Han PL (2009): Repression of tau
hyperphosphorylation by chronic endurance exercise in aged transgenic mouse model of
tauopathies. J Neurosci Res. 87(11): 2561-70.
25 Ekonomou
46. Marlatt MW and Lucassen PJ (2010): Neurogenesis and Alzheimer's disease: Biology and
pathophysiology in mice and men. Curr Alzheimer Res 7(2): 113-25.
47. Belarbi K, Burnouf S, Fernandez-Gomez FJ, Laurent C, Lestavel S, Figeac M, et al. (2011):
Beneficial effects of exercise in a transgenic mouse model of Alzheimer's disease-like Tau
pathology. Neurobiol Dis 43(2): 486-94.
48. García-Mesa Y, López-Ramos JC, Giménez-Llort L, Revilla S, Guerra R, Gruart A, Laferla
FM, et al. (2011): Physical exercise protects against Alzheimer's disease in 3xTg-AD mice. J
Alzheimers Dis 24(3): 421-54.
49. Marlatt MW, Potter MC, Lucassen PJ, van Praag H (2012): Running throughout middle-age
improves memory function, hippocampal neurogenesis, and BDNF levels in female
C57BL/6J mice. Dev Neurobiol. 72(6): 943-52.
50. Marlatt MW, Potter MC, Bayer TA, van Praag H, Lucassen PJ. (2013): Prolonged running,
not fluoxetine treatment, increases neurogenesis, but does not alter neuropathology, in the
3xTg mouse model of Alzheimer's disease. Curr Top Behav Neurosci. 15:313-40.
51. Voss MW, Vivar C, Kramer AF, van Praag H. (2013): Bridging animal and human models of
exercise-induced brain plasticity. Trends Cogn Sci., 17(10): 525-44.
52. Yang Y, Mufson EJ, Herrup K (2003): Neuronal cell death is preceded by cell cycle events at
all stages of Alzheimer's disease. J Neurosci. 23(7):2557-63.
53. Hong XP, Peng CX, Wei W, Tian Q, Liu YH, Yao XQ, Zhang Y, Cao FY, Wang Q, Wang
JZ (2010): Essential role of tau phosphorylation in adult hippocampal neurogenesis.
Hippocampus 20(12):1339-49.
54. Sierra A, Encinas JM, Deudero JJ, Chancey JH, Enikolopov G, Overstreet-Wadiche LS, et al.
(2010): Microglia shape adult hippocampal neurogenesis through apoptosis-coupled
phagocytosis. Cell Stem Cell. 7: 483-495.
26 Ekonomou
55. Ekdahl CT (2012): Microglial activation - tuning and pruning adult neurogenesis. Front
Pharmacol 3: 411-419.
56. Verkhratsky A, Olabarria M, Noristani HN, Yeh CY and Rodriguez JJ (2012): Astrocytes in
Alzheimer's disease. Neurotherapeutics. 7(4): 399-412.
57. Nyffeler M, Yee BK, Feldon J, Knuesel I. (2010): Abnormal differentiation of newborn
granule cells in age-related working memory impairments. Neurobiol Aging. 31(11): 1956-
74.
58. Kim SE, Ko IG, Kim BK, Shin MS, Cho S, Kim CJ, et al. (2010): Treadmill exercise
prevents aging-induced failure of memory through an increase in neurogenesis and
suppression of apoptosis in rat hippocampus. Exp. Gerontol. 45(5): 357-65.
59. Déry N, Pilgrim M, Gibala M, Gillen J, Wojtowicz JM, Macqueen G, Becker S. (2013):
Adult hippocampal neurogenesis reduces memory interference in humans: opposing effects
of aerobic exercise and depression. Front Neurosci. 7: 66.
27 Ekonomou
Figure legends
Figure 1: Immunohistochemistry showing neurogenesis in the dentate gurus (DG) and the
subventricular zone (SVZ) of the adult human brain. A: DAB immunohistochemistry for nestin (top
left, arrows) and doublecortin (top right, arrow) depicting neural stem cell/progenitors and late neural
progenitors, respectively in both neurogenic niches. Scale bar: 5um. B: Double immunofluorescence
for HuC/D (red) and PCNA (green) in severe AD patients (Braak stage V-VI) and their age-matched
controls (Braak stage 0-II). There are significantly less postmitotic immature neurons (arrows,
HuC/D-immunopositive cells) in the DG of severe AD patients compared to their age-matched
controls. Yellow arrowheads indicate proliferating neuronal progenitors/neuroblasts immunopositive
for both PCNA (a proliferating marker) and the HuC/D antigen. Images i and ii show higher
magnification of double labelled cells at Braak stage 0-II and V-VI, respectively. Scale bar: 20um.
C: Schematic representation of the markers used for the characterization of the different stages of
neurogenesis in the present study. Gr: dentate gyrus granular layer, h: hilus, LV: lateral ventricle,
Ep: Ependymal cell layer.
Figure 2: Graph bars represent the adjusted mean number (±standard error) of immunopositive cells
per mm of length of dentate gyrus for neurogenic (A) and glial (B) markers in AD patients at
different Braak stages, adjusted for age and dementia status. *: p<0.05, **: p<0.001.
Figure 3: Immunofluorescence for astrocytes (GFAP) and microglia (Iba1) in age-matched
individuals at Braak stage 0-II and patients with moderate (Braak stage III-IV) and severe (Braak
stage V-VI) tangle pathology. DG: dentate gyrus, h: hilus. Scale bar: 50m.
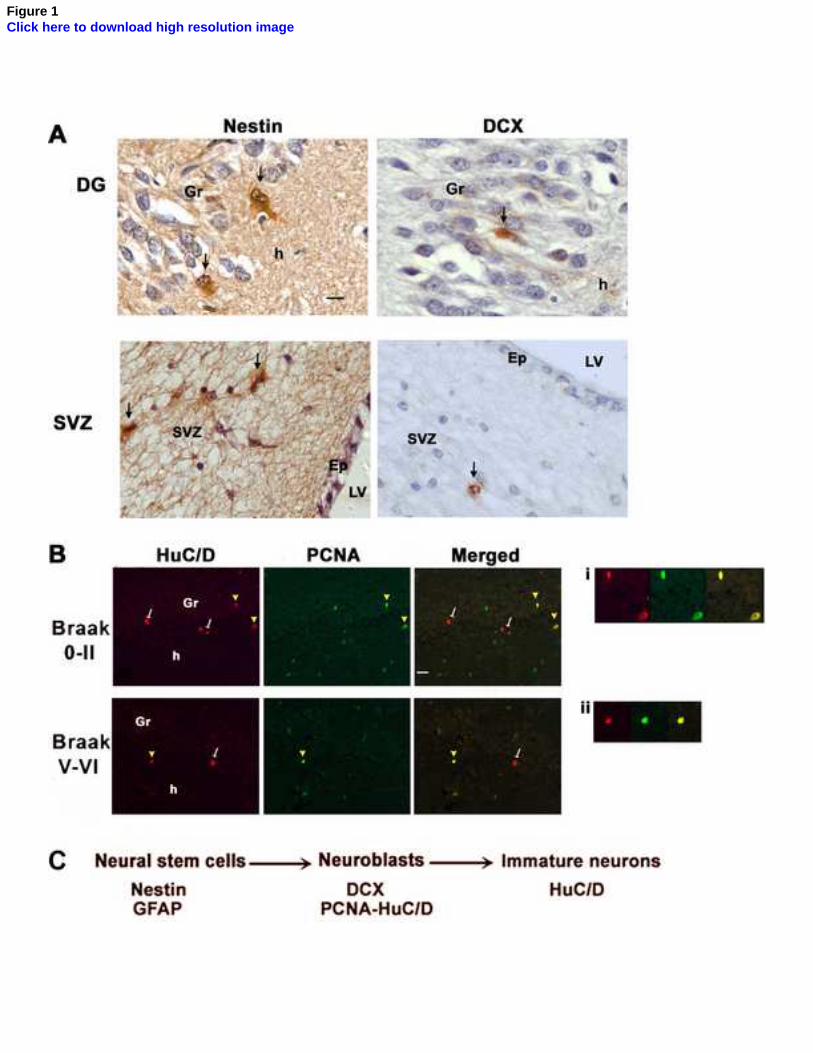
Figure 1Click here to download high resolution image
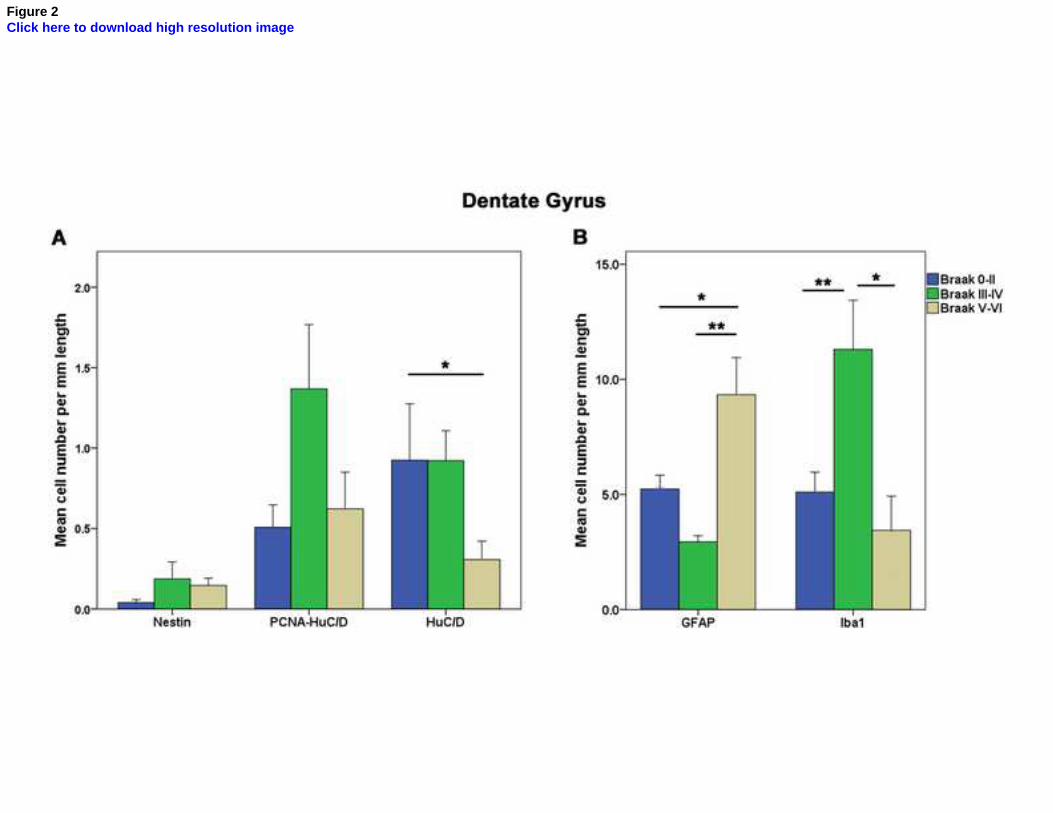
Figure 2Click here to download high resolution image
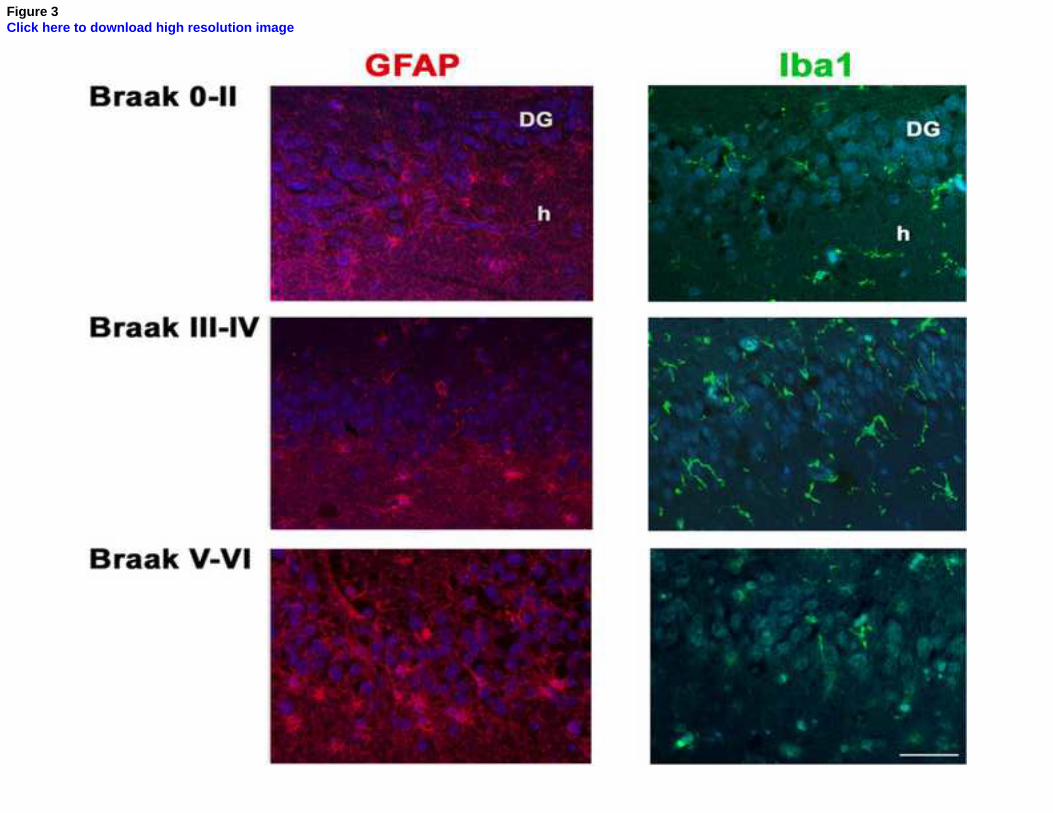
Figure 3Click here to download high resolution image
Ekonomou et al.
1
Stage-Specific Changes in Neurogenic and Glial Markers in Alzheimer’s Disease
Supplemental Information
Supplementary Materials and Methods
Immunohistochemistry
After deparaffinization, rehydration and microwave pressure cooking antigen retrieval
using 10 mM citrate buffer, pH 6, slides were processed for immunohistochemistry using DAB
staining and double immunofluorescence. A validated battery of antibodies was used in order to
identify the type of neural stem cells and progenitors as marked by nestin (1/200, Chemicon) (1)
and doublecortin (1/200, Santa Cruz) (2) and immature neurons (HuC/D, 1/1000, Invitrogen) (3).
In order to identify proliferating neuronal progenitors, double immunofluorescence was
performed with HuC/D and an antibody against the proliferating cell nuclear antigen (1/1000,
DAKO). Astrocytes were quantified using an antibody against glial fibrillary acidic protein
(GFAP, 1/6000, Dako), which also marks adult neural stem cells. Although all GFAP-positive
cells are astrocytes, only some of them are the adult neural stem cells. Microglial cells were
labelled using the Iba1 antibody (1/1500, Wako, Japan). Counterstaining was performed using
either haematoxylin (DAB staining) or Hoescht33258 (immunofluorescence). The endogenous
lipofuscin autofluorescence was removed by a 10-minute incubation of the sections in a 0.5%
Sudan Black B (SIGMA, UK) in 70% methanol solution, as previously described (4). Adjacent
sections were incubated in the absence of the primary or secondary antibodies in order to
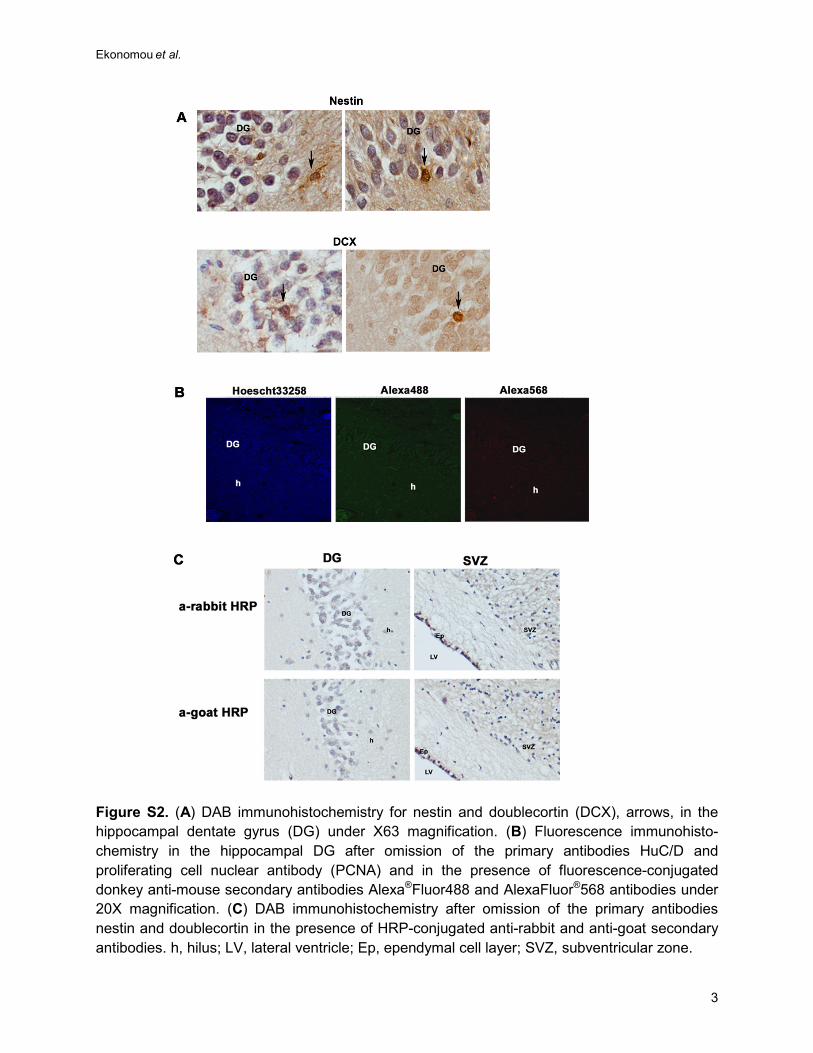
determine non-specific antibody binding, and they were devoid of immunoreactivity (Figure S2B
and S2C).
Supplemental InformationClick here to download Supplemental Information: Supplement_Ekonomou et al.pdf
Ekonomou et al.
2
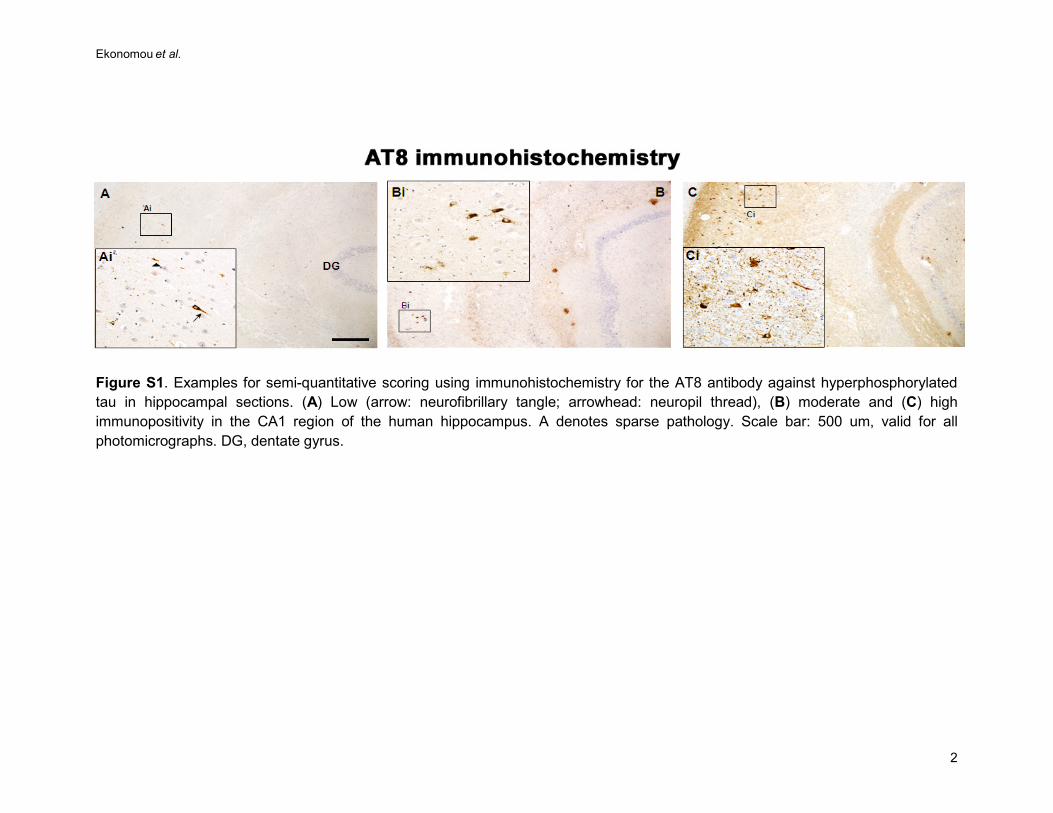
Figure S1. Examples for semi-quantitative scoring using immunohistochemistry for the AT8 antibody against hyperphosphorylated tau in hippocampal sections. (A) Low (arrow: neurofibrillary tangle; arrowhead: neuropil thread), (B) moderate and (C) high immunopositivity in the CA1 region of the human hippocampus. A denotes sparse pathology. Scale bar: 500 um, valid for all photomicrographs. DG, dentate gyrus.
Ekonomou et al.
3
Figure S2. (A) DAB immunohistochemistry for nestin and doublecortin (DCX), arrows, in the hippocampal dentate gyrus (DG) under X63 magnification. (B) Fluorescence immunohisto-chemistry in the hippocampal DG after omission of the primary antibodies HuC/D and proliferating cell nuclear antibody (PCNA) and in the presence of fluorescence-conjugated donkey anti-mouse secondary antibodies Alexa®Fluor488 and AlexaFluor®568 antibodies under 20X magnification. (C) DAB immunohistochemistry after omission of the primary antibodies nestin and doublecortin in the presence of HRP-conjugated anti-rabbit and anti-goat secondary antibodies. h, hilus; LV, lateral ventricle; Ep, ependymal cell layer; SVZ, subventricular zone.
Ekonomou et al.
4
Table S1. Neurogenic and glia markers at the anterior and temporal horn of the subventricular zone
Stage 0-2 (n = 12) Stage 3-4 (n = 11) Stage 5-6 (n = 5)
Cells/mm (raw data)
Adjusted Cells/mm
IRR Cells/mm (raw data)
Adjusted Cells/mm
IRR Cells/mm (raw data)
Adjusted Cells/mm
IRR
Iba1 SVZ BG 8.28 7.5 (2.3) Ref. 8.82 9.6 (3.3) 1.3 (0.5-3.4) 3.64 5.0 (2.9) 0.7 (0.2-2.4)
Iba1 EP BG 1.83 2.6 (1.3) Ref. 2.24 1.6 (0.7) 0.6 (0.1-2.4) 00.30 0.5 (0.6) 0.2 (0.02-2.3)
GFAP SVZ BG 4.58 5.6 (2.9) Ref. 4.27 4.4 (2.1) 0.8 (0.2-2.7) 5.28 5.1 (3.6) 0.9 (0.2-5.0)
GFAP EP BG 23.3 38.8 (20.1) Ref. 5.73 4.5 (2.6) 0.1 (0.02-0.8) 24.17 20.6 (16.5) 0.5 (0.05-5.3)
Nestin SVZ BG 22.12 20.9 (7.0) Ref. 12.59 14.3 (5.9) 0.7 (0.2-2.1) 13.94 11.9 (5.7) 0.6 (0.2-1.7)
Nestin EP BG 93.77 86.3 (26.3) Ref. 51.29 49.1 (15.8) 0.6 (0.2-1.5) 95.46 120.6 (54.4) 1.4 (0.5-3.8)
Iba1 SVZ
11.63 11.4 (2.2) Ref. 21.49 21.4 (3.9) 1.9 (1.1-3.3) 16.88 19.3 (5.3) 1.7 (0.9-0.6)
Iba1 EP
1.83 2.1 (0.6) Ref. 4.37 4.0 (0.9) 1.9 (0.9-4.1) 2.19 2.1 (0.9) 1.0 (0.4-2.7)
GFAP SVZ
15.12 14.8 (2.7) Ref. 19.10 19.7 (3.8) 1.3 (0.8-2.3) 17.5 17.3 (4.6) 1.2 (0.6-2.2)
GFAP EP
10 11.3 (3.4) Ref. 11.67 10.4 (3.1) 0.9 (0.3-2.2) 12.19 14.8 (7.0) 1.3 (0.5-3.8)
Nestin SVZ
15.93 16.9 (2.8) Ref. 20.67 22.1 (3.6) 1.3 (0.8-2.1) 17.81 14.2 (3.3) 0.8 (0.5-1.5)
Nestin EP
13.58 14.6 (4.5) Ref. 9.2 9.3 (3.1) 0.6 (0.3-1.6) 13.13 11.5 (5.0) 0.8 (0.3-2.2)
Cells/mm and incident rate ratios (IRR) (compared to the group with Braak stage 0-2 as a reference) are estimated by negative binomial regression. Adjusted cells per mm are standardized to the sample age and gender and numbers in parentheses represent standard error. None of the differences across groups are statistically significant. GFAP, glial fibrillary acidic protein; SVZ BG, subventricular zone at the level of basal ganglia (anterior horn); EP BG, ependymal cell layer at the level of basal ganglia, adjacent to SVZ BG.

Ekonomou et al.
5
Supplemental References
1. Lendahl U, Zimmerman LB, McKay RD (1990): CNS stem cells express a new class of intermediate filament protein. Cell 60: 585-595.
2. Brown JP, Couillard-Despres S, Cooper-Kuhn CM, Winkler J, Aigner L, Kuhn HG (2003):
Transient expression of doublecortin during adult neurogenesis. J Comp Neurol 467: 1-10. 3. Grandel H, Kaslin J, Ganz J, Wenzel I, Brand M (2006): Neural stem cells and neurogenesis
in the adult zebrafish brain: origin, proliferation dynamics, migration and cell fate. Dev Biol 295(1): 263-277.
4. Schnell SA, Staines WA, Wessendorf MW (1999): Reduction of lipofuscin-like
autofluorescence in fluorescently labeled tissue. J Histochem Cytochem 47: 719–730.
Copyright © 2022 FDOKUMEN