
Stage-specific adoption and maintenance of physical activity: testing a three-stage model
19
Stage-specific adoption and maintenance of physical activity: testing a three-stage model Sonia Lippke * , Jochen P. Ziegelmann, Ralf Schwarzer Health Psychology, Freie Universitaet Berlin, Habelschwerdter Allee 45, Berlin 14195, Germany Received 24 March 2004; accepted 20 November 2004 Available online 29 January 2005 Abstract Objectives: To examine a parsimonious three-stage model of health behavior change that makes a distinction between non-intenders, intenders, and actors in terms of physical activity. It was hypothesized that intention formation, action planning, and behavior change were at different levels in these three stages, and that these were differentially predicted by self-efficacy, outcome expectancies, and risk perception. Design: Longitudinal analyses with latent multi-group structural equation models using AMOS to test discontinuity patterns in latent means and associations of variables. Methods: To examine the discontinuity hypotheses, orthopedic out-patients were assessed at the beginning and the end of their rehabilitation as well as at 6-month follow-up (NZ423). Stages, self-efficacy, outcome expectancies, risk perception, intention, action planning, and behavior change were assessed in self-administered questionnaires. Results: In multi-group structural equation models, discontinuity patterns emerged. Differences in latent means, interrelations of social-cognitive predictors, and the amount of explained variance were found between the three stages. Self-efficacy was imperative for all groups of patients. Risk perception was important in intention formation for individuals who had no intention before. The intentional and the actional stages of behavior change were similar in terms of planning. Conclusions: The findings provided support for the usefulness of the three-stage distinction, and the stage-specific prediction of behavior change. To tailor interventions, one should assess stages and address stage-specific needs. q 2005 Elsevier Ltd. All rights reserved. Keywords: Physical exercise; Rehabilitation; Self-efficacy; Planning; Stage models; Discontinuity pattern; Multi-group structural equation modeling; Behavior change 1469-0292/$ - see front matter q 2005 Elsevier Ltd. All rights reserved. doi:10.1016/j.psychsport.2004.11.002 Psychology of Sport and Exercise 6 (2005) 585–603 www.elsevier.com/locate/psychsport * Corresponding author. Tel: C49 30 838 55619; fax: C49 30 838 55634. E-mail address: [email protected] (S. Lippke).
-
Upload
jacobs-university -
Category
Documents
-
view
0 -
download
0
Transcript of Stage-specific adoption and maintenance of physical activity: testing a three-stage model
Stage-specific adoption and maintenance of physical activity:
testing a three-stage model
Sonia Lippke*, Jochen P. Ziegelmann, Ralf Schwarzer
Health Psychology, Freie Universitaet Berlin, Habelschwerdter Allee 45, Berlin 14195, Germany
Received 24 March 2004; accepted 20 November 2004
Available online 29 January 2005
Abstract
Objectives: To examine a parsimonious three-stage model of health behavior change that makes a distinction
between non-intenders, intenders, and actors in terms of physical activity. It was hypothesized that intention
formation, action planning, and behavior change were at different levels in these three stages, and that these were
differentially predicted by self-efficacy, outcome expectancies, and risk perception.
Design: Longitudinal analyses with latent multi-group structural equation models using AMOS to test
discontinuity patterns in latent means and associations of variables.
Methods: To examine the discontinuity hypotheses, orthopedic out-patients were assessed at the beginning and
the end of their rehabilitation as well as at 6-month follow-up (NZ423). Stages, self-efficacy, outcome
expectancies, risk perception, intention, action planning, and behavior change were assessed in self-administered
questionnaires.
Results: In multi-group structural equation models, discontinuity patterns emerged. Differences in latent means,
interrelations of social-cognitive predictors, and the amount of explained variance were found between the three
stages. Self-efficacy was imperative for all groups of patients. Risk perception was important in intention
formation for individuals who had no intention before. The intentional and the actional stages of behavior change
were similar in terms of planning.
Conclusions: The findings provided support for the usefulness of the three-stage distinction, and the stage-specific
prediction of behavior change. To tailor interventions, one should assess stages and address stage-specific needs.
q 2005 Elsevier Ltd. All rights reserved.
Keywords: Physical exercise; Rehabilitation; Self-efficacy; Planning; Stage models; Discontinuity pattern; Multi-group
structural equation modeling; Behavior change
Psychology of Sport and Exercise 6 (2005) 585–603
www.elsevier.com/locate/psychsport1469-0292/$ - see front matter q 2005 Elsevier Ltd. All rights reserved.
doi:10.1016/j.psychsport.2004.11.002
* Corresponding author. Tel: C49 30 838 55619; fax: C49 30 838 55634.
E-mail address: [email protected] (S. Lippke).
S. Lippke et al. / Psychology of Sport and Exercise 6 (2005) 585–603586
Introduction
People may decide to be physically active because they become aware of the risk for their health due to
physical inactivity. Some individuals may translate their intentions into action, driven by different factors;
for example, they have planned precisely when to start the activity. Others, who have been physically
active before, may maintain their activity because they commit to their high intentions and plans, or they
relapse because they have not set the goal to maintain. Finally, those inactive persons who remain
undecided and sedentary may lack a firm belief in their competence to become active (Schwarzer, 2001).
These are examples of ‘stages’ and motives in the adoption and maintenance of physical activity. Two
classes of social-cognitive models have been developed and tested to explain and predict human
behavior: continuous models and stage models (Sutton, 2002). In the following, continuous and stage
models will be described, and a new approach for the investigation of stage models will be proposed and
empirically tested.
Linear continuous models to predict behavior change
In continuous models, individuals are placed along a continuum that reflects the likelihood of action.
Influential predictor variables are identified and combined in one equation. The assumption is that one
prediction equation meets all needs (‘one-size-fits-all’; Kreuter, Strecher, & Glasman, 1999). This single
theoretically or empirically derived equation places each person along a continuum. The goal of an
intervention is to move the individual along this continuum towards action. Thereby, quantitative
differences between persons are recognized but qualitative changes in the progress are not identified
(Weinstein, 1993). One assumption is, for example, that the higher an intention the more likely the
corresponding health behavior.
Continuous assumptions seem not to apply in every case (Kreuter et al., 1999). The adoption and
maintenance of a new behavior is too complex to be reflected by merely one decision continuum. The
initiation and maintenance processes might be different (Rothman, 2000). There might be more than a
single predicting rule, and the combination of continuous models with stage models represents one
approach to face these qualitative differences.
Stages of health behavior change
The main purpose of stage theories is to understand the mechanisms of qualitative behavior change.
Stage models of health behavior change describe how individuals move through discrete stages while
preparing and realizing behavior change. According to such models, persons at different stages will think
and behave in qualitatively different ways (Weinstein, Rothman, & Sutton 1998).
Stages are categories into which people can be classified according to rules of the stage theory. This
approach has to explain several distinct steps along the way to action (Weinstein et al., 1998). With
the stage construct, the dynamic nature of health behavior change is emphasized and made measurable.
By identifying influences and factors that induce movement from one category to the next, the process
of behavior change might be supported more effectively (Adams & White, 2003; Kreuter & Holt, 2001).
Weinstein (1993) argues that different procedures might be important at different stages and therefore,
various predicting rules are essential. Empirical findings support that one size does not fit all (Kreuter
et al., 1999) and that not ‘one-big-bullet’ would predict all changes (Kreuter & Holt, 2001).
S. Lippke et al. / Psychology of Sport and Exercise 6 (2005) 585–603 587
Examples of stage models
A variety of stage models have been developed such as the Transtheoretical Model (TTM; Prochaska,
DiClemente, & Norcross, 1992) and the Health Action Process Approach (HAPA; Schwarzer, 1992).
The latter has been selected as a theoretical framework for the present study because of three reasons: (1)
tailored interventions based on TTM have been shown as being unsupported for facilitating long-term
behavior changes (Adams & White, 2003), (2) the HAPA has been found superior to other social-
cognitive models (Garcia & Mann, 2003); and (3) due to the fact that the HAPA combines explicitly
continuous and stage assumptions.
The HAPA makes a distinction between a motivation phase and a volition phase of health
behavior change. The basic idea is that individuals experience a shift of mindset when moving from
the first phase (that is motivational) to the second (that is volitional). The moment when people
commit themselves to an intention to exercise, they enter the volitional phase. In this phase, a
division into two subphases appears to be meaningful where people can be labeled as either intenders
or actors. Firstly, they intend to act but they still remained inactive. Secondly, they have initiated the
intended action. Thus, three phases or stages can be distinguished. In the (a) non-intentional stage, a
behavioral intention is being developed which is similar to the contemplation stage in the TTM.
Afterwards, individuals enter (b) the intentional stage, where the person has already formed an
intention but still remains inactive (or at least not active at the recommended performance level),
while the exercise behavior is being planned and prepared. If these plans are translated into action,
individuals reside in (c) the actional stage. They are then physically active at the recommended
performance level.
In other words, there are stage-specific effects of social-cognitive variables on behavior change. At
each stage, variables predict cognitions and behaviors characteristic for the stage a person is in. To
demonstrate and test empirically these stage-specific prediction patterns, continuous models might be
combined with stage assumptions.
Stage models versus continuous models
Recent investigations have combined stage models with linear, continuous models (Courneya,
1995; Courneya & Bobick, 2000; Courneya, Nigg, & Estrabrooks, 1998; Marcus, Eaton, Rossi, &
Harlow, 1994; Nguyen, Potvin, & Otis, 1997; Plotnikoff, Hotz, Birkett, & Courneya, 2001; Resnick
& Nigg, 2003; Rosen, 2000). In these studies, the stage membership has been predicted additionally
or alternatively to intention and behavior in these linear estimations. However, stage is
conceptualized as analogous to intention and behavior probability. Thereby, the advantage of the
stage variable to the intention and behavior variables is rather small. In contrary, it may be more
fruitful to investigate stage as a moderator and to examine stage-dependent processes. These
processes are, analogous to the assumption of most social-cognitive models, intention formation,
action planning, and behavior change.
Some critiques of stage models have questioned the existence of stages or whether stages are not just
arbitrary divisions of an underlying continuum (Sutton, 2002; Weinstein et al., 1998). A stage model
actually exists if, in different variables, discontinuity patterns are observable (Armitage & Arden, 2002).
This would mean that there is a discontinuity in the degree to which variables act upon different stages.
Individuals at a particular stage should have different characteristics in comparison to those individuals
S. Lippke et al. / Psychology of Sport and Exercise 6 (2005) 585–603588
located in other stages. These discontinuity patterns may consist of mean differences in some stages and
no mean differences in other stages, or an increase from one stage to the next and a decrease to the one
thereafter (Weinstein et al., 1998).
Non-linear trends in cognitions at different stages would indicate such a discontinuity pattern, as it
was found by Armitage, Povey, and Arden (2003). Consequently, for behavior change, the influence of
certain variables is dependent on the stage a person is in. This has to be examined in longitudinal studies
(Burkholder & Harlow, 2003).
Only a small amount of data has been published on stage-specific predictions of behavior change (e.g.
Courneya, Plotnikoff, Hotz, & Birkett, 2001; DeVries & Mudde, 1998; Dijkstra, Tromp, & Conijn, 2003;
Plotnikoff et al., 2001). Plotnikoff and colleagues (2001) have found stage-specific predictions in a
physical exercise setting. They observed that higher pros were helpful for all stage groups except
preparation to remain in or progress to the next stage. Lower cons were only predictive for stage
movement in individuals being in the intentional and actional stages. For all stage groups, self-efficacy
was helpful to prevent relapse or to progress (Plotnikoff et al., 2001). In contrary, in smoking, self-
efficacy was only predictive for stage movement in the intentional stage (DeVries & Mudde, 1998;
Dijkstra et al., 2003). Both studies revealed that higher pros are only helpful for stage progression in the
non-intentional stage (contemplation and precontemplation) but not in preparation and actional stages.
Regarding intention for exercise behavior, Courneya et al. (2001) have found a beneficial effect of higher
intention for forward stage transition in all stage groups.
Discontinuity of prediction between stages
Depending on these stages, different social-cognitive variables may be more or less influential. These
different influences should be detected in discontinuity patterns (i.e. non-linear trends across stages;
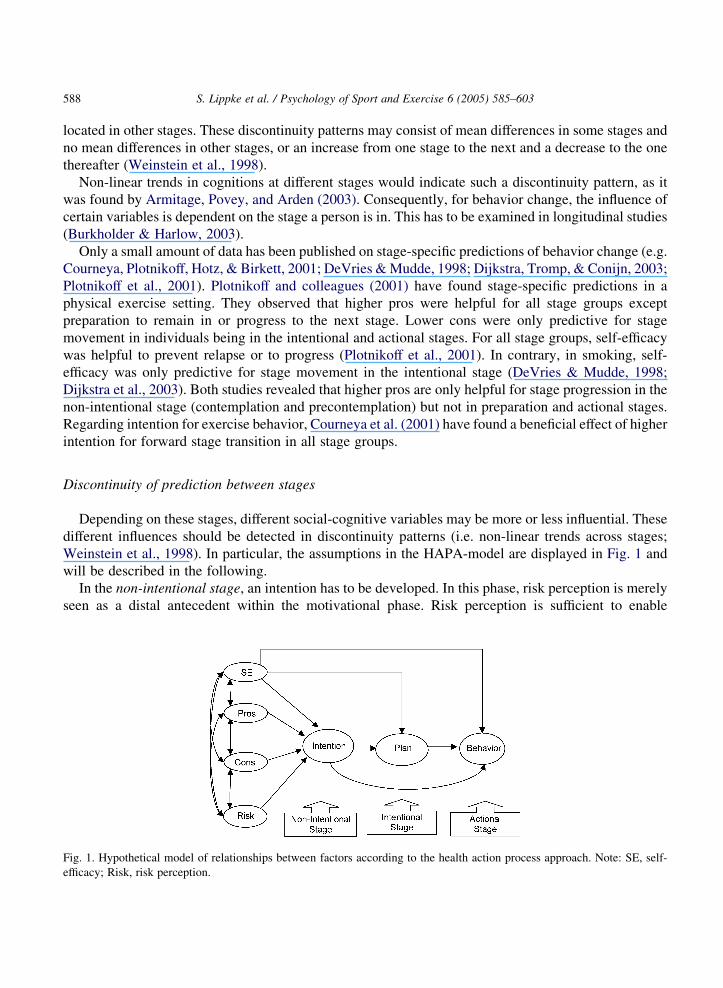
Weinstein et al., 1998). In particular, the assumptions in the HAPA-model are displayed in Fig. 1 and
will be described in the following.
In the non-intentional stage, an intention has to be developed. In this phase, risk perception is merely
seen as a distal antecedent within the motivational phase. Risk perception is sufficient to enable
Fig. 1. Hypothetical model of relationships between factors according to the health action process approach. Note: SE, self-
efficacy; Risk, risk perception.

S. Lippke et al. / Psychology of Sport and Exercise 6 (2005) 585–603 589
the undecided person to form an intention. Furthermore, it is a prerequisite for a contemplation process
and further elaboration of thoughts about consequences and capacities. Outcome expectancies (‘pros’ as
positive outcomes and ‘cons’ as negative aspects related to the goal behavior) are assumed as being most
important in the non-intentional phase, when balancing the pros and cons of a behavior. Further, the
belief in one’s capabilities to perform a desired action (self-efficacy) is substantial for goal pursuit. That
is, perceived self-efficacy promotes intention formation and behavior implementation (Lippke,
Ziegelmann, & Schwarzer, 2004a; Renner & Schwarzer, 2003; Schwarzer & Renner, 2000).
After a decision has been made, the intentional stage is entered. As long as the behavior has not been
performed, the individual has a high intention but is not acting at present. The intention has to be
transformed into detailed plans on how to perform the goal behavior. Detailed instructions on the goal
pursuit may contain assisting intentions and precise action plans (Luszczynska & Schwarzer, 2003).
These plans state when, where and how the goal behavior will be initiated (Lippke, Ziegelmann, &
Schwarzer, 2004b). Thereby, cognitive links between concrete opportunities and the intended behavior
will be built. Social-cognitive variables change their dominance and interplay. Risk perception has no
further influence while outcome-expectancies remain important. Self-efficacy is also important in the
planning and initiation process, especially if barriers occur or no enabling situation arises. Self-efficacy
keeps the intention high and the plans flexible to compensate for setbacks and stay on track to initiation.
If the goal behavior has been initiated, the individual enters the actional stage. The behavior has to be
controlled by cognitions in order to be maintained. Self-regulatory skills are substantial for the
maintenance process. Effort has to be invested, useful situations for implementation of the new behavior
have to be detected and distractions have to be resisted. The behavior will mainly be directed by self-
efficacy (Schwarzer & Renner, 2000) because it regulates how effort is invested and persistence is
managed if barriers and setbacks occur. The performed behavior has to be maintained, and relapses have
to be managed by action control strategies.
In general, discontinuity patterns should be indicated by significant differences in means and
relationships of the variables as described above. Recently, investigations on the HAPA model have
tested the structural features of the model with longitudinal data without stages (Lippke et al., 2004a;
Luszczynska & Schwarzer, 2003; Schwarzer & Renner, 2000) and in a two-stage approach (Renner &
Schwarzer, in press). Different patterns in social-cognitive predictor sets have been found in behaviors
such as nutrition and physical exercise. Fuchs (1996) tested a model similar to the HAPA separately in
adoption and maintenance of physical activity. Renner and Schwarzer (in press) analyzed non-intenders
and intenders separately for the domain of nutrition. Both studies revealed stage-specific patterns. No
study was found on the three stages of the HAPA and, therefore, the present study focuses on this issue.
Examining the three-stage approach in the context of regular physical activities
The present study attempts to elaborate the discontinuity patterns and to examine the hypothesized
relationships in the HAPA with all three stages. At first, the invariant factorial structure of the
psychometric instruments will be tested. The first hypothesis is that the items comprising a particular
instrument operate equivalently across the different stage groups (1) factor loadings and (2) covariances
are invariant.
Secondly, hypotheses on the discontinuity patterns in latent means are the following: (3) self-efficacy
will be lowest in the non-intentional stage and highest in the actional stage. Pros and cons will be lower
in the non-intentional stage than in the intentional and actional stage. Only minor differences will be
S. Lippke et al. / Psychology of Sport and Exercise 6 (2005) 585–603590
found in pros and cons between the intentional and actional stages. Intention will discriminate between
non-intenders and intenders as well as between intenders and actors. Planning will distinguish the non-
intentional and intentional stages but not the intentional and actional stages. Non-intenders and intenders
should change their behavior to a higher degree than actors do.
Finally, the stages should moderate the influence of the social-cognitive variables on goal setting and
the translation of intention into behavior: discontinuity patterns are also indicated by qualitative
differences in social cognitive variables, in the phases of intention formation and planning process. This
shall be indicated by unique (not invariant) paths in the specified causal structure (HAPA model) across
the stage groups. In particular, the hypotheses are: (4a) if non-intenders form an intention, this is highly
directed by risk perception and outcome expectancies. Self-efficacy is substantial but lower than in the
other stages. Only persons with high self-efficacy achieve behavior change. (4b) In the intenders, risk
perception should have no further influence; outcome-expectancies remain important for high intention,
while self-efficacy is more important than other social-cognitive variables. (4c) In actors, self-efficacy
should be influential whereas all other social cognitive variables are of less importance than in the other
stages. (4d) Intenders and actors should be similar in the way they translate intentions into behaviors,
namely by a mediation of planning.
Method
Study design
The study was conducted in an out-patient orthopedic rehabilitation center, where patients received
exercise therapy on a daily basis. A prospective design was used over approximately six and a half
months. Prior to exercise therapy, patients were informed about the research by a sport therapist and
were given an information leaflet about the study. To ensure anonymity and to encourage frank
responses, all study materials had a code number, instead of the patient’s name. After obtaining informed
consent, patients were handed the pre-rehab questionnaires (baseline) regarding physical activity prior to
rehabilitation, as well as social-cognitive variables, and demographic variables such as age, limitations
in movement, and partner status. At the end of their rehabilitation period (2–3 weeks after baseline),
patients were scheduled to meet with a research assistant (Wave 1) and were asked to fill out the second
questionnaire. They were scheduled for follow-up with a questionnaire six months after discharge
(Wave 2).
If patients failed to respond to the staging algorithm or if questionnaires contained more than 50%
missing information, the corresponding data records were removed from the analyses (see Section 2.4).
A total of 624 participants took part on the study during the rehabilitation stay. Of these, 64 had to be
excluded from the sample due to more than 50% missing values in their questionnaires. Of the remaining
560 participants, 450 returned their Wave 2 questionnaire. Of these questionnaires, 27 contained more
than 50% missing information and had to be excluded from further analyses. As a result, the complete
longitudinal sample consisted of 423 individuals.
No relevant differences were found between the remaining participants and the dropouts regarding
social-cognitive variables, age, sex, and BMI (all psO0.10). Accordingly, the final data set included
nZ560 patients of whom nZ423 participants had complete data for all three Waves.
S. Lippke et al. / Psychology of Sport and Exercise 6 (2005) 585–603 591
Sample
The recruitment approach was as follows: Orthopedic patients in an out-patient rehabilitation center
were enrolled in physical exercise therapy. They had to meet the inclusion criteria of being capable of
exercising on their own and to be able to fill out a questionnaire. As the study involved telephone follow-
ups, only patients with access to a telephone were recruited. The participation in the study was voluntary.
Patients were diagnosed with a number of ailments, such as spinal diseases, surgery of bones, joints,
muscles or ligaments, constraints in movement, chronic pain, arthrosis and arthritis, or stroke. The
minority was in rehabilitation treatment due to an accident (10%).
Participants aged 15–80 years completed the surveys in the rehabilitation center (MZ45.56; SDZ11.71; MedianZ44.50). The sample consisted primarily of women (62%), 68% were living with a
partner, and 33% were smokers. The mean body mass index (BMI) of the women was 25.45 (SDZ5.07;
MedianZ24.13), of the men it was 26.63 (SDZ3.59; MedianZ26.28).
Measures
This study presents data for stage assumptions and continuity assumptions of the HAPA from a larger
interdisciplinary trial testing multiple theoretical models. The measurement points during the
rehabilitation stay were analyzed and published separately (Lippke et al., 2004b), but stage-related
questions have not been addressed before. The 6-month follow-up measurement point (Wave 2) is
unique to the present paper and has not been included in previous analyses.
The questionnaires contained several psychometric scales, in addition to demographic information.
Most of the following items were taken from Fuchs (1996) and adapted to the special sample of
orthopedic rehabilitation patients. All item examples given below are translated from German. To have
sufficient information for testing measurement equivalence, all social-cognitive factors were measured
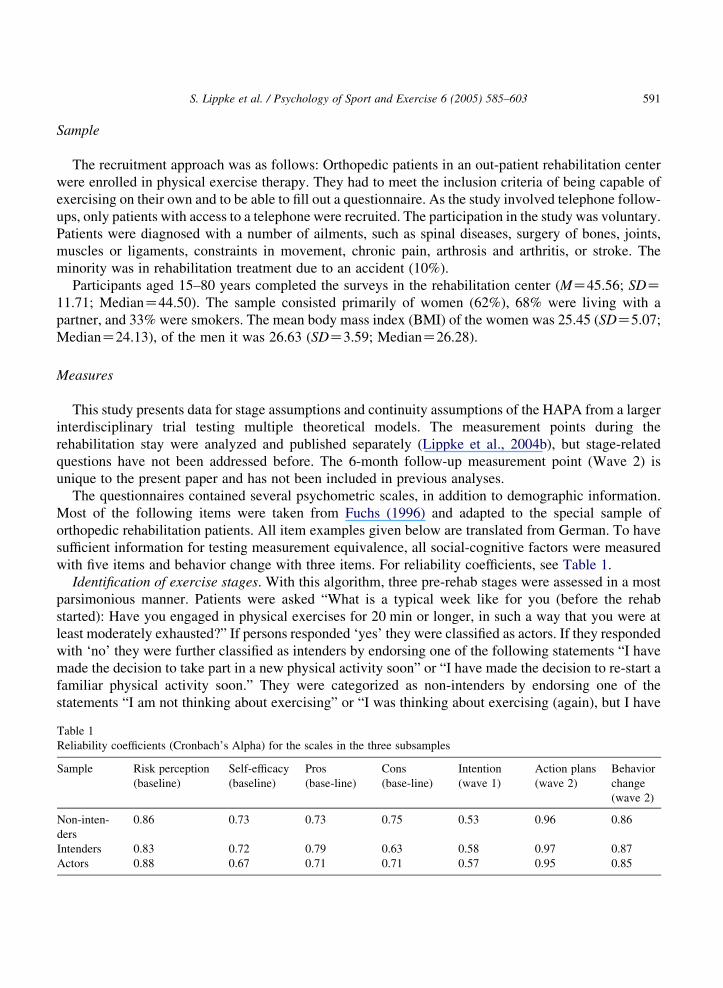
with five items and behavior change with three items. For reliability coefficients, see Table 1.
Identification of exercise stages. With this algorithm, three pre-rehab stages were assessed in a most
parsimonious manner. Patients were asked “What is a typical week like for you (before the rehab
started): Have you engaged in physical exercises for 20 min or longer, in such a way that you were at
least moderately exhausted?” If persons responded ‘yes’ they were classified as actors. If they responded
with ‘no’ they were further classified as intenders by endorsing one of the following statements “I have
made the decision to take part in a new physical activity soon” or “I have made the decision to re-start a
familiar physical activity soon.” They were categorized as non-intenders by endorsing one of the
statements “I am not thinking about exercising” or “I was thinking about exercising (again), but I have
Table 1
Reliability coefficients (Cronbach’s Alpha) for the scales in the three subsamples
Sample Risk perception
(baseline)
Self-efficacy
(baseline)
Pros
(base-line)
Cons
(base-line)
Intention
(wave 1)
Action plans
(wave 2)
Behavior
change
(wave 2)
Non-inten-
ders
0.86 0.73 0.73 0.75 0.53 0.96 0.86
Intenders 0.83 0.72 0.79 0.63 0.58 0.97 0.87
Actors 0.88 0.67 0.71 0.71 0.57 0.95 0.85

S. Lippke et al. / Psychology of Sport and Exercise 6 (2005) 585–603592
not yet made up my mind.” The stage and the following social-cognitive variables were assessed at
baseline.
Risk perception was measured at Wave 1 by three items: ‘Compared to other persons of your age and
sex, how do you estimate the likelihood that you will ever (a) suffer from chronic pain, (b) suffer from
movement limitations, and (c) get a severe disease?’ Responses were given on five-point scales,
anchored at much below average (1), below average (2), average (3), above average (4), and much
above average (5).
The answers on self-efficacy and outcome expectancies were scored on a four-point scale from not at
all true (1), not true (2), a little true (3), to exactly true (4). Self-efficacy, outcome expectancies and risk
perception were assessed at the beginning of the rehabilitation (baseline); for Cronbach’s Alpha see
Table 1.
Perceived motivational and volitional self-efficacy at baseline was composed of five items.
Participants reported how certain they were that they could exercise regularly, even when facing
barriers. Motivational self-efficacy was measured with the stem “I am able to.” followed by three items
“.change my lifestyle to an active one,” “.exercise at least once per week,” and “.exercise at least
twice per week for at least twenty minutes.” Volitional self-efficacy was measured with the stem “I am
capable of continuous physical exercise on a regular basis,.” followed by two items “.even if I do not
perceive positive changes” and “.even if I am accompanied by friends and other people who are not
physically active.“
For the assessment of outcome expectancies at baseline, the stem “If I would engage in physical
exercise on two or more days, for at least 20 minutes,.” was followed by six items on positive and
negative outcome expectancies. Pros were measured with “then I would feel better afterwards,” “then I
would be doing something good for my health,” and “then I will cope better with daily hassles.” Cons
were assessed by “then I have to perform a lot of organizational tasks,” “then other people around me
feel bothered,” “then I do not have enough time for other things.”
Intentions to perform physical activities were assessed at Wave 1 with five items: “I intend to exercise
for 20 minutes or longer on at least two days per week on a regular basis,” “I intend to exercise
occasionally for 20 minutes or longer on at least two days per week (at least once a month),” “I intend to
perform fitness and muscle strengthening activities”, “I intend to perform special exercises (e.g. for my
back)” and “I intend to be physically active in my leisure time (e.g. go for a walk).” The answers on
intention were assessed on a four-point scale from not at all true (1), not true (2), a little true (3), to
exactly true (4). Intention was assessed at the end of the rehabilitation (Wave 1); for Cronbach’s Alpha
see Table 1.
Action plans were measured at Wave 2. Therefore, it was asked “How precisely did you plan your
exercising on two or more days per week, for at least 20 minutes?” The participants had to rate the
five statements: “I already planned precisely...which physical activity I will perform; when; where; how,
and how often I will exercise.” The answers on plans ranged from not at all true (1), not true (2), a little
true (3), to exactly true (4). Action plans were measured half a year after discharge from rehabilitation
(Wave 2).
As behavior, three domains of physical exercise were taken into consideration: (a) physical activities
due to locomotion, (b) physical activities in daily life, and (c) deliberate rehabilitation-specific
physical exercises. It was asked how these activities changed compared to times prior to the rehab. To
rate these items, a five-point Likert scale with the anchors at much lower (1), lower (2), not changed (3),

S. Lippke et al. / Psychology of Sport and Exercise 6 (2005) 585–603 593
more (4), and much more (5) was used. Physical exercise was assessed half a year after discharge from
rehabilitation (Wave 2).
Age, sex and partner status were assessed in the baseline questionnaire. Height, body weight, being in
the rehabilitation due to an accident, medical diagnoses, and smoking status were taken from medical
records.
Missing values treatment
In the questionnaires, 70% of the participants answered all items, and 20% produced one or two
missing values. No item had more than 13% missing values. Missing values in the intention and action
planning items were imputed with SPSS MVA REGRESSION with age, gender, and responses to the
other subscale items as predictors in linear multiple regression analyses (cf. Fidell & Tabachnick, 2003).
For the nZ137 patients with no data at Wave 2, another method to impute missing data was applied to
test if the resultant pattern would change. Study drop out is a common problem in longitudinal and
treatment evaluation studies in the areas of health and risk behaviors. Several strategies have been
developed to handle missing data. One possible technique is, among others, the method of ‘mean
replacement.’ Thereby, the subjects’ missing outcome is replaced with means of those in the remaining
stage subgroups (Hall et al., 2001).
Data analysis
Structural equation modeling with latent variables was employed to investigate the pattern of
relationships within the overall data set. This method was chosen because of several reasons. Firstly, the
underlying theoretical order among the factors and relationships among predictors can be tested.
Secondly, a multi-sample structural equation model analyzes invariances across the subsamples.
Invariances may be analyzed in the measurement of the theoretical constructs, in the relationships
among theoretical constructs, the paths in a specified causal structure and in the latent means of
constructs in a model. Thirdly, if the independent variables in a regression analysis are moderately to
highly interrelated, there may be multi-collinearity problems. Finally, modeling with latent variables
tests the relationships among factors free of measurement error. This is especially important if scale
reliabilities are moderate (Bentler, 1990; Burkholder & Harlow, 2003; Byrne, 2001).
Multi-group structural equation modeling. A sequence of nested models ranged from an
unconstrained multi-sample model with the parameters freely estimated across subsamples, to more
parsimoniously nested models that include different levels of equality constraints (Kenny, 2002). The
following models will be estimated in this study:
†
Unrestricted model: noninvariant, unconstrained model;†
Model 2—measurement equivalent model: equal factor loading across the subsamples;†
Model 3: model 2 constraints plus equal factor variance and covariances;†
Model 4: model 3 constraints plus equal paths;†
Model 5: model 4 constraints plus equal factor residuals (‘fully constrained’).The equality of variances and covariances is specified subsequently to the model 2 because the other
constraints rely on assumptions of invariant measurements. The models 4 and 5 refer to the latent
S. Lippke et al. / Psychology of Sport and Exercise 6 (2005) 585–603594
construct level. This level deals with more substantive hypotheses about how the subsamples may differ
and are similar, respectively, in their perception of variables’ relationships. Therefore, the most
parsimonious model that varies not significantly from the unrestricted model is examined in comparing
the paths and the latent means (Byrne, 2001).
Model fit. Structural equation modeling (see Fig. 1) was estimated with AMOS using maximum
likelihood estimates for each subsample (Byrne, 2001). The overall fit of the resultant models was
assessed using a number of goodness of fit indices representing absolute, comparative and residual
aspects of fit, specifically c2/df, Tucker–Lewis index (TLI), Comparative Fit Index (CFI), and Root
Mean Square Error of Approximation (RMSEA). The higher the probability associated with the c2, the
closer is the fit between the hypothesized model and the perfect fit (Byrne, 2001). A c2/df ratio less than
2.0 indicates good overall model fit (Marsh, Balla, & McDonald, 1988) with values greater than 5.0
considered as unacceptable, although it should be noted that the c2 statistic is sample size dependent.
However, several problems are associated with the c2 test. In particular, it is based on restrictive
assumptions, depends on sample size and that a model is an approximation of the reality, rather than an
exact representation of the observed data (Bentler & Bonett, 1980). Therefore, a number of alternative fit
indices have been looked at.
In this study, TLI, CFI, and RMSEA are reported. The TLI and CFI range from 0 to 1 and derive from
the comparison of a hypothesized model with the independence model. Values greater than 0.90 indicate
acceptable model fit (Bentler & Bonett, 1980). The RMSEA has been recognized as one of the most
informative criteria in covariance structure modeling (Byrne, 2001). It takes into account the error of
approximation in the population and it estimates how well the model would fit the population covariance
matrix if all parameter values would be chosen optimally. An RMSEA of !0.10 is considered
acceptable, and !0.05 is good (Byrne, 2001).
When the theory underlying the model indicates that a moderating relationship among predictors
may vary by specific population subgroups, as the stage groups, Multi-Sample Structural Equation
Modeling (MSEM) is preferable. A single c2 goodness-of-fit statistic evaluates a set of complex
models—one for each group. To validate the usual assumptions that groups are equivalent,
subsamples can be required to have identical estimates for all parameters (a ‘fully constrained’
model). Differences among the groups can be evaluated for their appropriateness by ‘freeing’ special
parameters (allowing the groups to vary).
The theoretical model is separately applied to each subgroup and then the invariance analyses can be
set up. Before the invariance models are estimated, it must be established that the model without any
invariances (i.e. a model that is different in each group) is reasonable. This model can be used as a basis
of assessment of more constrained models. The constraints are placed in a sequence of nested models. To
compare the models, the c2 difference test and the Tucker–Lewis index (TLI) can be used to test the
equality constraints (Byrne, 2001; Kenny, 2002). If the difference between the c2s is not statistically
significant, then the statistical evidence points to no cross-group differences between the constrained
parameters. If the c2 difference is statistically significant, then the evidence of cross-group inequality
exists. The TLI is estimating the models for the groups separately and summing the c2s and the degrees
of freedom. The differences in the TLI up to 0.05 are considered as trivial in practical terms (Byrne,
2001). For the test of significant paths and significant differences across the subgroups, p%0.10 was
used, because uni-directional hypotheses where stated. Structural Equation Modeling was performed
using AMOS 4.01, and reliability and dropout analyses were performed using SPSS 12.0.1.
S. Lippke et al. / Psychology of Sport and Exercise 6 (2005) 585–603 595
Results
Distribution of patients across the three stages
The sample of NZ560 rehabilitation patients was assigned to the three stages according to the
retrospective staging algorithm. About every fifth patient (nZ106) reported to have been inactive and
undecided to be physically active at the time before the rehabilitation (non-intenders). About one third of
the sample (nZ195) reported to have been inactive but with a decision to start exercising (intenders).
The biggest fraction of the sample (nZ259) reported to have already been active before the
rehabilitation started (actors, stage 3). Due to dropout, only nZ423 patients could be followed up. Of
these, nZ67 were classified as non-intenders, nZ155 were intenders, and nZ201 were actors.
Dropout analysis
First, the dropout rates across the three stage groups were compared: 37% of the non-intenders, 21%
of the intenders, and 22% of the actors did not provide data at follow-up. This pattern was statistically
significant, c2 (2, NZ560)Z10.97; p!0.01. In other words, the non-intenders were more likely to
drop out.
Secondly, patients who were lost at follow-up were compared on baseline social-cognitive variables
with patients who completed the whole study, and were differentiated into stage subgroups. In non-
intenders, none of the seven constructs revealed significant differences across dropouts and those
patients who completed all measurement points (pO0.32). Concerning sex, age and BMI, no differences
in any subgroup revealed to be significant. However, patients who smoked dropped out with a higher
probability (32%) than non-smoking patients (16% dropouts). This was true for all stage groups.
Thirdly, all subsequent analyses were computed on the basis of patients with complete data sets, and
results were compared with the full sample with mean-replaced data for the dropouts. In most analyses,
no differences were found. In case differences in the results and pattern occurred, these are reported.
Multi-sample structural equation modeling
To examine whether the single sample models were adequate, the structural model was separately
tested in each group. Only if the hypothesized model was adequate in all subsamples, the model may
work well in the multi-sample analyses. Therefore, the hypothesized model shown in Fig. 1 was tested in
each sample.
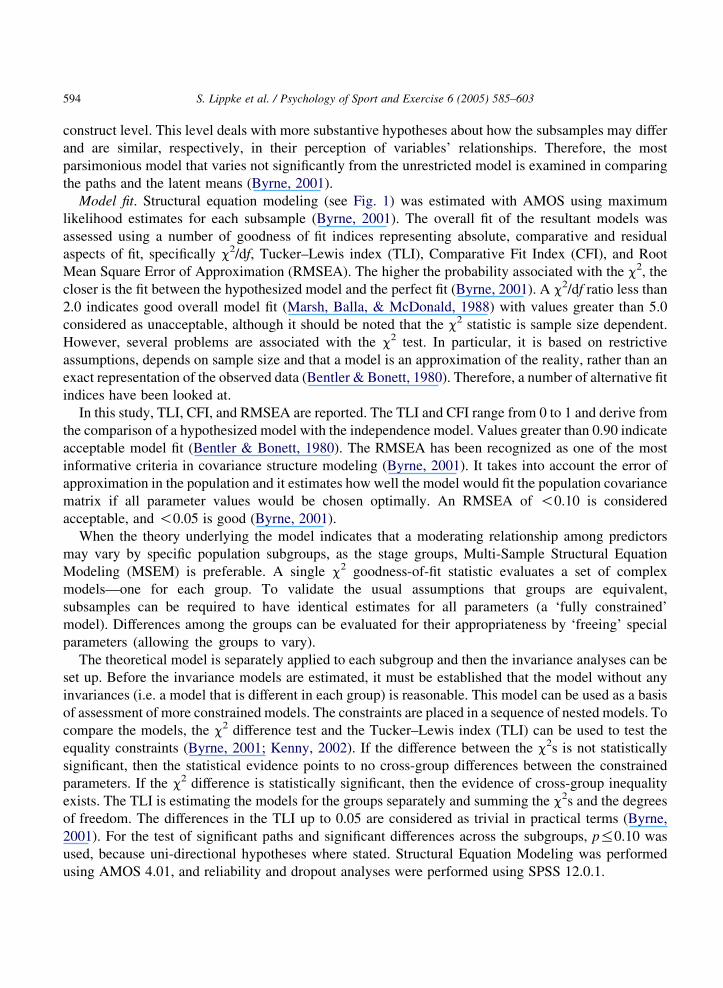
Goodness-of-fit indices for the three subsamples are shown in Table 2. In practical terms, the
hypothesized model represented the data well. Although the c2 was statistically significant, the other fit
Table 2
Goodness of fit indices for the three stage subsamples
Sample n c2 df c2/df p TLI CFI RMSEA
Non-Intenders 67 451.88 310 1.46 !0.01 0.97 0.97 0.08
Intenders 155 520.39 310 1.68 !0.01 0.98 0.98 0.07
Actors 201 534.23 310 1.72 !0.01 0.98 0.99 0.06

S. Lippke et al. / Psychology of Sport and Exercise 6 (2005) 585–603596
indices showed good or moderate model fit with c2/df smaller than 2, TLI and CFI greater than 0.95 and
RMSEA of 0.08 and smaller. Post hoc analyses and subsequent fitting procedures were not done because
the modification indices indicated different modifications in the three groups. The aim was to keep a
model that was most generalizable.
The fit indices revealed better fit with the mean-imputed entire sample. That indicated the moderate fit
was mainly related to the small sample size. Consequently, because the model offered a reasonable fit in
all the samples, the hypothesized multi-sample structural equation model was employed.
Testing for multi-group invariant factorial structure of the measuring instruments
To determine, whether (1) the items comprising a particular measuring instrument operated
equivalently across the different stage groups, and whether (2) the factorial structure of the instruments
was equivalent across stage groups, a confirmatory factor analysis was computed. This test of the
validity of the measurement model was done with a three-group model in which no constraints were set.
For comparing the constrained models with unconstrained models (model 1), nested models were
computed. The constrained models were specified with equal factor loadings (model 2), and equal factor
loadings along with covariances (model 3) (Table 3).
The first two constrained models were tenable, with practical fit indices showing good model fit.
The c2 difference was not statistically significant (pZ0.10). This confirms that models 2 and 3
account as well for the sample’s variance/covariance as model 1. The other models proved to be
applicable at p!0.01, suggesting that factor loadings, variances, and factor residuals were mostly
sample specific.
Patterns of social-cognitive variables across the stages
With the finding that all factor loadings and covariances were invariant across the three stage groups,
the assumption for the latent mean analysis (with invariant factor loadings) was met. At this point it was
analyzed if the latent means of the constructs in the model were different across the stage groups. By
restricting the means in one group, this group operated as a reference group against which the latent means
of the other groups were compared. The group of intenders served as the reference group (see Fig. 2).
The group of non-intenders differed significantly from the intenders with its means on self-efficacy
(MZK0.26; p!0.01), intention (MZK0.2; p!0.05) and planning (MZK0.37; p!0.01). The group
Table 3
Three group nested models and c2 differences with increased constraints
Model c2 df p c2/df TLI CFI RMSEA Model 1
delta c2Model 1
p
Delta
TLI
Unrest-
ricted
Model
1508.62 930 !0.01 1.62 0.98 0.98 0.038 – – –
Model 2 1560.64 970 !0.01 1.61 0.98 0.98 0.038 52.02 0.10 !0.01
Model 3 1572.86 980 !0.01 1.61 0.98 0.98 0.038 64.24 0.09 !0.01
Model 4 1774.92 1060 !0.01 1.67 0.98 0.98 0.040 266.30 !0.01 0.01
Model 5 1788.44 1066 !0.01 1.68 0.98 0.98 0.040 279.82 !0.01 0.01
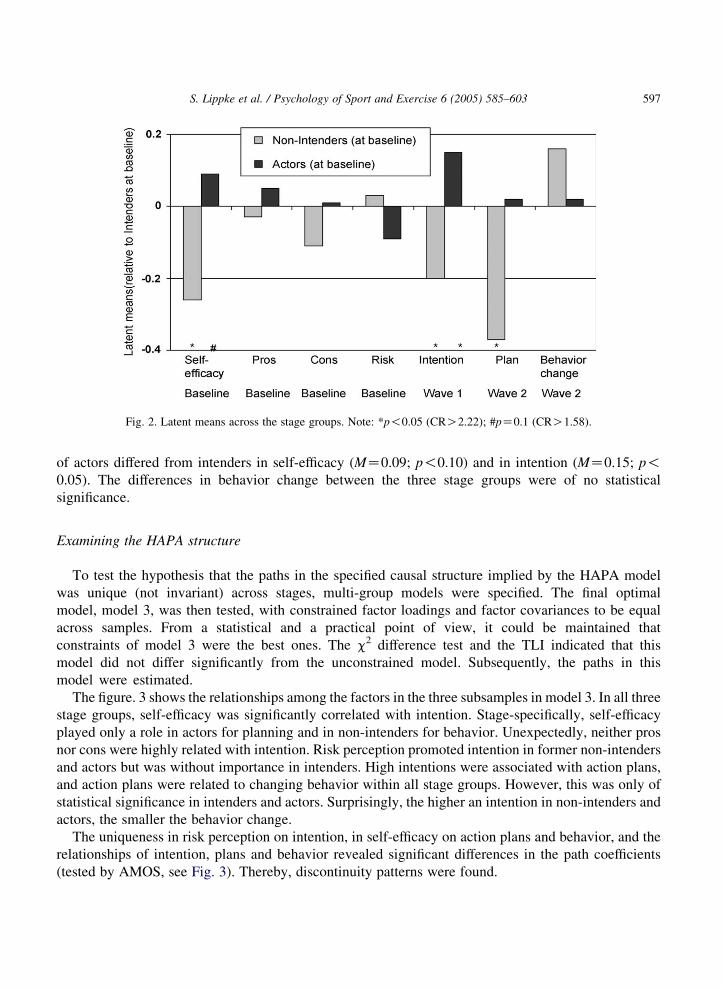
Fig. 2. Latent means across the stage groups. Note: *p!0.05 (CRO2.22); #pZ0.1 (CRO1.58).
S. Lippke et al. / Psychology of Sport and Exercise 6 (2005) 585–603 597
of actors differed from intenders in self-efficacy (MZ0.09; p!0.10) and in intention (MZ0.15; p!0.05). The differences in behavior change between the three stage groups were of no statistical
significance.
Examining the HAPA structure
To test the hypothesis that the paths in the specified causal structure implied by the HAPA model
was unique (not invariant) across stages, multi-group models were specified. The final optimal
model, model 3, was then tested, with constrained factor loadings and factor covariances to be equal
across samples. From a statistical and a practical point of view, it could be maintained that
constraints of model 3 were the best ones. The c2 difference test and the TLI indicated that this
model did not differ significantly from the unconstrained model. Subsequently, the paths in this
model were estimated.
The figure. 3 shows the relationships among the factors in the three subsamples in model 3. In all three
stage groups, self-efficacy was significantly correlated with intention. Stage-specifically, self-efficacy
played only a role in actors for planning and in non-intenders for behavior. Unexpectedly, neither pros
nor cons were highly related with intention. Risk perception promoted intention in former non-intenders
and actors but was without importance in intenders. High intentions were associated with action plans,
and action plans were related to changing behavior within all stage groups. However, this was only of
statistical significance in intenders and actors. Surprisingly, the higher an intention in non-intenders and
actors, the smaller the behavior change.
The uniqueness in risk perception on intention, in self-efficacy on action plans and behavior, and the
relationships of intention, plans and behavior revealed significant differences in the path coefficients
(tested by AMOS, see Fig. 3). Thereby, discontinuity patterns were found.
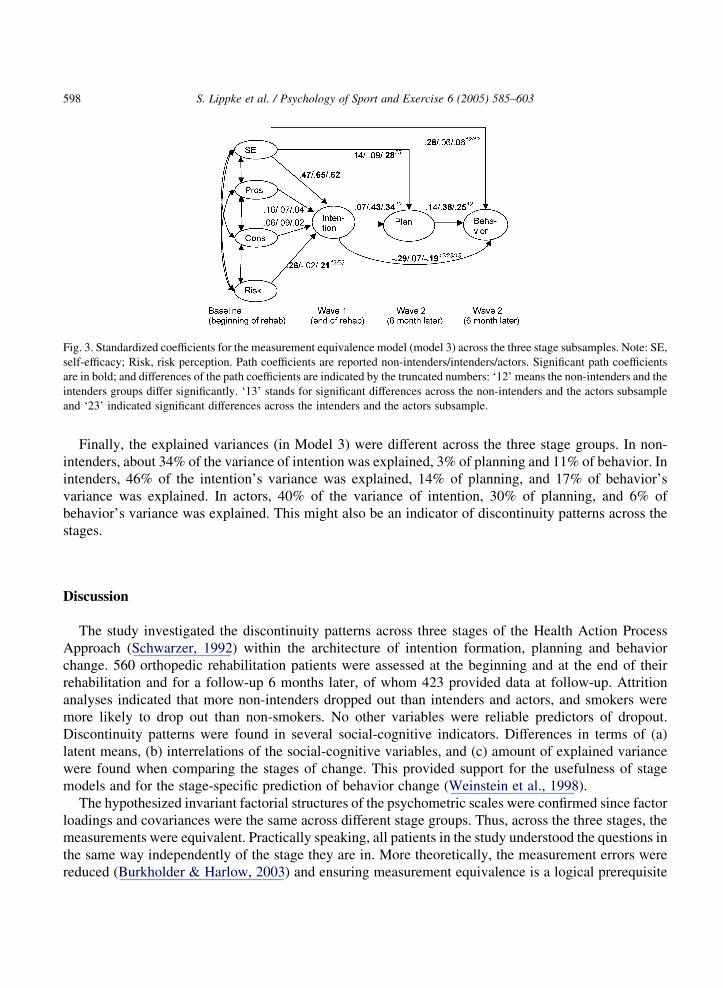
Fig. 3. Standardized coefficients for the measurement equivalence model (model 3) across the three stage subsamples. Note: SE,
self-efficacy; Risk, risk perception. Path coefficients are reported non-intenders/intenders/actors. Significant path coefficients
are in bold; and differences of the path coefficients are indicated by the truncated numbers: ‘12’ means the non-intenders and the
intenders groups differ significantly. ‘13’ stands for significant differences across the non-intenders and the actors subsample
and ‘23’ indicated significant differences across the intenders and the actors subsample.
S. Lippke et al. / Psychology of Sport and Exercise 6 (2005) 585–603598
Finally, the explained variances (in Model 3) were different across the three stage groups. In non-
intenders, about 34% of the variance of intention was explained, 3% of planning and 11% of behavior. In
intenders, 46% of the intention’s variance was explained, 14% of planning, and 17% of behavior’s
variance was explained. In actors, 40% of the variance of intention, 30% of planning, and 6% of
behavior’s variance was explained. This might also be an indicator of discontinuity patterns across the
stages.
Discussion
The study investigated the discontinuity patterns across three stages of the Health Action Process
Approach (Schwarzer, 1992) within the architecture of intention formation, planning and behavior
change. 560 orthopedic rehabilitation patients were assessed at the beginning and at the end of their
rehabilitation and for a follow-up 6 months later, of whom 423 provided data at follow-up. Attrition
analyses indicated that more non-intenders dropped out than intenders and actors, and smokers were
more likely to drop out than non-smokers. No other variables were reliable predictors of dropout.
Discontinuity patterns were found in several social-cognitive indicators. Differences in terms of (a)
latent means, (b) interrelations of the social-cognitive variables, and (c) amount of explained variance
were found when comparing the stages of change. This provided support for the usefulness of stage
models and for the stage-specific prediction of behavior change (Weinstein et al., 1998).
The hypothesized invariant factorial structures of the psychometric scales were confirmed since factor
loadings and covariances were the same across different stage groups. Thus, across the three stages, the
measurements were equivalent. Practically speaking, all patients in the study understood the questions in
the same way independently of the stage they are in. More theoretically, the measurement errors were
reduced (Burkholder & Harlow, 2003) and ensuring measurement equivalence is a logical prerequisite

S. Lippke et al. / Psychology of Sport and Exercise 6 (2005) 585–603 599
for the evaluation of substantive hypotheses regarding group differences (Horn & McArdle, 1992). Only
in case of measurement invariance, the differences between the stage-groups are clearly interpretable
(Horn & McArdle, 1992).
The hypotheses on the discontinuity patterns in latent means were partially confirmed. Self-efficacy
was—as hypothesized—lowest in the non-intentional stage and highest in actional stage. This finding
was in accordance with previous findings (Resnick & Nigg, 2003; Rosen, 2000). In particular, patients
who are not decided to be physically active feel less self-efficacious than patients who have formed the
intention. Those patients who are already active, may experience their competence to perform the
behavior and, accordingly, they perceive higher self-efficacy (Rothman, 2000). Pros and cons were
lower in non-intenders but not at a significant level. As expected, no differences were found in pros and
cons between the intentional and actional stages. Support for the distinction between non-intenders and
intenders was provided by the significant different levels of intention and plans between the two groups.
On the other hand, the lack of differences between intenders and actors in plans supported the
assumption that these two stages are similar in terms of underlying volitional processes (cf. Renner &
Schwarzer, in press). The finding in this study was that intenders differ from non-intenders in terms of
their formed intention and plans. The finding is in accordance with the HAPA (Schwarzer, 1992):
Intenders and non-intenders differ mainly in terms of having decided to be physically active. This is also
the case in actors and, therefore, intenders do differ from actors in terms of plans, and only moderately in
terms of intentions.
The hypotheses on discontinuity patterns in intention formation and the translation of intention into
behavior could partially be supported as well. It was found that, if non-intenders form an intention, risk
perception played a substantial role. For intenders, risk perception was no longer important for their
intention. This stage-specific pattern was also found in the context of preventive nutrition (Renner &
Schwarzer, in press). Assumingly, people who have not decided to perform a health behavior might lack
information and, therefore, they are not aware of the risk that is caused by not taking precautions. In this
group, the higher the risk perception, the more they ‘understand’ the need of adopting a health behavior.
In other words, if risk perception is higher, the probability of forming an intention is also higher. In
individuals who have already set the goal to start an activity, a higher perceived risk does no longer
increase their intention because they have to plan, how to translate the goal into action. Planning
becomes more salient (see Lippke et al., 2004a).
The effect of outcome expectancies was not large in any of the stage groups, and no differences were
found between groups. This might be due to the special context of the rehabilitation setting. Studies in
other settings should explore this further. Another explanation might be that self-efficacy was the most
important factor for intention formation and behavior change. In the current study, in all stage groups
self-efficacy was superior to all other variables in the prediction of intention, supporting the hypotheses
on intenders and actors. Thus, self-efficacy appears to be crucial in all stages, as found in other studies as
well (e.g. Plotnikoff et al., 2001). Self-efficacy in non-intenders tended to be—as expected—influential
on intention but lower than in the other stages; however, this did not reach statistical significance. In line
with the hypothesis, intention and planning mediated completely the impact of self-efficacy on behavior
change. In other words, self-efficacious patients are more likely to form intentions (Schwarzer & Renner,
2000). Afterwards, people translate their intentions into plans, and, by this, the intended behavior is more
likely to be performed (Luszczynska & Schwarzer, 2003). Patients who did not intend to be physically
active but who report higher self-efficacy, move to the intentional or actional stages without the
mediation process from intention formation to planning and behavior enactment. The latter finding
S. Lippke et al. / Psychology of Sport and Exercise 6 (2005) 585–603600
might be uniquely related to the current sample because rehabilitation patients were in an on-going
change process. In particular, patients who were in the non-intentional stage may have changed more in
terms of the above described psychological mechanisms. These psychological changes might occur
between the measurement points. Therefore, further studies should have a closer look into such micro
processes.
In non-intenders and actors, a higher intention was connected with less behavior change. This may be
interpreted in two ways. Firstly, a high intention was no guarantee for behavior change. Other factors
such as the belief in one’s competencies were more important to actually change the behavior. Secondly,
it has to be taken into account that behavior change was measured. Consequently, persons with a high
intention to exercise did not change their subsequent behavior because they maintained their prior
behavior: Actors had high intentions to exercise and they had already been active. After some time they
are still as active as before, so they state that they did not change their behavior since they were
maintaining their former behavior. The ones with low intentions and probably less behavior performance
had more potential to change their behavior.
Typical stage patterns were replicated, with the lowest levels of self-efficacy and intention in the non-
intenders and the highest ones in the actors. Moreover, across stages the pros were increasing whereas
the cons were decreasing. Non-linear trends were found but could not be observed consistently.
According to the principle of discontinuity, within each stage a unique pattern exists. The results are in
line with previous findings (e.g. Courneya et al., 2001; DeVries & Mudde, 1998; Dijkstra et al., 2003;
Plotnikoff et al., 2001). That means people are motivated differently depending on the stage they are in.
Health behavior change is then governed by different influences of social-cognitive variables such as risk
perception, and perceived self-efficacy. This has also been reflected here by intention formation and
planning, both of which were clearly distinct between stages.
From these findings it might be concluded that the identification of stages contributes substantially to
the differential prediction of behavior change. The idea of ‘one-size-fits-all’ should, therefore, be
abandoned (Kreuter & Holt, 2001; Kreuter et al., 1999). Furthermore, if separate predictions within stage
groups are chosen, different proportions in variance might be explained in these subgroups since these
predictions fit better than they do in the entire sample. Another aim could be to explain more variance.
However, this is difficult to demonstrate because the subgroups are more equal, and less variance
remained to be explained. Marcus and colleagues (1994), for example, have revealed that a high
percentage of variance of exercise behavior was explained by the stage six months earlier.
The present study is not free of limitations. First, all data is self-reported. The reliability coefficients
were of moderate to good size. Secondly, a self-selection and selective dropout may have led to a sample
of participants who are interested in the topic of physical activity. Non-intenders at baseline and smokers
were more likely to drop out at follow-up. Although the problem of attrition was dealt with by
recruitment and missing value replacement strategies, the generalizability of the findings is not clear.
Finally, for the structural equation models, larger sample sizes would have been favorable. To deal with
this problem, missing imputation methods were applied (Hall et al., 2001). In further studies, larger
sample sizes should replicate the results on stage groups of small and different sizes to ensure reliable
discontinuity patterns. The predictions have also to be validated in experimental studies (Burkholder &
Harlow, 2003).
In addition to the need to replicate the analyses, these findings are important in two ways. First,
implications may be given for theory building and, secondly, conclusions for exercise promotion may be
drawn (Sutton, 2002). For theory building and research, it was found that stages are qualitatively distinct.
S. Lippke et al. / Psychology of Sport and Exercise 6 (2005) 585–603 601
In testing the models, a new method was suggested to include stage assumptions into linear predictions,
and more stage-specific analyses should be done. Furthermore, volitional variables such as planning
should be included in studies on exercise change. For intervention practice, the results underscore the
potential importance of tailoring treatments (Kreuter & Holt, 2001). If stages are identified, stage-
specific needs can be taken care of, and—at least short-term—effects of interventions might be increased
(Adams & White, 2003). Moreover, planning cognitions were shown as being important in the behavior
change process, and, probably, it might be more effortless to modify action plans than other social-
cognitive variables (Lippke et al., 2004b).
To sum up: (1) this was the first study that tested three stages as moderators in the prediction of
behavior change. (2) The selected stages were a good predictor of subsequent differences in intention
and planning. (3) Discontinuity patterns were found in terms of stage-dependent relationships of risk
perception and intention as well as intention and behavior change. (4) Self-efficacy played a crucial role
for intention formation in all three stages. It was shown that the architecture of social-cognitive
variables, including intention and planning, is stage dependent. For physical exercise and general health
promotion, these findings might be helpful for the design of effective interventions by targeting them to
the individual’s stage.
Acknowledgements
We would like to thank the Zentrum fuer ambulante Rehabilitation (out-patient rehabilitation center)
in Berlin for their cooperation. This research was supported by Grant GK 429/2-03 from the German
Research Foundation (DFG).
References
Adams, J., & White, M. (2003). Are activity promotion interventions based on the Transtheoretical model effective? A critical
review. British Journal of Sports Medicine, 37, 106–114.
Armitage, C. J., & Arden, M. A. (2002). Exploring discontinuity pattern in the Transtheoretical model: An application of the
theory of planned behaviour. British Journal of Health Psychology, 7, 89–103.
Armitage, J. C., Povey, R., & Arden, M. A. (2003). Evidence for discontinuity patterns across the stages of change: A role for
attitudinal ambivalence. Psychology & Health, 18, 373–386.
Bentler, P. M. (1990). Comparative fit indices in structural models. Psychological Bulletin, 107, 238–246.
Bentler, P. M., & Bonett, D. G. (1980). Significance tests and goodness of-fit in the analysis of covariance structures.
Psychological Bulletin, 88, 588–606.
Burkholder, G. J., & Harlow, L. L. (2003). An illustration of a longitudinal cross-lagged design for larger structural equation
models. Structural Equation Modeling, 10, 465–486.
Byrne, B. M. (2001). Structural equation modeling with Amos: Basic concepts, applications, and programming. Mahwah, NJ:
Lawrence Erlbaum.
Courneya, K. S. (1995). Understanding readiness for regular physical activity in older individuals: An application of the theory
of planned behavior. Health Psychology, 14, 80–87.
Courneya, K. S., & Bobick, T. M. (2000). Integrating the theory of planned behavior with the processes and stages of change in
the exercise domain. Psychology of Sport & Exercise, 1, 41–56.
Courneya, K. S., Nigg, C. R., & Estabrooks, P. A. (1998). Relationships among the theory of planned behavior, stages of
change, and exercise behavior in older persons over a three year period. Psychology & Health, 13, 355–367.

S. Lippke et al. / Psychology of Sport and Exercise 6 (2005) 585–603602
Courneya, K., Plotnikoff, R., Hotz, S., & Birkett, N. (2001). Predicting changes in exercise stage over two consecutive six
month periods: An application of the theory of planned behaviour in a population-based sample. British Journal of Health
Psychology, 6, 135–150.
DeVries, H., & Mudde, A. N. (1998). Predicting stage transitions from smoking cessation applying the attitude-social influence-
efficacy model. Psychology & Health, 13, 369–385.
Dijkstra, A., Tromp, D., & Conijn, B. (2003). Stage-specific psychological determinants of stage transition. British Journal of
Health Psychology, 8, 423–437.
Fidell, L. S., & Tabachnick, B. G. (2003). Preparatory data analysis. In J. A. Schinka, & W. F. Velicer (Eds.), Handbook of
psychology: Research methods in psychology (pp. 115–141). New York: Wiley.
Fuchs, R. (1996). Causal models of physical exercise participation: Testing the predictive power of the construct ‘Pressure to
change’. Journal of Applied Social Psychology, 21, 1931–1960.
Garcia, K., & Mann, T. (2003). From ‘I wish’ to ‘I will’: Social-cognitive predictors of behavioral intentions. Journal of Health
Psychology, 8, 347–360.
Hall, S. M., Delucchi, K. L., Velicer, W. F., Kahler, C. W., Ranger-Moore, J., Hedeker, D., et al. (2001). Statistical analysis of
randomized trials in tobacco treatment: Longitudinal designs with dichotomous outcome. Nicotine & Tobacco Research, 3,
193–202.
Horn, J. L., & McArdle, J. J. (1992). A practical and theoretical guide to measurement invariance in aging research.
Experimental Aging Research, 18, 117–144.
Kenny, D. A. (2000). Multiple group models. Retrieved December 20, 2002, from: http://users.rcn.com/dakenny/mgroups.htm.
Kreuter, M. W., & Holt, C. L. (2001). How do people process health information? Applications in an age of individualized
communication. Current Directions in Psychological Science, 10, 1–4.
Kreuter, M. W., Strecher, V. J., & Glasman, B. (1999). One size does not fit all. Annals of Behavioral Medicine, 21, 276–283.
Lippke, S., Ziegelmann, J. P., & Schwarzer, R. (2004a). Behavioral intentions and action plans help motivate physical exercise:
A longitudinal study with orthopedic rehabilitation patients. Journal of Sport & Exercise Psychology, 26, 470–483.
Lippke, S., Ziegelmann, J. P., & Schwarzer, R. (2004b). Initiation and maintenance of physical exercise: Stage-specific effects
of a planning intervention. Research in Sports Medicine, 12, 221–240.
Luszczynska, A., & Schwarzer, R. (2003). Planning and self-efficacy in the adoption and maintenance of breast self-
examination: A longitudinal study on self-regulatory cognitions. Psychology & Health, 18, 93–108.
Marcus, B. H., Eaton, C. A., Rossi, J. S., & Harlow, L. L. (1994). Self-efficacy, decision-making, and stages of change: An
integrative model of physical exercise. Journal of Applied Social Psychology, 24, 489–508.
Marsh, H. W., Balla, J. R., & McDonald, R. P. (1988). Goodness-of-fit indexes in confirmatory factor analysis: The effect of
sample size. Psychological Bulletin, 103, 391–410.
Nguyen, N. M., Potvin, L., & Otis, J. (1997). Regular exercise in 30- to 60-year-old men: Combining the stages-of-change
model and the theory of planned behaviour. Journal of Community Health, 22, 233–246.
Plotnikoff, R. C., Hotz, S. B., Birkett, N. J., & Courneya, K. S. (2001). Exercise and the Transtheoretical model: A longitudinal
test of a population sample. Preventive Medicine, 33, 441–452.
Prochaska, J. O., DiClemente, C. C., & Norcross, J. C. (1992). In search of how people change: Applications to addictive
behaviors. American Psychologist, 47, 1102–1114.
Renner, B., & Schwarzer, R. (2003). Social-cognitive factors in health behavior change. In J. Suls, & K. Wallston (Eds.), Social
psychological foundations of health and illness (pp. 169–196). Oxford, England: Blackwell.
Renner, B., & Schwarzer, R. (in press). Nutritional intentions as a mediator or moderator: Differences between intenders and
non-intenders in terms of diet and social-cognitive variables. Polish Psychological Bulletin.
Resnick, B., & Nigg, C. (2003). Testing a theoretical model of exercise behavior for older adults. Nursing Research, 52, 80–88.
Rosen, C. S. (2000). Is the sequencing of change processes by stage consistent across health problems? A meta-analysis. Health
Psychology, 19, 593–604.
Rothman, A. J. (2000). Toward a theory-based analysis of behavioral maintenance. Health Psychology, 19, 64–69.
Schwarzer, R. (1992). Self-efficacy in the adoption and maintenance of health behaviors: Theoretical approaches and a
new model. In R. Schwarzer (Ed.), Self-efficacy: Thought control of action (pp. 217–243). Washington, DC: Hemisphere.
Schwarzer, R. (2001). Health self-regulation. In N. J. Smelser, & P. B. Baltes, The international encyclopedia of the social and
behavioral sciences (Vol. 10) (pp. 6615–6619). Oxford, England: Elsevier, 6615–6619.

S. Lippke et al. / Psychology of Sport and Exercise 6 (2005) 585–603 603
Schwarzer, R., & Renner, B. (2000). Social-cognitive predictors of health behavior: Action self-efficacy and coping efficacy.
Health Psychology, 19, 487–495.
Sutton, S. (2002). Using social cognition models to develop health behaviour interventions: Problems and assumptions. In D.
Rutter, & L. Quine (Eds.), Changing health behaviour: Intervention and research with social cognition models (pp. 193–
208). Buckingham, MK: Open University Press.
Weinstein, N. D. (1993). Testing four competing theories of health-protective behavior. Health Psychology, 12, 324–333.
Weinstein, N. D., Rothman, A. J., & Sutton, S. R. (1998). Stage theories of health behavior: Conceptual and methodological
issues. Health Psychology, 17, 290–299.