Stable Isotope Data from the Chilga Basin, Ethiopia and Their Implications for a Late Paleogene...
87
Transcript of Stable Isotope Data from the Chilga Basin, Ethiopia and Their Implications for a Late Paleogene...


STABLE ISOTOPE DATA FROM THE CHILGA BASIN, ETHIOPIA
AND THEIR IMPLICATIONS FOR A LATE PALEOGENE
TROPICAL FOREST ECOSYSTEM
Approved by:
_________________________________ Dr. Bonnie F. Jacobs
_________________________________ Dr. Neil J. Tabor
_________________________________ Dr. Dale A. Winkler

STABLE ISOTOPE DATA FROM THE CHILGA BASIN, ETHIOPIA
AND THEIR IMPLICATIONS FOR A LATE PALEOGENE
TROPICAL FOREST ECOSYSTEM
A Thesis Presented to the Graduate Faculty of
Dedman College
Southern Methodist University
in
Partial Fulfillment of the Requirements
for the degree of
Master of Science
with a
Major in Earth Sciences
by
Jordan Noret
(B.S., Texas A&M, 2008)
May 12, 2012

Copyright (2012)
Jordan Noret
All Rights Reserved

iv
ACKNOWLEDGMENTS
I would like to thank the following institutions and organizations, including their
staff, for supporting this research: the SMU Roy M. Huffington Department of Earth
Sciences, the Institute for the Study of Earth and Man, the SMU Stable Isotopes Lab, the
SMU Graduate Student Assembly, the Missouri Botanical Garden, and the Dallas
Paleontological Society. This research was also partially funded by the National
Geographic Society and National Science Foundation grants EAR-0001259 and EAR-
0617306.
Dr. Bonnie Jacobs of Southern Methodist University deserves special thanks for
giving me the opportunity to pursue this research, and for guidance and patience
throughout the process. I also extend this gratitude to my other committee members, Dr.
Neil Tabor and Dr. Dale Winkler, who have also been an integral part in the formulation
and revision of the ideas presented herein. Dr. Kurt Furgeson, Dr. Timothy Meyers, and
Mary Milleson also deserve special thanks for their generous help in carrying out lab
work. I would also like to thank the SMU faculty, staff, and graduate students for their
general help and support: , Dr. Louis Jacobs, Mike Polycn, Dr. Crayton Yapp, Thomas
Adams, Ricardo Araujo, Daniel Danehy, Meredith Faber, John Graf, Yuri Kimura, Nick
Rosenau, Christopher Strganac, and Tekie Tesfamichael to name a few.

v
I also wish to thank the following institutions and individuals in Ethiopia: the
Authority for Research and Conservation of Cultural Heritage, the Ministry of Culture
and Tourism, the director and staff of the National Museum in Addis Ababa, the people
of the Chilga Region, and our Ethiopian colleagues, sponsors, and guides; without their
support, this work would never have been possible.

vi
Noret, Jordan B.S., Texas A&M University, 2008
Stable Isotope Data from the Chilga Basin, Ethiopia and Their Implications for a Late Paleogene Tropical Forest Ecosystem
Advisor: Professor Bonnie F. Jacobs
Master of Science conferred May, 12, 2012
Thesis completed March, 15, 2012
Herbivorous mammals in modern tropical ecosystems are characterized by a high
degree of specialization, resulting in the systematic division of food resources among
them. In order to test whether this also occurred within ancient tropical ecosystems,
stable carbon and oxygen isotope data (δ13C and δ18O, respectively) were collected from
fossil seeds, lignites, and herbivore tooth enamel deposited in the Chilga Basin, Ethiopia
during the late Oligocene (~27 Ma). Tooth enamel samples were analyzed from orders
Proboscidea, Hyracoidea, and Embrithopoda. The δ13C data suggest that the landscape
was a heterogeneous, relatively closed-canopy forest. There are taxon-specific
peculiarities among the enamel δ13C data which indicate that systematic division of food
resources may have existed. It is not clear whether these data indicate that the herbivore
diets were different with regard to food types (e.g., legumes vs. palms), food source
locations (e.g., canopy vs. ground-level), or that they underwent seasonal changes.
However, Arsinoitherium δ13C varied the least, suggesting that its diet was the most
restricted of the taxa studied. This supports the current hypothesis that this animal had a

vii
specialized diet. Finally, the variation in δ18O values from Arsinoitherium tooth enamel
suggests that they were not semi-aquatic animals as previously thought.

viii
TABLE OF CONTENTS
LIST OF FIGURES ........................................................................................................... x
LIST OF TABLES ........................................................................................................... xi
LIST OF EQUATIONS .................................................................................................. xii
LIST OF ABBREVIATIONS ........................................................................................ xiii
CHAPTER
1. INTRODUCTION .................................................................................................. 1
1.1. The Late Oligocene of the Chilga Basin .......................................................... 3
1.2. Stable Isotope Chemistry of Herbivore Tooth Enamel .................................... 6
1.3. Vegetation δ13C within Tropical Forest Ecosystems ..................................... 13
1.4. Surface water δ18O ......................................................................................... 18
2. MATERIALS AND METHODOLOGY ............................................................. 21
2.1. Plant Specimens ............................................................................................. 24
2.2. Preparation and Analysis of Organic Samples ............................................... 32
2.3. Vertebrate Specimens ..................................................................................... 34
2.4. Preparation and Analysis of Carbonate Samples ........................................... 39
3. RESULTS AND DISCUSSION .......................................................................... 41
3.1. Vegetation δ13C .............................................................................................. 41
3.2. Tooth Enamel δ13C and δ18O .......................................................................... 46
3.3. Discussion ...................................................................................................... 55
4. CONCLUSIONS .................................................................................................. 57

ix
APPENDICES
A. Note About Digital Resources ............................................................................... 59
REFERENCES ................................................................................................................ 60

x
LIST OF FIGURES.
Figure
1.1 Paleomap of Afroarabia and Eurasia during the Oligocene ..................................... 4
1.2 Variation in δ18O within populations of aquatic, semi-aquatic (hippopotamids), and terrestrial mammals ............................................................................................. 13
1.3 Atmospheric CO2 δ13C values during the Oligocene ............................................. 15
1.4 Map of modern precipitation δ18O .......................................................................... 20
2.1 Fossil locality map ................................................................................................. 23
2.2 Modern Annonaceae seed morphology ................................................................. 27
2.3 Annonaceae cladogram showing endosperm morphology .................................... 28
2.4 Fossil CH83-2 ........................................................................................................ 29
2.5 Cluster analysis of Chilga lignite palynology ........................................................ 31
2.6 Lignite CH41L ....................................................................................................... 32
2.7 Arsinoitherium zitteli mandible .............................................................................. 37
3.1 Univariate plot of fossil organic matter δ13C ......................................................... 43
3.2 Enamel δ13C-WPC and δ18O-WPC biplots ............................................................ 50
3.3 Enamel δ13C - δ18O biplot ...................................................................................... 51
3.4 Enamel δ13C and δ18O, by family ........................................................................... 52

xi
LIST OF TABLES
Table
1.1 Influences on plant δ13C values ............................................................................. 14
2.1 Fossil Localities ..................................................................................................... 22
2.2 Plant specimens ...................................................................................................... 25
2.3 Tooth enamel specimens ......................................................................................... 35
3.1 Organic matter δ13C data ......................................................................................... 42
3.2 Organic matter δ13C statistics ................................................................................ 44
3.3 Enamel δ13C and δ18O data .................................................................................... 48
3.4 Enamel δ13C and δ18O statistics ............................................................................. 55

xii
LIST OF EQUATIONS
EQUATION
1.1 Delta (δ) notation ..................................................................................................... 7
1.2 V-SMOW – V-PDB relationship ............................................................................. 7
1.3 Δ18Owater-carbonate temperature dependence ............................................................. 11
1.4 Δ18Owater-carbonate solutions for T = 37°C ................................................................. 11
1.5 Mammalian body water δ18O and tooth enamel carbonate δ18O ........................... 11
2.1 Weight Percent Carbonate (WPC) ......................................................................... 40

xiii
LIST OF ABBREVIATIONS
CONISS - constrained incremental sums of squares (cluster analysis)
FOM – fossil organic matter
Ma - megaannum (millions of years)
WPC – weight percent carbonate
V-PDB – Vienna Pee Dee Belemnite
V-SMOW – Vienna Standard Mean Ocean Water

14
DEDICATION
This work is dedicated to my wife, Robin, who has supported me throughout the
process in more ways than I thought possible.

1
Chapter 1
INTRODUCTION
The study of ancient ecosystems is critical to fully understand certain
characteristics of their modern analogues (e.g., the origins of their trophic structure, and
species richness). Knowledge of Earth’s past allows for the testing of hypotheses
regarding specific evolutionary and ecological processes addressed at long temporal
scales. Furthermore, the analysis of fossilized plant and animal remains allows the
investigation of how and when modern ecosystems evolved, whether they are novel or
common, and how vulnerable they may be to change.
Understanding ancient and modern ecosystem organization and function has
become increasingly important for responding to modern environmental issues. One such
issue is the sustainability of tropical forest ecosystems in the face of changing climate
and/or increasing human disturbance from, for example, the introduction of non-native
species. Deep-time paleoecological records from tropical regions provide opportunities to
document the response of species in high diversity communities to such biotic and abiotic
factors. Today, tropical ecosystems are characterized by a high degree of specialization
among herbivorous mammals, which results in resource partitioning, or the systematic
division of available food resources, among herbivore taxa (e.g., Smythe, 1986). If

2
specialization is a universal characteristic of tropical ecosystems, similar resource
partitioning would have existed in analogues found in the geologic past. Furthermore,
specialization has been shown, in some cases, to be associated with a greater
vulnerability to extinction than generalization among co-occurring taxa (e.g., McKinney,
1997). This thesis tests the hypothesis that specialized herbivore niches can be discerned
among the late Paleogene mammals described from Chilga, Ethiopia. The results have
implications for the causes for their differential success across the Paleogene-Neogene
boundary, when mammalian “invaders” arrived from Eurasia.
δ13C and δ18O data were collected from late Oligocene Annonaceae seeds,
lignites, and herbivore tooth enamel from deposits in the Chilga region of Ethiopia.
Specifically, δ13C data were collected in order to test the following hypotheses: (1) the
δ13C values of tooth enamel from a variety of co-occurring mammals at Chilga vary
systematically along taxonomic lines and (2) the δ13C values of plant fossils indicate the
presence of different carbon isoscapes within the Chilga ecosystem. Furthermore, δ18O
data were collected from Arsinoitherium giganteum tooth enamel in order to test the
widely held hypothesis that this species had a semi-aquatic mode of living. If these
hypotheses are not rejected, it would indicate that resource partitioning and specialization
may have existed among the Chilga herbivores. Therefore, the results presented herein
provide new insight into the ecology of Africa’s archaic endemic mammals, including the
extinct herbivore, Arsinoitherium, which has been difficult to study using traditional
techniques due to a limited fossil record and a lack of modern analogues.

3
1.1. The Late Oligocene of the Chilga Basin
The tropical zone of Afroarabia is particularly interesting with regard to
ecosystem dynamics during the Paleogene-Neogene transition. Substantial changes
occurred in large taxonomic groups, both faunal and floral, during this time. These
changes were likely precipitated by the collision of the Afroarabian and Eurasian tectonic
plates which produced a land connection, and therefore a migration route, between these
two regions. Prior to this connection, Afroarabia had been isolated for some 70 million
years since the breakup of Gondwana in the Late Cretaceous (Smith et al., 1994; Figure
1.1). Examples of biotic changes during this time include the loss of some Afroarabian
endemic mammals, such as Arsinoitherium, after the latest Oligocene (Kappelman et al.,
2003; Rasmussen and Gutierrez, 2009), the introduction of Eurasian large-bodied
herbivores, such as perissodactyls, into Africa in the Early Miocene (e.g.,Harris and
Watkins, 1974; James and Slaughter, 1974; Pickford, 2002), and a loss of ecological
dominance by some African plant groups, such as palms (Morley, 2000; Pan et al., 2006).
Understanding the ecological roles of the African endemic taxa prior to contact with
immigrant fauna is critical in shedding light on how resource partitioning may have

Fanpu
co
co
E
E
re
ap
w
al
sa
re
Figure 1.1. Pnd star symbublished by
ontributed to
ompetitors.
Upper
Ethiopia offer
Eurasian imm
egional exten
pproximately
with sedimen
l., 2005). A
ample comfo
ecently revis
Paleomap of bol representBlakey (201
o the differen
r Oligocene
r a unique ch
migrant taxa
nsion caused
y 30 million
nts to a maxim
K-Ar radiom
ormably und
sed to 30.9 (±
Afroarabia ats the Chilga12). Color fig
ntial success
(28-23 Ma)
hance to stud
(Figure 1.1)
d faulting in
n years ago (H
mum thickn
metric age o
derlying thes
±0.5) Ma (un
4
and Eurasia a Basin localgures are av
s of incumbe
continental
dy African p
). The Chilg
the thick flo
Hoffman et
ess of 130 m
f 32.4 (±1.6
se sediments
npublished d
during the Olity. This ma
vailable in th
ent taxa face
strata of the
paleoecology
ga Basin is a
ood basalts th
al., 1997). T
meters (Kapp
) Ma was de
(Kappelman
data, Chris H
Oligocene. Eap is based oe digital cop
ed with immi
Chilga Basi
y prior to the
a graben, wh
hat had blan
The basin w
pelman et al.
etermined fro
n et al., 2003
Hall, Univers
Equator is shoon those py of this the
igrant
in in northw
e arrival of
hich formed a
nketed the ar
as then infill
., 2003; Jaco
om a basalt
3), and more
sity of
own
esis.
west
as
rea
led
obs et
e

5
Michigan). Detrital layers that occur through the overlying sequence have been dated at
between 28.15 (±0.14) and 26.70 (±0.01) Ma (unpublished data, Mark Schmitz, Boise
State University). Furthermore, the magnetic polarity of the sedimentary sequence is
consistent with Chron C9n (Kappelman et al., 2003; Jacobs et al., 2005), dated at
between 27.972 and 27.027 Ma (Cande and Kent, 1995). Thus, the age of the entire
sequence is well constrained to an interval of about 1.5 million years.
Jacobs et al. (2005) summarized the sedimentology and stratigraphy of the Chilga
Basin strata and generally interpreted the depositional environment as having been a
fluvial-lacustrine landscape dominated by overbank and pond deposits. Kaolinitic and
smectitic mudstones are most abundant, along with a variety of paleosols primarily
indicative of poor drainage. Five distinct tuff units were also described. Garcia Massini
et al. (2010) described the flora and sediments related to one of these tuff units, itself
comprised of several distinct airfall and fluvially-reworked ashes, and suggested that the
local ecosystem was significantly disturbed by these events. Such disturbances resulted
in repeated and varied stages of local plant community succession. Nevertheless,
palynological assemblages representing regional vegetation indicate forest communities
persisted. In summary, the Chilga sediments are heterogeneous both vertically and
laterally, even at fine temporal and spatial scales.
The Chilga Basin is rich in fossils, and although sampling has been historically
concentrated on the flora, there has been significant work on the fauna as well. The
paleofloral record suggests that a moist tropical forest occupied this basin, based on the
high proportion of large leaves with entire margins, the high diversity and spatial
heterogeneity of species composition, and the ecology of living relatives, found today

6
primarily in Central, West, and East African forest blocks (e.g., Yemane et al., 1985;
Jacobs et al., 2005; Pan, 2007, Currano et al., 2011). Swampy areas existed as well, as
indicated by laterally variable occurrences of lignites (histosols) within the Chilga
sediments. The fauna generally consists of Afroarabian endemic groups, such as
Hyracoidea, Embrithopoda, and Proboscidea, which are similar to, but more advanced
than, the well-known early Oligocene fauna of the Fayum (e.g., Gagnon, 1997). There
were as yet no Eurasian taxa, such as Rhinocerotidae, Suidae, and Bovidae (Sanders et
al., 2004).
Aside from insect herbivory (Currano et al., 2011), descriptions of faunal-floral
interactions within this ecosystem are lacking. Particularly interesting in this regard is
the poorly-understood feeding behavior of Arsinoitherium (Order Embrithopoda). Court
(1992) showed that the masticatory system of Arsinoitherium was bifunctional in that
food was crudely sliced anteriorly and then processed posteriorly after a repositioning of
the mandibular condyle. This specialized morphology has been used as evidence for
Arsinoitheres having been selective browsers and that they may have been feeding on
specific plants or plant parts (e.g., Court, 1992b). Such specialization could have been a
handicap in the face of Eurasian mammalian immigrants, which may have had a more
diverse diet or one that directly competed with that of the arsinoitheres.
1.2. Stable Isotope Chemistry of Herbivore Tooth Enamel
The stable isotope chemistry of fossil materials can be useful for constraining
specific biological and environmental conditions from the time that the organisms lived,
including the prevalence of resource partitioning among herbivores. These constraints

7
are derived from the ratios of stable isotopes, especially carbon and oxygen, which are
influenced by natural environmental variability of resources (e.g., food, water) as they are
incorporated into an organism’s tissues. For example, the ratios of stable carbon isotopes
collected from herbivore tooth enamel have been used as reliable proxies for whether an
herbivore primarily fed on sub-canopy or canopy vegetation within a closed forest
environment (Cerling et al., 2004).
Stable isotope data are represented using delta (δ) notation and measured as the
difference between the ratios of heavy and light stable isotopes in a sample and those of
an established standard (Equation 1.1). Data are converted to per mil (‰), for
convenience. In this study, stable carbon (δ13C) and oxygen (δ18O) isotope data are
reported and discussed relative to the Vienna Pee Dee Belemnite (V-PDB). However,
when δ18O values are used to investigate water-related processes or conditions, such as
the aquatic lifestyles of animals, values are more typically reported relative to Vienna
Standard Mean Ocean Water (V-SMOW). Therefore, when discussing water δ18O values
herein (e.g., surface water δ18O, body water δ18O), V-SMOW values will be given using
the relationship determined by Coplen et al. (1983; Equation 1.2).
Equation 1.1. Delta (δ) notation:
δ ‰ = (Rsample / Rstandard - 1) * 1000
where R (ratio) = abundance of heavy isotope of interest abundance of light isotope of interest
Equation 1.2. V-SMOW – V-PDB relationship:
δ18OV-SMOW = 1.03091* δ18OV-PDB + 30.91
8
Hydroxyapatite (Ca5[PO4,CO3]3[OH,CO3]) is the primary mineral forming
mammalian bones and tooth enamel, and has been used extensively for δ13C and δ18O
data collection. Compared to bone, tooth enamel is less porous, composed of larger
apatite crystals (~500x; Koch, 1998a), and contains much less organic matter (0.5%
compared to 35%; Bloom and Fawcett, 1975). As a result, enamel is more resistant to
physical and chemical alteration, and has been shown to be a robust archive for certain
paleoclimatic and paleoenvironmental conditions (e.g., Koch, 1998a). This has been
substantiated through the comparison of co-occuring enamel, bone and sedimentary
carbonates: in diagenetic regimes where δ13C and δ18O values of bone were pervasively
altered, enamel values were only slightly shifted (Lee-Thorp and van der Merwe, 1987;
Quade et al., 1992). Furthermore, analyses of co-occurring enamel from ecologically
distinct taxa have yielded the expected isotopic differences, based upon the natural
variability of resources among those ecosystems (Lee-Thorp and van der Merwe, 1987;
Morgan et al., 1994; Bocherens et al., 1996). For these reasons, fossil tooth enamel
specimens were selected for analysis from the Chilga collections.
Generally, the mineralization of hydroxyapatite in individual teeth of medium to
large-bodied mammals can take up to ten to twenty months and finishes before or shortly
after weaning, depending on the tooth type and environmental conditions (Hillson, 1986;
Davis, 1987). Therefore, the ontogeny of a tooth used for stable isotopic study is
important as the chemistry of hydroxyapatite formed before weaning will be influenced
by the metabolisms of both the individual and its mother. However, the teeth of modern
Proboscidea are known to continue to grow throughout the life of the animal, and
permanent cheek teeth of Afrotheria (e.g., Proboscidea, Hyracoidea) have been shown to

9
erupt only after the animal has reached adult size (Asher and Lehmann, 2008).
Therefore, the teeth of these groups record little to no pre-weaning influences.
Hydroxyapatite of modern mammalian enamel has been shown to contain
between 2.2% and 5.2% carbonate, by weight (e.g., Elliot, 1964; LeGeros, 1967, 1991;
Scott and Symons, 1974; Tochon-Danguy et al., 1980; Elliot et al., 1985; Bonar et al.,
1991; Rey et al., 1991; Michel et al., 1995; Koch et al., 1997). In fossil enamel, weight
percent carbonate (WPC) that is outside of this range is regard as an indication that
diagenetic fluids have caused either precipitation of secondary calcite in the enamel,
resulting in higher WPC, or leached carbonate from it, resulting in lower WPC. Both
diagenetic recrystallization or leaching may influence the stable carbon and oxygen
isotope chemistry of the carbonate. However, it has also been shown that WPC can
decrease with age of a living organism by as much as 0.5% (Brudevold and Söremark,
1967). Furthermore, significant taxonomic differences have also been observed. For
example, Rink and Schwarcz (1996) reported WPC values for ungulate enamel which
were significantly higher than those for human enamel.
The δ13C value of hydroxyapatite in herbivore teeth is primarily controlled by the
δ13C values of the plant tissues eaten, offset by a diet-tissue fractionation effect (e.g.,
DeNiro and Epstein, 1978; Vogel, 1978; Tieszen et al., 1979). Cerling and Harris (1999)
determined that this diet-tissue fractionation effect, or isotopic enrichment factor, ε
[ε=(Renamel/Rdiet−1)*1000], for δ13C is ~14‰ in modern ungulates. Similar, but slightly
lower, values have also been obtained for other mammalian taxa (e.g., Koch, 1998a,b).
As a result, it is possible to use tooth enamel δ13C as a proxy for the average δ13C values
of the vegetation consumed by herbivores that lived in a specific location and time. This

10
has significant implications for testing hypotheses regarding past vegetation type and
structure. For example, Cerling et al. (2004) demonstrated the possibility of determining
the ecological source of food eaten by herbivores using the δ13C values of their teeth: the
forest floor, the forest canopy, or in open areas. Similarly, δ13C values could be
diagnostic of the types of plants (C3 or C4) or plant tissues (photosynthetic or other) eaten
by herbivores. However, in order to identify the source of δ13C variation in an
herbivore’s diet, the possible variation in vegetation δ13C must first be appropriately
documented and understood.
Variation among the δ18O values obtained from tooth enamel is much more
complicated, and has been used less extensively as a proxy for paleoecological
conditions. It has been demonstrated repeatedly that the precipitation of biogenic apatite
in invertebrate and lower vertebrate taxa occurs in oxygen isotopic equilibrium with
environmental water and is not significantly influenced by kinetic or biological factors
(e.g., Longinelli and Nuti, 1973; Kolodny et al., 1983; Lécuyer et al., 1996). This has
also been demonstrated for the oxygen in PO4 and CO3 groups of tooth enamel apatite in
mammals (e.g., Bryant et al., 1996; Iacumin et al., 1996; Cerling and Sharp, 1996).
Therefore, for endotherms in which body temperature is constant (e.g., mammalian
herbivores), the δ18O values in pristine tooth enamel carbonate will be related to those of
body water by the following relationship, determined empirically by Epstein et al. (1953)
and reformulated by Hays and Grossman (1991):

11
Equation 1.3. Δ18Owater-carbonate temperature dependence:
T (°C) = 15.7 – 4.36(Δ18O) + 0.12(Δ18O)2
where Δ18O = δ18Oenamel carbonate (V-PDB) – δ18Obody water (V-SMOW)
By substituting a temperature of 37°C, appropriate for an average mammalian body
temperature, and solving for Δ18O:
Equation 1.4. Δ18Owater-carbonate solutions for T = 37°C
Δ18O = (40.695, -4.362)
Finally, solving for δ18Obody water (V-SMOW):
Equation 1.5. Mammalian body water δ18O and tooth enamel carbonate δ18O
δ18Obody water (V-SMOW) = δ18Oenamel carbonate (V-PDB) + 4.362
The second quadratic solution (40.695) does not make sense in this context and is
disregarded.
The δ18O of body water in terrestrial herbivores varies depending on the relative
contributions of ingested water, including local surface water and that from consumed
plant material, and water produced during the metabolic oxidation of organic compounds
(Luz et al., 1984). Therefore, body water δ18O can be used as a rough proxy for surface
water δ18O, given two significant caveats. The first is that δ18O values of free water in
consumed plant material are primarily a function of surface water δ18O, but can increase
significantly if environmental humidity is low and evapotranspiration rates are high (e.g.,
Barbour, 2007). However, this effect may be insignificant for herbivores living in wet
environments. A second caveat is that metabolically-produced water is strongly
influenced by atmospheric O2, which has higher δ18O values compared to typical surface
waters (e.g., Kroopnick and Craig, 1971). Nevertheless, both of these processes,

12
evapotranspiration and metabolic production of water, would ultimately result in higher
body water δ18O values compared to those of local surface water. Therefore, it is fair to
assume that surface water δ18O values would be lower than those of body water to some
degree. In other words, body water δ18O represents a reasonable upper limit for estimates
of surface water δ18O values ingested by a mammal.
Despite these uncertainties in quantifying the sources of oxygen isotopes in body
water δ18O values, there is strong evidence that in large animals it closely tracks that of
ingested water δ18O values (Ayliffe et al., 1992; Bryant and Froelich, 1995). This is likely
due to the increasing importance of liquid water intake relative to respiration rates as
animals attain larger body sizes (Bryant and Froelich, 1995). Therefore, the δ18O values
of body water in large mammals living in humid environments will be most closely
correlated to that of local surface waters. As a result of this, δ18O values within
populations of aquatic mammals, especially those living in water which has relatively
homogeneous 18O/16O ratios (e.g., seawater, large lakes, rivers), vary less than terrestrial
mammals (Figure 1.2; Yoshida and Miyazaki, 1991; Clementz and Koch, 2001;
Clementz et al., 2008). As expected, populations of semi-aquatic mammals, such as
hippopotamids, have yielded intermediate values. Therefore, not only can the δ18O values
of large herbivores be used as proxies for surface water δ18O, but the degree of variation
within a population can be an indicator of aquatic or terrestrial habit.

F(hdm
1
1
C
A
(e
Figure 1.2. Vhippopotamieviation (1S
mean. Modif
.3. Vegetati
There
.1). Conside
CO2, it follow
Atmospheric
e.g., massive
Variation in δids), and terr
S) of n populfied from Cle
on δ13C wit
are many fa
ering that mo
ws that the do
δ13C values
e burial of or
δ18O within prestrial mamations and erementz et al
thin Tropica
actors that ca
ost plants ob
ominant infl
are primaril
rganic matte
13
populations mmals. Filled
rror bar repr. (2008).
al Ecosystem
an influence
btain carbon
luence on pla
ly controlled
er, volcanic o
of aquatic, sd boxes repreresents one s
ms
δ13C values
almost excl
ant δ13C valu
d by large-sc
outgassing, a
semi-aquaticesent the mestandard dev
s among veg
lusively from
ues is atmos
cale geologic
and changes
c ean standardviation above
getation (Tab
m atmospher
spheric δ13C.
cal processes
in weatherin
d e this
ble
ric
.
s
ng

14
Table 1.1. Influences on plant δ13C values. Significant influences on δ13C values among plants within terrestrial ecosystems and magnitude of influence possible among the Chilga flora. † “Canopy effect” includes the effects of respired CO2 and lower irradiance levels, see text for more.
INFLUENCING FACTOR RESULT MAGNITUDE
atmospheric δ13C ↑ = ↑ δ13C1‰ in OligoceneTipple (2010)
diagenesis variable variable
photosynthetic pathway δ13CC4 < δ13CCAM < δ13CC310-15‰
Smith and Epstein (1971)
plant tissue type δ13Cphotosynthetic < δ13Cother1-2‰
Cernusak et al. (2009)
“canopy effect”† ↑ = ↓ δ13C10-15‰
Cerling et al. (2004)
salinity ↑ = ↑ δ13C10‰
Guy et al. (1980)
nutrient availability ↑ = ↑ δ13C5‰
Sparks and Ehleringer (1997)
water stress ↑ = ↑ δ13C2‰
Ehleringer et al. (1993)
elevation ↑ = ↑ δ13C1‰ per km
Körner et al. (1991)
latitude ↑ = ↑ δ13C1‰ per 20°
Körner et al. (1991)
BIO
LO
GY
GE
OL
OG
Y
CL
IMA
TE
EN
VIR
ON
ME
NT
rates), but can be influenced slightly by significant changes in the composition of
terrestrial vegetation (Kump and Arthur, 1999). Nevertheless, considering the fine
temporal resolution of this study, any variation in δ13C of terrestrial vegetation is not
likely to be the result of these large-scale factors. Furthermore, previous studies have not
provided strong evidence for significant change (>1‰) in atmospheric δ13C during the
Late Oligocene interval represented by Chilga strata (Figure 1.2; Tipple et al., 2010).

p
w
an
in
at
gr
T
v
th
re
pr
Ffrti
After
lants is the c
with C3 and C
nd Epstein,
nto tissues, δ
tmospheric C
reater degree
Therefore, the
alues occur
hird type of p
elatively few
roduced dur
Figure 1.3. Arom foraminime represen
atmospheric
carbon-isotop
C4 photosynt
1971; O’Lea
δ13C values o
CO2 than tho
e of carbon i
e lower δ13C
in C4 plants
photosynthe
w plant taxa a
ring respirati
Atmospheric nifera δ13C vanted by Chilg
c δ13C variat
pe fractionat
thetic pathwa
ary, 1988). O
of C4 plants m
ose of C3 pla
isotope discr
C values occu
(~ -13‰ ± 5
sis, crassula
and yields in
ion.
CO2 δ13C va
alues; gray pga Basin sed
15
ion, the next
tion effect o
ays producin
Owing to the
more closely
ants. More s
rimination th
ur in C3 plan
5‰; O’Lear
acean acid m
ntermediate v
alues duringpoints show diments is sh
t greatest inf
f carbon fixa
ng different
eir higher eff
y resemble th
simply, C3 ph
han that of C
nts (~ -27‰
ry, 1988; Tie
metabolism (C
values due to
g the Oligocepossible erro
hown by the
fluence on th
ation during
results (Ben
ficiency at in
he δ13C valu
hotosynthes
C4 photosynt
± 5‰), and
eszen and Bo
CAM), is uti
o the recycli
ene. Values wor (Tipple etshaded regio
he δ13C valu
g photosynth
nder, 1968; S
ncorporating
ues of
is results in
thesis.
the higher
outton, 1989
ilized by
ing of some
were calculat al., 2010). on.
ues of
esis,
Smith
g CO2
a
9). A
CO2
ated The

16
Another important biotic factor that influences δ13C values of plants is the plant
tissue type analyzed. Photosynthetic tissues (primarily mature leaves) consistently yield
δ13C values about 1-2‰ less than non-photosynthetic tissues such as roots, stems, fruits
and seeds from the same plant (e.g. Yoneyama and Ohtani, 1983; Farquhar and Richards,
1984; Scartazza et al., 1998; Yoneyama et al., 1998, 2000; Barbour et al., 2000;
Behboudian et al., 2000; Brugnoli and Farquhar, 2000; Cernusak et al., 2002; Badeck et
al., 2005). Several hypotheses have been put forth to explain this difference in δ13C
values among plant organs, the most plausible of which were summarized by Cernusak et
al. (2009):
1. variation in biochemical constituents (e.g., cellulose, lignin, etc.) between
photosynthetic and non-photosynthetic tissues,
2. temporal differences between the growth of photosynthetic and non-
photosynthetic tissues (growth occurs under different seasonal or daily conditions),
3. non-photosynthetic tissues produce and retain more organic molecules
derived from PEP carboxylase than photosynthetic tissues, and
4. changes in carbon fixation in photosynthetic tissues as they mature.
Many environmental variables also affect the degree of fractionation resulting
from photosynthesis. Plant δ13C values have been shown to be positively correlated with
water stress (Farquhar and Richards, 1984; Ehleringer and Cooper, 1988; Read et al.,
1991, 1992; Ehleringer et al., 1993), nutrient availability (Sparks and Ehleringer, 1997),
salinity (Guy et al. 1980, Farquhar et al., 1982), and irradiance levels (Zimmerman and
Ehleringer, 1990; Berry et al., 1997; Buchmann et al., 1997). At temperatures above

17
20°C, Troughton and Card (1975) observed very little variation in δ13C resulting solely
from changes in temperature.
Plant δ13C values are consistently more negative in closed canopy forests
compared to those from open forests or clearings (e.g., Medina and Minchin, 1980;
Medina et al., 1986; van der Merwe and Medina, 1989; Farquhar et al., 1989; Von
Fischer and Tieszen, 1995; Berry et al., 1997). This is due to the prevalence of soil-
respired CO2 under a closed canopy as well as lower irradiance levels, which both result
in lower δ13C values. For example, Cerling et al. (2004) reported plant δ13C values as
low as -36‰ in closed canopy forests while plant δ13C values averaged -25‰ in open
areas. That study also described a similarity between this horizontal isotopic gradient and
the vertical isotopic gradient of the closed-canopy forest itself. That is, they observed
much more negative values at the forest floor compared with those in the canopy, which
were similar in value to open areas.
It has also been shown that δ13C values in leaves generally vary linearly with
changes in latitude and elevation (Körner et al., 1991). This result is attributed to a
relationship between air temperature and the efficiency of carbon fixation by Rubisco
during photosynthesis. However, this variation only amounts to about 1‰ increase per
20º increase in latitude or kilometer increase in elevation, on average (Körner et al.,
1991). Although Körner et al. (1991) analyzed leaf chemistry exclusively, similar
variations would be expected in other plant tissues.
Of all these factors influencing vegetation δ13C, only a few need to be considered
for the study of plant fossils from Chilga. During the late Oligocene, atmospheric CO2
δ13C values were near the modern, pre-industrial value of -6.5‰ (e.g., Marino et al.,

18
1992; Francey et al., 1999) and there is no reason to suspect that it varied more than
0.8‰ during the time represented by Chilga strata (Figure 1.2; Tipple et al., 2010).
Evidence for the diversification of C4 plants and their rise to ecological significance
occurs much later in the Cenozoic than the fossils analyzed here (Morgan et al., 1994;
Cerling et al., 1997; Strömberg, 2005; Bouchenak-Khelladi et al., 2009). Considering the
proximity of the Chilga strata to the equator (Figure 1.1), there should not be a latitudinal
effect on vegetation δ13C but some of the palynology of the sediments suggests that they
were deposited at an elevation of about 1000 meters (Yemane et al., 1985), which would
increase vegetation δ13C by about 1‰ compared to similar vegetation at sea level under
modern conditions(Körner et al., 1991). Salinity, nutrient availability, and water stress
were not likely to have modified vegetation δ13C, because the ecosystems represented by
the Chilga fossils are all moist tropical forests and swamps (e.g., Yemane et al., 1985;
Jacobs et al., 2005; Pan, 2007, Currano et al., 2011). Therefore, variation among the δ13C
values in the fossil plants and associated herbivore teeth may provide insights into
differences in plant tissue type (photosynthetic or non-photosynthetic), forest canopy
structure (soil-respired CO2 and irradiance level effects), and plant tissue source (near-
ground or canopy). Finally, as with any analysis of geologic material, diagenetic
alteration must be considered.
1.4. Surface Water δ18O
Terrestrial surface water δ18O is primarily controlled by meteoric water δ18O,
except where shallow hydrothermal or artesian systems exist. Gat (1996) provided a
thorough review of isotopic fractionation effects of meteoric water δ18O, but for the
19
purposes of this study only a few need be mentioned. In general, evaporation of surface
ocean waters are the principal source of atmospheric moisture. Some studies (e.g., Veizer
et al. 1997, 1999; Veizer and Mackenzie, 2004; Wallmann, 2001) posit that seawater
δ18O has changed significantly during the Phanerozoic as a result of tectonic processes,
which drive long-term exchange of lithosphere and hydrosphere components.
Nevertheless, more robust evidence suggests that fluid-rock interactions within the
hydrothermal systems along mid-ocean ridges have buffered seawater δ18O values during
most of Earth’s history (Gregory and Taylor, 1981). Today, seawater has a δ18O value of
0‰ (V-SMOW).
Aside from the unlikely change in seawater δ18O, two physical processes are
primarily responsible for differences in the 18O content of meteoric water through time
and space: evaporation and precipitation. The initial evaporation of seawater results in
lower δ18O values in the atmospheric water vapor compared to seawater (or other source
waters) and precipitation of water vapor results in lower δ18O values in the remaining
water vapor. Therefore, the δ18O of a given air mass will initially be less than that of
seawater and will continually decrease as precipitation occurs during the transport of the
air mass. From this, we can predict that tropical precipitation δ18O will be nearer to that
of seawater than temperate or polar precipitation. This relationship has been documented
repeatedly (e.g., Craig, 1961; Figure 1.4).

FM
In
li
in
h
T
at
pr
th
Figure 1.4. MModified from
Consi
ndian Ocean
ikely had a δ
nfluenced the
eavy rainfall
Turkana Basi
ttributed this
recipitation
he water vap
Map of modem Bowen et
idering the p
n, the precipi
δ18O value ne
ese initial va
l, which low
in in East Af
s to variation
δ18O in mod
por in the sou
ern precipitatal. (2005).
proximity of
itation that p
ear that of se
alues: evapor
wers it. Cerli
frica that sug
ns in evapora
dern tropical
urce air mass
20
tion δ18O va
the Chilga f
produced the
eawater. Ho
ration, whic
ing et al. (19
ggested paleo
ative regime
regions duri
s, much low
alues. Only c
fossil localiti
surface wat
owever, two
h increases s
988) reported
olake water
e. Dansgaard
ring the rainy
wer than othe
continental d
ies to the equ
ters of intere
processes m
surface wate
d δ18O value
varied by ov
d (1964) sho
y season can
erwise expec
data are show
uator and the
est in this stu
may have
er δ18O, and
es from the
ver 10‰ and
owed that
n approach th
cted.
wn.
e
udy
d
hat of

21
Chapter 2
MATERIALS AND METHODOLOGY
All of the specimens described and analyzed for this study were collected from
nineteen localities mainly in two areas of the Chilga region of northwest Ethiopia: one
area along the Guang River, and the other approximately ten kilometers to the north in
the Kahar Valley (Table 2.1; Figure 2.1). The Guang River localities have been studied
extensively and occur in a sequence of sedimentary strata deposited on Oligocene
weathered basalts of the Ethiopian Plateau (e.g., Jacobs et al., 2005, Garcia Massini et al.,
2006; Garcia Massini et al., 2010; Pan, 2007, Currano et al., 2011). Recent 40Ar/39Ar
analyses date the Chilga basalts to ~31.0 Ma (30.9 ± 0.5 and 31.5 ± 0.7; Christopher Hall,
pers. comm.), an improvement upon a whole rock K/Ar age reported previously (32.4
±0.11, Kappelman et al., 2003; Jacobs et al., 2005), which is consistent with dates
reported from other localities on the Ethiopian Plateau (Hoffman et al., 1997). The
fossils considered here are from localities stratigraphically between Ash IV and Ash V,
which are dated by 238U/206Pb at 27.36 ±0.11 and 26.70 ±0.01 Ma, respectively (Jacobs et
al., 2005; Mark Schmitz, pers. comm.). Thus, the fossils span a maximum time interval
of 0.78 million years. The Kahar Valley localities have not been studied in as much
detail and their precise stratigraphic relationship to the Guang River localities is

22
Table 2.1. Fossil localities. A, Guang River localities; B, Kahar Valley localities. “Notes” column lists the type of fossil collected for analysis at each of these localities: A=fossil seed (Family Annonaceae); E=enamel.
SITE LATITUDE LONGITUDE NOTESCH3 12.51210 37.12291 E
CH4 12.51005 37.11558 E
CH7 12.50938 37.15983 E
CH8 12.48883 37.20050 E
CH9 12.51262 37.12087 E
CH10 12.51325 37.12058 E
CH15 12.51183 37.12128 E
CH18 12.51172 37.12317 A
CH62 12.50152 37.11668 E
CH83 12.51828 37.12392 A
SITE LATITUDE LONGITUDE NOTESCH25 12.59547 37.16115 E
CH26 12.60237 37.16143 E
CH27 12.60285 37.16220 E
CH28 12.60200 37.16790 E
CH34 12.60295 37.16722 E
CH35 12.60263 37.16792 E
CH64 12.60595 37.17127 E
CH71 12.58872 37.16690 E
CH75 12.58730 37.16653 E
A. GUANG RIVER
B. KAHAR VALLEY

FMd
Figure 2.1. FMapping Aut
igital copy o
Fossil localitythority (2004of this thesis
y map. Non-4) and Goog.
23
-locality datale Inc. (2011
a (e.g., topog1). Color fig
graphy) fromgures are ava
m Ethiopian ailable in thee

24
unknown, but 238U/206Pb ages on volcanic sediments from the Kahar sequence provide an
age of 28.15 ± 0.14 Ma (Schmitz, pers. comm.) Furthermore, lignite samples were not
collected from named Chilga localities, but were collected along the Guang River
upstream of CH62.
The Chilga localities were labeled sequentially during field seasons spanning
several years and do not indicate stratigraphic order. Furthermore, although all of the
localities are known to be within the stratigraphic section described and dated (see
Chapter 1), the stratigraphic position of each locality was not known at the time of this
writing. This provides an opportunity for continuing this work in further detail to refine
interpretations by investigating temporal relationships on a finer scale.
2.1. Plant Specimens
Thirty-three specimens consisting of seeds and lignites were selected for this
study to capture the variation in organic δ13C values across the paleolandscape (Table
2.2). The seeds are likely from a better drained forest environment compared to the
lignites, which would have formed in a lowland, swampy setting. Therefore, these two
classes of specimens are meant to sample the expected variation in δ13C values from
forest to swamp across the Chilga Basin during the late Oligocene.
Eighteen fossil seeds were selected for this study due to the presence of well-
preserved organic matter in their interior, presumably the inner integument, or on their
surface, presumably the preserved seed coat. These seeds display a unique ruminate
pattern that appears to be similar among all of the specimens. Where not covered by
matrix, a perichalazal ring is also regularly observed. These characters clearly diagnose

25
Table 2.2. Plant specimens. Specimen IDs used by Danehy (2010) also given for applicable lignite specimens; see text for further explanation. *The seed coat (“c”) and integument (“i") of specimen CH018-303 were sampled. † Monocot macrofossils were subsampled from lignites CH38L, CH41L, and DDCH6L.
SPECIMEN SPECIMENDANEHY
(2010)CH018-056 CH25L DDCH‐7L (Type I)CH018-123 CH38L-monocots† DDCH‐8L (Type I)CH018-154 CH38L-bulk† DDCH‐8L (Type I)CH018-163 CH41L-monocots†
CH018-237 CH41L-bulk†
CH018-265 CH50L DDCH‐2 (Type II)CH018-276 CH52L
CH018-303c* CH72L
CH018-303i* CH76L
CH018-305 CH84L
CH018-313 CH120L
CH018-323 CH122L
CH018-392 DDCH5L
CH018-437 DDCH6L-monocots†
CH018-487 DDCH6L-bulk†
CH018-656
CH083-001
CH083-002
FO
SSIL
AN
NO
NA
CE
AE
SE
ED
S
LIG
NIT
ES
the seeds as belonging to the family Annonaceae (“custard apple family”; de Jussieu,
1789). Containing about 128 genera and 2200 species, Annonaceae is the most diverse
family belonging to the order Magnoliales, a basal clade of the angiosperms, and has a
primarily tropical distribution anchored in three distinct regions: Southeast Asia and
Oceania, Africa, and South America (Kessler, 1993).
The most comprehensive cladistic analysis of Annonaceae taxa yet conducted –
79 morphological characters scored for 40 Annonaceae groups – yielded 180 most-

26
parsimonious trees of 425 steps. Although homoplasy is high in Annonaceae, resulting in
a consistency index (CI) of 0.27, all of the trees are broadly similar in consisting of four
main clades: Anaxagorea (basal clade), Ambavioid, Malmea-Piptostima-Miliusa (MPM),
and the inaperturate pollen clade representing Artabotrys, Hexalobus, Isolona,
Monodora, and many (>10) other genera (Doyle and Le Thomas, 1994). These results are
supported by more recent analyses, including those utilizing molecular data (e.g., Doyle
et al., 2000, 2004; Couvreur et al., 2008).
Fruit morphology can be highly variable across taxa, but the seeds of living
Annonaceae are similar to one another in having a ruminated endosperm, an integument
crushed between the endosperm ruminations, and a perichalazal ring defined as a
vascular bundle that circumscribes the seed along the raphe (Kessler, 1993). Besides the
poorly developed, irregular ruminated endosperm (Figure 2.2a) of the basal Anaxagorea
and Ambavia clades, which are shared with sister families of the Annonaceae (e.g.,
Myristicaceae), there are two distinct endosperm morphologies: spiniform and
lamelliform. Spiniform morphology manifests as spine-like structures radiating outward
from the center in all directions to the surface of the seed, resulting in a punctate
appearance on the seed exterior (Figure 2.2b). Lamelliform morphology develops as

Fremcrth
Figure 2.2. Memoved to il
manausensis)rispiflorus). his thesis.
Modern Annollustrate endo); B, spiniforScale bars r
onaceae seedosperm morprm (Polycerarepresent 1m
27
d morphologphology typatocarpus sc
mm. Color fig
gy. Specimees; A, irregucheffleri); C,gures are ava
ens shown wular (Anaxag, lamelliformailable in the
with seed coagorea m (Hexalobue digital cop
at
us py of

FiD
ro
p
fo
is
th
cl
gure 2.3. AnDoyle et al. (2
oughly disk-
erpendicular
olded appear
Accor
s restricted to
hree separate
lade (Figure
nnonaceae c2004).
-like structur
r to the peric
rance of the
rding to the p
o the MPM c
e lineages – t
e 2.3). There
ladogram sh
res oriented r
chalazal ring
endosperm s
previously m
clade, and th
twice in the
efore, the ru
28
howing endo
radially from
g (Figure 2.2
surface.
mentioned ph
he lamellifor
MPM clade
umination ch
osperm morp
m the central
2c). This mo
hylogenetic w
rm morpholo
e, and basally
haracter of A
phology. Mo
l axis of the
orphology re
work, spinif
ogy has origi
y in the inap
Annonaceae s
odified from
seed and
esults in a de
form morpho
inated in at l
perturate poll
seeds may be
eeply
ology
least
len
e a
FladU
u
sh
sh
on
sp
an
(2
C
(F
C
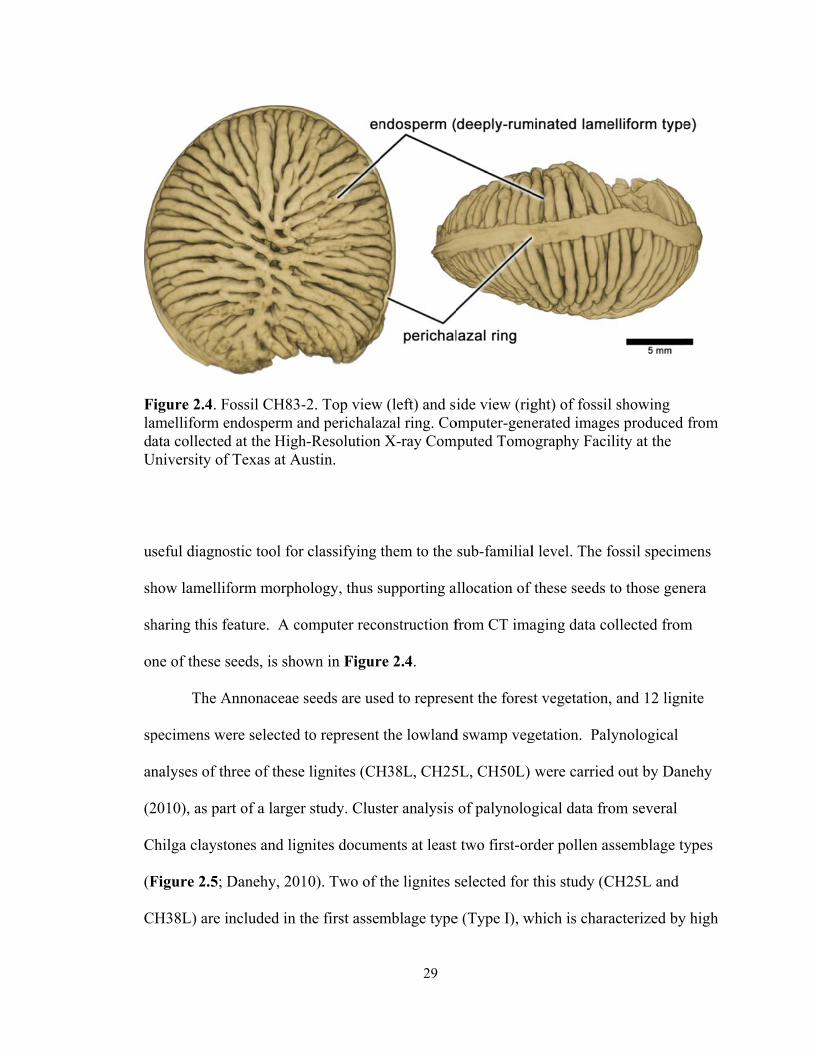
Figure 2.4. Famelliform eata collected
University of
seful diagno
how lamellif
haring this fe
ne of these s
The A
pecimens we
nalyses of th
2010), as par
Chilga claysto
Figure 2.5; D
CH38L) are i
Fossil CH83-endosperm and at the Highf Texas at Au
ostic tool for
form morpho
feature. A co
seeds, is show
Annonaceae s
ere selected
hree of these
rt of a larger
ones and lig
Danehy, 201
included in th
-2. Top viewnd perichala
h-Resolutionustin.
classifying
ology, thus s
omputer reco
wn in Figur
seeds are use
to represent
e lignites (CH
r study. Clus
nites docum
10). Two of t
he first assem
29
w (left) and siazal ring. Con X-ray Com
them to the
supporting a
onstruction f
re 2.4.
ed to represe
the lowland
H38L, CH25
ster analysis
ments at least
the lignites s
mblage type
ide view (rigomputer-gene
mputed Tomo
sub-familial
allocation of
from CT ima
ent the fores
d swamp veg
5L, CH50L)
of palynolog
t two first-or
selected for
e (Type I), w
ght) of fossilerated image
ography Faci
l level. The f
these seeds
aging data co
st vegetation
getation. Pal
were carried
gical data fro
rder pollen a
this study (C
which is char
l showing es produced ility at the
fossil specim
to those gen
ollected from
, and 12 lign
lynological
d out by Dan
om several
assemblage ty
CH25L and
acterized by
from
mens
nera
m
nite
nehy
ypes
y high

30
proportions (40-50% of total count) of pollen from order Poales (Small, 1903), including
families Cyperaceae (“sedge family”; de Jussieu, 1789) and Poaceae (“grass family”;
Barnhart, 1895). A third lignite selected for this study, CH50L, is included in the other
pollen assemblage type (Type II), which is more cosmopolitan with very low proportions
of Poales. Finally, along with analyzing bulk samples from all 12 of the lignite
specimens, three of them, CH38L, CH41L, and DDCH6L, were subsampled for
individual monocot macrofossils (Figure 2.6). These monocot fossils were individually
analyzed to test for the presence of C4 plants in the Chilga ecosystem, as they represent
the likeliest specimens to have utilized C4 photosynthesis.

31
Fig
ure
2.5
. Chi
lga
paly
nolo
gy a
nd C
ON
ISS
ana
lysi
s re
sult
s. M
odif
ied
from
Dan
ehy
(201
0); A
, his
togr
am
show
ing
rela
tive
pol
len
perc
enta
ges
of th
e 14
mos
t abu
ndan
t eco
logi
cal i
ndic
ator
s in
eac
h sa
mpl
e (l
ocal
ity)
; B,
dend
rogr
am s
how
ing
resu
lts
of c
onst
rain
ed in
crem
enta
l sum
of
squa
res
(CO
NIS
S)
anal
ysis
. L
igni
tes
are
deno
ted
by “
L”
suff
ix a
nd r
emai
ning
sam
ples
wer
e ta
ken
from
cla
ysto
nes.
Dot
s in
dica
te ta
xa r
epre
sent
ing
less
than
two
perc
ent o
f to
tal s
um.
“Typ
e I”
and
“T
ype
II”
are
term
s de
fine
d in
this
wor
k, n
ot th
at o
f D
aneh
y (2
010)
.

32
Figure 2.6. Lignite sample from CH41L showing preserved monocot macrofossils that were specifically analyzed for δ13C (CH41L-monocots) in addition to the bulk lignite (CH41L-bulk). Color figures are available in the digital copy of this thesis.
2.2. Preparation and Analysis of Organic Samples
The stable isotope analysis of the fossil organic matter was conducted following a
slightly modified version of that used by Boutton (1991). All glassware was sterilized
with concentrated hydrogen peroxide (40% H2O2) in order to remove labile organic
matter, and was covered with aluminum foil that had been pretreated with acetone to
remove any potential organic contaminants in order to prevent airborne contaminants
mixing with the samples. Organic samples were then ground to a powder with a
sterilized mortar and pestle, if necessary, and reacted with concentrated hydrochloric acid
(2M HCl) for four hours in order to remove any calcite that may have been present. After
treatment, samples were rinsed with deionized water using a centrifuge until the pH

33
reached that of the deionized water; between three and five rinses were typically
necessary.
Two methods were utilized for CO2 extraction and analysis. Annonaceae seed
samples were combusted using a Costech Elemental Combustion System and evolved
CO2 was analyzed by a Finigan MAT 253 isotope ratio mass spectrometer. For these
analyses between 0.5 and 2 mg of each sample was placed in a tin capsule, which was
folded and compressed as tightly as possible, and loaded into a sample carousel. These
were then combusted and analyzed in batches varying from 12 to 40 samples. Lignite
samples were analyzed using off-line extraction techniques and individually analyzed
using a Finigan MAT 252 isotope ratio mass spectrometer. First, 15-20 cm long vycor
tubes (9mm o.d., 7mm i.d.) were sealed on one end and sterilized in a furnace at 900° C
for one hour to remove any organic contaminants. Approximately one gram of copper
oxide followed by 5-20 grams of sample (depending on expected carbon content), and 0.5
grams of granular copper were placed in the tube, which was then sealed under vacuum.
Samples were then combusted in batches of 8-12 in a furnace at 900°C for two hours.
The temperature was then slowly brought down to 650°C over a four hour period
(approximately 1°/min) and maintained at that temperature for two more hours. This
combustion technique has been shown to eliminate halogens and converts CO to CO2,
nitrous oxides to N2, and sulfurous oxides to CuSO4, resulting in the presence of only
CO2, H2O, and N2 gasses (Boutton, 1991). Carbon dioxide was then separated
cryogenically from the evolved gas, measured manometrically to determine CO2 yields,
and analyzed for carbon isotope ratios.

34
2.3. Vertebrate Specimens
The overwhelming majority of the fossil vertebrate specimens described from the
Chilga Basin belong to the superorder Paenungulata (Simpson, 1945), including members
of the Proboscidea, Hyracoidea, and Embrithopoda (Chilga Catalog, 2012). These fossils
provide an opportunity to test the current understanding of the relationships among these
African endemics and the ecosystems in which they lived.
Simpson’s (1945) description of Paenungulata as a monophyletic group has been
substantiated by recent morphologic and phylogenetic analyses (e.g., Court, 1989, 1990,
1992a; Asher et al., 2003; Gheerbrant et al., 2005; Asher, 2007; Seiffert, 2007; Tabuce et
al., 2007). These have shown that this superorder consists of the Orders Embrithopoda,
Proboscidea, Sirenia, Desmostylia, and Hyracoidea. Furthermore, phylogenies
constructed using DNA sequence data from modern taxa suggest that Paenungulata
belong to the clade Afrotheria along with Macroscelidea, Afrosoricida, and
Tabulidentata, other Afroarabian endemics (Murphy et al., 2001; Springer et al., 2003).

35
Table 2.3. Tooth enamel specimens. ID: bold font indicates Guang River specimens, regular font indicates Kahar Valley specimens. References ("Ref"): 1 = Sanders et al. (2004), 2 = Chilga Catalog; 3 = Dr. Neil Tabor, Southern Methodist University, pers. comm.
CH3-1a distal half of upper molar, probably M3 1CH3-16 lower molar fragment 1CH3-55 tooth fragment 2CH8-3 molar fragment 2CH9-12 right p1 1CH9-31 lower molar fragment 2CH9-32 molar fragments 2CH9-38b dentine and enamel fragments 2CH10-9 molar fragments 2CH10-18b lower molar (partial) 2CH15-23 enamel fragment 2CH25-18 right p2 or p3 1CH27-2 molar fragment 2CH64-V2 molar 2CH71-1 enamel flake 2CH71-12 premolar series in matrix 2CH7-3a upper molar 2CH7-3b lower left molar 2
Bunohyrax indet. CH34-200 none 2Saghatheriidae Megalohyrax indet. CH28-2 m2 2
CH7-2 tooth cusp 2CH4-2L left P4 1CH9-7 left P3 1CH35-1 right M3 1CH4-34 tooth fragment 3CH75-10 molar fragment 3
sp. nov. B CH4-33 molar fragment 2CH25-21 molar fragment 2CH8-14 none 3CH15-13 cusp fragment 2CH9-24 deciduous molar fragments 2CH26-2 molar fragment 2CH34-2 molar fragment 2CH62-1 molar fragment 2CH71-19 tooth fragment 3
REFORDER FAMILY GENUS SPECIES ID DESCRIPTION
giganteum
Hyracoidea Geniohyidae Pachyhyrax indet.
indet.
Embrithopoda Arsinoitheriidae Arsinoitherium
Proboscidea Deinotheriidae Chilgatherium harrisi
Gomphotheriidae Gomphotherium indet.
Palaeomastadontidae Palaeomastadon
indet.
indet.

36
Fifteen specimens of Arsinoitherium giganteum from nine localities were sampled
for this study (Table 2.3). Arsinoitheres (Order Embrithopoda, Andrews [1906]; Family
Arsinoitheriidae, Andrews [1904]) are a group of poorly understood, large bodied
mammals that were most closely related to either the proboscideans (Asher, 2007) or
sirenians (Seiffert, 2007), or were a distant sister group to both (Tabuce et al., 2007).
Fossils of Arsinoitherium (Beadnell, 1902), the most well-known genus of the
arsinoitheres, occur in Eocene and Oligocene sediments that range from Egypt (late
Eocene to early Oligocene; e.g., Beadnell, 1902; Andrews, 1906; Holroyd and Maas,
1994; Gagnon, 1997), Oman (late Eocene; Thomas et al., 1999; Seiffert, 2006; Al-Sayigh
et al., 2008), Angola (Oligocene; Pickford, 1986, 1987), Libya (Wight, 1980), Kenya
(late Oligocene; Boschetto et al., 1992; Gutiérrez and Rasmussen, 2007), and Ethiopia
(late Oligocene; Kappelman et al., 2003; Sanders et al., 2004). The youngest fossils
described are latest Oligocene in age, between 27.5–24.0 Ma (Gutiérrez and Rasmussen,
2007). Therefore, although the Arsinoitherium fossils in this study provide an opportunity
to study this group near the end of its existence.
Arsinoitherium was very large, weighing approximately 2000 kg, and was most
uniquely characterized by a pair of massive horns which projected from its skull.
Thenius (1969) reported characteristics of heavy dental wear in arsinoithere teeth and
concluded that this was the result of foraging on abrasive vegetation in a fully terrestrial
environment. In contrast, due to their occurrence in fluvial sediments and the functional
morphology of their post-cranial anatomy, it has been argued that they lived semi-aquatic
lifestyles (Moustapha, 1955; Sen and Heintz, 1979; Court, 1993). Nevertheless,

37
Figure 2.7. Arsinoitherium zitteli mandible. A, posterior view of mandibular condyle; B, lateral view of mandible. Modified from Court (1992b).
Sanders et al. (2010b) argued that although arsinoitheres were probably not capable of
prolonged walking or running, their skeletal features are consistent with terrestrial
quadripedalism.
Another interesting feature of arsinoitheres is their dental anatomy. Court
(1992b) analyzed the occlusal dynamics of the molars and premolars and concluded that
while feeding, the premolars were first used to slice through bulky items, such as fruits,
and food was more finely processed by the molars after repositioning the mandibular
condyle. This unique masticatory system, coupled with the presence of a somewhat
narrow muzzle and enlarged central incisors, were interpreted by Court (1992b) as
consistent with a specialized foraging strategy.

38
Fourteen proboscidean (Order Proboscidea; Illiger, 1811) specimens were
sampled for this study: three from Family Deinotheriidae (Bonaparte, 1845), two from
Family Gomphotheriidae (Hay, 1922), four from Family Palaeomastodontidae (Andrews,
1906), and five that are indeterminate at the family level. Although these latter specimens
were only classified to order, they were analyzed and the data reported herein to assess
whether significant variation in δ13C values of enamel carbonate occurred among the Late
Oligocene Proboscidea.
The three Deinotheriidae specimens are the only proboscidean teeth to be
classified to species, having been identified as Chilgatherium harrisi (Sanders et al.,
2004). Only known from the Chilga deposits, Chilgatherium harrisi is currently the
oldest known deinothere taxon, and may have been the smallest of all deinothere taxa.
The Chilga gomphotheres were described by Sanders et al. (2004), but only a few dental
remains have been found, so it is uncertain how the Chilga specimens relate to other
members of the Gomphotheriidae. Nevertheless, they represent the oldest known
gomphothere-like proboscideans. All four of the Palaeomastodontidae specimens are
Palaeomastodon (Andrews, 1901), but are not identified to species level. Sanders et al.
(2004) report that the Chilga Palaeomastodon specimens belong to one or two new
species.
Six specimens of the Hyracoidea (Huxley, 1869), six specimens were selected:
three from Geniohyidae (Andrews, 1906), one from Saghatheriidae (Andrews, 1906), and
two that are indeterminate at the family level. As with the indeterminate proboscidean
specimens, these indeterminate hyracoids were included in this study to assess the
variation among the fauna within the order.

39
The Geniohyidae specimens consist of two Pachyhyrax (Schlosser, 1910) and one
Bunohyrax (Schlosser, 1910), and the Saghatheriidae specimen is identified as
Megalohyrax (Andrews 1903). However, none of these is classified to species.
Compared to that of Bunohyrax, the dentition of Pachyhyrax is characterized by more
molariform pre-molars and molars with more shearing crests (see Rasmussen and
Gutierrez, 2010), suggesting that the diet of Pachyhyrax consisted of tougher material
requiring more intense processing than that of Bunohyrax. This provides evidence for
differential foraging behavior among the Geniohyidae from Chilga. Megalohyrax fossils
from the Eocene of the Fayum (e.g., Andrews 1904, 1906; Schlosser, 1910) and those
from Chilga are similar, suggesting that this taxon was successful in whatever role it
played in these ecosystems.
2.4. Preparation and Analysis of Enamel Samples
Thirty-six tooth specimens were collected and drilled in preparation for stable
isotope analysis. The preparation and analysis of these samples was conducted following
a slightly modified version of that used by Koch et. al (1998). First, the drilling site of
each specimen was cleaned using hydrogen peroxide or acetone to remove any possible
organic contaminants. Enamel samples were then collected from the specimen using a
Dremel tool; inclusion of dentin and cementum was avoided when possible. Samples
were then pulverized with a mortar and pestle, if necessary, to produce a powder. To
remove organic contaminants and diagenetic carbonates, all samples were soaked in
concentrated hydrogen peroxide (40% H2O2) for 24 hours and dilute acetic acid (10%
CH3COOH) for 24 hours, respectively. After each chemical treatment, samples

40
underwent successive rinses with deionized water until the pH reached that of the
deionized water; between three and five rinses were typically necessary. Treated enamel
samples were placed in glass reaction vessels and reacted with 100% orthophosphoric
acid (H3PO4) at 25°C for 24 hours. Carbon dioxide was then separated cryogenically
from the evolved gas and analyzed. During the cryogenic separation process, the amount
of evolved CO2 was measured in order to determine the weight percent carbonate (WPC)
of each enamel sample using the following relationship:
Equation 2.1: Weight Percent Carbonate (WPC)
WPC (%) = (nCO2 * Mc / msample) *100
where n is the number of mols of CO2 evolved, Mc is the molar mass of
carbonate, and m is the mass of the powder sample.

41
Chapter 3
RESULTS AND DISCUSSION
3.1. Vegetation δ13C
The δ13C values measured from among the fossil organic samples is given in
Table 3.1 and Figure 3.1. Not shown are the lab standard samples which were analyzed
at regular intervals during the data collection process at a ratio of about one standard for
every four or five samples. These yielded an overall standard deviation of 0.22‰ and
represent the possible imprecision resulting from instrumental or user errors.
Most samples were analyzed multiple times to test for intrasample variation,
which appears to be minimal. The average standard deviation (SD=1S) among the fossil
seed samples was 0.27‰ and only three specimens yielded a standard deviation higher
than 0.5‰. Sample CH18-303c had the highest standard deviation, 0.75‰, which is
interesting because this sample was taken from the seed coat rather than from the
integument. The integument of the same seed had a significantly lower standard
deviation of 0.21‰.
The lignite samples also produced low intrasample standard deviations. Aside
from DDCH6L-reeds and DDH6L-bulk (0.46‰ and 0.67‰, respectively), all samples
produced standard deviations below 0.1‰. Lignites consistently produced greater

42
Table 3.1. Organic matter δ13C data. N = number of samples analyzed per specimen. M-B: difference between monocot samples and associated bulk samples.
MEAN 1S MEAN M-B 1SCH18-123 4 -24.05 0.09 2 CH25L 2 -26.49 - 0.05CH18-154 4 -26.10 0.27 2 CH38L-monocots 2 -25.64 0.36 0.02
CH18-163 3 -26.29 0.60 2 CH38L-bulk 2 -26.00 - 0.04
CH18-237 3 -26.82 0.10 2 CH41L-monocots 2 -26.37 0.00 0.01
CH18-265 1 -28.99 - 2 CH41L-bulk 2 -26.37 - 0.10
CH18-276 4 -26.37 0.34 2 CH50L 2 -26.99 - 0.04
CH18-303c 4 -26.05 0.75 2 CH52L 1 -26.51 - -
CH18-303i 4 -25.56 0.21 2 CH72L 1 -26.29 - -
CH18-305 4 -26.16 0.23 2 CH76L 1 -26.76 - -
CH18-313 1 -26.03 - 2 CH84L 2 -27.73 - 0.03
CH18-323 3 -25.00 0.29 2 CH120L 1 -26.77 - -
CH18-392 3 -25.55 0.11 2 CH122L 1 -25.94 - -
CH18-437 2 -25.88 0.06 2 DDCH5L 2 -24.38 - 0.00
CH18-487 3 -27.16 0.53 2 DDCH6L-monocots2 -26.60 0.17 0.46
CH18-56 2 -24.47 0.07 2 DDCH6L-bulk 2 -26.78 - 0.67
CH18-656 2 -26.75 0.11
CH83-1 1 -22.29 -
CH83-2 1 -22.87 -
N δ13C (‰)SPECIMEN
FO
SSIL
AN
NO
NA
CE
AE
SE
ED
S
LIG
NIT
ES
SPECIMEN N δ13C (‰)

FsaunpD
v
co
o
N
δ
ti
at
ef
Figure 3.1. Uamples that wnknown. Forlotted and on
DDCH6L (th
ariation in th
ontained wit
Annon
f CH83, hav
N=2), respect
13C values w
issue type wa
tributed to o
ffect (preval
Univariate plwere not stur consistencynly the bulk e monocot s
he bulk samp
thin them.
naceae seed
ving mean va
tively (Figur
were essentia
as sampled f
ne or more o
lence of soil-
ot of fossil oudied by Dany, sample CHsample resu
samples are e
ple compare
δ13C values
alues of -26.
re 3.1. Tabl
ally constant
from each se
of the enviro
-respired CO
43
organic δ13Cnehy (2010) H018-303c (
ults are plotteexcluded).
d to that from
from localit
08‰ (±1.17
le 3.2). Cons
t when these
eed, the appr
onmental fac
O2 and lower
C. “Lignitesand about w(the single sed for lignite
m the indivi
ty CH18 diff
7‰, N=15) a
sidering that
seeds devel
roximately 3
ctors discuss
r irradiance l
– Unknownwhich the pal
eed coat sames CH38L, C
idual monoc
ffer significan
and -22.58‰
global atmo
loped, and th
3.5‰ differe
ed in Chapte
levels), nutri
” are the lignlynology is mple) is not CH41L, and
ot macrofos
ntly from th
‰ (±0.41‰,
ospheric CO2
hat the same
nce is likely
er 1: canopy
ient availabi
nite
sils
ose
2
y
y
ility,

44
Table 3.2. Organic matter δ13C statistics. *Only bulk samples that were subsampled for monocot macrofossils are reported in this group.
MEAN 1SAnnonaceae seeds CH18 15 -26.08 1.17
CH83 2 -22.58 0.41
All 17 -25.67 1.60
Lignites Monocots* 3 -26.20 0.50
Bulk* 3 -26.38 0.39
Type 1 2 -26.24 0.34
Type 2 1 -26.99 -
All 12 -26.42 0.80
N δ13C (‰)GROUP
or water stress. Salinity effects can be excluded due to the unlikely existence of saline
surface waters at these localities, as well as a lack of evidence for salt minerals having
been in the associated strata. Latitudinal and elevational differences can be excluded due
to the small temporal and spatial difference between localities (Jacobs et al., 2005). There
may have been diagenetic alteration in the CH83 seeds, considering they are very similar
to each other in value (1S=0.41‰) and the CH18 seeds are not (1S=1.17‰). However,
this result may be due to small sample size, as only two seeds were analyzed from CH83.
The range of fossil organic δ13C values obtained from all the Annonaceae seeds is
greater than 6‰, and is about 5‰ among those from locality CH18. Considering that
these values likely represent the same tissue type from a single genus or species, and that
each locality samples a single stratum within a 10 meter lateral extent, the wide range in
δ13C among the seeds most likely indicates the existence of a closed canopy or diagenetic
differences. It is assumed that neither nutrient availability nor water stress varied
significantly within this locality during the time that the seeds were deposited. If these

45
are accurate assumptions, these fossil seed δ13C values actually represent the vertical δ13C
gradient of the forest. In other words, the seeds developed at different heights within the
forest and therefore experienced a diminishing canopy effect with increasing height. It is
also possible that the forest canopy was not uniformly closed or open and that there was a
lateral δ13C gradient between areas with closed and open canopies. Nevertheless, this
secondary hypothesis requires significant amounts of time averaging and/or fluvial
concentration of the seeds from geographically disparate sites to one locality.
It should also be noted that the δ13C of CH18-303c, a sample taken from seed coat
tissue, was 0.5‰ lower than CH18-303i, a sample taken from integument tissue of the
same seed. If seed coat tissues consistently yield lower δ13C values than integument
tissue, then seeds with lower values may have been contaminated with seed coat material.
Analysis of modern Annonaceae seed tissues could help to narrow the interpretation of
these observations.
Lignite δ13C values range from -27.73‰ to -24.38‰ and have a mean of -
26.42‰. There is no obvious correlation between the palynological assemblage of a
lignite and its δ13C values, except that the Type I lignites (having low Poales percentages)
yielded slightly higher values (Figure 3.1, Table 3.2). Nevertheless, the sample size,
three, is small. Further palynological work on the lignites analyzed in this study, or
additional carbon isotopic analyses of lignite samples previously studied palynologically,
could prove useful for clarifying relationships among different palynological assemblages
and their 13C content. In two of the lignite specimens subsampled for monocot
macrofossils, CH48L and DDCH6L, the monocot samples produced higher δ13C values
than the bulk samples. The third specimen (CH41L) yielded the same value for both

46
monocot and bulk samples. As a result, additional analyses of individual plant fossils
within the lignite specimens are needed to determine the δ13C variation among the plants
comprising the lignites.
Compared to the lignites, the Annonaceae seeds yielded slightly higher δ13C
values, on average (Table 3.2). Considering that the seed samples were collected from
non-photosynthetic tissues (i.e., seed coat and integument), and that the lignite specimens
likely have a significant photosynthetic (leaf matter) component, this relationship is not
surprising. The Annonaceae seed data show a higher range of δ13C values than those of
the lignites, whether including or excluding outliers, but overlap with the lignite values.
Each lignite sample represents an average value of the lignite-producing vegetation as a
whole, which can be expected to dampen the impact of extreme δ13C values that may
result from local environmental or seasonal extremes. Careful subsampling of plant
components comprising the lignites could reveal a greater range in δ13C values. As
previously mentioned, this subsampling technique was performed on three of the lignites
by specifically analyzing monocot macrofossils. Further work, including the collection
of δD, δ18O, and C/N ratio data, may permit discrimination of these effects and help to
more narrowly interpret these carbon isotope data.
3.2. Tooth Enamel δ13C and δ18O
The data derived from the tooth enamel specimens are given in Table 3.3 and
Figures 3.2-3.4. Not shown are the lab standard samples which were analyzed at regular
intervals during the data collection process at a ratio of about one standard for every four
or five samples. These yielded an overall standard deviation of 0.07‰ and 0.14‰ for

47
δ13C and δ18O, respectively, and they represent the possible imprecision in analyses
resulting from instrumental or user errors.
Weight percent carbonate (WPC) was calculated for each sample as an initial test
for diagenetic alteration (Table 3.3, Figure 3.2). A mean value is reported for samples
analyzed multiple times. Many samples did not produce enough CO2 for their volume to
be accurately measured using the manometer installed on the extraction line. In order to
calculate WPC in these cases, the manometer’s minimum detection limit of 0.4μmols was
used for the amount of CO2 evolved. Therefore, these WPC values represent the
maximum possible value that could exist below the detection limit of the manometer, and
the true WPC value for these samples is probably smaller than the value reported here.

Tab
le 3
.3 (
cont
inue
d on
nex
t pag
e). E
nam
el δ
18O
and
δ13
C d
ata.
ID
: bol
d fo
nt in
dica
tes
Gua
ng R
iver
spe
cim
ens,
reg
ular
fo
nt in
dica
tes
Kah
ar V
alle
y sp
ecim
ens.
ID
: bol
d fo
nt in
dica
tes
Gua
ng R
iver
spe
cim
ens,
reg
ular
fon
t ind
icat
es K
ahar
V
alle
ysp
ecim
ens
WP
C(w
eigh
tper
cent
carb
onat
e):i
tali
cize
d/gr
ayva
lues
indi
cate
max
imum
poss
ible
WP
Cva
lue
for
Val
ley
spec
imen
s. W
PC
(w
eigh
t per
cent
car
bona
te):
ital
iciz
ed/g
ray
valu
es in
dica
te m
axim
um p
ossi
ble
WP
C v
alue
for
C
O2
sam
ples
that
wer
e to
o sm
all t
o de
tect
wit
h th
e eq
uipm
ent u
sed
(<1μ
mol
). D
ata
from
sam
ples
that
yie
lded
WP
C
valu
es o
utsi
de th
e ra
nge
for
mod
ern
mam
mal
s (2
.2 –
5.2
%),
as
wel
l as
the
very
low
δ18
O a
nd δ
13C
val
ues
from
CH
71-1
2,
are
shad
ed to
indi
cate
dat
a m
ay n
ot h
ave
been
pri
stin
e. S
ee te
xt f
or f
urth
er e
xpla
nati
ons.
48

49
Tab
le 3
.3 (
cont
inue
d fr
om p
revi
ous
page
)

Figure 3.Embrithopmeasuredestimates mammali
2. Enamel δpoda; C, Hy
d WPC value(see text foran enamel.
13C –WPC ayracoidea; D,es while openr explanation
50
and δ18O–W, Probosciden symbols (n). Shaded r
WPC biplots. Aea. Closed sy
and )repregion show
A, all taxa; Bymbols ( present maxi
ws range of W
B, and ) reprimum WPC
WPC for mod
resent
dern

51
Figure 3.3. Tooth enamel δ13C-δ18O biplot. Open symbols represent specimens that were not classified at the family level. Samples that yielded anomalous WPC are not plotted. Color figures are available in the digital copy of this thesis.
Samples for which WPC was measured to be outside the range for modern
mammals (2.2 – 5.2%) may have been diagenetically altered. Three samples (CH3-55,
CH9-32, and CH9-24) yielded WPC values of 2.2% and one sample (CH71-1) yielded a
value of 5.2%. Considering the imprecision of calculating WPC, these samples may
actually be within the acceptable range and will therefore be included in the following
discussion. However, CH71-12 also yielded a WPC of 2.2% but will be excluded
because the δ18O and δ13C values obtained from it were extremely anomalous (Table
3.3). Therefore, as a result of anomalous WPC values, four Arsinoitheriidae, all three
Deinotheriidae, one Gomphotheriidae,one Palaeomastodontidae, and one Proboscidea

F3ininra
in
al
to
an
W
Figure 3.4. T.3. Calculatn gray italicindicate orderange. Color f
ndet. specim
lteration.
Althou
o be any corr
nd lowest va
WPC (Figure
Tooth enameted ranges ofized font benr-level statisfigures are a
men yielded δ
ugh many sp
relation with
alues in both
e 3.2). This
l δ13C and δf vegetation neath the metics: centere
available in t
δ18O and δ13C
pecimens yie
h δ18O or δ13
h datasets are
tenuous rela
52
18O, by famiδ13C values
easured enamed on mean athe digital co
C data that m
elded anoma
C values (Fi
e derived fro
ationship bet
ily. Symboland body w
mel values aland upper/loopy of this th
must be susp
alous WPC v
igure 3.2,).
om the same
tween low W
logy is the sawater δ18O valong the x-axwer bounds hesis.
pected of pos
values, there
Nevertheles
specimens t
WPC and ano
ame as Figualues are shoxis. Boxes indicate ±1S
ssible diagen
e does not ap
ss, the highe
that had low
omalous δ18O
ure own
S
netic
ppear
est
w
O

53
and δ13C values supports the use of WPC as an initial screening for diagenetic alteration.
Analyses of other co-occurring materials (e.g., dentin, bone, matrix), are required to
verify that these samples are not pristine.
Most enamel powders were small and only four had large enough mass to permit
replicate analyses to check for intrasample variation. Three of these yielded small
standard deviations (SD=1S) of 0.38‰, 0.20‰, 0.09‰ for δ13C, but the other was large
(1.84‰). Standard deviations were significantly higher for δ18O data than for δ13C,
except for specimen CH8-3, for which standard deviations were 0.03‰ and 0.38‰ for
δ18O and δ13C, respectively.
The δ13C values for the entire dataset, excluding those with anomalous WPC,
range from -5.98‰ and -16.21‰, and the δ18O values range from -0.13‰ to -11.07‰.
The samples analyzed twice document low intrasample variation in δ13C and δ18O values,
except in one instances (Table 3.2). The standard deviation calculated for the δ18O
values from proboscidean specimen CH62-1 was 1.43‰. However, the δ13C data from
this same specimen varied little (SD=0.20‰), suggesting that this variation in δ18O
values may be original. If so, then this may be an indicator of seasonal variation or that
more than one water source was used by this individual during tooth development.
Nevertheless, it has been shown that during diagenesis, δ18O reaches the new steady-state
value before δ13C begins to shift (Wang and Cerling, 1994). So, this may be further
evidence that diagenetic alteration has influenced at least some of these samples.
Considering the entire dataset, nearly all of the δ13C values derived from tooth
enamel samples with known, acceptable WPC values fall within the range of values
obtained from the fossil organics included in this study, assuming a 13C enrichment factor

54
of 14‰. An Arsinoitherium and a Proboscidea indeterminate specimen are slightly
above the range, each corresponding to vegetation values of about -21‰. However, these
values are only a few per mil above the range and correspond to values expected for
vegetation within the Chilga ecosystem.
There are several interesting observations when comparing order-level statistics
from the tooth enamel data (Table 3.3). Samples with known anomalous WPC are
excluded from this discussion. The Proboscidea (N=8) yielded the lowest δ13C values
with a mean of -12.39‰ (±2.61‰) and the Hyracoidea (N=6) yielded the highest with a
mean of -9.86‰ (±2.21‰). The Embrithopoda (N=10) δ13C values are closer to those of
the Hyracoidea with a mean of -10.23 (±1.55‰), but had a much lower standard
deviation. Intra-order variation is large with respect to fossil enamel δ18O values, but the
Proboscidea again produced the lowest values with a mean of -7.25‰ (±2.43‰). The
Embrithopoda and Hyracoidea produced very similar mean δ18O values of -5.61‰
(±2.41‰) and -5.56‰ (±3.28‰), respectively.
It is important to point out that the WPC values of many of these specimens is
unknown, and these observations may be influenced by diagenetically altered samples
that were not identified as such. Nevertheless, ruling out diagenesis, these results suggest
that the Hyracoidea were frequenting environments with higher δ13C and δ18O values
more often than the Proboscidea. Considering the fossil organic δ13C data mentioned
previously, this would correspond with the Hyracoidea spending less time in closed-
canopy areas compared with the Proboscidea.

1318
Tab
le 3
.3 .
Ena
mel
δ13
C a
nd δ
18O
sta
tist
ics.
A, a
ll s
ampl
es; B
, sam
ples
wit
h kn
own,
ano
mal
ous
WP
C e
xclu
ded.
O
rder
-lev
el s
tati
stic
s ar
e sh
aded
gra
y. C
alcu
late
d bo
dy w
ater
δ18
O v
alue
s an
d di
et δ
13C
val
ues
are
give
n in
par
enth
eses
.
55

56
Among the Embrithopoda data, there is a large range of variation in δ18O values,
even among samples that are known to have normal WPC. For these samples, the
standard deviation among δ18O values is 2.36‰. Populations of modern aquatic and
semi-aquatic mammals are characterized by standard deviations of ≤ 1‰. (Clementz et
al., 2008). Therefore, the Embrithopoda data in this study do not support the current
hypothesis that these animals lived a semi-aquatic lifestyle. However, the observation
that the Embrithopoda δ13C values vary less than those of Proboscidea or Hyracoidea
suggest that they had the narrowest diet of these three groups. This supports the
hypothesis that Arsinoitherium was a more selective browser than co-occurring taxa.
Aside from these Embrithopoda samples, only two samples from specimens
classified at the family level and known to have acceptable WPC values are available for
discussion: one each from the Geniohyidae (CH34-200) and the Saghatheriidae (CH28-
2). Unfortunately one sample from each taxon is not sufficient to draw any conclusions
that can be defended appropriately. All other samples known to have normal WPC are
not classified at the family level. For this reason, it is impossible to provide a robust
interpretation of taxon-specific relationships among the remaining samples.

57
Chapter 4
CONCLUSIONS
In this study δ13C and δ18O data were collected from fossil Annonaceae seeds,
lignites, and fossil tooth enamel in order to test several hypotheses. The first hypothesis
was that resource partitioning, or the systematic division of food resources by herbivore
taxa, existed among the large-bodied mammals living in the Chilga Basin during the late
Paleogene. Some of the δ13C data collected from these animals support this hypothesis.
These data suggest that the diet of the Proboscidea consisted of vegetation from more
closed environments (i.e., their enamel δ13C was lower) than that of the Embrithopoda or
Hyracoidea, and that the Embrithopoda had the most restricted diet of the three groups.
Only through careful replication of these results will this conclusion be meaningful.
The second hypothesis tested was that the ecosystem consisted of different carbon
isotope provenances, or isoscapes. The δ13C data collected from the Annonaceae seeds
support this hypothesis in that values from the CH18 locality range from about
-24‰ to -29‰. Considering that these data come from the same locality and taxonomic
family (possibly even genus or species), this range can only be explained by
environmental variables. The most likely explanation is the existence of a closed canopy
structure. Other possibilities are changes in water stress and nutrient availability.

58
However, these could not explain the 5‰ variation and are not likely to be significant
factors considering all other evidence (see Chapter 1) indicates that this paleoecosystem
was a wet tropical forest.
The other hypotheses tested were that Arsinoitherium had a specialized diet
consisting of specific plants or parts of plants, and it lived a semi-aquatic life. The δ13C
data from Arsinoitherium enamel suggest that this animal’s diet was less variable than
those of the Hyracoidea and Proboscidea included in this study, so the first hypothesis is
not rejected. However, the variation in Arsinoitherium δ18O values is larger than those of
modern aquatic and semi-aquatic mammals, indicating that it did not live a semi-aquatic
habit.

59
Appendix A
NOTE ABOUT DIGITAL RESOURCES
A digital copy of this thesis, including color figures, along with data files (spreadsheets
and comma-delimited text files) will be made available on the website
www.jordannoret.com.

60
REFERENCES
Al-Sayigh, A.R., Nasir, S., Schulp, A.S., and Stevens , N.J., 2008. The first described Arsinoitherium from the Upper Eocene Aydim Formation of Oman: Biogeographic implications. Palaeoworld, 17:41–46.
Andrews, C.W., 1901. Preliminary notes on some recently discovered extinct vertebrates from Egypt. Part I. Geological Magazine, Series IV, 8:400–409.
Andrews, C.W., 1904. Further notes on the mammals of the Eocene of Egypt: Part II. Geological Magazine Series 5(1):157–162.
Andrews, C.W., 1906. A Descriptive Catalogue of the Tertiary Vertebrata of the Fayum, Egypt. British Museum of Natural History, London, 324 pp.
Asher, R.J. 2007. A web-database of mammalian morphology and a reanalysis of placental phylogeny. BMC Evolutionary Biology, 7:108.
Asher, R.J., and Lehmann, T., 2008. Dental eruption in afrotherian mammals. BMC Biology, 6:14.
Asher, R.J., Novacek, M.J., and Geisler, J.H., 2003. Relationships of endemic African mammals and their fossil relatives based on morphological and molecular evidence. Journal of Mammalian Evolution, 10:131–194.
Ayliffe, L.K., Lister, A.M., and Chivas, A.R., 1992. The preservation of glacial-interglacial climatic signatures in the oxygen isotopes of elephant skeletal phosphate. Palaeogeography, Palaeoclimatology, Palaeoecology, 99:179–91.
Badeck F.W., Tcherkez, G., Nogues, S., Piel, C., and Ghashghaie, J., 2005. Post-photosynthetic fractionation of stable carbon isotopes between plant organs – a widespread phenomenon. Rapid Communications in Mass Spectrometry, 19:1381–1391.
Barbour M.M., 2007. Stable oxygen isotope composition of plant tissue: a review. Functional Plant Biology, 34:83-94.
Barbour, M.M., Fischer, R.A., Sayre, K.D., and Farquhar, G.D., 2000. Oxygen isotope ratio of leaf and grain material correlates with stomatal conductance and grain yield in irrigated wheat. Australian Journal of Plant Physiology, 27:625–637.

61
Barnhart, J.H., 1895. Family Nomenclature. Bulletin of the Torrey Botanical Club, 22(1):1-24.
Beadnell, H. J. C. 1902. A Preliminary Note on Arsinoitherium zitteli Beadnell, from the Upper Eocene Strata of Egypt. Egyptian Survey Department, Public Works Ministry, Cairo, 4 pp.
Behboudian, M.H., Ma, Q., Turner, N.C., and Palta, J.A., 2000. Discrimination against 13CO2 in leaves, pod walls, and seeds of water-stressed chickpea. Photosynthetica, 38:155–157.
Bender, M.M., 1968. Mass spectrometric studies of carbon-13 variations in corn and other grasses. American Journal of Science, Radiocarbon Supplement, 10:468–472.
Berry, S.C., Varney, G.T., and Flanagan, L.B., 1997. Leaf δ13C in Pinus resinosa trees and understory plants: variation associated with light and CO2 gradients. Oecologia, 109:499–506.
Blakey, R., 2012. Global Paleogeography Maps. NAU Geology, http://www2.nau.edu/rcb7/.
Bloom, W., and Fawcett, D.W., 1975. A textbook of histology. W.B. Saunders, 10th edition, 1033 pp.
Bocherens, H., Koch, P.L., Mariotti, A., Geraads, D., and Jaeger, J.J., 1996. Isotopic biogeochemistry (13C, 18O) of mammal enamel from African Pleistocene hominid sites: implications for the preservation of paleoclimatic signals. Palaios 11:306–318.
Bonaparte, C.L. 1845. Catalogo Metodico dei Mammiferi Europei. Valenciennes, Milan, 36 pp.
Bonar, L.C., Shimizu, M., Roberts, J.E., Griffin, R.G., and Glimcher, M.J., 1991. Structural and composition studies on the mineral of newly formed dental enamel: a chemical, x-ray diffraction, and 31P and proton nuclear magnetic resonance study. Journal of Bone and Mineral Research, 6:1167–1176
Boschetto, H.B., Brown, F.H., and McDougall, I., 1992. Stratigraphy of the Lothidok Range, northern Kenya, and K/Ar ages of its Miocene primates. Journal of Human Evolution, 22:47–71.
Bouchenak-Khelladi, Y., Verboom, G.A., Hodkinson, T.R., Salamin, N., Francois, O., Chonghaile, G.N., and Savolainen, V., 2009. The origins and diversification of C4 grasses and savanna-adapted ungulates. Global Change Biology, 15: 2397–2417.

62
Boutton,T.W., 1991. Stable carbon isotope ratios of natural materials. I. Sample preparation and mass spectrometric analysis. In: Carbon Isotope Techniques, Coleman, D.C., and Fry, B., Eds., pp. 155-171. Academic Press, New York.
Bowen G.J., Wassenaar L.I. and Hobson K.A., 2005. Global application of stable hydrogen and oxygen isotopes to wildlife forensics. Oecologia 143:337-348.
Brudevold, F., and Söremark, R., 1967. Chemistry of the mineral phase of enamel. In: Structural and Chemical Organization of Teeth, Volume 2, Miles., A.E.W., Ed., pp. 247-277.
Brugnoli E., and Farquhar G.D., 2000. Photosynthetic fractionation of carbon isotopes. In: Photosynthesis: Physiology and Metabolism, Leegood, R.C., Sharkey, T.C., and von Caemmerer, S., Eds., pp. 399–434. Kluwer Academic Publishers.
Bryant, J.D., and Froelich, P.N., 1995. A model of oxygen isotope fractionation in body water of large mammals. Geochimica Cosmochimica Acta, 59:4523–4537.
Bryant, J.D., Koch, P.L., Froelich, P.N., Showers, W.J., and Genna, B.J., 1996. Oxygen isotope partitioning between phosphate and carbonate in mammalian apatite. Geochimica Cosmochimica Acta, 60:5145–5148.
Buchmann, N., Kao, W., and Ehleringer, J.R., 1997. Influence of stand structure on carbon-13 of vegetation, soils and canopy air within deciduous and evergreen forests in Utah, United States. Oecologia, 110:109–119.
Cande, S.C., and Kent, D.V., 1995. Revised calibration of the geomagnetic polarity timescale for the Late Cretaceous and Cenozoic, Journal of Geophysical Research, 100(B4):6093–6095.
Cerling, T.E., and Sharp, Z.D., 1996. Stable carbon and oxygen isotope analysis of fossil tooth enamel using laser ablation. Palaeogeography, Paleoclimatology, Palaeoecology, 126:173–186.
Cerling, T.E., and Harris, J.M., 1999. Carbon isotope fractionation between diet and bioapatite in ungulate mammals and implications for ecological and paleoecological studies. Oecologia, 120:247–363.
Cerling, T.E., Bowman, J.R. and O'Neil, J.R., 1988. An isotopic study of a fluvial-lacustrine sequence: The Plio-Pleistocene Koobi Fora sequence, East Africa. Palaeogeography, Palaeoclimatology, Palaeoecology, 63: 335-356.
Cerling, T.E., Harris, J.M., MacFadden, B.J., Leakey, M.G., Quade, J., Eisenmann, V., and Ehleringer, J.R., 1997. Global vegetation change through the Miocene–Pliocene boundary. Nature, 389:153-158.
Cerling, T.E., Hart, J.A., and Hart, B.H., 2004. Stable isotope ecology in the Ituri Forest. Oecologia, 138:5-12.

63
Cernusak, L.A., Pate, J.S., and Farquhar, G.D., 2002. Diurnal variation in the stable isotope composition of water and dry matter in fruiting Lupinus angustifolius under field conditions. Plant, Cell & Environment, 25:893–907.
Cernusak, L., Tcherkez, G., Keitel, C., Cornwell, W.K., Santiago, L.S., Knohl, A., Barbour, M., Williams, D.G., Reich, P.B., Ellsworth, D.S., Dawson, T.E., Griffiths, H.G., Farquhar, G.D., and Wright, I.J., 2009. Why are non-photosynthetic tissues generally 13C enriched compared with leaves in C3 plants? Review and synthesis of current hypotheses. Functional Plant Biology, 36:199-213.
Clementz, M.T., and Koch, P.L., 2001. Differentiating aquatic mammal habitat and foraging ecology with stable isotopes in tooth enamel. Oecologia, 129:461– 472.
Clementz, M.T., Holroyd, P.A., and Koch, P.L., 2008. Identifying Aquatic Habits Of Herbivorous Mammals Through Stable Isotope Analysis. Palaios, 23(9):574-585.
Coplen, T.B., Kendall, C., and Hopple, J., 1983. Intercomparison of stable isotope reference samples. Nature, 302:236–238.
Couvreur, T.L.P., Richardson, J.E., Sosef, M.S.M., Erkens, R.H.J., and Chatrou, L.W., 2008. Evolution of syncarpy and other morphological characters in African Annonaceae: a posterior mapping approach. Molecular phylogenetics and evolution, 47(1):302-18.
Court, N., 1989. Morphology, functional morphology, and phylogeny of Arsinoitherium (Mammalia, Embrithopoda). Unpublished PhD dissertation, University of Bristol, 372 pp.
Court, N., 1990. Periotic anatomy of Arsinoitherium (Mammalia, Embrithopoda) and its phylogenetic implications. Journal of Vertebrate Paleontology 10:170–182.
Court, N., 1992a. The skull of Arsinoitherium (Mammalia, Embrithopoda) and the higher order interrelationships of ungulates. Palaeovertebrata 22:1–43.
Court, N., 1992b. A unique form of dental bilophodonty and a functional interpretation of peculiarities in the masticatory system of Arsinoitherium (Mammalia, Embrithopoda). Historical Biology 6:91–111.
Court, N., 1993. Morphology and functional anatomy of the postcranial skeleton in Arsinoitherium (Mammalia, Embrithopoda). Palaeontographica, Abt. A, 226:125–169.
Craig, H. 1961. Isotopic variations in meteoric waters. Science, 133: 1702-1703.
Currano, E. D., Jacobs, B. F., Pan, A. D., and Tabor, N. J., 2011. Inferring ecological disturbance in the fossil record: A case study from the late Oligocene of Ethiopia. Palaeogeography, Palaeoclimatology, Palaeoecology, 309(3-4):242-252.

64
Danehy, D., 2010. Terrestrial vegetation reconstructions spanning the Paleogene-Neogene boundary in the Ethiopian highlands. Unpublished Master’s thesis, Southern Methodist University, 162 pp.
Dansgaard, W., 1964. Stable isotopes in precipitation. Tellus, 16: 436-468.
Davis, S.J.M., 1987. The Archeology of Animals. Yale University Press, New Haven, 224 pp.
de Jussieu, A.L, 1789. Genera Plantarum, secundum ordines naturales disposita juxta methodum in Horto Regio Parisiensi exaratam. Paris. 522 pp.
DeNiro, M.J., and Epstein, S., 1978. Carbon isotopic evidence for different feeding patterns in two hyrax species occupying the same habitat. Science, 201:906–908.
Doyle, J.A., Le Thomas, A., 1994. Cladistic analysis and pollen evolution in Annonaceae. Acta Botanica Gallica, 141(2):149-170.
Doyle, J.A., Bygrave, P., and Le Thomas, A., 2000. Implications of molecular data for pollen evolution in Annonaceae. In: Pollen and spores: morphology and biology, Harley, M.M., Morton, C.M., and Blackmore, S., Eds., pp. 259–284. Royal Botanic Gardens, Kew.
Doyle, J.A., Sauquet, H., Scharaschkin, T., and Le Thomas, A., 2004. Phylogeny, molecular and fossil dating, and biogeographic history of Annonaceae and Myristicaceae (Magnoliales), International Journal of Plant Sciences, 165 (4 Suppl.):S55–S67.
Ehleringer, J.R., and Cooper, T.A. 1988. Correlations between carbon isotope ratio and microhabitat in desert plants. Oecologia, 76:562–566.
Ehleringer, J.R., Hall, A.E., and Farquhar, G.D., 1993. Stable Isotopes and Plant Carbon/Water Relations, Academic Press, San Diego, CA, 555pp.
Elliot, J.C., 1964. The crystallographic structure of dental enamel and related apatites. Ph.D. Thesis. University of London.
Elliot, J.C., Holcomb, D.W. & Young, R.A.,1985. Infrared determination of the degree of substitution of hydroxyl by carbonate ions in human dental enamel. Calcified Tissue Research, 37:372–375.
Epstein, S., Buchsbaum, R., Lowenstam, H.A., and Urey, H.C., 1953. Revised carbonate–water isotopic temperature scale. Geological Society of America Bulletin, 64:1315–1326.
Ethiopian Mapping Authority, 2007. Gonder, Ethiopia, 1:250,000 scale. Map series EMA-3, ND37-13, Edition 2.

65
Farquhar, G.D., and Richards, R.A., 1984. Isotopic composition of plant carbon correlates with water-use efficiency in wheat genotypes. Australian Journal of Plant Physiology, 11:539–552.
Farquhar, G.D., Ball, M.C., Caemmerer, S., and Roksandic, Z., 1982. Effect of salinity and humidity on δ13C value of halophytes—Evidence for diffusional isotope fractionation determined by the ratio of intercellular/atmospheric partial pressure of CO2 under different environmental conditions. Oecologia, 52:121-124.
Farquhar, G.D., Ehleringer, J.R., and Hubick, K.T., 1989. Carbon isotope discrimination and photosynthesis. Annual Review of Plant Physiology and Plant Molecular Biology, 40:503-537.
Francey, R.J., Allison, C.E., Etheridge, D.M., Tudinger, C.M., Enting, I.G., Leueberger, M., Langenfelds, R.L., Michel, E., and Steele, L.P., 1999. A 1000 year high precision record of δ13C in atmospheric CO2, Tellus, Ser. B., 51:170-193.
Gagnon, M. 1997. Ecological diversity and community ecology in the Fayum sequence (Egypt). Journal of Human Evolution, 32:133-160.
García Massini, J., Jacobs, B.F., Pan, A., Tabor, N., and Kappelman, J. 2006. The occurrence of the fern Acrostichum in Oligocene volcanic strata of the Northwestern Ethiopian Plateau. International Journal of Plant Sciences, 167:909-918.
García Massini, J., Jacobs, B.F., and Tabor, N., 2010. Paleobotany and sedimentology of late Oligocene terrestrial strata from the northwestern Ethiopian plateau. Palaeontologia Electronica, 13(1;6A), 51 pp.
Gat, J.R., 1996. Oxygen and hydrogen isotopes in the hydrologic cycle. Annual Review of Earth and Planetary Sciences, 24:225–262.
Gheerbrant, E., Sudre, J., Tassy, P., Amaghzaz, M., Bouya, B., and Iarochène, M., 2005. Nouvelles données sur Phosphatherium escuilliei ( Mammalia, Proboscidea) de l’Éocène inférieur du Maroc, apports à la phylogénie des Proboscidea et des ongulés lophodontes. Geodiversitas 27:239–333.
Google Inc., 2011. Google Earth (Version 6.1.0.5001) [Software]. Available from http://www.google.com/earth/download/ge/.
Gregory, R.T., and Taylor, H.P., Jr., 1981. An oxygen isotope profile in a section of Cretaceous oceanic crust, Samail Ophiolite, Oman: evidence for δ18O buffering of the oceans by deep (>5 km) seawater-hydrothermal circulation at mid-ocean ridges., Journal of Geophysical Research, 86(B4):2737–2755.
Guy, R.D., Reid, D.M., and Krouse, H.R., 1980. Shifts in carbon isotope ratios of two C3 halophytes under natural and artificial conditions. Oecologia, 44:241-247.

66
Harris, J.M., and Watkins, R., 1974. New early Miocene vertebrate locality near Lake Rudolf, Kenya. Nature, 252:576-577.
Hays, P. D., and Grossman, E. L., 1991. Oxygen isotopes in meteoric calcite cements as indicators of continental paleoclimate. Geology, 19, 441– 444.
Hillson, S., 1986. Teeth. Cambridge University Press, 376 pp.
Hofmann, C., Courtillot, V., Feraud, G., Rochette, P., Yirgus, G., Ketefos, E., and Pik, R., 1997. Timing of the Ethiopian flood basalt event and implications for plume birth and global change. Nature, 389:838-841.
Holroyd, P.A., and Maas, M.C., 1994. Paleogeography, paleobiogeography, and anthropoid origins. In: Anthropoid Origins, Fleagle, J.G., and Kay, R.F., Eds., pp. 297–334. Plenum Press, New York.
Huxley, T.H., 1869. An introduction to the classification of animals. J. Churchill, London. 147 pp.
Iacumin, P., Bocherens, H., Mariotti, A., Longinelli, A., 1996. Oxygen isotope analysis of coexisting carbonate and phosphate in biogenic apatite: a way to monitor diagenetic alteration of bone phosphate? Earth and Planetary Science Letters 142:1–6.
Illiger, J.K.W., 1811. Prodromus systematis mammalium et avium. Berolinum. 301 pp.
Jacobs, B.F., Tabor, N., Feseha, M., Pan, A., Kappelman, J., Rasmussen, T., Sanders, W., Wiemann, M., Crabaugh, J., and García Massini, J.L. 2005. Oligocene terrestrial strata of Northwestern Ethiopia: A preliminary report on paleoenvironments and paleontology. Palaeontologia Electronica, 8(1; 25A), 19 pp.
James, G.T., and Slaughter, B.H., 1974. A primitive new middle Pliocene murid from Wadi El Natrun,Egypt. Annals of the Geological Survey of Egypt IV:333-362
Kappelman, J., Rasmussen, D.T., Sanders, W.J., Feseha, M., Bown, T., Copeland, P., Crabaugh, J., Fleagle, J., Glantz, M., Gordon, A., Jacobs, B., Maga, M., Muldoon, K., Pan, A., Pyne, L., Richmond, B., Ryan, T., Seiffert, E.R., Sen, S., Todd, L., Wiemann, M.C., and Winkler, A. 2003. Oligocene mammals from Ethiopia and faunal exchange between Afro-Arabia and Eurasia. Nature, 426:549-552.
Kessler, P.J.A., 1993. Annonaceae. In: The Families and Genera of Vascular Plants #2. Magnoliid, Hamamelid, and Caryophyliid Families, Kubitzki, K., Rohwer, J.G., and Bittrich, V., Eds., pp 93-129. Springer Verlag, Berlin.
Koch, P.L., Tuross, N., and Fogel, M.L., 1997. The effects of sample treatment and diagenesis on the isotopic integrity of carbon in biogenic hydroxylapatite. Journal of Archeological Science, 24:417–429.

67
Koch, P.L., 1998a. Isotopic reconstruction of past continental environments. Annual Review of Earth and Planetary Sciences, 26:573-613.
Koch, P.L., 1998b. The isotopic ecology of late Pleistocene mammals in North America Part 1: Florida. Chemical Geology, 152(1-2):119-138.
Kolodny, Y., Luz, B., Navon, O., 1983. Oxygen isotope variation in phosphate of biogenic apatites, I. Fish bone apatite—rechecking the rules of the game. Earth and Planetary Science Letters, 64:398–404
Körner, C., Farquhar, G.D., and Wong, S.C., 1991. Carbon isotope discrimination by plants follows latitudinal and altitudinal trends. Oecologia, 88:30–40.
Kroopnick, P., and Craig, H., 1971. Atmospheric oxygen: isotopic composition and solubility fractionation. Science, New Series, 175(4017): 54-55.
Kump, L.R., Arthur, M.A., 1999. Interpreting carbon-isotope excursions: carbonates and organic matter. Chemical Geology, 161:181-198.
Lécuyer, C., Grandjean, P., Emig, C.C., 1996. Determination of oxygen isotope fractionation between water and phosphate from living lingulids: potential applications to palaeoenvironmental studies. Palaeogeography, Palaeoclimatology, Palaeoecology, 126:101–108.
Lee-Thorp, J.A., and van der Merwe, N.J., 1987. Carbon isotope analysis of fossil bone apatite. South African Journal of Science. 83:712–715.
LeGeros, R. Z., 1967. Crystallographic studies of the carbonate substitution in the apatite structure. Ph.D. Thesis. New York University.
LeGeros, R. Z., 1991. Calcium Phosphates in Oral Biology and Medicine. Paris: Karge.
Longinelli A, and Nuti, S., 1973. Revised phosphate-water isotopic temperature scale. Earth and Planetary Science Letters 19:373–76.
Luz, B., Kolodnu, Y., Horowitz, M., 1984. Fractionation of oxygen isotopes between mammalian bone-phosphate and environmental drinking water. Geochemica Cosmochemica Acta, 48:1689-1693.
Marino, B.D., McElroy, M.B., Salawitch, R.J., and Spaulding, W.G., 1992. Glacial to interglacial variations in the carbon isotopic composition of atmospheric CO2. Nature, 357:461–466.
McKinney, M.L., 1997. Extinction vulnerability and selectivity: combining ecological and paleontological views. Annual Review of Ecology and Systematics, 28:495-516.

68
Medina, E., and Minchin, P., 1980. Stratification of δ13C values of leaves in Amazonian rain forests. Oecologia, 45:377-378.
Medina, E., Montes, G., Cuevas, E., and Roksandic, Z., 1986. Profiles of CO2 and δ13C values of the upper Rio Negro Basin, Venezuela. Journal of Tropical Ecology, 2:207-217.
Michel, V., Ildefonse, P. & Morin, G.,1996. Assessment of archaeological bone and dentine preservation from Lazaret Cave (Middle Pleistocene) in France. Palaeogeography, Palaeoclimatology, Palaeocology, 126:109–119.
Morgan, M.E., Kingston, J.D., Marino, B.D., 1994. Carbon isotopic evidence for the emergence of C4 plants in the Neogene from Pakistan and Kenya. Nature 387:162–65.
Morley, R.J., 2000. Origin and evolution of tropical rainforests. Wiley, New York.
Moustapha, W. 1955. An interpretation of Arsinoitherium. Bulletin, Institut d’Egypte 36:111–118.
Murphy, W.J., Eizirik, E., O’Brien, S.J., Madsen, O., Scally, M., Douady, C.J., Teeling, E., Ryder, O.A., Stanhope, M.J., DeJong, W.W., and Springer, M.S., 2001. Resolution of the early placental mammal radiation using Bayesian phylogenetics. Science 294:2348–2351.
O’Leary, M.H., 1988. Carbon isotopes in photosynthesis. BioScience, 38:328–336.
Pan, A.D. 2007. The Late Oligocene (28-17 Ma) Guang River flora from the northwestern plateau of Ethiopia. Ph.D. dissertation, Southern Methodist University, Dallas, Texas, 219 pp.
Pan, A.D., Jacobs, B.F., Dransfield, J., and Baker, W.J. 2006. The fossil history of palms (Arecaceae) in Africa and new records from the Late Oligocene (28-27 Mya) of north-western Ethiopia, Botanical Journal of the Linnean Society, 151:69-81.
Pickford, M., 1986. Première découverte d’une faune mammalienne terrestre paléogène d’Afrique sub-saharienne. Comptes Rendus de l’Academie des Sciences, Paris, Série II, 19:1205–1210.
Pickford, M., 1987. Recognition of an early Oligocene or late Eocene mammal fauna from Cabinda, Angola. Musée Royal de l’Afrique Centrale (Belgique), Rapport Annuel du Département de Géologie et de Mineralogie 1985–1986:89–92.
Pickford, M., 2002. Ruminants from the early Miocene of Napak, Uganda. Annales de Paléontologie 88: 85–113.
Quade, J., Cerling, T.E., Barry, J.C., Morgan, M.M., Pilbeam, D.R.,Chivas, A.R., Lee-Thorp, J.A., and van der Merwe, N.J., 1992. A 16-Ma record of paleodiet using

69
carbon and oxygen isotopes in fossil teeth from Pakistan. Chemical Geology, 94:183–92.
Rasmussen, T., and Gutierrez, M., 2009. A mammalian fauna from the late Oligocene of northwestern Kenya. Palaeontographica, 288.
Rasmussen, T., and Gutierrez, M., 2010. Chapter 13: Hyracoidea. In: Cenozoic Mammals of Africa, Werdelin, L., Sanders, W.J., Eds., pp 115-122. University of California Press.
Read, J.J., Johnson, D.A., Asay, K.H., and Tieszen, L.T., 1991. Carbon isotope discrimination, gas exchange, and water-use efficiency in Crested Wheatgrass clones. Crop Science, 31:1203–1208.
Rey, C., Renugopalakrishnan, V., Shimizu, M., Collins, B. and Glimcher, M.J., 1991. A resolution-enhanced Fourier transform infrared spectroscopic study of the environment of the CO3
2- ion in the mineral phase of enamel during its formation and maturation. Calcified Tissue International 49, 259–268.
Rink, W.J., and Schwarcz, H.P., 1995. Tests for diagenesis in tooth enamel: ESR dating signals and carbonate contents. Journal of Archaeological Science 22: 251-255.
Sanders, W.J., Kappelman, J., and Rasmussen, D.T. 2004. New large-bodied mammals from the late Oligocene site of Chilga, Ethiopia. Acta Palaeontologica Polonica, 49:365-392.
Sanders, W.J., Gheerbrant, E., Harris, J.M., Saegusa, H., Delmer, C., 2010. Chapter 15: Proboscidea. In: Cenozoic Mammals of Africa, Werdelin, L., and Sanders, W.J., Eds., pp 161-251. University of California Press.
Sanders, W.J., Rasmussen, D.T., Kappelman, J., 2010. Chapter 12: Embrithopoda. In: Cenozoic Mammals of Africa, Werdelin, L., and Sanders, W.J., Eds., pp 115-122. University of California Press.
Scartazza, A., Lauteri, M., Guido, M.C., and Brugnoli, E., 1998. Carbon isotope discrimination in leaf and stem sugars, water-use efficiency and mesophyll conductance during different developmental stages in rice subjected to drought. Australian Journal of Plant Physiology, 25:489–498.
Schlosser, M. 1910. Über einige fossil Säugetiere aus dem Oligocän von Ägypten. Zoologischer Anzeiger, 35:500-508.
Scott, J. H. & Symons, N. B. B., 1974. Introduction to Dental Anatomy. London: Churchill Livingstone.
Seiffert, E. R. 2006. Revised age estimates for the later Paleogene mammal faunas of Egypt and Oman. Proceedings of the National Academy of Sciences 103:5000–5005.

70
Seiffert, E. R., 2007. A new estimate of afrotherian phylogeny based on simultaneous analysis of genomic, morphological, and fossil evidence. BMC Evolutionary Biology 7:224.
Sen, S., and Heintz, E., 1979. Palaeoamasia kansui Ozansoy 1966, Embrithopode (Mammalia) de l’Éocène d’Anatolie. Annales de Paléontologie (Vertébrés) 65:73–91.
Simpson, G.G, 1945. The principles of classification and a classification of mammals. Bulletin of the American Museum of Natural History, 85:1–350.
Small, J.K., 1903. Flora of the Southeastern United States. The New Era Printing Company, Lancaster, PA. 1394 pp.
Smith, B.N., and Epstein, S., 1971. Two categories of 13C/12C ratios for higher plants. Plant Physiology, 47:380–384.
Smith, A.G., Smith, D.G., and Funnell, B.M., 1994. Atlas of Mesozoic and Cenozoic coastlines, Cambridge University Press, Arlington, 99 pp.
Smythe, N., 1986. Competition and resource partitioning in the guild of neotropical terrestrial frugivorous mammals. Annual Review of Ecology and Systematics, 17:169-188.
Sparks, J.P., and Ehleringer, J.R., 1997. Leaf carbon isotope discrimination and nitrogen content for riparian vegetation along elevational transects. Oecologia, 109:362–367
Springer, M.S., Murphy, W.J., Eizirik, E., and O’Brien, S.J., 2003. Placental mammal diversification and the Cretaceous Tertiary boundary. Proceedings of the National Academy of Sciences 100:1056–1061.
Strömberg, C.A.E., 2005. Decoupled taxonomic radiation and ecological expansion of open-habitat grasses in the Cenozoic of North America. Proceedings of the National Academy of Sciences, 102:11980-11984.
Tabuce, R., C. Delmer, and E. Gheerbrant, 2007. Evolution of the tooth enamel microstructure in the earliest proboscideans (Mammalia). Zoological Journal of the Linnean Society 149:611–628.
Thenius, E. 1969. Stammesgeschichte der Säugetiere. Handbuch der Zoologie 8(48):369–722.
Thomas, H., Roger, J., Sen, S., Pickford, M., Gheerbrant, E., Al-Sulaimani, Z., and Al-Busaidi, S., 1999. Oligocene and Miocene terrestrial vertebrates in the southern Arabian Peninsula (Sultanate of Oman) and their geodynamic and palaeogeographic settings. In: Fossil Vertebrates of Arabia, Whybrow, P.J., and Hill, A., Eds., pp. 430–442. Yale University Press, New Haven.

71
Tieszen, L.L., Hein, D., Qvortrup, S.A., Troughton, J.H., and Imbamba, S.K., 1979. Use of δ13C values to determine vegetation selectivity in East African herbivores. Oecologia 37, 351–359.
Tieszen, L.L., and Boutton, T.W., 1989. Stable carbon isotopes in terrestrial ecosystem research. In: Stable Isotopes in Ecological Research, Rundel, P.W., Ehleringer, J.R., and Nagy, K.A., Eds., pp. 167-195. Springer-Verlag, New York, NY.
Tipple, B.J., Meyers, S.R., and Pagani, M., 2010. Carbon isotope ratio of Cenozoic CO2 : A comparative evaluation of available geochemical proxies. Paleoceanography, 25, PA3202.
Tochon-Danguy, H.J., GeoVroy, M. & Baud, C.A., 1980. Electron-spin resonance study of the effects of carbonate substitution in synthetic apatites and apatites from human teeth. Archives of Oral Biology 25, 357–361.
Troughton, J.H., and Card, K.A., 1975. Temperature effects on the carbon isotope ratio of C3, C4 and crassulacean-acid-metabolism (CAM) plants. Planta 123:185-190.
Wallmann, K., 2001. The geological water cycle and the evolution of marine δ18O values. Geochimica et Cosmochimica Acta, 65, 2469– 2485.
Wang, Y., and Cerling, T.E., 1994. A mode of fossil tooth and bone diagenesis: implications of paleodiet reconstruction from stable isotopes. Palaeogeography, palaeoclimatology, palaeoecology, 107:281-289.
Wight, A.W.R., 1980. Paleogene vertebrate fauna and regressive sediments of Dur at Talhah, southern Sirt Basin, Libya. In: The Geology of Libya, vol. 1, Salem, M.J., Busrewil, M.T., Eds., pp. 309–325. Academic Press, London.
Van der Merwe, N.J., and Medina, E., 1989. Photosynthesis and 13C/12C ratios in Amazonian rain forests. Geochimica et Cosmochimica Acta, 53:1091-1094.
Veizer, J., and Mackenzie, F.T., 2004. Evolution of sedimentary rocks. In: Sediments, Diagenesis, and Sedimentary Rocks, Treatise of Geochemistry, vol. 7, Mackenzie, F.T., Ed., pp. 369– 407. Elsevier- Pergamon, Amsterdam.
Veizer, J., Bruckschen, P., Pawellek, F., Diener, A., Podlaha, O.G., Carden, G.A.F., Jasper, T., Korte, C., Strauss, H., Azmy, K., and Ala, D., 1997. Oxygen isotope evolution of Phanerozoic seawater. Palaeogeography, Palaeoclimatogy, Palaeoecology, 132:159– 172.
Veizer, J., Ala, D., Azmy, K., Bruckschen, P., Buhl, D., Bruhn, F., Carden, G. A. F., Diener, A., Ebneth, S., Godderis, Y., Jasper, T., Korte, C., Pawellek, F., Podlaha, O., and Strauss, H., 1999. 87Sr/86Sr, δ13C and δ18O evolution of Phanerozoic seawater. Chemical Geology, 161:59-88.

72
Vogel, J.C., 1978. Isotopic assessment of the dietary habits of ungulates. South African Journal of Science, 74:298–301.
Von Fischer, J.C., and Tieszen, L., 1995. Carbon isotope characterization of vegetation and soil organic matter in subtropical forests in Luquillo, Puerto Rico. Biotropica, 27:138–148.
Yemane, D., Bonnefille, R., and Faure, H. 1985. Palaeoclimatic and tectonic implications of Neogene microflora from the Northwestern Ethiopian highlands. Nature, 318:653-656.
Yoshida, N., and Miyazaki, N., 1991. Oxygen isotope correlation of cetacean bone phosphate with environmental water. Journal of Geophysical Research, 96:815–820.
Yoneyama, T., Ohtani, T., 1983. Variations of natural 13C abundances in leguminous plants. Plant & Cell Physiology, 24:971–977.
Yoneyama, T., Fujiwara, H., Wilson, J.M., 1998. Variations in fractionation of carbon and nitrogen isotopes in higher plants: N metabolism and partitioning in phloem and xylem. In: Stable isotopes: integration of biological, ecological, and geochemical processes, Griffiths, H., Ed., pp 99-109. BIOS Scientific Publishers, Oxford.
Yoneyama, T., Fujiwara, H., Engelaar, W., 2000. Weather and nodule mediated variations in δ13C and δ15N values in field-grown soybean (Glycine max L.) with special interest in the analyses of xylem fluids. Journal of Experimental Botany, 51:559–566.
Zimmerman, J.K., and Ehleringer, J.R., 1990. Carbon isotope ratios are correlated with irradiance levels in the Panamanian orchid Catasetum viridiflavum. Oecologia, 83:247–249.