An optimized cosine-modulated nonuniform filter bank ... - CORE
Upload
khangminh22Category
view
3download
0
Crystallography Reports, Vol. 50, Suppl. 1, 2005, pp. S1–S9.Original Russian Text Copyright © 2005 by Tauson, Sapozhnikov.
STRUCTUREOF INORGANIC COMPOUNDS
Stability of the Modulated Structure of Baœkal Lazurite and Its Recrystallization at a Temperature of 600°C over
a Wide Range of Sulfur Dioxide FugacitiesV. L. Tauson and A. N. Sapozhnikov
Vinogradov Institute of Geochemistry, Siberian Division, Russian Academy of Sciences, ul. Favorskogo 1a, Irkutsk, 664033 Russia
e-mail: [email protected] February 8, 2005
Abstract—The stability of three-dimensional incommensurate modulation in cubic lazurite from the Baœkalregion is experimentally investigated at T = 600°C. It is found that the X-ray photoelectron spectra of theannealed samples exhibit a peak corresponding to sulfite and a split peak associated with the (Na,Ca)SO4 sul-fate. It is assumed that the splitting is caused by the ordering of the complexes not involved in the framework.This assumption is confirmed by the presence of a similar split peak in the X-ray photoelectron spectra of tri-clinic lazurite. It is demonstrated that the initial modulation is retained at the fugacity = 8 × 10⁻³ bar. The
decisive factors responsible for the retention of the three-dimensional incommensurate modulation are the tem-perature and the fugacity of sulfur dioxide. The latter quantity should be close to the stability boundary of thebasic lazurite structure. The growth and transformation mechanisms of the modulation formation are consid-ered. © 2005 Pleiades Publishing, Inc.
f SO2
INTRODUCTION
It is well known that lazurite is stable to externalactions. This mineral has been used to prepare anextremely resistant blue (sky blue) dye since antiquity.According to geothermometric data, lazurite is formedin the range ~600–500°C [1]. A decrease in the temper-ature is accompanied by a sequential series of phasetransformations in lazurite due to the change in itschemical composition. In the Baœkal region, three struc-tural (cubic, triclinic, monoclinic) modifications oflazurite are formed in the aforementioned temperaturerange. Cubic lazurite has a three-dimensional incom-mensurate structure in which the modulation period isnot a multiple of the subcell parameter. Triclinic andmonoclinic lazurites have commensurately modulatedstructures, which are responsible for the appearance ofadditional superstructure (satellite) reflections aroundthe reflections of the cubic subcell in the X-ray diffrac-tion patterns. The high-temperature cubic structurewith a three-dimensional incommensurate modulationis formed at temperatures from ~600 to ~500°C. Thecomposition of this modification is characterized byhigh ratios between sulfate and sulfide sulfur speciesand virtually does not contain potassium. Afganite,which is a facial analogue of lazurite, is formed at lowertemperatures. When forming afganite-bearing metaso-matites, triclinic lazurite is predominantly formed inthe temperature range ~560–520°C and the monoclinicvariety is formed at ~500°C at the front of substitutionof phlogopite for lazurite. Compositions with maxi-
1063-7745/05/5001-S $26.000001
mum concentrations of sulfide sulfur and potassium aretypical of the monoclinic modification. Transforma-tions, in particular, ordering of sulfide and sulfate clus-ters during lazurite recrystallization, occur as a result ofa change in the oxidation state of sulfur, which servesas a center of formation of intraframework clusters andis sensitive to external conditions, primarily, to SO2
activity (fugacity) [2].
The three-dimensional incommensurate modulationof the structure of cubic lazurites from Southern Baœkaldeposits has attracted particular interest of researchersdealing with aperiodic structures [3, 4]. The point isthat the sinusoidal three-dimensional modulation isunstable in terms of the continuum theory of elasticity,because the conditions for equilibrium of an elasticmedium are not satisfied for this modulation. Note thatthe sodalite-like structure of lazurite belongs to loosestructures with large holes, which are occupied by[Na3CaSO4]3+ sulfate and [Na3CaS]3+ sulfide clusters[5], whose displacements are weakly affected by thealuminosilicate framework and do not necessarily giverise to considerable internal stresses. In this case, thecharacter of deformation is similar to plastic flow, forwhich the conditions of mechanical equilibrium are sat-isfied by itself [2]. The three-dimensional incommen-surately modulated crystal structure of cubic lazuritefrom the Baœkal region is not determined, even thoughBolotina et al. [3, 6] attempted to solve this structurewithin a twin model consisting of three orthorhombiccomponents related by the [111] axis of the cubic cell.
f SO2
© 2005 Pleiades Publishing, Inc.

S2
TAUSON, SAPOZHNIKOV
Rastsvetaeva et al. [7] determined the average structureof this mineral without regard for satellite reflections.Such a structure corresponds to a superposition of allcells in which the positions of individual atoms aredetermined. The cation sites in the average structure aresplit into three subsites, which can be explained by theinadvertent errors arising when the parameters of themodulated structure are calculated within the averageapproximation. In the commensurately modulatedstructure of triclinic lazurite, Na and Ca cations occupydifferent positions and the unit cell involves two[Na3CaSO4]3+ and four [Na5.5Ca0.5SO4]4.5+ clustersarranged in an ordered manner [8].
The factors responsible for the formation of thethree-dimensional incommensurate modulation incubic lazurite, its frequent occurrence, and retention inmetasomatites of lazurite deposits in the SouthernBaœkal region remain unclear. Sapozhnikov et al. [9]experimentally revealed that the modulation can be eas-ily released by annealing the mineral in air at moderatetemperatures (for 24 h at 600°C). It is not knownwhether the three-dimensional incommensurate modu-lation is formed via the growth or transformation mech-anism and whether the modulation is reproduced upongrowth of lazurite crystals. In our earlier work [2], itwas demonstrated that, in lazurites rich with sulfateions, short-period modulations (involving from four tosix unit cells) can arise, whose stability is provided bythe balance between the elastic energy of sinusoidaldeformations and the energy of cluster ordering in themineral structure. This corresponds to the conditions ofmetastable forced equilibrium of type II (according tothe classification proposed in [10]). However, a similarequilibrium is possible only over a narrow range of SO2
fugacities, namely, from ~10–2 to ~10–5 bar at T <600°C [2]. Geochemically, it is very difficult to con-ceive factors responsible for the variation of the fugac-ity over the aforementioned narrow range taking intoaccount that the fugacity in the stability region of lazur-ite can vary by ten orders of magnitude and that naturalcubic lazurite almost always has a modulated structure.In order to gain an insight into the nature of this unusualphenomenon, it is necessary to analyze more accuratelymodulation transformations at fixed values of tempera-tures and activities of volatile components. This paperreports on the first results of such investigations. Therelease of the modulation in natural three-dimensionalincommensurately modulated lazurite was studied overa wide range of SO2 activities. It was found that, at600°C (the upper limit of the temperature range oflazurite formation in the Baœkal region), the modulationis released at all fugacities varied within five
orders of magnitude in the range where the modulationexists. However, there is a fugacity value at which themodulation is released at a minimum rate.
f SO2
CRY
EXPERIMENTAL TECHNIQUE
The experiments were performed in evacuatedsealed silica glass (optical quality) tubes. A gold tube3 mm in diameter with an oxygen buffer (500 mg) andtwo platinum tubes 1.5 mm in diameter, one of whichcontained initial lazurite (as a rule, 25 mg) and the othertube involved a sulfur fugacity indicator (pyrrhotite,100 mg), were placed in the silica tube with an innerdiameter 6 mm and ~80 mm in length. The tubes wereplaced in pockets of a massive steel holder mounted ina shaft furnace and held for a required time at600 ± 3°C, followed by cooling in air. The fugacity f ofa component in a gaseous phase characterizes its partialpressure in a nonideal gaseous medium. This quantitycan be provided by buffer mixtures (for example, ametal–oxide mixture for oxygen and a metal–sulfidemixture for sulfur) or be determined from an indicatorphase of variable composition. At a given temperatureand total pressure, the composition of such a phase (forexample, wüstite Fe1 – xO or pyrrhotite Fe1 – xS) dependsonly on the fugacity of the corresponding gas compo-nent (oxygen, sulfur). In this work, the sulfur fugacitywas determined from the pyrrhotite composition andthe SO2 fugacity was calculated from the thermody-namic data on the reaction with the participation of pyr-rhotite and S2 (see below).
When using the Ni–NiO oxygen buffer, the oxygenactivity in the system is maintained at a constant leveland the SO2 fugacity is calculated from the reaction
(1)
Within ~100 h after the beginning of the experiment,the magnetite phase is formed in the pyrrhotite indica-tor. This allows us to independently calculate the SO2fugacity according to the reaction
(2)
As was shown in our previous work [11], the dis-crepancy between the results of calculations from tworeactions does no exceed 0.2log . Higher fugacities
were achieved using the metal–oxide buffer ofvariable composition. This buffer was prepared byannealing Ni + Cu and Cu2O + NiO mixtures in sealedsilica tubes. Then, the metal and oxide components ofthe buffer were mixed in a ratio of 3 : 2. The heat treat-ment conditions were as follows: annealing at 800°Cfor two days and then annealing at 600°C for one day.Since the oxide component of the system is nonideal,the oxygen fugacity cannot be determined from thecomposition of the buffer mixture and the SO2 fugacitycannot be calculated from reaction (1). In this respect,the SO2 fugacity was initially calculated from reaction
O212---S2+ SO2.=
Fe3O43
2x------ 1+
S2+3x---FexS 2SO2.+=
f SO2
f O2
STALLOGRAPHY REPORTS Vol. 50 Suppl. 1 2005

STABILITY OF THE MODULATED STRUCTURE S3
(2) according to the relationship
(3)
where K(2) is the equilibrium constant of reaction (2),aFeS is the FeS activity in pyrrhotite, and
(4)
Here, ∆Gf are the Gibbs free energies of formation ofthe corresponding compounds. When the S2 and SO2fugacities are determined, it is easy calculate the O2fugacity from reaction (1).
The experiments were carried out using the three-dimensional incommensurately modulated lazuritetaken from the Pokhabinskoe deposit (the Slyudyankaregion). The chemical composition of the mineral canbe approximately expressed by the formulaCa1.4Na6.6Si6.1Al5.9(SO4)1.6S0.5Cl0.1(H2O)1.8. Mineralgrains were ground in an agate mortar in ethanol. Then,the powder was screened through a sieve with a square-mesh size of 40 µm. The product was elutriated initiallyin water and then in ethanol. The bottom fraction wasrejected. Thereafter, particles ~50 µm or more in sizewere absent in the sample. The size of the majority ofparticles falls in the range ~10–20 µm.
TECHNIQUES OF ANALYSISThe modulation character was determined from the
intensity ratio of satellite and subcell reflections [12].The degree of transformation or the completeness ofmodulation release was calculated as ξ = (ξin –Is/Im)/ξin, where Is/Im is the intensity ratio between the(4 + n, 4 – n, 1) satellite reflection and the (332) reflec-tion [2] and ξin = 1.60 ± 0.02 is the same ratio for theinitial sample of the three-dimensional incommensu-rately modulated lazurite. The iron content in pyrrhotitewas determined accurate to within ±0.1 at % accordingto the Toulmin–Barton standard technique [13] fromthe position of the (102) diffraction reflection with theuse of NaCl as an internal standard. The phase compo-sitions of the oxide buffers, sulfur fugacity indicator,and lazurite batch were checked by X-ray diffractionanalysis on a DRON-3 diffractometer (FeKα radiation,Mn filter; CuKα radiation, Ni filter).
The sulfur species in lazurite and products of itsannealing were studied by X-ray photoelectron spec-troscopy (XPS). This method, as a rule, is used forinvestigating the surface; however, when a sample isground immediately prior to measurements, it is possi-ble to obtain nearly true information on the sulfur spe-cies in the phase bulk. This is confirmed by the dataobtained in our previous work [14], according to whichthe atomic ratios determined for the sulfate and sulfidesulfur species by X-ray photoelectron spectroscopy and
f SO2log =
12--- K 2( )log
32x------ aFeSlog– 3
4x------ 1
2---+
f S2,log+
2.303RT K 2( )log– ∆G 2( )=
= 3x---∆GFexS
f 2∆GSO2
f ∆GFe3O4
f– 32x------ 1+
∆GS2
f .–+
CRYSTALLOGRAPHY REPORTS Vol. 50 Suppl. 1 20
chemical analysis of two lazurite samples are in reason-able agreement. The spectra were recorded on a RiberLAS-3000 spectrometer (equipped with a hemispheri-cal analyzer for electrons with a retarding potential)with the use of nonmonochromatic AlKα radiation froman aluminum anode (λ = 1486.6 eV; emission current,20 mA; tube voltage, 10 kV). The binding energy wascorrected for the surface charging by using the C 1s line(binding energy, 285 eV). The measured S 2p lineswere represented by the 2p3/2–2p1/2 doublets. In order todetermine accurate binding energies, the lines weredecomposed according to the special program provid-ing a nonlinear subtraction of the background and aGauss–Lorentz model of the line shape. The lines wereassigned to specific sulfur species in accordance withthe 2p3/2 doublet component on the basis of the dataavailable in the literature [15−19].
EXPERIMENTAL RESULTS
In the course of experiments, the lazurite batch isweakly recrystallized, which can be judged from theappearance of idiomorphic new grains in the form oftrigonal plates with a maximum size of ~50 µm (rarelyup to 100 µm). These plates bear a resemblance tostrongly flattened cubo-octahedra in which two oppo-site (111) faces are predominantly developed. Neitherthe sizes nor the number of these crystals are sufficientfor their separation from the lazurite batch and analysis.
The calculated fugacities of gases in experimentsand the measured degrees of modulation release ξ arelisted in Table 1. Analysis of these data demonstratesthat the modulation is released under all the studiedconditions in the range that was previously treated asthe range in which the modulation occurs [2]. Note that,in the time range 100–500 h under investigation, thedegree of transformation is minimum at fugacities
from 10–1.96 to 10–2.41 bar (Fig. 1).Table 2 presents the binding energies of S 2p3/2 pho-
toelectrons and the corresponding sulfur species in theinitial three-dimensional, incommensurately modu-lated lazurite and the products of its annealing in air anda under closed conditions (Fig. 2). The initial lazurite
contains sulfide, polysulfide ( , x > 2), and sulfatesulfur (Fig. 2). This is confirmed by comparison withthe spectra of ultramarine [15], which is considered alazurite form with a disordered distribution of Si and Alatoms in the framework [20]. However, after annealingat a relatively high activity of SO2, the doublet corre-sponding to the sulfate is split into two doublets (Fig. 2)and the most intense peak of the 2p3/2 doublet with abinding energy of 169.0 eV is split into two peaks withlower (167.8 eV) and higher (170.6 eV) binding ener-gies (Table 2). The intensity ratio of these peaks isapproximately 3 : 1. These peaks can be attributed onlyto sodium sulfate and calcium sulfate, respectively[17−19]. Since new phases are not formed in the lazur-
f SO2
Sx2–
05

S4 TAUSON, SAPOZHNIKOV
Table 1. Degree of release of the three-dimensional incommensurate modulation upon annealing of crystals of Baikal lazuriteat a temperature of 600°C for different fugacities of components in the gaseous phase
Experi-ment no. Metal–oxide buffer* Time, h
Pyrrhotite indicator** Degree of modulation
release ξ
Fugacities of gases, bar
phases FeS content in pyrrhotite, mol %
–log –log –log
1
Ni–NiO
100 Po + Mt 95.9 0.45 19.14 5.56 4.28
2 500 Po + Mt 95.9 0.88 19.14 5.56 4.28
3 840 Po + Mt 95.9 1.00 19.14 5.56 4.28
4Ni,Cu(21.3)–NiO + Cu2O
100 Po > Mt 96.3 0.29 17.23 6.00 2.41
5 500 Po > Mt 96.4 0.72 17.33 6.12 2.57
6Ni,Cu(50)–NiO + Cu2O
100 Po > Mt 96.0 0.32 16.95 5.65 1.96
7 500 Po + Mt 96.1 0.66 17.06 5.78 2.13
8Ni,Cu(65)–NiO + Cu2O
100 Po > Mt 95.0 0.68 16.13 4.64 0.63
9 500 Po + Mt 95.2 0.88 16.30 4.84 0.90
10Ni,Cu(80)–NiO + Cu2O
100 Po > Mt 94.4 0.82 15.63 4.06 –0.16
11 500 Po + Mt 94.0 0.78 15.30 3.69 –0.67
Note: In experiment no. 8, the amount of lazurite was taken to be larger (60 mg instead of 25 mg) for the subsequent X-ray photoelectronanalysis.
* The Cu content (wt %) in the Ni + Cu initial mixture is given in parentheses. ** Po is pyrrhotite Fe1 – xS, and Mt is magnetite Fe3O4.
f O2f S2
f SO2
ite batch, the case in point is the separation (withincrystals) and ordering of sodium and calcium sulfateclusters. This is confirmed by the appearance of super-structure reflections in the X-ray diffraction patterns of
1.0
0.8
0.6
0.4
0.2–5 –4 –3 –2 –1 0 1
Degree of release of the modulation
log fSO2, bar
12
Fig. 1. Degree of release of the three-dimensional incom-mensurate modulation in cubic lazurite from the Baœkalregion as a function of the SO2 fugacity in the gaseousphase upon annealing at a temperature of 600°C for (1) 100and (2) 500 h.
CRY
the annealed sample. It should be noted that the peak inthe range 170–171 eV is observed in the X-ray photo-electron spectra of anisotropic varieties of lazurite. Inparticular, a similar peak was found for triclinic lazurite(Fig. 3) with an ordered arrangement of clusters in thestructure. It can also be seen from Fig. 2 that, dependingon the O2 and SO2 activities, sulfate is partially trans-
formed into sulfite ( ), which becomes the domi-nant sulfur species upon annealing in air. The SO4 SO3 transformation is also observed in the systemclosed to air oxygen (Fig. 2b), even though the degreeof transformation is lower and can be determined witha larger uncertainty due to a partial overlapping of the
peaks corresponding to the and species.However, we can assume that the previously revealedreaction [14]
(5)
also proceeds in the system closed to air oxygen at rel-atively high activities of SO2.
DISCUSSION OF THE RESULTS
In our earlier work [2], it was experimentally provedthat the main factors controlling the phase relations oflazurite (including the stability of the three-dimen-sional incommensurate modulation) are the tempera-ture and the SO2 activity in the system. Modulations ofthe lazurite structure are governed by the presence of
SO32–
SO32– Sx
2–
SO42– S3
2– O2 gas( )+ + 2SO32– S2 gas( )+=
STALLOGRAPHY REPORTS Vol. 50 Suppl. 1 2005

STABILITY OF THE MODULATED STRUCTURE S5
0
ExperimentSum of doublet
Doublets
(a)
0
(b)
0.9
0.7
0.5
0.3
0.1
0175 170 165 160
(c)
Binding energy, eV
Intensity (normalized)
components
1.1
0.9
0.7
0.5
0.3
0.1
1.1
0.9
0.7
0.5
0.3
0.1
1.1
Fig. 2. S 2p X-ray photoelectron spectra of (a) the initial lazurite with three-dimensional incommensurate modulation and productsof its annealing at temperatures of (b) 600°C (100 h, = 0.23 bar) and (c) 800°C (24 h, air). The spectra are decomposed into
2p3/2–2p1/2 doublets. Sulfur species are listed in Table 2.
f SO2
CRYSTALLOGRAPHY REPORTS Vol. 50 Suppl. 1 2005

S6 TAUSON, SAPOZHNIKOV
Table 2. Binding energies of S 2p3/2 photoelectrons and the sulfur species in lazurite and products of its annealing
Lazurite type E, eV Hypothetical sulfur species
Cubic lazurite with a three-dimensional incommen-surately modulated structure*
161.1 S2–
163.5
169.0
Cubic lazurite after annealing at 600°C for 100 h, = 0.23 bar (experiment no. 8, Table 1)
161.5 S2–
164.7 +
167.8 (Na cluster)
170.6 (Ca cluster)
Cubic lazurite (small grains) after annealing at 800°C for 24 h in air
165.2
168.3
Triclinic lazurite** 161.5 S2–
163.8
167.5 (Na cluster)
171.0 (Ca cluster)
* Pokhabinskoe deposit (the Southern Baikal region).** Malo-Bystrinskoe deposit.
Sx2–
SO42–
f SO2 SO32– Sx
2–
SO42–
SO42–
SO32–
SO42–
Sx2–
SO42–
SO42–
sulfate and sulfide complexes (clusters), whose compo-sitions and ratios depend on the external conditions [3].The data obtained in the present work at T = 600°Cindicate that the three-dimensional incommensuratemodulation is released over the entire range of fugaci-ties , even though the transformation rate is mini-
mum at a fugacity of ~8 × 10⁻³ bar (Fig. 1). It seemslikely that, at 600°C, there are no fugacities atwhich the modulation retains its stability. Early Paleo-zoic deposits of the Southern Baœkal region wereformed over a very long time (approximately 30 millionyears [21]), which is quite incomparable to the durationof laboratory experiments. Such a contradiction thatresides in the presence and frequent occurrence ofthree-dimensional incommensurately modulated lazur-ite in Baœkal deposits, on the one hand, and the easinessof releasing this structural modulation, on the otherhand, can be resolved in two ways. In the first case(growth mechanism), it is assumed that cubic lazuritecrystallizes at a lower temperature (<550°C) and over avery narrow range of fugacities . In the secondcase (transformation mechanism), it is suggested thatthe three-dimensional incommensurate modulationresults from a solid-phase transformation (of the spin-odal decomposition type). According to this mecha-nism, as the temperature decreases, the “ideal” (withoutthree-dimensional incommensurate modulation) cubic
f SO2
f SO2
f SO2
CRY
lazurite formed at 600°C gradually decomposes intodomains of different compositions with the formationof structural modulation that reflects the developmentof sine waves of the composition throughout the struc-ture.
Lazurite can be represented as a solid solution ofpolysulfide sodalite (Na8Al6Si6O24Sx) and haüyne[Na6Ca2Al6Si6O24(SO4)2] [11]. Sulfate and sulfide clus-ters are ordered; however, since the SO4 sulfate content,as a rule, is higher than the sulfide content, the structurecontains excess clusters [Na3Ca · SO4]3+, i.e., clustersthat are not involved in ordering and can be distributedin a random manner [22].
The stability of the three-dimensional incommensu-rate modulation in cubic lazurite can be provided bydifferent factors. Most likely, the existence region ofthe modulation consists of two subregions or zones.The first zone is adjacent to the stability boundary ofthe lazurite phase and corresponds to high fugacities
. As the fugacity increases, lazurite decomposesinto oxide and sulfate phases, including Na4Ca(SO4)3and CaSO4 [2]. The second zone corresponds to lowerfugacities . In the second zone, cluster ordering isassociated with the chemical transformation of sulfateand sulfide (polysulfide) ions into each other. Thistransformation depends on the SO2 activity in the gas-eous phase. When the condition for forced equilibrium
f SO2
f SO2
STALLOGRAPHY REPORTS Vol. 50 Suppl. 1 2005

STABILITY OF THE MODULATED STRUCTURE S7
Intensity (normalized)
0.9
0.7
0.5
0.3
0.1
0175 170 165 160
Binding energy, eV
ExperimentSum of doublet
Doublets
components
1.1
Fig. 3. S 2p X-ray photoelectron spectrum of triclinic lazurite from the Baœkal region (compare the high-energy peak with that inFig. 2b). Sulfur species are listed in Table 2.
at which the strain energy of the structure is exactlyequal to the energy of cluster ordering is violated [2],the modulation is released rapidly. However, if thestructure contains excess sulfate clusters ([SO4] > [S])that are not involved in sulfate–sulfide ordering, theSO4 S transformation in a specific range of fugac-ities does not necessarily lead to a change in thedegree of cluster ordering. Clusters of disordereddomains will be reduced, and newly formed sulfideclusters will be characterized by ordering characteristicof the initial structure. Note that such a “damped”mechanism cannot occur in a system open to air oxygenin which sulfide (polysulfide) ions react with sulfate
ions to yield sulfite ( ) ions [14]. This can bejudged from the X-ray photoelectron spectra (Fig. 2c).Under similar conditions, the three-dimensional incom-mensurate modulation is quite unstable and can be rap-idly released, because sulfide clusters disappear.
The above damped mechanism of structure adapta-tion to changes in the external conditions seems to beimprobable for natural systems, in which variations inparameters are usually very pronounced (if for no otherreason than long-term nonuniform cooling of the sys-tem). In this respect, we consider the first zone of theexistence of the three-dimensional incommensuratemodulation, in which effects associated with the insta-bility of the sulfide sodalite minal and the “preparation”of the structure to disintegration manifest themselves.In this zone, a decrease in the fraction of sulfide clusters
f SO2
SO32–
CRYSTALLOGRAPHY REPORTS Vol. 50 Suppl. 1 20
cannot be compensated for and the fraction of sulfateclusters does not increase as a result of the S SO4simple transformation. Instead, as can be seen from theX-ray photoelectron data (Fig. 2b), clusters are ordered,which eventually (possibly, under somewhat differentconditions, for example, at lower temperatures) leads tothe formation of superstructures characteristic of tri-clinic and other lazurite modifications [23, 24]. It seemslikely that the separation of Na (S sodalite) and Ca(haüyne) clusters proceeds via the mechanism similarto spinodal decomposition of a solid solution, in dis-tinction to the above mechanism of sulfide–sulfate dis-ordering with the participation of the gaseous phase.According to the forced equilibrium theory [25], we aredealing here with the state that is controlled by the bal-ance between the chemical energy of composition fluc-tuations and the energy of cluster ordering. Fluctuationcomposition waves in developing immiscibility areobstructed by cluster ordering processes that involvenot only S and SO4 clusters with the same ratio of Naand Ca ions (whose distribution is fixed at a constantfugacity ), but also sulfate clusters with differentratios of Na and Ca ions. A compromise structureshould be consistent both with the corresponding mod-ulation of the composition and distortion and also withcluster ordering. It should be emphasized that this equi-librium is attained only in the region very close to thestability boundary of the lazurite phase, above which(along the axis) lazurite decomposes into simpleand complex oxides and sulfates. The above mecha-
f SO2
f SO2
05

S8 TAUSON, SAPOZHNIKOV
nism can be illustrated by the simple balance formula
∆Estrain + ∆Echem = + , (6)
where the left-hand side contains the increments of theelastic strain energy and the chemical energy of struc-tural components and the right-hand side includes theenergy changes associated with the cluster orderingprocesses. The adaptability of the given equilibrium(although this equilibrium is assumed to be metastable)is explained by the fact that the terms on the left- andright-hand sides are interdependent and can be“adjusted” to each other in specific ranges. Therefore,such a state can be stable with respect to insignificantvariations in the internal thermodynamic parameter.
The proposed model results in interesting geochem-ical consequences. It follows from this model that analmost constant fugacity at a given temperature ofcrystal formation in the vicinity of the stability bound-ary of the lazurite system should be a necessary condi-tion for the stability of the three-dimensional incom-mensurate modulation. However, this leads to the infer-ence that not the SO2 activity determines the ratio ofsulfur species in lazurite but, in contrast, the “internalfugacity” of sulfur dioxide (i.e., the existing distribu-tion of sulfate and sulfide ions in the lazurite structure),maintains a constant partial pressure of sulfur dioxidein the gaseous phase. Such a situation is possible whenthe mass of the solid phase is considerably larger thanthat of the gaseous phase in a closed system. In thiscase, the chemical potential of the mobile SO2 compo-nent cannot be treated as an independent variable thatgoverns the equilibrium state of the system, i.e., as anequilibrium factor. However, we cannot completelyrule out the possibility that a constant SO2 fugacity ismaintained by any buffer with a high capacity. Fluctua-tions that always arise in real systems would lead eitherto a scenario controlled by the aforementioned dampedmechanism (with a decrease in the fugacity ) or tocomplete decomposition of lazurite (with an increase inthe fugacity ), whose products were not retainedbecause of their high solubility in a hydrothermal fluid.
CONCLUSIONSThus, it was demonstrated that, although a three-
dimensional incommensurate modulation of cubiclazurite is easily released even upon short-term anneal-ing at moderate temperatures, such a modulation fre-quently occurs in the structure of minerals in lazuritedeposits of the Southern Baœkal region and is retainedfor hundreds of millions of years of their rather com-plex geologic history. There are at least three mecha-nisms of release of the three-dimensional incommensu-rate modulation. The first two mechanisms are hetero-geneous. The first mechanism involves rapid release ofthe modulation in the case of free access for air oxygendue to the reaction between polysulfide and sulfate ions
∆EordS–SO4 ∆Eord
Na–Ca
f SO2
f SO2
f SO2
CRY
with the formation of sulfite ions. The second mecha-nism suggests slower sulfide–sulfate disordering (alsogoverned by the gaseous phase) when the system comesout of metastable forced equilibrium that allows for astructural adaptation to a variation in the SO2 fugacityover a narrow range. The modulation release at rela-tively high activities of sulfur dioxide in the vicinity ofthe stability boundary of the lazurite structure, whenthe instability of the S sodalite minal of lazurite beginsto manifest itself, is accompanied by the separation andordering of Na and Ca sulfate clusters via the purelysolid-phase mechanism similar to spinodal decomposi-tion of solid solutions. The stability of the three-dimen-sional incommensurate modulation can be explained bythe fact that the energy of fluctuation compositionwaves in developing immiscibility is compensated forby the energy of ordering of clusters, including not onlyS and SO4 clusters with the same ratio of Na and Caions (whose distribution is fixed at a constant fugacity
) but also sulfate clusters with different ratios ofNa and Ca ions. Further experiments will be performedin order to refine the parameters with which the three-dimensional incommensurate modulation is com-pletely retained and to solve conclusively the problemregarding the nature of its stability.
ACKNOWLEDGMENTS
We would like to thank Yu.V. Shchegol’kov for hisassistance in performing the spectroscopic investiga-tion of the lazurite crystals.
This work was supported by the Russian Foundationfor Basic Research, project no. 03-05-65108.
REFERENCES
1. V. G. Ivanov and A. N. Sapozhnikov, Lazurites of USSR(Nauka, Novosibirsk, 1985) [in Russian].
2. V. L. Tauson, V. V. Akimov, A. N. Sapozhnikov, andK. E. Kuznetsov, Geokhimiya, No. 8, 803 (1998).
3. N. B. Bolotina, R. K. Rastsvetaeva, A. N. Sapozhnikov,et al., Kristallografiya 48 (5), 779 (2003) [Crystallogr.Rep. 48 (5), 721 (2003)].
4. Luo Gu-Fend, Zhao Ming, Xiao-Yue, et al., GaoxiaoDizhi Xuebao 6, 132 (2000).
5. I. Hassan and P. R. Buseck, Am. Mineral. 74 (3/4), 394(1989).
6. N. B. Bolotina, R. K. Rastsvetaeva, A. N. Sapozhnikov,et al., Kristallografiya 48 (1), 14 (2003) [Crystallogr.Rep. 48 (1), 8 (2003)].
7. R. K. Rastsvetaeva, N. B. Bolotina, A. N. Sapozhnikov,et al., Kristallografiya 47 (3), 449 (2002) [Crystallogr.Rep. 47 (3), 404 (2002)].
8. V. G. Evsyunin, A. N. Sapozhnikov, A. A. Kashaev, andR. K. Rastsvetaeva, Kristallografiya 42 (6), 1014 (1997)[Crystallogr. Rep. 42 (6), 938 (1997)].
9. A. N. Sapozhnikov, A. Ya. Medvedev, V. G. Ivanov, et al.,Zap. Vseross. Mineral. O–va, No. 2, 82 (1994).
f SO2
STALLOGRAPHY REPORTS Vol. 50 Suppl. 1 2005

STABILITY OF THE MODULATED STRUCTURE S9
10. V. L. Tauson and V. V. Akimov, Geochim. Cosmochim.Acta 61 (23), 4935 (1997).
11. V. L. Tauson, A. N. Sapozhnikov, and K. E. Kuznetsov,in Proceedings of the International Conference “Crys-tals: Growth, Properties, Real Structure, and Applica-tion,” Aleksandrov, Russia, 1999 (VNIISIMS, Aleksan-drov, 1999), Vol. 1, p. 278.
12. A. N. Sapozhnikov, V. L. Tauson, and L. N. Matveeva,Zap. Vseross. Mineral. O–va, No. 2, 121 (2001).
13. P. Toulmin III and P. B. Barton, Jr., Geochim. Cosmo-chim. Acta 28 (5), 641 (1964).
14. V. L. Tauson and A. N. Sapozhnikov, Zap. Vseross. Min-eral. O–va, No. 5, 102 (2003).
15. Heyong He, T. L. Barr, and J. Klinowski, J. Phys. Chem.98 (33), 8124 (1994).
16. Yu. Mikhlin, V. Varnek, I. Asanov, et al., Phys. Chem.Chem. Phys. 2, 4393 (2000).
17. R. V. Siriwardene and J. M. Cook, J. Colloid InterfaceSci. 104, 250 (1985).
CRYSTALLOGRAPHY REPORTS Vol. 50 Suppl. 1 20
18. J. F. Moulder, W. F. Stickle, P. E. Sobol, andK. D. Bomben, Handbook of X-ray Photoelectron Spec-troscopy (Perkin-Elmer Corporation, Minnesota, 1992).
19. C. D. Wagner, A. V. Naumkin, A. Kraut-Vass, et al.,www.nist.gov/srd/online.htm.
20. J. Klinowski, S. W. Carr, P. Tarling, and P. Barnes,Nature (London) 330 (6143), 56 (1987).
21. L. Z. Reznitskiœ, A. B. Kotov, E. B. Sal’nikova, et al.,Petrologiya 8 (1), 74 (2000).
22. I. Hassan, Am. Mineral. 85, 1383 (2000).23. A. N. Sapozhnikov, Zap. Vseross. Mineral. O–va, No. 1,
110 (1990).24. A. N. Sapozhnikov, V. G. Ivanov, et al., Zap. Vseross.
Mineral. O–va, No. 1, 108 (1993).25. V. S. Urusov, V. L. Tauson, and V. V. Akimov, Geochem-
istry of the Solid State (GEOS, Moscow, 1997) [in Rus-sian].
Translated by O. Borovik-Romanova
05

Crystallography Reports, Vol. 50, Suppl. 1, 2005, pp. S10–S15.Original Russian Text Copyright © 2005 by A. D. Lysenko, Kravets, A. A. Lysenko.
STRUCTUREOF INORGANIC COMPOUNDS
Structure of Lanthanum Prepared by Quenchingfrom a Liquid State
A. B. Lysenko, O. L. Kravets, and A. A. LysenkoDneprodzerzhinsk State Technical University,
Dneprostroevskaya ul. 2, Dneprodzerzhinsk, 51918 Ukrainee-mail: [email protected]
Received February 3, 2005
Abstract—The structure of lanthanum quenched from a liquid state at cooling rates of 2.5 × 10⁵–107 K/s isinvestigated. It is shown that a mixture of the face-centered cubic β-La phase stable above 583 K and the meta-stable lanthanum modification with a seven-layer hexagonal lattice consisting of alternating atomic layersABCABAC… is formed in rapidly cooled foils. A mechanism is proposed for the formation of the metastablepolytype, according to which the polytype is formed as a result of saturation of the main β-phase with well-ordered stacking faults. © 2005 Pleiades Publishing, Inc.
INTRODUCTION
Lanthanum, like other light rare-earth elements (Ce,Pr, Nd, etc.), belongs to polymorphic metals [1–3].Under near-equilibrium conditions, lanthanum crystal-lizes in the body-centered cubic γ-modification stable ina relatively narrow (59 K) temperature range (Table 1). Ata temperature of 1134 K, the γ modification of the metaltransforms into the β modification with a face-centeredcubic (fcc) lattice. Upon cooling to 583 K, lanthanumundergoes one more polymorphic transformation(β α). In this case, the face-centered cubic latticetransforms into a four-layer hexagonal lattice of the A3'type. In Table 1, this lattice is designated as the doublehexagonal close-packed lattice. According to the dataobtained by McHargue et al. [4], the last transformationoccurs through a gradual change in the sequence ofalternating close-packed layers (ABC… ABAC…)and is characterized by a low rate, incompleteness, anda large temperature gradient.
Therefore, lanthanum has two close-packed modifi-cations, namely, the face-centered cubic and doublehexagonal close-packed modifications, which differonly in the packing sequence of atomic layers (Fig. 1).The face-centered cubic lattice consists of three closestpacked layers ABC…, which are represented by the(111) atomic planes. The double hexagonal close-packed lattice is composed of four layers ABAC…. Thislattice is formed by the (0001) basal planes of the hex-agonal prism.
Similar structural varieties of crystalline com-pounds are referred to as polytypes. The specific atomicvolume of each compound does not depend on the num-ber of layers in a unit cell, and the free energies of thecompounds only slightly differ from each other. This
1063-7745/05/5001-S $26.000010
explains the coexistence of different polytypes and thelow rate of polytypic transformations [5].
Reasoning from the concept of polytypism and thedata available in the literature on the temperatureranges of stability of different allotropic varieties oflanthanum, it can be expected that, upon slow coolingto room temperature, the lanthanum structure shouldmost likely represented by a mixture of β and α close-packed modifications. In the course of quenching froma liquid state, the formation of the primary structure andsubsequent solid-phase transformations occur underconditions of the competitive formation of the poly-typic modifications. This can lead to both quantitativeand qualitative changes in the crystal structure of themetal. In order to verify the last assumption, we under-took an X-ray diffraction investigation into the struc-ture of the lanthanum samples subjected to differenttreatments, including rapid quenching at cooling ratesup to ~107 K/s.
Table 1. Structure and ranges of stability of the allotropiclanthanum modifications [3]
Modifi-cation Lattice type Stability
range, K
Lattice para-meter, nm
a c
γ Body-centered cubic (A2)
1134–1193 0.426
β Face-centered cubic (A1)
583–1134 0.5305
α Double hexagonal close-packed (A3')
<583 0.3722 1.2144
© 2005 Pleiades Publishing, Inc.

STRUCTURE OF LANTHANUM S11
SAMPLE PREPARATION AND EXPERIMENTAL TECHNIQUE
The experiments were performed with samples oftwo series (Table 2). Samples of the first series were cutin the form of plates (15 × 15 × 3 mm in size) from amassive ingot. These samples were annealed in anSShVÉ-12.5/25-43 vacuum electric furnace at temper-atures both above and below the temperature of theβ α polymorphic transformation. After the high-temperature treatment, the samples were cooled eitherat a low rate of ~3.3 × 10⁻² K/s or at a relatively highrate of ~0.7 K/s. In the latter case, after the isothermaltreatment, the samples were rapidly transferred fromthe working zone to the cold part of the vacuum cham-ber.
Samples of the second series were prepared byquenching a small portion (~50–100 mg) of the liquidmetal on the inner surface of a rapidly spinning (3000–8000 rpm) bronze drum. In order to prevent interactionbetween the melt and air, the quenching from the liquidstate was carried out in a purified argon. By varying thepressure of a carrier gas (Ar) and the rate of rotation ofthe crystallizer drum, we prepared 20- to 100-µm-thicklanthanum foils and individual plates whose thicknessdid not exceed 10 µm.
The cooling rate v of the products obtained by rapidquenching was determined from their thickness l withthe use of the relationships derived by numericallysolving the problem of heat transfer between a thinlayer of the liquid metal and a massive heat absorberwith the subsequent fitting of the results of the numeri-cal simulation to the known experimental values v [6].These relationships are as follows:logv = 10.53 – 2.93logl at 20 µm ≤ l ≤ 100 µm, (1)
logv = 8.43 – 1.3logl at l < 20 µm. (2)
The cooling rates calculated from relationships (1)and (2) for the aforementioned thicknesses of the rap-idly quenched samples vary from ~5 × 10⁴ to ~107 K/s.
The structure of the samples was investigated usingX-ray diffraction. The X-ray diffraction patterns wererecorded on a DRON-3 diffractometer (monochro-mated radiation). The phase composition of thesamples studied was determined by comparing theresults of the X-ray diffraction analysis with the ASTMdiffraction data file, as well as with the theoreticallycalculated sets of interplanar distances and relativeintensities of the diffraction lines for the hypotheticalequilibrium and metastable phases.
RESULTS AND DISCUSSIONFigure 2 shows the most informative portions of the
X-ray diffraction patterns obtained for samples of bothseries. It can be seen from Fig. 2 that the lanthanumsample treated under conditions providing the highestdegree of similarity to the equilibrium state (Table 2,regime 1) contains the α modification stable at room
CuKα
CRYSTALLOGRAPHY REPORTS Vol. 50 Suppl. 1 20
temperature and a small amount of the β-La modifica-tion (Figs. 2a, 2b). An increase in the rate of heat treat-ment at the final stage (regime 2) leads to an insignifi-cant change (by 5–10%) in the quantitative ratiobetween the α and β phases due to the increase in the βphase. Therefore, during relatively slow cooling of thelanthanum sample from temperatures corresponding tothe stability range of the β modification, the β αtransformation is not completed and the amount of theinitial β phase increases with an increase in the coolingrate.
Upon quenching from the liquid state at the highestrate (regime 3), the structure of the lanthanum samplechanges qualitatively. The X-ray diffraction patterns ofthe rapidly quenched foils (Fig. 2b) involve reflectionsof the high-temperature β modification and a number ofdiffraction lines that can be assigned to none of the
Table 2. Treatment conditions of the samples under investi-gation
Regime Sample type
Rate of rapid quenching,
K/s
Annealing conditions
T, K τ, h v, K/s
1 P 773 1.0 3.3 × 10⁻²
2 P 773 1.0 0.7
3 F 107
4 F 2 × 10⁵
5 F 107 673 1.0 1.2
Note: F is the foil prepared by quenching from the melt, and P isthe plate cut out from the ingot.
A
C
A
B
A
C
B
A
(c)
A
C
A
B
A
A
C
B
A
(b)
(a)
Fig. 1. Crystal lattices of the close-packed polymorphicmodifications of lanthanum: (a) face-centered cubic β-La,(b) double hexagonal closed-packed α-La, and (c) theseven-layer lattice (7R) formed upon quenching from theliquid state.
05

S12
LYSENKO
et al
.
0.14
I, arb. units
sinθ/λ, nm–10.16 0.18 0.20 0.22
(a)
(b)
(c)
(d)
(e)
Fig. 2. (a–d) X-ray diffraction patterns of the lanthanum samples treated according to the regimes given in Table 2: (a) the bulksample (regime 1) and (b–d) rapidly quenched foils treated according to regimes (b) 3, (c) 4, and (d) 5. (e) X-ray diffraction diagramsof the α-La (solid lines) and β-La (dashed lines) modifications.
equilibrium structural varieties of the metal. It is char-acteristic that the location and relative intensities of themajority of the unidentified lines correlate reasonablywith those observed in the X-ray diffraction diagram ofthe α-La modification (Fig. 2e). However, this correla-tion is not complete. The fundamental differencebetween these diffraction patterns lies in the fact that,instead of the most intense (102) line of the α modifica-tion, the X-ray diffraction patterns of the rapidlyquenched foils exhibit two lines of moderate intensity(in Fig. 2b, these lines are indicated by arrows). Adecrease in the cooling rate to 2 × 10⁵ K/s (regime 4)brings about a considerable decrease in the intensity ofthe lines under consideration (Fig. 2c). The subsequentannealing of the rapidly quenched samples (regime 5)results in the complete disappearance of these lines. Ascan be seen from Fig. 2d, the X-ray diffraction patternsof the annealed foils are similar to those observed for a
CRY
mixture of the equilibrium close-packed modifications,with the face-centered cubic β-La phase being predom-inant.
The experimental data obtained allow us to make theinference that, upon quenching from the liquid state atcooling rates higher than ~105 K/s, the lanthanum struc-ture contains the high-temperature β-modification anda metastable modification (hereafter, this modificationwill be designated as µ-La). The formation of the µ-Laphase can be associated with the change in the sequenceof the phase transformations occurring during rapidcooling of lanthanum. In this respect, we consider thepossible mechanism of the formation and the specificfeatures of the crystal structure of the µ-La phase.
As is known, quenching from a liquid state leads tostrong supercoolings, which, for different metals, canreach several hundreds of degrees [7]. Taking intoaccount this circumstance and the narrow temperature
STALLOGRAPHY REPORTS Vol. 50 Suppl. 1 2005

STRUCTURE OF LANTHANUM S13
BACBACBACBA
ABC
CBACBACBACBA
ACBACBACBAC
B
A
ACBACB
C
C
BACBA
A
A
CB
B
CA
B
A
ACBACBACBACB
C
B
BACBAC
A
ACBACBAC
BA
CABC... ABAC... ABC... ABCABAC...
(a) (b)
Fig. 3. Schematic diagrams illustrating the transformations of the face-centered cubic lattice into (a) a double hexagonal close-packed lattice of the α-La type and (b) a 7R seven-layer lattice typical of the metastable µ modification of lanthanum.
range of stability of the body-centered cubic γ-La phase(Table 1), it is reasonable to assume that crystals of theβ modification with a face-centered cubic lattice nucle-ate first in the supercooled melt during rapid quenchingof lanthanum. The nucleated β-La crystals grow at ahigh rate, which, in turn, encourages the appearance ofstacking faults in their structure. The high probabilityof these processes during crystallization of light rare-earth metals can be judged from the lowest energies ofstacking faults among those known for face-centeredcubic metals [8].
The development of the crystallization is accompa-nied by an increase in the number of stacking faults inthe main phase, followed by their partial or completeordering, which results in a decrease in the free energyof the metal. When the number of stacking faults in themetal reaches a critical level and the degree of orderingbecomes sufficiently high, the atomic packing changesqualitatively; i.e., there arises a new type of crystal lat-tice.
The proposed mechanism makes it possible toobtain different types of close-packed structures fromthe face-centered cubic lattice. As an example of simi-lar transformations, Fig. 3a depicts the schematic dia-gram illustrating the transformation of a face-centeredcubic lattice into a four-layer hexagonal lattice of the α-La type (A3'). The left column in Fig. 3a represents theinitial sequence of closed-packed atomic layers ABC…,which is characteristic of the face-centered cubic struc-ture. The horizontal segments show the positions of rel-ative displacements of the adjacent planes. The arrowsindicate the coordinates of the atoms in the displacedlayer before and after the displacement. The final con-figuration of the close-packed layers is marked withbold type.
It can be seen from Fig. 3a that the relative displace-ments of the two adjacent atomic planes of the face-centered cubic lattice in the crystal lead to the forma-tion of extrinsic stacking faults. In the case of anordered arrangement of these faults with a period ofthree atomic layers, the packing sequence of atomiclayers transforms into the sequence ABAC…, which is
CRYSTALLOGRAPHY REPORTS Vol. 50 Suppl. 1 2
characteristic of the α-La lattice. By using a similarprocedure, i.e., by introducing periodically arrangedstacking faults into the face-centered cubic lattice, it ispossible to construct different hypothetical metastablepolytypes of the metal that are formed under nonequi-librium cooling conditions.
In order to solve this problem, we performed thecomputer simulation of the structures whose packingsinvolve different numbers of closed-packed atomic lay-ers alternating in different manners. We consideredmodels in which the number of layers N was variedfrom five to twelve. These models were conventionallydenoted as NR. When calculating the structure factor ofthe intensity, the coordinates of the basis atoms(expressed in terms of the hexagonal unit cell parame-ter) for layers A, B, and C were specified in the follow-ing form [9]:
(3)
where nA, nB, and nC are the integer numbers (0, 1, 2, …,N – 1) corresponding to the numbers of close-packedlayers A, B, and C.
The unit cell parameters (aNR, cNR) of the multilayerstructures were determined under the assumption that,upon the transformation of the face-centered cubic lat-tice into an N-layer lattice NR, the atomic packing den-sity and the shortest interatomic distances remainunchanged. In this case, the following relationships are
satisfied: = and = . These relation-ships can be rewritten as
(4)
(5)
It should be noted that the lattice spacing of the mainface-centered cubic phase is affected by the impuritiesand excess vacancies frozen upon rapid quenching. Forthis reason, the unit cell parameters cNR and aNR, which
0 0 nA/N, ,( ),
1/3 2/3 nB/N, ,( ),
2/3 1/3 nC/N, ,( ),
d111fcc d00N
NR d220fcc d110
NR
cNR Nafcc/ 3,=
aNR 2afcc/ 8.=
005

S14 LYSENKO et al.
Table 3. Identification of the X-ray diffraction patterns of the lanthanum samples quenched from the liquid state at a rate of~107 K/s
Experimental dataIdentified phases
β-La (face-centered cubic), a = 0.5305 nm [3] µ-La (7R), a = 0.3751 nm, c = 2.1441 nm
sample I dHKL, nm H K L I dHKL, nm H K L I dHKL, nm
1 16 0.3251 1 0 0 0.3248
2 25 0.3139 1 0 2 0.3109
3 100 0.3042 1 1 1 100 0.3063 0 0 7 0.3063
4 38 0.2914 1 0 3 0.2957
5 33 0.2814 1 0 4 0.2778
6 18 0.2644 2 0 0 56 0.2653
7 13 0.2577 1 0 5 0.2589
8 6 0.1874 2 2 0 40 0.1876 1 1 0 0.1876
9 1 0.1697 1 0 11 0.1671
10 3 0.1633 2 0 0 0.1622
2 0 1
11 9 0.1606 3 1 1 43 0.1600 1 1 7 0.1599
12 4 0.1561 1 0 12 0.1560
2 0 4
13 11 0.1523 2 2 2 13 0.1531 2 0 5 0.1519
were calculated from relationships (4) and (5) with theuse of the references values aβ-La, were corrected at thestage of analyzing the results of the simulation by thebest fitting of the interplanar distances calculated forthe hypothetical phases to the experimental set ofparameters dHKL.
The results of the simulation performed demon-strate that, among all the obtained structural models ofthe lanthanum quenched from the liquid state at a cool-ing rate of ~107 K/s, the most probable model corre-sponds to a mixture of the metastable µ-La modifica-tion and a residual amount of the main β-phase. In thiscase, the metastable µ-La modification has a seven-layer lattice with alternating close-packed layersABCABAC… (Fig. 1c). The lattice spacings of thesephases, as well as the experimental and calculated setsof interplanar distances and relative intensities I of thediffraction lines, are presented in Table 3. As can beseen, the X-ray diffraction data are in good agreementwith the results obtained within the hypothetical struc-tural model of rapidly quenched lanthanum foils.
In order to give a deeper insight into the interrelationbetween the structure and the mechanism of the forma-tion of the metastable µ-La modification, we emphasizethat the crystal lattice 7R can be easily constructed fromthe face-centered cubic lattice by saturating the latterlattice with extrinsic stacking faults that are regularlyrepeated at intervals of five atomic layers (Fig. 3b). It is
CRY
also significant that the packing sequence ABCABAC…formed in the 7R-type structure involves three-layer(ABC) and four-layer (ABAC) related fragments, whichare characteristic of the A1-type and A3'-type lattices.Consequently, the X-ray diffraction patterns of the rap-idly quenched samples are similar in a number of traitsto the diffraction patterns of the face-centered cubic anddouble hexagonal close-packed modifications; as well,they exhibit the aforementioned specific features thatindicate a radically new structure of the metastable µ-La phase.
CONCLUSIONS
The metastable structural modification of lantha-num (µ-La) was prepared by quenching from a liquidstate at cooling rates of higher than 105 K/s. This mod-ification, together with the high-temperature face-cen-tered cubic modification of lanthanum, is identified inrapidly cooled foils.
The crystal lattice of the µ-La modification is ade-quately described as a seven-layer hexagonal lattice(a = 0.3751 nm, c = 2.1441 nm) composed of closed-packed layers with the packing sequence ABCABAC….
Most likely, the metastable modification is formedas a result of the accumulation of stacking faults andtheir ordered arrangement in the lattice of β-lanthanum,which crystallizes during rapid cooling of the melt.
STALLOGRAPHY REPORTS Vol. 50 Suppl. 1 2005

STRUCTURE OF LANTHANUM S15
REFERENCES1. K. A. Gschneidner, Rare-Earth Alloys (Van Nostrand,
Princeton, 1961; Mir, Moscow, 1965).2. Carl J. Altstetter, Metall. Trans. 4, 2723 (1973).3. E. M. Savitskiœ and V. F. Terekhova, Physical Metallurgy
of Rare-Earth Metals (Nauka, Moscow, 1975) [in Rus-sian].
4. C. J. McHargue, H. L. Yakel, Jr., and L. K. Jetter, ActaCrystallogr. 10, 832 (1957).
5. L. I. Lysak and B. I. Nikolin, Physical Principles ofThermal Treatment of Steels (Tekhnika, Kiev, 1975) [inRussian].
CRYSTALLOGRAPHY REPORTS Vol. 50 Suppl. 1 20
6. A. B. Lysenko, G. V. Borisova, and O. L. Kravets, Fiz.Tekh. Vys. Davlenii (Donetsk) 14 (1), 44 (2004).
7. I. S. Miroshnichenko, Quenching from a Liquid State(Metallurgiya, Moscow, 1982) [in Russian].
8. I. I. Novikov, Defects in the Crystal Structure of Metals(Metallurgiya, Moscow, 1975) [in Russian].
9. L. I. Lysak, B. I. Nikolin, and A. I. Ustinov, Fiz. Met.Metalloved. 42 (3), 601 (1976).
Translated by O. Borovik-Romanova
05

Crystallography Reports, Vol. 50, Suppl. 1, 2005, pp. S100–S105.Original Russian Text Copyright © 2005 by Budenkova, Vasiliev, Shlegel, Ivannikova, Bragin, Kalaev.
CRYSTALGROWTH
Comparative Analysis of the Heat Transfer Processes during Growth of Bi12GeO20 and Bi4Ge3O12 Crystals
by the Low-Thermal-Gradient Czochralski TechniqueO. N. Budenkova*, M. G. Vasiliev*, V. N. Shlegel**, N. V. Ivannikova**,
R. I. Bragin**, and V. V. Kalaev**** Ioffe Physicotechnical Institute, Russian Academy of Sciences,
Politekhnicheskaya ul. 26, St. Petersburg, 194021 Russiae-mail: [email protected]
** Institute of Inorganic Chemistry, Siberian Division, Russian Academy of Sciences,pr. Akademika Lavrent’eva 3, Novosibirsk, 630090 Russia
*** OOO Soft Impact, St. Petersburg, 194156 RussiaReceived February 7, 2005
Abstract—The heat transfer processes occurring in the solid and liquid phases during growth of Bi12GeO20 andBi4Ge3O12 crystals by the low-thermal gradient Czochralski method are analyzed and compared. It is experi-mentally found that, under similar growth conditions, the deflection of the crystallization front for theBi12GeO20 crystal is considerably smaller than the deflection of the crystallization front for the Bi4Ge3O12 crys-tal and the faceting of the former front is observed at the earlier stage of pulling. The results of the numericalsimulation demonstrate that the different behavior of the crystallization fronts is associated with the differencebetween the coefficients of thermal absorption in the crystals. © 2005 Pleiades Publishing, Inc.
INTRODUCTION
In the Bi2O3–SiO2 and Bi2O3–GeO2 systems, twoisostructural compounds, namely, Bi12GeO20 andBi12SiO20, crystallize in a sillenite-type structure, andtwo isostructural compounds, namely, Bi4Ge3O12 andBi4Si3O12, have an eulytine-type structure. Single crys-tals of these compounds are grown by the Czochralskimethod and exhibit a strong tendency to faceting. As arule, the faceting is considered a factor that hinders thegrowth of high-quality crystals. The formation of facetsat the crystallization front has been explained by thedeviation from the optimum growth conditions,because additional stresses and a nonuniform distribu-tion of impurities arise in the vicinity of faceted regions[1]. Therefore, it is common practice to suppress theformation of facets by appropriately choosing thegrowth conditions with large temperature gradients.However, the deterioration of the crystal quality iscaused not by the facets themselves but by the pro-cesses of crystal growth occurring through differentmechanisms on faceted and rough (rounded) regions ofthe crystallization front. By contrast, the use of smalltemperature gradients in the Czochralski method leadsto the rapid formation of facets already at early stagesof crystal pulling, after which the crystal growth occursonly through the layer (facet) mechanism over theentire front of crystallization and it becomes possible toprepare large-sized crystals of very high quality [2].
1063-7745/05/5001-S $26.00 0100
However, it turns out that, when growing Bi12GeO20and Bi4Ge3O12 crystals by the low-gradient Czochralskimethod under similar conditions (i.e., in the same appa-ratus, under similar temperature conditions, and inidentical pulling directions), the behavior of their inter-faces after the shouldering stage differs significantly.The facets of the former crystal are formed almostimmediately after the required (stationary) diameter isreached, whereas the crystallization front for germa-noeulytine appears to be deeply convex toward the meltand becomes fully faceted only in the course of crystalpulling. Without recourse to numerical analysis of thisprocess, it is difficult to determine the factor primarilyresponsible for the formation of the crystallization frontin the crystals under consideration. On the one hand,the thermal parameters of the melts differ significantly(see table). Under similar growth conditions, theGrashof and Reynolds numbers for the Bi12GeO20 meltare larger than those for the Bi4Ge3O12 melt by a factorof approximately 11 and 3, respectively. Hence, we canassume that different convection regimes should beresponsible for the different shapes of the crystalliza-tion fronts of these crystals [3–5]. On the other hand,both crystals are characterized by the semitransparentbands in the IR spectral range. This implies that heattransfer from the interface through the crystal is pro-vided by heat conduction and radiation, which, in turn,also substantially affects the shape of the crystallizationfront in the course of crystal pulling [6]. It should benoted that, in [3, 4], the growth of sillenite crystals was
© 2005 Pleiades Publishing, Inc.

COMPARATIVE ANALYSIS OF THE HEAT TRANSFER S101
studied without regard for the effect of heat transferthrough the crystal on the shape of the crystallizationfront. Rojo et al. [5] assumed that heat transfer in crys-tals occurs only through thermal conduction. In our ear-lier work [7], we numerically investigated the effect ofheat transfer on the shape of the crystallization front forBi4Ge3O12 crystals with a diameter of 7.7 cm. It wasdemonstrated that, for a diffusely reflective surface ofthe crystal, the inclusion of radiative heat transfer leadsto a moderate deflection of the crystallization fronttoward the melt and this defection remains virtuallyunchanged with an increase in the crystal length. Sucha situation contradicts the available experimental data.However, when it was assumed that the shoulderingcone surface is specularly reflective (Fresnel) and thecylindrical crystal surface is diffuse, the results of cal-culations were in good agreement with the experimen-tal results. In this case, the crystallization front at smallcrystal lengths is deflected by more than one radius andthe deflection decreases with an increase in the crystallength. Similar results were obtained in simulating thegrowth of Bi12GeO20 crystals with a diameter of 2.8 cm,for which the deflection of the crystallization fronttoward the melt also turned out to be comparable to thecrystal diameter [8]. However, the absorption coeffi-cient of the germanosillenite crystal in the most trans-parent spectral band is one order of magnitude largerthan that of the germanoeulytine crystal (see table).Therefore, at identical sizes of growing crystals, theeffect exerted by radiative heat transfer through thesolid phase on the interface shape during growth of theBi4Ge3O12 crystal should be considerably stronger thanthat during growth of the Bi12GeO20 crystal. It shouldbe noted that the influence of the absorption coefficientof the crystal and the melt on the shape of the crystalli-zation front (all other factors being the same) was con-sidered by Kobayashi et al. [9] in the case of growth ofLiNbO3 crystals under the assumption that the crystalsurface is diffusely reflective and that the temperatureconditions correspond to the Czochralski method withlarge temperature gradients.
In this work, we carried out a comparative analysisof the global heat transfer during growth of crystals ofthe Bi4Ge3O12 germanoeulytine and the Bi12GeO20 ger-manosillenite for specular (Fresnel) reflection of radia-tion from the crystal surface. The results of the numer-ical simulation were compared with the experimentaldata.
EXPERIMENTAL TECHNIQUE
The schematic diagram of the apparatus is depictedin Fig. 1. The platinum crucible was immovable, andthe crystal was rotated at the rate Ω = 15 rpm. The sta-tionary diameters of the grown crystals were identicaland equal to 50 mm. The diameter of the crucible was70 mm. The pulling rate was 3.5 mm/h. The crystalswere pulled along the [111] direction. During growth ofthe Bi4Ge3O12 crystals, only the 112 facets were
CRYSTALLOGRAPHY REPORTS Vol. 50 Suppl. 1 20
observed at the crystallization front. For the Bi12GeO20crystals, the crystallization front was formed by facetsof three types, namely, the 112, 001, and 110facets, depending on the growth conditions. In order tocompare the magnitude and shape of the front deflec-tion, we used the Bi4Ge3O12 and Bi12GeO20 crystals inwhich the central 112 facets occupy the larger part ofthe crystallization front. Figure 2 displays the micro-graphs of the Bi4Ge3O12 (Fig. 2a) and Bi12GeO20(Fig. 2b) crystals with typical shapes of the crystalliza-tion fronts.
Thermal and physical properties of the Bi4Ge3O12 andBi12GeO20 crystals
Parameter Bi4Ge3O12 Bi12GeO20
Melt
Melting temperature Tm, K 1323 1203
Density, kg/m3 6710 8130
Dynamic viscosity 0.044 0.017
Bulk thermal expansion coeffi-cient, 10–4 1/K
0.76 1.2
Thermal conductivity, W/(m K) 0.7832 0.345
Heat capacity, J/(kg K) 356.0 390.0
Thermal diffusivity, m2/s 2.99 × 10⁻⁷ 1.19 × 10⁻⁷
Prandtl number 21.9 17.54
Reynolds number 149 469
Grashof number 7425 84564
Crystal
Refractive index 2.15 2.35
Absorption coefficient for the most transparent band of the crystal, 1/m
3.0 45.5
Thermal conductivity, W/(m K) 1.2 0.18
1
2
3
4
Fig. 1. Schematic diagram of the growth apparatus:(1) melt, (2) crystal, (3) seed holder, and (4) gas gapbetween the crystal and the crucible.
05

S102
BUDENKOVA
et al
.
NUMERICAL SIMULATION
The problem of global heat transfer with the numer-ical simulation of the shape of the crystallization frontwas solved in the framework of the quasi-stationaryapproach described in our previous studies [7, 8].Within this approach, it was assumed that the cruciblecontains a crystal whose size above the melt, like theheight of the melt, is fixed; i.e., the velocity of move-ment of the crystal with respect to the crucible can beignored. At the beginning of each simulation stage, theshape of the crystallization front h(r), as a rule, wasassumed to be flat or identical to that obtained in thepreceding simulation stage. For a fixed shape of thecrystallization front, the simulation consisted in simul-taneously solving two stationary problems: the problem
(a) (b)
Fig. 2. Typical shapes of the crystallization fronts for(a) Bi4Ge3O12 and (b) Bi12GeO20 crystals.
1321
1327
1333
13321332
1333
1327
1321
(‡) (b)
Fig. 3. (a) Temperature fields in the melt and the crystal (atthe left) and (b) flow patterns of the melt and the crystal (atthe right) for the interface shape calculated for Bi4Ge3O12crystals with a specularly reflective surface. The tempera-tures are given in degrees Kelvin. The isotherms are drawnat 0.5-K intervals.
1331
CRY
of convection and heat transfer in the melt (region 1 inFig. 1) and the problem associated with the conductiveand radiative heat transfer in the crystal and in the gapbetween the crystal and the crucible (regions 2, 3, 4 inFig. 1). Solving the above problems involved theexchange of the data. As a result of this exchange, wedetermined the condition under which the conductiveheat flux from the liquid phase and the net radiative fluxin the region above this phase are equal to each other onthe free surface of the melt. The boundary conditionsfor both problems were specified in the form of the sta-tionary temperature distribution Text(z) on the inside ofthe crucible. This distribution was determined by mea-suring the temperature with thermocouples at severalpoints with the subsequent interpolation of the dataobtained to the ranges between these points. In thecourse of calculations, the temperature distributionText(z) was corrected for the temperature ∆T(z) in orderto obtain the necessary pulling rate. The temperature atthe crystallization front was assumed to be equal to themelting temperature Tm and remained constant duringthe simulation. The convective problem was solvedwith the CGSim program package [10] in the two-dimensional axisymmetric approximation. The radia-tive heat transfer in the media characterized by differentrefractive indices and separated by transparent bound-aries was calculated with the program which we devel-oped on the basis of the algorithm described by Mame-dov and Rucolaine [11]. By solving the two stationaryproblems, we determined the following fluxes at thecrystal–melt interface: the conductive fluxes from the
melt (r, h), the conductive flux from the crystal
(r, h), and the net radiative flux from the crystal
(r, h). With knowledge of all the fluxes involved, itis possible to calculate the rate of crystal growth
(r) at each point of the crystallization front in theaxial direction from the expression
(1)
Here, Q is the heat of melting, n(r, h) is the normal tothe crystallization front in the direction of the crystalbulk, and ez is the unit vector directed along the z axisinward the crystal. The shape of the crystallization frontwas corrected so that the triple point remained fixed;that is,
Here, τ is the iteration parameter with the dimension oftime. In the case when the crystal growth rate calculatedfrom relationship (1) became identical over the entireinterface, the calculations were terminated and theshape of the crystallization front was considered to bedetermined. Otherwise, all the aforementioned stagesof the calculation were repeated for a new position of
qLcond
qScond
qSrad
VGRi
VGRi r( ) qL
cond i, r h,( )– qSrad i, r h,( )+[=
+ qScond i, r h,( ) ] /Q n r h,( )ez( ).
hi 1+ r( ) hi r( ) τ VGRi r( ) VGR
i R( )–( ).+=
STALLOGRAPHY REPORTS Vol. 50 Suppl. 1 2005

COMPARATIVE ANALYSIS OF THE HEAT TRANSFER S103
Fig. 4. Temperature fields (at the left) and flow patterns (at the right) of the Bi12GeO20 melt according to the calculations for dif-ferent convection regimes: (a, b) instantaneous diagrams calculated for the nonstationary oscillatory regime under the assumptionof the laminar flow and (c) diagrams calculated with due regard for the turbulent flow. The temperatures are given in degrees Kelvin.
0.5
q, W/cm2
0.4
0.20 1.0 1.5 2.0 2.5
0.6
0.8
1.0(a)
12
3
1'0.5
0.8
0.4
0 1.0 1.5 2.0 2.5
1.2
1.6
2.0(b)
12
3
r, cm
Fig. 5. Distributions of heat fluxes arrived at the crystallization front from the melt in different regimes of heat convection and thetotal heat fluxes removed through (a) the germanosillenite crystal and (b) the germanoeulytine crystal: (1, 1') the oscillatory regimeunder the assumption of the laminar flow for the two instantaneous diagrams shown in Figs. 4a and 4b, respectively; (2) the regimeincluding the turbulent flow in the melt; and (3) the total heat flux removed through the crystal.
0.01
0–0.035 0.0350
r, Òm
0.02
0.03
0.04
0.05
0.06
0.07
0.08z, cm
1206
.5
1210
1208
.5
1209
0–0.035 0.035r, Òm
1206.5
1210
1209.5
1209
0–0.02r, Òm
1209
1209.5
1210
1209.77
1209.31
211
0.01
0
0.02
0.03
0.04
0.05
0.06
0.07
0.08z, cm
0.01
0
0.02
0.03
0.04
0.05
0.06
0.07
0.08z, m(a) (b) (c)
0.02
the crystallization front. In the numerical simulation,the presence of facets at the crystallization front wasdisregarded.
RESULTS OF NUMERICAL SIMULATION
The thermal parameters of the studied compoundsin the solid and liquid phases are listed in the table. Theresults of the simulation for the germanoeulytine crys-tals with a specularly reflective surface are presented inFig. 3 (hereafter, the numbers in the figures will indi-cate the temperature T in degrees Kelvin). It should benoted that, as in [7], the deflection of the crystallizationfront is approximately equal to the crystal radius. Theflow pattern in the melt is also similar to that observedin [7]. The forced convection due to the rotation of thecrystal is dominant in the region located immediatelyunder the crystal. Below, there exists a vortex of free
CRYSTALLOGRAPHY REPORTS Vol. 50 Suppl. 1 20
convection associated with the nonuniform temperaturedistribution in the melt. In order to ensure the requiredpooling rate (3.5 mm/h), the experimental temperatureswere increased by a temperature ∆T identical along theentire wall of the crucible. For the convective problemto be solved in the two-dimensional axisymmetricapproximation, the stationary solution can be obtainedover a rather wide range of correcting temperatures ∆T.
However, the situation changes for the germanosil-lenite melt. As was noted above, the forced and freeconvection rates in the liquid phase of the Bi12GeO20compound appear to be higher several times. The flowpattern in the melt changes from the pattern predomi-nantly determined by the forced convection to the pat-tern corresponding to a nonstationary oscillatoryregime (Figs. 4a, 4b) when the temperature assigned tothe crucible wall increases by only 1.5 K. The nonsta-
05

S104 BUDENKOVA et al.
1212
1211.14
1211
1210
1201
1201
1211
1213
1212
1208
1208.5
1207.871207.741207.5
1201
Fig. 6. Temperature fields in the melt and the crystal (at the left) and flow patterns of the melt and the crystal (at the right) with thecrystallization front shape calculated for the Bi12GeO20 crystal in different regimes of convection in the melt: (a, b) laminar flowand (c) weak turbulent flow. The temperatures are given in degrees Kelvin.
1193(a) (b) (c)
tionary regime manifests itself in a small mutualchange in the intensities of the two vertices shown atthe right of Figs. 4a and 4b. The corresponding changesin the temperature distributions in the melts are illus-trated at the left of these figures.
If the calculations in the latter case are performedunder the assumption of the turbulent regime in themelt, we obtain the stationary solution (Fig. 4c). How-
1207
1208
1201
–0.02 0.020r, cm
Fig. 7. Temperature fields in the melt and the crystal (at theleft) and flow patterns of the melt and the crystal (at theright) with the crystallization front shape calculated for theBi12GeO20 crystal at the absorption coefficient equal to thatof the Bi4Ge3O12 crystal. The temperatures are given indegrees Kelvin.
CRY
ever, it should be noted that this change in the flowregimes affects only slightly the distribution of heatfluxes arrived at the flat crystallization front from themelt (Fig. 5a). For comparison, Fig. 5b shows the dis-tributions of heat fluxes over the flat crystallizationfront according to the analogous calculations for theBi4Ge3O12 crystal. The fluxes that arrive at the interfacefrom the liquid phase are approximately equal for bothcompounds, whereas the quantity of the heat removedthrough the germanoeulytine crystal considerablyexceeds the quantity of the heat removed by radiationthrough the germanosillenite crystal.
The interface shape for the Bi12GeO20 crystal wascalculated for several flow regimes in the melt. In allcases, the deflection of the crystallization front for theBi12GeO20 crystal appears to be smaller than that for theBi4Ge3O12 crystal by approximately 1 cm (Fig. 6). Inorder to prove explicitly that the lower transparency ofthe germanosillenite crystal leads to a smaller deflec-tion of the crystallization front, the front shape for thiscrystal was calculated using the same thermal parame-ters of the Bi12GeO20 crystal, except for the absorptioncoefficient, which was taken equal to the absorptioncoefficient of the Bi4Ge3O12 crystal. It turned out that,in this case, the deflection of the crystallization front forthe germanosillenite crystal even exceeds the deflectionof the crystallization front for the germanoeulytinecrystal by approximately 1.5 cm. The results of thesecalculations are presented in Fig. 7.
CONCLUSIONS
Thus, the results obtained in this study have demon-strated that the decisive factor responsible for the dif-
STALLOGRAPHY REPORTS Vol. 50 Suppl. 1 2005

COMPARATIVE ANALYSIS OF THE HEAT TRANSFER S105
ferent deflections of the crystallization fronts duringgrowth of germanoeulytine and germanosillenite crys-tals is the difference between the absorption coeffi-cients of these crystals. For the Bi12GeO20 crystal witha lower transparency, the rate of radiative heat transferis considerably lower and, therefore, the deflection ofthe crystallization front is substantially smaller. In turn,the smaller deflection of the crystallization front leadsto a smaller bend of the isotherms in the vicinity of theinterface, thus providing more favorable conditions ofthe facet formation at the interface.
REFERENCES1. B. Cockayne, J. Cryst. Growth 3, 60 (1968).2. V. N. Shlegel, Yu. V. Shubin, and N. V. Ivannikova,
J. Korean Cryst. Growth Cryst. Technol. 13 (1), 1(2003).
3. M. T. Santos, J. C. Rojo, A. Cintas, et al., J. Cryst.Growth 156, 413 (1995).
CRYSTALLOGRAPHY REPORTS Vol. 50 Suppl. 1 20
4. J. P. Fontaine, G. P. Extrémet, V. Chevrier, andJ. C. Launay, J. Cryst. Growth 139, 67 (1994).
5. J. C. Rojo, C. Marín, J. J. Derby, and E. Diéguez,J. Cryst. Growth 183, 604 (1998).
6. Qiang Xiao and J. J. Derby, J. Cryst. Growth 128, 188(1993).
7. V. S. Yuferev, O. N. Budenkova, M. G. Vasiliev, et al.,J. Cryst. Growth 253, 383 (2003).
8. O. N. Budenkova, M. G. Vasiliev, V. S. Yuferev, et al.,J. Cryst. Growth 266, 92 (2004).
9. M. Kobayashi, T. Hagino, T. Tsukada, and M. Hozawa,J. Cryst. Growth 235, 258 (2002).
10. V. V. Kalaev, I. Yu. Evstratov, and Yu. N. Makarov,J. Cryst. Growth 249 (1–2), 87 (2003).
11. M. V. Mamedov and S. A. Rukolaine, in Proceedings ofthe 5th International Symposium on Radiation Transfer,Istanbul, Turkey, 2004 (Istanbul, 2004), p. 69.
Translated by O. Borovik-Romanova
05

Crystallography Reports, Vol. 50, Suppl. 1, 2005, pp. S106–S110.Original Russian Text Copyright © 2005 by Gudim, Bezmaternykh, Bovina.
CRYSTALGROWTH
Crystallization of Ba3Fe2Ge4O14 and Ba2Fe2GeO7
in Oxide–Fluoride FluxesI. A. Gudim, L. N. Bezmaternykh, and A. F. Bovina
Kirensky Institute of Physics, Siberian Division, Russian Academy of Sciences, Akademgorodok, Krasnoyarsk, 660036 Russia
e-mail: [email protected] February 3, 2005
Abstract—Crystallization of trigonal Ba3Fe2Ge4O14 and tetragonal Ba2Fe2GeO7 barium ferrogermanates isinvestigated in their own fluxes diluted by B2O3–BaF2 and B2O3–PbF2 mixtures, respectively. The ratios of thecomponents at which the properties of the fluxes satisfy the requirements for controlled crystallization of theseincongruently melting compounds are determined. Single crystals of Ba2Fe2GeO7 barium ferrogermanate aregrown for the first time. © 2005 Pleiades Publishing, Inc.
INTRODUCTION
In the langasite family, lead gallogermanatePb3Ga2Ge4O14 and barium gallogermanateBa3Ga2Ge4O14 (I) are distinguished by the greatest sizesof the large cations [1]. Single crystals of the formercompound with sizes suitable for complex investigationsinto the physical properties were synthesized by the fluxmethod in our previous work [2].
Optical spectroscopic investigations [3] allowed usto make the inference that single crystals Pb3Ga2Ge4O14 :Nd3+ (Si4+) with a disordered structure are very promis-ing for use as active materials in lasers with selectivediode pumping. However, contrary to the extrapolationestimates, the piezoelectric activity of Pb3Ga2Ge4O14appeared to be considerably less than that of the com-pound Sr3Ga2Ge4O14 with a smaller radius of the largecation. There arises an important question as to whichrole is played by the electronic configuration of thelarge cation in the origin of this deviation. The answerrequires additional experimental investigations into theelastic and piezoelectric characteristics of barium gal-logermanates and barium ferrogermanates, namely,trigonal Ba3Ga2Ge4O14 and tetragonal Ba2Ga2GeO7 andBa2Fe2GeO7 (II).
Investigation into the properties of barium galloger-manate single crystals as laser matrices with a disor-dered structure is an important problem. The consider-able interest expressed by researchers in the synthesisof barium ferrogermanate single crystals is associatedwith the problems of low-temperature magnetism.
Belokoneva et al. [4] and Lyubutin et al. [5] werethe first to synthesize compounds I and II by the solid-phase method. The prepared polycrystalline sampleswere studied using X-ray diffraction. Compound II wasadditionally investigated by Mössbauer spectroscopy.Structural investigations of single crystals were carriedout only for compound I. However, the problem con-
1063-7745/05/5001-S $26.00 0106
cerning the growth of large high-quality single crystalsof these compounds suitable for complex studies oftheir physical properties remains unsolved. In order tosolve this problem, in the present work, we investigatedcrystallization in two families of fluxes:
BaO + pFe2O3 + qGeO2 + rB2O3 + sBaF2, (1)
BaO + pFe2O3 + qGeO2 + rB2O3 + sPbF2. (2)
PHASE-PROBING TECHNIQUE
At the first stage of phase probing of solution–meltfamilies (1) and (2), it was necessary to reveal the fluxesin which trigonal compound I and tetragonal com-pound II are high-temperature phases crystallizing overa sufficiently wide range of temperatures. The upperlimit of this range, reasoning from the necessity ofensuring the stability of the solution–melt compositionin the course of long-term operations with an open cru-cible in air, was chosen as 950–960°C for the first fam-ily of fluoride-containing fluxes and 920–930°C for thesecond family. At the homogenization stages, theseranges were limited by temperatures of 980–1000 and970–980°C, respectively. At higher operating tempera-tures, an uncontrollable change in the solution–meltcomposition becomes considerable due to the selectiveevaporation of barium and lead fluorides.
Then, crystallization characteristics, such as theconcentration dependence of the saturation temperatureand the metastability range, and the thermal and hydro-dynamic conditions providing the stable growth of sin-gle crystals were determined for the chosen fluxes.
In family (1), we sought fluxes in which trigonalcompound I is characterized by two sequences of crys-tallizing phases in one of the fluxes with the stoichio-metric ratio of oxides of this compound (p = 1/3, q =4/3). This satisfies the aforementioned limitations on
© 2005 Pleiades Publishing, Inc.

CRYSTALLIZATION OF Ba
3
Fe
2
Ge
4
O
14
AND Ba
2
Fe
2
GeO
7
S107
the saturation temperature. A similar procedure wasperformed for tetragonal compound II in family (2).
A flux (weight, 30–40 g) was prepared in a platinumcylindrical crucible (D = 15 mm, H = 50 mm) bysequential melting of reactants B2O3 (special-puritygrade), BaO (analytical grade), Fe2O3 (special-puritygrade), GeO2 (reagent grade), BaF2 (special-puritygrade), and PbF2 (special-purity grade). We used a fur-nace with silicon carbide heaters and easy access to theoperating chamber. The first three oxides were meltedat a temperature of 1200°C. After melting the calcu-lated amount of B2O3, the crucible was weighed and thelosses of B2O3 (approximately 10% of the calculatedamount) were replenished. The losses were predomi-nantly associated with moisture removal. Oxide BaOwas introduced into the melt in small portions, and theweight of the crucible with the melt was again checkedafter melting the calculated amount. The weight losses(up to 10–15%) were compensated for by adding BaO.The losses upon melting of this reactant were due to thedecomposition of barium carbonate, barium peroxide,and barium hydrate impurities contained in this oxide.As a result, the total content of B2O3 and BaO oxidesand their ratio in the flux were obtained with the neces-sary accuracy. After melting the calculated amount ofFe2O3 oxide, the temperature was decreased to the lim-iting homogenization temperatures and the GeO2 andBaF2 (PbF2) compounds were added to the melt. Theweight of the flux thus prepared differed from the cal-culated weight by no more than 2–3%.
After homogenization, the temperature wasdecreased to the predicted saturation temperature. Aplatinum wire probe was introduced into the flux, and,within 2 h after the introduction, crystallization on thisprobe was examined under a microscope. This directprobing was continued at a step of 15–20 K to temper-atures close to the solidification point of the flux. The
CRYSTALLOGRAPHY REPORTS Vol. 50 Suppl. 1 20
crystals formed on the probe were subsequently usedfor refining the saturation temperature and the equilib-rium temperature boundaries of crystallizing phases.
For X-ray powder diffraction analysis, the necessaryamount of crystals of the high-temperature phase wasgrown on the probe. The identified phase compositionwas compared with the composition of compound Iunder investigation. Then, portions of “deficient”oxides were added to the flux, and the high-temperaturephase was again identified. Once the high-temperaturephase corresponded to trigonal compound I, the com-position was varied so that a combination of propertiesof the flux satisfied the requirements for controlledcrystallization.
FLUX COMPOSITIONS AND CRYSTALLIZATION PARAMETERS
Trigonal compound I is not a high-temperaturephase in fluxes proper, i.e., fluxes that do no containoxides in addition to crystal-forming oxides (r = 0, s =0) when they have a ratio close to the stoichiometricratio (p ~ 1/3, q ~ 4/3). However, compound I becomesthe high-temperature phase in fluxes proper that have ahigh superstoichiometric content of BaO oxide (p <1/3, q < 4/3) and are strongly diluted with B2O3 oxide(r ≠ 0, s = 0). Table 1 (row 1) presents an example of thecorresponding composition in the group of fluxes (atn = 60):
(100 – n)wt %(BaO + 0.62Ba2O3) + nwt %Ba3Fe2Ge4O14.
The saturation temperature of this flux is Tsat =1000°C, and the trigonal phase crystallizes at leastwithin the temperature range ∆Tcryst = 100 K. The mea-sured lattice parameters of the trigonal phase are as fol-lows: a = 8.441 Å and c = 5.352 Å. The faceted form ofspontaneously nucleated crystals is represented by
Table 1. Barium ferrogermanate Ba3Fe2Ge4O14 in the BaO + pFe2O3 + qGeO2 + rB2O3 + sPbF2 fluxes
Flux
Composition of the flux
High-tempera-ture phase
Tsat,
°CNotemoles
quasi-binary formp q r s
1 0.28 0.56 0.36 0 40 wt % (BaO + 0.62B2O3) + 60 wt % Ba3Fe2Ge4O14
Ba3Fe2Ge4O14 1000 ρflux < ρcryst
2 0.77 1.63 1.2 1.94 60.17 wt % (BaF2 + 0.62B2O3 + 0.225Fe2O3 + 0.15GeO2) + 39.83 wt % Ba3Fe2Ge4O14
Ba3Fe2Ge4O14 960 ρflux > ρcryst
3 0.77 1.81 1.53 1.92 60 wt % (BaF2 + 0.8B2O3 + 0.225Fe2O3 + 0.25GeO2) + 40 wt % Ba3Fe2Ge4O14
Ba3Fe2Ge4O14 850 ρflux ≈ ρcryst
4 0.78 1.64 1.98 1.98 62.88 wt % (BaF2 + B2O3 + 0.225Fe2O3 + 0.2GeO2) + 37.12 wt % Ba3Fe2Ge4O14
Ba3Fe2Ge4O14 870 ρflux < ρcryst
5 0.83 1.77 1.76 2.2 64.66 wt % (BaF2 + 0.8B2O3 + 0.225Fe2O3 + 0.2GeO2) + 35.34 wt % Ba3Fe2Ge4O14
BaFe12O19 845 ρflux ≈ ρcryst
05

S108 GUDIM et al.
(‡) (b)
Fig. 1. Ferrogermanate single crystals grown upon spontaneous nucleation: (a) the trigonal barium ferrogermanate Ba3Fe2Ge4O14and (b) the tetragonal barium ferrogermanate Ba2Fe2GeO7.
straight-line hexagonal prisms elongated along thethreefold axis (Fig. 1a). The concentration dependenceof the saturation temperature is depicted in Fig. 2. Thedependence has the slope dTsat/dn = 10 K/wt %. At thisslope, the crystal yield in the temperature range∆Tcryst = 100 K is equal to 10% of the initial weight ofthe flux. The metastability range of this flux is ∆Tmet =20 K. The metastability range was determined in thefollowing way. After due homogenization of the fluxwith the platinum probe, the temperature was decreasedto a temperature below the saturation temperature.Within 14–16 h, we removed the probe and evaluatedthe crystal formation. The largest supercooling ∆Tmet =Tsat – T at which crystals do not nucleate at the probewas taken equal to the metastability range. Note that thedensity of flux 1 is lower than the density of crystal I(ρcryst = 5.257 g/cm3). Therefore, this composition canbe used for growing single crystals in the surface regionof the flux. In operation with the open crucible, thesolution–melt composition is stable up to temperaturesof 1050–1070°C.
The main disadvantage of this flux as a medium forthe growth of single crystals I is its high viscosity.Therefore, the limiting rates at which high-quality crys-tals can be grown are relatively low. Controlled crystal-lization is substantially complicated by the possiblesuppression of the metastable state (collapse of themetastable range), which can be represented as follows.At a solution–melt density somewhat lower than thedensity of crystals grown, the temperature field withdT/dh < 0 is produced in the surface region in order tolocalize the growth process. If crystals spontaneouslynucleate on the supercooled open surface of the flux inthe course of long-term holding, these crystals are heldby the surface tension forces on the surface and grow toa certain critical mass. Then, the crystals sink to the bot-
CRY
tom region and begin to dissolve. Upon vigorous stir-ring, the locally inhomogeneous flux from this region istransferred to the growth zone and brings about multi-ple nucleation on a crystal holder with seeds and newcrystals floating on the surface of the flux.
Own fluxes diluted by a mixture of B2O3 with BaF2have a lower viscosity. The viscosities of fluxes werequalitatively compared with each other in scale anddynamics of the convective flow pattern observed onthe surface of the flux rapidly cooled outside the fur-nace. A decrease in the viscosity leads to a decrease inthe size of cells and an increase in the velocity of theirmotion. Table 1 presents the compositions of the fluxesbased on B2O3–BaF2 mixtures with a nonstoichiometriccontent of crystal-forming oxides in which compound Iis the high temperature phase crystallizing in the tem-perature range ∆Tcryst = 50–100 K (compositions 2,3, 4).
These fluxes, according to the concentration depen-dences of the saturation temperatures and the metasta-bility ranges, are comparable to the fluxes containingno BaF2. Note that the density of flux 2 is higher thanthe density of crystal I. This permits us to consider thepossibility of growing single crystals with diffusiontransfer of the crystallized material to the bottom regionof the flux. A comparison of fluxes 3 and 5 demon-strates that, as the superstoichiometric content of GeO2decreases, barium hexaferrite BaFe12O19 becomes thehigh-temperature phase.
In family (2), the most attention was concentratedon the study of crystallization in the subfamily satisfy-ing the conditions: 0.2 < p ≤ 0.5, 0.4 < q ≤ 0.5, r/s =0.62, and 0.4 < s < 0.6. The upper limits of the param-eters p and q correspond to the stoichiometric ratio ofoxides of compound II (BaO : Fe2O3 : GeO2 = 1 : 0.5 :
STALLOGRAPHY REPORTS Vol. 50 Suppl. 1 2005

CRYSTALLIZATION OF Ba3Fe2Ge4O14 AND Ba2Fe2GeO7 S109
Table 2. Barium ferrogermanate Ba2Fe2GeO7 in the BaO + pFe2O3 + qGeO2 + rB2O3 + sPbF2 fluxes
Flux
Composition of the fluxHigh-
temperature phase
Tsat, °C Notemolesquasi-binary form
p q r s
1 0.22 0.46 0.32 0.52 68.23 wt % (PbF2 + 0.62B2O3 + 1.09BaO + 0.45GeO2) + 31.77 wt % Ba2Fe2GeO7
Ba2GeO4 850
2 0.27 0.46 0.32 0.52 61.4 wt % (PbF2 + 0.62B2O3 + 0.89BaO + 0.35GeO2) + 38.6 wt % Ba2Fe2GeO7
BaFe12O19 875
3 0.25 0.43 0.3 0.49 62.14 wt % (PbF2 + 0.62B2O3 + BaO + 0.35GeO2) + 37.86 wt % Ba2Fe2GeO7
Ba2Fe2GeO7 825
4 0.31 0.41 0.29 0.47 53.44 wt % (PbF2 + 0.62B2O3 + 0.8BaO + 0.2GeO2) + 46.56 wt % Ba2Fe2GeO7
Ba2Fe2GeO7 920 dTsat/dn = 6.5 K/wt %
0.5). At p > q, the BaO and Fe2O3 contents are supers-toichiometric. At p < q, the BaO and GeO2 contents aresuperstoichiometric. The third condition implies thatthe fluxes proper are diluted with a PbF2 + 0.62B2O3
mixture in amounts determined by the parameter s. Themelting temperature of this mixture and the melt vis-cosity are lower than those of the BaF2 + 0.62B2O3
mixture.
According to the identification of the high-tempera-ture phases, the fluxes under investigation with satura-tion temperatures Tsat ≤ 920°C are separated into threegroups (Table 2). These high-temperature phases arerepresented by the Ba2GeO4 orthorhombic compound[a = 7.5805(26) Å, b = 9.9558(29) Å, c = 10.4481(41) Å],the BaFe12O19 hexagonal compound, and tetragonalcompound II (a = 8.323 Å, c = 5.588 Å). Our experi-mental lattice parameters of tetragonal compound IIare close (but somewhat smaller) than those of samplesII prepared by solid-phase reactions in stoichiometricmixtures of the Ba2CO3, Fe2O3, and GeO2 compounds[5].
Analysis of solution–melt compositions 1–3(Table 2) clearly demonstrates the tendency towardtransformation of the high-temperature phases with achange in the solution–melt composition. These com-positions can serve as reference compositions whenoptimizing the solution–melt composition. As a result,we determined the composition of the flux in which tet-ragonal compound II is the high-temperature phase andbegins to crystallize at the temperature Tsat = 920°C(Table 2, composition 4). The concentration depen-dence of the saturation temperature for this flux is plot-ted in Fig. 2. The metastability range is ∆Tmet = 10 K.The density of the flux is close to that of crystal II(ρcryst = 4.866 g/cm3). It is this flux that was used forinvestigating the stability of crystal growth.
CRYSTALLOGRAPHY REPORTS Vol. 50 Suppl. 1 20
STABILITY OF THE GROWTH OF CRYSTALS II
Let us consider one of the compromising sets ofthermal and hydrodynamic conditions that provide thestable growth of crystals II in the surface region offlux 4. The flux (weight, 90 g) was prepared in the plat-inum cylindrical crucible (D = 15 mm, H = 50 mm) bysequential melting of reactants B2O3 (4.8 g), BaO(36.2 g), Fe2O3 (11.7 g), PbF2 (27.2 g) and GeO2(10.1 g). The depth of the flux was 14 mm.
In a crystallization furnace with a nonuniform tem-perature field, the crucible was located so that the ver-tical component of the temperature gradient wasdT/dh = –(2–3) K/cm. The minus sign means that thetemperature decreases away from the crucible bottom.At the stage of primary homogenization, the flux was
800
78035
T, °C
n, wt %40 45 50
820
840
860
880
900
920
940
960
980
30
Fig. 2. Concentration dependences of the saturation temper-ature for the Ba3Fe2Ge4O14 ferrogermanate in fluxes 2(closed rhombuses) and 4 (closed triangles) (Table 1) andthe Ba2Fe2GeO7 ferrogermanate in flux 4 (closed squares)(Table 2).
4
4
2
05

S110 GUDIM et al.
held at T = 980°C for 8 h. The saturation temperatureTsat = 920 ± 2°C was determined using test crystals.
Upon secondary homogenization, a crystal holder inthe form of platinum rod was dipped in the surface layerof the flux. The crystal holder was either fixed orrotated at a rate ω = 30–40 rpm. After homogenizationwas completed, the temperature was decreased to T =Tsat – (12–13) K; i.e., the flux was supercooled by 2–3 K below the metastability range. At this supercooling,no more than six or eight crystals were formed for 14–16 h on the rod part dipped in the flux. An increase inthe holding time did not lead to the collapse of themetastable range with multiple nucleation of crystalson the rod and the surface of the flux in both static (ω =0) and dynamic regimes (ω = 30–40 rpm). Faces of ini-tially nucleated crystals were developed without forma-tion of macrosteps. The crystals grown for 48 h in thedynamic regime are shown in Fig. 1b. Among four crys-tals II grown in the form of rectangular plates, the larg-est crystal has sizes of 5 × 7 × 2 mm. The face regionsfree of the flux are specular.
In one of the experiments on spontaneous nucle-ation, we grew three crystals 1–1.5 mm in size on therod end. Then, we investigated the seeded growth. Afterhomogenization, the temperature in the furnace wasdecreased to T = Tsat + 5 K and the rod with the crystalswas inserted into the furnace. The rod was dipped in thesurface layer so that all the crystals were in contact withthe flux. The rod was rotated at a rate of 30 rpm. Within10 min, the temperature was decreased to T = Tsat – 3 K.Thereafter, the temperature was progressivelydecreased at a rate of 1 K/day. The crystal sizesincreased to 8 × 5 × 2.5 mm3 for four days. The growthrate appeared to be lower by a factor of approximately 2due to a considerably smaller supercooling. No insta-bility of the faceted front in the form of macrosteps wasobserved. The seeded growth with discrete pooling ofthe growing single crystal was also stable. Thedescribed conditions were used for growing single-crystal samples.
CRY
CONCLUSIONS
The compositions of oxide–fluoride fluxes for con-trolled crystallization of trigonal compound I and tet-ragonal compound II were determined and their char-acteristics were investigated. The thermal and hydrody-namic conditions that provide the stable growth oftetragonal single crystals II both upon spontaneousnucleation and with the use of seeds were revealed. Theresults made it possible to prepare single-crystal sam-ples for investigations of elastic, piezoelectric, mag-netic, and magnetoelastic properties and also the mag-netic structure by neutron diffraction methods.
ACKNOWLEDGMENTS
This work was supported in part by the Division ofPhysical Sciences of the Russian Academy of Sciences(project no. 2.6) and the Academician K.S. Aleksand-rov School.
REFERENCES
1. B. V. Mill and Yu. V. Pisarevsky, in Proceedings of the2000 IEEE/EIA International Frequency Control Sym-posium and Exhibition, Kansas City, MO, United States,2000 (IEEE, Danvers, 2000), p. 133.
2. L. N. Bezmaternykh, A. D. Vasil’ev, I. A. Gudim, andV. L. Teremov, Kristallografiya 49 (2), 354 (2004) [Crys-tallogr. Rep. 49 (2), 271 (2004)].
3. A. V. Butashin, L. E. Li, A. F. Konstantinova, andI. A. Gudim, Kristallografiya 49 (3), 514 (2004) [Crys-tallogr. Rep. 49 (3), 459 (2004)].
4. E. L. Belokoneva, M. A. Simonov, A. V. Butashin, et al.,Dokl. Akad. Nauk SSSR 255 (5), 1099 (1980) [Sov.Phys. Dokl. 25 (12), 954 (1980)].
5. I. S. Lyubutin, B. V. Mill’, V. G. Terziev, and A. V. Bu-tashin, Kristallografiya 33 (1), 136 (1988) [Sov. Phys.Crystallogr. 33 (1), 78 (1988)].
Translated by O. Borovik-Romanova
STALLOGRAPHY REPORTS Vol. 50 Suppl. 1 2005

Crystallography Reports, Vol. 50, Suppl. 1, 2005, pp. S111–S115.Original Russian Text Copyright © 2005 by Burachas, Beloglovsky, Vassilieva, Ziomko, Kuznetsova, Makov, Nikitin, Saveliev, Vasiliev, Ippolitov, Lebedev, Manko, Nikulin, Nya-nin, Tsvetkov, Tamula
œ
tis.
CRYSTALGROWTH
Development of the Technology for Large-Scale Production of Lead Tungstate Single Crystals for Physical Experiments
S. F. Burachas1, 2, S. Ya. Beloglovsky1, N. A. Vassilieva1, M. K. Ziomko1, E. A. Kuznetsova1, I. V. Makov1, R. M. Nikitin1, Yu. A. Saveliev1, A. A. Vasiliev2, M. S. Ippolitov2, V. A. Lebedev2,
V. I. Manko2, S. A. Nikulin2, A. S. Nyanin2, A. A. Tsvetkov2, and G. Tamulaœtis3
1 North Crystals Company, Apatity, Murmansk oblast, Russiae-mail: [email protected]
2 Kurchatov Institute, Russian Research Center, pl. Akademika Kurchatova 1, Moscow, 123182 Russia3 Vilnius University, Vilnius, Lithuania
Received February 8, 2004
Abstract—The scientific principles underlying the technology for growing crystals of lead tungstate PbWO4(PWO) with controlled properties are discussed. The developed technology is implemented at the North Crys-tals Company in mass production of PWO crystals with 100% reproducibility of operating parameters. Thismade it possible to solve the problem associated with the preparation of PWO crystals for the ALICE experi-ment at CERN and to produce the pilot batch of large-sized PWO crystals (diameter, 46 mm; length, 250 mm)with required characteristics for the CMS experiment at CERN. More than 10000 PWO scintillators of highoptical quality for the ALICE experiment were fabricated over a short time according to the proposed technique.© 2005 Pleiades Publishing, Inc.
INTRODUCTION
An advanced technology for mass production ofcrystals of lead tungstate PbWO4 (PWO) with repro-ducible characteristics cannot be developed withoutrecourse to the physical principles underlying thegrowth of optically homogeneous crystals or withoutunderstanding of the nature of the influence exerted bytechnological factors on the properties of PWO crystalsimportant for their applications in high-energy physicsexperiments.
The choice of PWO crystals as the basic scintillationmaterial for the CMS and ALICE projects (CERN) in1994 gave impetus to extensive investigations into themain radiation-optical and luminescence properties ofthese crystals.
At present, it has been established that ionizing radi-ation does not affect the scintillation spectrum of PWOcrystals. Under irradiation, the scintillation mechanismremains unchanged and the decrease in the specificlight yield is predominantly associated with theinduced absorption [1, 2]. Moreover, the bleaching ofPWO crystals under irradiation was observed by Bac-caro et al. [3]. Auffray et al. [4] revealed the relationbetween the absorption of a nominally pure crystal inthe UV range (350 nm) and the induced absorption.According to [5], the luminescence times in the bluespectral range (420–440 nm) are short and the greenemission component is caused by the presence of impu-rities in crystals. The nature of the green emission com-ponent was discussed in [6]. The conditions used forgrowing optically homogeneous PWO crystals by the
1063-7745/05/5001-S $26.000111
Czochralski method in the case of large-scale produc-tion were described in our earlier works [6, 7].
It has been found that, irrespective of the growth andheat treatment technology, all nominally pure PWOcrystals contain defects responsible for the UV absorp-tion identical for all crystals and their intense radiationcoloration. Only doping with trivalent lanthanum-group elements (which hypothetically replace Pb2+
ions) leads to an increase in the transparency in the UVrange and an improvement of the radiation resistance ofPWO crystals [8].
Different substitution mechanisms have been pro-posed under the assumption on substitution of trivalentlanthanum-group elements for Pb2+ ions [8–13]. Linet al. [13] theoretically showed that the absorption bandintensity is related to the difference ∆N between thenumbers of lead and oxygen vacancies: the larger thedifference ∆N, the higher the absorption band intensity.Doping with trivalent ions results hypothetically in the
formation of clusters [2 –VPb], which bound a num-ber of lead vacancies so that the number of active leadvacancies decreases. This leads to a decrease in the dif-ference ∆N, suppression of the absorption band at350 nm, and, hence, an increase in the radiation resis-tance of PWO crystals.
However, the proposed substitution mechanisms arenot conclusive, because the experimental data obtainedin [14] demonstrate that the amount of lead ions thatevaporated during the growth of PWO crystals is more
MPb3+
© 2005 Pleiades Publishing, Inc.

S112
BURACHAS
et al
.
than one order of magnitude larger than the amount ofdopants introduced upon optimum doping of melts [14].
Nikl et al. [15] put forward the concept according towhich Pb3+ and O– centers are predominantly responsi-ble for the weak radiation resistance of PWO crystals(in the range 350–370 nm) and the optical absorption at420 nm. Subsequently, it was revealed that the forma-tion of defects in crystals is affected by the impuritybatch composition [16]. The influence of impuritydefects on the properties of PWO crystals has beenstudied in detail [6, 8, 16–19].
Analysis of the data available in the literature showsthat the concepts of Pb3+ and O– centers and the substi-tution of trivalent lanthanum-group elements for Pb2+
ions cannot explain all the experimental resultsobtained in the study of PWO crystals [18].
More recently, on the basis of the experimental dataobtained in our previous works [14, 20, 21], weassumed that PWO crystals contain defects associatedwith the deficit of oxygen in tungsten oxide WO3 usedas the main component of the initial batch. The formulaof tungsten oxide WO3 – x reflects the presence of tung-sten ions W5+ and W4+ with a lowered valence. Theelectroneutrality of the crystal as a whole is provided bythe appearance of oxygen charged vacancies. In thePWO crystal lattice, a tungsten ion with a loweredvalence and an oxygen vacancy bonded to it can be rep-
resented as a [W5+– ] or [W4+– ] cluster.
The basic regularities of the effect of defects on theproperties of PWO crystals depending on the techno-logical conditions were discussed and revealed in[6, 22].
DISCUSSION OF THE RESULTS
Experience suggests that the successful develop-ment of mass production of PWO crystals is based onthe solutions of the following two main problems:
(i) the optimization of heat treatment conditionsnecessary for the Czochralski growth of opticallyhomogeneous PWO crystals with a constant diameter;
(ii) a controlled improvement of crystal quality withthe use of structural and impurity defects.
The optically homogeneous PWO crystals were pre-pared [6, 7] with the use of crystal raw materials pro-duced from a high-quality batch [16], a crystallizerwith an optimum design, optimum growth conditionschosen on the basis of the physicochemical regularitiesof Czochralski growth of oxide crystals with a constantdiameter [23, 24], and the optimum parameters of theautomatic control for the crystal growth process [25].
Our approach is based on the results obtained in ourearlier works [14, 20, 21], in which it was demonstratedthat the optical properties and the radiation resistanceof PWO crystals grown from raw materials are prima-rily determined by the defects of tungsten oxides of
V0+ V0
2+
CRY
general formula WO3 – x (0 < x < 1). This formula, withdue regard for the valence states of tungsten (6, 5, 4),can be represented in the form (1 – 2a – b)WO3 +aW2O5 + bWO2, where x = a + b.
Upon doping of PWO crystals with L2O3 oxides(where L = Y, La, Gd), the optical properties of the crys-tal are governed by the clusters that are formed in thecrystal lattice upon replacement of lead or tungsten ionsby lanthanum ions with the formation of the corre-sponding vacancies and displacement of atoms fromtheir positions.
The green component in the X-ray luminescencespectrum of nominally pure PWO crystals under spe-cific annealing conditions can be emitted only from thesurface and in the X-ray luminescence spectrum ofdoped crystals only upon doping with impurities of themolybdenum type [6, 22]. The aforementioned infer-ences regarding the role played by defects of PWOcrystals in an emission are based on the experimentalevidence given below.
EXPERIMENTAL EVIDENCE
It has been established that there is a clear correla-tion between the properties of the PWO crystals andtheir color and that this correlation depends on theannealing conditions (table, Fig. 1). The annealing con-ditions, specific light yields, and colors of the PWOsamples prepared from the same crystal are presentedin the table. The optical transmission spectra of thesesamples are shown in Fig. 1.
The crystal color is determined by the color comple-mentary to the color of radiation absorbed by chargedclusters and depends on the valence of tungsten ionsforming these clusters.
Figure 2 shows the X-ray luminescence spectra ofpolished PWO samples (grown in an inert medium)measured before (spectrum 1) and after (spectrum 2)their annealing in air at a temperature of 600°C. It canbe seen from Fig. 2 that annealing leads to an increasein the intensity of the green emission component. How-ever, structural defects responsible for the green emis-sion component are formed only in the surface layer ofthe crystal upon annealing in air. After removal of thislayer (0.1–0.2 mm thick), the green emission compo-nent disappears and the luminescence spectrum of theannealed crystal becomes identical to that of the unan-nealed sample. These structural defects in the surfacelayer play a dominant role only upon X-ray excitationof luminescence, because X rays (up to 200 kV) pene-trate into PWO crystals to a depth of ~0.1 mm; i.e.,they are almost completely absorbed by the surfacelayer [6].
STALLOGRAPHY REPORTS Vol. 50 Suppl. 1 2005

DEVELOPMENT OF THE TECHNOLOGY S113
Influence of the annealing conditions of the PWO samples (22 × 22 × 10 mm3 in size) on their specific light yield and color
Sample
Annealing conditions of the samples Specific light yield
Colorof the sample
regime Iannealing in air,
°C/h
regime IIannealing in the redu-cing atmosphere, °C/h
regime IIIannealing in air,
°C/hphotoelectrons/MeV
O-1 1000/40 950/10 500/5 16.5 Colorless
O-4 1000/40 5.7 Yellow
O-5 1000/40 950/10 4.8 Violet bluish
O-9 1000/40 950/10 1000/10 8.0 Dark yellow
GENERALIZATION OF EXPERIMENTAL RESULTS
The analysis of the main experimental data on thedefect formation in PWO crystals allows us to make thefollowing inference. The properties of nominally purePWO crystals are modified upon heat treatment due tothe presence of impurity and structural defects. Thismodification of defects in PWO crystals can be conven-tionally considered a solid-phase reaction in a solidwith the formation of new chemical compounds andforeign phases in crystals.
We performed a series of experiments on the growthand annealing of undoped and doped PWO crystalsunder different conditions. In [20], it was revealed thata melt during the crystal growth is enriched in tungstendue to the evaporation of lead in the form of differentcompounds (predominantly, in the form of the Pb2WO5phase). The formed excess tungsten ions occupy boththe tungsten and lead positions; in the latter case, thevalence of tungsten ions changes. The electrical neu-
CRYSTALLOGRAPHY REPORTS Vol. 50 Suppl. 1 20
trality is provided by the formation of oxygen vacan-cies. Electrons of tungsten ions and vacancies interactwith each other. Similar associates can be treated asclusters. These clusters transform an electromagneticwave incident on the crystal into a scattered wave thatis responsible for the crystal color. The change in thecolor of the PWO crystal upon heat treatment is associ-ated with the change in the valence state of tungstenions and their oxygen environment. It should be notedthat the coloration of crystals upon heat treatment indifferent media is not clearly understood and the mech-anism of color evolution has not been completelyrevealed. However, when the technological parametersare carefully maintained, the crystal color can serve asan indicator of the crystal quality. As was noted above, theformula WO3 – x reflects the averaged valence of tung-sten ions over the crystal volume. The formula (3 – x)Oindicates the averaged number of oxygen ions in theenvironment of tungsten ions. The quantity x character-izing the oxygen deficit correlates with the crystalcolor. According to [14], the crystal color is yellow for
O-1
O-9
O-4
O-5
300 350 400 450 500 550 600 65040
50
60
70
80
Wavelength, nm
Optical transmittance, %
Fig. 1. Optical transmission spectra of the samples presented in the table.
05

S114
BURACHAS
et al
.
WO3, green for WO2.96, blue for WO2.8–2.88, violet forWO2.7−2.75, and brown for WO2. During long-termreducing annealing, the crystal color changes in the fol-lowing order: yellow, green, colorless, blue, violet, andbrown. A similar change in the color of PWO crystalsoccurs in the course of long-term exposure to ionizingradiation [21]. The annealing of crystals under oxidiz-ing conditions when the partial oxygen pressure islower than the equilibrium pressure leads to the reversesequence of transformations. Upon deep reducingannealing or at a high dose of ionizing radiation, dopedcrystals become black and undoped crystals acquire aviolet color [14].
350 400 450 500 550 600 650Wavelength, nm
1
2
Intensity, arb. units
Fig. 2. X-ray luminescence spectra of polished PWO sam-ples (grown in an inert medium): (1) before and (2) afterannealing at 600°C in air.
CRY
Therefore, the color and its change under externalactions are predominantly governed by the defect clus-ters. The reduction state of tungsten ions depends onthe conditions of growth and annealing of crystals. Theoxygen deficit in tungsten oxide WO3 – x leads to theformation of defects that are characteristic of PWOcrystals and responsible for the optical absorption in theUV range and the crystal color. The valence of tungstenions in a cluster easily changes in the course of growth,annealing, and exposure to ionizing radiation. This isaccompanied by the change in the crystal color.
Doping of PWO melts with oxides of the L2O3 type(L = Y, La, Gd, etc.) inhibits the formation of oxygenvacancies and clusters. The content of the L2O3 dopantshould be chosen so that the optical transparency ofcrystals would not be reduced. Upon optimum doping,the transparency of crystals in the UV range is maxi-mum.
The influence of the exposure of nominally purePWO crystals to radiation is similar in many respects tothat of reducing–oxidizing annealing. In both cases, thetreatment leads to a change in the oxidation state oftungsten ions in clusters and, hence, to a change in thecrystal color. The induced absorption is due to the equi-librium of oxidation and reduction of tungsten ions incrystals.
The green component in the luminescence spectrumof PWO crystals can be observed only upon doping ofmelts with impurities of the Mo type. These impuritiesform inclusions of the PbMoO4 phase in the crystalmatrix. The green component is absent in the lumines-cence spectrum of pure PWO crystals. This componentcan appear if structural defects are formed in the vicin-ity of the crystal surface.
300 350 400 450 500 550 600 650Wavelength, nm
10
20
30
40
50
60
70
80
Optical transmittance, %
1
2
0 50 100 150 200Distance to the photocathode
8.5
9.0
9.5
10.0
10.5
11.0
11.5
12.0Specific light yield, photoelectrons/MeV
1
2
8.00
(a) (b)
of the photomultiplier, mm
Fig. 3. (a) Average optical transmittance and (b) average quantum yield for 2000 PWO scintillators fabricated (1) before and(2) after the application of the model under consideration.
STALLOGRAPHY REPORTS Vol. 50 Suppl. 1 2005

DEVELOPMENT OF THE TECHNOLOGY S115
It can be seen from Fig. 3 that the use of heat treat-ment of structural defects and clusters for preparingoptically homogeneous crystals permits one to improvesubstantially the properties of PWO crystals in theirmass production.
CONCLUSIONS
Thus, the technology for growing PWO crystalswith controlled properties has been designed. The tech-nology was implemented at the North Crystals Com-pany in large-scale production of PWO crystals with100% reproducibility of operating characteristics. Thismade it possible to solve the problem associated withthe PWO crystals for the ALICE experiment at CERNand to fabricate a pilot batch of large-sized PWO crys-tals (46 mm in diameter, 250 mm in length) withrequired parameters for the CMS experiment at CERN.More than 10000 PWO scintillation crystals with ahigh optical and scintillation quality for the ALICEexperiment have been produced to date. The parametersof the crystals are as follows: the quantum yield ishigher than 10 photoelectrons/MeV; the variation in thequantum yield along the crystal is less than 5%; and theoptical transmittances are higher than 30, 65, and 70%at wavelengths of 360, 420, and 600 nm, respectively.
ACKNOWLEDGMENTS
We would like to thank A.F. Konstantinova (Shubni-kov Institute of Crystallography, Russian Academy ofSciences, Moscow) and Yu.S. Kuz’minov (Institute ofGeneral Physics, Russian Academy of Sciences, Mos-cow) for their participation in the discussion of theresults obtained in this study and helpful remarks.
This work was supported by the Federal AtomicEnergy Agency of the Russian Federation.
REFERENCES1. E. A. Auffray, P. Lecoq, A. Annenkov, et al., CMS Note
No. 97/54 (CERN, Geneva, Switzerland, 1997).2. Ren-Yuan Zhu, IEEE Trans. Nucl. Sci. 44 (3), 468
(1997).3. S. Baccaro, P. Bohacek, B. Borgia, et al., Phys. Status
Solidi A 164, R9 (1997).4. E. Auffray, M. Lebeau, P. Lecoq, and M. Schneegans,
CMS Note No. 98/038 (CERN, Geneva, Switzerland,1998).
CRYSTALLOGRAPHY REPORTS Vol. 50 Suppl. 1 20
5. G. Tamulaitis, S. Burachas, V. Martinov, et al., Phys. Sta-tus Solidi A 157, 187 (1996).
6. S. Burachas, S. Beloglovsky, D. Elizarov, et al., Radiat.Meas. 38 (4–6), 367 (2004).
7. S. Burachas, S. Beloglovsky, A. Vasiliev, et al., Poverkh-nost, No. 2, 5 (2002).
8. M. Kobayashi, Y. Usuki, M. Nikl, and K. Nitsch, Nucl.Instrum. Methods Phys. Res. A 399, 261 (1997).
9. Q. Lin and X. Feng, J. Phys.: Condens. Matter 15, 1963(2003).
10. M. Nikl, K. Nitsch, J. Hybler, et al., Phys. Status SolidiB 196, K7 (1996).
11. M. Nikl, J. Rose, K. Nitsch, and J. H. Asaryan, Mater.Sci. Forum 239–241, 271 (1997).
12. A. Annenkov, E. Auffray, M. Korzhik, et al., Phys. StatusSolidi A 170, 47 (1998).
13. Q. Lin, X. Feng, Z. Man, et al., Phys. Status Solidi A181, R1 (2000).
14. S. Burachas, S. Beloglovski, I. Makov, et al., Nucl.Instrum. Methods Phys. Res. A 486 (1–2), 83 (2002).
15. M. Nikl, K. Nitsch, S. Baccaro, et al., J. Appl. Phys. 82,5758 (1997).
16. A. Annenkov, M. Korzhik, and P. Lecoq, Nucl. Instrum.Methods Phys. Res. A 490, 30 (2002).
17. M. Kobayashi, Y. Usuki, M. Ishii, et al., Nucl. Instrum.Methods Phys. Res. A 465, 428 (2001).
18. M. Nikl, Phys. Status Solidi A 178, 595 (2000).
19. S. Burachas, A. Apanasenko, B. Grinyov, et al., Int. J.Inorg. Mater. 3 (8), 1101 (2001).
20. S. Burachas, S. Beloglovski, I. Makov, et al., J. Cryst.Growth 242, 367 (2002).
21. S. Burachas, S. Beloglovski, I. Makov, et al., Nucl.Instrum. Methods Phys. Res. A 505 (3), 656 (2003).
22. S. Burachas, S. Beloglovsky, D. Elizarov, et al., Nucl.Instrum. Methods Phys. Res. A 537 (1–2), 185 (2005).
23. S. Burachas, O. Kolotii, and B. Timan, Funct. Mater. 3,29 (1996).
24. S. F. Burachas, O. D. Kolotii, and B. L. Timan, Kristal-lografiya 43 (5), 949 (1998) [Crystallogr. Rep. 43 (5),894 (1998)].
25. S. Burachas, P. Stadnik, and B. Timan, Automation ofCrystal Growth Processes (NIITÉKhIM, Moscow,1984) [in Russian].
Translated by O. Borovik-Romanova
05

Crystallography Reports, Vol. 50, Suppl. 1, 2005, pp. S116–S121.Original Russian Text Copyright © 2005 by Beloglovsky, Burachas, Vassilieva, Ziomko, Lysov, Nikitin, Saveliev, Makov, Kuznetsova, Chernousov, Yakovlev.
CRYSTALGROWTH
Specific Features of the Technology for Large-Scale Processingof Lead Tungstate Crystals for Research in the Field
of High-Energy PhysicsS. Ya. Beloglovsky, S. F. Burachas, N. A. Vassilieva, M. K. Ziomko, S. V. Lysov,
R. M. Nikitin, Yu. A. Saveliev, I. V. Makov, E. A. Kuznetsova, A. A. Chernousov, and Yu. V. Yakovlev
North Crystals Company, Apatity, Murmansk oblast, Russiae-mail: [email protected]
Received February 8, 2005
Abstract—The technology for large-scale processing of lead tungstate crystals intended for investigations inthe field of high-energy physics is implemented with the use of the processing equipment at the North CrystalsCompany. The quality of the PWO scintillators manufactured by the company satisfies the requirements of theALICE and CMS experiments at CERN. More than 8000 scintillators for the ALICE project and the pilot batchof scintillators for the CMS project have been fabricated. © 2005 Pleiades Publishing, Inc.
INTRODUCTION
The use of crystals of lead tungstate PbWO3 (PWO)in experiments performed in the field of high-energyphysics requires production of scintillators with stableradiation-optical, scintillation, and geometrical charac-teristics. The choice of PWO crystals as the basic scin-tillation material for the CMS and ALICE projects(CERN) in 1994 spurred intensive investigations con-cerned with the development of industrial technologyfor manufacturing scintillators that must satisfy differ-ent requirements, including requirements on the geo-metrical dimensions and the surface finish [1]. Thetechnology developed by CERN for processing thePWO crystals intended for the CMS project [2] wasused at the Bogoroditsk Electrochemical Plant as thebasis for the industrial technology of PWO scintillatorsfor the CMS experiment [3].
The development of the technology for producingPWO crystals with controlled properties at the NorthCrystals Company for the ALICE project [4–6]required simultaneous design of the technology fortheir processing.
In [7], it was established that PWO crystals grownwith the [100] orientation of the growth axis are leastprone to damage under mechanical actions. The condi-tions and optimum oxygen percentage in the mediumduring annealing of the crystal boule, which reduce theprobability of fracture of the crystal during its process-ing, were determined in [8].
In this work, we considered the implementation ofthe main stages of the technology for large-scale pro-cessing of PWO crystals with the use of the processingequipment existing at the North Crystals Company.
1063-7745/05/5001-S $26.000116
PROPERTIES OF PWO CRYSTALS AFFECTING THE CHOICE OF THE TECHNIQUES
FOR THEIR PROCESSING
The basic physicochemical properties of PWO crys-tals are listed in Table 1. The general view of the PWOcrystal grown along the [100] direction is depicted inFig. 1. The requirements on the physical parameters ofPWO scintillators for the ALICE project are given inTable 2. The specification for the geometrical dimen-sions and surface finish of scintillators are presented inFig. 2.
Lead tungstate crystallizes in the tetragonal crystalsystem, has a scheelite-type structure, and belongs tothe space group I41/a. The parameters of the PWO unitcell containing four formula units are as follows: a =5.462 Å and b = 12.046 Å. The Bragg angles calculatedfor the crystallographic planes that are most importantfrom the standpoint of the processing technology arelisted in Table 3. The PWO samples were investigatedon a DRON-4M diffractometer with a standard radia-tion source 29Cu.
Table 1. Basic physicochemical properties of PWO crystals [9]
Property Numerical values
Chemical formula PbWO4
Density, g/cm3 8.23 ± 0.05
Molecular mass, amu 391
Mohs hardness 4
Melting temperature, °C 1123 ± 3
Refractive index n 1.3–1.9
© 2005 Pleiades Publishing, Inc.

SPECIFIC FEATURES OF THE TECHNOLOGY S117
In choosing the orientation of seed crystals, theattraction was toward the [100] direction, because thePWO growth in different crystallographic directionsdetermines dominant cleavage planes, namely, the(104) cleavage plane for the (001) plane and the (101)and (112) cleavage planes for the (100) plane. Thedestructive action of these cleavage planes substantiallycomplicates the problem associated with the preserva-tion of crystal integrity in the course of processing [7].The basal crystallographic planes (004) and (200) wereused to prepare the seeds.
This approach provided reproducibility of the crys-tals grown in a habit and made it possible to predict thelocation of the scintillation element in the crystal boule.
The processing techniques were developed to solvethe problem associated with the crystal fracture alongthe cleavage planes due to the thermoelastic stresses,which depend on the physical properties and growthconditions of PWO crystals.
In the study of crystal defects affecting the quality oftheir processing, cracking of crystals that have pro-nounced variations in the diameter along the bouleheight (so-called “skirts” and “necks”) is of specialimportance. During the growth, the crystal structuretends to the energetically most favorable state, in whichthe internal energy is predominantly represented by thekinetic energy component of the molecular interaction.
If the crystal surface during the crystal growth devi-ates from a specified shape due to particular factors, thecomponents of the internal energy of the crystal areredistributed in surface regions. In these crystal surfaceregions, there arise forces of an additional pressure ∆pthat tend to restore an optimum energy state of the crys-tal surface. This situation is illustrated in Fig. 3.
Similar defects lead to the formation of crystalregions with different internal energies. Under externalactions (for example, incorporation of abrasive grains,sharp temperature drops, etc.), the crystal responds tothese actions and tends to minimize its internal energy;i.e., there occurs a so-called crystal discharge that man-ifests itself as crack formation and even complete frac-ture of crystal boule macroregions.
SPECIFIC FEATURES OF THE TECHNOLOGY FOR LARGE-SCALE PROCESSING OF PWO CRYSTALS FOR RESEARCH IN THE FIELD
OF HIGH-ENERGY PHYSICS
The technology for mechanical processing of PWOcrystals involves two stages: the operations associatedwith the workpiece shaping and the operations ensuringthe fulfillment of the requirements for the surface finishof elements.
The technological operations associated with theworkpiece shaping were performed on a 3D711VF11precision surface grinding machine. The machine wasmodified in order to regulate and control precisely thelongitudinal movement of an operating table that feeds
CRYSTALLOGRAPHY REPORTS Vol. 50 Suppl. 1 20
the crystal to the cutting zone. The hydraulic drive ofthe table was used only for adjustment and setting ofthe crystal. The cutting was performed with an electro-mechanical drive. The design provided a wide range ofcutting speeds from 30 to 100 mm/min. Triefus D-76-MH3 250/50/1.95 saws were used as a cutting tool.Special holders were designed for the saw fixation. Asa result, the runout of the base plane of a spindle undera saw housing was ≤0.02 mm and the saw holder runoutwas ≤0.005 mm.
In order to provide in-line processing, we rejectedthe techniques based on the crystal fixation in a gypsummold [9]. For all cutting stages, we designed specialtools that made it possible to firmly fix the crystal in thecourse of operations, to reduce concentrated loadscapable of resulting in a crystal fracture, and to mountsecurely and precisely the crystal on the operating tableof the machine. The tools were produced from a steelwith graphite and textolite inserts that play the role ofdampers at points of concentrated loads on the work-piece surface. The tools are fastened to a magnetic plateof the operating table equipped with positioning tools.
The first stage of crystal cutting consists in cuttingthe upper and lower ends (Fig. 4).
Special tools for the operation with the use of twosaws were developed for the cutting of crystal sides. Asa result, the parallelism of the opposite faces was noworse than 0.02 mm over the entire length (180 mm) ofthe workpiece (Fig. 5).
It was found that the quality of cutting PWO crystalsis affected by the sequence of cutting lateral faces with
[001]
[001]
[100]
[100]
Fig. 1. Schematic drawing of the PWO crystal grown alongthe [100] direction.
Table 2. Requirements imposed on the physical parametersof the PWO scintillator for the ALICE project [6]
Parameter Numerical values
Color of the scintillator Colorless
Specific light yield, photoelec-trons/MeV
>10
Change in the specific light yield along the scintillator axis, %
<5
Transmittance along the scintil-lator axis, ≥ %
30, 65, and 70 at wave-lengths of 360, 420, and 630 µm, respectively
05

S118
BELOGLOVSKY
et al
.
A A
B0.38B
0.19
0.07 0.01 M
Polishing
180–0.2
22–0.1
Fig. 2. Specification for the geometrical dimensions and surface finish of scintillators.
“Skirt” “Neck”Surface ofthe crystal
Crystalgrowth axis
P0ρ0
P0 + ∆pρ1
P0 – ∆pρ2
ρ1 ≥ ρ0 ≥ ρ2, where ρ is the density of force vectors of additional pressure
Fig. 3. Illustration of “skirt” and “neck” defects.
(a) Direction of cutting (b) Plan view
Fig. 4. Schematic diagram of the cutting of cone-shaped crystal ends: (a) the direction of cutting and (b) the plan view.
respect to the cleavage planes of the crystal. In particu-lar, when the faces perpendicular to the cleavage planesare cut first, the subsequent operations lead to cleavageand cracking of the workpiece. The performed investi-gations enabled us to reveal the cutting sequence for thepreparation of the workpiece from the crystal (Fig. 6).This is very important with due regard for structuralfeatures of the PWO crystal grown along the [100]direction and growth conditions in a high-gradient zoneof a crystallizer. First, the upper part of the boule thatcontains the largest number of regions with thermoelas-tic stresses is removed. Second, it becomes possible to
CRY
avoid the effect of surface crystal structures on the finalresult of cutting.
The cutting conditions were chosen so that the crys-tal fracture was excluded. The next stage of processingis the technological operation of fine grinding.
Special tools were designed and produced for in-linegrinding of end and lateral faces on the 3D711VF11machine with the use of a 14V1 250*21*23*3*76 ACM20/14 4/586 B3.16 grinding diamond disk. The chosengrinding conditions ensured the preservation of work-pieces and the reproducibility of the geometricaldimensions in each batch of workpieces (Figs. 7a, 7b).
STALLOGRAPHY REPORTS Vol. 50 Suppl. 1 2005

SPECIFIC FEATURES OF THE TECHNOLOGY S119
(b) View in the(a) Front view
Rotation of the saw
Movement of the
direction of cutting
operating table
Fig. 5. Schematic diagram of the cutting of lateral crystal sides: (a) the front view and (b) the view in the direction of cutting.
II III I IV V
Fig. 6. Sequence of the cutting of the PWO crystal.
Fig. 7. Schematic diagram of the grinding of (a) end faces and (b) lateral faces of the crystal.
2hL
h
L
I II
Rotation of the disk
Movement of the
(a2) Longitudinal view(a1) Front view
(b1) Longitudinal view (b2) Front view for II in panel (b1)
Movement of the
Rotation of the disk
operating table
Designations: 2h is the lift of the disk, and L is the displacement of the operating table in the operation with one machine
operating table
CRYSTALLOGRAPHY REPORTS Vol. 50 Suppl. 1 2005

S120
BELOGLOVSKY
et al
.
The workpieces were polished on Yu1.M1machines. In order to provide the smoothness of thestart and stop of the polishing operation, the machineswere equipped with Mitsubishi FR-E540-7.5K fre-quency converters.
Special tools were designed for in-line polishing.The masses of the tools and additional weights werechosen so that the resultant vector of the gravity forceand the torque of the polishing table could not lead todistortions of the element shape.
A suspension prepared on the basis of distilled waterand a diamond submicropowder served as an abrasive.
PC
A
B
α
β
k
p
Fig. 8. Schematic diagram of the control over the operationof the compass with a holder.
Fig. 9. Holder for polishing end faces of scintillators.
CRY
The end and lateral faces were polished using ACM 1/0and ACM 2/1 submicropowders, respectively.
Holders for polishing ensured the secure fixation ofworkpieces in a polishing zone but were not fastenedmechanically to parts and units of the machine. Thepolishing tables were equipped with positioning tools(“compasses”), which provide a way of moving work-pieces in two degrees of freedom. This ensured a uni-form polishing of all workpiece faces in the course ofpolishing.
The holder was rotated as a result of the differencebetween the centrifugal moments at the points A and B(Fig. 8). Bearing hinges α and β played the role of fas-teners of the holder and allowed the holder to rotate inthe direction of rotation of polishing table. In this case,the instantaneous linear velocities of the holder and thepolishing table are characterized by the vectors k and p,respectively.
The holders with a rigid composite design were usedfor polishing end faces. Holder flanges were made fromtextolite, and parts ensuring the rigidity and security ofthe structure were produced from aluminum. Eachworkpiece was placed in an aluminum barrel and fixedalong the guiding planes. The force pressing the endface to the surface of the polishing table was deter-mined by the total weight of the barrel and the work-piece and was identical for all workpieces. This simpli-fied the control over the removal of the crystallinematerial.
Composite holders whose parts were prepared fromtextolite were used to polish lateral faces. On the pol-ishing table, workpieces were freely placed in a texto-lite holder located inside a guiding ring. A casing forcomposite weights was placed on workpiece facesopposite those to be processed.
The schematic diagrams of tools for polishing endand lateral faces of scintillators as a unit are depicted inFigs. 9 and 10.
All the operations associated with the processing ofPWO crystals were metrologically supported. This per-
C
C–C
Weight Ring
(a) Schematic arrangement of (b) Holder with the weight as a unitworkpieces in the holder
Fig. 10. Holder for polishing lateral faces of scintillators.
STALLOGRAPHY REPORTS Vol. 50 Suppl. 1 2005

SPECIFIC FEATURES OF THE TECHNOLOGY S121
mitted us to opportunely reveal and correct possibledeviations of the shape and dimensions from the speci-fied values. In the technology used, the attraction istoward optical methods (laser stands) and also compar-ative testing methods based on the use of referencesamples.
CONCLUSIONS
An advanced technology for large-scale processingof PWO crystals for investigations in the field of high-energy physics was developed and implemented usingthe processing equipment available at the North Crys-tals Company. More than 8000 scintillators satisfyingthe technical requirements of the ALICE project atCERN were fabricated according to this technology todate. A pilot batch of PWO scintillators Barrel and EndCup was produced for the CMS project at CERN. The
Table 3. Bragg angles for crystallographic planes of PWOcrystals
(hkl) D (A) I, % Q, deg
112 3.2512 100 13°42′17″004 3.0115 20 14°49′10″200 2.7310 30 16°22′56″105 2.2043 2 20°27′11″
CRYSTALLOGRAPHY REPORTS Vol. 50 Suppl. 1 2
good-to-bad ratio at the stage of mechanical processingof PWO crystals is more than 90%.
REFERENCES
1. E. Auffray, M. Lebeau, P. Lecoq, and M. Scheegans,CMS Note No. 1998/038 (CERN, Geneva, Switzerland,1998).
2. M. Lebeau, CMS Note No. 1997/024 (CERN, Geneva,Switzerland, 1997).
3. A. Annenkov, M. Korzhik, and P. Lecoq, Nucl. Instrum.Methods Phys. Res. A 490, 30 (2002).
4. S. Burachas, S. Beloglovsky, D. Elizarov, et al., Pov-erkhnost, No. 2, 5 (2002).
5. S. Burachas, S. Beloglovski, I. Makov, et al., J. Cryst.Growth 243, 367 (2002).
6. S. Burachas, S. Beloglovsky, D. Elizarov, et al., Mater.Elektron. Tekh., No. 2, 35 (2004).
7. G. Tamulaitis and S. Burachas, Phys. Status Solidi A157, 187 (1996).
8. S. F. Burachas, in Proceedings of the X National Confer-ence on Crystal Growth, NKRK-2002, Moscow, Russia,2002 (Moscow, 2002), p. 145.
9. CMS Technical Proposal, CERN ILH CC 94-98 (1994);TT ALICE (1999).
Translated by O. Borovik-Romanova
005

Crystallography Reports, Vol. 50, Suppl. 1, 2005, pp. S122–S123.Original Russian Text Copyright © 2005 by Kerimova, Mustafaeva, Asadov, Kerimov.
CRYSTALGROWTH
Synthesis, Growth, and Properties of TlGa1 – xYbxS2 Crystals
É. M. Kerimova, S. N. Mustafaeva, Yu. G. Asadov, and R. N. KerimovInstitute of Physics, National Academy of Sciences, pr. Dzhavida 33, Baku, 370143 Azerbaidzhan
e-mail: [email protected] February 8, 2005
Abstract—The synthesis of TlGa1 – xYbxS2 single crystals with the partial substitution of ytterbium for galliumis described. Variations in the electric conductivity of grown crystals irradiated with X-rays of various intensi-ties are measured. © 2005 Pleiades Publishing, Inc.
The study of physical properties of the TlBIII
compounds (B = In, Ga and C = S, Se, Te) and solidsolutions on their basis is very important for establish-ing the relations between their compositions and prop-erties. Recently, we reported the influence of the inter-calation of TlGaS2 single crystals with lithium on thedielectric properties [1] and doping with iron on thephotoelectric characteristics [2] of these crystals. Thepresent study was undertaken to study the effect of thepartial substitution of ytterbium for gallium in TlGaS2single crystals on their physical properties.
Homogeneous TlYbS2, TlGaS2, TlGa0.999Yb0.001S2,and TlGa0.995Yb0.005S2 samples were obtained by themethod of direct synthesis, i.e., by the reaction betweenthe starting components. Homogeneous TlGa1 – xYbxS2(x = 0; 0.001; 0.005, 1.0) single crystals were grown bythe Bridgman method.
The samples synthesized were ground and placedinto 10 cm-long quartz ampules with the internal diam-eter r = 1 cm evacuated to a pressure of 10–3 Pa and thenwere placed into a furnace having two temperaturezones. In the upper furnace zone, the temperature wasmaintained above the melting points of the componentsby about 100 K. The temperature in the second zonewas lower by 50 K than Tmelt. The velocity of theampule motion in the furnace was 0.3 cm/h. The loca-tion of the sharp ampoule end in the zone with the tem-
C2VI
1063-7745/05/5001-S $26.000122
perature Tmelt resulted in the formation of a crystalliza-tion nucleus, whereas the velocity of the ampule motionin the furnace was sufficient for its further growth.
To identify the samples obtained, we obtained X-raydiffraction patterns from the samples synthesized andfrom the corresponding single crystals. These diffrac-tion patterns turned out to be identical, which indicatedthe presence of only one phase irrespective of the sam-ple composition. The crystallographic data obtainedfrom the diffraction patterns are listed in the table.
We also studied electrical, photoelectrical, andX-ray dosimetric characteristics of the TlGa1 – xYbxS2single crystals. It was established that the partial substi-tution of ytterbium for gallium resulted in an increasein sample resistivity, displacement of the intrinsic-pho-tocurrent maximum to the long-wavelength range ofthe spectrum, considerable broadening of the region ofspectral sensitivity, and an increase in the amplitude ofthe extrinsic photocurrent.
Figure 1 shows the dependence of the coefficient ofX-ray-induced conductivity of TlGa0.999Yb0.001S2 singlecrystals at various accelerating potentials of the X-raytube ranging from 25 to 50 keV. The coefficients ofX-ray-induced conductivity, which characterize thesensitivity of single crystals to X-ray radiation, were
Crystallographic data for TlGa1 – xYbxS2 single crystals
Composition SystemLattice parameters
Sp. gr. ρx, g/cm3
a, Å b, Å c, Å β, deg z
TlYbS2 Monoclinic 6.95 15.80 4.01 110 4 C21/n 7.086
TlGaS2 Monoclinic 10.772 10.772 15.638 100.06 16 C2/c 5.560
TlGa0.999Yb0.001S2 Monoclinic 10.776 10.776 15.646 100.06 16 C2/c 5.022
TlGa0.995Yb0.005S2 Monoclinic 10.820 10.820 15.723 100.06 16 C2/c 4.962
© 2005 Pleiades Publishing, Inc.

SYNTHESIS, GROWTH, AND PROPERTIES S123
determined from the equation
where σ0 and σE are the sample conductivities beforeand after sample irradiation with X-rays, and E is theirradiation dose. The coefficient Kσ of TlGa0.999Yb0.001S2single crystals turned out to be thrice higher than the Kσcoefficient of TlGaS2 single crystals. Analysis of theexperimental data obtained showed that the coefficientKσ of TlGaS2⟨Yb⟩ regularly decreases with an increasein the irradiation dose and accelerating voltage V. Thecharacteristic behavior of Kσ(E, V) may be explained asfollows. At relatively low accelerating voltages, X-ray-induced conductivity is explained mainly by radiationabsorption in the subsurface layer. In this case, anincrease in the radiation intensity results in a prevalenceof the mechanism of surface recombination describedby a quadratic law, which, in turn, results in a decreasein the X-ray-induced conductivity. With an increase inthe accelerating potential, the efficient harness of theX-ray radiation increases and the depth of radiationpenetration into the crystal also increases. In otherwords, we observe the prevalent absorption-generationof free X-ray carriers in the volume. The fraction of thetransmitted X-ray radiation increases. Thus, an increasein the accelerating potential results in a decrease in the
KσσE σ0–
σ0E-----------------,=
R/min
Kσ, 10–2min/R
20
10
0 20 40 60 80
30
40
50
1
2
345
6
Fig. 1. Coefficient of X-ray sensitivity Kσ of theTlGa0.999Yb0.001S2 single crystal as a function of the irradi-ation dose at various energies of the X-ray radiation: (1) 25,(2) 30, (3) 35, (4) 40, (5) 45, and (6) 50 keV (T = 300 K).
CRYSTALLOGRAPHY REPORTS Vol. 50 Suppl. 1 2
coefficient of X-ray-induced conductivity and its morepronounced dependence on the radiation dose.
We also studied the dependence of X-ray inducedcurrent in TlGa1 – xYbxS2 single crystals on the irradia-tion dose. Figure 2 shows the dependence of X-ray-induced current ∆IE, 0 on the irradiation dose forTlGa0.999Yb0.001S2 single crystals. It is seen that irre-spective of the energy of X-ray radiation at an acceler-ating voltage ranging from 25 to 50 keV, these depen-dences are described by power laws.
Thus, the experimental results show that the partialGa Yb substitution in TlGaS2 resulted in anincrease of the sensitivity coefficient to X-ray radiation,whereas the ∆IE, 0~ Eα characteristics tend to be linear,(α 1) tends to be linear in the region of low inten-sities (of the soft X-ray radiation E, R/min). In theregion of high intensities of hard X-ray radiation, αtends to 0.5 (Fig. 2).
REFERENCES
1. S. N. Mustafaeva, Problemy Énergetiki, No. 3, 70(2004).
2. É. M. Kerimova, S. N. Mustafaeva, and S. I. Mekhtieva,Prikl. Fiz., No. 4, 81 (2004).
Translated by L. Man
101
E, R/min
∆IE, 0, A
10–9
10–10
10–11
102100
1 2 34 5 6
Fig. 2. X-ray-induced current in TlGa0.999Yb0.001S2 singlecrystal at various accelerating potentials V, keV at the tubecathode: (1) 25, (2) 30, (3) 35, (4) 40, (5) 45, and (6) 50. T =300 K.
005

Crystallography Reports, Vol. 50, Suppl. 1, 2005, pp. S124–S129.Original Russian Text Copyright © 2005 by Avetisov, Mel’kov, Zinov’ev, Zharikov.
CRYSTALGROWTH
Growth of Nonstoichiometric PbTe Crystals by the Vertical Bridgman Method Using the Axial-Vibration Control Technique
I. Kh. Avetisov, A. Yu. Mel’kov, A. Yu. Zinov’ev, and E. V. ZharikovMendeleev University of Chemical Technology, Miusskaya pl. 9, Moscow, 125190 Russia
e-mail: [email protected] December 28, 2004
Abstract—A modification of the vertical Bridgman method with the excitation of low-frequency axial vibra-tions in the melt (axial-vibration control technique) is developed to grow crystals of volatile chemical com-pounds. It is shown that the use of the axial-vibration control technique in the growth of PbTe crystals makes itpossible to obtain a more uniform distribution of the excess (nonstoichiometric) component over the crystallength. As a result of the intense melt mixing, equilibrium between the vapor phase, the melt, and the growingcrystal is fixed so rapidly that it becomes possible to change the nonstoichiometry of a growing crystal bychanging the vapor pressure. The composition of the congruently melting lead telluride, determined by com-paring the nonstoichiometries of the initial charge and the crystal grown, was found to correspond to (2.8 ±0.3) × 10–4 mol excess Te/mol PbTe. © 2005 Pleiades Publishing, Inc.
INTRODUCTION
The problem of the effective control of heat andmass transfer during the growth of crystals from melt isa subject of intense study. This problem is especiallyurgent for the Bridgman method, which is character-ized by a low efficiency of heat and mass transfer in theliquid phase. In recent years, many attempts have beenmade to develop effective techniques of growth frommelt with the application of a rotating magnetic field,precessing ampoule (CVS technology), ultrasound irra-diation of melts, shaking of crystals, and many othermethods [1–4].
Methods based on the use of the axial-vibration con-trol (AVC) technique have proven to be the most devel-oped ones, both theoretically and practically. In partic-ular, as shown by numerous model experiments, excita-tion of axial low-frequency vibrations in a melt, eitherby introducing an inert vibrating body into the melt inthe classical vertical Bridgman method or by applyingvibrations directly to the growing crystal in the contact-less modification of the Bridgman method [5–10],makes it possible to change significantly the hydrody-namics of fluxes in the melt. The result is changes in thecharacteristics of the diffusion layer, the curvature ofthe crystallization front, and some other factors, whichsignificantly affect the characteristics of the crystalsgrown [5–7]. For example, the use of the AVC tech-nique in [8] made it possible to reduce the density ofgrowth dislocations from 103 to 1 cm–2 during thegrowth of sodium nitrate crystals.
The main difficulty in the implementation of a par-ticular technique of melt activation is the absence of adifferential approach to melts differing in viscosity,temperature, volatility, and chemical reactivity.
1063-7745/05/5001-S $26.000124
Experiments with the introduction of axial vibra-tions into a melt were carried out in an open system[11]. In the configuration of the vertical Bridgmanmethod, low-frequency vibrations were introduced intothe melt using a disk mounted on a rod, which, in turn,was subjected to mechanical vibrations using a low-fre-quency loudspeaker.
In this study, we attempted to extend the possibilityof using the AVC technique for the crystal growth withcontrolling both the gas and vapor atmospheres at high(up to 106 Pa) and low (down to 10–1 Pa) pressures. Wechose lead telluride as a model material to check thesetup operation. Lead telluride is a narrow-gap semi-conductor. There are many data in the literature on thegrowth of lead telluride crystals from both melt andvapor phase; thus, this compound can be considered awell-studied one [12, 13]. In contrast to NaNO3, whichcan be grown in an open system in air, PbTe is grown inclosed or quasi-closed systems. Taking into account thenecessity of controlling the nonstoichiometry of crys-tals grown, the process should be performed at a con-trolled vapor pressure of one of the components, deter-mined from the pi–T projection of the phase diagram ofthe Pb–Te system.
EXPERIMENTAL
Construction of the Growth Setup
The schematic of the setup for crystal growth by theAVC technique is shown in Fig. 1. The setup is con-trolled by a personal computer and an LTC crate (ZAOL-Card [14]).
The heating unit of the system is a resistance fur-nace with seven energy-independent zones. The maxi-
© 2005 Pleiades Publishing, Inc.

GROWTH OF NONSTOICHIOMETRIC PbTe CRYSTALS S125
Soundboard
LPTport
ëOMport
PC
Low-
amplifierVibrator
Amplitudesensor
Current leadsThermocouples
Furnace
Amplifier
Motionmechanism
Stepper motorcontroller
Controller
Digital inputoutput
Analog-to-
Digital-
CrateMobiletelephone
frequency
digital converter
to-analog converter
Fig. 1. Schematic of the setup for crystal growth by the vertical Bridgman method with the introduction of low-frequency vibrationsinto the melt.
mum operating temperature of the furnace is 1300 K;the error in maintaining temperature is ±0.1 K. Themechanism of motion of the growth ampoule, locatedin the bottom part of the heating unit, is controlled by astepper motor. A unit step of the motor corresponds toa displacement of the ampoule by 0.2 µm.
Estimation showed that, at a velocity of ampoulemotion of 2 mm/h, the maximum deviation of thegrowth rate from the average value does not exceed 2%.
The unit for the excitation of low-frequency vibra-tions (Fig. 2) is a system of external permanent magnets4, providing a free suspension of the internal permanentmagnet 12 and the electromagnet 15. The internal per-manent magnet 12 is placed in a hermetic Teflon hous-ing. The electromagnet 15 provides vibrations of themagnet 12 with a specified frequency and amplitude. Arod 6 with a disk 8 on the end is attached to the Teflonhousing of the magnet 12. During the crystal growth,the disk 8 is immersed in the melt 9. The rod with thedisk is positioned axially with respect to the growthampoule 7. The ampoule 7, the rod 6, and the disk 8 areremovable and can be made of different materials(corundum, boron nitride, platinum, and so on). For thegrowth of lead telluride, we used elements made ofquartz glass.
The electromagnetic vibrator can be shifted verti-cally to position the disk 8 with respect to the crystalli-zation front. The frequency and amplitude of vibrationsis controlled using a specially developed software. Anoutput signal is generated by a sound board with a sam-pling rate of 40 kHz and amplified by a low-frequencyamplifier. The vibration-amplitude feedback is per-formed using an electromagnetic sensor mounted on
CRYSTALLOGRAPHY REPORTS Vol. 50 Suppl. 1 2
the vibrator rod. The computer software can give infor-mation about the current operating parameters of thesetup and about an emergency situation by sending anSMS message. To this end, a Nokia 6110 mobile tele-phone was used with a standard Nokia Data Suite 3interface.
The gas atmosphere in the growth ampoule shouldbe inert to avoid oxidation of lead telluride. Evacuationof the ampoule makes it impossible to control the vaporphase during the crystal growth. The saturation vaporpressure of PbTe molecules at the melting temperatureis about 7 × 10³ Pa. Hence, when the growth ampoule isevacuated, the material rapidly evaporates and crystal-lizes in the cold part of the ampoule. Evaporation isenhanced significantly when the vibrating rod is intro-duced into the melt. Since the rod is colder than theampoule walls because of the radial gradient, a signifi-cant fraction of resublimating lead telluride is con-densed on the rod and, finally, jams it. During theexperiments, we found that the introduction of argonwith a partial pressure of about 8 × 10⁴ Pa into thegrowth ampoule makes it possible to reduce signifi-cantly the evaporation rate of PbTe, as a result of whichno more than 5% of PbTe is transferred to the cold partof the ampoule during the growth.
In the preliminary experiments, carried out withoutapplying vibrations, the optimal velocity of verticalampoule motion was determined to be 2 mm/h at adiameter of the growing crystal of 13 mm. The externaltemperature gradient in the crystallization zone was50 K/cm. To compare the results obtained in the con-ventional and AVC processes, the same conditions wereused to grow crystals using the AVC technique.
005

S126
AVETISOV
et al
.
1
2
5
3
13
4
15
12
3
52
5
6
5
37
98
10
11
14
Fig. 2. Schematic of the growth system with the introduc-tion of axial low-frequency vibrations into the melt in anevacuated ampoule: (1) vacuum valve; (2) tooth-seal hous-ing; (3) tooth-seal nut; (4) external permanent magnet;(5) rubber ring; (6) vibrator rod; (7) growth ampoule;(8) vibrator disk; (9) melt; (10) crystal; (11) ampoule-dis-placement rod; (12) internal permanent magnet; (13) glasstube; (14) resistance furnace; and (15) electromagnet.
CRY
Charge Synthesis
The synthesis of nonstoichiometric lead telluridecharge was performed in two stages. In the first stage,elementary tellurium (Extra grade, 99.999) and lead(high-purity C-000 grade) were melted in an evacuatedgraphitized quartz ampoule. The melt was homoge-nized at 1230 K for 6 h. To achieve completeness of thereaction, tellurium was taken in excess of 0.1 mol %with respect to the stoichiometric composition. Afterthe synthesis, the polycrystalline ingot was ground topowder with an average grain size of 20 µm and theexcess tellurium was removed by low-temperature dis-tillation in a vacuum.
In the second stage, the polycrystalline compoundobtained was subjected to annealing under controlledpartial Te vapor pressure. The Te vapor pressure waschosen on the basis of the known –T–X diagram forlead telluride [15]. After the annealing, the ampoulewith the compound was quenched and the nonstoichi-ometry of the compound was determined by the tech-nique described below.
Measurement of the Characteristics of the Crystals
To determine the concentration of the excess com-ponent (the nonstoichiometry) in lead telluride, themethod of extraction was used [16]. The essence of thismethod is as follows: upon annealing in an evacuatedampoule in a two-zone furnace, on the basis of thedetailed analysis of the pi–T–xi phase diagram of thecorresponding chemical compound, the conditions aredetermined at which the excess component is resubli-mated to the colder part of the ampoule. The tempera-ture of the PbTe compound is 700 ± 10 K and the vaporpressure of Te2 molecules is 10–7 Pa, which correspondsto a temperature of the colder part of the ampoule of520 K. In this case, by the end of the annealing, theresidual concentration of excess tellurium in the com-pound (whose temperature is higher) coincides with thestoichiometric composition within the measurementerror (10–7 mol of excess component per PbTe mol)[17]. The amounts of tellurium and lead in the conden-sate were determined photocolorimetrically [18]. Thedetection limit of this method is 1 µg of Te(Pb) in a testsample. With allowance for this limit and the realweights of nonstoichiometric lead telluride (from 0.5 to2 g), the detection limit of excess Te was 2 × 10⁻⁶ molof excess component per PbTe mol.
The type, concentration, and mobility of free chargecarriers were determined by measuring the dc-currentHall effect in a dc magnetic field [19].
The dislocation density in the crystals grown wasdetermined in the (100) plane by the etch-pit method,using an etchant of the following composition: KOH :H2O2 : C3H5(OH)3 (glycerin) : H2O = 10 : 0.5 : 1 : 10 [20].
pTe2
STALLOGRAPHY REPORTS Vol. 50 Suppl. 1 2005

GROWTH OF NONSTOICHIOMETRIC PbTe CRYSTALS S127
RESULTS AND DISCUSSION
The PbTe crystals grown were boules 40-mm-longin the cylindrical part (Fig. 3). The bottom (conical)part of the crystals was ~10-mm-long. To carry outmeasurements, the crystals were cleaved in the cleav-age planes into three parts: bottom (conical), middle,and top. Table 1 contains the electrical parameters ofthe crystals, calculated from the Hall measurements.
Analysis of the data obtained showed that the toppart of all crystals has a tendency towards a decrease inthe concentration of holes, which are majority carriersin the case of the incorporation of excess tellurium intolead telluride [21, 22]. At the same time, the mobility ofmajority carriers is the highest in the middle part for allcrystals.
The difference between the total concentration ofexcess Te (determined by the direct physicochemicalmethod) and the concentration of free charge carrierswas used to calculate the concentration of neutraldefects (Table 2). When lead telluride is used as an IR-photosensitive material, the concentration of electri-cally neutral defects, which can be recombination orattachment centers, determines the kinetic characteris-tics of the photoconductivity.
Comparison of the total defect concentration withthe concentration of ionized defects (Table 2) showsthat, as a result of an increase in the vibration ampli-tude, the difference in these concentrations decreases inall parts of the crystals. This fact indicates that ionizeddefects become dominant and make the largest contri-bution to the total defect concentration. Specifically,this situation is characteristic of the high-temperatureequilibrium at the boundary of the homogeneity rangeof PbTe from the side of excess Te [15, 21]. Therefore,an increase in the vibration amplitude makes the chem-ical potentials of the components in different (solid,melt, vapor) phases closer to their equilibrium values.
Fig. 3. Lead telluride crystal grown by the vertical Bridg-man method with the introduction of axial low-frequencyvibrations into the melt.
CRYSTALLOGRAPHY REPORTS Vol. 50 Suppl. 1 2
Thus, the results obtained can be analyzed on the basisof the equilibrium T–x projection of the phase diagramof the Pb–Te system.
At a vibration amplitude of 100 µm, when the non-stoichiometric Te concentration is almost constantalong the entire crystal length, crystals were grownfrom charges with different excess Te concentrations.Suggesting that the mass transfer through the vaporphase during the crystal growth is suppressed by theinert-gas pressure (PAr = 105 Pa), we assumed that, inthe initial stage of crystallization, the melt composition
Table 1. Electrical characteristics of the PbTe crystals
Part of the crystal A, µm XTe in the
charge p(n), cm–3 m,V cm–1 s–1
Top 0 1.2 × 10⁻⁴ –1.7 × 1018* 550
Middle 1.5 × 10¹⁸ 820
Bottom 1.1 × 10¹⁸ 740
Top 36 1.2 × 10⁻⁴ 2.9 × 10¹⁸ 530
Middle 1.5 × 10¹⁸ 750
Bottom 1.8 × 10¹⁸ 730
Top 50 1.2 × 10⁻⁴ 4.3 × 10¹⁸ 440
Middle 1.7 × 10¹⁸ 950
Bottom 1.1 × 10¹⁸ 900
Top 100 1.2 × 10⁻⁴ 3.4 × 10¹⁸ 350
Middle 2.2 × 10¹⁸ 620
Bottom 2.9 × 10¹⁸ 590
* n-type conductivity.
0x
T
–2 2 4 6
Tmcong
1 2
Tmmax = 1197 K
Fig. 4. (1) Solidus and (2) liquidus lines in the T–x projec-tion of the phase diagram of the Pb–Te system near the max-imum melting temperature of the PbTe compound (x is theexcess-component concentration: 10–4 mol excessTe(Pb)/mol PbTe).
005

S128 AVETISOV et al.
Table 2. Concentrations of charged and neutral point defects in PbTe crystals grown at a vibration frequency of 50 Hz anddifferent vibration amplitudes
A, µm Part of the crystalXTe in the charge XTe Xion Xneutr |Xneutr/Xion|
10–4 mol excess Te/mol PbTe rel. units
0 Top 1.2 –0.57*
Middle 0.40 0.51 –0.11 0.21
Bottom 2.00 0.37 1.63 4.40
36 Top 1.2 0.94 0.98 –0.04 0.04
Middle 2.00 0.51 1.49 2.96
Bottom 2.30 0.61 1.69 2.79
50 Top 1.2 0.40 1.45 –1.05 0.72
Middle 1.47 0.57 0.90 1.57
Bottom 1.97 0.37 1.60 4.31
100 Top 1.2 1.29 1.15 0.14 0.13
Middle 1.34 0.74 0.60 0.81
Bottom 1.78 0.98 0.80 0.82
50 Top 4.4 0.35
Middle 0.44
Bottom 3.36 0.49 2.87 5.86
50 Middle 3.4 3.2 0.91 2.29 2.52
* n-type conductivity.
corresponds to that of the initial nonstoichiometriccharge. In Fig. 4, these points correspond to the liqui-dus composition. The solidus composition was deter-mined from the analysis of the nonstoichiometry of thecrystals grown. Since we could not exactly determinethe temperatures at which the crystallization occurred,relative values of temperature are plotted on the ordi-nate axis.
Analysis of the results showed that the congruentmelting point of lead telluride corresponds to an excessof Te of about (2.8 ± 0.3) × 10–4 mol excess Te/molPbTe. The use of a charge of such composition allowedus to grow crystals with a much lower dislocation den-sity (Table 3).
It was shown previously [23] that, at a fixed vibra-tion frequency, a change in the vibration amplitude inthe AVC technique makes it possible to change thecrystallization-front shape from convex to concave,with an almost planar front at the optimal point. In thiscase, the density of growth dislocations in sodiumnitrate crystals decreased by several orders of magni-tude. As can be seen from Table 3, for the PbTe crystalsgrown from a charge with an excess Te concentration of1.2 × 10–4 mol Te/mol PbTe, with an increase in thevibration amplitude to 100 µm, the dislocation densitysignificantly increases. At the same time, the nonsto-ichiometry distribution becomes uniform over the crys-
CRY
tal length. This behavior can be explained by thechange in the curvature of the crystallization front fromconvex to concave with an increase in the vibrationamplitude.
The excess Te concentration in the initial chargeaffects the dislocation density much stronger (Table 3).A decrease in the excess Te concentration, i.e., the useof a charge with a composition close to stoichiometric,leads to a significant increase in the dislocation density.Vice versa, the use of a charge with nonstoichiometryclose to the congruent-melting point makes it possibleto grow crystals with a very low dislocation density.
Table 3. Dislocation density in PbTe crystals grown fromcharges with different nonstoichiometry at a vibration fre-quency of 50 Hz and different vibration amplitudes
A, µm XTe, mol excess Te/mol PbTe
Dislocation density, cm–2
top middle bottom
0 1.2 × 10⁻⁴ 3 × 10⁵ 1.5 × 10⁵ 2 × 10⁵
36 1.2 × 10⁻⁴ 3 × 10⁵ 3 × 10⁵ 2.5 × 10⁵
50 1.2 × 10⁻⁴ 3 × 10⁵ 2.5 × 10⁵ 3 × 10⁵
100 1.2 × 10⁻⁴ 1 × 10⁶ 1.5 × 10⁶ 1 × 10⁶
50 6.2 × 10⁻⁵ 2 × 10⁶ 2 × 10⁶ 2 × 10⁶
50 3.4 × 10⁻⁴ 7 × 10⁴ 7 × 10⁴ 7 × 10⁴
STALLOGRAPHY REPORTS Vol. 50 Suppl. 1 2005

GROWTH OF NONSTOICHIOMETRIC PbTe CRYSTALS S129
CONCLUSIONS
The use of axial vibrations of the solid immersedinto a melt as a tool for controlling the heat and masstransfer in the melt during the crystal growth by theBridgman method gives grounds to suggest that, undercertain conditions, the physicochemical parameters ofthe crystallization process approach the equilibriumvalues. This circumstance allowed us to determine forthe first time the composition of congruently meltinglead telluride: (2.8 ± 0.3) × 10–4 mol excess Te/molPbTe.
The introduction of axial vibrations into a meltmakes it possible to obtain a uniform nonstoichiometryover the length of a growing crystal.
The structural quality of the lead telluride crystalsobtained by the Bridgman method depends much morestrongly on the nonstoichiometry of the initial chargethan on the processes of heat and mass transfer in themelt.
REFERENCES
1. A. S. Senchenkov, I. V. Barmin, A. S. Tomson, andV. V. Krapukhin, J. Cryst. Growth 197, 552 (1999).
2. G. N. Kozhemyakin, Ultrasonics 35, 559 (1998).3. P. Dold and K. W. Benz, Cryst. Res. Technol. 32, 51
(1997).4. Y. C. Lu, J. J. Shiau, R. S. Feigelson, and R. K. Route,
J. Cryst. Growth 102, 807 (1990).5. D. V. Lubimov, T. P. Lubimova, S. Meradji, and B. Roux,
J. Cryst. Growth 180, 648 (1997).6. A. I. Fedoseyev and J. I. D. Alexander, J. Cryst. Growth
211, 34 (2000).7. A. I. Fedyushkin, T. G. Burago, E. V. Zharikov, and
V. I. Polezhaev, in Proceedings of the 7th All-RussiaSymposium “Mechanics of Zero Gravity,” Moscow, Rus-sia, 2000 (Moscow, 2000), p. 365.
8. A. Yu. Zinov’ev, A. Yu. Mel’kov, A. Kh. Avetisov, andE. V. Zharikov, in Proceedings of the 10th National Con-
CRYSTALLOGRAPHY REPORTS Vol. 50 Suppl. 1 20
ference on Crystals Growth “NKRK-2002,” Moscow,Russia, 2000 (Moscow, 2000), p. 376.
9. I. Kh. Avetisov, E. V. Zharikov, A. Yu. Zinov’ev, andA. Yu. Mel’kov, Prib. Tekh. Éksp. 4, 146 (2004).
10. Y. Wang, L. L. Regel, and W. R. Wilcox, J. Cryst. Growth260, 590 (2004).
11. R. S. Feigelson and E. V. Zhrikov, Techn. ReportNo. NAG-1457-06 (2001).
12. A. V. Novoselova and V. P. Zlomanov, Curr. Top. Mater.Sci. 7, 643 (1981).
13. V. Fano, Prog. Cryst. Growth Charact. 3, 287 (1981).14. www.lcard.ru.15. I. Kh. Avetisov, Ya. L. Kharif, and P. V. Kovtunenko, Izv.
Akad. Nauk SSSR, Neorg. Mater., No. 22, 410 (1986).16. Ya. L. Kharif, in Metods for Study of Deviations from
Stoichiometry in Chemical Compounds, Ed. by P. V. Kov-tunenko (Mosk. Khim. Tekh. Inst. Mendeleeva, Moscow,1988), p. 64 [in Russian].
17. I. Kh. Avetisov, Ya. L. Kharif, and P. V. Kovtunenko, Éle-ktron. Tekh., Ser. Mater. 2, 72 (1984).
18. Z. Holtzbecher, L. Divis, M. Kral, L. Sucha, andF. Vlacil, Organic Reagents in Inorganic Analysis(SNTL-Nakladatelstvi Technicke, Prague, 1975; Mir,Moscow, 1979).
19. E. V. Kuchis, Methods for Studying the Hall Effect (Sov.Radio, Moscow, 1974) [in Russian].
20. D. G. Coats and W. D. Lawson, Sr., J. Electrochem. Soc.108, 1038 (1961).
21. V. P. Zlomanov and A. V. Novoselova, P–T–x Phase Dia-grams of Metal–Chalkogen Systems (Nauka, Moscow,1987) [in Russian].
22. I. Kh. Avetisov, T. V. Zaœchuk, and Ya. L. Kharif, Izv.Akad. Nauk SSSR, Neorg. Mater., No. 25, 567 (1989).
23. I. Kh. Avetisov, A. A. Chigrai, A. Z. Myaldun, et al., inProceedings of the 3rd International Conference “SingleCrystal Growth, Strength Problem, and Heat MassTransfer,” Obninsk, Russia, 1999 (Obninsk, 1999),p. 246.
Translated by Yu. Sin’kov
05

Crystallography Reports, Vol. 50, Suppl. 1, 2005, pp. S130–S135.Original Russian Text Copyright © 2005 by Azhazha, Ladygin, Sverdlov, Zhemanyuk, Klochikhin.
CRYSTALGROWTH
Morphological Transition in the Cellular Structure of Single Crystals of Nickel–Tungsten Alloys near the Congruent
Melting PointV. M. Azhazha*, A. N. Ladygin*, V. Ja. Sverdlov*, P. D. Zhemanyuk**, and V. V. Klochikhin**
* Kharkov Institute of Physics and Technology, National Scientific Center, ul. Akademicheskaya 1, Kharkov, 61108 Ukraine
e-mail: [email protected]** PJSC Motor-Sich, ul. Vos’mogo Marta 15, Zaporozhye, 69068 Ukraine
Received February 3, 2005
Abstract—The structure and microhardness of single crystals of nickel–tungsten alloys containing 25–36 wt % W are investigated. The temperature gradient at the crystallization front and the velocity of the crys-tallization front are the variable parameters of directional crystallization. It is found that, when the velocity ofthe crystallization front is 4 mm/min, the morphology of the cellular structure of the single crystals grown fromnickel–tungsten alloys changes from square cells to hexagonal cells at a tungsten content of greater than orequal to 31 wt %. As the velocity of the crystallization front increases to 10 mm/min, no morphological transi-tion occurs. It is shown that impurities play an important role in the formation of a cellular structure with cellsof different types. © 2005 Pleiades Publishing, Inc.
INTRODUCTION
Alloys in the nickel–tungsten system possess anumber of specific features [1] that are important fromboth scientific and practical standpoints. Vekilov et al.[2] revealed that the thermodynamic properties ofnickel–tungsten alloys containing approximately35 wt % W exhibit an anomalous behavior due to theelectronic topological transition occurring in a narrowconcentration range. Nickel–tungsten alloys of theabove composition are of great practical importance,because it is these alloys that can be successfully usedas seeds for the growth of single-crystal blades of gas-turbine engines.
In this respect, it is of interest to investigate thegrowth of single crystals of nickel–tungsten alloys witha tungsten concentration in the vicinity of the congruentmelting point [3].
It is known that the effect exerted by the chemicalcomposition on the morphological stability of the crys-tallization front during growth of a single crystal isenhanced in the vicinity of the congruent melting point[4]. Moreover, soluble impurities also substantiallyaffect the growth of the single crystal [5]. The quantita-tive conditions under which the planar crystallizationfront loses morphological stability and the crystalundergoes a transition to a cellular structure can bedescribed by the Tiller–Jackson–Rutter–Chalmers cri-terion based on the theory of constitutional supercool-ing. According to Zasimchuk [5], the impurity concen-tration at which the planar crystallization front loses ofstability lies over a rather wide range from several thou-
1063-7745/05/5001-S $26.000130
sandths of an atomic percent to several atomic percentdepending on the temperature and kinetic conditions ofcrystallization and on the impurity type.
There exists a principle of optimum doping of metalsingle crystals according to which the optimum contentof soluble dopants or the optimum temperature andkinetic conditions of directional crystallization can bechosen in such a way as to provide the formation of awell-developed structure composed of regularly shapedlarge-amplitude equiaxial cells (usually, hexagonal inthe cross section of the crystal) with a high degree ofstructural perfection. Therefore, it is particularlyimportant to control the content of impurities in alloysused for growing single crystals.
The purpose of this work was to investigate the spe-cific features of the growth and the cellular substructureof single crystals of nickel–tungsten alloys containing25–36 wt % W.
SAMPLE PREPARATION AND EXPERIMENTAL TECHNIQUE
Single crystals were grown from nickel–tungstenalloys NV-4 (TU 1-92-112-87) of two different batches(hereafter, these alloys will be referred to as alloy 1 andalloy 2). The compositions of these alloys are given inTable 1. In order to prepare alloys with a decreasedtungsten content, the initial material (alloy 2) wasmelted with electrolytic nickel via vacuum-inductionmelting under vacuum at a residual pressure of~10−4 mmHg, followed by crystallization in a steel
© 2005 Pleiades Publishing, Inc.

MORPHOLOGICAL TRANSITION IN THE CELLULAR STRUCTURE S131
Table 1. Results of the chemical analysis of nickel–tungsten alloys at different tungsten contents
Alloy Nickel Tungsten,wt %
Impurities, wt % (no higher)
Fe Si S P
1 Basis metal 33.6 0.1 0.2 0.002 0.005
2 Basis metal 35.7 0.4 0.2 0.004 0.01
3 Basis metal 32.2 0.1 0.13 0.002 0.002
4 Basis metal 31.0 0.15 0.08 0.002 0.003
5 Basis metal 27.8 0.15 0.07 0.002 0.003
6 Basis metal 25.7 0.15 0.07 0.002 0.004
NV-4 (TU 1-92-112-87) Basis metal 32–36 ≤1.0 ≤0.4 ≤0.015 ≤0.015
mold. The compositions of the alloys thus preparedwere controlled using chemical analysis (Table 1).
The elemental composition of the alloys was deter-mined by laser mass spectrometry with photographicrecording. The measurements were performed on anÉMAL-2 high-resolution laser mass spectrometer withMattauch–Herzog double focusing and an IFO-451recording microphotometer. The results of analyzingthe elemental compositions of the alloys are presentedin Table 2.
The single crystals were grown in a molding boxfabricated from synthetic corundum. The molding boxwas preliminarily filled with a liquid melt and was thenmoved in a temperature field of the heater from the hotzone to the crystallizer. The velocity R of the crystalli-zation front was changed stepwise from 0.4 to10.0 mm/min. The temperature gradient G at the crys-tallization front was approximately 20 K/mm. After thedirectional crystallization, the ceramic box was brokenand the samples were withdrawn for further investiga-tions.
The single-crystal samples were prepared in theform of cylindrical rods 9 mm in diameter and~150 mm long. The transverse and longitudinal micro-sections for investigations were prepared by cutting thecylindrical rods with a vulcanite wheel. In order toreveal the microstructure, the surface of the microsec-tions was treated in a mixture of water with hydrofluo-ric and nitric acids (in a ratio of 2 : 1 : 1) for ~30–40 min at room temperature. The microstructure of thesamples was examined under a Neophot-32 opticalmicroscope. The crystallographic orientation and thedegree of perfection of the single crystals were deter-mined using X-ray diffraction analysis on a DRON-4diffractometer ( radiation). The microhardness ofthe samples was measured on transverse microsectionswith a PMT-3 instrument at a load of 50 g.
RESULTS AND DISCUSSION
Earlier [3], we investigated the formation of a cellu-lar structure of the nickel–tungsten alloy under differ-ent crystallization conditions as a function of the tem-
CuKα
CRYSTALLOGRAPHY REPORTS Vol. 50 Suppl. 1 20
perature gradient G and the velocity of the front ofdirectional crystallization R. Alloy 1 was used as theinitial material for growing single crystals. The opti-mum structure of the single crystals was observed at avelocity of crystallization front R = 4 mm/min. In thiscase, the single crystals have a cellular structure withsquare cells in the plane perpendicular to the growthdirection (Fig. 1a). Under these crystallization condi-tions, the cells formed in the axial region enriched withtungsten exhibit dendritic features in the form of a Mal-tese cross. According to [5], the optimum cellular struc-ture of the single crystal corresponds to a maximumamplitude of cellular asperities H/λ, where H is theheight of cellular asperities and λ is the cell parameter.To put it differently, the optimum cellular structure isformed at the cell parameters corresponding to thechangeover from the cellular growth to the dendriticgrowth.
Further investigations were carried out with nickel–tungsten single crystals grown from alloy 2. It wasrevealed that the cellular structures of the single crys-tals with different chemical compositions (Tables 1, 2)differ significantly. At the same temperature and kineticconditions, the cellular structure of the single crystalsgrown from alloy 2 contains hexagonal rather thansquare cells (Fig. 1b). Furthermore, the single crystalsgrown from alloy 2 exhibit a number of specific fea-tures, which, for convenience of comparison, are sum-marized in Table 3.
The difference in the morphology of the cells inalloys 1 and 2 is associated with the difference in theirchemical compositions. As can be seen from Table 1,the content of the second main component (tungsten) is33.6 wt % in alloy 1 and 35.7 wt % in alloy 2. At thesetungsten contents, the compositions of the alloys corre-spond to the ascending liquidus curve, because, accord-ing to the refined data [6], the congruent melting pointis observed at a tungsten content of 36.8 wt %. Hence,the specific features that were previously revealed inthe properties of disordered nickel–tungsten alloys at atungsten content in the range 36.2–36.8 wt % andwhich were explained by the electronic topologicaltransition [2] could not be exhibited in the case of alloys
05

S132
AZHAZHA
et al
.
Table 2. Elemental compositions of the NV-4 alloys
Element
AlloysRemelted
alloy 2
Distribution coeffi-cient of impurities
in nickel [11]1 2 3 4 5 6
C 0.046 0.049 0.02 0.02 0.02 0.022 0.044 0.20
N 0.00067 0.00045 0.00024 0.00016 0.00012 0.00024 0.00047
O 0.0031 0.00094 0.002 0.0012 0.00086 0.00052 0.0023
Al 0.022 0.0001 0.025 0.00004 0.000095 0.00011 0.0003 0.87
Si 0.021 0.02 0.0002 0.0009 0.00038 0.00036 0.029 0.61
P 0.00018 0.00023 0.000095 0.00011 0.000082 0.000095 0.0012 0.02
S 0.0013 0.0014 0.0012 0.0016 0.0013 0.0013 0.0013 <0.01
K 0.00005 <0.00001 0.00011 0.00012 0.000075 0.000075 <0.00001
Ca <0.00001 <0.00001 0.00028 0.00028 0.00025 0.00023 <0.00001 <0.1
Ti 0.044 0.0003 0.0001 0.032 0.0012 0.00095 0.0001 0.65
V 0.0028 0.00018 0.00018 0.019 0.000125 0.000095 0.00015 0.84
Cr 0.26 0.017 0.015 0.1 0.012 0.015 0.02 0.86
Mn 0.0005 0.00072 0.00045 0.00041 0.00042 0.00043 0.00032 <1
Fe 0.075 0.062 0.038 0.038 0.038 0.045 0.064 0.93
Ni Basis metal Basis metal Basis metal Basis metal Basis metal Basis metal Basis metal <1
Co 0.104 0.02 0.031 0.37 0.023 0.017 0.02 <1
Cu 0.0048 0.0034 0.0048 0.0034 0.0029 0.0029 0.0027 0.81
Mo 0.059 0.0057 0.017 0.085 0.0091 0.0067 0.023 0.89
Nb 0.011 0.0045 0.005 0.085 0.0091 0.00022 0.005 0.86
W ~32.0 ~38.0 ~32.5 ~31.0 ~27.8 ~25.7 ~38.0 1.66
F 0.00002 0.000027 0.000018 0.0002
Cl <0.00001 <0.00001 <0.00001 <0.00001
Br <0.00008 <0.00008 <0.00008 <0.00008
k0Ni
1 and 2. Therefore, the difference in the shape of thecells is caused by the different concentrations of theimpurities.
The cell parameters λ for the single crystals grownfrom alloy 2 are considerably smaller than those deter-mined for alloy 1 in our earlier work [3]. According tothe Brody–Flemings model of growth of cells [7], theparameter λ and the growth conditions at the crystalli-zation front are related by the expression
(1)
Here, ∆T is the difference between the liquidus temper-atures for a particular difference between the concen-trations of the dopant, mL is the slope of the liquiduscurve, ∆cmax is the maximum difference between thedopant concentrations in the melt within the cell, G isthe temperature gradient in the melt at the crystalliza-tion front, and DL is the diffusion coefficient of thedopant in the melt. It can be seen from relationship (1)that the presence of dopants (especially, with a high dif-fusion mobility) in the melt leads to an increase in the
∆T mL∆cmaxGRλ2
2DL
--------------.= =
CRY
size of the cells. In our case, as follows from the analy-sis of the elemental composition (Table 2), the contentof impurities in alloy 1 is considerably higher than thatin alloy 2 (in particular, the content of Cu, Nb, O, K,Co, Mo, Ti, V, Cr, or Al in alloy 1 can be higher thanthat in alloy 2 by a factor of 1.5 to 200). Most likely, thisis the main reason why the size of the cells in alloy 1 isapproximately 1.5 times greater than the size of thecells in alloy 2 over the entire range of crystallizationfront velocities (Table 3).
In order to confirm the inference that the impuritieshave a decisive effect on the morphology of the cellularstructure, we grew single crystals from alloy 2 remeltedin a ceramic molding box. After the remelting, the con-tents of O, Al, Si, P, and Mo impurities increased by afactor of approximately 3, 3, 1.5, 5, and 4, respectively(Table 2). As a result, the single crystal grown from thisalloy at the velocity of crystallization front R =4 mm/min had a cellular structure with square cells andthe cell parameter λ = 214 µm.
The effect exerted by dissolved impurities on themorphology of the cells in nickel–tungsten single crys-
STALLOGRAPHY REPORTS Vol. 50 Suppl. 1 2005

MORPHOLOGICAL TRANSITION IN THE CELLULAR STRUCTURE S133
(‡) (b)500 µm 200 µm
Fig. 1. Transverse microsections of the NV-4 alloy single crystals with different chemical compositions (a) Ni–33.6 wt % W and(b) Ni–35.7 wt % W at the velocity of the crystallization front R = 4 mm/min.
(‡) (b)100 µm 100 µm
Fig. 2. Transverse microsections of the NV-4 alloy single crystals with decreased tungsten concentrations (a) Ni–32.2 wt % W and(b) Ni–27.8 wt % W at the velocity of the crystallization front R = 4 mm/min.
tals can be adequately described within the model ofconstitutional supercooling [8, 9]. According to thismodel, the planar front of directional crystallization ata constant temperature gradient G can lose its stabilitydue to an increase both in the velocity of the crystalli-zation front R and in the concentration of dissolvedimpurities. The evolution in the morphology of the cel-lular structure of the nickel–tungsten single crystals ofalloys 1 and 2 with increasing velocity of crystalliza-tion front R is schematically illustrated in Table 4.
Thus, the results obtained indicate that the chemicalcomposition of alloy 2 is inconsistent with the principle
CRYSTALLOGRAPHY REPORTS Vol. 50 Suppl. 1 2
of optimum doping. This leads to unstable growth ofsingle crystals and to the formation of a large numberof structural defects. The problem can be solved byincreasing the velocity of the front of directional crys-tallization [10]. However, such an increase gives rise tonew problems associated with the ratio between theaxial and radial components of the temperature gradi-ent. In particular, this can result in a distortion of theshape of the macroscopic crystallization front.
The quality of the nickel–tungsten alloy single crys-tals can also be improved by decreasing the tungstencontent. As follows from [11], the Ni–28 wt % W alloy
005

S134
AZHAZHA
et al
.
is technologically optimum for both the growth of sin-gle crystals and their subsequent use as seed crystals.For this reason, we prepared alloys with a decreasedtungsten content (32.2–25.7 wt %). Alloy 2 was used asthe initial material. Metallographic analysis of themicrostructure of the single crystals grown at the veloc-ity of crystallization front R = 4 mm/min revealed thata decrease in the tungsten content to 31.0 wt % leads to
26c, wt %
Hµ, kg/mm2
210
205200
28 30 32 34 3624
215220
225
230
235
240
245
250
255
Fig. 3. Dependences of the microhardness on the tungstenconcentration c in the nickel–tungsten single crystals in theupper (j) and lower (d) regions of the sample.
CRY
a morphological transition in the cellular structure fromhexagonal cells to square cells. Figure 2 shows typicalcellular structures of the single crystals at tungsten con-tents of 32.2 wt % (alloy 3) and 27.8 wt % (alloy 5),which were grown at the velocity of crystallizationfront R = 4 mm/min.
The measured dependence of the microhardness Hµof the single crystals on the tungsten concentration cor-relates with the morphological transition in the cellularstructure (Fig. 3). The microhardness measured in theupper regions of the single crystals containing 31 wt %W is higher than that observed in the lower regions.Most likely, this difference is associated with the phaseseparation caused by the increase in the temperaturerange of crystallization.
In conclusion, it should be noted that the degree ofstructural perfection of the single crystals with adecreased tungsten content (25.7–31.0 wt %) is higherthan the degree of structural perfection of the singlecrystals grown from alloy 2 (with a tungsten content of35.7 wt %) but lower than that of the single crystalsgrown from alloy 1. This indicates that impurities playan important role in the stabilization of the cellulargrowth of nickel–tungsten alloy single crystals. In ouropinion, the special role in this case is played by chro-mium impurities, because tungsten and chromiumbelong to the same group of the periodic table and theirchemical interaction with nickel should exhibit similarfeatures. Since the atomic weight of chromium is con-siderably lower and the diffusion mobility of chromiumatoms is higher than those of tungsten atoms, the
Table 3. Specific features of the cellular microstructures of single crystals grown from alloys 1 and 2 at velocities of crystalli-zation front R = 1.2–10 mm/min
Characteristic of the cellular microstructure Alloy 1 Alloy 2
Cell shape Square Hexagonal
Cell parameter λ, µm 294–186 204–140
Cell boundaries Not revealed Clearly pronounced cell boundaries in the form of continuous stripes
Ordering of the cell arrangement in the plane perpendicular to the growth direction
Cells are arranged in ribbons aligned parallel to the [100] direction
Cells, as a rule, are arranged in a ran-dom manner
Stability of crystal growth High Low
Structural perfection High degree of structural perfection Large number of blocks with a mis-orientation angle of 1°–2°
Table 4. Morphology of cells in Ni–W alloys of different chemical compositions as a function of the velocity of the front ofdirectional crystallization
Initial material Velocity of the front of directional crystallization R, mm/min
Alloy 1 0.4 0.8 1.2 2.6 4.0 10
Alloy 2 1.2 4 8 10 15
Morphology of cells
STALLOGRAPHY REPORTS Vol. 50 Suppl. 1 2005

MORPHOLOGICAL TRANSITION IN THE CELLULAR STRUCTURE S135
former atoms can favor stable growth of nickel–tung-sten alloy single crystals with a high degree of struc-tural perfection.
REFERENCES1. I. K. Zasimchuk, Metallofiz. Noveœshie Tekhnol. 3, 103
(2000).2. Yu. Kh. Vekilov, A. V. Ruban, and S. I. Simak, Fiz.
Tverd. Tela (St. Petersburg) 35 (10), 2750 (1993) [Phys.Solid State 35 (10), 1361 (1993)].
3. V. M. Azhazha, Yu. V. Gorbenko, G. P. Kovtun, et al.,Kristallografiya 49 (2), 382 (2004) [Crystallogr. Rep. 49(2), 307 (2004)].
4. R. A. Swalin, Thermodynamics of Solids (Wiley, NewYork, 1962; Metallurgiya, Moscow, 1968).
5. I. K. Zasimchuk, Metallofiz. Noveœshie Tekhnol. 23 (3),293 (2001).
CRYSTALLOGRAPHY REPORTS Vol. 50 Suppl. 1 2
6. O. M. Barabash and V. Z. Voœnash, Metallofiz. NoveœshieTekhnol. 22 (2), 94 (2000).
7. R. E. Shalin, I. L. Svetlov, E. B. Kachanov, et al., SingleCrystals of Nickel Heat-Resistant Alloys (Mashinostroe-nie, Moscow, 1997) [in Russian].
8. M. Flemings, Solidification Processing (McGraw-Hill,New York, 1974; Mir, Moscow, 1977).
9. I. K. Zasimchuk, Vysokochist. Veshchestva, No. 3, 159(1991).
10. V. N. Toloraiya, N. G. Orekhov, E. N. Kablov, et al.,Metalloved. Term. Obrab. Met., No. 7, 11 (2002).
11. Crystallization from Melt: A Handbook, Ed. by K. Khaœnand É. Burig (Metallurgiya, Moscow, 1987) [in Rus-sian].
Translated by O. Borovik-Romanova
005

Crystallography Reports, Vol. 50, Suppl. 1, 2005, pp. S136–S140.Original Russian Text Copyright © 2005 by Akimov, Savchuk.
CRYSTALGROWTH
Synthesis and Physical Properties of Ag5Pb2O6 CompoundA. I. Akimov and G. K. Savchuk
Institute of Solid State Physics and Semiconductors, National Academy of Sciences of Belarus, ul. Brovki 17, Minsk, 22072 Belarus
e-mail: [email protected] February 8, 2005
Abstract—A simple method for the synthesis of the Ag5Pb2O6 compound in argon atmosphere is suggested.The optimum conditions for the synthesis of the stoichiometric Ag5Pb2O6 compound are determined on thebasis of thermogravimetric and DTA data. It is shown that the introduction of strontium ions during synthesisdoes not considerably change the lattice parameters, crystal structure, electrophysical properties, or thermal sta-bility of the compound. © 2005 Pleiades Publishing, Inc.
INTRODUCTION
The Ag5Pb2O6 phase has usually been achieved bytwo methods: (4–7)-day synthesis under high oxygenpressure (up to 10 MPa) at temperatures ranging within350–550°C and (3–12)-day hydrothermal synthesis at250–350°C [1–3]. The use of highly pressured oxygenand hydrothermal synthesis requires the use of expen-sive equipment and considerable energy consumptionbecause of the long duration of the experiment. A newmethod for the synthesis of pure Ag5Pb2O6 phase invacuum with the use of carbon, which play the part of areducing agent during synthesis was reported in [4].The crystal structure of Ag5Pb2O6 was studied else-where [2]. It was shown that the phase is described bythe sp. gr. P31m and has the unit-cell parameters a =5.939(3) Å and c = 6.428 Å. Somewhat different data
were indicated in [3, 5]: sp. gr. P 1m, but the unit-cellparameters were slightly different: a = 5.9324(3) Å andc = 6.4105(3) Å. The physical properties of the com-pound were studied in [1, 5]. As far as we know,Ag5Pb2O6 has never been synthesized in air atmo-sphere. The present study describes the synthesis con-ditions of this compound in air atmosphere and mea-surements of its physical properties.
EXPERIMENTAL
We suggest, for the first time, a cheap method for thesynthesis of the Ag5Pb2O6 phase in air atmospherewithout the use of any specialized equipment. TheAg5Pb2O6 compound was synthesized at the Labora-tory of Electronic Ceramics at the Institute of SolidState Physics and Semiconductors of the NationalAcademy of Sciences of Belarus by the method ofsolid-phase reactions. The (22–48)-h synthesis was per-formed with the use of SrO or SrCO3 (0.02–0.50 wt %)at temperatures ranging from 310 to 400°C. Prior tosynthesis, the starting powders were thoroughly mixed
3
1063-7745/05/5001-S $26.000136
in isopropyl alcohol and were pressed into disklike tab-lets 18 mm in diameter and 3 mm in height.
The evaluation of the average grain size, the study ofthe microstructure of the sample fracture, and the deter-mination of the elemental composition (EDX analysis)of the experimental samples were performed with theaid of a LEO electron microscope (Germany). Differen-tial thermal analysis (DTA) of the experimental sam-ples was performed with the use of a Setaram TGA92thermal analyzer (France). The temperature depen-dence of electrical conductivity was measured by afour-probe method using ac current on the samples inthe shape of parallelepipeds.
The lattice parameters of the Ag5Pb2O6 phase syn-thesized with the use of SrO microadditions wererefined by the Rietveld method [6].
RESULTS AND DISCUSSION
It is well known [7] that strontium ions change thecharacter of atomic interactions in the PbO–CO2 sys-tem. Therefore, it was reasonable to expect that thesame process would also be possible in the PbO2–Ag2Oand PbCO3–Ag2O systems.
We prepared the compounds with the compositionscontaining superstoichiometric amounts of SrO orSrCO3 (0.02–0.50 wt %). The starting components forthe synthesis of Ag5Pb2O6 were PbCO3 and Ag2O andalso PbO2 and Ag2O. The synthesis conditions and theexperimental results are indicated in Table 1.
Analysis of the experimental data listed in Table 1shows that the PbCO3, Ag2O, and SrO starting materialsin the proportion 2 : 2.5 : 0.02 allowed us to synthesizethe Ag5Pb2O6 – x phase for 48 h at 380°C. The use of thePbO2, Ag2O, and SrO in the same proportion resulted ina 22-h synthesis of the Ag5Pb2O6 compounds at thetemperature 310°C. In the first case, the synthesis of theAg5Pb2O6 – x phase proceeded by the scheme
2PbCO3 + 2.5Ag2O + 0.02SrO
© 2005 Pleiades Publishing, Inc.

SYNTHESIS AND PHYSICAL PROPERTIES S137
Table 1. Conditions of Ag5Pb2O6 synthesis in air with the use of SrO and SrCO3 microadditives
Starting materials Synthesistemperature, °C
Synthesisduration, h Composition of phases synthesized
PbCO3, Ag2O, SrCO3 380 24 90% Ag5Pb2O6 – x, Pb2CO4, Pb7C4O15, Pb0.57O
PbCO3, Ag2O, SrCO3 400 24 10% Ag5Pb2O6 – x, Ag, Pb3O4, PbO
PbCO3, Ag2O, SrO 380 24 90% Ag5Pb2O6 – x, Pb2CO4, Pb7C4O15
PbCO3, Ag2O, SrO 380 48 Ag5Pb2O6 – x
PbCO3, Ag2O, SrO 360 48 80% Ag5Pb2O6 – x, Pb3O4, Ag2O
PbO2, Ag2O, SrCO3 350 48 70% Ag5Pb2O6 – x, Pb2CO4, Pb7C4O15
PbO2, Ag2O, SrCO3 330 24 80% Ag5Pb2O6 – x, Pb2CO4, Pb7C4O15
PbO2, Ag2O, SrO 350 48 50% Ag5Pb2O6 – x, Pb2O3, Ag
PbO2, Ag2O, SrO 320 48 90% Ag5Pb2O6 – x, Pb2O3, Ag
PbO2, Ag2O, SrO 310 22 Ag5Pb2O6
Ag5Pb2O6 – x + 0.02Sr + 2CO2↑
and, therefore, the compound thus synthesized hassome “oxygen defects.” Elemental analysis showed thatthe Ag5Pb2O6 – x compound obeys the ratio Ag : Pb : O =5 : 2.5 : 4.6, which confirms that the structure of thecompound synthesized contains some oxygen defects.
In the second case, synthesis proceeded by the reac-tion
2PbO2 + 2.5Ag2O + 0.02SrO
Ag5Pb2O6 + 0.02Sr + 0.27O2↑ .
CRYSTALLOGRAPHY REPORTS Vol. 50 Suppl. 1 2
The Ag5Pb2O6 compound thus synthesized has nooxygen defects.
The experimental samples for studying physicalproperties and temperature stability of the Ag5Pb2O6compound were synthesized according to the secondscheme.
Figure 1 shows the diffraction pattern from theAg5Pb2O6 compound synthesized with microadditionsof strontium oxide under the above optimum condi-tions.
The experimental results indicated in Table 1 showthat the introduction into the starting mixture of super-stoichiometric strontium ions (0.02–0.50 wt %)
0
30 40 50 60 702θ, deg
10
20
30
40
50
60
I, arb. units
Fig. 1. X-ray pattern from Ag5Pb2O6 sample.
005

S138 AKIMOV, SAVCHUK
changes the free energy of the system, the rate of theproceeding reactions increases, and the Ag5Pb2O6 com-pound is formed at a lower temperature. An increase inthe Sr concentration above 0.5 wt % decelerates the rate
2 µm
1 µm
(a)
(b)
Fig. 2. Microstructure of the fracture of the Ag5Pb2O6 sam-ple at two magnifications: (a) 10000 and (b) 50000.
CRY
of the component interaction and the phase is formed ata higher temperature.
The granulated microstructure of the fracture of theAg5Pb2O6 sample (Fig. 2) consists of fine grains (0.5–1.0 µm). The distributions of Ag, Pb, and O over thegrain and the sample are inhomogeneous.
To analyze the effect of strontium ions on the struc-tural parameters of the experimental Ag5Pb2O6-basedsamples, we refined these parameters by the Rietveldmethod and compared the results obtained with the
known data within the sp. gr. P 1m. The refinedparameters of the crystal structure are listed in Tables 2and 3.
Our studies show that it is most probable that stron-tium ions in the unit-cell play the role of interstitialdefects, since the unit-cell parameters and volumechange only slightly. We failed to determine the distri-bution of strontium ion over the grain by X-raymicroanalysis because the amounts of the introducedadditions were too small.
Analysis of the results of the structural studies(Tables 2 and 3) shows that SrO microadditions in thesynthesis of the Ag5Pb2O6 compound slightly increasesome interatomic distances (Ag(2)–Ag(2), Pb–O, andAg(1)–Ag(1)) and slightly decrease some other dis-tances (Pb–Pb, Ag(1)–O, and Ag(2)–O). The introduc-tion of 0.02 wt % of SrO results in a 0.01% increase inthe Ag(2)–Ag(2) distances, a 0.04% increase in the Pb–O distances, and a 0.29% increase in the Ag(1)–Ag(1)distances. The introduction of 0.5 wt % of SrO resultsin a 0.04% increase in the Ag(2)–Ag(2) distances, a0.11% increase in the Pb–O distances, and a 1.54%increase in the Ag(1)–Ag(1) distances.
Thus, the introduction of a small amount of stron-tium ions during the synthesis of the Ag5Pb2O6 phasedoes not noticeably change the structural parameters ofthe experimental samples based on this compound.
3
Table 2. Refined structural parameters of the Ag5Pb2O6 phase synthesized in air with the use of strontium oxide microadditive
Ag5Pb2O6 (0.02% SrO) Ag5Pb2O6 (0.5% SrO)
atom coordinates atom coordinates
Ag 0 0 0.242 Ag 0 0 0.245
Ag 0.5 0 0 Ag 0.5 0 0
Pb 0.667 0.33 0.5 Pb 0.667 0.33 0.5
O 0.6224 0 0.6890 O 0.6226 0 0.6892
Unit-cell parameters a = 5.933 Å Unit-cell parameters a = 5.935 Å
c = 6.4106 Å c = 6.411 Å
Unit-cell volume 195.424 Å3 Unit-cell volume 195.568 Å3
R 5.5% R 5.5%
STALLOGRAPHY REPORTS Vol. 50 Suppl. 1 2005

SYNTHESIS AND PHYSICAL PROPERTIES S139
Therefore, it is reasonable to assume that the presenceof strontium ions would not considerably affect thephysical properties or the temperature stability of thesesamples. This assumption is confirmed by the experi-mental results of the temperature studies of resistivityof the Ag5Pb2O6 samples (Fig. 3).
The shape of the curve in Fig. 3 shows that theAg5Pb2O6 samples possess metal-type conductivity.The sample resistivity at room temperature is (0.33–0.37) mΩ cm, which agrees (by the order of magnitude)with the results obtained in [1, 5] and indicates thatstrontium ions in Ag5Pb2O6 do not change the electro-physical properties of the compound.
Table 3. Main interatomic distances in the Ag5Pb2O6 struc-ture at different strontium oxide contents
Interatomicdistances, Å
SrO additive, wt %
0.0 [4] 0.02 0.5
Ag(1)–Ag(1) 3.0937(3) 3.1027(3) 3.1414(2)
Ag(1)–O × 3 2.2855(6) 2.2836(5) 2.2792(6)
Ag(2)–Ag(2) × 4 2.9662(4) 2.9665(3) 2.9675(3)
Ag(2)–O × 3 2.1220(3) 2.1218(0) 2.1212(3)
Pb–Pb × 3 3.4320(4) 3.4220(2) 3.4240(1)
Pb–O × 6 2.2169(9) 2.2178(2) 2.2194(8)
0.2
100 200 300T, K
0.3
0.4
ρ, mΩ cm
Fig. 3. Temperature dependence of Ag5Pb2O6 resistivity.
CRYSTALLOGRAPHY REPORTS Vol. 50 Suppl. 1 20
The decomposition of Ag5Pb2O6 synthesized withthe addition of strontium oxide was studied by DTA inthe temperature range 20–600°C (Fig. 4).
DTA and thermogravimetric studies of the sampledecomposition were performed at the heating rate 1, 5,and 10 K/min. Curve 1 in Fig. 4 shows the temperaturedependence of the thermal flux and the weight loss atthe heating rate 1 K/min. Curve 2 shows the analogousdependence at the heating rate 10 K/min. The weightloss is determined as
3Ag5PbO6 15Ag + 2Pb3O4 + 5O2,
2Pb3O4 6PbO + O2.
The decomposition temperature of the compounddepends on the heating rate at both the first and secondstages of the process (Table 4). The content of stron-tium oxide in the samples does not influence thedecomposition character and temperature. With anincrease in the decomposition temperature at the firststage from 1 to 5 K/min, the decomposition tempera-ture shifts by 30 K, whereas at the second stage, thisshift is only about 20 K. The change of the heating ratefrom 5 to 10 K/min makes the shift of the decomposi-tion temperature at both stages practically the same,~10 K. The thermal effects obtained in DTA allowed usto calculate the enthalpy of the compound decomposi-tion at each stage (Table 4). It is seen that the enthalpyH of the decomposition is considerably dependent onthe heating rate only at the first stage. At the secondstage and at the heating rates used, decomposition pro-ceeds with the evolution of approximately the sameamount of heat.
Comparative analysis of the data in [1, 8] shows thatthe decomposition of the Ag5Pb2O6 samples at the heat-ing rate 1 K/min proceeds at temperatures close to thoseindicated in [1, 8] (452 and 493°C). This indicates thatthe strontium ions introduced do not change the tem-perature mode or the character of the Ag5Pb2O6 decom-position.
Table 4. Temperatures and enthalpy of Ag5Pb2O6 decompo-sition at different heating rates
Stage of decompositionHeating rate
1 K/min 5 K/min 10 K/min
First stage
Decomposition temperature, °C
448 477 484
Enthalpy, kJ/mol –10.367 –7.612 –7.045
Second stage
Decomposition temperature, °C
536 556 566
Enthalpy, kJ/mol –13.113 –13.126 –14.145
05

S140 AKIMOV, SAVCHUK
425 450 475 500 525 550 575
T, °C
–10
–6
–2
0
–35
–30
–25
–20
–15
–10
–5
m, %
H, kJ/mol
1
2
(a)
1
2
(b)
Fig. 4. Temperature dependence of the (a) thermal flux H and (b) weight loss m during heating of the Ag5Pb2O6 sample at a rate of(1) 1 K/min and (2) 5 K/min.
CONCLUSIONS
The studies performed lead to the following conclu-sions.
A new simple and cheap method for the synthesis ofAg5Pb2O6 compounds is suggested and the optimumconditions for the 22-h-synthesis of the compound at310°C are determined.
It is established that the introduction of strontiumions during Ag5Pb2O6 synthesis does not produce anysignificant effect on its structural parameters or on theconditions of its thermal stability.
It is also shown that the resistivity of Ag5Pb2O6 sam-ples at room temperature ranges within 0.35–0.37 mΩcm. Conductivity of the compound is of the metal type.
ACKNOWLEDGMENTS
This study was supported by the Belorussian Foun-dation for Basic Research, project no. F01-157.
CRY
REFERENCES
1. M. Jansen, M. Borttz, and K. Heidebrecht, J. Less-Com-mon Met. 161, 17 (1990).
2. A. Bystrom and L. Evers, Acta Chem. Scand. 4, 613(1950).
3. M. Jansen and M. Bortz, J. Solid State Chem. 103, 447(1993).
4. D. Letian, S. Changjin, Z. Yuheng, and W. Haihu, Phys-ica A 399, 178 (2003).
5. M. Jansen, M. Bortz, and K. Heidebrecht, J. Cryst.Growth 241, 347 (2002).
6. H. M. Rietveld, J. Appl. Crystallogr. 2, 65 (1969).
7. K. Viyasaka and M. Senna, React. Solids 4, 151 (1987).
8. I. Kouta, Y. Hisanori, K. Shunishi, et al., Physica A 382,263 (2002).
Translated by L. Man
STALLOGRAPHY REPORTS Vol. 50 Suppl. 1 2005

Crystallography Reports, Vol. 50, Suppl. 1, 2005, pp. S141–S144.Original Russian Text Copyright © 2005 by Dubovik, Korshikova, Parkhomenko, Tolmachev.
CRYSTALGROWTH
Synthesis and Thermally Stimulated Luminescence of Polycrystalline Sr1 – xEuxB4O7
M. F. Dubovik, T. I. Korshikova, S. V. Parkhomenko, and A. V. TolmachevInstitute for Single Crystals, National Academy of Sciences of Ukraine, pr. Lenina 60, Kharkov, 61001 Ukraine
e-mail: [email protected] February 3, 2005
Abstract—Specific features of the solid-phase synthesis of Sr1 – xEuxB4O7 (x = 0–0.15) in air are studied. Thephoto- and thermally stimulated luminescence of Sr1 – xEuxB4O7 is investigated in the range of Eu content0.01 < x < 0.15. The main energy parameters of traps are determined. It is shown that the peak of thermallystimulated luminescence at T = 380 K can be related to the decomposition and radiative relaxation of the
[ , F+ center] pair. © 2005 Pleiades Publishing, Inc.EuSr2+3+
INTRODUCTION
Strontium tetraborate SrB4O7 (SBO) is known to be apromising nonlinear optical material [1]. The lumines-cence properties of activated SBO:(Eu, Tm, Cu, Ag, Bi,Yb) crystals were investigated in [2–8] and the migra-tion of the electron excitation energy in SBO:Eu crys-tals was analyzed in detail in [9]. It was shown in [10]that in the temperature range T = 300–670 K unacti-vated SBO crystals show thermally stimulated lumines-cence (TSL), whose intensity is comparable with thatof a TLD-700 solid-state dosimeter based onLiF(Mg,Ti). Introduction of rare-earth activators intoSBO may lead to the formation of new centers of lightsum storage, i.e., to an increase in the TSL yield. Thissituation was implemented in SBO:Dy and SBO:Eucompounds [11–13]; however, no data on the nature oftrapping centers in pure SBO and activated SBO:Euwere reported in the noted studies.
According to [13], the SrB4O7 and EuB4O7 com-pounds are isostructural. It is known that in SBO:Eusynthesized in air europium can be stabilized in thedivalent state [2, 3, 9]. However, the concentration limitat which single-phase solid solutions Sr1 – xEuxB4O7may exist during synthesis in air has not been deter-mined. In this work we investigated the synthesis con-ditions for Sr1 – xEuxB4O7 solid solutions, determinedthe concentration incorporation limit for Eu2+, and ana-lyzed the thermoluminescent properties of these solu-tions.
EXPERIMENTAL
Samples of Sr1 – xEuxB4O7 (x = 0–0.15) were synthe-sized by the solid-phase method at T = 700–900 K inair. Differential thermal analysis (DTA) was performedon a Q-1500D (MOM) derivatograph and X-ray pow-der analysis (XPA) was carried out on a Siemens D500
1063-7745/05/5001-S $26.000141
diffractometer using radiation. Optical measure-ments were performed on pelleted samples with athickness of 3 mm and a diameter of 10 mm preparedby the pressing of synthesized powders under a load of108 Pa. Before pressing, a powder weight was mixedwith a 3% aqueous solution of polyvinyl alcohol in aratio of 20 : 1 and carefully grinded. The pellet densitywas as high as 3.0 g/cm3 and the hardness was 4 g/cm3
at an average grain size of 1–2 µm. The photolumines-cence (PL) of Sr1 – xEuxB4O7 samples was investigatedon an SDL-2 (LOMO) automatic complex using axenon lamp as an excitation source. TSL curves wererecorded using an FÉU-79 photomultiplier on an exper-imental setup with a controlled heating rate (5 K/min).An X-ray tube with a copper anode (U = 160 kV, I =9 mA) was used as a radiation source.
RESULTS AND DISCUSSION
The SBO compound is crystallized into an orthor-hombic system with the lattice parameters a = 4.237 Å,b = 4.431 Å, and c = 1.0706 Å. A unit cell contains twoformula units: Z = 2 [14]. SBO has a specific crystalstructure formed by nonplanar six-membered rings ofanionic groups (B3O9)9– consisting of three-dimen-sional (BO4)3– groups (Fig. 1). In (BO4)3– groups, eachB atom is coordinated by four O atoms. The Sr atom inthis structure is coordinated by nine O atoms; the Sr–Odistance varies from 2.52 to 2.84 Å [14].
SBO was synthesized by the reaction
SrCO3 + 4H3BO3 SrB4O7 + 6H2O + CO2.
Figure 2 shows the DTA curves for the SBO samplesobtained in different temperature and time modes. DTAcurve 1 of the initial SBO mixture shows endothermicpeaks in the range T = 120–140°C, which correspond tothe dehydration of orthoboric acid. The diffuse exother-
CuKα
© 2005 Pleiades Publishing, Inc.

S142
DUBOVIK
et al
.
mic peak in the temperature range 300–400°C is likelyto be due to the phase transition in boron oxide. Thereaction of solid-phase interaction between the compo-nents, accompanied by the mass loss due to the thermaldecomposition of strontium carbonate, occurs in thetemperature range from 660 to 900°C. The endothermicpeak in the range 1005–1015°C corresponds to themelting point of SBO. We failed to fix the melt crystal-lization temperature of this system by the DTA methodowing to the tendency to strong supercooling and glassformation and the high melt viscosity.
The DTA heating curve of the sample subjected to aheat treatment at T = 700°C (Fig. 2, curve 2) shows asmall exothermic peak at 850°C and a dual melting
Sr B Ob
a 4
2
3
1 2
2.76
2.67
2.63
2.52
2.84
1
Fig. 1. Fragment of the SrB4O7 structure projected onto the(001) plane.
t, min140120100806040200
200
400
600
800
1000
T, °C
1
2
3
4T
Fig. 2. DTA curves: (1) raw mixture of powders, (2) SBOafter the heat treatment at T = 700°C for 5 h, (3) SBO afterthe heat treatment at T = 700°C for 5 h and T = 900°C for5 h, and (4) Sr1 – xEuxB4O7 (x = 0.01–0.05) after the heattreatment at T = 700°C for 5 h and T = 900°C for 5 h.
CRY
peak, which indicates an incompleteness of the solid-phase interaction in this system. According to the phasediagram data [15], the first peak at T = 1005°C mayaccount for the decomposition of the incongruent phaseSr4B14O25 formed as a second phase during the SBOsynthesis, whereas the second peak at T = 1015°C cor-responds to the SBO melting. Repeated annealing atT = 900°C with intermediate grinding allowed us toobtain a single-phase compound with the content of thefirst phase exceeding 95%. The corresponding DTAcurve showed one endothermic peak related to the con-gruent SBO melting (Fig. 2, curve 3).
In the series of Sr1 – xEuxB4O7 solid solutions, themaximum intensity of the Eu2+ PL corresponds to x =0.15 [9]. The DTA curves of polycrystallineSr1 − xEuxB4O7 samples with x = 0.01–0.05 prepared bythe above-described technique show one endothermicpeak at 1015°C, which is characteristic of congruentmelting. The absence of other peaks is indicative of thesingle-phase composition of the samples. At higher Eucontents, the DTA curve of the Sr0.85Eu0.15B4O7 poly-crystal show an additional endothermic peak at T =440°C, which is likely to indicate the multiphase com-position of these samples. According to the preliminaryXPA data, the fraction of the phase of strontium tetrab-orate SrB4O7 in this sample is 85%; the second phasesare europium tetraborate EuB4O7, europium orthobo-rate EuBO3, and europium metaborate EuB3O6.
Taking into account that the ionic radii of the Eu2+
and Sr2+ ions have fairly close values (1.31 and 1.32 Å,respectively), we can suggest that the activator is incor-porated into the crystallographic position of the Sr2+
ion. It is known that a rare-earth activator is in the high-est charge state in the matrices in which its electroneg-ativity χ is lower than the electronegativity of the cationit substitutes [16]. In the case under consideration,χEu = 1.01 eV > χSr = 0.99 eV. Therefore, when SBO isactivated with europium, the formation of the activating
center is the most likely process. Stabilization of
the Eu ion in the divalent state during the synthesis inair is related to the presence of the rigid boron–oxygenframework composed of BO4 polyhedra. This frame-work prevents Eu2+ ions from interaction with oxygen [3].
The PL data for the polycrystals confirm the abovesuggestion. The PL spectra of Sr1 – xEuxB4O7 (Fig. 3,curves 1–3) show a band peaked near λ = 370 nm. Thisband is due to the 4f65d – 4f7 transitions in Eu2+ ions[2]. The luminescence excitation spectrum of Eu2+ ionscontains lines at λ1 = 250 nm and λ2 = 302 nm, whichis consistent with the data of [2]. With an increase in theEu content, additional peaks arise in the PL spectrum ofthe Sr0.85Eu0.15B4O7 sample in the wavelength range λ =585–705 nm (see inset in Fig. 3). The PL in this rangemay be related to the presence of europium metaborateEuB3O6 (the second phase) in the Sr0.85Eu0.15B4O7 sam-ples since europium orthoborate EuBO3 does not lumi-nesce in this wavelength range [17].
EuSr2+2+
STALLOGRAPHY REPORTS Vol. 50 Suppl. 1 2005

SYNTHESIS AND THERMALLY STIMULATED LUMINESCENCE S143
All irradiated samples demonstrated a decrease inthe PL intensity of Eu2+ ions. This can be due to the factthat some ions undergo the radiation-induced transitionEu2+ Eu3+. The TSL curve of pure SBO showsthree peaks at T = 380, 460, and 625 K (Fig. 4a). Acti-vation of SBO by europium does not lead to the occur-rence of new TSL peaks but increases the intensity ofthe existing peaks (Fig. 4c). Note that the activation byeuropium most significantly affects the intensity of thelow-temperature peak at T = 380 K. The parameters oftraps were calculated, according to [18], by construct-ing a TSL curve in the coordinates ln(I/n)–1/T andln(I/n2)–1/T. The recorded TSL peaks of theSr1 − xEuxB4O7 samples (x = 0.01–0.15) are described bythe first-order kinetics; their activation energies are0.73, 1.21, and 1.95 eV, respectively. The TSL effi-ciency of Sr1 – xEuxB4O7 (x = 0.01) is higher by an orderof magnitude than that of LiF(Mg,Ti) (TLD-100). Atlarger values of x (>0.05), the light sum stored by thecrystals also increases (Fig. 5).
On the basis of the data obtained, we suggest that atthe europium content x = 0.01–0.05 activating centers
of one type ( ) are formed in the positions of the
substituted strontium. By the instant when the ionizingradiation is switched off, some part of Eu2+ ions havecaptured holes [19]. The Eu3+ ion has a smaller ionicradius in comparison with the Eu2+ ion (0.109 and0.131 nm, respectively). Therefore, the capture of ahole by a Eu2+ ion should lead to the local distortion ofthe EuO9 polyhedron and the excess charge should becompensated due to the polarization effect. During theirradiation, trapping centers (for example, F+ centers)are formed in the oxide crystal Sr1 – xEuxB4O7. In the
EuSr2+2+
500475450425400375350325λ, nm
λ, nm600 650 700550
0123456Ι × 102, arb. units
0
1
2
3
4
5
6Ι × 102, arb. units
Fig. 3. PL spectra of Sr1 – xEuxB4O7 excited by radiationwith λ = 270 nm: x = (1) 0.15, (2) 0.05, and (3) 0.01. Theinset shows the Eu3+ PL spectrum of a Sr0.85Eu0.15B4O7sample.
1
2
3
CRYSTALLOGRAPHY REPORTS Vol. 50 Suppl. 1 2
real structure, these centers can be located in the imme-diate vicinity of recharged Eu3+ ions and initiate the
generation of Coulomb pairs [ , F+ center]. Such a
pair, stable at the instant of the irradiation termination,will lead to the light sum storage and contribute to theTSL. During the thermal decomposition, an F+ centerdecays and an electron is captured by the Eu3+ ion withsubsequent relaxation via radiative recombination:Eu3+ + e– (Eu2+)* Eu2+ + hν. After annealing
EuSr2+2+
7507006506005505004504003503000
1
2
3
4
5
6
T, K
(a) * 10(b) * 10(c)
I (TSL), 103 arb. units
Fig. 4. TSL curves of (a) SBO, (b) TLD-100, and(c) Sr1 − xEuxB4O7 (x = 0.01).
400
5
600500 700T, K
300
10
15
20
25
30
351
2
3
I(TSL), 103 arb. units
Fig. 5. TSL curve of the Sr1 – xEuxB4O7 samples with x =(1) 0.15, (2) 0.05, and (3) 0.01 subjected to X-ray irradiationwith a dose of 9000 R.
0
005

S144 DUBOVIK et al.
at 700 K, the PL intensity of Sr1 – xEuxB4O7 returns tothe initial value. Thus, the mechanism of the formationof the TSL peak at T = 380 K with the activation energyE = 0.73 eV is related to the thermal decomposition ofelectronic traps.
CONCLUSIONS
It is established that during the synthesis ofSr1 − xEuxB4O7 solid solutions (x ≤ 0.15) in air the sec-ond phases are europium tetraborate EuB4O7, europiumorthoborate EuBO3, and europium metaborate EuB3O6.It is shown that the activation of SBO by europium doesnot lead to the occurrence of new TSL peaks but onlyredistributes the intensity of the existing ones. The TSLpeak at T = 380 K with the activation energy ET =0.73 eV can be due to the thermal decomposition of theF+ center with subsequent radiative relaxation of theEu2+ ion. The light sum stored in SBO:Eu2+ is larger bymore than an order of magnitude than that stored inTLD-100, which gives grounds to consider SBO:Eu2+
as a promising material for thermoluminescent dosim-etry of thermal neutrons.
REFERENCES
1. Yu. S. Oseledchik, A. L. Prosvirin, V. V. Starshenko,et al., J. Cryst. Growth 135, 373 (1994).
2. K. Machida, G. Adachi, and J. Shiokawa, J. Lumin. 21,101 (1979).
3. H. Liang, H. He, Q. Zeng, et al., J. Electron Spectrosc.Relat. Phenom. 124, 67 (2002).
4. W. J. Schipper, A. Meijerink, and G. Blasse, J. Lumin.64, 55 (1994).
CRY
5. J. W. M. Verwev, J. M. Coronado, and G. Blasse, J. SolidState Chem. 92, 531 (1991).
6. A. Meijerink, M. M. E. van Heek, and G. Blasse, J. Phys.Chem. Solids 54 (8), 901 (1993).
7. G. Blasse, A. Meijerink, M. Nomes, et al., J. Phys.Chem. Solids 55 (2), 171 (1994).
8. G. Blasse, G. J. Dirksen, and A. Meijerink, Chem. Phys.Lett. 167 (1–2), 41 (1990).
9. A. Meijering, J. Nuyten, and G. Blasse, J. Lumin. 44, 19(1989).
10. M. Santiago, A. Lavat, E. Caselli, et al., Phys. Status Sol-ids A 167, 233 (1998).
11. M. Santiago, C. Grassely, E. Caselli, et al., Phys. StatusSolids A 185 (2), 285 (2001).
12. A. Lavat, E. Caselli, M. Santiago, et al., Cryst. Res.Technol. 39 (10), 840 (2004).
13. K. S. Mishra, J. K. Berkovitz, B. G. DeBoer, andA. E. Dale, Phys. Rev. B 37 (13), 7230 (1988).
14. A. Perloff and S. Block, Acta Crystallogr. 20 (2), 274(1966).
15. D. P. Kudrjavtcev, Yu. S. Oseledchik, A. L. Prosvirnin,et al., J. Cryst. Growth 254, 456 (2003).
16. M. F. Dubovik, A. I. Promoskal’, and B. S. Skoroboga-tov, Opt. Spektrosk. 20 (3), 371 (1966).
17. Yu. V. Fenisov, B. F. Dzhurinskiœ, and V. A. Kizel’,Neorg. Mater 5 (7), 1240 (1969).
18. V. V. Antonov-Romanovskiœ, The Kinetics of the Photo-luminescence of Crystal Phosphors (Nauka, Moscow,1966) [in Russian].
19. A. J. Wojtowicz, in Proceedings of the Conference onInorganic Scintillators and Their Applications, Delft,SCINT-95, Netherlands, 1995 (Delft Univ. Press, Delft,1995), p. 95.
Translated by Yu. Sin’kov
STALLOGRAPHY REPORTS Vol. 50 Suppl. 1 2005

Crystallography Reports, Vol. 50, Suppl. 1, 2005, pp. S145–S148.Original Russian Text Copyright © 2005 by Vigdorovich.
CRYSTALGROWTH
Mechanism of Formation of GaN Buffer Layers on Sapphire by Chemical-vapor Epitaxy
E. N. VigdorovichMoscow State Academy of Instrumentation Engineering and Informatics,
ul. Stromynka 20, Moscow, 107876 Russiae-mail: [email protected]
Received December 28, 2004
Abstract—Conditions of nucleation during epitaxy are determined by the properties of the substrate surfaceand the process parameters. On the basis of the Gibbs representations, the nucleation energy and rate are cal-culated as functions of supersaturation for the process of metal–organic chemical-vapor epitaxy: heteroepitaxy(on Al2O3) and homoepitaxy of GaN (0001). The conditions for GaN crystallization and the possibilities of tran-sition from three- to two-dimensional nucleation are determined. © 2005 Pleiades Publishing, Inc.
INTRODUCTION
Nitrides of elements of the III group (GaN, InN, andAlN) and their alloys have some properties that make itpossible to significantly improve the functional charac-teristics of optoelectronic elements, transistors, andother devices. A larger band gap, in comparison withconventional semiconductors (Si, GaAs, InP, and soon), a high carrier mobility, and better limitation of car-riers in these nitrides make it possible to develop ontheir basis high-efficiency emitters of green, blue, andwhite luminescence and super-power transistors.Chemical-vapor epitaxy is the main method of fabrica-tion of GaN-based heterostructures. Therefore, it is ofgreat interest to investigate the processes of nucleationof epitaxial layers during the formation of multilayerstructures [1–3].
INCUBATION PERIOD IN HETEROEPITAXY
In the study of the processes of epitaxy of semicon-ductors, one phenomenon that has attracted the atten-tion of researchers has been referred to as the delay inthe beginning of growth or the incubation period. Dur-ing this period in the initial stage of the process, no epi-taxial layer arises on the substrate. As far back as 1969,it was found [4] that, for the molecular-beam epitaxy ofSi, the delay in the beginning of growth is 20 min. In the1980s [5], an incubation period was observed for thehomoepitaxy of Ge (180 s) and GaAs (10 s). Recently, thisphenomenon has attracted the attention of researchesstudying the heteroepitaxy of GaN on sapphire(GaN/Al2O3) [6]. In the general case, the incubationperiod may include the characteristic times of differenttransient processes, which accompany the settling of anoperation regime of the vapor-transport system, theperiod of time-dependent layer nucleation, supersatura-
1063-7745/05/5001-S $26.000145
tion accumulation, kinetic factors, and so on. However,we believe the physicochemical aspects related to hete-roepitaxial nucleation to be decisive factors.
According to the thermodynamic theory of crystal-lization, the total energy of a cluster of three-dimen-sional (3D) nuclei can be expressed as [7, 8]
(1)
where ∆GV and ∆GS are the volume and surface compo-nents of the energy, respectively.
In a more detailed form,
(2)
where r is the cluster size; σ1, 2, 3 are the free surfaceenergies of the cluster, interface, and substrate, respec-tively (σ2 = σ1 + σad, where σad < 0); ∆FV is the volumefree energy of the material condensation; and ai are thecluster-shape constants.
For a hemispherical boundary between the clusterand the gas phase, a1 = 2π, a2 = π, and a3 = (2/3)π. Thedependence (2) has a maximum corresponding to thevalues of the critical free energy (∆Gcr) and the criticalcluster size (rcr), at which clusters begin to grow. Atδ∆G/δr = 0,
(3)
(4)
For chemical-vapor epitaxy, ∆FV is the thermody-namic supersaturation, which can be written as
(5)
where V is the molar volume of a cluster; R is the uni-
versal gas constant; T is temperature; and and are the constants of the corresponding chemical reac-
∆G ∆GV ∆GS,+=
∆G a3r3∆FV a1r2σ1 a2r2σ2 a3r2σ3,–+ +=
rcr 2σ1 σ2 σ3–+( )/∆FV ,–=
∆Gcr rcr( )3∆FV .=
∆FV RT /V( ) Kp* Kp0–( ),ln=
Kp* Kp0
© 2005 Pleiades Publishing, Inc.

S146
VIGDOROVICH
tions for the initial (*) and equilibrium (0) states,respectively (at the reactor input and in the growthzone).
Thus, calculating the critical size of a cluster for thereal conditions of heteroepitaxy (temperature, supersat-uration, and growth rate), we can determine the time τof the formation of stable 3D films. In essence, this timeis the incubation period:
(6)
where v hom is the rate of homoepitaxial nucleus growth.In view of the absence of reliable data on the free
surface energy of the materials under study, we esti-mated this parameter using the equation for the poten-tial of Coulomb interaction between unlikely atoms inthe crystallographic plane (0001) [4] (see table).
The estimated value of the surface free energy isσ2 = 2.6 × 10⁻⁴ J/cm2.
For typical conditions of the chemical-vapor hete-roepitaxy of GaN on sapphire (temperature 1050°C,thermodynamic supersaturation ∆FV = 9 × 10² J/cm3),we find the critical cluster size rcr = 84 Å and the incu-bation time τ = 21 s. An increase in the growth rateleads to a decrease in τ and vice versa. A similar depen-dence should be observed with an increase in the super-saturation in the system.
τ rcr/v hom,=
Parameters of the basal lattice plane (0001) and the free sur-face energy
Parameter Al2O3 AlN GaN InN
a, nm 0.475 0.311 0.319 0.353
σ, (10–4), J cm–2 3.9 1.7 1.6 1.2
1
2
2 3 4 5 6 7 8 901
3
4
56789
10E, 10–20 J
107
108
109
1010
1011I, cm–2 s–1
Supersaturation, kJ/mol
hh
h aaa
HOM
3HOM2HET
2HOM
3HET
HET
Fig. 1. Dependences of the energy E and nucleation rate Ion supersaturation for the 2D (2HOM, 2HET) and 3D(3HOM, 3HET) nucleation during homo- and heteroepitaxy(HOM and HET, respectively).
CRY
FORMATION OF A BUFFER LAYER
The conditions for the layer nucleation during epit-axy are determined, on the one hand, by the physicaland crystallographic properties of the substrate surfaceand, on the other hand, by the process parameters. Thedifference between the physical and crystallographiccharacteristics of the substrate and the layer determinesthe energy barrier during the nucleation, while the pro-cess conditions make it possible to control the nucle-ation mechanism, i.e., the formation of two-dimen-sional (2D) or 3D nuclei.
On the basis of the Gibbs representations [9], theequations for the work of the formation of 2D and 3Dnuclei during epitaxy can be written as
(7)
where V is the molar volume of a material, c is thethickness of a monolayer, and ∆FV is the supersatura-tion.
For the chemical-vapor epitaxy of GaN using ametal–organic compound containing Ga (MOCGa) andNH3 (hydride metal–organic vapor-phase epitaxy,MOVPE), which is performed at a large excess ofammonia, the MOCGa concentration in the vaporphase is the decisive factor in the crystallization and,accordingly, the supersaturation can be written as
where is the partial pressure of MOC Ga at the
input of the reactor and is the equilibrium pres-sure of MOC Ga at the substrate.
The nucleation rate can be written as Ii =
exp(−Ei/kT). The kinetic coefficient is related tothe adsorption ability of the crystallization surface.Therefore, this coefficient for heteroepitaxy (physical
adsorption) on sapphire, , is significantly smallerthan the corresponding coefficient for homoepitaxy
(chemical adsorption), . Analysis shows that the
average value of the ratio / is 1 × 10⁴. The
value of taken for the analysis is 1 × 1014 cm–3 s–1.
In this study, qualitative analysis of the nucleation inthe range of real supersaturations is performed for GaNhydride MOVPE (Fig. 1). It can be seen that the nucle-ation can be implemented, for example, at small super-saturations, when the formation of 2D nuclei at hetero-(het) and homoepitaxy (hom) is energetically morefavorable. However, the rate of heteroepitaxial nucle-ation is extremely small in this case and the incubationperiod may be fairly long. Heteroepitaxial at high ratesis energetically favorable at large supersaturations and3D nucleation. It can also be seen that, at high supersat-
E2 πcV 2σ1 σ2 σ3–+( )2/8∆FV[ ] ,=
E3 πV2 2σ1 σ2 σ3–+( )2/3∆FV[ ] ,=
∆FV RT PMOC* /PMOC0( ),ln=
PMOC*
PMOC0
Ii0 Ii
0
IHET0
IHOM0
IHOM0 IHET
0
IHOM0
STALLOGRAPHY REPORTS Vol. 50 Suppl. 1 2005

MECHANISM OF FORMATION S147
urations, after the formation of a continuous 3D nucle-ation layer (and, therefore, at the transition from hete-roepitaxy to homoepitaxy), the nucleation rate at the3D growth sharply increases as a result of the decreasein the energy barrier, which leads to the formation ofstructurally disordered layers. In the range of interme-diate supersaturations, we can implement 3D het-erophase nucleation and 2D homoepitaxial growth, butit is technologically difficult to stabilize the growthconditions.
To obtain high-quality nucleation layers, it is expe-dient to perform heteroepitaxy at high supersaturationsunder conditions of 3D nucleation. In addition, at theinstant of transition to homoepitaxy, the supersatura-tion in the system should be sharply decreased tochange for the conditions of 2D nucleation (het hom in Fig. 1), which provides more perfect layers.This procedure is difficult to perform in an actual pro-cess.
We can decrease the energy jump when going fromheteroepitaxy to homoepitaxy by decreasing the energyof the substrate surface. One of the ways to do this is toform monoatomic AlN layers on a sapphire substrate.Such a layer can be formed by either nitridation of thesapphire surface (i.e., treatment of sapphire in NH3vapor at high temperatures) or deposition of a thin Allayer on a sapphire substrate before the GaN epitaxy. Inboth cases, an AlN layer is formed on the sapphire sur-face, whose surface energy is close to that of GaN. Inthis case, the GaN nucleation can be almost immedi-ately implemented through the 2D mechanism, whichmakes it possible to obtain layers of high crystallo-graphic perfection.
Actually, all the main processes occurring duringthe two-stage GaN heteroepitaxy can be traced usinglaser reflectometry. The results are shown in Fig. 2. Thereflectogram in Fig. 2 demonstrates all phases of thestructure formation during the two-stage hydrideMOVPE epitaxy. After the incubation period (Fig. 2; 1,2), the formation of 3D nuclei (3) occurs at a low(600°C) temperature (LT), i.e., at high supersaturation.Primary coalescence (4), related to the growth ofnuclei, occurs during the annealing with an increase intemperature (decrease in supersaturation) and isaccompanied by a change in the shape and orientationof the nuclei. In this case, the density of nucleidecreases and diffusion zones are formed. The second-ary coalescence (5) at a high (1050°C) temperature(HT) is accompanied by the coalescence of neighbor-ing islands during their growth and exposure of largeareas on the substrate surface, on which secondarynucleation may occur. Before the homoepitaxial growth(6), a crystallographic network with a large number ofpores (channels) is formed, these channels are filled,and the growth surface is smoothed out; i.e., a transitionto the 2D growth occurs.
CRYSTALLOGRAPHY REPORTS Vol. 50 Suppl. 1 2
CONCLUSIONS
The model proposed here was confirmed in theinvestigation of GaN nucleation on the Al2O3(0001)surface, using MOVPE in a horizontal reactor withhigh-frequency heating. When the conditions of GaNnucleation are not optimal, low-resistivity buffer layersof low perfection with carrier concentrations from 5 ×10¹⁷ to 5 × 1018 cm–3 and carrier mobilities in the range20–50 cm2 V–1 s–1 are generally obtained.
When heterostructures for emitters are obtained,particular attention is given to the initial stages ofnucleation during the heteroepitaxy. Optimization ofthe functional properties of heterostructures made itpossible to determine the characteristics of the initialstages of the heterostructure growth. The thickness ofthe 3D low-temperature (450–650°C) nucleation layershould not exceed 20–25 nm. Annealing of the nucle-ation layer is carried out by increasing temperature to1020–1070°C and decreasing the NH3 consumption inthe system, which provides good conditions for thetransition from the 3D to the 2D growth of buffer layerswith a low concentration of defects. The subsequent(homoepitaxial) layers, which form the active region ofthe heterostructure, are grown with increased NH3 con-sumption at high temperatures (low supersaturation).GaN-based heterostructures obtained under these con-ditions can be used to design blue, green, and whitelight-emitting diodes with high efficiency (10–25%) [2].
Transistor technology requires the absence of ahigh-conductivity layer near the interface between thenucleation and main layers (ND should not exceed1016 cm–3). These requirements can be satisfied usingspecially developed processes (formation of nucleationlayers). For example, it was shown in [10] that, after theoptimization of the growth process, the doped GaN lay-ers with a carrier concentration of 4 × 1017 cm–3 had a
123 4 5 6
1500 2000 2500 3000 3500 4000 4500 5000t, s
0
4
8
12
16
20
24HTLT
Reflectometry signal, arb. units
Fig. 2. Reflectogram of the GaN epitaxy (LT: 600°C, HT:1050°C): (1) incubation period, (2) formation of subcriticalnuclei, (3) formation of 3D nuclei, (4) primary coalescence,(5) secondary coalescence, and (6) 2D homoepitaxialgrowth.
005

S148 VIGDOROVICH
mobility up to 250 cm2 V–1 s–1. After the optimization(the two-stage growth), the width of the rocking curve(XRD FWHM) was 0.1°–0.08° at sapphire nitridationfor 60 s, with the subsequent formation of Al monolay-ers before the growth of a (25–30)-nm Al0.05Ga0.95Nbuffer layer. Such structures were used to design a testelement of a field transistor with a channel length of3 µm and a length of contacts of 60 µm with high func-tional characteristics.
REFERENCES1. I. Akasaki, J. Cryst. Growth 237–239, 905 (2002).2. E. E. Zavarin, A. V. Sakharov, A. I. Besyul’kin, et al., in
Proceedings of 2nd All-Union Conference “Nitrides ofGallium, Indium and Aluminium, Structures andDevices,” St. Petersburg, Russia, 2003 (St. Petersburg,2003), p. 91.
3. O. Ambacher, J. Phys. D: Appl. Phys. 31, 2653 (1998).4. B. A. Joyce, R. R. Bradly, B. E. Watts, and G. R. Booker,
Philos. Mag. 19 (158), 403 (1969).
CRY
5. Problems of Semiconductor Film Epitaxy, Ed. byL. N. Aleksandrov (Nauka, Moscow, 1972) [in Russian].
6. V. B. Pushnyi, A. S. Usikov, B. Ya. Berg, et al., in Pro-ceedings of 3rd Russian Conference on Physics of Semi-conductors “Semiconductors-97,” Moscow, Russia,1997 (Moscow, 1997), p. 359.
7. O. G. Kozlova, Growth of Crystals (Mosk. Gos. Univ.,Moscow, 1967) [in Russian].
8. Physics of Fine Films, Ed. by M. I. Elinson (Mir, Mos-cow, 1967), Vol. 2, p. 14 [in Russian].
9. K. Meyer, Physicochemical Crystallography (Metal-lurgiya, Moscow, 1972) [in Russian].
10. A. A. Arendarenko, E. N. Vigdorovich, Yu. N. Sveshni-kov, et al., in Proceedings of 3rd All-Russian Conference“Nitrides of Gallium, Indium, and Aluminium: Struc-tures and Devices,” St. Petersburg, Russia, 2004 (St.Peterburg Gos. Ped. Univ., St. Petersburg, 2004), p. 26.
Translated by Yu. Sin’kov
STALLOGRAPHY REPORTS Vol. 50 Suppl. 1 2005

Crystallography Reports, Vol. 50, Suppl. 1, 2005, pp. S149–S151.Original Russian Text Copyright © 2005 by Azhdarov, Kyazimzade.
CRYSTALGROWTH
Growth of Homogeneous Single Crystals of GeSi Solid Solutions Using a Ge Seed by the Modified Bridgman Method
G. Kh. Azhdarov* and R. Z. Kyazimzade*** Institute of Physics, Academy of Sciences of Azerbaijan, pr. Dzhavida 33, Baku, 370143 Azerbaijan
** Azerbaijani State Academy of Oil, Baku, Azerbaijane-mail: [email protected]
Received February 7, 2005
Abstract—A modified technique for the growth of homogeneous Ge-rich GeSi single crystals is developed onthe basis of the vertical Bridgman method using a Ge seed and a Si source rod. Single crystals were grown intwo stages. In the first stage, a Si source rod was partially immersed in the Ge melt above the seed. A gradualincrease in the Si content in the melt leads to constitutional supercooling at the crystallization front and to thegrowth of an inhomogeneous GeSi buffer single crystal. The first stage ends when the temperature at the crys-tallization front becomes equal to the liquidus temperature of the specified composition of the Ge–Si system.In the second stage, a homogeneous GeSi single crystal is grown while maintaining a constant growth temper-ature. The growth temperature is controlled by an appropriate balance between the pulling and feeding rates.Relations determining the optimal process parameters (the pulling and feeding rates and the temperature gradi-ent at the crystallization front) for growing crystals of specified composition are obtained. © 2005 PleiadesPublishing, Inc.
The classical semiconductors Si and Ge, which arebasic materials of modern microelectronics, are com-pletely dissolved in each other at any ratios in both theliquid and solid states. The potential range of applica-tion of GeSi solid solutions includes substrates for epi-taxy, photo- and gamma detectors, solar cells, thermo-electric generators, and other optoelectronic devices.Hence, the problem of the fabrication of high-qualitymassive GeSe single crystals of specified compositionis fairly urgent.
Recently, massive crystals of GeSi solid solutionswere grown by the Czochralski method [1–7], theBridgman method [8–12], the zone-melting method[12–14], the floating-zone method [15, 16], and themulticomponent zone-melting method [17]. In almostall these studies, the crystals grown had an inhomoge-neous composition along the pulling axis because alimited amount of Si Ge melt was used in the growthprocess. It was only in a few studies that crystals withhomogeneous regions containing from 2 to 15 at % ofSi were obtained. These regions followed the initialregion characterized by a nonuniform distribution ofthe components in the matrix
It has been noted that the main difficulties in grow-ing homogeneous GeSi single crystals are related to thefollowing specific features of the system. (i) A signifi-cant segregation of the components occurs during thegrowth, which leads to constitutional supercooling ofthe melt near the crystallization front and, as a result, tothe violation of the single-crystal structure of thematrix. The equilibrium segregation coefficient of thecomponents changes from 5.5 in Ge-rich compositions
1063-7745/05/5001-S $26.00 0149
to 0.33 in Si-rich compositions. (ii) The significant lat-tice mismatch between germanium and silicon (4%)requires the presence of appropriate GeSi single-crystalseeds for the initiation of single-crystal growth from amelt of the corresponding composition. The absence ofsuch seeds leads to a lattice mismatch at the seed/meltinterface. As a result, stresses arising in the contactzone suppress the single-crystal growth. There are dif-ferent ways to solve this problem (see [5]).
In this study, we propose a new technique for grow-ing homogeneous Ge-rich Ge1 – xSix single crystals,which is based on the modified vertical Bridgmanmethod. Figure 1 shows the schematic diagram of thegrowth of GeSi crystals by this method and the temper-ature profile in the working volume of the heater. Singlecrystals are grown in two stages. First, after the meltingof a Ge charge above the single-crystal seed, a crystal-lization front is established (starting point A). Then, inthe first stage (B), a Si source rod is partially introducedat a rate ϑ1 into the Ge melt through its upper surface.In this stage, the crystal grows in a static mode, withoutswitching on the mechanism of crucible pulling. Agradual increase in the Si content in the melt leads toconstitutional supercooling at the crystallization frontand to the growth of a GeSi single crystal with a com-position varying along the pulling axis. The Si contentin the crystal and the growth temperature increase to thevalues determined by the volume of the source rodintroduced into the melt, after which a temperature isestablished at the crystallization front, which is deter-mined by the liquidus temperature of the Ge–Si systemof the corresponding composition. In the second stage
© 2005 Pleiades Publishing, Inc.

S150
AZHDAROV, KYAZIMZADE
(C), the mechanism of crucible pulling is switched onand a homogeneous GeSi single crystal is grown whilethe growth temperature is maintained at a constant. Thegrowth temperature is controlled by balancing the meltcomposition using a corresponding ratio of the pullingand feeding rates.
We present below the calculated distribution of thecomponents in GeSi crystals grown under the notedconditions, which determines the operating parametersfor the growth of crystals with homogeneous composi-tion along the pulling axis.
The problem is solved in the Pfann approximationunder the following conventional conditions: the crys-tallization front is planar, there is an equilibriumbetween the solid and liquid phases at the crystalliza-tion front, the diffusion of the components and the con-vection in the melt provide for the homogeneity of theliquid phase throughout in the entire volume, the diffu-sion of Ge and Si atoms in the solid phase is negligible,and the source rod is completely dissolved after its sub-mersion into the melt. Note that, for the Ge–Si system,these conditions are satisfied at growth rates below10−6 m/s [1].
Let us introduce the following designations: V0 andVl are the volumes of the melt in the crucible at the ini-tial and current instants of time, respectively; Vc and VSiare the volumes of the crystallizing melt and the dis-solving Si rod per time unit, respectively; Cl and Cc arethe Si contents in the melt and the crystal, respectively;C is the amount of Si in the melt; K is the equilibriumsegregation coefficient of Si; and t is time.
TGe TGe Si Temperature
Geseed
Gemelt
Sisource
rod
Ge Simelt
Geseed
Geseed
Ge Simelt
Ge Sibuffercrystal
Ge Sibuffercrystal
Ge Sihomo-
crystal
Quartzampoule
Quartzerucible
ϑ1 ϑ2
A B C
Distance
geneous
Fig. 1. Temperature distribution in the heater (left) and theschematic diagram of the growth of homogeneous GeSi sin-gle crystals (right): (A) starting point, (B) stage 1 (growth ofa buffer crystal of variable composition on a Ge seed), and(C) stage 2 (growth of a homogeneous GeSi crystal on thebuffer crystal).
CRY
With the above designations, we can write the fol-lowing relations for the first stage (B) of the growth ofa buffer crystal of variable composition in the staticmode:
(1)
According to the condition for the problem, weassume that Vc and VSi are time-independent during thetime interval under consideration.
Then, taking into account that Cc = ClK, we find that
(2)
Substituting relations (2) into (1), separating vari-ables, and integrating, we obtain
(3)
Here, the lower integration limit is taken to be zerobecause the starting melt is pure germanium. DenotingVSi/Vc as α and taking into account that Vct/V0 = Scl/V0(Sc is the cross-sectional area of the crystal, and l is thecrystal length counted from the starting point of thecrystallization front), we can write Eq. (3) in the form
(4)
Equation (4) makes it possible to determine the valueof α for the growth of a buffer crystal of specifiedlength l, with the composition of the end part equal tothe composition of the homogeneous crystal grownin the second stage. Note that the length of the buffercrystal is determined by the temperature gradient at thecrystallization front and the difference between the liq-uidus temperatures of Ge and GeSi of specified compo-sition. To take the integral in (4), one has to know theanalytical dependence of K on Cl. As shown by thephase diagram of the Ge–Si system, the value of K,depending on the melt composition, changes in a com-plicated way from 5.5 to 1 and cannot be described ana-lytically [18]. Taking into account this circumstance,the integral in (4) was calculated numerically using thevalues of the equilibrium segregation coefficient of sil-icon from the Ge–Si phase diagram.
The value of l corresponding to the required compo-sition at the final position of the crystallizationfront of the buffer crystal indicates the beginning of thesecond stage (B) of the growth of the GeSi crystal witha uniform distribution of the components.
ClCVl
----- anddCl
dt--------
CVl V lC–
Vl2
-------------------------C V lCl–
Vl
--------------------.= = =
Vl V0 Vc VSi–( )t, V l– Vc– VSi and+= =
C VcClK– VSi.+=
Vc VSi–( )Cld
Cl Vc VcK– VSi–( ) VSi+-----------------------------------------------------------
0
Cl
∫
= 1
1 1 VSi/Vc–( )Vct/V0–-------------------------------------------------------.
lV0
Sc
------ 11 α–------------ 1
Cl 1 α–( )dCl 1 K– α–( ) α+-------------------------------------------
0
Cl
∫–exp–
.=
Cc*
Cc*
STALLOGRAPHY REPORTS Vol. 50 Suppl. 1 2005

GROWTH OF HOMOGENEOUS SINGLE CRYSTALS S151
Obviously, the condition for the growth of homoge-neous crystals of solid solutions is the constancy of themelt composition during the entire technological cycle.For /dt = 0, we obtain from Eqs. (1) and (2)
(5)
Equations (5) demonstrate the possibility of grow-ing homogeneous crystals with a constant value of α*,which is determined by specified values of and K.
Figure 2 shows as an example the calculated distri-butions of the Si content along the pulling axis for threeGeSi ingots grown in two stages to obtain crystals withSi contents in the homogeneous parts of 10, 20, and30 at %. In the calculations, we assumed that the meltheight at the starting point is 100 mm and the tempera-ture gradient in the growth zone of the buffer crystal is50 K/cm. The initial portions of the curves for the crys-tals with variable composition in Fig. 1, which corre-spond to the first stage (B) of the crystal growth in thestatic mode, are calculated from Eq. (4) using a prelim-inary calculated value of α. The plateau in the curvescorresponds to the second stage (C), in which a crystalwith the composition determined by Eq. (5) grows. Thecurves in Fig. 2 demonstrate the possibility of obtainingGeSi solid solutions with a required uniform composi-tion by the modified Bridgman method. As followsfrom the analysis of the above data, the growth rate of
Cl*
Cl*α*
K 1– α*+-------------------------- or Cc*
Kα*K 1– α*+--------------------------.= =
Cl*
30
20
10
0 20 40 60 80 100
Cc, at % Si
l, mm
Fig. 2. Calculated distributions of Si along the three GeSiingots grown in two stages to obtain crystals with a Si con-tent of 10, 20, and 30 at % in the homogeneous part. Thecalculations assumed that the melt height at the startingpoint is 100 mm and the temperature gradient in the growthzone of the buffer crystal is 50 K/cm.
CRYSTALLOGRAPHY REPORTS Vol. 50 Suppl. 1 2
a buffer crystal with a variable composition is deter-mined by the temperature gradient at the crystallizationfront and the rate of feeding of melt with silicon (ϑ1).The optimal value of this process parameter, at whichhigh-quality single crystals are obtained, can be deter-mined from experiment.
On the basis of the above-said, we can conclude thatthe modified Bridgman method using a source rodmade of the secondary component and a single-crystalseed of the primary component can be successfullyapplied to grow crystals of solid solutions of specifiedcomposition with a uniform distribution of the compo-nents.
REFERENCES1. G. Kh. Azhdarov, T. Kucukomeroglu, A. Varilci, et al.,
J. Cryst. Growth 226, 437 (2001).2. I. Yunenaga, J. Cryst. Growth 198–199, 404 (1999).3. I. Yunenaga and M. Nonaka, J. Cryst. Growth 191, 393
(1998).4. I. Yunenaga, J. Cryst. Growth 226, 47 (2001).5. N. V. Abrosimov, S. N. Rossolenko, W. Thieme, et al.,
J. Cryst. Growth 174, 182 (1997).6. N. V. Abrosimov, S. N. Rossolenko, W. Thieme, et al.,
J. Cryst. Growth 166, 657 (1996).7. P. G. Azhdarov and N. A. Agaev, Inorg. Mater. 35 (8),
763 (1999).8. C. Marin and A. G. Ostrogorsky, J. Cryst. Growth 211,
378 (2000).9. P. Dold, A. Barz, S. Recha, et al., J. Cryst. Growth 192,
125 (1998).10. K. Kadakura and Y. Takano, J. Cryst. Growth 171, 56
(1997).11. L. Helmers, J. Schilz, and G. Bachr, J. Cryst. Growth
165, 381 (1996).12. A. Barz, P. Dold, U. Kerat, et al., J. Vac. Sci. Technol. B
16, 1627 (1998).13. D. Bliss, B. Demczuk, B. Anselmo, et al., J. Cryst.
Growth 174, 187 (1997).14. J. Wollweber, D. Shulz, and W. Shroeder, J. Cryst.
Growth 163, 243 (1996).15. J. Wollweber, D. Shulz, and W. Shroeder, J. Cryst.
Growth 158, 166 (1996).16. T. A. Campbell, M. Schweizer, P. Dold, et al., J. Cryst.
Growth 226, 231 (2001).17. K. Nakajima, S. Kodama, S. Miyashita, et al., J. Cryst.
Growth 205, 270 (1999).18. R. V. Olesinski and J. C. Abbaschian, Bull. Alloy Phase
Diagrams 5, 180 (1984).
Translated by Yu. Sin’kov
005

Crystallography Reports, Vol. 50, Suppl. 1, 2005, pp. S152–S158.Original Russian Text Copyright © 2005 by Melenev, Nyashina, Trusov.
CRYSTALGROWTH
A Phase-Field Model with Two-Component Order Parameter for Spontaneous
Crystallization in a Melt of Pure MetalP. V. Melenev, N. D. Nyashina, and P. V. Trusov
Perm State Technical University, Komsomol’skiœ pr. 29a, Perm, 614600 Russia
e-mail: [email protected] February 3, 2005
Abstract—A phase-field model with the two-component order parameter is proposed for describing the crys-tallization of a pure metal. The model is constructed on the basis of the Ginzburg–Landau theory of phase tran-sitions using the principle of the positivity of entropy production in an open weakly nonequilibrium system.This makes it possible to use the proposed model for describing nonisothermal processes. A number of one-dimensional and two-dimensional problems associated with the simulation of a solidified structure under dif-ferent temperature conditions are solved. © 2005 Pleiades Publishing, Inc.
INTRODUCTION
According to experimental data, physicomechanicalcharacteristics of a solid metal depend substantially onthe parameters of the cast structure formed upon crys-tallization. This and other factors (including rapidprogress in the development of computer science andmathematical methods) have explained the consider-able interest expressed by researchers in simulating thecast structure of a solidifying melt over the last twodecades.
Structuring processes cannot be described withintraditional formulations of heat and mass transfer prob-lems, because these formulations disregard the mainfactors responsible for the formation of structures. Anappropriate basis for the solution of similar problems isprovided by the phase-field model, which is based onthe apparatus of weakly nonequilibrium thermodynam-ics and includes the formalism of the Ginzburg–Landautheory of phase transitions [1]. According to this theory,the field of the order parameter characterizing the devi-ation of the system from thermodynamic equilibrium isintroduced and a phase transition is considered achange in this field. A change in the order parameter ateach point is accompanied by release of heat, which, inturn, affects the rate of this change. In the framework ofsuch an approach, unlike traditional formulations of theStefan problem, the interface is defined as an orderparameter isoline. This permits one to take into accountthe surface tension anisotropy and the interface curva-ture, which are the main structuring factors that renderthe interface nonisothermal.
1063-7745/05/5001-S $26.000152
MATHEMATICAL FORMULATIONOF THE PROBLEM
Crystallization in a melt of a pure metal in somedomain is described in terms of the phase-field model.In the works devoted to this model, the free energyfunctional and the principle of lack of increase in thefree energy in irreversible processes (valid for isother-mal cases) have been used frequently [2, 3]. However,temperature supercooling is one of the main drivingforces of crystallization. Another important factor is thelatent heat of crystallization. In order for these twoeffects to be included, temperature variations in thedomain should be described within the phase-fieldmodel. Therefore, consideration of the entropy of thesystem in our problem seems to be more justified,because the evolution of the system according to thesecond law of thermodynamics should be accompaniedby an increase in the entropy (including nonisothermalconditions). The equations of the model will be derivedusing the formalism proposed by Wang et al. [4]. Then,we will analyze a two-dimensional variant of the prob-lem (the Cartesian coordinate system with an orthonor-malized basis set i, j).
Let us consider a closed domain Ω filled with a puremetal that can undergo a liquid–crystal phase transi-tion. We assume that the temperature gradient and therate of temperature change in the domain are not veryhigh and external actions (for example, electromagneticfields) on a melt are absent. Moreover, we will examinethe problem on the mesolevel and disregard the influ-ence of melt motion and stresses arising in the material.
© 2005 Pleiades Publishing, Inc.

A PHASE-FIELD MODEL WITH TWO-COMPONENT ORDER S153
As in [5], we introduce the characteristic of thephase state, namely, an order parameter consisting oftwo components ϕ(t, r), θ(t, r). The component ϕ canbe interpreted as the degree of ordering of the material(the fraction of occupied sites in the crystal lattice) at apoint (more precisely, in a microvolume) with a radiusvector r at an instant of time t, so that the values of ϕ =0 and 1 correspond to the liquid and crystalline states,respectively. The component θ is the angle between oneof the principal crystallographic directions and the heatflux. It is evident that, taking into account the order N0of the symmetry axis in the lattice under consideration,we can analyze variations of the component θ in therange from 0 to 2ϕ/N0. This approach allows us todescribe the simultaneous growth of several arbitrarilyoriented crystals, their interaction, and the formation ofthe polycrystalline structure of the material.
It is assumed that the entropy of an arbitrary subvol-ume of the domain V ∈ Ω can be written in the form
(1)
where s(e, ϕ) is the entropy density, e is the internalenergy density, and the parameters ε and η can be func-tions of the order parameter. The gradient terms in theentropy functional are introduced by analogy with theinternal energy functional proposed in the works byLandau and Ginzburg and also Cahn and Hilliard, whoused the gradient approach, according to which thepotential depends not only on the thermodynamic vari-ables but also on their gradients (when the gradients ofthese variables are sufficiently large). Therefore, theproposed functional includes the order parameter gradi-ents, whereas the temperature gradient is not involvedin an explicit form in the expression for the entropy. Inthis case, the degree of disorder does not change if thegradients are equal to zero.
In order to allow for the surface energy anisotropy ofthe crystal, we assume that the parameter ε depends onthe crystal surface orientation, which is described bythe angle ψ = – θ, where is the angle between theabscissa axis and the vector –∇ϕ aligned along the nor-mal to the interface (Fig. 1).
The third term in expression (1) reflects the effect ofmisorientation of neighboring crystals. It is assumedthat this effect depends on the ordering of the materialand, hence, it is possible to write η(ϕ).
Now, we differentiate expression (1) with respect totime and separate the relationship for the entropy fluxthrough the boundary of the subvolume V. Then, the
S s e ϕ,( ) 12--- ε ∇ϕ( )2–
12--- η ∇θ( )2–
V ,d
V
∫=
ψ ψ
CRYSTALLOGRAPHY REPORTS Vol. 50 Suppl. 1 20
time dependence of the entropy can be represented inthe following form:
where
Here, the tensor J is represented as J = –ij + ji and I =ii + jj is a unit tensor.
As follows from the second law of thermodynamics,the entropy production in any subvolume V ∈ Ω is pos-itive. The entropy production can be found by subtract-ing the entropy flux through the boundary δV from the
quantity ; that is,
In the integrand, is the entropy flux caused by the
temperature gradient and Y is the entropy flux associ-ated with the change in the phase field (the change inthe ordering and orientation of the growing crystal) at
S q ∇ 1T---
⋅ 1T--- ∂e
∂ϕ------
S
Xϕ+ ϕ Xθθ+ +
Vd
V
∫=
– n∂s∂e-----
ϕq Y+
⋅ δV( ),d
δV
∫
Xϕ ∇ ε ψ( ) ε ψ( )I ε' ψ( )J+( ) ∇ϕ⋅[ ]⋅ η' ϕ( )2
------------- ∇θ 2,–=
Xθ ε ψ( )ε' ψ( ) ∇ϕ 2 ∇ η ϕ( )∇ϕ( ),⋅+=
Y ϕ ε ψ( )2∇ϕ ε ψ( )ε' ψ( )J ∇ϕ⋅+[ ] θ η ϕ( )∇θ .+=
S
S n qT--- Y+
δV( )d⋅δV
∫+ 0.≥
qT---
Fig. 1. Schematic drawing of the interface.
x
y
ϕ = 0
ϕ = 1
θ
ψ
– ∇ϕ
05

S154 MELENEV et al.
the boundary of the subvolume V. Consequently, thepositivity of entropy production
can be provided by choosing the following relation-ships for the heat flux and the time derivatives of thevariables:
(2)
(3)
(4)
where τ and MT are positive parameters and the tensorI is written as I = ii + jj. The equation describing theinternal energy density is represented in the form
(5)
Equations (2)–(4) form the system of the masterequations for the order parameter and the internalenergy density, respectively.
The derivative of the internal energy density in for-mula (5), as a rule, is determined using the free Helm-holtz energy density [4]
whose differential is given by the relationship
(6)
Consequently, at a constant temperature T, the func-tion f(T, ϕ) at any fixed component ϕ can be written asfollows:
(7)
where TM is the melting temperature and G(ϕ) is anarbitrary function.
For the internal energy density, we propose the fol-lowing relationship:
(8)
where es and el are the classical internal energy densi-ties of the solid and liquid phases, respectively; L(T) =el(T) – es(T); p(0) = 0; p(1) = 1; and L(TM) = L0 is thelatent heat of melting.
Sprod = q ∇ 1T---
⋅ 1T--- ∂e
∂ϕ------
S
Xϕ+ ϕ Xθθ+ +
Vd
V
∫ 0≥
q MT ∇ 1T---
,=
τϕ 1T--- ∂e
∂ϕ------
S
–=
+ ∇ ε ψ( ) ε ψ( )I ε' ψ( )J+( ) ∇ϕ⋅[ ]⋅ η' ϕ( )2
------------- ∇θ 2,–
τθ ε ψ( )ε' ψ( ) ∇ϕ 2 ∇ η ϕ( )∇θ( ),⋅+=
e ∇ MT ∇ 1T---
.⋅–=
f e Ts,–=
df∂e∂ϕ------
S
dϕ sdT .–=
f T ϕ,( ) Te z ϕ,( )
z2---------------- zd
TM
T
∫– TG ϕ( ),+=
e es T( ) 1 p ϕ( )–[ ] L T( )+ el T( ) p ϕ( )L T( ),–= =
CRY
With allowance made for relationship (8), function(7) can be rewritten in a more specific form
(9)
where
(10)
is a monotonically increasing function that passesthrough 0 at the point TM.
Making allowance for formula (6), Eqs. (3) and (5)can be represented as follows:
(11)
(12)
When the temperature and volume are fixed, the freeenergy of the system in the equilibrium state is mini-mum. Since it is assumed that the crystalline and liquidphases are metastable in the temperature range underconsideration, the free Helmholtz energy densityshould have local minima at the points ϕ = 0 and 1 atany temperatures in the studied range (this ensures theexistence of a supercooled liquid or a superheated crys-tal); that is,
(13)
Furthermore, the function f of the temperature Tshould be continuous at the melting point:
(14)
From expression (9) for the free energy density withdue regard for conditions (13) and (14), we find
(15)
(16)
(17)
In order to obey Eqs. (15)–(17), the function G(ϕ)can be chosen in the form of a W-shaped potential withminima at zero and unity. The simplest example of thisfunction is given by the expression
(18)
where G0 > 0 [4]. Note that, when using the functionG(ϕ) in the form (18), we have f(TM, 0) = f(TM, 1) = 0.The dependence p(ϕ) should also be chosen so that
f T ϕ,( ) Tel z( )
z2----------- zd
TM
T
∫– p ϕ( )Q T( ) G ϕ( )+ + ,=
Q T( ) L z( )z2
----------- zd
TM
T
∫=
τϕ Xϕ Q T( )p' ϕ( )– G' ϕ( ),–=
el T( ) p' ϕ( )L T( )ϕ– p ϕ( )L' T( )T–
= ∇ MT ∇ 1T---
.⋅–
∂f∂ϕ------
ϕ 0; 1=
0,∂2 f
∂ϕ2---------
ϕ 0; 1=
0.>=
f TM 0,( ) f TM 1,( ).=
G' ϕ( ) p' ϕ( )Q T( )+[ ] ϕ 0 1,= 0,=
G'' ϕ( ) p'' ϕ( )Q T( )+[ ] ϕ 0 1,= 0,>
G 0( ) G 1( ).=
G ϕ( ) G0g ϕ( ) G0ϕ2 1 ϕ–( )2,= =
STALLOGRAPHY REPORTS Vol. 50 Suppl. 1 2005

A PHASE-FIELD MODEL WITH TWO-COMPONENT ORDER S155
Eqs. (15)–(17) must be satisfied. For example, thedependence p(ϕ) can be constructed in the form
Then, with the use of function (18), we obtain
In order to simplify the developed model, the inter-nal energy density of the liquid can be approximated bya linear temperature dependence
where c is the specific heat capacity (it is assumed thatc = const).
The parameter MT can be specified in the form MT =λT2, where λ is the thermal conductivity coefficient. Ina strict sense, for anisotropic materials (including crys-tals), it is necessary to consider the tensor λ, whichaccounts for the possible anisotropy of heat transferalong different directions. However, in the presentwork, we use only the scalar constant thermal conduc-tivity coefficient. Taking into account these assump-tions, the evolution equations (11), (4), and (12) of themodel are written in the following final form:
(19)
(20)
(21)
The derived system of Eqs. (19)–(21) describes theevolution of the components of the order parameter andthe temperature field.
SOLUTION OF TEST PROBLEMSEquations (19)–(21) were used to solve several test
problems for one- and two-dimensional domains Ω.The calculations given below were performed with
the parameters for tin [6], because this is one ofthe metals whose homogeneous crystallization hasbeen experimentally investigated over a few decades[7].
The constants ε0 and G0 were estimated from thephysical characteristics of the material according to theprocedure proposed in [4]. The constants τ and η0 in thepresent work served as the model parameters. Theresults given below were obtained at the following con-stants: ε0 = 4.0 × 10⁻⁶, G0 = 3.0 × 10⁶, τ = 2.0 × 10⁵, andη0 = 5.0 × 10⁻¹⁰.
Let us analyze the one-dimensional variant of theproblem. We assume that a constant supercooling –∆uis maintained at the boundaries of the domain under
p ϕ( ) g z( ) z g z( ) z.d
0
1
∫d
0
ϕ
∫=
p ϕ( ) ϕ3 10 15ϕ– 6ϕ2+( ).=
el T( ) el TM( ) c T TM–( ),+=
τϕ ε02∇ εˆ ψ( ) ε ψ( )I ε'ˆ ψ( )J+( ) ∇ϕ⋅[ ]⋅=
– η0η'ˆ ϕ( )
2------------- ∇θ 2 Q T( )p' ϕ( )– G0g' ϕ( ),–
τθ ε ψ( )ε' ψ( ) ∇ϕ 2 ∇ η ϕ( )∇θ( ),⋅+=
c p ϕ( )L' T( )–( )T p' ϕ( )L T( )ϕ– λ∇ 2T .=
CRYSTALLOGRAPHY REPORTS Vol. 50 Suppl. 1 20
consideration; that is, T(0, x) = T(t, –∞) = T(t, +∞) =−∆u.
For the phase field, we chose randomly distributedperturbations with an amplitude of 0.1 (the orientationangle θ is randomly distributed) as the initial conditionsand the periodic boundary conditions ϕ(t, –∞) = ϕ(t,+∞) and θ(t, –∞) = θ(t, +∞).
Equations (19) and (20) contain the nonlinear differ-ential operators. Therefore, the explicit scheme withconstant steps in time and coordinate was applied tosolve the problem. In this case, we used the differenceanalogues of the derivatives that provided the first-order approximation in time and the second-orderapproximation in coordinate. In order to ensure stabil-ity of the numerical solution, the time integration stepwas chosen according to the Courant conditions [8].The coordinate step was determined by the domain sizeand the number of nodes in the computational grid.
Figure 2 presents the distributions of the degrees ofordering and the orientation angles at several instants oftime. These distributions reflect the development of thecrystallization process. It can be seen from Fig. 2 that,at the initial stage (t = 5 × 10⁻⁵, 7 × 10⁻⁵ s), crystalliza-tion begins at several nuclei whose growth is predomi-nantly responsible for the increase in the fraction of thesolid phase. In the domain, there are several regions ofthe crystallized material (the degree of ordering ϕ isclose to unity), which are separated by regions with alower degree of ordering. At later stages of the process(t = 10 × 10–5, 35 × 10–5 s), the crystals begin to interactwith each other: certain crystals grow at the expense ofother crystals, and their orientations become similar toeach other. A decrease in the number of crystals is asso-ciated with, first, melting of small-sized crystals due tothe release of the latent heat of crystallization duringthe growth of large-sized crystals, and, second, orienta-tional alignment of neighboring crystals with similarorientations. As a consequence, the number of grainsdecrease and their sizes increase in the domain.
Therefore, the solution of the one-dimensional vari-ant of the problem shows that the system is character-ized by a realistic behavior: the formation of orderedidentically oriented subregions (grains) separated bynarrow regions of the material with a lower degree ofordering. This enables us to apply the developedapproach to the two-dimensional problem.
As was noted above, the model equations (19)–(21)were derived on the basis of the entropy functional.This provides a way of describing solidification undernonisothermal conditions and allowing for the influ-ence of the latent heat of the phase transition on the pro-cess.
Now, we consider a rectangular domain acrosswhich the temperature gradient is specified at the initialinstant of time: a constant supercooling occurs at oneboundary of the domain (at the left of Fig. 3), and themelting temperature is maintained at the oppositeboundary. Moreover, it is assumed that the order
05

S156 MELENEV et al.
Fig. 2. Solutions of the one-dimensional isotropic problem for several instants of time. Tick marks on the horizontal axis are spacedat 10–6 m.
0.2
10080604020x
0.4
0.60.8
1.0
0.20.4
0.60.8
1.0
0.20.4
0.60.8
1.0
0.20.4
0.60.8
1.0
0.20.4
0.60.8
1.0ϕ
0.2
10080604020x
0.40.60.81.01.21.4
0.20.40.60.81.01.21.4
0.20.40.60.81.01.21.4
0.20.40.60.81.01.21.4
0.20.40.60.81.0
θ
1.21.4
t = 5 × 10⁻⁵ s
t = 7 × 10⁻⁵ s
t = 10 × 10–5 s
t = 35 × 10–5 s
t = 50 × 10–5 s
parameter flux through these boundaries is absent andthat the periodic boundary conditions are imposed onthe other two boundaries. A similar situation can beobserved in melt regions in the vicinity of matrix walls(or substrate if the case in point is the experiments withsmall-sized melt droplets) whose temperature is lowerthan the temperature in the melt. The crystal lattice ofthe solid phase has sixfold symmetry.
CRY
The development of the crystallization process isillustrated in Fig. 3. Microcrystals nucleate on thecooled boundary, grow, and acquire an elongated shape.Then, crystals at the cold boundary of the domain inter-act with each other and stick together to produce largercrystals. As a result, there remain only several grainsgrowing in the direction of heat removal. Note that thecrystallization front has a small curvature.
STALLOGRAPHY REPORTS Vol. 50 Suppl. 1 2005

A PHASE-FIELD MODEL WITH TWO-COMPONENT ORDER S157
020 40 60 80 100 120 1400
20
40
60
80
100
020 40 60 80 100 120 1400
20
40
60
80
100
020 40 60 80 100 120 1400
20
40
60
80
100
020 40 60 80 100 120 1400
20
40
60
80
100t = 12 × 10–5 s t = 50 × 10–5 s
t = 100 × 10–5 s t = 200 × 10–5 s
Fig. 3. Phase-field distributions at constant temperatures at the left and at the right boundaries of the domain (different gray tintscorrespond to growing grains with different crystallographic orientations). Tick marks on the axes are spaced at 10–6 m.
020 40 60 80 100 120 1400
20
40
60
80
100
20 40 60 80 100 120 1400t = 180 × 10–5 s t = 200 × 10–5 s
Fig. 4. Phase-field distributions in the case of the cooled right boundary. Tick marks on the axes are spaced at 10–6 m.
Furthermore, we examined one more variant of theabove problem. It was assumed that, at the initialinstant of time, the conditions are identical to those inthe preceding problem. However, at an instant of time,the temperature at the right boundary begins to
CRYSTALLOGRAPHY REPORTS Vol. 50 Suppl. 1 2
decrease. This problem describes the situation when asample involving the domain under consideration iscooled with time. The phase field distributions for thisproblem are shown in Fig. 4. Before cooling the secondboundary of the domain, the crystallization process
005

S158 MELENEV et al.
Fig. 5. Temperature distributions at the instant of time t = 2 ms for the problems illustrated in Figs. 3 and 4. Tick marks on the axesare spaced at 10–6 m.
020 40 60 80 100 120 1400
20
40
60
80
100
20 40 60 80 100 120 1400
proceeds identically to that described in the previousproblem. Then, solid nuclei suspended in the melt arisein the region adjacent to the cooled boundary and beginto grow. The formation of crystals in the vicinity of thecooled domain boundary can be explained by the factthat the temperature in this region is lower than the tem-perature ahead of the crystallization front (which isheated by the latent heat released during the growth ofthe solid phase) (Fig. 5).
CONCLUSIONSThus, the two-component order parameter was
introduced by analogy with [4]. The master equationsfor this order parameter were obtained using the princi-ple of the positivity of entropy production. The use ofthis principle rather than the principle of the minimumfree energy (as in the isothermal case) made it possibleto derive thermodynamically justified evolution equa-tions for the components of the order parameter and thetemperature field and to include nonisothermal condi-tions of crystallization. The physical meaning of theparameters entering into the evolution equations wasrevealed by analyzing simplified equations of the sys-tem.
The test calculations for the one-dimensional prob-lem demonstrated that the proposed model quantita-tively describes physical aspects of crystallization andgrain formation. The solved two-dimensional problemswith temperature gradients permitted us to reveal that
CRY
the model describes the formation of grains elongatedin the direction of the temperature gradient.
ACKNOWLEDGMENTSThis work was supported by the Russian Foundation
for Basic Research, project no. Ural-2004 04-02-96030.
REFERENCES1. Collected Papers of L. D. Landau (Pergamon, Oxford,
1965; Nauka, Moscow, 1969), Vol 1.2. J. S. Langer, Models of Pattern Formation in First-
Order Phase Transitions (World Scientific, Singapore,1986), p. 165.
3. G. Caginalp, Arch. Ration. Mech. Anal. 92, 205 (1986).4. S.-L. Wang, R. F. Sekerka, A. A. Wheeler, et al., Physica
D (Amsterdam) 69, 189 (1993).5. R. Kobayashi, J. A. Warren, and W. C. Carter, Physica D
(Amsterdam) 119, 415 (1998).6. Tables of Physical Data: A Handbook, Ed. by I. K. Ki-
koin (Atomizdat, Moscow, 1976) [in Russian].7. V. P. Skripov and V. P. Koverda, Spontaneous Crystalli-
zation of Supercooled Liquids (Nauka, Moscow, 1984)[in Russian].
8. M. G. Boyarshinov, Numerical Methods (Perm. Gos.Tekh. Univ., Perm, 1999), Part 2 [in Russian].
Translated by O. Borovik-Romanova
STALLOGRAPHY REPORTS Vol. 50 Suppl. 1 2005

Crystallography Reports, Vol. 50, Suppl. 1, 2005, pp. S159–S167.Original Russian Text Copyright © 2005 by Verezub, Prostomolotov, Mezhenny
œ
, Mil’vidski
œ
, Reznik.
CRYSTALGROWTH
Theoretical and Experimental Study of the Formation of Grown-in and As-Grown Microdefects in Dislocation-Free
Silicon Single Crystals Grown by the Czochralski MethodN. A. Verezub*, A. I. Prostomolotov*, M. V. Mezhennyœ**, M. G. Mil’vidskiœ**,
and V. Ya. Reznik**** Institute for Problems of Mechanics, Russian Academy of Sciences,
pr. Vernadskogo 101, Moscow, 117526 Russia** State Institute of Rare Metals, Bol’shoœ Tolmachevskiœ per. 5, Moscow, 119017 Russia
e-mail: [email protected]*** Institute of Chemical Problems for Microelectronics,
Bol’shoœ Tolmachevskiœ per. 5, Moscow, 119017 RussiaReceived February 18, 2005
Abstract—A complex theoretical and experimental investigation is performed, including the following stages.(i) Simulation of the processes of the recombination of intrinsic point defects and the formation of grown-inmicrodefects in dislocation-free Si single crystals 200 mm in diameter grown in modern commercial heatingunits. The simulation takes into account the thermal history of the defect growth. Modified designs of heatingunits are analyzed to compare the results of the simulation of thermal processes during the growth of Si singlecrystals 200 mm in diameter with a shield in the crucible region. The thermal history of the crystal is simulated,the recombination of intrinsic point defects near the crystallization front is analyzed, and the formation ofvacancy microdefects in the temperature range t = 1200–900°C is modeled. This simulation made it possible todetermine the effect of a heat shield on the processes of v–i recombination and microdefect formation.(ii) Microdefects in as-grown crystals and in crystals subjected to thermal treatments are investigated by opticaland electron microscopy; specific features of the generation and motion of dislocations are analyzed for Siwafers containing microdefects of different types, formed as a result of the decomposition of the supersaturatedsolid solution of oxygen during multistep heat treatments of Si wafers. (iii) The three-dimensional problem ofdetermining the field of elastic stresses caused by the wafer weight is solved in the isotropic approximation for200- and 300-mm Si wafers placed on three or symmetrically arranged point supports of different areas. © 2005Pleiades Publishing, Inc.
INTRODUCTION
The problems of the production of modern verylarge scale ultra integrated circuits are related to the useof wafers with an internal getter formed by the con-trolled decomposition of the supersaturated solid solu-tion of oxygen in silicon during multistep heat treat-ments. As a result, oxygen-containing precipitates areformed in the wafer bulk, which, depending on theirnature and size, can both play the role of centers of theheterogeneous nucleation of dislocations and serve astheir stoppers, hindering their generation and motion.
An urgent problem is to monitor and control thesizes and distributions of microdefects throughout theentire process of wafer fabrication: from the initialstages of crystal growth to the final stages of heat treat-ment of Si wafers.
A complex theoretical and experimental investiga-tion is performed here. This investigation includes (i)simulation of the processes of the recombination ofintrinsic point defects and the formation of grown-inmicrodefects in dislocation-free Si single crystals
1063-7745/05/5001-S $26.000159
200 mm in diameter, grown in modern commercialheating units, taking into account the thermal history oftheir growth; (ii) optical and electron microscopy studyof microdefects in the as-grown state and after heattreatments; and (iii) the calculation and measurementof stresses in 200- and 300-mm Si wafers during high-temperature annealing.
SIMULATION OF HEAT TRANSFERAND DEFECT FORMATION
DURING THE GROWTH OF DISLOCATION-FREE Si SINGLE CRYSTALS
We considered a modification of the heating unitdesign to compare the results of the simulation of ther-mal processes during the growth of 200-mm Si singlecrystals in the presence of a heat shield in the crucibleregion. Using the calculated thermal history of a crys-tal, we analyzed the recombination of intrinsic pointdefects near the crystallization front and then simulatedthe formation of vacancy microdefects in the tempera-ture range t = 1200–900°C. This analysis made it pos-
© 2005 Pleiades Publishing, Inc.

S160
VEREZUB
et al
.
sible to determine the effect of the heat shield on theprocesses of v–i recombination and the formation ofmicrodefects.
SIMULATION OF TEMPERATURE FIELDSIN A GROWING CRYSTAL
Global numerical approximation and solution of theequations were carried out using the finite-elementmethod. In the axisymmetric approach, the radiation-conductive heat transfer in the volume of the heatingunit was modeled in the gray-body approximation tak-ing into account the crystallization of the silicon melt.Specific features of the temperature distributions in acrystal were considered for different growth stages asapplied to a typical heating unit. The calculations wereperformed using the CRYSTMO software [1].
A preliminary stage in the analysis of the defect for-mation in Si crystals is the calculation of the thermalhistory of the crystal growth. Since the thermal pro-cesses are fairly fast, the entire growth process was rep-resented as a sequence of independent stationary stages(10, 15, …, 100% of the cylindrical part of the ingot)for a specific geometry of the heating unit. Taking intoaccount the data obtained within the global thermalmodel, we calculated the analytical expressions for thetemperature field in the growing crystal T(τ, r, z) at anyinstant of time and for any point of the crystal with dueregard for the shape of the crystallization front.
Variable geometric parameters of the growth pro-cess, which strongly affect the heat exchange in theheating unit and changes in the temperature field in thecrystal, are the positions of the crucible and the heater;
610
810
1010
1210
1410
1210
1510 18
10
Fig. 1. Distributions of isotherms in the heating unit for thegrowth stage 100% body. Numbers indicate tempera-ture (°C).
CRY
the melt height; the crystal length; and the pulling rateVp (varied by a certain program).
The effect of the crucible-related heat shield on thetemperature field in the crystal in the growth stage of100% is shown in Fig. 1: large axial temperature gradi-ents are observed in the crystal part located in the cru-cible region.
ANALYSIS OF THE DISTRIBUTIONS OF INTRINSIC POINT DEFECTS
AND COMPARISON WITH EXPERIMENTAL DATA
The nonstationarity of the growth process is takeninto account by changing the temperature field in thisregion, depending on time or (which is the same) theparameter. These data are taken from the global thermalmodel in the analytical form. Taking into account thetemperature field within the nonstationary model of thev–i recombination [2], we calculated the distributionsof the residual concentrations of vacancies Cv andinterstitials Ci (Fig. 2). The results correspond to thegrowth stage of 40% in the regime of inverted pullingrate, at Vp = 0.4 mm/min. In this stage, large tempera-ture gradients occur and the crystal grows in the inter-stitial (i) regime, whereas at lower pulling rates themixed vacancy–interstitial regime is implemented. It isnoteworthy that the i regime is implemented only at the
0
–10 –5 0 5 10
5
10
15
20
z, cm
r, Òm
20
18
19
20
18
9
23
25
21
19
17
Fig. 2. Distribution of isolines of the residual concentrationdifference ∆C = Ci – Cv after the v–i recombination for thegrowth stage 40% body at Vp = 0.4 mm/min. Numbers on
the isolines indicate: ∆C = (1) –2.2 × 10¹⁴, (3) –1.6 × 10¹⁴,(5) –1 × 10¹⁴, (7) –4.5 × 10¹³, (9) 0, (11) 4.3 × 10¹², (13)6.2 × 10¹², (15) 1.3 × 10¹³, (17) 4.2 × 10¹³, (19) 7.1 × 10¹³,(21) 7.6 × 10¹³, (23) 8.1 × 10¹³, and (25) 1.0 × 1014 cm–3.
STALLOGRAPHY REPORTS Vol. 50 Suppl. 1 2005

THEORETICAL AND EXPERIMENTAL STUDY S161
9
67
119
1314
15
12
12 9
9
7
6 5
4
10
20
30
40
50
60
70
800–10 10
10
20
30
40
50
60
70
800.4 0.6 0.8 1.0 1.2
i
v
i/v -boundary
v
r, cm Vp, mm/min
z, % z, %(a) (b)
(c)
5
Fig. 3. Calculated and experimental data. (a) Calculated distribution of isolines of the residual concentration difference after the v–i recombination. Numbers on the isolines indicate: ∆C = (1) –1.5 × 10¹⁴, (3) –1.3 × 10¹⁴, (5) –9.2 × 10¹³, (7) –5.9 × 10¹³, (9) –2.6 ×10¹³, (11) 0, (13) 2.4 × 10¹³, (15) 5.8 × 10¹³, (17) 9.1 × 10¹³, (19) 1.2 × 10¹⁴, (21) 1.6 × 10¹⁴, (23) 1.9 × 10¹⁴, and (25) 2.2 ×1014 cm−3. (b) Pulling rate distribution along the ingot axis. (c) Experimental carrier lifetime map for the Si crystal grown in theclosed thermal zone (v and i denote the regions corresponding to the vacancy and interstitial regimes, respectively; v /i is the bound-ary separating these regions).
ingot periphery and a vacancy ring with a radius ROSFarises at the crystal center.
To illustrate the nonstationary changes in the two-dimensional (2D) distributions of intrinsic point defectsafter the v–i recombination, we performed calculationsfor all (10–100%) growth stages. At a more detailedvariation in the parameter, the values of Ci and Cv werecalculated by an interpolation of the temperature andpulling rate to intermediate time intervals. The 2D dis-tribution maps obtained by calculating the distributionof the residual concentration difference over the crystallength are shown in Fig. 3a. The corresponding profileof the pulling rate Vp, averaged per hour of the growthprocess, is shown in Fig. 3b. Changes in the position of
CRYSTALLOGRAPHY REPORTS Vol. 50 Suppl. 1 2
the v /i boundary corresponding to the calculated datacan be clearly seen in the experimental carrier lifetimemap (Fig. 3c). Comparison of the position and shape ofthe v /i boundary in Figs. 3a and 3b shows their com-plete coincidence.
ANALYSIS OF THE FORMATION OF VACANCY MICRODEFECTS
We developed the theory of the formation ofvacancy microdefects (pores and oxide particles) pro-posed in [3] to calculate the 2D distributions of thesemicrodefects in single-crystal silicon ingots using theabove-mentioned data on the specific thermal history of
005

S162 VEREZUB et al.
the crystal and the calculated distributions of residualintrinsic point defects after the v–i recombination.
Important parameters determining the perfection ofdislocation-free Si single crystals are the density ofmicrodefects and their size. The radial distributions ofthese parameters for two designs of heating units oper-ating in the conventional fast pulling regime are shownin Figs. 4a and 4b. Note that micropores are dominantamong microdefects. The density of oxide particles ishigh only in a narrow layer near the lateral ingot sur-face. Micropores are larger in size than oxide particlesby a factor of about 5.
EXPERIMENTAL STUDY OF THE SPECIFIC FEATURES OF THE GENERATION AND MOTION
OF DISLOCATIONS IN Si WAFERS
We analyzed the specific features of the generationand motion of dislocations in Si wafers containingmicrodefects of different types that were formed due tothe decomposition of the supersaturated solid solution
1 2 3 4 5 6 7 8 9 10
2 × 10⁶
3 × 10⁶
4 × 10⁶
5 × 10⁶
6 × 10⁶
Nv, cm–3
Nv
Np
101
100
102
103
104
105
106
107
Np, cm–3
Np
90
80
70
60
50
40
30
100Rv, nm Rp, nm
5
7
9
11
13
15
17
19Rp
Rp
Rv
Rv
2 4 6 8 100r, cm
(b)
(a)
0
Fig. 4. Radial distributions of the concentrations and sizesof vacancy microdefects: (a) concentrations of pores andoxide particles (Nv and Np, respectively) and (b) sizes ofpores and oxide particles (Rv and Rp, respectively). Lineswith and without circles correspond to the heating unitswithout and with a thermal shield, respectively.
Nv
CRY
of oxygen occurring during multistep heat treatmentsof Si wafers (used to form an internal getter) and as aresult of the application of external loads.
Experimental samples were cut from 150-mmwafers of dislocation-free single-crystal Si of thevacancy type [4] grown by the Czochralski methodalong the ⟨100⟩ direction. The concentration of oxygendissolved in the samples was (7–8) × 1017 cm–3. Theresistivity of the samples was ~10 Ω cm. The wafersunder study were subjected to different multistep heattreatments, including the regime of internal getter for-mation. The heat treatment regimes used by us arelisted in Table 1. Samples for mechanical tests wereshaped as parallelepipeds 25 × 4 × 0.6 mm3 in size withthe largest face oriented in the 100 plane; the longestside was oriented along the ⟨110⟩ direction. The sam-ples were chemically polished in an acid mixture HF :HNO3 = 1 : 6 for 5 min to remove a ~40-µm layer fromthe surface. After this procedure, the sample understudy was placed in a four-point bend test system.Mechanical tests were performed at t = 600°C.
The stresses causing the generation of dislocationsfrom internal sources in the wafer bulk were deter-mined by the start of the intense generation of disloca-tions in the regions located at a large distance from thesupports and the sample edges. Selective chemicaletching of such samples revealed pronounced slip lineson their surface and the samples themselves showedmacroscopic bending. The structural features of thesamples were investigated by the methods of opticalmicroscopy (with selective etching in the Yang etchant[5]) and transmission electron microscopy (TEM).
In the context of the data obtained by us, the schemeof evolution of the defects related to the decompositionof the supersaturated solid solution of oxygen duringthe formation of the internal getter in Si wafers is as fol-lows.
At low-temperature (nucleation) annealing (450 or650°C), the decomposition of the supersaturated solidsolution of oxygen is accompanied by the formation ofatomic conglomerates having donor properties. Weshowed previously [6] by diffuse X-ray scattering thatimpurity clouds are formed in this stage of a multistepheat treatment. These clouds are regions with a higher(in comparison with the matrix) content of dissolvedoxygen; i.e., they are similar to Guinier–Preston zones.The size of the impurity clouds is 0.2–5 µm. With anincrease in the duration or temperature of nucleationannealing, the impurity clouds vanish, leaving largeatomic conglomerates (up to several hundred atoms),which serve as nuclei of future oxygen-containing pre-cipitates.
In the initial stages of the growth annealing at1000°C, small quasi-two-dimensional oxygen-contain-ing precipitates, coherent with the matrix, are formed in
STALLOGRAPHY REPORTS Vol. 50 Suppl. 1 2005

THEORETICAL AND EXPERIMENTAL STUDY S163
the samples. These precipitates are 20–25 nm in sizeand shaped as plates (Fig. 5a).
When the size of precipitates becomes as large as30–40 nm, they acquire a pronounced plate-like shapewith a ratio of the linear size to the thickness of about10 : 1. In this stage of decomposition, plate-like precip-itates begin to lose coherence with the environment.Perfect dislocation loops are formed around plate-likeprecipitates (Fig. 5b).
Plate-like precipitates grow with an increase in thegrowth annealing time. When they become as large as50–60 nm in size, the generation of prismatic disloca-tion loops begins by the mechanism of prismatic extru-sion, leading to the formation of linear precipitate–dis-location complexes (Fig. 5c). The average size of suchcomplexes is 2–3 µm.
Further growth of precipitates occurs with the grad-ual transformation of their shape, which manifests itselfprimarily in an increase in the precipitate thickness.Precipitates with linear sizes of 250–300 nm are shapedas parallelepipeds with a ratio of the linear sizes to thethickness of about 4 : 1. This transformation is accom-panied by the formation of bulk dislocation tanglesaround precipitates; i.e., globular precipitate–disloca-tion complexes arise (Fig. 5d). The development ofglobular precipitate–dislocation complexes is accom-panied by secondary oxygen precipitation at climbingdislocation fragments, which sometimes leads to thesecondary prismatic extrusion of dislocation loops. Thesizes of globular precipitate–dislocation complexesgenerally do not exceed 1 µm.
In addition to the above-described defects, in thelater stages of the decomposition of the supersaturatedsolid solution of oxygen, the wafers also contain inter-stitial stacking faults 3–3.5 µm in size (Fig. 5e), dislo-cation dipoles 3–4 µm in size (Fig. 5f), and perfect dis-location loops (50–200 nm).
The results of the investigation of the structural fea-tures of thermally treated samples are listed in Table 2.TEM study revealed no defects in the samples of series 1and 2. According to the diffuse X-ray scattering data,impurity clouds 0.2–5 µm in size are present in thesamples of series 1, and the samples of series 2 containatomic conglomerates (nuclei of oxygen-containingprecipitates). Figure 6 shows the results of the measure-ment of shear stresses σgen corresponding to the start ofthe intense generation of dislocations from internalsources in the samples under consideration. In the ther-mally treated samples of series 1 and 2, we observed asignificant increase in σgen in comparison with the as-grown state. According to the TEM data, an avalanche-like generation of dislocations occurs in these samples:a large number of sources (apparently, of the same type)generate dislocations almost simultaneously. Thenature of these sources has not yet been established.The largest increase in σgen was observed in the samples
CRYSTALLOGRAPHY REPORTS Vol. 50 Suppl. 1 2
of series 3, in which plate-like precipitates play the roleof heterogeneous nucleation centers.
Multistep heat treatments used in the conventionaltechnique of the formation of an internal getter inwafers (samples of series 4–6) lead to their significantsoftening. In these samples, the values of σgen are muchsmaller than in the as-grown samples. A characteristicfeature of the samples of these series is the presence ofrelatively large microdefects: linear precipitate–dislo-cation complexes, globular precipitate–dislocationcomplexes, stacking faults, and dislocation dipoles(Table 2). An especially significant decrease in σgen isobserved in the samples of series 6, which have fairlyhigh concentrations of stacking faults and dislocationdipoles. According to the TEM data, it is these defectsthat are the most effective centers of the heterogeneousnucleation of dislocations. In comparison with thesedefects, globular precipitate–dislocation complexesshow much lower activity as centers of the heteroge-neous nucleation of dislocations under the action ofexternal loads. Small plate-like precipitates are leasteffective as centers of the heterogeneous nucleation ofdislocations under external loads.
ANALYSIS OF THE GENERATIONOF DISLOCATIONS IN Si WAFERS
DUE TO STRESSES CAUSED BY THE WAFER WEIGHT AND NONUNIFORM
HEATING
To analyze the probability of dislocation generationin Si wafers due to stresses caused by the wafer weightand nonuniform heating, it is necessary to know thelevel of actual stresses occurring during a heat treat-ment. The stress threshold, above which heterogeneoussources begin to generate dislocations in Si wafersunder certain conditions, was experimentally deter-mined in [7, 8]. During the annealing, a wafer is freely
Table 1. Regimes of multistep heat treatment of Si wafers
Series no. Heat treatment regime
1 1000°C/15 min + 450°C/16 h
2 1000°C/15 min + 650°C/16 h
3 1000°C/15 min + 650°C/16 h + 800°C/4 h + 1000°C/0.5 h
4 1000°C/15 min + 650°C/16 h + 800°C/4 h + 1000°C/4 h
5 1000°C/15 min + 650°C/16 h + 800°C/4 h + 1000°C/16 h
6 1000°C/15 min + 450°C/16 h + 650°C/16 h + 1000°C/4 h
005

S164 VEREZUB et al.
0.15 µm 50 nm
0.5 µm 0.5 µm
1 µm 500 nm
(a) (b)
(c) (d)
(e) (f)
Fig. 5. TEM images of defects in the samples of series 3–6: (a) planar matrix-coherent precipitates, (b) planar precipitates sur-rounded by a perfect dislocation loop, (c) linear precipitate–dislocation complexes, (d) globular precipitate–dislocation complexes,(e) stacking faults, and (f) dislocation dipoles.
placed on three or four symmetrically arranged sup-ports.
The mathematical statement of the problem withspecified edge conditions was formulated in [9]. Thegeneral strain pattern changes only slightly with achange in the number of supports and is rather compli-cated. On the basis of the bending scheme we used, thestrain in the wafer was analyzed at three characteristicpoints at which maximum changes were observed witha change in the radial position of the supports. Figure 7shows the dependences of the strain at the characteristicpoints on the support area for the wafers placed on threeor four supports located at a distance of 0.7R from thewafer center, where R is the wafer radius. For eachscheme of the support location, the strains at the chosen
CRY
characteristic points depend weakly on the support con-tact area. The increase in the number of supports from3 to 4 makes it possible to decrease significantly thewafer bending, especially at point 1 (the peripheralpoint located at the largest distance from the support).
The maximum values of the von Mises stress σM areobserved near the support points. It can be clearly seenfrom the data shown that the stresses are the lowestwhen the supports are located at a distance of (0.6–0.7R) from the wafer center. Figure 8 shows the depen-dence of the maximum values of σM for a 300-mmwafer at different radial locations of three and four sup-ports. The increase in the wafer diameter from 200 to300 mm leads to an increase in the maximum strains bya factor of about 4.5 (calculation was performed for
STALLOGRAPHY REPORTS Vol. 50 Suppl. 1 2005

THEORETICAL AND EXPERIMENTAL STUDY S165
Table 2. TEM data on microdefects in thermally treated Si wafers
Series no.
Type, size, and density of microdefects
impurity clouds* atomic conglomerates coherent plate-likeprecipitates
coherent plate-like precipi-tates with a dislocation loop
1 0.2–5 µm**,3 × 108 cm–3***
absent absent absent
2 absent present absent absent
3 absent absent 25–30 nm, 4.3 × 109 cm–3 absent
4 absent absent absent 300 nm, 3 × 1010 cm–3
5 absent absent absent 150 nm
6 absent absent 25 nm, 5.8 × 1011 cm–3 100 nm, 3 × 1010 cm–3
Series no.
Type, size, and density of microdefects
linear precipitate–disloca-tion complexes
globular precipitate–dislo-cation complexes stacking faults dislocation dipoles
1 absent absent absent
2 absent absent absent
3 absent absent absent absent
4 2 µm, 2.8 × 1010 cm–3 0.8 µm, 7 × 109 cm–3 2 µm, 2.5 × 108 cm–3 absent
5 5 µm, 6 × 1010 cm–3 2 µm, 9 × 1010 cm–3 2 µm, 9 × 109 cm–3 absent
6 absent absent 1.5–2 µm, 5 × 109 cm–3 3–4 µm, 4.5 × 108 cm–3
* Diffuse X-ray scattering data [6]. ** Size of microdefects.*** Density of microdefects.
wafers of the same thickness: 1000 µm). Figure 9shows the comparative data on the dependence of themaximum values of σM on the support area for a300-mm Si wafer located on three or four supports. As
3
25
Grown-in 4 5 6n
1–2state
0
50
75
100
125
150
175σgen, MPa
Fig. 6. Measured stresses σgen corresponding to the start ofthe intense generation of dislocations from internal sourcesfor the samples from different series (n is the number of aseries).
CRYSTALLOGRAPHY REPORTS Vol. 50 Suppl. 1 20
one would suggest, the region of maximum stressesdecreases with a decrease in the support area due to adecrease in the size of the perturbation region at thecontact between the wafer and the support. It is note-
point 1
0
–16
0.5 1.0 1.5 2.0 2.5 3.0S, mm2
–20
–12
–8
–4
0
4
–16
–20
–12
–8
–4
0
4
Supports
∆z, µm
point 2point 3
point 1point 2point 3
1
2
3
1
2
3
Supports
Fig. 7. Dependence of the gravitational strain at character-istic wafer points on the support area S for wafers located on(a) three and (b) four supports.
(a)
(b)
05

S166 VEREZUB et al.
0.50
1.0
0.55 0.60 0.65 0.70 0.75
σM, MPa
rsup/R
0.5
1.5
2.0
2.5
3.03 supports4 supports
Fig. 8. Dependence of the maximum stress σmax for a300-mm wafer at different radial arrangements of three andfour supports.
σM, MPa
3 supports4 supports
1
1
0.1S, mm2
2
3
4
5
6
Fig. 9. Dependences of the maximum stress σmax on thesupport area for a 300-mm Si wafer located on three andfour supports (rsup/R = 0.7).
0 20 40 60 80 100 120 1400.010
0.015
0.020
0.025
0.030
0.035
r, mm
σM, MPa
Fig. 10. Radial distribution of the thermal stress σmax for a300-mm wafer, calculated for a radial temperature drop of 1 K.
CRY
worthy that the general level of stresses in the mainregion of the wafer increases with a decrease in the con-tact area, still remaining sufficiently low (0.01–0.05 MPa). The dependences in Fig. 9 indicate that inthe case of four supports the maximum stresses σmaxdecrease by a factor of 2 for a contact area of 2 mm2.This difference increases even more with a decrease inthe contact area. Thus, the change from three to foursupports makes it possible to decrease significantlyboth the level of maximum stresses in the contactregion (by more than a factor of 2) and the level ofstresses in the entire wafer. In this case, the maximumwafer bending also significantly decreases (by a factorof about 3).
Thermoelastic stresses result from the nonuniformtemperature distribution in the wafer plane, which isrelated to the heating conditions. The conventionalapproach was used in the calculation. As in the case ofthe action of gravitational forces, we used the vonMises stress σM to characterize the strained state
Figure 10 shows as an example the results of the cal-culation of the radial distribution of the thermal stressesσM for a 300-mm wafer. The calculation was performedfor a radial temperature drop of 1 K. The temperature atthe wafer center was assumed to be 1273 K. At a radialtemperature drop of 1 K, the maximum thermal stressesσmax are 0.03 MPa, which is much lower than the grav-itational stresses. The regions of maximum thermalshear stresses are at the center and the edge of the wafer.At the same time, these stresses are minimum near thesupports, in contrast to the gravitational stresses. Themaximum thermal shear stresses for 300-mm wafers atthis temperature drop between the center and the edgeof the wafer are ~0.01 MPa. An increase in the radialtemperature drop causes a proportional increase in thethermoelastic stresses. Calculation shows that the max-imum thermal stresses occurring during thermalannealing are comparable in magnitude with maximumgravitational stresses only for 200-mm wafers at radialtemperature drops below 10 K. For 300-mm wafers,even at the same radial temperature drops, the gravita-tional stresses greatly exceed the thermal ones.
Thus, the three-dimensional problem of determin-ing the field of elastic stresses caused by the waferweight is solved in the isotropic approximation for 200-and 300-mm Si wafers located on three or four symmet-rically arranged point supports with different contactareas.
ACKNOWLEDGMENTS
This study was supported by the Russian Founda-tion for Basic Research, project no. 04-02-17168.
REFERENCES
1. N. A. Verezub, M. G. Mil’vidskiœ, and A. I. Prostomolo-tov, Materialovedenie, No. 3, 2 (2004).
STALLOGRAPHY REPORTS Vol. 50 Suppl. 1 2005

THEORETICAL AND EXPERIMENTAL STUDY S167
2. A. I. Prostomolotov, in Proceedings of 4th InternationalConference on Single Crystal Growth and Heat andMass Transfer, Obninsk, Russia, 2001 (Obninsk, 2001),Vol. 3, p. 689.
3. V. V. Voronkov, Mater. Sci. Eng. B 73, 69 (2000).4. V. V. Voronkov and R. Falster, J. Cryst. Growth 204, 462
(1999).5. K. H. Yang, J. Electrochem. Soc. 131, 1140 (1984).6. V. T. Bublik, S. Yu. Matsnev, K. D. Shcherbachev, et al.,
Fiz. Tverd. Tela (St. Petersburg) 45 (10), 1825 (2003)[Phys. Solid State 45 (10), 1918 (2003)].
CRYSTALLOGRAPHY REPORTS Vol. 50 Suppl. 1 20
7. M. V. Mezhennyœ, M. G. Mil’vidskiœ, V. F. Pavlov, andV. Ya. Reznik, Fiz. Tverd. Tela (St. Petersburg) 43 (1),47 (2001) [Phys. Solid State 43 (1), 47 (2001)].
8. M. V. Mezhennyœ, M. G. Mil’vidskiœ, V. F. Pavlov, andV. Ya. Reznik, Fiz. Tverd. Tela (St. Petersburg) 44 (7),1230 (2002) [Phys. Solid State 44 (7), 1284 (2002)].
9. M. V. Mezhennyœ, M. G. Mil’vidskiœ, and A. I. Prostomo-lotov, Fiz. Tverd. Tela (St. Petersburg) 45 (10), 1794(2003) [Phys. Solid State 45 (10), 1884 (2003)].
Translated by Yu. Sin’kov
05

Crystallography Reports, Vol. 50, Suppl. 1, 2005, pp. S16–S21.Original Russian Text Copyright © 2005 by Kuznetsov, Rubtsov, Kognovitskaya.
STRUCTUREOF INORGANIC COMPOUNDS
Stabilization of Lattice Period in Quinary Solid Solutions of the A3B5 Compounds
V. V. Kuznetsov*, E. R. Rubtsov*, and E. A. Kognovitskaya*** St. Petersburg State University of Electrical Engineering (LETI), St. Petersburg, Russia
e-mail: [email protected]** Ioffe Physicotechnical Institute, Russian Academy of Sciences,
Politekhnicheskaya ul. 26, St. Petersburg, 194021 RussiaReceived February 3, 2005
Abstract—The stabilizing effect of elastic strains on the lattice period of a quinary solid solution is considered.The expression for the stabilization factor for quinary solid solutions of the AxB1 – xCyDzE1 – y – z type is derived.It is shown that the stabilizing influence of the substrate sharply increases in the vicinity of the region of thechemical spinodal. The stabilization factors are calculated for the GaxIn1 – xPyAszSb1 – y – z andAlxGayIn1 − x − yPzAs1 – z quinary solid solutions isoperiodic to InAs, GaSb, and GaAs. It is shown that in theregion of thermodynamic instability the stabilization factor has negative values. The changes in the compositionof the above elastically strained quinary solid solutions are analyzed with respect to the equilibrium composi-tion. It is also shown that stabilization of the lattice period does not signify the stabilization of its composition.© 2005 Pleiades Publishing, Inc.
As is well known [1, 2], elastic strains arising at themismatch of the lattice periods of the epitaxial solid-solution layer and the substrate give rise to changes inthe solid-solution composition, which, in turn, changesthe period of its crystal lattice. In this case, the latticeperiod of the layer becomes close to the lattice periodof the substrate. In other words, the indicated elasticstrains have a stabilizing effect on the lattice period ofthe solid solution.
Qualitatively, this effect was described with the aidof a specially introduced stabilization factor [3, 4] inthe form
(1)
where a0 is the lattice period of the solid solution crys-tallized under the conditions of thermodynamic equi-librium; a1 is the lattice period of the epitaxial layer inthe free state, i.e., after the removal of strains; and as isthe period of the substrate lattice. The technique for cal-culation of …A3B5 was reported in [3, 4].
Below, we consider the characteristic features of thecalculation of the stabilization factor for quinary sys-tems. This calculation is based on the method of calcu-lation of the contact supersaturation considered in [5].In essence, the method reduces to the following. Know-ing the composition x0, y0, and z0 of the solid solution,one determines the composition of the liquid phase atthe given temperature from the equations of the equilib-rium phase diagram. Once the composition of the liquidphase is found, one may also determine the composi-tion of the solid solution, x1, y1, and z1, from the equa-tions of the coherent phase diagram. The composition
q a0 as–( )/ a1 as–( ),=
1063-7745/05/5001-S $26.000016
of the equilibrium solid solution, x0, y0, z0, is used toobtain the equilibrium period of the crystal lattice, a0,and, using the composition of the elastically stressedsolid solution, x1, y1, z1, also the deformed lattice perioda1. However, such a sequence of stabilization-factorcalculations is too cumbersome and complicated. Inorder to simplify this procedure, we first derive the for-mula for the stabilization factor of the lattice period forA3B5-based quinary systems. With this aim, we derive theexpression relating the stabilization factor q to the solid-solution composition and the process temperature.
The state of the thermodynamic liquid–solid equi-librium is described by the corresponding change in thefree energy of the quinary system, which is equal tozero [6],
(2)
where n0i is the number of moles of the ith component
per mole of the solid solution and (T0) is the chemi-cal potential of the ith component in the liquid phase atthe equilibrium temperature T0. Under the conditions ofphase equilibrium, the following conditions are ful-filled for a quinary system:
(3)
∆G0s Gs x0 y0 z0 T0, , ,( ) n0iµi
l T0( )i 1=
5
∑– 0,= =
µil
∂∆G0s /∂x( )x x0=
y y0=z z0=
0;=
∂∆G0s /∂y( )x x0=
y y0=z z0=
0; ∂∆G0s /∂z( )x x0=
y y0=z z0=
0.= =
© 2005 Pleiades Publishing, Inc.

STABILIZATION OF LATTICE PERIOD IN QUINARY SOLID SOLUTIONS S17
When considering the state of the coherent metasta-ble equilibrium, one has to take into account the energyof elastic strains changing the equilibrium temperatureand, thus, also the solid-solution composition:
(4)
where ni is the number of moles of the ith componentper mole of elastically stressed solid solution and Gel isthe elastic energy of the strained solid phase. In thiscase
(5)
Subtracting Eq. (2) from Eq. (4) and assuming thatin both cases the liquids of the equivalent compositionscorrespond to the phase equilibrium, we arrive at thefunction g(x1, y1, z1, T1)
(6)
Expanding the function g(x1, y1, z1, T1) into a Taylorseries in degrees of ∆x, ∆y, ∆z, and ∆T with due regardfor Eq. (3) and the linear approximation of its tempera-ture dependence, we obtain
(7)
∆G1s Gs x1 y1 z1 T1, , ,( ) Gel niµi
l T1( )i 1=
5
∑–+ 0,= =
∂∆G1s /∂x( )x x0=
y y0=z z0=
0;=
∂∆G1s /∂y( )x x0=
y y0=z z0=
0; ∂∆G1s /∂z( )x x0=
y y0=z z0=
0.= =
g x1 y1 z1 T1, , ,( )
= Gs x1 y1 z1 T1, , ,( ) Gs x0 y0 z0 T0, , ,( )–
– niµil T1( ) n0iµi
l T0( )–[ ]i 1=
5
∑ Gel.–=
g x1 y1 z1 T1, , ,( ) 12---
∂2g x0 y0 z0 T0, , ,( )∂x2
------------------------------------------ x1 x0–( )2≈
+12---
∂2g x0 y0 z0 T0, , ,( )∂y2
------------------------------------------ y1 y0–( )2
+12---
∂2g x0 y0 z0 T0, , ,( )∂z2
------------------------------------------ z1 z0–( )2
+∂2g x0 y0 z0 T0, , ,( )
∂x∂y------------------------------------------ x1 x0–( ) y1 y0–( )
+∂2g x0 y0 z0 T0, , ,( )
∂x∂z------------------------------------------ x1 x0–( ) z1 z0–( )
+∂2g x0 y0 z0 T0, , ,( )
∂y∂z------------------------------------------ y1 y0–( ) z1 z0–( )
+∂g x0 y0 z0 T0, , ,( )
∂T---------------------------------------- T1 T0–( ).
CRYSTALLOGRAPHY REPORTS Vol. 50 Suppl. 1 20
Taking into account that the free energy of a mole ofquinary solid solution of the type AxB1 – xCyDzE1 – y – z inthe absence of elastic strains is determined, in fullaccordance with the approximation of a regular solu-tion, by the following expression [7]:
(8)
where are the chemical potentials of pure binarycompounds ij, which are the components of the solid
solution under consideration, and are the parame-ters of interatomic interactions in the solid phase thattake into account the deviation from the ideal solution.
The expressions for the partial derivatives of withrespect to the composition are
(9)
G0s xyµAC
0 1 x–( )yµBC xzµAD0+ +=
+ 1 x–( )zµBD0 x 1 y– z–( )µAE
0+
+ 1 x–( ) 1 y– z–( )µBE0 RT x x( )ln[+
+ 1 x–( ) 1 x–( )ln y y( )ln z z( )ln+ +
+ 1 y– z–( ) 1 y– z–( ) ]ln αABs x 1 x–( )+
+ αCDs yz αCE
s y 1 y– z–( ) αDEs z 1 y– z–( ),+ +
µij0
αkls
G0s
∂2G0s
∂x2----------- RT
x 1 x–( )------------------- 2αAB
s– δ1;= =
∂2G0s
∂y2----------- RT 1 z–( )
y 1 y– z–( )---------------------------- 2αCE
s– δ2;= =
∂2G0s
∂z2----------- RT 1 y–( )
z 1 y– z–( )--------------------------- 2αDE
s– δ3;= =
∂2G0s
∂x∂y------------ αC1 1 2x–( ) αAC BC–
s αAE BE–s–( )+=
+ z αAC AD–s αBC BD–
s–( )
+ 1 2y– z–( ) αAC AE–s αBC BE–
s–( )
– z αAD AE–s αBD BE–
s–( ) β1;=
∂2G0s
∂x∂z----------- αC2 1 2x–( ) αAD BD–
s αAE BE–s–( )+=
+ y αAC AD–s αBC BD–
s–( )
+ 1 2z– y–( ) αAD AE–s αBD BE–
s–( )
– y αAC AE–s αBC BE–
s–( ) β2,=
∂2G0s
∂y∂z----------- RT
1 y– z–( )------------------------ αCD
s αCEs– αDE
s–+ β3,= =
05

S18 KUZNETSOV et al.
where αCi is the combination of the energies of pairinteractions between the nearest tetrahedrally coordi-nated atoms from different sublattices. The parametersαCi characterize the excessive mixing energy in quinarysolid solutions determined from the formula given else-where [8].
Now, ignoring the temperature dependence of thecoefficients of component activity (because of thesmallness of ∆T) and taking into account the chemicalpotentials,
(10)
we can modify Eq. (7) to the form
(11)
In the above equation, , , and ∆ are thetemperature, enthalpy, and entropy of melting of the
binary compound ij; and are the activity coeffi-cient and concentration of the ith component in the liq-
uid phase, respectively; and are the activitycoefficients of the ith and jth components of the binary
melt of the stoichiometric composition ( = = 0.5);∆T = T0 – T1 is the equilibrium supercooling induced bystresses [9]. Introducing the notation
(12)
and using the expression for elastic energy obtained in[5], we may represent Eq. (11) in the form
(13)
µij0 µi
0 l, µ j0 l, RT γ i
slγ jsl/4( )ln ∆Sij
F TijF T–( );–+ +=
µil µi
0 l, RT γ ilxi
l( ),ln+=
12---δ1 x1 x0–( )2 1
2---δ2 y1 y0–( )2 1
2---δ3 z1 z0–( )2+ +
+ β1 x1 x0–( ) y1 y0–( ) β2 x1 x0–( ) z1 z0–( )+
+ β3 y1 y0–( ) z1 z0–( ) ∆TT0------- n0in0 jHij
F
j 3=
5
∑i 1=
2
∑–
– αABx 1 x–( ) αCDyz– αCEy 1 y– z–( )–
– αDEz 1 y– z–( ) Gel.–=
TijF Hij
F SijF
γ il xi
l
γ isl γ j
sl
xil x j
l
Heff n0in0 jHijF αABx 1 x–( )–
j 3=
5
∑i 1=
2
∑=
– αCDyz αCEy 1 y– z–( )– αDEz 1 y– z–( )–
12---δ1 x1 x0–( )2 1
2---δ2 y1 y0–( )2 1
2---δ3 z1 z0–( )2+ +
+ β1 x1 x0–( ) y1 y0–( ) β2 x1 x0–( ) z1 z0–( )+
CRY
Taking into account conditions (5) and assumingthat T0/T1 ≈ 1 (because, in practice, ∆T does not exceedseveral degrees), we may differentiate Eq. (13) withrespect to composition to obtain
(14)
where kx = ∂a/∂x, ky = ∂a/∂y, and kz = ∂a/∂z.Now, it is easy to modify Eqs. (14) to the form
(15)
Now, the dependence of the lattice period on thecomposition is represented as
(16)
Substituting Eq. (14) into Eq. (15), we obtain
Equation (17) for the stabilization factor corre-sponds to the left-hand side of the equation of a coher-ent spinodal [10]. The expression in the fractiondenominator corresponds to the equation of chemicalspinodal. This fact results in the infinite value of the sta-
+ β3 y1 y0–( ) z1 z0–( ) ∆TT0-------Heff– σ a1 as–( ).–=
δ1 x1 x0–( ) β1 y1 y0–( ) β2 z1 z0–( )+ +
= 2σ a1 as–( )kx,–
δ2 y1 y0–( ) β1 x1 x0–( ) β3 z1 z0–( )+ +
= 2σ a1 as–( )ky,–
δ3 z1 z0–( ) β2 x1 x0–( ) β3 z1 z0–( )+ +
= 2σ a1 as–( )kz,–
x1 x0– 2σ a1 as–( )=
×kx β3
2 δ2δ3–( ) ky δ3β1 β2β3–( ) kz δ2β2 β1β3–( )+ +
δ3 δ1δ2 β12–( ) β3 β1β2 δ1β3–( ) β2 β1β3 δ2β2–( )+ +
--------------------------------------------------------------------------------------------------------------------------;
y1 y0– 2σ a1 as–( )=
×kx δ3β1 β2β3–( ) ky β2
2 δ1δ3–( ) kz δ1β3 β1β2–( )+ +
δ3 δ1δ2 β12–( ) β3 β1β2 δ1β3–( ) β2 β1β3 δ2β2–( )+ +
--------------------------------------------------------------------------------------------------------------------------;
z1 z0– 2σ a1 as–( )=
×kx δ2β2 β1β3–( ) ky δ1β3 β1β2–( ) kz β1
2 δ1δ3–( )+ +
δ3 δ1δ2 β12–( ) β3 β1β2 δ1β3–( ) β2 β1β3 δ2β2–( )+ +
--------------------------------------------------------------------------------------------------------------------------.
a1 a0– kx x1 xs–( ) ky y1 ys–( ) kz z1 zs–( ).++=
q 1 2σ kx2 δ2δ3 β3
2–( ) ky2 δ1δ3 β2
2–( )+[+=
+ kz2 δ1δ2 β1
2–( ) 2kxky β2β3 δ3β1–( )+
+ 2kxkz β1β3 δ2β2–( )
+ 2kykz β1β2 δ1β3–( ) ]/ δ3 δ1δ2 β12–( )[
+ β3 β1β2 δ1β3–( ) β2 β1β3 δ2β2–( ) ].+
Fig. 1. Stabilization factor in (a) GaxIn1 – xPyAszSb1 – y – z/InAs ⟨111⟩ and (b) GaxIn1 – xPyAszSb1 – y – z/GaSb ⟨100⟩ at f = –1% andT = 773 K and (c)AlxGayIn1 – x – yPzAs1 – z/GaAs ⟨100⟩ at f = –1% and T = 1073 K; (1) positive and (2) negative values.
STALLOGRAPHY REPORTS Vol. 50 Suppl. 1 2005

STABILIZATION OF LATTICE PERIOD IN QUINARY SOLID SOLUTIONS S19
10000
1000
100
10
±1
–10
–100
–1000–10000
0
0.2
0.4
0.6
0.8
1.0 1.0
0.8
0.6
0.4
0.2
012
111
2
00 0.2
0.2 0.40.4 0.60.6 0.80.8 1.01.0 X, m
ol fraction
Z, mol fraction
Z, mol fraction X, m
ol fra
ction
1000
100
10
±1
–10
–100
–1000
q
00.2
0.40.6
0.81.0
00.14
0.280.42
0.560.70
1
2
1
Y, mol fraction X, mol fraction
0
0.14
0.28
0.42
0.56
0.70
0
0.2
0.4
0.6
0.8
1.0
1
2
1
X, mol
fracti
onY, mol fraction
(a)
(b)
1000
100
10
±1
–10
–100
–1000
q
00.2
0.40.6
0.81.0
00.14
0.280.42
0.560.70
Y, mol fraction X, mol fraction
0
0.14
0.28
0.42
0.56
0.70
0
0.2
0.4
0.6
0.8
1.0
X, mol
fracti
onY, mol fraction
1
2
1
1
1
2
(c)
CRYSTALLOGRAPHY REPORTS Vol. 50 Suppl. 1 2005

S20 KUZNETSOV et al.
0.15
0.09
0.03
–0.03
–0.09
–0.15
dXi, mol fraction
00.2
0.40.6
0.81.01.0 X, mol fraction
0.80.6
0.40.2
0
Z, mol fraction
1
2
34
0.20
0.12
0.04
–0.04
–0.12
–0.20
dXi
00.2
0.40.6
0.81.0
00.14
0.280.42
0.560.70
1
2
3
4
X, mol fraction
Y, mol fraction
(a)
(b)
Fig. 2. The change of the composition of elastically stressed solid solution with respect to the equilibrium composition. (a) TheAlxGayIn1 – x – yPzAs1 – z/GaAs ⟨100⟩ at f = – 1% and T = 1073 K; (1) In, (2) Al, (3) Ga, (4) P; and (b) GaxIn1 – xPyAszSb1 – z/GaSb⟨100⟩ at f = – 1% and T = 773 K; (1) Sb, (2) As, (3) Ga, and (4) P.
bilization factor at the boundary of the spinodal decom-position region. In practice, this signifies that the stabi-lizing effect of the substrate dramatically increases inthe vicinity of the chemical-spinodal region.
CRY
The stabilization factor for quinary solid solutions ofthe composition GaxIn1 – xPyAszSb1 – y – z isoperiodic toInAs and GaSb at the crystallographic orientations 100and 111 (T = 773 K) and AlxGayIn1 – x – yPzAs1 – z/GaAs
STALLOGRAPHY REPORTS Vol. 50 Suppl. 1 2005

STABILIZATION OF LATTICE PERIOD IN QUINARY SOLID SOLUTIONS S21
at the crystallographic orientation 100 (T = 1073 K)was calculated with the use of the thermodynamicparameters from [11]. The data obtained are presentedin Fig. 1.
Analysis of the calculated data shows that, in theregion of thermodynamic instability, the stabilizationfactor takes negative values. This is explained by thechange in curvature of the curve of the free energy ofthe solid-solution composition, which results in a rever-sal of the sign of ∆a.
It is for this reason that the values of contact super-cooling in the region of spinodal decomposition alsohave negative values [5]. The negative ∆TK indicatesthat in this region the contacting phase is not the super-saturated but undersaturated liquid phase, which givesrise to substrate dissolution in this region. SubstitutingEqs. (15) into Eqs. (13), we arrive at a simple formulafor evaluating contact supercooling in the form
(17)
The above equation is valid for ternary, quaternary,and quinary systems [2, 4]. It is seen that, at negativestabilization factors, the ∆T value also becomes nega-tive.
In quinary and quaternary solid solutions, stabiliza-tion of the lattice periods does not signify the stabiliza-tion of the solid-solution composition. This is confirmedby the analysis of composition variations in elasticallystressed solid solutions with respect to the equilibriumsolid solution performed for quinary solid solutions ofthe compositions AlxGayIn1 − x − yPzAs1 − z/GaAs andGaxIn1 – xPyAszSb1 – y – z/GaSb. Examples of such calcu-lations are illustrated by Fig. 2.
Thus, we derived an expression for the stabilizationfactor of quinary solid solutions of theAxB1 − xCyDzE1− y – z type. We also analyzed the stabiliz-ing effect of elastic strains on the lattice period of qui-
∆T T0/Heff( )σ a0 as–( )2/q.=
CRYSTALLOGRAPHY REPORTS Vol. 50 Suppl. 1 20
nary solid solution for an example of the Ga–In–P–As–Sb and Al–Ga–In–P–As systems.
REFERENCES
1. V. V. Kuznetsov, P. P. Moskvin, and V. S. Sorokin,J. Cryst. Growth 88, 241 (1988).
2. V. V. Kuznetsov, P. P. Moskvin, and V. S. Sorokin, Non-equilibrium Effects in Liquid-phase Heteroepitaxy ofSemiconductor Solid Solutions (Metallurgiya, Moscow,1991) [in Russian].
3. V. V. Voronkov, L. M. Dolginov, A. N. Lapshin, andM. G. Mil’vidskiœ, Kristallografiya 22 (2), 375 (1977)[Sov. Phys. Crystallogr. 22 (2), 211 (1977)].
4. V. S. Sorokin, Kristallografiya 31 (5), 844 (1986) [Sov.Phys. Crystallogr. 31 (5), 500 (1986)].
5. É. R. Rubtsov, V. V. Kuznetsov, V. I. Ratushnyœ, andE. A. Kognovitskaya, Zh. Fiz. Khim. 77 (2), 197 (2003)[J. Phys. Chem. 77 (2), 197 (2003)].
6. A. A. Selin and V. A. Khanin, Zh. Fiz. Khim., No. 11,2734 (1979).
7. V. S. Sorokin and É. R. Rubtsov, Neorg. Mater. 29 (1), 28(1993).
8. É. R. Rubtsov, V. V. Kuznetsov, and O. A. Lebedev,Neorg. Mater. 34 (5), 525 (1998).
9. Yu. B. Bolkhovityanov, Contact Phenomena at thePhase Boundary before Liquid-phase Epitaxy of A3B5
Compounds (Inst. Fiz. Poluprovodn. SO Akad. NaukSSSR, Novosibirsk, 1982) [in Russian].
10. V. V. Kuznetsov, É. R. Rubtsov, and I. I. Parfenova, Izv.Vyssh. Uchebn. Zaved., Tsvetn. Metall., No. 3, 57(1997).
11. É. R. Rubtsov, V. S. Sorokin, and V. V. Kuznetsov, Zh.Fiz. Khim. 71 (3), 415 (1997) [J. Phys. Chem. 71 (3),346 (1997)].
Translated by L. Man
05

Crystallography Reports, Vol. 50, Suppl. 1, 2005, pp. S168–S172.Original Russian Text Copyright © 2005 by Éfendiyev, Ali-zade, Zubov.
CRYSTALGROWTH
Synthesis of Polymer Magnetic Microspheres and Studyof Their Magnetic Properties
É. H. Éfendiyev*, R. A. Ali-zade*, and V. P. Zubov*** Institute of Physics, Academy of Sciences of Azerbaijan, pr. Dzhavida 33, Baku, Az-1143 Azerbaijan
** Shemyakin–Ovchinnikov Institute of Bioorganic Chemistry, Russian Academy of Sciences, ul. Miklukho-Maklaya 16/10, Moscow, 117997 Russia
e-mail: [email protected] February 3, 2005
Abstract—Polymer magnetic microspheres are synthesized on the basis of collagen and polysterene by intro-ducing magnetite nanoparticles into these materials. It is determined by transmission electron microscopy thatnanoparticles are separated from each other and cannot aggregate. The magnetization curve of polymer mag-netic microspheres is found to be very close to the theoretical curve calculated on the basis of the Langevinequation. It is established that the magnetization occurs by the Néel mechanism. The magnetic moments ofnanoparticles are oriented in an external magnetic field by their rotation inside the nanoparticles. The relaxationtime of magnetite nanoparticles is estimated to be 7 × 10–12 s. © 2005 Pleiades Publishing, Inc.
INTRODUCTION
Magnetic nanoparticles are currently being widelyinvestigated in both liquid organic media [1, 2] andpolymer matrices [3, 4]. The interest in these systems isdue to their new magnetic properties and to the pros-pects of their application in nanoelectronics [5]. Inaddition, there are data in the literature on the synthesisand investigation of polymer microspheres containingone magnetic particle from 0.1 to 200 µm in size [6, 7].Such systems are characterized by large values of theresidual magnetization and the coercitive force. There-fore, their application requires preliminary demagneti-zation. Polymer microspheres containing magneticnanoparticles—polymer magnetic microspheres(PMMSs)—are of great importance for practical medi-cine and biology. For example, they are used to trans-port drugs, select biological materials and cells, andperform enzymatic reactions [8–10]. PMMSs are a con-venient object for the study of magnetic nanoparticlesbecause the latter are protected from external effects inmicrospheres. In contrast to polymer microspherescontaining one large magnetic particle, polymer micro-spheres filled with many small magnetic nanoparticles,up to 100 nm in size, have superparamagnetic proper-ties (zero values of the residual magnetization and thecoercitive force). This circumstance makes it possibleto use them repeatedly in different manufacturing pro-cesses.
The magnetic properties of PMMSs are determinedby the magnetic properties of nanoparticles and theirconcentration in polymer microspheres, because thepolymer matrix is diamagnetic and has a high permit-tivity ε. For example, for polystyrene, ε = 2.5–2.6 at f =106 Hz and t = 20°C. The composites obtained by intro-
1063-7745/05/5001-S $26.000168
ducing nanoparticles into polymer microspheres havespecific electrical and magnetic properties in high-fre-quency electromagnetic fields. The sizes of nanoparti-cles and PMMSs make it possible to consider them asphysically small systems with properties differing fromthe characteristics of massive objects [11].
We have already investigated magnetite nanoparti-cles. The size distribution of nanoparticles wasobtained in [12]. The synthesis was performed by themethod of chemical deposition of divalent and trivalentiron salts with excess alkali. It is shown that the sizedistribution of nanoparticles can be described withrather high accuracy using an asymmetric histogramthat is flat from the side of large nanoparticles. Themorphology of magnetite nanoparticles was investi-gated in [13]; it was shown that the surface chemicalcomposition of nanoparticles differs from the bulkcomposition, and it was found that the surface magneticproperties of nanoparticles are weaker. The magnetiza-tion of chains composed of magnetite nanoparticleswas investigated in [14] taking into account the mag-netic dipole–dipole interaction. An expression for themagnetization of such systems was also derived in [14].The structure and some physical properties of PMMSswere investigated in [15]; it was shown that no aggrega-tion of nanoparticles occurs in a polymer matrix.
This study, continuing the series of our investiga-tions into the structure and properties of magnetitenanoparticles incorporated into a polymer matrix, isdevoted to the preparation of PMMSs and analysis oftheir magnetic properties. Specifically, we investigatedthe magnetization and magnetic susceptibility ofPMMSs and attempted to explain the mechanism ofPMMS magnetization.
© 2005 Pleiades Publishing, Inc.

SYNTHESIS OF POLYMER MAGNETIC MICROSPHERES S169
EXPERIMENTAL
Preparation of PMMSs for Study
PMMSs were prepared on the basis of collagen andpolystyrene with the introduction of magnetite nano-particles into them. PMMSs with three different diam-eters having a small spread were synthesized: 255 ±1.5, 179.1 ± 1.5, and 46.9 ± 7.3 µm.
Magnetite nanoparticles were introduced into poly-mer microspheres by two methods: (i) directly duringthe synthesis of polymer microspheres and (ii) by treat-ing fabricated porous polymer microspheres with saltsof divalent and trivalent iron salts with the subsequentprecipitation of magnetite nanoparticles. The precipita-tion occurs under the action of excess alkali. Magnetitenanoparticles are located in microsphere pores. Thecomplete description of the synthesis conditions forPMMSs with different concentrations of nanoparticlesand the analysis of some of their physical propertieswere reported in [16, 17]. As magnetic fillers forPMMSs, we used magnetite nanoparticles of four typessynthesized in different carrier media and having differ-ent average diameters: 9.5 ± 0.1, 7.7 ± 0.1, 7.3 ± 0.1,and 5.5 ± 0.1 nm. The methods and conditions of prep-aration of magnetite nanoparticles were described in [18].
Determination of the PMMS Diameter
The PMMS diameter was measured on an MBI-15optical microscope using different magnifications: 100,160, and 256, depending on the carrier (liquid or gas-eous) medium. We measured the diameter of250 PMMSs and performed statistical treatment of theresults obtained. The statistical analysis of the diametervalues and the construction of histograms of the PMMSdiameter distribution showed that the size distributionof synthesized microspheres (mean quadratic deviationσmean = 22.683) is flatter from the side of large sizes (theasymmetry coefficient εmean = 0.383) and is character-ized by the polydispersity coefficient Kmean = 1.057.Figures 1 and 2 show the micrograph and the histogramof the size distribution of collagen PMMSs.
The PMMS diameter depends on the properties ofthe carrier medium (molecular mass, polarity, viscosity,and so on). In this study, we used aqueous solutions ofethanol and glycerin as carrier media during the synthe-sis, storage, and investigation of PMMSs. Penetrationof molecules of the medium into porous PMMSs leadsto an increase in the microsphere size.
Measurement of the dependence of the averagediameter of PMMSs on the time of their storage in amixture of glycerin and water in the ratio 4 : 1 showedthat the PMMS diameter increases with time and tendsto a constant value at large storage times (t > 35 h)(Fig. 3). We measured the time dependence of the aver-age PMMS diameter in glycerin–water mixtures withdifferent glycerin/water ratios: 4 : 0.1, 4 : 0.5, 4 : 1.5,and 4 : 2. The final values of the average PMMS diam-eter for these media were 305.5 ± 1.6, 307.5 ± 1.7,
CRYSTALLOGRAPHY REPORTS Vol. 50 Suppl. 1 20
308.9 ± 1.7, and 313.4 ± 1.7 µm, respectively. Thesevalues were reached during 30–48 h. Therefore, allmeasurements of the physical characteristics ofPMMSs transferred into a viscous medium were per-
80 µm
Fig. 1. Micrograph of PMMSs (polymer microspheres con-taining magnetic nanoparticles).
240 280 320 360
0.2
0.4
0.6F
D, µm200
Fig. 2. Histogram of the PMMS diameter distribution.
5040302010
260
270
280
290
300
310
320
330D, µm
t, h
Fig. 3. Dependence of the PMMS diameter on the time ofstorage in the glycerin–water mixture (4 : 1).
05

S170
É
FENDIYEV
et al
.
formed after 48 h, i.e., after the PMMS size reached theconstant value.
Measurement of the Magnetization
To investigate the magnetic properties of nanoparti-cles incorporated into a polymer matrix and to confirmthe fact that nanoparticles do not aggregate in polymers(as was shown by the electron microscopy study ofPMMS cuts [15]), we measured the magnetization ofnanoparticles. The measurement was performed in avibrating-coil magnetometer based on an FL-1 electro-magnet. The magnetic field varied up to 105 A/m. Themagnetization was determined by the method describedin [19]. The measurement error was less than 3%. Fig-ure 4 shows the PMMS-magnetization curve (circles)measured for the volume concentration of magnetitenanoparticles ϕm = 0.01 at room temperature.
Measurement of the Magnetic Susceptibility of Individual PMMSs
To measure the magnetic susceptibility of an indi-vidual PMMS, we developed a setup similar to thatdescribed in [20]. The magnetic susceptibility of indi-vidual PMMSs was found by measuring the velocity ofPMMSs moving in a viscous medium in the nonuni-form field of a ferromagnetic cylinder placed in a uni-form magnetic field. The magnetic susceptibility χ wasdetermined by the formulas [20]
χ χ012πηR0Dr5
tµ0V Msa2 Msa
2 2H0r2+( )---------------------------------------------------------------+=
at H0 Ms/2>
0.5
0.4
0.3
0.2
0.1
40 80 120 1600H, 104 A/m
M, 104 A/m
Fig. 4. Experimental (circles) and calculated (solid line)PMMS magnetization curves for the magnetite concentra-tion ϕm = 0.00984.
CRY
and
where χ0 = 10–6 is the magnetic susceptibility of the vis-cous medium; r is the distance from the cylinder axis tothe PMMS center; R0 and V are the radius and the vol-ume of a PMMS, respectively; a = 1.008 mm is theradius of the ferromagnetic cylinder; η is the viscosityof the medium; µ0 is the magnetic constant; Ms = 0.5 ×10⁵ A/m is the saturation magnetization of the ferro-magnetic cylinder; H0 is the constant magnetic field; tis the time during which a PMMS passes the distance r;and D = 86.7 is the magnification parameter. The mag-netic susceptibility of individual PMMSs was mea-sured at room temperature in different magnetic fields:2.4, 50.0, and 206.84 kA/m. All these values of themagnetic field are within the linear portion of thedependence of the magnetic field strength on the elec-tric field strength in the coils of the FL-1 electromagnet.To satisfy the condition of the uniform slow motion ofPMMSs in a gradient magnetic field (the Reynoldsnumber is ~10–3), we used a glycerin–water mixturewith a ratio of the components of 4 : 1 as a viscousmedium; the viscosity of this medium is 38.85 mPa s.The viscosity was measured at room temperature usinga VPZh-3 viscometer with an inner diameter of the cap-illary of 0.99 mm. The viscometer constant is0.774 mm/s.
RESULTS AND DISCUSSIONAs can be seen from Fig. 4, the PMMS magnetiza-
tion curve at the concentration of magnetite nanoparti-cles ϕm = 0.0098 is characteristic of superparamagneticmedia. The saturation magnetization is Ms =4.034 kA/m and the initial magnetic susceptibility isχ0 = 0.026. The average, maximum, and minimummagnetic diameters of magnetite nanoparticles, deter-mined by the formulas from [13, 21] on the basis of themagnetization data, are 3.78, 7.80, and 1.86 nm,respectively. The magnetic diameters determined fromthe magnetization data and those obtained from theelectron microscopy data are in agreement with eachother.
The theoretical magnetization curve, plotted usingthe Langevin equation, is shown in Fig. 4 (the solidline). As can be seen from Fig. 4, the experimental andtheoretical magnetization curves are very close to eachother. This circumstance indicates that the magneticdiameters of nanoparticles are found correctly by themethod proposed in [21] and confirms that magnetitenanoparticles in a polymer matrix are separated andlocated at a certain distance from each other; i.e., theydo not aggregate in the matrix.
χ χ03πηR0Dr5
tµ0Vµ 1–µ 1+------------H0
2a2 µ 1–µ 1+------------a2 r2+
------------------------------------------------------------------------+=
at H0 Ms/2,<
STALLOGRAPHY REPORTS Vol. 50 Suppl. 1 2005

SYNTHESIS OF POLYMER MAGNETIC MICROSPHERES S171
Periodic measurement of the concentration of mag-netite nanoparticles in PMMSs and analysis of theirmagnetic properties every half year showed that themagnetic properties remain constant during the obser-vation time interval. This fact indicates that the nano-particles under study are rigidly fixed in the polymermatrix and their concentration is stable. The rigid fixa-tion of nanoparticles in the matrix shows that their mag-netization occurs by the Néel mechanism. Orientationof the magnetic moment of a nanoparticle in an externalmagnetic field occurs through the rotation of the mag-netic moment within the nanoparticle. The relaxationtime of magnetite nanoparticles was estimated to be7.028 × 10–12 s. Since the duration of measuring thePMMS magnetization is much longer than the relax-ation time of the magnetic moment, each nanoparticleexhibits superparamagnetic behavior.
We measured the magnetic susceptibility of120 individual PMMSs with an average diameter of269.9 µm at the magnetite concentration ϕm = 0.0098and H = 206.84 kA/m. This value of the magnetic fieldwas specially chosen for the given concentration ofnanoparticles in the polymer matrix and the viscosity ofthe carrier medium. The average magnetic susceptibil-ity of one PMMS is 4.79 × 10⁻³. The matching betweenthe histograms of the PMMS distributions over thediameter and the logarithmic value of the magnetic sus-ceptibility, calculated by the χ2-criterion method,turned out to be 95%, which may indicate a correlationbetween the magnetic susceptibility and the PMMSdiameter. In this context, on the basis of measuring themagnetic susceptibility of individual PMMSs with dif-ferent diameters, we plotted the dependence of themagnetic susceptibility of PMMSs on their diameter(Fig. 5). Previously, random values of the magnetic sus-ceptibility for all PMMS diameters were rejected by themethod of 4D- and Q-criteria [22].
To explain the dependence obtained (Fig. 5), wesuggested that PMMSs consist of disks of differentdiameters. The thickness of the disks is equal to the dis-tance between magnetite nanoparticles; hence, eachdisk consists of only one layer of nanoparticles. Thus,the total magnetic moment of PMMSs is equal to thesum of the magnetic moments of disks of differentdiameters. In turn, the magnetic moments of the disksare the sums of the magnetic moments of chains ofmagnetite nanoparticles, which are aligned along themicrosphere diameter.
The magnetic moment of a nanoparticle chaindepends on the magnetic moment of each individualnanoparticle and the number of nanoparticles in thechain. These parameters, in turn, depend on the force ofinteraction between the nanoparticles and the strengthof the external magnetic field [23]. For strong magneticfields and a small number of nanoparticles in a chain(due to either a low concentration of nanoparticles or asmall PMMS diameter), the magnetic moment of achain is determined by the total number of nanoparti-
CRYSTALLOGRAPHY REPORTS Vol. 50 Suppl. 1 20
cles forming the chain; i.e., all nanoparticles areinvolved in the magnetization process. In weak mag-netic fields, the magnetic dipole–dipole interactionplays the key role in the magnetization of the chains[14]. In this case, the energy of the dipole–dipole inter-action exceeds the energy of interaction of magneticdipoles with the external magnetic field. Therefore, forweak magnetic fields and a large number of magnetitenanoparticles in a chain (due to either a high concentra-tion of nanoparticles or a large PMMS diameter), somenanoparticles in neighboring chains form closed sub-systems with a zero total magnetic moment. Therefore,the number of nanoparticles contributing to the magne-tization decreases, the chain length decreases as well,and all these factors reduce the magnetic moments ofeach individual chain and each individual cross section.As a result, the total magnetic moment of PMMSsdecreases.
As was suggested above, the magnetization ofPMMS particles with small diameters (d = 294.22 µm,see Fig. 5) occurs due to the magnetization of the nano-particle chains oriented along the external magneticfield. In this case, chains of nanoparticles exhibitingmagnetic dipole–dipole interaction are magnetized byparallel magnetization reversal. With an increase in thePMMS diameter up to 294.22 µm, the number of nano-particles in chains increases, increasing the magnetiza-tion and the magnetic susceptibility. The initial mag-netic susceptibility of PMMSs calculated by us usingthe formula from [14] was 1.698 × 10⁻³, which is inagreement with the experimental value found by mea-
340320300280260
0.002
0.004
0.006χ
d, µm
Fig. 5. Dependence of the PMMS magnetic susceptibilityon the PMMS diameter.
05

S172 ÉFENDIYEV et al.
suring the magnetic susceptibility of individualPMMSs with small diameters (d = 223.2 µm, χ0 =1.681 × 10⁻³; d = 223.3 µm, χ0 = 1.92 × 10⁻³; the initialportion of the curve in Fig. 5).
The dependence of the magnetic susceptibility ofPMMSs on the magnetite concentration was investi-gated in the low-concentration range (ϕm = 0.0007,0.001, 0.003, 0.008, and 0.01) for the magnetic fieldH = 50 kA/m to confirm the above-described mecha-nism of magnetization. The investigation showed that atlow magnetite concentrations the magnetic susceptibil-ity of PMMSs increases with an increase in the concen-tration of nanoparticles. This dependence can bedescribed by the linear equation χ = 0.69ϕm – 0.52 × 10⁻³.This circumstance confirms our suggestion that at lowmagnetite concentrations all nanoparticles formingchains are involved in the magnetization process. Anincrease in the magnetite concentration leads to anincrease in the number of nanoparticles in chains and,therefore, increases the magnetic susceptibility.
For large PMMS diameters (d ≥ 294.22 µm) and ata constant magnetite concentration, the number of mag-netite nanoparticles aligned along the microspherediameter increases. The numbers of nanoparticles withthe average diameter d = 5.48 nm in PMMSs withdiameters of 304.36, 314.51, and 324.13 µm, foundfrom the data on the magnetite concentration (ϕm =0.013) in PMMSs, are 17913, 18510, and 19076,respectively. The numbers of magnetite nanoparticlesaligned in chains in the external magnetic field H =206.84 kA/m, calculated by the formula from [23], are16310, 14310, and 13096, respectively. As can be seen,the number of nanoparticles in chains decreases at largePMMS diameters, which leads to a decrease in themagnetic moment of the chains and, correspondingly,in the magnetic susceptibility of PMMSs.
Thus, the investigation performed here showed thatmagnetite nanoparticles are uniformly distributed inPMMSs. The size of nanoparticles does not change dur-ing the PMMS synthesis. The magnetic diameters ofnanoparticles determined from the PMMS-magnetiza-tion curve of and calculated from the correspondinggeometric diameters are in agreement with each other.PMMSs have superparamagnetic properties. The mag-netic characteristics of PMMSs are determined by thecharacteristics of magnetic nanoparticles and their con-centration. Magnetization of PMMSs occurs throughthe orientation of the total magnetic moment, which isthe sum of the magnetic moments of disks composed ofPMMSs. The magnetic moments of the disks are, inturn, sums of the magnetic moments of chains of mag-netite nanoparticles aligned along the PMMS diameter.In the case of small PMMS diameters and strong mag-netic fields, all nanoparticles forming magnetic chainsare involved in the magnetization, whereas for largePMMS diameters and weak magnetic fields, closeddipole subsystems are formed, which leads to adecrease in the PMMS magnetization.
CRY
REFERENCES
1. M. Zahn, J. Nanopart. Res. 3 (1), 73 (2001).2. A. N. Vinogradov, Zh. Fiz. Khim. 74 (7), 1324 (2000) [J.
Phys. Chem. 74 (7), 1188 (2000)].3. G. Yu. Yurkov, S. P. Gubin, D. A. Pankratov, et al.,
Neorg. Mater. 38 (2), 186 (2002).4. H. Srikanth, R. Hajndl, C. Chrinos, et al., Appl. Phys.
Lett. 79 (21), 3503 (2001).5. R. W. Siegel, Executive Summary and Introduction and
Overview, Nanostructure Science and Technology:World Technology Evaluation Center (WTEC) PanelReport on R and D Status and Trends in Nanoparticles,Nanostructured Materials, and Nanodevices, Ed. byR. W. Siegel, R. W. E. Hu, and M. C. Roco (Kluwer,Dordrecht, 1999).
6. U. Schroder and G. Lindia, US Patent No. 4,687,748(1987).
7. C. Berl, W. Tak, and K. H. Bartholomew, EP PatentNo. 0,180,384 (1986).
8. J. T. Kemshead and J. Ugelstad, Mol. Cell. Biochem. 67(1), 11 (1985).
9. F. P. Wayne, K. Jeongsoon, and S. J. Brunce, Biochem.Biophys. Acta 816 (1), 83 (1985).
10. H. Ovadia, A. M. Carbone, and P. Y. Paterson, J. Immu-nol. Methods 53 (1), 109 (1982).
11. L. D. Landau and E. M. Lifshitz, Course of TheoreticalPhysics (Nauka, Moscow, 1982; Pergamon Press, NewYork, 1988).
12. R. A. Ali-zade, Phys. B (Proc. Suppl.) 63 (1), 406 (1998).13. R. A. Ali-zade, Izv. Akad. Nauk Azerbaijan 20 (2), 88
(2000).14. R. A. Ali-zade, Fiz. Azerbaijan, No. 1, 37 (1999).15. É. H. Éfendiyev and R. A. Ali-zade, in Proceedings of
IV National Conference on Application of X-rays, Syn-chroton Radiation, Neutrons, and Electrons to MaterialCharacterization (RSNÉ-2003), Moscow, Russia, 2003(Moscow, 2003), p. 215.
16. S. I. Turkin, Yu. V. Lukin, E. A. Markvicheva, et al., SUPatent No. 1 486 515, Byull. Izobret., No. 22, 100(1989).
17. S. I. Turkin, Yu. V. Lukin, E. A. Markvicheva, et al., SUPatent No. 1 567 623, Byull. Izobret., No. 20, 105(1990).
18. A. N. Buryakov, I. A. Gritskova, V. P. Zubov, et al., SUPatent No. 1 628 478, Byull. Izobret., No. 6, 194 (1991).
19. V. I. Chechernikov, Magnetic Measurements (Mosk.Gos. Univ., Moscow, 1969) [in Russian].
20. Yu. A. Plyavin’sh and É. Ya. Blum, Magn. Gidrodin.,No. 4, 3 (1983).
21. E. E. Bibik, B. Ya. Matygullin, Yu. L. Raœkher, andM. I. Shliomis, Magn. Gidrodin., No. 1, 68 (1973).
22. W. Feller, An Introduction to Probability Theory and ItsApplications (Wiley, New York, 1971; Mir, Moscow,1984).
23. M. I. Shliomis, Usp. Fiz. Nauk 112 (3), 427 (1974).
Translated by Yu. Sin’kov
STALLOGRAPHY REPORTS Vol. 50 Suppl. 1 2005
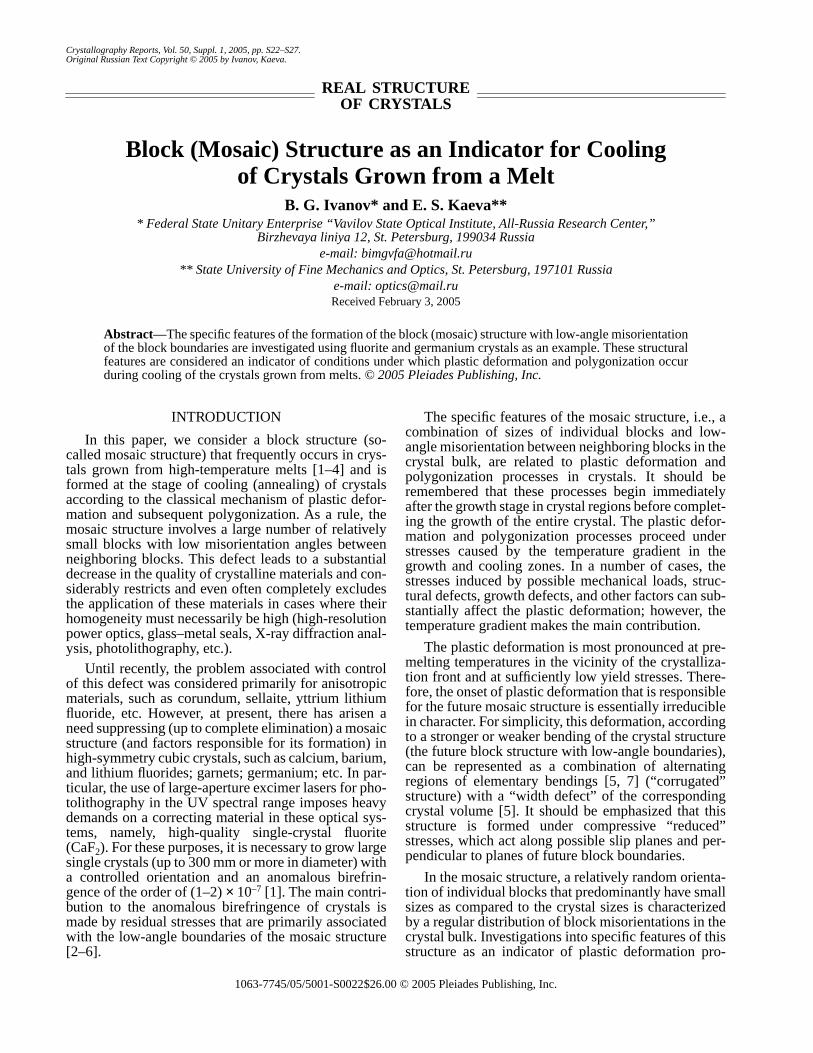
Crystallography Reports, Vol. 50, Suppl. 1, 2005, pp. S22–S27.Original Russian Text Copyright © 2005 by Ivanov, Kaeva.
REAL STRUCTUREOF CRYSTALS
Block (Mosaic) Structure as an Indicator for Cooling of Crystals Grown from a Melt
B. G. Ivanov* and E. S. Kaeva*** Federal State Unitary Enterprise “Vavilov State Optical Institute, All-Russia Research Center,”
Birzhevaya liniya 12, St. Petersburg, 199034 Russiae-mail: [email protected]
** State University of Fine Mechanics and Optics, St. Petersburg, 197101 Russiae-mail: [email protected] February 3, 2005
Abstract—The specific features of the formation of the block (mosaic) structure with low-angle misorientationof the block boundaries are investigated using fluorite and germanium crystals as an example. These structuralfeatures are considered an indicator of conditions under which plastic deformation and polygonization occurduring cooling of the crystals grown from melts. © 2005 Pleiades Publishing, Inc.
INTRODUCTION
In this paper, we consider a block structure (so-called mosaic structure) that frequently occurs in crys-tals grown from high-temperature melts [1–4] and isformed at the stage of cooling (annealing) of crystalsaccording to the classical mechanism of plastic defor-mation and subsequent polygonization. As a rule, themosaic structure involves a large number of relativelysmall blocks with low misorientation angles betweenneighboring blocks. This defect leads to a substantialdecrease in the quality of crystalline materials and con-siderably restricts and even often completely excludesthe application of these materials in cases where theirhomogeneity must necessarily be high (high-resolutionpower optics, glass–metal seals, X-ray diffraction anal-ysis, photolithography, etc.).
Until recently, the problem associated with controlof this defect was considered primarily for anisotropicmaterials, such as corundum, sellaite, yttrium lithiumfluoride, etc. However, at present, there has arisen aneed suppressing (up to complete elimination) a mosaicstructure (and factors responsible for its formation) inhigh-symmetry cubic crystals, such as calcium, barium,and lithium fluorides; garnets; germanium; etc. In par-ticular, the use of large-aperture excimer lasers for pho-tolithography in the UV spectral range imposes heavydemands on a correcting material in these optical sys-tems, namely, high-quality single-crystal fluorite(CaF2). For these purposes, it is necessary to grow largesingle crystals (up to 300 mm or more in diameter) witha controlled orientation and an anomalous birefrin-gence of the order of (1–2) × 10–7 [1]. The main contri-bution to the anomalous birefringence of crystals ismade by residual stresses that are primarily associatedwith the low-angle boundaries of the mosaic structure[2–6].
1063-7745/05/5001-S $26.000022
The specific features of the mosaic structure, i.e., acombination of sizes of individual blocks and low-angle misorientation between neighboring blocks in thecrystal bulk, are related to plastic deformation andpolygonization processes in crystals. It should beremembered that these processes begin immediatelyafter the growth stage in crystal regions before complet-ing the growth of the entire crystal. The plastic defor-mation and polygonization processes proceed understresses caused by the temperature gradient in thegrowth and cooling zones. In a number of cases, thestresses induced by possible mechanical loads, struc-tural defects, growth defects, and other factors can sub-stantially affect the plastic deformation; however, thetemperature gradient makes the main contribution.
The plastic deformation is most pronounced at pre-melting temperatures in the vicinity of the crystalliza-tion front and at sufficiently low yield stresses. There-fore, the onset of plastic deformation that is responsiblefor the future mosaic structure is essentially irreduciblein character. For simplicity, this deformation, accordingto a stronger or weaker bending of the crystal structure(the future block structure with low-angle boundaries),can be represented as a combination of alternatingregions of elementary bendings [5, 7] (“corrugated”structure) with a “width defect” of the correspondingcrystal volume [5]. It should be emphasized that thisstructure is formed under compressive “reduced”stresses, which act along possible slip planes and per-pendicular to planes of future block boundaries.
In the mosaic structure, a relatively random orienta-tion of individual blocks that predominantly have smallsizes as compared to the crystal sizes is characterizedby a regular distribution of block misorientations in thecrystal bulk. Investigations into specific features of thisstructure as an indicator of plastic deformation pro-
© 2005 Pleiades Publishing, Inc.

BLOCK (MOSAIC) STRUCTURE S23
cesses at the initial stage of cooling the crystal can pro-vide important information on the temperature–timeconditions of these processes [3].
EXPERIMENTAL TECHNIQUE
In order to investigate a block structure, i.e., toreveal quantitative regularities of misorientation ofmosaic blocks, we developed a method for determiningthe block orientation in crystals with the use of mea-surements of reflection of optical radiation from thesurface [8]. This method is based on the determinationof the spatial distribution of light rays reflected fromcrystallographic planes (faceted regions, cleavages,etc.) that are formed (or artificially produced) on thecrystal surface.
In essence, the reflection method is as follows(Fig. 1). A parallel light beam 2 is directed normally tothe surface of crystal 1 under investigation. Beam 4reflected from tilted planes (hkl) 3 (cleavage fragments,etc.) arrives at screen 5, which is also located normallyto incident light beam 2. The reflections observed inscreen 5 form a light pattern that corresponds to sym-metry of the direction in the crystal with the angles ϕ(the azimuthal angle of the reflected beam) and 2ρ (theangle of deviation of the reflected beam from the nor-mal). The method has a high sensitivity, allows one todetermine the misorientation angle between microb-locks in polar coordinates with an accuracy of 10′–15′,and is efficient at low misorientation angles, as is thecase with mosaic structures.
The experimental setup (Fig. 2) designed on thebasis of this method makes it possible to determine theorientation of mosaic blocks by scanning the crystalsurface with a laser beam and recording the reflectionsin the screen [9].
The angle ρ of inclination of the (hkl) reflectionplane (for example, the plane of a microcleavageformed after rough grinding) to the crystal surface (seeFig. 1) is calculated from the formula
(1)
The distance b from the crystal surface to the screenis fixed after mounting and adjusting crystals for mea-surements. The cleavage depth h does not affect hardlyat all the error in measurements, because it is consider-ably smaller than the distance b. At the known distanceb, it is possible to calculate the orientation angles ρfrom formula (1) and to graticulate the screen accord-ing to the angles ρ (rather than 2ρ). In the screen(Fig. 2d), the calculated orientation angles ρ are plottedalong the X and Y axes (concentric circles). The azi-muthal angles ϕ of the deviation of reflected beams aredetermined at ρ ≠ 0 (at ρ = 0, ϕ is indeterminate) fromthe straight lines passed through the center of the XYcoordinate system. The angle ϕ0 for each crystal sampleis arbitrarily chosen depending on the geometry of the
ρ 12--- a/b( ).arctan=
CRYSTALLOGRAPHY REPORTS Vol. 50 Suppl. 1 2
sample or its other characteristic features. The otherazimuthal angles ϕ for the crystal under investigationare exactly related to the angle ϕ0. When scanning thecrystal along circles by rotating a table with the crystal(Fig. 2c), the azimuthal angle ϕ is added to the rotationangle of the table β (0° ≤ β ≤ 360°) on the screen. Theangle ϕ' = ϕ + β is recorded in the screen. In order toobtain the sought azimuthal angle ϕ, all the angles ϕ'should be recalculated to the initial table position, i.e.,at β = 0° (ϕ = ϕ' – β).
The aforementioned technique was used to studymosaic structures of fluorite (CaF2) and germaniumcrystals grown by vertical directional crystallizationfrom melts (Bridgman–Stockbarger method) [1, 10–12].1 The crystals were grown in the form of disks 100–300 mm in diameter and 20–70 mm thick in graphitecrucibles. The crucibles with melts were sunk at a rateof 2–10 mm/h from the heating zone through the gradi-ent zone (growth zone) formed by a diaphragm. In thiscase, the material passed through the stages of nucle-ation, growth, and cooling of the crystal.
RESULTS AND DISCUSSION
The misorientation of mosaic blocks was measuredby scanning roughly ground surfaces of the upper andlower faces of the fluorite crystals and the upper surfaceof the germanium crystals and recording reflectionsfrom 111 cleavages on the screen. Moreover, we alsovisually observed the development of the mosaic struc-ture on these surfaces and the lateral surfaces of thedisks. The results obtained can be summarized as fol-lows.
1 The germanium crystals were supplied by V.A. Pis’mennyœ andV.N. Vetrov.
4 5a
3
2
1
b
h
ρ
ρ
Fig. 1. Illustration of calculating the angle ρ of inclinationof the (hkl) plane to the crystal surface from the angle ofreflection of the light beam: (1) crystal, (2) incident lightbeam, (3) (hkl) crystallographic plane, (4) reflected lightbeam, and (5) screen.
005

S24
IVANOV, KAEVA
Fig. 2. Schematic diagram of the setup for measuring the misorientation of mosaic blocks [9] in (a–c) three projections: (1) movablepart of the table, (2) immovable part of the table, (3) crystal, (4) screen, (5) unit with a mirror, (6) laser, (7) gear, and (8) adjustingscrews. (d) Graticule of the screen.
(‡) (b)
(c) (d)
3
4
5
6
7
8
1
2
90°
270°
0° X180°
ϕ
Y
ρ
(1) All the fluorite and germanium crystals underinvestigation have, to some extent, a mosaic structureover the entire volume. The low-angle boundaries onthe upper (Fig. 3a) and lower (Fig. 3b) surfaces of thefluorite crystals, as well as on the upper surface of thegermanium crystal (Fig. 4), are rather curved andexhibit a tendency toward radial arrangement withrespect to the center of the surfaces. Similar boundarieson the lateral surfaces tend to be located along the gen-eratrix of the cylinder. This indicates that, for the mostpart, dislocation walls are vertically arranged in thecrystal bulk. Therefore, the mosaic structures of bothcrystals are similar to each other. In turn, this suggestssimilar specific features of the temperature field at theinitial stages of cooling the crystals in the Bridgman–Stockbarger method.
(2) In the fluorite crystals, the mosaic structure ofthe upper surface closely resembles the mosaic struc-ture of the lower surface. The general regularities of thestructure and misorientation of mosaic blocks on thesesurfaces are similar to each other. There are regions thathave virtually identical mosaic structures. This indi-cates that, under thermal and mechanical stresses, thecrystal structure in the bulk is characterized by the samebending. The dependences of the misorientation angle
CRY
between mosaic blocks in the fluorite crystal 300 mm indiameter and 50 mm thick are depicted in Fig. 5. Themeasurements were performed along the circles withdifferent radii on the upper and lower surfaces of thedisk with the same initial angle ϕ for all the circles. Itcan be seen from Fig. 5 that the dependences of the mis-orientation angle between mosaic blocks for both sur-faces exhibit a similar general behavior.
(3) The misorientation angle between mosaic blockson the upper and lower surfaces and, correspondingly,in the bulk of the crystals (Figs. 5, 6) regularly increasesaway from the center from less than 1° for central crys-tal regions to several degrees at the periphery. Anincrease in the misorientation angle is attended by theformation of a more developed mosaic structure thatinvolves a larger number of mosaic blocks with morepronounced boundaries in between. This regularitysuggests that there arise compressive stresses in periph-eral regions of the samples at temperatures correspond-ing to active plastic deformation. Most likely, this isassociated with the fact that, at the initial stages of cool-ing, the cooling rate of containers is higher than thecooling rate of crystals and, hence, containers have acompressive action on the crystals. The graphite con-tainer with the grown crystal passes through the dia-
STALLOGRAPHY REPORTS Vol. 50 Suppl. 1 2005

BLOCK (MOSAIC) STRUCTURE S25
phragm and appears to be in a relatively cold zone.Owing to intense radiation and a high thermal conduc-tivity of graphite, the cooling rate of the side walls ofthe container is considerably higher than that of thegrown crystal in the container. At the melting tempera-tures of fluorite crystals and, especially, germanium,graphite, whose melting (sublimation) temperatureexceeds 3900 K, is a very rigid material that virtuallydoes not undergo plastic deformation. However, we canstate with assurance that the fluorite and germaniumcrystals at premelting temperatures undergo plastic
(a)
(b)
Fig. 3. Low-angle grain boundaries on the (a) upper and(b) lower surfaces of the fluorite crystal (diameter,300 mm).
CRYSTALLOGRAPHY REPORTS Vol. 50 Suppl. 1 20
deformation even at very low stresses (due to the lowyield stress). As a consequence, although the thermalexpansion coefficient of graphite is larger, on average,than those of the grown crystals, the total shrinkage ofthe crucible turns out to be considerably larger. The cru-cible with a sufficiently strong structure (wall thick-ness) has a compressive action on the peripheral crystalregions (as a hoop on a barrel) and produces tangentialstresses that relax via plastic deformation of the corru-gation type [5]. The subsequent polygonization afterrelaxation of compressive stresses and completion ofplastic deformation leads to the formation of low-angleboundaries that are predominantly perpendicular to thedisk surfaces.
(4) Although the mosaic structures of the upper andlower surfaces of the fluorite crystals closely resembleeach other in the block misorientation [see (1)–(3)], thespecific features of these structures differ substantiallyand indicate different degrees of their polygonization.On the upper surface, mosaic blocks are characterizedby larger sizes and misorientation angles and more pro-nounced boundaries (Fig. 3a). On the lower surface,which was in contact with the crucible during growthand cooling of the crystal, there are a large number ofmosaic blocks whose sizes are rather small and equal to~1–2 mm and less, i.e., at the limit of possible observa-tion (the diameter of the laser beam spot is approxi-mately equal to 3 mm). In some regions, the misorien-tation angles between blocks are within the sensitivityof the method (10'–15'). As a result, boundariesbetween blocks are meandering and cannot be clearlyrevealed in a visual way (Fig. 3b).
Fig. 4. Low-angle grain boundaries on the upper surface ofthe germanium crystal (diameter, 130 mm).
05

S26
IVANOV, KAEVA
2438
20
30
20
30
20
30
20
30
20
30
30
30
30
200 30 60 90 120 150 180 210 240 270 300 330 360
0 30 90 120 150 180 210 240 300 330 360
0 30 60 90 120 150 180 210 240 300 330 360
0 90 120 150 180 210 240 360270
0 60 90 120 150 180 210 240 360270
0 30 60 90 120 150 180 210 240 300 330 360
60 90 120 150 180 210 240 300270
0 30 60 90 120 150 180 210 240 300 330 360270
0 30 60 90 120150180210
ρ
ρ
ρ
ρ
ρ
ρ
ρ
ρ
ρ, deg
r = 130 mm
r = 120 mm
r = 110 mm
r = 95 mm
r = 80 mm
r = 65 mm
r = 45 mm
r = 25 mm
r = 10 mm
β, deg
Fig. 5. Dependences ρ(β) obtained by laser beam scanning of the upper (solid lines) and lower (dotted lines) surfaces of the CaF2crystal along the circles of different radii.
It seems likely that specific temperature–time condi-tions differed in the upper and lower crystal regions.The upper crystal region and the upper surface, whichin the course of cooling was in incomplete contact withthe graphite crucible located above, were at high tem-peratures for a longer time as compared to the lowercrystal region. The polygonization process on the lowersurfaces of the disks was terminated at the initial stagesand did not lead to such an increase in the sizes ofmosaic blocks as in the case of the upper surface.
Thus, the performed quantitative investigations intothe low-angle misorientation of neighboring blockspermitted us to reveal specific features of the mosaicstructure, such as sizes, shape, and spatial distributionof misorientation angles between neighboring blocksover the crystal volume. These are important character-istics of the mosaic structure and are directly related tothe parameters of growth and cooling of the crystals.Undeniably, there exists a quantitative relation betweenthe temperature gradient in the crystal cooling zone,plastic deformation (as a response of the crystal tostresses induced by temperature gradients), andpolygonization, which results in the stress relaxation inthe deformed crystal and generates secondary stressesdetermining the anomalous birefringence. Therefore,
CRY
the obtained specific features are qualitative character-istics of the plastic deformation processes and can bequantitative when revealing the correlation betweentemperature fields in the plastic deformation zone andthe mechanical properties of crystals and make it possi-ble to interpret thoroughly the processes responsible forthe formation of the mosaic structure [5].
In order to grow perfect crystals without indicationsof plastic deformation and mosaic structure, it is neces-sary to eliminate their origin, namely, thermal andmechanical stresses. It follows from these rather strin-gent requirements that, at all (especially, initial) stagesof active plastic deformation during cooling of crystals,it is necessary to provide small temperature gradientsand other technological parameters that do not result instresses exceeding the yield stress at any point of thecrystal [5]. The last condition is associated with the factthat the excess of the yield stress even at one local pointleads to the development of plastic deformation at con-siderably lower stresses induced by the temperaturefield gradient. This deformation can covers large crystalregions with the corresponding negative consequences[3, 5].
The study of the mosaic structure as an indicator oftemperature fields in the zones of growth and cooling
STALLOGRAPHY REPORTS Vol. 50 Suppl. 1 2005

BLOCK (MOSAIC) STRUCTURE S27
Fig. 6. Dependences ρ(β) obtained by laser beam scanning of the upper surface of the germanium crystal (diameter, 130 mm) alongthe circles of different radii.
10080604020
0 40 80 160
10080604020
120
100
80
60
40
20
100
80
60
40
20
0 40 80 160
0 40 80 120 160
0 40 80 160120 β, deg
β, deg
β, deg
β, deg
ρ, deg
ρ, deg
ρ, deg
ρ, deg
r = 27 mm
r = 35 mm
r = 45 mm
r = 50 mm
(annealing) of crystals and other technological condi-tions can provide information important for revealingthe factors responsible for the formation of this defectand ways for its elimination. This holds much signifi-cance for the use of crystals in science and engineering.
ACKNOWLEDGMENTS
This work was supported by the Council on Grantsfrom the President of the Russian Federation for Sup-port of Leading Scientific Schools (project no. RI-112/001/192).
REFERENCES1. G. T. Petrovskiœ, V. M. Reœterov, I. A. Mironov, et al., in
Proceedings of the 6th International Conference onApplied Optics, St. Petersburg, Russia, 2004 (St. Peters-burg, 2004), Vol. 2, p. 39.
2. S. V. Tsivinskiœ and L. A. Maslova, Izv. Akad. NaukSSSR, Ser. Fiz. 36 (3), 575 (1972).
3. B. G. Ivanov and M. I. Musatov, Opt.–Mekh. Prom-st.,No. 2, 35 (1979).
CRYSTALLOGRAPHY REPORTS Vol. 50 Suppl. 1 20
4. A. N. Belaya, in Proceedings of the 6th InternationalConference on Crystal Growth, Moscow, USSR (Mos-cow, 1980), Vol. 3, p. 222.
5. B. G. Ivanov, Poverkhnost, No. 6, 52 (2002).6. A. K. Przhevuskiœ and E. S. Kaeva, Opt. Zh. 70 (11), 68
(2003).7. A. A. Urusovskaya, Some Problems of the Physics and
Elasticity of Crystals (Akad. Nauk SSSR, Moscow,1960), p. 75 [in Russian].
8. S. Rösch, Sachs., Akad. Wiss. 39 (6), 5 (1926).9. B. G. Ivanov, E. S. Kaeva, and D. I. Klimenchenko, Izv.
Vyssh. Uchebn. Zaved., Mater. Elektron. Tekh., No. 1(2005) (in press).
10. V. A. Sokolov, Tr. Gos. Opt. Inst. 54 (188), 21 (1983).11. B. G. Ivanov, V. M. Reœterov, and A. Turkboev, Opt. Zh.
66 (5), 89 (1999).12. L. M. Avkhutsky, S. N. Borozdin, and E. G. Cher-
nevskaya, in Proceedings of the 4th International Con-ference on Single-Crystal Growth and Heat and MassTransfer, Obninsk, Russia, 2001 (Obninsk, 2001),p. 334.
Translated by O. Borovik-Romanova
05

Crystallography Reports, Vol. 50, Suppl. 1, 2005, pp. S28–S31.Original Russian Text Copyright © 2005 by Malyshkina, Ped’ko, Movchikova, Morgushka.
PHYSICAL PROPERTIESOF CRYSTALS
Effect of External Forces on the Dielectric and Pyroelectric Properties of Strontium–Barium Niobate CrystalsO. V. Malyshkina, B. B. Ped’ko, A. A. Movchikova, and I. V. Morgushka
Tver State University, Sadovyœ per. 35, Tver, 170002 Russiae-mail: [email protected]
Received February 3, 2005
Abstract—It is shown that high-temperature annealing of strontium–barium niobate crystals increases themobility of domain boundaries in these crystals. This effect manifests itself in a shift of the peak of the effectivepermittivity of annealed samples to weaker fields. It is ascertained that the polarization of strontium–bariumniobate crystals caused by annealing results in their more homogeneous single-domain state. The effect of Ceand Cr impurities on the polarization state of the surface layers in strontium–barium niobate crystals is consid-ered. © 2005 Pleiades Publishing, Inc.
INTRODUCTION
Strontium–barium niobate (SBN) crystals with thegeneral formula SrxB1 – xNb2O6 have the structure of tet-ragonal potassium–tungsten bronzes and belong to fer-roelectric relaxors with a diffuse phase transition [1].Currently, SBN crystals are widely used in optoelec-tronics [1] because they are characterized by a largevalue of electro-optic coefficient (420 × 10–12 m/V). Atthe same time, it is known that the degree of formationof the single-domain state in a crystal affects signifi-cantly its physical properties [1–4]. Such factors as anexternal electric field and high-temperature annealingmay strongly change the polarization state of SBNcrystals. In this context, the dielectric and pyroelectricproperties of SBN crystals subjected to the action ofthese factors are of interest.
Data on the distribution of the polarization and thespace charge in the surface regions of ferroelectric crys-tals can be obtained by analyzing the frequency depen-dences of the pyroelectric current [5]. When a rectangu-lar modulation of a heat flow is used, the nonuniformpolarization distribution affects the shape of the pyro-electric response [6]. In this context, we investigatedthe state of the surface layers of polar cuts of SBN crys-tals (x = 0.61) by analyzing their pyroelectric responseusing the dynamic method.
EXPERIMENTAL
When a modulated heat flow is incident on a crystal,the latter is heated only at a certain depth x, which isdependent on the modulation frequency f: x = (α/πf)1/2,where α is the thermal diffusivity. The pyroelectric cur-rent (in the case of a nonuniform polarization distribu-tion in a sample), measured by the dynamic method, isalso a function of the modulation frequency of the heatflow. Thus, the pyroelectric current can be interpreted
1063-7745/05/5001-S $26.000028
in this case as produced by a layer of depth x. Hence,the pyroelectric coefficient, calculated on the basis ofthis pyroelectric current, is the effective pyroelectriccoefficient of the layer.
The frequency dependences of the pyroelectric cur-rent were measured for all samples at room temperaturein the frequency range 2–400 Hz, which, for SBN crys-tals, corresponds to the range of penetration depths ofthermal waves from 12 to 180 µm. To investigate thepolarization in deeper layers, it is necessary to use lowmodulation frequencies for the heat flow. Since conven-tional measurements (using a mean-value voltmeter)are impossible in this case, we used digital methods ofsignal processing.
In this work, we investigated both pure SBN singlecrystals and SBN single crystals with Cr (1000 and2000 ppm) and Ce (1000, 4000, and 8000 ppm) impu-rities. The impurity concentration corresponded to thecomposition of the melt used to grow crystals (1 ppm =10–4 at %).
The pyroelectric coefficient was measured on thesample sides onto which both negative and positiveends of the polarization vector emerged (–Ps and +Ps,respectively).
We also investigated the effect of annealing (in air)on the polarization state in the SBN crystals. Annealingin air was performed at 200°C for 4 h. Primarily polar-ized and annealed samples were studied, as well assamples subjected to the action of an ac electric field of~300 V/mm. The crystals were polarized in an electricfield of 500 V/mm in the paraelectric phase (~120°C)with subsequent field cooling down to room tempera-ture.
© 2005 Pleiades Publishing, Inc.

EFFECT OF EXTERNAL FORCES S29
Fig. 1. Distributions of the effective values of the pyroelectric coefficient γ over thickness x of SBN crystals doped with Ce to aconcentration of 8000 ppm (a, b) and Cr to a concentration of 2000 ppm (c, d) and pure SBN crystals (e, f) on the sides correspondingto the positive (a, c, e) and negative (b, d, f) ends of the polarization vector: (1) polarized samples; (2) after 100 h after polarization;and (3) after the action of an ac electric field.
20 60 100 140 180
1
2
3
4
5 (b)
1
2
3
4
5 (a)
x, 10–6 m
1
2
3
γ, 10–4 C m–2 K–1
2
1
3
20 60 100 140 180x, 10–6 m
16
12
8
4
0
16
12
8
4
0
312
1
23
(Ò)(d)
γ, 10–4 C m–2 K–1
12
8
4
0
12
8
4
0
1
2
3
1
2
(e) (f)
RESULTS AND DISCUSSION
In all polarized SBN samples with either Ce(Figs. 1a, 1b; curves 1) or Cr impurity (Figs. 1c, 1d;curves 1), a nonuniform distribution of the pyroelectriccoefficient over the sample thickness was observed.The values of the pyroelectric coefficient in the layer
CRYSTALLOGRAPHY REPORTS Vol. 50 Suppl. 1 2
located at a depth from 30 to 80–120 µm (depending onthe type and concentration of the impurity) were foundto be larger than those in the other volume. At the sametime, in a pure SBN crystal (Figs. 1d, 1e; curves 1),such behavior of the pyroelectric coefficient wasobserved only on the side corresponding to the +Ps
005

S30
MALYSHKINA
et al
.
polarization. On the other side, the pyroelectricresponse near the surface was slightly lower than in thebulk.
This behavior of the pyroelectric coefficient indi-cates that the polarization in the layer is stronger thannear the surface and in the bulk of the crystal. This char-acter of the pyroelectric coefficient distribution givesgrounds to suggest that the polarization of an SBN crys-tal in an external field is incomplete. The region in thebulk of the crystal, located far from the surface, remainspartially depolarized. We should not exclude from con-sideration the fact that the volume charge localized nearthe surface may affect the polarization in the layer. Thedata on the crystal etching, performed by us previously[4], show that the surface layer is almost single-domain,whereas deeper etching reveals multidomain regions.Thus, polarization leads to the formation of a single-domain layer in the sample at a depth of about 10 µm.At larger depths, the state becomes less single-domain(i.e., in the terminology of [3], the domain densityincreases). The decrease in the polarization of the sur-face layer (thinner than 5 µm) is related to the screeningof the spontaneous polarization by the surface charge.
It should be noted that, for the Ce-doped SBN crys-tals, immediately after the polarization (Figs. 1a, 1b;curves 1), the pyroelectric response on the side corre-sponding to –Ps (Fig. 1b) is much higher than that onthe side corresponding to +Ps (Fig. 1a). It should alsobe noted that the pyroelectric response decreases withan increase in the Ce concentration.
For SBN samples with low Cr concentrations (nothigher than 1000 ppm), the pyroelectric response is thesame at both sides. At the same time, for an SBN crystalwith a Cr concentration of 2000 ppm, the pyroelectriccoefficient for the side corresponding to +Ps (Fig. 1c) islarger than that for the side corresponding to –Ps by afactor of almost 1.5 (Fig. 1d).
Exposure of crystals for 100 h at room temperaturewithout applying external forces leads to a change inthe pyroelectric-coefficient distribution in the samplesunder study. In a pure SBN sample, on the side corre-sponding to +Ps, a sharp increase in the pyroelectricresponse is observed near the surface. At the side corre-sponding to –Ps, the pyroelectric coefficient decreases(Figs. 1e, 1f; curves 2). In the doped SBN crystals, thevariation in the pyroelectric coefficient is insignificant(Figs. 1a–1d; curves 2).
The effect of an ac electric field on SBN:Cr andSBN:Ce crystals does not lead to their depolarization(Figs. 1a–1d; curves 3). In contrast, in a pure SBN crys-tal placed in an ac field, the pyroelectric response isobserved only on the side corresponding to –Ps, and itsvalue is much smaller than that for the polarized sample(Figs. 1e, 1f). Moreover, in SBN crystals with a high Ceconcentration (8000 ppm), the pyroelectric responseincreases after the action of an ac electric field.
Investigation of the annealed SBN samples showedthat annealing leads to an almost complete depolariza-
CRY
tion of the doped crystals. Only a weak pyroelectricresponse is observed when one of the sample sides issubjected to heating at frequencies exceeding 40 Hz.These conditions correspond to a penetration depth of~40 µm of thermal waves in the sample. According tothe pyroelectric-current direction, the polarization inthis layer is directed from the bulk to the sample sur-face. At the same time, the pyroelectric response of apure annealed SBN crystal coincides in magnitude withthat of a depolarized crystal; however, the polarizationfor both sample sides is directed from the bulk to thesurface.
Investigations of the effective permittivity also indi-cate that annealing affects the state of the domain struc-ture. According to [7], the effective capacitance shouldstrongly increase in fields corresponding to the maxi-mum reconstruction of the domain structure. Experi-ments showed a shift of the peak of the effective permit-tivity of the annealed samples to weaker fields. Thisbehavior of the permittivity may indicate an increase inthe mobility of domain boundaries.
Polarization reversal of the annealed samples by theabove-described technique shows that samples arepolarized more uniformly in this case. This is con-firmed by the rectangular shape of the pyroelectricresponse observed at frequencies down to 0.1 Hz (atthis frequency, the penetration depth of thermal wavesin the crystal is 0.78 mm; the samples under study rangein thickness from 1 to 2 mm).
CONCLUSIONS
The investigation performed shows that the dopingof SBN crystals with Cr and Ce impurities differentlyaffects the polarization state of the surface layers ofthese crystals. The fact that an ac electric field andannealing differently affect pure SBN crystals andSBN:Cr and SBN:Ce crystals can be related to the pres-ence of impurities and to differences in the positions ofCr and Ce ions in the SBN crystal structure, i.e., to thechange in the conditions of nucleation and motion ofdomain walls. This suggestion is confirmed by the neu-tron-activation data [8, 9], according to which Ce3+ andCr3+ ions substitute, respectively, Sr/Ba and Nb sites inthe SBN lattice.
The difference in the sample polarization before andafter annealing may be related to the fact that annealingleads to the redistribution of Sr and Ba ions in the struc-ture of these crystals.
ACKNOWLEDGMENTS
We are grateful to professors S. Kapphan andR. Pankrath (Osnabrük University, Germany) for sup-plying the crystals for investigation.
STALLOGRAPHY REPORTS Vol. 50 Suppl. 1 2005

EFFECT OF EXTERNAL FORCES S31
REFERENCES
1. Yu. S. Kuz’minov, Electro-optical and Nonlinear-opti-cal Niobate Lithium Crystal (Nauka, Moscow, 1987) [inRussian].
2. V. M. Fridkin, Photoferroelectrics (Nauka, Moscow,1976; Springer-Verlag, Berlin, 1979).
3. D. V. Isakov, T. R. Volk, L. I. Ivleva, et al., JETP Lett. 80(4), 258 (2004).
4. O. V. Malyshkina, I. L. Kislova, B. B. Ped’ko, et al., inProceedigns of the Research and Application Confer-ence “Piezoelectric Technique 2003,” Moscow, 2003(Mosk. Inst. Radiotekh. Élektr. Avtom., Moscow, 2003),p. 57.
CRYSTALLOGRAPHY REPORTS Vol. 50 Suppl. 1 20
5. O. V. Malyshkina, A. A. Bogomolov, and M. M. Major,Ferroelectrics 182, 11 (1996).
6. Yu. N. Zakharov, S. G. Gakh, V. Z. Borodin, et al., inSemiconductor Ferroelectrics (Izd. RGU, Rostov-on-Don, 1973), p. 133 [in Russian].
7. A. S. Sonin and B. A. Strukov, Introduction to Ferroelec-tricity (Vysshaya Shkola, Moscow, 1970) [in Russian].
8. Th. Woike, G. Weckwerth, Y. Palme, et al., Solid StateCommun. 102 (10), 743 (1997).
9. Th. Woike, U. Dofler, L. Tsankov, et al., Appl. Phys. B:Lasers Opt. 72 (6), 661 (2001).
Translated by Yu. Sin’kov
05

Crystallography Reports, Vol. 50, Suppl. 1, 2005, pp. S32–S36.Original Russian Text Copyright © 2005 by Shishonok, Petrashko, Soshnikov, Leusenko, Radyush.
PHYSICAL PROPERTIESOF CRYSTALS
Synthesis and Properties of a High-Frequency Dielectric in the BaO–Pr2O3–TiO2 and BaO–Pr2O3–TiO2–Ta2O5 Systems
N. A. Shishonok, V. V. Petrashko, L. E. Soshnikov, A. A. Leusenko, and Yu. V. RadyushInstitute of Solid State Physics and Semiconductors, National Academy of Sciences of Belarus, ul. Brovki 17, Minsk, 220072
Belaruse-mail: [email protected]
Received February 8, 2005
Abstract—The (Ba1 – aPba)4(Pr1 – y – zBiySmz)9 + 1/3Ti18O54 compound in the ternary BaO–Pr2O3–TiO2 systemand the Ba2Pr4Ti6Ta4O30, Ba3Pr3Ti5Ta5O30, Ba4Pr2Ti4Ta6O30, and Ba5Pr1Ti3Ta7O30 compounds in the quater-nary BaO–Pr2O3–TiO2–Ta2O5 system are obtained by solid-phase synthesis under high (up to 7 GPa) pressure.The influence of the synthesis conditions and the partial substitution of Pb ions for Ba and Bi (or Bi/Sm) ions forPr on the composition of the phases synthesized and their structure and dielectric properties is studied. The dielec-tric properties of the compounds synthesized are studied at the frequencies 102, 103, 104, and 106 Hz in the tem-perature range from 20 to 100°C. The synthesis modes and the Pb, Bi, Sm, and Bi/Sm concentrations necessaryfor the synthesis of materials with improved dielectric properties and an almost zero temperature coefficient ofthe resonance frequency are determined. In the ternary system of solid solutions of, the compounds with per-mittivity ε ≅ 100–110 and dielectric-loss angle tanδ . 0.0015–0.003 are synthesized. In the quaternary system,the compounds with ε . 100–150 and tanδ . 0.0015–0.003 are obtained. © 2005 Pleiades Publishing, Inc.
INTRODUCTION
The intense development of telecommunication andother communication facilities in the microwave range(satellite and mobile communication) has stimulatedthe elaboration of new technologies for the synthesis ofdielectric materials with high permittivity ε and smalldielectric-loss angles tanδ, as well as the study of theirproperties. These materials should possess high εr val-ues in order to reduce the resonator dimensions, as wellas low dielectric losses and an almost zero temperaturecoefficient of the resonant frequency τf in order tomaintain a stable resonance frequency [1]. The searchfor such materials requires the study of a large numberof dielectric systems. However, only a few of these sys-tems are of practical interest. Among them, the BaO–R2O3–TiO3 (R = La–Gd) systems are of special interest.Rare earth ions (from La to Gd) in these systems forma series of solid solutions that is described by the gen-eral formula Ba6 − 3xR8 + 2xTi18O54 and that possesseshigh εr values and low tanδ values, with the parameterτf varying over a large interval: from positive values forLa–Nd to negative values for Sm, Eu, and Gd [1]. Thefunctional properties of these materials are stronglydependent on a number of parameters, such as thepurity of the starting materials, the content of rare earthelement, the Ba/Ti ratio in the starting materials, thesynthesis conditions, crystal lattice and phase ratio ofthe final product, its density, etc. With R varying fromLa to Gd, the region of solid solutions becomes nar-rower, whereas the εr and τf values decrease. The micro-wave dielectric properties of these materials are consid-
1063-7745/05/5001-S $26.000032
erably improved by combining various rare earthoxides and using the partial substitution of other alkaliearth elements (Ca, Sr) for barium. The materials withsuch compositions usually satisfy high requirementswith respect to tanδ and εr but the parameter τf consid-erably varies and should be additionally controlled bythe introduction of special additives, usually, Bi2O3 andPbO oxides or titanates.
At present, promising studies are being performedin two directions: first, the search for new dielectricmaterials with better dielectric characteristics and, sec-ond, the improvement of dielectric properties of alreadyknown compounds. Of all the Ba6 – 3xR8 + 2xTi18O54 com-pounds, the materials with R = Nd are widely used inelectronics. At the same time, attempts are made toimprove their dielectric properties. Studies show [2–6]that the dielectric characteristics (and, especially, theparameter τf) may be considerably improved by theintroduction of Bi and Pb additions in combination withother rare earth elements (Sm, Gd). However, the prop-erties are in fact improved only if the concentration ofthese additives does not exceed the solubility limit; oth-erwise, new additional phases are formed, which con-siderably deteriorate the dielectric properties of thematerials synthesized (increase in tanδ and τf and aslight decrease in εr). In the process of material synthe-sis, Bi and Pb are partly evaporated, and therefore, toavoid the formation of impurity phases at this stage, onehas to maintain the stoichiometry and high density ofthe final product. Also, the known data on the structure,composition, and properties of these materials are often
© 2005 Pleiades Publishing, Inc.

SYNTHESIS AND PROPERTIES OF A HIGH-FREQUENCY DIELECTRIC S33
inconsistent. The optimum synthesis modes and com-position of the materials with highly reproducible highmicrowave dielectric properties have not been estab-lished as yet. Therefore, it is necessary to perform addi-tional systematic studies in order to elaborate new tech-nologies for the synthesis of materials with high εr andQ values and an almost zero coefficient of resonancefrequency τf.
In the BaO–Pr2O3–TiO2 system [7, 8], there existsthe region of the solid solutions described by the gen-eral formula Ba6 – 3xR8 + 2xTi18O54 (0 < x < 0.75). Thedielectric materials formed in this region have high per-mittivity and low dielectric losses and are very attractivefor application in microwave electronics. With an increasein the concentration x of a rare earth element, the permit-tivity and the resonance-frequency coefficient decreaseso that τf attains its minimum value ~125 ppg/K at x =0.75, although the quality factor Q attains its maximumvalue at x = 0.74. The resonance-frequency coefficient ofthe materials is rather high and should be reduced by mod-ifying the chemical composition.
Ternary compounds of the Ba6 – 3xR8 + 2xTi18O54 typewith the structure of tungsten bronze have rather highdielectric characteristics (permittivity ε ≅ 60–80) anddielectric losses (tanδ ≅ 0.001) and, therefore, are usedin dielectric resonators in various communication facil-ities. The quaternary compounds in the BaO–R2O3–TiO2–Ta2O5 systems (R = Nd, Sm) have better dielec-tric characteristics, ε ≅ 70–174 and tanδ ≅ 0.0001, and,therefore, are widely used in the systems of mobilecommunication facilities. The dielectric properties andtemperature stability of these materials are stronglydependent on the synthesis conditions and partial sub-stitution of structure-forming elements.
SAMPLES AND EXPERIMENTAL METHODS
The ceramic (Ba1 – aPba)4(Pr1 – y – zBiySmz)9 + 1/3Ti18O54(with a = 0–0.4, y = 0–0.24, z = 0–0.06) compoundsformed in the BaO–Pr2O3–TiO2 system and the ceramicBa2Pr4Ti6Ta4O30, Ba3Pr3Ti5Ta5O30, Ba4Pr2Ti4Ta6O30,and Ba5Pr1Ti3Ta7O30 compounds in the BaO–Pr2O3–TiO2–Ta2O5 system were obtained by solid-phase syn-thesis under high pressures (up to 7 GPa). The sampleswere prepared from the BaCO3, Pr2O3, Bi2O3, TiO2,Sm2O3, and PbO powders by the methods of solid reac-tions in air. The powder mixtures were subjected to (2–6)-h-annealing at 1000–1170°C. The annealed powdersof the corresponding compositions were ground andpressed into tablets, which then were synthesized indifferent modes. Some samples were synthesizeddirectly in the temperature range 1230–1350°C. Thesynthesis time ranged from 1 to 4 h. Some other mate-rials were synthesized under the simultaneous action ofhigh temperatures and pressures and then wereannealed at 1160–1250°C.
The phase compositions of the dielectrics obtainedwere studied on a DRON-3 diffractometer ( -radi-CuKα
CRYSTALLOGRAPHY REPORTS Vol. 50 Suppl. 1 20
ation). The samples for dielectric measurements werepolished disks 8–10 mm in diameter and 0.3–1.0 mm inthickness. After the study of their microstructure, silverelectrodes were applied to their surfaces. The dielectricproperties were measured in the mode of slow (0.5–1.0 K/min) heating by E7-12 and E7-14 LCR meters atthe frequencies 102, 103, 104, and 106 Hz in the temper-ature range from 20 to 100°C.
The temperature coefficient of the resonance fre-quency τf was calculated as τ1 = –τε/2 – α, where τε isthe temperature coefficient of permittivity measured atthe frequency 1 MHz and α is the thermal expansioncoefficient (≈10–5 K–1).
RESULTS AND DISCUSSION
Dielectric Properties of Bi-Doped Ba4Pr9 + 1/3Ti18O54 Solid Solutions
X-ray phase analysis of Ba4(Pr1 – yBiy)9 + 1/3Ti18O54samples (with y = 0, 0.03, 0.06, 0.18, and 0.24) synthe-sized for 2 h at the temperature 1350°C showed that allthe samples consisted of only one phase with the struc-ture of tungsten bronze (Fig. 1). The dielectric proper-ties of the materials depend on the bismuth content inBa4(Pr1 – yBiy)9 + 1/3Ti18O54 (Table 1). The study of the
20 25 30 35 402Θ, deg
1
2
3
4
5
6
Fig. 1. X-ray phase analysis of Ba4(Pr1 – yBiy)9 + 1/3Ti18O54samples synthesized at 1350°C for 2 h at different y values:(1) 0, (2) 0.03, (3) 0.06, (4) 0.15, (5) 0.18, (6) 0.24.
05

S34 SHISHONOK et al.
Table 1. Lattice parameters, dielectric properties, and temperature coefficients of the resonance frequency τf and permittivityτε of Ba4(Pr1 – yBiy)9 + 1/3Ti18O54 samples synthesized for 2 h at 1350°C at different Bi concentration (y). Dielectric propertieswere measured at frequency 1 MHz
y a, nm b, nm c, nm ε tanδ τf , ppm/K τε
0 122.6 223.33 38.41 95.4 0.0029 12.4 –44.8
0.03 122.68 223.44 38.36 99.0 0.0028 1.0 –22.0
0.06 122.79 223.63 38.36 96.8 0.0023 29.9 –79.8
0.15 122.08 221.94 38.63 110.8 0.0020 0.28 –20.0
0.18 122.07 221.7 38.67 106.1 0.0021 6.8 –33.0
0.24 122.26 221.92 38.56 106.6 0.0015 –37.6 55.2
dielectric properties in the temperature range 20–100°Cshowed only a weak dependence of the dielectric char-acteristics on temperature.
With an increase in the bismuth concentration in thesamples, the permittivity increases and attains its max-imum value (ε = 110.8) at y = 0.15. At this y value, thecoefficient of resonance frequency has the minimumvalue (τf ~ 0.28 ppm/K). With a further increase in thebismuth content, the permittivity ε decreases and τfdeteriorates, which may be explained by the formationof small amounts of impurity phases not detectablefrom the X-ray patterns (Fig. 1). A similar situation wasobserved on Ba4(Pr1 – yBiy)9 + 1/3Ti18O54 samples [3]. Aty = 0.06, the sample surface had some microcracks,which could cause the deterioration of the dielectricproperties.
Partial substitution of Bi for Pr in theBa4(Pr1 − yBiy)9 + 1/3Ti18O54 samples leads to dielectricmaterials with better dielectric properties and to a weaktemperature dependence of the permittivity. The bestdielectric properties at the frequency 1 MHz belong to thesamples of the composition Ba4(Pr0.85Bi0.15)9 + 1/3Ti18O54(ε = 108, tanδ = 0.002, and τf = 0.28 ppm/K).
DIELECTRIC PROPERTIES OF Ba4(Pr1 – yBiy)9 + 1/3Ti18O54 SAMPLES
SYNTHESIZED UNDER HIGH PRESSURE
The mixtures of the starting oxide and carbonatepowders corresponding to the compositionsBa4(Pr1 − yBiy)9 + 1/3Ti18O54 (y = 0, 0.03, 0.06, 0.15, 0.18,and 0.24) were annealed for 3 h at 1180°C. After grind-ing, the mixtures were pressed into tablets and sub-jected to the simultaneous action of high hydrostaticpressure (up to 7 GPa) and high temperature (910–940°C) and subsequent 4-h-annealing at 1200°C. Theproperties of the samples thus obtained are indicated inTable 2.
Synthesis under high hydrostatic pressures but atlower temperatures gave dielectric materials with highε and low dielectric losses. However, the dielectricproperties depended on the duration and temperature ofannealing of the samples synthesized. Immediately
CRY
after synthesis, the materials showed semiconductor-type conductivity. They were transformed into dielec-trics only after additional annealing until sample satu-ration with oxygen.
Effect of the Temperature of High-Pressure Synthesis (5 GPa) of Ba4(Pr0.85Bi0.15)9 + 1/3Ti18O54 Samples
on Their Dielectric Properties
The values of permittivity and dielectric losses ofceramic Ba4(Pr0.85Bi0.15)9 + 1/3Ti18O54 samples at differ-ent temperatures of their synthesis under a quasihydro-static pressure (5 GPa) and subsequent annealing at thetemperatures 1170–1206°C and the correspondingmeasurement frequencies are indicated in Table 3. Per-mittivity of materials ε only weakly depends on tem-perature.
Ten-minute synthesis of Ba4(Pr0.85Bi0.15)9 + 1/3Ti18O54samples under high pressure (5 GPa) in the temperaturerange 380–1400°C for 10 min yields dielectric materi-als with high permittivity and low dielectric losses. Thedielectric properties (ε and tanδ) only weakly dependon the frequency and temperature in the temperaturerange from 20 to 100°C. Synthesis at higher tempera-tures (1500°C) leads to sample fracture, whereas syn-thesis at lower temperature, to degradation of theirdielectric properties.
Table 2. Dielectric properties of Ba4(Pr1 – yBiy)9 + 1/3Ti18O54samples synthesized under high pressure (frequency 1 MHz)
y ρ, 103 kg/m3 ε tanδ
0 4.23 94.7 0.006
0.03 4.66 88.5 0.003
0.06 4.89 88.1 0.002
0.15 4.84 93.9 0.003
0.18 4.83 90.5 0.003
0.24 4.89 101.3 0.003
STALLOGRAPHY REPORTS Vol. 50 Suppl. 1 2005

SYNTHESIS AND PROPERTIES OF A HIGH-FREQUENCY DIELECTRIC S35
Table 3. Dielectric properties of ceramic Ba4(Pr0.85Bi0.15)9 + 1/3Ti18O54 samples synthesized for 10 min under the quasihydro-static pressure 5 GPa
Synthesistemperature, °C
f = 100 Hz f = 1 kHz f = 10 kHz f = 1 MHz
ε tanδ ε tanδ ε tanδ ε tanδ
300 86.0 0.0020 85.9 0.0014 85.9 0.0014 86.4 0.0022
380 92.3 0.0021 92.1 0.0019 92.1 0.0015 92.6 0.0023
730 92.7 0.0015 92.4 0.0013 92.4 0.0012 92.7 0.0020
1200 90.7 0.0024 90.4 0.0025 90.3 0.0021 90.6 0.0024
1400 92.6 0.0020 92.3 0.0015 92.2 0.0015 93.0 0.0032
Table 4. Dielectric properties of Ba4(Pr0.85 – zSmzBi0.15)9 + 1/3Ti18O54 samples at different Sm concentrations (z) measured atthe frequency f = 1 MHz
z ε tanδ Synthesis temperature, °C Pressure, GPa Synthesis duration, min
0 92.7 0.002 630 5 100.05 97.8 0.003 630 5 100.10 84.9 0.009 630 5 100.12 74.9 0.008 630 5 100.15 85.2 0.003 630 5 100.20 66.3 0.004 630 5 100.40 92.2 0.004 630 5 100.60 82.9 0.012 630 5 10
Dielectric Properties of Ba4(Pr0.85 – zSmzBi0.15)9 + 1/3Ti18O54 Samples
Synthesized under High Pressure
Table 4 indicates dielectric properties of ceramicBa4(Pr0.85 – zSmzBi0.15)9 + 1/3Ti18O54 samples synthesizedfor 10 min under a quasihydrostatic pressure of 5 GPaat 630°C with subsequent 2-h-annealing in the temper-ature range 1218–1236°C. The best dielectric proper-ties belong to samarium-doped samples (z = 0.05).Higher samarium content in the samples results in deg-radation of their dielectric properties.
The samples of the compositionBa4(Pr0.7Sm0.15Bi0.15)9 + 1/3Ti18O54 synthesized for 3 minunder a quasihydrostatic pressure of 7 GPa at two tem-
300 T, K
ε
80
75
70325 350 375
85
90
95
100
12
3
4
Fig. 2. Temperature dependences of permittivity of(Ba1− aPba)4(Pr0.8Bi0.15Sm0.05)9 + 1/3Ti18O54 samples atdifferent a: (1) 0.4, (2) 0.3, (3) 0.1, (4) 0.2.
CRYSTALLOGRAPHY REPORTS Vol. 50 Suppl. 1 2
peratures, 1220 and 1560°C, with subsequent 4-h-annealing at 1169–1204°C had the following dielectricproperties: ε = 74.4, tanδ = 0.002 and ε = 73.8, tanδ =0.006, respectively. In other words, faster synthesis per-formed at higher pressures and temperatures does notimprove the dielectric properties of the materials.
Our studies showed that the use of a high quasihy-drostatic pressure at relatively low synthesis tempera-tures allows one to obtain samples of theBa4(Pr0.85 − zSmzBi0.15)9 + 1/3Ti18O54 composition with ahigher permittivity and lower dielectric losses.
Influence of Lead on Dielectric Propertiesof (Ba1 – aPba)4(Pr0.8Bi0.15Sm0.05)9 + 1/3Ti18O54 Ceramics
The dielectric properties of the ceramic samples of thecomposition (Ba1 − aPba)4(Pr0.8Bi0.15Sm0.05)9 + 1/3Ti18O54synthesized for four hours at 1234–1245°C are indi-cated in Table 5. The typical temperature dependence ofsample permittivity, ε(T), is shown in Fig. 2. With anincrease in the lead content in the samples, their permit-tivity increases, attains the maximum value at A = 0.2,and then decreases. The dependence of dielectric losseson the lead content in the samples is of a more compli-cated character. Partial substitution of lead for bariumresults in a synthesis of dielectric ceramic materialswith high and stable permittivity (with values in respectto temperature) and low dielectric losses.
005

S36 SHISHONOK et al.
Dielectric Properties of Materials Synthesized in the BaO–Pr2O3–Ti2O3–Ta2O5 and Ag(Nb,Ta)O3
Systems
In the process of searching for new dielectric mate-rials with permittivity exceeding 100 and low values ofdielectric losses, we studied a number of compounds inthe BaO–Pr2O3–Ti2O3–Ta2O5 (I) and Ag(Nb,Ta)O3 (II)systems. We obtained new dielectric materials withhigh dielectric properties at the frequency 1 MHz: ε =109–154 and tanδ = 0.0015–0.009 in system I and ε =239 and tanδ = 0.009 in system (II). The temperaturedependences of permittivity for the samples with thecompositions Ba2Pr4Ti6Ta4O30, Ba3Pr3Ti5Ta5O30,Ba4Pr2Ti4Ta6O30, and Ba5Pr1Ti3Ta7O30 synthesized inthe quaternary BaO–Pr2O3–TiO2–Ta2O5 are shown inFig. 3. The use of a certain dopant allows one to consid-erably decrease the synthesis temperature without degra-dation of the dielectric properties of the samples, whichis very important for the mass production of dielectrics.
Table 5. Dielectric properties ofBa4(Ba1 − aPba)4(Pr0.8Bi0.15Sm0.05)9 + 1/3Ti18O54 ceramics syn-thesized for 4 h at 1234–1245°C at different Pb concentrations(a) measured at the frequency f = 1 MHz
a ε tanδ
0 86.6 0.004
0.1 94.3 0.006
0.2 101.4 0.004
0.3 93.5 0.003
0.4 84.2 0.003
20T, °C
ε
100
80
0 40 60 80 100
120
140
160
4
3
2
1
Fig. 3. Temperature dependences of the frequency of(1) Ba2Pr4Ti6Ta4O30, (2) Ba3Pr3Ti5Ta5O30,(3) Ba4Pr2Ti4Ta6O30, and (4) Ba5Pr1Ti3Ta7O30 samplessynthesized in the quaternary BaO–Pr2O3–TiO2–Ta2O3system.
CRY
CONCLUSIONS
High-frequency ceramic materials in the BaO–Pr2O3–TiO2 system are studied. New materials of the compo-sition (Ba1 – aPba)4(Pr1 – y – zBiySmz)9 + 1/3Ti18O54 are syn-thesized and their dielectric properties are studied at thefrequencies f = 100 Hz–1 MHz. The influence of thepartial substitution of Pb ions for Ba ions and of Bi andBi/Sm ions for Pr ions and the synthesis conditions(including synthesis under a high (up to 7 GPa) quasi-hydrostatic pressure) on the structure, phase composi-tion, and dielectric properties of the samples is studiedat frequencies up to 1 MHz. The temperature depen-dences of permittivity and dielectric losses are studiedin the temperature range from 20 to 100°C. The Pb, Bi,Sm, and Bi/Sm concentrations that ensure the synthesisof materials with better dielectric properties relative tothose of the matrix composition are determined, as wellas the modes of synthesis of ceramic samples with highpermittivity, low dielectric losses, and almost zero tem-perature coefficient of the resonance frequency. Theexperimental samples are obtained with the followingcharacteristics: ε = 100–110, tanδ = 0.0015–0.003, τf =0.3–7.0 ppm/K at f = 1 MHz. A number of samples withdifferent compositions are studied in the BaO–Pr2O3–Ta2O3–Ta2O5 (I) and Ag(Nb,Ta)O3 (II) systems.Ceramic samples with high dielectric properties aresynthesized in system I (ε = 154, tanδ = 0.0015) and insystem II (ε = 239, tanδ = 0.009). The studies per-formed show that it is possible to synthesize new mate-rials with high dielectric parameters, elaborate a newtechnology on their basis, and obtain new dielectricswith high permittivity, low dielectric losses, and analmost zero temperature coefficient of the resonancefrequency.
REFERENCES
1. D. Suvorov, M. Valant, and D. Kolar, J. Mater. Sci. 32,6483 (1997).
2. M. Valant, D. Suvorov, and D. Kolar, J. Mater. Res. 11(4), 928 (1996).
3. T. Okawa, M. Imaeda, and H. Ohsata, Jpn. J. Appl. Phys.39, 5645 (2000).
4. M. Podlipnik, D. Suvorov, M. Valant, and D. Kolar, J.Mater. Res. 15 (8), 1735 (2000).
5. Yong Jun Wu and Xiang Ming Chen, J. Am. Ceram. Soc.83, 1837 (2000).
6. M. Valant, D. Suvorov, and D. Kolar, Jpn. J. Appl. Phys.35, 144 (1996).
7. M. V. Varfolomeev and A. S. Mironov, Zh. Neorg. Khim.33, 1070 (1988).
8. K. Fukuda, R. Kitch, and I. Awai, J. Mater. Res. 10, 312(1995).
9. L. S. Kim, Ch. Cheon, et al., J. Mater. Sci. 35, 1487(2000).
Translated by L. Man
STALLOGRAPHY REPORTS Vol. 50 Suppl. 1 2005

Crystallography Reports, Vol. 50, Suppl. 1, 2005, pp. S37–S45.Original Russian Text Copyright © 2005 by Soshnikov, Trukhan, Golyakevich, Soshnikova.
PHYSICAL PROPERTIESOF CRYSTALS
Elastic and Dielectric Properties of AII (A = Cd or Zn, B = P or As) Single Crystals
L. E. Soshnikov*, V. M. Trukhan*, T. V. Golyakevich*, and H. L. Soshnikova*** Institute of Solid-State and Semiconductor Physics, National Academy of Sciences of Belarus,
ul. Brovki 17, Minsk, 220072 Belarus** Belarussian State University, ul. Leningradskaya 14, Minsk, 220080 Belarus
e-mail: [email protected] February 7, 2005
Abstract—Elastic and dielectric properties of CdP2, ZnP2, and ZnAs2 single crystals are investigated at fre-quencies of 102, 103, 104, 106, and 107 Hz in the [00l], [h00], and [hk0] directions in the temperature range 78–400 K. The elastic constants, the Gruneisen parameters, and the force constants of the crystals are calculatedfrom the measured ultrasonic velocities. The elastic constants Cij decrease with an increase in temperature andanomalously change in narrow (∆T = 10–20 K) temperature ranges. The permittivity sharply increases fromε ≈ 7–14 at 78–150 K to ε ≈ 102–103 in the temperature range 175–225 K without any signs of a structural phasetransition. The behavior of the temperature–frequency dependences of the complex permittivity ε*(f, T) is typ-
ical of relaxation processes. The dielectric relaxation in AII is considered on the basis of the model of iso-lated defects. The conductivity σ of the single crystals under study is a sum of the frequency-dependent (hop-ping) conductivity σh and the conductivity σs that is typical of semiconductors. The hopping conductivityincreases with an increase in frequency according to the law σh ~ f α, where α < 1 at low temperatures and α >1 at high temperatures. © 2005 Pleiades Publishing, Inc.
BV2
B2V
INTRODUCTION
Compounds of the AIIBV group are promising for usein optical, electronic, and thermal sensors; photovoltaicdetectors; solar cells; and IR detectors. At the sametime, AIIBV compounds are characterized by complexphase diagrams, polymorphism (for a number of com-pounds), the existence of metastable and amorphousphases, wide homogeneity ranges, and structural distor-tions with corresponding structural rearrangements [1].
AII semiconductors have attracted the attention
of researchers owing to such phenomena as incommen-surate phases, polytypism, and the devil’s staircase,which were observed in two representatives of this fam-
ily: CdP2 and ZnP2 [2–6]. AII compounds are crys-tallized as single crystals with a tetrahedral coordina-tion of atoms, layered structure, and zigzag chains ofanions, passing through a crystal.
Interest in the properties and structural transforma-
tions in AII crystals is occasioned by the specific fea-tures of their crystal structure. Crystals are tetrahedrallycoordinated to off-center covalent bonds and a fractionof an ionic bond. Tetrahedra forming a continuouschain are significantly distorted, which leads to latticeinstability with respect to structural transformationsand to the formation of superstructures of different
B2V
B2V
B2V
1063-7745/05/5001-S $26.000037
types [1–6]. One might expect the presence of strongnonlinear effects and anharmonic instability in crystals
of AII compounds [7]. Although the structural dis-tortions and related characteristic reconstructionsbelong to specific features of AIIBV compounds [1], themechanisms of lattice distortions and structural trans-formations in the crystals are still obscure. The electronand defect subsystems also significantly affect theproperties of semiconductor crystals. The interactionbetween the phonon and electron subsystems may giverise to such phenomena as thermal memory and meta-stable states with phase transitions [8].
According to the formula AII , in the Zn–P, Cd–P,and Zn–As systems, the following structures are crys-tallized: two modifications of CdP2: orthorhombicα-CdP2 and tetragonal β-CdP2, two modifications ofZnP2: tetragonal α-ZnP2 and monoclinic β-ZnP2, andmonoclinic ZnAs2. In the structure of these crystals,each atom of a metal M (M ≡ Cd, Zn) is surrounded byfour anion A atoms (A ≡ As, P) and each A atom is sur-rounded by two M atoms and two A atoms. The radiusof an A atom is about 0.1 nm. Since the A–A distance isabout 0.21 nm, the anion bond is sufficiently strong.Atoms of a metal M, being located at the center of adeformed tetrahedron, link chains of anion atoms into athree-dimensional (3D) structure. A complex character
B2V
B2V
© 2005 Pleiades Publishing, Inc.

S38
SOSHNIKOV
et al
.
Table 1. Elastic constants Cij and the Debye temperature ΘD of β-CdP2, α-ZnP2, and ZnAs2 single crystals at room temper-ature Tr = 300 K
Cij, GPaC11 C22 C33 C44 C66 C12 C' C'' ΘD, K
Compound
β-CdP2 78.7 99.5 26.25 30.45 42.79 91.21 32.73 198.2
α-ZnP2 102.1 115.7 42.85 52.08 30.76 118.5 27.13 280.2
ZnAs2 86.4
of chemical bond is observed in the compounds underconsideration: the anion–anion bond is covalent and themetal–anion bond is partially (by different estimates,from 16 to 54%) ionic [9]. The bond lengths in the com-pounds are different (the difference is on average ashigh as 10%); thus, to form a continuous spatial net-work, the bond angles vary in wide limits, which leadsto distortion of tetrahedra and a change in the bondlengths [10, 11].
It is the structure and optical properties of AII sin-gle crystals that have mainly been studied [10–14]. Arecent X-ray diffraction study gave refined data on thebond lengths and angles [11]. The elastic properties ofthe crystals were measured mainly at room temperature[14–16]. Temperature investigations are scarce and farfrom being complete [17, 18]. Study of the dielectric
properties and the conductivity of AII crystals
showed fairly unusual temperature behavior of thenoted characteristics and gave rise to a discussion inpress concerning the existence of superionic conductiv-ity in these crystals [19, 20]. It is of interest to investi-gate in detail the elastic and electrical properties of
crystals of AII compounds and to establish the mech-anisms of anomalous behavior of these properties andstructural distortions in the crystals.
In this work, we investigated the elastic and dielec-
tric characteristics of AII (A = Cd, Zn; B = P, As) sin-gle crystals in the temperature range 78–400 K and, onthe basis of the data obtained, calculated the anisotropy,Gruneisen parameters, effective Sigetti charge, andforce constants of these crystals. The purpose was toreveal the nature of the chemical bond and the anisot-
ropy and anharmonicity of AII (A = Cd, Zn; B = P,As) single crystals on the basis of data on the elastic anddielectric properties of these crystals at different fre-quencies and in a wide temperature range.
EXPERIMENTAL TECHNIQUE AND RESULTS
Single crystals of the β-CdP2, α-ZnP2, β-ZnP2, andZnAs2 phases were grown by chemical vapor deposi-tion. Samples for study were oriented and cut in the
B2V
B2V
B2V
B2V
B2V
CRY
(001), (100), (010), and (110) planes. The working sur-faces of the samples were ground and polished.
To investigate the elastic properties of the crystalsgrown, we measured the ultrasonic velocities by thepulse echo method at a frequency of 10 MHz. The sam-ples for ultrasonic experiments were cut in the form ofparallelepipeds with plane-parallel polished faces. Thevelocities of longitudinal and shear elastic waves weremeasured in the crystallographic directions a and c inβ-CdP2 and α-ZnP2 and in the b direction in β-ZnP2. InZnAs2, the velocities of longitudinal elastic waves weremeasured in the a, b, and c directions.
The dielectric properties of β-CdP2 (permittivity ε,loss tangent tanδ, and conductivity σ) were investigatedusing E7-12 and E7-14 LCR meters at frequencies of102, 103, 104, and 106 Hz. The sample in the form of athin plate with thin (~0.1 mm) graphite layers depos-ited on grinded opposite faces was placed between pol-ished brass electrodes. Measurements were performedin the [001] and [200] directions.
Ultrasonic and dielectric measurements were car-ried out in the temperature range 78–400 K upon slowheating/cooling at a rate of 1–2 K/min. The error of thedielectric measurements and the relative measurementsof the ultrasonic velocity did not exceed 0.1%. Temper-ature was measured accurate to 0.1–0.2 K.
Elastic Properties of β-CdP2, α-ZnP2, β-ZnP2, and ZnAs2 Single Crystals
On the basis of the measured ultrasonic velocities,we calculated the elastic constants Cij by the formulaC = ρV2, where ρ is the crystal density: 4.18 × 103,3.51 × 103, and 5. 245 × 103 kg/m3 for β-CdP2, α-ZnP2,and ZnAs2, respectively (Table 1). The elastic constantswere used to calculate the elastic compliances Sij, theYoung modulus E, the shear modulus G, the bulk com-pression modulus K, and the Poisson ratio ν. Table 2contains the experimental results and the data of [16]for the elastic constant C13 of tetragonal β-CdP2.
Figure 1 shows the typical temperature dependencesof the elastic constants Cij of β-CdP2 and α-ZnP2 singlecrystals. The temperature dependences of the elasticconstants C11, C33, C44, and C66, as well as C ' =(1/2)(C11 + C12 + 2C66) and C '' = (1/2)(C11 – C12), forthe tetragonal modifications of CdP2 and ZnP2 wereobtained by calculation using the measured velocities
STALLOGRAPHY REPORTS Vol. 50 Suppl. 1 2005

ELASTIC AND DIELECTRIC PROPERTIES S39
of longitudinal and shear elastic waves in the [001],[010], and [110] directions. The temperature depen-dences of the velocities of longitudinal ultrasonicwaves in monoclinic zinc diarsenide ZnAs2 and zincdiphosphide β-ZnP2 (Fig. 2) were measured, respec-tively, in the [001], [010], and [100] directions and inthe [001] direction. The temperature dependences ofthe elastic constants Cij(T) are, on the whole, fairlymonotonic and linear. They are described by the simple
equation Cij(T) = + AijT. However, at certain tem-peratures, the linear dependences are violated by thepresence of regions with anomalous changes in theelastic constants and the slope of the curves withrespect to the temperature axis. In the temperaturerange 78–410 K, the elastic constants exhibit anoma-lous changes in the form of small minima (about 0.1–0.4% in magnitude). The anomalies evolve with achange in temperature as follows. At low temperatures,the region of anomalous changes contains three min-ima, the intermediate minimum being located approxi-mately in the middle of the interval. With an increase intemperature, the intermediate minimum shifts to thelow-temperature minimum to collapse with it. At hightemperatures, the region of anomalous changes con-tains two minima, spaced at a distance approximatelyfrom 5 to 20 K. Large portions between the temperatureranges with anomalous changes are characterized bymonotonic, often close to linear, change in the elasticconstants and different slopes with respect to the tem-perature axis. The temperatures corresponding to theminima somewhat differ in different measurements anddepend on the rate of temperature change and the sam-ple history. The best reproducibility was obtained whenthe measurement unit with a sample was kept at initialtemperatures for several (4–8) h and subsequent mea-surements were carried out at the rates of temperaturechange from 0.05 to 0.1 K/min.
Dielectric Properties and Conductivity
The temperature dependences of the permittivityε(T) (Fig. 3), the loss tangent tanδ(T), and the conduc-tivity σ(T) were measured in the [001] and [h00] direc-tions of β-CdP2 single crystals at frequencies 102, 103,104, and 106 Hz in the temperature range 78–400 K. Atlow temperatures (78–150 K), the permittivity changeslittle: ε ≈ 7–14. With an increase in temperature, thepermittivity ε sharply increases to ≈300–400 with sub-sequent increase to ≈103 at high temperatures. With anincrease in the measuring frequency, the permittivitydecreases and the temperature–frequency dependencesε(ω, T) shift to higher temperatures.
The temperature dependences of the loss tangentshow characteristic peaks located in the region wherethe permittivity sharply increases. At liquid-nitrogentemperature and up to 130 K, tanδ is close to zero. Withan increase in temperature to 150 K, a sharp increase inthe loss tangent is observed to the values tanδmax. Then,
Cij0
CRYSTALLOGRAPHY REPORTS Vol. 50 Suppl. 1 2
the loss tangent sharply decreases to zero in the temper-ature range ∆T = 200–250 K. The peak values tanδmaxincrease with an increase in the measuring frequencyand obey the dependence tanδmax = 0.332 + 0.144logf.At temperatures above 350 K, tanδ increases owing tothe dc conductivity.
Figure 3 shows the experimental temperaturedependences of the conductivity measured at frequen-cies f = 102, 103, 104, and 106 Hz (curves 1, 2, 3, and 4,respectively). The conductivity, being the sum of thecontributions of the conventional and hopping conduc-tivities, is characterized by a pronounced frequencydependence.
RESULTS AND DISCUSSION
Elastic Properties of the Crystals
In tetragonal crystals, the elastic constants C11, C12,and C66 characterize the bonding forces in a layer(intralayer constants), whereas the elastic constants C33,C13, and C44 characterize to a large extent the bondingforces between layers (interlayer constants). Measure-ments in the directions along and across layers showed adifference between the elastic, structural, and electricalcharacteristics. The anisotropy of the elastic propertiesof the crystals studied is characterized by the anisotropycoefficient A = 2C44/(C11 – C12) and the deviations fromthe Cauchy relations Gkk = Cij – C9 – i – j, 9 – i – j (where i ≠j ≠ k; i, j, k = 1, 2, 3), which are caused by the off-centercharacter of the interaction between atoms (Table 3).
The elastic anisotropy in β-CdP2 is higher than in α-ZnP2. Apparently, the reason for this fact is that theionic radius of Cd exceeds that of Zn and distortions oftetrahedra in β-CdP2 are larger than in α-ZnP2 [1].Deviations from the Cauchy relations indicate that the
Table 2. Elastic compliances Sij, the Young modulus E, theshear modulus G, the bulk modulus K, and the Poisson ratioν measured in the main crystallographic directions in β-CdP2and α-ZnP2 single crystals at room temperature T = 300 K
Elastic characteristics β-CdP2 α-ZnP2
S11, 10–11 m2/N 2.327 1.25
S33, 10–11 m2/N 2.288 1.264
S44, 10–11 m2/N 3.81 2.334
S66, 10–11 m2/N 3.295 1.92
S12, 10–11 m2/N –0.504 –0.15
S13, 10–11 m2/N –1.096 –0.469
E100 = 1/S11, GPa 42.97 79.95
E101 = 1/S33, GPa 43.71 79.14
G = (C11 – C12)/2, GPa 17.97 35.7
ν12 = –E100 × S12 0.217 0.12
ν13 = –E001 × S13 0.479 0.371
K, GPa 64.5 62.91
005

S40 SOSHNIKOV et al.
11.4
100T, K
12.2
200150 250 300 350 400
12.0
11.8
11.6
(a)
(b)
C'
C33
9.0
100
C', 1010 Pa
9.6
200150 250 300 350 400
9.4
9.2
C'
C33
10.3
10.1
C33, 1010 Pa
9.9
9.7
Fig. 1. Temperature dependences of the elastic constants Cij of (a) β-CdP2 and (b) α-ZnP2 single crystals.
model of central forces is not valid for crystals ofdiphosphides.
The Gruneisen parameters characterize nonlinear(anharmonic) properties of crystals. The Gruneisen
Table 3. Elastic-anisotropy parameter A and deviations fromthe Cauchy relations, G and δ, for β-CdP2 and α-ZnP2 singlecrystals at room temperature
Anisotropy α-ZnP2 β-CdP2
A = 2C44/C11 1.2 1.46
δ = (C44 – C12)/C11 0.12 –0.21
G11 = C23 – C44 6.5 32
G33 = C12 – C66 –21.4 12.4
C11/C33 0.88 0.79
C11/C44 2.4 3
C66/C44 1.22 1.16
CRY
constant γij = , where M is the molecular
weight, ρ is the density, α is the coefficient of thermal
expansion, cp is the specific heat, and are the adia-batic elastic constants, characterizes the anharmonicityof thermal vibrations. For tetragonal crystals, thisparameter has two components with different direc-tions: along the fourfold symmetry axis and perpendic-ular to it:
where α|| and α⊥ are, respectively, the coefficients ofthermal expansion along and perpendicular to the four-fold symmetry axis (Table 4).
Mρcp
--------α klcijkls
cijkls
γ||C33
s α|| 2C13s α⊥+( )M
ρcp
------------------------------------------------,=
γ⊥C11
s C12s+( )α⊥ C13
s α||+[ ] Mρcp
----------------------------------------------------------------,=
STALLOGRAPHY REPORTS Vol. 50 Suppl. 1 2005

ELASTIC AND DIELECTRIC PROPERTIES S41
It can be seen from Table 4 that the Gruneisenparameters and, accordingly, the anharmonicity of α-ZnP2 exceed those of β-CdP2. The anharmonicity ofthermal atomic vibrations in the lattices of diphos-phides of tetragonal modification is higher in the planeof layers than along the fourfold symmetry axis.
Deviations from the Cauchy relations suggest that atransverse component arises in the bonding forces. Intetrahedrally coordinated crystals, the structure is stabi-lized by the bonds of off-center (shear or transverse)type. The forces corresponding to the transverse bondsare typically high, since they correspond to the off-cen-ter forces of covalent bonds. Actually, a force constantof a crystal is the force acting on an ion in the lattice siteA in the ith direction if the ion in the site B shifts by alength unit in the jth direction.
In the Born model of crystals, in which the nearestneighbors are bound by central and off-center forces[21], the force constants α' and β' are related to the elas-tic constants by the expressions C11 = (α' + β')/4a, C12 =(α' – 2β')/4a, and C44 = [3β'(α' + β'/4)/[4a(α' + β')],where a is the lattice parameter.
In tetrahedrally coordinated compounds with thesp3-type of bonding, the crystal structure is stabilizedby bond-bending forces. In the valence-force field(VFF) model, bonds are interpreted as bond-stretchingand bond-bending ones [22]. Keating extended the VFFmodel to homopolar crystals with diamond-like struc-ture, in which the second-order elastic constants aredescribed by longitudinal (bond-stretching) and shear(bond-bending) force constants (α and β, respectively)[21, 23]: C11 = (α + 3β)/4a, C12 = (α – β)/4a, and C44 =αβ/a(α + β), where a is the lattice parameter. Thismodel was extended by Martin [24] to heteropolar crys-tals with a zinc blende structure by including into con-sideration long-range Coulomb interactions. The longi-tudinal α and transverse β components correspond tothe diagonal and off-diagonal elements of the force-constant matrix. The off-diagonal elements are addi-tionally separated into symmetric and antisymmetriccomponents [25]. In terms of α and β, the second-orderelastic constants have the form
where a is the lattice parameter, e is the elementarycharge, Z is the effective charge, and ε0 is the permittiv-
C11α 3β+( )
a--------------------- 4.053
Z2e2
4πε0a4-----------------,–=
C12α β–( )
a----------------- 5.538
Z2e2
4πε0a4-----------------,–=
C44α β+( )
a------------------ 5.538
Z2e2
4πε0a4-----------------–=
– α β+( )a
------------------ 4.189Z2e2
4πε0a4-----------------–
ξ2,
CRYSTALLOGRAPHY REPORTS Vol. 50 Suppl. 1 20
ity of free space
ξ α β–( )a
----------------- 10.058Z2e2
4πε0a4-----------------–=
× α β–( )a
----------------- 4.189Z2e2
4πε0a4-----------------–
1–
.
150
Vlong, m/s
T, K
4600
200
4332
200
Vlong, m/s
T, K
4340
–2.0150
∆V/V, %
T, K
0
200100 250 300
–0.5
–1.0
–1.5
(b)
100 250 300 350 400
4400
4200
4000
210 220
433843364334
4330
(a)
3
2
1
Fig. 2. Temperature dependences of (a) the longitudinalultrasonic velocities Vlong(T) in ZnAs2 single crystals in the(1) [001], (2) [010], and (3) [100] directions and (b) the rel-ative longitudinal ultrasonic velocity in β-ZnP2 single crys-tals in the [001] direction.
05

S42 SOSHNIKOV et al.
The model contains three parameters: the longitudi-nal α and transverse β force constants and the fittingparameter ξ. A characteristic feature of the model isthat it takes into account the polarization (arising due to
–18
4T, K
–6
6
1
0 100
tan
δ
T, K
4
200
8 10 12
lnσ
–16
–12
–9
–18
–6
–16
–12
–94
3
2
1
4
3
2
1
(c)
(d)
300 400
3
2
300
0
600
900
1200
1500ε
1
2
3
4
105
103
f, Hz
200 250T, K
(a)
(b)
Fig. 3. Temperature dependences of the characteristics ofβ-CdP2 single crystals: (a) permittivity and (b) loss tangentmeasured in the [200] direction and conductivity measuredin the (c) [001] and (d) [200] directions at measuring fre-quencies f = (1) 100 Hz, (2) 1 kHz, (3) 10 kHz, and(4) 1 MHz.
CRY
the overlap of the electron shells of ions), which isintroduced into the calculation formulas through theeffective charge Z.
The ratio β/α is the measure of the covalent bond-ing. When a crystal becomes more ionic, the transverseforces tend to decrease. In the ionic limit, β/α 0since β 0 and the closed shells of the ions form astructure with predominantly central Coulomb forces.Vice versa, more covalent compounds have large valuesof β, and large force constants provide a more stabletetrahedrally coordinated structure [23].
Within the Keating model, the values of longitudinalforce constants α for the bonds of the A–B, A–A, and B–B types in binary semiconductors with tetrahedralatomic coordination were obtained by Neumann usingthe expression α = α0exp(–bd), where d is the bondlength, b = (1.13 ± 0.02) × 1010 m–1, and the constant α0is equal to 704 or, more rarely, 766 N/m [26].
Different models yield different values of the forceconstants (Table 5). Calculations in terms of the Keat-ing model were performed using the values of the effec-tive charge Z obtained from optical measurements [9].As a result, averaged values for the force constantswere found. According to the experimental data on theelastic constants, the value of the covalent contributionto the bonding, β/α, for α-ZnP2 exceeds that for β-CdP2by a factor of about two (Table 6).
An increase in the cation size increases the ionicityof the structure (i.e., the effective charge) and the elasticanisotropy and decreases the covalent contribution tothe chemical bonding. This effect indicates a smallerstability of the tetrahedrally coordinated lattice of β-CdP2as compared to the lattice of isomorphic α-ZnP2.
In cadmium diphosphide, the covalent contributionto the bonding is smaller than in zinc diphosphide.Accordingly, the lattice of CdP2 is less stable. In theideal case of an ionic crystal, where overlap of electronclouds is absent, e*/e = 1. However, electron shells inreal crystals overlap, which leads to the deformation ofthe electron cloud. Effective charge is the measure ofthe polarization caused by this overlap. In highly ioniccrystals, the effective charge e* is smaller than e by 10–20%. The reason for the deviation of the ratio e*/e fromunity is that the interaction between electron clouds ofneighboring ions modifies the electrical dipolemoment, and the thermal motion of ions affects theoverlap of electron shells. The increase in anharmonicinteractions with an increase in temperature leads toadditional distortion of electron clouds and decreasesthe effective charge [27].
The values of e*/e calculated for β-CdP2 fromexperimental data, using the values of permittivity mea-sured at low temperatures [27], are /e = 0.197 and
/e = 0.089. These values are consistent with the con-cept of predominantly covalent bonding in crystals ofdiphosphides with a fraction of ionic bonding [1]. How-ever, such a value of the effective charge suggests high
ec*
ea*
STALLOGRAPHY REPORTS Vol. 50 Suppl. 1 2005

ELASTIC AND DIELECTRIC PROPERTIES S43
Table 4. Debye temperatures Θ, average ultrasonic velocities Vm, the bulk (K) and shear (G) moduli, and the Gruneisen con-stants γ
ParameterΘ, K Vm, m/s K, GPa G, GPa γ|| γ⊥ γ⊥ /γ||
Compound
α-ZnP2 280.2 3708.1 63.6 39.3 0.632 0.723 1.144
β-CdP2 198.2 2603.3 64.2 22.1 0.449 0.46 1.024
Table 5. Force constants of diphosphides, calculated within the Born model of central and off-center forces and the Keating model
Model Born modelKeating model
Neumann’s data Martin’s data
Force constant, N/m α' β' β/α α (M–P) α(P–P) α β β/α
α-ZnP2 152.38 46.28 0.3 47.61 60.61 27.95 8.84 0.32
β-CdP2 136.24 24.45 0.18 38.47 60.61 30.28 4.54 0.15
Table 6. Elastic constants Cij (in 1010 N/m2); the force constants α and β; measure of the covalent contribution, β/α; and the
effective charge S ~ ( ), obtained from the optical splitting of frequencies in crystals with tetrahedral coordination ofatoms [10, 16]
CharacteristicC11, GPa C44, GPa C12, GPa α, N/m β, N/m β/α S
Compound
α-ZnP2102.12 42.85 30.76 27.95 8.84 0.32 0.39
β-CdP2 78.73 26.25 42.79 30.28 4.54 0.15 0.66
ω12 ωt
2–
polarization and the presence of dipoles in the crystallattice.
Dielectric Properties and Conductivity
Zinc diarsenide and cadmium diphosphide arewide-gap semiconductors. The band-gap width Eg is≅ 2.03 and ≅ (2.05–2.22) eV in tetragonal β-CdP2 and α-ZnP2, respectively, and ≅ (1.44–1.602) and ≅ 0.89 eV inmonoclinic β-ZnP2 and ZnAs2, respectively [28–30].
Typical temperature–frequency dependences of thepermittivity ε(ω, T) and the loss tangent tanδ(ω, T) areshown in Fig. 5. Such large values of the permittivityare typical of ferroelectric and wave-charge densitymaterials [31]. However, there are no experimental dataallowing us to speak with confidence about a phasetransition to the ferroelectric or wave-charge density
state in single crystals of AII compounds in the tem-perature range under consideration. Similar tempera-ture–frequency dependences of ε and tanδ are morecharacteristic of orientational dielectric relaxation [32].Apparently, the obtained values of permittivity arerelated to the mechanisms of dielectric relaxation.
One of the possible mechanisms describing strongdielectric relaxation in semiconducting ceramic sam-ples is the Maxwell–Wagner relaxation [33]. The sam-
B2V
CRYSTALLOGRAPHY REPORTS Vol. 50 Suppl. 1 20
ples under study are almost perfect single crystals witha small concentration of defects. These samples containno separate regions that could serve as grains. The sin-gle crystal itself can be regarded as grain. Then, theMaxwell–Wagner relaxation may be caused by thecapacitance of the air gap between an electrode and thecrystal surface. To avoid this effect, a semi-insulatinggraphite interlayer between the ground sample surfaceand the electrodes was used. In this case, the Maxwell–Wagner relaxation is unlikely to occur.
To explain the thermally activated increase in thepermittivity of ternary semiconductor compoundsCd1 − xMnxTe (0 ≤ x ≤ 0.7), a model of hopping chargeexchange was proposed [24]. According to this model,hopping charge exchange in multiply charged defects(which introduce deep levels into the band gap) in anexternal electric field should lead to an increase in thepermittivity. However, this mechanism is unlikely inthe case under consideration. Indeed, to increase thepermittivity to ε ≈ 200, the defect concentration shouldbe about 1019–1020 cm–3. In other words, the sampleshould be strongly imperfect, whereas the single crys-tals we used were much more perfect: the concentrationof point defects in them did not exceed 1013–1017 cm–3
[28].The model proposed by Ramirez [34, 35] to explain
the high permittivity of CaCu3Ti4O12 gives the most
05

S44 SOSHNIKOV et al.
likely description of the processes occurring in cad-mium diphosphide β-CdP2. Phosphorous vacancies VP,which deteriorate the quality on the initial crystal struc-ture, can play the role of isolated defects in this case.
Under the action of an external ac electric field, thedefect regions undergo distortions and relax betweenalternative equivalent configurations, retaining on aver-age the crystal structure. This model is in good agree-ment with the results obtained here.
The temperature dependences of the specific con-ductivity lnσsp(1/T) are characteristic of semiconduc-tors: they are broken curves, with separate portions cor-responding to different types of conductivity. The slopeof the curve lnσsp(1/T) can be used to calculate the acti-vation energy of carriers at a given frequency from theformula for the conductivity of semiconductors: σ =σexp(–∆Ea/2kT). The calculated values are listed inTable 7.
In the temperature range ∆T ≈ 130–260 K, thedependence becomes linear: lnσsp = (10–3500)(1/T),which suggests the impurity character of conductivity.Furthermore, the carrier concentration does not change,the impurity levels are depleted, and the conductivity isdetermined by the carrier mobility µ(T) and the hop-ping conductivity with the activation energy ∆Ea ≈0.01–0.1 eV. The linear portion at temperatures above350 K corresponds to either impurity or intrinsic con-ductivity of the material.
The values of the activation energy are different atdifferent frequencies, which is related to the frequencydependence characteristic of hopping conductivity. Theconductivity exhibits a pronounced frequency depen-dence, which is due to the superposition of the conven-tional and hopping conductivities. At low temperatures,σ(f) ~ fα (α ≈ 0.75–0.85); at high temperatures, σ(f) ~fβ (β > 1).
CONCLUSIONS
The elastic and dielectric properties of β-CdP2,α-ZnP2, β-ZnP2, and ZnAs2 single crystals are investi-gated in the temperature range 78–400 K. The elastic-anisotropy parameters, the Debye temperature, theGruneisen parameters, and the force constants of thecrystals are calculated. Anomalies related to complex
Table 7. Activation energies ∆Ea (eV) in the [001] directionin β-CdP2 single crystals at different temperatures and differ-ent frequencies of the measuring field
Frequency, Hz102 103 104 106
∆T, K
80–130 – – 0.01 0.003
130–260 0.6546 0.7305 0.5916 0.5889
260–350 0.04 0.0016 0.001 0.12
350–400 1.2 0.38 – –
CRY
structural transformations are revealed in the tempera-ture dependences of the elastic constants and the ultra-sonic velocity. Dielectric relaxation is observed in thecrystals, which can be described by the model of iso-lated defects with a low concentration (presumably,anion vacancies). The conductivity of the crystalsinvestigated is the sum of the conventional (typical ofconductors) and hopping conductivities.
REFERENCES1. V. B. Lasarev, V. Ya. Shevchenko, Ya. Kh. Grinberg, and
V. V. Sobolev, Semiconductor Compounds of II–V Group(Nauka, Moscow, 1978) [in Russian].
2. C. Manolikas, J. van Tendeloo, and S. Amelinckx, Phys.Status Solidi A 97 (1), 87 (1986).
3. A. U. Sheleg and V. V. Zaretskiœ, Fiz. Tverd. Tela (Le-ningrad) 25 (10), 3174 (1983).
4. A. U. Sheleg and V. V. Zaretskiœ, Pis’ma Zh. Éksp. Teor.Fiz. 39 (4), 166 (1984) [JETP Lett. 39 (4), 196 (1984)].
5. L. E. Soshnikov and A. U. Sheleg, Phys. Status Solidi A111 (2), 485 (1989).
6. V. V. Zaretskiœ, L. E. Soshnikov, S. S. Khasanov, andV. Sh. Shekhtman, Fiz. Tverd. Tela (Leningrad) 30 (4),952 (1988) [Sov. Phys. Solid State 30 (4), 553 (1988)].
7. J. A. Krumhansl and R. J. Gooding, Phys. Rev. B 39 (5),3047 (1989).
8. R. F. Mamin, Kristallografiya 38 (1), 140 (1993) [Crys-tallogr. Rep. 38 (1), 74 (1993)].
9. N. N. Syrbu and V. É. L’vin, Fiz. Tekh. Poluprovodn.(St. Petersburg) 25 (10), 1136 (1991) [Sov. Phys. Semi-cond. 25 (10), 1062 (1991)].
10. J. G. White, Acta Crystallogr. 18 (2), 217 (1965).11. K. B. Aleœnikova, A. I. Kozlov, S. G. Kozlova, and
V. V. Sobolev, Fiz. Tverd. Tela (St. Petersburg) 44 (7),1206 (2002) [Phys. Solid State 44 (7), 1257 (2002)].
12. A. P. Krokhmal’, V. A. Gubanov, and Z. Z. Yanchuk, Fiz.Tverd. Tela (St. Petersburg) 45 (7), 1177 (2003) [Phys.Solid State 45 (7), 1233 (2003)].
13. A. I. Kozlov, S. G. Kozlova, A. V. Matveev, andV. V. Sobolev, Fiz. Tekh. Poluprovodn. (St. Petersburg)36 (7), 809 (2002) [Semiconductors 36 (7), 755 (2002)].
14. Yu. V. Ilisavskiœ, L. A. Kulakova, A. B. Pevtsov, et al.,Fiz. Tverd. Tela (Leningrad) 23 (6), 1816 (1981) [Sov.Phys. Solid State 23 (6), 1059 (1981)].
15. E. Karajamaki, R. Laiho, T. Levola, and A. U. Sheleg,Semicond. Insul. 5, 153 (1980).
16. V. Ya. Kuryachiœ, V. P. Mikhal’chenko, N. V. Stuchin-skaya, and I. I. Tychina, Ukr. Fiz. Zh. 30 (2), 248 (1985).
17. A. U. Sheleg, É. M. Smolyarenko, N. P. Tekhanovich,et al., Neorg. Mater. 16 (2), 347 (1980).
18. K. S. Dubrova, V. S. Koval’, V. Ya. Kuryachiœ, andN. V. Stuchinskaya, Ukr. Fiz. Zh. 33 (8), 1259 (1988).
19. V. P. Novikov, A. U. Sheleg, and V. A. Filimonov, Fiz.Tverd. Tela (Leningrad) 30 (1), 289 (1988) [Sov. Phys.Solid State 30 (1), 166 (1988)].
20. Z. V. Silyavichyus, Z. V. Yanushkevichyus, A. P. Kezhe-nis, and A. S. Orlyukas, Fiz. Tverd. Tela (Leningrad) 27(10), 3159 (1985) [Sov. Phys. Solid State 27 (10), 1902(1985)].
STALLOGRAPHY REPORTS Vol. 50 Suppl. 1 2005

ELASTIC AND DIELECTRIC PROPERTIES S45
21. P. N. Keating, Phys. Rev. 145 (2), 637 (1966).22. M. J. F. Musgrave and J. A. Pople, Proc. R. Soc. London
268 (1335), 474 (1962).23. P. N. Keating, Phys. Rev. 152 (2), 774 (1966).24. R. M. Martin, Phys. Rev. B 1 (10), 4005 (1970).25. H. Rakel, C. Falter, and W. Ludwig, Z. Phys. B: Con-
dens. Matter 75 (2), 179 (1989).26. H. Neumann, Cryst. Res. Technol. 24 (6), 619 (1989).27. J. K. Vassiliou, J. Appl. Phys. 59 (4), 1125 (1986).28. V. V. Sobolev, A. I. Kozlov, Yu. I. Polygalov, et al., Phys.
Status Solidi B 154 (1), 377 (1989).29. R. S. Berg and P. Y. Yu, Solid State Commun. 46 (2), 101
(1983).30. V. A. Morozova, S. F. Marenkin, and O. G. Koshelev,
Neorg. Mater. 38 (4), 409 (2002) [Inorg. Mater. 38 (4),325 (2002)].
CRYSTALLOGRAPHY REPORTS Vol. 50 Suppl. 1 20
31. A. P. Ramirez, M. A. Subramanian, M. Gardel, et al.,Solid State Commun. 115, 217 (2000).
32. B. M. Tareev, Physics of Dielectric Materials (Énergoiz-dat, Moscow, 1982) [in Russian].
33. V. V. Lemanov, A. V. Sotnikov, E. P. Smirnova, andM. Weihnacht, Fiz. Tverd. Tela (St. Petersburg) 44 (11),1948 (2002) [Phys. Solid State 44 (11), 2039 (2002)].
34. P. V. Zhukovskiœ, A. Rodzik, and Yu. A. Shostak, Fiz.Tekh. Poluprovodn. (St. Petersburg) 31 (6), 714 (1997)[Semiconductors 31 (6), 610 (1997)].
35. A. P. Ramirez, G. Lawes, V. Butko, et al., cond-mat/0209498.
Translated by Yu. Sin’kov
05

Crystallography Reports, Vol. 50, Suppl. 1, 2005, pp. S46–S52.Original Russian Text Copyright © 2005 by Kaplunov, Kolesnikov, Sha
œ
ovich.
PHYSICAL PROPERTIESOF CRYSTALS
Methods for Measuring Light Scattering in Germanium and Paratellurite Crystals
I. A. Kaplunov*, A. I. Kolesnikov*, and S. L. Shaœovich*** Tver State University, Sadovyœ per. 35, Tver, 170002 Russia
** All-Russia Research Center Vavilov State Optical Institute, Birzhevaya liniya 12, St. Petersburg, 199034 Russia
Received February 8, 2005
Abstract—Methods for studying the scattered light in germanium and paratellurite (α-TeO2) crystals are con-sidered. Investigations of the light scattering in Ge crystals were performed in the infrared wavelength range bythe photometric-sphere method (in the range 2–3 µm) and by measuring the line-scattering functions (at 10.6 µm).In the visible range, the paratellurite single crystals were investigated by recording and analyzing images oflaser beams transmitted through the samples. It is shown that small-angle Mie scattering is characteristic of bothmaterials. Some conclusions about the sizes and the physical nature of scattering inhomogeneities are drawn.The effect of high-temperature annealing on the scattering intensity is studied. © 2005 Pleiades Publishing, Inc.
INTRODUCTION
With the development of the techniques used togrow crystals for optics, optoelectronics, and acous-tooptics, the materials obtained have reached somelevel of structural quality. In particular, the concentra-tion of the largest defects, which mainly determine lightloss and light wavefront distortions in the crystals, hasdecreased. For optical germanium, light loss is causedby the absorption by charge carriers. For paratellurite,light loss is related to the presence of gas bubbles,impurity clusters, and optical inhomogeneities (stria-tions). At a certain stage in the development of growthtechniques, the problem of decreasing the light losscaused by scattering (which is obscured by absorptionin imperfect crystals) becomes urgent. The problem ofdecreasing light scattering is urgent for devices basedon both germanium and paratellurite, especially for Ge-based infrared imaging devices and devices of laser (inparticular, force) optics and paratellurite acousto-opticfilters and deflectors.
The light scattering in germanium crystals has beenstudied insufficiently. There are few experimental stud-ies [1–3], in which complex systems were applied fordirect measurement of scattered fluxes using CO2 lasers(only at a wavelength of 10.6 µm). The light scatteringin paratellurite single crystals has not been investigatedat all. It was mentioned only in view of the manifesta-tion of gyrotropy [4] and has not been considered quan-titatively. The optical quality of paratellurite crystalswith respect to light scattering has been estimated inRussia and abroad fairly subjectively [5]. Crystals arearbitrarily divided into three groups (A, B, C) in ascend-ing order with respect to the intensity of scattered laserlight in the visible range. In crystals of group A, laser
1063-7745/05/5001-S $26.000046
beams are not visualized, whereas, in crystals of groupsB and C, the light scattering is pronounced. In crystalsof group C, the scattering manifests itself in the form ofsubfilamentous inclusions, whose nature has not beenestablished.
The up-to-date certificates for optical germaniumclassify materials only in the attenuation factor [6, 7].This photometric parameter is determined by measur-ing the transmission of optical germanium samples onspectrophotometers with subsequent calculation of theattenuation. However, spectrophotometers of all mod-els measure mixed transmission including both thedirected and scattered components, especially at smallscattering angles.
The spectrophotometric method proposed in [8] canbe used to study the light scattering in germanium andparatellurite. This method, characterized by a simpleinstrumentation and measurement scheme, makes itpossible to record scattering spectra and estimate thesizes of scattering centers. The drawbacks of thismethod are its relatively low sensitivity and difficultiesin quantitative estimation of the scattering.
In this paper, we report the method for monitoringoptical samples using the photometric-sphere methodand the method for measuring line-scattering functions,which ensure a sufficiently exact and efficient determi-nation of the magnitude of scattering and input moni-toring of the materials used to prepare parts of opticalsystems. For paratellurite single crystals, we will con-sider a method that uses visible laser light by recordingand analyzing images of the cross sections of laserbeams transmitted through samples. We believe that itis useful to combine in one study the data on the lightscattering in germanium and paratellurite crystals
© 2005 Pleiades Publishing, Inc.

METHODS FOR MEASURING LIGHT SCATTERING S47
(which are significantly different in structure and phys-ical properties). This approach makes it possible toreveal general problems related to the methods for mea-suring scattered light and provides an impetus to carryout similar investigations of other optical crystals.
CRYSTAL GROWTH
Paratellurite crystals were grown by the Czochralskimethod in air using platinum crucibles. The seed crys-tals were oriented in the [110], [001], [111], and [101]directions. The best results were obtained for the [110]growth direction, which is related to the implementa-tion of the tangential mechanism of the growth of theparticular singular face (110) of paratellurite crystals.Powder tellurium dioxide of 7–4 high-purity analyticalgrade was used as a starting raw material. The totalimpurity concentration in the raw material was about5 × 10–5 and the average effective impurity-distributioncoefficient K varied in the range 0.1 ≤ K ≤ 1 during thecrystal growth.
Germanium crystals were grown by the Czochralskimethod in vacuum in a carbon heating unit. The singlecrystals were oriented in the [111] direction. Polycrys-talline germanium had a grain size of 0.5–3.0 mm.Zone-purified polycrystalline germanium (GPZ grade)was used as a starting raw material. Pure and doped Gecrystals were grown, in which the density and distribu-tion of dislocations were determined.
METHODS FOR STUDY
Photometric-Sphere Method
The scattering coefficients of the optical elementswere measured on an FM-115 system, whose schematicis shown in Fig. 1.
The photometric-sphere method is based on thecomparison of the illuminance of the image of theblackbody 1, located against the uniform bright back-ground in the photometric sphere 3, and the illumi-nance of the image of the sample 7 formed by the aux-iliary objective 5. The illuminance in the photometricsphere 3 was formed by the radiation source 2 fed bythe power supply 8. The radiation detector in the mea-surement unit 9 is a noncooled PbS photoresistor,whose spectral characteristic allows for measuring sig-nals in the spectral range 2–3 µm.
This method makes it possible to measure the frac-tion of scattered light as a ratio of the illuminance of theimage of a blackbody (i.e., a nonemitting and nonre-flecting object) to the illuminance of a bright back-ground image. The blackbody size (diameter) can bevaried in order to change the convergence angle of scat-tered light.
The magnitude of scattering was determined bymeasuring the illuminance of the blackbody imageformed by the luminous flux transmitted through thesample. The illuminance of the background image was
CRYSTALLOGRAPHY REPORTS Vol. 50 Suppl. 1 20
measured after a segment was installed in the entranceaperture of the sphere. The fraction of light S scatteredfrom the sample under study was determined by the for-mula
(1)
where Ibg is the illuminance of the background imageand Ibb is the illuminance of the blackbody image.
Method for Measuring Line-Scattering Functions
The most important criteria for the estimation of thequality of germanium samples include the shape andthe half-width of the indicatrix, which characterizeschanges in the propagation direction and the spatial dis-tribution of the intensity of a parallel light beam trans-mitted through a sample. Changes in the propagationdirection are caused by the light scattering in the bulkof a germanium sample and by the nonuniform distri-bution of the refractive index in the samples. The pres-ence of scattering and inhomogeneity in the refractiveindex leads to image diffusion and decreases the qualityof images obtained by objectives made of these sam-ples.
The measurements of the scattering indicatrix bythis method are based on the comparison of the qualityof the images of a reference objective obtained in a par-allel light beam with a sample installed before theobjective and without a sample. This approach makes itpossible to estimate the total effect of the scattering insamples and their inhomogeneity in refractive index onthe quality of the reference-objective image.
The quality of Ge samples was estimated by mea-suring the line-scattering functions and the modulation-transfer coefficients at the center of the view field of thereference objective for the spatial frequencies N in therange from 10 to 20 lines/mm. In this case, we com-pared the half-width of the line-scattering function(width at half-maximum) and the modulation-transfercoefficients of the reference objective obtained with agermanium sample before the objective and without asample.
S Ibg/Ibb,=
34
57 6 9
82
1
Fig. 1. Schematic of the method for measuring scattering bythe photometric-sphere method.
05

S48
KAPLUNOV
et al
.
On the basis of the measurement results, we calcu-lated the quality-loss coefficient using the relation
(2)
where Tr(N) and Tr + s(N) are the modulation-transfercoefficients of the reference objective without and witha sample before it.
The method for determining the modulation-trans-fer coefficient of the reference objective consists inmeasuring the line-scattering function, i.e., the distribu-tion of the relative illuminance in the image of an infi-nitely narrow luminous line, formed by the sampletested, with subsequent numerical Fourier transforma-tion of the measured line-scattering function on a com-puter. The set of values of the modulation-transfer coef-ficient for different spatial frequencies N form the mod-ulation-transfer function.
The line-scattering function is measured by scan-ning the image of an illuminated slit diaphragm (simu-lator of the luminous line), formed by the referenceobjective, by a measuring slit diaphragm mountedbefore the sensitive layer of a one-area photodetector.
The shape and the half-width of the function charac-terizing the inhomogeneity and the scattering indicatrixof the samples were determined as follows: on the basisof the measured line-scattering function, the modula-tion-transfer functions of the reference objective withand without a sample before it (T(N)r + s and T(N)r,respectively) were calculated; the modulation-transferfunction (T(N)s), characterizing the quality of a samplestudied, was calculated from the relation
T(N)s = T(N)r + s/T(N)r; (3)
and the values of the line-scattering function (which isthe scattering indicatrix in the angular measure), char-acterizing the quality of the sample studied, were calcu-
Kql T r N( ) T r s+ N( )–( )/T r N( ),=
64
1
23
5
16
7
x 8910
14 13
12
11
15
Fig. 2. Schematic of the method for measuring the line-scat-tering functions.
CRY
lated by reverse numerical Fourier transformation ofthe function Φ(N)s.
The schematic of this method is shown in Fig. 2. Themeasurement equipment includes a laser 1 with a wave-length of 10.6 µm, a condenser 2, a test object 4 (around diaphragm 0.15 mm in diameter), a modulator 5,a mirror collimator 6, a scanning slit diaphragm 8 witha width of 0.004 mm, a photodetector 10, a measuringsystem 13, a reference objective, an aperture diaphragm30 mm in diameter, and a sample 15. An NP35 single-lens Ge objective with the focal length F = 50 mm wasused as a reference objective.
Method for Recording and Analyzing Images of Laser Light Beams
The light scattering in paratellurite single crystals inthe visible range was investigated using laser radiationwith wavelengths of 0.63 µm (a He–Ne laser) and0.53 µm (a double-frequency YAG laser). The laserswere generated in the transverse mode TEMoo; thelaser-beam cross section was in the form of a circle withthe Gaussian radial intensity distribution. The beamwidth w (at a level of e–2) was 2.9 and 2.4 mm for theYAG and He–Ne lasers, respectively.
The intensity distribution in the laser beams wasstudied in a completely darkened room, either directly,on a screen located at a distance of 3.5 m from the sam-ples (by a digital camera), or using a cooled CCD arrayinstalled at the same distance coaxially with the beam.Both transmitted through the crystals (and partiallyscattered) light beams and the beams propagating bythe crystals were studied. The images of the beamspropagating by the crystals were subtracted from theimages of the beams transmitted through the crystals inorder to reveal only scattered light.
In the first stage of studying the light scattering, werecorded the image of the laser beam passing by thecrystal. The corresponding intensity distribution wascalculated using a specially developed computer pro-gram by averaging the beam intensity over the coaxialrings around the beam center.
In the second stage, we investigated the imagesobtained under illumination of a distant screen by laserbeams transmitted through the paratellurite single crys-tals. To cut off central (brightest) regions of the beams,formed by directly transmitted or scattered light, anaperture with a radius of 1 cm was cut in the screen. Inthe absence of the aperture, the strong illuminationfrom the spot center impedes the measurement of scat-tered light.
The paratellurite crystals under study were rectan-gular parallelepipeds with polished faces. Their sizes
were 60, 25, and 25 mm in the [110], [001], and [ ]directions, respectively. According to the accepted clas-sification of paratellurite quality in terms of scatteringintensity, the samples studied belonged to groups A, B,and C (in order of decreasing quality). The average dis-
110
STALLOGRAPHY REPORTS Vol. 50 Suppl. 1 2005

METHODS FOR MEASURING LIGHT SCATTERING S49
location density in the samples varied from 7 × 10² to2 × 105 cm–2. The samples contained no bubbles,cracks, or visual inclusions.
RESULTS
Optical investigation of the cylindrical germaniumsingle crystals grown by the Czochralski methodshowed the presence of infrared-radiation scattering inthem with a characteristic distribution over ingots. Thescattering has a pronounced small-angle character: thescattered flux is mainly concentrated in a cone with anopening angle smaller than 2°. Such scattering indica-trices are characteristic of Mie scattering, which occurswhen the light wavelength is close to the sizes of scat-tering inhomogeneities. The dependences of the frac-tion of scattered light S on the height of cylindrical sin-gle-crystal and polycrystalline germanium ingots 50–55 mm in diameter are shown in Fig. 3. The character-istic feature of the scattering distribution for the singlecrystals (curve 1) is the presence of enhanced scatteringin the initial and final parts of the ingots. The scatteringdistribution for the polycrystals (curve 2) is more com-plex and the magnitude of scattering in the polycrystalsexceeds that in the single crystals.
Paratellurite and germanium crystals were subjectedto a long-term high-temperature annealing. Annealingof germanium crystals at 790–880°C for 14–28 h led tosignificant changes in the scattering intensity (table).The scattering data for five single-crystal samples (1–5)and two polycrystalline samples (6, 7) are obtained bythe integral photometric-sphere method in the spectralrange 2–3 µm. The diaphragms S20 and S40, used in thismethod, correspond to blackbody diameters of 20 and40 mm, respectively (Fig. 1), and provide the requiredconvergence angle of scattered light.
As can be seen from the table, the scattering in somesingle-crystal samples decreases by a factor of 7–8(with the diaphragm S20) and by a factor of 15 (with thediaphragm S40). The reflection of light from grain
CRYSTALLOGRAPHY REPORTS Vol. 50 Suppl. 1 20
boundaries in polycrystals makes a contribution to thescattering, which, as a result, exceeds several times thescattering in single crystals. However, after annealing, thescattering in polycrystals also significantly decreases.In addition, a decrease in the average dislocation den-sity Nd in single crystals was observed after annealing.
It follows from the Rayleigh scattering theory that,if the total amount (concentration) of inhomogeneitiesin a material does not change, the scattering coefficientαs, which enters the exponential Bouguer–Lambert lawas a term in the extinction coefficient αe = αa + αs, isrelated to the average radius r of an inhomogeneity andthe impurity concentration c by the expression:
(4)α s1r--- 4π
3c------
13---–
4π3c------
23---
4π3c------
23---
π– .ln=
18016014012010080604020
2
4
6
8
10
12
14
S, %
h, mm
2
1
Fig. 3. Distribution of the fraction of scattered light S overthe length h of (1) a Ge single crystal and (2) a Ge polycrys-tal.
Light scattering from Ge samples
Sample no. 1 2 3 4 5 6* 7*
Before annealing
Scattering, % S20 6 10.2 14 10 13 6 14.5
S40 1.3 2.2 7 4.2 3 15 20.5
Nd × 10–4, cm–2 0.5 0.57 0.78 7.2 1.25
After annealing
Annealing temperature, °C 790 880 790 790 880 790 880
Annealing time, h 14 21 14 21 21 14 21
Scattering, % S20 1.4 1.4 1.3 1.4 1.5 1.9 6
S40 0.3 0.7 0.7 0.7 0.8 1.0 2.5
Nd × 10–4, cm–2 0.5 0.4 0.8 3.6 0.75
* Polycrystalline Ge.
05

S50 KAPLUNOV et al.
According to (4), a decrease in the scattering coeffi-cient at a constant impurity concentration should beobserved at annealing-induced enlargement of inhomo-geneities.
Two germanium single-crystal samples (1, 4) wereinvestigated by measuring their line-scattering func-tions. The fraction of scattered light in these sampleswas measured by the photometric-sphere method. Thescattering-line functions of the reference objectiveNP35 with and without samples before it are shown inFig. 4. The horizontal coordinate axis in Fig. 4 is digi-tized both in linear (transverse displacement (in mm) inthe objective focal plane) and angular measures. Thecalculated scattering indicatrix (line-scattering func-tion), characterizing the quality of optical samples,determined by the scattering and the refractive-indexinhomogeneity, is also shown in Fig. 4.
The half-width of the indicatrix of the test samples,calculated by the above-described technique, is smallerthan 0.003 mm (15 s in the angular measure). When a
0.060.040.020–0.02–0.04–0.06–4 –3 31–1–2 420
mm
arc min
NP35
NP35 + no. 4
NP35 + no. 1
Scattering indicatrixwith allowance for thesample inhomogenity
E/Emax
1.0
0.8
0.2
0.6
0.4
Fig. 4. The line-scattering functions and the scattering indi-catrix for the reference objective NP35 with Ge samples 1and 4.
Fig. 5. Scattering of a polarized laser beam (λ = 0.53 µm)by the paratellurite single crystal (observation on a distantscreen).
CRY
sample under study is installed before the objective, wehave the so-called convolution of the line-scatteringfunction with the scattering indicatrix of the samplerather than summation of these parameters. Therefore,the half-width of the total line-scattering function issmaller than the sum of the half-widths of separatefunctions. Measurement of the modulation-transfercoefficients at spatial frequencies up to 20 lines/mmyielded a value of the quality-loss coefficient of 0.03.This estimation shows that the samples tested (1, 4)have the best quality in optical homogeneity and scat-tering indicatrix in the spectral range 8–12 µm, inaccordance with the requirements for the quality of ger-manium used for optical elements. However, the mea-surements of the scattering magnitude by the photomet-ric-sphere method (see table) showed the presence ofscattered light in these samples: 6 and 10% for samples 1and 4, respectively. The measurement of the line-scat-tering functions did not reveal any scattering in theselimits or a difference between the samples studied.
Experimental investigation of the visible-light scat-tering in the paratellurite single crystals made it possi-ble to reveal a number of regularities and to determinethe main scattering mechanism. Figures 5 and 6 showthe images obtained under illumination of a distantscreen by polarized and unpolarized laser beams (λ =0.53 and 0.63 µm, respectively) transmitted in the [001]direction through a 10-mm-thick paratellurite single-crystal sample, belonging to the quality group A withrespect to scattering. According to the measurementtechnique, the central aperture with a radius of 1 cm forcutting off the central regions of the light beams ispresent in the images.
The results of the computer processing of theimages obtained are shown as plots in Fig. 7. The top(2) and bottom (1) dependences correspond to thebeams of red unpolarized and green polarized light,respectively. Both plots and figures demonstrate ring-shaped angular maxima and minima, as predicted by
Fig. 6. Scattering of an unpolarized laser beam (λ =0.63 µm) by the paratellurite single crystal (observation ona distant screen).
STALLOGRAPHY REPORTS Vol. 50 Suppl. 1 2005
METHODS FOR MEASURING LIGHT SCATTERING S51
the theory of small-angle Mie scattering. The intensityof scattered light at the edge of the screen aperture islower than the intensity in the first-order, closelylocated, maximum. The scattering intensity decreasesin radius almost linearly by 60–70% for the scatteringin the crystal scattering at angles as small as 20′–30′.There are also pronounced second-order maxima. Thedifference in the positions of the maxima in curves 1and 2 is consistent with the difference in the light wave-lengths.
As follows from the Mie scattering theory, the aver-age distances between scattering inhomogeneities canbe estimated with high accuracy using the formulas forBragg diffraction by a bulk periodic structure. Thus, theaverage distance between inhomogeneities can befound from the relation
(5)
where n is the refractive index of the crystal, m is theorder of the maximum, λ is the light wavelength, L isthe distance from the crystal to the screen, and r is thedistance from beam axis to the diffraction maximum.Calculations by formula (5) give the value of 180 µmfor . It should be noted that this distance correspondsto the average distance between dislocations at an aver-age dislocation density of 3 × 103 cm–2. Specifically,this value was obtained by selective chemical etchingfor the sample under consideration. The average size ofinhomogeneities is ~1–2 µm. These values approxi-mately correspond to the sizes of impurity clouds anddislocation loops. In all paratellurite single crystalsunder study, the values of scattered-light intensity are inagreement with the values of the impurity concentra-tion and dislocation density.
The effect of high-temperature annealing on thelight scattering in the paratellurite single crystals wasinvestigated experimentally in the temperature range600–700°C. The upper limit of this range is only 33 Kbelow the melting temperature. The annealing time wasvaried from 24 to 60 h. No changes in the scatteringintensity were observed in the samples in comparisonwith the initial state. Thus, neither decay of inhomoge-neities nor their enlargement occurred. We believe thatthis fact is related to the high impurity concentration inthe paratellurite crystals (about 1018 cm–3). By way ofcomparison, the typical dopant concentrations in opti-cal germanium are in the range 1013–1014 cm–3.
CONCLUSIONS
The methods for measuring the light scattering inparatellurite and germanium single crystals in thewavelength range 0.35–3 µm and at 10.6 µm, respec-tively, revealed a number of general regularities forboth materials.
At the noted light wavelengths, small-angle Miescattering occurs, at which up to 99% of light rays scat-
a
anmλ
2 r/L( )arctan[ ]sin--------------------------------------------,=
a
CRYSTALLOGRAPHY REPORTS Vol. 50 Suppl. 1 2
tered in crystals make angles with the primary-beamaxis that do not exceed 2°. The sizes of scattering inho-mogeneities are close to the light wavelengths. Theparatellurite scattering indicatrices show maxima andminima, different from 0°, 90°, and 180°. Theseextrema were used to determine the average distancebetween inhomogeneities, which was found to be tensto hundreds of micrometers. These values are consis-tent with the average distance between dislocationswhen the dislocation density in the crystals ranges from102 to 105 cm–2. In the crystals of both types, when thesample thickness amounts to 1 cm, the total scattering-induced light loss may range from 0.5 to 20%, depend-ing on the presence of structural defects: dislocations,low-angle boundaries, slip lines, and impurities.
The loss-related scattering coefficients αs, enteringthe light extinction coefficients, are comparable inmany cases with the extinction coefficients themselves.This circumstance should be taken into account wheninterpreting the results of measurements of the extinc-tion coefficients, especially in germanium crystals,since the loss assigned to the absorption by electricallyactive impurities can in fact be related to the light scat-tering by inhomogeneities of another physical nature.
The occurrence of small-angle light scattering ingermanium and paratellurite crystals is caused by thepresence of structural defects in these crystals. Thesedefects and the related thermoelastic stresses lead tolocal changes in the permeability, resulting in light scat-tering (the photoelasticity effect). On the whole, impu-rity clouds, dislocations, and dislocation loops deco-rated by impurities should be considered as scatteringinhomogeneities.
The annealing of Ge crystals at 790–880°C for 14–28 h leads to a decrease in the scattered-light intensity
5.04.54.03.53.02.52.0 1.5 1.0
0.3
0.4
0.5
0.6
0.7
0.8
0.9
I, arb. units
R, cm
1
2
Fig. 7. Dependences of the average intensity of light scat-tered by the paratellurite single crystal on the distance fromthe beam center: (1) polarized light with λg = 0.53 µm and(2) unpolarized light with λr = 0.63 µm.
005

S52 KAPLUNOV et al.
by several times. This fact indicates that inhomogene-ities change in size and shape and, possibly, decay. Theannealing of the paratellurite single crystals even attemperatures close to the melting temperature (733°C)does not lead to a significant decrease in scattering.
The results obtained point to different possiblemethods for decreasing light loss caused by scattering.These methods include long-term high-temperatureannealing, the use of initial raw materials of ultrahighpurity, and primarily, the improvement of techniquesfor the growth of germanium and paratellurite singlecrystals by the Czochralski method. Specifically, condi-tions should be created that would provide for the max-imum possible structural homogeneity of the materialsas a result of decreasing temperature gradients andmelt-temperature fluctuations and using extremely highgrowth rates for paratellurite and germanium singlecrystals.
ACKNOWLEDGMENTS
We are grateful to A.V. Glazyrin (Vavilov StateOptical Institute, St. Petersburg) and V.Ya. Molchanov(RTC Acoustooptics, MISIS) for supplying the equip-
CRY
ment, the help in experiments, and helpful participationin the discussion of the results.
REFERENCES1. V. P. Kalinushkin, Tr. Inst. Obshch. Fiz., Ross. Akad.
Nauk 4, 3 (1986).2. V. V. Voronkov, G. I. Voronkova, B. V. Zubov, et al., Fiz.
Tverd. Tela (Leningrad) 23 (1), 117 (1981) [Sov. Phys.Solid State 23 (1), 65 (1981)].
3. V. V. Voronkov, G. I. Voronkova, B. V. Zubov, et al., Fiz.Tverd. Tela (Leningrad) 19 (6), 1784 (1977) [Sov. Phys.Solid State 19 (6), 1040 (1977)].
4. V. A. Kizel’ and V. I. Burkov, Gyrotrophy of Crystals(Nauka, Moscow, 1980) [in Russian].
5. A. I. Kolesnikov, R. M. Grechishkin, I. A. Terent’ev,et al., in Physics of Crystallisation (Tversk. Gos. Univ.,Tver, 2002), p. 18 [in Russian].
6. Optical Germanium Crystals, TU 48-4-522-89.7. Optical Crystal Materials (Gos. Opt. Inst., Leningrad,
1991) [in Russian].8. I. A. Kaplunov and A. I. Kolesnikov, Poverkhnost, No. 2,
14 (2002).
Translated by Yu. Sin’kov
STALLOGRAPHY REPORTS Vol. 50 Suppl. 1 2005

Crystallography Reports, Vol. 50, Suppl. 1, 2005, pp. S53–S57.Original Russian Text Copyright © 2005 by Bogomolov, Solnyshkin.
PHYSICAL PROPERTIESOF CRYSTALS
Polarization Distribution in DTGS Crystals under Nonequilibrium Thermal Conditions
A. A. Bogomolov and A. V. SolnyshkinTver State University, Sadovyœ per. 35, Tver, 170002 Russia
e-mail: [email protected] December 28, 2004
Abstract—The polarization distribution in crystals of deuterated triglycine sulphate in a constant temperaturegradient is investigated on the basis of the dynamic method for studying the pyroelectric effect. It is shown that,under equilibrium thermal conditions, the polarization distribution is uniform except for the surface layer~20-µm-thick. The nonuniform polarization distribution in this layer may indicate its multidomain state. In asteady-state temperature gradient, the layer thickens and its domains grow into the sample bulk. © 2005 Pleia-des Publishing, Inc.
The dielectric properties of ferroelectric crystalsunder nonequilibrium conditions have been investi-gated in detail [1–3]. At the same time, the pyroelectricproperties of crystals under nonequilibrium thermalconditions (in the presence of a temperature gradient)have been studied much less thoroughly, although theyare of interest both from the scientific point of view [4]and as possible applications related to measurements ofhigh-intensity heat fluxes by radiation detectors. It wasestablished previously that irradiation by high-intensityheat fluxes results in the depolarization of the surfaceregions of ferroelectric crystals. In this context, it isimportant to determine at what depth and to what extentthe polarization changes near the sample surface and toestimate the stability of the single-domain state and thepyroelectric characteristics throughout the crystal vol-ume.
To study the pyroelectric properties of crystals bythe dynamic method, we used single-crystal samples ofdeuterated triglycine sulphate (DTGS), which belongsto the group of triglycine sulphate (TGS). The crystalswere grown at the Institute of Crystallography of theRussian Academy of Sciences.
Triglycine sulphate (H2CH2COOH)3H2SO4 is auniaxial ferroelectric of the order–disorder type, whichmay undergo a second-order phase transition. Belowthe Curie point, crystals of the TGS group belong to thesymmetry class 2. In the paraelectric phase, they aredescribed by the point-symmetry group 2/m. TGS crys-tals have a monoclinic lattice. The phase-transitiontemperatures are ~49 and ~60°C for TGS and DTGScrystals, respectively.
The samples of naturally unipolar DTGS crystalswere prepared in the form of 1-mm-thick plane-parallelplates in the Y cut with an area of 5 × 5 mm2 and 0.7–1-mm-thick disks 17–20 mm in diameter. Silver elec-trodes were formed on the polar faces of the samples by
1063-7745/05/5001-S $26.000053
vacuum deposition (gold electrodes were formed on theplane-parallel plates of DTGS crystals) and silver blackwas deposited on the surface facing the source of ther-mal radiation.
The schematic of the setup for studying the effect ofsteady-state temperature gradient on the pyroelectriccharacteristics of ferroelectrics is shown in Fig. 1.
A sample 1 was placed in the thermostatic chamber 2on a massive brass substrate, which served as a heatsinkfor the sample rear. To form a temperature gradient,radiation of the incandescent lamp of the OI-24 illumi-nator 3 was focused on the blackened sample surface.The heat-flux density could be changed from15 mW cm–2 to 1 W cm–2. In this case, the temperature
2 3
6 5 4
7 10
11 9 8
13
1
12
Fig. 1. Schematic of the setup for studying the effect of asteady-state temperature gradient on the pyroelectric prop-erties of DTGS crystals: (1) sample, (2) thermostatic cham-ber, (3) illuminator, (4) laser, (5) electrooptic modulator,(6) Nicol’s prism, (7) photocell, (8) power supply, (9) oscil-lator, (10) isolation scheme, (11) selective amplifier,(12) double-beam oscilloscope, and (13) phase-differencemeter.
© 2005 Pleiades Publishing, Inc.

S54
BOGOMOLOV, SOLNYSHKIN
distribution in a ferroelectric plate is linear:
(1)
where β0 is the absorption coefficient of the black, W0is the heat-flux density, k is the thermal-conductivitycoefficient, d is the sample thickness, and y is a currentcoordinate. The temperature gradient ∂θ/∂y is constantover depth in this case. The pyroelectric properties ofDTGS crystals were investigated using sinusoidallymodulated radiation of the LG-126 laser 4 with a powerof ~1 mW. Modulation was performed using the ML-5electrooptic modulator 5 and the Nicol’s prism 6. Toapply simultaneously a bias and an ac electric field tothe modulator, we used the B5-50 power supply 8 andthe GZ-33 oscillator 9, respectively (voltages wereapplied to the modulator through the isolation scheme 10,including a capacitance C = 1000 pF and a resistanceR = 1 MΩ). A pyroelectric response was measured bythe U2-8 selective amplifier 11. The signal from theamplifier output arrived at one of the inputs of theC1-55 oscilloscope 12 and at the first input of the F2-34phasemeter 13. The phase of the modulated heat fluxwas monitored by the photocell 7, whose signal arrivedat the other input of the oscilloscope 12 and at the sec-ond input of the phasemeter 13. Thus, the phase shiftbetween a pyroelectric signal and a modulated heat fluxcould be monitored both visually (on the oscilloscopescreen) and numerically (from phasemeter readings).
The experimental results, including the frequencydependences of the amplitude value of the pyroelectriccurrent and the phase shift between the modulated heatflux and the pyroelectric response, were processed toobtain the spatial distribution of the pyroelectric coeffi-cient in the samples near the illuminated surface.
To reconstruct the spatial distribution of the pyro-electric coefficient, we used the method proposed in[5]. On the basis of the frequency dependences of thereal (ReI0(ω)) and imaginary (ImI0(ω)) components ofthe pyroelectric current, which is caused by the actionof the probe laser radiation on the sample, we calcu-lated the pyroelectric coefficient by the formula
(2)
where c and ρ are the specific heat and the density of thecrystalline sample, respectively; A is the illuminatedsurface area; ypen is the penetration depth of a thermalwave in the sample,
(3)
and α is the thermal diffusivity. It was shown in [5] thatthe approximating function γa(y) fairly exactlydescribes the distribution of the pyroelectric coefficient
θ y( )β0W0
k------------- d y–( ),=
γa ypen( ) cρdβ0W0A----------------- ReI0 ω( ) ImI0 ω( )–[ ] ,=
ypen2αω
-------;=
CRY
γ(y) in the surface region of the samples under consid-eration.
Investigation of the pyroelectric properties of DTGSsingle crystals in a steady-state temperature gradientwere performed in a wide temperature range, includingthe phase-transition region.
Figure 2 shows the distribution of the pyroelectriccoefficient γ(y) in a ~60-µm-thick surface layer at roomtemperature. Curve 1 corresponds to the distributionγ(y) in the absence of heat fluxes and curves 2, 3, and 4show the distributions in temperature gradients of 4, 9,and 13 K mm–1, respectively. The behavior of thecurves shows that the distribution of the pyroelectriccoefficient over the sample thickness, γ(y), is uniformunder equilibrium thermal conditions, except for thesurface layer with a thickness of ~20 µm. In this layer,the pyroelectric coefficient monotonically decreasesalmost to zero. This fact may indicate the existence ofa multidomain surface layer [6, 7]. The effect of thetemperature gradient leads to the following. In a layerwith a uniform polarization distribution (in the absenceof a temperature gradient), the pyroelectric coefficientlinearly depends on the coordinate, whereas, in the sur-face layer with a thickness of ~20 µm, the effect of thetemperature gradient on γ is not so significant.
With an increase in temperature, in both the absenceand presence of a temperature gradient, no significantchanges in the polarization distribution occur, up to atemperature of ~46°C, which corresponds to the peakin the dependence γ(T) obtained in the presence of atemperature gradient of about 13 K mm–1 in the sample.The distribution of the pyroelectric coefficient at a tem-perature of 46°C is shown in Fig. 2b. It should be notedthat the thickness of the layer with a nonuniform distri-bution of γ remains constant under equilibrium thermalconditions. Temperature gradients of 4 and 9 K mm–1
similarly affect the distribution γ(y) at this temperature,as at 20°C. However, the behavior of the pyroelectriccoefficient at gradT = 13 K mm–1 turns out to be differ-ent: the temperature gradient leads to a decrease in thethickness of the multidomain surface layer, as evi-denced by an almost uniform distribution of γ over thelayer thickness up to 10 µm, but then γ significantlydecreases and, near the surface (at a depth of 5 µm), alayer arises with a negative pyroelectric coefficient (incomparison with the value of γ for the main sample vol-ume).
In the absence of a temperature gradient, a furtherincrease in the crystal temperature almost does notaffect the distribution of the pyroelectric coefficient upto the phase-transition point. At the same time, the pres-ence of a temperature gradient in the sample increasesthe thickness of the layer with negative γ (Fig. 2c).
The coordinate dependence of the pyroelectric coef-ficient at the phase-transition point for DTGS crystals(59°C) is shown in Fig. 2d. Curve 1 (gradT = 0) showsthat a layer with inverse polarization arises in the sur-face layer with a thickness of ~5 µm, as evidenced by
STALLOGRAPHY REPORTS Vol. 50 Suppl. 1 2005

POLARIZATION DISTRIBUTION IN DTGS CRYSTALS S55
4
3
21
5
4
3
2
1
0
γ,10–8 C Òm–2 ä–1
(a)20
15
10
5
–5
γ,10–8 C Òm–2 ä–1
(b)
0
21
3
4
120
80
40
–400 20 40 60
y, µm
0
(d)
43
2
130
20
10
–100 20 40 60
y, µm
0
(c)
4
3
2
1
Fig. 2. Distributions of the pyroelectric coefficient in a DTGS single-crystal sample (a) at room temperature and (b) at temperaturesof the rear sample surface of (b) 46, (c) 52, and (d) 59°C; dθ/dy = (1) 0, (2) 4, (3) 9, and (4) 13 K mm–1.
the change in the sign of the pyroelectric coefficient.Temperature gradients of 4 and 9 K mm–1 lead to anincrease in the thickness of this layer to 25 and 35 µm,respectively. At gradT = 13 K mm–1, the region withinverse polarization becomes comparable in thicknesswith the layer probed. Note that the pyroelectric coeffi-cient is almost coordinate-independent and has smallvalues: ~0.4 × 10⁻⁸ C cm–2 K–1. It should also be notedthat at the above-mentioned temperature gradients thelayer probed is in the paraelectric phase.
The temperature dependence of the spontaneouspolarization of TGS crystals, according to the phenom-
CRYSTALLOGRAPHY REPORTS Vol. 50 Suppl. 1 2
enological theory of phase transitions, obeys the law
(4)
where α0 and β are the coefficients of series expansionof the free energy in polarization. The expression forthe pyroelectric coefficient, which characterizes therate of change in the spontaneous polarization withtemperature, has the form
(5)
Ps
α0
β----- TC T–( )
12---
,±=
γ∂Ps
∂T--------
12---
α0
β----- TC T–( )
12---–
.±= =
005
S56 BOGOMOLOV, SOLNYSHKIN
γ,10–8 C Òm–2 ä–1
4
3
2
1
25
20
15
10
5
0 0.2 0.4 0.6 0.8y, mm
(‡)
1
2
3 4
100
80
65
40
20
0 0.2 0.4 0.6 0.8y, mm
γ,10–8 C Òm–2 ä–1
(b)
Fig. 3. Calculated distributions of the pyroelectric coefficient in a DTGS single-crystal sample at temperatures of the rear samplesurface of (a) 46 and (b) 52°C; temperature gradient dθ/dy = (1) 0, (2) 4, (3) 9, and (4) 13 K mm–1.
According to the generally accepted representa-tions, under equilibrium thermal conditions, the spon-taneous polarization and the pyroelectric coefficient ofcrystalline insulators with ferroelectric properties areconstant throughout a crystal when the latter is in thesingle-domain state. In other words, the polarizationdistribution is uniform. However, the effect of heatfluxes may lead to a nonuniform temperature distribu-tion in the crystal volume, i.e., to the occurrence of tem-perature gradients. Since the values of Ps and γ dependon temperature, the presence of a temperature gradientin a crystal leads to a nonuniform distribution of thepolarization and the pyroelectric coefficient in thecrystal.
Let us consider a DTGS single-crystal sample witha thickness d, cut in a polar plane. We assume that aconstant heat flux is incident on the front sample sur-face (y = 0) and the rear sample side contacts a massivesubstrate that serves as a heatsink (the specific heat ofthe substrate is assumed to be infinitely high). In thefirst-order approximation, we can assume that the tem-perature gradient is constant over the sample thickness(dθ/dy) = const. In this case, the temperature distribu-tion in a ferroelectric plate is linear:
(6)
where T0 is the temperature of the rear sample surface.Thus, when the dependences Ps(T), γ(T), and T(y) areknown, one can find the distributions Ps(y) and γ(y).
In studying the pyroelectric properties of ferroelec-tric crystals by quasi-static and dynamic methods, thepyroelectric coefficient is determined experimentally.
T T0 d y–( )dθdy------,+=
CRY
Furthermore, we will consider the distribution γ(y).When necessary, this distribution can be used to find thepolarization distribution over the sample thickness.
For numerical calculations of the spatial distributionof the pyroelectric coefficient, the sample was dividedinto 1-µm-thick layers. The value of the pyroelectriccoefficient within a layer was assumed to be constant.
The coefficient , entering Eq. (5), was found
from the experimental temperature dependence of thepyroelectric coefficient: 3.7 × 10⁻⁷ C cm–2 K–1/2.According to the thermodynamic theory of phase tran-sitions, at temperatures T > TC, Ps = 0; hence, the pyro-electric coefficient is zero for T > TC. At T = TC, thepyroelectric coefficient was limited by the value γ = 9 ×10⁻⁷ C cm–2 K–1.
Figure 3a shows the results of the numerical calcu-lation of the distribution of the pyroelectric coefficientin a DTGS crystal in the absence of a temperature gra-dient (curve 1, uniform distribution) and in steady-statetemperature gradients of 4, 9, and 13 K mm–1 (curves 2,3, and 4, respectively). The temperature of the rear sur-face of the DTGS plate was assumed to be 46°C. As canbe seen in Fig. 3a, the distribution of the pyroelectriccoefficient becomes more nonuniform with an increasein the temperature gradient. Near the luminated surface,the deviation of γ from the corresponding valueobserved in the absence of a temperature gradient ismaximum.
At temperatures T > 48.5°C, in a sample with a tem-perature gradient, a region of the paraelectric phasearises (Fig. 3b, T = 52°C). As a result, the distribution
12---
α0
β-----
STALLOGRAPHY REPORTS Vol. 50 Suppl. 1 2005

POLARIZATION DISTRIBUTION IN DTGS CRYSTALS S57
of the pyroelectric coefficient in the crystal bulkbecomes highly nonuniform, which may affect signifi-cantly the results of pyroelectric measurements. In thiscase, the thickness lpe of the paraelectric layer in a tem-perature gradient of 9 K mm–1 is 50 µm. At gradT =13 K mm–1, lpe = 270 µm. At the points y1 = 50 µm andy2 = 270 µm, the curve describing the distribution γ(y)pass through the maximum.
Comparing the spatial distributions of the pyroelec-tric coefficient obtained by numerical analysis(Figs. 3a, 3b) and calculated on the basis of the experi-mental data (Figs. 2b, 2c), we can conclude that theinconsistency in the behavior of the curves is due to thenonuniform distribution γ(y) near the surface in actualsamples, which is related to the existence of a multido-main surface layer [6, 7]. The multidomain state of thislayer is evidenced by step polarization reversal duringthe formation of a temperature gradient (at the initialinstant of time), as a result of which the thickness of themultidomain surface layer increases. Provided the sur-face layer in the ferroelectric phase with a nonuniformpolarization distribution had another (different from
CRYSTALLOGRAPHY REPORTS Vol. 50 Suppl. 1 20
ferroelectric) nature, the above-mentioned phenome-non would be absent.
REFERENCES1. B. A. Strukov, A. V. Davtyan, and E. L. Sorokin, Fiz.
Tverd. Tela (Leningrad) 25 (4), 1089 (1983) [Sov. Phys.Solid State 25 (4), 627 (1983)].
2. B. A. Strukov, A. V. Davtyan, E. L. Sorokin, and K. A. Mi-naeva, Izv. Akad. Nauk SSSR, Ser. Fiz. 49 (2), 276(1985).
3. B. A. Strukov, A. V. Davtyan, E. L. Sorokin, andV. T. Kalinnikov, Vestn. Mosk. Univ., Ser. 3: Fiz.,Astron. 26 (6), 81 (1985).
4. S. P. Alpay, Z.-G. Ban, and J. V. Mantese, Appl. Phys.Lett. 82, 1269 (2003).
5. B. Ploss, R. Emmerich, and S. Bauer, J. Appl. Phys. 72,5363 (1992).
6. O. V. Malyshkina, in Ferroelectrics and Piezoelectrics(Izd-vo TvGU, Tver, 1993), p. 132 [in Russian].
7. A. A. Bogomolov and O. V. Malyshkina, Izv. Ross.Akad. Nauk, Ser. Fiz. 57 (3), 199 (1993).
Translated by Yu. Sin’kov
05

Crystallography Reports, Vol. 50, Suppl. 1, 2005, pp. S58–S61.Original Russian Text Copyright © 2005 by Shishonok, Gatal’ski
œ
, Erosh.
PHYSICAL PROPERTIESOF CRYSTALS
Flow of Space-Charge-Limited Currents in Cubic Boron Nitride
N. A. Shishonok, G. V. Gatal’skiœ, and A. Yu. EroshInstitute of Solid State Physics and Semiconductors, National Academy of Sciences of Belarus,
ul. Brovki 17, Minsk, 220072 Belaruse-mail: [email protected]
Received February 7, 2005
Abstract—Current–voltage characteristics of polycrystal cubic nitride samples are studied at various temper-atures. The samples were undoped crystals obtained by the method of direct phase transformation of pyrolyticgraphite-like boron nitride and crystals doped with sulfur to obtain n-type conductivity. The current–voltagecharacteristics consist of three different parts: linear and quadratic segments and the region of dramatic increasein the current, which indicates the existence of space-charge-limited currents. The activation energy, Et, andconcentration of the trapping centers, Nt, are determined. The experimental data obtained allowed us to calcu-late, for the first time, the mobility and concentration of free carrier in the conduction band. Possible mecha-nisms giving rise to a dramatic increase in are made the current on the current–voltage characteristics are dis-cussed. © 2005 Pleiades Publishing, Inc.
INTRODUCTION
High energy-gap semiconductor materials possess anumber of considerable advantages over traditionalmaterials, which allows one to use these materials indevices operating in wide temperature ranges, lightsources operating in the visible and ultraviolet spec-trum ranges and having high values of the criticalbreakdown field and high radiation and chemical stabil-ity. Cubic boron nitride (cBN) occupies a special posi-tion among intensely studied nitrides of A3 elements. Inits crystallochemical class, cubic boron nitride is thematerial with the strongest interatomic bonds, whichdetermines the maximum value of its elasticity modu-lus, band gap, hardness, thermal conductivity, and otherbasic semiconductor parameters. Therefore, it is naturalto expect that the practical use of cBN would allow oneto attain record parameters in various devices for solidstate electronics. However, the electrophysical proper-ties of cubic boron nitride have been studied insuffi-ciently, which hinders the practical use of this material.Below, we make an attempt to establish some charac-teristic features of charge transfer in polycrystal cBNsamples.
SAMPLE PREPARATION
We studied polycrystal cubic boron nitride samplesobtained as a result of direct phase transformation andphase transformation in the presence of a catalyst (extrapure ACD-4 metallic aluminum). The Al content in thecharge ranged from 0.5 to 4.0 wt %. The study of alu-minum-doped samples is of great interest because alu-
1063-7745/05/5001-S $26.000058
minum is an isovalent dopant and, therefore, will notchange the electrical properties of the material.
The starting material was high-purity graphite-likepyrolytic boron nitride and additionally purified carbo-thermic boron nitride.
In order to obtain the material with n type conduc-tivity, the charge was also doped with sulfur (elementalOS-4 sulfur powder with the total impurity content notexceeding 10–5–10–3 wt %). We used sulfur because it isthe lightest element of group 6 (except for oxygen),which should be easily incorporated into the cBN crys-tals’ lattice.
Samples were synthesized in a DO-138A pressingsetup. The parameters of the synthesis of polycrystalsamples were the following: pressure 7.7–8.0 GPa andtemperature 2200°C for samples obtained in the pres-ence of the catalyst and 2500°C for the direct phasetransformation.
The samples thus synthesized were shaped to rect-angular parallelepipeds. One of the faces was polishedfor microstructural analysis on an optical MMP-4microscope at a magnification ranging from 480 to 760.Analysis showed that the samples thus prepared had ahomogeneous microgranular one-phase structure.
X-ray phase analysis of the samples on a DRON-3diffractometer confirmed their sphalerite structure; notraces of a graphite-like phase were revealed.
The electrophysical properties of cBN were studiedon three groups of samples with different compositions:(1) undoped ones; (2) sulfur-doped ones with the S con-centrations 0.5, 1.0, and 2.5 wt %; and (3) aluminum-doped ones with Al concentrations 2.0, 3.0, and 4.0 wt %.
© 2005 Pleiades Publishing, Inc.

FLOW OF SPACE-CHARGE-LIMITED CURRENTS S59
The electrical parameters were measured with theuse of three types of contacts: those based on silverpaste, tantalum contacts, and Cu–Ni–Ti-based solder.The results obtained on all the contacts were similar;however, silver contacts had higher resistivity and wereless stable, especially in high-temperature measure-ments.
EXPERIMENTAL RESULTS AND DISCUSSION
The study of the electrical conductivity of all threegroups of samples showed that doping with sulfurresults in the formation of n-type conductivity anddecreases the resistivity by two to four orders of mag-nitude depending on the sulfur concentration. The pres-ence of aluminum decreases resistivity by an order ofmagnitude irrespective of its concentration and ensuresthe electron-type conductivity.
The study of the current–voltage characteristics ofundoped samples at room temperature showed that theyare all of a nonlinear character. These curves may satis-factorily be described by the expression j ~ E2 (curve 1 inFig. 1). Repeated (including multiple) measurementsgave the same results. The electrical conductivity atroom temperature remains constant over a wide rangeof field strength.
Then, we also measured the density of the currentflowing through the sample as a function of the electric-field strength at elevated temperatures (373–673 K). Itis seen (curves 2 and 3 in Fig. 1) that, at relatively lowtemperatures (374–473 K), the curves have the sameslope as at room temperature and are described by aquadratic law.
Upon the attainment in the sample of the fieldstrength 120 V/cm, the current–voltage curves demon-strated a dramatic increase in the current (by two to fourorders of magnitude) at the temperature 573 K (curve 4in Fig. 1). With a further increase in the field strength,the dependence is once again described by a quadraticlaw.
The current–voltage characteristics of aluminum-doped cBN samples at room temperature are describedby expressions that are intermediate between j ~ E andj ~ E2. Similar to the case of undoped samples, the cur-rent–voltage characteristics at high temperatures had aregion of dramatic increase in current. The current den-sity at the transition to the low-ohmic state has closevalues for all the samples with the same composition.
The current–voltage characteristics of sulfur-dopedsamples at room temperature are shown in Fig. 2. It isseen that they are close to linear dependences. Anincrease in the temperature also results in the formationof a region of drastic increase in current, which, as ear-lier, acquires a quadratic character in stronger fields.Some sulfur-containing samples showed breakdown atroom temperature (Fig. 3).
CRYSTALLOGRAPHY REPORTS Vol. 50 Suppl. 1 20
The studies of the current–voltage characteristicsare summarized for all the groups of samples in thetable. The vertical arrow indicates the region of dra-matic increase in the current.
One of the important features of the current–voltagecharacteristics is the current hysteresis formed with alowering of the voltage and observed for the samples ofall compositions. Regular measurements of the cur-rent–voltage characteristics of all samples showed aregular decrease in the voltage and the temperature oftransition to the low-ohmic state. The current–voltagecharacteristics of the samples measured after differenttime intervals are shown in Fig. 4.
Thus, the current–voltage characteristics of all sam-ples studied irrespective of their compositions had threecharacteristic portions (Fig. 3). The first one, located inthe region of weak fields, is described by dependences
1.0logE
logj
–81.5 2.0 2.5 3.0
123
45
–6
–4
–2
0
Fig. 1. Current–voltage characteristics of undoped cBNsample at different temperatures T: (1) 283, (2) 373, (3) 473,(4) 573, and (5) 673 K.
1.0 logE
logj
–7
–8
0.5 1.5 2.0 2.5 3.0
–6
–5
–4
–33
21
Fig. 2. Current–voltage characteristics of sulfur-doped cBNsamples. Sulfur concentration: (1) 0.5, (2) 1.0, and(3) 2.5 wt %.
05

S60
SHISHONOK
et al
.
that are intermediate between j ~ E and j ~ E2. The sec-ond portion is characterized by a drastic increase in thecurrent at a certain critical field strength. The third por-tion of all the current–voltage characteristics is charac-terized by the quadratic law, j ~ E2.
As is well known, the existence of a region ofintense increase in the current on the current–voltagecharacteristics of high-resistance materials is the mostcharacteristic feature of the space-charge-limited cur-rents [1]. Therefore, analysis of the results obtainedshould be performed within the framework of the the-ory of space-charge-limited currents. The linear depen-dence of current density on the field strength in theregion of low fields (portion 1 in Fig. 3) can be
1.0 logE
logj
–6
–7
0.5
0.5 logE
logj
–7
–8
0 1.0 1.5 2.0
–6
–5
–4
1
2
3
1.5 2.0 2.5 3.0
–5
–4
–3
–2
–8
123
456
Fig. 3. Current–voltage characteristics of the cBN samplewith 0.5 wt % S at 283 K: (1) ohmic portion, (2) region ofdramatic increase in current, and (3) region described by aquadratic law corresponding to the absence of trapping cen-ters.
Fig. 4. Current–voltage characteristics of undoped cBN sam-ples measured after different time intervals: (1) 1 month,(2) one week, (3) 24 h, (4) 1 h, (5) 10 min, (6) 1 min.
Ecr
CRY
explained by the fact that the concentration of the car-riers injected from the cathode into the given region islower than their equilibrium concentration [2]. Ignoringthe diffuse component of the current density, the cur-rent at this portion can be written as
(1)
where q is the absolute value of the electron charge, µis the mobility of electrons in the conduction band, n0 isthe equilibrium electron concentration, and E is theelectric-field strength.
For some samples, there is no ohmic branch and thecurrent–voltage characteristics even at low fieldstrengths are described by the quadratic dependence.This portion corresponds to the presence of monoener-getic traps with the energy Et in the band gap and isdescribed by the equation
(2)
where θ = (Nc/Nt)exp(–Et/kT); ε and a are the dielectricconstant and sample thickness, respectively; Nc is theeffective density of quantum states in the conductionband; Nt is the trap density; and Et is the distance fromthe energy level of traps to the conduction-bandbottom.
It is well known from the theory of space-charge-limited currents that shallow traps located in the vicin-ity of the conduction band do not affect the flow ofspace-charge-limited currents irrespective of the trapconcentration. Assuming the existence in the band gapof deep local centers (traps), which can trap the chargecarriers and, thus, generate an electric field deceleratingthe injection of free carriers, we determined the activa-tion energy Et and concentration Nt of such trappingcenters. The concentration was calculated using thewell-known formula for the critical voltage of the cur-rent–voltage characteristic in the theory of space-charge-limited currents [3]
(3)
Thus, the calculation yielded Nt = (1.5–1.8) ×1011 cm–3.
The activation energy Et was determined by amethod that is independent of the method of space-charge-limited currents: it was determined from the shapeof the peak of thermally stimulated conductivity [4]:
(4)
where k is the Boltzmann constant, T1 is the tempera-ture corresponding to half-intensity of the peak fromthe low-temperature side, and Tm is the temperature ofthe maximum. The value obtained ranges within Et =1.2–1.4 eV.
j qµn0E,=
j θεµ E2
a-----
,=
V cr
qa2Nt
2ε--------------.=
Et 1.51kT1Tm
Tm T1–------------------,=
STALLOGRAPHY REPORTS Vol. 50 Suppl. 1 2005

FLOW OF SPACE-CHARGE-LIMITED CURRENTS S61
We used the same method (characteristics of thethermally stimulated conductivity curve) to evaluate theconcentration of the trapping centers by the formula [4]
(5)
where e is the exponent, k is the Boltzmann constant, Tm
is the temperature of the maximum, ncm is the concen-tration of nonequilibrium charge carriers in the conduc-tion band, Et is the activation energy, τr is the time ofnonequilibrium-carrier recombination, and b is the rateof the temperature increase. The concentration calcu-lated by this method, Nt = 1.2 × 1011 cm–3, satisfactorilyagrees with the result obtained by the first method.
The region of dramatic increase in the current is usu-ally interpreted under two different assumptions: (1) anincrease in the current is associated with filling of thetraps and (2) on the contrary, an increase in the currentis associated with the field ionization by free carriers ofthose traps which have already managed to trap the cur-rent carriers.
Keeping of the samples under voltage graduallyreduced the current. This may be interpreted as the for-mation of the spatial charge during the capture of carri-ers by traps. Then, a dramatic increase in the currentmay be explained by an emptying of the traps due to thefield. This is also confirmed by the criterion of themechanism manifestation suggested in [5]. Accordingto this criterion, if
(6)
(where Ecr is the critical field strength), then the regionof a dramatic decrease in resistivity is associated withfilling of all the traps and vice versa. In our case, Nt >1011 cm–3 are the values calculated on the basis of thiscriterion.
Our assumption is also favored by the current–volt-age characteristics measured at elevated temperatures(Fig. 1). It is seen that the threshold electric-fieldstrength necessary for the start of trapping-center emp-tying decreases with an increase in temperature. Thus,the region of dramatic increase in the current is mostprobably associated with thermal emptying of traps.
Portion 3 of the current–voltage characteristics inFig. 3 corresponds to the “trap-free” quadratic portionof the curves and is described by the well known 3/2law in the metal–semiconductor–metal system:
(7)
Using the above equation, we calculated electronmobility, µ = 100 cm2/(V s). Once this value is deter-mined, we may calculate the current density from the
Nt
ekTm2 ncm
Etτ rb--------------------,=
Nt 2εEcr/aq<
j θεµ E2
a-----
.=
CRYSTALLOGRAPHY REPORTS Vol. 50 Suppl. 1 2
classical formula
(8)
and evaluate the concentration free-charge carriers inthe conduction band, nc. In the range of field strengthsand temperatures studied, the nc varied from 1010 to 5 ×1012 cm–3.
CONCLUSIONS
The current–voltage characteristics of undoped anddoped (with isovalent and donor impurities) polycrystalcubic boron nitride samples are studied. It is shown thatdoping with donor impurity (sulfur) results in the for-mation of a material with the electron-type conductivityand higher conductivity.
It is established that the current–voltage characteris-tics of the samples studied have three characteristic por-tions irrespective of their compositions. The first por-tion in the region of weak fields is described by depen-dences that are intermediate between j ~ E and j ~ E2.The second portion is characterized by a dramaticincrease in the current at a certain critical value of thefield strength. The third portion is described by the qua-dratic law j ~ E2.
On the basis of the current–voltage characteristics ofthe samples, we analyzed the results obtained withinthe theory of space-charge-limited currents. The mobil-ity and concentration of charge carriers are evaluated aswell as the depth of location and concentration of traplevels.
REFERENCES
1. B. L. Timman and V. M. Fesenko, Fiz. Tekh. Polupro-vodn. (St. Petersburg) 7 (3), 441 (1973) [Sov. Phys.Semicond. 7 (3), 385 (1973)].
2. P. T. Oreshkin, Physics of Semiconductors and Dielec-trics (Vysshaya Shkola, Moscow, 1977) [in Russian].
3. M. Lampert, Phys. Rev. 103, 1648 (1956).4. L. I. Grossweiner, J. Appl. Phys. 24, 1306 (1953).5. Yu. S. Ryabinkin, Fiz. Tverd. Tela (Leningrad) 6 (10),
2989 (1964) [Sov. Phys. Solid State 6 (10), 2382 (1964)].
Translated by L. Man
j qµncE=
Current-voltage characteristics of cBN samples of differentcompositions
Sample group/Curve portion 1 2 3
Undoped j ~ E2 ↑ j ~ E2
Sulfur-doped j ~ E ↑ j ~ E2
Aluminum-doped j ~ E1–2 ↑ j ~ E2
005

Crystallography Reports, Vol. 50, Suppl. 1, 2005, pp. S62–S67.Original Russian Text Copyright © 2005 by Shablovsky.
CRYSTALGROWTH
A Thermal Model of Periodic CrystallizationO. N. Shablovsky
Gomel State Technical University, Gomel, 246746 Belaruse-mail: [email protected]
Received February 7, 2005
Abstract—A model of periodic crystallization is constructed on the basis of the wave equation of heat transferwith two energy sources exponentially dependent on temperature. In the problem of metal crystallization in amold, these sources are competing. In the problem of explosive crystallization of amorphous films, the sourceshave the same sign. Both problems are analytically solved using the generalized separation of variables and theconstruction of finite-mode Galerkin approximations. The amplitude and period of oscillations of the phaseboundary velocity are analyzed. Spatially periodic structures of the one- and two-dimensional thermal fields areconstructed. It is found that the isotherm chains are arranged in a staggered manner. Other important regularitiesare revealed. © 2005 Pleiades Publishing, Inc.
INTRODUCTION
The crystallization periodicity most clearly mani-fests itself in two phenomena: (i) crystallization of asteel ingot [1] and (ii) explosive crystallization of amor-phous films [2]. Different physical and physicochemi-cal factors can be responsible for the formation of peri-odic inhomogeneities. The purpose of this study is tooffer a clear explanation of the conditions favorable forthe development of a periodic structure during crystal-lization in the framework of thermal physics.
THEORETICAL ANALYSIS
1. The hyperbolic heat conduction equation allow-ing for the finite velocity w = (λ/cγ)1/2 of thermal pertur-bations is derived using the variational principles [3, 4];that is,
(1)
Here, ∇ 2 is the Laplacian, γ is the time of thermal relax-ation, λ is the thermal conductivity coefficient, c is theheat capacity per unit volume, and qv is the power ofinternal heat sources (sinks).
The physical aspects of justification of Eq. (1) weredescribed in [5]. Let us assume that the wave mecha-nism dominates over the diffusion mechanism: γ∂/∂t @ 1.Then, in the two-dimensional case, Eq. (1) takes theform
(2)
where x and y are the Cartesian coordinates and kv =qv/(cγ). For a one-dimensional process, we assume that ∂T/∂y ≡ 0. For liquid (amorphous) and crystallinephases, it is assumed that λl = λs and (cγ)l = (cγ)s. Equa-
c∂T∂t------ γ∂2T
∂t2---------+
λ∇ 2T qv T( ); λ c γ = const., ,+=
∂2T
∂t2--------- w2 ∂2T
∂x2--------- ∂2T
∂y2---------+
kv T( ),+=
1063-7745/05/5001-S $26.000062
tion (2) can be applied to describe qualitatively thermalprocesses during periodic crystallization. The sourcefunctions can be written in the following form:
(3)
(4)
(5)
These relationships are similar to those used in anelliptic problem [6] for the dependence of the vorticityon the current function when studying two-dimensionalsteady-state flow of an inviscid fluid. The mathematicalresults obtained in [6] will be used for our purposes. Inorder to transform the equations into the dimensionlessform, we take the quantity scales (designated by thesubscript b) that provide the invariance of the dimen-
sional and dimensionless forms: λbtb = cb, λbTb =
(qv)b, etc. We will consider two physical phenomena.
I. Periodic crystallization of a metal melt in amold. In this case, the following two thermal processesare dominant: (1) heat release at the solidification frontand (2) heat transfer to the mold wall. The situation canbe simulated using two competing energy sources. The
positive source (T) > 0 is located in the vicinity ofthe isotherm T = Tc, which is associated with the phaseboundary (here, Tc is the equilibrium crystallization
temperature). The energy sink (T) < 0 is located inthe vicinity of the isotherm T = Ta, which is associated
kv T( ) kv1( ) T( ) kv
2( ) T( );+=
kv1( ) T( ) a1 T Tc–( )exp b1 T ,exp= =
b1 a1 Tc–( );exp=
kv2( ) T( ) a2 2– T Ta–( )[ ]exp b2 2– T( ),exp= =
b2 a2 2Ta( );exp=
b1 b2 = const; Ta Tc = const.,,
xb2
xb2
kv1( )
kv2( )
© 2005 Pleiades Publishing, Inc.

A THERMAL MODEL OF PERIODIC CRYSTALLIZATION S63
with the cold wall. The thermal field in the formed solidphase is studied between two isotherms: T ∈ [Ta, Tc].For definiteness, the dependences of the coefficients a1and a2 in relationships (4) and (5) on the main parame-ters of the process are represented as follows: a1 =LN/(cγa0) and a2 = q/(cγa0), where N and |q| are thecharacteristic (for example, maximum) velocity of thephase boundary and the magnitude of the heat flux tothe mold wall, respectively; L is the heat of phase tran-sition per unit volume of a material; and the quantity a0
has the length dimension.II. Explosive crystallization of amorphous films.
The characteristic features of this process are a highvelocity and periodicity of propagation of the crystalli-zation front. According to [7], the process is predomi-nantly affected by the crystal nuclei distributed in theamorphous phase region: crystallization with the par-ticipation of a large number of “embedded” nuclei isaccompanied by an increase in the phase boundaryvelocity, and growing nuclei “shield” the heat of crys-tallization. Such processes can be simulated by twopositive energy sources. The parabolic problem regard-ing the velocity of a crystallization autowave in anamorphous material with distributed crystal nuclei wassolved in [8]. A number of thermal aspects of the prob-lem concerning high-rate crystallization weredescribed in [9].
For problem II, the source functions are also repre-sented by relationships (3)–(5). As in problem I, the
source (T) > 0 is associated with the crystallization
phase boundary. The source (T) > 0 is located in thevicinity of the isotherm T = Ta < Tc characteristic of theamorphous phase. By analogy with the formula for thepower of a heat release source in the growth zone ofcrystal nuclei [8], the coefficient a2 in relationship (5)can be written in the following form:
(6)
where l is the characteristic linear crystal size in theamorphous phase, N1 is the characteristic linear crystalgrowth velocity, and l0 is the minimum distancebetween nuclei. The thermal field is studied in theregion ahead of the phase boundary: T ∈ [Ta, Tc].
2. For problem I, we consider a self-similar processin which the temperature depends on two arguments ofthe traveling wave type: α = x + at and β = y + bt, wherea and b are constants. The wave equation (2) of heattransfer takes the form
(7)
The source term is defined by formulas (3)–(5) inwhich b1 > 0 and b2 < 0. A thermal analogue of the gas-dynamic Mach number is given by the expression M2 =(a2 + b2)/w2. The subsonic process when M2 < 1 and
kv1( )
kv2( )
a2 LN1l2 cγl03 1 N /w( )– 3[ ] 1–
,=
a2 w2–( )∂2T
∂α2--------- 2ab
∂2T∂α∂β-------------- b2 w2–( )∂
2T
∂β2---------+ + = kv T( ).
CRYSTALLOGRAPHY REPORTS Vol. 50 Suppl. 1 20
Eq. (7) has an elliptical form is of prime interest. Byusing the characteristic variables ξ = β – k1α and η =−k2α, Eq. (7) is rewritten in the canonical form
(8)
Therefore, in the subsonic process (a2 < w2), theenergy source kv(T) reverses sign. Equation (8) is amathematical analogue of a steady-state equation forthe flow function in the case of inviscid flow. The solu-tion is constructed and analyzed according to the algo-rithm described in [6]; that is,
(9)
(10)
(11)
The prime and dot on function symbols mean differ-entiation with respect to the arguments η and ξ, respec-tively. Here, a0, h0, and µ are arbitrary constants. Aqualitative analysis of Eqs. (10) and (11) leads to thefollowing results.
If the algebraic equation H1(f) = 0 has three real dif-ferent roots f1, f2, and f3 such that f1 < f2 < f3, the equation
(g) ≡ h2 + H2(g) = 0 possesses the roots = –f1,
= –f2, and = –f3. The graph of the function H2(g)
is obtained from the graph of the function (g) bydownward parallel translation along the ordinate axis.For our purposes, it is sufficient to take h0 = 0. For two
roots f2 and f3, we have formulas µ/(2h1) = ( + f2f3 +
)/(f2 + f3) and a0/(2h1) = /(f2 + f3). Initially, weassume that a0 < 0 and µ < 0 and the roots of the equa-tion H1(f) = 0 satisfy the inequalities f1 < 0 < f2 < f3.Then, the function H1(f) exhibits two extrema, namely,a minimum at f∗ = 0 and a maximum at f∗∗ = µ/(3h1).
Consequently, the function f(η) is periodic in the rangeof values f ∈ [f2, f3]. At a0 + h2 < 0, the examination ofthe behavior of the dependence H2(f) leads to the ine-qualities g3 < g2 < 0 < g1. This means that the functiong(ξ) is periodic at g ∈ [g2, g1]. It is clear that, in thiscase, the condition E > 0 is fulfilled. Now, we assumethat a0 > 0 and µ > 0 and the roots of the equationH1(f) = 0 satisfy the inequalities f1 < f2 < 0 < f3. Then,
∂2T
∂ξ2--------- ∂2T
∂η2---------+ h1 Texp h2 2T–( ),exp+=
h1 b1/ a2 w2–( )k22[ ] 0,<=
h2 b2/ a2 w2–( )k22[ ] 0,>=
k1 ab/ a2 w2–( ),=
k2 w w2 a2– b2–( )1/2/ a2 w2–( ).=
E Texp≡ f η( ) g ξ( )+ 0;>=
f '( )2 H1 f( ), H1 2h1 f 3 µ f 2– 2h0 f a0;+ += =
g( )2 H2 g( ),=
H2 2h1g3 µg2 2h0g h2– a0,–+ +=
H2 g1
g2 g3
H2
f 22
f 32 f 2
2 f 32
05

S64 SHABLOVSKY
< 0 < < and the roots of the equation H2(g) =0 correspond to the inequalities g3 < 0 < g2 < g1. Thefunction f(η) is periodic in the range of values f ∈ [f2,f3]. The function g(ξ) is also periodic in the range ofvalues g ∈ [g2, g1]. Since the inequality f2 + g2 > 0 is ful-filled, we have E > 0. Therefore, there are two variantsof the roots f1, f2, and f3 when there exist solutions peri-odic in each argument, ξ and η. In these cases, we havef > 0 and g > 0 in their own ranges of values.
Let us discuss the behavior of the isotherms T(ξ,η) = Ti = const. From the formula E(Ti) ≡ Ei = f(η) +g(ξ), we have the equation for the isotherm; that is,dη/ (ξ) = dξ/[–f '(η)] = dα1, where α1 is a parameter.The corresponding dynamic system takes the followingform:
(12)
After the shift transformation with respect to argu-ments ξ and η in Eqs. (10) and (11), we find that thefunctions f(η) and g(ξ) exhibit maxima at zero. As aresult, we have f = fmax at η = Mτf and f = fmin at η = [M +(1/2)]τf, where τf is the period of the function f(η) andM is an arbitrary integer number. In turn, we obtain g =gmax at ξ = Mτg and g = gmin at ξ = [M + (1/2)]τg, whereτg is the period of the function g(ξ). The extrema of the
g3 g2 g1
g
dξ /dα1 f ' η( ), dη /dα1– g ξ( ).= =
η
ξ
(a)
(b)
ξ
η
Fig. 1. A staggered arrangement of the isotherm chains forthe “metal melt–mold” system at temperatures (a) T3 < T2and (b) T3 > T2.
CRY
functions f(η) and g(ξ) are the stationary points of thedynamic system (12). The characteristic roots r obeythe equation r2 + (ξ)f ''(η) = 0. Consequently, thepoints in the plane (η, ξ) at which the functions f(η) andg(ξ) have extrema of the same type (maxima or min-ima, i.e., f '' > 0) are singular points of the “center”type for the dynamic system (12). The points at f '' < 0correspond to saddle points. A point (ξ0, η0) is consid-ered critical when the equality [f '(η0)]2 + [ (ξ0)]2 = 0is satisfied. The corresponding critical temperature isT0 = T(ξ0, η0), i.e., E0 = E(T0). Therefore, in the class ofsolutions (9)–(11), there are four critical solutionsE(T1) = f3 + g1, E(T2) = f2 + g1, E(T3) = f3 + g2, andE(T4) = f2 + g2. The isotherms T1 and T4 correspond tostable equilibrium states of the center type, and the iso-therms T2 and T3 correspond to unstable saddle singu-larities. The phase portrait of the dynamic system (12)illustrates qualitative properties of the isotherm field(Fig. 1). The lines T = T2 and T = T3 are separatrices ofthe dynamic system (12) and pass from one saddlepoint to another saddle point. Figure 1a depicts thearrangement of isotherms at T3 < T2. The saddle pointsfall in the lines ξ = τgM/2. The parallel chains of the iso-therms are arranged in a staggered manner. The right-hand side of Eq. (8) can be represented in the form (a2 –w2)kv/[w2(w2 – a2 – b2)]. This relationship for a particu-lar chain has a specific sign, which becomes oppositefor the neighboring chain. The inversion is associatedwith the competing effect of the volume energy sources
and . Figure 1b shows the arrangement of iso-therms at T2 < T3. The saddle points fall in the lines η =τfM/2. For both variants in Fig. 1, there are isothermslocated between chains. At T2 = T3, such isotherms areabsent; i.e., the neighboring chains share boundaries.
In the physical plane (x, y), the process under con-sideration can be described as follows. The lines η =const move along the OX axis at the velocity (–a). Thelines ξ = const move at the subsonic velocity Nξ =w2b/[(a2 – w2)2 + a2b2]1/2. At each fixed instant, the tem-perature is a periodic function of the arguments y – k1xand –k2x. At each fixed point (x, y), the function E(T) isa superposition of two periodic functions of the argu-ments (b – k1a)t and –k2at. The oscillation periods intime t for these functions are τg/(b – k1a) and τf/(–k2a).For each isotherm Ti ∈ [Ta, Tc] at β = βi(α), the velocityof the line Ei ≡ expTi = f(η) + g(ξ) can be written in theform
At the points of the isotherm at which f = f2 or f = f3,
we have dξ/dη = 0 and, hence, = (ak1 – b)2/(1 + ) =
, which corresponds to the velocity of the ξ line. Atthe points of the isotherm at which g = g1 or g = g2, we
g
gg
g
kv1( ) kv
2( )
NE
a dβi/dα( ) b–
dβi/dα( )2 1+----------------------------------
a k1 k2 dξ /dη( )–[ ] b–
k1 k2 dξ /dη( )–[ ] 2 1+ 1/2----------------------------------------------------------------.= =
NE2 k1
2
Nξ2
STALLOGRAPHY REPORTS Vol. 50 Suppl. 1 2005

A THERMAL MODEL OF PERIODIC CRYSTALLIZATION S65
have dξ/dη ∞ and, hence, = a2, which corre-sponds to the velocity of the η line. This clarifies thephysical meaning of the parameters a and b: theseparameters characterize the subsonic velocities of iso-therms at the points corresponding to f = f2 and f = f3 forg ∈ (g2, g1) or g = g1 and g = g2 for f ∈ (f2, f3).
3. Problem II (explosive crystallization) will besolved using the one-dimensional variant of Eq. (2).The variables x and t are separated in a way similar tothat for the solution to the elliptic problem; that is,
(13)
(14)
(15)
Here, a0, b0, and µ are arbitrary constants; b1 > 0;and b2 > 0. Now, we perform the qualitative analysis ofthese equations. For this purpose, we examine thebehavior of the real roots of the equations F(f) = 0 andG(g) = 0. To three real different roots f1, f2, and f3 (f1 <f2 < f3) of the equation F(f) = 0 there correspond threeroots = –f3, = –f2, and = –f1 of the equation
≡ b2 + G(g) = 0. The equation G(g) = 0 has the rootsg1, g2, and g3 such that g1 < g2 < g3. Let us discuss theconditions under which the solution g(t) to Eq. (15) is aperiodic function. The function G(g) exhibits twoextrema, namely, a maximum at g = g∗ = (–µ –
D1/2)/(6b1) and a minimum at g = g∗∗ = (–µ +
D1/2)/(6b1), where D = µ2 – 12b0b1 > 0, µ < 0, and 0 <g∗ < g∗∗ . We consider three positive roots of the equa-
tion G(g) = 0: 0 < g1 < g2 < g3. Then, we find that g1g2 +g2g3 + g1g3 = b0/b1 > 0, g1 + g2 + g3 = –µ/(2b1), andg1g2g3 = (a0 + b2)/(2b1) > 0. The function g(t) > 0 is peri-
odic in the argument t at g ∈ [g1, g2]. The equation ≡F(f) – b2 = 0 possesses the negative roots = –g1,
= –g2, and = –g3 such that < < < 0. Thegraph of the function F(f) is obtained from the graph of
the function (f) by upward parallel translation alongthe ordinate axis. Consequently, at b2 > 0, we obtain theroot f1 < 0 [F(f1) = 0] such that f1 + g1 > 0. The conditionE > 0 in relationship (13) is fulfilled at f ∈ [f0, f1) whenthe initial value f0 satisfies the inequalities (–g1) < f0 <f1. The constant a0 satisfies the condition a0 + b2 ≥ 0.From expression (14), we find
w(df/dx) = [F(f)]1/2 > 0, x ∈ [0; ∞);
x = 0, f(0) = f0; x ∞, f f1.
NE2
E Texp≡ f x( ) g t( )+ 0;>=
w2 f '( )2 F f( ), F 2b1 f 3– µ f 2 2b0 f– a0;–+= =
f ' df x( )/dx,=
g( )2 G g( ), G 2b1g3 µg2 2b0g a0 b2,––+ += =
g dg t( )/dt.=
g1 g2 g3
G
F
f 1
f 2 f 3 f 3 f 2 f 1
F
CRYSTALLOGRAPHY REPORTS Vol. 50 Suppl. 1 20
At x ∈ (–∞, 0), the formulas are similar. For the iso-therm going to the right (dx > 0), we have df/dx > 0. Forthe isotherm going to the left (dx < 0), we have df/dx <0; i.e., as before, df > 0. In both cases, the inequalitydF/df < 0 is satisfied. Therefore, the temperature variesin the half-open interval E ∈ [g1 + f0, g2 + f1). Let usanalyze the behavior of the isotherm T = Ti ≡ const withthe equation of motion x = xi(t). It is evident that thefunction f[xi(t)] = Ei – g(t) is periodic in time t and islimited from above by the value Ei – g1 and from belowby the value Ei – g2, where Ei = expTi. Any isotherm inthe range Ei ∈ [g1 + f0, g2 + f1) moves at a finite velocity
Ni given by the formula /w2 = G(g)/F[f(xi)]. This for-mula holds true on any finite interval x. The functionNi(t) vanishes periodically. The total amplitude of oscil-lations of the velocity Ni is also periodic function of thetime (Fig. 2). This oscillation process is represented byspecific beats. It is clear that this inference is also validfor the isotherms T = Ta and T = Tc bounding the tem-perature range under investigation. It will be demon-strated below that there exists a two-dimensional solu-tion with similar properties. This behavior of the phaseboundary velocity explains the experimentallyobserved characteristic “lobed” and “scaly” structuresformed upon explosive crystallization in films [2,p. 147; 7]. The constant a0 characterizes the initial (att = 0) thermal field T(x, 0) in the amorphous phase. Thethermal process is periodic in time when the parametersa0 and b2 > 0 (the energy source parameter in the zoneof nucleus growth) satisfy the inequalities (– ) <
(−a0) < b2 (the formula for > 0 is not given).
4. The solution to the differential equation (15) canbe represented in the form of the finite-mode Galerkinapproximation
(16)
Approximations of this type turned out to be effi-cient in the study of a nonlinear behavior of distributedkinetic systems with an aperiodic instability [10]. Sub-stituting formula (16) into Eq. (15) and omitting har-monics higher than the second harmonic, we obtain
Ni2
a0*
a0*
g t( ) n0 n1 ktsin n2 ktcos+ +=
+ n3 2ktsin n4 2ktcos ….+ +
t
Ni
Fig. 2. Oscillations of the velocity of the phase boundary ofthe explosive crystallization.
05

S66 SHABLOVSKY
n2 = 0 and n3 = 0. The frequency k and three coefficientsn0, n1, and n4 are related to each other by three algebraicequations (not given). The approximate solution g(t) ≅n0 + n1sinkt + n4cos2kt possesses the following proper-ties: the quantity n0 + n4 = g(0) characterizes the initialtemperature at a fixed point x, (n0 – n4) is the “mean”value about which oscillations occur, and 2n1 is thetotal oscillation amplitude. The convergence of the for-mal series (16), which is the quasi-harmonic solution toEq. (15), can be proved using the method described in[11]. Numerical calculations indicate that the obtainedquasi-harmonic approximation is characterized by agood practical convergence at |n0| > |n1| > |n4| > |n5|, etc.;n4 < 0; and |4n4/n1| < 1. For example, at n0 = 5, n1 = 1,n4 = –0.1, and k2 = 1, we find b1 = 1 and (a0 + b2)/b1 ≅280.12.
The properties of the analytical relationships repre-senting the approximate solution g(t) are as follows.The constants a0, b0, and µ are calculated from the coef-ficients n0, n1, and n4. It is significant that the constantsµ and b0 depend linearly on either of the source param-eters b1 and b2 or, equivalently, on b1 and k2. When theparameters of temperature oscillations (the total oscil-lation amplitude, the initial and mean values) are spec-ified, the oscillation frequency is determined from theformula
Note the following important relationship
(17)
where the quantities A0 and A1 are calculated from thecoefficients n0, n1, and n4 (the corresponding formulasare not presented). Therefore, we obtain the inequalityd(a0 + b2)/d(k2) > 0. Consequently, the larger the param-eter b2 > 0 (i.e., the more pronounced the conditionsproviding the acceleration of the phase boundary), thehigher the circular frequency squared. According to
expression (6), we have b2 ~ a2 ~ . Therefore, theperiodicity of propagation of the explosive-crystalliza-tion front depends substantially on the concentration ofcrystal nuclei.
RESULTS AND DISCUSSION
For the problems under consideration, the necessaryconditions for the formation of a spatial and temporalperiodicity of the temperature field are (1) the wavemechanism of heat transfer and (2) the presence of twoenergy sources corresponding to two different iso-therms. These sources are competing in problem I asso-ciated with metal crystallization in the mold and havethe same sign in problem II concerning explosive crys-tallization of amorphous films.
k2 2 2b1n4 3b1n0– µ2---–
=
+ 2n4 6b1n02 2µn0 b1n4
2+ +( )n12– .
a0 b2+ A1k2 A0b1, A1 0,>+=
l03–
CRY
For definiteness, we assume that l0 = (g1 + g2)/2 inproblem II. Then, we find that the total oscillationamplitude is directly proportional to the circular fre-quency squared: (g2 – g1) ~ k2/b1, where, according to
relationship (17), k2 ~ b2 ~ . There is a finite range ofvalues l0 such that a decrease in the minimum distancel0 between frozen-in crystal nuclei leads to a decrease inthe period of temperature oscillations and an increase intheir total amplitude. Periodic stops of the isotherm T =Tc suggest drastic changes in the velocity of the crystal-lization phase boundary (Fig. 2). Let us study the spe-cific features of solutions in the following cases: (1) atwo-dimensional self-similar process and (2) a super-sonic mode (M2 > 1) of the field evolution. Equation (7)is written in the canonical form
(18)
By convention, the direction along the OX axis willbe referred to as the principal direction in the two-dimensional problem. If the process in the principaldirection is supersonic (a2 > w2), we have the hyper-bolic equation (18), in which the sign of the energy
source is opposite to the sign of the energy sourcekv irrespective of the value of b. In this supersonic pro-cess, the energy source reverses sign. When the velocityin the principal direction is subsonic but the process, onthe whole, is hyperbolic, i.e.,
(19)
the sign inversion is absent. Equation (18) is analyzedusing the solution in the form of relationships (13)–(15). The necessary replacements are obvious: x ζ,
t ξ, and kv .
In this case, the main variant corresponds to condi-tions (19), i.e., to the supersonic process without inver-sion. It turns out that the data obtained in Section 3 onthe oscillation of the phase boundary velocity in timecan be generalized to the two-dimensional self-similarproblem. For the isotherm Ti = T(α, βi(α)] = const [β =βi(α)], the condition for the stop of the phase boundaryNi = 0 is described by the equation
(20)
Here, f(ζ) is a monotonic function. To each value of fthere corresponds the sole value of g at which Eq. (20)is satisfied. Since the function g(ξ) is periodic in theargument ξ = y – k1x + t(b – ak1), the isotherm yi + bt =βi(x + at) is characterized by the velocity Ni periodic in
l03–
∂2T
∂ξ2--------- ∂2T
∂ζ2---------–
a2 w2–( )kv
w2 w2 a2– b2–( )--------------------------------------- kv
1 ,≡=
ξ β k1α , ζ– k3α ,–= =
k1 = ab/ a2 w2–( ), k3 = w a2 b2 w2–+( )1/2/ a2 w2–( ).
kv1( )
a2 w2 a2 b2,+< <
kv
1
( )
G g( ) a*2 F f( ), a*
2 a2 a2 b2 w2–+( )/ b2w2( ) 1;<= =
E Ti( ) f ζ( ) g ξ( ), f f 0 f 1 ), g g1 g2,[ ] .∈,[∈+=
STALLOGRAPHY REPORTS Vol. 50 Suppl. 1 2005

A THERMAL MODEL OF PERIODIC CRYSTALLIZATION S67
the argument x + at. Consequently, at each fixed coor-dinate x, the velocity Ni vanishes periodically (it is thisresult that was obtained in solving the one-dimensionalproblem). Moreover, at each instant of time t, the iso-therm T = Ti involves points [x, yi(x, t)] at which the iso-therm velocity is equal to zero. These stationary pointsare arranged periodically in the coordinate x. Thisarrangement has a pronounced two-dimensional char-acter. The substantial spatial and temporal temperatureinhomogeneities obtained are periodic and responsiblefor the formation of lobed and scaly structures in films.Note also that the studied classes of solutions to prob-lem II with the use of Eqs. (18) and (8) indicate thephysical impossibility of explosive crystallization fortwo self-similar variants, namely, in the cases of (1) asupersonic process (M2 > 1) with inversion of thesource sign and (2) a subsonic evolution of the temper-ature field. For a more general class of solutions, thisquestion remains open.
Now, we examine the “metal melt–mold” thermalsystem in a supersonic mode. The one-dimensional andself-similar two-dimensional solutions do not containfundamental quantitative differences. In the one-dimensional case, the analysis of the class of solutions(13)–(15) to the hyperbolic equation (2) demonstratesthat, at b1 > 0 and b2 < 0, there are no processes periodicin time t. The function E(x, t) = f(x) + g(t) is periodic inthe coordinate x and relaxes with time from the initialstate E(x, 0) to the state E∞(x) at t ∞. In the relaxedstate, the highest achievable temperature decreaseswith an increase in the parameter (–b2), which charac-terizes energy transfer to the mold wall.
Let us consider the two-dimensional variants. (1) Inthe supersonic case with inversion of the sign of theenergy source kv, there is a process periodic in the argu-ment ξ, i.e., along the line whose slope relative to theprincipal direction is equal to k1, and the solutionrelaxes with respect to the argument ζ. (2) When theinversion is absent [see conditions (19)], the process isperiodic in the argument ζ, i.e., along the principal sub-sonic direction, and the solution relaxes with respect tothe argument ξ. The distinctive feature of these super-sonic processes is that the isotherms are open in the (x,y) plane. These results and also two variants of isothermchains in Fig. 1 are in qualitative agreement with theexperimental data obtained in [12]. In [12], the authorsinvestigated the arrangement of pores and the presenceof other defects in profiled sapphire crystals as a func-tion of growth conditions. It was revealed that a molyb-denum crucible used for growing crystals affects thegrowth process and that the crystal structure involvesperiodically arranged chains composed of individualsmall-sized pores. It is significant that chains arealigned parallel, perpendicular, or at an angle to the
CRYSTALLOGRAPHY REPORTS Vol. 50 Suppl. 1 2
growth direction with a specific period [12, p. 1493]. Inthe subsonic case, a staggered arrangement of isothermchains (Fig. 1) is governed by the competition of theenergy sources. This effect has two hydrodynamic ana-logues, such as (1) a two-dimensional vortex flow of anideal fluid [6] and (2) a two-dimensional periodic flowof a viscous fluid due to the spatial periodic force in afinite-sized channel [13].
CONCLUSIONS
The wave heat transfer in a “medium–two nonlinearenergy sources” system is responsible for the formationof a spatial and temporal periodicity during crystalliza-tion. The nonlinear dynamic properties of the processdepend substantially on whether the evolution of thetemperature field occurs in a subsonic or supersonicmode.
REFERENCES1. A. S. Él’darkhanov, Processes of Crystallization in the
Field of Elastic Waves (Metallurgiya, Moscow, 1996) [inRussian].
2. L. N. Aleksandrov, Kinetics of Crystallization andRecrystallization of Semiconductors Films (Nauka,Novosibirsk, 1985) [in Russian].
3. Yu. T. Glazunov, Inzh.-Fiz. Zh. 40 (1), 134 (1981).4. N. I. Yavorskiœ, Izv. Akad. Nauk SSSR, Mekh. Zhidk.
Gasa, No. 3, 3 (1986).5. N. I. Nikitenko, Inzh.-Fiz. Zh. 73 (4), 851 (2000).6. O. V. Kaptsov, Prikl. Mekh. Tekh. Fiz., No. 1, 109
(1989).7. N. M. Bogdanov, V. P. Koverda, V. N. Skokov, et al.,
Dokl. Akad. Nauk SSSR 293 (3), 595 (1987) [Sov. Phys.Dokl. 32 (3), 221 (1987)].
8. V. P. Koverda, Zh. Tekh. Fiz. 64 (3), 62 (1994) [Tech.Phys. 39 (3), 255 (1994)].
9. O. N. Shablovskiœ, Relaxation Heat Transfer in Nonlin-ear Media (Gomel. Gos. Tekh. Univ., Gomel, 2003) [inRussian].
10. B. A. Malomed and M. I. Tribel’skiœ, Dokl. Akad. NaukSSSR 275 (6), 1363 (1984) [Sov. Phys. Dokl. 29 (4), 294(1984)].
11. A. D. Bryuno, Local Method of Nonlinear Analysis ofDifferential Equations (Nauka, Moscow, 1979) [in Rus-sian].
12. G. A. Satunkin, V. A. Tatarchenko, E. M. Tseœtlin, andT. N. Yalovets, Izv. Akad. Nauk SSSR, Ser. Fiz. 40 (7),1492 (1976).
13. E. B. Gledzer, F. V. Dolzhanskiœ, and A. M. Obukhov,Hydrodynamic Systems and Their Applications (Nauka,Moscow, 1981) [in Russian].
Translated by O. Borovik-Romanova
005

Crystallography Reports, Vol. 50, Suppl. 1, 2005, pp. S68–S73.Original Russian Text Copyright © 2005 by Ivanov.
CRYSTALGROWTH
Concept of Specific Supersaturation (Specific Supercooling) and Practical Aspects of Its Application
B. G. Ivanov
Federal State Unitary Enterprise “Vavilov State Optical Institute, All-Russia Research Center,”Birzhevaya liniya 12, St. Petersburg, 199034 Russia
e-mail: [email protected]
Received February 3, 2005
Abstract—It is demonstrated that the normal growth rate of crystals from solutions and melts depends on thearea of the crystallization front. New growth parameters, namely, the specific supersaturation and the specificsupercooling, are introduced, and the quantitative dependence of the normal growth rate on these parameters isdetermined. It is noted that the normal growth rate affects the formation of defects. The criteria and the rangeof the possible use of the specific supersaturation (specific supercooling) for optimizing the conditions of crys-tal growth from solutions and melts are revealed. © 2005 Pleiades Publishing, Inc.
INTRODUCTION
The regularities of the formation (ontogeny) of crys-tals, including the formation of particular growthdefects, in a broad sense, are the only reliable criterionfor evaluating both growth conditions and qualitativecharacteristics of the crystals. The internal structure ofcrystals is formed as a result of a combined effect ofmany growth conditions. However, eventually, the spe-cific features of the crystal formation are directlyrelated to the normal growth rate A, i.e., the rate of crys-tal growth in the direction perpendicular to the crystal-lization front [1].
CONCEPT OF SPECIFIC SUPERSATURATION (SPECIFIC SUPERCOOLING)
Investigation into the factors responsible for the nor-mal growth rates is one of the basic problems of thecrystallization kinetics. It is universally accepted thatthe dependence of the normal growth rate on the super-saturation (for solutions) or the supercooling (formelts) without regard for other factors is described bythe power function
(1)
Here, R is the radius or another characteristic crystalsize, t is the time, ∆C is the supersaturation, and theexponent n varies from 1 to 3. At n = 1, this dependenceexhibits an almost linear behavior [2–5]. However, evenin special experiments, similar dependences have beenevaluated accurate to within an order of magnitude andcould be used only for analyzing qualitative tendenciesin processes. These estimates are quite insufficient forrevealing quantitative regularities and cannot be
∂R/∂t ∆Cn.≈
1063-7745/05/5001-S $26.000068
applied to any calculations of conditions for practicalgrowth methods. In our opinion, this situation is associ-ated with a number of crucial circumstances. Althoughthe notions of the supersaturation and supercooling arewell known and have a clear physical meaning, theproblem associated with the establishment of thedependence of the normal growth rate on the supersat-uration and supercooling lies in the inadequate use ofthese notions.
On the one hand, the above dependence of the nor-mal growth rate should hold only for supersaturationsor supercoolings that occur directly at the crystalliza-tion front and are true driving forces (energy potentials)of crystallization. However, these quantities in generalare not constant both on a macroscale (for example,within the same face in the case of faceted growth) andon a microscale. Moreover, the measurement of thesequantities in the vicinity of the crystallization front ortheir calculation from indirect data involve consider-able difficulties or are impossible at all for real crystalgrowth processes.
On the other hand, real crystals of specific types,sizes, and masses grow in particular growth media(zones of growth) with spatiotemporal boundaries. As arule, the supersaturations or supercoolings are specifiedor estimated for these particular growth media and spe-cific time intervals. It is these quantities (in this sense)that are used in reference to the definitions of the type“supersaturation in a solution” or “supercooling in amelt” in view of their quantitative meaning. Thesequantities have real values only in the absence ofgrowth processes in specific media. During the crystalgrowth, a combined effect of convection and diffusionprocesses and kinetic factors of growth leads to the for-
© 2005 Pleiades Publishing, Inc.
CONCEPT OF SPECIFIC SUPERSATURATION S69
mation of temperature–concentration fields of complexconfigurations with different gradients of concentra-tions for solutions or temperatures for melts in growthmedia. The supersaturations (supercoolings) at thecrystallization front are intermediate between thesupersaturation (supercooling) in the growth mediumand the equilibrium concentration (melting tempera-ture) [5].
It is evident that the supersaturation (supercooling)at the crystallization front and in the growth mediumdiffers radically. However, the dependence of the nor-mal growth rate on the supersaturation (supercooling)[see relationship (1)] is very frequently consideredwithout regard for the above differences. Since thesequantities have a particular effect on the normal growthrate, they are used for approximate calculations andthen the normal growth rate is optimized in an experi-mental way (as a rule, for a long time) for specific con-ditions. It is believed that other factors that govern spe-cific features of the internal structure of crystals andtheir qualitative characteristics, such as the sizes and(or) the number of growing crystals, etc., are of second-ary importance and can be ignored in the majority ofcases.
The necessity of preparing high-quality crystalswith maximum sizes determines the tendency to thegrowth of a small number of crystals (in the limit, onecrystal) from a growth medium. It is a widespreadbelief (associated with the practice of growth of largesingle crystals) that the smaller the number of crystals,the higher the crystal quality, all other factors being thesame [6, 7]. The practice of large-scale growth of crys-tals from solutions demonstrates that, under identicalgrowth conditions, in particular, at constant supersatu-rations in growth media, the quality of crystals grownin the case of a small number of large-sized crystalsappears to be substantially worse than the quality ofcrystals grown in the case of a large number of small-sized crystals. Investigations into regularities of the for-mation of mother-solution inclusions as an indicator ofnormal growth rate during the growth of yttrium alumi-num garnet crystals from solutions in melts showed thatthere is a one-to-one correspondence between the for-mation of these inclusions and the normal growth rate:the larger the number (the higher the quality) of grow-ing crystals, the lower the normal growth rate, and viceversa [8].
Analysis of the mass transfer balance equation forcrystallization from solutions in specific growth mediashows that the normal growth rate, which is the firstderivative of the radial crystal size R with respect to thetime t (A = ∂R/∂t, cm/s), depends not only on the super-saturation and can be represented by the relationship
(2)
∂R/∂t 0.01M ∂C/∂T( ) ∂T /∂t( )/3NR2ρk–=
= 0.01C' t( )M/3NR2ρk–
= 0.01M/3kρ( ) C'[ t( )/NR2].–
CRYSTALLOGRAPHY REPORTS Vol. 50 Suppl. 1 2
Here, M is the mass (g) of the growth medium, C is thesolubility (wt %) of the crystallized material, N is thenumber of growing crystals, k is the coefficient deter-mined by the crystal shape, ρ is the crystal density(g/cm3), and T is the solution temperature (K).
According to relationship (2), the normal growthrate depends on two independent variables; i.e., it isproportional to the rate of change in the mass of thecrystallized material in the solution this rate deter-mines the supersaturation [at n = 1 in expression (1), Ais directly proportional to the saturation] and inverselyproportional to the product NR2. The product NR2 isproportional to the crystallization front area, and,hence, the normal growth rate is inversely proportionalto this area. At a constant supersaturation in the growthmedium, the normal growth rate is not constant in thecourse of growth, as should follow from expression (1).Depending on the variation in the crystallization frontarea, the normal growth rate regularly and often sub-stantially varies, in particular, with a change in thenumber of growing crystals (Fig. 1). The factors N andR2 are functions of the number of growing crystals todifferent powers: the larger the number of growingcrystals N, the larger the crystallization front area forcrystals with identical masses, the lower the normalgrowth rate, and the higher the crystal quality. Theseregularities are consistent with the aforementionedexperimental data [8].
The dependence of the normal growth rate on thecrystallization front area is affected not only by thenumber of growing crystals but also by other character-istics of crystal growth, such as crystal size, the pres-ence of shapers, etc. Therefore, it is necessary to allowfor any change in the crystallization front area, includ-ing the case of growth of individual crystals. In the gen-eral case, upon change in both independent variables,namely, supersaturation in the growth medium and thecrystallization front area, the effect of the latter quan-tity, as a rule, is considerably stronger than that of theformer quantity. This is additional evidence for thenecessity of accounting for the crystallization frontarea.
The analysis of the growth of yttrium aluminum gar-net, corundum, and fluoride crystals by the melt meth-ods demonstrates that similar regularities are observedin the course of crystal growth from melts. For the mostpart, the methods for growing crystals from melts havebeen developed for the preparation of individual singlecrystals. Crystals grow when the crystallization iso-therm moves in the growth medium due to the super-cooling provided by removal of the thermal energyfrom the crystallization front. The normal growth ratein these methods is two or three orders of magnitudehigher than that in methods for growing crystals fromsolutions. The shape of the crystallization front is gov-erned by the shape of the crystallization isotherm with
005

S70
IVANOV
0.5
1.0
1.5
2.5
1080 1040 1000
0.05
0.10
0.15
1080 1040
0.5
2.0
1080 1040 100010000
125
64
27
8
3
N = 1
R, cm
N = 1
3
N = 27
dT/dt = 10 K/4
5
1
827
64125
T, °CT, °CT, °C
A, cm/h
A, cm/h
(c)(a) (b)
Fig. 1. Temperature dependences of (a) the crystal size R at different numbers N of growing crystals and (b, c) the normal growthrate A under different conditions of growth of yttrium aluminum garnet crystals from the solution in the melt for (b) dT/dt = 5 K/hand different values of N [8] and (c) N = 27 and different values of dT/dt.
allowance made for temperature gradients in differentfront regions.
The assumption that the volume of the crystallizedmaterial is proportional to the change in the powerdelivered to the growth medium ∆W = K∆V (where Wis the power, V is the crystal volume, K is the propor-tionality factor) is valid virtually for all melt methods[9]. Then, the normal growth rate can be written in theform
(3)
where h is the change in the crystal size in the growthdirection perpendicular to the crystallization front(along the growth axis) or, in the general case, in thedirection of removal of the thermal energy from thecrystallization front; t is the time; and S(h) is the changein the crystallization front area. Since the change in thequantity ∂W/∂t corresponds to the conditions of super-cooling in the growth medium, the normal growth rateduring the growth from melts, like during the growthfrom solutions, is also determined by two independentparameters: the normal growth rate is proportional tothe rate of change in the supercooling of the growthmedium and inversely proportional to the crystalliza-tion front area. Consequently, the normal growth rate inthe case of growth from melts should be estimated withdue regard for the crystallization front area and itschange. However, there are radical differences betweenthe estimations of the normal growth rates in the meth-ods for growing from solutions and melts. In the melt
∂h/∂t ∂W /∂t( )/KS h( ),=
CRY
methods, the thermal energy is predominantly removedfrom the growth medium in a particular direction. Inthis case, the important aspect of the estimation of thenormal growth rate is the inclusion not only the area butalso the shape (curvature) of the crystallization front.The front curvature determines the angle between thevector of the temperature gradient governing the direc-tion of the isotherm motion in each specific region(point) of the crystallization front and the heat removaldirection (growth axis) according to the cosine law Vα =Vvertcosα (Fig. 2) [9]. As follows from this law, the nor-mal growth rate varies along the crystallization frontsurface from the maximum rate at the growth axis (thedominant heat removal direction) to the rate close tozero at the lateral surface of the crystal. Different nor-mal growth rates are observed at the crystallizationfront depending on defect and impurity distributions,morphology, etc. In particular, it is characteristic thatdefects are primarily formed in central crystal regionsalong the growth axis, i.e., in regions with maximumnormal growth rates.
In different methods for growing crystals frommelts, their specific features and efficiency can dependon the shape and curvature of the crystallization front.It is believed that, except for special cases, a planarcrystallization front is most optimum for a number ofimportant applications of crystals, such as doping, etc.However, the area of the planar crystallization front isminimal compared to those of any other shapes. Theplanar crystallization front is characterized by the max-
STALLOGRAPHY REPORTS Vol. 50 Suppl. 1 2005

CONCEPT OF SPECIFIC SUPERSATURATION S71
imum normal growth rates, which lead to an increase inthe probability of forming particular growth defects.Therefore, the small area of the crystallization front isnot optimum in many methods used, for example, forgrowing fluoride and corundum crystals.
The variation in the normal growth rates (describedby the cosine law) at the crystallization front in meltmethods substantially affects the morphological fea-tures of crystals, in particular, specific features of fac-eted growth [10]. Crystals grow from melts via theatomically rough mechanism with the formation ofcurved (irrational) surfaces that involve an insignificantnumber of faceted regions at the crystallization front(face effect). Evaluation of the morphological signifi-cance of different faceted forms indicates that the typeof faceted forms grown on the crystal surface dependson the normal growth rate. In yttrium aluminum garnetcrystals, the 211 faces are formed in central regionsof the crystallization front at maximum normal growthrates, whereas the 110 faces occur at lower normalgrowth rates in regions closer to the lateral surface andat its boundary. Therefore, faceted forms of an yttriumaluminum garnet habit change regularly with variationin the normal growth rate. More than ten faceted formsof the F and S types can be observed on the lateral sur-faces of yttrium aluminum garnet crystals at normalgrowth rates close to zero. In corundum crystals grownby the method devised at the State Optical Institute (St.Petersburg, Russia), no faces occur at the crystalliza-tion front, but the lateral surface contains large (0001)faces. It is known that the (0001) face is characterizedby an extremely high morphological stability and thesecrystals do not grow hardly at all along the [0001]direction. However, this face is formed at A ≈ 0. Itshould be noted that the genesis of faces on the lateralsurface of crystals exhibits specific features. The facesare formed via tangential growth along the line of con-tact between the melt mirror and the crystal, and thecrystal does not grow in the direction perpendicular tothe face surface. Consequently, growth pyramids areabsent. However, analysis of this genesis confirms theinference that the morphological stability of facesdepends on the normal growth rate.
Therefore, the aforementioned regularities theoreti-cally revealed from relationships (2) and (3) suggestthat the normal growth rate depends on the crystalliza-tion front area. The analysis of the supersaturation orsupercooling of growth media (zones of growth) showsthat the normal growth rate depends on two indepen-dent parameters for any growth mechanism (growthmethod) of crystals. Despite qualitative differences, thedependence of the normal growth rate eventually leadsto identical results, which are confirmed by observa-tions of crystal growth from solutions and melts. Inves-tigations into the specific features of the growth ofyttrium aluminum garnet crystals from solutions inmelts [8] and special model experiments on the growthof alum from aqueous solutions made it possible tocombine these parameters by introducing a qualita-
CRYSTALLOGRAPHY REPORTS Vol. 50 Suppl. 1 20
tively new parameter, namely, the specific supersatura-tion defined as the supersaturation of a growth mediumaccording to growth conditions per unit area of thecrystallization front [8]. Since similar dependences areobserved for the melt methods, it is possible to intro-duce a new growth parameter, i.e., the specific super-cooling defined as the supercooling of a growthmedium per unit area of the crystallization front. Then,from relationships (2) and (3), we obtain an importantdependence: the normal growth rate of crystals isdirectly proportional to the specific supersaturation(specific supercooling), all other growth factors beingthe same.
The introduced parameters and the correspondingdependences suggest the necessity and importance ofthe inclusion of the geometric factor, i.e., the crystalli-zation front area and its change over the course of crys-tal growth. It is known that, in practice, the supersatu-ration (supercooling) for the vast majority of growncrystals varies insignificantly in the growth mediumand is often maintained at a constant level. The changein the crystallization front area in the general case isconsiderably larger than that of the supersaturation(supercooling) and depends on specific growth condi-tions. When the solubility as a function of the tempera-ture (or the cooling rate as a function of the deliveredpower) and the shape of grown crystals are known, theabove dependences can be calculated with a high accu-racy.
α
Vα
Vvert
Crystal
Melt
Fig. 2. Schematic diagram illustrating the cosine law. Vα =Vvert/cosα [9].
05

S72 IVANOV
In essence, the proposed growth parameters and theobtained dependences are statistical and disregard allnumerous real features of crystal formation, such as thegrowth rate anisotropy; fluctuations of crystal, temper-ature gradient, concentration, and impurity distribu-tions; convection in growth media; interaction of diffu-sion and kinetic growth factors; etc. However, theseparameters appear to be convenient and have definitephysical meaning, because they enable one to performdirect quantitative estimations of real phenomena andgrowth of natural and synthetic crystals, such as den-dritic and faceted growth, defect formation, morpho-logical features, etc. The main criteria for the use of thespecific supersaturation and the specific supercoolingare the possibility of determining the normal growthrates when analyzing the growth of specific crystals indifferent growth media. Despite their averaged and sta-tistical character, the specific supersaturation and thespecific supercooling permit one to reliably reveal thequantitative criteria for the conditions necessary formanifestation of specific qualitative characteristics ofcrystals with the use of the dependences of the normalgrowth rate on these parameters by estimating the lim-iting normal growth rates of the formation of particulargrowth defects. Therefore, these parameters can andshould find practical application in calculating opti-mum growth conditions for different methods (from thecrystal growth from aqueous solutions to high-temper-ature variants of the Czochralski, Stockbarger, Schto-ber, Kyropoulos, and other methods that are used forgrowing crystals from melts).
The optimization of the conditions of the crystalgrowth from cooled solutions, as a rule, requires exper-imental correction, because the main criterion for theevaluation of the conditions is the formation of defectsdetermining the crystal quality. Therefore, the growthconditions should be calculated by determining the lim-iting conditions of the defect formation, whose maincharacteristics are represented by the normal growthrate and its dependence on the specific supersaturation[8], with the inclusion of other important factors, forexample, the diffusion control [11].
The cooling rate of the growth medium at differentstages of the process depends on a number of factors.The main factors are the change in the crystallizationfront of crystals and the retardation of transfer with adecrease in the temperature. At the initial stages whenthe crystal (seed) sizes are small, the solution should becooled at minimum rates, even though the permissiblenormal growth rates are highest. With an increase in thecrystallization front area, which leads a decrease in thepermissible normal growth rates, it is possible toincrease the cooling rate. Subsequently, the rate ofincrease in the crystallization front area is retarded, thisincrease does not compensate for the decrease in thepermissible normal growth rates, and it is necessary todecrease the cooling rate of the solution.
CRY
In the case of crystal growth from melts, the growthconditions providing the normal growth rates at whichhigh-quality crystals are grown can be optimized usingsimple mathematical models that adequately describethe processes responsible for the formation of stabletemperature fields in the growth zone [9]. The condi-tions under which the normal growth rate and the cor-responding specific supercooling ensure the requiredcrystal quality at each point of the crystallization frontcan be treated as optimum. The crystallization frontarea, which in the general case depends on the shapesof the crystallization front and crystals, can changeconsiderably (decrease, increase) during the growthprocess and lead to a corresponding change in the spe-cific supercooling and the normal growth rate. The opti-mum conditions should provide the maintenance of theoptimum normal growth rate at a constant level or itsdecrease with due regard for impurities that retard thegrowth of crystals [9]. By assuming that the volume ofthe crystallized material is proportional to the powerdelivered to the growth medium and using relationship(3), the rate of change in the heater power can be repre-sented in the form
(4)
Then, the growth conditions are calculated depend-ing on the form of the function S(h).
CONCLUSIONS
Thus, the problems associated with the fields ofcrystal growth investigations that are believed to havebeen thoroughly studied and universally accepted wereanalyzed in this work. Without pretending to the revi-sion of the universally accepted concepts, the authorcalled attention to a number of regularities that in hisopinion deserve more consideration. New parameters,namely, the specific supersaturation and the specificsupercooling, were introduced. The dependences of thenormal growth rate on these parameters make it possi-ble to gain a deeper insight into different aspects of realcrystal growth processes, on the one hand, and can beused for evaluating the conditions of crystal formationand developing practical technological processes ofcrystal growth, on the other.
REFERENCES
1. Yu. K. Vorob’ev, Regularities of the Growth and Evolu-tion of Crystals of Minerals (Nauka, Moscow, 1990) [inRussian].
2. A. A. Chernov, in Modern Crystallography, Vol. 3: Crys-tal Growth, Ed. by B. K. Vainshtein, A. A. Chernov, andL. A. Shuvalov (Nauka, Moscow, 1980; Springer, Berlin,1984).
∂W /∂t KS h( )∂h/∂t.=
STALLOGRAPHY REPORTS Vol. 50 Suppl. 1 2005

CONCEPT OF SPECIFIC SUPERSATURATION S73
3. T. G. Petrov, E. B. Treivus, and A. P. Kasatkin, GrowingCrystals from Solution (Nedra, Leningrad, 1967; Con-sultants Bureau, New York, 1969).
4. E. B. Treœvus, Kinetics of Growth and Dissolution ofCrystals (Leningr. Gos. Univ., Leningrad, 1979) [in Rus-sian].
5. R. F. Strickland-Constable, Kinetics and Mechanism ofCrystallization (Academic, London, 1968).
6. B. Ya. Lyubov, Theory of Crystallization in Large Vol-umes (Nauka, Moscow, 1975) [in Russian].
7. E. V. Khamskii, Crystallization from Solutions (Nauka,Leningrad, 1967; Consultants Bureau, New York, 1969).
CRYSTALLOGRAPHY REPORTS Vol. 50 Suppl. 1 20
8. B. G. Ivanov, Zap. Leningr. Gorn. Inst. im. G. V. Plekh-anova LXXIV (2), 104 (1977).
9. B. G. Ivanov, V. N. Nikolaev, A. Turkbaev, andYu. P. Gudkov, in Advanced Materials and Technologies(GUP TsNII KM Prometeœ, St. Petersburg, 1999), p. 105[in Russian].
10. B. G. Ivanov and A. Turkbaev, in Problems of MaterialsScience (GUP TsNII KM Prometeœ, St. Petersburg,1999), p. 81 [in Russian].
11. B. G. Ivanov, Tr. Gos. Opt. Inst. 54 (188), 45 (1983).
Translated by O. Borovik-Romanova
05

Crystallography Reports, Vol. 50, Suppl. 1, 2005, pp. S74–S77.Original Russian Text Copyright © 2005 by Gus’kov, Orlov.
CRYSTALGROWTH
Model Calculation of Experimentally Observed Eutectic Structures
A. P. Gus’kov and A. D. OrlovInstitute of Solid State Physics, Russian Academy of Sciences,
Chernogolovka, Moscow oblast, 142432 Russiae-mail: [email protected]
Received February 3, 2005
Abstract—A model of directed crystallization is developed that considers the stability of the phase boundaryto periodic (temporal and spatial) temperature and concentration perturbations. In the case of instability, i.e.,increase in the amplitude of perturbations with time, the dependence of the eutectic structure period on the crys-tallization rate is determined from the model. A possible shape of the crystallization front and the structure ofthe solid phase formed are considered qualitatively. The corresponding model calculation of experimentallyobserved eutectic structures is presented. © 2005 Pleiades Publishing, Inc.
INTRODUCTION
Most modern studies devoted to the directed crystal-lization of eutectic alloys are based on the classicalstudy of Jackson and Hunt [1]. For example, Ginibreet al. [2] compared their experimental data on eutecticstructures with the calculations [3, 4]. In these studies,the Jackson–Hunt theory was used to analyze the rea-sons for the formation of eutectic structures of differenttypes.
In [5, 6], eutectic structures of different types wereobtained by the superposition of periodic temporaloscillations on the three-phase equilibrium point. TheJackson–Hunt theory was used to relate the crystalliza-tion rate, the structure period, and the temporal oscilla-tion frequency. The calculation of experimentallyobserved structures in [7] is based on the phase fieldtheory [8]. In this case, comparison with the theory [1]was also performed and the structures experimentallyobserved in [2, 3] were simulated.
In this study, using the solutions derived in [9], wecalculated the type of structure that was experimentallyobtained in [2]. The model of directed crystallizationwas developed in [9] on the basis of the perturbationtheory. The problem considers the stability of the phaseboundary to periodic (temporal and spatial) perturba-tions of temperature and concentration. Transformationof the solutions obtained in [9] from a curvilinear to arectangular coordinate system makes it possible to usethese solutions for model calculation of the crystalliza-tion front shape and the structure of the solid phaseformed.
THEORETICAL ANALYSIS
Solutions for the temperature and concentration dis-tributions in the liquid phase and the temperature distri-
1063-7745/05/5001-S $26.000074
bution in the solid phase were found in [9]. Within theproposed theory of directed crystallization, a dispersionequation was obtained by joint solution of the diffusionand heat-conduction equations for small perturbations.Numerical analysis of the dispersion equation made itpossible to find the expression for the period of temper-ature and concentration perturbations corresponding tothe maximum growth increment. The calculated andexperimental dependences of the structure period onthe crystallization rate were compared in [9]. In thisstudy, we attempted to simulate numerically not onlythe period of the structure but also its shape, i.e., thestructure of eutectic fibers formed during the directedcrystallization, taking into account both spatial andtemporal perturbation frequencies.
Furthermore, we carry out calculations on the basisof the solutions to the directed crystallization problemfound in [9].
Schematically, the complex solutions in a curvilin-ear coordinate system have the form [9]
(1)
(2)
where K = K1 + iK2, ω = ω1 + iω2, and Tm(z) and Cm(z)are complex quantities. TS(z) and CS(z) form a solutionto the steady-state problem and Tm(z) and Cm(z) form asolution to the problem of small perturbations.
To obtain the actual distribution pattern, we willseparate the real part of the solution and transform thesolutions from the curvilinear to the rectangular coordi-nate system. Then, we record all quantities in the realform. After these transformations, the solution to theheat-conduction equation has the form (bars denote therectangular coordinate system at rest and caps denote
T z y τ, ,( ) TS z( ) Tm z( ) Ky ωτ+( ),exp+ +=
C z y τ, ,( ) CS z( ) Cm z( ) Ky ωτ+( ),exp+=
© 2005 Pleiades Publishing, Inc.

MODEL CALCULATION OF EXPERIMENTALLY OBSERVED EUTECTIC STRUCTURES S75
010 20 30 40 50βα
10
20
30
40
50
50 6040302010000
50
100
150
200
α β
010 20 30 40 500
20
40
60
80
100
βα 00
5 10 15 20 25 30
20
40
60
80
100
α β
Fig. 1. Calculated eutectic structures obtained for different values of the calculation parameters: distributions of the component con-centration at the crystallization front and the crystallization front shape.
(a) (b)
(c)
(d)
the moving rectangular coordinate system)
(3)
where
The solution to the diffusion equation has the form
(4)
where
Here, ρT, ρC, aT, aC, , , bT, and bC are the coeffi-cients found from the solutions to the problem. The
T z y τ, ,( ) T z( )S T z( )m1+=
–∂T z( )S
∂z----------------
∂T z( )m1
∂z-------------------+
zb,
T z( )m1 bT K1y ω1τ aTz+ +( )exp=
× ρT aTi z K2y ω2τ+ + +( ).cos
C z y τ, ,( ) C z( )S C z( )m1+=
–∂C z( )S
∂z----------------
∂C z( )m1
∂z--------------------+
zb,
C z( )m1 bC K1y ω1τ aCz+ +( )exp=
× ρC aCi z K2y ω2τ+ + +( ).cos
aTi aC
i
CRYSTALLOGRAPHY REPORTS Vol. 50 Suppl. 1 2
small quantity characterizes the crystallization frontshape and is found from the implicit equation
(5)
Here,
(6)
(7)
The quantities Un, Sn, Wn, and Ln are constants. Thefunction f( , , ) is in essence a linear combinationof the solutions to the heat-conduction and diffusionequations. Solution (4) is summed with the same solu-tion containing the negative wave number (a similarprocedure is also carried out with solution (3)). Thisoperation is permissible because K = K1 + iK2 enters theequations of the directed crystallization problem only
zb
zb
f zb y τ, ,( )1 ξ+
------------------------.=
ξ ∂f zb y τ, ,( )∂z
--------------------------z zb=
,=
Un Snzb K1y ω1τ+ +( )exp1
5
∑× Wnzb Ln K2y ω2τ+ + +( )cos
= f zb y τ, ,( ).
zb y τ
005

S76 GUS’KOV, ORLOV
α β100 µm100 µm
α β
100 µm
α β50 µm
α β
Fig. 2. Experimentally observed structures corresponding to the calculated structures in Fig. 1.
(a) (b)
(c)
(d)
in the quadratic form. Solution (4) is valid for both pos-itive and negative K2; the sum of the solutions is also asolution to the problem. As a result, we have the solu-tion in the form
(8)
Here, h1 and h2 are arbitrary constants. The terms in thefirst and second square brackets are the solutions withpositive and negative values of K2, respectively. Expres-sion (8) makes it possible to calculate the concentrationat the boundary and thus to determine a possible struc-ture of the solid phase. The term in expression (8)has the form
(9)
C z y τ, ,( ) C zb( )S∂C z( )S
∂z----------------
z zb=
zb+=
+ h1 C zb( )m1∂C z( )m1
∂z--------------------
z zb=
zb–
+ h2 C zb( )m1∂C z( )m1
∂z--------------------
z zb=
zb– .
zb
zb
h1 f+
1 h1ξ++
--------------------h2 f
–
1 h2ξ–+
-------------------,+=
CRY
and ξ+ are described by Eqs. (6) and (7), respec-
tively, with positive K2, and and ξ– are described bythe same equations but with negative K2.
We should note the following. (i) Since we considerthe problem to be infinite in the y direction, we obtainfor large values of y (y ∞) at any K1 an infinitelylarge amplitude in solutions (3) and (4). Therefore, onthe basis of physical considerations (temperature andconcentration cannot be infinitely large), we equate K1to zero. (ii) The value of the temporal frequency(growth increment) ω1 allows us to determine whetherthe imposed perturbations will increase or decreasewith time [10]. However, in the model calculations weassume that the perturbation amplitude is determined(or limited) by real physicochemical processes. Hence,we equate ω1 to zero.
RESULTS AND DISCUSSION
On the basis of the correspondence with experimentfor the dependence of the eutectic structure period (i.e.,the wave number K2) on the crystallization rate, foundpreviously in [9, 11, 12], we assume that the frequen-
f+
f–
STALLOGRAPHY REPORTS Vol. 50 Suppl. 1 2005

MODEL CALCULATION OF EXPERIMENTALLY OBSERVED EUTECTIC STRUCTURES S77
cies of temporal and spatial perturbations do not changeduring the transition from initial small perturbations tothe developed steady-state process of eutectic crystalli-zation. Expression (8), with due regard for (9), gives themodel structures shown in Fig. 1. The correspondingexperimental structures are shown in Fig. 2.
The structure in Fig. 1a was calculated with the fol-lowing model parameters: C(zb) = 0.2cos(y + 0.3τ) isthe distribution of the component concentration at thecrystallization front and zb = 0.5cos(y + 0.3τ) is the cal-culated shape of the crystallization front. Figure 1b cor-responds to the model equations
C(zb) = sin(zb + y + 0.05τ) + 0.3sin(zb – y + 0.05τ),
zb = –cos(y + 0.05τ) – 0.3cos(y – 0.05τ);
Fig. 1c corresponds to the equationsC(zb) = –15cos(zb + y – 0.15τ) – 9cos(zb – y – 0.15τ),
zb = 0.7cos(y – 0.15τ) + 0.42cos(y + 0.15τ);
and Fig. 1d corresponds to the equationsC(zb) = |exp(2zb)sin(y + 0.05τ)
+ 0.1exp(2zb)sin(–y + 0.05τ)|,zb = |cos(y + 0.05τ) + 0.1cos(–y + 0.05τ)|
(the modulus in the latter expressions takes intoaccount the change in the sign of the slope of the liqui-dus line when it passes through the area of eutectic con-centration, on the assumption of the symmetric equilib-rium diagram [11]).
CONCLUSIONSWe have shown that the solutions to the directed
crystallization problem obtained here and previously
CRYSTALLOGRAPHY REPORTS Vol. 50 Suppl. 1 20
[9–12] make it possible to model experimentallyobserved eutectic structures. In this context, we suggestthat the reason for the formation of the structures underconsideration, as well as the classical (normal) eutecticstructures, is the instability of the phase boundary totemperature and concentration perturbations.
REFERENCES
1. K. A. Jackson and J. D. Hunt, Trans. Metall. Soc. AIME236, 1129 (1966).
2. M. Ginibre, S. Akamatsu, and G. Faivre, Phys. Rev. E 56,780 (1997).
3. A. Karma and A. Sarkissian, Metall. Mater. Trans. A27A, 635 (1996).
4. K. Kassner and C. Misbah, Phys. Rev. A 44, 6533(1991).
5. V. Datye and J. S. Langer, Phys. Rev. B 24, 4155 (1981).6. B. A. Wolfe Diesslin and W. T. Grayhack, Phys. Rev. B
50, 9111 (1994).7. S. G. Kim, W. T. Kim, T. Suzuki, et al., J. Cryst. Growth
261, 135 (2004).8. I. Steinbach and F. Pezzola, Physica D (Amsterdam)
134, 385 (1999).9. A. P. Gus’kov, Zh. Tekh. Fiz. 73 (5), 46 (2003) [Tech.
Phys. 48 (5), 569 (2003)].10. A. P. Gus’kov, Izv. Ross. Akad. Nauk, Ser. Fiz. 63 (9),
1772 (1999).11. A. P. Gus’kov and A. D. Orlov, Materialovedenie, No. 3,
150 (2004).12. A. P. Gus’kov, Pis’ma Zh. Tekh. Fiz. 27 (11), 86 (2001)
[Tech. Phys. Lett. 27 (6), 480 (2001)].
Translated by Yu. Sin’kov
05

Crystallography Reports, Vol. 50, Suppl. 1, 2005, pp. S78–S81.Original Russian Text Copyright © 2005 by Rashkovich, Petrova, Chernevich, Shustin, Chernov.
CRYSTALGROWTH
Non-Kossel Crystals: Calcium and Magnesium OxalatesL. N. Rashkovich*, E. V. Petrova*, T. G. Chernevich*, O. A. Shustin*, and A. A. Chernov**
* Faculty of Physics, Moscow State University, Leninskie gory, Moscow, 119992 Russiae-mail: [email protected]
** NASA, Huntsville, USAe-mail: [email protected]
Received February 7, 2005
Abstract—The rate of movement of elementary growth layers at faces of CaC2O4 · H2O and MgC2O4 · 2H2Ocrystals is measured in situ by atomic force microscopy under kinetic growth conditions at a constant supersat-uration with a varying excess of cations or anions in the solution. It is shown that, as the deviation of the
Ca2+/C2 (or Mg2+/C2 ) ratio from unity increases, the rate of movement of the growth layers decreasesabruptly and nonlinearly. A model describing this effect is discussed. © 2005 Pleiades Publishing, Inc.
O42– O4
2–
INTRODUCTION
This paper describes a model of growth of a crystalbuilt up of particles A and B (building units) formedupon dissociation of the compound AB and reports onthe results of the experimental verification of the pro-posed model. It is assumed that the density of kinks atthe steps bounding the elementary growth layers is rel-atively low, which is typical of poorly soluble crystals.Experimental investigations into the influence of thecomposition of the solution (the deviation of theamount of A and B from the stoichiometric composi-tion) on the crystallization kinetics are few in number,and their results have not made it possible to reveal anyregularities. Studies pertinent to the problem arereviewed in [1, 2].
THEORY
The normal growth rate of crystal faces with a lowdensity of kinks is determined by the rate of movementof steps V, which depends on the rate of movement vand on the density ρ of the kinks. Arrival of a kink to aparticular point of a step means that it has moved for-ward at a distance of b equal to the distance between therows of the building units. Therefore, we can write
(1)
For a Kossel crystal (A ≡ B), the rate of movementof a kink has the form
(2)
where ω+ and ω– are the frequencies of attachment ofthe particles to the kink and their detachment from it,respectively, and a is the distance between the buildingunits in the step. The supersaturation of a solution isdefined as s = ω+/ω– – 1. Hence, we can write v = aω–sand ω+/ω– = C/C0, where C and C0 are the actual and
V bρv .=
v a ω+ ω––( ),=
1063-7745/05/5001-S $26.000078
equilibrium concentrations of the solution, respec-tively.
The expression for the rate of movement of thekinks, which alternatively include particles A and B,was derived independently by different authors withindifferent approaches [1–6]:
(3)
Let us now change over from the frequencies to theactivities of the components in the solution. From theexpression ω+A = νexp(µLA + E+A)/kT (where µLA =kTlnaA + ϕ is the chemical potential of particle A in thesolution, aA is the activity of particle A in the solution,ϕ is a function independent of the concentration, and νis the characteristic frequency of attempts to overcomethe potential barrier EA), we can easily obtain ω+A = fAaA(where fA is a constant). A similar expression can bederived for the frequency of attachment ω+B for particleB. The frequencies of detachment can be expressed bythe formulas ω–A = fAaAe and ω–B = fBaBe, where aAe andaBe are the activities of particles A and B in the saturatedsolution, respectively. As a first approximation, we canassume that fA = fB = f. Then, expression (3) takes theform
(4)
The product of the activities K = aAeaBe is a constant.Let us introduce the designation Π = aAaB. Then, thesupersaturation can be represented as
s = (Π/K)1/2 – 1. (5)
The isotherm of solubility of the AB compound isschematically shown in Fig. 1. Let aA and aB be thecoordinates of the composition of the supersaturated
v 2 faω+Aω+B ω–Aω–B–
ω+A ω+B ω–A ω–B+ + +-------------------------------------------------------.=
v 2 faaAaB aAeaBe–
aA aB aAe aBe+ + +---------------------------------------------.=
© 2005 Pleiades Publishing, Inc.

NON-KOSSEL CRYSTALS: CALCIUM S79
solution. In the course of crystallization from this solu-tion, the composition of the liquid changes along thestraight line forming an angle of 45° with the axes ofcoordinates and connecting the point corresponding tothe initial composition of the solution and the point ascharacterizing the composition of the solution at agiven instant of crystallization, i.e., at an excess (rela-tive to stoichiometric) content of component A in water.It is seen from Fig. 1 that as = aA – aB = aAe – aBe. There-fore, we can write the relationship
(6)
Then, the expression for the rate of movement of thekinks takes the form
(7)
Designating ε1 = aA/aB and ε2 = aAe/aBe, we obtain
(8)
Taking into account relationship (5), expression (7) canbe rewritten as
(9)
Using relationship (6) and the specified values of s andε1, we obtain ε2:
(10)
For a solution of the stoichiometric composition(i.e., the solution containing A and B in stoichiometricamounts), we have ε1 = ε2 = 1. Then, from expression(9), we obtain formula (2); that is, v = af(K)1/2s =afaAes = aω–s = a(ω+ – ω–). Note also that, althoughexpressions (9) and (6) are derived by assuming thataA > aB, they remain unchanged in the reverse casewhen ε1 = aB/aA > 1. To put it differently, the depen-dence v(ε1) is symmetric with respect to the deviationof the composition of the solution from stoichiometryin both directions and, hence, there is a special point onthe curve at ε1 = 1.
Thus, at a constant supersaturation, the rate ofmovement of the kinks should proportionally decreaseas the composition of the solution deviates from sto-ichiometry. Moreover, the quantity 1/v should be a lin-ear function of the denominator in expression (9).These two inferences can be verified experimentally bymeasuring the rate of movement of the steps V [see rela-tionship (1)] under the assumption that the density of
aA aBe+ aAe aB.+=
v afΠ K–
aA aBe+-------------------.=
aA Πε1( )1/2, aB Π /ε1( )1/2,= =
aAe Kε2( )1/2, aBe Π /ε2( )1/2.= =
v af K( )1/2 s s 2+( )
s 1+( ) ε1 ε21–+
-------------------------------------------.=
ε2 1/2 s 1+( ) ε1 ε11––( )=
× 1 4
s 1+( )2 ε1 ε11––( )
2---------------------------------------------------+ 1+ .
CRYSTALLOGRAPHY REPORTS Vol. 50 Suppl. 1 20
kinks weakly depends on the stoichiometry of the solu-tion.
EXPERIMENTAL TECHNIQUE
The experiments were performed on crystal faces ofcalcium oxalate monohydrate CaC2O4 · H2O (COM)and magnesium oxalate dihydrate MgC2O4 · 2H2O(MOD). Samples in the form of 10- to 30-µm crystalswere prepared according to a procedure similar to thatdescribed in [7]. The products of the activities KCOM
and KMOD were 2.0 × 10⁻⁹ and 4.83 × 10⁻⁶ (mol/l)2,respectively. The quantity ε was taken equal to the ratioof the cation activity to the anion activity. The activitycoefficient γ calculated from the standard Debye–Hückel formula for diluted solutions was equal to 0.33.The rate of movement of steps V was measured in situunder kinetic growth conditions provided by pumpinga supersaturated solution along the studied face (thequantity V did not depend on the flow rate). The mea-surements were performed using a Nanoscope 3atomic-force microscope. The shape of the dislocationgrowth hillocks is seen in the AFM images displayed inFig. 2.
The rate of movement of steps V as a function of thenonstoichiometry of the solution at a constant supersat-uration is presented in Fig. 3. It is seen that the pointscorresponding to ε > 1 and ε < 1 fall on the same curve.Similar dependences were obtained for different facesand directions of movement of the steps.
Figure 4 shows the dependences depicted in Fig. 3after their linearization according to formula (9). It canbe seen that the experimental points are in good agree-ment with theory.
ap aAe a'A aA, mol/l
aB, mol/l
a'B
a'Be
Fig. 1. Schematic isotherm of solubility of the AB com-pound. The curve K = aAeaBe is shown.
05

S80 RASHKOVICH et al.
(‡)
(b) (c)
1 µm 1 µm
Fig. 2. (a) The (010) face of CaC2O4 · H2O. The step height is equal to one-half the lattice parameter (0.73 nm). (b) The (010) faceof MgC2O4 · 2H2O. The step height is equal to the lattice parameter (0.54 nm). Conditions: s = 2, [Mg]/[Ox] = (b) 1 and (c) 5.
DISCUSSION
This study is not faultless. Below, we note the short-comings of the experiment and the limitations of themodel.
Experiment. The supersaturation was calculatedunder the assumption that the compounds are com-
5 10 15 20[Ca]/[Ox]
10
20
30
40
50V, nm/s
2 3 4 5[Mg]/[Ox]
4
6
8
10
12
14
1
(a)
(b)
Fig. 3. Influence of the nonstoichiometry of the solution onthe rate of movement of steps for (a) CaC2O4 · H2O crystalsat s = 5.633 (Π/K = 44) and (b) MgC2O4 · 2H2O crystals ats = 2.0 (Π/K = 9). Arrows indicate points for which the val-ues plotted along the abscissa axis are equal to the ratio ofthe anion activity to the cation activity.
CRY
pletely dissociated. This is obviously not the case: therecan exist dissolved complexes that involve a large num-ber of ions of the oxalate, calcium, or magnesium.Unfortunately, we have not found thermodynamic datanecessary for the appropriate calculations. Therefore,we cannot be sure in the constancy of the supersatura-tion s as the stoichiometry of the solution changes.
5 10 15 20(S + 1)([Ca]/[Ox])1/2 + (1/e2)1/2
0.04
0.08
0.12
0.16
1/V, s/nm(a)
0
0.20
25 30
11/2
1/4
1/10
101/20
20
4.0 4.5 5.0 5.5(S + 1)([Mg]/[Ox])1/2 + (1/e2)1/2
0.10
0.14
0.18
(b)
0
0.26
6.0 7.0
1
1/2
1/5
0.22
6.5
2
5
Fig. 4. The data presented in Fig. 3 after their linearizationaccording to formula (9). The values of ε2 were calculatedfrom formula (10) for (a) CaC2O4 · H2O crystals at s =5.633 and (b) MgC2O4 · 2H2O at s = 2. The numerals nearthe experimental points indicate the activity ratio of thecomponents in the solution.
STALLOGRAPHY REPORTS Vol. 50 Suppl. 1 2005

NON-KOSSEL CRYSTALS: CALCIUM S81
Model. In an ideal solution, the frequencies ofdetachment ω– depend only on the temperature. Theconsequences following from this fact were describedin [6]. A question arises as to whether the frequenciesof detachment ω– in our case can be considered to bedependent on the ratio of the components in the solu-tion. We have no answer to this question.
Another question arises as to whether the density ofkinks depends on the composition of the solution. Asthe concentration of the oxalate ions (the point ap inFig. 1) increases, the solubility of the salts decreases,which should lead to an increase in the surface freeenergy of the step rises [8] and to a decrease in the den-sity of kinks ρ. This effect is actually observed (Fig. 2):as the nonstoichiometry increases, the steps becomeless rough and more polygonized. A similar phenome-non is observed with decreasing supersaturation s. Sofar, we have failed to measure the density of kinks andto take into account the above effect.
The unit cell of CaC2O4 · H2O contains two crystal-lographically independent oxalate anions and calciumcations. Therefore, the crystal cannot be built of twotypes of particles. In this case, we should take intoaccount that particles A1 and A2, as well as particles B1and B2, are not equivalent to each other. An appropriatemodel has not been developed yet.
CRYSTALLOGRAPHY REPORTS Vol. 50 Suppl. 1 2
ACKNOWLEDGMENTS
This study was supported by the Russian Founda-tion for Basic Research, project no. 03-02-16113.
REFERENCES
1. J. Zhang and G. H. Nancollas, J. Colloid Interface Sci.200, 131 (1998).
2. A. V. Nardov and S. V. Moshkin, in Crystallography andCrystal Chemistry (Leningrad State University, Lenin-grad, 1982), No. 4, pp. 42–46 [in Russian].
3. A. A. Chernov, Usp. Fiz. Nauk 100, 277 (1970) [Sov.Phys. Usp. 13 (1), 101 (1970)].
4. A. E. Nielsen, Pure Appl. Chem. 53, 2025 (1981).
5. A. A. Chernov, J. Mater. Sci.: Mater. Electron. 12, 437(2001).
6. A. A. Chernov, L. N. Rashkovich, and P. G. Vekilov,J. Cryst. Growth 275, 1 (2005).
7. N. V. Gvozdev, E. V. Pertova, T. G. Chernevich, et al.,J. Cryst. Growth 261, 539 (2004).
8. O. Sohnel, J. Cryst. Growth 57, 101 (1982).
Translated by I. Polyakova
005

Crystallography Reports, Vol. 50, Suppl. 1, 2005, pp. S82–S87.Original Russian Text Copyright © 2005 by Vorontsov, Portnov, Chuprunov.
CRYSTALGROWTH
Effect of Impurity Adsorption on the Growthof Rochelle Salt Crystals
D. A. Vorontsov, V. N. Portnov, and E. V. ChuprunovNizhni Novgorod State University, pr. Gagarina 23, Nizhni Novgorod, 603950 Russia
e-mail: [email protected] February 3, 2005
Abstract—The influence of impurities of copper compounds on the growth of Rochelle salt crystals of thecomposition KNaC4H4O4 · 4H2O is studied. The growth rates of the faces of various simple forms experimen-tally measured as functions of the CuCO3 concentration in solution at a constant supersaturation and tempera-ture are compared with the theoretical models of impurity adsorption on the faces of a growing crystal. Decel-eration of the growth of various faces of a Rochelle salt crystal is satisfactorily described by the Bliznakov equa-tion with the use of the Langmuir, Frumkin–Fowler, and de Boor adsorption isotherms for all the faces exceptfor 010. However, such a comparison does not allow one to reveal the cause of adsorption or its type on dif-ferent faces. Photometric scanning of Rochelle salt solutions with copper-compound impurity showed that asmall addition of alkali (0.06–0.4 g/l) to the solution results in the appearance in the absorption spectra of boththe solution and the crystal grown from it of a maximum at the wavelength 660–670 nm. The intensity of thismaximum increases with an increase in the copper concentration. The EPR data, the absorption spectra of the solu-tion and the crystal, and the modified crystal shape showed that the addition of alkali to the solution results in theformation of new copper complexes that more actively decelerate the growth of Rochelle salt faces. © 2005 Ple-iades Publishing, Inc.
INTRODUCTION
The influence of impurities on crystal growth hasbeen studied for a long time. First, one observed thechanges in crystal shape caused by the presence ofimpurities in the solutions [1]. Then, the growth rates ofvarious crystal faces were measured [2], which allowedone to compare the theoretical and experimental data[3, 4].
The effect of impurity adsorption manifests itself atlow concentrations without noticeable changes in thesolution state. The impurity adsorption is characterizedby selectivity, fall of the growth-rate curves dependenton impurity concentration, and the reduction of thiseffect with an increase in temperature.
High selectivity of the effect is observed for variousdyes. Thus a direct light-blue dye strongly deceleratesgrowth only of the 100 faces of a cube in potassiumalum, the 101 faces of a bipyramid in potassiumdihydrogen phosphate (KDP) crystals, and the 010faces of the pinacoid in Rochelle salt crystalsKNaC4H4O6 · 4H2O. A decrease in the growth rate ofthese faces is accompanied by the dye capture by thecorresponding growth sectors [5, 6].
In many instances, the impurity compounds intro-duced into the solution become the basis for the forma-tion of new active impurities, with their compositionand activity varying with the concentration of the mainsubstance, solution pH, etc. [7, 8]. It has repeatedlybeen indicated that knowledge of the solution state and
1063-7745/05/5001-S $26.000082
the structure of impurity particles is necessary fordetermining the mechanism of impurity effect on crys-tal growth [9].
It has been indicated [1] that the most pronouncedchanges in the shape of Rochelle salt crystals observedin the presence of Cu2+ ions are explained by a decreasein the growth rate of the 001 and 210 faces. As aresult, in the [001] zone, the 210 faces prevail and,thus, the grown crystal is rather short along the c axis.Irrespective of which of the Cu2+-containing salts isused to introduce the Cu2+ ions into the solution, theeffect observed is always associated with these ions[10]. The addition to the solution of copper carbonate,CuCO3, decelerates the growth of 001 faces andgives rise to the formation of a platelike habit. The⟨001⟩ growth sectors acquire a blue color, which indi-cates the incorporation of copper ions into the crystal.An analogous effect is also produced by copper vitriol,CuSO4 · 5H2O, and copper hydroxide, Cu(OH)2.
The effect of the impurities mentioned above maybe multiply increased by an additional introduction intothe solution of NaOH or KOH alkali. The addition tothe solution of a small amount of CuCO3 (2 g/l) reducesthe crystal dimension along the c axis by a factor ofabout 2. The same effect may also be achieved at a con-siderably lower CuCO3 concentration by adding to thesolution a small amount of alkali. On the contrary, theeffect of CaCO3 is weakened by adding to the solutiona small amount of the H2SO4 acid. The influence of thealkali addition manifests itself especially pronouncedly
© 2005 Pleiades Publishing, Inc.

EFFECT OF IMPURITY ADSORPTION S83
in the case of the CuSO4 · 5H2O impurity. To reduce thecrystal length along the c axis by a factor of 2, one hasto add to the solution either 20 g/l of CuSO4 · 5H2O oronly 0.2 g/l of CuSO4 · 5H2O in the presence in thesolution also of 2 g/l NaOH. It is assumed [10] that thiseffect is explained by an increase in the adsorbingpower of crystal faces because of an increase in solu-tion pH.
The present study was undertaken to measure thegrowth rates of different faces of a Rochelle salt crystalin the presence of Cu2+ ions and to compare the resultsobtained with the theoretical data. We also studied thechanges of impurities in the solution.
MEASUREMENTS OF GROWTH RATES OF CRYSTAL FACES
To obtain quantitative data on the influence of cop-per ions on growth rate, we measured the growth ratesof the faces of Rochelle salt spheres in the case wherethe solution contained the CuCO3 addition. Figure 1shows the shape of a Rochelle salt crystal grown frompure solution. Figure 2 shows the stereographic projec-tion of this crystal with the indication of the faceswhose growth rates were measured.
The measurements were performed at the absolutesupersaturation 20 g/l and for a planetary rotation ofspheres with a frequency 60 rev/min at the temperature20°C. The growth rates of different faces thus measuredare indicated in Fig. 3. The accuracy of the determina-tion was ∆R = ±0.1 mm/h. The growth rates of the facesas functions of impurity content in the solution rapidlydecrease and tend to a certain constant value. Only thecurve for the 010 face turned out to be nonmono-tonic. The impurity acts selectively: the most pro-nounced influence of impurity is observed on the 001and 210 faces.
It is seen from Fig. 3 that at low CuCO3 concentra-tions (up to 0.4 g/l), the grown crystals have a platelikehabit, because the 001 faces have relatively lowgrowth rates. In this case, the 210 faces of the rhom-bic prism and the 010 faces of the pinacoid are themost pronounced. At a higher impurity content, thecrystal becomes faceted mainly with the 001 and210 faces. Our growth experiments confirm theseconclusions.
BLIZNAKOV EQUATION AND ADSORPTION ISOTHERMS
To describe the growth rates of the faces, R, as func-tions of impurity concentration in the solution andimpurity adsorption one usually invokes the Bliznakovequation [3, 11]
(1)R R0 1 αθ–( ),=
CRYSTALLOGRAPHY REPORTS Vol. 50 Suppl. 1 20
where R0 is the growth rate of a face in the absence of
impurity, α = , R∞ is the steady-state growth
rate at high impurity content, and θ is the occupancy ofthe growth sites with impurity particles. The quantity αcharacterizes the efficiency of the impurity effect.
R0 R∞–R0
------------------
a
a
b
b
210
110
001
110100 210
010
c
c
Fig. 1. Shape of a Rochelle salt crystal grown from puresolution.
001
101011
021
(120)
(110)
(210)
(100)
(210)
(110)
(120)
(010)(120)
(110)
(210)
(100)
(210)
(110)
(120)
(010)
Fig. 2. Stereographic projection of a Rochelle salt crystal.
05

S84
VORONTSOV
et al
.
If the surface is covered with adsorbed two-dimen-sional islands of impurity, the quantity θ signifies thefraction of the surface covered with the impurity film.
The degree of adsorption is described by the adsorp-tion isotherms. One such isotherm is the Langmuiradsorption isotherm
(2)
where C is the impurity concentration in the mediumand k is the adsorption constant equal to
where ϕAB is the adsorption energy. The use of Eqs. (1)and (2) allows one to interpret the curves of the growthrate of the faces of MgSO4 · 7H2O in the presence ofborax and NaClO3 in the presence of Na2SO4 [11]. Itwas assumed that in this case adsorption occurs atkinks.
Another isotherm taking into account the mutualattraction of impurity molecules in the adsorbed stateand the surface diffusion was suggested by de Boor
(3)
where k1 is the adsorption constant and k2 is the coeffi-cient taking into account the interaction between theimpurity molecules. In this case, adsorption of impuritymolecules may be accompanied by the formation of
θ Ck C+-------------,=
k k0ϕAB
kT--------–
,exp=
C k1θ
1 θ–------------ θ
1 θ–------------ k2θ–
,exp=
0 0.4 0.8 1.2 1.6
0.025
0.075
0.125
0.175
0.225
0.275
R, mm/h
(001)(210)
(100)
(110)
(011)(010)
(120)(101)
(021)
C, g/l
Fig. 3. Change in the growth rates of different faces of aRochelle salt crystal depending on the CuCO3 concentra-tion in the solution.
CRY
groups and islands. The critical k2 value of the begin-ning of two-dimensional impurity condensation equals6.75.
There is another type of adsorption accompanied bythe formation of two-dimensional coatings without sur-face migration of impurity molecules. The correspond-ing isotherm was obtained by Frumkin and Fowler [13]
(4)
where is the coefficient of adsorption strength and
is the quantity taking into account interactions ofimpurity molecules in the adsorbed state. Here, the crit-ical value of equals 4. Obviously, one has to use theabove isotherms with certain precautions, because,sometimes, the data obtained from these isotherms areinconsistent with the experimentally measured ones.
COMPARISON OF THEORETICALLY CALCULATED AND MEASURED DATA
The experimental curves of growth-rates of differentfaces (Fig. 3) may be represented by the equationobtained by substituting Eq. (2) into Eq. (1) and linear-ized to the form
(5)
The experimental points allow one to determine kand α values. The errors in their determination arewithin 15–20%.
The above equation satisfactorily describes theexperimental growth-rate curves for the 001, 101,011, 120, and 021 faces. However, Eq. (5) isinapplicable to the 100, 110, and 210 facesbecause the growth-rate curves of these faces haveinflection points.
It follows from Eq. (2) and table that, with anincrease in the impurity concentration in the solution,coverage θ attains its saturation the faster, the lower thek value, i.e., the higher the adsorption energy of theimpurity. It seems that, with an increase in the adsorp-tion energy, the efficiency of the impurity influence αshould have also increased. However, in our case, it isnot so. Thus, for the 021 face, the k value is minimaland, at the same time, the α value is also minimal. Thesmallness of α may be explained under the assumptionthat the growth sites on the face may be divided intoseveral groups. Then Eq. (1) takes the form
(6)
where ν is the number of the groups, ni is the fraction ofthe sites of the ith group, and θ is coverage. In this case
= 1.
C k1'θ
1 θ–------------ k2' θ–( ),exp=
k1'
k2'
k2'
R0
R0 R–---------------
kα--- 1
C---- 1
α---.+=
R R0 1 niθi
i 1=
ν
∑–
,=
nii 1=ν∑
STALLOGRAPHY REPORTS Vol. 50 Suppl. 1 2005
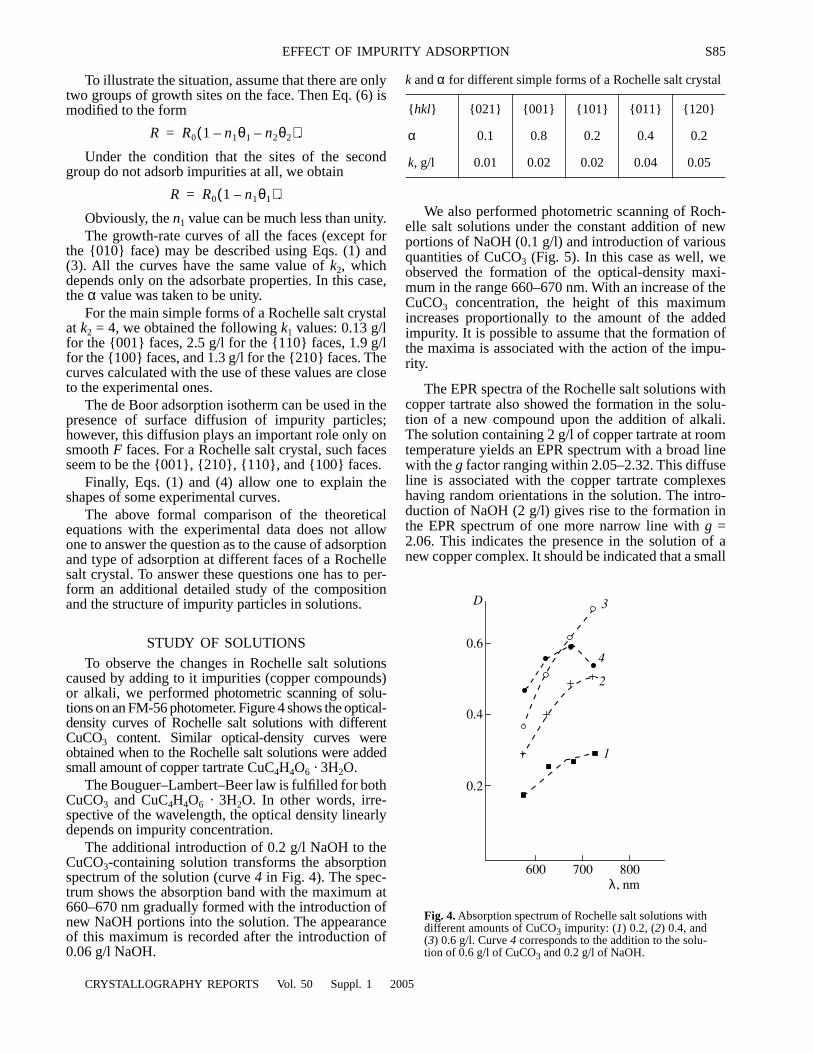
EFFECT OF IMPURITY ADSORPTION S85
To illustrate the situation, assume that there are onlytwo groups of growth sites on the face. Then Eq. (6) ismodified to the form
Under the condition that the sites of the secondgroup do not adsorb impurities at all, we obtain
Obviously, the n1 value can be much less than unity.The growth-rate curves of all the faces (except for
the 010 face) may be described using Eqs. (1) and(3). All the curves have the same value of k2, whichdepends only on the adsorbate properties. In this case,the α value was taken to be unity.
For the main simple forms of a Rochelle salt crystalat k2 = 4, we obtained the following k1 values: 0.13 g/lfor the 001 faces, 2.5 g/l for the 110 faces, 1.9 g/lfor the 100 faces, and 1.3 g/l for the 210 faces. Thecurves calculated with the use of these values are closeto the experimental ones.
The de Boor adsorption isotherm can be used in thepresence of surface diffusion of impurity particles;however, this diffusion plays an important role only onsmooth F faces. For a Rochelle salt crystal, such facesseem to be the 001, 210, 110, and 100 faces.
Finally, Eqs. (1) and (4) allow one to explain theshapes of some experimental curves.
The above formal comparison of the theoreticalequations with the experimental data does not allowone to answer the question as to the cause of adsorptionand type of adsorption at different faces of a Rochellesalt crystal. To answer these questions one has to per-form an additional detailed study of the compositionand the structure of impurity particles in solutions.
STUDY OF SOLUTIONSTo observe the changes in Rochelle salt solutions
caused by adding to it impurities (copper compounds)or alkali, we performed photometric scanning of solu-tions on an FM-56 photometer. Figure 4 shows the optical-density curves of Rochelle salt solutions with differentCuCO3 content. Similar optical-density curves wereobtained when to the Rochelle salt solutions were addedsmall amount of copper tartrate CuC4H4O6 · 3H2O.
The Bouguer–Lambert–Beer law is fulfilled for bothCuCO3 and CuC4H4O6 · 3H2O. In other words, irre-spective of the wavelength, the optical density linearlydepends on impurity concentration.
The additional introduction of 0.2 g/l NaOH to theCuCO3-containing solution transforms the absorptionspectrum of the solution (curve 4 in Fig. 4). The spec-trum shows the absorption band with the maximum at660–670 nm gradually formed with the introduction ofnew NaOH portions into the solution. The appearanceof this maximum is recorded after the introduction of0.06 g/l NaOH.
R R0 1 n1θ1– n2θ2–( ).=
R R0 1 n1θ1–( ).=
CRYSTALLOGRAPHY REPORTS Vol. 50 Suppl. 1 20
We also performed photometric scanning of Roch-elle salt solutions under the constant addition of newportions of NaOH (0.1 g/l) and introduction of variousquantities of CuCO3 (Fig. 5). In this case as well, weobserved the formation of the optical-density maxi-mum in the range 660–670 nm. With an increase of theCuCO3 concentration, the height of this maximumincreases proportionally to the amount of the addedimpurity. It is possible to assume that the formation ofthe maxima is associated with the action of the impu-rity.
The EPR spectra of the Rochelle salt solutions withcopper tartrate also showed the formation in the solu-tion of a new compound upon the addition of alkali.The solution containing 2 g/l of copper tartrate at roomtemperature yields an EPR spectrum with a broad linewith the g factor ranging within 2.05–2.32. This diffuseline is associated with the copper tartrate complexeshaving random orientations in the solution. The intro-duction of NaOH (2 g/l) gives rise to the formation inthe EPR spectrum of one more narrow line with g =2.06. This indicates the presence in the solution of anew copper complex. It should be indicated that a small
k and α for different simple forms of a Rochelle salt crystal
hkl 021 001 101 011 120
α 0.1 0.8 0.2 0.4 0.2
k, g/l 0.01 0.02 0.02 0.04 0.05
600 700 800λ, nm
0.2
0.4
0.6
D
Fig. 4. Absorption spectrum of Rochelle salt solutions withdifferent amounts of CuCO3 impurity: (1) 0.2, (2) 0.4, and(3) 0.6 g/l. Curve 4 corresponds to the addition to the solu-tion of 0.6 g/l of CuCO3 and 0.2 g/l of NaOH.
1
2
3
4
05

S86 VORONTSOV et al.
number of these complexes is also contained in thesolution without NaOH because of the high pH charac-teristic of the Rochelle salt solution, pH 8.2.
The latter conclusion is confirmed by the growthexperiments on KNaC4H4O6 · 4H2O single crystals.Single crystals obtained from the solutions with 0.1 and0.3 g/l CuCO3 change their shape in such a way that thec/b ratio becomes equal to 0.9 and 0.6, respectively. Forcrystals grown from pure solution, this ratio equalsunity. The addition to these solutions of a small amountof alkali (2 g/l) considerably enhances the impurityactivity. The c/b ratios become equal to 0.6 and 0.3,respectively.
Similar changes in the shape of Rochelle salt crys-tals were also observed with the introduction into thesolution of copper tartrate. Moreover, the optical-den-sity curves measured for crystals grown from the solu-tions containing copper carbonate and copper tartrate,either with or without the addition of alkali, had thesame shape. The absorption bands of crystals and thecorresponding solutions also coincided (660–670 nm).
CONCLUSIONS
The measurements of the growth rates of differentfaces and observation of the growth form of the crystalfaces of Rochelle salt crystals of the compositionKNaC4H4O6 · 4H2O indicate the adsorption mechanismof impurity action. The growth-rate curves of differentfaces of a Rochelle salt crystal obtained at differentimpurity concentrations are approximately describedby the Bliznakov equation with the use of differentadsorption isotherms.
At the same time, the establishment of the mecha-nism of impurity action requires a knowledge of thestructure of impurity particles in the solution.
The growth of crystals, absorption spectra of thesolutions and crystals, and also their EPR spectra pro-vide evidence that the introduction into solution of
600 700 800λ, nm
0.2
0.4
D
1
2
3
Fig. 5. Absorption spectrum of Rochelle salt solutions withdifferent amounts of CuCO3 impurity at a constant NaOHconcentration: (1) 0.1, (2) 0.23, and (3) 0.40 g/l.
CRY
alkali results in the formation of Cu2+ new complexes.Thus, the assumption about an increase in the adsorp-tive capacity of the faces a Rochelle salt crystal with theaddition to the solution of alkali [10] is not confirmedby our experiments.
It is highly probable that the addition of alkali to thesolution results in the formation of hydroxy complexesof the Cu(OH)n(H2O)6 – n type [14]. These complexesare also present in the solution without alkali because ofthe high pH of a Rochelle salt solution. The addition ofalkali to the solution increases the amount of this impu-rity, which is adsorbed by the faces and, thus, deceler-ates crystal growth. Possibly, some kinks are poisonedwith certain complexes or form coatings of impuritygroups or islands.
The similar absorption spectra of solutions and crys-tals grown from these solutions show that copper com-plexes, which are active impurities, from the solutionare incorporated into the crystal structure with a some-what changed arrangement of surrounding Cu2+ ions.
The EPR spectra of a Rochelle salt crystalKNaC4H4O6 · 4H2O doped with Cu2+ ions show thatthese ions occupy the sites of Na+ ions in the structure[15] and are coordinated with two oxygen ions, onehydroxyl ion, and three water molecules. Therefore therole of the active complex in a Rochelle salt solutionmay be played by the complex of the composition[Cu(OH)(H2O)5]1+. Perhaps tartrate copper complexesof two different types are also active complexes in thesolutions.
Thus, the structure of impurities in the solution mayreadily be changed. This, in turn, changes the quantita-tive ratio between active and inactive impurity mole-cules. The change in the main-component concentra-tion, pH, and temperature as well as the introductioninto the solution of other compounds displace thechemical equilibrium in the solution. Our study illus-trates once again the complex nature of the impurityeffect on crystal growth from solutions.
REFERENCES
1. H. Buckley, Crystal Growth (Wiley, New York, 1951;Inostrannaya Literatura, 1954).
2. V. A. Mokievskiœ and I. A. Mokievskaya, Zap. Vses.Mineral. O–va 39 (1), 15 (1956).
3. G. M. Bliznakov, Kristallografiya 4 (3), 150 (1959) [Sov.Phys. Crystallogr. 4 (3), 134 (1959)].
4. N. Cabrera and D. A. Vermilyea, Growth and Perfectionof Crystalls (Plenum, New York, 1958), p. 393.
5. V. N. Portnov, Kristallografiya 11 (6), 916 (1966) [Sov.Phys. Crystallogr. 11 (6), 774 (1966)].
6. V. N. Portnov, A. V. Rykhlyuk, and A. V. Belyustin, Kri-stallografiya 14 (6), 1093 (1969) [Sov. Phys. Crystallogr.14 (6), 954 (1969)].
STALLOGRAPHY REPORTS Vol. 50 Suppl. 1 2005

EFFECT OF IMPURITY ADSORPTION S87
7. T. G. Petrov, E. B. Treivus, and A. P. Kasatkin, GrowingCrystals from Solution (Nedra, Leningrad, 1967; Con-sultants Bureau, New York, 1969).
8. V. N. Portnov and A. V. Belyustin, Kristallografiya 10(3), 362 (1965) [Sov. Phys. Crystallogr. 10 (3), 231(1965)].
9. A. A. Chernov, L. N. Rashkovich, I. L. Smol’skiœ, et al.,in Crystal Growth (Nauka, Moscow, 1986), Vol. 15, p. 43[in Russian].
10. A. V. Belyustin, in Crystal Growth (Nauka, Moscow,1964), Vol. 4, p. 10 [in Russian].
11. G. M. Bliznakov, Coll. Int. Cancer Res. (Paris), No. 152,291 (1965).
CRYSTALLOGRAPHY REPORTS Vol. 50 Suppl. 1 20
12. J. H. de Boer, The Dynamical Character of Adsorption(Clarendon Press, Oxford, 1953; Inostrannaya Lite-ratura, Moscow, 1962).
13. R. Kern, in Crystal Growth (Nauka, Moscow, 1968),Vol. 8, p. 5 [in Russian].
14. E. A. Buketov, M. Z. Ugorets, and K. M. Akhmetov,Dehydration of Metal Hydrates in Alkaline Solutions(Nauka Kazakhskoœ SSR, Alma-Ata, 1971) [in Russian].
15. G. Volkel and W. Windsch, Phys. Status Solidi 17 (1), 75(1966).
Translated by L. Man
05

Crystallography Reports, Vol. 50, Suppl. 1, 2005, pp. S88–S91.Original Russian Text Copyright © 2005 by Yavetski
œ
, Dolzhenkova, Dubovik, Korshikova, Tolmachev.
CRYSTALGROWTH
Growth of Single Crystals of Li6Y1 – xEux(BO3)3 (x = 0–1) Solid Solutions by the Czochralski Method
R. P. Yavetskiœ, E. F. Dolzhenkova, M. F. Dubovik, T. I. Korshikova, and A. V. Tolmachev
Institute for Single Crystals, National Academy of Sciences of Ukraine, pr. Lenina 60, Kharkov, 61001 Ukraine
e-mail: [email protected] February 8, 2005
Abstract—The mutual solubility in the Li6Y(BO3)3–Li6Eu(BO3)3 system was investigated by differential ther-mal analysis and X-ray phase analysis. Single crystals of the Li6Y1 – xEux(BO3)3 solid solutions more than1 cm3 in volume were grown by the Czochralski method. The photoluminescence and thermoluminescenceproperties of the crystals grown are studied. © 2005 Pleiades Publishing, Inc.
INTRODUCTION
In view of the intense development of neutron-basedtechniques, the problem of measuring neutron fluxes isfairly urgent. This problem can be solved by both thescintillation method and solid-state dosimetry [1]. Inthis context, one of the intensively developed scintilla-tion materials is cerium-activated lithium–gadoliniumborate Li6Gd(BO3)3 : Ce (LGBO : Ce), which containsGd, B, and Li—elements with high selective sensitivityto thermal neutrons [2–6]. Variation in the isotopiccomposition of this compound makes it possible toreach a high theoretical light yield: S = 59600 pho-tons/neutron [2]. A drawback of LGBO is the largeeffective atomic number (Z = 46), which is responsiblefor the sensitivity of this material to gamma radiationand impedes its application in mixed n/γ fields. The useof the isostructural lithium–yttrium borate Li6Y(BO3)3: Ce (LYBO : Ce) makes it possible to decrease the sen-sitivity to gamma background (Z = 26), although thisleads to some decrease in the thermal-neutron capturecross section [3]. It was shown in [7, 8] that LGBO:Ceand LYBO:Ce cannot be used in solid-state dosimetrybecause of their low thermally-stimulated lumines-cence (TSL) yield. Doping of LGBO:Ce with sodiumor magnesium increases the TSL yield by more than anorder of magnitude [9]. However, it is insufficient forthe practical application of this material.
In [9, 10], we reported for the first time about thepresence of intense TSL in Li6Gd1 – xEux(BO3)3 singlecrystals, which was attributed to the decay of hole O–
centers. An O– center is a hole localized at the oxygenp orbital near a stabilizing negative defect. It wasshown that this material is promising for application insolid-state dosimetry of thermal neutrons. It was sug-gested that, owing to the ionization, some portion of Euions in the lattice of a Li6Gd1 – xEux(BO3)3 crystal
1063-7745/05/5001-S $26.000088
passes to the divalent charge state: Eu3+ Eu2+.Simultaneously, O– centers are formed, being localizedat bridge oxygen atoms, which link Gd atoms into
chains. Thermal decay of a + O– center leads to
the radiative relaxation of the trivalent Eu ion. Todecrease the sensitivity to gamma background, we pro-pose to use the lithium–yttrium orthoborateLi6Y1 − xEux(BO3)3. There are data in the literature onthe growth of europium-activated Li6Y(BO3)3 singlecrystals by the Czochralski method [11]. However, theconcentration limit for Li6Y1 − xEux(BO3)3 solid solu-tions has not been established. This information is notonly of scientific interest but also has practical importancefor optimization of the growth of single crystals of speci-fied composition. Li6Y1 – xEux(BO3)3 single crystals ofdifferent composition in a wide concentration range arenecessary to establish types of radiation defects andstudy the concentration dependence of the TSL yield.The purpose of this work is to investigate the possibilityof growing single crystals of Li6Y1 − xEux(BO3)3 solidsolutions by the Czochralski method in the concentrationrange x = 0–1 and to determine their photo- and thermolu-minescence characteristics.
EXPERIMENTAL
The Li6Y1 – xEux(BO3)3 compounds were synthe-sized by the solid-phase method. The phase composi-tion of the samples was determined on a Siemens D500powder diffractometer (CuKα radiation). The liquidustemperatures were determined by differential thermalanalysis (DTA) with an error of ±5 K, using the tech-nique described in [12]. DTA was performed on a Q-1500D derivatograph in the dynamic mode, with a heat-ing rate of 5 K/min and using an α-Al2O3 reference.The Eu concentration in the crystals grown was deter-
EuGd3+2+
© 2005 Pleiades Publishing, Inc.

GROWTH OF SINGLE CRYSTALS S89
mined by atomic emission spectroscopy with arc exci-tation. A DFS-8 spectrometer was used. Optical mea-surements were carried out on plane-parallel polishedplates 7 × 7 × 2 mm3 in size, cut perpendicular to thegrowth direction. The absorption spectra were mea-sured on a Specord M40 UV-VIS spectrophotometer.The photoluminescence spectra of the crystals weremeasured on an SDL-2 automatic complex (LOMO).The TSL curves were measured on an experimentalsetup using an FÉU-79 photomultiplier at a heating rateof ~5 K/min in the temperature range 300–650 K. Thesamples were irradiated by β particles at room temper-ature using a 90Sr/90Y radioactive source with an activ-ity of 7.4 × 10¹⁰ Bq.
RESULTS AND DISCUSSION
The Li6Y1 – xEux(BO3)3 compounds were synthe-sized by the solid-phase reaction
As the initial components, we used H3BO3 (reagentgrade), Li2CO3 (high-purity grade), Gd2O3 (ItO-Bgrade), and Eu2O3 (EvO-Zh grade). Analysis of theheating curves of the initial mixtures used for the for-mation of the Li6Y(BO3)3, Li6Eu(BO3)3, andLi6Gd(BO3)3 compounds (Fig. 1), as well as theLi6Y1 − xEux(BO3)3 solid solutions, showed that similarprocesses occur in all the systems studied upon solid-phase interaction. Taking into account the specific fea-tures of the phase formation in the Li2O–B2O3–Gd2O3system [13], we can conclude that the synthesis of thesecompounds has a step character. In the initial stage,intermediate compounds are formed: lithium borates(2Li2O · B2O3, 3Li2O · 2B2O3, etc.), which, with anincrease in temperature to 660–750°C, interact withY2O3 and Eu2O3 with the formation ofLi6Y1 − xEux(BO3)3 solid solutions.
To establish the solubility limits for the Li6Y(BO3)3–Li6Eu(BO3)3 system, the Li6Y1 – xEux(BO3)3 compoundswere synthesized with a step in x of 0.1. The sampleswere annealed in air in two stages: at temperatures 560–600 and 700–750°C. As can be seen in Fig. 2, theLi6Y(BO3)3–Li6Eu(BO3)3 system is characterized byunlimited mutual solubility, which makes it possible togrow single crystals of specified composition in theentire concentration range by the Czochralski method.Li6Y1 – xEux(BO3)3 melts demonstrate wide temperatureranges of supercooling (up to 200°C). An increase inthe Eu concentration is accompanied by a decrease inthe melting temperature of the Li6Y1 – xEux(BO3)3 com-pound, which is consistent with the increase in the unit-cell volume of this compound (Fig. 2).
Li6Y1 – xEux(BO3)3 single crystals were grown by theCzochralski method from an oriented seed. When seeds
3Li2CO31 x–
2-----------
Y2O3x2---
Eu2O3 3H2BO3+ + +
= Li6Y1 x– Eux BO3( )3 4.5H2O 3CO2.+ +
CRYSTALLOGRAPHY REPORTS Vol. 50 Suppl. 1 20
of arbitrary orientation were used, the crystals grownshowed a tendency to cracking upon cooling ormechanical treatment. In some cases, helical growth ofboules occurred (observed also) at low axial tempera-ture gradients in [11]. The use of a single-crystal seed
oriented in the [4 2] direction, which corresponds to
the intersection of the (10 ) and (121) planes, allowedus to grow transparent crystals without cracks, inclu-sions, or pores. Single crystals more than 1 cm3 in vol-ume were obtained with the following unit cell param-eters: sp. gr. P21/c, a = 7.157(5) Å, b = 16.378(4) Å, c =6.623(4) Å, β = 105.32(5)°, and V = 748.74(2) Å3
(Li6Y(BO3)3); sp. gr. P21/c, a = 7.2070(7) Å, b =16.467(2) Å, c = 6.6681(6) Å, β = 105.32(5)°, and V =
3
2
0 100 300 500 700 900
1
2
3
t, °C
Fig. 1. DTA curves for the initial stoichiometric mixturesused to form (1) Li6Gd(BO3)3, (2) Li6Eu(BO3)3, and(3) Li6Y(BO3)3 compounds.
10
t, °C
750
0 20 30 40 50 60 70 80 90 100mol %
800
850
900
700
Li6Y(BO3)3 Li6Eu(BO3)3
Vuc, Å3
790
780
760
750
740
770
Fig. 2. Liquidus temperatures and the unit-cell volume (j)of crystals in the Li6Y(BO3)3– Li6Eu(BO3)3 system.
05

S90 YAVETSKIΠet al.
50
600575 625 650 675 700 725λ, nm
0
100
150
200
250
300
350
400
450JPL, arb. units
2
3
Fig. 3. Photoluminescence spectra of the Li6Y1 – xEux(BO3)3 samples (λexc = 395 nm) with x = (1) 0.03, (2) 0.5, and (3) 1.0; thecomposition is indicated for the charge.
1
763.19(2) Å3 (Li6Y0.5Eu0.5(BO3)3); and sp. gr. P21/c,a = 7.232(10) Å, b = 16.507(3) Å, c = 6.697(10) Å, β =105.37(2)°, and V = 770.9(2) Å3 (Li6Eu(BO3)3). Theeffective Eu-distribution coefficient, determined bychemical analysis, is keff = 0.2 at activator concentra-tions x ≤ 0.05 in the initial charge. The value obtainedis in agreement with the phase diagram (introduction ofeuropium leads to a decrease in the melting temperatureof this compound) and is consistent with the values ofthe ionic radii of the elements at a coordination numberof 6:
Li6Y(BO3)3 crystals are transparent in the spectralrange λ = 200–900 nm. Activation by europium leads tothe formation of a wide charge-transfer band in the UVregion, peaked at λ = 249 nm. This band corresponds tothe transition of an electron from the 2p oxygen orbitalto the unfilled 4f orbital of the Eu ion. The charge statesof Eu and O ions change as follows: Eu3+ + O2– Eu2+ + O– [14]. The luminescence spectrum of theLi6Y1 – xEux(BO3)3 crystals contains groups of lines inthe range between 575 and 725 nm, which correspondto the transitions from the first excited state 5D0 of theEu3+ ion to the 7FJ (J = 0–4) levels [14–16]. Figure 3shows the photoluminescence spectra of theLi6Y1 − xEux(BO3)3 single crystals. The highest photolu-minescence intensity is observed for theLi6Y0.5Eu0.5(BO3)3 single crystal (Fig. 3; curve 2),which is in agreement with the data of [15] for the cor-
rY3+ 6( ) 1.04 Å, r
Eu3+ 6( ) 1.09 Å.= =
CRY
responding powders. Weak concentration lumines-cence quenching is caused by the weak interaction ofEu ions with the crystal-lattice field and is related to theanisotropy of the crystalline structure of this compound[14, 16]. After irradiation, the photoluminescenceintensity of Li6Y0.97Eu0.03
(BO
3
)
3
crystals decreases,which is indicative of the transition of some part of Euions to the stable divalent state (Eu
3+
Eu
2+
) with the
formation of + O
–
centers.EuGd3+2+
100
350300 400 450 500 550
T
, K
0
200
300
400
500
600
J
TSL
, arb. units
1
2
Fig. 4.
TSL curves of the
β
-irradiated crystals (dose 10
6
rad):(
1
) Li
6
Y
0.97
Eu
0.03
(BO
3
)
3
and (
2
) Li
6
Gd
0.97
Eu
0.03
(BO
3
)
3
;the composition is indicated for the charge.
STALLOGRAPHY REPORTS Vol. 50 Suppl. 1 2005

GROWTH OF SINGLE CRYSTALS S91
Li6Y0.5Eu0.5(BO3)3 and Li6Eu(BO3)3 crystals, aswell as Li6Gd(BO3)3 pure crystals [7], show no TSL.The presence of weak TSL peaks in Li6Y(BO3)3 crys-tals is apparently related to the presence of rare-earthelements in very small amounts (according to thechemical-analysis data, their total concentration is10−3 wt %). In Fig. 4, the TSL curves for theLi6Y0.97Eu0.03(BO3)3 crystals are compared with thecorresponding curves for the Li6Gd0.97Eu0.03(BO3)3
crystals. It can be seen that the curves are almost iden-tical. Both contain a doublet in the temperature ranget = 450–480°C with similar activation energies (Ea ~1.2 eV). The similarity of the TSL curves is also char-acteristic for other isostructural oxide crystals, forexample, M2SiO5 : Ce (M = Lu, Y, Yb, or Er) [17].Therefore, we can suggest that the TSL of theLi6Y0.97Eu0.03(BO3)3 crystals is also related to the decayof O– hole centers (high-temperature hole centers areknown to exist in borate glasses [18]). A hole, releasedas a result of thermal activation, is captured by an Eu2+
ion. As a result, radiative relaxation occurs according tothe equation Eu2+ + e+ (Eu3+)* Eu3+ + hν,where (Eu3+)* is the excitation state of the Eu3+ ion.After annealing, the photoluminescence intensity of theLi6Y0.97Eu0.03(BO3)3 crystals takes its initial value.Measurements of the TSL using light filters confirm themechanism proposed: the emission spectrum is locatedin the wavelength range λ ≥ 600 nm, which is in goodagreement with the experimentally observed emissionspectrum of Eu3+.
CONCLUSIONS
It is shown that the Li6Y(BO3)3–Li6Eu(BO3)3 sys-tem is characterized by unlimited mutual solubility. It isascertained that single crystals of Li6Y1 – xEux(BO3)3
solid solutions can be grown by the Czochralskimethod in the entire range of values of x. Thermallystimulated luminescence of Li6Y1 – xEux(BO3)3 crystalswas studied for the first time. The TSL of these crystals,as well as that of Li6Gd1 – xEux(BO3)3 crystals, is relatedto the decay of O– centers with subsequent radiativerelaxation of Eu3+ ions.
CRYSTALLOGRAPHY REPORTS Vol. 50 Suppl. 1 2
ACKNOWLEDGMENTSWe are grateful to V.N. Baumer for supplying the
X-ray diffraction data and Z.V. Shtitel’man for help inthe chemical analysis of samples.
REFERENCES1. C. W. E. van Eijk, Radiat. Prot. Dosim. 110, 5 (2004).2. J. B. Czirr, G. M. MacGillivray, R. R. MacGillivray, and
P. J. Seddon, Nucl. Instrum. Methods Phys. Res. A 424,15 (1999).
3. J. P. Chaminade, O. Viraphong, F. Guillen, et al., IEEETrans. Nucl. Sci. 48, 1158 (2001).
4. V. V. Chernikov, M. F. Dubovik, V. P. Gavrilyuk, et al.,Nucl. Instrum. Methods Phys. Res. A 498, 424 (2003).
5. J. B. Czirr, D. B. Merrill, D. Buehler, et al., Nucl.Instrum. Methods Phys. Res. A 476, 309 (2002).
6. A. M. Williams, P. A. Beeley, and N. M. Spyrou, Radiat.Prot. Dosim. 110, 497 (2004).
7. V. N. Baumer, M. F. Dubovik, B. V. Grinyov, et al.,Radiat. Meas. 38, 359 (2004).
8. M. J. Knitel, P. Dorenbos, C. W. E. van Eijk, et al., Nucl.Instrum. Methods Phys. Res. A 443, 364 (2000).
9. R. Yavetskiy, A. Tolmachev, and B. Grinyov, in Proceed-ings of the 3rd International Workshop “PhysicalAspects of the Luminescence of Complex Oxide Dielec-trics” (LOD-2004), Kharkiv, Ukraine, 2004 (Kharkiv,2004), p. 27.
10. M. F. Dubovik, V. A. Tarasov, A. V. Tolmachev, andR. P. Yavetskiy, in Proceedings of the 15th InternationalConference on Defects in Isulating Materials (ICDIM-2004), Riga, Latvia, 2004 (Riga, 2004), p. 92.
11. J. P. Chaminade, O. Viraphong, and S. Miyazawa,J. Cryst. Growth 237–239, 864 (2002).
12. P. P. Fedorov and L. V. Medvedeva, Zh. Neorg. Khim.34, 2674 (1989).
13. T. I. Korshikova, R. P. Yavetskiy, and A. V. Tolmachev,Funct. Mater. 10 (3), 407 (2003).
14. V. Jubera, J. P. Chaminade, A. Garcia, et al., J. Lumin.101, 1 (2003).
15. M. Leskelá and J. Hölsá, Eur. J. Solid State Inorg. Chem.28, 151 (1991).
16. J. Hölsá and M. Leskelá, J. Lumin. 48-49, 497 (1991).17. D. W. Cooke, B. L. Bennett, K. J. McClellan, et al.,
J. Lumin. 92, 83 (2001).18. D. L. Griscom, J. Non-Cryst. Solids 13 (2), 251 (1974).
Translated by Yu. Sin’kov
005

Crystallography Reports, Vol. 50, Suppl. 1, 2005, pp. S92–S96.Original Russian Text Copyright © 2005 by Timoshenko, Goriletski
œ
, Grinev, Sumin, Sizov.
CRYSTALGROWTH
Effect of the Growth Rate on Thermal Conditions During the Growth of Single Crystals with Melt Feeding
N. N. Timoshenko, V. I. Goriletskiœ, B. V. Grinev, V. I. Sumin, and O. V. SizovInstitute for Scintillation Materials, National Academy of Sciences of Ukraine,
pr. Lenina 60, Kharkov, 61001 Ukraine
e-mail: [email protected] February 8, 2005
Abstract—An attempt is made to establish a correlation between the radial and axial growth rates and thechange in the conditions of heat transfer from a growing crystal to the atmosphere of the water-cooled vacuumfurnace for the growth of large alkali halide single crystals. It is found experimentally that an increase in thegrowth rate leads to an increase in the automatic compensation of the melt temperature by the main heater. In thiscase, the thickness of the layer of melt condensate on the end face and the lateral surface of the crystal decreases.It is revealed that the possibility of growing infinitely long ingots in the presence of intense melt evaporation isrestricted by the possibilities of the heat transport through the boundary between the furnace atmosphere andthe cooled furnace walls, onto which melt condensate deposits. © 2005 Pleiades Publishing, Inc.
INTRODUCTION
The growth of crystals represents a certain sequenceof physico-chemical processes occurring in a certain.Naturally, the longest-term processes attract moreattention and have been studied in more detail. Onesuch process is that of natural melt evaporation. Evap-oration, which is a fundamental property of melts, isdetermined by the vapor elasticity tension, pressure,temperature, and the free melt surface. The optimalpressure in the growth furnace changes during thegrowth in a narrow range (from 1–5 Torr during themelting of the initial charge in the crucible to 15–30 Torr during all subsequent growth stages). The pres-sure increases to such values from vacuum (~10–1 Torr)by supplying such gases as He, Ar, N2, CO2, and theirmixtures. After this, the melt evaporation decreasesstep-wise (and significantly). Quantitative estimates fordifferent gases are absent, but rough estimation showsthat the evaporation rate changes by several orders ofmagnitude. With a further increase in the partial gaspressure, the furnace atmosphere loses transparencyand the process, which should be controlled visually,cannot be continued. Helium is an exception, since itretains transparency even at an excess pressure. How-ever, due to strong convective fluxes in the melt, growthunder such conditions also turned out to be impossible.No detailed investigations of the dependence of theevaporation rate of iodides of alkali metals on pressurein systems of this type have been performed. However,according to rough estimations, in the pressure range15–30 Torr, the melt-evaporation rate does not changesignificantly for any of the above-mentioned gases. Thepurpose of this study is to establish the dependence of
1063-7745/05/5001-S $26.000092
the intensity of heat transfer from the surface of a grow-ing crystal to the environment at different growth rates.
EXPERIMENTAL TECHNIQUE
Investigations were performed on ROST vacuumcompression systems [1] of the first and second gener-ation. CsI(Na) and NaI(Tl) single crystals (up to 320and 540 mm in diameter, respectively) were grown withan automatic control through the feedback with thetemperature of the bottom heater using current data onthe position of the melt level in the crucible [2]. It is thebottom heater that is chosen for automated control ofthe growth process in ROST systems. The contributionof this element to the melt heating is decisive. There-fore, the recorded change in the temperature tbot of thebottom heater reflects to a large extent the change in theconditions of heat removal from a growing crystal.
The schematic of the ROST system is shown inFig. 1. To maintain a constant level of melt in the cruci-ble 1 during the growth of a crystal 2, the system isequipped with an annular reservoir 3, into which an ini-tial charge is supplied from the feeder 4 through thetransport tube 5. Being melted by the lateral heater 6,the charge flows through the aperture 7 into the gapbetween the crucible walls and the shield 8 and then ismixed with the melt 9, whose level is measured by theprobe of the melt-level meter 10.
The growth of large CsI(Na), CsI(Tl), and NaI(Tl)single crystals in ROST systems occurs as follows. Theinitial salt is supplied to the charge-preparation unit,where it is subjected to additional dehydration at differ-ent temperatures and under continuous evacuation (thetemperature regimes are different for the CsI and NaI
© 2005 Pleiades Publishing, Inc.

EFFECT OF THE GROWTH RATE S93
salts). During the dehydration, the salt acquiresflowability, which is necessary for the optimal opera-tion of the vibration dispenser of the melt-feeding sys-tem. From the charge-preparation unit, the salt is trans-ferred to the growth zone in evacuated quartz cells. Ifnecessary, the salt is mixed with an activator in thegrowth zone. When CsI(Na) single crystals are grown,this procedure is omitted: an activator in the form of theNaI salt is loaded into the crucible only once immedi-ately before the growth. Then, the salt is supplied fromremovable bins to maintain a constant melt level in thecrucible throughout the experiment.
After loading the crucible with the initial charge, thegrowth furnace is degassed and the heater temperaturesare increased at a certain rate to the melting temperatureof the initial charge in the crucible under continuousevacuation. At the first signs of charge melting, theabove-mentioned gases are fed into the furnace with anincrease in pressure up to 15–30 Torr. Then, the chargein the crucible melts, after which the crystal growthbegins.
The crystal growth is performed by seed pulling at acertain rate with simultaneous initial-charge feeding tothe melt. During the growth, the single crystal and thecrucible are uniformly rotated in the same direction butat different rates, which makes the temperature fieldsymmetric and provides for the necessary melt stirringin the crucible. The crystal holder and the furnace wallsare cooled by water to form the axial temperature gra-dient required for the crystal growth.
EXPERIMENTAL RESULTS
The melt temperature above the melting point isobtained when the salt melts in the crucible. The timeduring which the salt melts away depends on tempera-ture: at a low superheating of the salt above the meltingpoint, the melting process elongates; at a high super-heating, we have enhanced evaporation. Such a param-eter as the area of evaporation of the melt and its com-ponents (SL) appears to be most important in the growthof large crystals, which require crucibles with largecross sections. Taking into account that the melt-levelsensor should also be located on the melt surface, thediameter of the melt mirror should exceed the limitingcrystal diameter. For this reason, there is an annular gapon the melt surface between the growing crystal and thecrucible. It is this gap that determines the parameter SL.In the stage of salt melting in the crucible, SL is maxi-mum; in the stage of radial crystal growth to the finaldiameter, this area decreases; and, in the stage of axialgrowth, the value of SL is stabilized to the specifiedminimum. It is in the latter stage that the volatile acti-vator Tl is introduced into the feed composition (as athallium iodide salt) during the growth of CsI(Tl) andNaI(Tl) scintillation single crystals. The axial-growthtime is 14–20 and 34–50 h for crystals about 320 and540 mm in diameter, respectively.
CRYSTALLOGRAPHY REPORTS Vol. 50 Suppl. 1 2
The melt evaporation leads to the formation of acondensate on the crystal surface and the internal wallsof the growth furnace. The deposition rate of the con-densate and, therefore, its thickness depend on time andtemperature for specific pressures in the furnace andsizes SL. With an increase in the diameter, a radiallygrowing crystal gradually reduces the melt surface,from which not only evaporation but also effective heattransfer to the environment occurs. The denser andthicker the condensate layer on the crystal, the smallerthe amount of heat emerging from the crystal into theenvironment and the smaller the value of tbot, whichcompensates for the heat transfer from the crystal to theenvironment by the automated system throughout thegrowth process and, especially, at the critical instant:when the crystal emerges outside the crucible. Themain factor determining the temperature gradient in theatmosphere around the crystal is the transparency of thecrystal surface for thermal radiation. In other words, theboundary condensate layer on the crystal is actuallylocated between the heat source (heaters) and the envi-ronment in the growth furnace. Thus, the thermal con-ditions in the furnace volume are determined by thetransparency of the condensate on the ingot surface.
The above considerations were verified experimen-tally. For example, when the time of the radial growthof a CsI(Na) crystal to the final size (310 mm) increasedfrom 12 to 20 h, tbot increased from 770 to 790°C by theend of this stage (Fig. 2). As was shown in [3] for dif-
Fig. 1. Schematic of the ROST system: (1) crucible,(2) crystal, (3) annular peripheral reservoir, (4) feeder,(5) transport tube, (6) side heater, (7) apertures, (8) shield,(9) melt, (10) probe of the melt-level sensor, and (11) bot-tom heater.
1
2
3
4
5
6
7
89
10
11
005

S94
TIMOSHENKO
et al
.
780
40 8 12 16 τ, h
810
840
870tbot, °C
7501
3
1
3
1
23
Fig. 2. Time dependences of the automatic correction of the bottom-heater temperature during the radial growth of 310-mm CsI(Na)single crystals at different growth rates: (1) 8.0, (2) 7.0, and (3) 6 mm/h. The numbers on the photographs correspond to the numbersof the curves.
ferent radial-growth rates, the condensate layer wasthicker and denser specifically on the end face of thecrystal that was grown for a longer time. In our opinion,this finding is confirmed by the photographs madewithout additional illumination, i.e., at natural temper-ature luminescence of the crucible, the melt, and thecrystal (Fig. 2, bottom left and top right). These photo-graphs can be considered as qualitative distribution pat-terns of the heat-insulating material (i.e., the layer ofthe melt condensate) over the radius of the growingingot. A similar distribution is observed for the growthof other crystals, in particular, NaI(Tl) crystals up to520 mm in diameter (Fig. 3). At high radial-growthrates, a large number of radial block boundaries may beformed. Therefore, we limited the radial-growth time tothe minimum: 34 h (Fig. 3, curve 1). In this case, theradial-growth rate was about 6 mm/h. It should be notedthat scintillation crystals NaI(Tl) allow the presence ofblock boundaries leading to a lattice misorientation ashigh as several degrees. At radial-growth rates exceed-ing 6 mm/h, the growth edge of the crystal becomes dis-continuous as a result of the additional melting at theblock boundaries, and the process becomes unstable.
The time dependence of tbot in this growth stage ischaracterized by a minimum. This minimum corre-sponds to the instant when the top face end of the crys-tal passes the level of the top rim of the crucible, afterwhich the value of tbot and, accordingly, the heatremoval from the crystal begin to increase.
Thus, the investigations performed reveal a correla-tion between the radial-growth rate and the minimumvalue of tbot (the latter directly depends on the proper-ties and amount of the condensate on the crystal).
CRY
Concerning the probability of the defect formationin the volume of the growing crystal [4], the duration ofthe time interval from the onset of the salt melting in thecrucible to the onset of axial growth becomes veryimportant. An increase in the process duration is equiv-alent to a decrease in the axial temperature gradient. Atthe same time, the larger the axial-temperature gradi-ent, the more stable is the growth and the lower is theprobability of forming structural defects in the growingcrystal, and vice versa.
The above considerations give grounds to concludethat the time from the onset of the salt melting in thecrucible to the onset of the stationary phase (axial crys-tal growth) should be minimized.
10
740
20 30 40 500720
760
780
800
820
tbot, °C
τ, h
Fig. 3. Time dependences of the automatic correction of thebottom-heater temperature during the radial growth of520-mm NaI(Tl) single crystals at different growth rates:(1) 5.8, (2) 5.4, (3) 5, and (4) 4 mm/h.
12
34
STALLOGRAPHY REPORTS Vol. 50 Suppl. 1 2005

EFFECT OF THE GROWTH RATE S95
12
Fig. 4. Deposition of melt condensate on the top end faces of NaI(Tl) single crystals by the end of the radial growth to a diameterof 520 mm (crystal 1) and the stabilization of the condensate coating during the subsequent axial growth of the ingot after 100 h(crystal 2).
The presence of a condensate coating is an undesir-able factor of the ingot growth. At the same time, thisfactor is favorable to a certain extent. Observations ofthe growth process show that the visual picture of thetop face end of the crystal is nearly frozen at the instantwhen the growth changes from radial to axial. Anexample is the growth of NaI(Tl) single crystals up to520 mm in diameter (Fig. 4): the time interval betweenthe instances at which crystals 1 and 2 were photo-graphed is about 100 h, but there is only a slight differ-ence in the amount of condensate deposited by theseinstances. The reason for this phenomenon is not onlythe constancy of the parameter SL and, respectively, theevaporation rate, but also that the mass evaporation rateis low in this stage and can be calculated for each spe-cific case [5]. When the growth changes from radial toaxial, a condensate layer begins to grow on the newlyformed lateral surface, as evidenced by the stable pic-ture observed on the end surface (Fig. 4). This observa-tion suggests another conclusion: the area of the lateralcrystal surface increases continuously and proportion-ally to the pulling rate. This increase is sufficient for thedeposition of the entire amount of the evaporating con-densate. Next, we can suggest that the magnitude of thecurrent parameter tbot in the axial-growth stage shoulddepend on the rate of formation of the lateral crystalsurface, i.e., on the axial-growth rate of the ingot.
This suggestion, which would seem to be inconsis-tent at first glance (from the general considerations, theincrease in the crystal-growth rate should require alarger decrease in tbot in comparison with lower growthrates), was confirmed by the results of our study. As canbe seen in Fig. 5, which shows the actual dependencesof the automatic compensation of the temperature ofthe main bottom heater on the crystal length at differentgrowth rates, the slope of the curve tbot(Hcr) increasesafter the minimum at higher growth rates. Such a situa-tion is possible in only one case (all other factors being
CRYSTALLOGRAPHY REPORTS Vol. 50 Suppl. 1 2
equal): when the phase boundary between the crystalsurface and the surrounding furnace space becomesmore transparent for the radiant heat transfer. Thus, alogical conclusion can be drawn: the condensate onsuch a surface should be thinner and more transparent
tbot, °C
100 200 300 400 5000
720
740
760
780
3
4
(b)
Hcr, mm
100 150 200 250 300
(a)
500
780
800
820
8402
1
Fig. 5. Dependences of the automatic compensation fortemperature by the bottom heater on the crystal length dur-ing the growth of (a) 310-mm CsI(Na) single crystals and(b) 540-mm NaI(Tl) single crystals at different growthrates: (1) 2.5, (2) 4.0, (3) 2.0, and (4) 3.7 mm/h.
005

S96
TIMOSHENKO
et al
.
for IR radiation at higher growth rates. Indeed, prelim-inary qualitative estimations of the amount of conden-sate on the surface of a grown crystal, made by measur-ing the condensate transparency to IR radiation, show asignificant difference.
Since the condensate has a loose structure and highhygroscopicity, it is difficult to obtain quantitative datafor it. However, there are plans to carry out such exper-iments.
In our opinion, another interesting result of thisstudy is the evident possibility of controlling the axialtemperature gradient in a growing crystal. Returning tothe dependences tbot(Hcr) in Fig. 5, we should note thatthe time compensation for tbot is larger for crystalspulled at higher rates; in other words, the heat exchangebetween the crystal and the furnace atmosphere is moreintense in this case, and, therefore, the temperature gra-dient in the crystal is higher.
On the basis of the results obtained, we can general-ize the previous conclusion: not only the time intervalfrom the onset of the salt melting in the crucible to theonset of the axial growth, but also the total time of theprocess (to the end of the crystal growth) should beminimized.
The above original result gives grounds to concludethat there is a significant resource in the further devel-opment of our physical understanding of the crystalli-zation of alkali halides in the mode of automatic semi-continuous growth in ROST systems.
Considering the sequence of the dominant radiativeheat transfer, we investigated only the phase boundarybetween the crystal and the furnace atmosphere. How-ever, along with this boundary, other phase boundariesare known: crystal/melt; melt/furnace atmosphere; andthe specific boundary between the furnace atmosphereand the water-cooled furnace walls, which is character-istic of only completely open nonconservative systems.Returning again to Fig. 5, note that the slope of thecurves tbot(Hcr) decreases when the crystal lengthreaches the value of approximately 250 mm at bothgrowth rates for two types of crystals. In our opinion,this phenomenon confirms the existence of the thermo-physical boundary between the furnace atmosphere andthe water-cooled furnace walls. In the next heat-transfersequence (after the heat transfer through the crystal/fur-nace boundary), the heat-transfer ability of the bound-ary between the furnace atmosphere and the furnacewalls decreases as a result of the increase in the thick-ness of the condensate layer. In a narrow range ofgrowth rates, the amount of condensate can be con-
CRY
trolled by decreasing the process time. However, thismethod is invalid for the latter heat-transfer sequence.In essence, this experimental fact limits the length ofingots grown and indicates that a special techniqueshould be developed to remove the condensate from thefurnace. For alkali halide crystals, at least to date, thisproblem is not urgent.
Currently, we can draw some conclusions (based onthe indirect experimental data) about the existence ofsome mental dependences. However, actual processescan be revealed only in direct experiments, which havealready begun [6].
CONCLUSIONS
A correlation between the radial and axial crystal-growth rates and the change in the conditions of heattransfer from a growing crystal to the environment isestablished: with an increase in the growth rate, the heatexchange at the phase boundary between the crystaland the furnace atmosphere becomes more intenseowing to the decrease in the thickness of the condensatelayer deposited on the crystal surface. It is shown thatthe possibility of growing ingots of arbitrary lengthunder conditions of intense melt evaporation is limitedby the possibilities of the heat transfer through theboundary between the furnace atmosphere and thewater-cooled furnace walls covered by a layer of meltcondensate.
REFERENCES1. L. G. Eidelman, V. I. Goriletsky, V. G. Protsenko, et al.,
J. Cryst. Growth 128, 1059 (1993).2. S. K. Bondarenko, V. I. Goriletsky, and V. S. Suzdal,
Funct. Mater. 6, 380 (1999).3. V. I. Goriletsky, S. K. Bondarenko, M. M. Smirnov,
et al., J. Korean Cryst. Growth Cryst. Technol. 13, 5(2003).
4. V. I. Goriletsky, B. V. Grinyov, V. S. Suzdal, et al., inProceedings of the 14th International Conference onCrystal Growth, Grenoble, 2004 (Grenoble, 2004),p. 570.
5. V. I. Goriletsky and N. N. Smirnov, J. Cryst. Growth 218,125 (2000).
6. O. Ts. Sidletskii, V. I. Goriletskii, N. N. Timoshenko,et al., in Proceedings of the 11th National Conference onCrystal Growth, Moscow, Russia, 2004 (Moscow, 2004),p. 223.
Translated by Yu. Sin’kov
STALLOGRAPHY REPORTS Vol. 50 Suppl. 1 2005

Crystallography Reports, Vol. 50, Suppl. 1, 2005, pp. S97–S99.Original Russian Text Copyright © 2005 by Bezmaternykh, Temerov, Gudim, Stolbovaya.
CRYSTALGROWTH
Crystallization of Trigonal (Tb,Er)(Fe,Ga)3(BO3)4 Phases with Hantite Structure in Bismuth Trimolybdate-Based Fluxes
L. N. Bezmaternykh*, V. L. Temerov*, I. A. Gudim*, and N. A. Stolbovaya*** Kirenskiœ Institute of Physics, Siberian Division, Russian Academy of Sciences, Akademgorodok,
Krasnoyarsk, 660036 Russiae-mail: [email protected]
** Krasnoyarsk State University, Krasnoyarsk, RussiaReceived February 3, 2005
Abstract—The stability regions of the trigonal (Tb,Er)(Fe,Ga)3(BO3)4 phases are established in (Bi2Mo3O12)-based fluxes. The specific features of heterogeneous nucleation and the subsequent phase transformations dur-ing transition to the equilibrium are studied in the vicinity of the boundaries. The temperature modes of singlecrystal growth on seeds are suggested with due regard for the “nonequilibrium effect.” © 2005 Pleiades Pub-lishing, Inc.
INTRODUCTIONSingle crystals of rare earth gallium ferroborates
R(Fe,Ga)3(BO3)4 with the hantite structure consist oflinear chains of RO6 trigonal prisms and helicoidalFeO6 octahedra located along the threefold axis.
The quasi-one-dimensional structure of the rareearth and iron subsystems stimulated the study of thespecific features of magnetism demonstrated by thesecompounds.
The widespread use of static magnetic measure-ments [1], methods of magnetic resonance [2], calorim-etry [3, 4], linear and nonlinear optical spectroscopy[3, 5], and Mössbauer spectroscopy under high pres-sures [6] have allowed the most detailed studies of gad-olinium ferroborate GdFe3(BO3)4 single crystals.
In light of the study of magnetic ordering in the rareearth and iron subsystems and their interaction in thisclass of compounds, the experiments on single crystalsof terbium and erbium ferrogalloborates,Tb(Fe,Ga)3(BO3)4 and Er(Fe,Ga)3(BO3)4, seem to beimportant.
The present study was undertaken to study the con-ditions of synthesis of the above single crystals frombismuth trimolybdate-based fluxes: Bi2Mo3O12 +pB2O3 + q(Tb,Er)2O3 + r(Tb,Er)(Fe,Ga)3(BO3)4. Unlikethe well-known Bi2O3-based fluxes [8], in bismuth tri-molybdate-based fluxes, Bi2O3 is strongly bonded toMoO3 [7], which should exclude any partial substitu-tion of bismuth for rare earth elements during crystalli-zation.
STABILITY REGIONS OF THE TRIGONAL (Tb,Er)(Fe,Ga)3(BO3)4 PHASE
Fluxes with different p, q, and r values and weightsup to 30 g were prepared in a 50-mm3 platinum crucible
1063-7745/05/5001-S $26.000097
by sequential melting together of the Bi2O3, MoO3,B2O3, (Fe,Ga)2O3, and (Tb,Er)2O3 oxides at t = 1000°C.Homogenization processes, the spontaneous nucleationof crystals, and characteristics of the transition to theequilibrium states were studied only for fluxes with sat-uration temperatures not exceeding 1000°C. This limi-tation excluded any significant noncontrollable varia-tions in the crystallization conditions even in long-durable experiments with an open crucible.
It was established that the trigonal phase of the(Tb,Er)(Fe,Ga)3(BO3)4 compound is crystallized withina certain interval of the temperature range 1000–850°Conly in the fluxes with nonstoichiometric amounts ofthe crystal-forming oxides (p ≠ 0 and q ≠ 0). The high-temperature phase that is stable in a large temperaturerange is formed only in the narrow region of the (p, q, r)parametric space. Examples of the fluxes of such com-positions are indicated in the table (1, 2, 4, 5).
ADJACENT PHASES. NONEQUILIBRIUM EFFECT
The stable high-temperature phase in the fluxes notcontaining Ga2O3 and with stoichiometric amounts ofthe crystal-forming oxides (p = q = 0) is the α-Fe2O3phase (hematite). At a certain superstoichiometricamount of B2O3 (p = p1 and q = 0), the hematite phaseis transformed into the orthorhombic Fe3BO6 phase.Finally, in the fluxes with a considerable excess ofboron oxides and rare earth element (p > p2 and q > q2),the stable high-temperature phase is the hexagonal(Tb,Er)BO3 phase. In the (p, q, r) parametric space, thestability regions of the above phases are adjacent to thestability region of the trigonal (Tb,Er)Fe3(BO3)4 phase.
It is established that the transition of supercooledflux 1 into the state equilibrium with respect to
© 2005 Pleiades Publishing, Inc.

S98
BEZMATERNYKH
et al
.
Composition of bismuth trimolybdate-based fluxes
Flux
Fluxes composition
tsat,
°C
dtsat/dn,
°C/wt %
Competingnonequilibrium
phasesin moles
in quasibinary formp q r s
1 1.5 0.3 0 0.88 70.9 wt % (Bi2Mo3O12 + 1.5B2O3 + 0.3Tb2O3) + 29.1 wt % TbFe3(BO3)4
950 5 α-Fe2O3
2 3 0.5 0 0.87 72.4 wt % (Bi2Mo3O12 + 1.5B2O3 + 0.5Er2O3) + 27.6 wt % ErFe3(BO3)4
945 5 α-Fe2O3, Fe3BO6, ErBO3
3 4 0.5 0.5 0.99 65.1 wt % (Bi2Mo3O12 + 4B2O3 + 0.3Tb2O3 + 0.5 Li2MoO4) + 24.9 wt % TbFe3(BO3)4
940 4.5 α-Fe2O3
4 2 0.3 0 0.83 70 wt % (Bi2Mo3O12 + 2B2O3 + 0.3Er2O3) + 30 wt % ErGa3(BO3)4
930 5 β-Ga2O3
5 2.5 0.4 0 0.59 77 wt % (Bi2Mo3O12 + 2.5B2O3 + 0.4Er2O3) + 23 wt % ErGa3(BO3)4
940 4.5 –
TbFe3(BO3)4 proceeds via the intense formation ofhematite and its subsequent dissolution (“nonequilib-rium effect”). Depending on p, q, and r values and thepreset initial supercooling, this effect may manifestitself in the nucleation of another adjacent phase or oftwo adjacent phases simultaneously (Fig. 1a).
CRY
In fluxes not containing Fe2O3 (composition 4 intable) and containing stoichiometric amounts of thecrystal-forming oxides (p = q = 0), the stable high-tem-perature phase is β-Ga2O3. However, the stabilityregion of the trigonal phase in these fluxes is wider, sothat it is possible to select p, q, and r such that the non-
¥6
(b)
T
Tsat
Tsat–∆T1met
Tsat–∆T2met
HE E
TbF
e 3(B
O3)
4
TbF
e 3(B
O3)
4
α-Fe
2O3
α-Fe
2O3
(a)
Fig. 1. (a) Nonequilibrium (NE) and equilibrium (E) temperature sequences for the phases crystallized in fluxes 3 (see table). For
α-Fe2O3, the width of the metastable region is ∆ = 7–10°C, for TbFe3(BO3)4, ∆ = 30–35°C. (b) Results of crystallization
on a holder with two seeding TbFe3(BO3)4 crystals in flux 3 at ∆tin = 12°C, τ = 24 h.
t1met
t2met
STALLOGRAPHY REPORTS Vol. 50 Suppl. 1 2005

CRYSTALLIZATION OF TRIGONAL S99
equilibrium effect will not manifest itself at all (compo-sition 5 in table).
INFLUENCE OF FLUXES DILUTION BY LITHIUM MOLYBDATE
Addition of lithium molybdate to the above-men-tioned bismuth trimolybdate-based fluxes decreasestheir viscosity and density in accordance with the reac-tion Bi2Mo3O12 + pB2O3 + q(Tb,Er)2O3 + sLi2MoO4 +r(Tb,Er)Fe3(BO3)4. As a result, the danger of nucleationand growth of floating parasitic crystals on the fluxessurface kept by the forces of surface tension consider-ably decreases. With a decrease in viscosity, the proba-bility of the formation of defects (fluxes inclusions)also decreases. At the same time, the stability region ofthe trigonal (Tb,Er)Fe3(BO3)4 phase becomes narrower.A compromise between these two factors is achievedby the fluxes dilution with s ≤ 0.5 (composition 3 intable).
ALLOWANCE FOR NONEQUILIBRIUM EFFECT IN CRYSTALLIZATION ON SEEDS
If the nonequilibrium effect takes place, each of thephases is characterized by its own threshold supercool-
Fig. 2. TbFe3(BO3)4 single crystals grown on seeds influx 3 at ∆tin = 5°C, dt/dτ = (1–2)°C/day, τ = 4 days.
CRYSTALLOGRAPHY REPORTS Vol. 50 Suppl. 1 20
ing ∆tmet after the attainment of which nucleation takesplace (Fig. 1a). In crystallization on (Tb,Er)Fe3(BO3)4seeds, the initial supersaturation and the rate of the sub-sequent gradual temperature decrease should beselected in such a way as to avoid the attainment of thethreshold supercooling. Figure 1b shows the result ofcrystallization in the case where this condition was vio-lated. Along with the (Tb,Er)Fe3(BO3)4 seeds, “needle-like pyramids” consisting of small hematite rhombohe-dra also grew on the crystal holder. One such pyramidgrew into the seed. The result of a growth experiment inthe appropriate temperature mode is shown in Fig. 2.
CONCLUSIONS
The compositions of fluxes are found such that thetrigonal (Tb,Er)(Fe,Ga)3(BO3)4 phase is the high-tem-perature phase stable over a wide temperature range.These fluxes are much better than other known mediafor the growth of single crystals of this compound [8].
With due regard for the discovered nonequilibriumeffect, the choice of the temperature modes of growth issubstantiated. Trigonal single crystals of the composi-tion (Tb,Er)(Fe,Ga)3(BO3)4 are grown in order to studythe specific characteristics of their magnetic propertiesrelated to the quasi-one-dimensional structure of therare earth and iron subsystems.
REFERENCES
1. D. Balaev, L. N. Bezmaternykh, I. A. Gudin, et al.,J. Magn. Magn. Mater. 532, 258 (2003).
2. A. I. Pankrats, G. A. Petrakovskiœ, L. N. Bezmaternykh,et al., Zh. Éksp. Teor. Fiz. 10, 887 (2004) [JETP 99, 766(2004)].
3. R. Z. Levitin, E. A. Popova, and R. M. Chtsherbov,Pis’ma Zh. Éksp. Teor. Fiz. 79 (9), 531 (2004) [JETPLett. 79 (9), 423 (2004)].
4. Yu. Hinatsu, Y. Doi, K. Ito, et al., Solid State Chem. 172,438 (2003).
5. A. M. Kalashnikova, V. V. Pavlov, and R. V. Pisarev,Pis’ma Zh. Eksp. Teor. Fiz. 80 (5), 339 (2004) [JETPLett. 80 (5), 293 (2004)].
6. L. N. Bezmaternykh, A. G. Gavriliuk, and S. A. Kharla-mova, in Abstract Book of EASTMAG (Inst. Fiz. Sib.Otd., Krasnoyarsk, 2004), p. 148.
7. L. N. Bezmaternykh, S. A. Kharlamova, andV. L. Temerov, Kristallografiya 49 (4), 945 (2004)[Crystallogr. Rep. 49 (5), 855 (2004)].
8. N. I. Leonyuk, Prog. Cryst. Growth Charact. 31, 279(1995).
Translated by L. Man
05
Copyright © 2022 FDOKUMEN