SSS-Q4FY22-STOCK-UPDATES.pdf - Smart Sync Services
166
-
Upload
khangminh22 -
Category
Documents
-
view
1 -
download
0
Transcript of SSS-Q4FY22-STOCK-UPDATES.pdf - Smart Sync Services


Click here to Subscribe on
www.smartsyncservices.com
SMART SYNC SERVICES
A-404, Titanium Heights,
Corporate Road, Makarba,
Ahmedabad, Gujarat - 380015
Who We Are We are a SEBI Registered (INA000007881) Investment Advisory firm. We passionately believe that the people of our country must know about the importance of financial literacy and financial freedom and we will do everything possible to realize this vision.
We at Smart Sync Investment Advisory Services (SSIAS) are guided by the words of wisdom from the father of Investment Management, Benjamin Graham —
“An investment operation is one which, upon thorough analysis, promises safety of principal and a satisfactory return.”

Click here to Subscribe on
www.smartsyncservices.com
Contents
Who We Are ................................................................................................................................ 2
AUTO & AUTO ANCILLARIES ......................................................................................................... 6
Bajaj Auto ........................................................................................................................................ 6
Balkrishna Industries ..................................................................................................................... 10
Craftsman Automation .................................................................................................................. 13
Eicher Motors ................................................................................................................................ 16
Rajratan Global Wire ..................................................................................................................... 18
Sansera .......................................................................................................................................... 20
SJS Enterprises ............................................................................................................................... 22
AMC .......................................................................................................................................... 24
HDFC AMC ..................................................................................................................................... 24
Nippon Life India AM ..................................................................................................................... 27
BANKS ....................................................................................................................................... 30
HDFC Bank ..................................................................................................................................... 30
Kotak Mahindra Bank .................................................................................................................... 33
BROKING ................................................................................................................................... 36
Angel One ...................................................................................................................................... 36
Motilal Oswal ................................................................................................................................ 39
CEMENT ..................................................................................................................................... 42
Dalmia Bharat ................................................................................................................................ 42
Heidelberg Cement ....................................................................................................................... 45
Orient Cement ............................................................................................................................... 47
Ultratech Cement .......................................................................................................................... 49
CHEMICALS ................................................................................................................................ 52
Apcotex ......................................................................................................................................... 52
Galaxy Surfactants ......................................................................................................................... 54
Rallis .............................................................................................................................................. 56
CONSUMER ELECTRONICS .......................................................................................................... 59
Amber Enterprises ......................................................................................................................... 59
Blue Star ........................................................................................................................................ 61
Dixon Technologies ....................................................................................................................... 64
EXCHANGE ................................................................................................................................. 67

Click here to Subscribe on
www.smartsyncservices.com
BSE ................................................................................................................................................. 67
Indian Energy Exchange ................................................................................................................ 69
FMCG......................................................................................................................................... 72
CCL Products.................................................................................................................................. 72
ITC .................................................................................................................................................. 74
Marico ........................................................................................................................................... 76
Tata Consumer Products ............................................................................................................... 79
Varun Beverages ........................................................................................................................... 82
HEALTHCARE & PHARMA ........................................................................................................... 84
Cadila Healthcare .......................................................................................................................... 84
Divi’s Laboratories ......................................................................................................................... 86
Hester Biosciences ........................................................................................................................ 88
Syngene ......................................................................................................................................... 90
LIFESTYLE PRODUCTS ................................................................................................................. 92
VIP Industries ................................................................................................................................ 92
MICROFINANCE .......................................................................................................................... 94
Credit Access Grameen ................................................................................................................. 94
NBFC .......................................................................................................................................... 97
AAVAS Financiers .......................................................................................................................... 97
Bajaj Finance ............................................................................................................................... 100
Manappuram Finance ................................................................................................................. 103
Muthoot Finance ......................................................................................................................... 105
Piramal Enterprises ..................................................................................................................... 108
Shriram Transport Finance .......................................................................................................... 111
NETWORK & COMMUNICATIONS ............................................................................................. 114
Sterlite Technologies ................................................................................................................... 114
OTHERS ................................................................................................................................... 117
ACRYSIL ........................................................................................................................................ 117
ISGEC ........................................................................................................................................... 119
Relaxo Footwears ........................................................................................................................ 121
SIS ................................................................................................................................................ 123
PLATFORM COMPANIES ........................................................................................................... 125
CarTrade Tech ............................................................................................................................. 125
Easy Trip Planners ....................................................................................................................... 127
IRCTC ........................................................................................................................................... 129

Click here to Subscribe on
www.smartsyncservices.com
Map My India .............................................................................................................................. 131
QSR ......................................................................................................................................... 134
Barbeque Nation ......................................................................................................................... 134
Restaurant Brands Asia (Burger King India) ................................................................................ 136
Devyani International .................................................................................................................. 138
Jubilant Foodworks ..................................................................................................................... 141
REAL ESTATE & CONSTRUCTION ............................................................................................... 143
KNR Constructions ....................................................................................................................... 143
Ashiana Housing .......................................................................................................................... 146
TECHNOLOGY ........................................................................................................................... 148
Intellect Design Arena ................................................................................................................. 148
L&T Infotech ................................................................................................................................ 150
Ramco Systems ........................................................................................................................... 154
Tata Elxsi ...................................................................................................................................... 156
TRAVEL & HOSPITALITY ............................................................................................................ 159
MHRIL .......................................................................................................................................... 159
Thomas Cook India ...................................................................................................................... 162
Wonderla Holidays ...................................................................................................................... 165

Click here to Subscribe on
www.smartsyncservices.com
AUTO & AUTO ANCILLARIES Bajaj Auto
Financial Results & Highlights Brief Company Introduction
Bajaj Auto Ltd has been one of the largest automobile players in India for a long time. They have been in operations since 1945. Bajaj Auto operates primarily in the entry level and premium segment motorcycles along with small and large three wheeler commercial vehicles segment. It is the largest three wheeler manufacturer and third largest motorcycle manufacturer in the world. They are now present in more than 70 countries around the world. Bajaj Auto also owns Force Motors and is a part owner of the popular Austrian motorcycle brand KTM.
Standalone Financials (In Crs)
Q4FY22 Q4FY21 YoY % Q3FY22 QoQ % FY22 FY21 YoY%
Sales 8263 8879 -6.7% 9294 -11.0% 34,353 29,017 18.3%
PBT 1897 1739 9.0% 1573 20.5% 6505 5939 9.5%
PAT 1468 1332 10.2% 1214 20.9% 5018 4554 10.1%
Consolidated Financials (In Crs)
Q4FY22 Q4FY21 YoY % Q3FY22 QoQ % FY22 FY21 YoY%
Sales 8263 8879 -6.9% 9369 -11.8% 34,428 29,017 18.6%
PBT 1954 1958 -0.2% 1788 9.2% 7615 6241 22.0%
PAT 1526 1551 -1.6% 1429 6.7% 6165 4857 26.9%
Detailed Results:
The company had a negative quarter with consolidated revenues at Rs 8263 Cr, a fall of -6.9% YoY and a decrease of -1.6% YoY in PAT for Q4.
The standalone results were mixed with a degrowth of -6.7% in revenues and growth of 10.2% in PAT.
FY22 results were great with consolidated revenues rising 18.6% YoY and PAT rising 26.9% YoY.
The company reported highest ever annual turnover and highest ever annual exports.
The volumes sold for the quarter stood at 976,651 units
The export volumes were at 587,496 units in Q4FY22 which was down -8% YoY.
EBITDA margin was at 17.5% vs 18.1% last year.
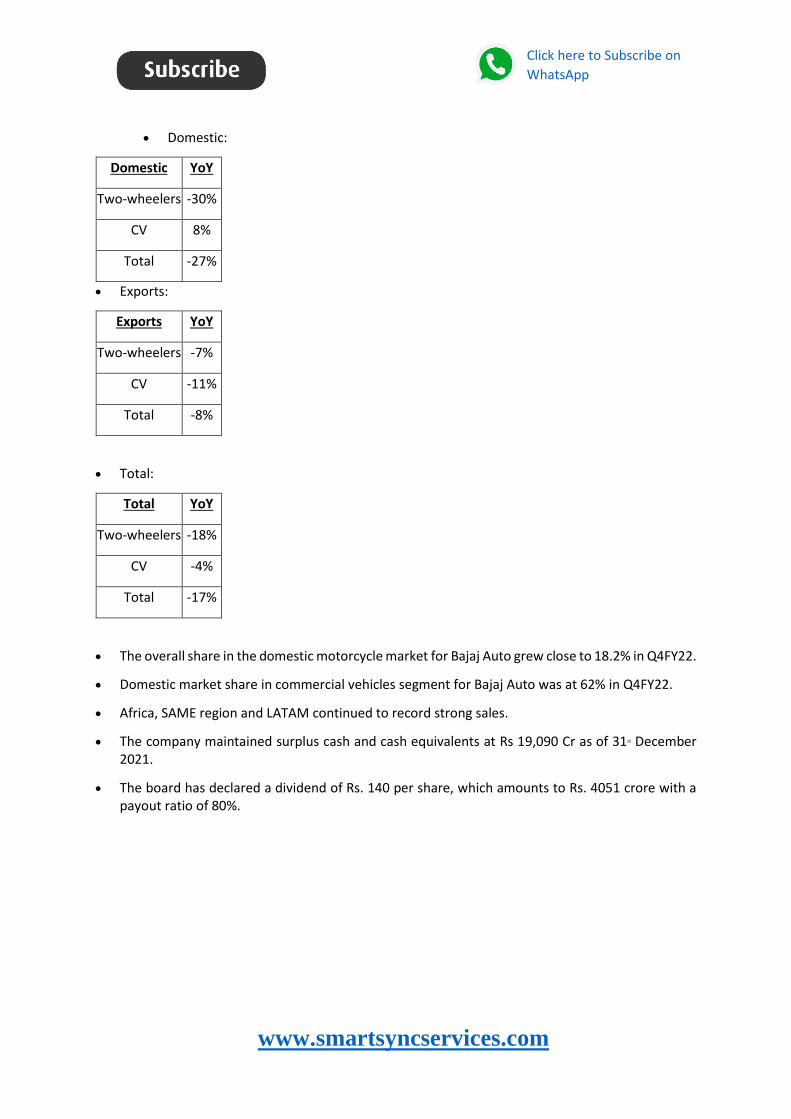
The YoY changes in volumes for Q4FY22 are as follows:
Click here to Subscribe on
www.smartsyncservices.com
Domestic:
Domestic YoY
Two-wheelers -30%
CV 8%
Total -27%
Exports:
Exports YoY
Two-wheelers -7%
CV -11%
Total -8%
Total:
Total YoY
Two-wheelers -18%
CV -4%
Total -17%
The overall share in the domestic motorcycle market for Bajaj Auto grew close to 18.2% in Q4FY22.
Domestic market share in commercial vehicles segment for Bajaj Auto was at 62% in Q4FY22.
Africa, SAME region and LATAM continued to record strong sales.
The company maintained surplus cash and cash equivalents at Rs 19,090 Cr as of 31st December 2021.
The board has declared a dividend of Rs. 140 per share, which amounts to Rs. 4051 crore with a payout ratio of 80%.

Click here to Subscribe on
www.smartsyncservices.com
Investor Conference Call Highlights
1. The company witnessed a market share improvement of 2% in all regions of LATAM, Africa, South Asia, Middle East and ASEAN.
2. Over 85% of the company’s revenues come from markets where the company is holding number one or number two positions.
3. The share of sports brands Pulsar and Dominar continued to increase quarter-on-quarter and is at its highest now.
4. The company has a large order book for Dominar from LATAM, Europe and Asia. 5. The management states that supply chain issues in Q4 compromised the performance, which
otherwise should have been better by 5%. 6. The management explains that the estimated decline in registrations at VAHAN was at 12%,
witnessed across all segments mainly due to cost increases, regulatory requirements and nonrecovery of economic hardships of the weaker section of the society.
7. Bajaj fared slightly better than the industry and declined less than the industry resulting in a market share rise from 18% in FY21 to 20% in FY22.
8. The NS125 is 22% more expensive than the average 125 cc bike, yet it contributes to 45% of the company’s 125 cc portfolio. 60% of its buyers are below 25 years of age.
9. The company’s market share in the three-wheelers CNG segment inclusive of passenger and cargo is 77%. The CNG segment itself has moved from 24% in the industry in FY21 to 62% in Q4 FY22.
10. The company has sold 3,300 electric two-wheelers during the quarter and has an order book of 15,000. The company has also added another 12 cities during the quarter bringing the overall count to 20 cities.
11. Export constituted 60% of the company’s volumes in Q4 as compared to 55% in Q3. Thus, margins have been better as export enjoys better profitability.
12. The management expects a shortfall of 15% to 20% of its requirements on account of semiconductors which will mostly impact the domestic business unit.
13. The management plans to increase costs by 3.5% due to rising metal input costs. The company has already taken a price increase of 1.5%-2% on April 1. Remaining price increases will be taken after watching demand and competition.
14. The management has a steady outlook for exports and expects to deliver double digit growth for the next FY. The company is in a leading position in 65 out 70 markets.
15. The company plans to launch electric three-wheelers in a limited way in June. 16. The company will not get affected on an overall level in the coming FY from the Sri Lankan
economic crisis. 17. The company’s dollar realization for exports was 75.5 in Q4 which was better than Q3. The
management expects the realization for the coming quarters to be at 76. 18. The management sees student demand coming back up which used to be at 10% to 15% levels of
volume pre-covid. 19. The management thinks that electric three-wheelers will start to cannibalize CNG after EV cell
costs resume their downward journey. 20. 50%-55% exports are contributed from Africa, 20% from LATAM, 22% to 25% from Middle East,
Asia, ASEAN. 21. The top 20 countries for the company are all back to pre-pandemic levels of exports. 22. The management is confident for double digit growth in the export business and three-wheeler
business.

Click here to Subscribe on
www.smartsyncservices.com
23. The management states that the main problem being faced by Chetak is the semiconductor shortage which is resulting in a six to nine months waiting period. This is heavily delaying the delivery time of the EV which annoys the customer.
24. The management aims to make the Chetak as the most aspired and preferred brand even though it is the most expensive in the segment. It plans to do this in 100 cities by delivering a very good customer experience backed by solid service.
Analyst’s View:
Bajaj Auto has been a long-performing player in the automobile sector that has established itself as a dominant player in all the segments that it operates in both in India and abroad. The company has seen a good year for export volumes which continue to grow and contribute hugely to the topline and bottom line. The company continues to see market share rise despite industry decline in Q4. It has also seen a good uptick in Chetak sales and now plans to expand it to 100 cities in total. The 3-wheeler segment is expected to see demand comeback as vaccination rises. Exports have now become the dominant segment for the company accounting for more than 60% of sales in Q4. It remains to be seen how the company handles the transition from ICE to electric in both the 2 & 3-wheeler sectors and how long will the semiconductor shortage last for the auto industry. Nonetheless, given the company’s position in export markets and its strong presence in all market segments in the two-wheeler market and three-wheeler markets, Bajaj Auto remains a pivotal auto sector stock to watch out for.

Click here to Subscribe
on WhatsApp
www.smartsyncservices.com
Balkrishna Industries
Financial Results & Highlights Brief Company Introduction
Balkrishna Industries Limited (BKT) is a tire manufacturing company based in Mumbai, India. Balkrishna Industries manufactures off-highway tires used in specialist segments like mining, earthmoving, agriculture and gardening in five factories located in Aurangabad, Bhiwadi, Chopanki, Dombivali and Bhuj. In 2013, it was ranked 41st among the world’s tire makers.
Balkrishna Industries is currently an OEM vendor for heavy equipment manufacturers like JCB, John Deere and CNH Industrial. The company currently enjoys 2% market share of the global off-the-road tire segment.
Standalone Financials (in Crs)
Q4FY22 Q4FY21 YoY % Q3FY22 QoQ % FY22 FY21 YoY%
Sales 2481 1804 37.5% 2141 15.9% 8697 5919 46.9%
PBT 488 494 -1.2% 439 11.2% 1954 1531 27.6%
PAT 374 372 0.5% 328 14.0% 1410 1155 22.1%
Consolidated Financials (in Crs)
Q4FY22 Q4FY21 YoY % Q3FY22 QoQ % FY22 FY21 YoY%
Sales 2483 1815 36.8% 2159 15.0% 8733 5955 46.6%
PBT 490 503 -2.6% 450 8.9% 1982 1555 27.5%
PAT 375 380 -1.3% 339 10.6% 1435 1177 21.9%
Detailed Results:
1. The revenue for the quarter grew 36% YoY & 15% QoQ in consolidated terms.
2. PBT was down by 1% YoY & 2% YoY in standalone and consolidated terms in Q4.
3. Consolidated PAT was down 1% YoY in the quarter while EBIDTA was up by 3%.
4. Sales volumes for the quarter came in at 77,119 metric tons which were up 13% YoY.
5. The EBITDA margin fell 820 bps YoY to 23.7% in Q4.
6. Sales breakup in FY22 for the company is:
A. Agri-65.5%, OTR-31.1%, Others-3.3%.
B. Replacement-69.1%, OEM-27.7%, Others-3.3%
C. EU-53.9%, Americas-17.3%, India-17.6%, RoW-11.2%
7. The company saw a forex gain of Rs 58 Cr in Q4.
8. The company remains debt-free with current cash holding at Rs 1932 Cr as of 31st March 2022.
9. The company is aiming to reach achievable capacity of 3.6 Lac tons per year by the end of FY23.

Click here to Subscribe
on WhatsApp
www.smartsyncservices.com
10. The Sales Volume guidance for FY23 stands at 320,000 – 330,000 MT.
11. The company declared final divided of Rs.4 per equity share.
12. The Board of Directors have decided keep the Capex investment of Rs.350 Cr announced at Old Waluj Plant in November 2021, on hold.
Investor Conference Call Highlights
1. The Waluj plant Capex has been put on hold due to higher demand scenario leading to company deciding to utilise the existing plant.
2. The company plans to incur capex of Rs.900 Cr in FY23 & 24.
3. The management expects the current elevated freight costs to stay for the next few quarters.
4. The company’s working capital costs have gone up due to higher shipping periods, higher costs of raw material & higher turnover achieved by the company.
5. The company took price increase of 2-3% in February & is planning to take another hike of 3-4% in June.
6. The cost of key raw materials stood as follows - Natural rubber around Rs.150 per kg, carbon around Rs.98 to Rs.100 per kg, and fabric approximately Rs.375 per kg.
7. 100% of carbon black consumption is from the captive usage.
8. The management states that its Bhuj power plant will be operational within 2-3 months which will help to reduce the power costs & ensure uninterrupted supply.
9. The gap between company & its competitor’s price from Tier 1 is 12-15%.
10. The company wants to maintain an EBIDTA margin of 28-30% on a sustainable basis.
11. The management expects to get 8-10% of cost savings due to captive power plant in Bhuj.
12. The company’s market share In India stands at 4-5%.
13. The employee costs have reduced from Rs.97 Cr to Rs.90 Cr QoQ due to lapse of additional incentives given during the Covid period.
14. The company will incur maintenance Capex of Rs.200 Cr in FY23.
15. The company’s total carbon black capacity is 140000 metric ton out of which 115000 is currently achievable.

Click here to Subscribe
on WhatsApp
www.smartsyncservices.com
Analyst’s View:
BKT has been a rising player in the off-road tires business for years now. The company witnessed strong inflationary pressures with PAT remaining flat despite revenues increasing by 36%. It is looking to maintain a steady EBITDA margin of 28-30% and has done a price increase of 2-3% in February to preserve margins despite rising RM & logistics costs. The management maintains that the end industries are all seeing positive trends and good tailwinds and the company embarked on its big new capex due to the growth expectations arising from these trends. It remains to be seen how the India market shapes up for BKT in going forward and how the company’s plans for the new capex pans out. Nonetheless, given the company’s sustained margin performance, its resilient market share in a slow global market, and the rapid rise of the company in India, Balkrishna Industries is a good tire stock to watch out for.

Click here to Subscribe
on WhatsApp
www.smartsyncservices.com
Craftsman Automation
Financial Results & Highlights
Brief Introduction:
Craftsman Automation started the journey in the year 1986 as a small scale industry in the southern Indian city of Coimbatore, has grown to become a leader in precision manufacturing in diverse fields.
The co. manufactures several components and sub-assemblies on a supply and job-work basis according to client specifications in the automotive, industrial, and engineering segments. Headquartered in Coimbatore with 12 plants including 10 satellite units across India. The majority of its revenues come from auto ancillary parts.
Standalone Financials (in Crs)
Q4FY22 Q4FY21 YoY % Q3FY22 QoQ % FY22 FY21 YoY%
Sales 660 538 22.7% 553 19.3% 2216 1559 42.1%
PBT 81 73 11.0% 57 42.1% 248 147 68.7%
PAT 51 47 8.5% 37 37.8% 160 97 64.9%
Consolidated Financials (in Crs)
Q4FY22 Q4FY21 YoY % Q3FY22 QoQ % FY22 FY21 YoY%
Sales 661 540 22.4% 556 18.9% 2224 1570 41.7%
PBT 81 74 9.5% 57 42.1% 252 149 69.1%
PAT 51 47 8.5% 38 34.2% 163 97 68.0%
Detailed Results:
1. The company had a decent quarter with sales increasing by 22% YoY while PAT increasing by 8%. 2. The company saw a rise in EBIDTA of 20% YoY to Rs.539 Cr. 3. The Automative powertrain segment saw a growth of 42% YoY in FY22 while EBIT stands at Rs.304
Cr Vs Rs.221 Cr YoY. 4. The Auto aluminium segment clocked revenue of Rs.440 Cr Vs Rs.330 Cr YoY but this was mostly due
to aluminium commodity price increase while EBIT increased from Rs.3 Cr to Rs.10 Cr. 5. The Industrial engineering segment saw revenue increase from Rs.405 Cr to Rs.612 Cr YoY while its
EBIT decreased from Rs.75 Cr to Rs.64 Cr. 6. ROE increased from 11% to 15% YoY. 7. Debt/ Equity improved from 0.72 to 0.63 meanwhile working capital increased due to higher
inventory levels lead by availability issues and high commodity prices.

Click here to Subscribe
on WhatsApp
www.smartsyncservices.com
Conference Call Highlights
1. The management is confident about delivering 20% growth in all the segments in the coming quarters even after factoring for commodity price hikes.
2. The management is bullish about strong recovery in the 2-wheeler segment as volumes in Q1 will almost be 90% of Q4 which is better than the generally expected volumes in Q1.
3. The company states that in the auto power train segment, it is immune from any commodity price hike as it does 100% pass through to its customers.
4. The company expects to get the benefit from price hikes in its industrial engineering segment in the current quarter due to new arrangements with its long-term clients.
5. The management expects to increase the turnover of the storage solutions business by 50% in the coming year with margins also improving from the current levels.
6. The management is guiding for a double-digit ROCE & EBIT margins in its auto aluminium biz in the coming years.
7. The capacity utilization levels for the auto powertrain & auto aluminium segment for FY22 stood at 60-70% & 57% respectively.
8. The management is seeing strong order wins in its aluminium segment & expects to increase the revenues from Rs.446 Cr to Rs.1000 Cr within 3 years timeframe.
9. The management expects some part of its revenue from Daimler will get affected due to its decision to stop production of medium duty vehicles coupled with a new deal with Cummins, However it doesn’t see this as a major threat since the majority of the Daimler biz comes from Brazil where the production will continue. Further, its reducing dependence on Daimler on the revenue front will reduce the impact on the company.
10. The company can generate annual revenue of Rs.3600 Cr at peak capacity utilization.
11. The company is expecting to repay the debt of Rs.100 Cr in FY23.
12. The management expects the ROCE of the storage solutions business to reach the level of 20% since although EBIT margins are low, so is the capital intensity of the business.
13. The Management believes it will once again reach EBIDTA margins of 17-18% in an industrial segment from current levels of 16% due to better pricing in the storage solutions business coupled with price correction in high-end assemblies.
14. The company is targeting to reduce the contribution of two-wheelers to its auto aluminium biz from high 80s to 50% by FY25.
15. The product-wise contribution to the powertrain segment’s FY22 revenue stood at commercial vehicle - ₹620 Cr, off-highway - ₹232 Cr, passenger vehicles - ₹97 Cr & farm equipment- ₹206 Cr.
16. The management believes that one of the major threats for the biz is manpower cost inflation of 20-30% which constitutes around 18-20% of total value added for the company.
17. The management expects the margins of auto powertrain & aluminium biz to be similar once the aluminium biz scales up.

Click here to Subscribe
on WhatsApp
www.smartsyncservices.com
Analyst’s View:
Craftsman Automation is a leading maker of engine parts in India. The company saw a decent Q4 with 23% YoY revenue growth but PAT growth was only at 8.5% YoY due to commodity price rises. It has however seen a phenomenal FY22 with 42% YoY revenues growth and 68% PAT growth. The company expects this margin blip to get mitigated in the near future as it passes on the cost rises to customers. The management expects the ROCE and EBIT margins for the aluminium business to rise above 10% in the near future. It remains to be seen how the company’s near term performance will pan out given the steady rise in inflation and how long will it take for the non-core businesses to grow. Given the company’s strong positioning and its rising segments, Craftsman Automation is a good auto ancillary stock to watch out for.

Click here to Subscribe
on WhatsApp
www.smartsyncservices.com
Eicher Motors
Financial Results & Highlights Brief Company Introduction
Eicher Motors Limited is an Indian manufacturer of motorcycles and commercial vehicles. Eicher is the parent company of Royal Enfield, a manufacturer of middleweight motorcycles. In addition to motorcycles, Eicher has a joint venture with Sweden’s AB Volvo - Volvo Eicher Commercial Vehicles Limited (VECV).
Standalone Financials (in Crs)
Q4FY22 Q4FY21 YoY % Q3FY22 QoQ % FY22 FY21 YoY%
Sales 3308 3035 9.0% 2933 12.8% 10577 9071 16.6%
PBT 749 631 18.7% 562 33.3% 2112 1783 18.5%
PAT 553 468 18.2% 422 31.0% 1586 1330 19.2%
Consolidated Financials (in Crs)
Q4FY22 Q4FY21 YoY % Q3FY22 QoQ % FY22 FY21 YoY%
Sales 3311 3054 8.4% 2973 11.4% 10739 9173 17.1%
PBT 806 688 17.2% 593 35.9% 2202 1798 22.5%
PAT 610 526 16.0% 456 33.8% 1677 1347 24.5%
Detailed Results:
1. The company had a decent quarter with a 8% YoY rise in consolidated revenues, which was up 11% QoQ. Similarly, PAT was up 16% YoY and 33% QoQ.
2. FY22 figures were decent with 17% YoY revenue rise and 24% YoY rise in PAT. 3. In Q4, Royal Enfield sold 1,82,125 motorcycles, which is down 10.4% YoY. 4. EBIDTA margin for the quarter increased by 210 Bps YoY to 23.7% while EBIDTA for FY22 stood at
21.1% 5. Standalone EBITDA margins for H1 rose to 19% vs 16.8% in H1FY21. 6. Overall market share was above 30% in the 125+ cc segment. 7. The company has added 33 exclusive stores and about 44 multi brand outlets in its export market. 8. VECV saw PAT for FY22 at Rs.108 Cr Vs Rs.63 Cr YoY while EBIDTA margins decreased by 120 Bps YoY
to 5.6%. 9. Total CV volumes & market share stood at 57,077 & 16.6% respectively. 10. The Board of declared a final dividend of Rs.21 per share for FY22.
Investor Conference Call Highlights
1. The company closed Q4 with a market share of 7% in overall motorcycle industry while it has around 90% market share in the 250cc space.
2. The company maintained its market share of around 30% in Light and Medium and duty tuck segments, and 7% in Heavy duty trucks.
3. The company in Q4 saw exports grow by 59% YoY to 21,787 motorcycles while the yearly sales more than doubled from 35,700 to 74,238 motorcycles.

Click here to Subscribe
on WhatsApp
www.smartsyncservices.com
4. The company’s two new product introductions in FY22 were Classic 350 and the Scram 411. 5. The company’s market share in 5–16-ton segment was 30.2%, as against 30.6% YoY, in buses market
share improved from 19.9% to 21.6%, In heavy duty trucks market share is at 7.3% Vs 7.9% YoY. 6. The company has 34% market share in the entire CNG market. 7. In the VECV segment, the company introduced almost 66 new products last year, which included 25
in light and medium duty, 16 in heavy duty & 7 in buses. 8. The company’s other expenditure have increased by Rs.200 Cr to Rs.1400 Cr in the last 2 years
primarily due to higher freight costs due to scale up of export biz where shipping rates have been very high.
9. The management expects supply chain issues with regards to semi-conductor shortage to improve post Q1 of FY23 due to higher capacities coming in the market.
Analyst’s View
Eicher Motors has been one of the highest-rated auto companies in India. This was mainly on the back of their successful turnaround of Royal Enfield and the emergence of the mid-sized (250cc-750cc) motorcycle market. The company saw a decent quarter with revenue growth close to 10% while PAT growth of 24%. The export business has done very well and has grown 59% YoY in volumes in Q4. The newly launched Classic 350 has also seen good reception. The management expects the semiconductor shortage to ease going forward. It remains to be seen how long the company will be able to keep outperforming the industry, how international expansion plans pan out in the future, and whether the new Classic 350 replicates the success of the previous version. Nonetheless, given its resilient performance in its various segments and the strong brand and industry position of the company, Eicher Motors remains a critical stock to watch out for every auto sector investor.

Click here to Subscribe
on WhatsApp
www.smartsyncservices.com
Rajratan Global Wire
Financial Results & Highlights
Introduction
Rajratan Global Wire Ltd was established in 1989, it manufactures bead wire, high-carbon steel wire with specialisation in TBW, which is bronze-coated and used in tyres and drawn steel wire (known as black wire), used in automobile, construction and engineering industries.
Standalone Financials (In Crs)
Q4FY22 Q4FY21 YoY % Q3FY22 QoQ % FY22 FY21 YoY%
Sales 145 117 23.9% 136 6.6% 541 338 60.1%
PBT 22 18 22.2% 23 -4.3% 90 47 91.5%
PAT 19 16 18.8% 17 11.8% 69 37 86.5%
Consolidated Financials (In Crs)
Q4FY22 Q4FY21 YoY % Q3FY22 QoQ % FY22 FY21 YoY%
Sales 248 184 34.8% 222 11.7% 895 548 63.3%
PBT 40 25 60.0% 40 0.0% 153 66 131.8%
PAT 37 23 60.9% 33 12.1% 124 53 134.0%
Detailed Results:
1. The company reported a strong quarter with consolidated revenue rising by 34% YoY coupled with PAT growth of 61% YoY.
2. EBDITA margins stood at 19.21% while PAT margins at 14.96%. 3. EBIDTA for the quarter grew at 46% YoY. 4. ROE stood at 36.9%. 5. Working capital days for the FY reduced from 64 to 27 days owing to increase in creditor days from
53 to 79 days. 6. A Final Dividend of Rs.2 per share has been declared in Q4.
Investor Conference Call highlights:
1. The management states that margin expansion has taken place due to a. capacity expansion in India which has reduced cost of bead wire conversion, b. reduced variable costs, c. improvement in product quality and d. product mix along with change in customer profile leading to the ability to pass on cost of
raw material to the consumer. 2. The company currently supplies at prices lower than what China, Malaysia and Vietnam charges thus
it is not expensive to customers. 3. Customer contracts are on a quarterly basis while raw material procurement is on a monthly basis. 4. The Thailand unit’s profitability is not at par with the India unit due to increase in capacity utilization
to 95%. 5. The company will increase capacity in Thailand to 60,000 tons this year.

Click here to Subscribe
on WhatsApp
www.smartsyncservices.com
6. The company doesn’t expect to get affected with EV disruption since tires will remain the same whether it is traditional auto or EV.
7. The company has received approvals in Thailand from few customers leading to better push of volumes from added capacity.
8. The company expects the tire market to grow at 7-8% CAGR for next 5 years. 9. The management also sees possibility to export products to other countries from India. 10. The management sees high customer stickiness due to relationship with marquee clients & the cost
of bead wires being only 3% of total costs for tire makers. 11. The Chennai capacity of 60000 tons will take 2-3 years to be properly utilized. 12. The company is only bead wire manufacturer in Thailand coupled with lower imports from other
countries due to supply chain disruption leading to higher share of domestic biz. 13. The management expects profitability in domestic market of Thailand will be higher due to less
volatility of freight, storage and better cost of management. 14. The management is targeting 40% of Chennai plant to be catered for exports market. 15. The management believes it is the lowest cost bead wire manufacturer in the world. 16. The company enjoys economies of scale advantage against its customers. 17. Debottlenecking will help in achieving higher utilization. 18. The company plans to produce 10,000-11000 tons of black wire. 19. The company currently supplies 500-600 tons to USA without taking any selling efforts. 20. The company is incurring Rs.300 Cr capex for Chennai plant 21. The company has availed Rs 100 Crs worth of debt from two banks and wont avail any further loans
for capex. 22. The company expects 20% volume growth in the coming year. 23. The Indian market size is 120,000 tons and market share of the company is 45% in auto tier
customer segment.
Analyst’s View:
Rajratan had a good quarter with revenue growth of 35% YoY and profit growth of close to 61% YoY in Q4. The company expects good demand from export markets due to its low prices as compared to other exporters from China, Vietnam and others. The management is optimistic for the company’s future as it is EV agnostic in nature and should not be affected by the EV disruption movement. The management maintains that the company will be able to maintain its edge as the lowest cost manufacturer in the world for bead wire. It is also expecting to add to the Thai capacity and use 40% of the production from the Chennai unit for exports. It remains to be seen how the company will be able to retain its lowest cost manufacturer position and how the export market pans out for it. Nonetheless, given the company’s strong market positioning in the domestic market and its inherent low cost manufacturing capacity, Rajratan is a good auto ancillary stock to watch out for.

Click here to Subscribe
on WhatsApp
www.smartsyncservices.com
Sansera
Financial Results & Highlights
Brief Company Introduction
Sansera Engineering Ltd is an engineering-led manufacturer of complex and critical precision engineered components across automotive and non - automotive sectors. The company manufactures and supplies a wide range of precision forged and machined components for the automotive sector and for non - automotive sector it manufactures and supplies a wide range of precision components for aerospace, off-road, agriculture, and other segments.
Standalone Financials (in Crs)
Q4FY22 Q4FY21 YoY % Q3FY22 QoQ % FY22 FY21 YoY%
Sales 519 430 20.7% 421 23.3% 1762 1368 28.8%
PBT 55 58 -5.2% 27 103.7% 171 132 29.5%
PAT 41 42 -2.4% 20 105.0% 128 98 30.6%
Consolidated Financials (in Crs)
Q4FY22 Q4FY21 YoY % Q3FY22 QoQ % FY22 FY21 YoY%
Sales 581 496 17.1% 487 19.3% 2004 1572 27.5%
PBT 52 63 -17.5% 32 62.5% 178 146 21.9%
PAT 37 47 -21.3% 24 54.2% 132 110 20.0%
Detailed Results:
1. The company recorded highest ever quarterly revenue with revenue growth of 17% YoY. 2. EBIDTA decreased by 4% while EBIDTA margins decreased by 17.2% Vs 21.1% YoY. 3. PAT decreased by 21% YoY while NPM stood at 6.4%. 4. Revenue mix product wise stood at:
A. Non-auto – 16% B. Auto-Tech Agnostic & xEV – 22% C. Auto-ICE- 62% 5. International to Domestic mix stood at 59% & 41%. 6. Item wise mix stood at A. Motorcycles – 36% B. Scooters – 12% C. Passenger vehicles – 29% D. Commercial vehicles – 13% E. Aerospace – 3% F. Off-road – 3% G. Agriculture – 3% H. Others – 1%

Click here to Subscribe
on WhatsApp
www.smartsyncservices.com
7. Net Debt/ Equity stood at 0.57 while ROCE & ROE stood 13.7%.
Investor Conference Call Details:
1. The company recently won a very big order of Rs.30 billion from a leading North American OEM for connecting rods for their upcoming project.
2. The company also bagged orders for two packages consisting of 26 aluminium forged and machined parts from BMW Motorrad amounting to approximately Rs.3 billion over the next 10 years.
3. The company incurred a capex of Rs.255 Cr in FY22. 4. The company currently has about 255 components under various stages of development including
auto and non-auto excluding aerospace & another 300 components on various stages of RFQ. 5. The geographical sales mix for FY2022 stood as follows: India 63%, Europe 24%, USA 9%, and other
foreign countries about 5%. 6. The management expects at least a CAGR growth of about 25% to 30% in aerospace for the next three
years. 7. The management expects peak capex for its North America division to be Rs.30-35 Cr & peak revenue
generation of Rs.75 Cr. 8. The management believes that the trend of a newer set of engines, platforms & outsourcing will lead
to an increase in its global market share from 3-3.5% to 10% in the coming years. 9. The company expects the margins from the USA manufacturing plant to be either stable or increase
Vs the Indian plant due to lower cost of capital & higher automation. 10. The company currently have 5 two-wheeler EV manufacturers on board and expects to work with at
least 7-8 manufacturers in the long term. 11. The management expects a drop in EBIDTA margins of its Sweden biz from current levels of 7% to a
lower no. In the current FY due to high energy prices. However, the company is working on developing alternative sources of energy whose benefits will come from FY24 onwards.
12. The company is planning to keep the debt levels constant in FY23. 13. The management expects that technology agnostic and non-auto components which stand currently
at 17% this year would at least 22% to 22.5% next year signifying 50% growth in this segment and which is in line with what the company has projected in terms of its roadmap to reach about 40% of this segment in the next three years.
Analyst’s View:
Sansera is a leading smallcap Auto ancillary provider in India. The company has seen a dismal quarter with declining margins. The company has done well to secure new 2 wheeler EV customers and also expects to onboard more in the future. The rising inflation posts a big challenge to Sansera as steel and other commodities are the main raw materials for the company. It remains to be seen how the company will be able to increase its non-auto businesses and whether it will be able to capture the rise in outsourcing in the auto sector manufacturing space in the future.

Click here to Subscribe
on WhatsApp
www.smartsyncservices.com
SJS Enterprises
Financial Results & Highlights
Introduction
SJS Enterprises Ltd. (SJS) is one of the leading players in the Indian decorative aesthetics industry in terms of revenue. It offers a "design-to-delivery" aesthetics solutions provider with the ability to design, develop and manufacture a diverse product portfolio for a wide range of customers primarily in the automotive and consumer appliance industries.
Standalone financials (in Crs)
Q4FY22 Q4FY21 YoY % Q3FY22 QoQ % FY22 FY21 YoY%
Sales 74 74 0.0% 67 10.4% 271 255 6.3%
PBT 19 15 26.7% 19 0.0% 69 64 7.8%
PAT 14 11 27.3% 14 0.0% 52 48 8.3%
Detailed Results:
1. The revenue growth for Q4FY22 was flat YoY & increased by 10% on a QoQ basis. 2. EBIDTA margins stood at 25.3% while NPM stood at 14.6%. 3. The company’s new customer additions include Stellantis, MG, Honda, Hyundai & Continental. 4. Revenue contribution from different segments for FY22 stood as follow: -
a. 2W- 43.3% b. PV- 28.8% c. CD- 22.2% d. Others- 5.7%
Investor Conference Call Highlights:
1. The management states that traditional versus the new age products, which were only 3% of its sales in FY2019 today constitute about 16% of its overall sales in FY2022.
2. The management states that for Q4FY22, the two-wheeler industry production volume declined 21% YoY while SJS sales were down only 5%, similarly Passenger vehicle industry production volume growth was flat at 2% YoY while SJS passenger vehicle sales jumped to 52.3 YoY.
3. The company’s acquisition of Exotech ltd has led to strong performance in FY22 with revenue growth of around 50% YoY & increase in EBITDA margins to 12.8% from 11.3% in FY2021 excluding the one-time gain on the sale of land.
4. The company’s medium-term growth plan for FY2023 to FY2025 involves the aspiration to grow the top line at a CAGR of about 25% organically while maintaining margins.
5. The company is expected to incur a capex of about 100 Crores over 18 to 24 months to service high demand for its chrome platings division which will generate revenue & ROCE of Rs.300 Cr & 20% respectively at full capacity.

Click here to Subscribe
on WhatsApp
www.smartsyncservices.com
6. The management states that almost 85% - 90% of the sales that the company is expecting to do for FY2023 are already business awarded to the company.
7. The company’s exports for FY2022 over FY2021 have grown by 15% and its consumer durable business grew by 24% during the same period.
8. The management states that customers prefer SJS over others due to its strong financial profile, diversified product basket, lower employee costs in comparison to suppliers in Europe & North America & its services in the form of a styling studio.
9. The company expects sustainable margins of 13-15% from its chrome plating division.
Analyst’s View:
SJS is one of the leading players in the Indian decorative aesthetics industry. The company saw a mixed quarter with revenues flat YoY while profit increased by 27% YoY. The company is gearing up for a capex of Rs 100 Cr to expand its chrome plating division to meet the additional demand. It has also added MG, Honda and Hyundai as customers in Q4. The management guides for an organic topline growth of 25% for the next 3 years. It remains to be seen whether the company will be able to match the management growth guidance and how will its export business pan out in the future. Given the company’s strong position in its industry, SJS is an interesting smallcap stock to watch out for.

Click here to Subscribe
on WhatsApp
www.smartsyncservices.com
AMC HDFC AMC
Financial Results & Highlights
Brief Company Introduction
HDFC Asset Management Company Limited (HDFC AMC) is Investment Manager to HDFC Mutual Fund, the largest mutual fund in the country. HDFC AMC has a diversified asset class mix across Equity and Fixed Income/Others. It also has a countrywide network of branches along with a diversified distribution network comprising Banks, Independent Financial Advisors and National Distributors.
Consolidated Financials (In Crs)
Q4FY22 Q4FY21 YoY % Q3FY22 QoQ % FY22 FY21 YoY%
Sales 580 545 6.4% 635 -8.6% 2433 2201 10.5%
PBT 442 423 4.4% 485 -8.8% 1855 1748 6.1%
PAT 343 316 8.5% 359 -4.4% 1393 1325 5.1%
Detailed Results
1. The company had an ok quarter with revenues up 6.4% YoY.
2. PBT in Q4 is up 4.4% YoY and PAT is up 8.5% YoY.
3. FY22 figures were decent with 10.5% YoY revenue growth & 5.1% YoY PAT growth.
4. QAAUM for the company was at Rs 4321billion which was up 4% YoY. Closing AUM was also up 3% YoY at Rs 4076 billion. Market share in both was at 11.3 & 10.8% respectively.
5. The breakup of closing AUM for HDFC by segment is as follows:
1. Equity: 51.4% vs industry average of 48.1%
2. Debt: 32.1% vs industry average of 25.3%
3. Liquid: 13.5% vs industry average of 12%
4. Others: 3% vs industry average of 14.6%
6. Market share in Actively Managed Equity Oriented AUM for HDFC was at 11.3%. Actively managed QAAUM saw a rise of 19% YoY while Closing AUM saw a rise of 21% YoY.
7. Market share in Debt QAAUM was at 14.1% and QAAUM & Closing AUM have fallen -9% and -14% YoY respectively.
8. Market share in liquid funds was at 13.3% by QAAUM which was down -11% YoY. Closing AUM for liquid funds was down -14% YoY.
9. The number of individual accounts grew 10% YoY while individual MAAUM grew 10% YoY. The company’s share of unique investors in the industry fell to 17% in Q4 vs 23% last year.

Click here to Subscribe
on WhatsApp
www.smartsyncservices.com
10. The company also maintained a long tenure SIP book with 86% of order book having flows over 5 years and 76% having flows over 10 years.
11. The distribution of total AUM across different channels saw the following changes:
1. Direct: 41.6% vs 46.5% a year ago
2. HDFC Bank: 5.9% vs 5.6% a year ago
3. Banks: 10.5% vs 10% a year ago
4. MFDs: 27.8% vs 25.9% a year ago
5. National Distributors: 20.1% vs 17.6% a year ago.
12. The company also maintained its position as 2nd biggest player in B-30 markets with an 11% market share. The company has a total of 228 branches with 150 in B30 cities and 75,000+ empanelled distribution partners. The company now has customers in 99% of pin codes in India
13. The company has seen 76% of transactions in FY22 by electronic means as compared to 82% in FY21.
14. Operating margin was at 35 bps of AUM in FY22 vs 36 bps in FY21.
Investor Conference Call Highlights
1. Industry equity net sales for the FY is INR 2.68 trillion. This includes INR 448 billion in index funds. AUM of all Debt index funds adds up to INR 276 billion. Liquid funds have grown by 11% and debt funds have lost INR 0.8 trillion.
2. SIP flows were Rs 353 billion in Q4 vs Rs 328 billion in Q3. 3. The management states that its investment style has worked over long periods of time and has
periods in between when it tests their patience. Their investing team stuck to this conviction and are now seeing rewards for the same.
4. The company is expanding its product range in thematic and sectoral funds. It has filed for 4 products with the regulator. These are MNC fund, Business cycle fund, Defence fund and non-technical consumption fund.
5. On back of the success of its Developed World Indexes fund of funds, the company has filed for a fund that would track the MSCI emerging markets index. These two funds shall give domestic investors an optimal solution to get global exposure.
6. The management plans to file a category to AI PPM with the regulator during this week. It would a fund of funds investing across the entire spectrum from early seed stage to late stage.
7. The company is awaiting regulatory approvals for setting up a wholly owned subsidiary in GIFT city. 8. The company has 1.3 million users on its investor portal and have added 350,000 users in FY22. 9. Connect, a new-age digital marketing app for partners has grown 2x in its user base with 50% weekly
engagement rate. 10. The company has 48,000+ registered partners on its website with engagement rate of 34%. 11. Employee costs for the company have increased by INR 294 million which is 13.4%. 12. Other expenses have seen an increase of 28% attributed to low base effect the previous FY. 13. The board has approved a dividend of Rs 42 per share vs Rs 34 per share last year. The dividend
payout ratio will be 64%. 14. The management sees the merger of HDFC and HDFC Bank facilitating more efficient cross-selling of
financial services products which includes mutual funds.

Click here to Subscribe
on WhatsApp
www.smartsyncservices.com
15. The balance advantage fund, which is the company’s largest product went up from 39,000 crores to 43,000 crores. Flexicap went up from 23,000 crores to 27,000 crores YoY.
16. The management is working on having 12 ETFs in total after launching 9 new ETFs.
Analyst’s View
HDFC AMC is a leading mutual fund house in India. It is the market leader in actively managed equity funds space and a trusted mutual fund provider for individual investors which is evident in its high individual account numbers and AUM. The company had an ok quarter due to muted inflows as the rest of the industry saw good inflows due to many NFOs. The major focus for HDFC AMC is to maintain & consolidate its position as one of the leading SIP book holders in India while launching new products cover its portfolio gaps. The management has admitted that although market share has been falling for HDFC AMC in the past few quarters, the company is working to introduce new funds to address gaps in its product portfolio and this should see it recapture lost market share. It is looking to launch 4 new thematic funds and an AI PPM soon. It remains to be seen whether the company will be successful in reversing its market share loss with its current set of actions and how will it maintain its hold over the industry given rising competition from tech-enabled players like Zerodha. However, given the company’s strong past track record and its leadership position in the industry, the medium and long-term outlook for HDFC AMC remains intact.

Click here to Subscribe
on WhatsApp
www.smartsyncservices.com
Nippon Life India AM
Financial Results & Highlights
Brief Company Introduction
Nippon Life India Asset Management Limited (NAM India) is the asset manager of Nippon India Mutual Fund (NIMF). Nippon Life Insurance Company are the promoters of NAM India and currently hold 75 of its total issued and paid-up equity share capital while Reliance Capital holds 0.93% of shares in the company. Equity Shares of NAM India are listed on BSE Limited and National Stock Exchange of India Limited.
Standalone Financials (In Crs)
Q4FY22 Q4FY21 YoY % Q3FY22 QoQ % FY22 FY21 YoY%
Sales 348 335 3.8% 345 0.8% 1428 1325 7.7%
PBT 228 207 10.1% 228 0% 945 842 12.2%
PAT 170 157 8.2% 168 1.1% 711 649 9.5%
Consolidated Financials (In Crs)
Q4FY22 Q4FY21 YoY % Q3FY22 QoQ % FY22 FY21 YoY%
Sales 372 361 3% 368 1% 1535 1419 8.1%
PBT 234 217 7.8% 235 -0.4% 988 877 12.6%
PAT 174 166 4.8% 173 0.5% 743 679 9.4%
Detailed Results:
1. Revenues were flattish with being up 3% YoY in Q4. Profits for the company rose 4.8% YoY. 2. FY22 performance was decent with revenue growth of 8.1% YoY and PAT growth of 9.4% YoY. 3. As of 31th March 2021, AUM was at Rs 3.46 trillion. 4. Mutual Fund QAAUM was at Rs 2,833 billion which was up 7.4% YoY. 5. NIMF added over 20 lac unique Investors & 1.6 million ETF folios in Q4. 6. Equity assets were at 42% of total AUM. Retail Assets were at Rs 638 bn which is 52% of NIMF AUM. 7. Fixed income (Debt + Liquid) assets have remained flat YoY and account for 38% of total AUM. 8. Successfully completed 7 NFOs including Taiwan Equity Fund, Flexi Cap fund, Nifty Auto ETF and Silver
ETF. 9. Garnered assets of approx. INR 40 from more than 275k investors. 10. Digital transactions now account for 58% of total purchases. Digital SIP registrations contributed to
47% of the total new SIPs registered in Q4. 11. The company enjoys a market share of 14% in ETF space with an AUM of Rs 558 bn. It also has a
volume share of 68% and a 58% share of folios in the ETF space. 12. B30 assets accounted for 17.2% of overall MF AUM vs industry average of 16.6%. 13. The overall distribution mix was 56% direct and 44% distributed assets. In distributed assets, Banks
were at 21%, National Distributors were at 20% and MF Distributors were at 59%. 14. Individual AUM accounted for 81% of distributed assets which is 50% of the total MF AUM. 15. The offshore business has an AUM of Rs 114 bn. 16. NIAIF has raised commitments of Rs 45 bn as of March ’22. 17. Nippon India Digital Innovation Fund has made investment in 6 VC funds and is in the process to
approve 3 more investments. 18. Made 5 complete exits in Real Estate portfolios during the year.

Click here to Subscribe
on WhatsApp
www.smartsyncservices.com
19. An interim dividend of INR 3.5 per share and a proposed final dividend of Rs 7.5 per share was announced in Q4.
Investor Conference Call Details
1. The management expects the growth trajectory to maintain in future.
2. NIMF’s total market share rose by 26 basis points to 7.38%.
3. NIMF added more than 7 million investors and now the highest investor base in the industry.
4. Offerings in the pipeline include, S&P EV Index fund, Innovation Fund and the Artificial Intelligence fund of funds.
5. The company has filed 11 schemes in total for regulatory approval.
6. The management states that it will focus on strong asset growth but never at the cost of profitability.
7. 70% of the Individual assets have a vintage of more than 12 months.
8. 12% of SIP folios have continued for more than five years as compared to the industry average of 8%.
9. The Gold ETF of Nippon is the biggest in its category with an AUM of Rs 66 billion.
10. Nippon India mutual fund share in ETF folios rose to 58% . Nippon India has 68% share of ETF volumes on BSE & NSE.
11. As a diversified AMC, the company manages INR 682 billion in non-mutual fund segments. The offshore business has a set of 114 billion under management and advisory.
12. As of March,’22, the company has 84,300 distributors with them, having added 500 this quarter.
13. The management states that marketing efforts are focused mainly on digital channels which are more coft effective as compared to offline advertising.
14. Profit as a ratio of Average assets under management rose from 21 basis points to 28 basis points.
15. The management states that the pressure on the yield has been due to the mix, the size of the fund, the rates at which competition is offering etc.
16. The management states that it currently has enough capital that it needs therefore is rewarding shareholders through dividends. And going forward it plans to continue the dividend payout at 100% of profits.
17. The management says that newer assets will have a lower yielding as compared to old assets, but this will be covered up by the operating leverage.
18. The management sees outflow from the long term debt category and consolidation in the liquid & ultra-short term category. They see the construct of the flows changing without any reduction in the overall levels of debt.
19. The company would not be adding more than a few physical branches as the focus would be mainly on digital.

Click here to Subscribe
on WhatsApp
www.smartsyncservices.com
Analyst’s View:
Nippon India Life Asset Management is one of the leading asset managers in the country. The company has done well to bounce back after the rebranding last year. The company saw a flat performance in Q4. The company continues to have a good hold in the ETF space which has seen good growth in market share in terms of ETF folios to 58%. It is also looking to launch several new funds and ETFs to maintain its hold on this industry. The company is focused on expanding digitally and will not be doing a big physical branch expansion going forward. The management has also stated that the new products should have lower yields than before but the company can make up for the drop with operating leverage at large scale. It remains to be seen whether the company will be able to maintain its hold over the rapidly rising ETF space and how the landscape of the mutual fund industry changes with the influx of new tech-driven players like NAVI & Zerodha. Nonetheless, given the company’s market positioning and its competitive advantage in the ETF and AIF space, Nippon Life India Asset Management is a must-watch stock for every investor interested in the AMC space.

Click here to Subscribe
on WhatsApp
www.smartsyncservices.com
BANKS HDFC Bank
Financial Results & Highlights Brief Company Introduction
standalone financials (In Crs)
Q4FY22 Q4FY21 YoY % Q3FY22 QoQ % FY22 FY21 YoY%
Sales 41086 38017 8.1% 40652 1.1% 157263 146063 7.7%
PBT 13045 10839 20.4% 13782 -5.3% 49015 41659 17.7%
PAT 10055 8186 22.8% 10342 -2.8% 36961 31116 18.8%
consolidated financials ( In Crs)
Q4FY22 Q4FY21 YoY % Q3FY22 QoQ % FY22 FY21 YoY%
Sales 43960 40909 7.5% 43365 1.4% 167695 155885 7.6%
PBT 13690 11266 21.5% 14218 -3.7% 50873 42796 18.9%
PAT 10475 8444 24.1% 10616 -1.3% 38151 31857 19.8%
Detailed Results: 1. Net standalone revenues rose 8% YoY in Q4. 2. Other income formed 28.8% of net revenues at Rs 7637.1 Cr 3. Fees & Commissions: Rs 5630.3 Cr vs 5023.3 last year. 4. FX & Derivatives: Rs 892.5 Cr vs 879.3 Cr last year. 5. Gain on sale/revaluation: Rs (40.3) Cr vs 655.1 Cr last year. 6. Miscellaneous Income: Rs 1154.7 Cr vs 1036.2 Cr last year. 7. NII grew 10% to Rs 18872.7 Cr driven by growth in advances of 16.5% and core NIM of 4% of total
asset. 8. Operating expenses were up 10.6% YoY. 9. Pre-provision Operating Profit grew 10.2% YoY. 10. Total Credit Cost ratio was at 0.96%. 11. The Bank maintained a CAR of 18.9%. 12. The Bank maintained floating provisions of Rs 1451 Cr and contingent provisions of Rs 9685 Cr. Total
provisions were at 182% of GNPAs. 13. HSL saw revenues for the quarter rose 16% YoY. However PAT de grew 3.7% YoY. 14. HDB Financial Services Net revenues grew 7.9% YoY. CAR was maintained at 20.2%
Investor Conference Call Highlights: 1. Rural & commercial banking biz grew at 30% YoY, retail bz grew at 15% YoY & wholesale biz grew at
17.4% YoY. 2. The company opened 2.4 million new liability relationships during the quarter and 8.7 million new
liability relationships during the year exhibiting growth of 25% over prior year. 3. CASA ratio stood at 48%. 4. Retail constitutes 80% of total deposits.

Click here to Subscribe
on WhatsApp
www.smartsyncservices.com
5. The bank added 8.2 lakh new card users in Q4 and 21.8 lakh cards since lifting of embargo. 6. Credit card spends grew by 28% YoY, while UPI and direct pay grew at 30% YoY. 7. Market share and advances improved from 10 to 11%. 8. Incremental share of credit growth in the economy was at 24%. 9. In deposit mobilization, market share improved from 8.8% to 9.5% during the year. 10. The LCR average for the quarter was 112%. 11. Shifting of Asset mix towards higher rated segments during the COVID period albeit at lower yield
has resulted in lower growth of NII. 12. The company added 563 branches for the quarter and for the year 734 branches and 2,043 ATMs
taking the total network strength to 6342 branches, 18,130 ATMs and 15,046 business correspondents who manage the common service centers.
13. Net NPA was at 0.32 while annualized slippage ratio for the current quarter is at approximately 1.3% about ₹ 4,000 Crores as against 1.6% in the prior quarter.
14. Write-offs in the quarters were ₹ 1,700 Crores for approximately 16 basis points. 15. Restructuring under the RBI resolution framework for COVID-19 as of March end stands at 114 basis
points of ₹ 15,700 Crores. 16. specific provision coverage ratio was at 73% 17. floating and contingent and general provisions were 1.28% of gross advances as of March quarter
end 18. As of March 2022 HDBFSL had 1,374 branches across 989 cities and towns 19. ROA for the quarter was >2% while ROE > 17% 20. Higher growth of wholesale loans Vs retail has led to reduction in margins. 21. The company is trying to generate profitability through the safer given the pandemic led volatility
since although retail loans are decreasing but the management believes increase in retail loan will also have its own perils in the form of higher cost to income as credit costs will rise.
22. Yield on commercial banking is approximately about 8% & that of agriculture is 9-10%. 23. The bank has branch productivity of 250 Crores per branch which is best in the industry as per
management. 24. The management is focused on increasing branch count since it believes that the radius around
which the customers can be serviced is currently at 4-5 Km radius which needs to come down to 1-2 Km radius because of which the branch in the catchment area can effectively manage the customers relationships better.
25. The management expects CASA ratio to taper down to historical levels of 40-42 Vs current levels of 48.
26. Wholesale biz grew substantially due to higher credit demand from PSU’s and Telecom sector coupled with lower prepayments.
27. Floating rate: fixed rate is 54:46 of total loan book now. 28. Out of the floating rate, repo linked is 29-30% while T-bills linked is 10%. 29. PayZapp is expected to be launched in Q1FY23.

Click here to Subscribe
on WhatsApp
www.smartsyncservices.com
Analyst Views:
HDFC Bank is the biggest bank in the country by market capitalization. The bank saw a mediocre Q4 with 10% YoY growth in NII and 16.5% YoY growth in advances. It has seen good growth in the wholesale segment with rising demand for credit from PSU’s and the likes coupled with lower prepayments. The management has stated that the next leg of growth in NII will be coming from the retail segment with the company working to establish itself in the payment ecosystem in the country. It also sees good potential for growth in the MSME lending space and expansion of the addressable market with programs like Kirana and Dukandar Overdraft. It remains to be seen how the company will combat the rising competition in the payments space from tech majors like Paytm and consumer finance giants like Bajaj Finance and how will the announced merger with parent HDFC pan out. Nonetheless, given the bank’s customer set, strong liquidity profile, and enduring brand image, HDFC Bank remains an indispensable banking stock for every investor.

Click here to Subscribe
on WhatsApp
www.smartsyncservices.com
Kotak Mahindra Bank
Financial Results & Highlights Introduction
Kotak Mahindra Bank is an Indian private sector bank headquartered in Mumbai, Maharashtra, India. It offers banking products and financial services for corporate and retail customers in the areas of personal finance, investment banking, life insurance, and wealth management. As of April 2019, it is the second-largest Indian private sector bank by market capitalization.
Standalone financials (in Crs)
Q4FY22 Q4FY21 YoY % Q3FY22 QoQ
% FY22 FY21 YoY%
Sales 8892 7953 11.8% 8260 7.7% 33393 31847 4.9%
PBT 3646 2228 63.6% 2832 28.7% 11361 9303 22.1%
PAT 2767 1682 64.5% 2131 29.8% 8572 6965 23.1%
Consolidated financials (in Crs)
Q4FY22 Q4FY21 YoY % Q3FY22 QoQ
% FY22 FY21 YoY%
Sales 16794 15725 6.8% 14176 18.5% 58883 56296 4.6%
PBT 5087 3363 51.3% 4410 15.4% 15948 13168 21.1%
PAT 3892 2589 50.3% 3402 14.4% 12089 9990 21.0%
Financial Results & Highlights
1. The company had a decent quarter with revenues increasing by 7 YoY while PAT rose 50% YoY mainly due to the low base last year from high provisioning.
2. Consolidated CAR was at 23.7% with tier 1 capital at 22.8%. 3. Consolidated assets grew to Rs 327,074 Cr in Q4 vs Rs 268,130 Cr last year. 4. RoA was at 2.94% vs 2.2% last year. 5. The Consolidated Book value per share was at Rs 487 per share. 6. 71% of the total PAT came from the bank vs 65% a year ago. 7. Standalone CASA was at 60.7% vs 60.4% a year ago. 8. Standalone NIM was at 4.78% vs 4.39% a year ago. NII grew to Rs 4521 Cr vs 3843 Cr last year. 9. Standalone CAR was at 22.7% with Tier I ratio at 21.7%. 10. No. of Customers stood at 32.7Mn Vs 26Mn. 11. Net NPA stood at 0.64% Vs 1.21%. 12. The company’s COVID-19 provision reversed stood at 453 cr while it continues to carry Rs.547 cr. 13. Credit cost on advances for Q4FY22 27 bps annualised (excluding COVID reversal).

Click here to Subscribe
on WhatsApp
www.smartsyncservices.com
14. Standalone GNPA was at 2.34% vs 3.25% last year. 15. Average CA grew 32% YoY while SA and TD grew 11% and 20% YoY respectively. 16. Insurance AUM as of 31st March was at Rs.51,800 cr registering a growth of 20.3% YoY. GWP grew
17.3%. 17. Kotak securities saw an overall market share in Q4FY22 of 3.7% vs 2.2% last year. 18. Kotak Mahindra Capital saw many big issues including Adani Wilmar & Manyavar. 19. Kotak Mahindra Prime & Investments saw ROA of 2.1% & 3.5% respectively. 20. Kotak AMC saw the Overall Market share on AAUM rise to 7.4% in Q4FY22 vs 7.3% last year. AAUM
grew by 35% YoY compared to industry growth of 20%.
Investor Conference Call Highlights:
1. The company's slippage ratio for the 4th quarter on an annualized basis is down to 1.08%. 2. The management believes that the company will be able to weather higher interest rate situations
due to CASA ratio being over 60% & shorter tenure loan book. 3. During the quarter, the added 2 million customers as against 1.1 million customers in the same
quarter last year 4. The company's average fixed rate savings deposit grew YTD YoY 11%, current accounts 26%, and
sweep term deposits 15% 5. The company in Q4 acquired six lakhs plus FASTag, maintaining its position as the fourth highest
issuer. 6. The company's embedded value in the insurance biz during the year grew by 8.2% to Rs.10,679
crores. 7. The company's VNB margin grew by 29.5% to Rs.895 crores for '21-22. While VNB margin was at
31.1%. 8. Individual conservation ratio was at 89.4% while the Share of the protection business was 32.9%. 9. Gross return premium grew 17.3% YoY during FY'22 while Individual APE new business growth for
Q4'22 was 11.8% against private industry growth of 8.5%. 10. Individual renewal premium grew by 15.6% and AUM for the year grew by 20.3% to Rs.51,800
crores. 11. OPEX ratio improved to 12.8% Vs 13.6% YoY.. 12. The cash market share for this quarter was 11.5% against 9.7% for the same period last year 13. The KS overall market volume on a daily basis was Rs.1,74,000 crores against Rs.49,000 crores in the
same quarter last year. 14. The company's equity AUM market share increased to 5.4% while SIP inflows for March '22 grew
34% YoY to Rs.7.2 billion. 15. The company’s Operating tech cost as a part of the overall tech cost is about 7.5%. 16. The management currently has no plans of increasing savings deposit rates. 17. The management believes that the government agency business will play a major role in driving
deposit growth in the coming period. 18. The company’s growth strategy is to increase the unsecured retail as a percentage of its balance
sheet.

Click here to Subscribe
on WhatsApp
www.smartsyncservices.com
Analyst’s View
Kotak Mahindra Bank is the third-biggest private bank in the country by market capitalization. It has
deservedly earned its stellar reputation over the years. The bank had a decent performance in Q4 with
a 7% increase in Q4 revenues despite a drop in other income due to MTM loss. But PAT was up 50%
with lower provisioning in Q4 and a reversal of provisioning. The bank has seen good growth across all
its lending segments.. The bank has also launched several new digital initiatives and will continue this
momentum for 6 more months at least. It remains to be seen how the threat of inflation and rising
interest rates will affect the bank and how long will it take for the bank to bring in operating leverage
from its digital technology to compete with other players with its low branch density plan. Nonetheless,
given the bank’s track record and the capability and vision of the management over the years, Kotak Mahindra Bank remains a pivotal banking stock for every Indian investor.

Click here to Subscribe
on WhatsApp
www.smartsyncservices.com
BROKING Angel One
Financial Results & Highlights Brief Introduction:
Angel One also known as Angel Broking is one of the largest retail broking houses in India in terms of active clients on NSE as of June 30, 2020 (Source: CRISIL Report). It has a network of 11,000 Authorised Persons and has had more than 4.39 million downloads of the Angel Broking mobile application and nearly 1 million downloads of the Angel BEE mobile application as of June 30, 2020. It manages ₹ 132,540 million in client assets and over 2.15 million operational broking accounts as of June 30, 2020.
Standalone Financials (In Crs)
Q4FY22 Q4FY21 YoY % Q3FY22 QoQ % FY22 FY21 YoY%
Sales 676 413 63.6% 601 12.4% 2281 1289 76.9%
PBT 270 138 95.6% 217 24.4% 823 398 106.7%
PAT 202 99 104% 162 24.6% 614 290 111.7%
Consolidated Financials (In Crs)
Q4FY22 Q4FY21 YoY % Q3FY22 QoQ % FY22 FY21 YoY%
Sales 685 418 63.8% 607 12.8% 2305 1298 77.5%
PBT 274 142 92.9% 220 24.5% 836 411 103.4%
PAT 204 101 101.9% 164 24.3% 625 295 111.8%
Detailed Results:
1. The company had another excellent quarter with 63% YoY growth in consolidated revenues and 101% YoY growth in consolidated profits.
2. It has a 10.1% share in NSE Active Client Base in Mar’22. Angel has a total client base of 9.2 million as of Mar ’22 across 98% of pin codes in India.
3. Q4 saw the top 5 digital brokers hold around 68% share of Incremental NSE Active Clients. The top 5 brokers now have a share of 58% In Cumulative NSE Active Clients Base.
4. Overall equity market share of Angel has risen to 20.9% in Q4FY22 vs 20.8% a year ago. F&O market share has risen to 21.2% in Q4FY22 from 20.9% a year ago.
5. Cash market share has gone down to 13.7% vs 16.3% a year ago while commodity market share has risen to 42.4% vs 25.5% a year ago.
6. Total gross customer additions in Q4 were at 1.4 million. 7. ~94% Of Gross Client Addition Contributed by Tier 3 & Tier 2 Cities in Q4FY22. 8. Around 92% Of Gross Clients Added Under Flat Fee Plan. 9. The total client base grew 18% QoQ. Average daily turnover grew 24% QoQ in Q4 while number of
trades grew 17% QoQ. 10. Segment revenue breakup was 69% from Gross Broking, 16% from Interest, 4% from Depository, 1%
from distribution, 8% from ancillary transaction income and 1% from other income. 11. Gross Broking split was 78% from F&O, 18% from Cash, 4% from Commodity & 1% from Currency. 12. Cost to net income was at 50.3% for FY22 vs 54.2% in FY22.

Click here to Subscribe
on WhatsApp
www.smartsyncservices.com
13. The company’s borrowings have risen to Rs 1257.6 Cr in March’22 from Rs 1171.5 Cr in March’21. 14. Angel has cash and cash equivalents of Rs 4,875 Cr as of 31st March 2022. 15. It had a book value of Rs 191.2 per share. 16. Angel announced an interim dividend of Rs 9.25 per share with a 37% dividend payout.
Investor Conference Call Highlights:
1. The emergence of FinTech players and the dynamic changes they brought to the economy were largely responsible for the rapid transformation of financial landscapes.
2. The company’s lifetime app downloads were higher by 19% to 22 million downloads. 3. The company’s ranking in incremental active clients on NSE during the last couple of months improved
to second, outsmarting many aggressive competitors. 4. The company is in the penultimate phase for its new mobile app, the forerunner to the much waited
super mobile app. 5. For the expansion of its tech capacity and infra, the company is building a new state of the art data
center and global disaster recovery capabilities. 6. The company has taken some improvements in its KYC journey like allowing clients to choose between
the monthly and quarterly settlement of funds and the option to add a nominee. 7. The company has included the direct mutual fund product in its distribution business, which went live
last week on the Angel BEE app. 8. The average revenue per client for the quarter was INR 513. This was primarily due to a higher share
of new market clients, which were about 85% of the gross acquisitions for the quarter. 9. The company hired talents from Uber, Ola and Amazon and yet had a reduction in the workforce as
the company focused on hiring high-skilled 10x engineers that give 10x output as compared to normal engineers.
10. The management states that the average revenue per user is in a slight decline and is stabilising because of the gestation period of the users who are new and getting used to the platform.
11. The management believes that the new clients have a great potential for the company ahead as they are mainly between 25-29 years old which shall provide lifetime value to the company.
12. The company will incur INR 60 crore as ESOP costs over the next four years. In FY22 this cost was INR 15 to 16 crore.
13. These ESOP costs are being incurred for granting RSUs to employees, increasing their skin in the game, thus helping company productivity and results.
14. The company is taking a data science-oriented approach to increase its client activation rate. 15. The company is the market leader in the commodity space mainly because of its early adoption of
commodity options to the mobile platform for its customers. 16. Commodity futures exchange volumes seem to be stagnating at 20,000-25,000 crore a day whereas
commodity options have grown to 15,000 crores a day of which Angel was a big beneficiary. 17. Most other brokers require their clients to earmark their funds towards the commodity segment,
which is not the case for AngelOne. This enabled clients to take commodity trades fuelling the company’s market share growth to above 40%.
18. The management continues to have a sharp focus on its core business of broking even though it sees opportunities in different products. It believes that it is very easy for them to launch 10 different products and do a poor job in all of them, thus is razor-focused on winning broking.
19. The management plans to be in the 50% to 60% client activation rate for the next FY. 20. The process for AMC is one and the company expects to receive the in-principle approval in a few
months.

Click here to Subscribe
on WhatsApp
www.smartsyncservices.com
21. The Super-app which the company will be launching will be of great importance as it will have new features and capabilities being a solid product for the clients.
22. Angel is looking to include customer experiences in the super-app that were not done at the time but are mainstream today. Another reason for doing so is to better position themselves for the newcomer customers in the market today.
23. The super-app will remain an important focus of the management for some time as it will have a huge impact on the customer experience and will greatly impact the customer activation rate.
Analyst’s View:
Angel Broking is one of the front runners of the online broking space in India. They have been in the broking business for over 25 years now and have time and again shown remarkable adaptability by pivoting its business model and transforming from a traditional physical broking house to an AI/ML-led digital-only broker that has its eyes set on becoming a fintech platform. Angel continued its great run with a 63% YoY rise in revenues and 1.4 million new customer additions in Q4. The company continues to source almost 94% of its new additions from tier 2 & 3 cities and is focussing on the launch of the super app in the next few quarters. The super-app which the company is going to launch will make a huge difference and will greatly improve customer experience. Angel is also looking to differentiate itself on service quality and customer journey and the ability to allow for small-ticket investment profiles which will be instrumental for expansion in Tier 2 and beyond cities. It remains to be seen what impact will the turbulent state of global markets will have on the broking industry and whether Angel will be able to maintain its growth momentum amidst the highly competitive space with seemingly everyone in the financial sector from traditional banks like HDFC Bank & NBFCs like Bajaj Finance to fintech unicorns like Paytm & Zerodha looking to get a slice of the pie and go a similar way to become fintech giants. Nonetheless, given the sustained momentum Angel has in this crowded space and the history of successful pivots along with the vision of the new tech-oriented CEO, Angel Broking may prove to be a reliable bet in the ever-rising fintech space.

Click here to Subscribe
on WhatsApp
www.smartsyncservices.com
Motilal Oswal
Financial Results & Highlights
Brief Company Introduction
Motilal Oswal Financial Services Ltd. was founded in 1987 as a small sub-broking unit, with just 2 people running the show. Today we are a well-diversified financial services firm. The company has a network spread over 550 cities and towns comprising 2500+ Business Locations operated by our Business Partners and us and 16,00,000+ customers.
Standalone financials (in Crs)
Q4FY22 Q4FY21 YoY % Q3FY22 QoQ % FY22 FY21 YoY%
Sales 532 373 42.6% 556 -4.3% 1869 1047 78.5%
PBT 38 3 1166.7% 54 -29.6% 112 -70 -260.0%
PAT 79 7 1028.6% 54 46.3% 153 65 135.4%
Consolidated financials (in Crs)
Q4FY22 Q4FY21 YoY % Q3FY22 QoQ % FY22 FY21 YoY%
Sales 1055 1148 -8.1% 1034 2.0% 4320 3634 18.9%
PBT 370 550 -32.7% 300 23.3% 1616 1458 10.8%
PAT 302 469 -35.6% 239 26.4% 1312 1265 3.7%
Detailed Results:
1. Company saw a good quarter on an operational front with operating PAT growing by 41% YoY however due to comparatively poor fund based returns, the overall PAT de grew by 35%.
2. Segment wise ROE & % of net worth employed for FY22: A) Capital markets - 258% & 3% B) Asset & wealth management – 173% & 6% C) Housing finance - 10% & 20% D) Fund based investments – 13% & 72%
3. Cash market share was up by 30 Bps to 6%. 4. PAT in capital markets business grew by 79% which involves brokerage (22%), distribution (+47%) , interest income (+47%) & investment banking. 5. Overall ARPU stood at 26,518 Vs 28,093 YoY due to higher base effect. 6. Total retail client base stood at 2.85 Mn while active clients stood at 0.9 Mn. 7. Total distribution AUM stood at Rs.168 Bn. 8. SIP AUM & live SIP count stood at Rs.41.5 Bn & 1,65,117. 9. PAT from AMC business decreased by 14% YoY on a quarterly basis. 10. AMC EBITDA Margin and Opex to AAUM stood at 39% & 29% for FY22. 11. Share of Alternatives share in AUM stood at 37% while Performance linked AUM share in alternatives stood at 30%. 12. Private Equity & real estate investment unit PAT increased by 184% YoY on a quarterly basis.

Click here to Subscribe
on WhatsApp
www.smartsyncservices.com
13. Wealth management PAT decreased by 12% YoY in Q4FY22 while PAT for FY22 increased by 116% YoY. 14. Wealth AUM stood at Rs.344 Bn which was up 36% YoY while revenue per RM stood at Rs.13.5 Mn Vs Rs.10.3 Mn YoY. 15. Disbursements in Home finance business stood at Rs.2.1 Bn in Q4FY22. 16. GNPA & NNPA stood at 2.6% & 1.6% respectively as per new RBI norms. 17. Collection efficiency in March was at 104%. 18. Yields for FY22 stood at 13.9% while cost of funds & NIM stood at 8.2% & 7.3%. 19. ALM for 1-3 years & 3-5 years was positive. 20. 67% of the liability mix constituted of floating rate liabilities while net leverage stood at 2.3. 21. Opex & cost to income stood at 36% while ROA & CRAR stood at 2.6% & 52%.
22. Total equity investment including alternate funds for FY22 stood at Rs.40.5 Bn while total unrealized gain on these investments stood at Rs.17.1 Bn.
Investor Conference Call Details:
1. The company raised Rs.14 Bn in FY22 at an average cost of 7% vs an overall Cost of funds of 8.2%.
2. The company’s ratings were upgraded by CRISIL & India Ratings to AA/Stable.
3. The company’s net sales in AMC biz for Q4 was Rs.1000 Cr while its average AUM was lower due to mark-to-market impact.
4. In the private equity division, the company charges a 2% management fee from the date of the first close on the entire fundraises and a 20% profit share at the end of the life of the fund meanwhile the life of the fund is 10 years which is extendable by two years.
5. In the real estate fund, the fees would be 1% yield & 10% of the profit share meanwhile the life of this fund is 4-5 years & payout is relatively more frequent and faster as compared to private equity as this fund is primarily for income generation.
6. The management states that the AUM constitutes 60% external and 40% captive because historically when the business was born, it used to be 100% captive and over some time that number has come down to 40% and it expects this to trend lower in the coming years.
7. The management believes that the AMC biz will turn around in the coming time due to the recent healthy performance of its funds.
8. The company’s key operating priority is - ‘Performance First, Yield Next, and AUM follow Suit.’
9. The income from the IPO biz in FY22 was Rs.70 Cr.
10. The management believes that it can double its disbursements from Rs.600 Cr in FY22 to 1200 Cr in the coming year meanwhile increase its leverage from 2.4X to 3.5X & the decreased cost of borrowings will help it achieve ROE of 15-16% in the coming period.
11. The management states that its active & passive funds complement each other since it doesn't have any international active funds and its passive funds are predominantly International.
12. The company’s cost of acquisition of clients & ARPU through the digital side is Rs.2000 & 7000 respectively while ARPU through advisors is Rs.17,000.

Click here to Subscribe
on WhatsApp
www.smartsyncservices.com
13. The bounce rate in the housing finance division is 13% on the new book & 19% on the overall book.
Analyst’s View:
Motilal Oswal is one of the most recognizable names in the broking industry in India. The company had a dismal quarter on the back of the continued decline of stock markets around the world and India. The other businesses including private equity and real estate lending businesses are doing good with NPAs in the latter at reasonable levels. The AMC business however has been on the decline along with the rest of the AMC industry. It remains to be seen how the company will fare in the near future with the widespread expectation of an oncoming recession and capital markets will staying down. Nonetheless, given the long history and brand image of the company along with its wide physical presence, Motilal Oswal is a good NBFC/broking stock to watch out for.

Click here to Subscribe
on WhatsApp
www.smartsyncservices.com
CEMENT Dalmia Bharat
Financial Results & Highlights Introduction
Founded by Jaidayal Dalmia in 1939, Dalmia Bharat possesses India’s fifth largest installed cement manufacturing operational capacity of 30.75 million tonnes per annum (MTPA). This capacity is spread across 13 state-of-the-art manufacturing plants in nine States. Dalmia Bharat contributes ~6% of the entire country’s cement capacity. It has a brand portfolio of three marquee brands: Dalmia Cement, Dalmia DSP and Konark Cement. These brands are available as Portland Pozzolona Cement, Portland Slag Cement, Composite Cement, and Ordinary Portland Cement in select markets.
Standalone Financials (in Crs)
Q4FY22 Q4FY21 YoY % Q3FY22 QoQ % FY22 FY21 YoY%
Sales 127 55 130.9% 36 252.8% 349 189 84.7%
PBT 96 5 1820.0% 7 1271.4% 195 34 473.5%
PAT 96 5 1820.0% 37 159.5% 183 25 632.0%
Consolidated Financials (in Crs)
Q4FY22 Q4FY21 YoY % Q3FY22 QoQ % FY22 FY21 YoY%
Sales 3433 3190 7.6% 2764 24.2% 11441 10291 11.2%
PBT 360 420 -14.3% 93 287.1% 1146 1364 -16.0%
PAT 599 641 -6.6% 61 882.0% 1165 1185 -1.7%
Detailed Results:
1. The company had 7% YoY rise in revenues and a 6% YoY fall in PAT. 2. Dalmia Bharat saw quarterly volume growth of 2.3% YoY while EBITDA stood at Rs 683 Cr. 3. The company commenced commercial production of 2.9 MnT Murli Cement plant in Maharashtra on
15th January 2022. 4. Total Cement Capacity increased to 35.9 MnT while Total Clinker Capacity stood at 18.9 MnT. 5. Annual volumes grew by 7.3% YoY. 6. WHRS & Solar capacity for FY22 stood at 32 & 31 MW each. 7. EBIDTA margins stood at 20.1%. 8. Quarterly variable costs increased by 20.9% YoY while logistics costs increased by 8.2%. 9. EBITDA/Ton was at Rs 1036. 10. Net debt to EBITDA stands at -0.59X. 11. The Board has proposed a final dividend of Rs. 5 per share.
Investor Conference Call Highlights:
1. The company has identified 3 strategic long-term targets which are
a) to be a pan-India pure-play cement company

Click here to Subscribe
on WhatsApp
www.smartsyncservices.com
b) to maintain a significant presence in every market it serves
c) to grow its capacity to between 110-130 MTPA by 2031
2. Rising input costs impacted the cash flows and EBITDA for Dalmia due to the lag in passing on the cost increases.
3. The cement industry demand outlook is expected to grow at a CAGR of 8-9% in the coming future. 4. Petcoke prices have doubled YoY in FY22 to $246. 5. The green fuel% stood at 16.4% in Q4. 6. The company has won the Brinda-Sisai Coal Block in Eastern India recently. 7. Overall fuel consumption has almost doubled from $78 in FY21 to $141 in FY22. 8. Dalmia has also managed to double its renewable capacity from 31 MW to 62 MW in FY22. 9. The management states that restricting the product mix and improvement in operating KPIs have
helped in cost savings of Rs.64 per tonne. 10. The company has seen cement price increase from Rs 30-50 per bag in Q4 vs Q3 and this trend is
expected to continue. 11. The company outperformed the industry in North & south region where it saw double digit
volume growth whereas it lost some market share in Eastern market. 12. The company remains on track to achieve its medium-term goal of reaching 48.5 million tonnes
capacity by March ‘24. 13. The company’s brand – “DSP” as a % of trade sales stood at 20% Vs 18% YoY. 14. The company’s CO2 emissions per tonne of cement has reduced to 489 kg while its water positivity
rate of 12.5x. 15. The company’s incentive collection for FY22 was Rs.237 Cr. 16. The freight costs increased by Rs.80 per tonne due to movement of higher quantities from
railways along with lead distance increasing by 20 Km. 17. Capex for FY22 was at Rs 1900 Cr and the projected capex for FY23 is at Rs 3000-3500 Cr. 18. The management states that the delta from CPP or grid, and the WHRS and solar would be ranging
between Rs.6 to Rs.7. 19. The company will add capacity of 41MW in WHRS & 66Mw in solar plant & expects saving of close
to Rs.150 Cr in FY23 & Rs.240 Cr in FY24. 20. The company expects to clock capacity utilisation rate of 60-70% in its Murli plant in FY22. 21. The management has reassured that although it is committed to maintain d a net debt EBITDA of
less than 2 times, it will not be forgoing any acquisition opportunities to maintain this ratio. 22. The management expects to see good demand from the rural side as tractor sales for M7M have
risen 50% YoY in April which is a good sign for overall rural demand recovery. 23. The upcoming H1 is expected to be tough according to the management due to supply side
inflation concerns from the ongoing war and the interest rate hike cycle. 24. The company’s trade mix for the quarter stood at 65%, and the lead distance for the quarter was
318 km. 25. The company’s CO2 emissions reduction was relatively lower due to usage of old plants of its
Murli & Kalyanpur facility. 26. The company’s blending % in cement stood at 78%. 27. The contribution of pet coke towards total power mix stood at 64%.

Click here to Subscribe
on WhatsApp
www.smartsyncservices.com
Analyst’s View:
Dalmia Bharat is one of the leading cement makers in India. The company has had a decent quarter with an 7% YoY rise in revenues. The company has done well to maintain Debt to EBITDA at negative levels and has seen commercialization of a 2.9 MT capacity in Murli plant in Maharashtra in Q4. But the company has not been able to grow in terms of utilization level which has remained at 60% since 2019. It is planning to reach 100% blended cement sales by 2025 from the current 75%. It remains to be seen whether the company will be able to keep its debt low while trying to maintain its ambitious capacity growth, whether its expansion plans will bear fruit according to the management and board expectations & how will it weather the current inflationary climate. Nonetheless, given the strong brand image of the company, the efficient utilization of its plants, and the high EBITDA/ton and high carbon efficiency of its operations, Dalmia Bharat can prove to be a pivotal cement sector stock going forward.
ncy of its operations, Dalmia Bharat can prove to be a pivotal cement sector stock going forward.

Click here to Subscribe
on WhatsApp
www.smartsyncservices.com
Heidelberg Cement
Financial Results & Highlights Introduction
Heidelberg Cement India Limited is is a subsidiary of HeidelbergCement Group, Germany. The Company has its operations in Central India at Damoh (Madhya Pradesh), Jhansi (Uttar Pradesh) and in Southern India at Ammasandra (Karnataka).
Standalone Financials (in Crs)
Q4FY22 Q4FY21 YoY % Q3FY22 QoQ % FY22 FY21 YoY%
Sales 632 615 2.8% 557 13.5% 2346 2163 8.5%
PBT 98 130 -24.6% 42 133.3% 335 391 -14.3%
PAT 94 140 -32.9% 30 213.3% 252 315 -20.0%
Detailed Results:
1. The company had a very poor quarter reporting revenue growth of 2% YoY and profit de-growth of 33% YoY.
2. The share of green power was at 23%. 3. Capacity utilisation for FY22 was 76%. 4. The company’s EBIDTA per tonne stands at Rs 961 per tonne which is down by 21% YoY. 5. Sales volumes decreased by 1% YoY whereas gross realizations increased by 2.4% YoY. 6. Total costs per tonne were up 13.6% YoY. 7. EBIDTA margins decreased by 597 bps YoY to 20.2%. The biggest reason for this fall was rise in
power & fuel costs & input cost inflation. 8. The company has net cash balance of Rs 134.4 Cr. 9. MYCEM accounted for 21% of trade volumes. 10. Trade segment accounted for 80% of total sales having a de growth of 296 bps YoY. 11. Road volume stood at 46% whereas coal as a % of power mix stood at 62%. 12. The board has recommended a dividend of Rs.9 per share.
Investor Conference Call Highlights:
1. The company had a clinker factor of 61.4%, CO2 is 511 Kg per ton of cement while the water positivity rate stood at 4.4X.
2. The management expects weak April month sales due to the construction slowdown.
3. The management states that Since March, there has been an increase of around Rs.20- 25 per bag of cement
4. The company’s debottlenecking initiatives will yield results by April-May of next FY.
5. The management expects environmental clearances in Gujarat to take 1-1.5 Years meanwhile it will then take 2 years to get the plant up & running.
6. The new reduced diesel prices will help result in a cost reduction of Rs.2 per bag.

Click here to Subscribe
on WhatsApp
www.smartsyncservices.com
7. The company expects to incur Rs.100 Cr capex in FY23 out of which Rs.50-60 Cr will be maintenance capex.
8. The management believes that prices have remained stagnant despite high inflation in costs due to excess capacity in the industry where the players want to keep their plants running leading to no price hikes.
9. 100% of the coal requirement was sourced domestically.
10. The lead distance remains unchanged at 360-375 Km.
11. The company doesn’t expect any market share loss despite not adding any capacities in the next 2 years as its current utilisation rates stand at 72% for the full year & if the market grows at 6-7-8% for the next 2 years, even then the company will reach utilisation rates of only 90%.
12. The company expects price competition to not intensify post the Adani – Lafarge deal due to higher cost of acquisition leading to higher cost of capital & requirement of larger profits.
Analyst’s View:
Heidelberg Cement is one of the leading cement makers in South and Central India. It had a poor quarter with revenues increasing by 8% YoY & EBIDTA margins were down 597 bps to 20.2% due to higher input costs & fuel costs. Like everyone else in the cement industry, HCIL is also facing the threat of coal supply disruption with costs of its raw materials increasing drastically. The management believes that input costs will remain at elevated levels even in the coming quarters and an increase in realizations is going to be an uphill task due to poor demand from the market. The company remained unable to pass on the rise in RM costs due to poor demand in Q4. It remains to be seen how the company will face increased competition from pan India players and the raw materials and power cost inflation. Nonetheless, given the strong brand image of the company, the efficient utilization of its plants, and the pricing power it has, Heidelberg Cement India can prove to be a pivotal cement sector stock going forward.

Click here to Subscribe
on WhatsApp
www.smartsyncservices.com
Orient Cement
Financial Results & Highlights
Brief Company Introduction
Orient Cement Ltd is primarily engaged in the manufacture and sale of Cement and its manufacturing facilities at present are located at Devapur in Telangana, Chittapur in Karnataka and Jalgaon in Maharashtra.
Consolidated Financials (in Crs)
Q4FY22 Q4FY21 YoY % Q3FY22 QoQ % FY22 FY21 YoY%
Sales 806 834 -3.4% 620 30.0% 2735 2342 16.8%
PBT 114 153 -25.5% 67 70.1% 404 333 21.3%
PAT 73 100 -27.0% 44 65.9% 263 214 22.9%
Detailed Results:
1. The company saw a weak quarter with revenue decreasing by 3% while PAT decreasing by 27% on YoY basis.
2. Net debt stands at Rs.260-270 Cr. 3. EBIDTA decreased by 24% YoY & increased by 29% on a QoQ basis.
Investor Conference Call Highlights
1. The company saw YoY decline in its current quarter’s performance due to higher base of previous year coupled with several headwinds in the current quarter.
2. The management states that it is declining several orders recently due to pricing issues in the market & considering the replacement cost of coal, they believe it would be prudent to not accept these orders.
3. The company’s strategy of being selective about its customers has led to lower volumes but at higher profit margins.
4. The volume rise for FY22 stood at 8% YoY. 5. EBIDTA per ton for Q4 stood at around Rs.950 while that for FY22 stood at Rs.1100 which is a
decrease of Rs.20 on a YoY basis. 6. The management states that the company’s premium product – “ Strongcrete “ saw healthy growth
of 64% YoY while its contribution to total B2C sales stood at 14%. 7. The company’s blended cement sales as a % of total sales has been close to 63%. 8. The company’s B2B:B2C sales mix is close to 40:60. 9. The company’s geographical wise sales mix stood as 53% in West, 37% in South and the rest 10%,
largely in Central India. 10. The company has dispatched 25% of its material using railways in a bid to optimize freight & logistics
cost. 11. The fuel mix for Q4 stood as AFR 17%, domestic coal 51%, pet coke 24% and imported coal at about
8%. 12. The management states that some components of AFR are available to company at negative costs
like liquid hazardous waste because it has invested money into creating the infrastructure, which can handle this liquid hazardous waste.

Click here to Subscribe
on WhatsApp
www.smartsyncservices.com
13. The management states that it is completely on track to commission the enhanced Brownfield capacity at Devapur and a grinding unit at the Tiroda power plant of Adanis & expects both these project to be up & running by FY24.
14. The company will incur capex of Rs.750 Cr in FY22. 15. The company plans to commission its 10 MW WHRS plant by the end of FY23.
Analyst’s View
Orient Cement is a leading cement maker in the West and South Zones. The company had a tepid Q4 which saw revenues decline 3.4% YoY while profits fell 27% YoY due to difficulty in raising selling prices and input cost inflation. The company is set on its capex plans with which it expects to increase capacity in 2024. It has also seen good response to its premium offering. It remains to be seen how will the ongoing consolidation in the cement industry and the entry of Adani in the sector affect smaller players like Orient and whether the company’s future plans will pan out according to expectations. Nonetheless, given its strong position in its native zones, and its good EBITDA/ton, Orient Cement is a good small cap cement stock to watch out for.

Click here to Subscribe
on WhatsApp
www.smartsyncservices.com
Ultratech Cement
Financial Results & Highlights Brief Company Introduction
UltraTech Cement Ltd. is the largest manufacturer of grey cement, Ready Mix Concrete (RMC) and white cement in India. It is also one of the crown jewels of the Aditya Birla Group, one of India’s leading Fortune 500 companies.
The company has a consolidated capacity of 117.35 Million (including Bara) Tonnes Per Annum (MTPA) of grey cement. UltraTech Cement has 23 integrated plants, 1 clinkerisation plant, 27 grinding units and 7 bulk terminals, post the Century merger. Its operations span across India, UAE, Bahrain, Bangladesh and Sri Lanka. UltraTech Cement is also India's largest exporter of cement reaching out to meet the demand in countries around the Indian Ocean and the Middle East.
In the white cement segment, UltraTech goes to market under the brand name of Birla White. It has a white cement plant with a capacity of 0.56 MTPA and 2 WallCare putty plants with a combined capacity of 0.8 MTPA. With 100+ Ready Mix Concrete (RMC) plants in 35 cities, UltraTech is the largest manufacturer of concrete in India. It also has a slew of speciality concretes that meet specific needs of discerning customers.
Standalone Financials (in Crs)
Q4FY22 Q4FY21 YoY % Q3FY22 QoQ % FY22 FY21 YoY%
Sales 15312 14050 9.0% 12579 21.7% 51275 43977 16.6%
PBT 2275 2643 -13.9% 1556 46.2% 8293 8060 2.9%
PAT 2454 1777 38.1% 1631 50.5% 7066 5342 32.3%
Consolidated Financials (in Crs)
Q4FY22 Q4FY21 YoY % Q3FY22 QoQ % FY22 FY21 YoY%
Sales 15860 14466 9.6% 13055 21.5% 53106 45459 16.8%
PBT 2255 2639 -14.6% 1634 38.0% 8364 7857 6.5%
PAT 2613 1774 47.3% 1710 52.8% 7334 5462 34.3%
Detailed Results:
1. The company had a poor quarter with consolidated revenues rising 9% YoY while normalised PAT decreased by 18.5% YoY.
2. Sales volumes grew 8.8% YoY in Q4 while consolidated EBITDA decreased 15.6% YoY. 3. Operating EBIDTA stood at Rs.1266 per MT. 4. Trade mix stood at 66% while blended mix stood at 69%. 5. Solar Capacity addition @ 48 MW while WHRS Capacity addition @11 MW for Q4. 6. Capacity utilisation for Q4 stood at 90%. 7. Green power now accounts for 19.7% of total power demand. 8. Current net debt stands at Rs 3751 Cr with net debt to EBITDA at 0.32. 9. Changes in operating costs in Q3 is as follows:

Click here to Subscribe
on WhatsApp
www.smartsyncservices.com
1. Logistics: Up 4% YoY to Rs 1218/ton. Accounts for 31% of the total operating costs. 2. Energy: Up 48% YoY to Rs 1450/ton. Accounts for 34% of total operating costs. 3. Raw Materials: Up 14% YoY at Rs 554/ton. Accounts for 14% of total operating costs.
10. Diesel Price higher by ~11% YoY which led to logistics costs rising 4% YoY. 11. Energy cost rise of 48% YoY mainly due to a rise in petcoke/coal prices. 12. Raw material costs increased by 14% YoY due to increase in flyash, gypsum prices 13. Other costs increased 7% YoY due to 6% YoY rise in packing costs.
14. Consolidated ROCE was at 15.3% in Q4.
Investor Conference Call Details:
1. The company acquired a majority stake in a company called RAK White Cement in the UAE which will help strengthen Birla White in India due to strategic synergies.
2. The company is putting on hold the capacity expansion plan in India which was about Rs. 978 Cr because it will have access to RAK White Cement’s 9 lakh metric tons of clinker and 6 lakh metric tons of white cement capacity.
3. Petcoke's contribution to the energy mix has increased from 20-25% to 40% sequentially.
4. The company has completed the divestment of its stake in Binani Fibre Glass.
5. The capex guidance for FY23 is Rs.4000-5000 Cr.
6. The management states that average inventory days should stand at 50 days.
7. The company has hiked the price per cement bag from an average of Rs.360-365 to Rs.390 per bag in April.
8. The company expects the eastern market to rebound post 3 quarters of decline & expect it to be the fastest growing market.
9. The company’s costs for new green-field expansion projects have gone up by 20-25%.
10. The company got Rs.983 Cr worth of benefits from tax adjustment changes.
11. The incentives for the quarter were about Rs.117 Cr.

Click here to Subscribe
on WhatsApp
www.smartsyncservices.com
Analyst’s View:
Ultratech Cement is the biggest cement maker in India. The company has done well to acquire ageing cement makers in India and integrating them and adding to the company’s ever-growing market presence and reach in the country. Ultratech has had a poor quarter in line with the industry with sales growth of 9% while EBITDA fell 15% YoY. The EBITDA fall was due to rising input prices, especially energy costs. The company is looking to maintain a steady rate of capacity expansion in both grey and white cement. It also looking to develop its construction chemicals business a lot in the next few years to position itself as a complete building solutions provider. It remains to be seen how long the input cost inflation will go on and whether the projected rise in oil prices will hurt the demand for construction & infrastructure development more than anticipated and whether the management vision of rising utilization across the entire industry will happen or not. Nonetheless, given the company’s leadership position in the industry, its wide distribution network across India, and its strong brand image, Ultratech Cement remains a pivotal cement sector stock for all Indian investors.

Click here to Subscribe
on WhatsApp
www.smartsyncservices.com
CHEMICALS Apcotex
Financial Results & Highlights Introduction
Apcotex Industries Limited is one of the leading producers of Synthetic Lattices (VP Latex, Acrylic Latex, Nitrile Latex) and Synthetic Rubber (HSR, SBR) in India.
consolidates financials ( In Crs)
Q4FY22 Q4FY21 YoY % Q3FY22 QoQ % FY22 FY21 YoY%
Sales 279 189 47.6% 253 10.3% 965 546 76.7%
PBT 42 28 50.0% 32 31.3% 130 57 128.1%
PAT 31 22 40.9% 24 29.2% 99 44 125.0%
Detailed Results:
1. The company achieved its highest-ever quarterly revenue of Rs 279 Cr, up 47% YoY, on the back of strong volumes and an increase in realizations.
2. Quarterly Volumes grew 24% YoY with Export contribution growing to 20% of overall revenues. 3. The company earned EBIDTA of Rs.45.3 Cr at an EBIDTA margin of 16.32% growing 27 Bps YoY. 4. The company’s expansion project is expected to get completed by Q3 FY23. 5. The company has recommended final dividend of Rs.3 & total dividend of Rs.5 for FY22. 6. EBIDTA margins for the FY22 stood at 14.6% while PAT margins stood at 10.3% & asset turnover ratio
at 6.1 times.
Investor Conference Call Highlights: 1. The company is currently running at 100% capacity utilisation rates. 2. The management believes the company’s performance should be judged through its EBIDTA per
tonne or volumes rather than revenues. 3. The management has grown Apcobuild by more than 130% in the current FY although it remains at a
small part of the revenue mix. 4. The company expects its Taloja plant to start revenue generation from Q3 and expects the demand
to remain strong giving the current enquiries. 5. The company’s profit was positively impacted by 10-12% due to higher price of its inventory of oils. 6. The company endeavours to remain in 13-17% EBIDTA margins bracket provided no major
macroeconomic shocks. 7. The management has incurred cash outflow of 40% of total project cost of Rs.190 Crs 8. 60:40 was the latex:rubber revenue mix in Q4. 9. 7 out of the 11% QoQ growth is derived from volume growth while remaining 4% is due to
realization increase. 10. The management primary focus is currently on supply chain management due to high volumes of
raw material import which risk has further increased due to high shipping rates and shortage of supply due to war.

Click here to Subscribe
on WhatsApp
www.smartsyncservices.com
11. The company expects to get technological transfer benefits from its acquisition. 12. The key drivers of EBIDTA per tonne growth is due to passing of price increase, tailwinds, high-
capacity utilisation & benefits of price increase of its stock. 13. The strong growth is due to import substitution in domestic market coupled with several internal
initiatives leading to company being no.1 in almost all of its product categories. 14. The company doesn’t opt for buyback due to lower liquidity of the stock
Analyst’s View:
Apcotex is one of the very few synthetic rubber makers in India. The company continued its good momentum from Q3 and achieved its best-ever sales, volumes, and exports in Q4. The margin profile improved by 27 bps QoQ. The management is aiming to expand the export outlook for Apcotex mainly through nitrile latex which is expected to rise to 70-75% of revenues in the next 2 years. It remains to be seen how the company will be able to preserve its margins if there is further RM inflation and what obstacles will it face in its export expansion. Nonetheless, given the company’s industry-leading position in the domestic market, the prudent management of the company, and the management’s optimism from its on-track Capex plans, Apcotex seems to be a good chemical stock to watch out for.

Click here to Subscribe
on WhatsApp
www.smartsyncservices.com
Galaxy Surfactants
Financial Results & Highlights Introduction:
Galaxy Surfactants is engaged in manufacturing of surfactants and other speciality ingredients for the personal care and home care industries. The Company produces a range of vital cosmetic ingredients, including active ingredients, ultra violet (UV) protection and functional products. Its products cater to various brands in the fast moving consumer goods (FMCG) sector and offers in various applications, including skin care, hair care, oral care, body wash, sun care, household cleaners and fabric care segments. Galaxy Surfactants is a global leader supplying a wide range of innovative products to over 1750+ customers in 80 countries.
Standalone financials (in Crs)
Q4FY22 Q4FY21 YoY % Q3FY22 QoQ % FY22 FY21 YoY%
Sales 775 529 46.5% 661 17.2% 2627 1835 43.2%
PBT 58 53 9.4% 33 75.8% 181 239 -24.3%
PAT 42 39 7.7% 24 75.0% 134 178 -24.7%
Consolidated financials (in Crs)
Q4FY22 Q4FY21 YoY % Q3FY22 QoQ % FY22 FY21 YoY%
Sales 1054 786 34.1% 931 13.2% 3698 2795 32.3%
PBT 124 93 33.3% 57 117.5% 329 372 -11.6%
PAT 98 79 24.1% 45 117.8% 263 302 -12.9%
Detailed Results:
1. Consolidated revenues grew 34% YoY in Q4. 2. EBITDA for Q4 increased by 22% YoY while PAT Increased by 24% YoY. 3. EBITDA margin decreased by 130 Bps to 13.9%. 4. Fatty alcohol prices in this Quarter increased to an average price of $ 2,862/MT Vs average prices of
$ 2,073/MT in Q4FY21. The same was $ 2,602/MT in Q3FY22. 5. Volume growth in different geographies in Q4 is as follows: a. India: Up 3.3% YoY b. AMET: Down 29.1% YoY c. Rest of the World: up 11% YoY
6. In Q4, volume declined in the performance surfactant division was 15% YoY while specialty care products increased 3.7% YoY.
7. EBITDA/Ton in Q4 was at Rs 25,400.
Investor Conference Call Highlights
1. The management states that a volatile supply-side combined with a cutback in demand due to down-trading will be a potential downside to its business model in the coming year.

Click here to Subscribe
on WhatsApp
www.smartsyncservices.com
2. The company saw margin expansion on QoQ basis due to changes in product mix, inventory gains & new contracts.
3. The management states that its US subsidiary TRI-K has been doing exceptionally well.
4. The company is seeing a steep decline in the AMET market due to high inflation, currency devaluation & supply side constraints.
5. The company will incur a capex of Rs.150-200 Cr in FY23.
6. The company is guiding for EBIDTA per tonne of Rs.16000-18000 in the coming year & the guidance is skewed towards the upper band.
7. The working capital days have increased primarily due to increased inventory days which have risen due to supply chain disruption & higher cost of raw materials.
8. The current debt to equity stands at 0.22.
9. The management saw increased volatility in Palm kernel oil due to supply cutback from Indonesia.
Analyst’s View:
Galaxy Surfactants is one of the most consistent speciality chemical makers in India. The company had a strong quarter where the company clocked the highest ever EBIDTA per tonne of Rs.25,400. It expects to see difficulties in both supplies as well as demand side due to high inflation & uncertain geopolitical climate. The company has seen good growth coming from India, but it remains cautious due to signs of a growth slowdown in the country. The company is expecting sustained demand for its products going forward due to the premiumization trend in developed countries, the growth potential in developing countries, and the rise of eCommerce players in the Indian market. The only credible concerns for the company are RM inflation and supply chain issues arising from the shipping container shortage. It remains to be seen how the RM inflation will pan out going forward and how the company will be able to cope in times of prolonged supply chain stress. Nonetheless, given the company’s robust product portfolio and the ever-increasing list of both FMCG majors and niche speciality product makers, Galaxy Surfactants remains a good stock to watch out for in the speciality chemicals space.

Click here to Subscribe
on WhatsApp
www.smartsyncservices.com
Rallis
Financial Results & Highlights
Introduction
Rallis India, a Tata Group company Group Co., has a history of over 150 years. The company is into manufacturing of Agrochemicals and is present across the value chain of agriculture inputs - from seeds to organic plant growth nutrients. Rallis is also in the business of contract manufacturing for global corporations.
Standalone Financials (In Crs)
Q4FY22 Q4FY21 YoY % Q3FY22 QoQ % FY22 FY21 YoY%
Sales 515 479 7.5% 1278 -59.7% 2631 2470 6.5%
PBT -16 12 -233.3% 122 -113.1% 222 303 -26.7%
PAT -14 8 -275.0% 90 -115.6% 164 228 -28.1%
Consolidated Financials (In Crs)
Q4FY22 Q4FY21 YoY % Q3FY22 QoQ % FY22 FY21 YoY%
Sales 515 479 7.5% 633 -18.6% 2631 2470 6.5%
PBT -16 11 -245.5% 53 -130.2% 222 303 -26.7%
PAT -14 8 -275.0% 39 -135.9% 164 228 -28.1%
Detailed Results:
1. The company had a poor quarter with revenue increasing by 7% due to shortage of key raw materials coupled with phasing issues with one of its international clients.
2. Company reported negative PAT of Rs.14 Cr Vs positive PAT of Rs.8 Cr YoY. 3. EBIDTA margins for the quarter were flat. 4. EBIDTA was hit due to higher provisions for slow moving seeds coupled with opportunity loss in the
form of short of inputs 5. EBITDA percentage for full year stands at 10.5% as against 13.3% in the base year which was
impacted due to pricing volatility and inability to fully absorb seed inflation and the mix led headwind because of de-growth in seeds.
6. The board recommended dividend of Rs.3 for the FY22.
Investor Conference Call highlights:
1. Domestic business growth was soft due to soft Rabi season & rapid spread of black trips in the South coupled with the resurgence of Covid in the early part of the quarter according to the management.
2. The revenue growth for the entire industry was primarily price driven which was a result of high costs of inputs.
3. The management states that on the exports front, demand for agrochemicals continued to remain strong driven by remunerative crop prices and supply shortages from China.
4. In a bid to strengthen its product portfolio, the company added 7 new products in the current fiscal of which 3 were 9(3) products, 2 were 9(4) products & balance 2 products were through co-marketing.
5. The company aims to launch at least 2 9(3) products annually.

Click here to Subscribe
on WhatsApp
www.smartsyncservices.com
6. Despite these new introductions, the company’s ITI was around 11% which is lower than the target of 15%.
7. Domestic seeds business continued to remain under challenge. 8. Herbicides grew 20% YoY while Insecticide & Fungicide grew 5% YoY. 9. The company’s retailer count was at 55,000 Vs 47,000 while its distributer count was at 4,100 Vs 3900
YoY. 10. The crop protection segment grew by 17% YoY every quarter in FY22. 11. In FY22, the company added six new products in the crop nutrition segment, two in-house and four
through co-marketing 12. Seeds business didn’t perform well in the current fiscal due to increased demand for illegal herbicide
tolerant cotton seeds impacting the overall growth momentum and profitability of the business according to the management.
13. The company’s retail footprint in the seeds business stood at 38,000 Vs 31,000. 14. The management states that capacity expansion undertaken for Kresoxim-methyl, Acetamiprid and
Lambda-Cyhalothrin have started contributing to the overall growth of the business. 15. The company’s realizations have improved by around 5% in the domestic crop protection segment
and 14% in the international business, but these efforts haven’t offset the impact of raw material inflation.
16. The management expects to start the operation of Acephate formulation in Brazil by H1FY23 which will help in increasing the share of the formulations business.
17. The company has started taking efforts to reduce supply dependence on China by finding suppliers in the local markets although the Chinese contribution remains above 50%.
18. The management states that the company is on track towards introducing one new AI, Difenoconazole from the new multi-purpose plant in FY 23 & its new formulation facility at the Dahej CZ is also stabilizing & gearing up for larger volumes in FY 23.
19. The company will liquidate its large inventory of seeds through prudent commercial interventions which will have an impact on EBIDTA margins.
20. Shift towards increasing the share of formulation products has sustained growth and margins of the domestic crop protection business.
21. The company’s Seeds business contribution to overall revenue dropped by 3% during the year. Since this business makes higher material margins in the range of 15% to 20%, margins were impacted by 50 bps by this shift in mix.
22. The company’s total capex for FY22 stood at Rs.185 Cr & plans to do a capex of Rs.250 Cr in FY23. 23. The growth of Metribuzen chemical was stalled due to a high inventory overhang in the market, but
the management expects it to bounce back by Q2. 24. Out of the growth of 25% in the crop protection segment, there was an equal split between
contribution from price & volumes. 25. The management believes that since on the illegal cotton side, the availability is even higher than last
year, it does not see the challenges in its seeds business slowing down during the year. 26. The international revenue for FY22 is Rs.780 Cr. 27. The management recognizing the demand and stronger realization of pyrethroids have invested in a
dedicated Lambda Cyhalothrin facility. 28. The management expects a soft Q1 as the volatility and uncertainty will continue on input availability
as well as raw material pricing front, which will affect margins.

Click here to Subscribe
on WhatsApp
www.smartsyncservices.com
Analyst’s View:
Rallis is one of the leading crop-care & seeds companies in India. It had a bad quarter with revenue growth of 7.5% YoY and Loss after tax of Rs 14 Cr in Q4. The company continues to see price inflation in raw materials. The demand scenario in the agrochemical space remains robust due to good crop prices available in India and supply shortages from China. Meanwhile, the company continues to see pressure on the high margin domestic seeds business which is also diminishing the overall margin profile for the company. Furthermore, the management expects to see soft demand in the coming quarter due to rising raw material prices and input unavailability. It remains to be seen how the company will be able to tackle inflation and raw material supply problems and how long will it take for the seeds business to get back on track. Nonetheless, given the company’s strong market position and operational history, Rallis India remains a good Chemical stock to watch out for.

Click here to Subscribe
on WhatsApp
www.smartsyncservices.com
CONSUMER ELECTRONICS Amber Enterprises
Financial Results & Highlights Brief Introduction:
Amber Enterprises India is engaged in the business of manufacturing a versatile range of products i.e. Air conditioners, microwave ovens, washing machines, refrigerators, heat exchangers, sheet metal components etc. Currently, the Company has nine manufacturing facilities in India out of which two manufacturing facilities are operating in tax exemption zone.
Standalone Financials (in Crs)
Q4FY22 Q4FY21 YoY % Q3FY22 QoQ % FY22 FY21 YoY%
Sales 1565 1314 19.1% 670 133.6% 3170 2326 36.3%
PBT 49 94 -47.9% 18 172.2% 70 77 -9.1%
PAT 32 60 -46.7% 14 128.6% 48 51 -5.9%
Consolidated Financials (in Crs)
Q4FY22 Q4FY21 YoY % Q3FY22 QoQ % FY22 FY21 YoY%
Sales 1946 1607 21.1% 983 98.0% 4240 3064 38.4%
PBT 86 116 -25.9% 43 100.0% 154 120 28.3%
PAT 59 76 -22.4% 33 78.8% 111 83 33.7%
Detailed Results:
1. The company had a poor quarter with a rise of 21% YoY in consolidated revenues while consolidated profits declined by 22% YoY.
2. Operating EBITDA in Q4 for Amber was at Rs 133 Cr with the margin at 6.9%.
3. Operating EBITDA in FY22 for Amber was at Rs 296 Cr with the margin at 7%.
4. Working capital days for FY22 stood at 39 days Vs 56 days YoY.
5. The subsidiary revenues for FY22 were at:
1. PICL: Rs.236 Cr
2. ILJIN & EVER:: Rs.650 Cr
3. Sidwal/ mobility applications: Rs. 289 Cr
4. Amber PR : Rs.51 Cr
5. Pravartaka : Rs.26 Cr
6. The order book for Sidwal stands at more than Rs.600 Cr.

Click here to Subscribe
on WhatsApp
www.smartsyncservices.com
Investor Conference Call Highlights:
1. The management states that the company is ready for the new BEE rating revision to be implemented on 1st July 2022.
2. FY22 revenues were the highest annual revenues recorded by Amber. 3. The company’s contribution value in the RAC sector for both finished goods and components is around
26.5% as of today. 4. The company was able to convert a few customers from the first phase of gas filling to offering
completely built units CBUs. It also added the entire product lineup of commercial ductable ACs as well as cassette ACs to its portfolio in FY22.
5. The company acquired a 60% stake in Pravartaka Tooling Services Private Limited which is engaged in the business of injection mould tool manufacturing and injection moulding components for various applications.
6. The management states that due to BEE norm change, the company expects finished goods to get expensive by at least Rs.1000 to Rs.1200 on a model to model basis.
7. The company’s gross margin decreased to 10.9% due to the company’s practice of passing on commodity cost increases through price hikes with a quarter’s lag & the management expects margins of Q1FY23 to be much better due to the price hike.
8. The management expects 100% YoY growth in the value & volume of exports of motor components. 9. The company expects to increase its market share by at least 100 bps in the RAC division due to strong
growth in its component segment. 10. The company will incur capex in the range of Rs.350-400 Cr in FY23. 11. The management expects RAC’s contribution to come down to less than 50% in the coming years. 12. The company expects the industry to grow by 30% in volumes term in the next FY. 13. The company’s geographical mix stood as north @ 35% to 40%, South @ 30% to 32% and West and
East contributes the remaining portion. 14. The company expects 3-4% points of benefits in the coming years due to an increase in the capacity
of critical components in India, 80-85% of which are currently imported. 15. The management states that the contribution from CAC is somewhere to the tune of Rs.20-25 Cr
which it expects to go up by around Rs.100 Cr in the next two years. 16. The company expects a good festive season due to new policies coming in place from 1st July
where brands are pre- cautioning, so the current model is likely to be sold till 15th or 20th June and then from 10th July, they will get into new models because of which demand rather than spreading into the quarter, would go until August and September.
Analyst’s View:
Amber Enterprises has cemented its position as a prime AC and white good components manufacturer in India. The performance of the quarter was poor with YoY growth in sales while margins collapsed due to input cost inflation. The demand for components is expected to rise significantly with pent up demand coming to the fore this summer. The management remains optimistic about the industry growing at 30% YoY & amber growing at a similar rate. It has stated that Amber stands ready for the new BEE ratings change. It remains to be seen how the industry demand will be affected by rising RM costs and whether the company will be able to achieve its optimistic expectations in the exports and components space. Nonetheless, given the massive opportunity size from import substitution, the growth prospects of the industry, and the company’s dominant position in the ODM market, Amber Enterprises remains a pivotal stock in the fast-rising air conditioning industry. However, the current valuation appears to be very stretched for the company.

Click here to Subscribe
on WhatsApp
www.smartsyncservices.com
Blue Star
Financial Results & Highlights Brief Company Introduction
Blue Star is India's leading air conditioning and commercial refrigeration company, with an annual revenue of over ₹5200 crores (over US$ 750 million), a network of 32 offices, 5 modern manufacturing facilities, 2800 employees, and 2900 channel partners. The Company has 5000 stores for room ACs, packaged air conditioners, chillers, cold rooms as well as refrigeration products and systems, along with 765 service associates reaching out to customers in over 800 towns.
The Company fulfils the cooling requirements of a large number of corporate, commercial as well as residential customers. Blue Star has also forayed into the residential water purifiers business with a stylish and differentiated range including India’s first RO+UV Hot & Cold water purifier; as well as the air purifiers and air coolers businesses.
Blue Star's other businesses include marketing and maintenance of imported professional electronics and industrial products and systems, which is handled by a wholly owned subsidiary of the Company called Blue Star Engineering & Electronics Ltd.
Consolidated Financials (In Crs)
Q4FY22 Q4FY21 YoY % Q3FY22 QoQ % FY22 FY21 YoY%
Sales 2253 1651 36.4% 1519 48.3% 6081 4325 40.6%
PBT 113 104 8.6% 70 58.9% 250 147 70%
PAT 76 68 11.7% 47 61.7% 168 100 68%
Standalone Financials (In Crs)
Q4FY22 Q4FY21 YoY % Q3FY22 QoQ % FY22 FY21 YoY%
Sales 2005 1531 30.9% 1339 49.7% 5413 3904 38.6%
PBT 91 97 -6.1% 57 59.6% 195 98 98.9%
PAT 59 65 -9.2% 38 55.2% 127 65 95.3%
Detailed Results:
1. The company had a consolidated revenue rise of 36% YoY & 48% QoQ. 2. PAT was up to Rs 76 Cr vs Rs 68 Cr last year. 3. EBIDTA grew from Rs.102 Cr to Rs.143 Cr YoY, its margins increased to 6.4% from 6.3%. 4. Carry forward order book for the company stood at Rs 3253 Cr. 5. Capital employed increased from Rs.653 Cr to Rs.989 Cr on account of decreased working capital
management. 6. Net borrowings were increased to Rs.67 Cr in FY22. 7. Segment revenue for the Electro-Mechanical Projects & Packaged Air Conditioning Systems was up
44% YoY in Q4. Orders Booked in FY22 was at Rs 3145 Cr vs Rs 2245 Cr last year. 1. The Carried-forward order book of the Electro-Mechanical Projects business was Rs 3034 Cr Vs
Rs.2839 Cr. 2. Blue Star was able to maintain its position as number 1 position in Ducted Air Conditioning, number
2 in VRF and moved up to number 2 in Chiller product categories.

Click here to Subscribe
on WhatsApp
www.smartsyncservices.com
3. In the unitary products segment, the company saw revenue growth of 32% YoY in Q4. 4. The company grew its market share to 13.3%. 5. The commercial refrigeration business saw improvement in demand across all customer segments. 6. The board has approved a dividend of Rs 10 per share for FY22. 7. Mr. Neeraj Basur, Group CFO has decided to leave Blue Star.
Investor Conference Call Highlights: 1. The company implemented a price increase of 2% to 3% on April 1 to combat commodity price
increases. 2. The management has a very positive outlook for Q1 despite interest rate hikes. 3. Offices followed by Metro rail were the largest contributors to the carry forwards order book of the
EMP business. 4. The management’s view on the growth of their international business in Middle East is very positive. 5. Unitary products business faced headwinds in input costs and disruptions in supply chains which led
to drop in segment margins. 6. The company received breakthrough orders from top companies like Ola, Reliance, Dunzo, Zomato
and Dmart for its commercial refrigeration products. 7. Major order by the company for its segment 3 business were bagged from Axis Bank, Hdfc bank, Icici
bank and Hal. 8. The company’s new range of room ACs and commercial refrigeration is expected to significantly aid
the growth in the upcoming quarters. 9. Due to the ongoing conflict between Russia and Ukraine, the management expects input cost
pressures and supply chain challenges to persist in the short term. 10. The management states that 90% of the company’s buyers are first time buyers, 65% buyers are from
tier - 3,4,5 markets and 45% of the sales are finance through consumer finance. 11. To cater well to these first-time buyers, the company has introduced a new range of affordable
premium air conditioners which are reengineered to have a cost reduction. 12. The company has 22 models future ready considering the energy label change coming into effect on
1st July. 13. Due to the PLI scheme, a component ecosystem is developing in India which is helping reduce the
company’s dependence on China. 14. The company plans to commence production at the Sri City facility in Q3 which will reduce logistics
cost. 15. The southern region of the country contributes to 45% of the company’s sales. 16. The company continues to pursue its goal of 15% market share by 2025. 17. The management expects the input costs to soften by the end of the year due to the inflation control
measures being taken. 18. The management expects the company to get back to 8% to 8.5% operating margin this year. A
contributor to this will be reducing advertising expenses which is being followed by all industry peers. 19. The management states that the company has adequate inventory to cater to 30% growth during the
peak summer season. 20. The company is no longer dependent on import of drives. Currently it still needs to import chips and
compressors. 21. The management expects penetration levels to reach 10% for the market from the current 6%. 22. 17% of the company’s sales are taking place through the ecommerce channel.

Click here to Subscribe
on WhatsApp
www.smartsyncservices.com
23. The management has stated that “For such a huge country like India, a market size of Rs 15,000 crores is very surprising, but good days are here, for next five years, it will be a golden period for room air conditioners, it will grow exponentially because of these factors.”
Analyst’s View:
Blue Star is one of the largest cooling solutions providers in the country. It is one of the biggest branded players in the RAC market. The company has seen an excellent quarter which saw good revenues growth of 36% YoY. It saw a good resurgence in EMP business with segment revenues showing great growth. The demand for commercial refrigeration remains resilient and this demand is expected to continue from QSRs. The company remains confident of the prospects of its EMP business given the policy support for the rise of the infra sector. It also expects to preserve its market share of 15% in the RAC space and match the industry CAGR of 15-18%. The company is also commissioning additional capacity for the expected demand rise across RAC and commercial refrigeration segments. It remains to be seen how the pricing environment and competition will fare in the industry going forward and how will the new opportunities in the EMP and commercial AC spaces evolve. Nonetheless, given the company’s strong market presence, its history of completing EMP projects, and its robust presence in semi-urban and rural India, Blue Star is a pivotal white goods stock to watch out for.

Click here to Subscribe
on WhatsApp
www.smartsyncservices.com
Dixon Technologies
Financial Results & Highlights Brief Introduction:
Dixon Technologies (India) Limited is the largest home grown design-focused and solutions company engaged in manufacturing products in the consumer durables, lighting and mobile phones markets in India. Its diversified product portfolio includes Consumer electronics like LED TVs, Home appliances like washing machines, Lighting products like LED bulbs and tubelights, downlighters and CFL bulbs, Mobile phones like feature phones and smartphones, Security Surveillance Systems like CCTV & DVRs. The company manufactures and supplies these products to well-known companies in India who in turn distribute these products under their brands.
Standalone Financials (in Crs)
Q4FY22 Q4FY21 YoY % Q3FY22 QoQ % FY22 FY21 YoY%
Sales 1670 1840 -9.2% 2090 -20.1% 7487 5677 31.9%
PBT 48 62 -22.6% 48 0.0% 200 206 -2.9%
PAT 35 44 -20.5% 35 0.0% 151 152 -0.7%
Consolidated Financials (in Crs)
Q4FY22 Q4FY21 YoY % Q3FY22 QoQ % FY22 FY21 YoY%
Sales 2954 2110 40.0% 3074 -3.9% 10700 6450 65.9%
PBT 87 61 42.6% 63 38.1% 255 217 17.5%
PAT 63 44 43.2% 46 37.0% 190 160 18.8%
Detailed Results:
1. The company had a great quarter with Q4 revenues rising 40% YoY while profit increased by 43%.
2. The EBITDA margin for the company has increased by 30 bps YoY to 4.1% in Q4FY22 & EBITDA has risen 49% YoY.
3. FY22 figures saw revenues rising 66% YoY while EBITDA margin fell 90 bps YoY to 3.6% and PAT saw growth of 19% YoY.
4. Segment-wise revenue performance in Q4 was as follows:
1. Consumer Electronics: down 15% YoY (34% of Q4 revenues)
2. Lighting Products: down 20% YoY (10% of Q4 revenues)
3. Home appliances: up 60% YoY (8% of Q4 revenues)
4. Mobile Phones: Up 348% YoY (44% of Q4 revenues)
5. Security Systems: Up 0.3% YoY (4% of Q4 revenues)
5. The company had a cash conversion cycle of 0 days.

Click here to Subscribe
on WhatsApp
www.smartsyncservices.com
6. It had a ROCE of 24.9% and ROE of 21.9%.
7. As of 31st March 2022, Dixon has a cash balance of Rs.176.46 Cr.
8. Total cash flow from operations in Q4FY22 was at Rs.272.76 Cr.
9. The company’s net debt was at Rs.140.63 Cr in March.
Investor Conference Call Highlights
1. The company expanded its annual capacity of the AC PCB division to 6 million leading to the ability to cater to almost 35% of India’s market requirements.
2. The management expects LD volumes to grow by 40% in the coming FY on account of a big order win while margins will remain stable or increase due to operating leverage.
3. The management states that the LED bulb segment has a capacity of 300 million, which is 50% of India's requirement.
4. The company made a subsidiary- Dixon Technologies Solutions Private Limited in line with its backward integration strategy and it will be making investments of INR 20 crore this year and overall investment to the tune of INR 100-odd crore in 5 years.
5. The management is expecting a 30% growth in the washing machine segment. 6. The company is making an entry in the refrigerators segment where it will be creating a capacity of
almost 1.2 million direct cool categories, which will be ultimately expanded to the frost-free category as well. Its product portfolio will be from 190 to 235 litres with multiple features and different star ratings.
7. The company entered in 51:49 JV made with Betel for telecom and networking products. 8. The company entered into a 60:40 JV with Rexxam to manufacture inverter controller boards for air
conditioners. 9. A 50:50 JV has been formed with Imagine Marketing for its flagship brand, Boat for manufacturing
variables in wearables where currently the company is manufacturing TWS and has an estimated yearly volume order of around 7 million units. The company will soon start the production of the neckband with an estimated yearly order of around 4.44 million units at our Noida manufacturing facility.
10. The management expects growth of close to 1.5X in its mobile division with expected revenue of close to Rs.7000-7500 Cr in FY23.
11. The management is seeing inflationary pressures in the biz & is unable to pass price hikes in its lighting division. It expects the margin to reach back to the original after 2 quarters.
12. The management is guiding for revenue growth of 55-60% for FY23 & margin profile of 4-4.25%. 13. The company is planning a Capex of Rs.340 Cr in FY23. 14. The management states that out of Rs.7000 Cr of potential revenues from mobile biz in FY23,
Rs.6000 Cr will be contributed by Motorola. 15. The management states that it is comfortable with the existing level of debt & doesn’t plan to raise
any equity. 16. The company is not planning to enter into the AC business as it wants to consolidate in its existing
verticals. 17. The company is not facing any chip shortage currently.

Click here to Subscribe
on WhatsApp
www.smartsyncservices.com
Analyst’s View:
Dixon Technologies is one of the foremost leaders in the electronics manufacturing and outsourcing industry in India. The company had another great quarter despite challenges and margin contraction due to RM price increases and high shipping costs. The company is participating in multiple PLI schemes like mobile phone PLI, IT hardware PLI, AC components PLI, and Telecom products PLI. It has also added refrigerators to its ODM portfolio. The management has high expectations from all its newly formed JV. It has also seen the Samsung smartphones order rise to 1.5 million per month, highly increasing its chances of fulfilling the PLI scheme obligations. The company has also started passing the RM price increases to its customers and it expects margins to come back to 4% and above soon. It remains to be seen what obstacles it will face that may threaten to halt its growth momentum, how will the RM price situation pan out, and whether its export ambitions of Dixon will bear fruit as expected. Nonetheless, given the list of marquee customers that the company has gained and retained over the years and its continuous efforts to expand existing capacities like consumer electronics, add new product lines, and participate in multiple PLI schemes, Dixon Technologies is cementing its place as a good growth story in the electronics manufacturing sector in India.

Click here to Subscribe
on WhatsApp
www.smartsyncservices.com
EXCHANGE BSE
Financial Results & Highlights Introduction
BSE was established in 1875 and is Asia’s first Stock Exchange and one of India’s leading exchange groups. Over the past 144 years, BSE has provided a capital-raising platform and provided a platform for trading in equity, debt instruments, derivatives and mutual funds. It also has a platform for trading in equities of small-and-medium enterprises (SME).
Standalone Financials (in Crs)
Q4FY22 Q4FY21 YoY % Q3FY22 QoQ % FY22 FY21 YoY%
Sales 179 142 26.1% 180 -0.6% 724 565 28.1%
PBT 64 31 106.5% 62 3.2% 261 116 125.0%
PAT 54 15 260.0% 41 31.7% 195 97 101.0%
Consolidated Financials (in Crs)
Q4FY22 Q4FY21 YoY % Q3FY22 QoQ % FY22 FY21 YoY%
Sales 233 170 37.1% 218 6.9% 863 654 32.0%
PBT 85 48 77.1% 83 2.4% 327 152 115.1%
PAT 71 32 121.9% 58 22.4% 245 142 72.5%
Detailed Results:
1. Sales for Q4 were very good with consolidated revenues up 37% YoY & consolidated PAT up by 121% YoY.
2. EBITDA margin for Q2 was at 28% vs 11% last year & 26% in Q4FY21. 3. Average daily turnover rose 28.5% YoY in the Equity Cash segment in FY22 to Rs.5396.1 Cr. TC revenue
in the segment on the other hand rose 100% YoY to Rs.202.1 Cr. 4. Average daily turnover & average daily number of contracts remained flat QoQ. 5. Average daily turnover in commodity contracts for FY22 increased by 23% YoY. 6. BSE Star MF saw MF revenue rise 32.3% YoY in FY22 while Average Number of Orders rose 97% YoY
in the same period. 7. In the services to corporates segment, listing fees grew by 15.75% YoY in FY22 while Book Building &
other Services grew 64.5% YoY. 8. In the India International Exchange IFSC, the total turnover grew more than 288% YoY in FY22. 9. BSE Ebix Insurance Broking collected total premium of Rs.12 Cr in FY22 vs Rs.4.5 Cr in FY21. 10. Star MF maintained a market share of 85.3% while INX had a market share of 95.7%. 11. The board recommended final dividend of Rs.13.5.

Click here to Subscribe
on WhatsApp
www.smartsyncservices.com
Investor Conference Call Highlights:
1. In 2022, the BSE platform has enabled issuers to raise Rs. 18.4 lakh Cr through the issue of equities, bonds, commercial paper, municipal bonds, InVITs etc.
2. The company is in process of taking final regulatory approval from SEBI to launch EGR (electronic gold receipt) as the new segment.
3. The company’s market share in the SME segment stands at 60%.
4. The India International Bullion Exchange is expected to go fully live from the 1st quarter of FY23.
5. The company’s operating EBIDTA for FY22 increased from 8% to 29% whereas its net profit margin increased from 22% to 29%.
6. The company invested Rs.7.5 Cr in a non-profit Govt. entity – ‘ONDC’ as a part of nation building exercise.
7. The owned cash for the BSE group is around Rs.2200 Cr.
8. The management states that the process of appointment of new CEO is ongoing.
9. The management states that the company’s market share is coming off in currency & derivative trade primarily due to market conditions.
10. The company is hopeful of capturing some revenue share of PTC from IEX through its power exchange since its other ICICI bank has en-routes into many companies which are its users or producers.
11. The company has no plans for a separate market listing of its Star mutual fund platform.
Analyst’s View:
BSE is the largest stock exchange in the world in terms of listed entities. The company has been in this industry sector for close to 150 years and is still at the forefront of the industry in terms of technology and access to tradable products. BSE had a great quarter with rising volumes in all the segments coupled with total revenues increasing by 37% YoY. The company is doing well to continue to expand its strength in the equity and commodity derivatives space and continue the growth momentum of the BSE Star MF platform. It remains to be seen whether BSE Star MF turns into another CDSL for BSE or not, how long will it take for INX to start generating profits and what is the road ahead for the new businesses of Ebix Insurance and Hindustan Power Exchange. Nonetheless, given the company’s long-standing brand value and its market execution experience, and the potential of its new businesses, BSE can turn out to be a dark horse wealth creator in the next few years.

Click here to Subscribe
on WhatsApp
www.smartsyncservices.com
Indian Energy Exchange
Financial Results & Highlights
IEX is the first and largest energy exchange in India providing a nationwide, automated trading platform for physical delivery of electricity, Renewable Energy Certificates, and Energy Saving Certificates. The exchange platform enables efficient price discovery and increases the accessibility and transparency of the power market in India while also enhancing the speed and efficiency of trade execution. In August 2016, the Exchange received ISO Certifications for quality management, Information security management, and environment management. The Exchange is now a publicly listed company with NSE and BSE. IEX is approved and regulated by the Central Electricity Regulatory Commission (CERC) and has been operating since 27 June 2008.
Standalone Financials (In Crs)
Q4FY22 Q4FY21 YoY % Q3FY22 QoQ % FY22 FY21 YoY%
Sales 128 102 25.5% 127 0.8% 478 357 33.9%
PBT 106 84 26.2% 106 0.0% 400 282 41.8%
PAT 81 64 26.6% 80 1.3% 302 213 41.8%
Consolidated Financials (In Crs)
Q4FY22 Q4FY21 YoY % Q3FY22 QoQ % FY22 FY21 YoY%
Sales 128 100 28.0% 131 -2.3% 484 356 36.0%
PBT 107 80 33.8% 107 0.0% 398 270 47.4%
PAT 88 60 46.7% 80 10.0% 309 205 50.7%
Detailed Results:
1. On a consolidated basis, PAT was up 46% YoY while revenue for the quarter was up 28% YoY ( before exceptional items).
2. 21% volume growth YoY was witnessed across all markets in the quarter with FY22 seeing 37% YoY growth in volumes.
3. Margins were at 63% for the Q4 & FY22. 4. Revenue breakup for Q4 included
A. Transaction fees – 83% B. Admission & annual fees – 5% C. Other income – 12%
5. Indian Gas Exchange sees volume growth with 7 million MMBTU traded in Q4 & 12 million MMBTU traded for the year.
6. IGX achieved breakeven with PAT of approx. Rs 1.8 Cr in FY22. 7. Total electricity consumption in India has risen 7.8% YoY in FY22. 8. Final dividend of Rs.1 was announced in Q4 and with total dividend payout for the year at Rs. 2.

Click here to Subscribe
on WhatsApp
www.smartsyncservices.com
Investor Conference Call Highlights: 1. In FY22, volumes involved 90.6 billion in conventional power market, 5 billion in green market and 6.4
billion in certificates. 2. New segment such as RTM cumulatively contributed 24% to total volumes. 3. The company was conferred as best business by finance minister in 70TH CNBC business excellence
awards. 4. The company is working to promote long term power contracts, national access registry etc . 5. CRC approved IEX for hydro power contracts trading. 6. The company will be shortly launching web based platform for its customer to make trading more
seamless along with provide research and information to its customers. 7. The management saw demand for April increase by 11-12% YoY 8. The management saw gap between demand and supply leading to high prices in exchange leading to
capping of price by Govt. which led to buyers shifting to alternative platforms but management believes this to be short term phenomenon and expects scenario to improve from May onwards.
9. Since the company can only launch products for 11 days, thus it is launching long duration contracts offering delivery contracts upto 365 days & get good share from bilateral market where market size is 55-60 Billion units.
10. Cross bidding is a new innovative product by co. which is will help in efficient selling & buying of power.
11. National open access registry product by co. will help in streamlining process and grow the spot market.
12. Market share of company for certificates in FY22 was 75% 13. The company expects 80-90 lakh certificates to happen in FY23 Vs 60 lakh in FY22. 14. The company paid 60% dividend pay out of total net profit & expects to continue this policy in future. 15. The company’s market share of total generation is 7% & wants to take this share to 25% through
thrust of Govt. due to high renewable power generation to be expected in the future & integration with grid which will require a liquid platform for exchange.
16. The company expects to grow at 20-25%. 17. Power shortage scenario is not conducive for the market and will adversely affect company’s
performance in future. 18. Revenue achieved by IGX is 5.6 Cr and EBIDTA of 1.8 Cr. 19. Open access market’s clearing price is Rs. 4.4 which is very high leading to volume degrowth of 8%. 20. The company is interacting with regulators to take part in unified carbon market. 21. The company expects order in NBC within a month. 22. The management doesn’t expects its market share to get hindered by someone offering at lower
transaction costs as the key value provided in the form of liquidity is the key for the biz and due to small part of transaction fees to total revenue to the seller of power, they believe that the seller won’t shift to another platform just because of lower transaction fees.
23. Higher volume & prices has led to significant increase in payables amount which is a short term phenomenon and will normalise.
24. The company expects gas volumes increasing post rationalisation of gas prices. 25. The management doesn’t intends to revise its exchange fees upwards. 26. Since company has to reduce its stake in IGX to 25% post 5 years , it will explore various options like
an IPO to reduce its stake.

Click here to Subscribe
on WhatsApp
www.smartsyncservices.com
Analyst’s View:
IEX is the first and largest energy exchange in India providing a nationwide, automated trading platform for physical delivery of electricity, Renewable Energy Certificates, and Energy Saving Certificates. It has a very asset-light business model and a strong Balance Sheet. In the last several years it has done well by constantly adding new products and improving offerings for the participants on its platform. The company continues its growth march with another good quarter with volume growth of 21% YoY and sales & profit growth of 28% & 46% YoY. IEX saw a great rise in volumes mainly on the back of increased consumption in the country and the power shortage due to rising fuel costs. It has also received approval for long duration contracts and is planning to launch ESCERTs and GTAM very soon.. It remains to be seen whether the MBED development will pan out as the management expects and how IEX will fare with the addition of new rival exchanges in this space. It is still very early days in the power exchange market. However, as of date, IEX looks like a pivotal player in this industry.

Click here to Subscribe
on WhatsApp
www.smartsyncservices.com
FMCG CCL Products
Financial Results & Highlights Brief Company Introduction
CCL Products (India) is engaged in the manufacturing of instant coffee. The Company operates through the Coffee and Coffee related products segment. It is engaged in the manufacture of soluble instant spray dried coffee powder, spray dried agglomerated/granulated coffee, freeze-dried coffee and freeze concentrated liquid coffee.
Standalone Financials (In Crs)
Q4FY22 Q4FY21 YoY % Q3FY22 QoQ % FY22 FY21 YoY%
Sales 251 290 -13.4% 261 -3.8% 954 861 10.8%
PBT 80 122 -34.4% 32 150% 183 210 -12.8%
PAT 65 100 -35% 16 306% 127 158 -19.6%
Consolidated Financials (In Crs)
Q4FY22 Q4FY21 YoY % Q3FY22 QoQ % FY22 FY21 YoY%
Sales 379 334 13.4% 423 -10.4% 1466 1245 17.7%
PBT 68 71 -4.2% 74 -8.1% 261 234 11.5%
PAT 52 49 6.1% 58 -10.3% 204 182 12%
Detailed Results:
1. The company had a good quarter with consolidated sales up 13.4% YoY and PAT up 6.1% YoY. 2. FY22 numbers were good with 17.7% YoY revenue growth and 12% YoY PAT growth.
Investor Conference Call Highlights: 1. The company witnessed a hit in gross margins due to delay in FD supplies because of the Ukraine-
Russia War. 2. The company also faced input cost pressures and logistics cost pressures during the quarter. 3. The percentages of costs that got impacted in Q4 due to various reasons was 2%. And 500-700 tons
of FD got deferred. 4. The new small pack capacity of 12000 ton has been commissioned this quarter. 5. Freeze Dried coffee contributed to 25% volumes this year. 6. The company has achieved 200 crores in domestic revenues this year out of which 70% is branded
sales. 7. The company launched protein based snacks recently in Pune, Hyderabad and Chandigarh. 8. The management has given guidance of 15%-17% volume growth for the coming year. 9. The company is on track to commission 16500 tons of capacity in Vietnam in the second half of the
year. 10. Currently at group level the capacity utilisation stands at 85%, which is almost maximum kind of
utilisation.

Click here to Subscribe
on WhatsApp
www.smartsyncservices.com
11. The company’s inventory days have mainly gone up as the company has taken a call to store more green coffee and the company plans to keep supplies of four months currently as compared to previous two and half to three months.
12. Volume growth for the year was 10% in Russian markets, 20% in USA and Europe was around 15%. 13. About 20% of the company’s revenues are from Russia and are currently at 75% of normalized levels. 14. The management does not see the Brazil issue ease-up for another year. 15. Capex planned by the company stands at 30 to 40 crore on Indian Operations and 30 million USD on
Vietnam operations to increase capacity from 15000 tons to 30000 tons. 16. Out of the 30 million USD capex for Vietnam operations, the company is going to contribute 7 million
and is going to borrow 20 million. 17. The company is in plans to decide a location for adding another 16000 tons capacity in a greenfield
capex apart from Vietnam expansion. 18. The management does not expect green coffee prices falling below 100 USD, which will keep the spray
dried coffee demand intact. 19. The income tax on the new capex in Vietnam will be zero. 20. The company has 10000-ton small pack capacity in India which can be increased to 25000 ton anytime
with minimum expenditure as per the demand. 21. For the upcoming FY, FD volume is expected to be flattish due to the current capacity constraints. 22. The company’s aim for creating the domestic entity was to shift from being a B2B player to being a
B2C player. 23. Coffee prices have increased from 1300 USD per ton in Jan to 2100 USD per ton currently for Robusta.
The company uses 90% Robusta. 24. The company has booked 16.5 cr of export incentives received during FY22 and has 7 cr as the balance
left to be received. 25. The company reported 230 crores revenue in the Switzerland operations with a PAT of 7.5 crores.
Analyst’s View:
CCL has already established itself in the wholesale coffee space for many years and their foray into branded sales through the Continental Coffee label has been very encouraging. The company has had a decent quarter with growth in Sales & growth in profit despite inflation pressures. It also saw utilization of above 85% at the plants. The company has seen a hit in gross margins due to the delays in shipments due to the Russia Ukraine war. Its capacity expansion plans for small packs in India and spray dried coffee in Vietnam remain on track. It remains to be seen whether the rising green coffee prices will result in any drop in order placement for CCL and whether the branded business will be able to maintain its growth momentum in other parts of India. Nonetheless, given the enormous market opportunity for the branded business in the domestic market, CCL products may turn out to be a dark horse in the global coffee industry in the years to come.

Click here to Subscribe
on WhatsApp
www.smartsyncservices.com
ITC
Financial Results & Highlights Brief Introduction:
ITC Limited is an Indian multinational conglomerate company headquartered in Kolkata, West Bengal. Established in 1910 as the 'Imperial Tobacco Company of India Limited', the company was renamed as the 'India Tobacco Company Limited' in 1970 and later to 'I.T.C. Limited' in 1974. It has a diversified presence in FMCG, Hotels, Packaging, Paperboards & Specialty Papers and Agri-Business. It has many famous brands under its stable like Wills, Classic, Gold Flake, Aashirvaad, Sunfeast, Bingo, Fiama, Vivel, Classmate and many others.
Standalone Financials (In Crs)
Q4FY22 Q4FY21 YoY % Q3FY22 QoQ % FY22 FY21 YoY%
Sales 17100 14928 14.5% 17616 -2.9% 62335 51775 20.3%
PBT 5442 4853 12.1% 5492 -0.9% 19829 17164 15.5%
PAT 4190 3748 11.7% 4156 -0.8% 15057 13031 15.5%
Consolidated Financials (In Crs)
Q4FY22 Q4FY21 YoY % Q3FY22 QoQ % FY22 FY21 YoY%
Sales 18252 15983 14.1% 18787 -2.8% 67041 55787 20.1%
PBT 5620 5039 11.5% 5580 0.7% 20722 17945 15.4%
PAT 4259 3816 11.6% 4118 3.4% 15485 13389 15.6%
Detailed Results:
1. The company had a good quarter with a 14% consolidated revenue growth YoY and a rise of 11% YoY in consolidated profits in Q4.
2. The Company EBITDA was up 16.8% YoY. 3. Cigarette segment saw revenue growth of 10% YoY. Segment EBIT also grew 12.2% YoY with EBIT
margins up 130 bps YoY. 4. FMCG-Others segment grew 12.3% YoY in Q4. Segment EBITDA grew 22.5% over Q4FY21. EBITDA
margin was at 9%. 5. Staples & Convenience Foods remained resilient while Hygiene products also moderated. Out of
home consumption saw strong growth. 6. ITC e-commerce FMCG FY22 Sales are 1.5x of FY21 levels. 7. Market and outlet coverage is at 1.4x and 1.1x respectively compared to last year levels. 8. ITC e-store now covers 15 cities with over 700 products in 45 categories. 9. No new FMCG product launches done this quarter. 10. In the personal care segment, Engage saw good resurgence with rise in mobility. 11. FMCG Cigarettes saw new varieties of additions to the portfolio. 12. The Hotels business saw strong sequential improvement in ARRs however saw occupancy below
pre-pandemic levels. Leisure travel remained strong while business travel is coming back.

Click here to Subscribe
on WhatsApp
www.smartsyncservices.com
13. The hotels segment added 9 new properties to the group portfolio including four Welcomhotel properties.
14. More properties to be launched soon under the Welcomhotel brand. Welcomhotel Brand footprint scaled up to 23 properties/2600 keys.
15. The company is looking to drive engagement and business through ITC Hotels app which provides food delivery, room reservation, loyalty benefits and offers for customers.
16. In the Paper & Paperboard business, the company saw revenues rise 31.8% YoY & an EBIT rise of 39.1%. It saw revenue driven by higher volumes and realization.
17. A greenfield project for Paper and Paperboard business in Nadiad, Gujarat is expected to be commissioned by Q2 FY23.
18. Agribusiness saw a good revenue increase of 29.6% YoY & an EBIT growth of 28.5% YoY driven by strong growth in Wheat, Rice & Leaf Tobacco exports.
19. ITC Infotech saw a great FY22 with revenue growth of 13.9% YoY to sales of Rs 2853 Cr while Pat grew 16.6% to Rs 541 Cr in the same period. Margin expansion a/c improved business mix and higher resource productivity.
20. EBITDA margin for ITC Infotech decreased 10 bps YoY to 25.1% in FY22. It also saw PAT margin growth of 60 bps to 19%.
21. ITC Infotech has also signed a ten-year strategic partnership agreement with PTC Inc. The transaction is expected to be consummated in Q1 FY23.
Analyst’s View:
ITC has been one of the biggest conglomerates in the history of modern India. The company has done well to diversify into other FMCG segments and build many leading brands like Aashirvaad, Bingo, etc. The company has seen good performance in Q4FY22 with all segments reporting good growth especially the Paperboard business growing 31.8% YoY and the Agribusiness segment growing 29.6% YoY. The company is doing well in maintaining a leadership position in many of its brands and always introducing new products under these brands. The company has seen sharp recovery in its out of home consumption products and has seen consistent rise in EBITDA in the FMCG-Others segment with EBITDA margin now at 9%. The hotel business is also on its way back with business travel demand coming back and the company is looking to drive this business using digital means through its ITC Hotels app. ITC Infotech has also turned into a good growth machine for ITC with revenue growth of 13.9% YoY. It remains to be seen how the company will mitigate the effects of the systematic decline of the cigarette industry and how long will it take for the FMCG business to realize its value and start performing like the rest of the industry. Also, ITC Infotech will play a huge role in the upcoming years towards growth of ITC’s bottom line. Nonetheless, given its history of building and maintaining durable brands, its leadership in various operating segments, and its mammoth cash-generating ability, ITC remains a critical stock to watch for any investor interested in the themes of FMCG and consumption, all the while providing a consistently high dividend yield every year.

Click here to Subscribe
on WhatsApp
www.smartsyncservices.com
Marico
Financial Results & Highlights Introduction
Marico Limited is one of India's leading consumer goods companies providing consumer products and services in the areas of health, beauty and wellness. With its headquarters in Mumbai, Maharashtra, India, Marico is present in over 25 countries across emerging markets of Asia and Africa. It owns brands in categories of hair care, skin care, edible oils, health foods, male grooming, and fabric care.
Standalone Financials (In Crs)
Q4FY22 Q4FY21 YoY % Q3FY22 QoQ % FY22 FY21 YoY%
Sales 1812 1712 5.8% 1929 -6.0% 7857 6683 17.5%
PBT 341 281 21.3% 339 0.5% 1413 1311 7.7%
PAT 293 244 20.0% 278 5.3% 1163 1106 5.1%
Consolidated Financials (In Crs)
Q4FY22 Q4FY21 YoY % Q3FY22 QoQ % FY22 FY21 YoY%
Sales 2185 2041 7.0% 2429 -10.0% 9610 8142 18.0%
PBT 322 283 13.7% 407 -20.8% 1601 1523 5.1%
PAT 257 227 13.2% 317 -18.9% 1255 1199 4.6%
Detailed Results:
1. Consolidated revenues grew 7% YoY in Q4. 2. EBITDA margins were down 150 bps QoQ to 16.4% for Q4. 3. PAT for Q4 is up by 8% YoY excluding one-offs. 4. In Q4, domestic sales were up 5% YoY while domestic volumes were up 1% YoY. 5. The Gross margin was up 80 bps QoQ owing increase in pricing. 6. Parachute Rigids registered 5% volume growth and 11% value growth for FY22. 7. Value-Added Hair Oils registered a 3% value growth. The company increased its value market share
by 90 basis points. 8. The Saffola franchise, which includes Refined Edible Oils and Foods, grew by 17% in value. 9. Saffola Foods grew by 50% YoY in value terms in FY22. 10. The Oats franchise grew by 512 bps in value market share. 11. Saffola Foods forayed into nut butter and spreads. 12. Livon serum has shown double digit growth YoY. Beardo crossed an annual run rate of Rs 100 Cr on
exit basis. 13. Advertising & Sales Promotion was at 9.4% of revenues in Q4. 14. The volume market share of various divisions is at:
1. Coconut Oils: 63% 2. Parachute Rigids: 53% 3. Saffola –Super Premium ROCP: 82% 4. Saffola Oats (overall): 42% 5. Value-Added Hair Oils: 37% 6. Post wash Leave-on Serums: 63% 7. Hair Gels/Waxes/Creams: 56%

Click here to Subscribe
on WhatsApp
www.smartsyncservices.com
15. International business grew by 12% on a YoY basis with constant currency growth of 16% for FY22. 16. The international revenue growth breakup for FY22 is:
1. Bangladesh: Up 14% YoY 2. MENA: Up 27% YoY 3. South Africa: Up 18% YoY 4. Vietnam: Up 12% YoY
Investor Conference Call Details:
1. Due to calibrated price hikes, cost rationalization and deflationary copra, the company managed to inch up gross margins for the third quarter in a row.
2. During the quarter, FMCG industry witnessed persistent inflation leading to decelerating market volumes with growth being pricing led.
3. For Saffola Edible Oils, the management expects to remain competitive in the near term due to the recent surge in edible oil prices.
4. In Saffola Foods, the company has achieved the aspirational topline target for the year. 5. Soya Chunks has been scaled to 50 crore revenue in less than one year’s time. 6. With the launch of Saffola Peanut Butter and Saffola Mayonnaise, the total addressable market of the
brand Saffola has increased to 6000 crore. 7. The management targets 850-1000 crores revenue in foods over the next couple of years. 8. The company’s digital brands have clocked 180-200 crores in annual run rate on exit basis and the
management shall continue towards building a 450-500 crores portfolio by FY24. 9. The management is confident in delivering a healthy growth rate over the medium term in South
Africa. 10. The management expects margins to remain subdued in the short term and sees copra prices remain
stable throughout the year. 11. The company is facing stress in rural areas for coconut oils, therefore is focusing on protecting market
share in these areas. 12. The company clocked 450-500 crores revenue for its foods business during the year. 13. The management states that it has stopped disclosure of few volume-based metrics as the company
has internally shifted to value-based comparison. And due to the increase in the competitive intensity in the market.
14. Copra is expected to remain stable as it has an insulated market structure mainly because imports are not allowed.
15. The management believes that there is no correlation between copra and other vegetable oils, therefore copra prices would not be affected by price movements of oils globally.
16. The company has taken 5-6% price increase in March for value added hair oils. 17. In foods, soya and honey have both crossed the 50-crore mark. 18. The company had been doing well in Vietnam, in which it replicated it successful Bangladesh strategy. 19. The company is facing inflation challenges in Egypt and Bangladesh. 20. The company has priced parachute and VAHO oils in a way which will facilitate transition of customers
from unbranded oils to branded oils.

Click here to Subscribe
on WhatsApp
www.smartsyncservices.com
Analyst’s View:
Marico is one of India’s leading FMCG companies with many market-leading brands like Saffola and Parachute. The company has done well to maintain value growth on a YoY basis in almost all categories and sustain growth momentum in domestic business despite price pressures in edible oil and liquid paraffin. The company's core franchise is doing well while emerging segments like Beardo and Foods business is on track and has reached Rs 100 Cr and Rs 500 Cr sales in FY22 respectively. The management maintains guidance to deliver healthy revenue growth over the medium term. Marico also wants to expand its digital footprint by acquiring companies either organically or inorganically to reach sales of Rs 450-500 crores by FY24. The company expects the fall in margins due to input price pressures to ease out in the second half of the year. It remains to be seen how the management expectations will play out and what difficulties it will face in building its digital consumer brands, and what challenges will inflation bring up in its international territories. Nonetheless, given the company’s solid standing in its core categories, its expansion plans for high-margin food categories, and its robust distribution network, Marico looks like a pivotal FMCG stock to watch out for.

Click here to Subscribe
on WhatsApp
www.smartsyncservices.com
Tata Consumer Products
Financial Results & Highlights Brief Company Introduction
Tata Consumer Products Limited (formerly Tata Global Beverages) is an Indian multinational non-alcoholic beverages company headquartered in Kolkata, West Bengal, India and a subsidiary of the Tata Group. It is the world's second-largest manufacturer and distributor of tea and a major producer of coffee.
Tata Consumer Products markets tea under the major brands Tata Tea, Tetley and Good Earth Teas. Tata Tea is the biggest-selling tea brand in India, Tetley is the biggest-selling tea brand in Canada and the second-biggest-selling in United Kingdom and United States.
In 2012, the company ventured into the Indian cafe market in a 50/50 joint venture with Starbucks Coffee Company. The coffee shops branded as "Starbucks Coffee - A Tata Alliance" source coffee beans from Tata Coffee, a subsidiary company of Tata Consumer Products.
Standalone Financials (In Crs)
Q4FY22 Q4FY21 YoY % Q3FY22 QoQ % FY22 FY21 YoY%
Sales 1986 1878 5.7% 2054 -3.3% 8171 7287 12.1%
PBT 272 115 136.5% 252 7.9% 1151 836 37.6%
PAT 206 81 154.3% 187 10.1% 885 619 42.9%
Consolidated Financials (In Crs)
Q4FY22 Q4FY21 YoY % Q3FY22 QoQ % FY22 FY21 YoY%
Sales 3222 3080 4.6% 3233 -0.3% 12565 11723 7.1%
PBT 384 197 94.9% 387 -0.7% 1455 1311 10.9%
PAT 289 133 117.2% 287 0.6% 1078 993 8.5%
Detailed Results:
1. The consolidated performance was good at 4.6% YoY growth in revenue while PAT was up 117% YoY.
2. FY22 performance was good with 7% YoY revenue growth and 8.5% YoY growth in PAT.
3. EBITDA margin was at 14.4% which was down 20 bps QoQ and was up 400 bps YoY.
4. Overall, India's business grew 13% YoY with a business growth of 10% in beverages & 19% in foods. The company has a cash position of Rs 2486 Cr.
5. India business A&P was up 29% YoY.
6. TCPL has acquired Tata SmartFoodz Ltd. (TSFL), owner of the brand Tata Q which marks their expansion into new higher margin Ready-to-eat categories.
7. The company has a net cash balance of Rs 2486 Cr as of Mar 2022.
8. Tata Tea saw market share gain of 100 bps YoY and Tata Salt saw market share gain of 400 bps YoY.

Click here to Subscribe
on WhatsApp
www.smartsyncservices.com
9. The India Beverages business showed revenue growth of 6% YoY & volume growth of 3% YoY in Q4.
10. The India Foods business showed revenue growth of 19% YoY & volume growth of 8% YoY in Q4. Salt revenues grew by 15% in Q4 with Rock salt delivering growth of 82%. Tata Sampann portfolio also grew 30% in volumes.
11. NourishCo had revenue of Rs 344 Cr and saw 83% YoY revenue growth in Q4. Tata Water Plus (now rebranded to Tata Copper Water) sold 3.2x volumes in Q4.
12. The Tata Coffee division saw 11% revenue growth YoY in FY22. Plantation revenue grew and Extraction revenue grew 19% YoY in FY22. Vietnam plant operated with 98% capacity utilisation.
13. In the Starbucks JV, the company had 96% of stores operational. Sales have been rising each month since the opening-up post 3rd wave of COVID-19. The company increased its store count to 268 stores with 50 stores added during the year.
14. The UK tea business saw revenue growth of -2% YoY in FY22. It maintained a market share of 19.4% in the everyday black tea segment. Teapigs revenue grew 7% YoY in FY22.
15. The USA coffee business saw a flat YoY revenue growth in FY22. The tea business saw revenue decline 8% YoY in FY22.
16. In Canada, the company saw revenue decline of -7% YoY in FY22. It maintained a market share of 27.8%.
17. The total revenue distribution for TCPL was:
1. India Business: 69%
2. Intl Business: 31%
Investor Conference Call Highlights
1. India beverages business saw better margins due to tea inflation tapering off. 2. The company is sitting with 2486 Crores of cash which incidentally despite the investment in Tata
SmartFoodz, the recapitalization of APPL, investment into taking control of the TRIL JV and Starbucks investment is still higher than last year.
3. The company has seen great progress in alternate channels, with modern trade growing 30% YoY and e-commerce contributing 7.3% of sales.
4. Premiumization has started showing results for the company with Sampann up 28% and value-added salt up 26%.
5. The company is focused on innovation and currently spends 2.7% of sales from 0.9% previously. 6. The company has 11000 drop-off points in India to 38 centers. Supply chain integration has yielded
great results with a 25% reduction in secondary trade. 7. 24% of the company’s energy needs for its supply chain come from renewable sources. 8. The company has announced its plans for merger of Tata Coffee and simplification of the international
business which will yield higher operational efficiencies. 9. Tata Starbucks reported 18% same store sales growth vs pre-covid levels and opened a record 23
stores in a single quarter. 10. Commodities like tea, coffee and salt are range bound currently which is positive for the company. 11. The company had been taking rapid price increases in the international business in line with the
inflation levels.

Click here to Subscribe
on WhatsApp
www.smartsyncservices.com
12. The company’s e-commerce market share in tea is 41.9% on platforms including Amazon, BigBasket etc.
13. The management sees tea prices remaining range bound with a slight downtrend for the upcoming quarters as they expect a decent monsoon. The company has not been affected by the problems in Russia and Sri Lanka.
14. The management states that the gross margins for beverages are at a comfortable level and will remain sustainable going forward.
15. The management believes that it has fairly good numeric reach in Tier 1 and 2 towns and sees opportunities in rest of urban and rural. This year it plans to increase the multiplier of wholesales.
16. The management expects a double-digit growth in the India food business with margins continuing to improve for the long term.
17. Secondary freight per kilometer for the company is down 25% because of combining of salt and tea. 18. The company is currently seeing EBITDA margins between 15% and 20% currently for Tata Starbucks
and plans to ramp it up going forward. 19. The company’s other expenses are higher in Q4 as the company is investing into sales and digital
infrastructure. 20. The company’s target for numeric reach is 4 million outlets and the company is at 2.7 million outlets
currently. 21. In Tata Sampann, the company has entered the dry fruits category which is a high margin category. 22. The management expect Tata Sampann to outpace TCPL’s growth numbers significantly going
forward. 23. The company is keeping 2400 crores cash ready to deploy, in case good opportunities arise.
Analyst’s View:
Tata Consumer Products has a very good product portfolio in diverse F&B segments and strong brands like Tata Tea under its umbrella. The company has seen a mixed performance in Q4FY22 with the revenues rising only 5% YoY while PAT increased more than 117% YoY due to rise in margins. It also completed the acquisition of Tata SmartFoodz which would add Tata Q to the company’s roster. The company is focused on expanding and enhancing the brand image for emerging brands like Tata Sampann, Soulfull, and Tata Coffee products, and in premium flagship brands like Tetley. The margins in the tea business are normalizing which is resulting in a good revenue rise despite modest volume growth. The management is committed to maintaining a high A&P spend to enhance the brands of the company and to capitalize on the unbranded to branded transition for food and beverage products in India. It remains to be seen how the company will be able to weather the rising inflation concerns and how the company will fare against other branded players like ITC in the fast-rising branded staples category. Nonetheless, given the company’s leadership position in its top brand segments, its enhanced distribution reach after the merger, and the incoming synergies and benefits from integration, Tata Consumer Products remains a good FMCG stock to watch out for.

Click here to Subscribe
on WhatsApp
www.smartsyncservices.com
Varun Beverages
Financial Results & Highlights
Brief Company Introduction
VBL are the second largest franchisee in the world (outside US) of carbonated soft drinks (“CSDs”) and non-carbonated beverages (“NCBs”) sold under trademarks owned by PepsiCo and a key player in the beverage industry. They produce and distribute a wide range of CSDs, as well as a large selection of NCBs, including packaged drinking water. PepsiCo CSD brands sold include Pepsi, Diet Pepsi, Seven-Up, Mirinda Orange, Mirinda Lemon, Mountain Dew, Seven-Up Nimbooz Masala Soda, Evervess Soda, Sting and Gatorade. PepsiCo NCB brands sold by the company include Tropicana (100%, Essentials & Delight), Tropicana Slice, Tropicana Frutz, Seven-Up Nimbooz and Quaker Oat Milk as well as packaged drinking water under the brand Aquafina.
Standalone Financials (In Crs)
Q1CY22 Q1CY21 YoY % Q4CY21 QoQ %
Sales 2204 1805 22.1% 1134 94.4%
PBT 275 175 57.1% -33 933.3%
PAT 195 125 56.0% -20 1075.0%
Consolidated Financials (In Crs)
Q1CY22 Q1CY21 YoY % Q4CY21 QoQ %
Sales 2876 2276 26.4% 1766 62.9%
PBT 361 195 85.1% 42 759.5%
PAT 271 137 97.8% 33 721.2%
Detailed Results:
1. The consolidated revenues for the current quarter increased by 26% YoY whereas PAT increased by 98% YoY.
2. The company saw an EBITDA rise of 39.1%% YoY and a volume rise of 18.7% YoY in the quarter. 3. Realization per case improved by 6.3% to Rs.157.3 in Q1 CY2022 driven by price hike in select SKUs,
change in SKU mix and higher realization in international markets. 4. CSD constituted 70%, Juice 7%, and Packaged Drinking water 23% of total sales volumes in Q1 CY21. 5. Gross margins fell by 427 bps YoY to 51.5% due to increase in preform prices by 30%. 6. EBITDA margin improved by 175 bps to 18.8% in Q1 CY2022 led by higher realization and operating
leverage from increased sales volume. 7. Finance costs for the company reduced by 19.0% to Rs.46.96 Cr primarily because of lower average
cost of borrowing. 8. During Q1 CY 2022, the new beverage manufacturing plant in Bihar and the new backward integration
plant in Jammu & Kashmir commenced commercial production. 9. The company has written off the CSD glass and can line in its Roha plant and has shifted the packaged
drinking water line from this plant to its Paithan plant. 10. The Board of Directors has recommended a bonus issue of 1 equity share of Rs. 10 each for every 2
equity shares of Rs.10 each held by shareholders of the Company.

Click here to Subscribe
on WhatsApp
www.smartsyncservices.com
Investor Conference Call Highlights:
1. The company entered into an agreement to manufacture “Kurkure Puffcorn” for PepsiCo & commercial production is expected to start from Q3 of CY22.
2. The management states that the enhancement in go-to market coupled with chilling equipment is helping the company to gain market share.
3. The company’s new products like Sting (contributing 6-7% of volumes) grew by 131% in this quarter, whereas other products like dairy (contributing 0.5%) & Tropicana (contributing 2%) are already being produced at full capacity.
4. The management is guiding for international capex of Rs.1-1.5 Cr in CY22. 5. The management doesn’t expect any major jump in profit margins except due to operating leverage. 6. Since the company has enough inventory for its key ingredients like PET resin for the full season
coupled with sugar prices being in the same range, it doesn’t expect any major cost escalation. 7. The company did a write off Rs.14.5 Cr in its plant & machinery in Roha to consolidate the production
of these products with its other larger capacities. This write off was recorded as other expenses in P&L statement.
8. The management states that out of total volume of 180 million, 147 came from India & the rest 33 came from international markets.
9. The company’s Net debt as on 31st March 2022 was approximately Rs. 3,100 Cr which included additional financing for inventory, which was created for PET stocking.
10. The capex done in Q1 so far were for the backward integration of the Jammu plant, the brownfield expansion of the Sandila plant and for the implementation of the new Bihar plant.
11. The management states that it bought most of the PET requirement till Q3CY22 at the end of last year which was at a reasonable price level.
12. Home consumption: out of home consumption mix stood at 35:65 from 65:35 last year. 13. The management assures that there are no problems with the Sri Lanka business. 14. South-west volumes were at 1/3 of total volumes. 15. The company will initially make a small investment of Rs.20-23 Cr for production of Kurkure Puffcorn. 16. The management states that the 6% increase in realizations involves 1-2% coming from pricing &
remaining 4% from cutting back discounts.
Analyst Views:
Varun Beverages have been one of the biggest bottlers in India and has been quite proactive in international expansion for some time now. The company has seen good YoY growth in the quarter with a sustained EBITDA margin despite falling gross margins due to higher preform prices. The company is witnessing strong performance in its exports division. The management expects to see EBITDA rise to 20-21% in the next few quarters. VBL’s new plants in Bihar and Jammu have online in this quarter. VBL’s efforts in deleveraging the balance sheet are resulting in significant finance costs reduction thus improving debt profile as well as PAT. It remains to be seen what challenges the company will face in trying to maintain its growth momentum while setting up the new facility and how long will it take for the new brands like Sting, Cream Bell & others to start contributing meaningfully to the company’s sales. Nonetheless, given the resilient sales network, the rising demand for the company’s products, and the good potential of its emerging products like Sting, Mountain dew, & Cream bell beverages, Varun Beverages is a good consumption stock to watch out for at present. However, the valuation at current levels does not provide any margin of safety.

Click here to Subscribe
on WhatsApp
www.smartsyncservices.com
HEALTHCARE & PHARMA Cadila Healthcare
Financial Results & Highlights Brief Company Introduction
Zydus Cadila is a leading Indian Pharmaceutical company and a fully integrated, global healthcare products manufacturer. From formulations to active pharmaceutical ingredients and animal healthcare products to wellness products, Zydus has earned a reputation amongst Indian pharmaceutical companies for providing comprehensive and complete healthcare solutions. From a humble turnover Rs. 250 crores in 1995, the group witnessed significant financial growth and registered a turnover of over Rs. 12,700 crores in FY19.
Standalone Financials (in Crs)
Q4FY22 Q4FY21 YoY % Q3FY22 QoQ % FY22 FY21 YoY%
Sales 2073 1992 4.1% 1856 11.7% 8160 7869 3.7%
PBT 346 442 -21.7% 240 44.2% 1164 1688 -31.0%
PAT 247 465 -46.9% 197 25.4% 858 1476 -41.9%
Consolidated Financials (in Crs)
Q4FY22 Q4FY21 YoY % Q3FY22 QoQ % FY22 FY21 YoY%
Sales 3943 3640 8.3% 3700 6.6% 15490 14449 7.2%
PBT 573 547 4.8% 604 -5.1% 2838 2399 18.3%
PAT 397 679 -41.5% 500 -20.6% 4487 2133 110.4%
*Contains Gain on disposal of discontinued operations.
Detailed Results:
1. Consolidated revenues were up with 8% YoY growth. 2. EBIDTA margins for Q4 stood at 22.3% while growth was 1% YoY. 3. Net Debt stood at Rs.-57 Cr. 4. Capex for the quarter stood at Rs.266.8 Cr. 5. The Board approved buy-back of up to Rs. 7,500 mn at Rs. 650 per equity share (90% premium to the
closing share price of 19th May 2022). 6. The company launched Desidustat (OxemiaTM) in India for the treatment of anemia in patients with
Chronic Kidney Disease (CKD). 7. Q4 Revenue mix includes –
a. US Formulations – 38% b. Consumer wellness – 17% c. Indian formulations – 31% d. Emerging markets – 7%

Click here to Subscribe
on WhatsApp
www.smartsyncservices.com
Investor Conference Call Highlights
1. The company’s formulations biz in Q4 saw branded biz (Excluding sales of COVID-related products) grow by 19% YoY.
2. The management states that the company gained market share in its core therapies of anti-diabetic, cardiovascular & gynaecology during the quarter on a YoY basis, On the super speciality front retained its leadership position in the nephrology segment & the oncology space, the company remained one of the fastest growing companies in India.
3. The consumer wellness biz saw sales growth of 6% YoY in Q4. 4. The US formulations biz saw sales degrowth of 4% YoY in Q4. 5. The company launched 4 new products in the US taking the cumulative number of new product
launches for the year to 14 while the company received final approval for 5 new products during the quarter taking the cumulative number of approvals for the year to 28.
6. The company recorded sales growth of 10% YoY in the emerging markets segment while the growth excluding covid-related products stood at 29%.
7. The management states that the Board has approved the proposal for the Buyback of shares at an attractive value to reward the shareholders.
8. The company was able to maintain GPM despite high inflation due to its business mix, foreign exchange benefits, stockings of inventory & price hikes in its Zydus wellness division.
9. The company is confident of maintaining 20% plus EBIDTA margins in the coming year. 10. The growth in the API segment remained largely subdued due to the high base because of Covid, but
the management expects the growth to come back. 11. The management expects its US biz to witness a price erosion in the range of mid to high single-digits
& grow in single digits for FY23. 12. The company took up Nulibry-product as a part of its philosophy of working on therapies and areas
where there are unmet medical needs. 13. The management is guiding for R&D as % of sales to be around 8%. 14. The company is looking to use its strong cash position on the balance sheet post sale of its pet care
division to grow its speciality biz & do acquisitions of brands as a part of its expansion strategy.
Analyst’s View:
Zydus Cadila is one of the leading pharmaceutical and wellness product makers in the country. The company has done well to maintain good growth in the branded business while the consumer wellness and India Business were mostly flat YoY. The company is seeing demand decline for COVID-related drugs but the demand scenario for the in-house developed vaccine remains stable. It is also expecting good potential from its Saroglitazar Mg drug in the next 3 To 5 years which is said to be given a fast-track designation by the USFDA. The company is also looking to concentrate on biosimilars and is said to have enough capacity for biosimilar demand for the next 2-3 years. It remains to be seen what the future holds for the pharma industry and how will the company’s foray into biosimilars pan out. Nonetheless, given the strong positioning of the company in various pharma and consumer product categories and its ever-increasing speciality product portfolio, Zydus Cadila is an important stock to watch out for in the pharma space.

Click here to Subscribe
on WhatsApp
www.smartsyncservices.com
Divi’s Laboratories
Financial Results & Highlights Brief Introduction:
Divi's Laboratories Limited manufactures and sells generic active pharmaceutical ingredients (APIs) and intermediates for in the United States, Asia, Europe, and internationally. The company also undertakes custom synthesis of APIs and intermediates; and supplies a range of carotenoids, as well as markets vitamins to nutritional, pharma, food/beverage, and feed industries. In addition, it exports its products. The company was formerly known as Divi's Research Center and changed its name to Divi's Laboratories Limited in 1994. Divi's Laboratories Limited was founded in 1990 and is headquartered in Hyderabad, India.
Standalone Financials (in Crs)
Q4FY22 Q4FY21 YoY % Q3FY22 QoQ % FY22 FY21 YoY%
Sales 2545 1741 46.2% 2483 2.5% 8991 6861 31.0%
PBT 1066 652 63.5% 1037 2.8% 3676 2628 39.9%
PAT 883 488 80.9% 907 -2.6% 2948 1955 50.8%
Consolidated Financials (in Crs)
Q4FY22 Q4FY21 YoY % Q3FY22 QoQ % FY22 FY21 YoY%
Sales 2571 1812 41.9% 2510 2.4% 9074 7032 29.0%
PBT 1076 669 60.8% 1033 4.2% 3683 2666 38.1%
PAT 895 502 78.3% 902 -0.8% 2960 1984 49.2%
Detailed Results:
1. Consolidated revenues were very good rising 41% YoY while profit saw a rise of 78% YoY in Q4. 2. Annual figures were similarly good with 29% YoY revenue rise and 49% YoY rise in PAT. 3. EBIDTA margins for FY22 stood at 44%.
Investor Conference Call Highlights
1. The company’s product mix for generics to custom synthesis stood at 41% and 59% for the full year. 2. The company capitalized assets worth Rs.172 Cr during the quarter and Rs.935 Cr during the year.
Further, it has capital work in progress of Rs.470 Cr. 3. The company had a Forex gain of Rs.29 Cr for the quarter and Rs.38 Cr for FY22. 4. The Exports for the year accounted for 90% of total sales where Exports to Europe and Africa
accounted for 77% of total revenue. 5. The company’s capacity utilisation stood at close to 80%. 6. The management sees a good opportunity for growth in the generics segment since close to $40
billion worth of products will be going out of patents between FY23-25. 7. The management believes that divis will be the go-to partner for big pharma companies due to its
large capacity to produce small molecules. 8. The company expects to spend between Rs.2000-3000 Cr in the next 2-3 years for capex. 9. The management sees good growth opportunities in generics (due to higher capacity & new contracts
signed), Sartan & contrast media.

Click here to Subscribe
on WhatsApp
www.smartsyncservices.com
10. The management expects increased demand from lifestyle medicine segments in the coming quarters. 11. The management states that since all of its capacities are multi-purpose facilities, they can be used to
shift to other products either for the big Pharma companies or its generic division as & when required.
Analyst’s View:
Divi’s Labs has been a celebrated API manufacturer in India for a long time. The company is doing well and differentiating itself from the rest of the Indian Pharma industry by continuing to hone its efforts in maintaining its dominance in the API industry and Custom Synthesis. It had a phenomenal Q4 with 41% sales growth and 78% PAT growth while maintaining its margin profile despite challenges in logistics costs and a rise in input prices. The product mix remained in favour of customer synthesis which accounted for 59% of revenues in Q4. The management has stated that the company can see good opportunity from the evolving demand for new COVID drugs and drug combinations. It remains to be seen whether the company’s identified growth engines pan out according to expectations and whether it will face any issues in its proposed expansion plans in Kakinada where they are finally completing the delayed land acquisition. Nonetheless, given the company’s history of excellent performance and its standing in the global API industry, Divi’s Laboratories remain a pivotal pharma stock in India, especially given the massive China substitution opportunity.

Click here to Subscribe
on WhatsApp
www.smartsyncservices.com
Hester Biosciences
Financial Results & Highlights
Brief Company Introduction
Hester Biosciences Limited (HBL) is a publicly traded Indian company headquartered in Ahmedabad, Gujarat, India. Hester is an animal and poultry vaccines manufacturing Company with plants situated in Gujarat and Nepal. The company currently has a 30% share of the poultry vaccines market in the country.
Standalone Financials (in Crs)
Q4FY22 Q4FY21 YoY % Q3FY22 QoQ % FY22 FY21 YoY%
Sales 51.3 63.2 -18.8% 55.2 -7.1% 224 210.1 6.6%
PBT 7.2 12.5 -42.4% 13.7 -47.4% 53.2 54.7 -2.7%
PAT 4.9 8.8 -44.3% 10.5 -53.3% 39.5 39.9 -1.0%
Consolidated Financials (in Crs)
Q4FY22 Q4FY21 YoY % Q3FY22 QoQ % FY22 FY21 YoY%
Sales 63.6 66.6 -4.5% 58.4 8.9% 248.7 219 13.6%
PBT 11.3 13.8 -18.1% 11.6 -2.6% 53.5 50.1 6.8%
PAT 9 10 -10.0% 8.3 8.4% 39.4 34.6 13.9%
Detailed Results:
1. The company had a poor quarter with a 4% YoY drop in consolidated revenues and a 10% YoY drop in PAT at a consolidated level.
2. FY22 performance saw with 13% YoY rise in revenues and 13% rise in PAT. 3. The EBITDA margin was at 20% in the current quarter vs 30% a year ago. ROE has fallen to 13% Vs 17%
a year ago. 4. The standalone revenue growth in Q4 for the various segments is:
1. Poultry Healthcare: down 16% YoY 2. Animal Healthcare: Up 17% YoY
2. Vaccine sales fell by 20% YoY due to higher base in the previous year due to a major disease outbreak coupled with adverse conditions in the form of high feed costs in the current quarter. 3. The Q4 FY21 also had a one-time contribution from license fees leading to higher base in the previous year. 4. Hester Nepal has seen a growth of 193% in FY22 sales and a net profit of Rs.22.86 million in FY22 as against a loss of Rs. 9.73 million in FY21 5. Hester Africa received the regulatory approvals for the manufacturing of PPR and CBPP vaccines. 6. During Q4FY22, the company acquired 50% equity stake in Threshold Exim Limited, Tanzania, a distribution company of vaccines and animal health products in Tanzania. 7. The company is expected to launch the modified Inactivated Coryza vaccine in this year.
8. The company will launch 3 products in the pet care division in this month (These three products are mainly for joint disorders, gut health and preventing pets from bacterial infections) & 6 more products are in the pipeline which will be launched during FY23.

Click here to Subscribe
on WhatsApp
www.smartsyncservices.com
Investor Conference Call Details:
1. The management states that it achieved these revenues without any price hikes.
2. The management states that the poultry industry is going through a tough situation since Egg & meat prices are lower than the production cost and therefore it is unviable for poultry farmers to spend their resources on vaccinating the poultry.
3. The company’s health product saw margins decline due to prices remaining unchanged despite high input inflation.
4. The management believes that due to its human vaccine facility being multipurpose, it would be able to utilise the same plant even if the demand for covid vaccines goes down.
5. The company expects to generate revenues between Rs.9-15 Cr from its PPR tender contract from the Indian Govt. in FY23.
6. The management states that the company currently has 70-75% market share in PPR vaccine sales worldwide although volumes are very low, even if the volumes increase by 2-3 times Vs the FAO expectation of 15-20 times, the company’s capacity would be fully utilised.
7. The management states that although the healthcare segment has lower margins, due to the possibility of higher growth & higher asset turnover, it expects to generate healthy returns on investment once the biz scales up.
8. The company incurred a capex of Rs.70 Cr on the covid facility & Rs.50 Cr on the fill finish unit & bulk antigen facility in FY22.
9. The company is targeting a topline of Rs.3-4 Cr in FY23 from the pet-care division.
10. The company’s GP fell by only 1% YoY despite higher contribution from health products (which generally have lower margins) due to the product mix.
Analyst Views:
Hester Bio had a weak quarter with a 4% fall in sales and a 23% fall in PAT due to weak industry demand. The company is making good inroads in the animal health products space and the poultry business remains resilient. It is also looking to expand into the pet healthcare space. FAO tenders have yet to come back to pre-pandemic levels but the management believes that it is slowly recovering. Hester is also looking to add capacity to its India operations which are expected to bring in incremental revenue of Rs 80-120 Cr. It remains to be seen how long the slowdown in animal vaccine tenders in India & from FAO continues and what challenges will the company face in ramping up production in Hester Africa once the plant is operational. Nonetheless, given its excellent technical expertise and the future potential of its international operations, and its upcoming foray into animal health products, Hester Biosciences remains a good small-cap stock to watch out for.

Click here to Subscribe
on WhatsApp
www.smartsyncservices.com
Syngene
Financial Results & Highlights Brief Introduction:
Syngene International Limited, a contract research and manufacturing company, provides drug discovery and development services in India and internationally. The company serves start-up companies, pharma/biotech, agrochemical, chemical, nutrition, and animal health companies. It has partnerships with Bristol-Myers Squibb Co.; Baxter International Inc.; Amgen Inc.; Zoetis Inc.; GSK; Merck KGaA; Artelo Biosciences, Inc.; PharmAust Limited; HiMedia Laboratories; and Zumutor Biologics. The company was incorporated in 1993 and is based in Bengaluru, India. Syngene International Limited is a subsidiary of Biocon Limited.
Standalone financials (in Crs)
Q4FY22 Q4FY21 YoY % Q3FY22 QoQ % FY22 FY21 YoY%
Sales 773 676 14.3% 652 18.6% 2654 2244 18.3%
PBT 178 192* -7.3% 127 40.2% 482 467 3.2%
PAT 147 160 -8.1% 103 42.7% 394 404 -2.5%
Consolidated financials (in Crs)
Q4FY22 Q4FY21 YoY % Q3FY22 QoQ % FY22 FY21 YoY%
Sales 773 677 14.2% 654 18.2% 2657 2249 18.1%
PBT 179 192* -6.8% 128 39.8% 484 469 3.2%
PAT 148 160 -7.5% 104 42.3% 396 405 -2.2%
*Contains an exceptional item of Rs 35 Cr
Detailed Results:
1. Consolidated revenues were up 14% YoY in Q4. Profit has fell by 7% YoY in the same quarter while profit after tax before exceptional items was up 7% YOY.
2. EBITDA margin for the period was at 34% with EBITDA growing 13% YoY. 3. PAT margins stood at 19%. 4. FY22 was decent for the company with revenue growth of 19% YoY and EBIDTA growth of 15% 5. It also continued to manufacture remdesivir for COVID-19, under a voluntary licensing agreement
from Gilead. 6. The company is guiding for 30% EBIDTA margins due to higher investments & travel related expense,
single digit PAT growth due to effective tax rate being higher by 200-300 Bps & revenue growth to be atleast in Mid-teens.
7. The company is on track to receive huge regulatory approval for its Mangalore plant.
Investor Conference Call Highlights
1. The company crossed the $100 million revenue mark in a quarter for the first time. 2. The company’s expenditure on raw materials increased by 390 basis points due to the change in the
mix with more early-stage manufacturing projects as well as input cost inflation. 3. The Employment cost was reduced by 5% year-on-year due to a special bonus in Q4FY21.

Click here to Subscribe
on WhatsApp
www.smartsyncservices.com
4. The hedge gains led to an improvement in the margin by 50 basis points 5. The company’s effective tax rate stood at 18% Vs 12% YoY. 6. The management states that supply chain challenges and long lead times constrained the growth of
the biologics in FY2022, but it expects things to improve in FY2023 and expect biologics to contribute an increasing share of revenues.
7. The company’s Investment during the year was Rs.621 Cr and this included capital projects under progress and capitalization of lease rentals from long-term lease arrangements.
8. Out of the total investments in the current year, the company invested approximately 70% in the research business while it also added laboratory capacity in Hyderabad in two phases and expanded facilities in Bengaluru as part of the contractual commitment for dedicated centres.
9. Around 10% was invested in development services mainly in completing the clinical scale fill-finish facility of its formulation operating unit & another 10% was invested in the manufacturing business mainly for the capacity addition of its fourth reactor in biologics as well as completing the microbial development and manufacturing facilities. The remaining investments were in common assets including added power grid capacity which is commonly used by all divisions.
10. The management expects Q1FY23 to be significantly lower due to the very high contribution from Remdesvir (covid medication) in Q1FY22 which is not expected in the current quarter.
11. The company expects strong growth from its manufacturing side from FY23-24 onwards.
Analyst’s View:
Syngene is a fast-rising player in the CRMO space and has established itself well with its associations with industry leaders in the pharma space like Bristol-Myers Squibb, Amgen and others. The Company had a mediocre Q4 with a revenue increase of 14% YoY. The company expects the Mangalore API facility to get USFDA approval in the next 2 years. The management remains confident of the company’s revenue growth guidance of 13-15%. It remains to be seen whether the company will be able to maintain its growth momentum, how long will the elevated raw materials prices prevail and what challenges it will face when expanding into the API industry. Nonetheless, given its scientific capabilities, its associations with industry leaders for drug discovery, and its expanding reach in the global pharma space, Syngene is a pivotal midcap pharma stock to keep in mind for all investors.

Click here to Subscribe
on WhatsApp
www.smartsyncservices.com
LIFESTYLE PRODUCTS
VIP Industries
Financial Results & Highlights
Brief Company Introduction
VIP Industries Ltd is an Indian luggage maker which is the world's second largest and Asia’s largest luggage maker. The company has more than 8,000 retail outlets across India and a network of retailers in 50 countries. VIP's products are imported in numerous other countries. It acquired United Kingdom luggage brand Carlton in 2004. It also owns the Aristocrat and Skybags brands which are very popular in India.
Standalone Financials (in Crs)
Q4FY22 Q4FY21 YoY % Q3FY22 QoQ % FY22 FY21 YoY%
Sales 352 258 36.4% 398 -11.6% 1304 672 94.0%
PBT 13 -16 -181.3% 37 -64.9% 84 -112 -175.0%
PAT 9 -12 -175.0% 27 -66.7% 64 -84 -176.2%
Consolidated Financials (in Crs)
Q4FY22 Q4FY21 YoY % Q3FY22 QoQ % FY22 FY21 YoY%
Sales 362 259 39.8% 407 -11.1% 1326 667 98.8%
PBT 16 -6 -366.7% 44 -63.6% 86 -125 -168.8%
PAT 12 -4 -400.0% 33 -63.6% 67 -97 -169.1%
Detailed Results:
1. The company saw its revenue grow by 40% YoY whereas decline by 11% QoQ. 2. Hard luggage accounted for 62% of revenues while soft luggage stood at 38%. 3. Gross Margin for VIP was 53%, compared to 49% in the sequential quarter & this increase was on
account of higher prices, product mix in favour of VIP & Skybags & higher contribution from its Bangladesh’s manufacturing plant.
4. EBITDA margin was at 10.6% for Q4. 5. The company has consolidated cash & cash equivalents of Rs 61 Cr as of March 2022 whereas net
debt stood at Rs.61 Cr. 6. Consolidated Borrowings were at Rs.123 Cr as of March 2022.
Investor Conference Call Highlights
1. The management states that the Aristocrat brand portfolio has been growing faster than the peer companies in the same segment where the brand saw almost 61% YoY growth in Q4FY22 and 140% in FY22 & the brand contribution stood at 36% of the overall business.
2. The company’s current quarter saw almost 40% of its annual advertising spending.

Click here to Subscribe
on WhatsApp
www.smartsyncservices.com
3. The management states that its manufacturing has scaled up to almost two-thirds of its total sales.
4. The management foresees good demand in the coming quarter due to domestic travel coming back to pre-pandemic levels, resumption of international travels, pandemic-free weeding seasons and school/college reopening.
5. The management also foresees several headwinds in the form of high inflation & high contribution of the future group to the total sales (15% of pre-pandemic sales).
6. The company took a 4% price increase in November and about the same towards the end of March and one in Q1FY22 while the RM inflation if FY22 stood at 6%.
7. The management states that several units were at about 83% revival in FY22 compared to FY20.
8. The management states that the CAPEX outlay for the current financial year FY23 will be between ₹30 to ₹35 Cr.
9. The company’s current contribution from the Future Group stands close to zero.
10. The company’s online sales contribution stood at 16% of total sales in FY22 while the management expects it to taper down to 12-15% levels in the coming years.
11. The company’s Skybags division is going to launch a new range targeting the younger generation of women.
12. The company’s share of modern trade in CSD was at 30%.
Analyst’s View:
VIP has been the market leader in the soft and hard luggage segment in India for a long time now. The company is one of the biggest luggage manufacturers in the world by volume. Luggage sales in all segments are picking up with the value segment bouncing back the most. The management is also confident that there are no issues regarding the supply of raw materials. It remains to be seen how VIP continues to strengthen its internals in the meantime and develop the eCommerce channel along with headwinds in the form of inflation & future groups’ current financial health. Nonetheless, given the company’s strong brand image and leadership position in the industry along with the resilient balance sheet of the company, VIP Industries remain a pivotal mid-cap stock to watch out for.

Click here to Subscribe
on WhatsApp
www.smartsyncservices.com
MICROFINANCE Credit Access Grameen
Financial Results & Highlights Brief Introduction:
CreditAccess Grameen Limited (formerly known as Grameen Koota Financial Services Pvt. Ltd.) is a microfinance institution providing a wide range of financial services to the rural poor and low-income households, particularly women. It is registered with the Reserve Bank of India under the NBFC-MFI category. The company provides loans primarily under the joint liability group (JLG) model. Its primary focus is to provide income generation loans which comprised 87.02% of its total JLG loan portfolio, as of March 31, 2018. It also provides other categories of loans such as family welfare loans, home improvement loans and emergency loans to existing customers.
CreditAccess Grameen is also an aggregator of the National Pension Scheme (NPS) of the Government of India. As of March 31, 2018, CreditAccess Grameen had 516 branches across 132 districts in the states of Karnataka, Maharashtra, Madhya Pradesh, Chhattisgarh, Tamil Nadu, Odisha, Kerala, Goa, and the union territory of Puducherry.
Standalone Financials (in Crs)
Q4FY22 Q4FY21 YoY % Q3FY22 QoQ % FY22 FY21 YoY%
Sales 694 609 14.0% 577 20.3% 2291 2031 12.8%
PBT 203 99 105.1% 172 18.0% 513 194 164.4%
PAT 151 72 109.7% 129 17.1% 382 142 169.0%
Consolidated Financials (in Crs)
Q4FY22 Q4FY21 YoY % Q3FY22 QoQ % FY22 FY21 YoY%
Sales 824 726 13.5% 690 19.4% 2750 2466 11.5%
PBT 218 78 179.5% 155 40.6% 481 180 167.2%
PAT 160 56 185.7% 117 36.8% 357 131 172.5%
Detailed Results:
1. The company had a great quarter with a 14% YoY rise in standalone revenues. The consolidated revenues were up 13% while PAT was up 185% YoY.
2. GLP grew 22.2% YoY to Rs 16,599 Cr. Standalone GLP grew 21.1% YoY. MMFL GLP grew 27.7% YoY.
3. Disbursements grew 22.5% YoY with CAGL up 12.2% YoY and MMFL up 96.2% YoY.
4. The customer base fell 2.2% YoY & increased by 2.3% QoQ to 38.2 Lakh. The standalone customer base stood at 29.2 lakh while MMFL’s customer base stood at 9.3 lakh.
5. The company added 6.9 lakh new borrowers in FY22.
6. NII has risen 12.1% YoY to Rs 519.6 Cr. PPoP grew 12.1% YoY at Rs 369 Cr.

Click here to Subscribe
on WhatsApp
www.smartsyncservices.com
7. Provisioning for CAGL & MMFL stood at 3.19% & 4.57% respectively
8. Overall RoA and RoE were at 3.7% and 15.9%.
9. GNPA & NNPA of CAGL stood at 3.1% & 0.9% respectively while the same for MMFL stood at 5.8% & 3%.
10. CRAR: CAGL 26.5% (Tier 1: 25.9%), MMFL 20% (Tier 1: 12.5%).
11. Collection efficiency at 96% for CAGL in March excluding. MMFL collection efficiency excluding arrears was at 92%
12. Standalone debt to equity was at 2.7 times. MMFL debt to equity was at 6.7 times.
13. Consolidated cost to income ratios was at 33.8% in Q4. Opex to GLP was at 4.8% in Q4.
14. WA cost of borrowing for CAGL was at 8.8% in Q4.
15. Consolidated cost of borrowings stood at 8.9%.
16. 38 new branches of CAGL opened in Q4 while MMFL opened 4 new branches in Q4 and the total branches stand at 1635.
17. NIM of standalone business stood at 11.5%. Consolidated NIM was at 11.3% while MMFL was at 10% in Q4.
18. Positive ALM mismatch with an average maturity of assets at 18.1 months and average maturity of liabilities at 22.5 months in CAGL.
19. IGL loans accounted for 96% of total loans.
20. No district accounts for >4% of the total loan portfolio currently.
21. Karnataka remains the biggest market for the company with 35.9% of GLP. Maharashtra comes in second with 21.5% of GLP and Tamil Nadu is third with 20.8% of GLP.
Investor Conference Call Highlights:
1. The management foresees NIMs improving by 50 to 60 bps in FY2023 compared to FY2022 due to allowing of risk-based financing by RBI in its new microfinance guidelines.
2. The management expects portfolio growth to remain muted during Q1 FY2023 as it will implement the new RBI guidelines on the field and ensure required training on new processes and controls to its employees.
3. The company doesn’t expect to raise capital in the next 1-2 years to meet its growth targets.
4. The management plans to increase its active client base by 8% to 10% in the coming year.
5. The company believes that demand in rural areas will remain unaffected despite higher interest rates & inflation.
6. The management states that MMFL’s borrowing cost is higher than CREDAG leading to the yield difference meanwhile 65% of MMFL portion is underwritten as per CREDAG.

Click here to Subscribe
on WhatsApp
www.smartsyncservices.com
7. The management states that as a rule of thumb the company’s growth should not exceed its customer acquisitions by more than 25% otherwise that would mean leveraging.
8. The company’s market share in its industry is about 5.6% and among NBFCs, it is about 18%.
Analyst’s View:
Credit Access Grameen has emerged as one of the most reliable microlenders in the country. Their revolutionary JLG model has helped bring communities of borrowers together and helped reduce overall risk from their lending to a very large extent as seen in their low NPA numbers. The company has delivered a great Q4 performance which saw GLP, revenue, disbursement & profits growth. The company rising collection efficiency but a few states like Maharashtra are expected to remain subdued for some time where the company is charging higher rates due to higher risk in that region. The company remained conservative and focused on servicing existing customers which led to higher average loan outstanding, but it has been able to add new borrowers in the past few months. It remains to be seen whether the company will be able to come back to its pre-covid growth rate of 30-40% CAGR given the issues in the microfinance industry and how will the RBI rate hike affect the demand from its target market. Nonetheless, given its strong market position and exemplary operating and risk management practices, Credit Access Grameen remains one of the must-watch stocks in the Microfinance sector for any interested investor.

Click here to Subscribe
on WhatsApp
www.smartsyncservices.com
NBFC AAVAS Financiers
Financial Results & Highlights Brief Company Introduction
Aavas Financiers Limited provides housing loans to customers belonging to low and middle income segments in semi-urban and rural areas in India. The company offers home loans for flats, houses, and bungalows, as well as resale properties; land purchase and construction loans, including finance for self-construction of residential house; and home improvement loans, which include loans for tiling or flooring, plaster, painting, etc. It also provides home equity loans; and micro, small, and medium enterprise loans for business expansion, purchase of equipment, working capital, etc., as well as balance transfer products. The company was formerly known as AU Housing Finance Limited .
Standalone Financials (In Crs)
Q4FY22 Q4FY21 YoY % Q3FY22 QoQ % FY22 FY21 YoY%
Sales 365 291 25.4% 343 6.4% 1305 1105 18.1%
PBT 146 95 53.7% 115 27.0% 455 353 28.9%
PAT 116 88 31.8% 89 30.3% 357 289 23.5%
Consolidated Financials (In Crs)
Q4FY22 Q4FY21 YoY % Q3FY22 QoQ % FY22 FY21 YoY%
Sales 365 291 25.4% 344 6.1% 1305 1105 18.1%
PBT 146 95 53.7% 115 27.0% 455 353 28.9%
PAT 116 88 31.8% 89 30.3% 357 289 23.5%
Detailed Results:
1. The company had a good quarter with revenue growth of 25% YoY and 6% QoQ & PAT growth of 31% YoY and 30% QoQ.
2. AUM growth for the company was 20.1% YoY to Rs.1,13,502 Cr as of 31st March 2022.
3. Disbursements in FY22 increased by 35.6% to Rs.36,022 Cr.
4. Gross Stage 3 loans were at 0.99%. Net stage 3 stood at 0.77%
5. NIM in FY22 has gone up 52 bps YoY to 8.23%.
6. ROA for the year is up by 8 Bps to 3.58% while ROE was at 13.72%
7. Product breakup was 73.5% Home Loans & 26.5% Other Mortgages Loans.
8. Around 60.2% of existing customers are self-employed while the rest are salaried.
9. The company has kept the yield spread at a stable 5.77% in Q4.
10. Opex to AUM in FY22 was to 3.45%.

Click here to Subscribe
on WhatsApp
www.smartsyncservices.com
11. It has surplus funds of Rs.3844.9 Cr as of 31st March 2021.
12. It maintained a CAR of 51.41% with Tier 1 capital at 50.73%.
13. Book value per share was at Rs.355.8.
14. 1+DPD improved from 6.45% to 4.47% in the last quarter.
15. The company in the current fiscal year borrowed incremental amount of Rs.4388.4 Cr at 6.04% for 102 months and overall average cost of borrowing stood at 6.88%.
16. The company registered a growth of 20% YoY in total number of live accounts and employee count increased by 31% YoY.
17. The company maintained a positive ALM surplus across all time periods and has an average tenor of outstanding borrowings stood at 126 months for this quarter.
Investor Conference Call Highlights
1. The company has categorized 0.31% of up to 90 DPD assets as GNPA following RBI's notification dated 12th November 2021 to harmonize IRACP norms across all lending institutions.
2. The total no. of branches stood at 314 after 34 new additions in the current FY.
3. The management believes that the market is huge & it can continue to grow for the next 20-25 years sustainably.
4. The Opex numbers for the current quarter were relatively high due to a lower base of employee salaries in the previous FY, high expenditure being incurred towards digital & technology infrastructure & higher depreciation due to 30-35 branches being added every year.
5. The employee base for the current year stood at 5,222.
6. The management expects cost efficiency of 30-35 Bps in FY23.
7. The assets held for sale in March are Rs.23 Cr while the same stood at Rs.20 Cr in December.
8. The management expects ROE to improve by 100-150 Bps on a YoY basis.
9. The company invested Rs.15 Cr in AAVAS FINSERV as per the regulatory requirement of minimum capital.
10. The company’s acquisition yields in the current fiscal for the housing & non-housing segment stood at 11.7% & 14.2%.
11. The management states that the company’s efforts towards investing in technology will help it serve at a larger scale coupled with reduced TAT by around 50-75%.
12. The management maintains its growth guidance of 20-25% on a YoY basis.

Click here to Subscribe
on WhatsApp
www.smartsyncservices.com
Analyst’s View:
Aavas Financiers is a fast-growing housing finance company in India. What sets it apart from the large housing finance players like HDFC, LIC Housing Finance & Repco is the space they cater to. The average ticket size of loans is less than 9 lacs against more than 14 lacs for others. Aavas caters to smaller towns where the population is less than 10 lacs. Aavas has a good quarter that saw both YoY growth and QoQ growth. It has also maintained AUM growth of >20% and improved its FY22 NIM to 8.23%. The company continued its growth journey & added 34 new branches in the current fiscal. It remains to be seen whether the company will be able to sustain its lofty growth momentum and what challenges will it face when expanding into new states like Odisha where housing loan penetration is very low. However, stretched valuations may have factored in most of the positives. Nevertheless, it is a good business to track in the housing finance space, especially given its consistent and steady growth while maintaining good asset quality and underwriting standards.

Click here to Subscribe
on WhatsApp
www.smartsyncservices.com
Bajaj Finance
Financial Results & Highlights Brief Introduction:
Bajaj Finance is engaged in the business of lending. BFL has a diversified lending portfolio across retail, SME and commercial customers with a significant presence in urban and rural India. It also accepts public and corporate deposits and offers variety of financial services products to its customers.
Standalone financials (in Crs)
Q4FY22 Q4FY21 YoY % Q3FY22 QoQ % FY22 FY21 YoY%
Sales 7620 6010 26.8% 7525 1.3% 27871 23546 18.4%
PBT 3059 1571 94.7% 2610 17.2% 8586 5363 60.1%
PAT 2268 1161 95.3% 1934 17.3% 6350 3955 60.6%
Consolidated financials (in Crs)
Q4FY22 Q4FY21 YoY % Q3FY22 QoQ % FY22 FY21 YoY%
Sales 8630 6855 25.9% 8535 1.1% 31640 26683 18.6%
PBT 3265 1822 79.2% 2868 13.8% 9504 5992 58.6%
PAT 2419 1347 79.6% 2125 13.8% 7028 4420 59.0%
Detailed Results:
1. The company had an excellent Q4 with consolidated revenue increasing by 25% YoY & PAT growth of 79% YoY due to the low base in Q4FY21.
2. Consolidated AUM for the company has risen 26% YoY. 3. Quarterly Opex to NII increased from 34.5% to 34.6% YoY while annual Opex to NII increased from
30.7% to 34.6%. 4. Net NPA stood at 0.68% Vs 0.75%. 5. In Q4, the Company booked 6.28 MM new loans Vs 5.47 MM in Q4 FY21. 6. Volume growth in B2B biz was 15% & disbursements grew by 27% in Q4. 7. 2.21 MM new customers were added in Q4. 8. Deposits book grew by 19% YOY to ₹ 30,800 crore as on 31 March 2022 while their contribution to
total borrowings stood at 19%. 9. In Q4, loan loss to average receivables was 0.38% 10. CAR stood at 27.22%. 11. The company declared total dividend of Rs.20 for FY22. 12. Customer franchise stood at 57.57 MM as of 31 March 2022 which is a growth of 19% YoY 13. Quarterly ROE increased from 3.7% to 5.7% YoY & yearly ROE increased from 12.8% to 17.4%. 14. BHFL had a good quarter with AUM growth of 37% to ₹ 53,322 Cr, Net Interest Income growing by
22% YoY to ₹ 452 Cr from ₹ 369 Cr. 15. OPEX to NII of BHFL for this quarter increased significantly from 26.6% to 32.5% YoY due to accelerated
investments for geographical expansion while GNPA & NNPA stood at 0.31% & 0.14% respectively. 16. Capital adequacy of BHFL was 19.72% as of 31 March 2022.

Click here to Subscribe
on WhatsApp
www.smartsyncservices.com
17. BFSL had a great quarter adding 62K new customers with margin trading finance book growing to Rs.720 Cr from 184 Cr YoY while total income growing from Rs. 14 Cr to 39 Cr YoY & PAT growing to Rs. 9 Cr from 4.5 Cr.
18. The breakup of growth in the consolidated loan book is as follows: 1. Auto Finance: -16% YoY 2. Sales Finance: 30% YoY 3. Consumer B2C: 27% YoY 4. Rural Sales Finance: 43% YoY 5. Rural B2C: 29% YoY 6. SME Lending: 24% YoY 7. Securities Lending: 79% YoY 8. Commercial Lending: 39% YoY 9. Mortgage lending: 24% YoY
Investor Conference Call Highlights:
1. In Q4, the Company added 81 new locations making the total Geographic presence at 3,504 locations & 1,33,200 + distribution points as on 31 March 2022.
2. In Q4, cost of funds was 6.71% whereas the Liquidity buffer stood at ₹ 10,110 Cr as on 31 March 2022
3. The company is comfortable adding 8-9MM new customers in FY23. 4. In Q4, the Company added net 2.6 MM users on its digital app platform as against 3.6 MM in Q3
FY22 & plans to add 14-16 MM net new users in FY23. 5. The management states that 4th quarter is always important for the company as it determines what
will be its entry run rate in the coming fiscal years. 6. The management overlay for the current quarter is Rs.1052 Cr and the company plans to decrease
this in the next 6 months provided there is no 4th covid wave. 7. On 7th April, company infused Rs.2500 Cr in BHFL. 8. The company acquired 455,000 new EMI card customers digitally. 9. The company’s digital app platform delivered Rs.1,800 Cr of personal loans in the quarter that went
by and 29,000 credit cards. 10. The management believes that the app is critical for the company to reach 100 million customers
someday from the current levels of 4-7 million. 11. The management states that it will rather dilute growth than to dilute margin. 12. The management believes that NIM is a function of pricing, product mix & cost of funds. 13. The company isn’t worried about competition in SME biz due its 14 years of experience in that
segment which has taught that new players get attracted seeing the gross margins however they abort the field quickly after showing inability to clock healthy net margins.
14. The management expects Opex to NII to remain at 34-35.5% range in FY23. 15. The consumer durables lending segment as a % to total balance sheet is 10% currently. 16. The company is launching Bajaj Mall on 1st July. 17. The company is building the entire technology stack itself so as to monetize its strong franchise. 18. The management is focused on developing the company from a financial services business to a
payments and financial services business with 100 million franchises in the next five years & thus doesn’t see conversion into a bank as an option for at least the next 3 years.
19. The company’s market share in consumer electronics biz is 57-59% & 68-70% in consumer durables biz.

Click here to Subscribe
on WhatsApp
www.smartsyncservices.com
Analyst’s View:
Bajaj Finance is one of the fastest-growing NBFCs in India today. The company has done well to bounce back quickly from the post-COVID situation and has seen good traction across most categories. The current quarter was good for the company with PAT rising 80% YoY with revenue growth of 25% and AUM growth of 26% YoY. The company’s focus on building an omnichannel framework and app ecosystem is the immediate concern as it will also help it harness its potential through digital transformation. The app suite is expected to be up and launched by Sep. The company is also building a technology stack to monetize its strong franchise. The management has also stated that the immediate focus for Bajaj Finance is to scale up its payments and financial services businesses and it is not looking to become a commercial bank for the near future at least. It remains to be seen how the current situation evolves with the several new RBI regulations indicating similar compliances for NBFC & Banks in India and what obstacles will the company face in scaling up its digital payments business. Nonetheless, given the company’s strong market position, the management drive to derive new opportunities through the use of data and technology, and its strong balance sheet position, Bajaj Finance remains a pivotal NBFC stock for all Indian investors.

Click here to Subscribe
on WhatsApp
www.smartsyncservices.com
Manappuram Finance
Financial Results & Highlights Brief Company Introduction
Manappuram Finance Ltd. is one of India’s leading gold loan NBFCs. Today, it has 4208 (Includes branches of subsidiary companies) branches across 28 states/UTs.
Standalone financials (in Crs)
Q4FY22 Q4FY21 YoY % Q3FY22 QoQ % FY22 FY21 YoY%
Sales 1063 1319 -19.4% 1110 -4.2% 4587 5193 -11.7%
PBT 359 608 -41.0% 346 3.8% 1750 2269 -22.9%
PAT 265 458 -42.1% 259 2.3% 1304 1698 -23.2%
Consolidated financials (in Crs)
Q4FY22 Q4FY21 YoY % Q3FY22 QoQ % FY22 FY21 YoY%
Sales 1491 1630 -8.5% 1507 -1.1% 6126 6375 -3.9%
PBT 354 622 -43.1% 348 1.7% 1783 2316 -23.0%
PAT 261 468 -44.2% 261 0.0% 1329 1725 -23.0%
Detailed Results:
1. The company reported another set of dismal result with consolidated revenue decreasing by 8% YoY and PAT falling by 44% YoY.
2. The company’s ROE decreased by 1280 bps YoY to 12.6% & 30 bps QoQ whereas its ROA declined by 290 bps YoY to 3.1%.
3. The gold loan AUM declined by 1.4% sequentially while LTV stood at 62%. 4. The company’s consolidated AUM was at Rs 303 Bn which increased 11.2% YoY and was flat on QoQ
basis. 5. Book value per share at the end of the quarter was Rs 94.1. 6. The company’s consolidated cost of funds decreased by 110 bps YoY to 8%. 7. In the gold loan business, the Opex to AUM stood at 6% for Q4FY22. 8. The standalone business has a GNPA of 3% and NNPA of 2.7% while net yield stood at 18.8% for Q4. 9. The CAR for the standalone business stands at 31%. 10. Gold AUM per branch stood at 56.4Mn. 11. Online gold loan division contributed 44% to the company’s overall gold AUM in Q4. 12. The company’s advance mix saw a decline in gold loan business to 67% of total advances while MFI
business was flat at 22% of total advances. 13. Asirvad MFI saw a GNPA of 3.5% with NNPA at 0 for Q4. Opex to AUM for Asirvad was at 7%. Cost of
funds was at 10.3%. 14. Collections were at 99% for Q4 in MFI business. 15. The company’s housing finance business reported AUM of Rs.845.3 Cr. 16. The company’s vehicle finance business reported an AUM of Rs 1643.2 Cr 17. The company has announced a quarterly dividend payout at Rs 0.75 per share.

Click here to Subscribe
on WhatsApp
www.smartsyncservices.com
Investor Conference Call Highlights
1. The company was able to add 3.75 lakh new customers whereas the average ticket size and the average duration were Rs. 56,568 and 82 days respectively.
2. The company’s loan tenure mix stood as 2/3rd of the loans for 3 months, 30% in 6 months. And below 5% is in the 1-year category.
3. The management is optimistic about pricing wars between NBFC to settle soon and disbursement to be at 21%.
4. The yields in the Asirvad segment went up by 4% due to higher credit costs.
5. The company believes that its key competition comes from NBFC & not banks. Due to the rate hike by RBI, it expects the weaker NBFCs to reduce the intensity of competition leading to more stabilisation of its operations.
6. The company is currently targeting yields of 5%.
7. The management states the capital adequacy of Asirvad is 20% & so it has enough room to raise tier 2 capital.
8. The amount spent on advertisement for Q4 stood at Rs.12 Cr while that for FY22 stood at Rs.89 Cr.
9. The management expects gold loan growth to be at around 10% in the FY2023.
10. The company expects yields to increase by around 150 bps to 200 bps.
Analyst’s View
Manappuram Finance has long been one of the most consistent players in the NBFC sector in India. The company has cemented its position as one of India’s leading gold loan providers by growing its core business consistently. The company has also started seeing good collections in MFI and vehicle business. The management states that it views NBFCs as their main competition and these NBFCs should be in for a tough time given the rising rate scenario. It remains to be seen how the company would mitigate the possible risk of further decline in gold prices, the margin erosion from moving to a higher duration product, and the increased competition in this industry. Nonetheless, given the company’s resilient customer base and gold loan AUM along with the rising star among MFIs in Asirvad Microfinance, Manappuram Finance seems like a pivotal finance stock to watch out for.

Click here to Subscribe
on WhatsApp
www.smartsyncservices.com
Muthoot Finance
Financial Results & Highlights Brief Company Introduction
Muthoot Finance Limited operates as a gold financing company in India. It provides personal and business loans secured by gold jewelry, or gold loans primarily to individuals; micro finance; and loans to landlords. The company also offers gold coins, money transfer, foreign exchange, insurance, ATM, wealth succession, and housing finance services; mutual funds and non-convertible debentures; and wealth management services, including risk evaluation, client evaluation, value analysis, and consultancy. As of March 31, 2020, the company operated approximately 4,567 branches in 29 states. Muthoot Finance Limited was founded in 1887 and is headquartered in Kochi, India.
Standalone Financials (in Crs)
Q4FY22 Q4FY21 YoY % Q3FY22 QoQ % FY22 FY21 YoY%
Sales 2670 2824 -5.5% 2868 -6.9% 11082 10557 5.0%
PBT 1292 1350 -4.3% 1377 -6.2% 5309 5006 6.1%
PAT 960 995 -3.5% 1029 -6.7% 3954 3722 6.2%
Consolidated Financials (in Crs)
Q4FY22 Q4FY21 YoY % Q3FY22 QoQ % FY22 FY21 YoY%
Sales 3041 3119 -2.5% 3168 -4.0% 12237 11570 5.8%
PBT 1352 1385 -2.4% 1397 -3.2% 5410 5131 5.4%
PAT 1006 1024 -1.8% 1044 -3.6% 4031 3819 5.6%
Detailed Results:
1. The company saw a weak quarter with consolidated revenue de-growing 3% YoY and Profits de-growing 2% YoY.
2. The consolidated gross loan assets for the company grew 11% YoY.
3. The total number of branches stood at 5581.
4. The GLA growth for the company’s different businesses was:
a) Muthoot Finance: Up 10% YoY
b) Muthoot Homefin: Down 14% YoY
c) Belstar Microfinance: Up 32% YoY
d) Muthoot Money: Down 44% YoY
e) Asia Asset Finance: Down 13% YoY
5. Cash and cash equivalents for the company at the consolidated level were at Rs 10035.8 Cr as of march ‘22.
6. The consolidated interest income grew 6% YoY.

Click here to Subscribe
on WhatsApp
www.smartsyncservices.com
7. 33.8% of gold loan customers are transacting online. Interest income in standalone business grew 6% YoY.
8. The company has total funding of Rs 48970.1 Cr through various means like debt, NCDs, etc.
9. The company has around 187 tonnes of gold kept as security.
10. The gold loan portfolio distribution is North @ 17%, South @ 60%, East @ 7%, and West @ 16%.
11. Average monthly disbursement and collection were at Rs.112 & 100 billion respectively
12. The company has 5.31 million active customers.
13. The company saw a net interest margin of 12.21% & an interest spread of 10.91% in Q4FY22.
14. ROA was at 6.81% in Q4.
15. Opex to AUM was at 3.19%. ROE was at 21.48%.
16. Muthoot maintained a CAR of 29.97% with 29.10% being Tier I.
17. The book value per share was Rs.456.98.
18. Muthoot Homefin saw NIM of 6.16% and cost to income ratio of 56.76%.
Investor Conference Call Highlights
1. The company consciously adopted lower yields to acquire more customers in the current quarter. 2. It has discontinued the teaser rate loans & now plans to capitalize on the new customers. 3. The auctions for the quarter are Rs.2,100 Cr and accrued interest is Rs.2,071 Cr. 4. The company is looking to maintain spreads in the range of 10%. 5. The management states that since 75% of its portfolio in Srilanka is from the gold loan segment &
since prices of gold have shot up in that part due to the currency crisis, the loan book in Srilanka is very safe.
6. The management believes that the situation of Srilanka’s economy is not as bad as what newspapers are articulating & it expects the demand to revive strongly.
7. The management expects to maintain its guidance of 12-15% credit growth in the coming FY.
8. The management states that the company is facing delays in getting approvals for new branch openings from RBI.
9. The company’s loan book comprises loans above INR 1 lakh @ 58% and loans below INR 1 lakh @ 42 per cent.
10. The management believes that increased competition from banks in the gold loan segment will also help in attracting more customers to the gold loan sector.

Click here to Subscribe
on WhatsApp
www.smartsyncservices.com
Analyst’s View
Muthoot Finance is the leader in the gold loan industry. The company has cemented its market position by growing its core business consistently and maintaining its momentum. The company posted mediocre quarterly results with sales de-growth of 3% YoY and profit de-growth of 2% YoY. The management is expecting good growth in the coming quarters due to the further opening of the economy. The management Is maintaining its guidance of 12-15% revenue growth for FY23. It remains to be seen how the company would mitigate the risk of further decline in gold prices, the rising interest rate environment, and the increased competition in this industry. Nonetheless, given the company’s resilient customer base, resilient brand image, and gold loan AUM, Muthoot Finance seems like a pivotal finance stock to watch out for.

Click here to Subscribe
on WhatsApp
www.smartsyncservices.com
Piramal Enterprises
Financial Results & Highlights Brief Company Introduction
Piramal Enterprises Limited (PEL) (including its subsidiaries) is one of India’s large diversified companies, with a presence in Healthcare, Healthcare Insights & Analytics business and Financial Services. In Pharmaceuticals, through an end-to-end manufacturing capabilities across its manufacturing facilities and a large global distribution network, the Company sells a portfolio of niche differentiated pharma products and provides an entire pool of pharma services (including in the areas of injectable, HPAPI etc.). In Financial Services, PEL provides comprehensive financing solutions to real estate companies.
Standalone financials (in Crs)
Q4FY22 Q4FY21 YoY % Q3FY22 QoQ % FY22 FY21 YoY%
Sales 876 517 69.4% 702 24.8% 2693 1920 40.3%
PBT 360 129 179.1% 192 87.5% 651 189 244.4%
PAT 316 78 305.1% 168 88.1% 572 40 1330.0%
Consolidated financials (in Crs)
Q4FY22 Q4FY21 YoY % Q3FY22 QoQ % FY22 FY21 YoY%
Sales 4401 3565 23.5% 4067 8.2% 14713 13173 11.7%
PBT 174 966 -82.0% 1137 -84.7% 2677 3397 -21.2%
PAT 150 -510 -129.4% 888 -83.1% 1999 1413 41.5%
Detailed Results
1. The company had a very poor quarter with consolidated Revenues for Q4 rising 23% YoY & PAT decreasing by 83% YoY.
2. The overall loan book grew by 33% year-on-year to Rs. 65,185 Cr and retail AUM grew four times YoY to AUM of Rs. 21,552 Cr.
3. Average cost of borrowings stood at 9.2% while average maturity of borrowings stood at 3.7 years.
4. GNPA and NNPA post the merger were at 3.4% and 1.6% respectively with provisioning at 5.7% of AUM.
5. Capital adequacy ratio stood at 21%.
6. Wholesale: retail loan mix stood at 64:36.
7. The loan book breakup after the demerger is:
1. Affordable Housing: 68%
2. MSME Secured:29%
3. Used car loans:0.4%
4. Digital unsecured:1.4%

Click here to Subscribe
on WhatsApp
www.smartsyncservices.com
5. MSME unsecured:0.7%
8. Net debt to equity of the financial services division is now at 2.7 times.
9. Cumulative ALM mismatch was positive & stood at Rs.12,237 Cr.
10. Self-employed: salaried customers stood at 56:44
11. The yield on disbursements was 12.5% while the average cost of funds was at 9.1% in Q4. ROA and ROE were at 1.3% and 4.1% respectively.
12. Pharma revenues grew 16% YoY for FY22 7 11% YoY for Q4. EBITDA margins stood at 18% for FY22.
13. The breakup of pharma revenues was:
1. Pharma CDMO: Up 8% YoY in Q4
2. Complex Generics: Up 8% YoY in Q4
3. India Consumer Healthcare: Up 55% YoY in Q4
14. PEL launched 40 new products in the India Consumer Healthcare division in FY22.
15. Demerger is expected to be completed by Q3 FY23.
16. The Pharma division contributed to 48% of total sales for FY22.
Investor Conference Call Highlights
1. The company has increased its presence with 1 million life-to-date customers and 309 branches across 24 states and union territories.
2. The management is aiming to increase its debt to equity to 3.5-4.5X & increase its branch count by 100 in FY23.
3. The company invested in EarlySalary (a fintech startup) for a 10% equity stake. 4. Through the DHFL acquisition, the company acquired a 50% stake in Pramerica Life Insurance JV with
Prudential U.S. 5. The management states that the company has $157 million of growth-oriented Capex investments
committed across various multiple sites. 6. The management states that in the medium to the long term, it expects about 15% revenue growth
across the businesses and expects the EBITDA margin to be 25% to 28% in the 3-5 year time frame. 7. The company had to make extra provisions because its expected realisation from the sale of a few
companies which it had lent in the past was sold at a lower rate. 8. Since the take-over of DHFL, the company has recovered Rs.715 Cr worth of loans from the POCI book
out of which roughly Rs.425-odd Cr has come in Q4. 9. The management is targeting a doubling of AUM post 5 years & shift the loan mix between wholesale:
and retail from 65:35 to 35:65.

Click here to Subscribe
on WhatsApp
www.smartsyncservices.com
Analyst’s Views
Piramal Enterprises has seen the continuation of the recovery in the financial division and good growth in the pharma division. PEL had a poor Q4 with a 23% YoY rise in revenues however profitability took a deep dive due to higher provisioning. The company announced a demerger of its pharma business from the financial services business earlier in Q2FY22. This event is expected to take place in Q3 FY2023. PEL continues to invest in adding on to its pharma business. It has acquired a minority stake in Yapan Bio which is expected to help Piramal pharma foray into biologics. It remains to be seen how long it will take for the new business segments in financial services to scale up for PEL and what challenges it will face in the integration of DHFL and the growth path of the pharma business. However, given their past track record, management capability, and surplus unallocated capital which can be deployed to support any of the conglomerate’s various businesses, Piramal Enterprises continues to be a good conglomerate stock to watch out for, particularly in the real-estate lending space.

Click here to Subscribe
on WhatsApp
www.smartsyncservices.com
Shriram Transport Finance
Financial Results & Highlights Brief Company Introduction
Shriram Transport Finance Company Ltd is a part of the SHRIRAM Group conglomerate which has a
significant presence in the financing business. STFC is engaged in the business of commercial vehicle
financing mainly focusing on trucks from preowned to new ones. It's a Deposit-taking NBFC comprising 1,758 branches, 831 rural centers, and partnerships with ~500 private financiers.
Standalone financials (in Crs)
Q4FY22 Q4FY21 YoY % Q3FY22 QoQ
% FY22 FY21 YoY%
Sales 5087 4498 13.1% 4832 5.3% 19274 17436 10.5%
PBT 1350 938 43.9% 923 46.3% 3549 3278 8.3%
PAT 1086 754 44.0% 680 59.7% 2707 2487 8.8%
Consolidated financials (in Crs)
Q4FY22 Q4FY21 YoY % Q3FY22 QoQ
% FY22 FY21 YoY%
Sales 5087 4498 13.1% 4832 5.3% 19274 17436 10.5%
PBT 1350 938 43.9% 923 46.3% 3549 3278 8.3%
PAT 1091 756 44.3% 686 59.0% 2721 2499 8.9%
Detailed results :
1) The company saw a decent quarter with revenues growing by 13% YoY while PAT increased by
44% YoY.
2) The collections for FY22 stood at 104.28%.
3) The Liquidity Coverage Ratio was 148.70 % as of March 31, 2022.
4) The Cost to income ratio stood at 20.00 % in Q4 FY22 as compared to 21.96% in Q4 FY21.
5) Net interest income for Q4 increased by 22.16% YoY.
6) The AUM for the year end stood at Rs 1,270,408.6 Mn.
7) Gross & net stage 3 assets stood at 7.14% & 7.5% respectively.
8) The CRAR stood at 22.97 % as of Q4 FY22 compared to 22.50% as of Q4 FY21.
9) The ALM mismatch Over 6 months- 1 year, 1 year to 3 years & 3 to 5 years was positive.
Concall highlights :
1) The management is bullish about the industry's future due to the favorable budget.
2) The management states that the auto industry performed well by reporting growth in sales of
18.75% to 2,49,806 units in Q4 2022 against 2,10,356 units in Q4 2021 and an increase of 28.3%

Click here to Subscribe
on WhatsApp
www.smartsyncservices.com
compared to 1,94,712 units sold in Q3 2022. While for the full year, it registered a 26% percent
growth to 7,16,566 compared to 5,68,559 units sold in 2021 despite the chip shortage.
3) The heavy and medium commercial showed a positive growth of 16.69% with 93,947 units sold
in Q4 against 80,534 units sold in Q4FY21, & a positive growth of 46.92% as compared to 63,964
units sold in Q3FY22. For the FY22 it registered a growth of 49.72% to 2,40,577 units compared
to 1,60,688 units sold in 2021.
4) The LCV numbers also showed a growth of 20.04% to 1,55,832 units as compared to 1,29,822
units sold in Q4 2021 and a growth of 19.18% as compared to 1,30,748 units sold in Q3FY21 and
for the full year growth of 16.7% percent to 4,75,989 units compared to 4,70,871 units.
5) The management states that the used vehicle demand has been very high and on average, the
resale prices have gone up by 20%. On the LCV front, the resale prices are as high as 30-35% &
on the heavy vehicles segment, it is between 15% and 20%.
6) The company has added 20 new branches.
7) The management is targeting 15% growth for the combined entity and on a standalone basis on
the commercial vehicle lending, it would be 12%.
8) The incremental cost of funds is down by 20 Bps while the total funds mobilized in Q4 is close to
around 15,000 Crores including an ECB which the company did in January to the extent of 3,500
Crores.
9) The company expects new vehicle lending to increase YoY in the coming quarters due to the
favorable economic scenario.
10) The management states that on the taxation front, it had a reversal of around 82 Crores on
account of early year's provisions which were no longer required and that gave a benefit for a
lower tax in the current quarter.
11) The management believes there won't be any challenges to the existing truck segment due to
high fuel prices because of the ability to pass price hikes to the end consumer.
12) The management states that they are not planning to enter into any new product segment in
this financial year as a combined entity or on a standalone basis.
13) The management states that Out of the 10470 Crores write-off, the NPL assets were 1216
Crores.
14) The company's customer mix between new and old customers stands at 65:35 approx.
15) The company is focusing on NIM of 7%.
16) Management believes their massive scope for further penetration in the used vehicle segment
where the company has a 30% market share since out of the remaining 70%, 50% is from the
unorganized sector.
17) The management is giving conservative guidance of Opex at 22-23%.

Click here to Subscribe
on WhatsApp
www.smartsyncservices.com
Analyst’s view:
STFC is a market leader in the CV financing space. The ongoing merger in the Shriram group presents
an interesting cross-selling opportunity for STFC. Over the last fel years, due to the downturn in the CV
space, STFC has faced asset quality and loan growth issues. It remains to be seen how long the CV cycle
will take to turn upwards. Some early signs of rivival have been visible. However, it is too early to take
a confident call on the cycle. Nevertheless given the long track record, and favourable valuation, it makes sense to track STFC at the current juncture.

Click here to Subscribe
on WhatsApp
www.smartsyncservices.com
NETWORK & COMMUNICATIONS Sterlite Technologies
Financial Results & Highlights
STL, Sterlite Technologies Limited (Formerly Sterlite Tech) is a digital technology multinational company having offices in India, China, US, SEA, Europe and MEA. It is listed on Bombay Stock Exchange and National Stock Exchange of India. It has more than 270 patents and serving customers in over 150 countries, including Fortune 100.
The company is specialized in optical fibre and cables, hyper-scale network design, and deployment and network software and offer bespoke integrated solutions for global data networks of CSPs, Telcos and OTTs. STL has also partnered with global telecom companies, cloud companies, citizen networks and large enterprises to design, build and manage such cloud-native software-defined network. It has strong global presence with next-gen optical preform, fibre and cable manufacturing facilities in India, Italy, China and Brazil and two software-development centres.
Standalone Financials (in Crs)
Q4FY22 Q4FY21 YoY % Q3FY22 QoQ % FY22 FY21 YoY%
Sales 1350 1338 0.9% 1321 2.2% 5080 4199 21.0%
PBT -38 157 -124.2% -144 -73.6% 111 365 -69.6%
PAT -32 109 -129.4% -107 -70.1% 82 261 -68.6%
Consolidated Financials (in Crs)
Q4FY22 Q4FY21 YoY % Q3FY22 QoQ % FY22 FY21 YoY%
Sales 1613 1491 8.2% 1370 17.7% 5813 4868 19.4%
PBT -40 173 -123.1% -191 -79.1% 31 380 -91.8%
PAT -25 122 -120.5% -140 -82.1% 47 265 -82.3%
Detailed Results:
1. The quarter saw revenue growth of 8% YoY in consolidated terms. 2. Standalone revenues remained flat % YoY. 3. The open order book is at Rs 11639 Cr currently. 4. The completion of various data network projects for the company are as follows:
1. T-Fibre: 50% 2. Modern Optical fibre rollout for large Indian telco (phase 1): 88% 3. Fibre to the home rollout in the U.K.: 3% (for the first project) 4. Data center connectivity projects: 58 completed 5. Network modernization (PGCIL): 47%

Click here to Subscribe
on WhatsApp
www.smartsyncservices.com
5. The order book spread across customer segments is as follows: a. Telcos: 62% b. Enterprises: 15% c. Citizen Networks: 22% d. Cloud Players: 1% 6. The client base revenue break up for FY22: . Telcos: 76% a. Citizen networks: 7% b. Enterprises: 14% c. Cloud: 3%
Investor Conference Call Highlights:
1. Huge investments by network creators including Govt. in creating digital infrastructure are being done according to the management.
2. Technological shift to 5G is happening rapidly with 4.4 billion 5G subscribers expected by 2027. 3. OFC demand is expected to increase to 648 million by 2026. 4. The management states that the company captured a 6% market share in America in a very less
time. 5. The company's market share in Europe increased from 16% to 25% YoY. 6. The company increased its optical interconnect attach rate from 3% in FY21 to 11% in FY22. 7. The management is guiding for revenue growth of 23-25% in FY23 along with EBIDTA margins of its
optical biz being 20-22% & 10-12% respectively & the net debt to remain flattish. 8. The company has sought principal approval for the demerger of its entities in case it wants to raise
cash & ensure that the consolidated debt level doesn’t increase. 9. The company is expecting to do Capex of Rs.500 Cr in FY23 out of which Rs.400 Cr will be for new
projects. 10. The company is focusing on incurring regular capex because of which it doesn’t expect debt levels to
come down substantially. 11. The decrease in margins by 500 Bps was contributed by increased investments (100Bps) & increased
costs of raw materials & freight (200 Bps each). 12. The management states that normalized margins are likely to come from H2 FY23. 13. The management expects an increase in margins by 700-900 Bps to 20-22% in the coming period
due to higher pricing, higher attach rate & softening of costs. 14. The company is planning a capex of Rs.300 Cr in the US & UK which will help in increasing its cable
capacity by 8-9 Kms. 15. The company’s inventory levels increased in Q4 due to higher dispatches to the US & UK where
transit time is between 45-90 days.

Click here to Subscribe
on WhatsApp
www.smartsyncservices.com
Analyst’s View:
The company had a poor quarter in terms of profitability due to higher costs of freight & raw materials along with increased investments. The company is aiming to have sustained growth momentum due to the deal wins and the recent qualification as a PLI scheme-approved company. Its global recognition as an Open RAN vendor should also help it bag 5G orders in the future. It remains to be seen how fast the move towards 5G will take place in the company’s principal geographies and whether the company will be able to maintain its planned trajectory to take advantage of this 5G movement along with the company’s ability to scale up its European business which is currently not profitable. Nonetheless, given the company’s capabilities in providing integrated and tailored network solutions, its expanded production capacity, and long-running order, Sterlite Technologies looks like a pivotal stock to watch out for in the communications technology space.

Click here to Subscribe
on WhatsApp
www.smartsyncservices.com
OTHERS ACRYSIL
Financial Results & Highlights
Brief Company Introduction
Acrysil Ltd is one the leading manufacturer and exporter of Composite Quartz Granite Kitchen Sinks in India. The company is engaged in the manufacture and sale of kitchen sinks in India. They offer granite kitchen sinks and stainless steel kitchen sinks. They market their sinks under the brand name 'Carysil'.
Standalone Financials (in Crs)
Q4FY22 Q4FY21 YoY % Q3FY22 QoQ % FY22 FY21 YoY%
Sales 113 84 34.5% 106 6.6% 402 255 57.6%
PBT 17 13 30.8% 16 6.3% 67 39 71.8%
PAT 12 7 71.4% 12 0.0% 51 26 96.2%
Consolidated Financials (in Crs)
Q4FY22 Q4FY21 YoY % Q3FY22 QoQ % FY22 FY21 YoY%
Sales 141 105 34.3% 130 8.5% 494 318 55.3%
PBT 22 19 15.8% 23 -4.3% 86 54 59.3%
PAT 16 13 23.1% 17 -5.9% 65 39 66.7%
Detailed Results:
1. The company saw a decent quarter with revenue growth of 34% while PAT growth of 23% YoY. 2. EBIDTA margins stood at 22.2% for Q4. 3. Product wise revenue mix for FY22 – A. Quartz sink – 77% B. Steel sink – 14% C. Appliances & others – 9% 4. The domestic business increased by 53.0% YoY to Rs. 97.5 crores for FY22 contributing 20% of the revenue.
5. The exports business increased by 61.4% YoY to Rs.381.8 crores for FY22 contributing 80% of the revenue.
6. The board of directors have recommended a final dividend of Rs. 1.2 per equity share in addition to an interim dividend of 1.2 per equity share declared in February 2022. Thus the total dividend of FY2021-FY2022 amounts to Rs.2.4 per equity share.
Investor Conference Call Highlights

Click here to Subscribe
on WhatsApp
www.smartsyncservices.com
1. The company's wholly owned subsidiary Acrysil U.K. Limited acquired 100% shares of Tickford Orange Limited, the U.K. holding company of its operating subsidiary Sylmar Technology Limited on 1st April 2022 for a total consideration of GBP 11 million which was funded through a mix of debt and internal accruals.
2. The company signed Bollywood celebrity ‘Vaani Kapoor’ for the new marketing campaign #TheHeartofMyHome for its ‘Carysil’ Brand.
3. The management states that due to a sharp increase in steel prices, the price differential has narrowed between quartz and steel globally which led to a significant shift towards quartz sinks.
4. The company's expansion plan of 160,000 quartz sinks is expected to be completed in the current quarter.
5. The company's capacity expansion of stainless steel is expected to finish by Q1FY23 from 90,000 units to 118,000 units per annum.
6. The share of quartz sink to total revenues stood at 77%. 7. The company incorporated Acrysil Ceramictech – a wholly owned subsidiary on April 12, 2022, with
the objective of manufacturing and selling Hi-Tech Ceramic kitchen sinks and bath products. 8. The company expects its supply to IKEA to double in FY23. 9. The management states that it is the lowest cost producer in the industry with the company being
cheaper by 15-20% despite quality being at par with others. 10. The management expects to continue to grow at 30-40% with a target revenue run rate of $100
million. 11. The geographical revenue mix constitutes of US @ 25% to 30%, UK and Europe @ 30%, India @ 20%
to 25% and Asia and Gulf @ 15% to 20%. 12. The management is confident about turning around its new acquisition & increasing its EBIDTA
margins from current levels of 14-15% to 15-16% & then to 18-20%. 13. The company’s A&P spend is 2% of total sales & 5% of the domestic sales. 14. The management believes that the sector is in a sweet spot because all the major companies in home
improvements in the U.S.A have been able to pass on inflationary costs to consumers leading to stable margins.
15. The company’s debt level for FY23 can go up to Rs.200 Cr. 16. The management states that 30% of the raw material goes into the manufacturing of one sink. 17. The company’s margin for exports is around 24% and around 18% to 19% in domestic for the quartz
sink. 18. The company enabled a resolution a few quarters back for equity raise & the company is currently in
the process of that resolution. This equity fundraise will be used for the new expansion in the ceramic, faucet and built-in appliances segment.
Analyst’s View:
Acrysil is one of the leading manufacturers of quartz sinks in India and a leading exporter of this product. It has seen good growth in Q4 & FY22 which saw a 61% YoY rise in exports. The company is doing well with good expansion in the quartz sink segment due to the rise in prices of steel sinks. The company has also been in expansionary mode and it remains committed to staying as the lowest cost producer of quartz sinks. It remains to be seen how their expansion plans pan out and what impact will the rising inflation around the world will have on their growth trajectory. Given the vast potential for the real estate sector and the company’s strong competitive positioning, Acrysil remains a good real estate ancillary stock to watch out for.

Click here to Subscribe
on WhatsApp
www.smartsyncservices.com
ISGEC
Financial Results & Highlights
Introduction:
ISGEC Heavy Engineering Ltd is a diversified heavy engineering company engaged in manufacturing and project business with an extensive global presence. It manufactures process plant equipment, presses, Iron & Steel castings & Boiler pressure parts.
Standalone Financials (in Crs)
Q4FY22 Q4FY21 YoY % Q3FY22 QoQ % FY22 FY21 YoY%
Sales 1366 1342 1.8% 1118 22.2% 4470 4345 2.9%
PBT 47 93 -49.5% 49 -4.1% 147 284 -48.2%
PAT 35 74 -52.7% 37 -5.4% 113 218 -48.2%
Consolidated Financials (in Crs)
Q4FY22 Q4FY21 YoY % Q3FY22 QoQ % FY22 FY21 YoY%
Sales 1597 1627 -1.8% 1402 13.9% 5512 5477 0.6%
PBT 48 95 -49.5% 78 -38.5% 158 356 -55.6%
PAT 39 68 -42.6% 52 -25.0% 115 253 -54.5%
Detailed Results:
1. The company saw a very poor quarter with flat revenue growth while PAT de-grew by 50% YoY. 2. Quarterly EBIDTA decreased by 18% YoY. 3. Segment revenue for FY22 stood at –
A. Manufacturing : 29% B. EPC : 59% C. Sugar : 12% 4. Debt/Equity stood at 0.5 while interest coverage ratio stood at 3.4 times. 5. Fixed asset turnover for FY22 stood at 6.3. 6. Export: domestic stood at 10:90. 7. Order book for FY22 stood at Rs.7,332 Cr.
Investor Conference Call Highlights: 1. The company's EPC segment's profitability was sharply lower due to a steep increase in material costs
due to an increase in commodity prices, mainly steel, aluminium, nickel and copper, and time and cost overrunning EPC projects due to the impact of COVID-related disruptions coupled with a shortage of

Click here to Subscribe
on WhatsApp
www.smartsyncservices.com
skilled manpower, a sharp increase in freight cost - both for purchase of materials and supply of goods to the customers along with higher employee costs.
2. The management states that lower profitability on the EPC segment will continue for some time as the fixed price longer duration orders presently under institution were booked before the increase in commodity prices.
3. The company's profits in the Sugar segment are lower due to a a lower quantity of sugar sales i.e. 16.19 lakh quintals in FY22 versus 21.76 lakh quintals in FY 2021 due to lower exports.
4. The Saraswati sugar mills plant is operating at full capacity. 5. The construction of the the company's Cavite biofuel plant in the the Philippines will be starting in
June 2022 and it expects expectedto complete the plant by June 2023. 6. The company's largest operating sectors are Automobile & oil & gas segment. 7. The company expects its Philippines plant to get operational within a year. 8. The management expects topline growth of 5% in FY23. 9. The company's feedstock for ethanol production at Saraswati Sugar Mills is B-heavy. 10. The company's PSU order book is about 39% of its total order book & the management expects this
to decrease to 25-30% in the coming period. 11. The Order intake for the quarter on a consolidated basis was Rs.1,442 Cr. 12. The company's order booking from Hitachi for FY22 roughly doubled on a YoY basis to Rs.520 Cr. 13. The exports for this quarter were nil due to high competition from coastal states & lack of geopolitical
stability in its key exporting countries like Afghanistan & Sri Lanka. 14. The management states that it is not entering into any long-term tie-up for one particular product in
the defence sector because the investments are heavy, the gestation period is high, and the market is also uncertain.
Analyst’s View:
ISGEC is a large heavy engineering company that is involved in diverse and multiple industry sectors like power, refineries, and others. The company saw a big decline in performance in Q2 due to rising commodity costs and the unavailability of skilled manpower. It also saw a delay in the shipping of major orders which led to the postponement of revenue recognition of those orders. The management expects the margins for ISGEC to remain subdued if the RM inflation continues to rise. The Philippines project had also gotten delayed due to COVID in the country and the management expects the projects to be completed in the next 10-12 months. It remains to be seen how long the inflated commodity price scenario continues and whether the company will be able to bring back margins to normal levels soon. Nonetheless, given the company’s strong track record, strong tailwinds of the industry, and sustained demand from its customer segments ISGEC remains a pivotal heavy engineering stock to watch out for.

Click here to Subscribe
on WhatsApp
www.smartsyncservices.com
Relaxo Footwears
Financial Results & Highlights
Brief Company Introduction
Relaxo Footwears Limited is the largest footwear manufacturing company in India, which deals in non-leather products i.e. rubber/EVA slippers, canvas shoes, sport shoes, sandals, school shoes and other types of footwear. It is also the leader in 'value' segment footwear. It has a portfolio of renowned brands like Relaxo, Sparx, Flite and Bahamas. The company sells its products through retailers served through distributors, retail outlets, exports and e-commerce / modern trade. The company has ‘state of the art’ manufacturing facilities at Bahadurgarh (Haryana), Bhiwadi (Rajasthan) and Haridwar (Uttarakhand). The company manufactures over 800,000 pairs of footwear every day.
Consolidated Financials (In Crs)
Q4FY22 Q4FY21 YoY % Q3FY22 QoQ % FY22 FY21 YoY%
Sales 704 754 -6.6% 759 -7.2% 2677 2381 12.4%
PBT 84 137 -38.6% 94 -10.6% 310 391 -20.7%
PAT 63 102 -38.2% 70 -10.0% 232 291 -20.2%
Detailed Results:
1. The performance of the company has been bad with revenues growing -6.6% YoY in Q4. 2. FY22 revenues were good with 12.4% YoY growth. 3. EBITDA margin for the quarter dropped to 15.9% in Q4FY22 from 21.8% in Q4FY21. 4. EBITDA margin for FY22 dropped to 15.7% from 21% the previous year. 5. The number of pairs sold during the quarter were 4.2 Cr vs 5.7 Cr the previous year. 6. The average realisation per pair stood at Rs 164 in Q4FY22 vs Rs 129 in Q4FY21. 7. The company’s customer reach currently stands at 60,000+ retailers; 650 distributors and 394 EBOs
with exports to 30 countries. 8. The company’s Net Debt stands at INR -156 crore. The company’s net worth has grown to INR 1760
crore at the end of FY22.
Investor Conference Call Details:
1. Revenue during the quarter was mainly affected due to Omicron variant and GST rate hike from 5% to 12% w.e.f. Jan’ 22 on footwear priced below Rs 1000.
2. The company also faced subdued demand due to high inflation. 3. The growth in revenues during the year is achieved mainly due to calibrated price hikes taken to
mitigate the impact of high raw material prices. 4. As of March ’22 the company has 394 EBOs which contributed to 7% of FY22 revenues. 5. Exports crossed the 100 crore mark for FY22 contributing to 4% of the total revenues. 6. The company took price increases in the range of 25% during the year across all categories of
products. 7. The SPARX brand has done very well in e-commerce platform and growth rate for e-commerce
platform was more than 40%.

Click here to Subscribe
on WhatsApp
www.smartsyncservices.com
8. Total exposure of online channel to the company was 11.5% of sales for the year. 9. The was huge working capital increase this year mainly due to inventory reasons. 10. The management states that 17% EBITDA margins are achievable for FY23. 11. The mix between different brands is following: Hawai and Bahamas – 25%, Flite – 37.5% and SPARX
at 37.5%. Within SPARX 60% were shoes and 40% were sandals. 12. The management does not have any intent to spend in the south and is expanding capacity in the
north. 13. In FY23, the company intends to spend 100 crores in capex on mainly backend operations. 14. The company has around 650-680 distributors and has added 10% during the year. 15. The company currently has 400 articles and 12,257 SKUs. 16. The company has 50 to 60 days of inventory out of which 30% is raw materials and remaining is WIP
and finished goods. 17. More than 25% of sales for SPARX come through the online channel. 18. North contributes to 50% of the company’s sales, East contributes 18%, West 18% and 13% from
South. 19. The open to closed footwear sales ratio of the company currently stand at 80:20 from previous 85:15. 20. The company has ventured into new channels and mediums this year like Udaan and Ajio which
currently contribute to less than 1% of sales. 21. The management does not have any future price hike plans and shall wait for RM prices to stabilize. 22. The management states that this time the company and the industry faced very fast and severe
inflation which wasn’t the case as compared to 2010 periods. Therefore, the company had to take 4 price hikes during the year which had never happened before.
Analyst’s View:
Relaxo is one of the most recognizable names in the footwear industry in India after Bata. The company has been doing well with its offbeat model of focusing on distributor network and wholesale operations as compared to other players in the market like Bata and Khadims, all of whom sell directly to customers through multi-brand outlets and exclusive franchise stores. The company has seen a bad quarter in Q4 with fall in sales and PAT due to margin fall amid the inflationary environment. The Sparx brand continues to do well for Relaxo in the ecommerce space. Although the company has undertaken 4 price hikes since the start of the year, it has been unable to mitigate the impact of inflation. It remains to be seen what is in store for the company and the industry in general in terms of inflation and how will it affect the consumption trend in the Indian market going froward. Nonetheless, Relaxo seems like a good investment option for anyone looking to put money on the theme of rising consumption and footwear.

Click here to Subscribe
on WhatsApp
www.smartsyncservices.com
SIS
Financial Results & Highlights Introduction
Security & Intelligence Serv.(India)is directly and indirectly engaged in rendering security and related services consisting of manned guarding, training, and indirectly engaged in paramedic and emergency response services; loss prevention, asset protection and mobile patrols; facility management services consisting of cleaning, housekeeping and pest control management services in the areas of facility management; cash logistics services consisting of cash-in-transit, ATM cash replenishment activities and secure transportation of precious items and bullion; and alarm monitoring and response services consisting of trading and installation of electronic security devices and systems through its subsidiaries, joint ventures and associates.
Standalone Financials (in Crs)
Q4FY22 Q4FY21 YoY % Q3FY22 QoQ % FY22 FY21 YoY%
Sales 899 780 15.3% 854 5.3% 3381 3030 11.6%
PBT 13 16 -18.8% 18 -27.8% 115 85 35.3%
PAT 27 7 285.7% 28 -3.6% 134 57 135.1%
Consolidated Financials (in Crs)
Q4FY22 Q4FY21 YoY % Q3FY22 QoQ % FY22 FY21 YoY%
Sales 2653 2795 -5.1% 2628 1.0% 10112 9605 5.3%
PBT 75 416 -82.0% 105 -28.6% 341 758 -55.0%
PAT 97 102 -4.9% 100 -3.0% 326 367 -11.2%
Detailed Results:
1. Consolidated sales de-grew by 5% YoY & whereas PAT was down 5% YoY (due to impact of deferred tax credit).
2. EBIDTA margins for the quarter were 4.7% while operating PAT stood at 3.7%. 3. OCF to EBIDTA was 46.9% for FY22. 4. Net debt to EBITDA was at 1.4 times in Q4. 5. The Australia business saw new deal wins of AUD 25M of annualized value during the quarter. 6. The Contribution towards group revenues & EBIDTA -
a) Security solutions India – 39.1% & 32% (EBIDTA% @3.8%) b) Security solutions International – 46.7% & 53.9% (EBIDTA% @ 5.8%) c) Facility management solutions – 14.6% & 14% (EBIDTA% @ 4.5%) d) Cash logistics EBIDTA% @ 20% (Highest Ever)
Investor Conference Call Highlights:
1. The management states that it is seeing strong volume growth due to the opening up of economies but it is yet to see the rationalization of prices.
2. The company won a multi-year contract for the Mahanadi coal field worth Rs.220 Cr.

Click here to Subscribe
on WhatsApp
www.smartsyncservices.com
3. The company has created a fund incubator strategy with funds of Rs.75 Cr to invest in new-age startups in security services who are finding valuable & innovative uses of AI.
4. The management states that since the average contribution from sectors like IT, hospital etc. range close to 10%, it is not dependent on the growth of any single sector for strong operational performance which can be demonstrated by the growth of 7% even in the Covid-struck year.
5. The management states that there is a delta of 12% between EBIDTA & NPM of cash logistics business due to higher depreciation & financing costs being a capex-heavy business.
6. The management expects to increase Vprotect’s market share to 2-5% of India’s security market, clock revenue of more than Rs.100 Cr within 2 years & increase connection marks from 10,000 to 15,000.
7. The management expects the Facility management business to maintain the highest growth rate in the coming 3 years.
8. The management states that FY21 was a completely exceptional year for international business where revenue grew by 20% & EBIDTA margins were close to 6%, however, it expects this segment to taper down to pre-covid levels with single-digit revenue growth & EBIDTA margins closer to 5%.
9. The company expects consolidated revenue growth of 20% in FY23.
10. The company expects the margin to taper down temporarily in the coming quarter due to high start-up costs for its new Coal project which is the nature of the business.
Analyst’s View:
SIS is the market leader in security, cash logistics, and facilities management in India. The company saw a mixed quarter with revenues decreasing by almost 5% YoY while profit decreased by 5%. The management is expecting significant market expansion in the future for SIS from the anticipated demand for surveillance in upcoming infra projects and the ongoing construction boom. The company is also looking to expand its target market segments to include IT parks, and malls. The new business line of surveillance setup and maintenance only is also expected to do well in the future. It remains to be seen what obstacles SIS will face during expansion into new segments and whether international growth will come about as expected, further high inflation especially in the employee costs can dampen the company’s profitability. Given the market leader status of the company in its operating segments of facilities management and security and the promise of an ever-increasing market opportunity due to the infra boom in India, SIS is a critical stock to look for in the security and facility management space.

Click here to Subscribe
on WhatsApp
www.smartsyncservices.com
PLATFORM COMPANIES CarTrade Tech
Financial Results & Highlights Brief Company Introduction
CarTrade Tech Ltd is a multi-channel auto platform provider company with coverage and presence across vehicle types and Value-Added Services. The company operates various brands such as CarWale, CarTrade, Shriram Automall, BikeWale, CarTradeExchange, Adroit Auto, and AutoBiz. The platform connects new and used automobile customers, vehicle dealers, vehicle OEMs, and other businesses to buy and sell different types of vehicles. The company offers a variety of solutions across automotive transactions for buying, selling, marketing, financing, and other activities.
Standalone financials (in Crs)
Q4FY22 Q4FY21 YoY % Q3FY22 QoQ % FY22 FY21 YoY%
Sales 46 38 21.1% 42 9.5% 157 113 38.9%
PBT -34 11 -409.1% -37 -8.1% -152 20 -860.0%
PAT -32 10 -420.0% -29 10.3% -146 79 -284.8%
Consolidated financials (in Crs)
Q4FY22 Q4FY21 YoY % Q3FY22 QoQ % FY22 FY21 YoY%
Sales 106 92 15.2% 102 3.9% 359 281 27.8%
PBT -21 19 -210.5% -22 -4.5% -119 47 -353.2%
PAT -21 16 -231.3% -18 16.7% -121 103 -217.5%
Detailed Results:
1. Sales grew by 15% YoY on a consolidated basis with 4% rise QoQ. 2. Adjusted EBIDTA margins for the quarter stood at 26%. 3. AVG monthly unique visitors (UV) stood at 30 million out of which 84.2% were organic. 4. The auction listing for the quarter stood at 3,23,693 while the number sold stood at 74,603.
Investor Conference Call Highlights:
1. The manpower costs increased by 25% YoY due to a lower base in the previous year due to Covid.
2. The management states that the company’s marketing expenses are relatively lower than its competitors due to higher brand affinity & the ability to generate 30 Million new traffic out of which 84% is organic, leading to lower requirements for spending.
3. The management believes the presence of physical infrastructure due to its SAMIL biz segment provides it with a clear differentiation Vs its competitors.
4. The management believes that the simplification of GST rules for the used car market will help fuel the industry’s growth in the coming time.
5. The company’s volumes have grown at a higher pace vis-a-vis the revenue due to higher contribution from the non-physical segment due to Covid where commissions are comparatively lower.

Click here to Subscribe
on WhatsApp
www.smartsyncservices.com
6. The company’s abSure biz is a franchisee model where the company is expected to incur higher costs initially, but the management is very bullish about its growth prospects in the long run.
7. The management believes that without increasing traffic it could rapidly grow its revenues if manufacturers give more budgets to go up on digital advertising.
8. The management states that 14% of the OEM spends are digital which amounts to about Rs.850 Cr out of which the company gets a pie of close to Rs.120 Cr.
Analyst’s View:
CarTrade Tech is one of the biggest auto platform providers in India and the only profitable one to date. The company had a good IPO post which it saw a serious fall in its share price of over 60%. The overall revenue growth has been decent in Q4 with revenues growing 15% YoY. The profits for Q4 and FY22 remain subdued due to a non-cash exceptional item regarding ESOPs issued by the company in 2022. The company has a lot of plans in place for the expansion of its new business segments like the abSure outlets and the fintech loan platform. It has also earmarked Rs 750 Cr for investments in growing new businesses. SAMIL has also added Ashok Leyland to its institutional auto auction business and expects to add more OEMs in the future. It remains to be seen what obstacles the company will face in its expansion into new business segments and how will the whole online vehicle ecosystem develop in the future. Given the brand strength of the company and its status as the only profitable player in this rising segment, CarTrade Tech is a pivotal auto platform stock to watch out for, particularly considering its currently attractive valuation levels.

Click here to Subscribe
on WhatsApp
www.smartsyncservices.com
Easy Trip Planners
Financial Results & Highlights Brief Company Introduction
EaseMyTrip is an Indian online travel company, founded in 2008 by Nishant Pitti, Rikant Pitti, and Prashant Pitti. Headquartered in New Delhi, the company provides hotel bookings, air tickets, holiday packages, bus bookings, and white-label services. EaseMyTrip has overseas offices in Singapore, Dubai, Maldives, and Bangkok.
Standalone financials (in Crs)
Q4FY22 Q4FY21 YoY % Q3FY22 QoQ % FY22 FY21 YoY%
Sales 64 69 -7.2% 89 -28.1% 247 151 63.6%
PBT 33 43 -23.3% 54 -38.9% 145 85 70.6%
PAT 24 31 -22.6% 40 -40.0% 107 62 72.6%
Consolidated financials (in Crs)
Q4FY22 Q4FY21 YoY % Q3FY22 QoQ % FY22 FY21 YoY%
Sales 65 69 -5.8% 90 -27.8% 250 151 65.6%
PBT 32 42 -23.8% 54 -40.7% 143 83 72.3%
PAT 23 30 -23.3% 40 -42.5% 106 61 73.8%
Detailed Results:
1. The company had an weak quarter with revenues de-growing by 6% YoY on consolidated basis. 2. PAT decreased by 23% YoY on a consolidated basis. 3. Gross booking revenue for this FY increased by 75% YoY whereas Air segment bookings increased by
56.9% YoY. 4. Air segment & trains/bus segment saw transaction numbers growing by 13% & 59% YoY in Q4. 5. Hotel nights (in numbers) de-grew by 15% YoY for Q4. 6. The Board has recommended a bonus issue of 1:1.
Investor Conference Call Details:
1. The company saw lower revenues were due to a reduction in discount income & commission which the company receives based on performance targets which couldn’t be achieved due to the Omicron wave.
2. The management states that the overall market share should be north of 10% & for the online market, it should be north of 20%.
3. The company is targeting double-digit growth in its hotel segment for the next 2-3 years.
4. The management explains that the OTA can offer better discounts than captives due to tie-ups with several banks, credit cards & fin-tech companies who contribute a certain portion of the company’s discounts to the users.
5. The company got lower convenience fees due to lower discounts offered.

Click here to Subscribe
on WhatsApp
www.smartsyncservices.com
6. The management believes that since most of its competitors are loss-making & dependent on PE, VC funds unlike the company will be able to perform better at times of cash scarcity.
7. The company gave an advance of Rs.40 Cr to airlines in FY22 to help the company get better commissions from the airlines.
8. The management is very bullish about demand in the current year due to the pent-up demand of previous years.
Analyst Views:
Founded in 2008, EaseMyTrip is India’s 2nd largest online travel booking portal. The Q4 was impacted due to the omicron wave leading to lower discount & commission incomes coupled with the company missing its volume targets resulting in further lower commission income. The company is making good inroads into the travel industry and is looking to expand its influence in the sector with key acquisitions which help enhance its portfolio of offerings and help provide bundled services. The company has also taken various actions and introduced new policies like a full medical refund and others which are expected to help differentiate EasyTrip from the rest of the market. It remains to be seen how long it will take for normal travel behaviour to come back to pre-covid levels and whether the acquisitions and policy actions of the company will help it separate itself from the rest of the pack. Nonetheless, given the large market share in online travel bookings for EaseMyTrip and the steady revival of the travel sector in India, Easy Trip Planners is a pivotal stock to watch out for in the travel sector.

Click here to Subscribe
on WhatsApp
www.smartsyncservices.com
IRCTC
Financial Results & Highlights Brief Introduction:
Indian Railway Catering and Tourism Corporation (IRCTC) is a Mini Ratna (Category-I) Central Public Sector Enterprise under the Ministry of Railways, Government of India. IRCTC was incorporated on 27th September 1999 as an extended arm of the Indian Railways to upgrade, professionalize and manage the catering and hospitality services at stations, on trains and other locations and to promote domestic and international tourism through the development of budget hotels, special tour packages, information & commercial publicity and global reservation systems.
Consolidated financials (in Crs)
Q4FY22 Q4FY21 YoY % Q3FY22 QoQ
% FY22 FY21 YoY%
Sales 717 358 100.3% 556 29.0% 1952 861 126.7%
PBT 283 139 103.6% 281 0.7% 889 257 245.9%
PAT 214 104 105.8% 209 2.4% 664 187 255.1%
Detailed Results:
1. The company saw a 100% YoY rise in total revenues.
2. PAT and PBT were up 106% and 103% YoY.
3. EBIDTA margins for Q4 stood at 40% versus 42.8% YoY due to higher contribution from the catering
business.
4. Catering saw revenues of Rs 266.2 Cr reporting growth of 1.5X QoQ & 3X YoY while EBITDA margin
came at 9.4% versus 5.5% QoQ.
5. Rail Neer saw revenues of Rs.51.9 Crores reporting a 4% growth QoQ & an EBITDA loss came of
Rs.24.3 Crores.
6. Ticketing saw revenues of Rs.292.8 Crores growing by 42.4% YoY & EBIT margin came at 91.5% Vs
83.3% YoY.
7. Tourism saw revenues of Rs 80 Cr & achieved breakeven level.
8. The company announced a final dividend of Rs. 1.5 per share.
9. The bank balances and net worth of the company as on 31st March 2022 were Rs.1732 Crores and
Rs.1884 Crores, respectively.
Investor Conference Call Highlights
1. The management states that revenue for Q4 is just 3.5% lower than the pre-COVID level.
2. Catering biz saw high growth due to increased presence in TSV trains section.
3. The management states that in Q4 the average daily ticket sales have been 12.87 lakh.

Click here to Subscribe
on WhatsApp
www.smartsyncservices.com
4. The company incurred one time charge in its Rail Neer segment to share profits of that biz with the
ministry of railways from FY 07-21. Further from now on, company will share 15% of the profits of
this segment with the ministry.
5. EBIT margins in the ticketing segment have gone up due to increased convenience fees, higher agent
collaborations, increased marketing & advertisement income & payment gateway charges.
6. The management states that the cancellation is nearly 19% while the refund is nearly 18%.
7. The management states that the company has been given additional work of a retiring room up-
gradation which will help in boosting revenues.
8. The company’s Average realization per ticket is Rs.16.6.
9. The current capacity utilization of Tejas is 70% while the breakeven is achieved at 75%.
10. the percentage of unreserved tickets to total tickets for Indian Railways is 7%.
11. The management states that in the bus ticketing, it has tied up with the red bus and the Abhi Bus
along with various states to resume development for the state SCDCs & the revenue from the bus
booking is Rs.6 lakhs per day.
Analyst’s View:
Indian Railway Catering and Tourism Corporation (IRCTC) is a Mini Ratna PSU with massive cash flows
and a well-managed balance sheet. The company has seen a great Q4 with its revenue reaching the
pre-covid levels. The ticketing inventory has also increased to 12.8 lacs per day due to the mandatory
reservation in the General category. IRCTC continues to have 80%+ of total bookings for Indian Railways
in Q4. The company has applied for a payment aggregator license from both the Ministry of Railways
and RBI. It has also increased the B2C catering aggregators to 20 and has seen the number of meals
booked per day exceed pre-COVID levels. The tourism segment has suffered mainly due to high
operational losses in the Tejas Express. The company is looking to take measures like reducing the
frequency of these trains or getting concessions on haulage to reduce these operational losses. It
remains to be seen what disruptions come up in the future from the upcoming waves of COVID-19 are,
how long will it take for normal rail travel and how will the company’s foray into private trains pans out
given the difficulties it is seeing with Tejas. Nonetheless, given that IRCTC has a near-monopoly in its
space and the resilient demand for its services and products in railway stations, IRCTC remains a good
stock to watch out for investors betting on the travel and railway theme.

Click here to Subscribe
on WhatsApp
www.smartsyncservices.com
Map My India
Financial Results & Highlights Brief Company Introduction
C E Infosystems Limited (“Map My India”) was incorporated on February 17, 1995. The company is a data and technology products and platforms company, offering proprietary digital maps as a service (“MaaS”), software as a service (“SaaS”), and platform as a service (“PaaS”). They are India’s leading provider of advanced digital maps, geospatial software, and location-based IoT technologies.
Standalone Financials (in Crs)
Q4FY22 Q4FY21 YoY % Q3FY22 QoQ % FY22 FY21 YoY%
Sales 66.6 55.9 19.1% 49.3 35.1% 237.1 192.1 23.4%
PBT 33.9 24.7 37.2% 19 78.4% 115 79 45.6%
PAT 23.5 20.4 15.2% 15.7 49.7% 85.5 60.1 42.3%
Consolidated Financials (in Crs)
Q4FY22 Q4FY21 YoY % Q3FY22 QoQ % FY22 FY21 YoY%
Sales 68.6 56 22.5% 52 31.9% 242 192.2 25.9%
PBT 33.5 24 39.6% 21.7 54.4% 117 78.8 48.5%
PAT 22.5 19 18.4% 18.5 21.6% 87 59.8 45.5%
Detailed Results:
1. The company had a decent quarter with a 22% YoY rise in consolidated revenues and a 18% YoY rise in consolidated PAT.
2. FY22 revenues were up 26% YoY and PAT was up 45.5% YoY. 3. EBITDA margins for FY22 expanded to 43% from 35% the previous year. PAT margins expanded to 36%
from 31% the previous year. 4. The cash and cash equivalents of the company stand at 382 Cr. 5. In Market Segment, A&M revenue has grown 41% YoY for FY22. C&E revenue has grown 21% YoY for
FY22. 6. In Product Segment, revenue from Map & Data is up 37% YoY. Platform and IoT revenue grew 28%
YoY for FY22. 7. The company’s Open Order Book as of April 1, 2022, stood at Rs. 699.6 Crores vs Rs 377.5 Cr as of
April 1, 2021. 8. The No. of Customers on MaaS, SaaS & PaaS platforms in FY22 grew by more than 100 to 600+
customers. 9. New deal wins in A&M segment for Q4FY22 included :
• Indian Motorcycle OEM signed up and went live • Indian EV 2-Wheeler OEM startup signed up • Japanese Mobility as a Service provider signed up • Largest 4-wheeler OEM went live with their next-gen connected vehicles integrated with the company’s maps & technologies • Nissan partnered for Road Safety initiative by using the company’s Road Safety Platform

Click here to Subscribe
on WhatsApp
www.smartsyncservices.com
10. New deal wins in C&E segment included : • 2 Large FMCG majors went live with geospatial analytics and workforce automation use cases respectively • Large E-commerce company signed up for geospatial analytics • Large CRM SaaS company signed up for integrating map APIs for providing their customers with in-built location intelligence • Large Global Social Media App integrated map data to provide a better location-based end consumer experience in India • A Smart City signed up for GIS-based Property Tax Solutions • State Urban Development Authority signed up for Drone and 3D mapping-based GIS System with multiple end use cases • Large Safe City in South India signed up for Crime Mapping & Analytics • Large State Road Transport Corporation signed up for Public Transport Platform
Investor Conference Call Highlights
1. The company’s R&D expenses were approximately Rs.3 Cr in FY21 which increased to Rs.5 Cr in FY22.
2. The management states that there are five growth engines to its automotive business – selling navigation systems, connected systems, ADAS, autonomous systems, shared mobility as well as an electric mobility system.
3. The company acquired a 76% stake in Gtropy to give a specific focus on the IoT and logistic SaaS part of its business.
4. 1.3 million new vehicles in FY22 were integrated with the company’s maps & technologies vs 1 million new vehicles in FY21.
5. The company’s 35 customers contributed 80% of its total revenue while 92% of the large customers were retained in FY22.
6. The number of employees increased in FY22 to 936 from 734 YoY. 7. The attrition rate increased from 13.5% to 17.45% YoY. 8. The Govt contribution in the current mix is 10% & the management has put an upper cap limit of
20% on that. 9. The company launched Maapls to service the global market. 10. The management expects to spend 2-3% of revenue on R&D which majorly constitutes the cost of
people employed in the R&D segment. 11. The management expects the EBIDTA margin to be in the range of 35-43%. 12. The employee costs were lower by Rs.5 Cr in Q4 due to the reversal of a provision created for
employee incentives & bonuses.

Click here to Subscribe
on WhatsApp
www.smartsyncservices.com
Analyst’s View
C E Infosystems (MapMyIndia) is a leading provider of advanced digital maps, geospatial maps, and location-based IoT technologies. Its business is seasonal with heavy revenue being booked in the latter half of the year due to the nature of its revenue recognition and contracts. Its customers include the government and big companies giving it recurring revenue. The management is highly positive about the company’s future. The company has done well to bag multiple orders for it’s A&M and C&E segments. It has also acquired Gtropy which should help them expand well in the industrial IoT segment. Recent changes in government policies that worked in favor of the company give a positive roadmap to the company. Huge market opportunities in digital maps and geospatial data give huge growth potential to the company. Yet, current valuations offer no margin of safety for a value investor. Nonetheless, being a one-of-its-kind company in its niche industry, C E Infosystems is a company that should be under every investor's watchlist.

Click here to Subscribe
on WhatsApp
www.smartsyncservices.com
QSR Barbeque Nation
Financial Results & Highlights Brief Company Introduction
Incorporated in 2006, Barbeque Nation is one of the leading casual dining chains in India. Barbeque Nation Hospitality Limited (BNHL) is a pioneer in "over the table barbeque" live grills embedded in dining tables. Having a significant presence in India's hospitality sector, Barbeque Nation is one of the most visited and widely recognised restaurant brands in the rapidly growing casual dining restaurant market of India. As on 31st March 2020, BNHL had a chain of 150 restaurants across 77 cities and towns in India. It is operating 6 restaurants in International markets of Middle east and Malaysia.
Standalone financials (in Crs)
Q4FY22 Q4FY21 YoY % Q3FY22 QoQ % FY22 FY21 YoY%
Sales 632 615 2.8% 557 13.5% 2346 2163 8.5%
PBT 98 130 -24.6% 42 133.3% 335 391 -14.3%
PAT 94 140 -32.9% 30 213.3% 252 315 -20.0%
Consolidated financials (in Crs)
Q4FY22 Q4FY21 YoY % Q3FY22 QoQ % FY22 FY21 YoY%
Sales 257 237 8.4% 291 -11.7% 887 553 60.4%
PBT 2 8 -75.0% 19 -89.5% -32 -111 -71.2%
PAT 0.4 6.4 -93.8% 15 -97.3% -25 -92 -72.8%
Detailed Results
1. The company reported a revenue growth of close to 10% YoY in Q4FY22. 2. EBITDA decreased by 10% while margins stood at 20.1%. 3. Delivery revenue increased by 56.5% YoY 4. Restaurant operating margins for the quarter stood at 14.4%. 5. Total restaurant count as on April 2022 stood at 185 which included 168 BBQ indian stores, 6 BBQ
international & 11 italian restaurants under the brand TOSCANO. 6. The company also has 15 extension kitchens as on April 22. 7. Dine-in recovery was 110% of pre-covid period of Q4 FY21. 8. Delivery segment was 18% of the total revenue from operations in Q4 FY22 9. Cumulative BBQ App downloads stood at 4.2mn+, which is a 63% increase over March’21. 10. Channel contribution was at 24.1% of its own app. 11. The loyalty program SMILES saw 16.7% share of total bills in Q4 2022.
Investor Conference Call Highlights
Click here to Subscribe
on WhatsApp
www.smartsyncservices.com
1. The management states that the company is confident of growing its restaurant strength by 35 to 40 restaurants in FY 23.
2. The company is targeting a restaurant count of 300 by FY25. 3. The management doesn’t expect capex per store to increase despite inflation. 4. The company expects to open 3-4 stores every month from the current quarter. 5. The management clarified that RBL bank sold the pledged shares of the company because they
wanted to come out of the association & management further states that banks now have zero pledged shares with them.
6. The company expects the delivery biz to grow at 20% CAGR over the next few years. 7. The company didn’t take a price hike in Q4 as the priority was on growing volumes due to the Omicron
wave. However, the company has now taken a price hike of 5% between April & May which will help in tackling inflation.
8. The company aspires to increase gross margins from 65-66% to 67-68% in the next 3-4 years. 9. The management states that due to its strong analysis & menu reengineering strategy, it has been
able to maintain decent gross margins despite input cost inflation. 10. The margins for the current quarter got squeezed also due to high fixed costs in the form of high
inflation in employee costs coupled with rental costs. However, the company expects to reach 20% margins at the portfolio level in Q1FY23.
11. The management expects rental costs per store to stay at around 10-10.5% of revenues. 12. The company’s revenue framework & seasonality leads to sales break-up of 45-47% from H1 & around
53% from H2. 13. The management is planning to increase the store count of TOSCANO from 11 stores to 16-17 stores
by the end of FY23. 14. The company on a normalized basis expects store revenue of Rs.7 Cr which includes delivery sales. 15. The company’s top 20 restaurants, which is approximately 12% of its total restaurant network
contribute between 18% - 20% of the entire revenue.
Analyst’s Views
Barbeque Nation is one of the most recognizable casual dining restaurant chains in India. The company has done well to get back the dine-in sales to above pre-covid levels and to ramp up its delivery business which has seen 4.2 million cumulative downloads. The company has opened up 12 new units in Q4FY22 so far and 14 more are in the construction phase. Its Italian restaurant chain Toscano is also expected to open new stores and reach 20-25 stores in the next 2 years. It remains to be seen what obstacles will the company face in expanding the new restaurant chain and whether it will be able to scale up its delivery business in competition to 3rd party delivery majors like Dominos, Swiggy and Zomato. Nonetheless, given the good brand recall, wide geographical reach and the vast potential of the Indian Food Services sector, Barbeque Nation is an interesting stock to watch out for.

Click here to Subscribe
on WhatsApp
www.smartsyncservices.com
Restaurant Brands Asia (Burger King India)
Financial Results & Highlights Brief Company Introduction
Burger King India Ltd is an international QSR chain in India. It started operations in 2014 and has established ~260 restaurants across major cities.
Restaurant Brands Asia has exclusive rights to develop, establish, operate and franchise Burger King branded restaurants in India as a master franchisee.
Consolidated financials (in Crs)
Q4FY22 Q4FY21 YoY % Q3FY22 QoQ % FY22 FY21 YoY%
Sales 409 325 25.8% 439 -6.8% 1513 1038 45.8%
PBT -81 -60 35.0% -26 211.5% -235 -282 -16.7%
PAT -81 -60 35.0% -26 211.5% -235 -282 -16.7%
Detailed Results
1. The company had a great quarter with revenues increasing by 26% YoY 2. Q4 FY22 ADS recovery stood at 95%, April @ 102% & May @ 111%. 3. Region Recovery: West: 141%; South & East: 112% and North: 100% 4. GPM improved 50 bps from 65.6% to 66.1%. 5. Restaurant EBITDA% stood at 17.3% Vs 17.1% YoY. 6. Company EBITDA% stood at 10.7% Vs 10.2% YoY. 7. Restaurant count stood at 315 after 21 net new additions in the current quarter. 8. BK app installs stood at 3 Mn which is a 25% growth QoQ while BK app delivery revenue growth
stood at 24% QoQ. 9. The company launched 17 BK Cafés in the current quarter.
Investor Conference Call Highlights
1. The company saw SSSG of 17% in Q4FY22. 2. The company has a pipeline of 50 restaurants while it has 13 restaurants in construction. 3. The company did several activities like meme premier league & launching NFTs to increase its brand
engagement with the users. 4. The company re-launched its kings collection variety of burgers along with new desserts like choco-
lava cake & mouse cup which will be rolled out nationally. 5. The management expects a payback period of about 1.5 years on the cafe investments. 6. The company saw 25% QoQ growth in its app downloads. 7. The management is guiding for store count of 390 & 470 in FY23 & 24 respectively. 8. The management expects to grow SSSG by 25% in the coming FY. 9. The management changed its ADS growth guidance from 5-7% to 7-10%. 10. The company increased its GPM guidance by 100 Bps to 67% in the coming FY. 11. The GPM of Indonesia biz improved from 56.7% to 58.5% YoY while the management expects the
benefits of synergies to be more visible from the 2-3rd quarter.

Click here to Subscribe
on WhatsApp
www.smartsyncservices.com
12. The Indonesian biz has 11 restaurants in construction & management is building freestanding drive-through restaurants which will have higher ADS & EBIDTA margins.
13. The current recovery from pre-covid levels in Indonesia is 80% & management expects it to reach 100% levels within 2-3 quarters which will drive margins close to 60%.
14. The costs of building cafe kiosks in normal stores will be close to Rs.20 lakhs & the company doesn't need to close its stores for this renovating activity.
15. The management states that EBIDTA margins in Indonesian biz are higher than in Indian biz despite the GPM of Indian biz being higher by close to 10% due to lower rents & delivery costs.
16. The management expects very high double-digit company level EBITDA in FY 24. 17. The management states that the company's growth in the West was aided by IPL. 18. The company's store split comprises 50% in North, & 25% each in South & West.
Analyst’s Views
Burger King is one of the leading QSR chains around the world. Restaurant Brands Asia is the master franchisee of Burger King in India. The company has seen impressive growth and a blockbuster IPO just over a year ago. It saw revenues rise 37% YoY but profits remained subdued with an increase in losses of 35% YoY. The BK app is also seeing good traction and orders coming in while dine-in sales are expected to revive going forward. The company is also looking to acquire 83% of Burger King Indonesia to expand its business to a new market. It remains to be seen what challenges will the company face in its expansion in both India and Indonesia, and how will the rising competition in the QSR space in India pan out for it. Nonetheless, given the high potential of the QSR sector, the strong brand of the Burger King franchise and the rapid planned expansion of the company, Restaurant Brands Asia is a pivotal QSR sector stock to watch out for.

Click here to Subscribe
on WhatsApp
www.smartsyncservices.com
Devyani International
Financial Results & Highlights Brief Company Introduction
Devyani International is the largest Franchisee of Yum! Brands and operates the highest outlets of KFC, Pizza Hut, Costa Coffee in India, and the company is the largest operator of quick-service restaurants chain in India. It operates 655 stores across 155 cities in India, as of March 31, 2021.
Devyani International Ltd is part of RJ Corporation started by Ravi Kant Jaipuria in 1991. RJ Corp is a powerhouse multinational with thriving businesses in beverages(Varun Beverages) fast-food restaurants(KFC, Pizza Hut, Costa Coffee) retail, ice-cream, Livestock (Cream bell, Daima) healthcare (Medanta Afri care) and education with a presence across 26 Nations through its subsidiaries.
Standalone financials (in Crs)
Q4FY22 Q4FY21 YoY % Q3FY22 QoQ % FY22 FY21 YoY%
Sales 532 373 42.6% 556 -4.3% 1869 1047 78.5%
PBT 38 3 1166.7% 54 -29.6% 112 -70 -260.0%
PAT 79 7 1028.6% 54 46.3% 153 65 135.4%
Consolidated financials (in Crs)
Q4FY22 Q4FY21 YoY % Q3FY22 QoQ % FY22 FY21 YoY%
Sales 593 419 41.5% 628 -5.6% 2100 1199 75.1%
PBT 42 23 82.6% 67 -37.3% 123 -82 -250.0%
PAT 76 62 22.6% 66 15.2% 155 -63 -346.0%
Detailed Results
1. The company saw revenue growing 41% YoY & de-growing by 5% QoQ. 2. Pre-IND AS EBITDA grew by 44% YoY while margins stood at 14.4% Vs 8.1% YoY. 3. Consolidated EBITDA margins (post IND-AS) stood at 24.3%. 4. The Company added 54 new stores in Q4:- a) KFC India- 25 b) Pizza Hut India- 22 c) Costa Coffee- 5 d) Others- 2 e) KFC Nigeria and Nepal – 0 f) It also added 246 stores in FY22. 5. Quarterly Consolidated Gross margins stood at 71.3% while yearly levels stood at 71.2%. 6. Brand contribution for the quarter stood at 21.2% while annual contribution stood at 19.9%. 7. KFC’s quarterly revenue grew by 39.2% YoY, ADS decreased by 3% yearly to 113,000 meanwhile
GPM stood at 69.3% and brand contribution margin stands at 21.8%. 8. Off/On premise mix for KFC on quarterly basis stood at 41:59 while on an annual basis it stood
at 44:56.

Click here to Subscribe
on WhatsApp
www.smartsyncservices.com
9. Pizza Hut’s quarterly revenue increased by 41% YoY, ADS decreased by 2.3% YoY to 41,000 meanwhile GPM stood at 75.5% & brand contribution margin stands at 17.5%.
10. Off/On premise mix for Pizza Hut on quarterly basis stands at 59:41 while on yearly basis it stands at 63:37.
11. Costa Coffee’s quarterly revenue increased by 61% YoY, ADS increased by 24% YoY to 30,000 meanwhile GPM stood at 81.6% & brand contribution margin stood at 30.2%.
Investor Conference Call Highlights
1. The company added 246 net new stores in FY22 taking the total store count to 938 stores. 2. The Company was able to battle cost inflation through timely forward contracts. 3. The company’s performance saw dip in Q4 as 4-6 weeks were affected by 3rd covid wave. 4. The management states that KFC’s biryani bucket is gaining wide acceptance from customers. 5. The employee costs were down temporarily due to perks received from omicron variant and expects
this to stabilise in the coming quarters. 6. The company received several cost benefits from its international business leading to lower cost in
the current quarter despite more store additions. 7. The management believes that all the benefits of transition from dine in to delivery based model in
Pizza Hut biz has flown in & now expects the margins and profitability to grow in line with revenue growth & expects to sustain the current margins in this business.
8. The management expects to incur capex of Rs.300 Cr in FY23 for the opening of 250 new stores. 9. The company expects KFC to have delivery to dine in ratio of 35:65 in the coming quarters due to
removal of Covid related restrictions. 10. The company introduced hand tossed pizza in its Pizza hut portfolio which will complement its
previous offering of pan based pizzas & introduced two new side items in the portfolio. 11. The company has recognized only 2 years of deferred tax asset due to uncertainty concerning input
cost inflation, possible covid 4th wave & geo political issues. 12. The management expects to have 7-8% SSSG numbers in the coming years in its Pizza Hut division. 13. The company hasn’t seen any fall in demand despite close to 10% price increase in KFC(% (1-2% in
October & 8-9% in April) but the company hasn’t completely passed on the input price increase to the customers.
14. The management is focused on clocking ADS of 40,000 in Costa Coffee in the next couple of years. 15. The company’s app for KFC and Pizza Hut is shared between the company & Sapphire Ltd & this app
is regulated by YUM brands. 16. The rental cost for FY22 was at 11% of revenues. 17. The company is more bullish in KFC business Vs Pizza Hut due to population demographics of India
wherein 70% population in India is non-vegetarian whereas QSR industry constitutes of only 25% non-vegetarian offerings leading to long runway for growth & penetration in chicken category Vs Pizza category which is already highly penetrated.
18. The company doesn’t expects to increase margins in KFC biz in FY23 due to high input cost inflation, but expects to maintain margins through operational efficiency & a possible price increase.

Click here to Subscribe
on WhatsApp
www.smartsyncservices.com
Analyst’s Views
Devyani International is one of the largest QSR operators in India and the largest franchisee operator for Yum Foods which has brands like KFC and Pizza Hut. It had a very good quarter with over 40% YoY revenue growth and 23% YoY PAT growth. The company is focused on converting the Pizza Hut franchise into a delivery focused model with the help of aggregators which have lower running costs than building its own app and delivery network. The company has also added 54 new stores in the quarter, maintaining its impressive expansion momentum which took the total for FY22 to 246 new stores opened. Devyani is also looking to enhance its Costa business and add 250 new stores in FY23 for an estimated capex of Rs 300 Cr. It remains to be seen how it will be able to grow the Pizza Hut franchise amidst the massive competition in the pizza delivery segment with Dominos as the market leader and several national pizza chains also expanding quickly, what issues will it face in its international expansion efforts, and how will the competition with Sapphire affect its future plans. Nonetheless, given the company’s market position, the brand strength of Yum Foods and the potential of the QSR segment in India, Devyani International is a pivotal QSR sector stock to watch out for.

Click here to Subscribe
on WhatsApp
www.smartsyncservices.com
Jubilant Foodworks
Financial Results & Highlights Brief Company Introduction
Jubilant FoodWorks Limited is an Indian food service company based in Noida, Uttar Pradesh which holds the master franchise for Domino's Pizza in India, Nepal, Sri Lanka and Bangladesh, for Popeyes in India, Bangladesh, Nepal and Bhutan, and also for Dunkin' Donuts in India. The company also operates two homegrown restaurant brands called Ekdum! and Hong's Kitchen. Jubilant FoodWorks is a part of the Jubilant Bhartia Group, owned by Shyam Sunder Bhartia and Hari Bhartia.
Standalone financials (in Crs)
Q4FY22 Q4FY21 YoY % Q3FY22 QoQ % FY22 FY21 YoY%
Sales 1170 1037 12.8% 1204 -2.8% 4372 3339 30.9%
PBT 154 137 12.4% 183 -15.8% 589 309 90.6%
PAT 116 104 11.5% 137 -15.3% 437 233 87.6%
Consolidated financials (in Crs)
Q4FY22 Q4FY21 YoY % Q3FY22 QoQ % FY22 FY21 YoY%
Sales 1188 1051 13.0% 1222 -2.8% 4437 3385 31.1%
PBT 150 138 8.7% 182 -17.6% 581 306 89.9%
PAT 96 105 -8.6% 133 -27.8% 418 230 81.7%
Detailed Results
1. Consolidated Revenues in Q4 have increased by 13% YoY. FY22 sales have seen an impressive 81% YoY growth.
2. EBITDA margins stood at 25%. 3. The company opened 80 new Domino's stores along with 4 new Popeyes restaurants in Bengaluru &
1 new each for Dunkin’ and Hong’s Kitchen. 4. Sales growth In Srilanka & Bangladesh stood at 80.6% & 44.5% respectively. 5. GPM decreased by 56 Bps to 76.9% while PAT margins stood at 10% 6. Like-for-like (LFL) growth for the quarter stood at 5.8%. 7. The company opened 80 new Domino’s stores opened in Q4FY22 and 230 stores in FY22. 8. The company had 7.7 Mn app installs in Q4FY22 and 30.2 Mn in FY22. 9. The Company completed 100% acquisition of its subsidiary with an intention to further strengthen
presence and scale of operations in the fast-growing and critical market of Bangladesh. 10. Online ordering accounted for 97.9% of total sales in Q4 with mobile orders accounting for 97.4%.
Investor Conference Call Highlights

Click here to Subscribe
on WhatsApp
www.smartsyncservices.com
1. The Board approved the appointment of Sameer Khetrapal as the Chief Executive Officer and Managing Director.
2. The management states that more than 70% of its orders are now being delivered in under 20 minutes.
3. The management doesn’t expects a reduction in marketing spend in FY23. 4. The management expects to differentiate its Popeyes brand by offering chicken sandwiches. 5. The company expects Popeyes to have atleast 250-300 stores in medium term. 6. The management doesn’t expect a big downside in margins of Dominoes segment for FY23. 7. The management believes that popeyes stores are oriented more towards dine in based & it expects
its profitability in medium term to be similar to Dominoes. 8. The company will have a new expanded commissary in Bangalore, Mumbai, Kolkata, Ahmedabad
and ramped up capacity in Mohali between FY23-24. 9. The management is guiding for opening 250 new dominoes store in the coming FY. 10. The company took a price hike of about 5% to 6% at a menu price level during the end of Q4 which
flew through in quarter 4, and it had also taken another round of price increase towards early April, which was in the similar range.
11. The management states that its branch expansion strategy isn’t margin dilutive & the new store payback is between 2 to 3 years.
Analyst’s View
Jubilant Foodworks is the largest QSR player in India with the master franchise of Dominos. It also holds the licenses for Dunkin DOnuts and Popeye’s Chicken. The company has seen impressive recovery post the pandemic and has seen FY22 revenues rise 31% YoY. The company continues to focus on superior delivery times and shrinking operating areas to be able to deliver within 20 mins. The management is also very optimistic on the future of the Popeye’s franchise in India and is building a custom delivery network for this brand. It remains to be seen what issues will the company face in expanding Popeye’s and whether they will be able to compete in terms of delivery times with the other food delivery majors like Swiggy and Zomato. Nonetheless, given the strong market position of the company, the future potential of the QSR sector and the introduction of Popeye’s in India, Jubilant Foodworks is a pivotal QSR and food services stock to watch out for.

Click here to Subscribe
on WhatsApp
www.smartsyncservices.com
REAL ESTATE & CONSTRUCTION KNR Constructions
Financial Results & Highlights Introduction:
KNR Constructions is engaged in the business of the infrastructure sector, primarily in the construction of roads, bridges, flyovers and irrigation projects.
Standalone financials (in Crs)
Q4FY22 Q4FY21 YoY % Q3FY22 QoQ % FY22 FY21 YoY%
Sales 1029 945 8.9% 774 32.9% 3314 2752 20.4%
PBT 180 148 21.6% 146 23.3% 579 381 52.0%
PAT 112 77 45.5% 101 10.9% 381 244 56.1%
Consolidated financials (in Crs)
Q4FY22 Q4FY21 YoY % Q3FY22 QoQ % FY22 FY21 YoY%
Sales 1121 1000 12.1% 863 29.9% 3651 2955 23.6%
PBT 207 159 30.2% 87 137.9% 552 512 7.8%
PAT 140 95 47.4% 44 218.2% 366 382 -4.2%
Detailed Results:
1. Revenue increased by 12% while PAT increased by 47% on a consolidated basis while PAT on a standalone basis in 45%.
2. Consolidated EBITDA increased by 14% while EBITDA margins stand at 20.6%. 3. Net working capital for FY22 stands at 63 days. 4. Consolidated net debt to equity 0.29. 5. The total order book is at Rs.9,000.8 Cr. The irrigation segment constitutes 25% & EPC & HAM 75%
of total order book.
6. Third-party order book accounts for 58% of the total order book position is distributed between
state government contracts with 41% and 11% is from central government and balance 3% of order
book is from other private players.
7. The outstanding order book position of INR 6,511 crores.
8. The percentage of physical progress as of 31st December 2021 for the HAM project is:
a. Chittor to Mallavaram at 100%;
b. Ramsanpalle to Mangloor at 100%;
c. Trichy to Kallagam at 93.6%;
d. Magadi to Somwarpet at 55.6%;
e. Oddanchatram to Madathukulam at 56%
f. Ramanattukara to Valanchery at 2.8%
g. Valanchery to Kappirikkad at 2.4%
h. Chittor to Thatchur at 0%

Click here to Subscribe
on WhatsApp
www.smartsyncservices.com
9. KNR received a new order post 31st march for Six laning of Chittoor – Thatchur section (Package 3) in
the state of Andhra Pradesh and Tamil Nadu on Hybrid Annuity Mode under Bharatmala Pariyoiana
worth Rs.765 Cr.
10. ROE for FY22 stood at 17%.
11. Shareholders have approved 100% stake sale of KNR Shankarampet Projects Private Limited, KNR
Srirangam Infra Private Limited and KNR Tirumala Infra Limited.
12. Standalone Net debt to equity stood at 0.
Investor Conference Call Highlights:
1. The industry saw 12,731 kilometers of road awarding which is a growth of 22% YoY.
2. The company has received financial closure for KNR Ramagiri Infra Private Limited which received the
financial closure from NHAI on 30th March 2022 for HAM projects.
3. The toll collection for the Bihar project in Q4 FY22 and FY22 has been Rs. 10.42 crores and Rs. 38.58
crores respectively.
4. The company is targeting further order book inflow of Rs. 4,000 to Rs. 5,000 crores for FY23.
5. The income tax department has carried out a search operation at the company's various business
premises in March 2022. It has created no provision for any liability in the financial results.
6. The management states that giving any projection of EBITDA at this stage may not be right, but it will
try to maintain EBITDA margin of at least 15-16%.
7. The company’s irrigation project has pending receivables of around Rs. 650 crores.
8. The company expects to incur capex of around Rs.120-150 Cr.
9. The company’s Retention receivable is around Rs. 181 crores and unbilled revenue are around Rs. 250
crores.
10. The management expects a few problems this year due to the early monsoon of 1 to 1-1/2 months
coupled with higher receivables from the irrigation biz.
11. The company is currently not targeting Northern India due to the requirement of its quarry which the
management, believes will be a margin decreasing activity.
12. The management states that it currently has a sufficient order book in its existing portfolio, but if it
doesn’t get any orders, it will venture into railways, mining operation areas & metros.
13. The company’s EBITDA margins for irrigation are around 24%, HAM around 18%, and other roads are
around 13%.
14. 60% of the contract value in irrigation projects has cost escalations while HAM & EPC are fixed price
contracts with no cost escalation.
15. The company’s creditor days are based on purchasable calculator & not turnover.

Click here to Subscribe
on WhatsApp
www.smartsyncservices.com
Analyst’s View:
KNR has been one of the top performers in the construction industry. KNR has seen a great quarter with
a 28% YoY rise in revenues. The company had a decent quarter with revenue & profit growth of 12% &
47% respectively. The company has done well to gather an order book of over Rs 9,000 Cr. It is already
bidding for new projects and is targeting to get Rs 3000 Cr orders for irrigation projects in the coming
year. The central govt push for PM Gati Shakti National Master Plan for multiple modal connectivity is
expected to be a great boost for the entire industry and a seasoned player like KNR. It remains to be
seen how the industry will fare going forward given the sustained rise in raw material costs and how
long will it take for the Govt’s push in infrastructure to gain proper momentum. Nonetheless, given its
strong balance sheet, good operational history, and resilient order book, KNR Constructions remains a pivotal construction sector stock to watch out for.

Click here to Subscribe
on WhatsApp
www.smartsyncservices.com
Ashiana Housing
Financial Results & Highlights Brief Company Introduction
Ashiana Housing Ltd. (AHL) is an Indian real estate development company established in 1986 with its head office in New Delhi, India. It is a real estate company recognized by Forbes as Asia's 200 Best Under A Billion (2010 and 2011) Ashiana Housing is a mid-income housing developer with primary focus on Kid Centric Homes, Senior Living, Care Homes (i.e. assisted living) and also comfort homes.
Standalone Financials (in Crs)
Q4FY22 Q4FY21 YoY % Q3FY22 QoQ % FY22 FY21 YoY%
Sales 62.8 69.7 -9.9% 42.8 46.7% 181.9 217.1 -16.2%
PBT 8.8 -5.7 254.4% -6.1 244.3% -12 3 -500.0%
PAT 9.3 -5.8 260.3% -3.5 365.7% -5.9 3.6 -263.9%
Consolidated Financials (in Crs)
Q4FY22 Q4FY21 YoY % Q3FY22 QoQ % FY22 FY21 YoY%
Sales 78.2 81.3 -3.8% 54.2 44.3% 233.5 259.3 -9.9%
PBT 7.68 -6.2 223.9% 7.3 5.2% -14.6 0.3 -4966.7%
PAT 6.3 -5.6 212.5% -3.8 265.8% -7 1.7 -511.8%
Detailed Results
1. Booking stood at 4.53 lakhs Sq. ft Vs 4.21 Lakhs QoQ. 2. Area constructed stood at 5.07 Lakh sq. ft Vs 3.73 Lakh sq.ft QoQ. 3. Value area Booked Rs.18,557 Vs 16,976 lakhs QoQ. 4. The average realization for Q4 stood at Rs/Sq.ft 4093 Vs 4,028. 5. Debt/Equity is 0.21. 6. Area constructed higher at 16.20 Lakhs Sq. ft. FY22 vs 11.66 Lakhs Sq. ft. FY21. 7. New land parcels acquired in the current year in Gurgaon 22.1 acres, Pune 11.93 acres, Jaipur 8.6
acres, Jamshedpur3.96 acres, and two land parcels in Chennai of 15.64 acres and 9.93 acres. 8. Total Revenue increased to Rs.78.28 Crs vs 54.19 Crs QoQ due to higher deliveries.
Investor Conference Call Highlights
1. The company's total potential saleable area in new land parcels will be around 61 lakh square feet.
2. The company’s bookings in Q4 were driven by Ashiana Amantaran Phase 3, Nirmay Phase 4, Bhiwadi; Ashiana Anmol Phase 2, Gurgaon, and Ashiana Shubham Phase 4 in Chennai.
3. The management states that Sales price improved to Rs.3,883 per square foot in FY 22 versus Rs.3,571 per square foot in FY 21, driven by increasing prices across projects and changing mix towards higher-priced projects.
4. The company is planning to add about 25 to 30 lakh square feet in FY23. 5. The company expects to cross Rs.1000 Cr sales landmark & Rs.1100 Cr presale landmark in FY23
out of which Gurgaon is expected to make 1/4th contribution.

Click here to Subscribe
on WhatsApp
www.smartsyncservices.com
6. The management believes that it will not be able to meet its guidance of 15% ROE in FY22. However, it expects the same to be in double digits.
7. The company is expecting margin expansion in the next 3-5 years due to higher contribution from the senior living segment, operating leverage & increase in sales price.
8. The management believes the key challenge in sustaining the growth post FY23 would be the availability of land parcels at reasonable rates rather than the availability of capital.
9. The company expects to spend Rs.200 Cr on acquisitions. 10. The company has filed for RERA for Phase 1 of Ashiana Adwik while Milakpur is currently in a
status quo position. 11. The management believes that the industry will be able to digest the home loan interest rates up
to 8.5%.
Analyst’s Views
Ashiana Housing is a unique presence in the Indian real estate industry. The company saw a revenue decrease of 3% while PAT turned positive YoY. The projects are going ahead in time and the management expects a good response to the upcoming projects in the future. The management expects margin expansion in the future for Ashiana due to the rising share of senior living. It also expects to breach the Rs 1000 Cr sales mark in FY23. It remains to be seen how long will it take for the company to recover and come back to provide levels of performance and what impact will the rising inflation have on the real estate sector and Ashiana. Nonetheless, given the evergreen nature of the real estate industry in India, the unique and cautious business model of Ashiana and the rising trend of senior living in India, Ashiana is a good real estate sector stock with a lot of potential in the future.

Click here to Subscribe
on WhatsApp
www.smartsyncservices.com
TECHNOLOGY Intellect Design Arena
Financial Results & Highlights Brief Introduction:
Intellect Design Arena is a global leader in Financial Technology for Banking, Insurance and other Financial Services. It is positioned at the forefront of the digital transformation that global banks are looking for in a connected world. Intellect’s robust iDigital platform enables products across four distinct lines of businesses: Global Consumer Banking (iGCB), Risk, Treasury & Markets (iRTM), Global Transaction Banking (iGTB), Central Banking and Insurance (Intellect SEEC). Deep banking domain expertise, coupled with investments of Rs 800 Crores over the last ten years in developing the world’s first full spectrum of banking products has made Intellect the company with one of the most advanced technologies for financial institutions and global businesses.
Standalone Financials (in Crs)
Q4FY22 Q4FY21 YoY % Q3FY22 QoQ % FY22 FY21 YoY%
Sales 360 283 27.2% 325 10.8% 1291 1019 26.7%
PBT 72 59 22.0% 50 44.0% 264 222 18.9%
PAT 51 56 -8.9% 40 27.5% 202 207 -2.4%
Consolidated Financials (in Crs)
Q4FY22 Q4FY21 YoY % Q3FY22 QoQ % FY22 FY21 YoY%
Sales 523 400 30.8% 519 0.8% 1918 1510 27.0%
PBT 106 82 29.3% 118 -10.2% 413 290 42.4%
PAT 95 82 15.9% 101 -5.9% 350 265 32.1%
Detailed Results:
1. The company had a great quarter with consolidated revenues rising 30% YoY while PAT grew 16% YoY. 2. In $ terms, revenues grew 24% YoY in Q4. 3. SaaS revenues rose 84% YoY in Q4. 4. License revenues decreased by 6% YoY. AMC revenues were up 14% YoY in Q4. 5. The gross margin was at 57.2% which is up 40 Bps YoY. 6. EBITDA margin decreased by 180 Bps YoY to 23.7% while EBIDTA grew by 19% YoY. 7. The Net Days of Sales Outstanding (DSO) is 115 days in Q4. 8. The company has zero net debt and cash equivalents of Rs.257 Cr. 9. Investment in product development was Rs.29.7 Cr in the current quarter 10. The current deal pipeline is sitting at Rs.5455.6 Cr. It accounts for 167 opportunities out of which it
has 61 destiny deals having an average deal size of Rs 45.1 Cr which accounts for 64% of total opportunities.
11. The company had 6 new deals including 3 in platform businesses. 12. The board of directors recommended final dividend of Rs.2.5. 13. The large deals in Q4 include

Click here to Subscribe
on WhatsApp
www.smartsyncservices.com
a. Strategic deal wins from Reserve Bank of India and a leading private sector multinational bank in India in Q4 FY 22
b. iGTB partners with Microsoft to establish Corporate Banking transformation on Cloud
c. 35 new Customers have chosen Intellect’s Digital stack for their Digital transformation in FY22 including 13 large transformational deals
Investor Conference Call Highlights:
1. The company lost a deal for the Russian bank due to the Russia-Ukraine war which could have led to Rs.4 Cr worth of revenues.
2. The talent cost for the quarter increased by Rs.13 Cr due to higher salary, employee base & travel related expenditure.
3. The management states that it can deliver the products & services to customers at a faster rate leading to a significant moat in digital transformation where it applies design thinking at the requirement stage, Solution stage & Engineering stage.
4. The management states that its budget for FY22 will go up by at least 15% to 20% due to higher travel-related expenses coupled with a higher R&D budget as the company is looking to enter into new countries.
5. The management is confident of delivering 20% growth in the coming FY.
6. The company is planning to add close to 100-125 people in the current quarter.
7. The management states that the company’s PAT margin in the coming FY will be lower due to the higher tax rate.
8. The management is confident of touching the $75 million run rate in the coming quarters.
9. The company got a contract with Bajaj FinServ and DBS where they came together to launch the first Co-branded credit card & this credit card is being managed by the company from a technology as well as operations perspective.
10. The timeline of the company’s deal pipeline of $725 million in 10 years.
11. The deal between the company & Microsoft involves exclusive signing for working on all the GTB products suite, cash & cloud payments along with some other products.
12. The company is targeting 70-80% of EBIDTA conversion to free cash flows.

Click here to Subscribe
on WhatsApp
www.smartsyncservices.com
Analyst’s View:
Intellect Design Arena is a fast-rising disruptor in the world fintech space. The company’s products are well received all over the world which is evidenced in the diverse set of geographies and financial institutions that they cater to. The company has had an excellent quarter with 30% Yoy revenue growth and 16% Pat growth. The management maintains that the company will reach $75 revenue in the next 3-4 quarters at its current pace and will deliver >20% revenue growth in FY23. Intellect is also looking to set up a Rs 100 Cr AIF to invest in growing fintech businesses that may leverage its platforms It remains to be seen how will the company maintain its growth momentum given the higher employee salaries, attrition rates and more travel-related expense which might hurt its margins. Nonetheless, given the acceptance of the company’s products in all kinds of financial institutions worldwide and its high customer retention rate and accelerated implementation time for its projects, Intellect Design Arena remains a stock to watch out for in the financial software industry.
L&T Infotech
Financial Results & Highlights Brief Introduction:
Larsen & Toubro Infotech Limited, a technology consulting and digital solutions company, provides information technology services and solutions in India, North America, Europe, the Asia Pacific, and

Click here to Subscribe
on WhatsApp
www.smartsyncservices.com
internationally. The company operates through Banking, Financial Services & Insurance; Manufacturing; Energy & Utilities; High–Tech, Media & Entertainment; and CPG, Retail, Pharma & Others segments. It offers application development, maintenance and outsourcing, enterprise solution, infrastructure management, testing, digital solution, and platform-based solution services. It is a subsidiary of Larsen & Toubro Limited.
Consolidated financials (In Crs)
Q4FY22 Q4FY21 YoY % Q3FY22 QoQ % FY22 FY21 YoY%
Sales 4435 3372 31.5% 4237 4.7% 16135 12644 27.6%
PBT 859 717 19.8% 823 4.4% 310 259 19.7%
PAT 64 55 16.4% 61 4.9% 230 194 18.6%
Standalone financials (In Crs)
Q4FY22 Q4FY21 YoY % Q3FY22 QoQ % FY22 FY21 YoY%
Sales 4103 3080 33.2% 3942 4.1% 14995 11791 27.2%
PBT 806 624 29.2% 787 2.4% 3010 2392 25.8%
PAT 599 467 28.3% 590 1.5% 2325 2227 4.4%
Detailed Results:
1. The company had a great quarter with 31.5% YoY growth in consolidated revenues and 16% YoY growth in consolidated profits.
2. The constant currency revenue growth was at 3.6% QoQ and 29% YoY in Q4. 3. USD revenues saw a growth of 27.5% YoY & 3.1% QoQ. 4. ROE for the year stood at 28.5%. 5. EBITDA margin decreased by 34 bps QoQ to 19.7% in Q4. 6. Revenue breakup in Q4 by vertical is:
1. BFS: 32.7% (Up 35.5% YoY) 2. Insurance: 13.4% (Up 17.6% YoY) 3. Manufacturing: 16.8% (Up 26.5% YoY) 4. Energy & Utilities: 8.8% (Up 23% YoY) 5. CPG, Retail & Pharma: 10.3% (Up 21.9% YoY) 6. Hi-tech, Media & Entertainment: 11.7% (Up 27.1% YoY) 7. Others: 6.3% (Up 30.6% YoY)
7. Revenue breakup by Service Offerings is: 1. ADM and Testing: 33% (Up 26.1% YoY) 2. Enterprise Solutions: 30.8% (Up 21.6% YoY) 3. Cloud Infrastructure & Security: 13.7% (Up 15.9% YoY) 4. Analytics, AI & Cognitive: 12.8% (Up 46.8% YoY) 5. Enterprise Integration & Mobility: 9.7% (Up 51.8% YoY)
8. Geographical breakup was North America @ 65.6%, EU @ 16.2%, RoW @ 8.3% & India @ 9.9%. 9. Top 5 clients accounted for 28.2% of revenue, Top 10 accounted for 40.4% of revenue & Top 20
accounted for 55.8% of revenue. 10. The company added 25 new clients in Q4. 11. Effort Offshoring is at 84.6% while offshore revenues are at 60.2%. 12. Utilization including trainees is at 80.1% and excluding is at 81.5%. 13. Attrition rate for the quarter stood at 24%.

Click here to Subscribe
on WhatsApp
www.smartsyncservices.com
14. Cash and Cash equivalents as of end of Q4 was at Rs 759.4 Cr. 15. Few Recent deal wins of L&T Infotech in Q4 were:
Selected by a Global Fortune 500 financial services company for an end-to-end managed services engagement involving transformation, governance and support for middleware and data as part of their global technology function
A Global Fortune 500 corporation, a leading provider of ratings, benchmarks, analytics and financial data, has selected LTI as its primary partner for an engagement involving data and digital services to integrate its data platforms with its recent acquisition
Selected by a Global Fortune 500 consumer goods company as their strategic partner for data and analytics work to transform and gain insights across their most critical business functions of manufacturing, supply chain, marketing and creation of a metadata hub
Selected by a Global Fortune 500 corporation engaged in the supply of IT infrastructure products and services to upgrade its SAP S/4HANA ERP platform
Selected by a global security services firm to set up a digital command center to monitor Infrastructure and network, and ensure minimal disruption
A top healthcare provider in the Middle East has selected LTI, through its strategic partnership with a regional leader, for support on its security and network operation center
Engaged by a key government body in the public healthcare space to develop an eco-system and technology infrastructure providing, storing and improving access to relevant public data and supporting public health insurance programs
Selected by a large metals and mining company for an ERP managed services engagement involving key business modules like transportation management, technology, customer and supplier engagement across its legal entities and over 40 operating units
16. The company announced a final dividend of Rs.30 for Q4 while total dividend for the year stood at Rs.55.
Investor Conference Call Highlights:
1. As a part of localization strategy, the company has expanded its presence in US with a new engagement center in Hartford.
2. New TCV for Q4 was over $80 million. 3. Around 40 bps margin impact of higher employee costs was offset by SG&A leverage while the 60 bps
drop in margins is primarily due to working days impact and business mix 4. The management reiterates its PAT margin guideline of 14-15% for FY23. 5. Billed DSO stood at 65 days vs 66 days in Q3. 6. DSO including unbilled revenue was at 99 days vs 100 days QoQ. 7. The management states that capex was slightly elevated this year due to investment in its own center
in the form of Mahape facility which can seat 7,500 employees. 8. The management further expects to continue investing in its infrastructure in the coming years since
it did a lot to the headcount in the past 2 years without increasing any infrastructure to accommodate them.
9. The company has given a salary hike on 1st April which will have an impact of 290 bps in quarter one itself. The company will focus on reducing onsite and offsite attrition rate which the management sees as the biggest challenge.
10. 2-4% of onsite volume growth got impacted due to high attrition. 11. The company hiring of freshers will stand at 6,500 this year vs 5,200 in the previous year. 12. The management doesn’t sees demand from European market softening despite Russia Ukraine
conflict.

Click here to Subscribe
on WhatsApp
www.smartsyncservices.com
Analyst’s View:
L&T Infotech is a major in the digital solutions space in India. The company has done well to maintain its presence in many end industries like BFS, Insurance, Manufacturing, etc, and focus on cloud and data products to drive growth soon. It has had a decent Q4 with major deal wins and good revenue growth of over 31% YoY while keeping EBITDA margin decline at only 34 bps. The management expects the growth drivers for the IT industry to remain intact due to the demand for core digitization across various industries. LTI is looking to continue hiring as long as it is necessary while keeping the PAT margin profile within the guided range of 14-15%. It remains to be seen how the company will be able to sustain its growth momentum and the increased competition in the tech space, & whether it will face any margin pressure due to the large hiring it is doing and very high attrition rates across the industry. Nonetheless, given the company’s ever-increasing roster of marquee clients and its focus on driving growth from cloud & data products, L&T Infotech is a pivotal technology stock to watch out for.

Click here to Subscribe
on WhatsApp
www.smartsyncservices.com
Ramco Systems
Financial Results & Highlights Brief Company Introduction
Ramco Systems Limited operates as an enterprise software company in India, the Americas, Europe, APAC, the Middle East, and Africa. The company offers Ramco AviationSoftware, an enterprise-wide M&E/MRO software to address the needs of airlines, heli operators, MROs, and business aviation segments; Ramco VirtualWorks, a software meta-model that captures data required to generate and deliver solutions in various technology platforms; and Ramco DecisionWorks for analytics/reporting. It also provides Ramco ERP on Cloud, a suite of products that covers enterprise functions, such as manufacturing; financial, supply chain, human capital, customer relationship, enterprise asset, and project management; process control; analytics; advanced planning and optimization; and connectors. In addition, the company offers Ramco Human Capital Management, HR and talent management, and payroll software; and Ramco Logistics Software, cloud-based software that covers the needs of third-party logistics, freight forwarders, and parcel/courier service providers.
Standalone Financials (in Crs)
Q4FY22 Q4FY21 YoY % Q3FY22 QoQ % FY22 FY21 YoY%
Sales 73 90 -18.9% 68 7.4% 290 354 -18.1%
PBT -19 19 -200.0% -15 26.7% -58 81 -171.6%
PAT -15 10 -250.0% -11 36.4% -50 44 -213.6%
Consolidated Financials (in Crs)
Q4FY22 Q4FY21 YoY % Q3FY22 QoQ % FY22 FY21 YoY%
Sales 125 153 -18.3% 128 -2.3% 540 641 -15.7%
PBT -29 15 -293.3% -27 7.4% -73 108 -167.6%
PAT -26 7 -471.4% -25 4.0% -73 57 -228.1%
Detailed Results
1. The company saw a poor quarter with revenue decline of 18% while PAT stood negative.
Investor Conference Call Highlights
1. The company’s order booking for the quarter declined to USD 11.82 million, which was USD 13.55 million in the previous quarter.
2. The company’s Booking for the year had come down to around USD 64.78 Mn Vs USD 109 Mn YoY due to weakness in Asian markets.
3. The management wants to continue its operations with zero long term borrowings. 4. The company saw its unbilled revenue improving due to implementing the projects quickly &
moving away from deferred payment model for licenses to annuity model. 5. The management expects increasing revenue through high contribution from the workday front. 6. The company is bullish on recovery of Asian market due to opening up of the economies post Covid. 7. The management is targeting USD 100 Mn plus order booking in FY23.

Click here to Subscribe
on WhatsApp
www.smartsyncservices.com
8. The management states that its Payroll engine is built for 61 countries and 90% of those 61 countries are in the Asia Pacific region and Middle East because of which it could not generate revenues from other regions during the closure of Asian markets.
9. The management states that the only major headwind will be any stagflation happening in the western market.
10. The management states that the payroll market in Asia-Pacific is USD 26 billion & is currently growing at 5% CAGR.
11. The company’s clientele includes Big four consulting who use the platform to provide services to their end customers & three of the top four large global consulting companies are using its platform to provide payroll services to their end customers.
12. The company normally expects close to 30% margin in its projects.
Analyst’s Views
Ramco is a fast-growing enterprise software player disrupting the market with its multi-tenanted cloud and mobile-based enterprise software in HCM and Global Payroll, ERP, and M&E MRO for Aviation. Ramco Systems had a bad quarter with revenues rising 18% YoY with a loss of Rs 26 Cr vs a profit of Rs 7 Cr in Q4 last year. It had a similarly bad FY22 with the annual order booking shrinking to $65 million from $109 million last year. The management remains bullish on the opening up of these geographies which should help the company get back on track. It remains to be seen how will it take for Ramco to regain its earning momentum what challenges it will face in coming times. Nevertheless, Ramco Systems is one stock to watch out for in the IT product space due to its unique proposition and its wide reach in terms of geographies.

Click here to Subscribe
on WhatsApp
www.smartsyncservices.com
Tata Elxsi
Financial Results & Highlights Introduction
Tata Elxsi provides product design and engineering services to the consumer electronics, communications & transportation industries and systems integration and support services for enterprise customers. It also provides digital content creation for media and entertainment industry.
consolidated financials (In Crs)
Q4FY22 Q4FY21 YoY % Q3FY22 QoQ % FY22 FY21 YoY%
Sales 700 525 33.3% 642 9.0% 2515 1866 34.8%
PBT 220 162 35.8% 200 10.0% 745 512 45.5%
PAT 160 115 39.1% 151 6.0% 550 368 49.5%
Detailed Results:
1. The company saw its revenue rise by 33% YoY. 2. PAT increased by 39% YoY. 3. EBIDTA margins at 32.5% 4. EBIDTA grew by 31.7% YoY. 5. Constant currency revenue was up 31.5% YoY. 6. The company reported EBIDTA margins at 33.2% and PAT margins at 23.5%. 7. Company’s embedded product division (EPD) reported growth of 7.5% QoQ while IDV grew by 8%
QoQ. 8. Performance for the year end involved PAT @21.9% , Revenue growth at 35.3%, EBIDTA margins at
31% & PBT margin at 29.6% 9. The revenue rise in different segments in the EPD business was– a. Automotive business: Up 38.6% YoY b. Media & communication business: 31.6% YoY c. Healthcare business: Up 62.4% YoY 10. Revenue distribution across different geographies is as follows: a. EU: 34.2% b. Americas: 40.1% c. India: 14.5% d. RoW: 11.2% 11. The top client accounted for 11.4% of sales while the top 5 & top 10 accounted for 36.1% and 48.3% of sales respectively. 12. Attrition among employees was at 20.8% 13. The offshore mix was at 70.1% vs 75.1% in Q4.
14. The company won many new deals including a. Design Digital deal win leveraging Tata Elxsi video platform and IP for a Middle East broadcasting leader b. A North American Healthcare platform provider selected Tata Elxsi for providing cloud engineering services

Click here to Subscribe
on WhatsApp
www.smartsyncservices.com
c. selected by a leading German Tier 1 supplier for establishing an Offshore Development Center for Autonomous Driving and ADAS technologies d. multi-year multi-million USD deal for EV system development from a global automotive leader e. selected to establish and set up a Virtual Reality Innovation Center by a leading European commercial vehicle manufacturer
Investor Conference Call highlights:
1. The company added 2000 employees on net basis in FY22. 2. The management states that its attrition rate is better than overall industry. 3. Company takes 6-9 months to train freshers. 4. Company is planning to add 2500-3000 freshers in this year. 5. On site: off shore effort mix is 90:10. 6. The company did a wage hike in January to junior employees which constitute 55-70% of total
employee base & expects to give wage hike to senior employees from may onwards. 7. The quarterly wage hike had an impact of 150 Bps on margins which was offset by operating leverage,
better utilisations & better utilisation from fix price contracts. 8. The company is confident about maintaining margins despite inflation due to revenue expanding
while cost remaining nonlinear along with expansion in places where tax rates are lesser. 9. The company expects to maintain fixed price contracts ratio to 50% of total contracts. 10. The company doesn’t see any slowdown in OTT market according to the management. 11. The company has hired more freshers in Q2 & Q3 and lower fresher hiring in Q4 should not indicate
slowdown according to the management. 12. The company’s EV centre is expected to bridge gap for traditional & modern OEM to adopt software
& technology. 13. The company is targeting Indian market for EV service offerings & is looking to target 2 & 3-wheeler
segments first. 14. The management states last 3 quarter’s performance of automotive business is a good indication of
strong potential of this segment. 15. The company doesn’t have any customers in Ukraine-Russian Geography & doesn’t expect to be
affected by the war. 16. The company has expanded its media business segment in Middle East & Latin America as well. 17. The company has been investing aggressively in sales & tools in last 4 Quarters. 18. The consistency in the revenue has been largely due to pivot from project-based contracts to annuity
based long term contract. 19. The company is targeting a 40:40:20 revenue mix for automotive, media and healthcare businesses. 20. The company isn’t focusing on M&A unless a great opportunity presents in its valuation range since it
is comfortably doing organic growth of 30%. 21. The management sees market expanding as well as the market share of customers is expanding,
leading to a higher share of wallet from existing customers. 22. The company’s ability to get new customers through a long multi-year deal is aiding it to growth QoQ
without getting affected by any seasonality.

Click here to Subscribe
on WhatsApp
www.smartsyncservices.com
Analyst’s View:
Tata Elxsi had another good quarter with revenue growth of 30% YoY and profit growth of close to 40% YoY in Q4. The company continues to see good growth in all segments and recovery in the transport segment. The deal wins in the media and comms space have been very encouraging. The auto segment continues to recover and the opportunities for Tata Elxsi in this space are getting better with more and more auto players coming onto the EV and connected vehicles bandwagon. It has been hiring aggressively and is not expected to slowdown in its hiring trend according to the management. The company has also seen good growth in the auto sector for Tata Elxsi and it is looking to target 2 and 3-wheeler EVs in India with its service offerings. It remains to be seen how the company will be able to retain its top talent given the high attrition in the industry and what opportunities will the company explore to grow its new verticals. Nonetheless, given the company’s strong technological capabilities and its resilient performance in the last year, Tata Elxsi remains a good technology stock to watch out for, particularly given the rising demand for its services in the media & communications spaces.

Click here to Subscribe
on WhatsApp
www.smartsyncservices.com
TRAVEL & HOSPITALITY MHRIL
Financial Results & Highlights Brief Company Introduction
Club Mahindra Holidays is an Indian travel company founded in 1996. It is a part of the Mahindra Group and provides holidays on a timeshare basis. Mahindra Holiday & Resorts India Limited (MHRIL) is a part of the Leisure and Hospitality sector of the Mahindra Group. Vacation ownership is its key offering and "Club Mahindra" is its flagship brand. MHRIL offers family holidays primarily through vacation ownership memberships for over a period of 25/10 years. Today they boast a fast-growing customer base of over 235,000 members and 50+ resorts at some of the most exotic locations in both India and abroad.
Standalone Financials (In Crs)
Q4FY22 Q4FY21 YoY % Q3FY22 QoQ % FY22 FY21 YoY%
Sales 304 254 19.6% 284 7% 1070 908 17.8%
PBT 59 32 84.3% 48 22.9% 203 169 20.1%
PAT 44 24 83.3% 36 22.2% 151 125 20.8%
Consolidated Financials (In Crs)
Q4FY22 Q4FY21 YoY % Q3FY22 QoQ % FY22 FY21 YoY%
Sales 582 496 17.3% 584 -0.3% 2178 1847 17.9%
PBT 31 -10 410% 20 55% 110 2 5400%
PAT 15 -9 266% 13 15.3% 67 -14 578.5%
Detailed Results
1. It was a mixed quarter for the company with a rise in consolidated revenues of 17.3% YoY while PBT rose to a profit of Rs 31 Cr and PAT was at Rs 15 Cr. Both PBT & PAT saw improvement YoY.
2. FY22 consolidated performance was also great with revenues increasing 17.9% QoQ and PAT up 578% YoY.
3. Standalone PBT & PAT was up 83.4% & 83.3% YoY for the quarter respectively. 4. The deferred revenue pool was at Rs 5083 Cr. 5. Strong cash position at Rs 1172 Cr. 6. Resort occupancy was at 77% for Q4. Resort income declined QoQ to Rs 57 Cr in Q4. 7. The member additions in Q4 were at 4058 vs 4789 the previous year. 8. Member acquisitions through the Referral & Digital route was at 58% in Q4. 9. Consolidated EBITDA margin improved 720 bps YoY to 32.1% in Q4 due to a one-off gain from sale of
investment. 10. Fixed assets for the company stand at Rs 2292 Cr as of 31st March 2022. This includes land worth Rs
1233 Cr and excludes long-term leases valued at Rs 268 Cr. 11. The room inventory was at 4568 units. 12. Revenues for HCRO were up 41% YoY. Renting income & Spa hotel revenues were -2.8% YoY and
95.8% YoY respectively due to the summer holiday season in Finland. Time share sales increased 31.6% due to Omicron surge.
13. The unit delivered an operating profit in Q4 of EUR 0.6 mn and PAT of EUR -1.1 mn.

Click here to Subscribe
on WhatsApp
www.smartsyncservices.com
14. The company saw forex gain of Rs 0.27 Cr vs gain of Rs 10.16 Cr last year.
Investors conference call Highlights
1. The company has crossed the milestone of 4500+ keys. The management targets to reach 5500+ rooms in the next 24 to 30 months.
2. The company has commenced expansion of resort at Kandaghat, Shimla. The expansion requires the company to invest INR 200 crore and will deliver 185 rooms.
3. The company is at its last stage of getting the last permissions to set up a resort in Ganpatipule with 236 keys and a total investment of INR 250 crores.
4. The company achieved very good growth in resort revenues by enhancing member engagement. 5. The company has increased its stake in Rocksport from 6.67% to 23.4% which will happen by Sept
2022 as the transaction completes. This will help the company increase customer engagement avenues.
6. The company was affected by inflationary pressures in its F&B services and has taken price increases in April 2022.
7. To manage resort costs, the company has installed solar plants at 14 resorts with a total capacity of 2,500 KW power. Further, 1000 KWP is ready for installation in Q1 FY23.
8. The company sold its investment in Nreach Online Services netting a one-off gain of Rs. 26.3 crore. This is a 9x return as the company had taken this 12% stake in 2016 at an investment of INR 3 crore.
9. The company’s expenses have increased 17% for FY22 which is on account of higher business activity, higher sales, marketing expenses and overheads. The company’s marketing expenses have increased by Rs. 34 crore which is in line with the additional sales volume.
10. The management states that Holiday Club Resorts largely focuses on domestic leisure travel, thus it will not be impacted by the Russia-Ukraine war.
11. The management is comfortable with a 55:1 member to room ratio, because it believes that there is a huge opportunity to serve existing members. Current ratio is 58:1.
12. Current occupancies at 90% show that huge traction is coming as dormant members are now holidaying, therefore inventory addition will help take care of members booking needs.
13. The company should be able to declare dividends once they get a clarification from the ministry of corporate affairs related to a transition difference according to the management.
14. The company has a debt of Euro 51 million at the HCRO holding company which was for the acquisition and at the operating level, the debt is at Euro 16 million.
15. The management is confident of crossing the 228-crore mark in FY23 for resort incomes which is their all-time best. This is expected to be driven mostly by F&B income.
16. The ASF for the year has been increased by about 7.8% as per the formula for WPI and CPI inflation. 17. The management states that in the ASF, the company never increases the base fee and only tops it
up to the extent of inflation. 18. The company plans to do a CAPEX of 1000-1200 crore over the next three to four years for acquiring
resorts or building new resorts. 19. The company currently has three product types as compared to 2011 when it had only one. Thus, the
company is covering various price points. 20. The company is happy to sell on EMI while trying for quality member additions but has various policies
to encourage people to pay upfront. This includes shorter EMI tenures and higher value to upfront paying members.

Click here to Subscribe
on WhatsApp
www.smartsyncservices.com
Analyst’s View
MHRIL is the leading vacation ownership company in India. It has a unique business model where the company funds its Capex from customers’ advance money. Because of this model, they are in a much better position against other hotels in terms of Balance Sheet strength. The company saw a decent overall performance in both India & in HCRO with resort occupancy rising to 80% in Q4. HCR also reported positive EBITDA in Q4. The management expects the momentum for HCRO to rise again in Q1 according to Finland’s seasonal patterns. The recent hotel room price inflation has also seen many more additions to the 25-year product than others. It remains to be seen how long it will take for sentiments to completely normalize in the travel sector, & how long will it take for HCRO to become a consistent performer, and when will the company’s continued aggressive inventory expansion plans bear fruit. Nonetheless, given the company’s resilient model and the current valuation is not too far from its replacement cost, MHRIL can turn out to be a pivotal travel sector stock in the times ahead.

Click here to Subscribe
on WhatsApp
www.smartsyncservices.com
Thomas Cook India
Financial Results & Highlights Brief Company Introduction
Thomas Cook India is one of India’s oldest companies which was established in 1881. It is an integrated travel and travel related financial services company. They provide a wide range of services from packaged tours and forex services to visa support and travel insurance. Thomas Cook has been credited with a number of innovations in the travel industry, which include the world’s first packaged tour, first prepaid hotel, first holiday brochure and even the conceptualization of the first traveller’s cheques.
Standalone Financials (In Crs)
Q4FY22 Q4FY21 YoY % Q3FY22 QoQ % FY22 FY21 YoY%
Sales 80 95 -15.7% 121 -33.8% 359 318 12.8%
PBT -38 -29 -31% -25 -52% -123 -56 -119.6%
PAT -35 -13 -169% -19 -84.2% -82 -14 -485%
Consolidated Financials (In Crs)
Q4FY22 Q4FY21 YoY % Q3FY22 QoQ % FY22 FY21 YoY%
Sales 528 401 31.6% 750 -29.6% 1946 945 156.7%
PBT -51 -68 25% -36 -41.6% -322 -416 22.5%
PAT -51 -20* -155% -24 -112% -254 -295 13.8%
*Contains negative tax expense of Rs 47.4 Cr
Detailed Results:
1. Consolidated revenues grew 31.6% YoY. The bad standalone performance was mitigated by growth in other businesses from DEI, Sterling, and DMSs in the Middle East.
2. FY22 also saw good sales growth of 156% YoY and decent reduction in losses of 13.8% YoY.
3. Total cash and bank deposits were maintained at Rs 639 Cr on 31st Dec 2021.
4. Business recovery in various segments (Q4FY22 vs Q4FY21) was:
a. Domestic Holidays: 43% growth in sales
b. MICE: 36% growth in sales
c. DEI: 2.8x growth in sales
d. Sterling Holidays: 15.3% growth in sales
e. Corporate Travel: 155% growth in sales
5. Conversion of Optionally Convertible Cumulative Redeemable Preference Shares: 133 mn balance OCCRPS converted into 28 mn equity shares of Re. 1/- each at the approved rate of Rs. 47.30 per equity share. Upon conversion, the promoter equity shareholding would increase to 72.34% from the present 70.58%
6. The group staged a rapid recovery during the fourth quarter turning operating EBITDA positive

Click here to Subscribe
on WhatsApp
www.smartsyncservices.com
7. DEI opened new partnerships like Legoland Korea Resort, Andamanda Phuket, Attack on Titan Exhibition, Adventure Park UAE.
8. DEI also renewed its terms with 10 partners during the quarter.
9. Sterling lost 593 members this quarter with resort occupancy at 52%.
10. Sterling saw a fall of -15.3% YoY in revenue from operations in Q4. It also a positive EBIT of Rs 18.7 Cr vs Rs 32.7 Cr last year.
11. The segment performance in Q4 is as follows:
. Financial Services: Up 37.5% YoY
a. Travel & Related Services: Up 43.5% YoY
b. VO & Resorts: Down 13.8% YoY
c. Digiphoto: Up 2.8 YoY
Investors Conference Call Highlights:
1. The company has an employee trust which has Quess Corp shares, earmarked only for distribution to the employees and are currently lying undistributed in the trust. The volatility in the shares affects the EBITDA of the company. The PBT for the company fell mainly due to the MTM losses on the Quess shareholding.
2. In this quarter, three companies of the group became profitable; Thomas Cook India Ltd, SOTC and Private Safaris East Africa. These became profitable after a gap of seven quarters.
3. The company shall convert 132 mn balance of preference shares in the next quarter which will increase Fairfax’s holding by 1.7%.
4. The cash on the balance sheet as of March end is Rs 639 cr. The overall debt position of the company was 455.8 cr from which short term debt was 326.8 cr.
5. The forex business had recoveries in its various lines within the segment. Retail recovered during the quarter 68%, corporate at 35% and airport business at 26% from pre-pandemic levels.
6. International holidaying is facing external challenges with no visa slots available in some long haul destinations.
7. The number of active corporates of the company in the corporate business has moved up 50% month-on-month.
8. The air to non-air ratio has been improving for the company with currently 12% from non-air. The management expects this to go to 15% for the year which will improve the yields on those businesses.
9. The MICE business has seen a slow start but the management is very confident about the recovery of the government business in MICE and has also acquired some large government contracts.
10. The current recovery in the MICE business is 9% and the management expects the recovery to be at 15% by the end of the year.
11. The company continues to face supply side constraints in terms of both input costs and availability.
12. The management expects Q1FY23 to be about 55% to 60% of pre-pandemic levels for overall company level.
13. The company’s business in the US – Allied TPro has started to see strong bookings flowing.

Click here to Subscribe
on WhatsApp
www.smartsyncservices.com
14. DEI has continued to remain profitable and has seen 95% recovery in entire middle east market. It has seen 55% recovery in Hong Kong, Singapore and Malaysian markets.
15. During the year, Starling launched three new destinations; Aleppy, Gir and Tiruvannamalai. This grows its portfolio to 36 resorts.
16. In the last two to three years, Starling has given up loss-making locations and gone more into profitable locations.
17. Sterling also expanded its portfolio by going into a management contract model which reduced their exposure in terms of capex and opex.
18. The company has also built a non-member vertical for its resorts to ramp up revenue. 19. DMS was the only unit in the Thomas Cook group which was profitable for the full year. It has
order bookings from huge amount of tourists in Dubai from western and eastern Europe. 20. The company has achieved 45% - 50% reduction in its domestic fixed and operating costs thus
improving margins. 21. Sterling’s current share of non-members and members is 55:45 for room occupancy. 22. The management expects Sterling’s EBITDA margin to go up from here towards the 30% mark as
it is growing its non-member vertical at a fast and sustainable pace.
Analyst’s View:
Thomas Cook is the biggest travel company in India in terms of reach. They have been innovators in the sector for more than a century now. The company continues to see steady recovery with Q4 seeing most of the holiday and travel segments bounce back. Thomas Cook has taken encouraging actions like opening new partnerships for DEI and many others. The management expects to see revenues levels to reach 55-60% of pre-pandemic levels in Q1FY23. It remains to be seen how long it will take for all operating segments to normalize for the travel industry and how the company can adapt and come up with new products and services to capture the pent-up demand. Nonetheless, given the company’s resilient balance sheet and the management’s focus on improving the internals of the company and focusing on new avenues for the industry, Thomas Cook seems to be a resilient travel industry stock in an industry plagued with shutdowns and bankruptcies these days.

Click here to Subscribe
on WhatsApp
www.smartsyncservices.com
Wonderla Holidays
Financial Results & Highlights Brief Company Introduction
Wonderla Holidays Limited operates amusement parks and resorts in India. It operates through Amusement Parks and Resort, and Others segments. The company's amusement parks offer land, water, high thrill, and kid rides. It operates three amusement parks in Kochi, Bengaluru, and Hyderabad; and the Wonderla resort in Bengaluru under the brand name Wonderla. The company operates Wonder Kitchen, a food takeaway outlet. It also sells merchandise, cooked food, packed foods, etc. The company was incorporated in 2002 and is based in Bengaluru, India.
Consolidated Financials (In Crs)
Q4FY22 Q4FY21 YoY % Q3FY22 QoQ % FY22 FY21 YoY%
Sales 59 34 73.5% 50 18% 133 44 202.2%
PBT 11 -6 283% 6 83.3% -12 -66 81.8%
PAT 8 -4 300% 4 100% -9 -49 81.6%
Detailed Results
1. The company revenues were up to Rs 59 Cr for the 1st time since the start of COVID-19. The company was PAT positive for the 2nd time since the pandemic started with PAT of Rs 8 Cr.
2. Hyderabad & Bangalore parks were operational throughout Q3 while Kochi park was operational for 80 days in the quarter.
3. Total footfall in Q4 was at 4.94 lacs while in FY22 footfall was at 10.57 Lacs.
4. March month recorded highest ever footfall since inception at 3.02 lacs.
5. FY22 Revenue metrics:- ARPU – 1146, ATP – 849, SPH – 297
6. Various marketing strategies like “women only world” and “girl power rocks” were received positively by the target audience.
Investors Conference Call Highlights
1. Many different unique events were done last quarter to increase footfalls in innovative ways.
2. Women’s day was a record breaking highlight day, with highest footfall ever in the 22 years history of the company at 32,000 visitors in a single day.
3. All three parks reported their highest ever footfalls in the month of March since their opening.
4. If the company keeps on adding new rides in its parks, it also removes the old rides. The new rides added by the company are much different than the ones added back in 2002 or 2003 thus resulting in a different experience.
5. Currently the management believes that the company has enough rides, so there is no plan right now to add rides.

Click here to Subscribe
on WhatsApp
www.smartsyncservices.com
6. The Chennai Park capex is currently on hold. The company has invested 100 crore INR in it till now in the land. The company plans to do INR 350 to 400 crore more capex which is pending due to an outstanding issue with taxation there.
7. The Odissa park is a smaller project with less than 100 crore. The company plans to get it off the ground in this financial year itself.
8. The company plans to have a light version of its park in Bhubaneshwar as it a less than 100 crore investment. The company also plans to have a lower-than-average ticket pricing there.
9. The problem the company is facing in Tamil Nadu is that there is an extra 10% tax on every ticket that is sold in every amusement park or movie theatre. This is apart from the current 18% GST.
10. The capex planed by the company will be funded through internal accruals and some debt. Although this year the company is not planning to take any debt.
11. The construction period for the Odissa park is two years with a CAPEX plan of INR 120 crore.
12. Currently about 30% bookings happen online, which was only 10% pre-COVID.
13. The company is keen on doing a project in Goa if Chennai project gets delayed. The company has also been invited by the Government of Goa.
14. In the current size, each park of the company can handle only 1.2 million to 1.5 million visitors a year.
15. The company has goal of reaching 60:40 ticket to non-ticket revenue. Currently it is 75:25 for the company.
16. The management states that for a much larger accommodation of 3 million visitors a year, the parks will have to be much bigger, and people will have to be willing to pay for that kind of a ticket.
17. In the past FY, the company has already increased prices three times and plans to increase prices one more time on June 1.
Analyst’s View
Wonderla Holidays is India’s leading amusement park operator. This business has strong entry barriers because of high Capex and long gestation cycle. Wonderla has been able to manage its operations well over the years and create a niche space for itself. Q4 saw great footfalls for the company with over Rs 50 Cr in revenues and turning PAT positive for the 2nd time since COVID-19. The management remains confident of the company’s brand value and states that the company can improve its EBITDA margins even further from the current level of 29% when footfalls rise. The company is also looking at revenue-sharing opportunities with other parks and is not keen on buying them out fully. It is also keen on looking at opportunities in Goa now that the Chennai plans have been put on hold. It remains to be seen how much time it will take for normalcy to come back in their business, how will the company be able to capitalize on its current momentum, and how will it be able to weather through the incoming future waves of COVID. However, Wonderla has the resilience of the balance sheet to survive through these tough times and the potential to positively surprise once all the parks are opened and the footfall comes to pre-COVID level.