Q3FY21 - Smart Sync Services
174
-
Upload
khangminh22 -
Category
Documents
-
view
1 -
download
0
Transcript of Q3FY21 - Smart Sync Services

www.smartsyncservices.com Page | 2
Click here to Subscribe
on WhatsApp
SMART SYNC SERVICES
A-404, Titanium Heights,
Corporate Road, Makarba,
Ahmedabad, Gujarat - 380015
Who We Are We are a SEBI Registered (INA000007881) Investment Advisory firm. We passionately believe that the people of our country must know about the importance of financial literacy and financial freedom and we will do everything possible to realize this vision.
We at Smart Sync Investment Advisory Services (SSIAS) are guided by the words of wisdom from the father of Investment Management, Benjamin Graham —
“An investment operation is one which, upon thorough analysis, promises safety of principal and a satisfactory return.”

www.smartsyncservices.com Page | 3
Click here to Subscribe
on WhatsApp
Contents
Who We Are ..................................................................................................................... 2
ASSET MANAGEMENT ...................................................................................................... 6
HDFC AMC ........................................................................................................................................... 6
Nippon Life India AM .......................................................................................................................... 9
AUTO & AUTO ANCILLARIES............................................................................................ 12
Bajaj Auto .......................................................................................................................................... 12
Balkrishna Industries ......................................................................................................................... 16
Eicher Motors .................................................................................................................................... 19
Minda Industries ............................................................................................................................... 22
BANKS ............................................................................................................................ 26
Bandhan Bank ................................................................................................................................... 26
HDFC Bank ......................................................................................................................................... 29
Kotak Mahindra Bank ........................................................................................................................ 32
CEMENT ......................................................................................................................... 35
Heidelberg Cement ........................................................................................................................... 35
Ultratech Cement .............................................................................................................................. 38
CHEMICALS .................................................................................................................... 41
Apcotex ............................................................................................................................................. 41
Galaxy Surfactants ............................................................................................................................ 44
PI Industries ...................................................................................................................................... 47
Sudarshan Chemicals ........................................................................................................................ 50
CONSTRUCTION .............................................................................................................. 52
KNR Constructions ............................................................................................................................ 52
CONSUMER ELECTRONICS ............................................................................................... 55
Amber Enterprises ............................................................................................................................ 55
Blue Star ............................................................................................................................................ 58
Dixon Technologies ........................................................................................................................... 61
EXCHANGE ..................................................................................................................... 64
BSE .................................................................................................................................................... 64
Indian Energy Exchange .................................................................................................................... 67
FMCG ............................................................................................................................. 70

www.smartsyncservices.com Page | 4
Click here to Subscribe
on WhatsApp
CCL Products ..................................................................................................................................... 70
ITC ..................................................................................................................................................... 73
Jyothy Labs ........................................................................................................................................ 75
KRBL .................................................................................................................................................. 77
Marico ............................................................................................................................................... 79
Tata Consumer Products ................................................................................................................... 83
VBL .................................................................................................................................................... 86
HEALTHCARE & PHARMA ................................................................................................ 89
Cadila ................................................................................................................................................. 89
Cupid ................................................................................................................................................. 92
Divi’s Laboratories............................................................................................................................. 95
Hester Biosciences ............................................................................................................................ 98
Suven Pharma ................................................................................................................................. 101
Syngene ........................................................................................................................................... 105
INSURANCE .................................................................................................................. 108
HDFC Life ......................................................................................................................................... 108
SBI Life ............................................................................................................................................. 111
LIFESTYLE PRODUCTS .................................................................................................... 114
Vaibhav Global ................................................................................................................................ 114
VIP Industries .................................................................................................................................. 117
MICROFINANCE & SMALL FINANCE BANKS ................................................................... 120
AU Small Finance Bank .................................................................................................................... 120
Credit Access Grameen ................................................................................................................... 123
Ujjivan Small Finance Bank ............................................................................................................. 127
NBFC ............................................................................................................................ 131
AAVAS Financiers ............................................................................................................................ 131
Bajaj Finance ................................................................................................................................... 134
Manappuram Finance ..................................................................................................................... 137
Piramal Enterprises ......................................................................................................................... 140
NETWORK & COMMUNICATIONS ................................................................................. 144
Sterlite Technologies ....................................................................................................................... 144
OTHERS ........................................................................................................................ 147
CRISIL ............................................................................................................................................... 147
Mayur Uniquoters ........................................................................................................................... 149
www.smartsyncservices.com Page | 5
Click here to Subscribe
on WhatsApp
TECHNOLOGY ............................................................................................................... 152
Intellect Design Arena ..................................................................................................................... 152
L&T Infotech .................................................................................................................................... 155
Persistent Systems .......................................................................................................................... 159
Ramco Systems ............................................................................................................................... 162
Tata Elxsi ......................................................................................................................................... 165
TRAVEL & HOSPITALITY ................................................................................................ 168
MHRIL .............................................................................................................................................. 168
Thomas Cook India .......................................................................................................................... 171
Wonderla Holidays .......................................................................................................................... 173

www.smartsyncservices.com Page | 6
Click here to Subscribe
on WhatsApp
ASSET MANAGEMENT HDFC AMC
Financial Results & Highlights
Brief Company Introduction
HDFC Asset Management Company Limited (HDFC AMC) is Investment Manager to HDFC Mutual Fund,
the largest mutual fund in the country. HDFC AMC has a diversified asset class mix across Equity and
Fixed Income/Others. It also has a countrywide network of branches along with a diversified
distribution network comprising Banks, Independent Financial Advisors and National Distributors.
Consolidated Financials (In Crs)
Q3FY21 Q3FY20 YoY % Q2FY21 QoQ % 9MFY21 9MFY20 YoY%
Sales 595 592 0.51% 570 4.39% 1656 1694 -2.24%
PBT 483 466 3.65% 463 4.32% 1326 1323 0.23%
PAT 369 353 4.53% 338 9.17% 1010 1013 -0.30%
Detailed Results
1. Revenues for the quarter were up 0.5% YoY only at Rs 592 Cr.
2. PBT in Q3 is up 3.6% YoY and PAT is up 4.5% YoY.
3. QAAUM for the company was at Rs 3895 billion which was up 2% YoY. Closing AUM was up 10%
YoY at Rs 4068 Cr. Market share in both was at 13.1%.
4. The breakup of closing AUM for HDFC by segment is as follows:
1. Equity: 40.4% vs industry average of 39.2%
2. Debt: 38.4% vs industry average of 35.3%
3. Liquid: 19.2% vs industry average of 14.4%
4. Others: 2% vs industry average of 11%
5. Market share in Actively Managed Equity Oriented AUM for HDFC is 13.6%. Actively managed
QAAUM saw a fall of 10% YoY while Closing AUM fell 5% YoY.
6. Market share in Debt QAAUM was at 13.8% and QAAUM & Closing AUM have risen 34% and 40%
YoY respectively.
7. Market share in liquid funds was at 17.2% by QAAUM which was down 17% YoY. Closing AUM for
liquid funds was flat YoY.
8. The number of individual accounts fell 4% YoY while individual MAAUM fell 2% YoY.
www.smartsyncservices.com Page | 7
Click here to Subscribe
on WhatsApp
9. The company also maintained a long tenure SIP book with 83% of order book having flows over 5
years and 72% having flows over 10 years.
10. The distribution of total AUM across different channels saw the following changes:
1. Direct: 49.2% vs 41.7% a year ago
2. HDFC Bank: 5.3% vs 6.5% a year ago
3. Banks: 9.6% vs 12.2% a year ago
4. MFDs: 24.4% vs 26.4% a year ago
5. National Distributors: 16.8% vs 19.8% a year ago.
11. The company also maintained its position as 2ndbiggest player in B30 markets with an 11.8%
market share. The company has a total of 224 branches with 146 in B30 cities and 65,000+
empanelled distribution partners. The company now has customers in 98% of pin codes in India
12. The company has seen 84% of transactions in 9MFY21 by electronic means as compared to 69%
in FY20.
Investor Conference Call Highlights
1. Equity-oriented funds saw net outflows of INR 440 billion during the quarter, while debt-oriented
funds from net inflows of INR 1,518 billion. Liquid funds saw net new flows of INR 131 billion
during the quarter ended December 2020 for the MF industry.
2. Individual investors contributed to 52% of the industry’s total MAAUM and 91% of the equity
MAAUM.
3. The management admits that competing with SBI MF is difficult in B30 regions due to the breadth
of the reach of SBI itself which is a captive distributor for SBI MF. But HDFC AMC is content at the
moment on maintaining the lead over the 3rd ranked player and will continue to focus on brand
building in B30 regions.
4. The management attributes the general industry outflows in equity funds in Dec to risk aversion
which was evident from the fact that bank deposits grew 10% YoY despite interest rates being at
historically low levels. This has also led to outstanding growth in debt funds in the same period.
5. The management expects this redemption behavior to taper off as the risk appetite of individual
investors comes back to normal.
6. The management firmly believes that increased retail participation indirect equity is not a threat
to mutual funds as the captive market is different in terms of their participation and size.
7. The company is looking to bring in diversification in style when looking for investment managers.
8. Although HDFC Equity Fund and HDFC Balanced Advantage Fund have lagged behind the
benchmark significantly in the recent past, the management has stated that these funds have
shown strong recovery in the last 3 months and should get back to normal levels soon.
9. Debt funds have indeed seen good growth in the past year but if interest rates and liquidity remain
at current levels, debt fund returns will start getting moderated as yield remain down.
www.smartsyncservices.com Page | 8
Click here to Subscribe
on WhatsApp
10. In SIPs, the predominant segment is equity with a very small % going to the non-equity segment.
11. The company saw cost savings of Rs 25 Cr in 9M most of which was from lockdown and cost savings
initiatives taken by the company.
12. The management has assured that cost control shall be calibrated according to the business
environment and if the company sees a chance for business growth it will be ready to spend
money to do it.
13. The channels with the most influence in B30 regions are banks and IFAs. But the digital channel is
also growing fast with widespread internet coverage and thus the dependence on specific
channels is coming down.
14. The company is indeed looking at IFAs & MFD as one of the mainstays of the B30 regions. Around
41.2% of AUM in B30 comes from IFAs. The company also saw good participation of over 6500
IFAs at the recent launch of its HDFC Dividend Yield Fund which collected Rs 1500 Cr at its debut.
15. The other income growth was mainly driven by the fact that the company invested a large part of
its investment book in debt funds. But the management admits that this growth is clearly not
sustainable and will taper off going forward.
16. In Q3’s board meet, the management has gotten another fund launch approved which is to be
registered for approval with the regulator in the next month.
17. The company has a pipeline of 3 new funds for launch.
18. The management states that since the participation in debt funds is more from HNIs, family
offices, institutional investors, etc, these investors tend to invest more via the direct channel
which may have led to the growth of the direct channel in the past 2 quarters. HDFC AMC has not
made any conscious effort to grow the direct channel by themselves.
19. The company has not made any change in TER for debt funds in the last 2 quarters.
20. New fund collections should not be taken as a measure of the fund’s quality as these funds are
open-ended and will need some time to deliver performance.
Analyst’s View
HDFC AMC is the leading mutual fund house in India. It is the market leader in actively managed equity
funds space and a trusted mutual fund provider for individual investors which is evident in its high
individual account numbers and AUM. The company had a muted quarter due to the continuing fall in
Equity AUM and overall outflows for the MF industry. The company has done well to focus on cost
savings and new product launches and was able to launch the HDFC Dividend Yield Fund with good
reception and collections of Rs 1500 Cr. The management has admitted that some of the equity funds
had fallen behind the benchmark but they have assured that the recovery in these funds has already
started. It remains to be seen how the economic situation post-COVID-19 will unravel and how it will
continue to affect the investment sentiments in India. However, given the company’s strong past track
record and its leadership position in the industry, the medium and long-term outlook for HDFC AMC
remains intact.
www.smartsyncservices.com Page | 9
Click here to Subscribe
on WhatsApp
Nippon Life India AM
Financial Results & Highlights
Brief Company Introduction
Nippon Life India Asset Management Limited (NAM India) is the asset manager of Nippon India Mutual
Fund (NIMF). Nippon Life Insurance Company are the promoters of NAM India and currently hold 75
of its total issued and paid-up equity share capital while Reliance Capital holds 0.93% of shares in the
company. Equity Shares of NAM India are listed on BSE Limited and National Stock Exchange of India
Limited.
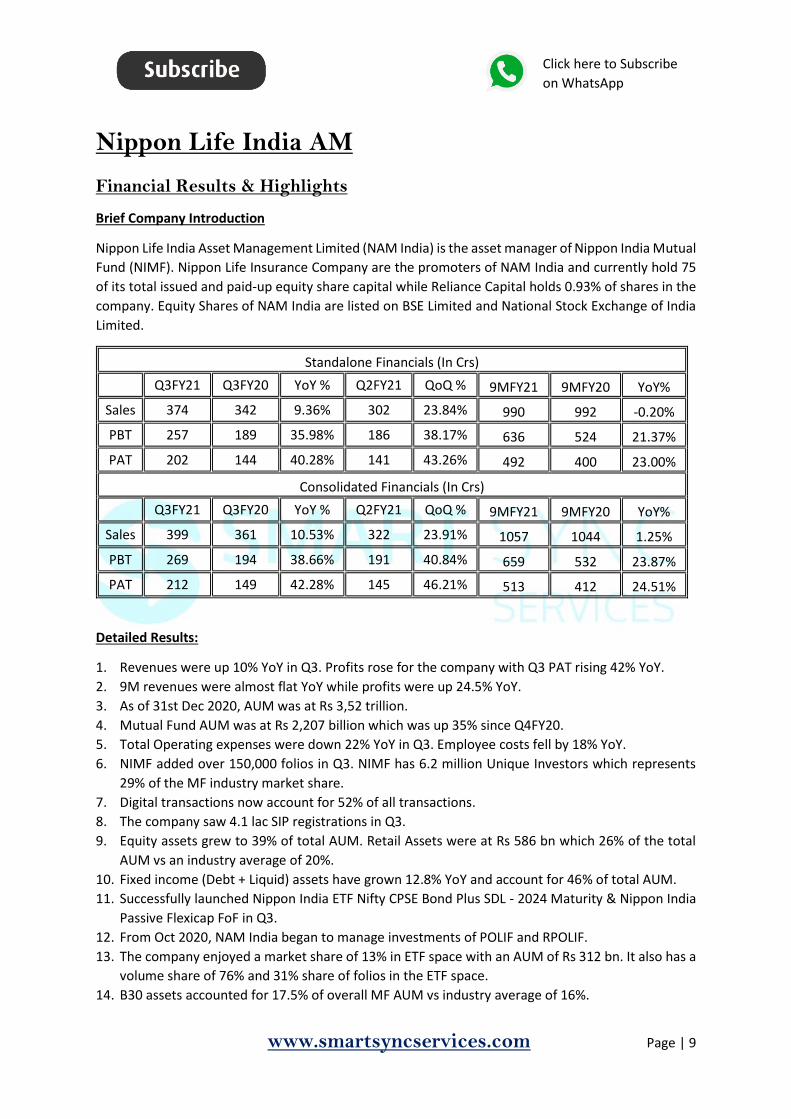
Standalone Financials (In Crs)
Q3FY21 Q3FY20 YoY % Q2FY21 QoQ % 9MFY21 9MFY20 YoY%
Sales 374 342 9.36% 302 23.84% 990 992 -0.20%
PBT 257 189 35.98% 186 38.17% 636 524 21.37%
PAT 202 144 40.28% 141 43.26% 492 400 23.00%
Consolidated Financials (In Crs)
Q3FY21 Q3FY20 YoY % Q2FY21 QoQ % 9MFY21 9MFY20 YoY%
Sales 399 361 10.53% 322 23.91% 1057 1044 1.25%
PBT 269 194 38.66% 191 40.84% 659 532 23.87%
PAT 212 149 42.28% 145 46.21% 513 412 24.51%
Detailed Results:
1. Revenues were up 10% YoY in Q3. Profits rose for the company with Q3 PAT rising 42% YoY.
2. 9M revenues were almost flat YoY while profits were up 24.5% YoY.
3. As of 31st Dec 2020, AUM was at Rs 3,52 trillion.
4. Mutual Fund AUM was at Rs 2,207 billion which was up 35% since Q4FY20.
5. Total Operating expenses were down 22% YoY in Q3. Employee costs fell by 18% YoY.
6. NIMF added over 150,000 folios in Q3. NIMF has 6.2 million Unique Investors which represents
29% of the MF industry market share.
7. Digital transactions now account for 52% of all transactions.
8. The company saw 4.1 lac SIP registrations in Q3.
9. Equity assets grew to 39% of total AUM. Retail Assets were at Rs 586 bn which 26% of the total
AUM vs an industry average of 20%.
10. Fixed income (Debt + Liquid) assets have grown 12.8% YoY and account for 46% of total AUM.
11. Successfully launched Nippon India ETF Nifty CPSE Bond Plus SDL - 2024 Maturity & Nippon India
Passive Flexicap FoF in Q3.
12. From Oct 2020, NAM India began to manage investments of POLIF and RPOLIF.
13. The company enjoyed a market share of 13% in ETF space with an AUM of Rs 312 bn. It also has a
volume share of 76% and 31% share of folios in the ETF space.
14. B30 assets accounted for 17.5% of overall MF AUM vs industry average of 16%.
www.smartsyncservices.com Page | 10
Click here to Subscribe
on WhatsApp
15. The overall distribution mix was 55% direct and 45% distributed assets. In distributed assets, Banks
were at 25%, National Distributors were at 20% and IFAs were at 55%.
16. Individual AUM accounted for 82% of distributed assets which is 45% of the total MF AUM.
17. The offshore business has an AUM of Rs 102 bn.
18. NIAIF has raised commitments of Rs 35 bn as of Dec ’20.
19. The company announced an interim dividend of Rs 3 per share.
Investor Conference Call Details:
1. Nippon India Mutual Fund added 233,000 SIPs and STP folios.
2. NIMF onboarded 260 institutional investors in 9MFY21.
3. The overall rise in equity AUM was MTM while the debt AUM rose due to net additions majority
of which was from institutional investors.
4. The management doesn’t see any return to pre-covid levels of fixed expenses and has stated that
the current levels are sustainable and can stay on even after the pandemic goes away.
5. The company had SIP collections of Rs 660 Cr in Dec.
6. The management has acknowledged that the company is open to acquisitions in the mutual fund,
AIF, PMS, or strategic fintech space.
7. Overall equity has been lower in Q3 while fixed income has risen somewhat while ETFs have
continued their growth momentum in terms of market share.
8. The increase in other income is from the rise in MTM of the company’s investments into its own
equity & ETF schemes.
9. Although debt investors have been moving from long term to short term funds in the past 6-9
months due to the overall risk-off mood, the management believes that this will start getting
reversed as economic normalcy comes back.
10. The management is crediting the rise in new SIP to digital SIP registration.
11. From an overall yield perspective, equity yields have fallen 15% YoY while debt yields have fallen
due to migration of funds from long term (higher yield) to short term (lower yield).
12. The management admits that there will indeed be outflows since markets are at all-time highs but
in overall small investors are expected to stay invested and the main stickiness in equity is
expected to be from SIPs.
13. The company is indeed working with parent Nippon Life to bring various foreign funds to India and
is exploring areas for collaboration here.
14. Although ETF market share has gone up, the corresponding effect on yield was not enough to
mitigate the fall in yield from other sectors. This is because ETFs are inherently low realization
products.
15. Barring increments, employee costs shall remain the same for the near future.
www.smartsyncservices.com Page | 11
Click here to Subscribe
on WhatsApp
16. The company will not be opening any new branches but will be looking to service more than 1000
cities and towns through its 230+ branches with the hub and spoke model.
17. The management has stated that HNIs are indeed coming back to the company and more than 25
of the top 100 companies in India have restarted their relationship with the company since the
brand change. Thus the company is gaining market share slowly in the MNC space in India.
18. The brand acceptance of the Nippon Life brand is very high among institutional and HNI investors.
19. The company will have 2 new fund managers joining in soon. One will be in debt and the other
will be fixed income.
20. Nippon’s contribution to the offshore fund is at 50% currently.
21. Employee count has indeed gone down due to various office functions getting automated and due
to the company only making new hires to replace old ones going out.
Analyst Views:
Nippon India Life Asset Management is one of the leading asset managers in the country. The company
has done well to bounce back after the rebranding last year. The company saw good performance in
Q3 with profits rising as high as 42% YoY despite sales rising only 10% YoY. The company continues to
have a good hold in the IFA space with this channel being the largest distribution channel for the
company and has seen good participation in its recent NFOs. It is also looking to maintain its growth
momentum in the ETF space and bring in new investors to this asset class. It continues to bring in old
customers who are now looking to restart their relationship post the rebranding. It remains to be seen
whether the company will be able to match the pace of growth of its prime competitor HDFC AMC in
this space and whether it will be able to maintain its growth momentum going forward. Nonetheless,
given the company’s market positioning and its competitive advantage in the ETF and AIF space,
Nippon Life India Asset Management is a must-watch stock for every investor interested in the AMC
space.
www.smartsyncservices.com Page | 12
Click here to Subscribe
on WhatsApp
AUTO & AUTO ANCILLARIES Bajaj Auto
Financial Results & Highlights
Brief Company Introduction
Bajaj Auto Ltd has been one of the largest automobile players in India for a long time. They have been
in operations since 1945. Bajaj Auto operates primarily in the entry level and premium segment
motorcycles along with small and large three wheeler commercial vehicles segment. It is the largest
three wheeler manufacturer and third largest motorcycle manufacturer in the world. They are now
present in more than 70 countries around the world. Bajaj Auto also owns Force Motors and is a part
owner of the popular Austrian motorcycle brand KTM.
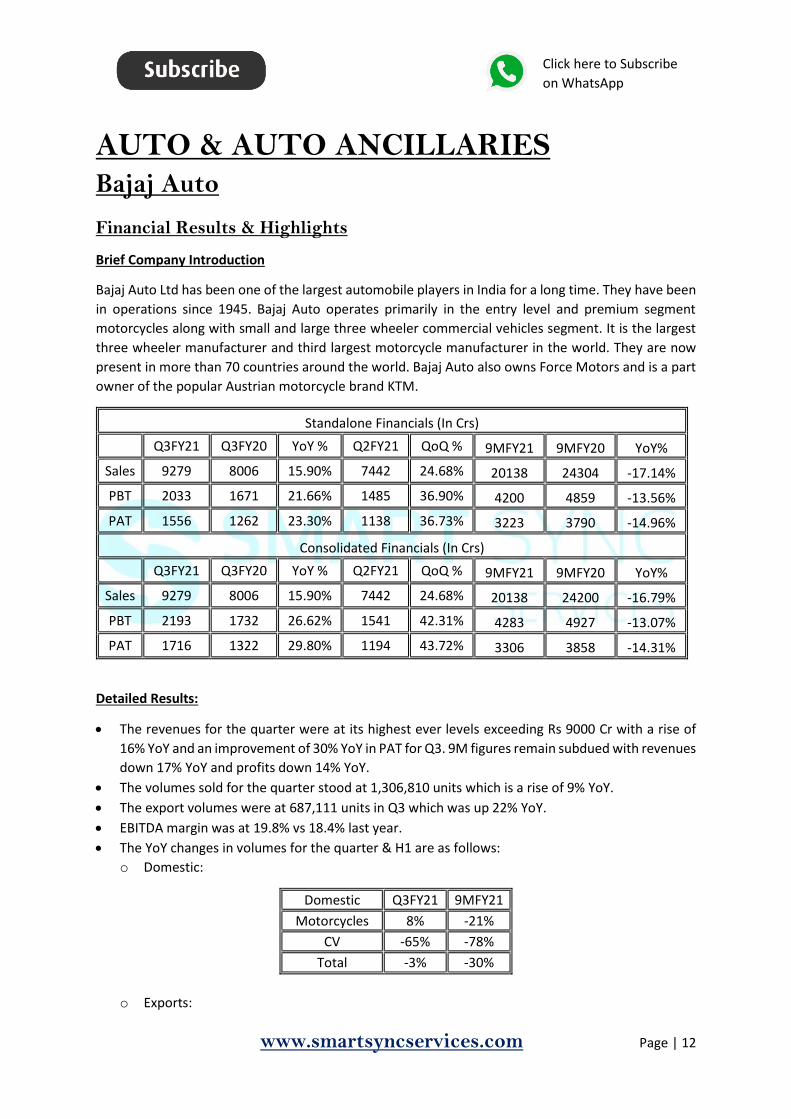
Standalone Financials (In Crs)
Q3FY21 Q3FY20 YoY % Q2FY21 QoQ % 9MFY21 9MFY20 YoY%
Sales 9279 8006 15.90% 7442 24.68% 20138 24304 -17.14%
PBT 2033 1671 21.66% 1485 36.90% 4200 4859 -13.56%
PAT 1556 1262 23.30% 1138 36.73% 3223 3790 -14.96%
Consolidated Financials (In Crs)
Q3FY21 Q3FY20 YoY % Q2FY21 QoQ % 9MFY21 9MFY20 YoY%
Sales 9279 8006 15.90% 7442 24.68% 20138 24200 -16.79%
PBT 2193 1732 26.62% 1541 42.31% 4283 4927 -13.07%
PAT 1716 1322 29.80% 1194 43.72% 3306 3858 -14.31%
Detailed Results:
The revenues for the quarter were at its highest ever levels exceeding Rs 9000 Cr with a rise of
16% YoY and an improvement of 30% YoY in PAT for Q3. 9M figures remain subdued with revenues
down 17% YoY and profits down 14% YoY.
The volumes sold for the quarter stood at 1,306,810 units which is a rise of 9% YoY.
The export volumes were at 687,111 units in Q3 which was up 22% YoY.
EBITDA margin was at 19.8% vs 18.4% last year.
The YoY changes in volumes for the quarter & H1 are as follows:
o Domestic:
Domestic Q3FY21 9MFY21
Motorcycles 8% -21%
CV -65% -78%
Total -3% -30%
o Exports:

www.smartsyncservices.com Page | 13
Click here to Subscribe
on WhatsApp
Exports Q3FY21 9MFY21
Motorcycles 26% -13%
CV 0% -24%
Total 22% -14%
o Total:
Total Q3FY21 9MFY21
Motorcycles 16% -17%
CV -36% -54%
Total 9% -23%
The overall share in the domestic motorcycle market grew close to 18.6% in Q3FY21 from 17.5%
last year.
Pulsar and Boxer had their highest ever sales in a quarter of over 420,200 & 380,000 units
respectively.
Domestic CV volumes continue to remain muted and are dependent on the return of adequate
short distance mobility demand.
Export continues to perform very well, with highest ever export volumes. This is despite the
shortage of shipping containers which
Pulsar125 witnessed strong traction with sales of over 164,000 units; growth of 32% over Q2FY21;
market share for Pulsar125 in its segment has grown to 22.8% for Q3FY21.
The company maintained surplus cash and cash equivalents at Rs 16891 Cr as of 31st Dec 2020.
The company signed an MoU with Maharashtra Govt to set up a new manufacturing facility at
Chakan, Maharashtra for the manufacture of high-end motorcycles and electric vehicles, at a
proposed investment of Rs 650 Cr. Production at the facility is expected to commence from 2023
onwards.
Investor Conference Call Highlights
The management acknowledged that a rebound effect or pent-up demand is returning as
economies emerge from the pandemic.
The export recovery and rise was mainly due to the company’s top 2 position in most export
countries which helped it capture much of the economic recovery in those regions.
South Asia, with the exception of Sri Lanka, is back to pre-COVID levels.
The Philippines is still at 50% of pre-COVID levels.
In three-wheelers, LatAM is back to 50%; ASEAN is struggling at 25%; & for all others in Africa &
Middle East are at or higher than pre-covid levels.
The container availability posed a huge challenge with 15% of order book getting spilt over to the
next month.
Despite the rise of Pulsar 125, the core Pulsar segment of 150+ cc is protected and cannibalization
is well maintained.
www.smartsyncservices.com Page | 14
Click here to Subscribe
on WhatsApp
The company is looking to build the 250+ cc segment around 4 models in Bajaj, KTM and
Husqvarna. KTM and Husqvarna have seen 35% growth in these brands in India.
The company has seen some cannibalization action in 150 Neon due to the Pulsar 125 and the
raising of prices for entry-level 150.
Sales of CVs have recovered only to 40% levels. the cargo three-wheeler segment is outperforming
others and is back to about 70% level of normal times.
The company is expecting high growth in Q4 due to continued momentum and low base in
Q4FY20.
The company did price increases in Jan to offset RM cost rise and MEIS in international markets.
The cost increase in Q3 was 3% of revenues. This was mainly due to rise in prices of steel and
aluminium. The company is not getting any indication from any steel or aluminium manufacturer
that they're going to roll back these prices anytime soon.
The company is running with export stocks slightly behind retail right now.
The main reason for the company’s robust export performance is the competitive positioning
where 85% of exports are to countries where it has more than 25% market share and wide dealer
network with assembly plants and service facility.
KTM added around Rs 160 Cr to consolidated profits. KTM has done very well in e-bicycles which
have boomed since the start of COVID-19.
The management has stated that other expenses which are primarily advertising and promotion
will come back to pre-covid levels as consumer schemes run down.
The company expects to capture the rise of 3 wheelers fast when demand rises because three-
wheeler is almost 100% financed which shall aid in fast sales whenever needed.
There shouldn’t be any noticeable rise greater than 1-2% in employee costs as ramping up
production does not require additional manpower for the company.
The company expects the 3 wheeler industry to show 15-20% growth in FY22 once normalcy
comes back. The company is not in a hurry to launch electric 3 wheelers as it is more focussed on
the development of necessary infrastructure for charging and cost reductions.
The management has stated that the Pulsar 125 experience has inspired the company to push the
industry into better products and premium products in the bottom half of the industry. Although
competition is tough in this segment, the management is confident that Bajaj Auto can compete
on the basis of getting the customer to upgrade to better products and better formats.
The management has stated that given the targeted promotion plans and their intensity, there
shouldn’t be any durable cost savings in other expenses going forward as compared to pre-covid
times.
The company is expected to have a blended tax rate of 23.5%.
The company will be looking to retire the Pulsar 150 Neon as the price increase has been pushing
most customers to Pulsar 125. But the overall market share gain from Pulsar 125 is much greater
than for Pulsar 150 Neon.
Electric start is now 75% of all motorcycles for the company and Bajaj is aiming to bring this
number up to 100%.
Overall price increases were 1% in Jan across all models.
The company will be focussing on comprehensive brand building in the higher segments to be able
to compete with the like of Royal Enfield.
The dollar realization in Q3 was around $20 million.
Overall spare parts revenue was at Rs 990 Cr.
www.smartsyncservices.com Page | 15
Click here to Subscribe
on WhatsApp
The proposed plant at Chakan will be making primarily high-end bikes for KTM, Husqvarna and
Triumph. It will also have some capacity to make electric vehicles but it will not be making the
company’s flagship models like Pulsar.
The company has pulled back on bookings for the electric Chetak as there were a lot of
vulnerabilities in the sourcing from Wuhan and shortage in semiconductors worldwide. The
company will be looking to fix these weaknesses first before looking to go forward with the launch.
The management expects this product to have rolled out in top 24 cities in India by the end of
FY22.
The management has stated that it is planning for 1-2 launches in each quarter in 2021.
Analyst’s View:
Bajaj Auto has been a long performing player in the automobile sector that has established itself as a
dominant player in all the segments that it operates in both in India and abroad. The company has
seen a phenomenal quarter with its highest ever revenues, export volumes and export revenues in
Q3. The company has seen good momentum continue in Pulsar 125 which has managed to capture
23% market share despite being the most expensive bike in the category, all within 6+ months of
launch. The recovery of the 3 wheeler segment on the other hand continues to be slow but Bajaj is
confident of capturing the recovery momentum when it comes. It remains to be seen whether the
recent rise in demand is sustainable and how will the RM costs fare out in the near future.
Nonetheless, given the company’s position in export markets and its strong presence in all market
segments in the two-wheeler market and three-wheeler markets, Bajaj Auto remains a pivotal auto
sector stock to watch out for.

www.smartsyncservices.com Page | 16
Click here to Subscribe
on WhatsApp
Balkrishna Industries
Financial Results & Highlights
Brief Company Introduction
Balkrishna Industries Limited (BKT) is a tire manufacturing company based in Mumbai, India.
Balkrishna Industries manufactures off-highway tires used in specialist segments like mining,
earthmoving, agriculture and gardening in five factories located in Aurangabad, Bhiwadi, Chopanki,
Dombivali and Bhuj. In 2013, it was ranked 41st among the world’s tire makers.
Balkrishna Industries is currently an OEM vendor for heavy equipment manufacturers like JCB, John
Deere and CNH Industrial. The company currently enjoys 2% market share of the global off-the-road
tire segment.
If you are interested to know about the business of BKT in detail, watch this video
Standalone Financials (In Crs)
Q3FY21 Q3FY20 YoY % Q2FY21 QoQ % 9MFY21 9MFY20 YoY%
Sales 1556 1191 30.65% 1597 -2.57% 4115 3608 14.05%
PBT 424 275 54.18% 451 -5.99% 1036 784 32.14%
PAT 322 221 45.70% 339 -5.01% 783 688 13.81%
Consolidated Financials (In Crs)
Q3FY21 Q3FY20 YoY % Q2FY21 QoQ % 9MFY21 9MFY20 YoY%
Sales 1564 1186 31.87% 1598 -2.13% 4141 3624 14.27%
PBT 428 278 54% 452 -5.31% 1052 793 32.66%
PAT 325 224 45% 341 -4.69% 798 695 14.82%
Detailed Results:
1. The revenue for the quarter grew 32% YoY in consolidated terms.
2. PBT was up 54% YoY in standalone and consolidated terms in Q3.
3. Consolidated PAT was up 45% YoY in the quarter.
4. 9M figures were also very good with revenues rising 14% YoY while PBT and PAT rose 33% YoY
and 15% YoY respectively.
5. Sales volumes for the quarter came in at 59,810 tons which were up 26% YoY.
6. Sales volumes for 9M were up 11% YoY which is very good considering the fall in performance in
Q1.
7. The EBITDA margin improved 70 bps YoY to 31.9% in Q3.
8. The company announced a third interim dividend for FY21 of Rs 5 per share.
9. Net forex gain for Q3 was at Rs 15 Cr vs a gain of Rs 6 Cr a year ago.
10. Sales breakup in 9M for the company is:
a. Agri-64%, OTR-33%, Others-3%.
b. Replacement-71%, OEM-25%, Others-4%
www.smartsyncservices.com Page | 17
Click here to Subscribe
on WhatsApp
c. EU-49%, Americas-15%, India-23%, RoW-13%
11. The company remains debt-free with current cash holding at Rs 1423 Cr as of 31st Dec 2020.
12. The previously guided CapEx programs are on track for the company.
13. BKT announced new capex programs of Rs 1900 Cr which included:
a. Debottlenecking and Brownfield expansion at Bhuj; Expansion to add ~50,000 MTPA
capacity; expected completion by H2FY23; Capex cost of up to Rs 800 Cr.
b. Expanding carbon black capacity to 200,000 MTPA including 30,000 MTPA of high value
advanced carbon material and Power Plant; Capex cost of up to Rs 650 Cr; expected
completion by H1FY23.
c. Modernization, automation, and technology upgradation of existing facilities; Capex cost
of up to Rs. 450cr; expected to be completed by H1FY23.
Investor Conference Call Highlights
1. 9M volumes were at 159,310 MT. the management has increased its volumes guidance for FY21
to 215,000 to 220,000 MT.
2. The new facility for 57-inch ultra large giant all-steel radial tire plant of 5,000 MTPA has been
completed.
3. The carbon black plant has been running at full capacity as third-party sales have also
commenced and there is strong acceptance for the product.
4. The management has stated that BKT has planned the new capex so that it doesn’t face any
capacity constraints from FY23 onwards.
5. Production is expected to commence in the greenfield tire plant at Waluj from Q1FY22.
6. The management expects payback in 5-6 years on the new capex in the carbon black plant.
7. The management has stated that the decision to expand carbon black capacity was taken due
to good demand in the market for it and possible future requirements.
8. The modernization project will mainly result in manpower reduction and automation of many
processes. The impact should not only be reflected in the margin; it will also result in an
increase in product quality according to the management.
9. The management has stated that because of the market moving towards radialization,
equipment upgradation is necessary. It has also clarified that the automation will only be in
material handling and movement processes.
10. Market share in USA and EU are between 5-6% for BKT.
11. Around 25-30% of carbon black capacity is available for third party sales.
12. The margin on carbon black sales is at 15-16% which is the industry norm.
13. The management has stated that since 75-80% of carbon black is for internal consumption, it
should not have any adverse impact on the overall margin for BKT.
14. Maintenance capex will vary from Rs 100-200 Cr per year.
15. The management has clarified that the Bhuj plant expansion is high because it will also have
the automation and modernization aspect included in it.
16. The management has reassured that the expansion of the carbon black plant is not at the
expense of the tire business and the tire business will remain core for BKT. The carbon black
expansion is mainly for pre-empting expansion in tire capacity in the future even after 5-7 years.
It has also stated that carbon black capacity expansion cannot be done in small increments and
that it should yield certain economies of scale and thus the decision to expand it in a large
increment was taken.
www.smartsyncservices.com Page | 18
Click here to Subscribe
on WhatsApp
17. The rated capacity and achievable capacity for carbon black plant are different as the plant is
required to be shut down from time to time as per the norms of the pollution boards.
18. The management has stated that mostly the advanced variant of carbon black with a capacity
of 30,000 Mt will be for third party sales. The margin in this variant should be 4-5% higher than
the lower quality one.
19. The modernization requirement is necessary as some of the plants like the one in Bhiwadi was
formed in 2001-03. The management has stated that the requirement for modernization
should come up every 7-10 years.
20. Currently carbon black sales account for less than 2% of revenues.
21. The company has not seen any opportunities from announced PLI schemes by the Govt of India.
22. After abandoning the plan for an overseas plant, the company is looking to make its distributors
stronger and getting them to stock more material to keep business close to end customers.
23. The company developed small lots for testing which grade of carbon black would be well
received and after testing and feedback it concluded to make the advanced carbon black which
is basically mid-category that sits above the grade used to make tires and plastic.
24. Starting Q4, the company is also going to take some price increase of 2-3% to negate these
enhanced costs and maintain EBITDA margins near 28-30%.
25. The management has also emphasized that the upgrades are also necessary to be able to
compete fairly with international giants so that BKt can continue to compete effectively and
doesn’t get left behind by the market leaders.
26. The usage of the advanced carbon black will be mainly in print and ink grades and certain high-
quality plastic grades.
27. Depending on the demand situation, the new capacity can be ramped up to full utilization
within 1 quarter after completion.
28. Around half of the new capacity will come in H2FY23 and the rest will come in FY24.
29. Capex done in FY21 to date is at Rs 600 Cr and around Rs 100-120 Cr is expected in Q4. This is
including maintenance capex.
30. The company has around 2 months of raw materials inventory at the moment. RM prices have
gone up 4-5% in last 2 quarters. BKT is looking to pass on this rise in Q4 and the next quarter.
Analyst’s View:
BKT has been a rising player in the off-road tires business for years now. The company witnessed a
great Q3 with continued momentum from Q2. It has also hiked its volume guidance for FY21 due to a
continuous rise in sales. BKT has also announced a capex plan for Rs 1900 Cr for expansion of the Bhuj
plant, expansion of carbon black capacity, and modernization of existing plants. These projects are
expected to be completed by H2FY23 and are necessary to maintain momentum and stay competitive
according to management. It remains to be seen whether there are any other RM shocks to come for
BKT and how the company’s plans for the new capex pans out. Nonetheless, given the company’s
sustained margin performance, its resilient market share in a slow global market, and the rapid rise of
the company in India, Balkrishna Industries is a good tire stock to watch out for.
www.smartsyncservices.com Page | 19
Click here to Subscribe
on WhatsApp
Eicher Motors
Financial Results & Highlights
Brief Company Introduction
Eicher Motors Limited is an Indian manufacturer of motorcycles and commercial vehicles. Eicher is the
parent company of Royal Enfield, a manufacturer of middleweight motorcycles. In addition to
motorcycles, Eicher has a joint venture with Sweden’s AB Volvo - Volvo Eicher Commercial Vehicles
Limited (VECV).
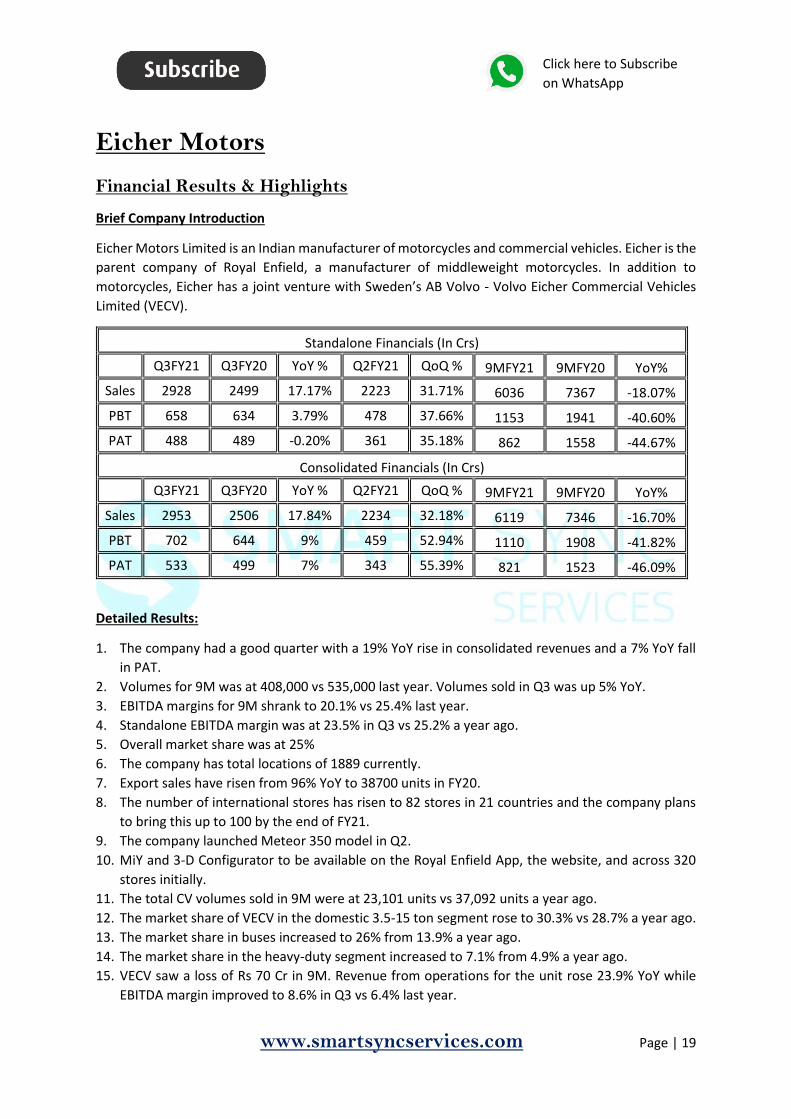
Standalone Financials (In Crs)
Q3FY21 Q3FY20 YoY % Q2FY21 QoQ % 9MFY21 9MFY20 YoY%
Sales 2928 2499 17.17% 2223 31.71% 6036 7367 -18.07%
PBT 658 634 3.79% 478 37.66% 1153 1941 -40.60%
PAT 488 489 -0.20% 361 35.18% 862 1558 -44.67%
Consolidated Financials (In Crs)
Q3FY21 Q3FY20 YoY % Q2FY21 QoQ % 9MFY21 9MFY20 YoY%
Sales 2953 2506 17.84% 2234 32.18% 6119 7346 -16.70%
PBT 702 644 9% 459 52.94% 1110 1908 -41.82%
PAT 533 499 7% 343 55.39% 821 1523 -46.09%
Detailed Results:
1. The company had a good quarter with a 19% YoY rise in consolidated revenues and a 7% YoY fall
in PAT.
2. Volumes for 9M was at 408,000 vs 535,000 last year. Volumes sold in Q3 was up 5% YoY.
3. EBITDA margins for 9M shrank to 20.1% vs 25.4% last year.
4. Standalone EBITDA margin was at 23.5% in Q3 vs 25.2% a year ago.
5. Overall market share was at 25%
6. The company has total locations of 1889 currently.
7. Export sales have risen from 96% YoY to 38700 units in FY20.
8. The number of international stores has risen to 82 stores in 21 countries and the company plans
to bring this up to 100 by the end of FY21.
9. The company launched Meteor 350 model in Q2.
10. MiY and 3-D Configurator to be available on the Royal Enfield App, the website, and across 320
stores initially.
11. The total CV volumes sold in 9M were at 23,101 units vs 37,092 units a year ago.
12. The market share of VECV in the domestic 3.5-15 ton segment rose to 30.3% vs 28.7% a year ago.
13. The market share in buses increased to 26% from 13.9% a year ago.
14. The market share in the heavy-duty segment increased to 7.1% from 4.9% a year ago.
15. VECV saw a loss of Rs 70 Cr in 9M. Revenue from operations for the unit rose 23.9% YoY while
EBITDA margin improved to 8.6% in Q3 vs 6.4% last year.
www.smartsyncservices.com Page | 20
Click here to Subscribe
on WhatsApp
16. The bus segment continues to remain sluggish with a drop of 83% in Q3 as schools remain mostly
closed and low inter-state movement of buses.
17. While the overall CV industry (3.5T GVW and above) declined by 52% YTD till December 2020,
VECV sales declined by 38% for the same period.
18. The company launched the Meteor 350, an easy and accessible cruiser in India and across Europe,
Thailand, and Australia in Q3.
19. It also became the first Indian auto company to open up a store in Japan.
20. It also launched the Classic 350 in two new color-ways along with alloy wheels and tubeless tires.
21. In Q3, 13 new exclusive stores were opened with a focus on Latin American and ASEAN markets –
2 in Thailand, 4 in Argentina, and 3 in Columbia.
Investor Conference Call Details:
1. The company posted its highest ever quarterly revenue from operations at Rs 2828 Cr in Q3.
2. Motorcycles volumes sold in Q3 were at 199,000 units. Exports were up 30% YoY at 10,800 units.
3. The company increased the production run rate to 75,000 in December.
4. It has hiked prices by 3-5% in the last few months.
5. Demand remains strong with the supply of key components like electronics remaining the main
concern.
6. RE added 43 large stores in India and 129 studio stores during the quarter. It has now reached
1889 touchpoints across 1,500 cities in India.
7. The company got very good feedback on the Meteor mainly on the comfort, riding quality,
refined engine, and the new tripper navigation pod. The booking rate of Meteor continues to
trend at a much higher level than Thunderbird.
8. The company also launched the Make it Yours MiY tool for Meteor which enhanced its market
response. On the Meteor alone, the app offers as many as 500,000 permutation combinations.
9. Currently the Twins, Meteor and Classic are available on the MiY app.
10. Since the launch of the RE app in August, the daily users of the RE app have now tripled and the
amount of time that the customer is spending on our app is doubled since Q1.
11. The Interceptor was awarded MCN's Best Retro Bike of the Year, the second time in a row. It also
won the Bike Sales Year of the award in Australia.
12. The total sales of trucks and buses stood at 12,800 units, which is up 3.3%, which is better than
the 7% decline in Q3.
13. VECV inaugurated its all new fully digital and state-of-the-art manufacturing unit in Bhopal. This
unit will be delivering the entire light and medium-duty range of Pro 2000 series, largely replacing
the Pro 1000 series in India as VECV’s mainstay. The BSVI units from here will be sold in 40
countries.
14. Every truck sold since August is 100% connected with data coming from those trucks based on
the customers' acceptance. This is used for advanced diagnostics for better customer response
by predicting customers' problems even before some of them happen.
15. VECV added 41 touch points in the 9M period.
16. The management cites the introduction of good products like the Meteor, the branch expansion,
and the big focus on digital to the consistently high demand for RE.
17. Cancellations have only been less than 5% showcasing good resilient demand for RE.
18. The management has clarified that the MiY app is mainly used for customization of accessories
and it does not include critical components like engine or gearbox. Thus the cycle time for a
www.smartsyncservices.com Page | 21
Click here to Subscribe
on WhatsApp
customized version is no more than 1-2% more than normal. Thus it is also not having any adverse
effect on overall production capacity.
19. ASP has gone up mainly due to improving product mix and increase in prices.
20. The Meteor is positioned differently in different regions. As it does well in the 100-110 km/hr
speed, it is positioned as a highway bike in India. In western markets, this speed is too low for
highway bikes so it is positioned as a city plus bike there. IN ASEAN and LatAM it is positioned as
an upgrade bike.
21. The Meteor represents a big export opportunity for RE as it has fuel injection and is Euro-6 and
BSVI compliant.
22. In the long run, the management’s target for export contribution to total revenues is at 20%.
23. Around 35-40% of bookings are for Meteor with wait times as long as 4 months.
24. The management has stated that it has learned a lot from the launch and digital engagement of
Meteor which can be applied in the future on other product launches.
25. The company is not seeing any cannibalization in sales of other models from the Meteor right
now.
26. The electronic component shortage is not a big concern for management and it is only expected
to result in a slight delay in production.
27. The RM cost rise impact on gross margin was around 80-100 bps. The management expects this
cost inflation to continue as so it has taken the price increase. It has also stated that in the future,
all the cost increases will be passed on to customers.
28. The management has admitted that there is some room for increasing assembly capacity by
debottlenecking without significant capex.
29. The MiY app is mainly simplifying the process of accessorizing the bike which is very prevalent
since the bike is seen more as a discretionary purchase representing a personality statement for
the customer rather than a necessary purchase for an essential activity like commute like other
2 wheelers in India.
30. Top 20 cities contributed to 27-30% of the business.
31. Average accessories revenue per vehicle was Rs 6000 for Thunderbird. For Meteor, this is around
1.5 to 1.7 times the number for Thunderbird.
Analyst’s View:
Eicher Motors has been one of the highest-rated auto companies in India. This was mainly on the back
of their successful turnaround of Royal Enfield and the emergence of the mid-sized (250cc-750cc)
motorcycle market. The company saw impressive industry outperformance in both the RE and VECV
businesses and its highest ever revenue from operations for a quarter. The company has seen a good
response to the MiY platform and the Meteor which has seen overwhelmingly good response. The
demand for the Meteor is so high that around 35-40% of new bookings are for the model and wait
times are as long as 4 months. The company still faces major challenges plaguing the industry like RM
cost inflation and the electronic components shortage. It remains to be seen how long the company
will be able to keep outperforming the industry and how its various initiatives like studio stores and
Make Your Own platforms pan out in the future. Nonetheless, given its resilient performance in its
various segments and the strong brand and industry position of the company, Eicher Motors remains
a critical stock to watch out for every auto sector investor.

www.smartsyncservices.com Page | 22
Click here to Subscribe
on WhatsApp
Minda Industries
Financial Results & Highlights
Brief Introduction:
Minda Industries is a supplier of automotive solutions to original equipment manufacturers. The
Company offers a range of products across various verticals of auto components, such as switching
systems, acoustic systems and alloy wheels, among others.
Standalone Financials (In Crs)
Q3FY21 Q3FY20 YoY % Q2FY21 QoQ % 9MFY21 9MFY20 YoY%
Sales 1087 788 37.94% 905 20.11% 2223 2464 -9.78%
PBT 81 35* 131.43% 96 -15.63% 96 133* -27.82%
PAT 61 26 134.62% 64 -4.69% 73 102 -28.43%
Consolidated Financials (In Crs)
Q3FY21 Q3FY20 YoY % Q2FY21 QoQ % 9MFY21 9MFY20 YoY%
Sales 1812 1338 35.43% 1478 22.60% 3710 4149 -10.58%
PBT 164 73* 125% 129 27.13% 137 226* -39.38%
PAT 121 53 128% 84 44.05% 87 162 -46.30%
*Contains an exceptional item of Rs 5.17 Cr
Detailed Results:
1. The company had a very good quarter with a revenue rise of 35% YoY and consolidated PAT
growth of 128% YoY.
2. The EBITDA margins rose 236 bps YoY to 14.7% in Q3FY21. EBITDA for Q3 stood at Rs 264 Cr vs Rs
163 Cr last year growing 62% YoY.
3. The revenue of Lighting, Acoustics, and Others grew in Q2 while Switches and Light Metal saw
slight declines.
4. Almost 83% of revenues were from domestic sources while 17% were from exports. In terms of
channels, 86% of revenues were sourced from OEMs while 14% were from the replacement
market. 48% of sales were for 2 wheelers while 52% were for 4 wheelers.
5. The revenue share of various segments in Q3 is as follows:
1. Switches: 35%
2. Lighting: 24%
3. Acoustics: 10%
4. LMT: 15%
5. Others: 16%
6. The Harita merger has been approved but final orders are pending.
7. The latest operational updates on the company’s various segments are:
1. Switches:
1. 2W Switch: Acquired new customer John Deere

www.smartsyncservices.com Page | 23
Click here to Subscribe
on WhatsApp
2. 4W: New orders received for Steering Wheel Switch, second gear switch driver
side switch, Power window, Sunroof Switches, Audio and panel switches from
Indian OEMs
2. Lighting:
1. 2W Lighting: New LED order for Yamaha
3. Acoustics: Clarton Horn received new orders from Ford, KIA, FCA and Hyundai
4. LMT:
1. 2W alloy wheel 3rd Line also got operational
2. Commercial sales started and New Orders received from OEM
5. Others:
1. Sensor: - Started Manufacturing and supply of Wheel speed Sensor for Korea
2. MKL: Received new Business from MSIL
8. The company announced an interim dividend of Rs 0.35 per share.
Investor Conference Call Highlights
1. The auto industry revival was backed by sustained retail sales momentum post festivals, low
channel inventory, and a soft base and with rising preference for personal mobility and continued
positive sentiments in rural and semi-urban markets.
2. Most automotive industry segments have reported successive improvement in offtake throughout
the second half of 2020 on the back of the initial bounce provided by pent-up demand, followed
by the preference for affordable personal mobility and continued rural resilience.
3. The proposed PLI scheme of INR 57,000 crores for the auto sector is a major development in Q3.
4. The new voluntary vehicle scrappage strategy policy in the Union Budget is expected to encourage
the consumer demand towards new and environment-friendly vehicles.
5. The Finance Minister has also announced that custom duties on specified auto parts, like ignition
wiring sets, safety glass, parts of signaling equipment, et cetera, will be hiked to 15%. This bodes
for local component makers like Minda.
6. The CV segment has also gotten a welcome push from the Govt announcing a new scheme worth
INR 18,000 crores to support the augmentation of public bus transportation services.
7. The management has stated that Minda has been working to upgrade our existing group products
to meet requirements specific to electric vehicles like low energy consumption, light weighting. It
already has several products in this segment including LED headlamps, tail lamps, side indicators,
low-current switches, and electronic horns.
8. Minda has also launched new sensors specific to electric vehicles like APS or accelerated position
sensors, brake pedal sensors for regenerative braking, EV battery temperature sensors, and also
vacuum sensors for EV brake systems.
9. The management believes that the segment of 2Wheelers and 3Wheelers will have the largest
and the quickest adoption in the electric vehicle segment and primarily because there is less
dependency on charging infrastructure and as well as the range of these vehicles would be enough
for more city driving conditions.
10. Thus Minda’s focus will be on these new products for 2Wheelers and 3Wheelers which include
ECUs, DC-DC converters, on-board, and off-board chargers, telematics control units, and smart
plugs. It is also working on developing battery management systems for lithium-ion batteries along
with its technical partner, Auto Motive Power, in the USA.
www.smartsyncservices.com Page | 24
Click here to Subscribe
on WhatsApp
11. The lighting business achieved a revenue of INR 426 crores for Q3, contributing to 24% of total
turnover. Minda is working to build a master plan for setting up a greenfield plant for meeting
increased demand in the 4Wheeler lighting business.
12. LMT segment achieved revenue of INR 270 crores for Q3, contributing to 15% of total turnover.
13. The company saw sales of Rs 30 Cr in Q3 from the new 2W alloy wheels. The last product line in
this segment is expected to be completed by March.
14. Acoustics achieved revenue of INR 188 crores for Q3, contributing 10% of total turnover.
15. Other businesses achieved revenue of INR 288 crore for Q3, contributing to 16% of the overall top
line. It mainly comprised of sales from sensor business at around INR 55 crores, a similar amount
from blow molding parts business, and around INR 33 crores from i-SYS.
16. Total borrowings as of December 31, 2020, were INR 1,083 crores compared to INR 1,152 crores
for Q1 FY '21.
17. The company has done Rs 250 Cr of capex to date in FY21.
18. It has around Rs 190 Cr of cash currently.
19. The aftermarket segment improved 50% QoQ. The management expects this segment to reach
annual sales of Rs 1000 Cr.
20. MKL will be incurring an expenditure of around INR 87.3 crores for enhancement of capacity and
setting up an in-house paint shop in Bangalore.
21. The paint shop will be set up on a greenfield expansion which is expected to be completed by April
2022.
22. The growth in switches has been above 30-35% mainly on the back of new customer additions in
4W and the addition of many components in 2W due to BSVI.
23. With the rise in sales volumes, the company has been able to achieve operating leverage which
has resulted in margin expansion according to the management.
24. The management states that there is still scope for margin expansion in the lighting and acoustics
businesses.
25. The management expects Minda to become free cash positive next year.
26. The management states that most of Minda’s products excluding filters can go into EVs.
27. The overall kit value has risen for Minda with the addition of more switches to the average
portfolio.
28. In 2W alloy wheels, the management expects to scale up to fast and revenues from this segment
to rise to Rs 350-400 Cr in FY22.
29. The new orders from Maruti will be commercialized in FY22 and the company may need to add a
new facility in Gujarat to be able to meet this order.
30. The 4W alloy wheel is expected to launch in the upcoming festive season in 2021.
31. The average kit value currently is above Rs 15000 and the new products for EVs should add around
7000-10000 to it.
32. These new products should go into production around the middle of FY22 and should go out in
1.5 years.
33. The annualized revenues from sensors have risen from Rs 120 Cr to Rs 200 Cr currently. The
management’s objective is to take this number up to Rs 400-500 Cr in the next 3-5 years.
34. The primary reason for the Delvis acquisition was to bridge the gap and stay competitive with
global majors in the lighting industry, all of which are now present in India right now.
35. The company is looking to enhance its marketing in Europe and ASEAN and is setting a new office
in Thailand.

www.smartsyncservices.com Page | 25
Click here to Subscribe
on WhatsApp
36. The management has stated that the focus currently is not to drive sales from new customers but
to do so by increasing revenue share from existing customers.
37. ROCE for Q3 has risen above 20%.
38. The management states that from existing facilities, Minda will be able to earn 50% more revenues
at the most.
39. Minda intends to start its new customers with some small volumes from the existing 4-million-
wheel capacity in the alloy wheel segment and add new customers only after phase 2 is completed
in the next 1.5 years.
40. Manpower costs have risen 20% QoQ mainly due to an increase in semi-permanent or blue collar
workers due to a rise in volumes.
41. The management expects the sales and volume momentum from Q3 to sustain in the short term
at least.
42. The margins will hard to maintain at the current level of 14.7% as many fixed costs will rise as the
economy normalizes according to the management.
43. The management has not seen much material impact from the PCB shortage.
Analyst Views:
Minda Industries has been one of the top auto ancillary providers in the country. They have steadily
expanded their product offerings such that their kit value is increasing year on year with the addition
of newer products in the mix. The company has had a very good quarter with a 35% YoY rise in sales
and >100% YoY rise in PAT. It is looking to focus on the new and rising businesses of alloy wheels and
sensors and develop a full portfolio geared towards EVs. The company’s acquisition of Delvis is yielding
steady orders from global auto majors and is also helping Minda compete effectively in the domestic
market against international competitors. There is a big opportunity here for component makers like
Minda from the recently announced PLI scheme for the auto industry. It remains to be seen whether
this momentum will sustain and whether Minda will be able to realize its export ambitions with the
new PLI scheme. The management has a goal of doubling revenues in 4-5 years. It is still early days to
comment on that. Nonetheless, given the new orders that the company has bagged, their improving
product portfolio, and massive import substitution opportunity, Minda remains a compelling auto
ancillary stock to watch out for.

www.smartsyncservices.com Page | 26
Click here to Subscribe
on WhatsApp
BANKS Bandhan Bank
Financial Results & Highlights
Brief Company Introduction
Bandhan started in 2001 as a not-for-profit enterprise that stood for financial inclusion and women
empowerment through sustainable livelihood creation. It turned into an NBFC a few years later but
the core objective remained financial inclusion. When Bandhan Bank started operations on August 23,
2015, it was the first instance of a microfinance entity transforming into a universal bank in India. On
the day of launch itself, Bandhan Bank started with 2,523 banking outlets. It offers world-class banking
products and services to urban, semi urban and rural customers alike. In the last few years of
operations, Bandhan Bank has spread its presence to 34 of the 36 states and union territories in India
with 4,559 banking outlets serving 2.01 crore customers, as on March 31, 2020.
Consolidated Financials (In Crs)
Q3FY21 Q3FY20 YoY % Q2FY21 QoQ % 9MFY21 9MFY20 YoY%
Sales 3861 3075 25.56% 3579 7.88% 10845 9088 19.33%
PBT 845 969 -13% 1233 -31.47% 2813 3360 -16.28%
PAT 633 731 -13% 920 -31.20% 2102 2506 -16.12%
Detailed Results:
1. The revenues for Q3 grew 25.6% YoY. PAT fell 13% YoY mainly due to higher provisions of Rs 1068
Cr vs Rs 295 Cr last year.
2. PPoP grew 51.4% YoY in Q3.
3. The deposit portfolio grew 29.6% YoY and 7.7% QoQ.
4. Loan portfolio (on book + off book + TLTRO) grew 22.6% YoY.
5. CASA grew 62% YoY.
6. CASA ratio at 42.9% against 38.2% in Q2.
7. Added 17 lakh customers during the quarter with a total customer base at 2.25 crore as of Dec 31,
2020.
8. Capital Adequacy Ratio (CRAR) at 26.2%; Tier I at 21.4%.
9. During the quarter the Bank has taken accelerated additional provision on standard advances
amounting to Rs 1000 Cr. With this provision and additional Standard Assets provision that Bank
is carrying in Micro banking portfolio total additional provision in books stands at Rs 3119 Cr.
10. Net Interest Income (NII) for the quarter grew by 34.5% YoY to Rs 2,071.7 Cr as against Rs 1,540
Cr in the corresponding quarter of the previous year.
11. Non-interest income grew by 54.7% YoY to Rs 553.3 Cr for the quarter against Rs 358 Cr in the
corresponding quarter of the previous year.
12. Operating Profit for the quarter increased by 51.4% YoY to Rs 1,914 Cr against Rs 1,264 Cr in the
corresponding quarter of the previous year.

www.smartsyncservices.com Page | 27
Click here to Subscribe
on WhatsApp
13. Net Interest Margin (annualized) for the quarter stood at 8.3% (merged) against 7.9% on Dec 31,
2019.
14. Total Advances (on book + off book + TLTRO) grew by 22.6% YoY to Rs 80,255 Cr at the end of
Q3FY21 against Rs 65,456 Cr in the previous year, and 4.8% QoQ against Rs 76,614 crores in the
previous quarter.
15. Gross NPAs as of Dec 31, 2020, are at Rs 859 Cr (1.1%) against Rs 1182 Cr (1.9%) last year.
16. Net NPAs as on Dec 31, 2020 is at Rs 201 Cr (0.3%) against Rs 491 Cr (0.8%) last year.
17. The cost to income ratio was at 27.1% in Q3 vs 33.4% last year.
18. The retail deposit to total deposits was 81%.
19. EEB collection efficiency had reached 92% in value and 94% of customers.
20. The cost of funds was at 6% in Q3.
21. 496 new locations opened in Q3.
Investor Conference Call Details:
1. RoA & RoE for Q3 were at 2.4% and 14.6% respectively.
2. Group loans or micro credit loans accounted for 59% of loans.
3. Total collection efficiency in micro credit has come up to 98%. Around 7.1% of customers have
made partial repayment.
4. Collection efficiency dipped in Jan due to the announcement of micro credit loan waive in Assam.
5. The 0 DPD on the entire micro lending book is 76%.
6. Although the management had guided earlier about credit costs being near 3.5% in FY21, it is
confident that despite the situation in Assam, credit costs should exceed 100 bps more than the
guided number but it will not exceed 5%.
7. Only 6% of disbursements were top up loans in Q3 vs 25% of all disbursements in Q2.
8. The bank reduced FD rates as the cost of FD was getting higher than the cost of SA.
9. 30 to 60 DPD was at 10% and 60 to 90 DPD was at 5% for Bandhan.
10. The bank first allocates resuming EMIs to cover the interest and then principal payments. The total
unrecovered interest is now sitting as Rs 349 Cr in receivables.
11. The management has stated that the elections should not have any impact on collection efficiency
and credit growth in West Bengal.
12. The company is indeed getting some partial payments from the proforma NPL of 7%. Removing
the partial payments, the proforma NPL comes to 3.5%.
13. The management acknowledges that the accelerated provisioning in Q3 was taken on account of
the developing situation in Assam.
14. Around 80% of customers are paying on time and in full.
15. Bandhan has not made any write-offs in Q3.
16. The management states that new account acquisition has come back to pre-covid levels and the
existing customer base has also increased its wallet share.
17. The management states that in response to the situation in Assam, Bandhan’s first reaction is to
step back, connect with the customers, go slow on disbursement, improve the connect quotient
with the customer. Around 95% of the proforma NPL of 7% is in EEB.
18. The management states that the reason it has seen a high pickup in SA in Q3 was due to the higher
term deposit rate provided by Bandhan.
19. Around 67-68% of accounts are less than Rs 1 Lac. With the average being at Rs 60,000+.

www.smartsyncservices.com Page | 28
Click here to Subscribe
on WhatsApp
20. The management clarifies that there is no automatic increase disbursement for any customer
whose payment cycle has finished. It evaluates the customer's case thoroughly before deciding
whether to do so or not.
21. The bank has seen 30% QoQ growth in disbursements in mortgages. The bank is also getting the
credit linked subsidy from the government on the affordable housing of customers who are
eligible for the CLFS. This reduces the outstanding loan amount and thus keeps AUM growth low.
22. The current share of Assam in outstanding MFI loans is 14+%.
23. The management states that the balance in MFI accounts went down in COVID-19 due to the
shutdown of business activity. As the business activity of customers has come back, the balance
has also risen back correspondingly. Another contributing factor to the rising balance is the
continuing subsidy from social welfare schemes which are ongoing.
Analyst’s View:
Bandhan Bank has aggressively grown its business over the last few years. The company had a very
good quarter with good YoY growth in deposits and loans and >50% growth in PPoP. The company has
taken out provisions of Rs 1000 Cr in Q3 due to the ongoing situation in Assam regarding the rumoured
MFI loan waiver. This may prove to be a dampener in the company’s collections in Assam which is a
big market for the company with >15% of the MFI loan book. The company is seeing good traction in
mortgage and commercial lending businesses and the savings deposit franchise. It remains to be seen
how the Assam story plays out in the medium term and whether things will come back to normalcy as
fast as reported by the management. Nonetheless, given its consistent growth momentum in recent
years and its rapidly expanding customer set, Bandhan Bank remains an interesting company to keep
track of the microfinance and small finance banking industry in India.

www.smartsyncservices.com Page | 29
Click here to Subscribe
on WhatsApp
HDFC Bank
Financial Results & Highlights
Brief Company Introduction
HDFC Bank Ltd. is an Indian banking and financial services company headquartered in Mumbai,
Maharashtra. It has a base of 1,04,154 permanent employees as of 30 June 2019. HDFC Bank is India’s
largest private sector lender by assets. It is the largest bank in India by market capitalisation as of
March 2020.
Standalone Financials (In Crs)
Q3FY21 Q3FY20 YoY % Q2FY21 QoQ % 9MFY21 9MFY20 YoY%
Sales 37523 36039 4.12% 36069 4.03% 108046 102156 5.77%
PBT 11772 9902 18.89% 10110 16.44% 30820 27433 12.35%
PAT 8758 7416 18.10% 7513 16.57% 22930 19330 18.62%
Consolidated Financials (In Crs)
Q3FY21 Q3FY20 YoY % Q2FY21 QoQ % 9MFY21 9MFY20 YoY%
Sales 39839 38326 3.95% 38438 3.64% 114976 108781 5.69%
PBT 11813 10249 15.26% 10378 13.83% 31530 28513 10.58%
PAT 8760 7660 14.36% 7711 13.60% 23412 20000 17.06%
Detailed Results:
1. The net standalone revenues rose 4% YoY in Q3.
2. NII grew 15.1% YoY to Rs 16317 Cr driven by growth in advances of 15.6% YoY and core NIM
of 4.2%.
3. Other income formed 31.3% of net revenues at Rs 7443 Cr.
4. The breakup of other income is:
5. Fees & Commissions: Rs 4975 Cr vs 4527 Cr last year.
6. FX & Derivatives: Rs 562 Cr vs 526 Cr last year.
7. Gain on sale/revaluation: Rs 1109 Cr vs 677 Cr last year.
8. Miscellaneous Income: Rs 797 Cr vs 940 Cr last year.
9. Operating expenses were up 8.6% YoY. The cost to income was at 36.1% vs 37.9% a year ago.
10. Pre-provision Operating Profit grew 17.3% YoY. Provisions and contingencies for the quarter
were at Rs 3414 Cr. Total Provisions include Rs 2400 Cr for proforma NPA.
11. The Total Credit Cost ratio was at 1.25%.
12. Standalone PAT rose 18.1% YoY.
13. Total Balance Sheet size rose 18.6% YoY. Total Deposits rose 19.1% YoY while CASA deposits
rose 29.6% YoY. Time deposits grew 12.2% YoY.
14. Total advances rose by 15.6% YoY with domestic advances rose 14.9% YoY. Retail advances
grew 5.2% YoY while wholesale advances grew 25.5% YoY. Retail to the wholesale mix was at
48:52. Overseas advances were at 3% of total advances

www.smartsyncservices.com Page | 30
Click here to Subscribe
on WhatsApp
15. 9M revenues grew 5.8% YoY while Profits grew 18.6% YoY.
16. The bank maintained a CAR of 18.9%. with Tier I CAR at 17.6%.
17. GNPAs was at 0.81% on 31st Dec 2020. NNPA was at 0.09%. If the bank classified borrower
accounts as NPA after 31st Aug 2020, Gross NPA would come out to 1.38% and NNPA would
be 0.4%.
18. The bank maintained floating provisions of Rs 1451 Cr and contingent provisions of Rs 8658
Cr. Total provisions were at 195% of GNPAs.
19. HSL saw revenues for the quarter rose to Rs 337 Cr vs Rs 216 Cr last year. PAT was at Rs 167
Cr vs Rs 102 Cr last year.
20. HDB Financial Services saw a total loan books rise by 1.6% YoY and LCR at 285%. NII for the
subsidiary was at Rs 924 Cr vs Rs 971 Cr last year. PAT fell to Rs (44) Cr from Rs 217 Cr last
year. GNPA here was at 2.7% while NNPA was at 1.7%. CAR was maintained at 19.5%.
Investor Conference Call Details:
1. HDFC bank signed up approximately 1.6 lakh village-level entrepreneurs, of which 1.02 lakh are
on-boarded as business facilitators and 13,502 business correspondents. These business
correspondents are not only executing financial transactions through the use of other enabled
payment systems, which works on biometric authentication but also — but have also enabled
them to sell multiple products, including CASA, fixed deposits, loans, including gold loan, 2-
wheeler loan, car loan, tractors and home loans.
2. The bank has also opened more than 2.3 million CASA accounts in FY21 so far.
3. It also saw a growth of 20% YoY in savings account acquisition and 15% YoY in current account
acquisition due to focus on new customer acquisition complemented with video KYC, like full KYC
accounts and digitally powered smart accounts.
4. Personal loan customers are now on-boarded through VKYC through the digital channel. VKYC will
extend to auto-loans, 2-wheeler loan,s and card customers in the future.
5. Card sales volumes were up 32% QoQ due to the festive season.
6. Merchant acquisition volumes were also up 20% QoQ.
7. The bank maintained an average LCR of 146%.
8. The bank opened 231 branches during 9MFY21.
9. Retail constituted about 80% of total deposits and 100% of incremental contribution during the
quarter.
10. The credit deposit ratio was at 85% for the current quarter.
11. The wholesale portfolio for the bank is now at Rs 5,80,000 Cr.
12. The gross incremental portfolio during the quarter was rated 4.37 on the 1-10 HDB scale which
corresponds to the AA/AAA rating.
13. Around 68% of the portfolio is rated HDB 5 and above, which measures into AA.
14. The collateral coverage was between 85% and 90%.

www.smartsyncservices.com Page | 31
Click here to Subscribe
on WhatsApp
15. The restructuring is 0.5% of the total book.
16. Slippages in Q3 have been at Rs 5100 Cr.
17. Under ECGLS 1.0, HDFC Bank disbursed Rs 22,103 Cr. In ECLGS 2.0, it disbursed Rs 579 Cr across
58 customers.
18. The management assures that the bank is working on technology upgrades and has several action
plans from strengthening of the disaster recovery or the recovery point and the recovery time and
automating the orchestration tool to get on to the DR side of architectural efficiencies, cloud
strategy, etc.
19. The bank is back to pre-covid levels of demand resolution and collections.
20. The management stated that it is not fair to compare asset quality for HDB and HDFC Bank as HDB
has a higher-risk customer segment than HDFC Bank’s and it operates in a different product range.
21. Total provisions for HDB stand at Rs 800 Cr.
Analyst Views:
HDFC Bank is the biggest bank in the country by market capitalization. It has deservedly earned its
stellar reputation over the years. The bank has performed well in Q3FY21 with almost 30% growth in
CASA. The bank has been able to successfully capitalize on the festive season which was evident from
the QoQ increase in card accounts. The bank has also launched Video KYC for personal loans and will
look to expand this into other segments which should help enhance customer experience and reduce
costs and improve efficiency. It remains to be seen how the post-COVID-19 recovery will pan out in
the near future and whether there are any surprises in store from COVID-19 still. Nonetheless, given
the bank’s resilient customer set, strong liquidity profile, and enduring brand image, HDFC Bank
remains an indispensable banking stock for every investor, more so because of the recent correction
in valuation.
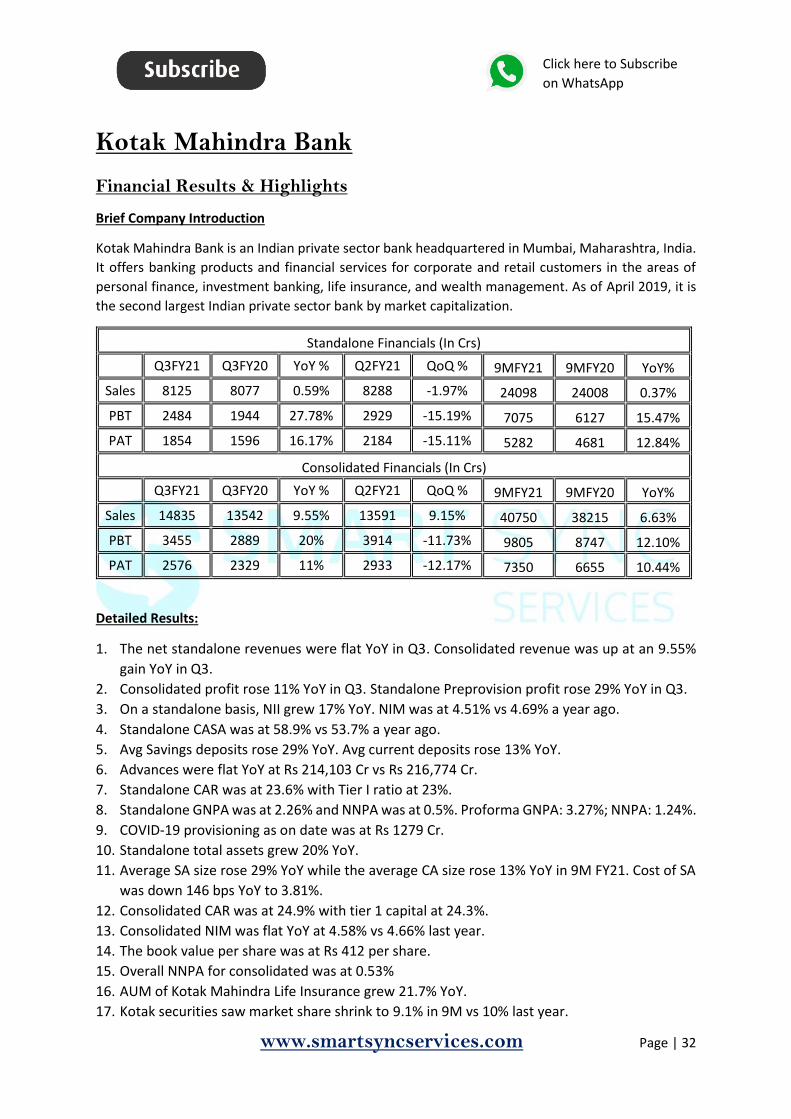
www.smartsyncservices.com Page | 32
Click here to Subscribe
on WhatsApp
Kotak Mahindra Bank
Financial Results & Highlights
Brief Company Introduction
Kotak Mahindra Bank is an Indian private sector bank headquartered in Mumbai, Maharashtra, India.
It offers banking products and financial services for corporate and retail customers in the areas of
personal finance, investment banking, life insurance, and wealth management. As of April 2019, it is
the second largest Indian private sector bank by market capitalization.
Standalone Financials (In Crs)
Q3FY21 Q3FY20 YoY % Q2FY21 QoQ % 9MFY21 9MFY20 YoY%
Sales 8125 8077 0.59% 8288 -1.97% 24098 24008 0.37%
PBT 2484 1944 27.78% 2929 -15.19% 7075 6127 15.47%
PAT 1854 1596 16.17% 2184 -15.11% 5282 4681 12.84%
Consolidated Financials (In Crs)
Q3FY21 Q3FY20 YoY % Q2FY21 QoQ % 9MFY21 9MFY20 YoY%
Sales 14835 13542 9.55% 13591 9.15% 40750 38215 6.63%
PBT 3455 2889 20% 3914 -11.73% 9805 8747 12.10%
PAT 2576 2329 11% 2933 -12.17% 7350 6655 10.44%
Detailed Results:
1. The net standalone revenues were flat YoY in Q3. Consolidated revenue was up at an 9.55%
gain YoY in Q3.
2. Consolidated profit rose 11% YoY in Q3. Standalone Preprovision profit rose 29% YoY in Q3.
3. On a standalone basis, NII grew 17% YoY. NIM was at 4.51% vs 4.69% a year ago.
4. Standalone CASA was at 58.9% vs 53.7% a year ago.
5. Avg Savings deposits rose 29% YoY. Avg current deposits rose 13% YoY.
6. Advances were flat YoY at Rs 214,103 Cr vs Rs 216,774 Cr.
7. Standalone CAR was at 23.6% with Tier I ratio at 23%.
8. Standalone GNPA was at 2.26% and NNPA was at 0.5%. Proforma GNPA: 3.27%; NNPA: 1.24%.
9. COVID-19 provisioning as on date was at Rs 1279 Cr.
10. Standalone total assets grew 20% YoY.
11. Average SA size rose 29% YoY while the average CA size rose 13% YoY in 9M FY21. Cost of SA
was down 146 bps YoY to 3.81%.
12. Consolidated CAR was at 24.9% with tier 1 capital at 24.3%.
13. Consolidated NIM was flat YoY at 4.58% vs 4.66% last year.
14. The book value per share was at Rs 412 per share.
15. Overall NNPA for consolidated was at 0.53%
16. AUM of Kotak Mahindra Life Insurance grew 21.7% YoY.
17. Kotak securities saw market share shrink to 9.1% in 9M vs 10% last year.
www.smartsyncservices.com Page | 33
Click here to Subscribe
on WhatsApp
18. Kotak AMC saw overall market share on AAUM rise to 7.3% vs 6.6% a year ago.
Investor Conference Call Details:
1. The management states that growth momentum in loans is expected to continue ahead. The
management has stated that Kotak shall focus on secured lending and will remain cautious on
unsecured lending.
2. Unsecured loans are at near 6% of total loans and around 40% of the incremental rise in proforma
NPAs is from this segment.
3. CASA and term deposits make up for almost 92% of total deposits.
4. Restructuring requests from customers are expected to be low in Q4.
5. Collection efficiency on the secured portfolio has come back to pre-covid levels. In the unsecured
portfolio, it is rising and is expected to come back to pre-covid levels soon.
6. Total ECLGS disbursement was around Rs 9400 Cr by Q3 and it has crossed Rs 9700 Cr in Jan.
7. The management has stated that it has given out ECLGS to 50-60% of accounts eligible for the
scheme.
8. The management has stated that the required density of branches should be less with more
coverage area for each branch. Thus it will be restrained when opening up new branches.
9. The management expects cost reductions to be sustainable and yields should remain high to
maintain or expand margins from current levels.
10. The CV loan book remains stressed as 10-15% of the book is in buses that have yet to come back
to pre-covid levels.
11. For borrowers where even one account turned 90+dpd, the entire outstanding balance (including
other accounts) was considered as NPA. 3QFY21 Provisioning also includes interest reversal for
the whole moratorium period (6 months), wherever applicable.
12. Mortgage segment saw its best ever month in Dec and momentum in this segment is expected to
sustain. The focus in this segment will remain on salaried customers.
13. In the CV loan segment, utilization in the goods segment was near pre-covid level but operator
economics were affected due to higher fuel prices. Collection efficiency is near pre-covid levels.
14. In the Agri customers segment, demand is rising and customers are reporting regular cashflows.
15. Disbursals have risen higher in the tractor finance segment as collections in the segment are at
normal levels and volumes are expected to rise going forward.
16. 80% of the ECLGS was towards small consumer business and commercial business. The rest of the
amount was towards the lower end of corporate.
17. In the Rs 0.1 mn to Rs 10 mn bucket in SA, KMB offers 4%, which is 75bps better than the top 3
private banks.
18. Digital uptake by consumers continued, led by mobile channels. As digital picks up, the approach
towards branches would be refined. Other productivity measures, including work from home, are
being implemented. As volumes increase, tech-related efficiencies will kick in.
19. The bank has a 5% market share in mobile banking in terms of the transaction value. Transaction
volume/value is up 73/40% YoY.
20. PAT declined 20% YoY for Kotak Prime. PAT for Kotak Life was flat YoY and it rose 44% YoY for
Kotak securities.
21. The PAT from AMC business was also flat YoY.
22. GNPA in Kotak Prime was 2.46% while, on a proforma basis, it was over 4%.
23. Q3 employee costs were better due to the absence of pension costs which were present in Q2
and Q3FY20.

www.smartsyncservices.com Page | 34
Click here to Subscribe
on WhatsApp
24. Other expenses rose primarily due to an increase in ad and promotional activity expenses as well
as a pick-up in collection/recovery related costs.
Analyst’s View:
Kotak Mahindra Bank is the second-biggest private bank in the country by market capitalization. It has
deservedly earned its stellar reputation over the years. The bank has performed well in Q3FY21 with
more than 29% growth in savings deposits and has gotten 17% YoY growth in NII despite flat YoY
growth in advances. The company has done well to keep its books resilient and focus on expanding on
the secured lending side while remaining cautious on the unsecured side. It has also seen a very good
rise in the digital channels with more than 73% YoY rise in digital transactions and plans to use this
consumer shift to keep its branch density low to be able to better compete with peers who have a
much larger physical presence. It remains to be seen how the proforma NPAs will affect the bank going
forward and whether the company will be able to better compete with other players with its low
branch density plan. Nonetheless, given the bank’s track record and the capability and vision of the
management over the years, Kotak Mahindra Bank remains a pivotal banking stock for every Indian
investor.

www.smartsyncservices.com Page | 35
Click here to Subscribe
on WhatsApp
CEMENT Heidelberg Cement
Financial Results & Highlights
Introduction
HeidelbergCement India Limited is is a subsidiary of HeidelbergCement Group, Germany. The
Company has its operations in Central India at Damoh (Madhya Pradesh), Jhansi (Uttar Pradesh) and
in Southern India at Ammasandra (Karnataka).
Consolidated Financials (In Crs)
Q3FY21 Q3FY20 YoY % Q2FY21 QoQ % 9MFY21 9MFY20 YoY%
Sales 607 560 8.39% 524 15.84% 1548 1696 -8.73%
PBT 92 86 7% 95 -3.16% 261 297 -12.12%
PAT 64 65 -2% 62 3.23% 175 202 -13.37%
Detailed Results:
1. The company had a mixed quarter with 8% YoY rise in revenues and a 2% YoY fall in profits.
2. 9M revenues and profits remained subdued due to the poor performance in Q1.
3. The company also saw volume growth of 3.7% YoY in Q3.
4. Industry decline was 10% YoY.
5. EBITDA margin for Q3 fell 167 bps YoY to 20.3% in Q3.
6. Gross realizations rose 4.5% YoY to Rs 4669/ton.
7. EBITDA per ton fell 3.4% YoY in Q3 to Rs 947. The main drag on this number was the rise in fuel
costs.
8. The company had 1 Lost Time Injury (LTI) for a contract employee.
9. Dependence on-grid power decreased to 66%.
10. The cash & cash equivalents for the company was at Rs 570.9 Cr as of 31st Dec 2020.
11. The company maintained a negative working capital.
12. Mycem power volumes were up 33% YoY in Q3. It formed 22% of trade volumes.
13. The company has provided the following points in its outlook for the near future in FY21:
a. The expectation of further improvement post COVID.
b. Demand recovery in housing and infrastructure segments fuelled by Govt. capital outlay.
c. Hardening of international and domestic fuel prices.
Investor Conference Call Highlights:
1. The company has paid back Rs 125 Cr of NCDs and has pending NCDs of Rs 120 Cr which is due
in Dec 2021.
2. Net cash balance for HCIL is Rs 216 Cr.
3. The company expects to do a capex of Rs 90 Cr in FY22.
4. 40% of power is from WHRS. The company is also looking to set up a 5.5 MW solar power plant.
5. Pet coke prices are at $115 and can go even higher according to the management.

www.smartsyncservices.com Page | 36
Click here to Subscribe
on WhatsApp
6. The plant is running at 80% capacity utilization. Considering that the industry grows 9% each
year, the management is confident of not requiring spare capacity for the next 2 years.
7. The company is already in the process of applying for clearances for its mining lease in Gujarat.
It is also looking at places near the mines to set up a brownfield project as it does have the cash
in books to do so.
8. All non-trade business is done with advance payment only to prevent any credit losses. The non-
trade channel typically has lower realizations than the trade channel. Besides, the management
has stated that the cost of recovery of funds is greater than the cost of sales so it tends to avoid
non-trade channel.
9. The difference is around Rs 800-900. The management has stated that it is not looking to push
for volumes by accepting all the lower realization orders from the non-trade channel as it will
hurt the brand image and cause faster erosion of limestone reserves for the company.
10. The company has a target to reduce its carbon footprint to 500 by 2030. It is currently at 511
and the industry is at 580. But progress from 511 to 580 is going to be more difficult as it will
require more sophisticated carbon capture technologies.
11. The management has added that if the law restricting the amount of fly ash is removed and the
company can add 5-7% more fly ash, it can easily reach 500.
12. The management has stated that fuel consumption has gone up in Q3 mainly due to the
company working line 1 which is a fuel guzzler. The company looks to keep line 1 working only
for 100 days each year only in case of additional demand. All of this and the shutdown of 21 km
of the conveyor belt caused costs to rise by Rs 80-90 per ton in Q3.
13. The shutdown of the conveyor belt was done to upgrade the belt. This upgradation is required
to be done every 7-8 years. This process takes around 3 months per stage and is to be done in 3
stages.
14. The MAT credit reserve for HCIL is at Rs 75 Cr currently.
15. The management has stated that the EBITDA margin should come back to 23% as one-off
expenses go away.
16. The management has stated that comparing HCIL to other industry players may not be fair as it
is predominantly a central India player.
17. The company is aiming to keep the ratio of coal to pet coke at 50:50 going forward.
18. The company has spent Rs 7-8 Cr on alternate fuel and it will spend a further Rs 12-13 Cr in the
next 7-8 months.
19. In alternate fuels, the company is looking at biomass which can be easily sourced from municipal
waste. The thermal substitution at the start will be 3$ and will be brought up to 8-9%.
20. The company will be looking at another alternate fuel to substitute another 5% bringing the total
substitution to 12-13% in the medium term.
21. Once the company gets all clearances for the Gujarat mines, it will be looking to set up a 3-
million-ton plant there.
22. Around 80-90% of orders are supplied directly to the dealer which reduces the requirement for
maintaining warehouses.
23. The company has postponed price hikes due to soft winter season.
24. The current capacity at mines should suffice for 27-28 years for the company.
Analyst’s View:

www.smartsyncservices.com Page | 37
Click here to Subscribe
on WhatsApp
Heidelberg Cement is one of the leading cement makers in South and Central India. The company has
had a mixed quarter with a fall in realization and margins but volumes saw growth in Q3. The company
has done well to maintain growth despite the overall industry decline YoY. The realizations were down
in Q3 due to partial shutdown of the conveyor belt for upgradation and the company using Line 1 to
substitute for lost capacity. It remains to be seen whether the company will be able to match the
competition which is operating in a much larger addressable market as compared to HCIL.
Nonetheless, given the strong brand image of the company, the efficient utilization of its plants, and
the pricing power it has, Heidelberg Cement India can prove to be a pivotal cement sector stock going
forward.

www.smartsyncservices.com Page | 38
Click here to Subscribe
on WhatsApp
Ultratech Cement
Financial Results & Highlights
Brief Company Introduction
UltraTech Cement Ltd. is the largest manufacturer of grey cement, Ready Mix Concrete (RMC) and
white cement in India. It is also one of the crown jewels of the Aditya Birla Group, one of India’s leading
Fortune 500 companies.
The company has a consolidated capacity of 117.35 Million (including Bara) Tonnes Per Annum (MTPA)
of grey cement. UltraTech Cement has 23 integrated plants, 1 clinkerisation plant, 27 grinding units
and 7 bulk terminals, post the Century merger. Its operations span across India, UAE, Bahrain,
Bangladesh and Sri Lanka. UltraTech Cement is also India's largest exporter of cement reaching out to
meet the demand in countries around the Indian Ocean and the Middle East.
In the white cement segment, UltraTech goes to market under the brand name of Birla White. It has
a white cement plant with a capacity of 0.56 MTPA and 2 WallCare putty plants with a combined
capacity of 0.8 MTPA. With 100+ Ready Mix Concrete (RMC) plants in 35 cities, UltraTech is the largest
manufacturer of concrete in India. It also has a slew of speciality concretes that meet specific needs
of discerning customers.
Standalone Financials (In Crs)
Q3FY21 Q3FY20 YoY % Q2FY21 QoQ % 9MFY21 9MFY20 YoY%
Sales 12092 10143 19.22% 10165 18.96% 29927 30784 -2.78%
PBT 2303 934 146.57% 1778 29.53% 5253 3775 39.15%
PAT 1550 643 141.06% 1209 28.21% 3565 2549 39.86%
Consolidated Financials (In Crs)
Q3FY21 Q3FY20 YoY % Q2FY21 QoQ % 9MFY21 9MFY20 YoY%
Sales 12522 10608 18.04% 10522 19.01% 30994 32019 -3.20%
PBT 2331 997 133.80% 1462* 59.44% 4967** 3723 33.41%
PAT 1585 711 122.93% 896 76.90% 3274 2515 30.18%
*Contains exceptional item loss of Rs 336 Cr
**Contains exceptional item loss of Rs 493 Cr
Detailed Results:
1. The company had a very good quarter with consolidated revenues rising 18% YoY and PBT & PAT
rising 134% YoY and 123% YoY respectively.
2. Sales volumes grew 14% YoY in Q23 while operating EBITDA/ton increased 30% YoY to Rs
1330/ton.
3. Operating margins improved 5% YoY to 26%.
4. Capacity utilization in Q3 was at 75% in Century. Power consumption was reduced by 7% and
production cost was reduced by 12% YoY. 72% brand transition was completed.
www.smartsyncservices.com Page | 39
Click here to Subscribe
on WhatsApp
5. In UltraTech Nathdwara, the plant is working at 45-75% capacity utilization. Production costs
reduced by 15% YoY while EBITDA/ton was consistent at > Rs 1500/ton.
6. The company reduced Rs 2696 Cr of net debt in Q3.
7. Capacity utilization was at near 80% for the company. Selling price was down 1% QoQ. Production
costs were down 1% QoQ.
8. The company increased rural penetration by 3.5% YoY.
9. Consolidated volume growth was at 14% YoY in Q3 and it fell by 4% YoY in 9MFY21.
10. Fixed costs were brought down by 4% YoY.
11. Changes in operating costs in Q3 is as follows:
a. Logistics: Up 5% YoY to Rs 1178/ton. Accounts for 33% of the total operating costs.
b. Energy: Down 3% YoY to Rs 952/ton. Accounts for 27% of total operating costs.
c. Raw Materials: Flat YoY at Rs 501/ton. Accounts for 14% of total operating costs.
d. Overall variable costs increased by 1% YoY in Q3.
12. Diesel Price higher by ~10% YoY which led to logistics costs rising 5% YoY.
13. Energy cost reduction of 3% YoY mainly due to an increase in green power from 11% last year to
13% currently and reduced power consumption by 2%.
14. Absolute EBITDA grew 60% YoY. Consolidated EBITDA margins improved 7% YoY to 28% in Q3FY21.
15. Net debt to EBITDA was at 0.73 times and net debt to equity was at 0.19 times.
Investor Conference Call Details:
1. Capacity utilization was 85% in December.
2. Rebranding of Century should be done be Q2FY22 at the latest.
3. Net debt stands at Rs 7973 Cr while current gross debt is at Rs 21000 Cr.
4. ROE without goodwill has reached 14.1% and is expected to rise above 15% with new projects
coming in.
5. RMC is gaining good momentum for Ultratech. RMC generates incremental margins over cement
and is also a high ROCE opportunity for Ultratech.
6. Net sales of white cement segment are up 15% in Q3. This was driven by good volume
performance and a strong price/mix with growth broad-based across categories and regions.
7. White Cement grew about 13% while putty grew 18% in Q3.
8. The company introduced new variants of Fragrance Putty which resulted in incremental growth
in Putty segment.
9. The management is not concerned about the entry of the parent Birla Group in the paints segment
and is focussed on the cement sector only.
10. The company is indeed looking to raise debt to refinance some of its existing debt at lower rates
and take advantage of an opportunity for interest arbitrage.
11. The Waste Heat Recovery System project is in full swing and is expected to get over by 3-4 months
from its intended date.
12. Pet coke prices are indeed at the high end currently and are not expected to rise much further.
13. North & East zone have both grown more than 20% for the industry.
14. The capacity utilization in South zone was in 70s while for the rest of India it was in the 80s.
15. The management feels that demand will continue to outstrip incremental supply for the next 3-4
years for the cement industry.
16. RMC sales were at Rs 620 Cr & white cement sales were at Rs 538 Cr in Q3.
17. The company has to do minimal capex on distribution network as the transportation is entirely
outsourced and acquiring dealers is easy for the company given its brand.
www.smartsyncservices.com Page | 40
Click here to Subscribe
on WhatsApp
18. 64% of sales were from trade channel.
19. The company is seeing non-trade segment coming back well with the rise in urban real estate.
20. The increase in pet coke prices will be reflected marginally in the next 2 quarters.
21. The lead distance currently is close to 440 km. This has gone up mainly because the East zone was
working at 100% capacity and the company had to source from other zones to service additional
demand in the East zone.
22. The company has no plans to hive off the white cement business at this point.
23. The growth in RMC is directly linked to the rise in urban demand.
24. White cement volumes sold in Q3 were at 3.9 lac tons.
25. The management is insistent that the company will not be taking part in the paints business as the
target customer set for the cement business and paints business are different. The distributor for
Ultratech may start selling paints from Grasim but this will not involve Ultratech in any way.
26. The total power generating capacity of Ultratech is 1100-1200 MW.
Analyst’s View:
Ultratech Cement is the biggest cement maker in India. The company has done well to acquire aging
cement makers in India and integrating them and adding on to the company’s ever-growing market
presence and reach in the country. Ultratech has had a phenomenal quarter with sales growth of 19%
and profit growth exceeding 100% YoY. The company is doing well to focus on cash conservation and
cost reduction while maintaining its steady pace of debt repayment. It has also been restarting all the
projects postponed by COVID and expects the Century brand transition to be completed in the next 2
quarters. It remains to be seen how long will uptick for infra and urban real estate will last and whether
there is something in store for the infra and real estate sector in the upcoming Union Budget.
Nonetheless, given the company’s leadership position in the industry, its wide distribution network
across India, and its strong brand image, Ultratech Cement remains a pivotal cement sector stock for
all Indian investors.
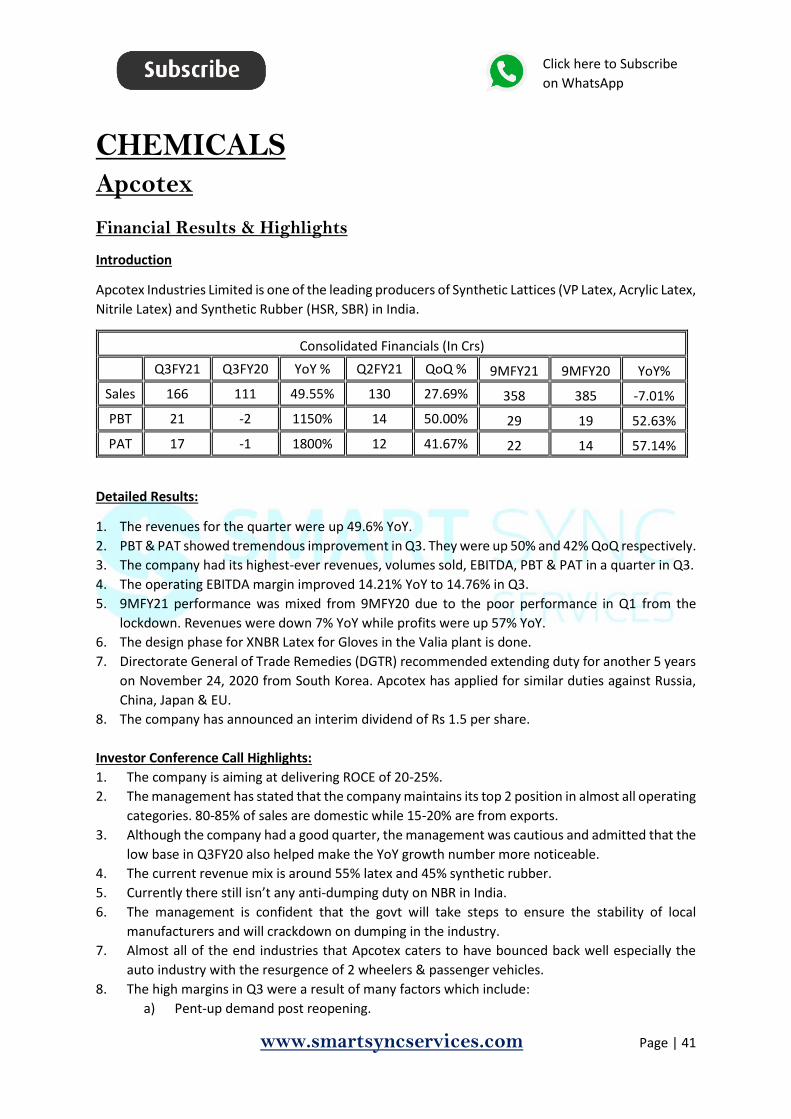
www.smartsyncservices.com Page | 41
Click here to Subscribe
on WhatsApp
CHEMICALS Apcotex
Financial Results & Highlights
Introduction
Apcotex Industries Limited is one of the leading producers of Synthetic Lattices (VP Latex, Acrylic Latex,
Nitrile Latex) and Synthetic Rubber (HSR, SBR) in India.
Consolidated Financials (In Crs)
Q3FY21 Q3FY20 YoY % Q2FY21 QoQ % 9MFY21 9MFY20 YoY%
Sales 166 111 49.55% 130 27.69% 358 385 -7.01%
PBT 21 -2 1150% 14 50.00% 29 19 52.63%
PAT 17 -1 1800% 12 41.67% 22 14 57.14%
Detailed Results:
1. The revenues for the quarter were up 49.6% YoY.
2. PBT & PAT showed tremendous improvement in Q3. They were up 50% and 42% QoQ respectively.
3. The company had its highest-ever revenues, volumes sold, EBITDA, PBT & PAT in a quarter in Q3.
4. The operating EBITDA margin improved 14.21% YoY to 14.76% in Q3.
5. 9MFY21 performance was mixed from 9MFY20 due to the poor performance in Q1 from the
lockdown. Revenues were down 7% YoY while profits were up 57% YoY.
6. The design phase for XNBR Latex for Gloves in the Valia plant is done.
7. Directorate General of Trade Remedies (DGTR) recommended extending duty for another 5 years
on November 24, 2020 from South Korea. Apcotex has applied for similar duties against Russia,
China, Japan & EU.
8. The company has announced an interim dividend of Rs 1.5 per share.
Investor Conference Call Highlights:
1. The company is aiming at delivering ROCE of 20-25%.
2. The management has stated that the company maintains its top 2 position in almost all operating
categories. 80-85% of sales are domestic while 15-20% are from exports.
3. Although the company had a good quarter, the management was cautious and admitted that the
low base in Q3FY20 also helped make the YoY growth number more noticeable.
4. The current revenue mix is around 55% latex and 45% synthetic rubber.
5. Currently there still isn’t any anti-dumping duty on NBR in India.
6. The management is confident that the govt will take steps to ensure the stability of local
manufacturers and will crackdown on dumping in the industry.
7. Almost all of the end industries that Apcotex caters to have bounced back well especially the
auto industry with the resurgence of 2 wheelers & passenger vehicles.
8. The high margins in Q3 were a result of many factors which include:
a) Pent-up demand post reopening.

www.smartsyncservices.com Page | 42
Click here to Subscribe
on WhatsApp
b) Construction industry rising post monsoons.
c) Low raw material prices.
d) Better product mix with a shift towards latex.
9. Q3 capacity utilization was at 90-95% across all lines for Apcotex.
10. The debottlenecking project in Taloja is expected to be done by May or June 2021.
11. The company has plans ready to double NBR capacity but the management decided to pause it
till the situation regarding dumping gets better.
12. During the year when the demand for construction and plastic products was low the company
was able to repurpose the spare capacity to make XNB latex for gloves which has since grown
tremendously in demand.
13. Currently 8% to 10% comes from XNB latex for gloves. The company is planning to expand this
steadily and also invest in developing adjacent products.
14. Most projections show that the glove industry is going to do extremely well in the next 3 to 4
years. The full capacity sales from the XNB project is expected to be Rs 300-350 Cr per year.
15. In Phase 1, the full capacity revenue generation is at Rs 100 Cr for XNB.
16. In the 45% sales from synthetic rubber, 35% is from NBR and 10% is from high styrene rubber. In
NBR, around half is from auto and the rest is from other applications.
17. In the 55% sales from latex, 20% is from paper, 10% is from construction, 10% is from tires, 10%
is from nitrile latex where 7-8% is from textiles.
18. Volumes growth in Q3 was above 40% YoY.
19. In NBR imports, 40-50% of imports come from South Korea and 40% come from Japan, China,
Russia and EU combined.
20. Apcobuild is still a small part of the overall sales for the company and although it has been
growing, the company is looking to build it slowly and profitably due to high competition and the
rigors of building up a portfolio and distribution network in the space. It is now operating in
Maharashtra, Gujarat and Goa only.
21. The management looks to maintain an asset turn of at least between 3% and 5% turnover ratio
when there are new investments for expansion. This can rise to up to 7 times once the expansions
are fully integrated.
22. The current quarter was also the best on record in terms of EBITDA per ton for Apcotex.
23. According to the management, the 2 main core competencies for Apcotex are:
a) The wide range of products on offer with the capability to switch between products with
the same machinery.
b) The depth of knowledge about customer technology and processes enabling products to
evolve with customer preferences.
24. Raw material costs will continue to for at least 60-70% of costs for the company as it is a B2B
business and it will stay so unless the company changes its business model.
25. The company remains cash positive and has liquid reserves above Rs 20 Cr.
26. The management has stated that the projected new capacities will come online in a step by step
fashion and these steps have been planned to be able to meet expected demand at different
points in the upcoming timeline. The only factor that can delay the demand expectations is
customer approvals.

www.smartsyncservices.com Page | 43
Click here to Subscribe
on WhatsApp
Analyst’s View:
Apcotex is one of the very few synthetic rubber makers in India. The company had its best ever quarter
with its highest revenues, sales volumes, EBITDA and profits on record. The margins have also risen
above 14% for the company due to better product mix and low RM prices. The company is now
focusing on capitalizing on the strong demand for gloves and is concentrating on expanding sales for
XNB latex for gloves. The antidumping petition by the company is still pending approval and this has
caused the management to maintain its pause on its plans to expand NBR production lines. It remains
to be seen how the demand for the company’s products changes going forward and whether the
current margins and demand profile remains sustainable. Nonetheless, given the company’s industry
leading position in the domestic market, the prudent management of the company, and the
management’s optimism from its on track Capex plans, Apcotex seems to be a good chemical stock to
watch out for.

www.smartsyncservices.com Page | 44
Click here to Subscribe
on WhatsApp
Galaxy Surfactants
Financial Results & Highlights
Brief Introduction:
Galaxy Surfactants is engaged in manufacturing of surfactants and other speciality ingredients for the
personal care and home care industries. The Company produces a range of vital cosmetic ingredients,
including active ingredients, ultra violet (UV) protection and functional products. Its products cater to
various brands in the fast moving consumer goods (FMCG) sector and offers in various applications,
including skin care, hair care, oral care, body wash, sun care, household cleaners and fabric care
segments. Galaxy Surfactants is a global leader supplying a wide range of innovative products to over
1750+ customers in 80+ countries.
Standalone Financials (In Crs)
Q3FY21 Q3FY20 YoY % Q2FY21 QoQ % 9MFY21 9MFY20 YoY%
Sales 456 438 4.11% 488 -6.56% 1306 1363 -4.18%
PBT 62 49 26.53% 78 -20.51% 186 170 9.41%
PAT 46 37 24.32% 58 -20.69% 138 136 1.47%
Consolidated Financials (In Crs)
Q3FY21 Q3FY20 YoY % Q2FY21 QoQ % 9MFY21 9MFY20 YoY%
Sales 678 629 7.79% 723 -6.22% 2009 1946 3.24%
PBT 103 63 63% 106 -2.83% 279 207 34.78%
PAT 85 48 77% 82 3.66% 223 168 32.74%
Detailed Results:
1. Consolidated revenues grew 8% YoY in Q3.
2. EBITDA for Q3 grew 43.3% YoY while PAT grew 77% YoY driven by increasing share of specialty,
better product mix due to new products, and higher capacity utilization.
3. EBITDA margin improved 450 bps YoY to 18.1% in Q3.
4. Fatty alcohol prices went up to $1588/MT from $1228 in Q2 and $1188 last year.
5. Volume growth in different geographies in Q3FY21 is as follows:
a. India: Up 14.4% YoY
b. AMET: Up 2.9% YoY
c. Rest of the World: Up 4.3% YoY
d. Total: Up 7.3% YoY
6. In Q3, revenue growth in the performance surfactant division was 3.7% YoY while specialty care
products grew 14.1% YoY. Volumes for the PS division grew 4.7% YoY while SCP division volumes
grew 12% YoY.
7. The company currently has 78 approved patents and 13 are under application as of date.
8. The Board has declared an interim dividend of Rs. 14 per share.
9. EBITDA/Ton excluding export incentives in Q3 was at Rs 18,632.

www.smartsyncservices.com Page | 45
Click here to Subscribe
on WhatsApp
10. 9M performance was similarly good with revenue rise of 3% and PAT rise of 33% YoY.
11. Volumes in 9M grew 4.2% YoY. EBITDA/ton was at Rs 19,620 vs Rs 16,387 last year.
Investor Conference Call Highlights
1. Demand remains resilient and with vaccination drive gaining traction, focus on health and
hygiene remains strong in both masstige as well as premium specialty products.
2. Pricing vulnerability in raw material prices & supply chain disruptions pose the biggest risks in
servicing this underlying demand.
3. Galaxy’s new products in the nontoxic preservation, sulfate-free, and proteins range accounted
for 5% of revenues in Q3.
4. The company has also seen a strong improvement in business share with non-MNC customers.
5. T1 revenue share is now down to 50.4% from 63.8% in Q1.
6. The management has reiterated that growth for galaxy will be driven by proteins, mild
surfactants, nontoxic preservatives & syndet, and transparent bathing bars which have gained a
lot of visibility lately.
7. The growth taper in AMET was mainly due to supply chain disruptions which reduced sales in Q3.
8. The EBITDA/ton is expected to continue growing slowly as the pie of specialty products grows for
Galaxy.
9. Depending on the capex requirements, the company will keep increasing or decreasing the
dividend payout accordingly.
10. The company has restarted 3 capex projects which were put on hold due to COVID-19. They are:
a) CapEx at Tarapur for new products
b) Expansion of R&D center in Vashi
c) Mild surfactants and nontoxic conservatives in Jhagadia
11. The company intended to spend around Rs 150 Cr in capex on the above projects but has only
been able to do around Rs 70-75 Cr so far. The rest will be pushed on to FY22.
12. The company is aiming to maintain a yearly capex rate of Rs 100-150 Cr going forward.
13. The management maintains guidance on volume growth at 5-8% per year.
14. Fatty alcohol is close to about 60% to 65% of total RM consumption.
15. The management assured that all increases in RM costs are passed on to the customer.
16. The major issue for the industry is going to be the container shortage which is expected to last
till June.
17. Fatty alcohol prices have risen above $2000 currently.
18. The management says that Galaxy is on the lookout all the time to unearth good opportunities
for acquisition that is in line with its strategy.
19. The management has stated that the EBITDA/ton for new products is greater than the average
number. Due to long product cycles, as these new products will rise in share and volumes, it will
also cause EBITDA/ton to rise.

www.smartsyncservices.com Page | 46
Click here to Subscribe
on WhatsApp
Analyst’s View:
Galaxy Surfactants is one of the most consistent specialty chemical makers in India. The company has
done well to achieve good revenue & profit growth in Q3 and has managed to increase EBITDA/ton
due to increased utilization and launch of new products. The company saw revenue growth despite
modest volume growth mainly due to the continued rise in fatty alcohol prices and rising demand for
specialty products. The company has seen good growth coming from India as demand comeback was
strong for all tiers of customers. The company is expecting sustained demand for its products going
forward due to the renewed focus on health & hygiene and the new products of nontoxic
preservatives and mild surfactants. The only credible concerns for the company are RM inflation and
supply chain issues arising from the ongoing container shortage. It remains to be seen how the whole
container situation will pan out going forward and whether the focus on health and hygiene is going
to stay or not post COVID. Nonetheless, given the company’s robust product portfolio and the ever-
increasing list of both FMCG majors and niche specialty product makers, Galaxy Surfactants remains a
good stock to watch out for in the specialty chemicals space.
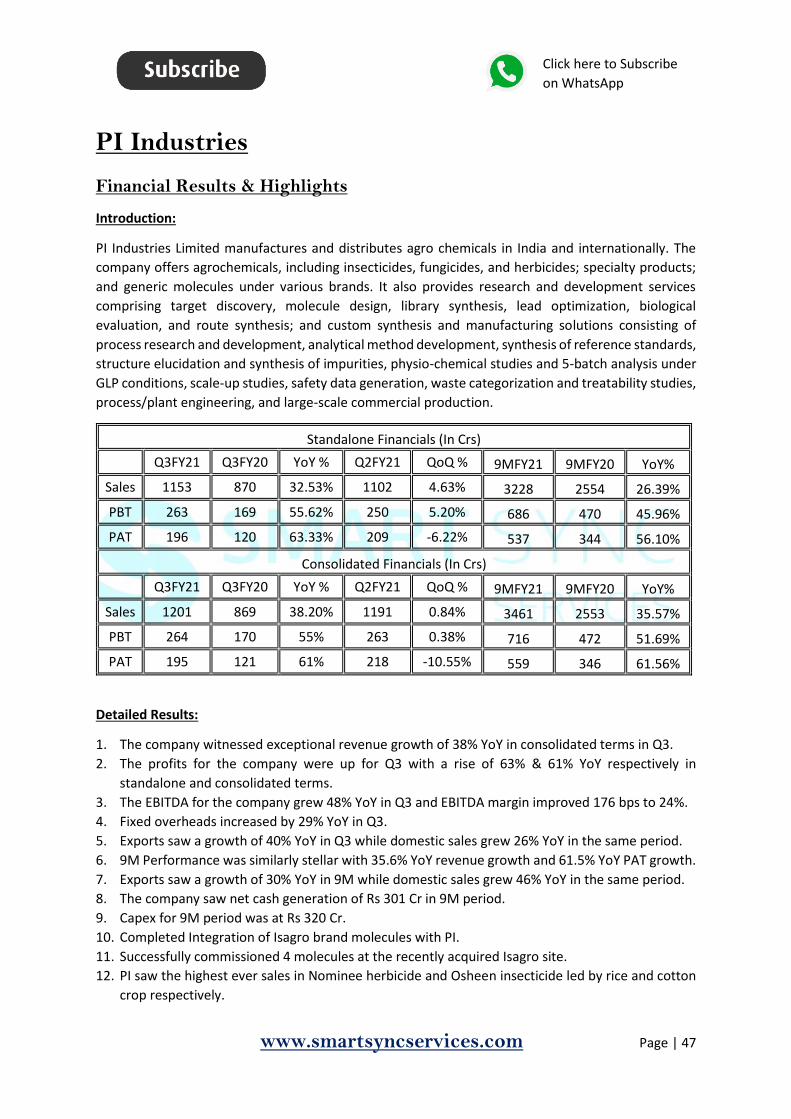
www.smartsyncservices.com Page | 47
Click here to Subscribe
on WhatsApp
PI Industries
Financial Results & Highlights
Introduction:
PI Industries Limited manufactures and distributes agro chemicals in India and internationally. The
company offers agrochemicals, including insecticides, fungicides, and herbicides; specialty products;
and generic molecules under various brands. It also provides research and development services
comprising target discovery, molecule design, library synthesis, lead optimization, biological
evaluation, and route synthesis; and custom synthesis and manufacturing solutions consisting of
process research and development, analytical method development, synthesis of reference standards,
structure elucidation and synthesis of impurities, physio-chemical studies and 5-batch analysis under
GLP conditions, scale-up studies, safety data generation, waste categorization and treatability studies,
process/plant engineering, and large-scale commercial production.
Standalone Financials (In Crs)
Q3FY21 Q3FY20 YoY % Q2FY21 QoQ % 9MFY21 9MFY20 YoY%
Sales 1153 870 32.53% 1102 4.63% 3228 2554 26.39%
PBT 263 169 55.62% 250 5.20% 686 470 45.96%
PAT 196 120 63.33% 209 -6.22% 537 344 56.10%
Consolidated Financials (In Crs)
Q3FY21 Q3FY20 YoY % Q2FY21 QoQ % 9MFY21 9MFY20 YoY%
Sales 1201 869 38.20% 1191 0.84% 3461 2553 35.57%
PBT 264 170 55% 263 0.38% 716 472 51.69%
PAT 195 121 61% 218 -10.55% 559 346 61.56%
Detailed Results:
1. The company witnessed exceptional revenue growth of 38% YoY in consolidated terms in Q3.
2. The profits for the company were up for Q3 with a rise of 63% & 61% YoY respectively in
standalone and consolidated terms.
3. The EBITDA for the company grew 48% YoY in Q3 and EBITDA margin improved 176 bps to 24%.
4. Fixed overheads increased by 29% YoY in Q3.
5. Exports saw a growth of 40% YoY in Q3 while domestic sales grew 26% YoY in the same period.
6. 9M Performance was similarly stellar with 35.6% YoY revenue growth and 61.5% YoY PAT growth.
7. Exports saw a growth of 30% YoY in 9M while domestic sales grew 46% YoY in the same period.
8. The company saw net cash generation of Rs 301 Cr in 9M period.
9. Capex for 9M period was at Rs 320 Cr.
10. Completed Integration of Isagro brand molecules with PI.
11. Successfully commissioned 4 molecules at the recently acquired Isagro site.
12. PI saw the highest ever sales in Nominee herbicide and Osheen insecticide led by rice and cotton
crop respectively.
www.smartsyncservices.com Page | 48
Click here to Subscribe
on WhatsApp
13. 5-6 pipeline molecules at various stages of development to be commercialized in the coming FY.
14. Another MPP is planned to be made ready by Q4 FY21, thus enhancing the overall capacities.
15. The company maintained an order book of > $1.5 billion.
16. PI announced an interim dividend of Rs 3 per share.
Investor Conference Call Highlights:
1. Capacity utilization building has almost come back to the pre-COVID levels.
2. The management maintains the growth guidance of 20-25% for the CSM business.
3. PI’s residual brand portfolio has seen domestic growth of 17% YoY and Isagro has grown 26% YoY.
4. The company currently has 2 options that it is actively evaluating for acquisition.
5. The management has stated that PI is ready to commercialize 12-15 new molecules in the next 2
years.
6. The pace of commercialization of new molecules has risen in the past 2 years as the R&D pipeline
has matured and the flow of new inquiries has gone up.
7. The management has stated that the current R&D pipeline will be geared more towards specialty
refined chemicals going forward.
8. The company has 15 lead scientists in the pharma division and it has 4 PhDs in the leadership
team.
9. The company is still evaluating opportunities for allocation of the QIP proceeds.
10. The management has stated that the company and the whole Agchem sector is expanding slowly
in the world and North America remains one of the biggest markets for the industry.
11. The management maintains that it has a good pipeline for the next 2 years and any capacity
expansion will probably be for some of these new products. Apart from building new capacity, the
company is also working on increasing throughput from existing capacity which would increase
capital efficiency of existing facilities.
12. The management has stated that growth opportunities for PI remain intact but capex intensity
may go down as the company uses technology initiatives for capacity expansion. The target is to
increase asset turnover above 2 times.
13. In a multi-product plant scenario, the management states that the ideal utilization rate should be
between 80-85%. The technological initiatives are taken to widen the existing capacity in current
plants and bring in room for expansion in utilization back to ideal levels.
14. The management states that the order book remaining stable at $1.5 billion should not be a cause
for concern as it is constrained by the asset base of the company and as PI gets larger and scalable
into products and deep over the relationships, the importance of order book gets declined.
15. Although the container shortage issue is seen as a challenge by the management, it doesn’t feel
that the shortage will have much impact on operations.
16. Employee costs will remain high as the company is looking to attract top talent but the
management is comfortable with it.
17. The company is also looking to implement digital technologies from IBM for data analysis and
processing to generate insights to drive throughput.
18. 20% of domestic growth comes from Isagro.
19. The company’s plan for the pharma space is to develop APIs and intermediaries to establish its
credentials and eventually graduate to the CDMO/CRAMS model.
20. The company hopes to highlight its complex chemistry capability and establish cost leadership in
less competitive and highly complex products in the pharma space to show its technology as its
key differentiator.
www.smartsyncservices.com Page | 49
Click here to Subscribe
on WhatsApp
21. The company has 24-25 products in the commercialization stage and around 40-45 products in
the synthesis stage.
22. Although valuations in the entire chemicals and pharma industry have gone up, the management
remains confident in its acquisition capabilities.
23. The share of the export business will continue to remain large as the international market is much
bigger than the domestic market.
24. The company currently has 15 multi-product plants.
25. The primary purpose for the evaluation of the current acquisition opportunities is to be able to
expedite the whole process of expanding into the pharma sector without time-consuming
activities like getting approvals and passing the regulations for its facilities.
26. The company has 3-4 specialty non-agro chemicals and 2-3 agrochemicals in the pipeline
currently.
27. The utilization level for the 2 new plants is at 80% and below 50% currently. The lower one is
expected to come up to 50% soon.
28. The management remains confident of sustaining the revenue growth rate of 18-20% in FY22 as
well.
29. The company has seen the application of Awkira to 1 Lac acres out of an opportunity size of 13
million acres which highlights good room for growth according to the management.
30. The management maintains that any acquisition that the company does will be EPS accretive.
31. The target for the expansion in specialty chemicals will be additives that will not be in food.
Analyst’s View:
PI Industries have been one of the most consistent performers in the agrichemicals business. The
company saw another stellar performance in Q3 on the back of sustained sales momentum in both
domestic and export markets and the completed integration of Isagro. The company is evaluating
options on how to use the Rs 2000 Cr through QIP. It is specifically looking for acquisition opportunities
in the pharma sector to expedite the process of expansion into this sector. PI already has 2 earmarked
opportunities that it is evaluating actively right now. It remains to be seen whether there are any
other disruptions in-store from the expansion into the pharma space and whether the company will
be able to match its lofty guidance for growth in all segments. Nonetheless, given the company’s
strong track record, strong tailwinds of the industry, a good agricultural season, and opportunities
arising from the China substitution phenomenon, PI Industries remains a pivotal agrichemical sector
stock to watch out for.
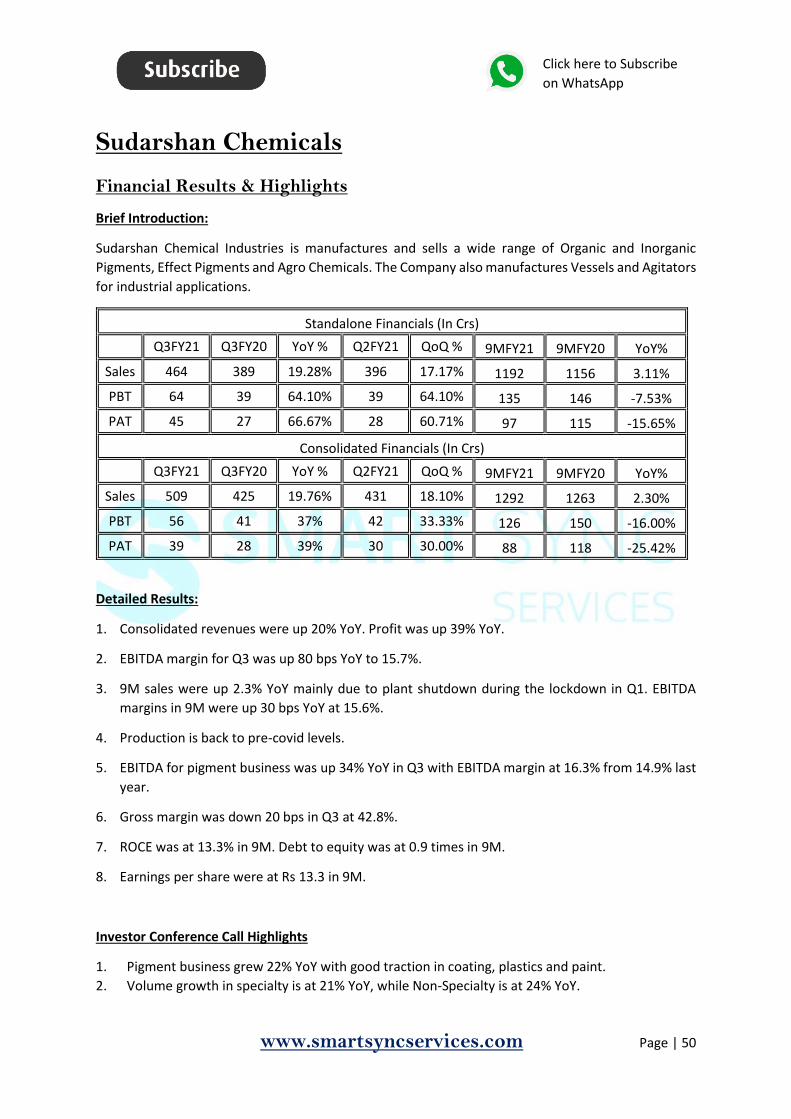
www.smartsyncservices.com Page | 50
Click here to Subscribe
on WhatsApp
Sudarshan Chemicals
Financial Results & Highlights
Brief Introduction:
Sudarshan Chemical Industries is manufactures and sells a wide range of Organic and Inorganic
Pigments, Effect Pigments and Agro Chemicals. The Company also manufactures Vessels and Agitators
for industrial applications.
Standalone Financials (In Crs)
Q3FY21 Q3FY20 YoY % Q2FY21 QoQ % 9MFY21 9MFY20 YoY%
Sales 464 389 19.28% 396 17.17% 1192 1156 3.11%
PBT 64 39 64.10% 39 64.10% 135 146 -7.53%
PAT 45 27 66.67% 28 60.71% 97 115 -15.65%
Consolidated Financials (In Crs)
Q3FY21 Q3FY20 YoY % Q2FY21 QoQ % 9MFY21 9MFY20 YoY%
Sales 509 425 19.76% 431 18.10% 1292 1263 2.30%
PBT 56 41 37% 42 33.33% 126 150 -16.00%
PAT 39 28 39% 30 30.00% 88 118 -25.42%
Detailed Results:
1. Consolidated revenues were up 20% YoY. Profit was up 39% YoY.
2. EBITDA margin for Q3 was up 80 bps YoY to 15.7%.
3. 9M sales were up 2.3% YoY mainly due to plant shutdown during the lockdown in Q1. EBITDA
margins in 9M were up 30 bps YoY at 15.6%.
4. Production is back to pre-covid levels.
5. EBITDA for pigment business was up 34% YoY in Q3 with EBITDA margin at 16.3% from 14.9% last
year.
6. Gross margin was down 20 bps in Q3 at 42.8%.
7. ROCE was at 13.3% in 9M. Debt to equity was at 0.9 times in 9M.
8. Earnings per share were at Rs 13.3 in 9M.
Investor Conference Call Highlights
1. Pigment business grew 22% YoY with good traction in coating, plastics and paint.
2. Volume growth in specialty is at 21% YoY, while Non-Specialty is at 24% YoY.

www.smartsyncservices.com Page | 51
Click here to Subscribe
on WhatsApp
3. The gross margins were lower YoY in Q3 because of lower export benefits and lag in passing on
incremental cost rises to customers.
4. The management expects the demand environment to remain robust in the coming quarters as
the Indian as well as world economy returns to normalcy.
5. Domestic to export mix for pigment sales was at 56:44.
6. The company has accelerated its capex projects for the new product launches. It is expected to
launch 4 or 5 high-performance pigments and a total of 20-25 products in the next year.
7. The company is looking to expand its market reach in key export destinations like Japan, USA, EU
& South East Asia.
8. The management has stated that as the product mix shifts to higher margin products, overall
gross margins should improve going forward. The full impact of these changes will be visible in a
few years.
9. Despite being cost leaders, the fall in gross margins was accompanied by a rise in EBITDA margins.
This is mainly due to changing product mix and focus on specialized business.
10. The company is looking to do a full-blown launch for yellow 128 in H1FY22.
11. The company is looking to complete the launch of the inorganic compound in March as scheduled
but the Sep product launch is expected to be delayed by 1-2 months.
12. The bookings for plastic and inks have been robust from Asia and India but they have been
subdued from USA & EU due to the ongoing 2nd wave of COVID-19.
13. The company is looking at asset turnover of 2.5 times from the new product launches at full scale.
14. The full scale benefit from the completion of capex projects is expected to be realized in 2-3 years
after completion.
15. The newly launched products are expected to account for 15-20% of sales going forward.
16. The MEIS impact for Q3 was at Rs 2.4 Cr.
Analyst’s View:
Sudarshan Chemicals is one of the largest pigment makers in the world. The company has had a good
Q3 with domestic demand coming back robustly and export demand remaining resilient. It also has a
launch schedule for 20-25 new products including 5 high-performance pigments in FY22. Sudarshan
was also able to increase EBITDA margins despite a slight fall in gross margin. This was mainly due to
the shift to a better product mix. It is also doing well to focus on expanding market reach in fast-
growing export markets and associating with key players in the ever-rising domestic paints industry.
It remains to be seen how the new products are received for the company and how long will it take
for the company to reach its goal of cracking the global top 3 in the pigment industry. Nonetheless,
given the company a strong position in both domestic and export markets and its steadily improving
margins due to an improving product portfolio, Sudarshan Chemicals is a pivotal chemical sector stock
to watch out for.
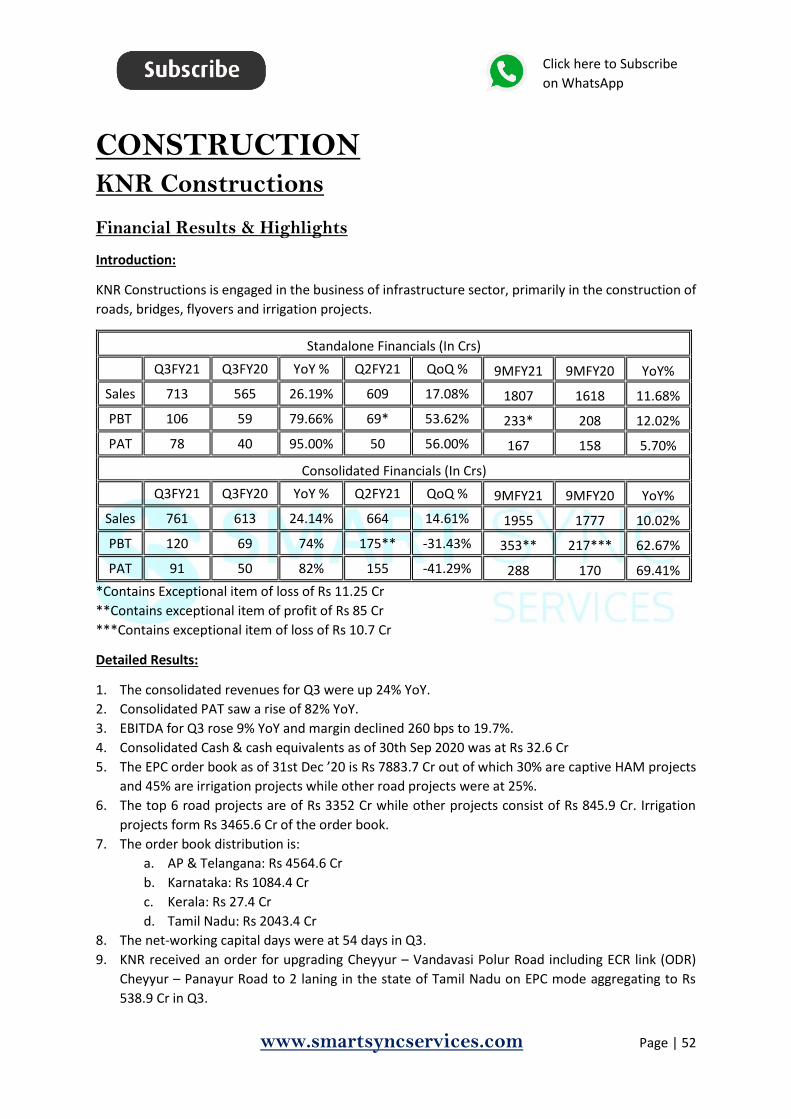
www.smartsyncservices.com Page | 52
Click here to Subscribe
on WhatsApp
CONSTRUCTION KNR Constructions
Financial Results & Highlights
Introduction:
KNR Constructions is engaged in the business of infrastructure sector, primarily in the construction of
roads, bridges, flyovers and irrigation projects.
Standalone Financials (In Crs)
Q3FY21 Q3FY20 YoY % Q2FY21 QoQ % 9MFY21 9MFY20 YoY%
Sales 713 565 26.19% 609 17.08% 1807 1618 11.68%
PBT 106 59 79.66% 69* 53.62% 233* 208 12.02%
PAT 78 40 95.00% 50 56.00% 167 158 5.70%
Consolidated Financials (In Crs)
Q3FY21 Q3FY20 YoY % Q2FY21 QoQ % 9MFY21 9MFY20 YoY%
Sales 761 613 24.14% 664 14.61% 1955 1777 10.02%
PBT 120 69 74% 175** -31.43% 353** 217*** 62.67%
PAT 91 50 82% 155 -41.29% 288 170 69.41%
*Contains Exceptional item of loss of Rs 11.25 Cr
**Contains exceptional item of profit of Rs 85 Cr
***Contains exceptional item of loss of Rs 10.7 Cr
Detailed Results:
1. The consolidated revenues for Q3 were up 24% YoY.
2. Consolidated PAT saw a rise of 82% YoY.
3. EBITDA for Q3 rose 9% YoY and margin declined 260 bps to 19.7%.
4. Consolidated Cash & cash equivalents as of 30th Sep 2020 was at Rs 32.6 Cr
5. The EPC order book as of 31st Dec ’20 is Rs 7883.7 Cr out of which 30% are captive HAM projects
and 45% are irrigation projects while other road projects were at 25%.
6. The top 6 road projects are of Rs 3352 Cr while other projects consist of Rs 845.9 Cr. Irrigation
projects form Rs 3465.6 Cr of the order book.
7. The order book distribution is:
a. AP & Telangana: Rs 4564.6 Cr
b. Karnataka: Rs 1084.4 Cr
c. Kerala: Rs 27.4 Cr
d. Tamil Nadu: Rs 2043.4 Cr
8. The net-working capital days were at 54 days in Q3.
9. KNR received an order for upgrading Cheyyur – Vandavasi Polur Road including ECR link (ODR)
Cheyyur – Panayur Road to 2 laning in the state of Tamil Nadu on EPC mode aggregating to Rs
538.9 Cr in Q3.
www.smartsyncservices.com Page | 53
Click here to Subscribe
on WhatsApp
Investor Conference Call Highlights:
1. Infrastructure companies across the board have witnessed a marked improvement in execution
during Q3 FY '21 due to a fast bounce back in labour availability to pre-COVID levels and
smoothening of raw material, supply chain, and passage of monsoon season.
2. The Ministry of Road Transport and Highways has initiated a series of relief messages like a shift
from milestone-based billing to typically used -- to rate within 45 to 75 days to monthly billing,
which significantly helped to ease the pressure on working capital inventory for the industry.
3. Considering the huge capital bid pipeline of INR 72,000 crore and in the second half of Q4
historically witnessing a substantial awarding, the management expects significant order inflows
for the road and highway success in the near term as well during FY '22.
4. The government envisages the development of 34,800 km of highways for INR 5.345 lakh crore
under the Bharatmala Pariyojana. So far, the contract has been awarded for a length of 13,531 km
road. And the detailed project report for 16,500 km is currently in the pipeline.
5. Toll collections have risen 12-13% in Q3 implying growth in road traffic of 8-9%. According to ICRA,
toll collections are likely to grow 14% to 15% in FY '22 on a low base in FY '21 as the traffic stands
may just increase by 5% and toll rates are expected to increase by 3% to 4%.
6. With more than 2.5 crore users, FASTag currently contributes about 80% of the total toll collection.
7. The physical progress on KNR’s 5 ongoing HAM projects is:
1. Chittoor to Mallavaram is at 72.1%,
2. Ramsanpalle to Mangalore is at 64.2%,
3. Trichy to Kallagam at 58.9%,
4. Magadi to Somwarpet at 22.4%,
5. Oddanchatram to Madathukulam at 14%.
8. Out of INR 624.28 crore, equity requirement for all HAM projects, KNR has already invested INR
345.51 crore as of December 31, 2020. Its incremental equity requirement stands at INR 90 crore,
INR 139 crore, and INR 50 crores for FY '21, FY '22, and FY '23, respectively.
9. KNR’s non-captive order book, which accounts for 70% of the total order book, is skewed between
State Government contracts with 51%, whereas 3% is from Central Government and the balance
15% is from other players.
10. The company has gotten back Rs 540 Cr of dues from Telangana already. Around Rs 140 Cr is due
currently.
11. KNR is targeting a further order inflow of around INR 3,000 crores to INR 4,000 crore in the rest of
FY21.
12. The management maintains its revenue guidance of Rs 2400 Cr for FY21.
13. The total order inflow in 9M FY21 was Rs 4000 Cr.
14. KNR has bid for 15 projects including 1 EPC project and it expects to bag at least 2-3 projects. Thus
the management is confident of bringing in orders of Rs 3000-4000 Cr in Q4.
15. KNR has done 5 major flyovers in the past which should add to its qualifications when bidding for
urban infra projects and metro projects.
16. Standalone gross debt for KNR is at Rs 16 Cr. The company has a standalone net cash balance of Rs
43 Cr.
17. The management has stated that interest costs may stay at Rs 5-6 Cr per year going forward.
www.smartsyncservices.com Page | 54
Click here to Subscribe
on WhatsApp
18. The management has stated that it maintains EBITDA margin guidance of 17-18% and that margin
in Q3 was high due to the high proportion of irrigation projects which made up 45% of the order
book. As the irrigation projects come down so will the margin profile.
19. The company is looking to complete 3 of its ongoing HAM projects by end of Q1 or Q2.
20. Consolidated debt is at Rs 750 Cr and the cash balance is at Rs 75 Cr.
21. KNR has done capex of Rs 60 Cr in 9MFY21 and expects this number to rise to Rs 100 Cr for FY21.
22. The company has receivables of Rs 333 Cr sitting on the books currently.
23. The management is guiding for capex of Rs 100-120 Cr in FY22.
24. The majority of the current order book should be completed by June 2021.
25. The company is in talks with Cube Highways for a deal to sell the 3 soon-to-be-completed HAM
projects. This is so that KNR may be able to complete the sale as soon as the new regulation allows
which is 6 months from the Completion Date.
26. The Mallana project is 90% complete. The customer is asking KNR to complete this project by June
or July but the management has stated that it will probably be done by March 2022 due to land
acquisition issues.
27. The management has stated that some price escalation is already built in the contract for EPC
projects. Although this may not mitigate the whole rise in commodity costs, it can cover up to 50-
60% of the rise. HAM projects have inflation built in using CPI and WPI to some extent.
28. Mallana Sagar is expected to be done in 2021 while Navayuga is expected to be done in 2022.
29. The EPC project that KNR is currently bidding for is Rs 1000 Cr.
30. The total order book that KNR has submitted bids for is Rs 21000 Cr including the above EPC project.
31. The company has already executed orders of above Rs 1500 Cr and the management is confident
of being able to execute Rs 2000 Cr orders as well.
32. Given the emphasis on infra by the govt, the management expects revenues to double in 2.5-3
years. It also expects the industry to grow at a CAGR of 15-20% going forward for the next 4-5 years.
Analyst’s View:
KNR has been one of the top performers in the construction industry. KNR has seen a phenomenal
quarter with a 24% YoY rise in revenues. The company has done well to source a new HAM project
and is looking to replace the 3 HAM projects that will be over in the next 6-8 months. It is already
bidding for new projects and has made bids for orders of Rs 21000 Cr. It has also started talks with
Cube for the sale of the 3 HAM projects which will be over soon. It remains to be seen how the industry
will fare going forward and how long will it take for the Govt’s push in infrastructure to gain proper
momentum. Nonetheless, given its strong balance sheet, good operational history, and resilient order
book, KNR Constructions remains a pivotal construction sector stock to watch out for.

www.smartsyncservices.com Page | 55
Click here to Subscribe
on WhatsApp
CONSUMER ELECTRONICS Amber Enterprises
Financial Results & Highlights
Brief Introduction:
Amber Enterprises India is engaged in the business of manufacturing a versatile range of
products i.e. Air conditioners, microwave ovens, washing machines, refrigerators, heat
exchangers, sheet metal components etc. Currently, the Company has nine manufacturing
facilities in India out of which two manufacturing facilities are operating in tax exemption
zone.
Standalone Financials (In Crs)
Q3FY21 Q3FY20 YoY % Q2FY21 QoQ % 9MFY21 9MFY20 YoY%
Sales 584 570 2.46% 233 150.64% 1011 1963 -48.50%
PBT 27 6 350.00% -15 280.00% -17 77 -122.08%
PAT 18 12 50.00% -9 300.00% -9 65 -113.85%
Consolidated Financials (In Crs)
Q3FY21 Q3FY20 YoY % Q2FY21 QoQ % 9MFY21 9MFY20 YoY%
Sales 774 791 -2.15% 421 83.85% 1457 2656 -45.14%
PBT 40 24 67% -1 4100.00% 4 121 -96.69%
PAT 28 25 12% 3* 833.33% 7** 101 -93.07%
*Contains negative tax expense of Rs 3.4 Cr
**Contains negative tax expense of Rs 3 Cr
Detailed Results:
1. The company modest quarter with a decline of 2% YoY in consolidated revenues while
consolidated profits rose to Rs 28 Cr.
2. Operating EBITDA for Amber was at Rs 62 Cr with margin at 8.2%.
3. The consolidated revenue mix has remained unchanged from 55:45 to 54:46 in Q3 for RAC:
Components+Mobility respectively.
4. 9M revenue mix has come to 50:50 from 60:40.
5. Amber has signed 6 new customers since the import ban on Air conditioners with Refrigerants.
6. The Company has bought land in Supa region near Pune for its upcoming greenfield project.
Investor Conference Call Highlights:
1. The PLI scheme for ACs and components is of Rs 5000 Cr and details of this scheme are expected
to be finalized soon.
www.smartsyncservices.com Page | 56
Click here to Subscribe
on WhatsApp
2. Q3 FY21 revenues for Sidwal stood at Rs 44 Cr, operating EBITDA stood at Rs 9 Cr and margin stood
at 21.4%. 9M revenues for Sidwal stood at Rs 120 Cr with operating EBITDA of Rs 27 Cr with
operating EBITDA margin at 22.5%.
3. Revenues for PICL stood at Rs 35 Cr, operating EBITDA stood at Rs 3 Cr, and operating EBITDA
margin stood at 7.7%. The management expects some margin expansion over the next 2 to 3 years'
time.
4. Q3 revenue for IL JIN stood at Rs 91 Cr and in Ever stood at Rs 33 Cr. Operating EBITDA margin for
IL JIN stood at 6.3% and Ever stood at 6.6%. 9M revenue for IL JIN stood at Rs 189 Cr and Ever
revenue was at Rs 95 Cr, while operating EBITDA margin for IL JIN at 5.3% and for Ever at 3.8% in
the same period. IL JIN added 4 new customers and has a few more to be approved.
5. Volumes sold in Q3 were at 5,43,000 units vs 5,72,000 units last year.
6. Consolidated debt as of 31st Dec 2020 was at Rs 263 Cr vs Rs 343 Cr last year.
7. Industry inventory levels have dropped as most brands have pushed a lot of inventory into the
primary sales due to the expected cost increases of the product due to commodity and commodity
impacts.
8. The management has stated that any increase in RM costs will be passed on to end customers.
The company will be inserting this kind of price variation clause in all its orders soon.
9. The plot in Supa has an area of 10 acres and the company is constructing on 2.5 lac sq feet area
initially. It is also adjacent to Toshiba manufacturing plant and Carrier Midea plant. Commercial
production in the facility is expected to start by FY22.
10. The starting capacity for this plant is around 1 million units and some spare parts capacity.
11. The company will be submitting samples for top through window air conditioners in USA which is
very different from the models sold in India.
12. In overall, RM cost increases are expected to cause prices of finished goods to rise by 5-7%
according to the management.
13. The management doesn’t feel that a price increase is going to deter most customers as it would
be only around Rs 1500-2000. For someone who is looking to upscale from cooler to AC, such a
price increase may cause them to move to EMI schemes or postpone the purchase.
14. Currently Amber has an overall RAC market share of 24% and RAC ODM market share of almost
70%.
15. The company is seeing the opportunities from the import ban on finished goods to unfold in 2
phases. In Phase 1, the company will be supplying finished units to customers till they can set up
their manufacturing facilities. In Phase 2, once these customers have their manufacturing setup,
Amber can supply them with components for the unit manufacturing.
16. The validation phase in the components business takes around 18-24 months and thus the uptake
from the components is expected to start rising in 2-3 years.
17. There are a total of 15 manufacturers who are servicing a market of 7 million units per year in
India.
18. Sidwal has grabbed 2 or 3 new orders worth Rs 120 Cr in Q3. The current order book for Sidwal is
at Rs 400 Cr which is expected to be executed within the next 2 years.
19. The management is also expecting custom duty increases on the component side and the
unfinished goods side.
20. The company has recently started commercial air conditioner line with 3.5- and 4.5-ton units. The
company will also be adding 22 new products in this segment in the next 2 years catering to
commercial and industrial applications.
21. Mobility applications now account for 5.5% of total revenues for Amber.
www.smartsyncservices.com Page | 57
Click here to Subscribe
on WhatsApp
22. The company will be the first ODM in the commercial AC space and it is thus expecting good
response.
23. Exports now account for 20% of PICL revenues. The management expect this number to rise to
30-35% in next 2 years.
24. Capex guidance is for Rs 300 Cr for the next 2 years for the expansion of the 2 new sites.
25. The local procurement of components for the RAC space accounts for only 25% of industry
demand. the PLI scheme is looking to increase this number to 75%in the next 5 years.
26. The management has stated that setting up a 2 million units’ capacity compressor plant from
scratch will take around 18-24 months and Rs 250 Cr.
27. The company has already gotten an order from Voltas Beko for refrigerator and washing machine
components. It has also gotten 2 customers for washing machine motors.
28. In washing machines, Amber is supplying tub assemblies, inverter PCB board, injection molding
components, and motors which account for around 25% of washing machine manufacturing.
29. In refrigerators, Amber is doing sheet metals, door liner and case liners, and electronics. All of
these account for 20-25% of refrigerator manufacturing.
30. The components are being supplied for semi-auto and top-loading washing machines only.
31. The management expects around 10-15% of revenues to come from exports in the next 4-5 years.
Analyst’s View:
Amber Enterprises has cemented its position as a prime AC and white good components manufacturer
in India. The performance of the quarter was good with recovery back to Q3FY20 levels in both sales
and volumes. The demand for components has been steadily rising and the company is also looking
to supply components for other consumer electronics like washing machines and refrigerators. The
management has clearly outlined how the company plans to take the opportunities arising from the
import ban on finished goods. It remains to be seen how the industry demand will be affected by the
rise in RM costs and whether the company will be able to achieve its optimistic expectations in the
exports and components space. Nonetheless, given the massive opportunity size from import
substitution, the growth prospects of the industry, and the company’s dominant position in the ODM
market, Amber Enterprises remains a pivotal stock in the fast-rising air conditioning industry.
However, the current valuation appears to be very stretched for the company.
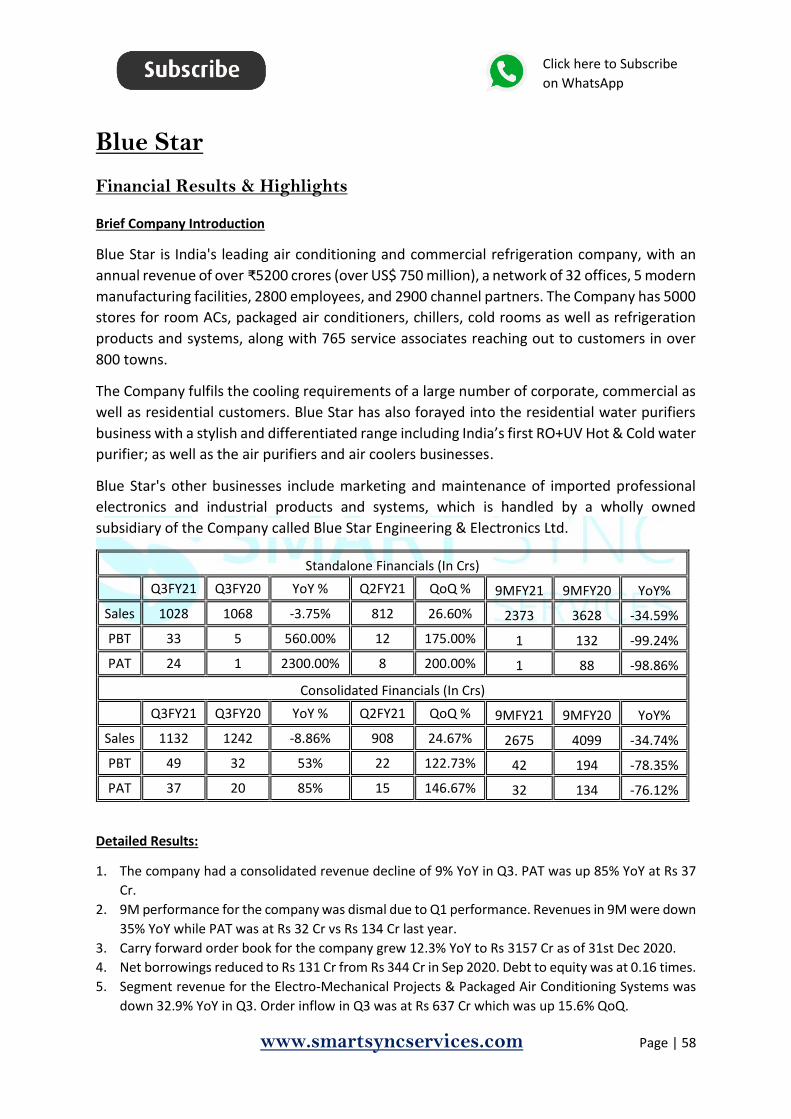
www.smartsyncservices.com Page | 58
Click here to Subscribe
on WhatsApp
Blue Star
Financial Results & Highlights
Brief Company Introduction
Blue Star is India's leading air conditioning and commercial refrigeration company, with an
annual revenue of over ₹5200 crores (over US$ 750 million), a network of 32 offices, 5 modern
manufacturing facilities, 2800 employees, and 2900 channel partners. The Company has 5000
stores for room ACs, packaged air conditioners, chillers, cold rooms as well as refrigeration
products and systems, along with 765 service associates reaching out to customers in over
800 towns.
The Company fulfils the cooling requirements of a large number of corporate, commercial as
well as residential customers. Blue Star has also forayed into the residential water purifiers
business with a stylish and differentiated range including India’s first RO+UV Hot & Cold water
purifier; as well as the air purifiers and air coolers businesses.
Blue Star's other businesses include marketing and maintenance of imported professional
electronics and industrial products and systems, which is handled by a wholly owned
subsidiary of the Company called Blue Star Engineering & Electronics Ltd.
Standalone Financials (In Crs)
Q3FY21 Q3FY20 YoY % Q2FY21 QoQ % 9MFY21 9MFY20 YoY%
Sales 1028 1068 -3.75% 812 26.60% 2373 3628 -34.59%
PBT 33 5 560.00% 12 175.00% 1 132 -99.24%
PAT 24 1 2300.00% 8 200.00% 1 88 -98.86%
Consolidated Financials (In Crs)
Q3FY21 Q3FY20 YoY % Q2FY21 QoQ % 9MFY21 9MFY20 YoY%
Sales 1132 1242 -8.86% 908 24.67% 2675 4099 -34.74%
PBT 49 32 53% 22 122.73% 42 194 -78.35%
PAT 37 20 85% 15 146.67% 32 134 -76.12%
Detailed Results:
1. The company had a consolidated revenue decline of 9% YoY in Q3. PAT was up 85% YoY at Rs 37
Cr.
2. 9M performance for the company was dismal due to Q1 performance. Revenues in 9M were down
35% YoY while PAT was at Rs 32 Cr vs Rs 134 Cr last year.
3. Carry forward order book for the company grew 12.3% YoY to Rs 3157 Cr as of 31st Dec 2020.
4. Net borrowings reduced to Rs 131 Cr from Rs 344 Cr in Sep 2020. Debt to equity was at 0.16 times.
5. Segment revenue for the Electro-Mechanical Projects & Packaged Air Conditioning Systems was
down 32.9% YoY in Q3. Order inflow in Q3 was at Rs 637 Cr which was up 15.6% QoQ.
www.smartsyncservices.com Page | 59
Click here to Subscribe
on WhatsApp
6. The Carried-forward order book of the Electro-Mechanical Projects business was Rs 2217 Cr as of
31st Dec 2020.
7. The commercial AC business saw a partial recovery in Q3. Major orders bagged in Q3FY21 were
from Avenue Supermart (All India), Food & Drug Laboratory (Baroda), Prime Hospital (Roorke),
ISRO Mahendragiri (Bangalore), and Larsen & Toubro Ltd (Bangalore).
8. Improved demand for cooling products in the Middle East markets enabled recovery for our
International Business during the quarter.
9. In the unitary products segment, the company saw revenue growth of 17.3% YoY in Q3. Segment
EBIT was up almost 5 times YoY at Rs 38.8 Cr.
10. RAC market in India grew 25% YoY in Q3. The company maintained a market share of 13% and
grew 32% YoY RAC business. It intends to participate in the RAC PLI scheme announced by the
Govt of India. Blue Star also announced a price increase between 4% to 6% with effect from
January 1, 2021.
11. The commercial refrigeration business saw good recovery with traction coming from investments
into the vaccination cold chain. Blue Star has been receiving orders from Government and private
sector players investing in the augmentation of the cold chain for the vaccine inoculation program.
12. The company bagged major orders in commercial refrigeration from SK Logistics, Metropolis, and
Riveraa Labs, Keimed and CMC, Vellore.
13. The Professional Electronics and Industrial Systems business saw revenue fall to Rs 45 Cr from Rs
57 Cr last year.
14. Opportunities from the BFSI sector for the Data Security Solutions business, increased order inflow
from the healthcare sector, a pick-up in orders from the industrial sector for material testing, and
growth in orders from the essential services of the government sector drove revenue during the
quarter.
Investor Conference Call Highlights:
1. Inquires in other markets such as SAARC, ASEAN and Africa improved during the quarter.
2. The upcoming Expo 2021 in Dubai is expected to offer good opportunities in the construction
sector for Blue Star.
3. The company owns 20 acres of land in Sri City, apart from potential expansion opportunities at
the Himachal Pradesh location.
4. There has been pre-buying going on at the dealer level in anticipation of a string summer and the
price rise of raw materials which is to be reflected in Q4.
5. The employee cost reduction taken by Blue Star is likely to be rolled back in the future as the
business recovers.
6. In the PLI scheme announced for RACs, around Rs 3000 Cr is expected to be for finished goods and
Rs 2000 Cr is expected to be for components.
7. The management doesn’t think that the recent ban on CBU imports has contributed significantly
to the market share rise for Blue Star. It has also stated that it has impacted mid and small-size
players mostly.
8. The PLI scheme for RACs is expected to be similar to the mobile PLI scheme. Both are expected to
run for 5 years.
9. The management sees the PLI scheme as a good opportunity to solidify its presence in the SAARC
and ASEAN regions.
10. Water purifier business is expected to become breakeven by the end of FY21.
www.smartsyncservices.com Page | 60
Click here to Subscribe
on WhatsApp
11. Margin profile is expected to remain stable in Q4 and there is also some room for overall growth
in the coming quarter according to management.
12. The company is making close to 100% of its IDUs in-house. It had also taken the buying decisions
for Q4 in Q3 itself so it was not affected too badly by the container shortage.
13. The container issues are expected to be normalized by March or April.
14. the cold chain opportunity for vaccination drives is expected to be Rs 200 Cr or more for Blue Star.
The vaccinations will be happening in phases and so the demand for this is not expected to be a
flash in the pan and will be spread out over many quarters.
15. The company may also operate under the PLI scheme for components and supply electronics for
RACs but it will not be looking to get into the compressor space as it has different economies of
scale and requires different levels of investment than Blue Star wants to do.
16. E-commerce sales were at 6% in Q3.
Analyst’s View:
Blue Star is one of the largest cooling solutions providers in the country. It is one of the biggest branded
players in the RAC market. The company has seen a decent recovery in revenues and profits for
Q3FY21. It saw a good recovery in the RAC business which also saw the company's market share rise
to 13%. The company has done well to rationalize inventory and order ahead for raw materials which
helped it stave off the threat from the container shortage. There are a few big opportunities for Blue
Star on the horizon like the RAC PLI scheme and the demand for the cold chain for vaccination drives.
It has also seen good growth in the water purifier segment where it expects to achieve breakeven by
the end of FY21. It remains to be seen whether the estimations of industry revival remain on track as
mentioned by the management and whether disruptions from container shortage and the rise in raw
material prices go away soon. Nonetheless, given the company’s strong market presence, its history
of completing EMP projects, and its robust presence in semi-urban and rural India, Blue Star is a pivotal
white goods stock to watch out for.
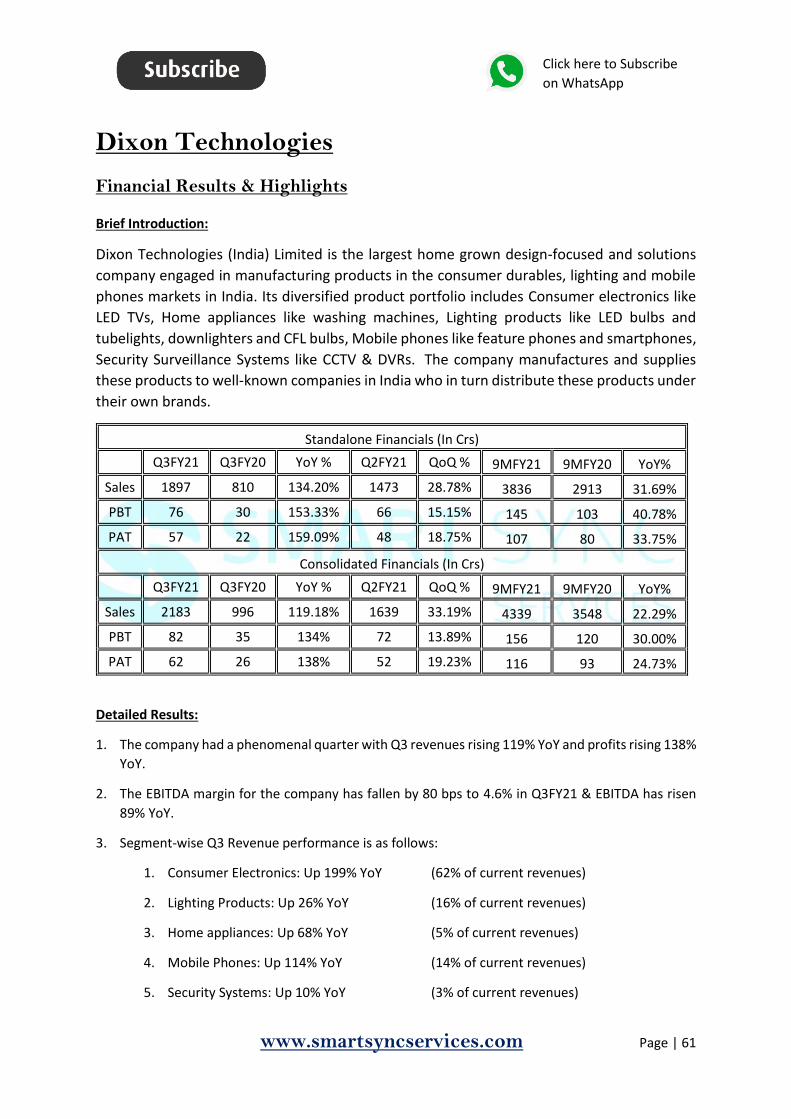
www.smartsyncservices.com Page | 61
Click here to Subscribe
on WhatsApp
Dixon Technologies
Financial Results & Highlights
Brief Introduction:
Dixon Technologies (India) Limited is the largest home grown design-focused and solutions
company engaged in manufacturing products in the consumer durables, lighting and mobile
phones markets in India. Its diversified product portfolio includes Consumer electronics like
LED TVs, Home appliances like washing machines, Lighting products like LED bulbs and
tubelights, downlighters and CFL bulbs, Mobile phones like feature phones and smartphones,
Security Surveillance Systems like CCTV & DVRs. The company manufactures and supplies
these products to well-known companies in India who in turn distribute these products under
their own brands.
Standalone Financials (In Crs)
Q3FY21 Q3FY20 YoY % Q2FY21 QoQ % 9MFY21 9MFY20 YoY%
Sales 1897 810 134.20% 1473 28.78% 3836 2913 31.69%
PBT 76 30 153.33% 66 15.15% 145 103 40.78%
PAT 57 22 159.09% 48 18.75% 107 80 33.75%
Consolidated Financials (In Crs)
Q3FY21 Q3FY20 YoY % Q2FY21 QoQ % 9MFY21 9MFY20 YoY%
Sales 2183 996 119.18% 1639 33.19% 4339 3548 22.29%
PBT 82 35 134% 72 13.89% 156 120 30.00%
PAT 62 26 138% 52 19.23% 116 93 24.73%
Detailed Results:
1. The company had a phenomenal quarter with Q3 revenues rising 119% YoY and profits rising 138%
YoY.
2. The EBITDA margin for the company has fallen by 80 bps to 4.6% in Q3FY21 & EBITDA has risen
89% YoY.
3. Segment-wise Q3 Revenue performance is as follows:
1. Consumer Electronics: Up 199% YoY (62% of current revenues)
2. Lighting Products: Up 26% YoY (16% of current revenues)
3. Home appliances: Up 68% YoY (5% of current revenues)
4. Mobile Phones: Up 114% YoY (14% of current revenues)
5. Security Systems: Up 10% YoY (3% of current revenues)
www.smartsyncservices.com Page | 62
Click here to Subscribe
on WhatsApp
6. Reverse Logistics: Down 3% YoY (0.2% of current revenues)
4. The company had a cash conversion cycle of 1 day.
5. It had a ROCE of 31.7% and ROE of 23.8%.
Investor Conference Call Highlights:
1. The EBITDA margin contraction in Q3 was primarily driven by a substantial change in the segment
mix with a higher increase in the share of business during the quarter from LED TVs and due to
certain input price increases.
2. The management expects the cost pressure to continue in the near to medium term.
3. The company has completed the automation of 1/3 of its capacity for LED bulbs.
4. It has also decided to expand capacity at a new site in Dehradun in an adjacent plot of land for
semi-automatic washing machines from 1.2 million to almost 1.6 million.
5. The plant in the Tirupati campus for fully automatic top loading is almost complete. The lines are
being laid, and the trials will begin in February and early March. It will have a capacity of 600,000
units.
6. Dixon has closed agreements with new global customers Motorola and Nokia. The commercial
production for Nokia has already started.
7. The capacity for smartphones is expected to be at 20 million units per year for the next 2 years
which should yield sales of Rs 25000-28,000 Cr in the next 5 years.
8. In set-top boxes, Dixon manufactured 9 lakhs set-top boxes for Jio, DISH, and SITI Cable in Q3. It
has an order book for 3-4 lac units per month for the next few quarters.
9. The order book and the forecast given by Motorola is consuming almost all of the ceiling that the
government offers in the mobile phone PLI scheme.
10. The management has stated that the business should become sustainable by the time the PLI
scheme is over in 2025 as the goal of the scheme is to create a stable environment for local
companies to be able to compete globally.
11. The management expects TV volumes sold to be at least 20-25% up from last year.
12. The main issue in the TV business is not the demand but it is the supply chain challenges like the
availability of open cell in glass.
13. The company is already near full utilization in the new capacity in battens and downlighters.
14. The LED TV market in India has shifted from 32 inches to 43 inches. Thus unit sale value has gone
up by 14-15k in last 2 quarters.
15. The wearables market in India is expected to be at Rs 5000 Cr. Dixon has tied up with boAt to
create a new brand in this space.
www.smartsyncservices.com Page | 63
Click here to Subscribe
on WhatsApp
16. In Q3, in the mobile business, 75% of revenues have come from Xiaomi and Samsung. Rest 25%
came from all other brands.
17. The management expects sales volumes for Samsung to reach 0.7 million in the next fiscal year.
18. The set top box market opportunity is expected to be around Rs 350-400 Cr for Dixon. This is
mainly from domestic sales and the company is not looking at export options for it at the moment.
19. The management shouldn’t have any problems sourcing the components for the mobile phones
as they are sourced and procured by the brand owner.
20. The company is not expected to be affected by the rise in duty for some input materials for PCBs
as the rise in duty is for a small part of the overall PCB and this minor cost increase will anyway be
passed on to the customer.
21. The company has done capex of Rs 104 Cr in 9M, most of which was for the full auto washing
machine plant and the mobile PLI project. The overall capex for Fy21 is expected to be around Rs
145-155 Cr.
22. In terms of sales volumes, the company sold 6 Cr light bulbs, 45 lac battens, 14 lac downlighters,
46-47 lac of other lighting products. It also sold 2.4 lac washing machines and 75 lac phones of
which 72 lac were feature phones and 3 lac were smartphones. It also sold 9 lac CCTVs and 9 lac
set top boxes.
23. Given the company’s capabilities in the lighting business, the management feels that it can
venture into export markets. The company already has a full portfolio of lighting options and is
already #3 or #4 in terms of LED bulb volumes in the world.
24. The global lighting market is around $8 billion and the company will be aiming for a $500 million
slice of this pie in the next 4-5 years.
25. The management has guided that EBITDA margins should be at 4.5% at least in FY22.
26. The main international competition other than China for contract manufacturing for India are
Vietnam, Thailand, and Philippines according to the management.
Analyst’s View:
Dixon Technologies is one of the foremost leaders in the electronics manufacturing and outsourcing
industry in India. The company had a phenomenal quarter with revenues and profits doubling from
last year. Demand has come back fast in all of its segments and the company has already acquired
Motorola and Nokia as customers for mobile phones whose volumes should help Dixon reach the
volume ceiling for the PLI scheme easily. Despite the issues of components shortage for the TV
industry, Dixon is confident of being able to complete its commitments without many hiccups. It
remains to be seen whether the company will be able to expand aggressively as it has done in the
recent past and what obstacles it will face that may threaten to halt its growth momentum in its
emerging segments. Nonetheless, given the list of marquee customers that the company has gained
and retained over the years and its continuous efforts to expand existing capacities like consumer
electronics and adding new product lines like disruptive medical devices, Dixon Technologies is
cementing its place as a good growth-story in the outsourced manufacturing sector in India.

www.smartsyncservices.com Page | 64
Click here to Subscribe
on WhatsApp
EXCHANGE BSE
Financial Results & Highlights
Introduction
BSE was established in 1875 and is Asia’s first Stock Exchange and one of India’s leading exchange
groups. Over the past 144 years, BSE has provided a capital-raising platform and provided a platform
for trading in equity, debt instruments, derivatives and mutual funds. It also has a platform for trading
in equities of small-and-medium enterprises (SME).
Standalone Financials (In Crs)
Q3FY21 Q3FY20 YoY % Q2FY21 QoQ % 9MFY21 9MFY20 YoY%
Sales 138 125 10.40% 147 -6.12% 423 412 2.67%
PBT 25 100** -75.00% 26* -3.85% 85* 175** -51.43%
PAT 21 99 -78.79% 29 -27.59% 82 172 -52.33%
Consolidated Financials (In Crs)
Q3FY21 Q3FY20 YoY % Q2FY21 QoQ % 9MFY21 9MFY20 YoY%
Sales 162 149 8.72% 160 1.25% 485 474 2.32%
PBT 38 46*** -17% 27* 40.74% 104* 129*** -19.38%
PAT 31 45 -31% 46^ -32.61% 110^ 123 -10.57%
*Contains exceptional item of loss of Rs 14.5 Cr.
**Contains exceptional item of gain of Rs 91.58 Cr
***Contains exceptional item of gain of Rs 32 Cr
^negative tax expense of Rs 19.21 Cr in Q2FY21 & Rs 5.64 Cr in 9MFY21.
Detailed Results:
1. Sales for Q3 were mixed with consolidated revenues up 8.7% YoY, consolidated PBT falling 17%
YoY & PAT falling 31% YoY.
2. EBITDA margin for Q3 was at 33% vs 21% last year.
3. Average daily turnover rose 44% YoY in the Equity Cash segment in 9MFY21. TC revenue in the
segment on the other hand rose 26% YoY.
4. Equity derivatives saw a meteoric rise of nearly 3 times in Average Daily Turnover in Q3 over Q2.
5. The currency derivative segment saw a drop in average daily turnover of 32%+ YoY in 9M. This
was mainly due to restricted bank timings due to COVID-19 and the merger of nationalized banks.
6. In the commodity derivatives segment, average daily turnover rose almost 10 times YoY in 9M
period. It now has a market share of 64.12% in gold mini contracts.
7. BSE Star MF saw MF revenue fall 19% YoY in 9M while Average Daily Value of Orders rising 34%
YoY in the same period. The average no of daily orders in SIPs and Equity & Debt rose 58% YoY in
9M.
www.smartsyncservices.com Page | 65
Click here to Subscribe
on WhatsApp
8. In the services to corporates segment, listing fees were flat YoY in 9M while Book Building & other
Services grew 51% YoY.
9. 106 Securities got been listed in 9M FY21 as compared to 95 securities in 9M FY20.
10. In the India International Exchange IFSC, total turnover grew nearly 100% YoY in 9M.
11. BSE Ebix Insurance Broking collected total premium of Rs 64.8 Lacs in Q3 vs Rs 96.1 Lacs in Q2.
Investor Conference Call Highlights:
1. BSE Star achieved a new milestone of processing 92.98 lakh transactions, which is the highest ever
in a month, including 4.77 lakhs new SIP registration in January 2021.
2. The total value of orders processed in the Mutual Fund segment increased by 37% to INR 2.05 lakh
crore for the 9 months ended December 31, 2020 from INR 1.49 lakh crore for the 9 months ended
December 31, 2019.
3. The total number of X-SIPs registered under BSE Star increased by 256% to 11.18 lakhs during the
9 months ended 31st December 2020 from 3.14 lakh for the 9 months ended December 31, 2019.
4. StAR MF platform witnessed a consistent net equity inflow of INR 15,809 crore as against the total
net equity outflow in the mutual fund industry of INR 30,546 crore during the YTD.
5. BSE Star’s market share was at 79%.
6. On November 14, 2020, BSE launched StAR MF Corporate Direct, a direct investment portal for
corporates with more features to further simplify toward end-to-end value-based services to the
AMCs, distributors, investors, and MF industry participants.
7. The Corp direct portal is available for other non-individuals, like HUF partnerships firms, societies,
et cetera.
8. As of January 31, 2021, BSE Ebix registered 3,907 point of sale persons and 2,370 certifications.
The platform has 7 general insurance companies, 2 stand-alone health insurance, and 3 life
insurance companies currently.
9. BSE Ebix also plans to offer other insurance products for commercial vehicles like trucks, tractors,
auto, taxi, commercial products like fire, liability, shopkeeper insurance, and other personal lines
of business like home, personal accident, travel insurance, et cetera.
10. BSE launched an electronic spot platform for agriculture commodities, known as BSE E-Agricultural
Markets, B-E-A-M, BEAM, through its wholly owned subsidiary BSE Investments Limited on
December 11, 2020. This platform functions as a national level institutionalized electronic
transport commodity spot trading platform facilitating spot agriculture commodities transactions
across the value chain, consisting of producers, intermediaries, and ancillary services and
consumers.
11. BSE has yet to get the final approvals for the new power exchange from CERC.
12. Operating expenses have decreased by 8% YoY while operating EBITDA increased by INR 20.11
crores to INR 11.91 crore for the quarter ended December 31, 2020, as against an operating loss
of INR 8.2 crore for the corresponding quarter previous year.

www.smartsyncservices.com Page | 66
Click here to Subscribe
on WhatsApp
13. The management states that most of the costs in the exchange business are fixed in nature and
thus any rise in revenues is not accompanied by a corresponding rise in expenses. Thus as
revenues rise, margins should expand as well for BSE.
14. Despite the volume rise of 65-70% in BSE Star, the company has seen the price per transaction
drop from Rs 10 to Rs 8 to Rs 5 currently. The company is yet to find a way to increase value per
transaction.
15. The management states that in INX, IFSC and their subsidiaries tend to reduce their prices close
to 0 which ensures that BSE cannot charge well.
16. MF revenue has been at Rs 7.6 Cr in Q3 vs Rs 3.66 Cr in Q2.
Analyst’s View:
BSE is the largest stock exchange in the world in terms of listed entities. The company has been in this
industry sector for close to 150 years and is still at the forefront of the industry in terms of technology
and access to tradable products. BSE had a decent quarter with rising volumes in all segments.
However, BSE Star saw a revenue decline of 19% in 9MFY21 due lowering of transaction costs on the
platform from Rs 8 to Rs 5 per transaction. The company is doing well to continue to expand its
strength in the equity and commodity derivatives space and continue the growth momentum of BSE
Star. The company is still looking for opportunities for value unlocking for BSE Star and has also
received a few bids from investors. The company continues to face tough competition from other
rivals especially NSE in emerging segments like INX which has forced them to maintain zero charges
for the platform. It remains to be seen how the company will get value unlocking from BSE Star and
whether it will be able to exercise any pricing power on the platform & how will it handle the trio of
new growth businesses going forward. Nonetheless, given the company’s long-standing brand value
and its market execution experience, and the potential of its new businesses, BSE can turn out to be
a dark horse wealth creator in the next few years.

www.smartsyncservices.com Page | 67
Click here to Subscribe
on WhatsApp
Indian Energy Exchange
Financial Results & Highlights
IEX is the first and largest energy exchange in India providing a nationwide, automated trading
platform for physical delivery of electricity, Renewable Energy Certificates, and Energy Saving
Certificates. The exchange platform enables efficient price discovery and increases the accessibility
and transparency of the power market in India while also enhancing the speed and efficiency of trade
execution. In August 2016, the Exchange received ISO Certifications for quality management,
Information security management, and environment management. The Exchange is now a publicly
listed company with NSE and BSE. IEX is approved and regulated by the Central Electricity Regulatory
Commission (CERC) and has been operating since 27 June 2008.
Standalone Financials (In Crs)
Q3FY21 Q3FY20 YoY % Q2FY21 QoQ % 9MFY21 9MFY20 YoY%
Sales 96 69 39.13% 79 21.52% 256 218 17.43%
PBT 78 53 47.17% 62 25.81% 198 169 17.16%
PAT 60 42 42.86% 47 27.66% 150 131 14.50%
Consolidated Financials (In Crs)
Q3FY21 Q3FY20 YoY % Q2FY21 QoQ % 9MFY21 9MFY20 YoY%
Sales 96 69 39.13% 79 21.52% 256 218 17.43%
PBT 76 53 43.40% 58 31.03% 191 168 13.69%
PAT 58 42 38.10% 44 31.82% 145 130 11.54%
Detailed Results:
1. On a consolidated basis, PAT was up 38% YoY while revenue for the quarter was also up 39% YoY.
2. Q3 saw an increase of 61.8% YoY in electricity exchange volumes.
3. Indian Gas Exchange secures PNGRB authorisation to become India’s first delivery-based Gas
Exchange. Adani Total Gas & Torrent Gas become the first strategic investors in IGX by acquiring
5% stake each.
4. The REC trading remains halted in the quarter due to a stay order from APTEL (Appellate Tribunal
for Electricity).
5. The day-ahead market saw good volumes growth of 43% YoY. The market witnessed an average
market clearing price of Rs 2.76 per unit in Q3.
6. Total volumes including REC rose 48.2% YoY.
7. There was a 39.5% YoY growth in open access volumes.
8. The Real-time electricity registered an all-time high monthly volume of 1129 MU in December.
9. The green market cumulatively traded 473 MU during the quarter.
10. The company announced an interim dividend of Rs 2.5 per share.
Investor Conference Call Highlights:
1. IEX successfully introduced 2 new contracts (daily and weekly) in the green market.
www.smartsyncservices.com Page | 68
Click here to Subscribe
on WhatsApp
2. It also signed a licensing agreement with MCX to launch electricity derivatives in the market using
IEX price as a clearing.
3. The national energy consumption increased 7% YoY in Q3.
4. As on 31st December 2020, the installed power capacity in India was at 375 GW with a growth of
1.8% YoY. The renewable capacity grew 6% YoY.
5. On Dec 4th 2020, the Ministry of Power introduced a draft proposal to enable distribution utilities
to exit from the power purchase agreements after completion of the term of the PPA. This
initiative will enable more buying by the utilities and sale of power by the generators on the
exchange platform.
6. The REC market used to have transactions of around Rs 80-90 Lacs a year for IEX.
7. The management has clarified that IEX is only looking for strategic partners to invest in IGX at the
moment.
8. The increase in the open access volume is 14% YoY in Q3 and it formed 24% of total volumes in
the quarter. Majority of the open access is traded through day ahead market only.
9. The remaining 76% volumes are all from distribution companies.
10. Although there is an opportunity for monetizing of software that IEX owns, the management has
stated that IEX will not be doing so as the best way to make money with the software is to maintain
it as the USP of the exchange.
11. The electricity derivative by MCX is still pending approval from regulators. These derivatives will
be physically settled on IEX platform and financially settled using IEX price.
12. The main business development activity for IEX is to create awareness about the platform and
values that it provides energy at.
13. In the green market, the sellers are mainly distribution companies, distribution companies of
Telangana and Karnataka. As the demand in these discoms is rising the volumes to be sold is
coming down. The green market clearing price is between Rs 3.5-4.
14. Annuals fees collected in Q3 was at Rs 4.2 Cr which was flat QoQ. This is because the number of
participants is not increasing but the volumes are. Top 10 DISCOMs contribute almost about 75%
to 80% of the total buy.
15. IEX is looking to maintain a significant stake in IGX within permissible levels and will bring it down
to 25% in the next 5 years.
16. Participation in exchange is increasing mainly due to the flexibility and the competitive pricing
offered as compared to bilateral traders contracts which have fixed terms for price and quantum.
17. The main hurdles in the growth in adoption of the gas exchange are the absence of a uniform tax
system for gas which is not under GST, gas transportation tariffs and almost no spare capacity in
active LNG terminals.
18. The company is seeing more and more states making power available as open access as it
contributes to ease of doing business and thus IEX is seeing more states doing so to promote
industrial activity in their territories.
19. The company has filed a petition with CRC for long duration contracts and is waiting for the result.
In the case of cross border activities, it will be dependent on whether the Govt of India will approve
to do so with neighbouring countries.
20. The top 3 states for open access are Gujarat, Tamil Nadu and Telangana. In many states, the
breakeven rate for open access is around Rs 2.8-3.4 depending on various charges like cross-
subsidy surcharge, transmission charges, billing charges, etc.
21. The management has stated that there is scope for volumes rise in states like Andhra Pradesh,
Maharashtra and Gujarat as there may be power plants here which have variable costs higher

www.smartsyncservices.com Page | 69
Click here to Subscribe
on WhatsApp
than exchange clearing price and thus there is an opportunity for cost savings here. On the other
hand, such opportunities are low in states like Chhattisgarh, Orissa, West Bengal where the
variable costs are very low due to plants located near RM sources.
22. The company has kept transaction charges constant for the last 8 years at INR 0.02 from the buyer
and INR 0.02 from the seller.
23. The company will be looking to do a lot of marketing awareness with the participants to bring
enough liquidity in long-duration contracts and GDAM when they are launched. Once these
products reach sufficient liquidity and the market evolves, the company will look to develop new
products.
Analyst’s View:
IEX is the first and largest energy exchange in India providing a nationwide, automated trading
platform for physical delivery of electricity, Renewable Energy Certificates, and Energy Saving
Certificates. It has a very asset-light business model and a strong Balance Sheet. In the last several
years it has done well by constantly adding new products and improving offerings for the participants
on its platform. The company has seen a good quarter with its highest ever volumes traded on the
platform and sales & profit growth of 39% YoY. It has also gotten approval for IGX and has already
gotten strategic partners like Adani Total Gas and Torrent Gas to invest 5% each in it. IEX is also seeing
increased participation from discoms in the exchange given the flexibility and competitive pricing as
compared to bilateral contracts. It remains to be seen how the policies and regulations will evolve in
the power sector and how the issues capping the gas sector in India will be resolved in the future. It is
still very early days in the power exchange market. However, as of date, IEX looks like a pivotal player
in this industry.

www.smartsyncservices.com Page | 70
Click here to Subscribe
on WhatsApp
FMCG CCL Products
Financial Results & Highlights
Brief Company Introduction
CCL Products (India) is engaged in the manufacturing of instant coffee. The Company operates through
the Coffee and Coffee related products segment. It is engaged in the manufacture of soluble instant
spray dried coffee powder, spray dried agglomerated/granulated coffee, freeze-dried coffee and freeze
concentrated liquid coffee.
Standalone Financials (In Crs)
Q3FY21 Q3FY20 YoY % Q2FY21 QoQ % 9MFY21 9MFY20 YoY%
Sales 189 224 -15.63% 205 -7.80% 571 711 -19.69%
PBT 31 58 -46.55% 33 -6.06% 88 187 -52.94%
PAT 22 36 -38.89% 20 10.00% 58 142 -59.15%
Consolidated Financials (In Crs)
Q3FY21 Q3FY20 YoY % Q2FY21 QoQ % 9MFY21 9MFY20 YoY%
Sales 300 303 -0.99% 322 -6.83% 911 876 4.00%
PBT 56 69 -19% 61 -8.20% 163 168 -2.98%
PAT 47 47 0% 47 0.00% 133 124 7.26%
Detailed Results:
1. The company had an encouraging quarter with consolidated sales flat YoY and PAT flat YoY.
2. Consolidated figures were boosted due to the low impact of COVID-19 on Vietnam operations as
compared to its impact on Indian operations.
3. 9M figures were good with consolidated revenues rising 4% YoY and PAT rising 7% YoY.
Investor Conference Call Highlights:
1. The company saw substantial stock build-up due to logistics issues and the inability to get
dispatches on time.
2. This problem was not unique to the company and was present for all major exporters and
shippers in India like Bajaj Auto.
3. Another big omission this year was the absence of MEIS which was Rs 11 Cr last year in Q3.
4. During the quarter, the company suffered from a scarcity of food-grade containers and suffered
a delay of 15-20 days on average.
5. According to management around Rs 50-60 Cr of sales couldn’t be recognized in time in Q3 due
to these delays. The majority of this was in freeze dried product.
6. The company has not seen any loss in orders due to this delay because coffee has a shelf life of
2 years or more & the onus is on the customer to arrange for containers and lift them. The
www.smartsyncservices.com Page | 71
Click here to Subscribe
on WhatsApp
company also saw in many cases that customers were paying extra to procure containers and
get shipments in time.
7. Also there isn’t any chance of replacing any order from another vendor as any customer will
need a minimum of 3 months lead time for them to procure from anybody else, according to
the management.
8. The company had increased manufacturing of small packs as freeze dried product was not
being shipped and thus other expenses climbed up due to packing material costs going up.
9. The Russia business order has been pushed to Q4 due to the shipping delay and similarly, other
postponed orders have also spilled over to Q4 and Q1FY22.
10. The management is unclear on what is going to happen on the MEIS replacement incentive
scheme.
11. Pricing is not affected by the MEIS situation and it will be affected only by the supply and
demand situation in the market at the time of the order.
12. For both the new installations in India and Vietnam, they are expected to be completed in Q4
and commissioned in Q1.
13. The container scarcity is expected to continue for the next 1-1.5 months.
14. The company is also looking to time its exports more precisely and to use its import containers
for export to partially mitigate the container shortage.
15. Volumes sold in 9MFY21 were similar to those in 9MFY20.
16. Small packs now account for 15-20% of sales and the company has also increased small packs
capacity by 40% QoQ.
17. The total incentives from MEIS was Rs 33 Cr for FY20.
18. Once the container issue is resolved, the management is confident of adding Rs 50 Cr to the
top line from current sales figures for India operations.
19. Given the dispatches go in a timely manner, the management is confident of hitting 10%
volumes growth for FY21.
20. The management is estimating MEIS backlog to be at Rs 28 Cr currently.
21. Capacity utilization in Vietnam was at 90% while in India, FDC plant was at 80-85% and
Duggirala plant was at 60-65%.
22. EBITDA margins are expected to rise back to 25% from current level of 21% once the FDC
dispatches are completed in time.
23. The management is aiming for 80-85% capacity utilization in FY22 which brings the volumes
guidance to around 33,000 tons. The volume growth is expected to be driven primarily by the
increase in capacity in Vietnam which has been running at 90%+ utilization levels throughout
FY21 so far.
24. The volumes spill over into Q4 should yield higher margins and PBT as the expenses have
already been recognized in Q3.
25. The India sales for 9M were at Rs 105 Cr where Rs 70 Cr was in branded sales.
26. The Swiss office should be able to add supermarket chains from FY22 onwards as the minimum
of 2 years supply experience will be covered by the end of FY21.
27. The management is confident of maintaining margins of 25% even without MEIS.
28. The company has seen good response on the cold brew product from USA and has started
getting inquiries for it from EU, Russia and others.
29. Volume growth from USA has doubled YoY.
30. The management has stated that it doesn’t expect any import restrictions on coffee in USA as
all coffee consumed there is imported.
www.smartsyncservices.com Page | 72
Click here to Subscribe
on WhatsApp
Analyst’s View:
CCL has already established itself in the wholesale coffee space for many years and their foray into
branded sales through the Continental Coffee label has been very encouraging. The company has had
a modest quarter due to the container shortage which has forced many orders to be postponed to Q4.
It also saw continued high utilization at the Vietnam facility. The company’s branded business is
growing well and has already reached Rs 70 Cr in sales in 9MFY21. The company is doing well to
capitalize on its unique offerings and is working hard on expanding its influence. This is evident from
the response seen from customers for its new cold brew product and the inquiries it is getting from
export destinations. It remains to be seen how long the container shortage will last and whether the
branded business will be able to maintain its growth momentum. Nonetheless, given the enormous
market opportunity for the branded business in the domestic market, CCL products may turn out to
be a dark horse in the global coffee industry in the years to come.

www.smartsyncservices.com Page | 73
Click here to Subscribe
on WhatsApp
ITC
Financial Results & Highlights
Brief Introduction:
ITC Limited is an Indian multinational conglomerate company headquartered in Kolkata, West
Bengal. Established in 1910 as the 'Imperial Tobacco Company of India Limited', the company
was renamed as the 'India Tobacco Company Limited' in 1970 and later to 'I.T.C. Limited' in
1974. It has a diversified presence in FMCG, Hotels, Packaging, Paperboards & Specialty
Papers and Agri-Business. It has many famous brands under its stable like Wills, Classic, Gold
Flake, Aashirvaad, Sunfeast, Bingo, Fiama, Vivel, Classmate and many others.
Standalone Financials (In Crs)
Q3FY21 Q3FY20 YoY % Q2FY21 QoQ % 9MFY21 9MFY20 YoY%
Sales 13551 12997 4.26% 12587 7.66% 36537 37645 -2.94%
PBT 4848 5036 -3.73% 4274 13.43% 12250 14655 -16.41%
PAT 3663 4142 -11.56% 3232 13.34% 9238 11339 -18.53%
Consolidated Financials (In Crs)
Q3FY21 Q3FY20 YoY % Q2FY21 QoQ % 9MFY21 9MFY20 YoY%
Sales 14670 13960 5.09% 13730 6.85% 39804 40763 -2.35%
PBT 4805 5049 -5% 4565 5.26% 12906 15283 -15.55%
PAT 3587 4048 -11% 3419 4.91% 9573 11658 -17.88%
Detailed Results:
1. The company had a mixed quarter with a 5% consolidated revenue growth YoY and a fall of 11%
YoY in consolidated profits in Q3.
2. FMCG-Others segment grew almost 11% YoY in Q3 and 16% YoY in 9M. Segment EBITDA grew
28% YoY and EBITDA margin improved 150 bps YoY to 9.2%. Staples, Convenience Foods, and
Health & Hygiene products record growth of 11% YoY. Discretionary/’out-of-home’ categories
grew 11% YoY. Savlon saw consumer spend of Rs 1000 Cr in 9M period.
3. The hotel business turned EBITDA positive and was break-even in Q3.
4. Ecommerce now accounts for 5% of revenues from the FMCG-Others segment.
5. In Staples, Snacks and Meals category, ‘Aashirvaad’ atta fortified its leadership position in the
branded packaged atta industry during the quarter while Aashirvad Salt saw strong growth.
6. The company also added new products like ‘YiPPee!’ Saucy Masala Noodles, ‘Sunfeast Dark
Fantasy’ ChocoChip and ChocoNut Fills biscuits, ‘B Natural’ Pom+immunity juice, and ready-to-
drink immunity soups in two variants -Red Veggie and Tomato; Khatta Meetha Poha, Veggie
Upma, Mini Idli Sambar, Suji Halwa with Jaggery under Aashirvaad range of breakfast and snacking
meals; ‘Sunfeast Caker’, Range of organic dals and pulses under ‘Aashirvaad Nature’s Super
Foods’, and many others.
www.smartsyncservices.com Page | 74
Click here to Subscribe
on WhatsApp
7. In the Cigarette segment, Revenues grew 5% QoQ but declined 7.6% YoY while PBT rose 13% QoQ.
The company introduced new variants like Gold Flake Neo, Classic Connect, American Club Clove
Mint, Gold Flake Indie Mint, Capstan Fresh Flavour, Gold Flake Luxury Filter, Gold Flake Neo
SMART Filter, Navy Cut Deluxe Filter, Player’s Gold Leaf Chase, and Gold Flake Star.
8. In the Hotels business, leisure destinations turned in a strong performance with Rajasthan, Goa,
and hill stations leading the charge. The company reduced fixed costs by 44% in Q3. ITC also added
Welcomhotel Shimla and relaunched Welcomhotel Port Blair in Q3.
9. In the Paper & Paperboard business, the company saw revenues decline 5% YoY & EBIT decline of
14.6%. It saw subdued domestic demand which was partly offset by export growth.
10. Agribusiness saw a robust growth of 18.5% YoY driven by trading opportunities in rice, soya, and
wheat supplies for Aashirvaad atta. Value-added portfolio (ex. aqua) comprising spices for ‘food-
safe’ markets, processed fruits, frozen snacks, etc. posted 25% growth in revenue.
11. The company also announced an interim dividend of Rs 5 per share.
Analyst’s View:
ITC has been one of the biggest conglomerates in the history of modern India. The company has done
well to diversify into other FMCG segments and build many leading brands like Aashirvaad, Bingo, etc.
The company has seen another mixed performance in the current quarter with its FMCG-Cigarettes
still not recovered to pre-covid levels and the FMCG-Others doing very well and rising steadily. The
company is doing well in maintaining a leadership position in many of its brands and always
introducing new products under these brands. The company has shown resilient growth in its FMCG
segment in the health & hygiene space which was witnessed by the more than Rs 1000 Cr consumer
spend on Savlon alone in 9MFY21. It has also done well to keep expanding the Aashirwad range and
maintain market share in strong areas like atta while expanding into pulses and breakfast meals. The
Hotels business is also on its way back and was EBITDA positive and breakeven in Q3. It remains to be
seen how the company will mitigate the effects of the systematic decline of the cigarette industry and
how long will it take for the Hotels business to get back to pre-covid level of operations. Nonetheless,
given its history of building and maintaining durable brands, its leadership in various operating
segments, and its mammoth cash-generating ability, ITC remains a critical stock to watch for any
investor interested in the themes of FMCG and consumption.
www.smartsyncservices.com Page | 75
Click here to Subscribe
on WhatsApp
Jyothy Labs
Financial Results & Highlights
Introduction
Jyothy Laboratories Ltd is a Mumbai-based fast-moving consumer goods company founded in 1983. It
has 6 business divisions namely Fabric Care (Ujala -. market leader), Household Insecticide (Maxo),
Utensil Cleaners (Exo), Fragrances, Personal Care (Margo) and Fabric Care Service. Ujala, Maxo, Exo,
Jeeva and Maya are some of the brands it owns under these divisions. The company is the largest
player in the fabric whitener space in India with a market share of 72%.
Standalone Financials (In Crs)
Q3FY21 Q3FY20 YoY % Q2FY21 QoQ % 9MFY21 9MFY20 YoY%
Sales 476 413 15.25% 504 -5.56% 1412 1299 8.70%
PBT 64 44 45.45% 71 -9.86% 194 146 32.88%
PAT 52 43 20.93% 61 -14.75% 163 132 23.48%
Consolidated Financials (In Crs)
Q3FY21 Q3FY20 YoY % Q2FY21 QoQ % 9MFY21 9MFY20 YoY%
Sales 483 426 13.38% 509 -5.11% 1428 1334 7.05%
PBT 68 49 38.78% 73 -6.85% 202 162 24.69%
PAT 53 45 17.78% 60 -11.67% 163 136 19.85%
Detailed Results:
1. Standalone and Consolidated quarterly revenues were up at 15% & 13% YoY respectively. (volume
up by 15%)
2. The gross margin for the quarter increased from 48.7% last year to 48.8%.
3. Operating EBITDA at 16.7% (Rs 79.8 Cr) Vs 15.8% (Rs 66.3 Cr) in the same period last year.
4. PAT at Rs 53 Cr as against Rs 45 Cr last year, up by 18% YoY.
5. In 9M, consolidated revenues were up 7% YoY while volumes were up 9.8% YoY.
6. Gross Margin in 9M was 47.6% from 47.8% in the same period last year.
7. Operating EBITDA in 9M improved to 17.2% vs 16% last year.
8. Category wise break-up of Q3 YoY Revenue Growth:
1. Fabric Care: Up 2.3% (37% of sales)
2. Dishwashing: Up 21.1% (38% of sales)
3. Household Insecticides: Up 10% (10% of sales)
4. Personal Care: Up 48.2% (11% of sales)
5. Others: Up 56% (4%)
www.smartsyncservices.com Page | 76
Click here to Subscribe
on WhatsApp
9. A&P expenses to sales were at 7.4% in Q3.
Investor Conference Call highlights:
1. The company launched Exo All Surface cleaner in South India in Q3.
2. The company stepped up its media spending with the intent to grow its market share.
3. The company faced minor inflationary pressures in raw materials which were mitigated by rise in
operational efficiencies and higher contribution from personal care business.
4. A&P spend has increased by 40% in Q3 to Rs 35.3 Cr.
5. Main wash category has started doing better than the last 6 months with modern trade and
canteen store department almost coming back to normal.
6. Post wash segment remained subdued as offices, schools, colleges have yet to fully resume.
7. Dishwash segment has benefitted from the renewed focus on hygiene and the focus on small
packs has brought in many new users to the category.
8. Household insecticides segment has seen good growth with the vaporizer leading the growth.
9. Margo has seen very good growth due to focus on hygiene and from higher media spend and
customer demand for personal hygiene products made from natural ingredients like Neem.
10. The company has taken multiple interventions to promote general trade channel and focus on
rural expansion. The most prominent ones would be to direct the sales force to increase the
number of outlets and reach and to increase the number of SKUs for small packs.
11. The management expects operating leverage to come into play as higher volumes bring better
utilization for the company and also bring down the employee cost as a % of sales.
12. Other expenses have come down for the company due to lack of travel and other activities. It is
expected to rise in the future but not to pre-covid levels according to the management.
13. The management maintains margin guidance of 15-16% for FY21.
14. Henko has seen a good recovery in the modern trade channel in the matic versions and the
premium products. Ujala is expected to be back within the next 1-2 quarters.
15. The company has already introduced TShine in other Southern states and has gotten a good
response to it. It is planning to make the call soon to take the brand up to the national level.
16. The tax rate is expected to be at 18-19% for the rest of the year.
17. Rural growth has been 30% higher than urban growth for the company.
18. The management has stated that the Rs 10 segment has worked well for the company in personal
care space and it will be looking to take this to many more places and continue the growth
momentum of the personal care segment.
Analyst’s View:
Jyothy Labs is a consistent performer in the FMCG segment in India. They have successfully carved out
a niche for themselves and have established themselves as market leaders in the fabric care and
dishwashing segment. The performance of the company was very encouraging in this quarter mainly
on the back of sustained good performance of dish wash and increasing rural penetration. The
company has done well to increase sales volumes on the back of small packs and see the rise of the
personal care segment and recovery of the fabric care segment. The company still faces the issue of
very slow recovery in the post-wash segment which is the company’s biggest earner. It remains to be
seen how long will it take for the post-wash segment to revive and how the company will fare in the
increasingly competitive environment in the health hygiene space. Nonetheless, given the renewed
focus on health and hygiene going forward and the company’s good distribution reach and resilient
product portfolio, Jyothy Labs may turn out to be a pivotal FMCG stock to watch out for.
www.smartsyncservices.com Page | 77
Click here to Subscribe
on WhatsApp
KRBL
Financial Results & Highlights
Brief Company Introduction
KRBL is the world’s leading basmati rice producer and has fully integrated operations in every aspect
of basmati value chain, right from seed development, contact farming, procurement of paddy,
storage, processing, packaging, branding and marketing. It is also the owner of the famous basmati
rice brand INDIA GATE.
Standalone Financials (In Crs)
Q3FY21 Q3FY20 YoY % Q2FY21 QoQ % 9MFY21 9MFY20 YoY%
Sales 1137 1334 -14.77% 1136 0.09% 3046 3449 -11.68%
PBT 195 212 -8.02% 203 -3.94% 564 557 1.26%
PAT 146 159 -8.18% 150 -2.67% 422 409 3.18%
Consolidated Financials (In Crs)
Q3FY21 Q3FY20 YoY % Q2FY21 QoQ % 9MFY21 9MFY20 YoY%
Sales 1137 1334 -14.77% 1136 0.09% 3047 3450 -11.68%
PBT 194 211 -8% 202 -3.96% 563 557 1.08%
PAT 145 159 -9% 150 -3.33% 421 409 2.93%
Detailed Results:
1. The company had a bad quarter with a 15% fall in consolidated revenues and an 8% fall in PBT at
a consolidated level.
2. PAT fell 9% YoY.
3. EBITDA in Q3 fell 11% YoY. EBITDA margin rose 108 bps YoY to 19.4% while gross margin rose
299 bps to 30.14%.
4. 9M performance was mixed with a 12% YoY revenue decline and 3% PAT growth. This was
mainly due to bad performance in Q1.
5. Net debt is now at Rs 406 Cr. Cash & Cash equivalent is at Rs 121 Cr. The interest Coverage ratio
improved by 2.6 times YoY at 36 times.
6. The market share of KRBL was at 38.6%.
7. Bulk pack sales are now back at pre-Covid levels.
8. Consumer pack sales were at their highest ever levels in Q3.
9. The company saw a 61% QoQ growth in modern trade + e-commerce channels. KRBL now has a
37% market share in the modern trade sales channels. Modern trade & e-commerce contributed
to 28% of overall sales for the company.
10. Health Portfolio saw a 20% YoY growth in 9M.
11. Inventory is at Rs 3113 Cr.
12. Book value per share was at Rs 151 as of 31st Dec 2020.
13. Net debt to equity was at 0.11 times vs 0.27 times a year ago.
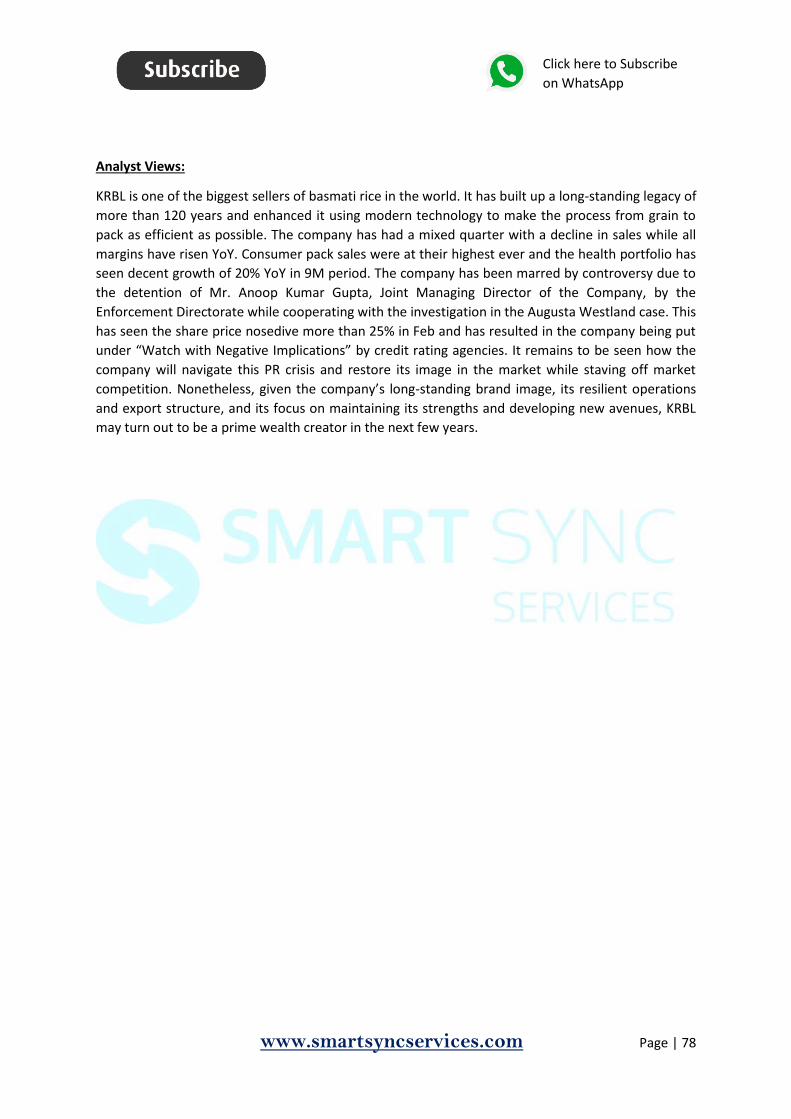
www.smartsyncservices.com Page | 78
Click here to Subscribe
on WhatsApp
Analyst Views:
KRBL is one of the biggest sellers of basmati rice in the world. It has built up a long-standing legacy of
more than 120 years and enhanced it using modern technology to make the process from grain to
pack as efficient as possible. The company has had a mixed quarter with a decline in sales while all
margins have risen YoY. Consumer pack sales were at their highest ever and the health portfolio has
seen decent growth of 20% YoY in 9M period. The company has been marred by controversy due to
the detention of Mr. Anoop Kumar Gupta, Joint Managing Director of the Company, by the
Enforcement Directorate while cooperating with the investigation in the Augusta Westland case. This
has seen the share price nosedive more than 25% in Feb and has resulted in the company being put
under “Watch with Negative Implications” by credit rating agencies. It remains to be seen how the
company will navigate this PR crisis and restore its image in the market while staving off market
competition. Nonetheless, given the company’s long-standing brand image, its resilient operations
and export structure, and its focus on maintaining its strengths and developing new avenues, KRBL
may turn out to be a prime wealth creator in the next few years.

www.smartsyncservices.com Page | 79
Click here to Subscribe
on WhatsApp
Marico
Financial Results & Highlights
Brief Company Introduction
Marico Limited is one of India's leading consumer goods companies providing consumer products and
services in the areas of health, beauty and wellness. With its headquarters in Mumbai, Maharashtra,
India, Marico is present in over 25 countries across emerging markets of Asia and Africa. It owns
brands in categories of hair care, skin care, edible oils, health foods, male grooming, and fabric care.
Standalone Financials (In Crs)
Q3FY21 Q3FY20 YoY % Q2FY21 QoQ % 9MFY21 9MFY20 YoY%
Sales 1744 1510 15.50% 1695 2.89% 4975 4869 2.18%
PBT 349 329 6.08% 361* -3.32% 1030* 979 5.21%
PAT 293 270 8.52% 314 -6.69% 862 783 10.09%
Consolidated Financials (In Crs)
Q3FY21 Q3FY20 YoY % Q2FY21 QoQ % 9MFY21 9MFY20 YoY%
Sales 2146 1853 15.81% 2016 6.45% 6107 5911 3.32%
PBT 394 358 10% 342* 15.20% 1241* 1122 10.61%
PAT 312 276 13% 273 14.29% 973 844 15.28%
*Contains provision for impairment of inventory of Rs 33 Cr
Detailed Results:
1. Consolidated revenues grew 15.8% YoY in Q3.
2. EBITDA margins were down 90 bps YoY at 19.5% for Q3.
3. PAT for Q3 rose 13% YoY.
4. In Q3, domestic sales volumes were up 15% YoY while sales were up 18% YoY.
5. General trade channel grew consistently with rural growing ahead of urban, while in the new-age
channels, strong acceleration continued in E-Commerce. MT came back to pre-covid levels and
CSD saw a QoQ rise.
6. Parachute Rigids registered 8% volume growth & 9% value growth during the quarter.
7. Value-Added Hair Oils registered a 21% volume growth & 21% value growth. The company
anticipated market share gain in this segment.
8. Saffola Edible Oils continued its stellar run with 17% growth in volume terms & 26% value growth.
65% of the growth was attributed to increased penetration.
9. The Foods portfolio grew by 74% in value terms, with the base Oats franchise posting a strong
50% value growth. The company entered the plant-based protein category with the launch of
Saffola Mealmaker Soya Chunks in select markets.
10. Saffola Honey saw good growth and crossed 20% market share in E-Commerce.

www.smartsyncservices.com Page | 80
Click here to Subscribe
on WhatsApp
11. The Premium Personal Care portfolios of Leave-in Hair Serums, Male Grooming and Premium Skin
Care has been witnessing a gradual revival in demand and thereby recovering progressively.
However, the portfolio posted a modest volume decline on a year-on-year basis.
12. Advertising & Sales Promotions pend was at 9% of sales and was up 4% YoY.
13. The volume market share of various divisions is at:
1. Coconut Oils: 62%
2. Saffola –Super Premium ROCP: 76%
3. Saffola Oats: 33%
4. Value-Added Hair Oils: 35%
5. Post wash Leave-on Serums: 65%
6. Hair Gels/Waxes/Creams: 59%
14. Marico increased prices of Parachute by 5% in Q3 to counter inflation.
15. Of the total coconut oil market, approximately 30-35% in volume terms is unorganized (sold in
unbranded loose packs) which provides significant headroom for growth to branded players.
16. The company expects to deliver 5-7% volume CAGR in Parachute Rigids over the medium term.
17. In Q3FY21, the market price of copra was up 26% YoY and up 16% sequentially. In FY22, the
company expects copra prices to be flat on an annualized basis owing to a healthy crop outlook.
18. Rice bran oil was up 7% QoQ. The company expects this rise to be transient and come down over
the next few months. Liquid Paraffin (LLP) was up 12% YoY, while HDPE was up 18% YoY.
19. During the quarter, General Trade performed consistently with sales in urban and rural markets
up by 10% and 24% in volume terms respectively. Modern Trade returned to pre-COVID levels
with rising footfalls. E-Commerce delivered an exponential growth of 88% YoY, now contributing
8% to the overall turnover. CSD recovered sequentially, however posting a decline of 10% YoY.
20. International business grew by 8% YoY in Q3 in constant currency terms.
21. The operating margin in the international business expanded to 21.3% in Q3FY21 vs 20.5% in
Q3FY20.
22. The international revenue growth breakup is:
1. Bangladesh: up 15% YoY
2. SE Asia: down 3% YoY
3. MENA: up 1% YoY
4. South Africa: up 7% YoY
5. Others: up 16% YoY
23. Market share in Bangladesh for Parachute coconut oil was at 82%. The non-Coconut oil portfolio
in Bangladesh grew by 27% and 26% in Q3FY21 and 9MFY21. The non-Coconut Oil portfolio in
Bangladesh constitutes 40% of the total business.
24. Employee Cost was up 28% YoY, due to; i) higher incentive payout owing to better performance
during the quarter; ii) integration of Beardo (not in the base quarter); and iii) higher share-based
payout (linked to Marico’s share price performance on the bourses). Excluding the same, the
increase in employee cost was in line with average salary increments.
25. Other Expenses were up 9% YoY. Other expenses are likely to remain in the range of 11-13% of
turnover in the medium term.
26. The Capex for FY21 is expected to be around Rs 125-150 Cr.
27. The current MAT credit stands at Rs 141 Cr as of 31st Dec 2020.
28. The company improved its ROCE in Q3 by 210 bps YoY to 40.2%. The debt to equity was maintained
at 0.09 times.
www.smartsyncservices.com Page | 81
Click here to Subscribe
on WhatsApp
29. The net surplus for the company was at Rs 1508 Cr after a gross debt of Rs 346 Cr as of 31st Dec
2020.
30. The company is targeting 8-10% volume growth and 13-15% revenue growth in the medium term.
31. It aims to reach Rs 450-500 Cr Mark in Foods category and Rs 100 Cr in sales of Saffola Honey by
FY22.
Investor Conference Call Details:
1. Rural markets continued to outperform growing at 24% vis-à-vis urban markets, which grew by
10%.
2. The management expects a correction of 10-15% in copra prices as the winter goes away.
3. Rising oil prices have caused Marico to undertake price increases of 15%+ in the edible oils
segment.
4. The management expects Beardo to reach sales of Rs 100 Cr in FY22.
5. The management outlined 5 focus areas for Marico going forward which are:
1. drive double-digit growth in VAHO while maintaining growth in the core Parachute and
Saffola
2. aggressively scale up food business into INR 400 crore to INR 500 crore business in the
next year
3. bring discretionary portfolios back into healthy and sustained growth
4. dial up the contribution of Vietnam in International business while maintaining
momentum in Bangladesh
5. accelerate digital transformation and try to create at least 2, 3 digital brands like Beardo
6. The two main changes to consumer behavior that the management has observed post COVID-19
are the rise in in-home consumption and cooking & the adoption of healthier options in snacks
and meals.
7. The company has also seen that the adoption of healthy foods is sticky and this seems to be a
permanent trend given the significant limelight on lifestyle diseases or comorbidities because of
COVID-19.
8. The company has reduced debtor days to 23 days from 36 previously using strict credit control in
the general trade channel. It has also been able to do so as it has reduced dealer inventory
significantly.
9. The management has stated that the growth in VAHO has been driven by all brands and not just
Shanti Amla.
10. The management is not worried about any sourcing issues for materials for new products like
Hiney and Chawanprash as it believes that Marico has proved itself in supply chain management
with its other products already.
11. Employee expenses are expected to remain high in Q4 as well.
12. The management has stated that the Chawanprash products need till April or May at least to
establish whether the brand response is good or not.
13. The company is not looking to invest behind advertising in the hygiene brand as it contributes a
minuscule 1% to sales only.
14. The company has entered into the soya market as it is largely unorganized and the branded section
in this market is at Rs 800-900 Cr with only 2 players. Given Saffola’s brand equity, the
management is confident of establishing market share in this segment swiftly.
15. The management is confident of growth in the core Saffola edible oil segment as it was delivering
9% volume growth CAGR since 2017 even before COVID-19.

www.smartsyncservices.com Page | 82
Click here to Subscribe
on WhatsApp
16. The management has stated that it is focussing more on the foods segment than on personal care
as it offers a far better business model and an opportunity for scale-up faster as compared to
personal care.
17. The management has stated that Masala Oats business should reach that inflection point in
another 1 year or 2 years, where there will be significant opportunity to improve margins because
of backward integration and scale. Thus once the entire foods category reaches Rs 400+ Cr,
economies of scale should kick in and yield margin expansion.
18. Total turnover for Foods business in FY21 is expected to be at Rs 325-350 Cr.
19. The management is making significant changes to the Masala Oats business which it believes will
drive growth. These are:
1. Increasing distribution
2. Moving it from breakfast to in-between meals as the new category is 50-70 times the
breakfast market and with lesser competition.
3. Drive regional tastes in new launches
20. The management has stated that soya chunks have a similar margin profile as Masala oats.
According to the main drivers in the soya segment are the big unorganized market and the rise of
plant protein as a healthy option.
21. Beardo will stay a digital first brand with 80%+ sales through the website and ecommerce sites.
The management believes that there is a good opportunity to develop a profitable working model
with digital-first and then move aggressively on other channels.
22. The management wants Beardo to function completely independently and stay in a startup
mindset.
23. In terms of distribution, Masala Oats is available in 1.5, 2 lac outlets, and Honey is expected to be
available at 1.2 lac outlets.
24. The management states that in edible oils, the company is not the one leading price increases and
it is just following the general trend here while in Parachute, it is the one who leads pricing moves.
25. One big measure that the company is doing in Saffola is increasing marketing spend and
communication on Saffola Gold which is the premium product instead of Saffola Activ which is the
entry product to prevent Activ from cannibalizing Gold.
Analyst’s View:
Marico is one of India’s leading FMCG companies with many market-leading brands like Saffola and
Parachute. The company has done well to maintain value and volume growth on a YoY basis in almost
all categories and sustain growth momentum in domestic business. It is showing encouraging
performance in the food category, especially in the health foods segment. The VAHO segment has
seen a good recovery for Marico after 6 months of underperformance. The company has seen decent
growth in overall volumes and has maintained its leadership position in all categories highlighting good
brand resilience. In light of the COVID-19 disruption, the company has done well to develop direct
distribution channels and rationalize its SKUs and develop towards the health category by launching
Honey, Chawanprash, and Soya Chunks products. The company’s focus on expanding into new health
food categories under the Saffola brand and the in-demand hygiene looks shows good room for
growth in these segments. It remains to be seen how long the COVID-19 situation lasts and what
second-order effects it has on the company and general consumer behaviour. Nonetheless, given the
company’s solid standing in its core categories, its expansion plans for high margin food categories,
and its robust distribution network, Marico looks like a pivotal FMCG stock to watch out for.

www.smartsyncservices.com Page | 83
Click here to Subscribe
on WhatsApp
Tata Consumer Products
Financial Results & Highlights
Brief Company Introduction
Tata Consumer Products Limited (formerly Tata Global Beverages) is an Indian multinational non-
alcoholic beverages company headquartered in Kolkata, West Bengal, India and a subsidiary of the
Tata Group. It is the world's second-largest manufacturer and distributor of tea and a major producer
of coffee.
Tata Consumer Products markets tea under the major brands Tata Tea, Tetley and Good Earth Teas.
Tata Tea is the biggest-selling tea brand in India, Tetley is the biggest-selling tea brand in Canada and
the second-biggest-selling in United Kingdom and United States.
In 2012, the company ventured into the Indian cafe market in a 50/50 joint venture with Starbucks
Coffee Company. The coffee shops branded as "Starbucks Coffee - A Tata Alliance" source coffee beans
from Tata Coffee, a subsidiary company of Tata Consumer Products.
Standalone Financials (In Crs)
Q3FY21 Q3FY20 YoY % Q2FY21 QoQ % 9MFY21 9MFY20 YoY%
Sales 1988 1488 33.60% 1770 12.32% 5409 4456 21.39%
PBT 176 194 -9.28% 231 -23.81% 721 634 13.72%
PAT 136 143 -4.90% 169 -19.53% 538 453 18.76%
Consolidated Financials (In Crs)
Q3FY21 Q3FY20 YoY % Q2FY21 QoQ % 9MFY21 9MFY20 YoY%
Sales 3089 2522 22.48% 2808 10.01% 8643 7322 18.04%
PBT 292 264 11% 321 -9.03% 1113 826 34.75%
PAT 237 189 25% 234 1.28% 860 585 47.01%
Detailed Results:
1. The consolidated performance was good at 22.5% YoY growth in revenue and 25% YoY PAT
growth for Q3.
2. The company saw growth in consolidated EBITDA of 12% YoY. EBITDA margins fell 120 bps YoY
to 11.9%.
3. Overall India business grew 36% YoY. The company has a cash position of Rs 1550 Cr.
4. TCPL acquired 100% equity stake in Kottaram Agro Foods Pvt Limited (Soulfull). Operational
integration to be completed by Q2FY22.
5. Integration expected to be substantially completed by Q4 FY21.
6. 100% of all channel partners have been digitised and dedicated sales reps have risen 30% in 9M.
7. The India Packaged Beverages business showed revenue growth of 19% YoY & volume growth of
12% YoY in Q3. India tea business saw 43% YoY revenue growth, 10% YoY volume growth and 94
bps market share gain.
www.smartsyncservices.com Page | 84
Click here to Subscribe
on WhatsApp
8. The India Foods business showed a revenue growth of 19% YoY & volume growth of 12% YoY in
Q3. Salt revenues grew 19% in Q3 with market share gains. The value-added salt portfolio has
grown 2.7 times. Pulses grew 35%. Launched new products Poha and nutria-mixes in Q2.
9. NourishCo had revenue of Rs 33 Cr and saw 9% QoQ revenue growth. Tata Water Plus sold 1.6 x
volumes in Q3.
10. The Tata Coffee division saw value growth of 1% YoY. Plantations revenue grew 6% YoY and
Extractions Volume fell 3% YoY. Vietnam plant now operating at ~93% capacity. Extractions
business was impacted by global shortage of shipping containers and further lockdowns in
Europe.
11. In the Starbucks JV, the company saw a 90% YoY revenue recovery in Q3. Around 92% of stores
are operational and 13 new stores and 3 new cities are added in Q3.
12. The UK tea business saw revenue growth of 1% YoY with volume growth of 5% YoY. It maintained
a market share of 20.3% in the everyday black tea segment.
13. The USA coffee business saw a 7% YoY rise in volumes and 6% YoY revenue growth. The tea
business saw revenue growth of 18% YoY & volume growth of 22% YoY.
14. In Canada, the company saw revenue growth of 24% YoY in Q3 and it maintained a market share
at 29.5%. The volume growth in the quarter was 19% YoY.
Investor Conference Call Highlights
1. TCPL exited the Map Coffee business in Australia for the sake of portfolio rebalancing.
2. The company has trimmed down the number of distributors by about 63% and all distributors are
now 100% food and beverage.
3. Unique outlets built for 3 months are up by 65%.
4. The SoulFull portfolio straddles multiple consumer occasions, breakfast, snacking, mini-meals,
convenience, healthy, clean label, no maida offerings targeted for millennial families. It also has a
reach of 15,000 outlets.
5. The acquisition was done for Rs 156 Cr for 100% equity stake.
6. The founders and key management will remain with the company at their normal posts.
7. The estimated market size for TCPL’s health and wellness offerings portfolio is at Rs 20,000 Cr and
is expected to grow to Rs 40,000 Cr in next 5-6 years.
8. In the U.K., after growth in Q2, black tea has started to get into declining territories, but we
continue to see strong growth in Fruit & Herbals.
9. In USA, TCPL saw a decline in regular black tea after strong growth in Q1 and decent growth in Q2.
Coffee continues to grow at 7-9% rate.
10. Canada saw growth both in black tea and in speciality tea.
11. The company’s super premium brand Teapigs grew 32% YoY in Q3.
12. Tea inflation in India remains a challenge in the near term according to the management.
13. The management maintains that there is ample room for growth in the Salt business both on the
mass and value added end.
14. The management has stated that Soulfull already has a good product portfolio and it will be
currently looking for distribution expansion for Soulfull and then look to expand the product
portfolio.
15. The biggest permanent impact from COVID-19 was the increased consumption of beverages in
home and the rise of tea here.

www.smartsyncservices.com Page | 85
Click here to Subscribe
on WhatsApp
16. Pantry loading is indeed expected to continue but it will be declining going forward.
17. Soulfull had revenues of Rs 39 Cr in FY20.
18. The tea prices are expected to soften once the new crop comes in by the end of April.
19. The management sees geographic expansion, capacity expansion and portfolio expansion as the
key for NourishCo in the near future.
20. Although the company has very little presence in the retail coffee space in India, the management
believes that this business can expand fast through the company’s brand strength and distribution
reach.
21. The Sampann business has seen 5x growth in the Poha portfolio and is also introducing thin poha
to expand the portfolio.
Analyst’s View:
Tata Consumer Products has a very good product portfolio in diverse F&B segments and strong brands
like Tata Tea under its umbrella. The company has seen good growth in both value and volume terms
across all segments, especially in the tea and salt businesses. The company has a good opportunity for
growth in the health and wellness segment with the recent acquisition of Soulfull. This increases
TCPL’s health portfolio to a massive addressable market of Rs 20,000 Cr which is expected to double
in 5-6 years. It was also able to pass on the increase in tea and salt prices directly to consumers and
also gain market YoY. It remains to be seen how the company’s wholesale businesses which was the
worst hit from COVID-19 fare going forward and how the company will fare against other branded
players like ITC in the fast-rising branded staples category. Nonetheless, given the company’s
leadership position in its top brand segments, its enhanced distribution-reach after the merger, and
the incoming synergies and benefits from integration, Tata Consumer Products remains a good FMCG
stock to watch out for.
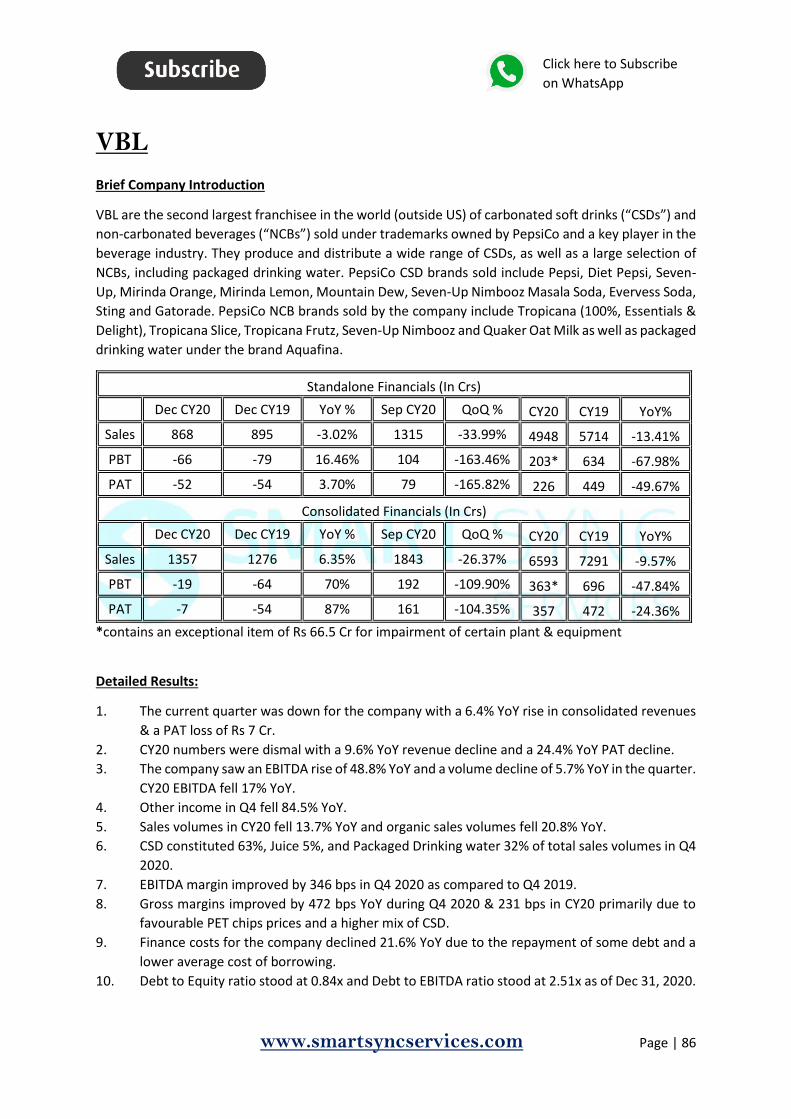
www.smartsyncservices.com Page | 86
Click here to Subscribe
on WhatsApp
VBL
Brief Company Introduction
VBL are the second largest franchisee in the world (outside US) of carbonated soft drinks (“CSDs”) and
non-carbonated beverages (“NCBs”) sold under trademarks owned by PepsiCo and a key player in the
beverage industry. They produce and distribute a wide range of CSDs, as well as a large selection of
NCBs, including packaged drinking water. PepsiCo CSD brands sold include Pepsi, Diet Pepsi, Seven-
Up, Mirinda Orange, Mirinda Lemon, Mountain Dew, Seven-Up Nimbooz Masala Soda, Evervess Soda,
Sting and Gatorade. PepsiCo NCB brands sold by the company include Tropicana (100%, Essentials &
Delight), Tropicana Slice, Tropicana Frutz, Seven-Up Nimbooz and Quaker Oat Milk as well as packaged
drinking water under the brand Aquafina.
Standalone Financials (In Crs)
Dec CY20 Dec CY19 YoY % Sep CY20 QoQ % CY20 CY19 YoY%
Sales 868 895 -3.02% 1315 -33.99% 4948 5714 -13.41%
PBT -66 -79 16.46% 104 -163.46% 203* 634 -67.98%
PAT -52 -54 3.70% 79 -165.82% 226 449 -49.67%
Consolidated Financials (In Crs)
Dec CY20 Dec CY19 YoY % Sep CY20 QoQ % CY20 CY19 YoY%
Sales 1357 1276 6.35% 1843 -26.37% 6593 7291 -9.57%
PBT -19 -64 70% 192 -109.90% 363* 696 -47.84%
PAT -7 -54 87% 161 -104.35% 357 472 -24.36%
*contains an exceptional item of Rs 66.5 Cr for impairment of certain plant & equipment
Detailed Results:
1. The current quarter was down for the company with a 6.4% YoY rise in consolidated revenues
& a PAT loss of Rs 7 Cr.
2. CY20 numbers were dismal with a 9.6% YoY revenue decline and a 24.4% YoY PAT decline.
3. The company saw an EBITDA rise of 48.8% YoY and a volume decline of 5.7% YoY in the quarter.
CY20 EBITDA fell 17% YoY.
4. Other income in Q4 fell 84.5% YoY.
5. Sales volumes in CY20 fell 13.7% YoY and organic sales volumes fell 20.8% YoY.
6. CSD constituted 63%, Juice 5%, and Packaged Drinking water 32% of total sales volumes in Q4
2020.
7. EBITDA margin improved by 346 bps in Q4 2020 as compared to Q4 2019.
8. Gross margins improved by 472 bps YoY during Q4 2020 & 231 bps in CY20 primarily due to
favourable PET chips prices and a higher mix of CSD.
9. Finance costs for the company declined 21.6% YoY due to the repayment of some debt and a
lower average cost of borrowing.
10. Debt to Equity ratio stood at 0.84x and Debt to EBITDA ratio stood at 2.51x as of Dec 31, 2020.
www.smartsyncservices.com Page | 87
Click here to Subscribe
on WhatsApp
11. Working capital days increased marginally to ~ 31 days as of Dec 31, 2020, due to lower sales
volumes.
12. The company announced a dividend of Rs 2.5 per share.
Investor Conference Call Highlights:
1. For CY 2020, total sales volumes stood at 425.3 million cases.
2. VBL recently introduced a new product variance under the Mountain Dew brand which is a
lemon juice based drink called Mountain Dew Ice.
3. Realization per case has improved by 4.8% in CY20. This was essentially on account of
favourable mix and improvement in realization in the international markets.
4. CSD constituted 72.6%, juice constituted 6.3%, and packaged drinking water constitute 21.1%
of the total sales volume mix in CY20.
5. The management stated that the rise in water sales in Q3 & Q4 was due to the resumption of
people consuming drinking water outside as compared to Q2 when all outside activities and
consumption were suspended.
6. In-home consumption was mostly in CSD and was geared towards large packs.
7. On the go consumption reduced to 44% in CY20 from 60% in CY19.
8. Glass volumes have declined a lot and all of the growth in CSD is coming from PET bottles.
9. The company is planning to add a plant in Bihar in CY21. This expansion will be greenfield.
10. The dairy segment is doing well so far. The management has stated that it will continue to
monitor the response to it to see the results from the market before expanding into other
territories.
11. The company doesn’t have any plans to make any large investments into the dairy segment
currently.
12. Nepal has seen 25% volume growth in Q4. Sri Lanka has seen volume decline due to lockdowns.
Morocco has stayed flat due to lockdown while Zimbabwe and Zambia volumes have grown
40% and 17% respectively.
13. In CY21, any excess cash will be used for the reduction of debt only according to the
management.
14. Tax rate for CY21 should be close to 24%.
15. Annual volumes for Nepal were close to 16 million; Sri Lanka was about 10.5 million; Morocco
was about 18 million; Zimbabwe was 34 million; Zambia was 9.2 million.
16. The management has stated that PET prices for VBL will not be affected by rising oil prices as
VBL is reasonably covered for the major portion of its year.
17. The company is open to international acquisition opportunities as the potential for market
growth in India is limited. It is looking at areas in South East Asia and Africa primarily.
18. The management reports that VBL has seen market share gains in CY20.
19. Contrary to popular belief, VBL does not have 100% of India for Pepsi. It is operating in 85% of
Indian territories for Pepsi only.
20. There has been no change in territory from 2020 to 2021.
21. The management has stated that it expects growth and expansion of the market to continue
in 2021 for the recently acquired territories.
22. The go-to-market was very weak before when PepsiCo is running it. VBL is improving on it by
expanding routes, increasing outlets, and expanding on the number of visi coolers.
www.smartsyncservices.com Page | 88
Click here to Subscribe
on WhatsApp
Analyst Views:
Varun Beverages have been one of the biggest bottlers in India and has been quite proactive in
international expansion for some time now. The company has seen a good YoY recovery in the quarter
with sustained margins. Post lockdown demand has remained resilient and water volumes have risen
dramatically as on-the-go consumption comes back to normalcy. VBL has also seen good growth in
African territories except for Morocco. The company has also done well to shield itself from rising oil
prices by covering for PET earlier on. It remains to be seen whether there is a further economic
disruption in the future from the resurgence of COVID-19 cases which may have severe second-order
effects on the company’s performance. Nonetheless, given the resilient sales network, the rising
demand for the company’s products, and the arrival of the peak season for the beverages industry,
Varun Beverages is a good consumption stock to watch out for at present. However, as it is a capital-
intensive business, the current pandemic can put a strain on the Balance Sheet which is already laden
with debt. The valuation at current levels does not provide any margin of safety.
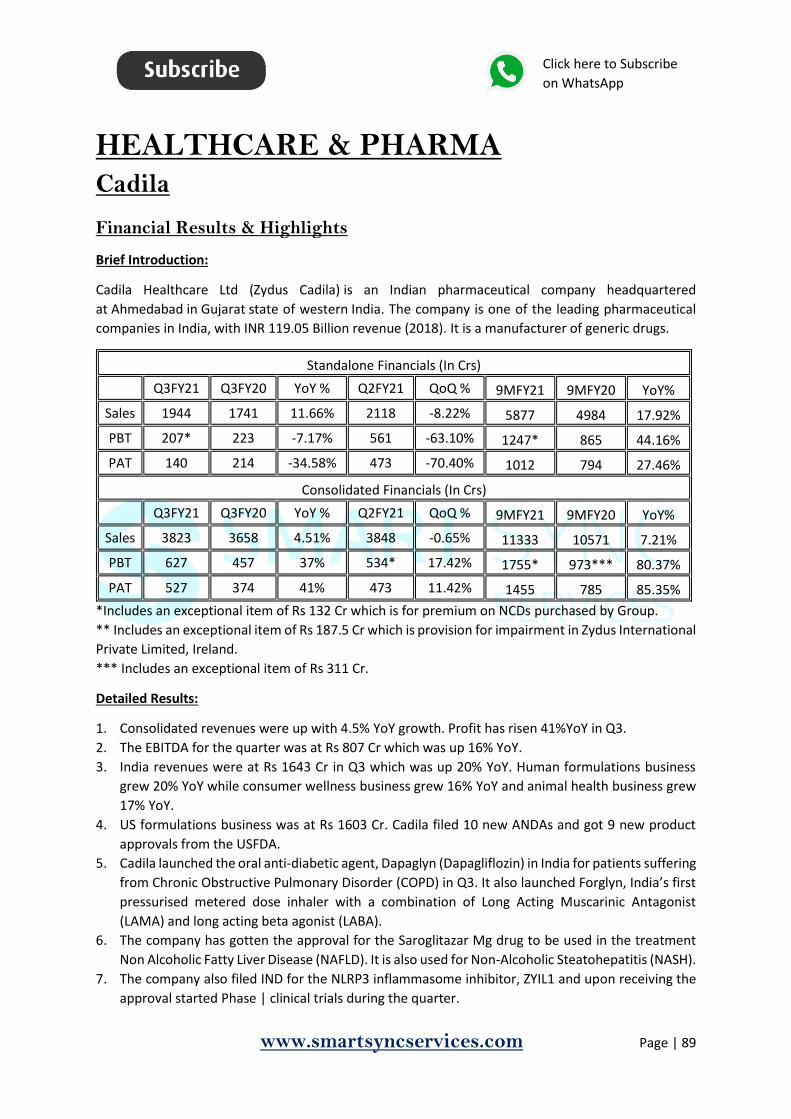
www.smartsyncservices.com Page | 89
Click here to Subscribe
on WhatsApp
HEALTHCARE & PHARMA Cadila
Financial Results & Highlights
Brief Introduction:
Cadila Healthcare Ltd (Zydus Cadila) is an Indian pharmaceutical company headquartered
at Ahmedabad in Gujarat state of western India. The company is one of the leading pharmaceutical
companies in India, with INR 119.05 Billion revenue (2018). It is a manufacturer of generic drugs.
Standalone Financials (In Crs)
Q3FY21 Q3FY20 YoY % Q2FY21 QoQ % 9MFY21 9MFY20 YoY%
Sales 1944 1741 11.66% 2118 -8.22% 5877 4984 17.92%
PBT 207* 223 -7.17% 561 -63.10% 1247* 865 44.16%
PAT 140 214 -34.58% 473 -70.40% 1012 794 27.46%
Consolidated Financials (In Crs)
Q3FY21 Q3FY20 YoY % Q2FY21 QoQ % 9MFY21 9MFY20 YoY%
Sales 3823 3658 4.51% 3848 -0.65% 11333 10571 7.21%
PBT 627 457 37% 534* 17.42% 1755* 973*** 80.37%
PAT 527 374 41% 473 11.42% 1455 785 85.35%
*Includes an exceptional item of Rs 132 Cr which is for premium on NCDs purchased by Group.
** Includes an exceptional item of Rs 187.5 Cr which is provision for impairment in Zydus International
Private Limited, Ireland.
*** Includes an exceptional item of Rs 311 Cr.
Detailed Results:
1. Consolidated revenues were up with 4.5% YoY growth. Profit has risen 41%YoY in Q3.
2. The EBITDA for the quarter was at Rs 807 Cr which was up 16% YoY.
3. India revenues were at Rs 1643 Cr in Q3 which was up 20% YoY. Human formulations business
grew 20% YoY while consumer wellness business grew 16% YoY and animal health business grew
17% YoY.
4. US formulations business was at Rs 1603 Cr. Cadila filed 10 new ANDAs and got 9 new product
approvals from the USFDA.
5. Cadila launched the oral anti-diabetic agent, Dapaglyn (Dapagliflozin) in India for patients suffering
from Chronic Obstructive Pulmonary Disorder (COPD) in Q3. It also launched Forglyn, India’s first
pressurised metered dose inhaler with a combination of Long Acting Muscarinic Antagonist
(LAMA) and long acting beta agonist (LABA).
6. The company has gotten the approval for the Saroglitazar Mg drug to be used in the treatment
Non Alcoholic Fatty Liver Disease (NAFLD). It is also used for Non-Alcoholic Steatohepatitis (NASH).
7. The company also filed IND for the NLRP3 inflammasome inhibitor, ZYIL1 and upon receiving the
approval started Phase | clinical trials during the quarter.
www.smartsyncservices.com Page | 90
Click here to Subscribe
on WhatsApp
8. In Q3, the company received approvals to start Phase III clinical trials of Pegylated Interferon
Alpha-2b in India and the approval to start Phase III clinical trials of its vaccine ZyCoV-D. The trials
for the vaccine are underway and will be tested across 60 locations with 30,000 volunteers in
India.
Investor Conference Call Highlights
1. Cadila’s EBITDA margin improved during the quarter to 21.3% which was an improvement of 210
bps YoY.
2. Emerging Markets business grew by 11% YoY to Rs 293 Cr.
3. Cadila gained market share in pain management, anti-infectives and the antidiabetic portfolio
during Q3 FY '21.
4. The company launched 7 new products in Q3 which includes the launch of doxorubicin liposomal
injection, which is the first complex injectable developed in-house.
5. In CY2020, Cadila received approvals for 38 new products, which is the second highest number
of ANDA approvals received by any generic company across the world.
6. The commercial production of the ZyCoV-D vaccine is expected to start in Q1FY22. The designated
capacity of the plant is equivalent to 120 million doses.
7. On the biologics front, Cadila received marketing authorization for 1 biosimilar in India and
completed preclinical toxicity study for another biosimilar during the quarter.
8. It also submitted an NDA for one product from the specialty portfolio.
9. It completed a Phase II/III trial for tetanus Diptheria, the TD vaccine in India during the quarter.
10. The company has not seen any stock return for Remdesivir and is seeing healthy demand for the
drug even in export markets.
11. Given the high prevalence of NAFLD and NASH in India, the management has high expectations
from the Saroglitazar Mg drug. It has stated that this drug can become the largest selling molecule
in Zydus in the next 3 to 5 years.
12. The company is expecting to enter USA with the Saroglitazar Mg drug for PBC in 2023 and NASH
in 2025. The company has gotten fast track approval for PBC usage and hopes to get the same for
NASH.
13. The opportunity size in PBC is around $10 billion by 2026 and the NASH market size is 2-3 times
it.
14. The company will maintain 8-9% of R&D spending going forward.
15. Overall capex in the vaccine will be at Rs 150-250 Cr. The vaccine will be administered in 3 doses.
16. The company has seen strong demand for its vaccine from export markets. Almost all countries
are accepting Phase II trial data for market authorizations. Some will do local studies if necessary.
17. US revenues saw a QoQ decline due to delay in some orders and YoY inventory correction. The
management is expecting Q4 revenues to be at $215-220 million in USA.
18. The management states that the USA business has not seen any curtailment of cost and it remains
stable at current levels. The spending on India formulations is at 80-85% of normal spending levels
and it should rise higher in FY22. But the management expects spending levels to stay below pre-
covid levels.
19. The management maintains that all 30,000 volunteers will get the first dose of the COVID vaccine
by end of Feb.
20. The management doesn’t envisage any additional tax outgo because of the proposed change in
goodwill depreciation till FY24 or FY25.
www.smartsyncservices.com Page | 91
Click here to Subscribe
on WhatsApp
21. The company sees an opportunity in the range of INR 40 crores to INR 50 crores in dapagliflozin.
It also has one monoclonal therapy coming which should see sales of Rs 40-50 Cr in a year.
22. It is also looking to launch a home test kit for COVID.
23. The company is also looking for appropriate CMOs to additionally produce 50 million to 70 million
doses of the COVID vaccine. The in-house manufacturing capacity should be ready by April.
24. The management expects 5-10% growth in US business in FY22.
25. The management states that the Saroglitazar Mg drug can easily turn into a Rs 250 Cr molecule
for Cadila in India. It is very confident of gaining approval for PBC for the drug in India, USA and
Mexico post the successful Phase III trial which is expected to start in March.
26. The company has completed enrolment for Desidustat in India and the commercial potential for
the drug is Rs 100+ Cr in India alone. The process for approval in China for the drug is also going
smoothly. Cadila has started a trial on chemotherapy-induced anemia in USA for this drug and it
sees this patient set as a better value driver in the U.S. market.
27. The company sees a patient size of 1 million in India for Saroglitazar Mg with >10% YoY growth in
this molecule.
28. Annual effective tax rate is expected to be at 20-21% for FY21 and FY22.
29. The company is planning for 40-plus new launches in USA in FY22 with 8-10 of them being high
value molecules.
30. Around 40-50% of R&D spend in on generics.
31. Capex for FY21 and FY22 should be at Rs 700-800 Cr.
32. Cadila is also working on the next-generation of the pneumococcal vaccine, which covers the
largest number of screens. Without COVID, the management expects the vaccine portfolio to
reach $125 million in revenues by FY24,25.
33. The Moraiya issue is still pending and there have not been any updates in the situation.
34. The opportunity size for the COVID vaccine shall remain steady as any vaccination drive needs at
least 3-5 years to be completed.
35. The management states that Cadila can see prequalification and tender offers in vaccines for
WHO from FY23 onwards. It will be targeting a 10-12% market share on its 3 approved vaccines.
36. The biggest chunk in the vaccine business is expected to come from exports.
37. The management expects to add almost 1% margin improvement with its ongoing cost savings
initiatives.
38. The company reduced almost Rs 200 Cr of net debt in Q3. Net debt now stands at Rs 3800 Cr.
Analyst’s View:
Zydus Cadila is one of the leading pharmaceutical and wellness product makers in the country. The
company has done well to maintain good growth in the India business while the US business has seen
marginal decline QoQ. The company is on track with its Phase III trials for its COVID vaccine and should
have its 120 million doses capacity by April. It is also expecting good potential from its Saroglitazar Mg
drug in the next 3-5 years. It remains to be seen what the future holds for the pharma industry with
the race to COVID-19 vaccine intensifying. The company also has to resolve the Moraiya issue pending
which can delay its plans for the expansion in the transdermal space. Nonetheless, given the strong
positioning of the company in various pharma and consumer product categories and its ever-
increasing specialty product portfolio, Zydus Cadila is an important stock to watch out for in the
pharma space.
www.smartsyncservices.com Page | 92
Click here to Subscribe
on WhatsApp
Cupid
Financial Results & Highlights
Introduction
Cupid is engaged in business of dealing, marketing and manufacture of rubber contraceptives and
allied prophylactic products. It is the first company in the world to obtain Pre-qualification status from
WHO/UNFPA for supply of both Male & Female condoms. It currently exports to more than 65
countries worldwide.
Consolidated Financials (In Crs)
Q3FY21 Q3FY20 YoY % Q2FY21 QoQ % 9MFY21 9MFY20 YoY%
Sales 48 44 9.09% 31 54.84% 107 122 -12.30%
PBT 13 13 0% 9 44.44% 30 39 -23.08%
PAT 10 10 0% 7 42.86% 23 29 -20.69%
Detailed Results:
1. The current quarter was mixed with revenue growth of 9% YoY and while PAT was flat YoY.
2. The company’s total order book as of 1st Jan 2021 consists of Rs 121 Cr of confirmed orders.
3. The EBITDA margin for Q3 fell to 28.5% vs 32.5% a year ago.
4. Geographical sales breakup was 79% in exports and 21% domestic in Q3FY21.
5. Product-wise revenue breakup in Q3 is as follows:
1. Male Condoms: 53%
2. Female Condoms: 34%
3. WBJ & Hand Sanitizers: 7%
4. IVD: 6%
6. The company has started dispatching goods pertaining to the new tender order received from
Brazil.
Investor Conference Call Highlights
1. Male condom order book size is Rs 75 Cr out of the total of Rs 121 Cr.
2. Female condom order book is Rs 44 Cr while others account for Rs 2 Cr.
3. The current order from Brazil is Rs 45 CR which was being serviced at the end of Q3. The
management expects Brazil to come back with another tender by end of FY21.
4. A tender for female condoms is expected from South Africa in June or July and dispatches for it
can start from Oct 2021.
www.smartsyncservices.com Page | 93
Click here to Subscribe
on WhatsApp
5. Although production costs are down 10% as compared to Q1, margins were down due to less sale
of female condoms. This was due to the impact on South African Health Budget due to COVID-19
according to the management.
6. The production cost reduction was mainly due to an improvement in labor productivity according
to the management.
7. The management is seeing a rise in demand for male condoms. In Q3, Cupid received its largest
ever order from WHO/UNFPA. It also got an additional order of Rs 4 Cr of male condoms in Feb
2021.
8. The new tender for female condoms from Brazil is expected to be for 1 year while the South
African one is expected to be for 3 years.
9. The clinical trials have been delayed by 4-5 months for the company and it plans to apply to the
USFDA in April or May. The management is confident of receiving FDA approval in 2022.
10. The other expenses have risen from Rs 11.5 Cr to Rs 14.5 Cr due to an increase in marketing and
the increased cost of registration of products.
11. In the medical kit venture, the company has gotten an order of Rs 8.3 Cr from UP Government. Of
this, it has already supplied around Rs 6 Cr worth of kits by Dec end and the rest was delivered in
Jan. The management expects this business to bring in sales of Rs 7.5 Cr in Q1FY22 and rise to Rs
15-20 Cr by Q4FY22.
12. The company is also getting in touch with world players in the medical test kits space to become
outsourcing partners.
13. The company is targeting 15% net profit to Cupid from the medical business after deducting the
share of Invex. It is also projecting sales of Rs 50 Cr from this business in FY22.
14. The management has stated that it expects the Brazil and South Africa tenders to be of at least Rs
45 Cr each.
15. The company is not expecting much competition in the female condom space in the near future
as it takes at least 2 years to get the necessary prequalification from WHO and UNFPA.
16. The company has already supplied 1 lac female condoms to a domestic seller and is waiting on
feedback on the market response.
17. The company can make around 50 million female condoms per year and the management doesn’t
expect any capacity constraints to come up for the next 3-4 years.
18. The management is expecting sales of Rs 200 Cr in FY22.
19. The management expects a clear margin of 25-30% on the medical test kits.
20. The company is planning to register its products in 9 new countries including Turkey, Morocco,
Guinea, Argentina, & Peru.
21. The management has stated that the ratio of male to female condoms in the order book will
always be greater for male condoms as the demand for them is much higher than for female
condoms.
22. The management aims to maintain margins for male condoms at 25-30%.
23. The company has zero debt and has surplus funds of Rs 54 Cr as of 1st Jan 2021.
24. The management has stated that it has no plans to raise additional funds from a stake sale or debt
raise or equity issuance currently.
25. The surplus funds are parked in FDs or MFs.

www.smartsyncservices.com Page | 94
Click here to Subscribe
on WhatsApp
Analyst’s View:
Cupid is a leading condom maker in India. It is also one of the only 3 WHO-approved female condom
manufacturers in the world. It exports its products to over 80 countries around the world now. The
company has had a mixed quarter revenue growth of 9% YoY and flat PAT growth. The company seems
to be well placed with a strong order book ensuring revenues of more than Rs 121 Cr. It is seeing
renewed demand for male condoms and has also been able to improve the margin on this segment to
25%. The company is also looking to expand in the medical testing space and has already serviced Rs
8.3 Cr of orders. It also expects this business to bring in sales of Rs 50 Cr in FY22. It remains to be seen
how the COVID-19 situation pans out for Cupid in South Africa and what challenges the company faces
in its foray into the medical devices field. Nonetheless, given the company’s long history of expertise
in this field and the consistent sales growth and expanding order book, Cupid is a good small-cap stock
to watch for.
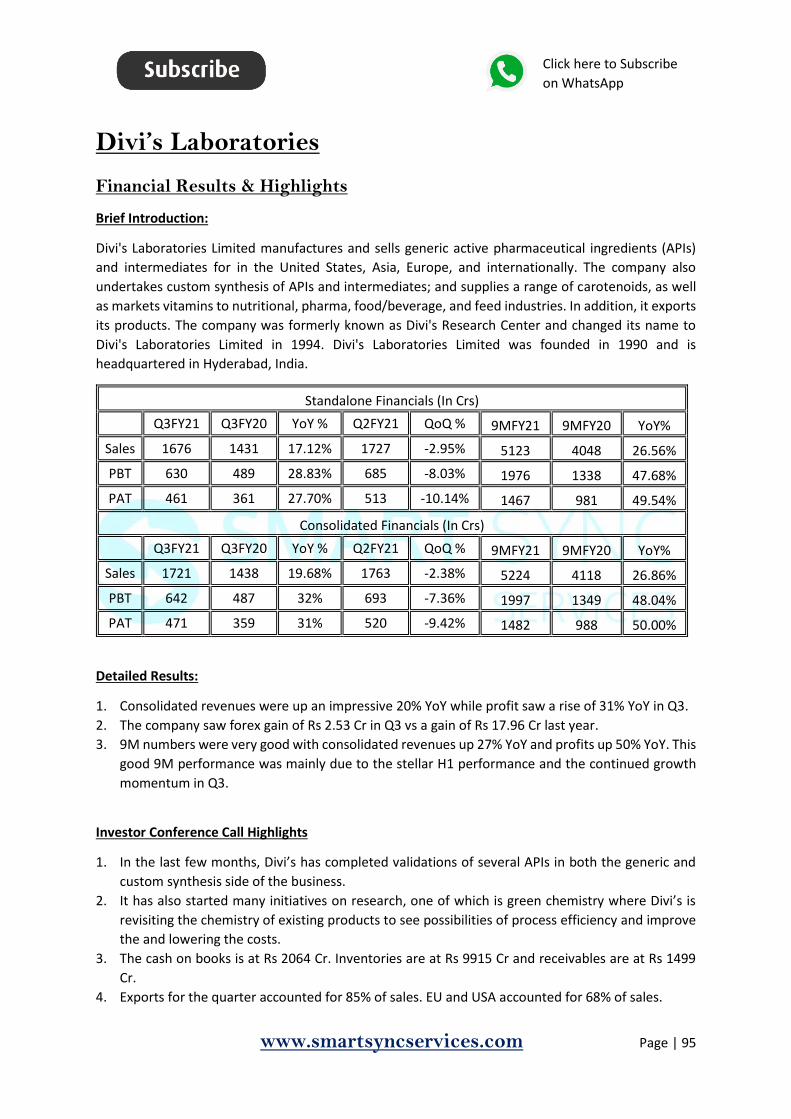
www.smartsyncservices.com Page | 95
Click here to Subscribe
on WhatsApp
Divi’s Laboratories
Financial Results & Highlights
Brief Introduction:
Divi's Laboratories Limited manufactures and sells generic active pharmaceutical ingredients (APIs)
and intermediates for in the United States, Asia, Europe, and internationally. The company also
undertakes custom synthesis of APIs and intermediates; and supplies a range of carotenoids, as well
as markets vitamins to nutritional, pharma, food/beverage, and feed industries. In addition, it exports
its products. The company was formerly known as Divi's Research Center and changed its name to
Divi's Laboratories Limited in 1994. Divi's Laboratories Limited was founded in 1990 and is
headquartered in Hyderabad, India.
Standalone Financials (In Crs)
Q3FY21 Q3FY20 YoY % Q2FY21 QoQ % 9MFY21 9MFY20 YoY%
Sales 1676 1431 17.12% 1727 -2.95% 5123 4048 26.56%
PBT 630 489 28.83% 685 -8.03% 1976 1338 47.68%
PAT 461 361 27.70% 513 -10.14% 1467 981 49.54%
Consolidated Financials (In Crs)
Q3FY21 Q3FY20 YoY % Q2FY21 QoQ % 9MFY21 9MFY20 YoY%
Sales 1721 1438 19.68% 1763 -2.38% 5224 4118 26.86%
PBT 642 487 32% 693 -7.36% 1997 1349 48.04%
PAT 471 359 31% 520 -9.42% 1482 988 50.00%
Detailed Results:
1. Consolidated revenues were up an impressive 20% YoY while profit saw a rise of 31% YoY in Q3.
2. The company saw forex gain of Rs 2.53 Cr in Q3 vs a gain of Rs 17.96 Cr last year.
3. 9M numbers were very good with consolidated revenues up 27% YoY and profits up 50% YoY. This
good 9M performance was mainly due to the stellar H1 performance and the continued growth
momentum in Q3.
Investor Conference Call Highlights
1. In the last few months, Divi’s has completed validations of several APIs in both the generic and
custom synthesis side of the business.
2. It has also started many initiatives on research, one of which is green chemistry where Divi’s is
revisiting the chemistry of existing products to see possibilities of process efficiency and improve
the and lowering the costs.
3. The cash on books is at Rs 2064 Cr. Inventories are at Rs 9915 Cr and receivables are at Rs 1499
Cr.
4. Exports for the quarter accounted for 85% of sales. EU and USA accounted for 68% of sales.

www.smartsyncservices.com Page | 96
Click here to Subscribe
on WhatsApp
5. Domestic sales accounted for 15% of total sales.
6. Product mix for generics to custom synthesis is at 60%:40%.
7. The company is currently offering contrast media API for iopamidol which it has been producing
for many years. The management has stated that the majority of the cost in the API was in Iodine
which can now be fully recycled which can lead to significant savings and minimal costs on recalling
and recycling iodine from waste streams. Divi’s is also looking to start implementing in other
contrast media compounds.
8. The management has stated that there a reasonably good size of the market for it and Divi’s is
one of very few players in the world with the capability to do so.
9. The company has already gotten all the required approvals for the new unit on Kakinada. The AP
govt has also set up a committee to address all the concerns raised on the unit and the company
is hopeful of resolution on this issue soon.
10. The management has clarified that the company is not losing any business due to the delay as Unit
I & II are already done and ready for operation.
11. The gross margin improvement has been a result of the introduction of new technologies, new
designs of equipment by the engineering department & backward integrations with process
improvement according to the management.
12. The management expects growth to accelerate from Q4 or Q1FY22 onwards as 10 big molecules
become generic and Divi’s has completed qualification to make them.
13. The management is confident of sustaining margins at current levels.
14. The capex of Rs 400 Cr announced in Q2 is ongoing and 1 stream is completed while 2 others are
yet to be commissioned. Production from these new lines should start in H1FY22.
15. Over 95% of the carotenoids business is from USA and EU. The revenue potential of the business
at its current full capacity is Rs 600 Cr. The company has also doubled the capacity for this business
after undertaking the expansion a year ago.
16. The world market size for contrast media API is expected to be around $4-6 billion. The
consumption of contrast media has risen a lot in the past 2-3 years. Divi’s hopes to be a major
player in this field going forward.
17. Green chemistry mentioned above is mostly about conservation and recycling of materials to
reduce end wastage. This also leads to lower RM consumption and emissions at plants.
18. The management has acknowledged that the competition from China on the API front is indeed
rising but the company has been able to maintain its leadership position in many of its captive
segments.
19. The management has stated that the arrival of the 10 big molecules shouldn’t cause mature
molecules to slow down as the demand for these old molecules remains resilient. A good example
of this is ibuprofen where the company has increased capacities but demand has remained stable.
In the case of the new molecules, they may cannibalize a few of the old ones but this will happen
only in those used for the same kind of treatments.
20. The management has stated that all of Divi’s prices are fixed beforehand in long term contracts
and thus it is not concerned with spot price volatility.
21. The management has stated that large volumes have declined for the industry in general as many
end manufacturers already have their own API setup for large volume drugs set up and the
industry is moving towards sourcing small volume and more complex products for API makers. But
Divi’s has an advantage in that it can also supply large volumes of quality products whenever
required.
www.smartsyncservices.com Page | 97
Click here to Subscribe
on WhatsApp
22. Although the company has visited gadolinium-based APIs in the past, it has no plans currently to
get into it.
23. The investments for the 10 new generic molecules are already planned and allocated. In some
products, the company has already completed the submission of applications.
24. The management has stated that there is no immediate big impact on the profitability of any drug
when it goes off patent as there is strict resistance in the market to maintain the previous quality
standards. This may go down in the case of normal drugs but in the case of critical drugs like
neurological drugs, this resistance is very strong as a little variation in the impurities can cause
enough disturbance in the brain in this case. Nonetheless, Divi’s is confident of maintaining
margins in custom synthesis even when products are going off patent by mitigating the fall with
initiatives like green chemistry according to the management.
Analyst’s View:
Divi’s Labs has been a celebrated API manufacturer in India for a long time. The company is doing well
and differentiating itself from the rest of the Indian Pharma industry by continuing to hone its efforts
in maintaining its dominance in the API industry and Custom Synthesis. It had another good quarter
in Q3 and maintained its growth momentum in 9M with 27% revenue growth and 50% PAT growth.
The management is doing well to explore and develop new avenues like contrast media APIs and in
overall efficiency through initiatives like green chemistry. It remains to be seen how the company will
be able to chart its path in the future by solely relying on its core areas of API and Custom Synthesis
while everyone else is diversifying into as many emerging segments as they can and whether the rise
in gross margins in last 9 months can be sustained going forward. Nonetheless, given the company’s
history of excellent performance and its standing in the global API industry, Divi’s Laboratories remain
a pivotal pharma stock in India, especially given the massive China substitution opportunity.

www.smartsyncservices.com Page | 98
Click here to Subscribe
on WhatsApp
Hester Biosciences
Financial Results & Highlights
Brief Company Introduction
Hester Biosciences Limited (HBL) is a publicly traded Indian company headquartered in Ahmedabad,
Gujarat, India. Hester is an animal and poultry vaccines manufacturing Company with plants situated
in Gujarat and Nepal. The company currently has a 30% share of the poultry vaccines market in the
country.
Standalone Financials (In Crs)
Q3FY21 Q3FY20 YoY % Q2FY21 QoQ % 9MFY21 9MFY20 YoY%
Sales 53 49 8.16% 54 -1.85% 147 131 12.21%
PBT 18 11 63.64% 14 28.57% 42 35 20.00%
PAT 13 8 62.50% 4 225.00% 11 9 22.22%
Consolidated Financials (In Crs)
Q3FY21 Q3FY20 YoY % Q2FY21 QoQ % 9MFY21 9MFY20 YoY%
Sales 58 51 13.73% 54 7.41% 152 141 7.80%
PBT 18 15 20% 11 63.64% 36 35 2.86%
PAT 13 12 8% 7 85.71% 25 26 -3.85%
Detailed Results:
1. The company had a decent quarter with an almost 14% YoY rise in consolidated revenues and an
8% YoY rise in PAT at a consolidated level.
2. 9M figures were encouraging with a revenue gain of 7.8% YoY and a profit fall of 3.85% YoY.
3. The EBITDA margin was at 38.97% in the current quarter vs 29.97% a year ago. ROE has risen to
23.24% in Q3FY21 from 15.6% a year ago.
4. The revenue growth in Q3 for the various segments is:
a. Poultry Healthcare: Up 32% YoY
b. Animal Healthcare: Up 4% YoY
c. Other: Down 15% YoY
5. Poultry healthcare remains the biggest contributor at 75% contribution to revenues.
6. Domestic sales have registered a growth of 43% in Q3FY21 and 20% in 9MFY21 and the export
sales have reduced by 51% in Q3FY21 and 5% in 9MFY21.
7. Overall vaccine sales grew 20% YoY in Q3 and 12% YoY in 9M. Health product sales grew 48% YoY
in Q3 and 31% YoY in H1.
8. The National Animal Disease Control Program of the Government of India is expected to be
implemented for the Brucella vaccine by March 2021.
9. There has been no material impact on sales from the outbreak of bird flu in India.
10. Hester is set to launch a new range of Herbal Health products this quarter.
www.smartsyncservices.com Page | 99
Click here to Subscribe
on WhatsApp
11. The company will be focussing on domestic demand for vaccines and exports will be for animal
products mostly.
12. The management will be looking to raise Rs 200 Cr to finance future expansion.
13. Hester Nepal saw a comeback in revenues. Revenues grew to Rs 3.6 Cr in Q3FY21 from Rs 0.87 Cr
last year. FAO orders for PR have resumed.
14. The Texas Lifesciences unit also saw good revenue growth of 55% YoY in Q3 to Rs 5.17 Cr.
15. Hester Tanzania had a good quarter with almost 100% YoY growth in Q3. Commercial production
in the Tanzania facility is expected to start from June 2021.
Investor Conference Call Details:
1. The modest growth in animal health business in Q3 was due to the absence of tender business for
animal vaccines.
2. The income from technology transfer to Novapharma in Egypt is reflected in other income. This
project is expected to be over in 1.5-2 years.
3. Consolidated debt is now at Rs 114 Cr.
4. The company is not yet committed as to how to raise the Rs 200 Cr funds for expansion. It is
expected to be a mix of debt and equity.
5. WC has seen good improvement YoY.
6. The company has decided to concentrate on the domestic vaccine demand mainly as the margins
for both domestic and export sales of vaccines are roughly the same for Hester. The management
is confident of regaining lost export business once capacity expands to be able to address
additional demand.
7. Pending capex in Texas is around Rs 5 Cr and is 10% of the allocated amount.
8. There haven’t been any overruns in any of the company’s capex projects so far.
9. The company’s efforts in sales and marketing in FY20 have yielded results and thus the company
is seeing unprecedented demand from the domestic sector which has forced the management to
decide to concentrate on supplying vaccines only for domestic sales in the short term.
10. The plan ahead for Africa is to look to set up or acquire animal health product making facility as
the asset turnover ratio in animal health business is much higher than vaccines.
11. The company will be looking to expand marketing in export destinations from Q1FY22 and creating
a distribution network in Africa.
12. The company does want to enter into the pet vaccine market but it is looking for an international
partner for international marketing for this sector. Also, it has not entered this segment in India
as it is very small here compared to the domestic animal vaccine market. This situation is the
reverse of USA where the pet market is much bigger than the domestic animals market.
13. The management expects massive consolidation to take place in the cattle farming segment in
India in the future and other animal rearing sectors which should bring in demand for vaccines as
the organized sector expands. A similar evolution is expected to take place in Africa at a slower
pace as the organized sector is even smaller there as compared to India.
14. The management has stated that it expects margins to stay at current levels or higher in the
medium term and revenues to rise to Rs 400-500 Cr in the next 5 years.
15. Around 75% of revenues come from vaccines while the rest is from animal health business.
16. Vaccine capacity utilization is above 80%.

www.smartsyncservices.com Page | 100
Click here to Subscribe
on WhatsApp
Analyst Views:
Hester Bio has had a tough time this year with the COVID-19 outbreak and delays in the animal vaccine
tenders. The company had a good Q3 with minimal impact from bird flu and despite the absence of
the domestic animal vaccine tender business. The company has made good inroads in the animal
health products space. The management has identified domestic demand as the primary focus for
vaccine sales in the near future till they can expand capacity while animal health products will continue
to be exported. It is also looking forward to the start of production in Hester Africa in the next 6
months. It remains to be seen how long the slowdown in animal vaccine tenders in India continues
and how long it will take for the company to establish itself in the new space of animal health products
that it has entered. Nonetheless, given its excellent technical expertise and the future potential of its
international operations, and its upcoming foray into animal health products, Hester Biosciences
remains a good small-cap stock to watch out for.

www.smartsyncservices.com Page | 101
Click here to Subscribe
on WhatsApp
Suven Pharma
Financial Results & Highlights
Brief Introduction:
Suven Pharmaceuticals Limited operates as a bio-pharmaceutical company in India, the United States,
Europe, and internationally. It develops, manufactures, and sells new chemical entity based
intermediates, active pharmaceutical ingredients, specialty chemicals, and formulated drugs under
contract research and manufacturing services for pharmaceutical, biotechnology, and chemical
companies. The company was incorporated in 2018 and is based in Hyderabad, India. Suven
Pharmaceuticals Limited is a subsidiary of Jasti Property and Equity Holdings Private Limited.
Standalone Financials (In Crs)
Q3FY21 Q3FY20 YoY % Q2FY21 QoQ % 9MFY21 9MFY20 YoY%
Sales 280 184 52.17% 238 17.65% 761 662 14.95%
PBT 132 72 83.33% 88 50.00% 327 289 13.15%
PAT 98 52 88.46% 65 50.77% 244 217 12.44%
Consolidated Financials (In Crs)
Q3FY21 Q3FY20 YoY % Q2FY21 QoQ % 9MFY21 9MFY20 YoY%
Sales 280 184 52.17% 238 17.65% 761 662 14.95%
PBT 148 78 90% 97 52.58% 362 315 14.92%
PAT 114 58 97% 74 54.05% 279 243 14.81%
Detailed Results:
9. Consolidated revenues were up with 52% YoY growth. Profit has risen over 97% YoY in Q3. EBITDA
has grown 69% in the same period.
10. The CDMO pharm segment has risen 2.74 times to Rs 217 Cr of sales in Q3. The CDMO spec Chem
segment has declined around 50% to Rs 34.8 Cr. The formulation and others segment has fallen
to Rs 23.25 Cr from Rs 33.19 Cr last year.
11. 9M figures for Suven were very good with 15% YoY revenue & profit growth while EBITDA rose
12.3% YoY in the same period.
12. EBITDA margin was at 51.11% in Q3 and 48.4% in 9M periods.
13. Overall EPS has grown to Rs 4.5 per share in Q3 from Rs 2.9 in Q2 and Rs 2.3 in Q3FY20.
14. The company has announced a dividend of Rs 1 per share.
Investor Conference Call Highlights
1. The management maintains its previous guidance of 15-20% revenue growth in FY21.
2. The current rise in CDMO and fall in the CDMO spec chem segment are in line with expectations
according to the management.

www.smartsyncservices.com Page | 102
Click here to Subscribe
on WhatsApp
3. The management states that it expects revenue growth to remain at the current guidance in FY22
as it has provided for FY21.
4. The company has filed for 12 ANDAs and has gotten approvals for 6 of them in FY21 so far. It is
looking to launch a new product in Q4 and approvals for another 6 in the rest of 2021.
5. The management states that the difference between pharma CRAMS and specialty chemical
CRAMS is that in the pharma one, there isn’t much visibility in terms of volumes guidance or
response while in chemical CRAMS, you do get some indication of them. There isn’t much
difference in the development cycle stage for both these segments.
6. The company is in talks with 2 big customers to manufacture for them in India. The management
has stated that it will take at least 2-3 years for Suven to start delivering.
7. The management has stated that the company has always tried to employ green chemistry
principles from the start and it doesn’t have to do any major pivot to bring this in.
8. The management has refrained from providing PAT guidance for FY22 and has stated that it
maintains visibility for only 6 months.
9. The management admits that the pharma CRAMS model has revenues lumpiness ingrained in the
revenue model as projects can be for 3-4 months’ duration or even for 5-6 months.
10. The profit share from the 2 ANDAs launched in H1FY21 is still small but it is growing well according
to the management. The potential contribution from sale and profit share from these products
may be from $0.5-4 million per product.
11. The lumpiness in the spec chem segment is not due to lost orders but due to delay in delivery. The
management maintains that it will be smoothed out in the entire year numbers.
12. The breakup of the Rs 600 Cr capex announced by the management is as follows:
1. Relocation of the R&D center which can take 2-3 years.
2. Replacement of a block in Suryapet.
3. Warehousing equipment at a small block in Pashamylaram.
13. The company has not finalized the exact breakup of the capex amount yet and will announce it in
the next investor concall. The capex activity will start in FY22. Around 80% of this capex is expected
to be done in the relocation.
14. The company is looking to add a new contract in the spec chem segment in Q1FY22 and is on track
to add another one in FY22.
15. The company earned Rs 35 Cr of profit share from Rising Pharma in 9M.
16. The company is still in talks for signup of new research projects and it expects to take at least 6
months in the initial stages.
17. The management believes that the company has enough capacity at present.
18. The management has stated that it is indeed expecting a rise in value from migration from
intermediates to APIs but it is not possible to specify a number on this value appreciation right

www.smartsyncservices.com Page | 103
Click here to Subscribe
on WhatsApp
now. Incremental sales growth from this shift will take at least 2 years according to the
management.
19. The company is looking to launch 3-5 ANDAs in FY22, all of which are small volume and value-
based products.
20. The specialty chemicals business is expected to grow 5-10% in FY22.
21. The company is still on the lookout for a COO at the moment.
22. The management has admitted that project accumulation has been slow due to travel restrictions
but this is an issue with the entire industry and not just Suven. The management is confident that
the slowdown of 2 quarter will not have much material impact on the company’s long term
growth.
23. The management remains optimistic about its pipeline and it believes that although customers
are starting with low volumes, it will scale up in the long term.
24. The company has a debt of Rs 66 Cr from Suven Life Sciences and Rs 1004 Cr of debt from term
loans.
25. Most of the Rs 600 Cr capex is expected to be done using internal accruals.
26. The company is not doing anything in the biologics space currently.
27. The EBITDA margin is dependent on product mix which can change very easily in CRAMS and thus
the management has stated that it doesn’t expect the margin to remain at the current level but it
should be at 40% at least.
28. The cost of debt to Suven is at 5%.
29. The management has stated that the resurgence of COVID in many countries should not affect its
operations in a great way and it can mostly increase logistics costs and raw material costs for no
more than 3-4% at a time.
30. The management expects 20-25% growth in the formulations business in the next 1-2 years.
31. Around 90% of the company’s business comes from big pharma companies while the rest of the
business comes from small ones. Most of the innovation and growth is led by the business with
big pharma companies.
32. The company doesn’t have any first right of refusal arrangement with Rising Pharma.
33. Right now the company has 3 projects from Rising Pharma.
34. The management has stated that its vision for Suven Pharma is to remain on the innovation side
in pharma and venture into APIs as innovators.
35. The management clarifies that it doesn’t have the first right to refusal with Rising Pharma and
instead, it gets the first opportunity to bid for any new projects for Rising. But it can only take on
opportunities where it can deliver here. It has also clarified that Rising will not necessarily give
Suven the deal if it is getting better terms from someone else.

www.smartsyncservices.com Page | 104
Click here to Subscribe
on WhatsApp
Analyst’s View:
Suven Pharma is a fast-rising player in the CRAMS space in India. It has had a phenomenal quarter with
>50% rise in revenues and 97% rise in profits. The management remains cautious on the fact that this
performance should not be indicative of future performance as revenues are always lumpy in the
CRAMS model. The company has indicated its intention to go into the innovation side in APIs but it
will take some time for it to build itself up in this space. The management maintains that although the
current EBITDA margin of 51% may not be sustainable, Suven can achieve at least a 40% margin going
forward. It remains to be seen what obstacles Suven will face in its new business expansion and
whether it will be able to successfully become an API innovator in the future, Nonetheless, given the
rise of the CRAMS space in India, the company’s induction from smallcap into the midcap space by
AMFI, Suven looks to be an exciting new pharma prospect for investors.
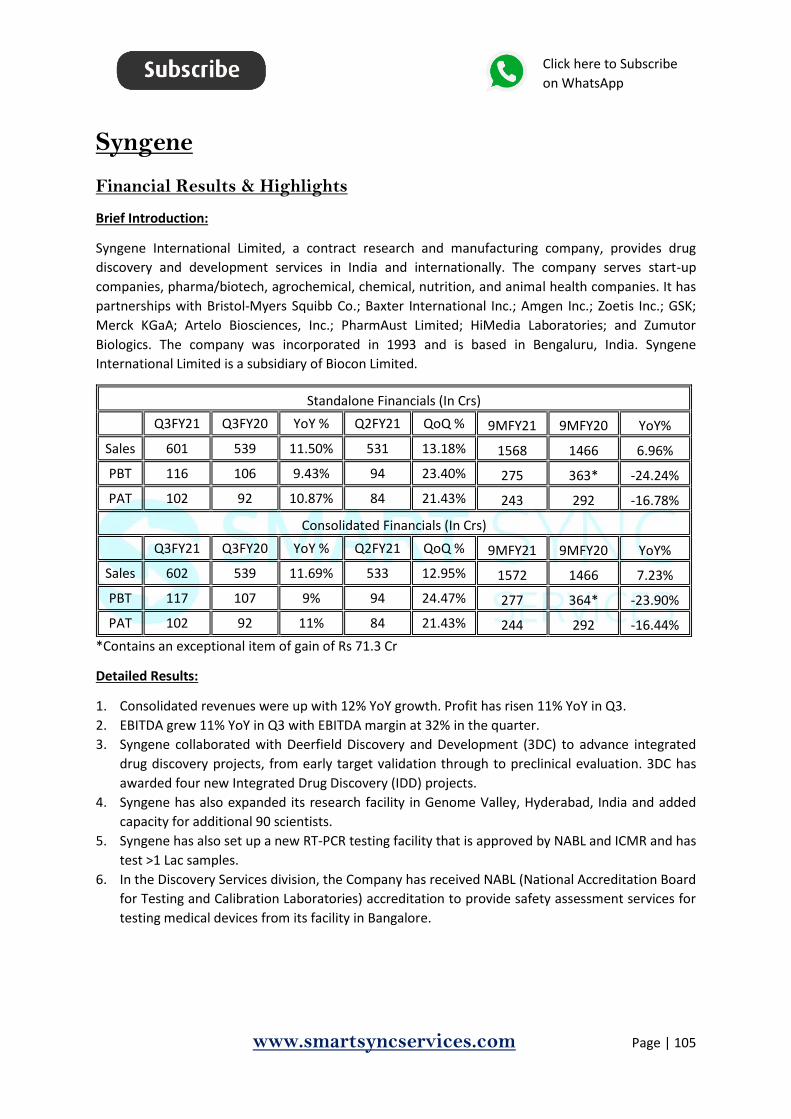
www.smartsyncservices.com Page | 105
Click here to Subscribe
on WhatsApp
Syngene
Financial Results & Highlights
Brief Introduction:
Syngene International Limited, a contract research and manufacturing company, provides drug
discovery and development services in India and internationally. The company serves start-up
companies, pharma/biotech, agrochemical, chemical, nutrition, and animal health companies. It has
partnerships with Bristol-Myers Squibb Co.; Baxter International Inc.; Amgen Inc.; Zoetis Inc.; GSK;
Merck KGaA; Artelo Biosciences, Inc.; PharmAust Limited; HiMedia Laboratories; and Zumutor
Biologics. The company was incorporated in 1993 and is based in Bengaluru, India. Syngene
International Limited is a subsidiary of Biocon Limited.
Standalone Financials (In Crs)
Q3FY21 Q3FY20 YoY % Q2FY21 QoQ % 9MFY21 9MFY20 YoY%
Sales 601 539 11.50% 531 13.18% 1568 1466 6.96%
PBT 116 106 9.43% 94 23.40% 275 363* -24.24%
PAT 102 92 10.87% 84 21.43% 243 292 -16.78%
Consolidated Financials (In Crs)
Q3FY21 Q3FY20 YoY % Q2FY21 QoQ % 9MFY21 9MFY20 YoY%
Sales 602 539 11.69% 533 12.95% 1572 1466 7.23%
PBT 117 107 9% 94 24.47% 277 364* -23.90%
PAT 102 92 11% 84 21.43% 244 292 -16.44%
*Contains an exceptional item of gain of Rs 71.3 Cr
Detailed Results:
1. Consolidated revenues were up with 12% YoY growth. Profit has risen 11% YoY in Q3.
2. EBITDA grew 11% YoY in Q3 with EBITDA margin at 32% in the quarter.
3. Syngene collaborated with Deerfield Discovery and Development (3DC) to advance integrated
drug discovery projects, from early target validation through to preclinical evaluation. 3DC has
awarded four new Integrated Drug Discovery (IDD) projects.
4. Syngene has also expanded its research facility in Genome Valley, Hyderabad, India and added
capacity for additional 90 scientists.
5. Syngene has also set up a new RT-PCR testing facility that is approved by NABL and ICMR and has
test >1 Lac samples.
6. In the Discovery Services division, the Company has received NABL (National Accreditation Board
for Testing and Calibration Laboratories) accreditation to provide safety assessment services for
testing medical devices from its facility in Bangalore.

www.smartsyncservices.com Page | 106
Click here to Subscribe
on WhatsApp
Investor Conference Call Highlights
1. The 4 IDD projects from 3DC are in Oncology and Autoimmune segments.
2. Syngene has currently close to 175 scientists operating out of the Hyderabad facility.
3. The company saw EBITDA margin appreciation of 150 bps on improvement in direct cost with raw
materials and power cost which has gone down from 28.5% last year to 27% currently.
4. Staff costs increased by 16% to INR 176 Cr. Other expenses have risen 13% YoY due to new ways
of doing business during the COVID-19 times and an increase in cost associated with maintaining
necessary health and safety protocol.
5. Depreciation rose 22% YoY to Rs 70 Cr owing to the investments in the Hyderabad facility,
expansion at the main Bangalore campus and the commencement of the Mangalore commercial
API plant at the end of the last financial year.
6. Syngene recorded an exchange gain of INR 8 crores in the quarter. The effective tax rate was at
12.3% vs 13.9% last year. Forex gain in the 9M period was at Rs 12 Cr vs Rs 15 Cr last year.
7. Capex in 9M was at $53 million. Of this, $8 million pertains to the commercial API manufacturing
facility, another USD 16 million was invested in Discovery Services, USD 15 million was invested in
dedicated centers, USD 7 million in the biologics manufacturing facility and a balance of USD 7
million in Development Services and other assets.
8. The company maintains its guidance of spending USD 550 million by end of March 2021. Some
part of this may spill over into Q1FY22.
9. The company continued to work at near 100% operational levels in Q2 and Q3.
10. Mangalore OpEx is diluting Syngene’s margin by close to 2%. The company has spent $75 million
here and will be depreciating this number over 18 years.
11. The management maintains that the company’s successful track record and its scientific capability
are what led 3DC to choose it as its collaborator.
12. Headcount numbers and people costs will continue to grow in absolute terms as people are a
direct revenue generator in terms of how that business model works for Syngene.
13. There is a general slowness around the whole of the industry globally on starting new clinical trials
as all hospitals around the world are running close to full capacity due to COVID.
14. The management has stated that most of the work Syngene does with BMS is under a research
discovery relationship. It is working on the science today that will probably become new product
approvals in about 8 years.
15. The management has stated that it has expanded on the Mangalore facility to be able to win more
integrated projects and expand upon the CMO opportunities in the future. The startup period for
this venture is expected to be till the next 5 years.
16. Although the company faces tough competition in the biologics space from global giants like Lonza
and Samsung, the management is confident of the company’s value proposition and the space for
agile, modestly scaled, and competent Biologics manufacturers in the industry.
17. Constant currency growth in Q3 is above 10% YoY.
18. The gestation period for the Mangalore expansion will be around 3-5 years before it starts showing
a strong return on capital employed in that investment.
www.smartsyncservices.com Page | 107
Click here to Subscribe
on WhatsApp
Analyst’s View:
Syngene is a fast-rising player in the CRMO space and has established itself well with its associations
with industry leaders in the pharma space like Bristol-Myers Squibb, Amgen and others. It has seen a
good Q3 with revenues rising 12% YoY and EBITDA margins improving to 32%. The company has seen
a good response to its CRO capability and this has resulted in its association with 3DC for its Integrated
Drug Discovery platform. The management remains cautiously optimistic on its foray into contract
manufacturing with the setup of the Mangalore facility. It remains to be seen how long will it take for
the company’s foray into CMO to bear fruit and whether the company can continue its robust growth
momentum on its current CRO capabilities. Nonetheless, given its scientific capabilities, its
associations with industry leaders for drug discovery, and its expanding reach in the global pharma
space, Syngene is a pivotal midcap pharma stock to keep in mind for all investors.
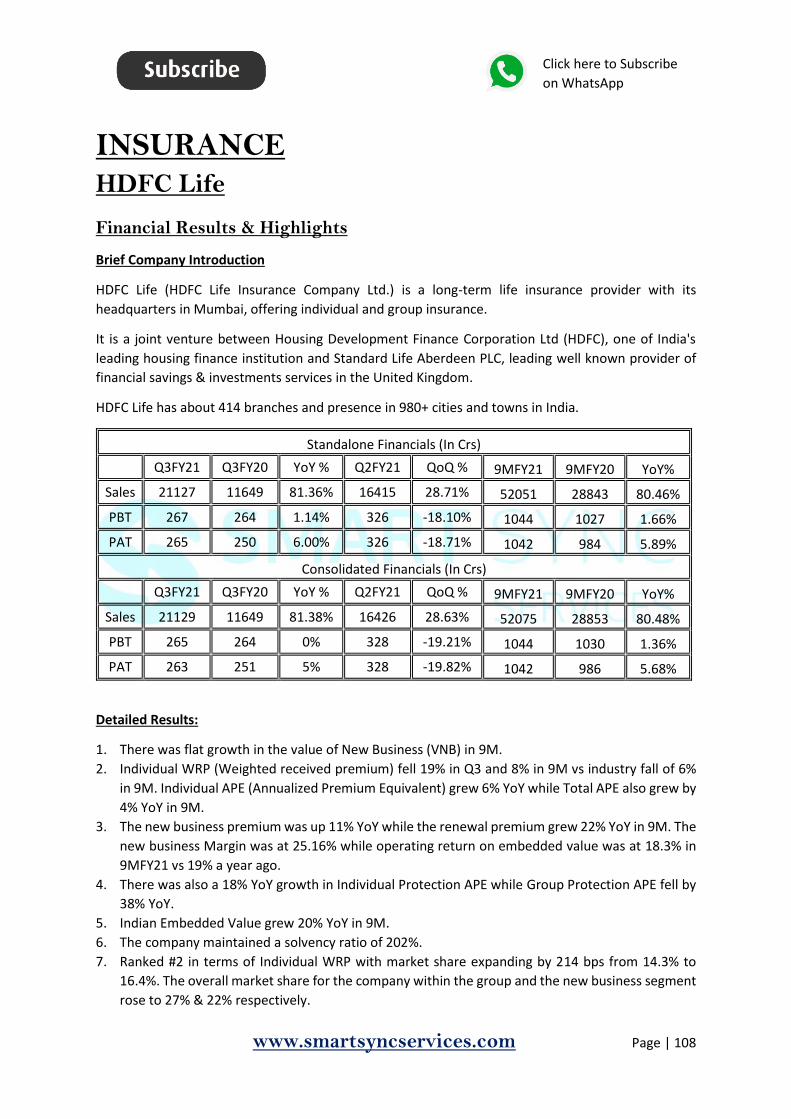
www.smartsyncservices.com Page | 108
Click here to Subscribe
on WhatsApp
INSURANCE HDFC Life
Financial Results & Highlights
Brief Company Introduction
HDFC Life (HDFC Life Insurance Company Ltd.) is a long-term life insurance provider with its
headquarters in Mumbai, offering individual and group insurance.
It is a joint venture between Housing Development Finance Corporation Ltd (HDFC), one of India's
leading housing finance institution and Standard Life Aberdeen PLC, leading well known provider of
financial savings & investments services in the United Kingdom.
HDFC Life has about 414 branches and presence in 980+ cities and towns in India.
Standalone Financials (In Crs)
Q3FY21 Q3FY20 YoY % Q2FY21 QoQ % 9MFY21 9MFY20 YoY%
Sales 21127 11649 81.36% 16415 28.71% 52051 28843 80.46%
PBT 267 264 1.14% 326 -18.10% 1044 1027 1.66%
PAT 265 250 6.00% 326 -18.71% 1042 984 5.89%
Consolidated Financials (In Crs)
Q3FY21 Q3FY20 YoY % Q2FY21 QoQ % 9MFY21 9MFY20 YoY%
Sales 21129 11649 81.38% 16426 28.63% 52075 28853 80.48%
PBT 265 264 0% 328 -19.21% 1044 1030 1.36%
PAT 263 251 5% 328 -19.82% 1042 986 5.68%
Detailed Results:
1. There was flat growth in the value of New Business (VNB) in 9M.
2. Individual WRP (Weighted received premium) fell 19% in Q3 and 8% in 9M vs industry fall of 6%
in 9M. Individual APE (Annualized Premium Equivalent) grew 6% YoY while Total APE also grew by
4% YoY in 9M.
3. The new business premium was up 11% YoY while the renewal premium grew 22% YoY in 9M. The
new business Margin was at 25.16% while operating return on embedded value was at 18.3% in
9MFY21 vs 19% a year ago.
4. There was also a 18% YoY growth in Individual Protection APE while Group Protection APE fell by
38% YoY.
5. Indian Embedded Value grew 20% YoY in 9M.
6. The company maintained a solvency ratio of 202%.
7. Ranked #2 in terms of Individual WRP with market share expanding by 214 bps from 14.3% to
16.4%. The overall market share for the company within the group and the new business segment
rose to 27% & 22% respectively.
www.smartsyncservices.com Page | 109
Click here to Subscribe
on WhatsApp
8. As of 31st Dec 2020, the AUM was at Rs 1.65 Lac Cr and had a 64:36 debt to equity mix. 98% of
debt investments were in G-Sec and AAA-rated bonds.
9. The product mix was at: UL: 23%, Par: 35%, Non-par savings: 30%, Protection: 7%, Annuity: 5%.
10. The operating expense to total premium ratio was maintained at 12.1% in 9MFY21 vs 13.7% a year
ago.
11. HDFC Pension Fund saw AUM growth of 81% YoY while market share rose to 34% from 30% last
year.
12. 13M and 61M persistency was at 89% and 53% respectively.
Investor Conference Call Highlights
1. In terms of individual WRP, the company grew by 8% for 9MFY21 vs an 8% decline in the industry.
Average ticket size and no. of policies sold continued to rise.
2. As of Dec, HDFC Life has gotten 1,271 individual and 542 group COVID related claims which the
management states are well within its projections.
3. HDFC Life has launched a new term plan, “Click 2 Protect life” with innovative features. It is actively
engaged with new banca channel partners to get new business and tap new gen customers
through the online channel.
4. This new product should help HDFC life expand on margins going forward.
5. ULIP was up 13% in Q3. Credit protect has seen a strong pickup QoQ, generating business worth
Rs 10 bn in Q3 vs Rs 7 bn in Q2 and Rs 2.4 bn in Q1.
6. The new product Click2Protect Life provides flexibility to auto balance death and critical illness
cover or receive income payouts from age 60. The management believes that this product launch
underlines the company’s innovation edge.
7. The management remains positive on the annuity opportunity given that HDFC Life aspires to
grow the retiral corpus by 3x by FY25. It also believes that the annuity opportunity is bigger than
the protection opportunity for HDFC Life.
8. Renewal growth was strong at 22% YoY with 87% via the digital mode.
9. Growth in the banca channel has been strong, including that for HDFC Bank, where the company
has been able to retain its market share.
10. The management remains confident in managing the product mix in times of rate hardening,
stating that it follows a dynamic rate pricing governance.
11. Individual and group annuities have seen 42% growth with annuity contributing over 5% to
individual APE.
12. The company is seeing signs of demand for individual protection reverting to normal levels after
the initial surge due to the pandemic. The long-term opportunity for protection remains strong.
13. The management states that tax savings are no longer the primary reason to buy insurance and
thus the core demand for insurance products is expected to remain sustained.
14. The management reiterated its sales approach as being customer-centric rather than being
product or distribution channel-centric. It stated that it usually works with its distributors in terms
of what their customers want and what the partner strategy is to cater to the customers’ demand.
15. The management expects the quality of the protection book to improve going forward given the
price actions taken after the rate hike.
16. Average ticket sizes for plain term plan were between Rs 20,000-30,000 while ROPs were between
Rs 35,000-40,000.

www.smartsyncservices.com Page | 110
Click here to Subscribe
on WhatsApp
Analyst’s View:
HDFC Life is one of the front runners in the life insurance industry in India. The company has gone
from strength to strength and maintained a good balance of new business and existing business while
consistently growing over the years. The company has done well to adapt to the new normal and
remained conservative in current uncertain times. The results show a sustained rise in Individual WRP,
its market share and renewal premium remains strong despite the industry decline. The company has
also done well to maintain its focus on operational segments and on introducing the new digital
product Click2Protect. It also sees a big opportunity in annuity space which is even bigger than the
protection opportunity. It remains to be seen whether the situation ahead unfolds within the
company’s expectations or how long will it take for the industry to normalize. Nonetheless, given the
company’s market positioning, its dynamic product portfolio, and its emphasis on the development of
non-traditional channels and innovative products, HDFC Life remains a pivotal insurance stock in the
country.

www.smartsyncservices.com Page | 111
Click here to Subscribe
on WhatsApp
SBI Life
Financial Results & Highlights
Brief Company Introduction
SBI Life Insurance is a joint venture life insurance company between State Bank of India (SBI), the
largest state-owned banking and financial services company in India, and BNP Paribas Cardif. BNP
Paribas is a French multinational bank and financial services company with global headquarters in
Paris. SBI owns 62.1% of the total capital and BNP Paribas Cardif 22% of the capital. Other investors
are Value Line Pte. Ltd. and MacRitchie Investments Pte. Ltd., holding 1.95% of the total capital each
and remaining 12% with Public.
Consolidated Financials (In Crs)
Q3FY21 Q3FY20 YoY % Q2FY21 QoQ % 9MFY21 9MFY20 YoY%
Sales 26552 15779 68.27% 18458 43.85% 61188 38168 60.31%
PBT 233 395 -41% 300 -22.33% 920 892 3.14%
PAT 233 390 -40% 300 -22.33% 923 892 3.48%
Detailed Results:
1. There was a 2% YoY fall in the Value of New Business (VNP). GWP rose by 21% YoY.
2. IRP (Individual Rated Premium) and APE (Annualized Premium Equivalent) declined 10% & 7% YoY
while Total Protection NBP rose 12% YoY.
3. The new business premium rose 13% YoY. The new business Margin was at 19.3%.
4. The company maintained a solvency ratio of 234%.
5. The company saw a fall in its private market share based on IRP to 23.4%.
6. Total AUM and Net Worth grew 28% and 19% YoY respectively in the 9M period.
7. As of 31st Dec 2020, the AUM was at Rs 2095 billion and had a 73:27 debt to equity mix. Over 90%
of debt investments were in AAA-rated bonds.
8. The operating expense to the gross premium ratio declined 90 bps YoY to 5.1%.
9. The total Cost to gross premium ratio was at 8.5% from 10% a year ago.
10. The company reported minor improvement in persistency across all time periods.
11. 61st-month persistency has improved to 61.69% in 9M FY 2021 as compared to 58.53% in 9M FY
2020.
12. The company achieved market leadership in Total NBP with 23.7% private market share.
13. ULIP maintains an overall NBP share at 38% in 9M. Par and non-par were at 5% and 58%
respectively.
14. In distribution channels, Banca channels account for 55% of APE while Agency and other accounts
for 15% and 30% respectively.
www.smartsyncservices.com Page | 112
Click here to Subscribe
on WhatsApp
Investor Conference Call Highlights
1. Protection contribution to VNB was in 26-30% range for Q3FY21 and 9MFY21. Within individual
protection, the share of Return of Premium (ROP) product has risen 5-10% YoY, capping the
increase in margin.
2. In individual protection segment, ROP product continues to dominate with a 75-80% share. The
average ticket size of the ROP product is ~Rs 18,000-20,000 and for pure protection it was lower.
Growth has been largely volume driven according to the management.
3. Under group protection business (Rs 11.3bn), Credit life (Rs 8.7 bn) registered a >10% growth on
a sequential basis and is back to last year’s level.
4. The company is still awaiting regulatory approval for the repricing of its new protection product.
The management has stated that the effect of the price increase will be very small on the overall
margin.
5. On 9MFY21 basis, APE is still down 30% YoY mainly on account of a 38% YoY decline in the ULIP
segment.
6. On QoQ basis, the ULIP APE was up 49%. The momentum in ULIP is partly on account of the healthy
run-up in equity market prices. According to the management, the ULIP inflows are 60% debt
compared to 65% earlier.
7. The management maintains an aggressive position in expanding the protection business.
8. While the filing of the protection product with revised pricing is yet to take place, the company is
already working with its sponsor SBI to push protection across its bank branches. SBI’s 450mn
customer base serves as a huge opportunity for SBI Life.
9. Credit protect has also seen good pick-up on the back of demand for housing finance. YTD, credit
protect is nearly at last year’s level despite losing out on the majority of H1.
10. Renewals for the quarter were up 27% YoY.
11. The current protection gap in India is 92%. Also, the management believes that a lot of those who
already have protection are not adequately covered. Growing awareness about protection is
expected to lead to better penetration levels for the industry going ahead.
12. The new protection product with the repricing is expected to be launched in Q4.
13. The current credit protect attachment rate is 43%. In metros, where average home loan ticket
sizes are larger, the attachment rates are lower as customers are reluctant to spend more.
14. The average ticket size of a credit protect product increases with the age of the customer and the
typical age of a home buyer in India is 40+ years.
15. As a percentage of the overall credit protect portfolio, the home loan is ~96%. Attachment rates
on car loans are very low.
16. Distribution of the new product (SBI Life – Smart Future Choices) is taking place across all channels.
The product is mainly aimed at those who can afford to invest Rs 1 Lac or above.
17. The company has not undertaken any assumption changes in 9MFY21.
Analyst’s View:
SBI Life is one of the front runners in the life insurance industry in India. The company has done well
to establish itself as the biggest private insurance company in India in terms of AUM and market share.
The company has seen good growth in New business premium and ULIPs have seen a good recovery
with ticket sizes higher than last year. the company sees good potential for growth from the
association with SBI and its 450 million customer base serves as a big opportunity for SBI Life. The
www.smartsyncservices.com Page | 113
Click here to Subscribe
on WhatsApp
company is yet to receive approval for repricing for its new protection product but this product is
expected to be launched shortly in Q4. The focus of the management remains to focus on products
based on customer requirements & stay competitive and drive volumes in these segments. It remains
to be seen whether the situation ahead unfolds within the company’s expectations or how will SBI Life
remain competitive with other industry players in this rising industry. Nonetheless, given the
company’s market positioning, its emphasis on cautious capital allocation, and the immense cross-sell
opportunity with SBI, SBI Life remains one of the most preferred life-insurance companies in the
country.

www.smartsyncservices.com Page | 114
Click here to Subscribe
on WhatsApp
LIFESTYLE PRODUCTS Vaibhav Global
Financial Results & Highlights
Brief Introduction
Vaibhav Global is a company dealing in fashion jewellery and lifestyle products. They mainly source
and assemble their products in India and South East Asia and sell these products in the US and UK
primarily. They sell both to businesses and retail customers whom they reach through TV sales
channels and shows through they reach more than 100 million TV homes in the US and UK.
Standalone Financials (In Crs)
Q3FY21 Q3FY20 YoY % Q2FY21 QoQ % 9MFY21 9MFY20 YoY%
Sales 131 127 3.15% 122 7.38% 330 345 -4.35%
PBT 14 5 180.00% 15 -6.67% 28 25 12.00%
PAT 13 4 225.00% 13 0.00% 26 21 23.81%
Consolidated Financials (In Crs)
Q3FY21 Q3FY20 YoY % Q2FY21 QoQ % 9MFY21 9MFY20 YoY%
Sales 729 567 28.57% 602 21.10% 1885 1499 25.75%
PBT 116 82 41% 89 30.34% 272 188 44.68%
PAT 92 66 39% 71 29.58% 216 151 43.05%
Detailed Results:
1. The company continued its phenomenal run in FY21 with a consolidated revenue rise of 29% YoY
and PAT rise of 39% YoY. Retail revenues rose 30% YoY.
2. EBITDA grew 37.3% YoY with margins improving 110 bps YoY to 17.4%.
3. The company has declared a third interim dividend of Rs 7.5 per share for FY21.
4. TV sales accounted for 64% of sales while web sales accounted for 36% in 9M. Mobile sales
accounted for 59% of web sales in 9M.
5. Non jewellery items now account for 32% of sales in 9M.
6. The company has a TV reach of 74 million households in the USA and 25 million households in the
UK.
7. The revenue growth in different categories in Q3 is:
1. TV sales: 24% up YoY (Rs 460 Cr)
2. Web sales: 43% up YoY (Rs 256 Cr)
3. B2B: 26.9% down YoY (Rs 9 Cr)
8. Shop LC revenues grew 20% YoY to $65 million in Q3 & 19.9% YoY to $172 million in 9M.
9. TJC UK revenues grew 32.7% YoY to GBP 24.3 million in Q3 & 30.6% YoY to GBP 60 million in 9M.
10. TV sales volumes have risen to 2.134 million in Q3 from 1.719 million last year. Correspondingly
average selling price has fallen to $29.2 from $30.5 a year ago.
www.smartsyncservices.com Page | 115
Click here to Subscribe
on WhatsApp
11. Web sales volumes have risen to 1.463 million from 1.171 million a year ago. The average selling
price here has risen to $23.7 from $21.6 a year ago.
12. Gross margins in Q3 have fallen slightly to 61.4% from 61.8% last year while EBITDA margin has
risen to 17.4% from 16.3% in the same period.
13. PAT margin in Q3 has also improved to 12.7% from 11.6% a year ago.
14. The company has a negative net debt of Rs 304 Cr.
15. Operating cash flow for 9M was at Rs 198 Cr while free cash flow was at Rs 166 Cr.
16. ROE in 9M was at 30% while ROCE was at 56%.
Investor Conference Call Highlights:
1. The unique customer base has risen 33% YoY to 4.7 lacs.
2. The company sees a good opportunity in the manufacturing and export of textiles and garments
from India.
3. Shop LC expanded its presence on third-party marketplaces by listing products on Amazon, eBay
and Walmart in Canada.
4. VGL also partnered with Mavrck, a leading all-in-one influencer marketing platform, to boost its
influencer program.
5. In TJC, the company launched a customer loyalty program TJC PLUS.
6. As of Dec 2020, VGL has seen its customers buy an average of 27 pieces on TTM basis as compared
to 30 pieces last year. The retention rate has improved slightly to 51.4% from 50.7% last year.
7. The management provides guidance of achieving constant currency growth of 21-23% in FY21 and
15-17% in FY22.
8. For 9M, budget pay contribution to overall retail revenues stood at 36%.
9. Cash and cash equivalents stood at Rs 380 Cr as of 31st Dec 2020.
10. The management maintains that it will not take any big risks and will be operating while
maintaining 2 main guardrails of revenue growth of at least 15-17% and gross margins above 60%.
11. For Reach, the company will be looking to expand to new countries. For Registrations, it will be
setting marketing sped targets to improve new registrations. For Retention, it will be doing
investment into sales force integration, marketing automation on cloud and Salesforce Commerce
Cloud for the web platform. All 3 R’s should help the company increase the repeat rate from
existing customers.
12. New customer acquisition will be 50:50 for TV and web according to the management. It expects
revenue contributions for both mediums to become 50:50 in 3 years’ time.
13. The total volumes sold in marketplaces were 3 times that sold last year. But the company has not
been able to complete successful transition for many of these customers to its main platform. Just
2% have transitioned to the main sites.
www.smartsyncservices.com Page | 116
Click here to Subscribe
on WhatsApp
14. On the other hand, social media conversions have been small as compared to marketplaces but
these have been 100% conversions. The management also admits that customer acquisition costs
from social media is much less than digital spend on search engines.
15. The product innovation and experimentation have also yielded good results as to which products
people are more ready to purchase online or through TV sales. Among these products are candies,
biscuits, mid-market perfumes and personalized jewellery.
16. The variations in average sales price are not of much import for the company as it is committed
to maintaining its value image and staying at ASPs of roughly 50% of its competitors.
17. The management admits that although VGL may be ahead of competitors like QVC in terms of its
story point of better vertical sourcing, it still lags behind them in terms of digital understanding of
customers.
18. The company is close to Amazon in terms of logistics capability in UK and is aiming to do the same
in USA.
19. The fashion and apparel market in USA is 10 times that of the jewellery market. There is also no
direct retailer catering to the company’s primary target segment of population with age above 40
years in USA and UK. The company is just looking to address this gap in the market and utilize its
manufacturing and supply operations to capture this vacant space.
20. Despite there being more brand consciousness in advanced economies like USA and UK, the value
segment will always thrive no matter the spending habits of the demographic according to the
management.
21. In the TV space, the company’s competition is Curate Group, QVC, ShopHQ, Jewel Television &
Ideal Shopping. In the digital space, all the marketplaces like Amazon, Walmart, etc are
competitors for VGL.
Analyst’s View:
Vaibhav Global has established itself as an influential player in the jewellery exporting and
telecommerce business. They have consistently delivered good revenue growth in recent years and
continue to grow their business through new selling mechanisms and product offerings. The company
has had another blockbuster quarter with revenue growth of 29% & profit growth of 45% in Q3. It has
also seen its unique user base expand 33% YoY to 4.7 lac. The company is also looking to slowly
establishing its presence in the digital medium especially in the social media and influencer space as
conversions from these are 100%. VGL is also looking to capitalize on its target demographic of adults
aged above 40 and address the gap of fashion and apparel in this age group. It remains to be seen how
long the company will be able to maintain its current growth pace and match up to its other TV sellers
rivals like QVC and JTV, and also compete with e-commerce giants like Amazon and Walmart in the
web space. Nonetheless, given the company’s prudent and efficient cost management, its resilient
supply chain, and its agility to introduce new products fast depending on changing situations, Vaibhav
Global seems to be an interesting jewellery stock to watch out for.

www.smartsyncservices.com Page | 117
Click here to Subscribe
on WhatsApp
VIP Industries
Brief Company Introduction
VIP Industries Ltd is an Indian luggage maker which is the world's second largest and Asia’s largest
luggage maker. The company has more than 8,000 retail outlets across India and a network of retailers
in 50 countries. VIP's products are imported in numerous other countries. It acquired United Kingdom
luggage brand Carlton in 2004. It also owns the Aristocrat and Skybags brands which are very popular
in India.
Standalone Financials (In Crs)
Q3FY21 Q3FY20 YoY % Q2FY21 QoQ % 9MFY21 9MFY20 YoY%
Sales 240 432 -44.44% 116 106.90% 415 1423 -70.84%
PBT -9 34 -126.47% -30 70.00% -97 127 -176.38%
PAT -9 27 -133.33% -22 59.09% -73 94 -177.66%
Consolidated Financials (In Crs)
Q3FY21 Q3FY20 YoY % Q2FY21 QoQ % 9MFY21 9MFY20 YoY%
Sales 243 432 -43.75% 108 125.00% 408 1414 -71.15%
PBT -8 43 -119% -44 81.82% -119 138 -186.23%
PAT -7 34 -121% -35 80.00% -94 102 -192.16%
Detailed Results:
1. The results for the quarter were down YoY with 44% YoY decline in standalone and consolidated
revenues.
2. The profits for the quarter were in negative territory in both standalone & consolidated terms.
3. The company saw good performance on QoQ basis in both standalone and consolidated terms.
4. Gross Margin for VIP after netting of other income was 41%. It was mainly due to higher discounts
and a high mix of India produced goods sales rather than Bangladesh production.
5. EBITDA margin was at 8% vs 16% last year.
6. Overall Expenses were down by 49% YoY. Employee cost was lower by 46% YoY & Other expenses
were lower by 51% YoY.
7. The company has cash & cash equivalents of Rs 219 Cr as of 31st Dec 2020.
8. Net borrowings were at Rs 148 Cr as of 31st Dec 2020.
9. Net debt was at 0.
Investor Conference Call Highlights
1. The company has appointed Mr. Anindya Dutta as Managing Director as of 1st Feb 2021.
2. As mentioned above, gross margins have remained flat QoQ due to continued discounts. The
management expects EBITDA margins to fully reflect production from Bangladesh entirely by
FY23.

www.smartsyncservices.com Page | 118
Click here to Subscribe
on WhatsApp
3. The major comeback in demand is mainly due to air travel slowly coming back to normal. The
demand will have boosted additionally in Q1 next year when wedding season comes back.
4. Overall inventory is in the range of INR 300 Cr. Old inventory is expected to be cleared soon and
production from both Nashik and Bangladesh plants is expected to hit markets in Q1.
5. The management has stated that fixed costs will remain at current levels of Rs 25 Cr per quarter
for the near future.
6. The company has stopped importing finished goods from China and is only dependent on raw
materials from there.
7. The management has stated that the new MD’s experience in international markets should prove
vital in the company’s quest to revive and expand its export presence.
8. The company has a lot of inventory in backpacks and it should be able to meet any upswing in
demand once all educational institutions in India open up.
9. The gross margins are expected to rise slowly as competitive intensity will be there in the industry
as everyone is sitting on a lot of inventory.
10. The management has stated that VIP has had cost savings of Rs 180 Cr in the year so far. Around
50% of this will come back in time while 50% is permanent saving.
11. The general trade channel is still going slow while all others are in line now with last year.
12. Ecommerce is doing well for VIP with more than 20% revenue contribution. But this is expected
to drop once the general trade channel gets back to normal.
13. There will a lead time of 3-6 months for increasing capacity at the Bangladesh plant. It will be small
enough to be able to be funded by internal funds.
14. The bulk segment in backpacks is schools.
15. The company has seen collections on its receivables from all vendors except Big Bazaar. The
amount outstanding from Big Bazaar is Rs 35 Cr. VIP has started receiving some amounts from it
from Jan onwards.
16. RM prices have gone up in the last 9M period and are expected to come down going forward.
17. The cost of the product from Bangladesh is 15% less than from China.
18. The management has stated that although corporate travel is expected to go down a lot due to
rise of work from home culture, the corporate gifting demand should remain intact.
19. The long term borrowings are expected to mature in July and August and are expected to be paid
in full.
20. The company has not added any new dealers in FY21.
21. The payment to the Bangladesh plant is made in dollars and thus there is some amount of forex
risk here.
22. The company should be back to a quarterly revenue rate of Rs 400 Cr in Q1FY22 if recovery
momentum does not weaken.
www.smartsyncservices.com Page | 119
Click here to Subscribe
on WhatsApp
Analyst’s View:
VIP has been the market leader in the soft and hard luggage segment in India for a long time now. The
company is one of the biggest luggage manufacturers in the world by volume. However, the company
and the industry have been facing tough times with sales contraction due to a fall in demand and
disruption from COVID-19. The company saw good sequential recovery in Q3 and is expecting to get
back to its quarterly run rate of Rs 400 Cr by Q1FY22. As per the management, the competitive
scenario at the moment remains very intense as all industry players are sitting on a lot of stock and
gross margins may take at least 1-1.5 years to come back to pre-covid levels. It remains to be seen
how fast demand comes back to the sector and how will the company fare in the meantime. Given
the slowdown in travel and travel activities at the moment, demand-revival seems a distance away.
Nonetheless, given the company’s strong brand image and leadership position in the industry along
with the resilient balance sheet of the company, VIP industries remains a pivotal mid-cap stock to
watch out for.
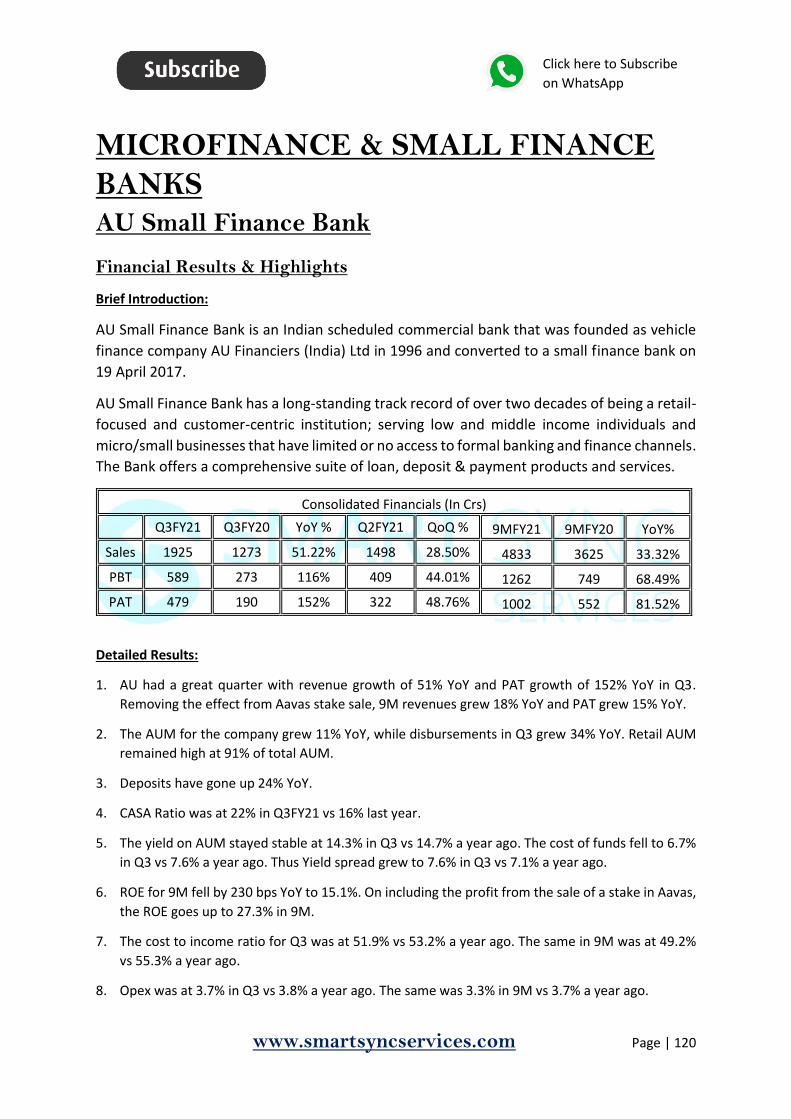
www.smartsyncservices.com Page | 120
Click here to Subscribe
on WhatsApp
MICROFINANCE & SMALL FINANCE
BANKS AU Small Finance Bank
Financial Results & Highlights
Brief Introduction:
AU Small Finance Bank is an Indian scheduled commercial bank that was founded as vehicle
finance company AU Financiers (India) Ltd in 1996 and converted to a small finance bank on
19 April 2017.
AU Small Finance Bank has a long-standing track record of over two decades of being a retail-
focused and customer-centric institution; serving low and middle income individuals and
micro/small businesses that have limited or no access to formal banking and finance channels.
The Bank offers a comprehensive suite of loan, deposit & payment products and services.
Consolidated Financials (In Crs)
Q3FY21 Q3FY20 YoY % Q2FY21 QoQ % 9MFY21 9MFY20 YoY%
Sales 1925 1273 51.22% 1498 28.50% 4833 3625 33.32%
PBT 589 273 116% 409 44.01% 1262 749 68.49%
PAT 479 190 152% 322 48.76% 1002 552 81.52%
Detailed Results:
1. AU had a great quarter with revenue growth of 51% YoY and PAT growth of 152% YoY in Q3.
Removing the effect from Aavas stake sale, 9M revenues grew 18% YoY and PAT grew 15% YoY.
2. The AUM for the company grew 11% YoY, while disbursements in Q3 grew 34% YoY. Retail AUM
remained high at 91% of total AUM.
3. Deposits have gone up 24% YoY.
4. CASA Ratio was at 22% in Q3FY21 vs 16% last year.
5. The yield on AUM stayed stable at 14.3% in Q3 vs 14.7% a year ago. The cost of funds fell to 6.7%
in Q3 vs 7.6% a year ago. Thus Yield spread grew to 7.6% in Q3 vs 7.1% a year ago.
6. ROE for 9M fell by 230 bps YoY to 15.1%. On including the profit from the sale of a stake in Aavas,
the ROE goes up to 27.3% in 9M.
7. The cost to income ratio for Q3 was at 51.9% vs 53.2% a year ago. The same in 9M was at 49.2%
vs 55.3% a year ago.
8. Opex was at 3.7% in Q3 vs 3.8% a year ago. The same was 3.3% in 9M vs 3.7% a year ago.
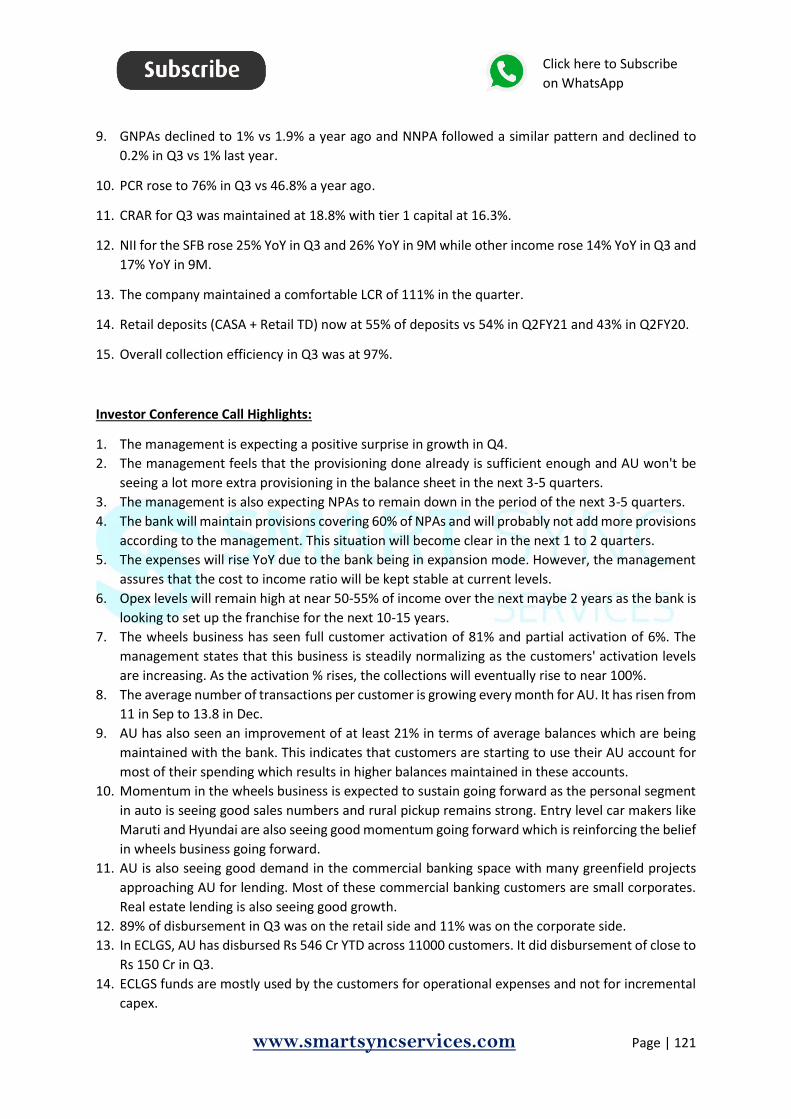
www.smartsyncservices.com Page | 121
Click here to Subscribe
on WhatsApp
9. GNPAs declined to 1% vs 1.9% a year ago and NNPA followed a similar pattern and declined to
0.2% in Q3 vs 1% last year.
10. PCR rose to 76% in Q3 vs 46.8% a year ago.
11. CRAR for Q3 was maintained at 18.8% with tier 1 capital at 16.3%.
12. NII for the SFB rose 25% YoY in Q3 and 26% YoY in 9M while other income rose 14% YoY in Q3 and
17% YoY in 9M.
13. The company maintained a comfortable LCR of 111% in the quarter.
14. Retail deposits (CASA + Retail TD) now at 55% of deposits vs 54% in Q2FY21 and 43% in Q2FY20.
15. Overall collection efficiency in Q3 was at 97%.
Investor Conference Call Highlights:
1. The management is expecting a positive surprise in growth in Q4.
2. The management feels that the provisioning done already is sufficient enough and AU won't be
seeing a lot more extra provisioning in the balance sheet in the next 3-5 quarters.
3. The management is also expecting NPAs to remain down in the period of the next 3-5 quarters.
4. The bank will maintain provisions covering 60% of NPAs and will probably not add more provisions
according to the management. This situation will become clear in the next 1 to 2 quarters.
5. The expenses will rise YoY due to the bank being in expansion mode. However, the management
assures that the cost to income ratio will be kept stable at current levels.
6. Opex levels will remain high at near 50-55% of income over the next maybe 2 years as the bank is
looking to set up the franchise for the next 10-15 years.
7. The wheels business has seen full customer activation of 81% and partial activation of 6%. The
management states that this business is steadily normalizing as the customers' activation levels
are increasing. As the activation % rises, the collections will eventually rise to near 100%.
8. The average number of transactions per customer is growing every month for AU. It has risen from
11 in Sep to 13.8 in Dec.
9. AU has also seen an improvement of at least 21% in terms of average balances which are being
maintained with the bank. This indicates that customers are starting to use their AU account for
most of their spending which results in higher balances maintained in these accounts.
10. Momentum in the wheels business is expected to sustain going forward as the personal segment
in auto is seeing good sales numbers and rural pickup remains strong. Entry level car makers like
Maruti and Hyundai are also seeing good momentum going forward which is reinforcing the belief
in wheels business going forward.
11. AU is also seeing good demand in the commercial banking space with many greenfield projects
approaching AU for lending. Most of these commercial banking customers are small corporates.
Real estate lending is also seeing good growth.
12. 89% of disbursement in Q3 was on the retail side and 11% was on the corporate side.
13. In ECLGS, AU has disbursed Rs 546 Cr YTD across 11000 customers. It did disbursement of close to
Rs 150 Cr in Q3.
14. ECLGS funds are mostly used by the customers for operational expenses and not for incremental
capex.
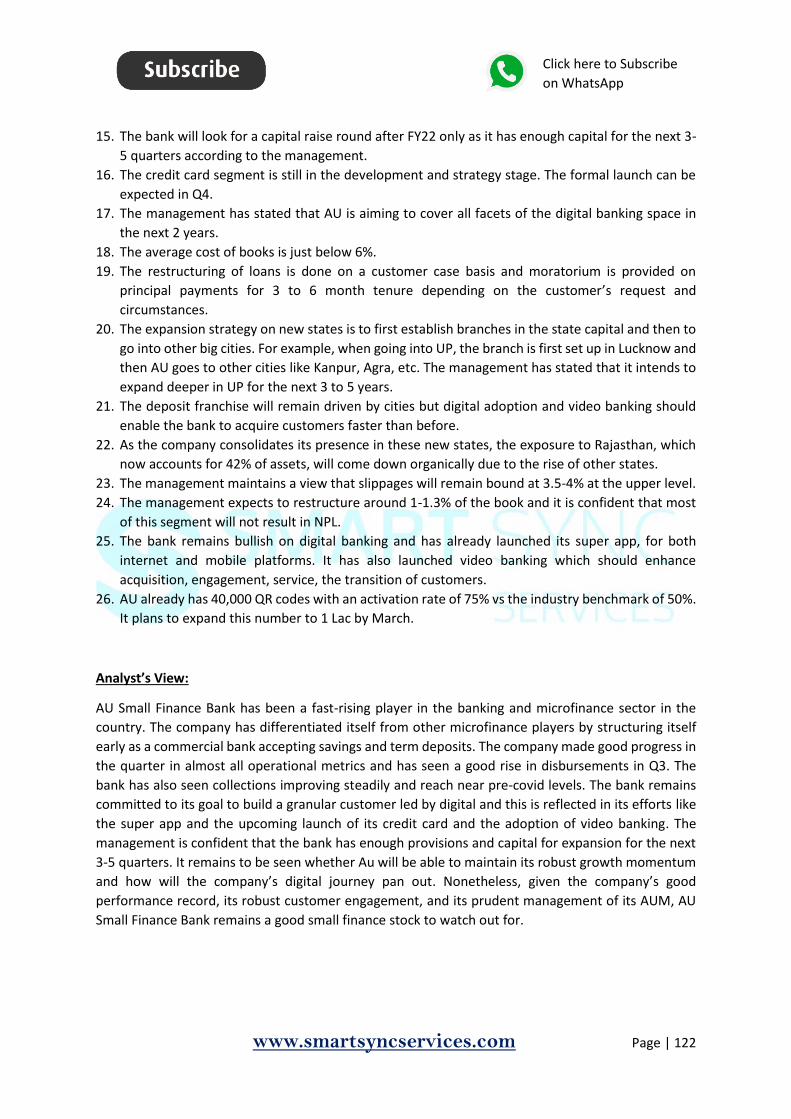
www.smartsyncservices.com Page | 122
Click here to Subscribe
on WhatsApp
15. The bank will look for a capital raise round after FY22 only as it has enough capital for the next 3-
5 quarters according to the management.
16. The credit card segment is still in the development and strategy stage. The formal launch can be
expected in Q4.
17. The management has stated that AU is aiming to cover all facets of the digital banking space in
the next 2 years.
18. The average cost of books is just below 6%.
19. The restructuring of loans is done on a customer case basis and moratorium is provided on
principal payments for 3 to 6 month tenure depending on the customer’s request and
circumstances.
20. The expansion strategy on new states is to first establish branches in the state capital and then to
go into other big cities. For example, when going into UP, the branch is first set up in Lucknow and
then AU goes to other cities like Kanpur, Agra, etc. The management has stated that it intends to
expand deeper in UP for the next 3 to 5 years.
21. The deposit franchise will remain driven by cities but digital adoption and video banking should
enable the bank to acquire customers faster than before.
22. As the company consolidates its presence in these new states, the exposure to Rajasthan, which
now accounts for 42% of assets, will come down organically due to the rise of other states.
23. The management maintains a view that slippages will remain bound at 3.5-4% at the upper level.
24. The management expects to restructure around 1-1.3% of the book and it is confident that most
of this segment will not result in NPL.
25. The bank remains bullish on digital banking and has already launched its super app, for both
internet and mobile platforms. It has also launched video banking which should enhance
acquisition, engagement, service, the transition of customers.
26. AU already has 40,000 QR codes with an activation rate of 75% vs the industry benchmark of 50%.
It plans to expand this number to 1 Lac by March.
Analyst’s View:
AU Small Finance Bank has been a fast-rising player in the banking and microfinance sector in the
country. The company has differentiated itself from other microfinance players by structuring itself
early as a commercial bank accepting savings and term deposits. The company made good progress in
the quarter in almost all operational metrics and has seen a good rise in disbursements in Q3. The
bank has also seen collections improving steadily and reach near pre-covid levels. The bank remains
committed to its goal to build a granular customer led by digital and this is reflected in its efforts like
the super app and the upcoming launch of its credit card and the adoption of video banking. The
management is confident that the bank has enough provisions and capital for expansion for the next
3-5 quarters. It remains to be seen whether Au will be able to maintain its robust growth momentum
and how will the company’s digital journey pan out. Nonetheless, given the company’s good
performance record, its robust customer engagement, and its prudent management of its AUM, AU
Small Finance Bank remains a good small finance stock to watch out for.
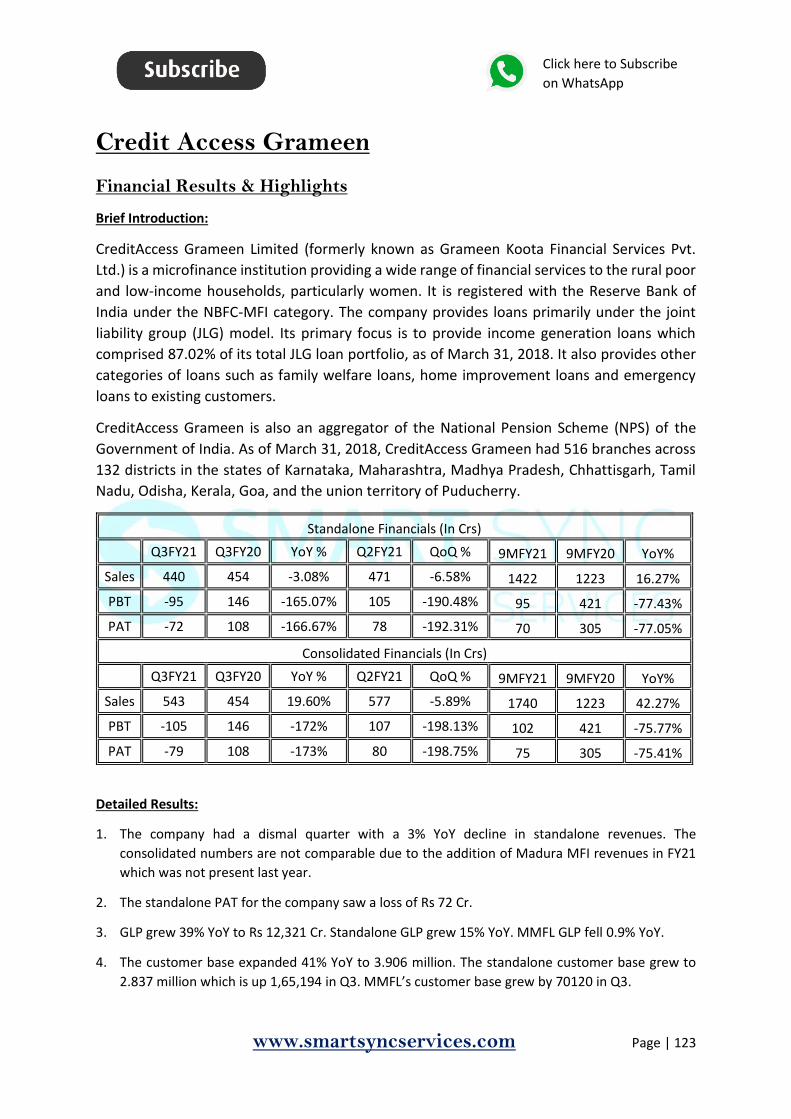
www.smartsyncservices.com Page | 123
Click here to Subscribe
on WhatsApp
Credit Access Grameen
Financial Results & Highlights
Brief Introduction:
CreditAccess Grameen Limited (formerly known as Grameen Koota Financial Services Pvt.
Ltd.) is a microfinance institution providing a wide range of financial services to the rural poor
and low-income households, particularly women. It is registered with the Reserve Bank of
India under the NBFC-MFI category. The company provides loans primarily under the joint
liability group (JLG) model. Its primary focus is to provide income generation loans which
comprised 87.02% of its total JLG loan portfolio, as of March 31, 2018. It also provides other
categories of loans such as family welfare loans, home improvement loans and emergency
loans to existing customers.
CreditAccess Grameen is also an aggregator of the National Pension Scheme (NPS) of the
Government of India. As of March 31, 2018, CreditAccess Grameen had 516 branches across
132 districts in the states of Karnataka, Maharashtra, Madhya Pradesh, Chhattisgarh, Tamil
Nadu, Odisha, Kerala, Goa, and the union territory of Puducherry.
Standalone Financials (In Crs)
Q3FY21 Q3FY20 YoY % Q2FY21 QoQ % 9MFY21 9MFY20 YoY%
Sales 440 454 -3.08% 471 -6.58% 1422 1223 16.27%
PBT -95 146 -165.07% 105 -190.48% 95 421 -77.43%
PAT -72 108 -166.67% 78 -192.31% 70 305 -77.05%
Consolidated Financials (In Crs)
Q3FY21 Q3FY20 YoY % Q2FY21 QoQ % 9MFY21 9MFY20 YoY%
Sales 543 454 19.60% 577 -5.89% 1740 1223 42.27%
PBT -105 146 -172% 107 -198.13% 102 421 -75.77%
PAT -79 108 -173% 80 -198.75% 75 305 -75.41%
Detailed Results:
1. The company had a dismal quarter with a 3% YoY decline in standalone revenues. The
consolidated numbers are not comparable due to the addition of Madura MFI revenues in FY21
which was not present last year.
2. The standalone PAT for the company saw a loss of Rs 72 Cr.
3. GLP grew 39% YoY to Rs 12,321 Cr. Standalone GLP grew 15% YoY. MMFL GLP fell 0.9% YoY.
4. The customer base expanded 41% YoY to 3.906 million. The standalone customer base grew to
2.837 million which is up 1,65,194 in Q3. MMFL’s customer base grew by 70120 in Q3.
www.smartsyncservices.com Page | 124
Click here to Subscribe
on WhatsApp
5. NII has risen 23% YoY to Rs 416.7 Cr. PPoP declined 15% YoY at Rs 170.3 Cr after de-recognition of
INR 68.5 crore interest income (on Stage 3 portfolio @ 60+ dpd).
6. Total ECL provisions were 5.94% in CAGL and 4.6% in MMFL.
7. Overall RoA and RoE were at -2.3% and -9.4%.
8. Overall GNPA was at 6.14% while NNPA was at 0.9%.
9. CRAR: CAGL 31.4% (Tier 1: 30.7%), MMFL 23.3% (Tier 1: 19.2%).
10. Collection efficiency at 91% for CAGL in Dec excluding arrears & including it collection was at 96%.
MMFL collection efficiency excluding arrears was at 86% and including it was at 87%.
11. Standalone debt to equity was at 2.2 times. MMFL debt to equity was at 4.4 times.
12. Standalone cost to income ratios was at 43.5% and Opex to GLP was at 4.7%.
13. The weighted average cost of borrowing was at 9.4% for CAGL & 10.8% for MMFL.
14. Positive ALM mismatch with an average maturity of assets at 18 months and average maturity of
liabilities at 23.7 months in CAGL.
15. Consolidated Disbursements in Q3 rose 54% YoY to Rs 4590 Cr with CAGL at Rs 4032 Cr and MMFL
at Rs 558 Cr.
16. GL loans accounted for 96.1% of total loans for CAGL with the rest being retail finance.
17. GL loan usage breakup was:
1. Animal Husbandry: 46.2%
2. Trading: 24.5%
3. Partly Agri: 14.9%
4. Production: 8.2%
5. Housing: 2.2%
6. Others: 4%
18. Only 1 district for CAGL & 2 districts for MMFL have >4% of the total loan portfolio currently.
19. Karnataka remains the biggest market for the company with 38.3% of GLP. Maharashtra comes in
second with 24.8% of GLP and Tamil Nadu is third with 19.5% of GLP.
Investor Conference Call Highlights:
1. The collection efficiency excluding Maharashtra was 93%. Collection efficiency in Maharashtra
was at 86%.
2. Full paying customers increased to 88% in Dec from 81% in Sep.
3. Partial paying customers were at 7%. Nonpaying customers were at 5% only from 8% in Sep.
4. Maharashtra business is expected to come back to normal by Q4.

www.smartsyncservices.com Page | 125
Click here to Subscribe
on WhatsApp
5. New disbursements since June is now at 45% of GLP.
6. CAGL is expected to surpass its GLP target for FY21.
7. The company has written off Rs 111.9 Cr and has not recognized interest income of Rs 61.2 Cr on
stage 3.
8. The management admits that MMFL is growing at a slower rate than the industry.
9. MMFL has written off Rs 19.9 Cr and not recognized interest income of Rs 7.3 Cr of Stage 3
portfolio.
10. The company has cash and cash equivalents of Rs 1586.94 Cr. It also has Rs 1599 Cr of undrawn
facility and Rs 4113 Cr of sanctions in the pipeline.
11. The management states that COVID stress is now over for CAGL and it should now resume normal
growth momentum.
12. Most of the additional provisioning in Q3 is towards Maharashtra which is still under stress
according to the management.
13. The management states that most of the provisions should get reversed when Maharashtra stress
goes away.
14. Even in the 0 payment segment of 5%, the company is expecting a recovery of 10-15% at least.
15. The management has stated that the company will probably not need additional provisions in Q4.
16. The management is not worried by the industry trend of going cautious and it will maintain its
normal growth rate in its operations in FY22.
17. The management has stated that normal provisioning will indeed increase in absolute terms as
the GLP rises but it will stay at below 1% of GLP which is normal for CAGL.
18. The management is stated that Maharashtra recovery is slower than other states due to the
extended lockdown as compared to other states. There aren’t any pending challenges in
Maharashtra for CAGL.
19. The share of Karnataka will keep coming down due to the rising share of new states like Gujarat,
Rajasthan, Bihar, etc. Around 1/3rd of branches are in new states. Although the company will be
stressing on geographical expansion, it will ensure that the GLP concentration remains low in %
terms at the district level.
20. MMFL collection model is monthly and thus there is a lag in recognition of collections. The
management is looking to enhancing the on time collections and not changing the model for faster
collection.
21. The management maintains that elections and political promises do not cause much material
impact on MFI business.
22. The company is also allowing customers who are in good standing and have maintained
repayment behavior to pre-close existing loan and move on to a new loan. This has resulted in a
difference in disbursements and the rise in GLP. Older loans were running at rates above 21%
while new loans are now issued at a lower rate of 19.35%. This a benefit for customers who want
to close the old loan and get a new loan.
23. The growth in mature states should slow down to 10-15% and the share of Karnataka should come
down to 25% in the next 2-3 years.
24. The credit losses in COVID should be similar to that in demonetization which was close to 4%.
25. The company has reversed interest income for all partially paid customers beyond 60 DPD.
26. The management is confident that there shouldn’t be any issues with its lenders due to the credit
loss as it is an industry issue and this has already occurred before with demonetization when the
company was not penalized.

www.smartsyncservices.com Page | 126
Click here to Subscribe
on WhatsApp
27. The industry growth for the next 4-5 years should be near to the normal range of 20-25% CAGR
and CAGL can see growth of 30-40% CAGR in the same period.
28. The management states that the company has enough capital to last till the second half of FY23
conservatively without any additional capital raise.
29. NIM was down due to the reversal of interest income. Without the reversal, it would have been
close to 12%. Similarly, portfolio yield was down due to the same reason.
30. The company will keep liquidity at 12-15% of AUM and it will come down to 8% by Q2 next year.
31. Any fall in the cost of borrowing will be passed on to customers and NIM will be kept stable at
above 10%.
32. New borrowing cost is at 8-8.5% and average borrowing cost is at 9-9.5% and this is expected to
continue for the next 3-4 quarters according to the management.
33. The management target branch expansion of 20-25% in new geographies but this was eased in
FY21 due to COVID. This pace is expected to be carried on going forward.
34. The behavioral change from the moratorium can result in credit losses rising by 50-60 bps. But this
is not fixed currently and the management hopes that it doesn’t come to pass.
35. The company is providing relaxation in terms of repayment as putting pressure on non-payers for
repayment will start putting pressure on paying members in the same JLG.
36. The company has simplified the application process so that the customer doesn’t need to visit the
branch for completion and it has expanded payment process options to digital options to reduce
customer travel and maintain their safety.
37. Around 15-18% of disbursement was given to new customers in Q3.
38. MMFL process integration should see the alignment of the operating model by March and the
majority of the loan book will move to the Grameen model in 3 stages starting from Feb. The legal
consolidation should take 3-4 months to complete. The process merger should be ready before
the legal merger.
39. The management reiterates that the company doesn’t have any plans to become a bank and it
will continue on its mission to provide loans to low income segment especially in rural regions.
Analyst’s View:
Credit Access Grameen has emerged as one of the most reliable microlenders in the country. Their
revolutionary JLG model has helped bring communities of borrowers together and helped reduce
overall risk from their lending to a very large extent as seen in their low NPA numbers. The company
has delivered a mixed Q3 performance which saw robust GLP, revenue and disbursement growth but
profits remained subdued due to high provisioning. The company rising collection efficiency even in
the stressed region of Maharashtra. The company’s acquisition of Madura Microfinance is expected
to be done in the next 3-4 months in terms of both the process and legal. It remains to be seen whether
the company will be able to come back to its precovid growth rate of 30-40% CAGR given the possible
integration issues with MMFL and the ongoing COVID-19 pandemic. Nonetheless, given its strong
market position and exemplary operating and risk management practices, Credit Access Grameen
remains one of the must-watch stocks in the Microfinance sector for any interested investor.

www.smartsyncservices.com Page | 127
Click here to Subscribe
on WhatsApp
Ujjivan Small Finance Bank
Financial Results & Highlights
Brief Introduction:
Ujjivan Small Finance Bank Limited is a mass-market focused bank in India, catering to financially
unserved and underserved segments and committed to building financial inclusion in the country.
Their Promoter, Ujjivan Financial Services Limited (UFSL) commenced operations as an NBFC in 2005
with the mission to provide a full range of financial services to the ‘economically active poor’ who
were not adequately served by financial institutions. On 7, October 2015, UFSL received RBI In-
Principle Approval to set up a Small Finance Bank(SFB), following which it incorporated Ujjivan Small
Finance Bank Limited as a wholly-owned subsidiary. UFSL, subsequent to obtaining RBI Final Approval
on November 11, 2016, to establish and carry on business as an SFB, transferred its business
undertaking comprising of its lending and financing business to the Bank, which commenced its
operations from 1, February 2017. Ujjivan Small Finance Bank has a diversified portfolio with branches
spread across 24 states and union and a customer base of 4.9 million as of September 30, 2019.
Consolidated Financials (In Crs)
Q3FY21 Q3FY20 YoY % Q2FY21 QoQ % 9MFY21 9MFY20 YoY%
Sales 789 781 1.02% 818 -3.55% 2382 2216 7.49%
PBT -380 113 -436% 132 -387.88% -174 373 -146.65%
PAT -279 90 -410% 96 -390.63% -128 277 -146.21%
Detailed Results:
1. The company had a dismal quarter with a 1% growth in YoY revenues. The bank saw PBT and PAT
losses of Rs 380 Cr and Rs 279 Cr respectively in Q3. These figures were subdued because of the
increased provision made of Rs 583 Cr in Q3 vs Rs 30.5 Cr last year.
2. The company made disbursements of Rs 2184 Cr in the current quarter vs Rs 3403 Cr last year.
December disbursements were up 8% YoY.
3. The gross loan portfolio has risen to Rs 13638 Cr registering a YoY growth of 8%.
4. The non-MicroBanking portfolio now contributes 27% to the portfolio against 22% as of last year.
5. Secured loans now constitute 25% of all loans as compared to 21% a year ago.
6. GNPA in Q3 was at 1% while NNPA was at 0.05%, in line with the interim order of Hon. Supreme
Court. Without this order, GNPA would be at 4.8% and NNPA would be at 2.05%.
7. Deposits were at Rs 11617 Cr were up 9% YoY, covering 85% of total loans.
8. Retail deposits are now at 48% of total deposits vs 43% a year ago. CASA has improved to 18% vs
12% a year ago. Retail deposits grew 20% YoY in Q3.
9. Net Interest Income was flat YoY at Rs 432 Cr.
www.smartsyncservices.com Page | 128
Click here to Subscribe
on WhatsApp
10. Net interest margin declined 120 bps to 9.7% in Q3FY21 vs 10.9% a year ago.
11. PPoP rose 42% YoY.
12. The cost to income ratio was reduced to 62% from 71% a year ago.
13. ROA and ROE for the company were at (5.8)% (vs 2.1% a year ago) and (34.7)% (vs 14% a year ago)
in Q3.
14. The company maintained an LCR of 179%. CAR was at 27% with tier 1 capital at 26%.
15. The number of customers was at 56.6 lakh. 1.7 Lac new customers were acquired in Q3.
16. Collection efficiency was at 94% in Dec. 99.5+% collection for loans disbursed in 9M-FY21.
17. Q3 disbursement in micro banking was at Rs 892 Cr which is above pre-COVID levels.
18. The cost of deposits was at 7% in Q3 vs 7.3% in Sep.
19. Gold loan pilot is working well in 5 branches and has seen disbursement of 36 loans of Rs 18 Lacs.
20. Collection efficiency in MSE was at 90% in Q3. with disbursements of Rs 136 Cr in Q3 vs Rs 92 Cr
in Q2.
21. Collection efficiency in Affordable Housing was at 94% in Q3 with disbursements of Rs 209 Cr in
Q3 vs Rs 116 Cr in Q2.
22. Collection efficiency in Personal Loan was at 89% in Q3 with disbursements of Rs 30 Cr in Q3.
23. Collection efficiency in Vehicle Loan was at 97% in Q3. with disbursements of Rs 21 Cr in Q3.
24. Digital transactions at 59% in Q3-FY21.
25. Digital collection was at 13% in Q3.
26. Low Collections were only in Maharashtra at 87%, 92% in WB, 72% in Assam & 88% in Punjab in
Jan. Low collections in Assam are due to the new MFI waiver bill.
27. 3.7 lac accounts amounting to Rs 852 Cr portfolio restructured – 8.5% of MicroBanking portfolio
as of Dec’20. Rs 536 Cr (2.2 lac accounts) saw Tenor elongation and Rs 316 Cr (1.5 lac accounts)
saw moratorium restructuring.
28. Total provisions in 9M were at Rs 1029 Cr.
29. The top 3 states Tamil Nadu (16.4%), Karnataka (14.4%), and West Bengal (13.8%) account for
44.6% of total advances.
30. 90% of MFI loans were given to repeat customers in Q3.
31. Group loans account for 61.2% of gross advances.
32. The average ticket size in group loans is Rs 39279.
www.smartsyncservices.com Page | 129
Click here to Subscribe
on WhatsApp
Investor Conference Call Highlights:
1. The management maintains that Ujjivan will stay cautious in expanding the customer base in
microbanking as only 10% of group loans were to new customers.
2. The bank has tied up with PayNearby, which has almost 800,000 outlets.
3. The management is bullish on the affordable housing business for FY22.
4. In MSE, Ujjivan has tied up with a fintech firm for supply chain finance.
5. The bank disbursed INR 55 crores under the ECLGS scheme.
6. The bank has tied up with many fintech firms for workflow digitization which has resulted in the
reduction of turnaround time and freeing up of bandwidth at the back office for handling more
volume.
7. Ujjivan has INR 364 crores of an outstanding book as of December in Assam and it is not planning
to grow that book at all right now until things improve.
8. The book coverage of total provisions is at 8% as of Dec 2020. On the microbanking book, the
coverage would be 9.3%.
9. Under tenor elongation, the bank has reduced the borrower's EMI after assessing the cash flows
and elongated the tenor by a maximum of 24 months from the original date of maturity. The
interest for the unpaid period has been capitalized. Customers who have availed the moratorium
for 1 or more months were restructured by way of tenor extension by the number of EMIs unpaid.
There is no change in the EMI in that case.
10. The bank is seeing a collection efficiency of 73% in the restructured book in Jan.
11. The cost of funds has come down for Ujjivan as it was able to replace a lot of high-cost deposits at
a significantly lower rate.
12. Ujjivan has enabled all of its branches to cross-sell all asset products.
13. Ujjivan has divided the digital strategy into 3 parts which are:
a) Digitizing the business processes with a focus on improving turnaround time and
employee productivity.
b) Investing in digital solutions, which will further improve the customer experience,
including some that we are using for customer engagement through messaging and
notifications.
c) Partnering with fintech firms for its API banking framework where Ujjivan has released
90+ APIs of its 150 total.
14. The turnaround time for various processes on the onboarding side through these fintech
engagements has helped Ujjivan reduce the turnaround time for various activities by almost 70%
to 90%.
15. In robotic process automation, Ujjivan has identified 100 plus processes, which are going to be
automated. It has already completed 13 such processes.
16. The management doesn’t expect to take any more provisions in Q4 as it believes that it has
sufficiently front ended all of the expected requirement.
17. The management believes that the restructuring was necessary to provide much needed relief to
the customers in question and it has not resulted in any loss in credit discipline as the bank is
seeing 73% collection efficiency in restructured accounts already.
18. The situation in Assam has been one of systematic deterioration in collections as both the ruling
party and opposition have come up with the MFI waiver narrative and thus Ujjivan is maintaining
a very cautious stance here with no fresh disbursements until any resolution is done here.
www.smartsyncservices.com Page | 130
Click here to Subscribe
on WhatsApp
19. The bank has capitalized Rs 575 Cr of interest. The drop in interest income from this is about Rs
11 Cr in Dec and Rs 42 Cr in the last 4 months.
20. The field officers in MFI doing collections were at 8000+ at the latest.
21. The yield on the MFI book has gone down due to Rs 575 Cr of loans not yielding any interest
currently.
Analyst’s View:
Ujjivan Small Finance Bank has been one of the top players in the SFB industry. It is the biggest and
most diversified company in this sector in terms of geographical reach. The company has had a mixed
quarter with flat revenue growth but good pre-provision profit growth of above 40% YoY. The bank
saw operating losses in Q3 due to high provisioning of Rs 538 Cr. These provisions were taken mainly
due to the ongoing situation in Assam regarding the proposed MFI waiver. Ujjivan has seen
encouraging results in its digital initiatives and the smaller loan segments like affordable housing and
MSE. The company has also seen a good bounce back in collections. It has also done restructuring of
Rs 852 Cr of MFI loans where it has already seen an encouraging collection efficiency of 73%. It remains
to be seen how the situation in Assam pans out and how will Ujjivan get back to the growth track in
order to not get left behind in the intensifying MFI race in India. Nonetheless, given the bank’s industry
position, its wide geographical reach, and its rising digital transactions, Ujjivan Small Finance Bank is a
pivotal Small Finance Bank stock to watch for, particularly given its current valuation of close to 2
times book value.
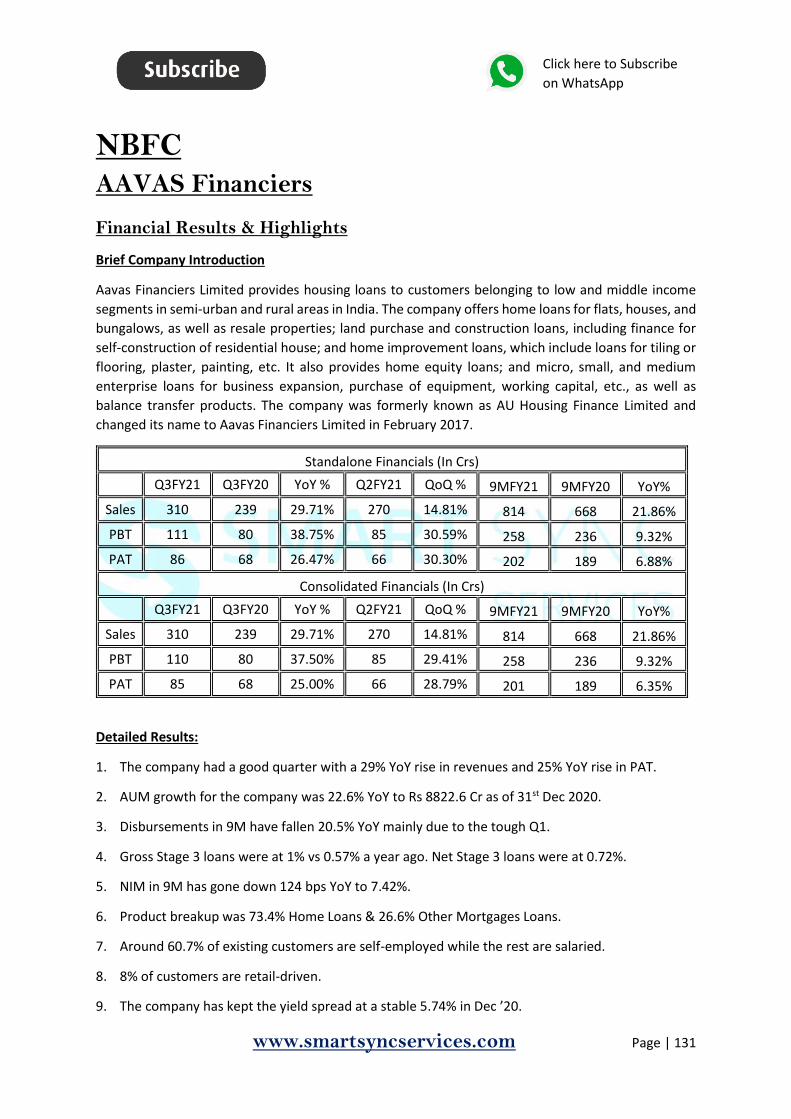
www.smartsyncservices.com Page | 131
Click here to Subscribe
on WhatsApp
NBFC AAVAS Financiers
Financial Results & Highlights
Brief Company Introduction
Aavas Financiers Limited provides housing loans to customers belonging to low and middle income
segments in semi-urban and rural areas in India. The company offers home loans for flats, houses, and
bungalows, as well as resale properties; land purchase and construction loans, including finance for
self-construction of residential house; and home improvement loans, which include loans for tiling or
flooring, plaster, painting, etc. It also provides home equity loans; and micro, small, and medium
enterprise loans for business expansion, purchase of equipment, working capital, etc., as well as
balance transfer products. The company was formerly known as AU Housing Finance Limited and
changed its name to Aavas Financiers Limited in February 2017.
Standalone Financials (In Crs)
Q3FY21 Q3FY20 YoY % Q2FY21 QoQ % 9MFY21 9MFY20 YoY%
Sales 310 239 29.71% 270 14.81% 814 668 21.86%
PBT 111 80 38.75% 85 30.59% 258 236 9.32%
PAT 86 68 26.47% 66 30.30% 202 189 6.88%
Consolidated Financials (In Crs)
Q3FY21 Q3FY20 YoY % Q2FY21 QoQ % 9MFY21 9MFY20 YoY%
Sales 310 239 29.71% 270 14.81% 814 668 21.86%
PBT 110 80 37.50% 85 29.41% 258 236 9.32%
PAT 85 68 25.00% 66 28.79% 201 189 6.35%
Detailed Results:
1. The company had a good quarter with a 29% YoY rise in revenues and 25% YoY rise in PAT.
2. AUM growth for the company was 22.6% YoY to Rs 8822.6 Cr as of 31st Dec 2020.
3. Disbursements in 9M have fallen 20.5% YoY mainly due to the tough Q1.
4. Gross Stage 3 loans were at 1% vs 0.57% a year ago. Net Stage 3 loans were at 0.72%.
5. NIM in 9M has gone down 124 bps YoY to 7.42%.
6. Product breakup was 73.4% Home Loans & 26.6% Other Mortgages Loans.
7. Around 60.7% of existing customers are self-employed while the rest are salaried.
8. 8% of customers are retail-driven.
9. The company has kept the yield spread at a stable 5.74% in Dec ’20.
www.smartsyncservices.com Page | 132
Click here to Subscribe
on WhatsApp
10. Opex to AUM in 9M was down to 2.82% from 3.42% a year ago.
11. ROA for 9M was at 3.22%.
12. The company has no CP exposure and has recently raised borrowings of Rs 935.6 Cr for 144
months at 7.04%.
13. The company maintains a positive ALM mismatch across all time periods and has an average
tenure of outstanding borrowing at 131 months.
14. It has total liquidity of Rs 2670 Cr as of 31st Dec 2020.
15. It maintained a CAR of 52.98% with Tier 1 capital at 51.12%.
16. Interest Income has risen 27.6% YoY in Q3 while interest expenses have risen 23.6% YoY.
Investor Conference Call Highlights
1. Aavas’s long-term credit rating continues to be AA- with a stable outlook from ICRA and CARE.
2. As on 31 December 2020, the average borrowing cost 7.68% against the average portfolio yield of
13.42%, resulting in a spread of 5.74%.
3. Additional ECL provisioning of Rs 4.29 Cr was created to consider the impact of COVID-19 during
Q3. Total provision for COVID stands at Rs 19 Cr.
4. Book value stands at Rs 294.6 per share.
5. Collection efficiency in Dec was at 98.8%.
6. As of December, only 2,000 accounts were there who have not paid the December installment
down from 5,800 such accounts in Sep.
7. The company has done securitization of almost 23% of total AUM. The management has stated
that it aims to bring it down and keep this figure in the range of 15-20% depending on the yield
available.
8. The increase in salaried % should not be seen as a decrease in self-employed disbursements and
this % will keep on changing depending on market conditions.
9. The management is confident of maintaining AUM growth guidance of 20-25% and has stated that
Aavas will remain cautious in lending till Q4 and will start on a normal growth path from FY22
onwards.
10. Normally, the company keeps only 3-4 months of disbursement as cash in hand but due to COVID-
19, the management decided to be more conservative and maintain cash at 6 months
disbursement level.
11. Despite operating in similar geographies as Gruh, Aavas is not getting any yield pressure as both
have different customer sets to cater to. Gruh finances apartment properties and has a 70%
salaried customer set while Aavas finances mostly independent houses and have a 70% self-
employed customer set. The management has stated that the market is large enough for both to
co-exist.
12. The management has identified 3 main priorities for Aavas which are maintaining asset quality,
maintaining the spread, and maintaining growth pace.
13. The management has clarified that the 1% NPA figure is without the Supreme Court freezing
decision and with this decision, the NPA is at 0.3%.
14. The management has clarified that the disbursement in salaried have been normal while
disbursements in self-employed will increase naturally as the economy opens up.
www.smartsyncservices.com Page | 133
Click here to Subscribe
on WhatsApp
Analyst’s View:
Aavas Financiers is a fast-growing housing finance company in India. What sets it apart from the large
housing finance players like HDFC, LIC Housing Finance & Repco is the space they cater to. The average
ticket size of loans is less than 9 lacs against more than 14 lacs for others. Aavas caters to smaller
towns where the population is less than 10 lacs. Aavas has done well in Q3 with 30% YoY revenue
growth and 25% profit growth. It has also maintained AUM growth of >20% despite the pandemic and
is back to collections above 98%. Given the positive cues from the real estate sector in recent times,
Aavas could be a big beneficiary going forward. However, stretched valuations may have factored in
most of the positives. Nevertheless, it is a good business to track in the housing finance space.
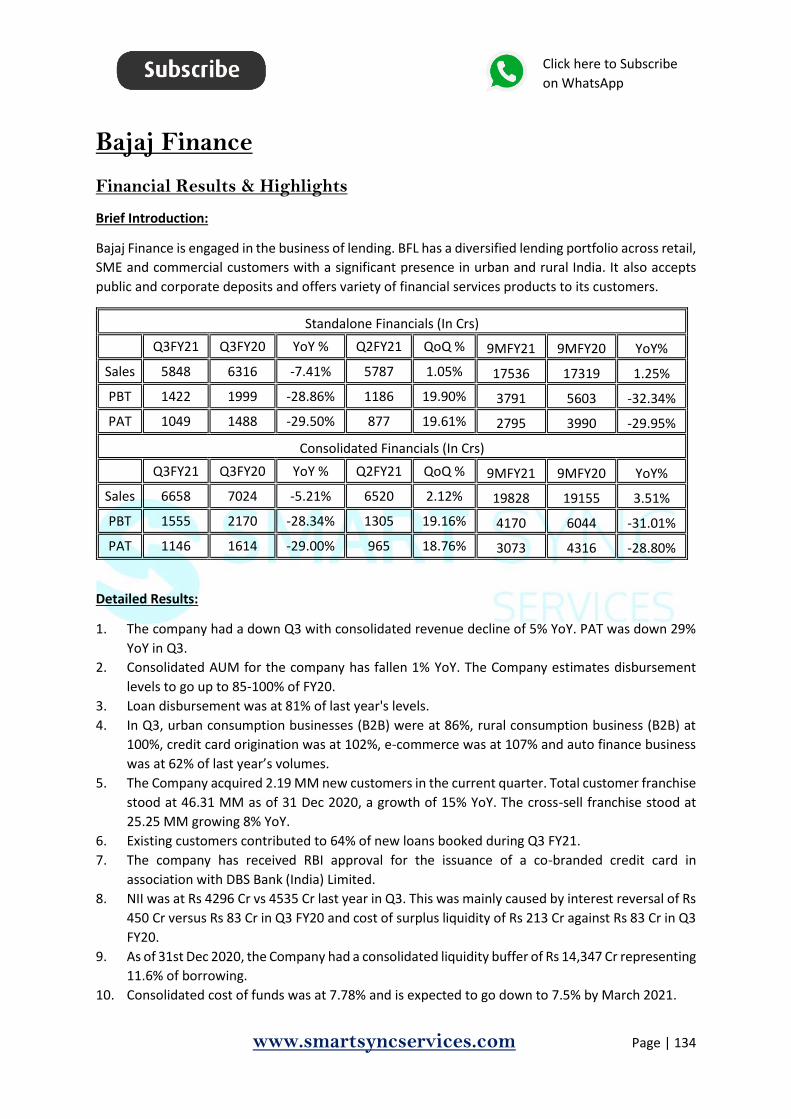
www.smartsyncservices.com Page | 134
Click here to Subscribe
on WhatsApp
Bajaj Finance
Financial Results & Highlights
Brief Introduction:
Bajaj Finance is engaged in the business of lending. BFL has a diversified lending portfolio across retail,
SME and commercial customers with a significant presence in urban and rural India. It also accepts
public and corporate deposits and offers variety of financial services products to its customers.
Standalone Financials (In Crs)
Q3FY21 Q3FY20 YoY % Q2FY21 QoQ % 9MFY21 9MFY20 YoY%
Sales 5848 6316 -7.41% 5787 1.05% 17536 17319 1.25%
PBT 1422 1999 -28.86% 1186 19.90% 3791 5603 -32.34%
PAT 1049 1488 -29.50% 877 19.61% 2795 3990 -29.95%
Consolidated Financials (In Crs)
Q3FY21 Q3FY20 YoY % Q2FY21 QoQ % 9MFY21 9MFY20 YoY%
Sales 6658 7024 -5.21% 6520 2.12% 19828 19155 3.51%
PBT 1555 2170 -28.34% 1305 19.16% 4170 6044 -31.01%
PAT 1146 1614 -29.00% 965 18.76% 3073 4316 -28.80%
Detailed Results:
1. The company had a down Q3 with consolidated revenue decline of 5% YoY. PAT was down 29%
YoY in Q3.
2. Consolidated AUM for the company has fallen 1% YoY. The Company estimates disbursement
levels to go up to 85-100% of FY20.
3. Loan disbursement was at 81% of last year's levels.
4. In Q3, urban consumption businesses (B2B) were at 86%, rural consumption business (B2B) at
100%, credit card origination was at 102%, e-commerce was at 107% and auto finance business
was at 62% of last year’s volumes.
5. The Company acquired 2.19 MM new customers in the current quarter. Total customer franchise
stood at 46.31 MM as of 31 Dec 2020, a growth of 15% YoY. The cross-sell franchise stood at
25.25 MM growing 8% YoY.
6. Existing customers contributed to 64% of new loans booked during Q3 FY21.
7. The company has received RBI approval for the issuance of a co-branded credit card in
association with DBS Bank (India) Limited.
8. NII was at Rs 4296 Cr vs 4535 Cr last year in Q3. This was mainly caused by interest reversal of Rs
450 Cr versus Rs 83 Cr in Q3 FY20 and cost of surplus liquidity of Rs 213 Cr against Rs 83 Cr in Q3
FY20.
9. As of 31st Dec 2020, the Company had a consolidated liquidity buffer of Rs 14,347 Cr representing
11.6% of borrowing.
10. Consolidated cost of funds was at 7.78% and is expected to go down to 7.5% by March 2021.
www.smartsyncservices.com Page | 135
Click here to Subscribe
on WhatsApp
11. Deposits book stood at Rs 23,777 Cr, a growth of 18% YoY. It accounted for 19% of total assets.
12. The Retail: Corporate mix stood at 76:24 in Q3 FY21 as against 61:39 in Q3FY20.
13. Opex declined by 9% YoY. Total Opex to net interest income came down to 32.3% in Q3FY21 vs
33.8% in Q3FY20.
14. Loan losses and provisions for Q3 FY21 was Rs 1,352 Cr as against Rs 831 Cr in Q3 FY20. The
company also took a one-time principal write-off of Rs 1,970 Cr on account of COVID-19 related
stress. The Company holds management overlay provision of Rs 800 Cr as of 31 Dec 2020 for
COVID-19 related stress.
15. The company has accounted for additional losses on account of COVID-19 in FY22.
16. FY22 onwards, the company expects loan losses and provisions to revert to pre-COVID-19 levels
of 160-170 bps of average assets.
17. The company estimates residual credit costs in Q4 at Rs 1,200-1,250 Cr bringing the total credit
cost in FY21 to Rs 5,925-5,975 Cr.
18. Consolidated PBT for Q3 contracted by 28% YoY due to increase in loan loss provisions by Rs 520
Cr, interest reversals by Rs 367 Cr, and cost of additional liquidity by Rs 130 Cr vs Q3 last year.
19. CRAR remains at 28.18% while Tier-1 capital was at 24.73%. The Company has adequate capital
to meet its next 3 years’ growth aspiration.
20. GNPA was at 0.55% while NNPA was at 0.19% according to the Supreme Court directive. The
company also maintained a PCR of 65%.
21. The breakup of growth in the consolidated loan book is as follows:
1. Auto Finance: -4% YoY
2. Sales Finance: -27% YoY
3. Consumer B2C: -1% YoY
4. Rural Sales Finance: -10% YoY
5. Rural B2C: 10% YoY
6. SME Lending: 1% YoY
7. Securities Lending: -22% YoY
8. Commercial Lending: 15% YoY
9. Mortgage lending: 6% YoY
22. Bajaj Housing Finance had a good quarter with AUM growth of 18% YoY and a rise in net interest
income of 15% YoY. PAT declined 24% YoY for this subsidiary due to higher provisioning. The
entity’s Opex to NII improved to 26.4% in Q3FY21 vs 33.7% in Q3FY20.
23. Bajaj Financial Securities Ltd (BFinsec) made a net profit of Rs 0.7 Cr in Q3 FY21.
Investor Conference Call Highlights:
1. The core AUM growth in Q3 was Rs 8000 Cr which was short of the normal growth rate of Rs
9000-9500 Cr per quarter which is expected to be back by Q4.
2. The AUM growth in mortgage space was smaller despite disbursement at 90% of last year's
levels as there was significant portfolio attrition caused by pricing actions by competitors.
3. The Pro-forma GNPA and NNPA were at 2.86% and 1.22% respectively. Other auto finance, all
other segments are expected to come back to pre-covid NPA levels in Q4.
4. The omnichannel framework for the complete online loan generation is expected to be
completed by May 2021.
5. The company will launch Bajaj Pay for consumers sometime in Q4. It will be providing the Bajaj
Pay for its existing network of 103,000 merchants initially and will be aiming to double the
volumes in this space in the medium term.

www.smartsyncservices.com Page | 136
Click here to Subscribe
on WhatsApp
6. Within a single app ecosystem, the customer will be able to access 5 proprietary marketplaces
that Bajaj Finance is looking to create. These will include the company’s EMI Store, insurance
marketplace, broking app, and many other financial services all rolled into a single app
ecosystem across electronics, insurance, investments, and health. The EMI store is expected to
go live in the next 30 days for existing customers.
7. The first phase is expected to be launched in July, the second in August and the third will be
done by end of Sep.
8. H2 of FY22 is expected to be devoted to focusing on sharpening and refining this new offering.
9. The management believes that this new app ecosystem development can act as a watershed
moment for the company and take them from 46 million customers today to 75-100 million
customers. The prime strategy here will be to enhance customer experience (both pre and post
purchase) and reducing operational friction.
10. The company is also moving to make 100% of calls by collection agents to be recorded for
current level of 35-40%.
11. The company is not converting any existing loans to flexi now after Q2. All new flexi loans will
be from fresh origination.
12. The segment that saw the biggest write-offs was auto finance particularly 3 wheeler finance.
13. The company has restarted retail EMI cards focusing on an average ticket size of INR 15,000.
14. The company will bring back higher ticket sizes once the Bajaj Pay for merchants is launched.
15. The company is also offering retail fixed deposits at 6.6%.
16. The management has stated that the bigger impact in the next 2 quarters will come from the
productivity apps that the company has created rather than the consumer app.
17. The Bajaj Pay app will be using Open loop universal QR infrastructure for customers to use
universal QR and UPI infrastructure to allow the customer to use a single interface for credit
card, UPI, EMI card, or other payment mechanism depending on the network.
18. This pay app will integrate directly into the B2B business.
19. The credit card offering with DBS is expected to be launched by July. The management maintains
that this development will not cannibalize the tie-up with RBL bank.
Analyst’s View:
Bajaj Finance is one of the fastest-growing NBFCs in India today. The company has done well to bounce
back quickly from the post-COVID situation and has seen good traction across most categories. The
current quarter was dull for the company with revenues and AUM growth flat YoY while profits fell
due to increased provisions. But the current cautious stance of the company is commendable with it
deciding to frontload potential losses and focussing on building an omnichannel framework and app
ecosystem with its sights at the next evolutionary phase of commerce in India. It remains to be seen
whether there are any further disruptions in place from the evolving situation from COVID-19 in India
and whether the company’s worst fears regarding credit losses come to exist. Nonetheless, given the
company’s strong market position, the management drive to derive new opportunities through the
use of data and technology, and its strong balance sheet position, Bajaj Finance remains a pivotal NBFC
stock for all Indian investors.

www.smartsyncservices.com Page | 137
Click here to Subscribe
on WhatsApp
Manappuram Finance
Financial Results & Highlights
Brief Company Introduction
Manappuram Finance Ltd. is one of India’s leading gold loan NBFCs. Today, it has 4208 (Includes
branches of subsidiary companies) branches across 28 states/UTs.
Standalone Financials (In Crs)
Q3FY21 Q3FY20 YoY % Q2FY21 QoQ % 9MFY21 9MFY20 YoY%
Sales 1355 1133 19.59% 1294 4.71% 3875 3161 22.59%
PBT 623 456 36.62% 544 14.52% 1662 1219 36.34%
PAT 465 334 39.22% 406 14.53% 1240 891 39.17%
Consolidated Financials (In Crs)
Q3FY21 Q3FY20 YoY % Q2FY21 QoQ % 9MFY21 9MFY20 YoY%
Sales 1650 1451 13.71% 1578 4.56% 4744 4042 17.37%
PBT 657 560 17% 544 20.77% 1694 1516 11.74%
PAT 483 414 17% 405 19.26% 1257 1114 12.84%
Detailed Results:
1. The company had a decent quarter with consolidated revenues rising 13.7% YoY and consolidated
PAT rising 17% YoY.
2. Standalone numbers were very good with revenue & profit growth of 20% & 39% YoY respectively
in Q3 and 23% & 39% YoY respectively in 9M.
3. RoA for the quarter came in at 6.1% while consolidated RoE came in at 29%.
4. Total AUM grew 14.7% YoY to Rs 27642.5 Cr while gold AUM grew 24.4% YoY, highlighting
excellent growth in standalone business.
5. The company has a borrowing cost of 8.95% in the quarter.
6. The share of new businesses in revenues was at 26.9% in Q3.
7. The book value per share was at Rs 81.2 at the end of Q3.
8. The company also raised fresh borrowing of Rs 1925 Cr through NCDs, and bank loans.
9. In the gold loan business, the Opex to AUM has remained steady at 5.5% in Q3.
10. Gold AUM per branch rose significantly to Rs 5.7 Cr per branch vs Rs 4.8 Cr per branch a year ago.
11. The standalone business has GNPA and NNPA of 1.3% and 0.8% respectively while maintaining a
CAR of 25.9%.
www.smartsyncservices.com Page | 138
Click here to Subscribe
on WhatsApp
12. The online gold loan’s share of total gold AUM was at 59% in Q3.
13. In Asirvad MFI, AUM was at Rs 5357.7 Cr while RoE was at 6.8% in Q3.
14. The GNPAs for Asirvad has risen to 2.63% in Q3 vs 2.1% in Q1. The NNPA is still due to the
company’s good provisioning. Asirvad maintained a CAR of 24%. The cost of funds for Asirvad was
at 10.7% in Q3.
15. Collections are back to 99% in Dec.
16. The company has announced an interim dividend of Rs 0.65 per share.
Investor Conference Call Highlights
1. The company has extended its doorstep gold loan facility to all our branches across India, which
allows Manappuram to service customers, even beyond normal working hours, at their homes
and offices.
2. The CV finance segment saw good revival with collection efficiency reaching 110%. The CV
division's AUM stood at Rs 988 Cr which was down 7% YoY.
3. The company has undrawn bank lines of Rs 2502 Cr bringing its surplus liquidity up to almost Rs
5000 Cr.
4. CP exposure has come down to 8% vs 24% a year ago.
5. Gold holding was at 68.24 tons which was flat QoQ and down 7.2% YoY.
6. Gold loan average ticket size and average duration was INR 46,318 and 75 days respectively.
7. The total number of gold loan customers stood at 26.24 lakh with an net increase of 67,000 new
customers in Q3.
8. The weighted average LTV is now at 63%. Gold loan disbursements during the quarter stood at
INR 57,445 crores.
9. The disbursements for Asirvad in Q3 were at Rs 1306 Cr.
10. The home loan business had a total book of INR 633 crores, which was up 2.1% QoQ and 5.4%
YoY.
11. In MFI segment, the company has taken provision of Rs 48.4 Cr in Q3. The overall provisioning for
FY21 so far is at Rs 320 Cr which the management feels is adequate enough.
12. The states of WB and Odisha are showing revival in collections and the management has stated
that the situation in these states should normalize by Q1FY22.
13. WB exposure is at 12% of MFI AUM.
14. The pressure on MFI margins is due to low AUM growth. The management reassures that as AUM
growth revives, the margins will rise to normal levels.
www.smartsyncservices.com Page | 139
Click here to Subscribe
on WhatsApp
15. In standalone entity, ECL provision stands at Rs 223 Cr while in vehicle finance ECL stands at Rs
66% or nearly 6% of book.
16. ECL in MFI is at Rs 322 Cr which is also close to 6% of book.
17. Assam portfolio is very small at only Rs 38 Cr.
18. The management maintains its growth guidance of 15% revenue growth in FY21 & FY22.
19. RoA is expected to stay in the range of 6-7%.
20. The management remains confident that it will not need to take any additional provisions related
to COVID-19.
21. The LTV in gold loan is capped at 75% and as gold price goes up, the LTV is taken down.
22. The provisioning in NBFC lending is at Rs 20 Cr on a book of Rs 450 Cr.
23. The company is now seeing 15-20% of new customers being onboarded online.
24. The company made writeoffs of Rs 68 Cr in Q3.
25. Out of the customer set of 23 Lac for Asirvad, around 1 Lac didn’t make any payments till Dec and
as per RBI guidelines, the company has restructured the portfolio of this 1 Lac customer set.
26. Many industry entrants in the gold loan space have seen QoQ growth of more than 10%. The
management states that it is a temporary phenomenon as the LTV cap has been relaxed to 90%
till 31st March. Thus these new entrants have been aggressively acquiring customers and
expanding AUM by offering higher LTV. But ultimately this is temporary and should fade away as
the cap comes back to normal levels.
27. The incremental yield is expected to remain stable at current levels.
28. The company has applied to RBI for permission to open up 300 new branches in North India. These
branches are expected to break even within 1 year of opening.
Analyst’s View
Manappuram Finance has long been one of the most consistent players in the NBFC sector in India.
The company has cemented its position as one of India’s leading gold loan providers by growing its
core business consistently. The company’s current quarter performance has been decent with 14.7%
YoY overall AUM growth with continued growth momentum in gold loan segment. The company
continues to see good traction in the online gold loan and it has also activated doorstep gold loan
facility to all branches in India. The company has seen good revival in Asirvad and collections have
improved to 99% in Dec. The vehicle finance division has also come back strong and posted collections
around 110%. It remains to be seen whether the company will be able to sustain its growth
momentum in the gold loan space with every big bank getting into this space and how will things pan
out for Asirvad and the MFI industry. Nonetheless, given the company’s resilient customer base and
gold loan AUM along with the rising star among MFIs in Asirvad Microfinance, Manappuram Finance
seems like a pivotal finance stock to watch out for.

www.smartsyncservices.com Page | 140
Click here to Subscribe
on WhatsApp
Piramal Enterprises
Financial Results & Highlights
Brief Company Introduction
Piramal Enterprises Limited (PEL) (including its subsidiaries) is one of India’s large diversified
companies, with a presence in Healthcare, Healthcare Insights & Analytics business and Financial
Services. In Pharmaceuticals, through an end-to-end manufacturing capabilities across its
manufacturing facilities and a large global distribution network, the Company sells a portfolio of niche
differentiated pharma products and provides an entire pool of pharma services (including in the areas
of injectable, HPAPI etc.). In Financial Services, PEL provides comprehensive financing solutions to real
estate companies.
Standalone Financials (In Crs)
Q3FY21 Q3FY20 YoY % Q2FY2
1 QoQ %
9MFY21 9MFY20 YoY%
Sales
586 532 10.15% 434 35.02% 1404 2109 -33.43%
PBT -158* 53 -398.11% -31 -409.68% -198* 513 -138.60%
PAT -165 -9 -1733.33% -26 -534.62% -199 490 -140.61%
Consolidated Financials (In Crs)
Q3FY21 Q3FY20 YoY % Q2FY2
1 QoQ %
9MFY21 9MFY20 YoY%
Sales
3265 3411 -4.28% 3339 -2.22% 9607 9979 -3.73%
PBT 1001 898 11% 832 20.31% 2489 2509 -0.80%
PAT 799 671 19% 628 27.23% 1923 1808 6.36%
*Contains exceptional item of Rs 258 Cr which is transaction cost on transfer of pharma business
Detailed Results
1. The company had a mixed quarter with consolidated Revenues for Q3 falling 4% YoY and PAT rising
19% YoY. Similarly, 9M revenues fell 3.7% YoY while PAT rose 6.4% YoY.
2. The DHFL acquisition has total consideration of INR 34,250 Cr. –upfront cash component of INR
14,700 Cr. (incl. cash on DHFL’s B/S) and a deferred component (NCDs) of INR 19,550 Cr.
3. Net debt to equity has fallen to 0.9 times.
4. The company has unallocated equity of Rs 12,375 Cr which is 35% of overall equity.
5. The wholesale loan book in the Financial Services segment was at Rs 41060 Cr vs Rs 51436 Cr last
year a reduction of 20% YoY.
6. Sales of developer clients are now at 82% of Q3 last year.
7. GNPA at 3.7% with provisioning at 6.3% of the total loan book. NNPA was at 1.8%.
www.smartsyncservices.com Page | 141
Click here to Subscribe
on WhatsApp
8. CAR was at 37% in Q3 vs 29% last year.
9. Net debt to equity for this business was improved to 1.9 times from 2.5 times last year.
10. The revenue drop in Financial Services was at 9% YoY. This division accounted for 59% of total
revenues.
11. The company’s multi-product retail lending platform made disbursements of Rs 3122 Cr since soft
launch in Oct.
12. The average yield on loans was at 14.6% while the average cost of funds was at 8.4%. NIM was at
6.2% while the cost to income was at 18%. ROA and ROE were at 3.8% and 11.5% respectively.
13. Pharma revenues grew 5% YoY. This division accounted for 43% of total revenues.
14. The breakup of pharma revenues was:
1. Pharma CDMO: Rs 846 Cr (Up 16% YoY)
2. Complex Generics: Rs 399 Cr (Down 13% YoY)
3. India Consumer Healthcare: Rs 130 Cr (Up 14% YoY)
15. EBITDA margin in the Pharma division was at 22%.
16. The company passed 17 successful regulatory inspections during 9MFY21.
17. Launched 15+ products and 35+ SKUs in 9M in the India Consumer Products division.
18. Announced expansion of $32 million in Riverview, Michigan facility.
19. PEL also announced acquisition of 49% remaining stake in Convergence Chemicals.
Investor Conference Call Highlights
1. The company is aiming to create a lending portfolio where retail will be 50% of the lending book
in the near term.
2. The company launched 6 new products in the retail lending platform in Q3.
3. It is now live in 40 locations.
4. The company has gradually pivoted the retail lending business towards mass-affluent and
affordable housing with no fresh disbursement in the affluent housing finance business. This is
expected to improve profitability.
5. The DHFL retail loan portfolio should help in jump-starting the organic retail business and
expansion in presence with additional branches and customer reach.
6. PEL’s top 10 exposures have reduced 27% since March 2019 from INR 18,400 crores to INR 13,400
crores.
7. Only 1 account at 15% of net worth with only 3 accounts greater than 7% of net worth.
8. The next aim for transformation for PEL is moving from short-term liabilities to stable long-term
borrowings. Around Rs 12,800 Cr of long term, debt was raised in 9MFY21 while CP exposure
remains low at Rs 1000 Cr. Thus ALM profile has improved with significant positive gaps in all the
buckets.
www.smartsyncservices.com Page | 142
Click here to Subscribe
on WhatsApp
9. In Q3, PEL invoked onetime restructuring for loans worth Rs 1741 Cr accounting for 3.8% of the
loan book.
10. The fall in complex hospital generics business was due to volatility in the demand of products used
in surgeries globally but this is expected to normalize shortly.
11. The expansion in the Riverview facility is for additional capacity in potent and non-potent API
development and manufacturing.
12. The company is successfully moving towards the demerger of the Financial Services and Pharma
businesses.
13. The management has stated that it does see some upside in the wholesale book of DHFL and is
yet to decide on its approach in this area.
14. Now that the non-compete clause with Abbott is over, the company is looking to expand its
portfolio through the OTC space.
15. In the complex generics space, the company has won a few large contracts and 1 very large
contract. This business division has seen a W-shaped recovery.
16. The management expects that once vaccinations are going full way and things normalize, demand
will come back to this business due to the big backlog of surgeries that got delayed due to COVID-
19.
17. The infra book has been reduced to Rs 2375 Cr as of Dec 2020. The majority of exposures are now
3-5% in the wholesale book.
18. The Lodha exposure has come down from Rs 3300 Cr to Rs 2671 Cr. The company has split the
deal with Lodha into 2 and has moved all finished inventory into an SPV. By March the total
exposure will be near Rs 2500 Cr of which Rs 1000 Cr or less will be Lodha exposure while the rest
will be in the SPV.
19. The management has stated that the cost of funds has remained high due to high wholesale
exposure but it will go down significantly as the DHFL portfolio will get added which has only 6.75%
cost of funds.
20. The personal loans exercise is still in the experiment phase. The company is looking at a target
market with a monthly salary of Rs 25000-50000 for this business.
21. The merger with DHFL should be complete by May or June 2021.
22. The 4 main business lines in the retail lending side will be mass-affluent housing with margins just
under 11%, loan against property with a margin between 11.5-12%, affordable housing with a
margin above 12%, and small business secured lending with a margin above 13%. Overall the
margin from the new business is expected to be above 11% at the least.
23. The company went live with ZestMoney as a partner and has 3 more fintech partnerships lined
up.
24. The management has clarified that it will be doing floating economics with all partners with the
front end of the partners and the back end from PEL.
25. The 4 large exposure that the company has restructured are in real estate, hospitality, auto
components, and infra.
26. The company had 1 large exposure in the auto ancillary space that it let go from Stage 2 to Stage
3. This was done as the management saw that liquidating and selling the assets of the company
was a better way to get back money than restructuring it. The company recovered around Rs 436
Cr from this exposure.
27. The management expects the ongoing acquisition and expansion in the pharma business to drive
margin expansion in the future for the company.
28. The outstanding retail loan book is at Rs 5300 Cr currently.
www.smartsyncservices.com Page | 143
Click here to Subscribe
on WhatsApp
Analyst’s Views
Piramal Enterprises is facing the heat of the challenging economic environment and downturn in the
real estate sector. The company has seen a good bounce back in the financial division and good growth
in the pharma division. The company has managed to make a successful acquisition bid for DHFL which
is a shot in the arm for the nascent retail lending business. It has brought the net debt to equity for
overall business to 0.9 and for Financial Services business to 1.9 times which is exceptional for a
predominantly NBFC company. The company is doing well since the launch of the retail lending
platform in Nov. PEL’s pharma business is also expected to see additional demand coming back in the
complex generics business which has been subdued due to the postponement of most surgeries due
to COVID-19. It remains to be seen how long will this slow period for financial services lasts for the
company and what challenges will it face in establishing its retail lending platform and the integration
of DHFL. However, given their past track record, management capability, and surplus unallocated
capital which can be deployed to support any of the conglomerate’s various businesses, Piramal
Enterprises continues to be a good conglomerate stock to watch out for, particularly in the real-estate
lending space.

www.smartsyncservices.com Page | 144
Click here to Subscribe
on WhatsApp
NETWORK & COMMUNICATIONS Sterlite Technologies
Financial Results & Highlights
STL, Sterlite Technologies Limited (Formerly Sterlite Tech) is a digital technology multinational
company having offices in India, China, US, SEA, Europe and MEA. It is listed on Bombay Stock
Exchange and National Stock Exchange of India. It has more than 270 patents and serving customers
in over 150 countries, including Fortune 100.
The company is specialized in optical fibre and cables, hyper-scale network design, and deployment
and network software and offer bespoke integrated solutions for global data networks of CSPs, Telcos
and OTTs. STL has also partnered with global telecom companies, cloud companies, citizen networks
and large enterprises to design, build and manage such cloud-native software-defined network. It has
strong global presence with next-gen optical preform, fibre and cable manufacturing facilities in India,
Italy, China and Brazil and two software-development centres.
Standalone Financials (In Crs)
Q3FY21 Q3FY20 YoY % Q2FY21 QoQ % 9MFY21 9MFY20 YoY%
Sales 1199 1118 7.25% 908 32.05% 2861 3744 -23.58%
PBT 109 86* 26.74% 67 62.69% 208 459* -54.68%
PAT 79 65 21.54% 49 61.22% 152 362 -58.01%
Consolidated Financials (In Crs)
Q3FY21 Q3FY20 YoY % Q2FY21 QoQ % 9MFY21 9MFY20 YoY%
Sales 1322 1209 9.35% 1169 13.09% 3377 4018 -15.95%
PBT 120 71* 69.01% 80 50.00% 207 451* -54.10%
PAT 86 50 72.00% 55 56.36% 143 351 -59.26%
*Contains exceptional item of loss of Rs 50.71 Cr.
Detailed Results:
1. The quarter saw revenue growth of 9% YoY in consolidated terms.
2. Consolidated net profit rose by 64% YoY for the quarter mainly due to a lower base last year due
to exceptional loss.
3. The current order book stands at Rs 10707 Cr. Volumes of optical fibre and cables sold were at an
all-time high in Q3.
4. Exports accounted for 44% of revenues in 9MFY21.
5. The company expects continued growth in Q3 & Q4 according to Vision 2023.
6. The client base revenue breakup in 9M is as follows:
1. Telcos: 64%
2. Enterprises: 11%
3. Citizen Networks: 22%
4. Cloud Players: 3%
www.smartsyncservices.com Page | 145
Click here to Subscribe
on WhatsApp
7. The completion of various data network projects for the company are as follows:
1. Network Modernisation for Indian Navy: 87%
2. MAHANET: 92% (A) 34% (B)
3. T-Fibre for Telangana: 18% (A) 13% (B)
4. FTTH rollout for a large Indian Telco: 2%
5. Modern Optical fibre rollout for large Indian telco: 21%
8. The order book spread across customer segments is as follows:
1. Telcos: 47.8%
2. Citizen networks: 34.3%
3. Enterprises: 17.5%
4. Cloud: 0.4%
9. The order book spread is expected is Rs 1501 Cr in the rest of FY21, Rs 5470 Cr in FY22 and Rs 3766
Cr for beyond FY22.
10. EBITDA margins were at 18%.
Investor Conference Call Highlights:
1. Demand for fibre is expected to be at almost 255 million in H2FY21.
2. The global micro data center market is expected to grow 5 fold by 2025.
3. The company has launched STL LEAD 360 which has a lot of technology interfaces using robotics,
using drone survey, using VR-based digital training as well as very strong cloud-based planning
and integrated remote field management to ensure both a very fast as well as long-lasting network
rollout.
4. STL has also launched its range of wireless solutions in Q3. The first among these is Garuda, which
is a smart 5G indoor small cell.
5. STL has also launched a high-capacity outdoor Wi-Fi access point for high-density deployments.
6. The commercial rollout of these newly launched products should start from H2FY22 onwards.
7. STL has completed the acquisition of Optotec in Q3. The addressable market for STL post-
acquisition is $8-10 billion.
8. STL is also bringing back the expansion of optical fiber cable capacity which is expected to be
expanded from 18 million km to 33 million km by June 2021.
9. STL has bagged a 5-year multimillion-dollar deal for 5G RAN systems and a significant order of an
Opticonn Solution for a leading telecom player in Europe.
10. Despite rising demand for OFC, pricing has remained stable and has not risen much in Q3.
11. The management maintains margin guidance of 18-20%.
12. There was a drop in depreciation in Q3 as the goodwill from the Elitecore acquisition was fully
amortized in Q2.
13. The management admits that to reach revenues of Rs 10,000 Cr STL needs to have an order book
of Rs 16,000-18,000 Cr.
www.smartsyncservices.com Page | 146
Click here to Subscribe
on WhatsApp
14. Currently, the company will be looking to use the cash generated from operations to retire debt
and thus will not be looking for acquisitions for some time.
15. Wireless is not expected to be higher than 4-5% of revenues for STL according to management.
16. The company is yet to decide whether it will utilize the PLI benefit or not on making wireless
devices. This is because it is focused on product design and capability at the moment.
17. STL is looking to offer end to end solutions by combining CODU software from ASOCS with Open
RAN hardware.
18. The earliest this can be implemented is expected to be FY23.
19. EU accounts for 26-27% of revenues currently.
20. The management expects overseas growth to faster for STL as compared to India.
21. Given the ratio of products to services remains at current levels of 50:50, the management expects
margin expansion to come from value-added product sales.
22. The company has 21 key accounts which generate 82% of sales. The company is focused on
creating a larger addressable market of their wallets and deeper penetration of their wallets for
these accounts.
Analyst’s View:
The company has had a good quarter and it has witnessed the highest ever cable sales volumes.
However, high-profit growth YoY in this quarter is mainly due to the lower profit base last year. In
Q3FY20, they had a high exceptional loss of 50 Cr. That is not there this quarter, hence, profit optically
looks higher. They are seeing a good recovery in the product business with utilization levels at an all-
time high. The company is seeing a good deal-wins abroad mainly in its products in Q3 and is also
expecting to see sales for virtualized access products start from next year onwards. There is a massive
opportunity in the cards for the company from the development of the 5G ecosystem announced by
Reliance Jio based on Open RAN technology which is also supported by Airtel, both of which have
announced that they will connect more than 100 million homes in next 5 years. It remains to be seen
how the post-COVID-19 unravels and how fast will the move towards 5G take place in the company’s
principal geographies. Nonetheless, given the company’s capabilities in providing integrated and
tailored network solutions, its expanded production capacity, and long-running order, Sterlite
Technologies looks like a pivotal stock to watch out for in the communications technology space.

www.smartsyncservices.com Page | 147
Click here to Subscribe
on WhatsApp
OTHERS CRISIL
Financial Results & Highlights
Brief Company Introduction
CRISIL (formerly Credit Rating Information Services of India Limited) is a global analytical company
providing ratings, research, and risk and policy advisory services. CRISIL’s majority shareholder is
Standard & Poor's, a division of McGraw Hill Financial and provider of financial market intelligence.
Standalone Financials (In Crs)
Dec CY20 Dec CY19 YoY % Sep CY20 QoQ % CY20 CY19 YoY%
Sales 255 233 9.44% 268 -4.85% 996 970 2.68%
PBT 51 26 96.15% 67 -23.88% 218 197 10.66%
PAT 40 15 166.67% 50 -20.00% 167 136 22.79%
Consolidated Financials (In Crs)
Dec CY20 Dec CY19 YoY % Sep CY20 QoQ % CY20 CY19 YoY%
Sales 612 484 26.45% 522 17.24% 2076 1815 14.38%
PBT 134 132 2% 114 17.54% 458 492 -6.91%
PAT 110 95 16% 90 22.22% 355 344 3.20%
Detailed Results:
1. The current quarter was encouraging for the company with consolidated revenues rising by 26%
while profits rose 16% YoY.
2. Excluding Greenwich Associates, revenues would have risen 2.6% YoY while profits would have
risen 16.2% YoY.
3. In the CY20, the revenues have risen 14% YoY while profits have risen 3.2% YoY. Excluding
Greenwich Associates, revenues would have risen 1.4% YoY while profits would have risen 17.8%
YoY in the year.
4. The board of directors has declared a final interim dividend of Rs 14 per share. This brings up the
total dividend in CY20 for CRISIL up to Rs 33 per share.
5. The rating business rose 6.5% YoY due rise in corporate bond issuances in the quarter.
6. The research business grew 40.9% in revenues in the quarter and 22.8% in CY20 due to rising
traction in non-financial and credit risk. Greenwich Associates was also a big contributor to
revenue growth in the quarter. Excluding Greenwich, revenue was lower by 1.0% in the quarter
and higher by 1.2% for 2020.
7. India Research introduced new analytics and district-level risk tracking dashboards to aid decision-
making as the pandemic unfolded.
8. The Advisory segment saw good traction with new mandates won in regulatory reporting, credit
risk, and select city infrastructure projects. However, delays in clients' decision-making and
www.smartsyncservices.com Page | 148
Click here to Subscribe
on WhatsApp
implementation affected business. Revenues in this division grew 16.9% in the quarter with CY20
revenues falling 5.9% YoY.
9. Greenwich Associates saw revenues of Rs 121 Cr and a post-tax loss of Rs 0.77 Cr. It also saw CY20
revenues come in at Rs 225.71 Cr and a post-tax loss of Rs 50.58 Cr.
10. CRISIL launched India's first AIF benchmarks.
Investor Conference Call Highlights
1. The management expects banks, mutual funds, or other segments to come back to normalcy in
the second half of 2021 with the demand revival happening in a continuous manner leading to
more demand for new borrowing and ratings.
2. The management states that it has done quite a bit to restructure the business in ways to align
our products and services to some of the emerging areas of interest for our customers like ESG.
3. The company has started on the migration of back end processes for Greenwich which got delayed
due to COVID-19.
4. The company is also seeing increased adoption of AI and ML across clients and thus is expected to
give forward more offerings in digital format.
5. In AI/ML, the company is seeing opportunities in providing better calibrated models that will aid
decision-making.
6. The management admits that margins have fallen in the last few years due to headwinds in the
research business and tapering of demand, especially on the regulatory remediation side. But it is
seeing demand coming back on the risk side in the traded risk and the model risk sides.
7. The company has shown margin expansion excluding the numbers from Greenwich and expects
this expansion to continue as opportunities are rising in all segments.
8. The main driving force in the advisory business is the deep domain knowledge in the different
domains of infra advisory and other advisory services according to the management.
9. Given the push on infra development by the Govt of India, the management remains optimistic
about the prospects of the infra advisory business going forward.
10. Typically, the pricing for capital market ratings is around 2.5 times that of the bank loan rating.
Analyst’s View:
CRISIL has been a trusted financial service and information provider for a long time. They have
established themselves as a reputed name in their operational fields of ratings, research, and advisory.
The company saw a good response to the rating business while the research business grew steadily
with the addition of Greenwich Associates to the company’s umbrella. Although the profits for the
company are subdued due to the addition of Greenwich without which PAT growth would have been
16% YoY in CY20, this drop in profits is expected to be temporary only. The advisory business is
expected to rise going forward due to the revival in demand and govt push for infra development. It
remains to be seen how long the Greenwich integration takes and when will it start delivering
according to the company’s expectations. Nonetheless, given the company’s industry position and its
financial resilience, CRISIL remains a pivotal stock in the rating sphere.
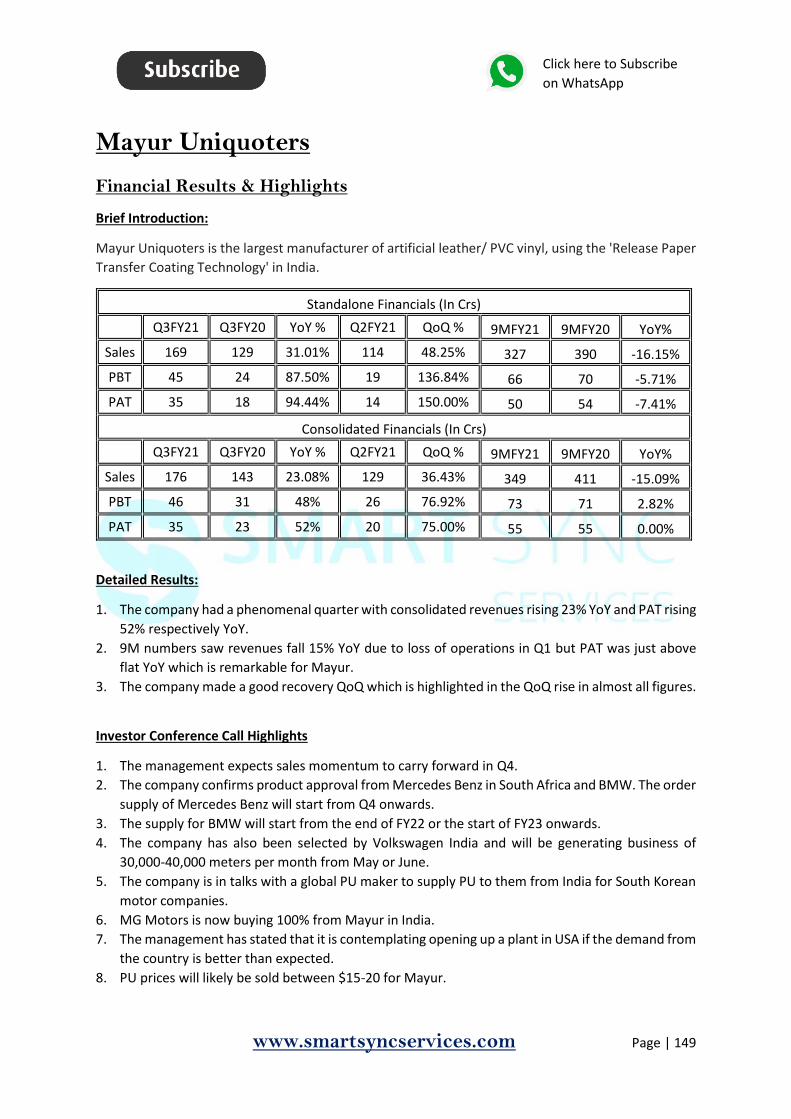
www.smartsyncservices.com Page | 149
Click here to Subscribe
on WhatsApp
Mayur Uniquoters
Financial Results & Highlights
Brief Introduction:
Mayur Uniquoters is the largest manufacturer of artificial leather/ PVC vinyl, using the 'Release Paper
Transfer Coating Technology' in India.
Standalone Financials (In Crs)
Q3FY21 Q3FY20 YoY % Q2FY21 QoQ % 9MFY21 9MFY20 YoY%
Sales 169 129 31.01% 114 48.25% 327 390 -16.15%
PBT 45 24 87.50% 19 136.84% 66 70 -5.71%
PAT 35 18 94.44% 14 150.00% 50 54 -7.41%
Consolidated Financials (In Crs)
Q3FY21 Q3FY20 YoY % Q2FY21 QoQ % 9MFY21 9MFY20 YoY%
Sales 176 143 23.08% 129 36.43% 349 411 -15.09%
PBT 46 31 48% 26 76.92% 73 71 2.82%
PAT 35 23 52% 20 75.00% 55 55 0.00%
Detailed Results:
1. The company had a phenomenal quarter with consolidated revenues rising 23% YoY and PAT rising
52% respectively YoY.
2. 9M numbers saw revenues fall 15% YoY due to loss of operations in Q1 but PAT was just above
flat YoY which is remarkable for Mayur.
3. The company made a good recovery QoQ which is highlighted in the QoQ rise in almost all figures.
Investor Conference Call Highlights
1. The management expects sales momentum to carry forward in Q4.
2. The company confirms product approval from Mercedes Benz in South Africa and BMW. The order
supply of Mercedes Benz will start from Q4 onwards.
3. The supply for BMW will start from the end of FY22 or the start of FY23 onwards.
4. The company has also been selected by Volkswagen India and will be generating business of
30,000-40,000 meters per month from May or June.
5. The company is in talks with a global PU maker to supply PU to them from India for South Korean
motor companies.
6. MG Motors is now buying 100% from Mayur in India.
7. The management has stated that it is contemplating opening up a plant in USA if the demand from
the country is better than expected.
8. PU prices will likely be sold between $15-20 for Mayur.
www.smartsyncservices.com Page | 150
Click here to Subscribe
on WhatsApp
9. The management has highlighted an ambitious target of breaking into the top 3 in the world
market in artificial leather in the next 3-4 years.
10. Total volumes sold in Q3 were at 77,61,400 meters.
11. The margins at current levels are sustainable according to the management as it has risen due to
a shift to a better product mix and Mayur has and will pass on any increase in raw material costs
to the customers to preserve its margin levels.
12. The company has had its best quarter in terms of revenues and PAT margin.
13. The management expects revenues from the auto segment to grow 75-100% in the next 3 years.
14. The company will start its 7th coating line in March and it will reach a capacity of 6-6.5 Lac meters
per month.
15. The expected volume in the Mercedes will be also between 30,000 to 40,000 per month.
16. The footwear segment is slowly rising as store footfall is rising but it is not able to match the
growth of the auto segment.
17. Footwear segment sales have risen 14% YoY.
18. The company is also introducing new material to sell like sport shoe material from PU which it did
not make in the past.
19. PU sales for Q3 were at Rs 2.5 Cr.
20. Fixed have risen in Q3 and it is expected to rise further as the primary force behind it was freight
costs which are expected to stay up going forward.
21. The management has stated that it is on the lookout for acquisition targets with good machinery
and R&D capability. Unfortunately, Mayur doesn’t see any such prospects in India currently.
22. The company has also received an offer from BMW to start supplying to its China unit if the current
order goes well.
23. The management believes that the PU unit can generate sales of Rs 100 Cr in the next 2-3 years.
24. In the Indian PU market, 70% is for low grade, 20% is for medium grade and 10% is for high grade.
Mayur is concentrating solely on the medium and high grade zones here.
25. The management is hopeful of starting a new plant for knitted fabric in the next 1.5 years.
26. The company has added a person from Taiwan who is very well known for R&D in the PU sector
and the Footwear world.
27. Currently, the company is doing 180,000 meters of export to USA. Once this number reaches 4
Lac, it will look to start a local facility in USA.
28. The management hopes to gradually convert the PVC majority footwear market in India towards
PU in the coming years.
29. The negotiation with Hero is still going on.
30. The current management has assured that Mayur will transition to a fully professional corporate
structure in the next 1.5-2 years.
Analyst’s View:
Mayur Uniquoters has been one of the biggest artificial leather makers in the world. But the company
has been through a rough patch in the past few years with stagnant revenues and decline of the
unorganized footwear segment which was a big revenue generator for the company. The company is
making good inroads into the auto-export segment. Q3 performance for Mayur was phenomenal with
its highest ever quarterly revenues and profits. The management remains confident of the product’s
technical and quality edge which has helped it bag multiple export orders from international auto
majors like BMW and Mercedes. The company’s domestic orders for Volkswagen & MG should help

www.smartsyncservices.com Page | 151
Click here to Subscribe
on WhatsApp
the company maintain good growth in the medium term. The new import duty on PU should also help
the company increase its PU sales which have stayed stagnant to date. It remains to be seen how long
will the non-auto segments take to match the growth momentum of the auto segment and how long
will it take for the management vision to materialize. Nonetheless, given its dominant market position
both in the domestic and export segments and the management’s focus on not compromising on
quality no matter what, Mayur Uniquoters remains a good small-cap stock to watch out for.
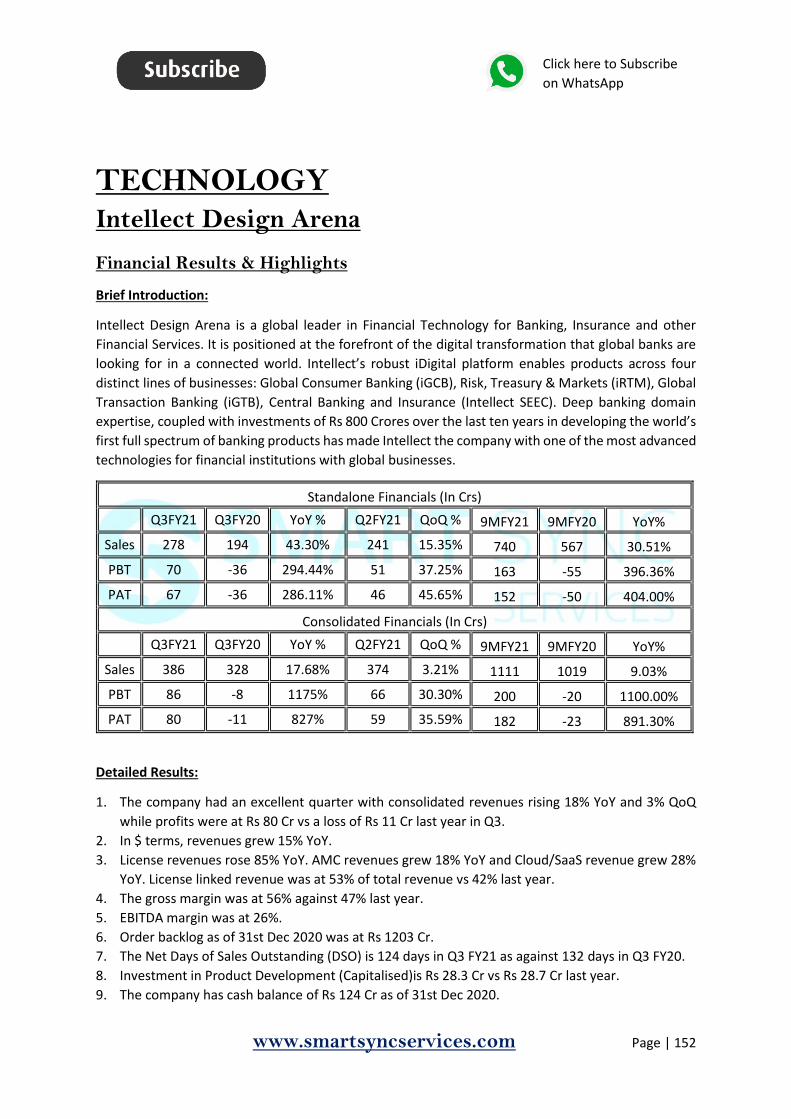
www.smartsyncservices.com Page | 152
Click here to Subscribe
on WhatsApp
TECHNOLOGY Intellect Design Arena
Financial Results & Highlights
Brief Introduction:
Intellect Design Arena is a global leader in Financial Technology for Banking, Insurance and other
Financial Services. It is positioned at the forefront of the digital transformation that global banks are
looking for in a connected world. Intellect’s robust iDigital platform enables products across four
distinct lines of businesses: Global Consumer Banking (iGCB), Risk, Treasury & Markets (iRTM), Global
Transaction Banking (iGTB), Central Banking and Insurance (Intellect SEEC). Deep banking domain
expertise, coupled with investments of Rs 800 Crores over the last ten years in developing the world’s
first full spectrum of banking products has made Intellect the company with one of the most advanced
technologies for financial institutions with global businesses.
Standalone Financials (In Crs)
Q3FY21 Q3FY20 YoY % Q2FY21 QoQ % 9MFY21 9MFY20 YoY%
Sales 278 194 43.30% 241 15.35% 740 567 30.51%
PBT 70 -36 294.44% 51 37.25% 163 -55 396.36%
PAT 67 -36 286.11% 46 45.65% 152 -50 404.00%
Consolidated Financials (In Crs)
Q3FY21 Q3FY20 YoY % Q2FY21 QoQ % 9MFY21 9MFY20 YoY%
Sales 386 328 17.68% 374 3.21% 1111 1019 9.03%
PBT 86 -8 1175% 66 30.30% 200 -20 1100.00%
PAT 80 -11 827% 59 35.59% 182 -23 891.30%
Detailed Results:
1. The company had an excellent quarter with consolidated revenues rising 18% YoY and 3% QoQ
while profits were at Rs 80 Cr vs a loss of Rs 11 Cr last year in Q3.
2. In $ terms, revenues grew 15% YoY.
3. License revenues rose 85% YoY. AMC revenues grew 18% YoY and Cloud/SaaS revenue grew 28%
YoY. License linked revenue was at 53% of total revenue vs 42% last year.
4. The gross margin was at 56% against 47% last year.
5. EBITDA margin was at 26%.
6. Order backlog as of 31st Dec 2020 was at Rs 1203 Cr.
7. The Net Days of Sales Outstanding (DSO) is 124 days in Q3 FY21 as against 132 days in Q3 FY20.
8. Investment in Product Development (Capitalised)is Rs 28.3 Cr vs Rs 28.7 Cr last year.
9. The company has cash balance of Rs 124 Cr as of 31st Dec 2020.
www.smartsyncservices.com Page | 153
Click here to Subscribe
on WhatsApp
10. The company had 10 digital led deal wins in Q3 with 6 of them being large deal wins. In 9M period,
the company won 20 deals with 11 of them being large ones.
11. Repeat revenue from existing customers stood at 85%.
12. The current funnel of Intellect is around Rs 4162 Cr out of which Rs 3200 Cr is accounted for by
132 Opportunities.
13. The average destiny deal size in Q3 FY21 stands at Rs 45 Cr against Rs 39 Cr in Q3 FY20. Destiny
deals contribute to 53% of the total Opportunity funnel in Q3 FY21.
14. Revenue breakup is 58% Advanced Markets, 28% Rest of the World & 15% India.
15. iGCB enters North America by winning its first IDC cloud subscription deal.
16. 9 projects went live in Q3.
17. The company won destiny deals in North America, Germany, CEE, Australia, Indonesia, and Jordan.
Investor Conference Call Highlights:
1. Intellect Design Arena has the world's largest cloud-native API led microservices based
multiproduct fintech platform powered by AI/ML for global leaders in banking, insurance, and
capital markets.
2. It is also the only company on the same architecture, which offers a full spectrum of banking and
insurance technology product through its 4 lines of business, which are Global Consumer Banking
(GCB), Global Transaction Banking (GTB), Risk, Treasury, and Markets (RTM) & Insurance.
3. The growth in the product business is moving from almost $20 billion to the $30 billion market
size in the fintech space.
4. Intellect’s competition in Consumer Banking is Temenos, Finastra, TCS, Finacle, and Oracle. In
Transaction Banking, Finastra is the key competition along with ACI Worldwide, CGI, and
Bottomline. In Treasury, competition is from Sungard, Finastra, and Calypso. And competition in
Insurance is from Carpe Data and Planck.
5. Cash and cash equivalents for Intellect are at Rs 183.7 Cr.
6. The company also won a supply chain deal in Vietnam.
7. The management has stated that whenever Intellect enters a new geography, it approaches the
largest bank for a deal and subsequently other banks come in with time. This is going on with
Jordan right now.
8. Intellect has launched 3 new products in the quarter including DTB M 21 which already has 53
customers.
9. The destiny deal in Germany is with OTTO which is one of the largest European e-commerce
players and the second largest e-commerce player in Germany after Amazon.
10. The North American deal is its first cloud subscription deal for a mid-tier bank in Canada.
11. Intellect also won a multimillion-dollar upgrade deal with an innovative digital bank in Africa. The
deal is a 4 country rollout which includes core banking as well as core lending.
12. The big deal from Australia is for Intellect SEEC in the insurance space.
13. Intellect SEEC also went live in Q3 with Ameritrust which is a commercial insurance underwriter
in USA.
14. Another client from USA, Amerisure has extended its contract instead of 3 years to a fresh contract
for 5 years. Amerisure is one of the leading commercial insurance companies in USA focusing on
construction, manufacturing, and health care.
15. Liberty, which is one of the largest insurance companies worldwide with revenues well over $43
billion, has gone live on IDX platform for 3 of its business lines.
www.smartsyncservices.com Page | 154
Click here to Subscribe
on WhatsApp
16. The company has indeed seen a rise in win rate as compared to last year according to
management.
17. The management has stated that revenues have stabilized at $40 million per quarter and even
10% revenue growth may result in 30% EPS growth in coming years.
18. The management has stated that it is indeed aiming for 20%+ rupee revenue growth going
forward.
19. There are significant tailwinds for the move to cloud subscription model in the fintech space
according to the management. There isn’t any degradation in lifetime value from migration to
subscription model according to the management.
20. The management has stated that as the global presence of Intellect rises and it goes to new
markets like Thailand and Vietnam, its share of advanced markets will naturally go down.
21. The company is targeting business share from emerging markets to be near 33%.
22. The deal funnel contains both license and subscription deals and in subscription deals, it has only
2 years of deal value linked even if the deal is for more than 2 years.
23. The management has admitted that USA is the toughest market to crack for fintech companies
and AI/ML is key to succeeding in this region. The management is optimistic about the company’s
prospects based on the good acceptance of the Intellect SEEC platform in the Insurance sector in
USA and its data platform which is similar to Palantir. The company has also recently won 2 big
deals in Liquidity space in USA.
24. The management is confident that as growth levers for the company mature, the EBITDA margin
will slowly come to 40% and will ensure bottom-line growth even when the top line is stagnant.
25. The company still has Rs 450 Cr in tax losses.
26. The company is also working on some deals with Jio, AWS, and IBM.
Analyst’s View:
Intellect Design Arena is a fast-rising disruptor in the world fintech space. The company’s products are
well received all over the world which is evidenced in the diverse set of geographies and financial
institutions that they cater to. The company has had an excellent quarter with its first ever German
deal and a first ever cloud subscription deal in USA. 9MFY20 was very good for Intellect with it scoring
20 deals in the year so far with 11 of them being big destiny deals. The company is now targeting to
grow organically in the USA market with its SEEC platform and its data platform which is reportedly
similar to Palantir. It remains to be seen whether the company will be able to maintain its growth
momentum as the management has proposed or whether there will be any other headwinds that will
put pressure on the company. Nonetheless, given the acceptance of the company’s products in all
kinds of financial institutions worldwide and its high customer retention rate and accelerated
implementation time for its projects, Intellect Design Arena remains a stock to watch out for in the
financial software industry.
www.smartsyncservices.com Page | 155
Click here to Subscribe
on WhatsApp
L&T Infotech
Financial Results & Highlights
Brief Introduction:
Larsen & Toubro Infotech Limited, a technology consulting and digital solutions company, provides
information technology services and solutions in India, North America, Europe, the Asia Pacific, and
internationally. The company operates through Banking, Financial Services & Insurance;
Manufacturing; Energy & Utilities; High–Tech, Media & Entertainment; and CPG, Retail, Pharma &
Others segments. It offers application development, maintenance and outsourcing, enterprise
solution, infrastructure management, testing, digital solution, and platform-based solution services. It
is a subsidiary of Larsen & Toubro Limited.
Standalone Financials (In Crs)
Q3FY21 Q3FY20 YoY % Q2FY21 QoQ % 9MFY21 9MFY20 YoY%
Sales 3039 2700 12.56% 2840 7.01% 8709 7708 12.99%
PBT 662 485 36.49% 575 15.13% 1768 1477 19.70%
PAT 494 367 34.60% 430 14.88% 1321 1137 16.18%
Consolidated Financials (In Crs)
Q3FY21 Q3FY20 YoY % Q2FY21 QoQ % 9MFY21 9MFY20 YoY%
Sales 3222 2875 12.07% 3035 6.16% 9272 8126 14.10%
PBT 699 500 40% 613 14.03% 1871 1451 28.95%
PAT 519 377 38% 457 13.57% 1393 1093 27.45%
Detailed Results:
1. The company had an excellent quarter with 12% YoY growth in consolidated revenues and 38%
YoY growth in consolidated profits.
2. The constant Currency Revenue increase was at 5.3% QoQ and 7.4% YoY.
3. USD revenues were at $427.8 million which is a growth of 8.5% YoY.
4. Digital revenues were at 44.4% of revenues in Q3.
5. EBITDA margin expanded 440 bps YoY to 23.2% in Q3.
6. Revenue breakup in Q3 by vertical is:
1. BFS: 30.6% (Up 19.4% YoY)
2. Insurance: 15% (Down 7.9% YoY)
3. Manufacturing: 16.8% (Up 4.4% YoY)
4. Energy & Utilities: 10% (Down 3.6% YoY)
5. CPG, Retail & Pharma: 10.9% (Up 5.2% YoY)
6. Hi-tech, Media & Entertainment: 10.6% (Up 6.5% YoY)
7. Others: 6% (Up 76.4% YoY)
7. Revenue breakup by Service Offerings is:
1. ADM and Testing: 33.6% (Up 1.8% YoY)
www.smartsyncservices.com Page | 156
Click here to Subscribe
on WhatsApp
2. Enterprise Solutions: 31.4% (Up 8.6% YoY)
3. Infrastructure Management Services: 14.3% (Up 34.7% YoY)
4. Analytics, AI & Cognitive: 11.9% (Up 0.3% YoY)
5. Enterprise Integration & Mobility: 8.8% (Up 12.3% YoY)
8. Geographical breakup is North America @ 67.9%, EU @ 16.1%, RoW @ 7.4% & India @ 8.6%.
9. Top 5 clients account for 29.3% revenue, Top 10 account for 42% revenue & Top 20 account for
57.1% revenue.
10. The company has added 22 new clients in Q3.
11. Effort Offshoring is at 81.6% while offshore revenues are at 55.7%.
12. Utilization including trainees is at 81.1% and excluding is at 84.1%.
13. Cash and Cash equivalents as of end of Q3 was at Rs 524.8 Cr.
14. The company won two large deals with cumulative net new TCV of $278 million.
15. Recent deal wins of L&T Infotech are:
1. A UAE-based leader in digital transformation has selected LTI as its partner of choice to
provide infrastructure and application operations support and maintenance for its existing
and new customers.
2. A Global Fortune 500 energy company has chosen LTI as its primary partner for an
application managed services agreement to create and consolidate a business-aligned IT
services delivery platform across the organization and reduce total cost of ownership.
3. A company located in the U.S providing leading data-driven marketing, loyalty & payment
solutions has selected LTI for customer-centric digital transformation initiatives.
4. An engineering, construction and mining company located in South East Asia has
partnered with LTI to transform its procurement, sales, bidding, contracting and analytics
functions using SAP.
5. LTI executed a license sale agreement for AI, Decisions and Catalog products on its Mosaic
platform with a multinational banking and financial services company to bring about
efficiency in their reporting with the regulators.
6. A leading European financial services firm has chosen LTI to manage its infrastructure
operations through a leaner operating model and by leveraging the Mosaic platform to
drive automation.
7. A leading commercial property and casualty insurance group based in Canada has selected
LTI to consolidate and transform its policy administration systems and processes onto the
Duck Creek platform to ensure streamlining of its operations.
8. A U.S. based real estate investment company has chosen LTI for providing application
support, maintenance and development services.
16. LTI is now an ‘Elite’ level partner of Snowflake, a ‘Premier’ level partner of Google Cloud, & a
‘Platinum’ tier partner of IBM.
17. LTI has partnered with Temenos to launch a Digital Banking Platform in the Nordic region.
Investor Conference Call Highlights:
1. The client from UAE is Injazat which is part of the Mubadala Group and is currently partnered with
G42. LTI will start with infrastructure, applications, and ERP services for 50-plus clients with
Injazat. The deal tenure is 6 years, and the deal value is estimated at $204 million.
2. The second large deal was with a Global Fortune 500 energy company. It's a 5-year deal with net
new TCV of $74 million.
www.smartsyncservices.com Page | 157
Click here to Subscribe
on WhatsApp
3. The company now has 69 Fortune 500 clients.
4. According to the management, the 3 main growth drivers in BFS vertical are:
a. investment in core infrastructure like accounting, reporting, and governance, which is
predominantly data-driven;
b. investment in building for utilities like Google Pay and other payment service apps;
c. investments in platforms to support retail wealth because of the global stimulus and
liquidity.
5. The manufacturing vertical is expected to grow in the coming quarters due to the presence of
higher pass-through in one of LTI’s domestic engagements.
6. The management states that the reasons for margin appreciation are enhancing productivity,
improvement in the offshore mix, and efficiencies in SG&A.
7. The management is confident of LTI maintaining its position in the leading quadrant in the industry
at the least.
8. The company has a separate unit focusing on cloud and this unit has 4 other sub units which focus
on AWS, Microsoft, Google Cloud, and IBM.
9. The management maintains that LTI is a growth company with stable PAT margins of 14-15% and
the rest shall be invested back into the businesses.
10. The management has stated that business modernization at all levels will be the primary growth
driver for the IT industry in the next 4-5 years.
11. The management has implied that it is not worried due to falling revenue share of top clients
because it is not because of falling revenues from these clients rather it is driven by rising share
from smaller clients.
12. The deal with the European financial services firm does have a license component where the
company is growing a platform to consolidate all of their risk models and reporting -- regulatory
reporting on this platform. The deal also includes services to integrate this platform into the bank’s
ecosystem. This should provide future opportunities for applying this platform to other sections
of the bank.
13. The margin profile is indeed expected to come down to the prescribed range as the company will
be doing a wage hike in January and it will be making investments into sales and marketing, cloud
and data units & in buying the license to set up the framework for Nordic financial companies in
the SaaS platform.
14. The management states that LTI has always been a proponent of high offshore mix and it will
maintain the offshore mix at current levels.
15. The management has stated that every year LTI can expect to bring in $100 million of sales from
new customers.
16. The revenue streams from Injazat will be seen from Q1FY22 onwards.
17. The utilization rate is indeed higher than what the management wants and so LTI is expected to
raise its fresh grad uptake and increase cross skilling of existing employees.
18. The management has stated that the things clients are looking for now are whether the total cost
of ownership can be brought down or whether product launch can be done faster than in the past.
19. The management has stated that the improvement in utilization is due to a higher than expected
rise in demand and billing of resources in Q3. Thus to bring back utilization to desirable levels, it
will be doing aggressive hiring.
20. The wage hike offshore will be 6-8% while on site it will be 2%. The impact on P&L should be 160-
170 bps.
www.smartsyncservices.com Page | 158
Click here to Subscribe
on WhatsApp
Analyst’s View:
L&T Infotech is a major in the digital solutions space in India. The company has done well to maintain
its presence in many end industries like BFS, Insurance, Manufacturing, etc, and focus on cloud and
data products to drive growth in the near future. It has had a good Q3 with major deal wins including
from Injazat which has a TCV of > $200 million. The management has also been perceptive in
identifying offshoring and creating new operating and sales models as a good source for improving
performance and bring in cost savings. It is also focused on the digital transformation theme and is
confident that this will be the primary growth driver for the Indian IT industry in the next 4-5 years.
LTI is also doing well to maintain its partnerships with industry leading platforms like AWS, Snowflake,
and Google Cloud. It remains to be seen how the company will be able to sustain its growth
momentum and the increased competition in the tech space. Nonetheless, given the company’s ever-
increasing roster of marquee clients and its focus on driving growth from cloud & data products, L&T
Infotech is a pivotal technology stock to watch out for.

www.smartsyncservices.com Page | 159
Click here to Subscribe
on WhatsApp
Persistent Systems
Financial Results & Highlights
Brief Introduction:
Persistent Systems Limited provides computer programming, consultancy, and related services. It
operates through three segments: Technology Services, Alliance, and Accelerite (Products). The
company engages in the provision of software products, services, and technology innovation in
telecom and product lifecycle management domains, and digital practice; software development,
professional, and marketing services; and telecommunication API gateway for defining, exposing,
controlling, and monetizing telecom services to partners and application developers, as well as an
Internet of Things service creation platform that allows enterprises to add a service layer to the basic
APIs exposed to by connected devices, and to expose and monetize APIs. The company serves the
banking, financial services, insurance, healthcare and life sciences, industrial, and software and
technology industries.
Standalone Financials (In Crs)
Q3FY21 Q3FY20 YoY % Q2FY21 QoQ % 9MFY21 9MFY20 YoY%
Sales 675 586 15.19% 617 9.40% 1878 1670 12.46%
PBT 161 121 33.06% 159 1.26% 478 366 30.60%
PAT 126 90 40.00% 118 6.78% 365 280 30.36%
Consolidated Financials (In Crs)
Q3FY21 Q3FY20 YoY % Q2FY21 QoQ % 9MFY21 9MFY20 YoY%
Sales 1105 958 15.34% 1024 7.91% 3142 2746 14.42%
PBT 165 114 45% 138 19.57% 425 339 25.37%
PAT 121 88 38% 102 18.63% 313 256 22.27%
Detailed Results:
1. The company had an excellent quarter with consolidated revenue growth of 15% YoY and PAT
growth of 38% YoY.
2. 9M performance was similar with revenue growth of 14% YoY and 22% YoY PAT growth.
3. USD revenues were at $146.15 million which was up 12.9% YoY.
4. EBITDA was up 47.8% YoY.
5. Industry revenue mix was at:
1. BFSI: 29.5%
2. HCLS: 19.1%
3. Tech & Emerging: 51.5%
6. Client concentration was: Top 1 @ 18.5%, Top 5 @ 37.8% & Top 10 @ 47%.
7. Revenue breakup in terms of business offerings was at 81.9% for Services & 18.1% for IP led.
8. Geographical revenue breakup was:
1. North America: 81%
www.smartsyncservices.com Page | 160
Click here to Subscribe
on WhatsApp
2. EU: 8.8%
3. India: 8.6%
4. RoW: 1.6%
9. Persistent Systems was recognized as a Top 15 Service Provider in 2020 ISG Index™ for a fourth
consecutive quarter.
10. The company has cash & investments of Rs 1903 Cr as of 31st Dec 2020.
11. The company has 17 clients of > $5 million engagement and 65 clients of engagement size of $1-
5 million.
12. PS announced an interim dividend of Rs 14 per share.
13. Persistent completed acquisition of 100% shares of CAPIOT Software Private Limited.
Investor Conference Call Highlights:
1. The company added >1600 new full time employees in Q3 with >70% of them being lateral hires.
2. The salary increment postponed from July was implemented in November.
3. PS added new deals with a total TCV of $302 million in Q3.
4. The cash on books was at $258 million or Rs 1888 Cr as of the end of Q3.
5. The acquisition of CAPIOT added $1 million to revenues while alliance business added $34.6
million in Q3.
6. PS’s large deal wins in alliance business will see revenues coming in from Q1 onwards.
7. In BFSI, PS won a large multiyear deal to deliver a solution. It will be helping the client, who is one
of the top 5 banks globally, to comply with the rules issued by U.S. Financial Crimes Enforcement
Network, FinCEN, through identification and verification of beneficial owners of legal entity
customers and so on.
8. The management states that the broad theme in BFSI will be compliance, modernization,
launching new products in digital banking, & making new digital products more secure. The main
theme in Healthcare & Life Science will be the digital front door, which is the consumer
experience, for Persistent.
9. In terms of the linear revenue, offshore linear revenue grew by 8.9%, comprising of volume growth
of 11.5% and declining billing rate by 2.3%, essentially because of the lower number of working
days.
10. The on-site linear revenue decreased by 1%, while there was an increase in volume by 0.2% and
the billing rate declined by 1.2%, again, basically because of the impact of furloughs.
11. BFSI had a marginally soft quarter with a dip of 0.8% given the seasonality factor, while health
care saw good 6.4% QoQ and technology companies and emerging verticals registered a very good
growth of 13.2% QoQ.
12. The gross margin in Q3 was at 34.3% vs 34.7% in Q2.
13. The SG&A expenses were 17.3% as against 18.3% in the previous quarter
14. Forex loss was much less at Rs 20 lacs as against Rs 5.1 Cr in the previous quarter.
15. The lateral hires of around 1000 employees in Q3 were done mainly for the deal wins in FY21 so
far. The fresh hires of 600+ people were done anticipating future deal wins as the company is
ramping up its winning momentum.
16. Around $175 million of the TCV of deal wins in Q3 was from new customers.
17. The utilization rate was in the range of 80-81% in Q3. The employee costs rose 4% QoQ mainly
due to the new hires done in Q3 and the wage hike in November.
www.smartsyncservices.com Page | 161
Click here to Subscribe
on WhatsApp
18. The management has admitted that some of the cost savings like the ones in travel will get
reversed in the future.
19. The company is not going to do any buybacks with its cash and is keeping large cash reserves to
stay ready for any potential acquisitions.
20. The management believes that the improvement in IP business in Q3 is sustainable.
21. In BFSI, the management has stated that it is seeing most of the activity coming in from the digital
banking side with more and more banks are trying to launch newer products in the online space.
A lot of them are looking at working with the hyperscalers and working towards a hybrid cloud
environment.
22. The average duration of the new customer deals in Q3 with TCV of $175 million is less than 3 years.
23. The management has stated that PS will concentrate on consolidating industry verticals and
sharpening service lines for organic growth and it will also be looking for inorganic growth
opportunities in Europe. This has been identified as the go-to strategy to pursue growth for PS for
the next 4-8 quarters.
24. The management has admitted that its strategy to keep creating opportunities in services is to
compensate for the volatility in the IP side of the business. Another reason for pursuing services
with partners is to source new customers and add new revenue streams which can be expanded
upon with cross selling at a later date.
25. The management has stated that the M&A would be more in terms of getting capabilities on cloud,
security, data and it is not looking to acquire IP-based companies.
26. PS is looking to double down in Europe to reduce geographical concentration and dependence on
USA and to leverage the opportunities there with its acquisitions. In 3-4 years, the management
expects revenues from EU to be at 15-18% of total revenues.
Analyst’s View:
Persistent System is a fast-rising player in the digital transformation space. It has seen good growth in
recent years and is looking to capitalize on this momentum and aim to reach revenues of $1 billion in
the next 4 years. The company had an excellent quarter with many deal wins resulting in a TCV of $302
million. It is also looking to double down on the industry partnerships as it is a growing source of
income for PS and a new medium to source new customers. The company is also looking at possible
acquisition opportunities particularly in Europe to reduce dependence on USA. It remains to be seen
whether the company will be able to maintain its current momentum and whether its strategic
acquisitions will prove to be as useful as projected. Nonetheless, given its fast rise in recent years and
its big presence in North America & its various Alliances, Persistent Systems remains a key technology
stock to watch out for.
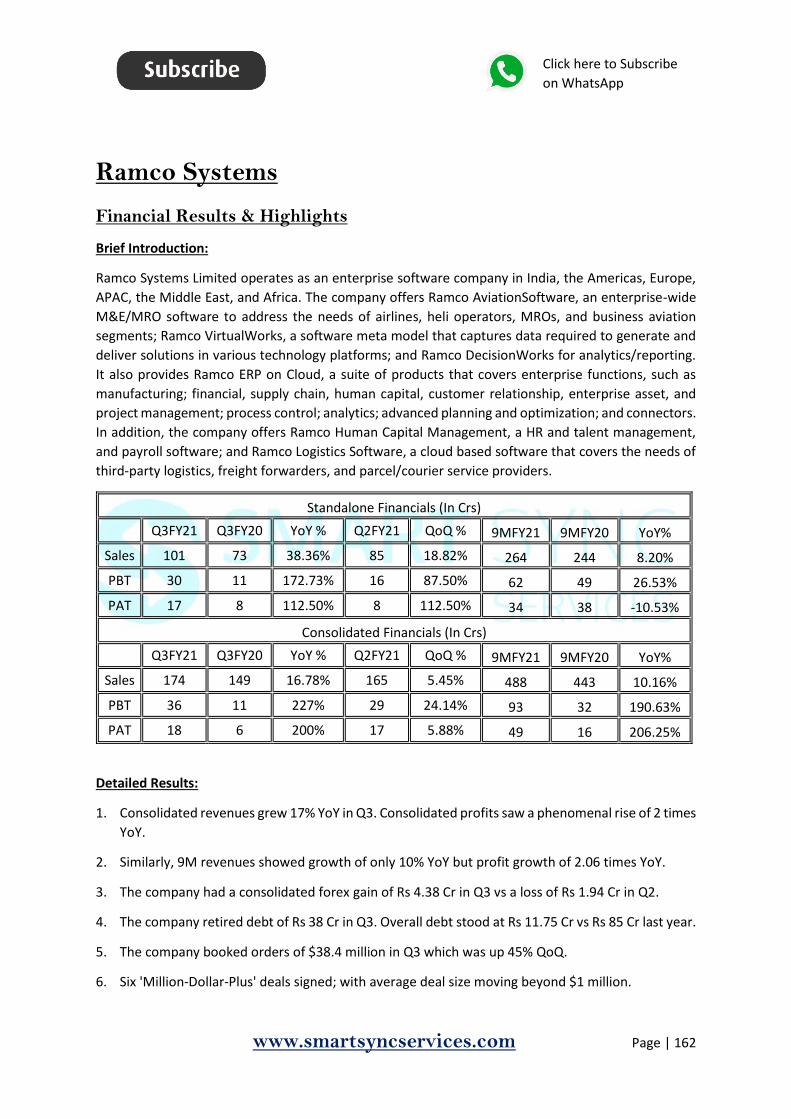
www.smartsyncservices.com Page | 162
Click here to Subscribe
on WhatsApp
Ramco Systems
Financial Results & Highlights
Brief Introduction:
Ramco Systems Limited operates as an enterprise software company in India, the Americas, Europe,
APAC, the Middle East, and Africa. The company offers Ramco AviationSoftware, an enterprise-wide
M&E/MRO software to address the needs of airlines, heli operators, MROs, and business aviation
segments; Ramco VirtualWorks, a software meta model that captures data required to generate and
deliver solutions in various technology platforms; and Ramco DecisionWorks for analytics/reporting.
It also provides Ramco ERP on Cloud, a suite of products that covers enterprise functions, such as
manufacturing; financial, supply chain, human capital, customer relationship, enterprise asset, and
project management; process control; analytics; advanced planning and optimization; and connectors.
In addition, the company offers Ramco Human Capital Management, a HR and talent management,
and payroll software; and Ramco Logistics Software, a cloud based software that covers the needs of
third-party logistics, freight forwarders, and parcel/courier service providers.
Standalone Financials (In Crs)
Q3FY21 Q3FY20 YoY % Q2FY21 QoQ % 9MFY21 9MFY20 YoY%
Sales 101 73 38.36% 85 18.82% 264 244 8.20%
PBT 30 11 172.73% 16 87.50% 62 49 26.53%
PAT 17 8 112.50% 8 112.50% 34 38 -10.53%
Consolidated Financials (In Crs)
Q3FY21 Q3FY20 YoY % Q2FY21 QoQ % 9MFY21 9MFY20 YoY%
Sales 174 149 16.78% 165 5.45% 488 443 10.16%
PBT 36 11 227% 29 24.14% 93 32 190.63%
PAT 18 6 200% 17 5.88% 49 16 206.25%
Detailed Results:
1. Consolidated revenues grew 17% YoY in Q3. Consolidated profits saw a phenomenal rise of 2 times
YoY.
2. Similarly, 9M revenues showed growth of only 10% YoY but profit growth of 2.06 times YoY.
3. The company had a consolidated forex gain of Rs 4.38 Cr in Q3 vs a loss of Rs 1.94 Cr in Q2.
4. The company retired debt of Rs 38 Cr in Q3. Overall debt stood at Rs 11.75 Cr vs Rs 85 Cr last year.
5. The company booked orders of $38.4 million in Q3 which was up 45% QoQ.
6. Six 'Million-Dollar-Plus' deals signed; with average deal size moving beyond $1 million.

www.smartsyncservices.com Page | 163
Click here to Subscribe
on WhatsApp
7. Ramco Aviation added Iberia Maintenance and the world's largest commercial fleet of tactical ex-
military aircraft. This now makes four of the top U.S. ADAIR (Adversary Air Services) Operators as
customers of Ramco.
8. Ramco ERP announces a digital transformational program at DLF Limited.
Investor Conference Call Highlights
1. Revenue per employee had crossed $4,000 per employee per month for the first time.
2. Q3 had the highest ever booking of about $38 million, primarily on account of one large aviation
deal in Europe.
3. About half the booking this year for Ramco is from the USA Aviation business was from the
Defence sector. About 30% of the global aviation pipeline is now defense.
4. Ramco entered into two new segments this year - unmanned aerial vehicles (Drones and Aerial
taxis) and Space launch vehicles.
5. The company added 3 deals of >$4 million, 2 deals of >$5 million, and 1 deal >$10 million in Q3.
6. Ramco is now contracted to 200 fighter jets to date.
7. The 4 out of 5 ADAIR companies is still 1-2% of the defense market.
8. The management expects the HR and payroll sector to rise faster than before for Ramco as
discretionary spending is coming back.
9. The logistics business has doubled in booking in Q3. The company is anticipating many more deals
from the ERP space in India due to dissatisfaction in many Indian companies with the pricing
offered by the Big 4 ERP providers in the country.
10. HR product line implementation takes around 6 months but the company is aiming to bring this
down to 2-3 months.
11. Recurring revenue has grown at a CAGR of 27% in the last 5 years.
12. The company aims to convert the HR and payroll business into a pure SaaS model. It is also aiming
to grow the logistics business in the recurring revenue path with all new accounts calculated on
per parcel or per transaction or consignment basis.
13. Ramco is aiming to minimize the time taken in implementation and going live as the management
believes that the faster you go live, the customers’ experiences are more intense and better, which
gives more repetitive orders. Similarly delivering before industry time is the aim for other
segments of logistics and aviation.
14. The tax charge for Ramco is high as it cannot account for MAT credit for using foreign withholding
tax to discharge MAT liability. Around 47-48% of tax charge goes to the deferred tax provision.
15. The EBITDA margin has risen to above 30% in FY21 from 15-20% in FY20. This is because of higher
top-line growth and lowering expenses according to the management. Although some expenses
like travel will be coming back, they will not be at the same level as before due to the rise of
remote implementation. The management is confident of maintaining EBITDA margin between
25-30% in the long run.
16. The company is aiming to add Europe to its payroll product destinations and is also looking at
providing more specialization and greater depth and value proposition. It is also looking to make
a new user interface that promises to do the same.
17. The management has admitted that lumpiness of revenue shall remain and that $10 million deals
may not repeat every quarter. But it is confident of the strong momentum sustaining going
forward.

www.smartsyncservices.com Page | 164
Click here to Subscribe
on WhatsApp
18. In overall, Ramco is aiming to reduce 20-25% of the timeline for ERP and Aviation and 50% of the
timeline for Logistics and HR, and payroll products.
19. The wage bill has risen QoQ mainly due to restoration of the salary cuts taken earlier in FY21 and
the addition of 185 new employees.
20. Although the sentiment remains positive, the management is cautious due to anticipation of
lockdowns in South East Asia.
21. The management has stated that it is aiming for an annual booking rate of $30+ million to get
closer to the goal of $100 million annual revenues.
22. The company offers 3 SaaS models which are a pure multitenant model with interface sharing, a
shared database model like the one that SalesForce offers, and a private instance for customers
with sensitive payroll data. It supports both Azure and AWS and Oracle Cloud as well.
23. Most of the implementation is done by Ramco itself. In some cases, the Big 4 doe the
implementation in some projects outside of India. For the Defence customers in USA, the
implementation is done by Ramco’s defense partners in the USA due to requirements for security
and second generation Americans only to access data.
Analyst’s View:
Ramco is a fast-growing enterprise software player disrupting the market with its multi-tenanted cloud
and mobile-based enterprise software in the area of HCM and Global Payroll, ERP, and M&E MRO for
Aviation. Ramco Systems had a phenomenal quarter with large deal wins including one of >$10 million.
It has also added another big USA customer and now accounts for 4 out of 5 ADAIR companies in USA.
The management has repeatedly emphasized the importance of the SaaS model going forward for all
of its verticals. The management remains confident of the demand going forward despite admitting
to the lumpiness of revenues at the same time. It remains to be seen whether this earning momentum
can carry on in the quarters to come and whether the company will be able to fulfill its promises of
superior implementation times without any compromise on quality. The price has shot up a lot in a
short time making the current valuation look very expensive at the moment. Nevertheless, Ramco
Systems is one stock to watch out for in the IT product space.

www.smartsyncservices.com Page | 165
Click here to Subscribe
on WhatsApp
Tata Elxsi
Financial Results & Highlights
Introduction
Tata Elxsi provides product design and engineering services to the consumer electronics,
communications & transportation industries and systems integration and support services for
enterprise customers. It also provides digital content creation for media and entertainment industry.
Consolidated Financials (In Crs)
Q3FY21 Q3FY20 YoY % Q2FY21 QoQ % 9MFY21 9MFY20 YoY%
Sales 492 444 10.81% 435 13.10% 1341 1216 10.28%
PBT 146 102 43.14% 110 32.73% 350 243 44.03%
PAT 105 75 40.00% 79 32.91% 253 174 45.40%
Detailed Results:
1. The company saw revenues rise 10.8% YoY in Q3. Revenues from operations rose 12.7% YoY.
2. 9M revenues were also up 10% YoY.
3. The PAT for the company rose 40% YoY in Q3 & 45% YoY in the 9M period.
4. The operating margin was at 30.1% in Q3.
5. The company gained Rs 4.55 Cr from foreign exchange gains.
6. EPD division grew 14.5% YoY and 9.3% QoQ.
7. Transportation division declined 8.4% YoY & grew 6.9% QoQ.
8. Media & Communications vertical grew 7.3% QoQ & 24.3% YoY.
9. Healthcare division grew 23.5% QoQ & 34% YoY. Others in EPD grew 4.3% QoQ & 20.1% YoY.
10. IDV grew 27.5% QoQ & 7.1% YoY.
11. Revenue distribution by geography is as follows:
o EU: 36.5%
o Americas: 36%
o India: 13%
o Rest of the World: 14.4%
12. The top 10 customers now account for 47.2% of the total sales while top customer accounted for
11.7% of sales.
13. The company had offshore % at 67.8% in Q3.

www.smartsyncservices.com Page | 166
Click here to Subscribe
on WhatsApp
Investor Conference Call highlights:
1. The constant currency growth in Q3 was 10% QoQ and 7.5% YoY.
2. The management has clarified that the revenues are volume driven and IP revenues have not
shown major growth yet. The major cause for higher revenue productivity is utilization levels
which have gone up for the company.
3. Another reason for increased margins was the growth in the high margin healthcare business.
4. The management expects the onsite ratio to remain at current levels of near 30% and it is not
expected to go back to pre-covid levels of near 50%.
5. The company is not pushing on the semiconductor industry for business and all ongoing work from
this vertical is from legacy customers.
6. The management has admitted that although Japan is an important region for the company, the
decision-making process is very slow there and they tend to insource as much as possible.
Nonetheless, the company is focusing on the medical business in the region.
7. The management views the consolidation of Tata Elxsi as a subsidiary of Tata Sons very favourably
as it will open up new opportunities for the company within the group.
8. The company has started working with a leading EV player in North America in the connectivity
and infotainment domain.
9. The management has clarified that Autoscape launched by TCS is not a competitor for Tata Elxsi
as it is more of a service framework and is a collection of services, capabilities, and some IP that
they have which is applicable to the entire auto industry.
10. While auto-recovery is still underway, the main drivers of growth for the company have been
media & comms and the healthcare verticals.
11. The company has the policy to cover through both options and forward cover for forex hedges.
12. Customer concentration will reduce slowly as the company is onboarding many new customers
who may in the future contribute higher and enter the top 10.
13. As mentioned before, the company will continue to look to expand into adjacent verticals to its
existing verticals to reduce dependence on these verticals and to expand avenues of growth for
the company.
14. The management has mentioned that currently a few of the company’s platforms are firing and
once all of them are up, it will reflect in growth and profitability for the company.
15. According to management, the main differentiator for Tata Elxsi is that it is a very focused
engineering player and is mainly looking to build its edge on design-led initiatives instead of
competitive pricing.
16. The current utilization rate was at 75-76% vs 70% last quarter. The management has stated that
there are still avenues for margin expansion in the future for Tata Elxsi.
17. The management confirms that the company is indeed ingrained in the EV initiatives for both Tata
Motors & JLR.
www.smartsyncservices.com Page | 167
Click here to Subscribe
on WhatsApp
18. The management is not worried about attrition as it is confident in the company’s sourcing of
talent and market reputation.
19. Revenue per engineer has gone up due to higher utilization and the company being able to charge
based on the value that it provides to the customers.
20. The company is actively focussing on sourcing customers and deals with multi-year engagement
rather than one-time projects. Thus most of its recently added customers are in on multi-year
deals.
21. The management is confident that the healthcare business will yield higher margins than other
segments as the company is confident of being able to offer end to end solutions for the industry
while maintaining required levels of compliance to the rigorous regulatory standards for the
industry.
22. The company has around Rs 900 Cr as cash in its books.
23. The management admits that it indeed had to make concessions on pricing due to COVID-19 but
it is not expected to face much pricing pressure as it is not competing on pricing in most of its
projects and is mostly working on the upper end of the industry spectrum.
Analyst Views:
Tata Elxsi had a good quarter with its highest ever quarterly revenues and robust PBT & PAT
growth. The company continues to see good growth in the emerging medical space and the media &
communications space which have been the primary driver of growth in Q3. It has also managed to
improve its offshore ratio and maintain high levels of utilization which has helped boost PBT growth.
The auto segment continues to be subdued due to the COVID-19 situation but is recovering well. The
company has done well to bring in a North American EV player as a customer in Q3. It remains to be
seen how the company’s major clients adapt to the new world transformed after COVID-19 and what
impact it shall have on the company’s performance going forward. Nonetheless, given the company’s
strong technological capabilities and its resilient performance in the last year, Tata Elxsi remains a
good technology stock to watch out for, particularly given the rising demand for its services in the
broadband and media & communications spaces.

www.smartsyncservices.com Page | 168
Click here to Subscribe
on WhatsApp
TRAVEL & HOSPITALITY MHRIL
Financial Results & Highlights
Brief Company Introduction
Club Mahindra Holidays is an Indian travel company founded in 1996. It is a part of the Mahindra
Group and provides holidays on a timeshare basis. Mahindra Holiday & Resorts India Limited (MHRIL)
is a part of the Leisure and Hospitality sector of the Mahindra Group. Vacation ownership is its key
offering and "Club Mahindra" is its flagship brand. MHRIL offers family holidays primarily through
vacation ownership memberships for over a period of 25/10 years. Today The boast a fast growing
customer base of over 235,000 members and 50+ resorts at some of the most exotic locations in both
India and abroad.
Standalone Financials (In Crs)
Q3FY21 Q3FY20 YoY % Q2FY21 QoQ % 9MFY21 9MFY20 YoY%
Sales 246 267 -7.87% 212 16.04% 654 782 -16.37%
PBT 55 39 41.03% 46 19.57% 137 95 44.21%
PAT 41 25 64.00% 34 20.59% 101 61 65.57%
Consolidated Financials (In Crs)
Q3FY21 Q3FY20 YoY % Q2FY21 QoQ % 9MFY21 9MFY20 YoY%
Sales 515 600 -14.17% 511 0.78% 1351 1800 -24.94%
PBT 7 14 -50.00% 41 -82.93% 13 60 -78.33%
PAT -1 2 -150.00% 29 -103.45% -4 27 -114.81%
Detailed Results
1. The quarter was down for the company with a fall in consolidated revenues of 14% YoY while
PBT fell 50% YoY and PAT was at a loss of Rs 0.67 Cr.
2. 9M performance was down with 25% YoY revenue decline and PAT loss of nearly Rs 4 Cr mainly
due to the fall in Q1.
3. The deferred revenue pool was at Rs 5388 Cr.
4. Strong cash position at Rs 848 Cr and receivables were at Rs 1585 Cr.
5. Occupancy was at 75% for Q3. As of 31st Dec 2020, 2 new resorts were added taking the total
room inventory up to 3776 rooms. Resort occupancy was at 85% in Dec.
6. The member additions in Q3 were at 3291. The cumulative member base was at 2,63,952.
7. Digital referral and member engagement rose to an all-time high of 56% in Q3 FY21.
8. The company reduced overall costs by 17% YoY with a major reduction of 13% and 21% in Sales
& Marketing and Other Expenses respectively while rent & employee expenses were down 27%
and 14% respectively.
www.smartsyncservices.com Page | 169
Click here to Subscribe
on WhatsApp
9. The company is continuing with planned Capital investments in two ongoing projects at Goa &
Ashtamudi, Kerala.
10. 9M Standalone EBITDA margin improved 750 bps YoY to 33.8% in Q3.
11. Standalone revenues were down 8% YoY while PBT and PAT rose 41% YoY and 64% YoY
respectively.
12. Revenues for HCRO were down 26% YoY. The unit delivered an operating loss in Q3 of 1.57
million euros and PAT loss of 2.54 million euros.
13. Resort occupancy started falling due to the second wave and went from 71% in Oct to 37% in
Dec.
14. The main drop was in Spa Hotels which saw revenue fall of 40% YoY. HCRO also saw cost savings
of 19% YoY.
15. The company also had a forex loss of Rs 7.05 Cr in Q3.
16. Consolidated EBITDA margin improved 300 bps YoY to 19.6% in Q3.
Investors conference call Highlights
1. The management has stated that the focus on acquiring members with higher down payment
continues.
2. The company has also launched the ‘Travel with Confidence’ campaign in Q3 where it offers
members discounted COVID tests, travel, and COVID insurance, special discounts for renting a
car from Mahindra First Choice Wheels alliance along with sanitizing the car.
3. The company has introduced new resort experiences and thematic evenings to ensure physical
distancing and has also re-engineered menus with in-room dining services.
4. The company has also completed the stake purchase of 6.67% in Great Rocksport.
5. The company also added a new resort in Jaipur. This facility has been leased and operated by
MHRIL.
6. The sales of the 25-year product have been coming back to normal levels in Q3 and the product
mix is shifting more towards the long end.
7. Digital marketing and adoption have indeed risen fast in FY21 and the high referral % has helped
keep the cost of customer acquisition low for the company.
8. There was indeed a dip in the deferred revenue pool in YTD FY21 as a large number of member
additions in the first 6 months were in lower tenured products. But this situation was abnormal
and has seen reversal already in Q3.
9. The management has refrained from providing any specific guidance but has stated that
member additions and resort occupancy trends are expected to continue at current momentum.
10. The management expects the situation in HCRO to improve in the next quarter when the second
wave subsides and businesses start opening up as usual.
11. The management expects HCRO to bounce back fast in FY22 once things normalize.
12. On a broad level, the management is looking to utilize the cash in books to fund room inventory
expansion in the next 3-4 years through greenfield, brownfield, and expansion through
acquisition. The plan is to add roughly 1500+ rooms for Rs 1200 Cr.
13. The management remains confident of retaining HCRO and its prospects in the future despite
the Mahindra Group’s announcement that it will be looking to exit low ROI and low profitable
businesses.
14. The management expects the Finland business to start its resurgence in FY22 and make a full
turnaround in the next 2-3 years.
www.smartsyncservices.com Page | 170
Click here to Subscribe
on WhatsApp
15. The management has clarified that a member cannot start holidaying till full payment has been
received and thus no issues arise in case of a member default as no services have been rendered
at that point.
Analyst’s View
MHRIL is the leading vacation ownership company in India. It has a unique business model where the
company funds its Capex from customer’s advance money. Because of this model, they are in a much
better position against other hotels in terms of Balance Sheet strength. The company saw a good
standalone performance in India with resort occupancy rising to 85% in Dec. the company is also
seeing the long duration products come back to normalcy and product mix shifting towards the long
end. It has a big cash chest of above Rs 800 Cr which it plans to utilize to expand room inventory in
the next 3-4 years. On the other hand, HCRO has seen performance fall due to the second wave coming
back to Europe. But the management remains confident of HCRO’s prospects in the near future. Even
though travel and tourism is a sector that seems to take a long time to recover and come back to
normalcy, MHRIL is utilizing its firepower (read Balance Sheet strength) to continue its expansion plans
in Goa and other sites. It remains to be seen how long will it take for sentiments to normalize in the
travel sector and whether the company will be able to capitalize on its resilient balance sheet and cash
reserves to make any aggressive moves on Capex. Nonetheless, given the company’s resilient model
and the current valuation is not too far from its replacement cost, MHRIL can turn out to be a pivotal
travel sector stock in the times ahead.
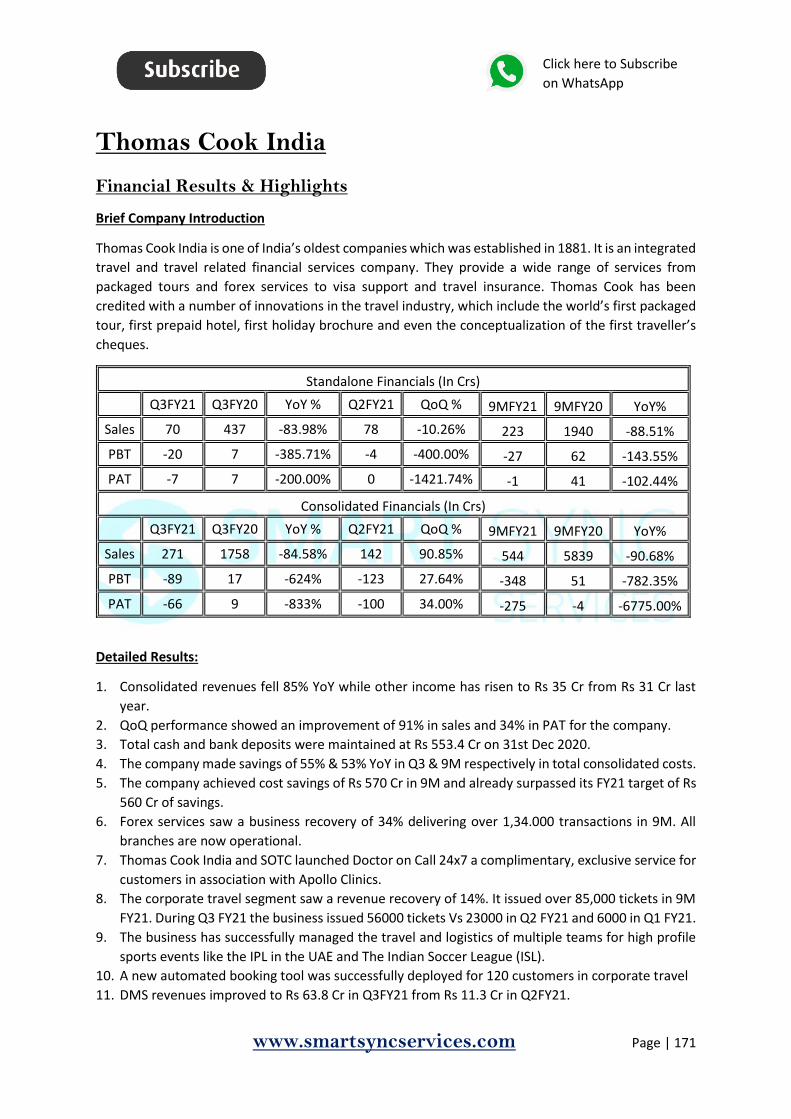
www.smartsyncservices.com Page | 171
Click here to Subscribe
on WhatsApp
Thomas Cook India
Financial Results & Highlights
Brief Company Introduction
Thomas Cook India is one of India’s oldest companies which was established in 1881. It is an integrated
travel and travel related financial services company. They provide a wide range of services from
packaged tours and forex services to visa support and travel insurance. Thomas Cook has been
credited with a number of innovations in the travel industry, which include the world’s first packaged
tour, first prepaid hotel, first holiday brochure and even the conceptualization of the first traveller’s
cheques.
Standalone Financials (In Crs)
Q3FY21 Q3FY20 YoY % Q2FY21 QoQ % 9MFY21 9MFY20 YoY%
Sales 70 437 -83.98% 78 -10.26% 223 1940 -88.51%
PBT -20 7 -385.71% -4 -400.00% -27 62 -143.55%
PAT -7 7 -200.00% 0 -1421.74% -1 41 -102.44%
Consolidated Financials (In Crs)
Q3FY21 Q3FY20 YoY % Q2FY21 QoQ % 9MFY21 9MFY20 YoY%
Sales 271 1758 -84.58% 142 90.85% 544 5839 -90.68%
PBT -89 17 -624% -123 27.64% -348 51 -782.35%
PAT -66 9 -833% -100 34.00% -275 -4 -6775.00%
Detailed Results:
1. Consolidated revenues fell 85% YoY while other income has risen to Rs 35 Cr from Rs 31 Cr last
year.
2. QoQ performance showed an improvement of 91% in sales and 34% in PAT for the company.
3. Total cash and bank deposits were maintained at Rs 553.4 Cr on 31st Dec 2020.
4. The company made savings of 55% & 53% YoY in Q3 & 9M respectively in total consolidated costs.
5. The company achieved cost savings of Rs 570 Cr in 9M and already surpassed its FY21 target of Rs
560 Cr of savings.
6. Forex services saw a business recovery of 34% delivering over 1,34.000 transactions in 9M. All
branches are now operational.
7. Thomas Cook India and SOTC launched Doctor on Call 24x7 a complimentary, exclusive service for
customers in association with Apollo Clinics.
8. The corporate travel segment saw a revenue recovery of 14%. It issued over 85,000 tickets in 9M
FY21. During Q3 FY21 the business issued 56000 tickets Vs 23000 in Q2 FY21 and 6000 in Q1 FY21.
9. The business has successfully managed the travel and logistics of multiple teams for high profile
sports events like the IPL in the UAE and The Indian Soccer League (ISL).
10. A new automated booking tool was successfully deployed for 120 customers in corporate travel
11. DMS revenues improved to Rs 63.8 Cr in Q3FY21 from Rs 11.3 Cr in Q2FY21.
www.smartsyncservices.com Page | 172
Click here to Subscribe
on WhatsApp
12. DEI saw revenues of Rs 64.8 Cr vs Rs 37.4 Cr last quarter. EBIT losses reduced to Rs 7.7 Cr in Q3
from Rs 11.1 Cr in the last quarter.
13. DEI has acquired 4 new customers which include Dubai Parks and Resorts, Dubai Safari Park,
Global Village, and The National Aquarium in Abu Dhabi.
14. The segment performance in Q3FY21 is as follows:
a. Financial Services: Down 66% YoY
b. Travel & Related Services: Down 93% YoY
c. VO & Resorts: Down 32% YoY
d. Digiphoto: Down 62% YoY
15. The segment performance in 9MFY21 is as follows:
a) Financial Services: Down 65% YoY
b) Travel & Related Services: Down 96% YoY
c) VO & Resorts: Down 58% YoY
d) Digiphoto: Down 74% YoY
16. Sterling saw 637 net member additions in Q3 and 897 additions in 9M. ARR rose to Rs 4524 in Q3
vs Rs 3600 in Q2 and 4358 in 9M. Resort occupancy improved to 40% in Q3 vs 20% in Q2 and 34%
in 9M.
17. Net revenues from Sterling were at Rs 51.1 Cr in Q3 and 86.4 Cr in 9M.
Analyst’s View:
Thomas Cook is the biggest travel company in India in terms of reach. They have been innovators in
the sector for more than a century now. The company is going through the toughest of times with the
travel industry being hit hard due to COVID-19. The management is doing well to use this period of
slow operations to focus internally and improve the cost structure which has resulted in them already
achieving their cost savings target for FY21 in 9M period. The company has taken encouraging actions
for DEI like winning various commitments for large tourist attractions in the Middle East like Dubai
Safari Park which should help expand this business line once normal tourist activity resumes. It is also
continuing to bring back its other businesses to normal levels and has been constantly innovating and
adding new services like automated travel booking for corporate clients. It remains to be seen how
long it will take for things to normalize for the travel industry and how consumer behaviour will evolve
from COVID-19. Nonetheless, given the company’s resilient balance sheet and the management’s
focus on improving the internals of the company and focusing on new avenues for the industry,
Thomas Cook seems to be a resilient travel industry stock in an industry plagued with shutdowns and
bankruptcies these days.
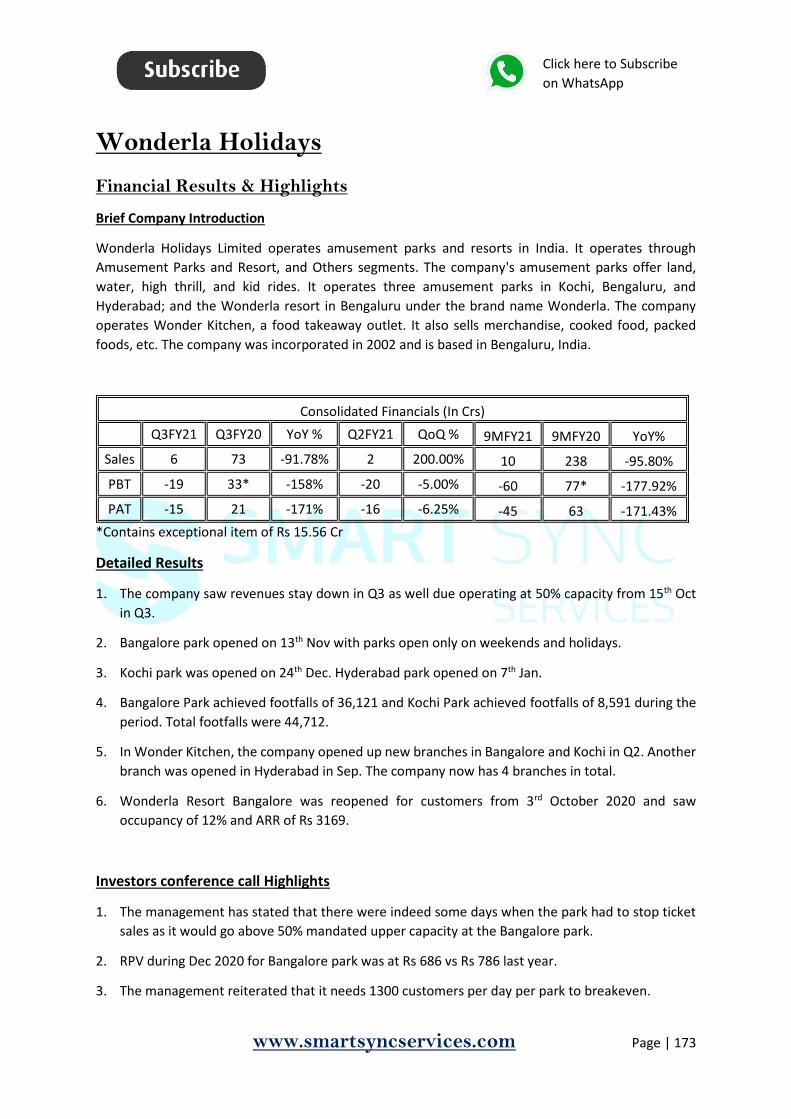
www.smartsyncservices.com Page | 173
Click here to Subscribe
on WhatsApp
Wonderla Holidays
Financial Results & Highlights
Brief Company Introduction
Wonderla Holidays Limited operates amusement parks and resorts in India. It operates through
Amusement Parks and Resort, and Others segments. The company's amusement parks offer land,
water, high thrill, and kid rides. It operates three amusement parks in Kochi, Bengaluru, and
Hyderabad; and the Wonderla resort in Bengaluru under the brand name Wonderla. The company
operates Wonder Kitchen, a food takeaway outlet. It also sells merchandise, cooked food, packed
foods, etc. The company was incorporated in 2002 and is based in Bengaluru, India.
Consolidated Financials (In Crs)
Q3FY21 Q3FY20 YoY % Q2FY21 QoQ % 9MFY21 9MFY20 YoY%
Sales 6 73 -91.78% 2 200.00% 10 238 -95.80%
PBT -19 33* -158% -20 -5.00% -60 77* -177.92%
PAT -15 21 -171% -16 -6.25% -45 63 -171.43%
*Contains exceptional item of Rs 15.56 Cr
Detailed Results
1. The company saw revenues stay down in Q3 as well due operating at 50% capacity from 15th Oct
in Q3.
2. Bangalore park opened on 13th Nov with parks open only on weekends and holidays.
3. Kochi park was opened on 24th Dec. Hyderabad park opened on 7th Jan.
4. Bangalore Park achieved footfalls of 36,121 and Kochi Park achieved footfalls of 8,591 during the
period. Total footfalls were 44,712.
5. In Wonder Kitchen, the company opened up new branches in Bangalore and Kochi in Q2. Another
branch was opened in Hyderabad in Sep. The company now has 4 branches in total.
6. Wonderla Resort Bangalore was reopened for customers from 3rd October 2020 and saw
occupancy of 12% and ARR of Rs 3169.
Investors conference call Highlights
1. The management has stated that there were indeed some days when the park had to stop ticket
sales as it would go above 50% mandated upper capacity at the Bangalore park.
2. RPV during Dec 2020 for Bangalore park was at Rs 686 vs Rs 786 last year.
3. The management reiterated that it needs 1300 customers per day per park to breakeven.

www.smartsyncservices.com Page | 174
Click here to Subscribe
on WhatsApp
4. The cash loss during 9M period is Rs 35 Cr. Cash levels as of 31st Dec 2020 stands at Rs 89 Cr.
5. The management is optimistic of becoming cash breakeven soon. It is slowly progressing to staying
open from Wednesday to Sunday from Feb onwards and may decide on March on whether to
remain open all days.
6. The parks have seen visitors numbering 4000-5000 at max on weekends while on weekdays the
max number is around 1000.
7. The management is confident of operating at 100% capacity once the regulatory cap is lifted but
it expects this cap to stay in place for a while till vaccination drives succeed and COVID-19 cases
don’t resurface.
8. The situation in Chennai is still the same as last quarter and the negotiations on tax benefits have
been put on hold due to local elections there.
9. The company is not planning to expand the use of its open space for weddings as it doesn't fit well
with the target audience.
10. The company had been paying employees 50% of salary when parks were closed. Now they are
paying 75% of salary and will slowly come back to 100% as it starts to stay open more days of the
week.
11. The company is postponing all new expansions and is focusing on opening up existing parks to the
full currently.
12. The management is confident of biding its time and roughing out the tough times better than its
competitors due to its robust balance sheet and good operations.
13. Wonder Kitchen is still not profitable and is doing sales of Rs 6-7 Lacs per month in Q3 in Kochi.
14. The management doesn’t expect the Wonder Kitchen vertical to breakeven in Q4 as well.
15. Once all parks are open, the company expects monthly expenses run rate of Rs 9-9.5 Cr.
16. The management is not looking at any means of raising cash as it still has enough cash on books.
Analyst’s View
Wonderla Holidays is India’s leading amusement park operator. This business has strong entry barriers
because of high Capex and long gestation cycle. Wonderla has been able to manage its operations well
over the years and create a niche space for itself. The Quarter was subdued for Wonderla mainly due
to the selective opening and the visitor caps imposed on the parks. The business for the first half of
the year was fully impacted by nil operating revenue from park operations. In the meantime, the
company has focused on cost-cutting measures and getting expanding the open days of the week. It
has also put all expansion plans on hold and is focusing solely on improving existing park operations
to their previous levels. The company now has 3 parks open in Bangalore, Hyderabad and Kochi and
needs 1300 visitors per day per park to breakeven. It remains to be seen how much time it will take
for normalcy to come back in their business. However, Wonderla has the resilience of the balance
sheet to survive through these tough times and also the potential to positively surprise once all the
parks are opened and the footfall comes to pre-COVID level.