Information dissemination framework for context-aware products
Upload
independentCategory
view
4download
0
Sprinkler: A Reliable and Energy Efficient Data DisseminationService for Wireless Embedded Devices∗
Vinayak [email protected]
Anish [email protected]
Prasun [email protected]
Hongwei [email protected]
Department of Computer Science and EngineeringThe Ohio State University
Columbus, OH-43210
Abstract
We present Sprinkler, a reliable data dissemina-tion service for wireless embedded devices whichare constrained in energy, processing speed, andmemory. Sprinkler embeds a virtual grid over thenetwork whereby it can locally compute a con-nected dominating set of the devices to avoid re-dundant transmissions ,and a transmission sched-ule to avoid collisions. Sprinkler transmits O(1)times the optimum number of packets in O(1) of theoptimum latency; its time complexity is O(1). Thus,Sprinkler is suitable for resource-constrained wire-less embedded devices.
We evaluate the performance of Sprinkler interms of the number of packet transmissions andthe latency, both in an outdoor and an indoor en-vironment. Our indoor evaluation is based on animplementation in the Kansei testbed, that houses210 XSSs whose transmission power is controllableto even low ranges. We compare Sprinkler with theexisting reliable data dissemination services, an-alytically or using simulations also. Our evalua-
∗This work was sponsored by DARPA NEST contract OSU-RF program F33615-01-C-1901 and by the National ScienceFoundation under Grant No. 0341703. Intel sponsored 225 star-gates.
tions show that Sprinkler is not only energy effi-cient as compared to existing schemes but also haveless latency. Further, the energy consumption ofnodes and the latency grows linearly as a functionof newly added nodes as network grows larger.
1. Introduction
Reprogramming in the field has emerged as anecessary primitive for wireless devices. There aremany reasons for this, for instance – resulting froman incomplete knowledge of the deployment envi-ronment, planned phases of operation that are in-strumented only at runtime or evolution of the oper-ational requirements. Reprogramming necessitatesa data dissemination service that is fully reliable,since a program must be delivered in entirety. Fur-ther, reprogramming must utilize minimum energyso that the lifetime of the network is maximized. Inthe context of reprogramming, message transmis-sion is an energy expensive operation, as shown inTable 1. Another factor is the number of opera-tions for the microprocessor. Hence, reducing thenumber of transmissions and the amount of compu-tation are both important goals in addition to relia-

bility.The problem of reliable data dissemination is
widely studied, even in the context of wireless em-bedded devices. The optimization criteria for oneclass of well-known existing schemes – viz. Del-uge [8], Infuse [4], MNP [10], and PSFQ [14] – arereliability and latency, in that order. Even thoughsome of these schemes do instrument sender sup-pression techniques, these techniques do not effec-tively minimize the number of senders and hencethe number of packet transmissions. The criteriafor Sprinkler are reliability, energy, and latency – inthat order. To reduce energy consumption, Sprin-kler computes a subset of nodes as senders. Thesubset is connected and every node in the networkhas a neighbor in the subset. The problem of se-lecting minimum number of senders is computinga minimum connected dominating set (MCDS) ofthe graph induced by the wireless network, which isknown to be NP-hard even for a unit disk graph [5].As a part of Sprinkler, we provide a low complex-ity CDS algorithm, which is suitable for embeddeddevices.
Operation Current DrawMote Stargate
Microprocessor and 8mA 330 mAIdle Radio
Packet Reception 16mA 610 mAPacket Transmission 24mA 980 mA
Table 1. Energy required by commonoperations
The CDS nodes broadcast messages instead ofunicasting to reduce the number of transmissions.But broadcast messages can collide due to thehidden terminal effect. Sprinkler avoids hiddenterminals by using Time Division Multiple Ac-cess (TDMA). The number of TDMA slots deter-mine the latency of a reprogramming operation.The problem of computing a TDMA schedule thatavoids hidden terminals with a minimum number ofslots in a unit disk graph is equivalent to computinga D-2 vertex coloring [9]. Intuitively, the reasonbehind distance two is that two non-neighboring
nodes u and v interfere with each other if there exista node w such that there are edges (u, w) and (w, v)in the unit disk graph. We provide a D-2 vertex col-oring algorithm, of low complexity, which is suit-able for embedded devices (henceforth, we use theterms TDMA and D-2 vertex coloring interchange-ably). In practice, node w may or may not interferewith node u depending upon the distance betweenv and w. Therefore a D-k vertex coloring, wherek is a real number greater than 1 and less than 2,would suffice.
The time complexities of the state-of-the-artCDS construction and D-2 vertex coloring algo-rithms and the number of message transmissionsare functions of the number of nodes [13]. Hence,the existing algorithms are not scalable for ex-tremely large networks, such as those in projectExScal [3]. ExScal consisted of 1000 extreme scal-ing motes (XSMs) [6] and 203 XSSs. Such ex-treme scale networks demand local algorithms ofconstant time complexities. The networks in ExS-cal were used for intruder detection, classification,and tracking. One of the services required for thisclass of application is a localization service whichinforms location to each node. Further, to guaran-tee sensor coverage, the underlying networks aredense. We use these two characteristics, viz. avail-ability of location service and density of networks,to derive local CDS and D-2 coloring algorithms oflow time complexities.
1.1. Our Contributions
• Sprinkler effectively reduces the number ofsenders to a constant factor of the minimumusing a local algorithm of time complexityO(1) for constructing a CDS. A performanceratio of a CDS construction algorithm is themaximum ratio of the cardinality of com-puted CDS for a graph G over that MCDSof G. The performance ratio of our algo-rithm is 18 2
3 . The state-of-the-art distributedCDS algorithm, with constant performance ra-tio, have O(∆ log2 n) time complexity, where∆ is the maximum degree in the network andn is the number of nodes in the network [13].

• Sprinkler effectively manages the latency bycomputing a near optimal schedule using a lo-cal D-2 coloring algorithm of time complexityO(1) for the above calculated CDS. A perfor-mance ratio of a D-2 vertex coloring algorithmis the maximum ratio of the number of com-puted colors for a graph G over the minimumnumber of D-2 colors for G. The performanceratio of our algorithm is 2 2
3 . The stat-of-the-art distributed D-2 coloring algorithm, withconstant performance ratio, have time com-plexity O(∆ log2 n) [13]. Further, both theexisting algorithms are randomized whereasours are deterministic. The locality and con-stant time complexity of our algorithms makeSprinkler scalable. A TDMA schedule withfew slots results in low latency.
• The number of packet transmissions is uni-formly distributed among all the transmit-ters. This helps in load-balancing across thenetwork. Further, the latency is also uni-formly distributed among all the receiverswhich means that all the nodes receive a newprogram at uniformly distributed intervals.
• The number of packet transmissions and thelatency scale as a linear function of newlyadded nodes. Further, for a given network ifwe increase the density of nodes without in-creasing the hop counts, then the number ofpacket transmissions and latency remain ap-proximately the same.
In a nutshell, we divide the problem of reliabledata dissemination problem into three subproblems– CDS construction, D-2 vertex coloring, and a pro-tocol to reliably disseminate data using a CDS anda TDMA schedule. Each of these subproblems issolved separately to yield our reliable data dissem-ination service.
1.2. Organization of the paper
We present the system model in Section 2, thenin Section 3, we recall and extend some concepts
in graph theory. Following that, we describe our al-gorithms for CDS construction and D-2 vertex col-oring in Section 4. In Section 5, we present ourdata dissemination protocol Sprinkler. We adaptSprinkler to a high-fidelity radio model and eval-uate the scalability of Sprinkler in Section 6 . Thenwe compare the performance of Sprinkler with ex-isting schemes. Finally, we discuss related work inSection 8, and we summarize our findings in Sec-tion 9.
2. System Model
We consider wireless devices which are con-strained in energy and processing. The examplesinclude mote and stargate. The devices are embed-ded in a plane. Let n be the number of devices.In steady state, the devices are static. Each deviceknows its location. The location information can beprovided using a localization service.
R is the reliable communication radius of thedevice. Let p(x) be the packet delivery rate at dis-tance x from a sender and P be the maximum valueof p for any x. Let A be the set of distances at whichpacket delivery rate is equal to P . Then, R is themaximum distance in A. Intuitively, R is the maxi-mum distance over the set of distances at which thepacket delivery rate is maximum. We use unit diskradio model for analytical evaluation of Sprinklerand probabilistic radio model for experiments andsimulations.
The density of the nodes is such that if we dividethe plane into a virtual grid of equal sized squareswhere (a) each square has at least one node and (b)a node is able to communicate to all the nodes ineach of the four adjoining squares. Formally, ourdensity assumption is:
If R is the reliable communication radiusof the device, then every square of lengthR/√
5 contains at least one device.
3. Preliminaries
Consider a set of n equal-sized circles in a plane.The intersection graph of these circles is an n-

vertex graph; each vertex corresponds to a circle,and an edge appears between two vertices when thecorresponding circles intersect. Such intersectiongraphs are called unit disk graphs [5]. A dominat-ing set (DS) of a graph G = (V,E) is a subset V ′
of V such that every vertex v ∈ V is either in V ′
or adjacent to some member of V ′. A dominatingset is connected (CDS) if the subgraph induced byit is connected. A minimum connected dominat-ing set (MCDS) is a connected dominating set ofminimum cardinality [5]. Let G(V,E) be an undi-rected graph. A distance-2 vertex (D-2) coloringof a graph is a mapping f : V → {1, ..., k} suchthat f(u) 6= f(v) whenever there is a path consist-ing of at most two edges between u and v in G TheD-2 coloring problem is equivalent to the standardminimum vertex coloring on G2, where G2 has thesame vertex set as G and there is an edge betweentwo vertices of G2 if and only if there is a path oflength at most 2 between the vertices in G [9].
(i,j-1)
(i-1,j)
(i+1,j)
(i,j+1)(i,j)
Figure 1. A Bi-dimensional Grid B(1)
A bi-dimensional grid B(1) of size r × c has rrows and c columns, indexed respectively from 0 tor − 1 (from top to bottom) and from 0 to c − 1(from left to right), with r ≥ 1 and c ≥ 1. Ageneric vertex u of B will be denoted by u = (i, j),where i is its row index and j is its column index.Each vertex has degree equal to 4, except for thevertices on the borders. In particular, each vertex(i, j), which does not belong to the grid borders, isadjacent to the vertices (i−1, j), (i, j+1), (i+1, j),and (i, j − 1) as shown in Figure 1. B(k) is a bi-dimensional grid such that each vertex (i, j) is ad-jacent to all the vertices (i′, j′) where the euclideandistance between (i, j) and (i′, j′) is not more thank.
4. Algorithms to Compute CDS and D-2Vertex Coloring
4.1. CDS Computation
r mod 3 ≡ 0 r mod 3 ≡ 1
r mod 3 ≡ 2
… …
…
Figure 2. CDS of Bi-dimensional GridB(1)
Given a wireless network, let G = (V,E) be itscorresponding unit disk graph. We assume that G isenclosed in the smallest rectangular area of lengthr(R′/
√5) and breadth c(R′/
√5), where r,c are
positive integers, 3 ≤ r ≤ c, and R′ = R. If r > c,then they can be exchanged. Further, the rectan-gle is divided into square-shaped clusters of lengthR′/
√5 and one node is selected from each cluster
as a cluster-head. Only the cluster-head nodes areused to construct a CDS M . At the end of this sec-tion, we discuss the case where such clustering isnot available.
A node u(i, j) ∈ M , where 0 ≤ i ≤ r − 1 and0 ≤ j ≤ c− 1, if
• r mod 3 ≡ 0 : [i mod 3 ≡ 1] ∨ [(i mod 3 6≡1) ∧ (0 < i < r − 1) ∧ (j = 0)]
• r mod 3 ≡ 1 : [i mod 3 ≡ 0] ∨ [(i mod 3 6≡0) ∧ (j = 0)]
• r mod 3 ≡ 2 : [i mod 3 ≡ 1] ∨ [(i mod 3 6≡1) ∧ (i 6≡ 0) ∧ (j = 0)]
Figure 2 illustrates M for various cases of r.Figure 3 illustrates an application the above men-tioned algorithm for a network of randomly dis-tributed nodes. The circles represent nodes, gray
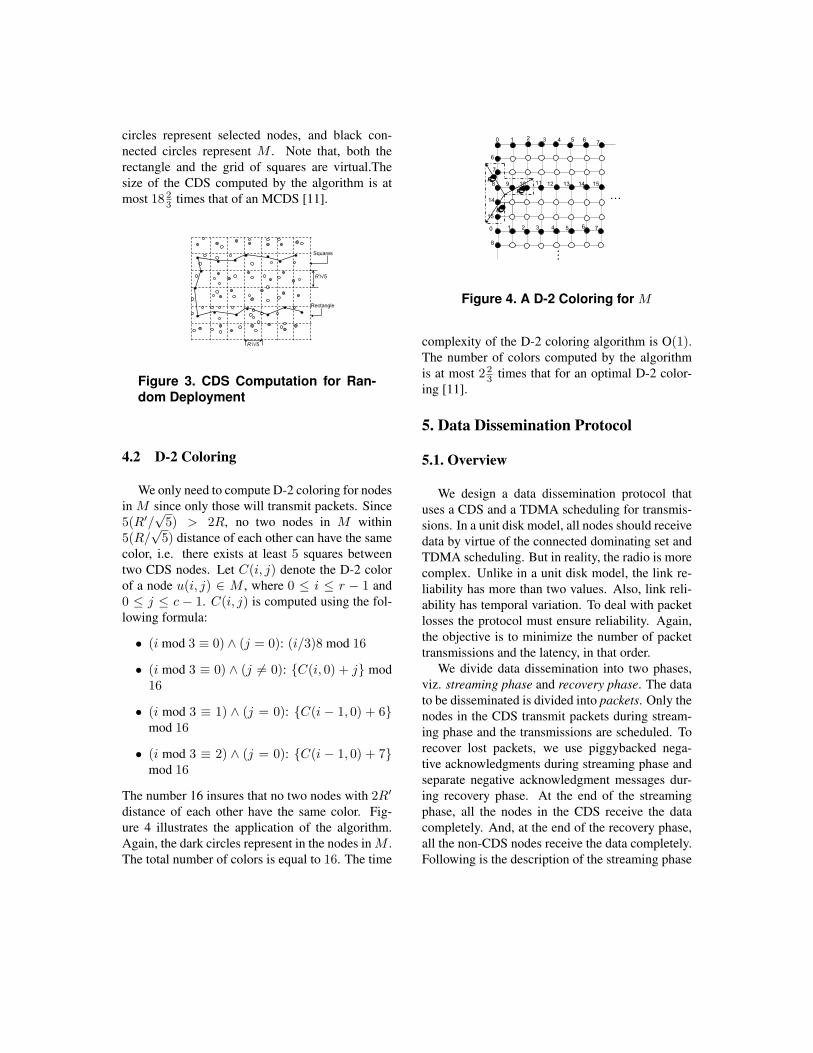
circles represent selected nodes, and black con-nected circles represent M . Note that, both therectangle and the grid of squares are virtual.Thesize of the CDS computed by the algorithm is atmost 18 2
3 times that of an MCDS [11].
R’/√5
R’/√5
Rectangle
Squares
Figure 3. CDS Computation for Ran-dom Deployment
4.2 D-2 Coloring
We only need to compute D-2 coloring for nodesin M since only those will transmit packets. Since5(R′/
√5) > 2R, no two nodes in M within
5(R/√
5) distance of each other can have the samecolor, i.e. there exists at least 5 squares betweentwo CDS nodes. Let C(i, j) denote the D-2 colorof a node u(i, j) ∈ M , where 0 ≤ i ≤ r − 1 and0 ≤ j ≤ c − 1. C(i, j) is computed using the fol-lowing formula:
• (i mod 3 ≡ 0) ∧ (j = 0): (i/3)8 mod 16
• (i mod 3 ≡ 0) ∧ (j 6= 0): {C(i, 0) + j} mod16
• (i mod 3 ≡ 1) ∧ (j = 0): {C(i − 1, 0) + 6}mod 16
• (i mod 3 ≡ 2) ∧ (j = 0): {C(i − 1, 0) + 7}mod 16
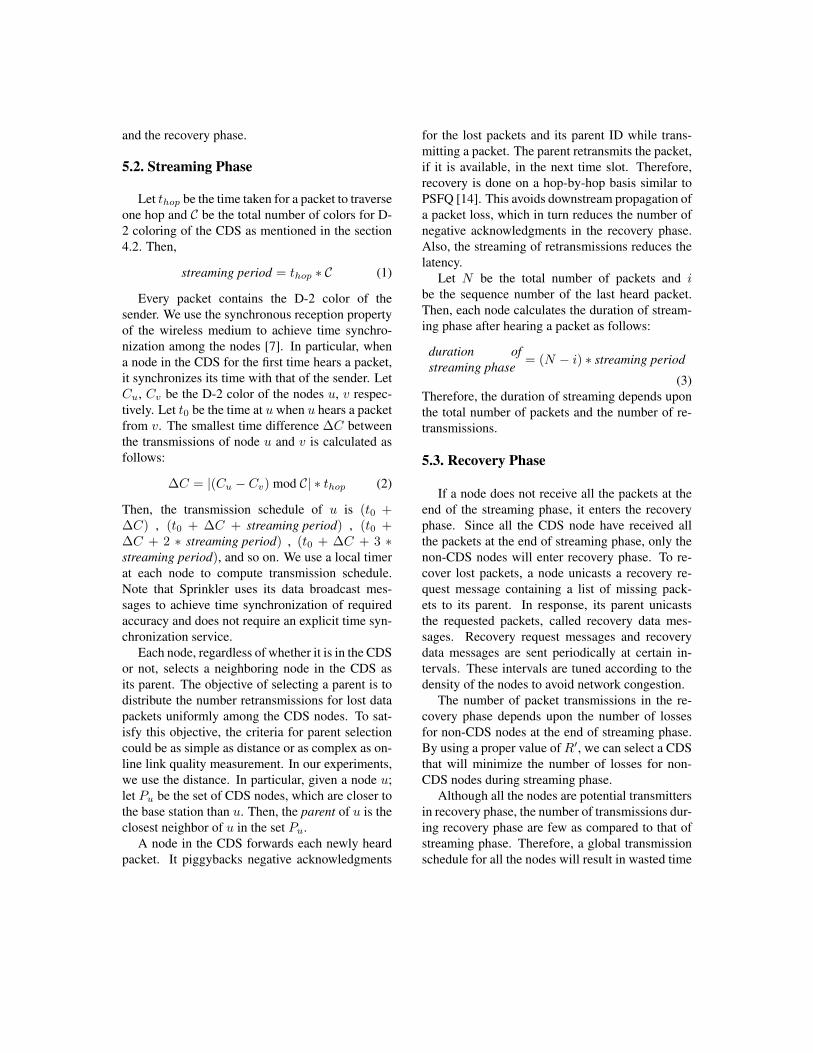
The number 16 insures that no two nodes with 2R′
distance of each other have the same color. Fig-ure 4 illustrates the application of the algorithm.Again, the dark circles represent in the nodes in M .The total number of colors is equal to 16. The time
0 1 2 3 4 5
6
7
8
1 2 3
9 10
4 50
8
6
11 12 13 14
14
15
6 7
7
15
…
…
R′
R′
R′
Figure 4. A D-2 Coloring for M
complexity of the D-2 coloring algorithm is O(1).The number of colors computed by the algorithmis at most 2 2
3 times that for an optimal D-2 color-ing [11].
5. Data Dissemination Protocol
5.1. Overview
We design a data dissemination protocol thatuses a CDS and a TDMA scheduling for transmis-sions. In a unit disk model, all nodes should receivedata by virtue of the connected dominating set andTDMA scheduling. But in reality, the radio is morecomplex. Unlike in a unit disk model, the link re-liability has more than two values. Also, link reli-ability has temporal variation. To deal with packetlosses the protocol must ensure reliability. Again,the objective is to minimize the number of packettransmissions and the latency, in that order.
We divide data dissemination into two phases,viz. streaming phase and recovery phase. The datato be disseminated is divided into packets. Only thenodes in the CDS transmit packets during stream-ing phase and the transmissions are scheduled. Torecover lost packets, we use piggybacked nega-tive acknowledgments during streaming phase andseparate negative acknowledgment messages dur-ing recovery phase. At the end of the streamingphase, all the nodes in the CDS receive the datacompletely. And, at the end of the recovery phase,all the non-CDS nodes receive the data completely.Following is the description of the streaming phase
and the recovery phase.
5.2. Streaming Phase
Let thop be the time taken for a packet to traverseone hop and C be the total number of colors for D-2 coloring of the CDS as mentioned in the section4.2. Then,
streaming period = thop ∗ C (1)
Every packet contains the D-2 color of thesender. We use the synchronous reception propertyof the wireless medium to achieve time synchro-nization among the nodes [7]. In particular, whena node in the CDS for the first time hears a packet,it synchronizes its time with that of the sender. LetCu, Cv be the D-2 color of the nodes u, v respec-tively. Let t0 be the time at u when u hears a packetfrom v. The smallest time difference ∆C betweenthe transmissions of node u and v is calculated asfollows:
∆C = |(Cu − Cv) mod C| ∗ thop (2)
Then, the transmission schedule of u is (t0 +∆C) , (t0 + ∆C + streaming period) , (t0 +∆C + 2 ∗ streaming period) , (t0 + ∆C + 3 ∗streaming period), and so on. We use a local timerat each node to compute transmission schedule.Note that Sprinkler uses its data broadcast mes-sages to achieve time synchronization of requiredaccuracy and does not require an explicit time syn-chronization service.
Each node, regardless of whether it is in the CDSor not, selects a neighboring node in the CDS asits parent. The objective of selecting a parent is todistribute the number retransmissions for lost datapackets uniformly among the CDS nodes. To sat-isfy this objective, the criteria for parent selectioncould be as simple as distance or as complex as on-line link quality measurement. In our experiments,we use the distance. In particular, given a node u;let Pu be the set of CDS nodes, which are closer tothe base station than u. Then, the parent of u is theclosest neighbor of u in the set Pu.
A node in the CDS forwards each newly heardpacket. It piggybacks negative acknowledgments
for the lost packets and its parent ID while trans-mitting a packet. The parent retransmits the packet,if it is available, in the next time slot. Therefore,recovery is done on a hop-by-hop basis similar toPSFQ [14]. This avoids downstream propagation ofa packet loss, which in turn reduces the number ofnegative acknowledgments in the recovery phase.Also, the streaming of retransmissions reduces thelatency.
Let N be the total number of packets and ibe the sequence number of the last heard packet.Then, each node calculates the duration of stream-ing phase after hearing a packet as follows:
duration ofstreaming phase = (N − i) ∗ streaming period
(3)Therefore, the duration of streaming depends uponthe total number of packets and the number of re-transmissions.
5.3. Recovery Phase
If a node does not receive all the packets at theend of the streaming phase, it enters the recoveryphase. Since all the CDS node have received allthe packets at the end of streaming phase, only thenon-CDS nodes will enter recovery phase. To re-cover lost packets, a node unicasts a recovery re-quest message containing a list of missing pack-ets to its parent. In response, its parent unicaststhe requested packets, called recovery data mes-sages. Recovery request messages and recoverydata messages are sent periodically at certain in-tervals. These intervals are tuned according to thedensity of the nodes to avoid network congestion.
The number of packet transmissions in the re-covery phase depends upon the number of lossesfor non-CDS nodes at the end of streaming phase.By using a proper value of R′, we can select a CDSthat will minimize the number of losses for non-CDS nodes during streaming phase.
Although all the nodes are potential transmittersin recovery phase, the number of transmissions dur-ing recovery phase are few as compared to that ofstreaming phase. Therefore, a global transmissionschedule for all the nodes will result in wasted time
slots. Instead, we use link level unicast primitivewhich uses RTS-CTS-DATA-ACK mechanism forcoordination to reliably transmit packets during re-covery phase.
6. Scalability of Sprinkler
6.1. Adapting Reliable Transmission Radius
The radio model in practice is more complexthan a unit disk model.Commonly used practical ra-dio models are two ray ground model and shadowmodel. Computing a CDS under these models iscomplex as compared to that of unit disk model. Inthis section, we present an adaptation of Sprinklerto practical radio model.
Theorem 1 Given a graph G, if there exist at leastone node in every square of length x in a rectangleenclosing G then there also exist a at least one nodein every square of length y > x in that rectangle.
Proof Since y > x, every square of length y en-closes at least one square of length x. Hence, therealso exist a at least one node in every square oflength y.
6.2. Network Setup
We use Kansei [12], the testbed of stargatesequipped with IEEE 802.11b ad hoc network, forour experiments. Kansei provides an option to at-tenuate transmission power to attain required powerlevel. We use a network of 49 nodes arranged uni-formly in a grid of area 7 × 7 at a separation of0.91m. The node at a corner is the base station.The number of data packets to be disseminated isequal to 240. The location is provided to each nodeusing a localization service. According to the def-inition of R in section 2, the value of R in Kanseiis equal to 0.91m. Sprinkler adapts R′ to a valueof 1.83m using the procedure mentioned in section6.1.
6.3. Analysis
We measure the performance of Sprinkler as afunction of the number of nodes in the network.
We consider two types of distribution; viz. constantdensity and increasing density. In case of constantdensity, we add nodes without changing the num-ber of nodes per a square of length R′/
√5. And in
case of increasing density, we add equal number ofnodes to all the existing squares of length R′/
√5.
Let packet tx denote packet transmisions.
#packet tx = #packets ∗ |CDS| (4)
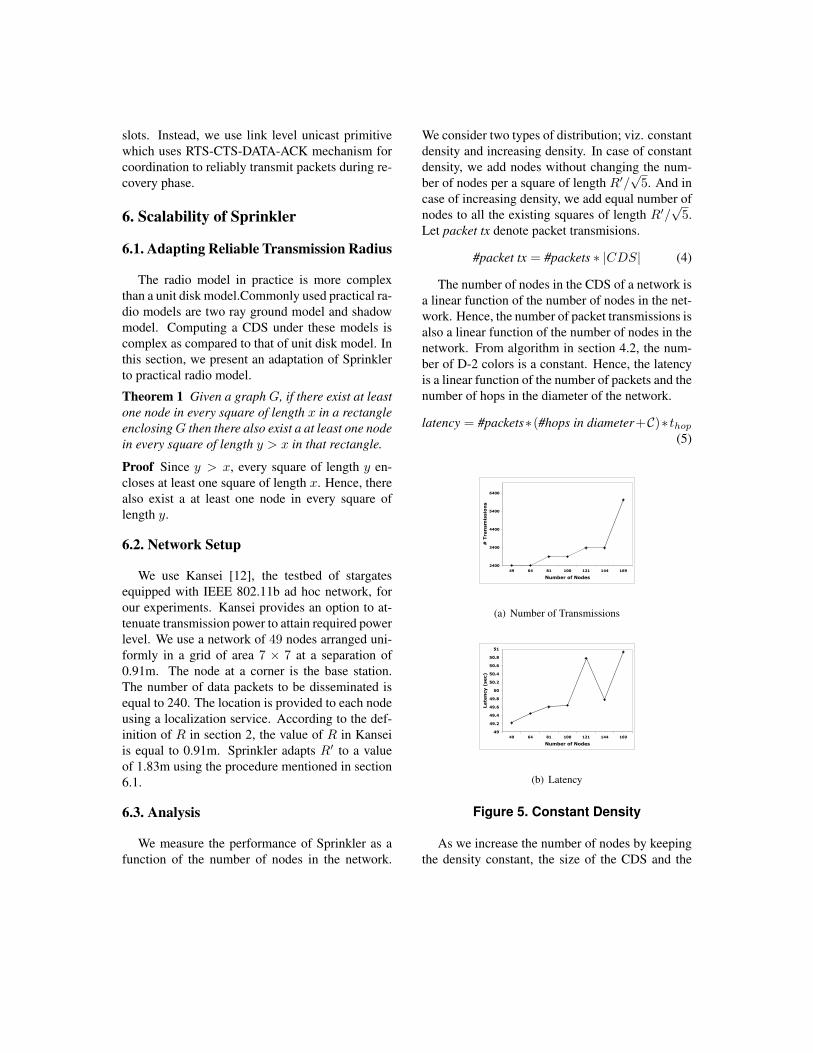
The number of nodes in the CDS of a network isa linear function of the number of nodes in the net-work. Hence, the number of packet transmissions isalso a linear function of the number of nodes in thenetwork. From algorithm in section 4.2, the num-ber of D-2 colors is a constant. Hence, the latencyis a linear function of the number of packets and thenumber of hops in the diameter of the network.
latency = #packets∗(#hops in diameter+C)∗thop
(5)
2400
3400
4400
5400
6400
49 64 81 100 121 144 169
Number of Nodes
# T
ran
smis
sio
ns
(a) Number of Transmissions
49
49.2
49.4
49.6
49.8
50
50.2
50.4
50.6
50.8
51
49 64 81 100 121 144 169
Number of Nodes
Late
ncy
(se
c)
(b) Latency
Figure 5. Constant Density
As we increase the number of nodes by keepingthe density constant, the size of the CDS and the
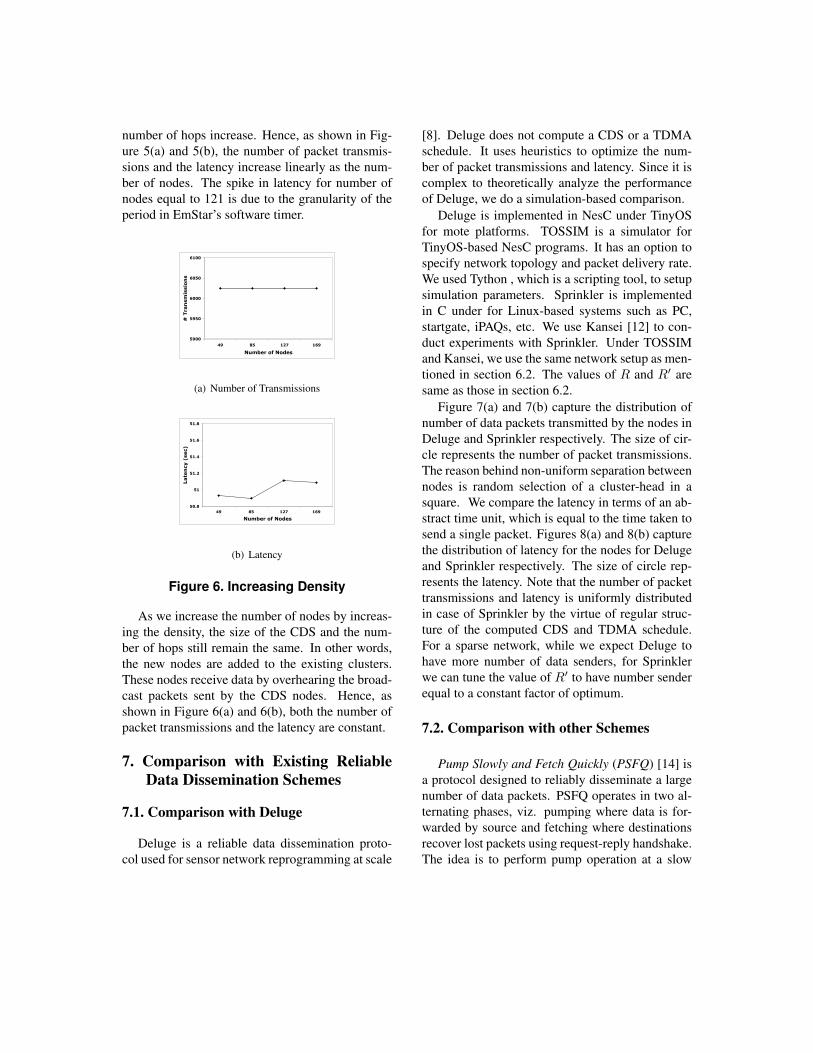
number of hops increase. Hence, as shown in Fig-ure 5(a) and 5(b), the number of packet transmis-sions and the latency increase linearly as the num-ber of nodes. The spike in latency for number ofnodes equal to 121 is due to the granularity of theperiod in EmStar’s software timer.
5900
5950
6000
6050
6100
49 85 127 169
Number of Nodes
# T
ran
smis
sio
ns
(a) Number of Transmissions
50.8
51
51.2
51.4
51.6
51.8
49 85 127 169
Number of Nodes
Late
ncy
(se
c)
(b) Latency
Figure 6. Increasing Density
As we increase the number of nodes by increas-ing the density, the size of the CDS and the num-ber of hops still remain the same. In other words,the new nodes are added to the existing clusters.These nodes receive data by overhearing the broad-cast packets sent by the CDS nodes. Hence, asshown in Figure 6(a) and 6(b), both the number ofpacket transmissions and the latency are constant.
7. Comparison with Existing ReliableData Dissemination Schemes
7.1. Comparison with Deluge
Deluge is a reliable data dissemination proto-col used for sensor network reprogramming at scale
[8]. Deluge does not compute a CDS or a TDMAschedule. It uses heuristics to optimize the num-ber of packet transmissions and latency. Since it iscomplex to theoretically analyze the performanceof Deluge, we do a simulation-based comparison.
Deluge is implemented in NesC under TinyOSfor mote platforms. TOSSIM is a simulator forTinyOS-based NesC programs. It has an option tospecify network topology and packet delivery rate.We used Tython , which is a scripting tool, to setupsimulation parameters. Sprinkler is implementedin C under for Linux-based systems such as PC,startgate, iPAQs, etc. We use Kansei [12] to con-duct experiments with Sprinkler. Under TOSSIMand Kansei, we use the same network setup as men-tioned in section 6.2. The values of R and R′ aresame as those in section 6.2.
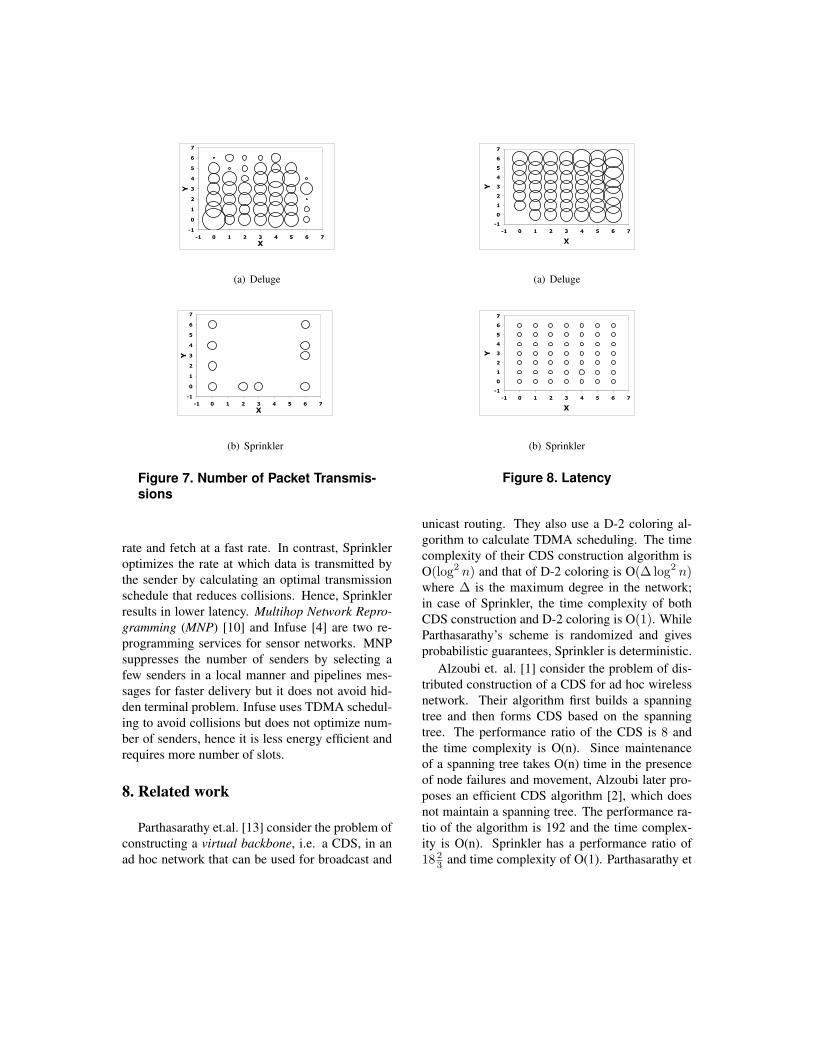
Figure 7(a) and 7(b) capture the distribution ofnumber of data packets transmitted by the nodes inDeluge and Sprinkler respectively. The size of cir-cle represents the number of packet transmissions.The reason behind non-uniform separation betweennodes is random selection of a cluster-head in asquare. We compare the latency in terms of an ab-stract time unit, which is equal to the time taken tosend a single packet. Figures 8(a) and 8(b) capturethe distribution of latency for the nodes for Delugeand Sprinkler respectively. The size of circle rep-resents the latency. Note that the number of packettransmissions and latency is uniformly distributedin case of Sprinkler by the virtue of regular struc-ture of the computed CDS and TDMA schedule.For a sparse network, while we expect Deluge tohave more number of data senders, for Sprinklerwe can tune the value of R′ to have number senderequal to a constant factor of optimum.
7.2. Comparison with other Schemes
Pump Slowly and Fetch Quickly (PSFQ) [14] isa protocol designed to reliably disseminate a largenumber of data packets. PSFQ operates in two al-ternating phases, viz. pumping where data is for-warded by source and fetching where destinationsrecover lost packets using request-reply handshake.The idea is to perform pump operation at a slow
-1
0
1
2
3
4
5
6
7
-1 0 1 2 3 4 5 6 7X
Y
(a) Deluge
-1
0
1
2
3
4
5
6
7
-1 0 1 2 3 4 5 6 7X
Y
(b) Sprinkler
Figure 7. Number of Packet Transmis-sions
rate and fetch at a fast rate. In contrast, Sprinkleroptimizes the rate at which data is transmitted bythe sender by calculating an optimal transmissionschedule that reduces collisions. Hence, Sprinklerresults in lower latency. Multihop Network Repro-gramming (MNP) [10] and Infuse [4] are two re-programming services for sensor networks. MNPsuppresses the number of senders by selecting afew senders in a local manner and pipelines mes-sages for faster delivery but it does not avoid hid-den terminal problem. Infuse uses TDMA schedul-ing to avoid collisions but does not optimize num-ber of senders, hence it is less energy efficient andrequires more number of slots.
8. Related work
Parthasarathy et.al. [13] consider the problem ofconstructing a virtual backbone, i.e. a CDS, in anad hoc network that can be used for broadcast and
-1
0
1
2
3
4
5
6
7
-1 0 1 2 3 4 5 6 7
X
Y
(a) Deluge
-1
0
1
2
3
4
5
6
7
-1 0 1 2 3 4 5 6 7
X
Y
(b) Sprinkler
Figure 8. Latency
unicast routing. They also use a D-2 coloring al-gorithm to calculate TDMA scheduling. The timecomplexity of their CDS construction algorithm isO(log2 n) and that of D-2 coloring is O(∆ log2 n)where ∆ is the maximum degree in the network;in case of Sprinkler, the time complexity of bothCDS construction and D-2 coloring is O(1). WhileParthasarathy’s scheme is randomized and givesprobabilistic guarantees, Sprinkler is deterministic.
Alzoubi et. al. [1] consider the problem of dis-tributed construction of a CDS for ad hoc wirelessnetwork. Their algorithm first builds a spanningtree and then forms CDS based on the spanningtree. The performance ratio of the CDS is 8 andthe time complexity is O(n). Since maintenanceof a spanning tree takes O(n) time in the presenceof node failures and movement, Alzoubi later pro-poses an efficient CDS algorithm [2], which doesnot maintain a spanning tree. The performance ra-tio of the algorithm is 192 and the time complex-ity is O(n). Sprinkler has a performance ratio of18 2
3 and time complexity of O(1). Parthasarathy et

.al. and Alboubi et. al.’s solutions do not assume aminimum density and location information unlikeSprinkler.
9. Conclusion
We presented Sprinkler, a reliable and energy ef-ficient data dissemination service for wireless em-bedded devices. Sprinkler assumes a minimumnode distribution density and the knowledge oflocation information. These assumptions enableus to efficiently construct clusters in the form ofsquares. We then use the regular grid structure ofthe cluster-heads to efficiently compute a CDS anda corresponding TDMA schedule. We analyticallybounded its performance in terms of the number ofpacket transmissions and the latency. Further, wecompared its performance with Deluge. We foundthat Sprinkler outperforms Deluge by a factor of 15for a 7× 7 network under simulation.
References
[1] K. Alzoubi. Virtual Backbones in Wireless Ad HocNetworks. PhD thesis, Illinois Institute of Technol-ogy, 2002.
[2] K. Alzoubi, P. Wan, and O. Frieder. Message-optimal connected dominating sets in mobile adhoc networks. In Proceedings of the 3rd ACMInternational Symposium on Mobile Ad hoc Net-working & Computing, pages 157–164. ACMPress, 2002.
[3] A. Arora, R. Ramnath, P. Sinha, E. Ertin, S. Ba-pat, V. Naik, V. Kulathumani, H. Zhang, M. Sid-haran, S. Kumar, H. Cao, N. Seddon, C. Ander-son, T. Herman, C. Zhang, N. Trivedi, M. Gouda,Y. Choi, M. Nesterenko, R. Shah, S. Kulkarni,M. Arumugam, L. Wang, D. Culler, P. Dutta,C. Sharp, G. Tolle, M. Grimmer, B. Ferriera, andK. Parker. Project exscal. In International Confer-ence on Distributed Computing in Sensor Systems,2005.
[4] M. Arumugam. Infuse: a tdma based reprogram-ming service for sensor networks. In SenSys ’04:Proceedings of the 2nd International Conferenceon Embedded Networked Sensor Systems, pages281–282, New York, NY, USA, 2004. ACM Press.
[5] B. Clark, C. Colbourn, and D. Johnson. Unit diskgraphs. Discrete Mathematics, 86:165–177, 1990.
[6] P. Dutta, M. Grimmer, A. Arora, S. Bibyk, andD. Culler. Design of a wireless sensor networkplatform for detecting rare, random, and ephemeralevents. In The Fourth International Conference onInformation Processing in Sensor Networks, Apr.2005.
[7] J. Elson. Time Synchronization in Wireless SensorNetwork. PhD thesis, UCLA, 2003.
[8] J. Hui and D. Culler. The dynamic behavior of adata dissemination protocol for network program-ming at scale. In Proceedings of the 2nd interna-tional conference on Embedded networked sensorsystems, pages 81–94. ACM Press, 2004.
[9] S. Krumke, M. Marathe, and S. Ravi. Models andapproximation algorithms for channel assignmentin radio networks. Wireless Networks, 7(6):575–584, 2001.
[10] S. Kulkarni and L. Wang. Mnp: Multihop net-work reprogramming service for sensor networks.In 25th International Conference on DistributedComputing Systems, June 2005.
[11] V. Naik, A. Arora, P. Sinha, and H. Zhang. Sprin-kler: A reliable and energy efficient data dis-semination service for wireless embedded devices.Technical Report ExScal-OSU-EN04-2005-05-11,The Ohio State University, Computer Science andEngineering Department, May 2005.
[12] V. Naik, S. Bapat, H. Zhang, C. Anderson, G. Fox,J. Wieseman, A. Arora, E. Ertin, and R. Ram-nath. Kansei: Sensor tesbed for at-scale experi-ments. Technical report, The Ohio State Univer-sity, Computer Science and Engineering Depart-ment, http://www.cse.ohio-state.edu/exscal, Feb.2005.
[13] S. Parthasarathy and R. Gandhi. Fast dis-tributed well connected dominating sets for adhoc networks. Technical Report UM ComputerScience Department; CS-TR-4559, The Univer-sity of Maryland, Computer Science Department,http://hdl.handle.net/1903/538, Feb. 2004.
[14] C. Wan, A. Campbell, and L. Krishnamurthy. Psfq:A reliable transport protocol for wireless sensornetworks. In WSNA ’02: Proceedings of the1st ACM International Workshop on Wireless Sen-sor Networks and Applications, pages 1–11, NewYork, NY, USA, 2002. ACM Press.
Copyright © 2022 FDOKUMEN