
Class A Foam Water Sprinkler Systems
130
ISSN 1173-5996 CLASS A FOAM WATER SPRINKLER SYSTEMS BY David B Hipkins Supervised by Dr Charley Fleischmann Fire Engineering Research Report 99/9 March 1999 This report was presented as a project report as part of the M.E. (Fire) degree at the University of Canterbury School of Engineering University of Canterbury Private Bag 4800 Christchurch, New Zealand Phone 643 364-2250 Fax 643 364-2758
-
Upload
khangminh22 -
Category
Documents
-
view
0 -
download
0
Transcript of Class A Foam Water Sprinkler Systems

ISSN 1173-5996
CLASS A FOAM WATER SPRINKLER SYSTEMS
BY
David B Hipkins
Supervised by
Dr Charley Fleischmann
Fire Engineering Research Report 99/9 March 1999
This report was presented as a project report as part of the M.E. (Fire) degree at the University of Canterbury
School of Engineering University of Canterbury
Private Bag 4800 Christchurch, New Zealand
Phone 643 364-2250 Fax 643 364-2758


ACKNOWLEDGEMENTS
My sincere thanks to my employer, Tyco New Zealand Limited, for having the foresight to invest
in the higher education of their employees.
To all my colleagues in the Tyco organisation, world wide, who assisted with professional advice
and who rummaged through libraries to source references. A special word of thanks to Joe Behnke
and Mitch Hubert (Ansul, Marinette), Jerry Pepi (Grinnell R & D), Ulrich Rieger (Total Walther),
and Roger Thomas (TIS, Sydney). To Brenda Hoskins for the professional and cheerful manner
in which this report was typed.
A special thank you to William Carey at Underwriters Laboratories, and Dan Madrzykowski at
NIST for willingly providing vital information.
To Dr Charles Fleischmann for offering his assistance and guidance to a geographically remote
student.
To my wife Joasia, for being understanding and supportive to a man who chained himself to a desk
every weekend for a year.
Thank you all.

ii
TABLE OF CONTENTS
PAGE
Acknowledgments ..............•.•......•......................•..................•.•.•...................................•....... 1
Table of Contents ...•........•.................•.......................•.•......................................................... ii Abstract ••.••.•.••.........•.•......•..........•...•.......•...•.•..........•...•...•..•.•.....•.....•...•................................ v List of Figures and Tables ....•.•......................................•.•...•....•..•.•........•.....................•..•... vi Nomenclature ..•...•..•...•......•.•.•••....•.•..•.••.•...•......•...•..••...•...••.........•.....•.•.•...............•....•.•.....•.. x Glossary of Terms and Abbreviations ..........•.......................•.....•..............•.•..••.........•....... xii
CHAPTER
1.0 Introduction •.••.••..•....•..........................•...•.....•.•......•.•.....•.•...........•..•..........•....... ! 1.1 Background .......................................................................................................... 1 1.2 Aims ofthis Project ............................................................................................. 2
CHAPTER
2.0 Literature Review ............................................................................................... 3 2.1 Overview .............................................................................................................. 3 2.2 Residential Sprinkler Systems Utilising Class A Foam Solution ........................ 3 2.3 Protection of Vertically Racked Plastic Boxes ................................................... .4 2.4 Fixed Overhead Compressed Air Foam Systems ................................................ 14 2.5 Manual Fire Fighting with Class A Foam ........................................................... 16 2.6 Suppression Effectiveness of Class A Foams ..................................................... 22 2.7 Extinguishment ofPlastic Fires with Plain Water and Dilute Solutions of AFFF ........ 27
CHAPTER
3.0 Theory .............•...............••........•...•......•.•.......•................................................... 29 3.1 Water As An Extinguishing Agent ..................................................................... 29 3.2 Sprinkler Droplet Size and Distribution .............................................................. 30 3.3 Sprinkler Spray Distribution ............................................................................... 32 3.4 Sprinkler System Suppression ............................................................................. 34 3.5 Sprinkler Suppression Model .............................................................................. 38 3.6 Class A Foam Suppression .................................................................................. 40 3.7 Foam Expansion Ratio And Its Effect On Suppression ...................................... 44 3.8 Aspirated Foam Stability ..................................................................................... 46
CHAPTER
4.0 Experimental Apparatus ...........•....•.........•...............................•...................•... 48 4.1 Foam Expansion Tests ........................................................................................ 48 4.2 Foam Distribution Tests ...................................................................................... 50

iii
TABLE OF CONTENTS
CHAPTER
5.0 Experimental Procedure ................................................................................... 52 5.1 Foam Expansion Tests ........................................................................................ 52 5.2 Foam Distribution Tests ...................................................................................... 55
CHAPTER
6.0 Results and Obse(Vations ................................................................................. 56 6.1 Foam Expansion Tests ........................................................................................ 56 6.2 Foam Distribution Tests ...................................................................................... 58 6.3 Discussion ........................................................................................................... 60
CHAPTER
7.0 Environmental Considerations ........................................................................ 64 7.1 Introduction ........................................................................................................ 64 7.2 Toxicity .............................................................................................................. 65 7.3 Biodegradability ................................................................................................. 67 7.4 Fish Toxicity ...................................................................................................... 68 7.5 Conclusion- Environmental Implications ......................................................... 70
CHAPTER
8.0 System Hardware and Material Compatibility .............................................. 75 8.1 Introduction ........................................................................................................ 7 5 8.2 Bladder Tank Proportioning ............................................................................... 7 5 8.3 Balanced Pump Proportioning ........................................................................... 79 8.4 Material Compatibility and Corrosion ............................................................... 81
CHAPTER
9.0 Potential Applications ...................................................................................... 86 9.1 Introduction ........................................................................................................ 86 9.2 Plastic Commodities .......................................................................................... 86 9.3 Paper Products and Storage ................................................................................ 88 9.4 Limited Water Supply Situations ....................................................................... 89 9.5 Warehousing of Stored Rubber Tyres ................................................................ 90

iv
TABLE OF CONTENTS
CHAPTER
10.0 Recommendations and Conclusions ...........•.......•.•..•...................................... 96 10.1 General Conclusions .......................................................................................... 96 10.2 Future Research .................................................................................................. 98
REFERENCES .•..............•.•.•.....•............•.....•.•........•...•.•.....•...•...•.......•.•..•......•................... 1 00
Appendix 1: Physical Properties ........................................................................................... 106 Appendix 2 : Environmental Properties ................................................................................ 1 09

ABSTRACT
Class A foam is often used in the suppression of wildland and structural fires, with manual
application methods. This report examines the feasibility of utilising class A foam extinguishing
medium in automatic wet pipe sprinkler systems.
Previous researchers report that for certain applications the addition of class A foam solution to a
sprinkler system increases suppression effectiveness. Researchers investigating applications with
manual fire fighting techniques, using this extinguishing medium, report mixed conclusions.
The integration of class A foam hardware with standard wet pipe sprinkler technology is discussed.
Consideration is given to potential corrosion effects and compatibility with sprinkler hardware
items. A review of environmental issues revealed that some products are readily biodegradable,
while others are not, and that results vary with the test method used.
Tests undertaken to investigate the relationship between the applied sprinkler head pressure and
the foam expansion ratio, revealed that only a slight increase in the expansion ratio occurred when
the pressure was increased from 50 kPa to 85 kPa. Expansion ratios obtained were similar to those
obtained by other researchers using AFFF type foam solution. Foam-water distribution tests
indicated that the distribu~ion densities obtained with class A foam sprinkler arrays are within
close proximity to the densities obtained using pure water.
It is suggested that future work in this area should be based around the protection of extreme class
A hazard type fires.

vi
LIST OF FIGURES AND TABLES
CHAPTER2
Figure 2.3-1 Figure 2.3-2
Figure 2.3-3 Figure 2.3-4 Figure 2.3-5 Figure 2.3-6
Figure 2.5-1
Figure 2.5-2
Figure 2.6-1
CHAPTER3
Figure 3.3-1 Figure 3.3-2
Figures 3.3-3a,b,c Figure 3.3-4 Figure 3.5-1 Figure 3.6-1 Figure 3.6-2 Figure 3.7-1 Figure 3.7-2
CHAPTER4
Figure 4.1-1 Figure 4.1-2 Figure 4.2-1
CHAPTERS
Figure 5.1-la,b
PAGE
Polypropylene Plastic Boxes, Rack Stacked ........................................... 5 Test Configuration using an "In Rack" Class A Foam Based Sprinkler System ..................................................................................... 6 Test 3 Fire Development ......................................................................... 9 Fire Damage Associated with Test 1 ....................................................... 1 0 Fire Damage_Associated with Test 3 ....................................................... 12 Fire Damage Associated with the Class A Foam Based System .......... , .......................................................................................... 13 Results of Structural Fire Fighting Room Burn Tests (Time until HRR was 500kW) ................................................................ 20 Results of Structural Fire Fighting Room burn Tests (Quantity until HRR was 500kW) ........................................................... 21 Schematic of the Nozzle Arrangement for the Crib Fire Tests ............... 25
Typical Spray Pattern for a Standard Spray Type Sprinkler ................... 32 Variation in Mass Flux Density as a Function of Radial Distance ................................................................................................... 3 3 Effect of Discharge Pressure on Floor Level Spray Patterns .................. 34 Flow Contours for a Standard Pendant Spray Sprinkler ......................... 35 610mm Wood Crib Heat Release Rates at Varying Densities ............... .40 Surface Tension Valves for Water and Class A Foam Solution ............ .41 Surface Contact Angle ............................................................................. 42 Aspirated Foam Formation for a Foam Water Sprinkler ........................ 44 Mesh type Diffuser Aspirating Head ...................................................... .45
Schematic Representation of the Test Configuration .............................. 48 Foam Slider Collector Board ................................................................... 50 Foam Distribution Test Array ................................................................. 51
Position ofFoam Slider Board ................................................................ 54

vii
LIST OF FIGURES AND TABLES
CHAPTER6
Figure 6.1-1 Figure 6.1-2 Figure 6.2-1 Figure 6.2-2 Figure 6.3-1 Figure 6.3-2
CHAPTERS
·.Figure 8.2-1
Figure 8.3-1
CHAPTER9
Figure 9.5-1
Figure 9.5-2
Figure 9.5-3
PAGE
Expansion Ratio as a Function of Pressure ............................................. 57 Foam Expansion Tests .................... , ....................................................... 58 Foam Distribution Test Number 1 .......................................................... 59 Foam Distribution Test Number 2 .......................................................... 60 Density Variation for Tests 1 and 2 ......................................................... 62 Density_Variation for Tests Conducted by Factory Mutual with Plan Water ....................................................................................... 63
Typical Schematic of Hardware Arrangement for Class A Sprinkler System, utilising a Bladder Tank ............................................ 78 Typical Schematic for Balanced Proportioning with a Pumped Concentrate Supply and In Line Pressure Proportioner ............................................................................................. 79
Tyre Storage Test Configuration- FMRC Test 1 ................................................................. 92 Tyre Storage Test Configuration- FMRC Test 2 ................................................................. 92 TyrC? Storage Test Configuration- FMRC Test 3 ................................................................. 93'

viii
LIST OF FIGURES AND TABLES
CHAPTER2
Table 2.3-1
Table 2.3-2
Table 2.4-1
Table 2.5-1 Table 2.5-2 Table 2.6-1
Table 2.7-1
CHAPTER3
Table 3.2-1
Table 3.7-1
CHAPTER4
Table 4.1-1
CHAPTER6
Table 6.1-1 Table 6.1-2 Table 6.2-1 Table 6.2-2
CHAPTER 7
Table 7.5-1
Table 7.5-2
Table 7.5-3
PAGE
Results of Full Scale Fire Tests with Racked Plastic Boxes ....................................................................................................... 8 Results of Full Scale Fire Tests with Racked Plastic Boxes and Class A Foam ................................................................................... 11 Summary of Kim and Dlugogorski's Class A Confined Fire Tests .... "" ......................................................................................... 15 Results of "Salem Tests" ......................................................................... 1 7 University of Wuppertals Room Fire Test Results ................................. 18 Size Distribution of Smoke from Fire Suppressant Foam Agents Extinguishment ........................................................................... 24 Extinction Time for Common Plastics with Plan Water and 0.2% AFFF Solution ......................................................................... 27
Estimated and Measured Valves of Mean Sprinkler Droplet Size ............................................................................................. 31 Foam Expansion Ratios for Various Discharge Hardware Devices .................................................................................................... 46
Summary_ of Equipment used in Foam Expansion Experiments ............................................................................................. 49
Results ofF oam Expansion Tests ........................................................... 56 Results of 25% Drain Tests ..................................................................... 57 Foam Distribution Test Number 1 Results .............................................. 58 Foam Distribution Test Number 2 Results .............................................. 59
Estimates of the Quantity of Class A Foam Discharged from a Sprinkler System, based in 8 Heads Operating .................................... 71 Estimates of the Quantity of Class A Foam Discharged from a Sprinkler System based on Typical Sprinkler System Design Parameters ............................................................................................... 72 Toxicity Characteristics of Fire Ground Run-OffWater and Class A Foam Solution .......................................................... ,~-" .............. 73

ix
LIST OF FIGURES AND TABLES
CHAPTERS PAGE
Table 8.4-1 Uniform Corrosion Rates for Steel and Brass with Fresh Concentrate .................................................................................... 82
Table 8.4-2 Uniform Corrosion Rates for Steel and Brass with 1% Foam Solution ................................................................................... 83
Table 8.4-3 Typical Materials Exposed to Foam Concentrate in Class A Foam System ............................................................................. 84
Table 8.4-4 Typical Materials Exposed to Foam Solution in a Class A.Foam Sprinkler System .............................................................. 85
CHAPTER9
Table 9.5-1 Draft Results of the Class A Type Foam Products Tested on Stacked Tyres .......................................................................... 94
Table 9.5-2 NIST Stacked Tyre Fire Test Results - Summary ................................... 95

X
NOMENCLATURE
A =area m2
C =imperical constant (approximately 3.21)
C,R0,R1 = Rosin-Rammler coefficients
d = droplet diameter
D = sprinkler orifice diameter (mm)
D = Sprinkler orifice diameter (mm)
d111 = mean droplet diameter (mm)
dm = volume mean droplet diameter
E = expansion ratio
f(d) = dropletsize distribution function
F(r,t) = bubble size distribution function
He = crib height (mm)
K proportionality constant (inclusive of ll P)
m =meters
P = orifice pressure (kglm.sec. 2)
P =pressure kPa
ll P =pressure difference
Q =flow rate (m3 /sec)
Q =flow rate !!min)
Q (tacJ = heat release rate at the time of sprinkler activation (tacJ; Kw
Q (t-tacJ = post sprinkler activation heat release rate of the fire, kW
r = bubble radius
r e = large bubble radius
rs = small bubble radius

NOMENCLATURE
U= Water velocity through the sprinkler orifice (mlsec)
Vfs =volume of foam solution
Va = volume of air
w " = spray density (llminlm2)
We= Weber number
y = surface tension
pw = water density (1 000kg/m3)
<J =air-water interface surface tension (0.0073 N/m)
1: = time constant (s)
xi

xii
GLOSSARY OF TERMS & ABBREVIATIONS
Aspirate
Class A Fires
Class A Foam
Class B Fires
Class B Foam
Compressed Air Foam Systems (CAPS)
Concentration
Drainage Time
Expansion
Foam
Foam Concentrate
Foam Solution
Surfactant
Wetting Agent
To draw in air, nozzle aspirating systems draw air into the nozzle to mix with the agent solution.
Fires involving ordinary combustible materials (such as wood, cloth, paper, rubber and many plastics).
Foam intended for use on class A fires, made from hydrocarbon based surfactants.
Fires involving flammable or combustible gases, liquids, greases and similar materials.
Foam designed for use on class B fires, made from fluorocarbon-based surfactants.
A generic term used to describe foam systems consisting of an air compressor (or air source), water pump and foam solution.
The percentage of foam concentrate contained in a foam solution.
The time taken for water to drain out of foam. The 25% drainage time is most commonly used. The ratio of final foam volume to original foam solution volume.
The aerated solution created by forcing air into, or entraining air in a water solution containing a foam concentrate by means of suitably designed equipment or by cascading it through the air at high velocity.
Foam concentrate is a concentrated liquid foaming agent as received from the manufacturer.
A homogenous mixture of water and foam concentrate in the proper proportions.
A surface active agent.
A chemical that, when added to water, reduces the surface tension of the solution and causes it to spread and penetrate exposed objects more effectively.
ABBREVIATIONS
ABS
AFFF
AFFF ARC
BOD
CAFS
COD
Dv0.5
Dv0.9
Dv0.99
FMRC
NFPA
NIST
PAR's
U.L.
xiii
Acrylonitrile Butadien Styrene.
Aqueous Film-Forming Foam.
Aqueous Film-Forming Foam Alcohol Resistant Concentrate.
Biological Oxygen Demand.
Compressed Air Foam System
Chemical Oxygen Demand.
50% of the total liquid is in drops of smaller diameter than that referenced.
90% of the total liquid is in drops of smaller diameter than that referenced.
99% of the total liquid is in drops of smaller diameter than that referenced.
Factory Mutual Research Corporation.
National Fire Protection Association.
National Institute of Standards and Technology, U.S. Department of Commerce, Technology Administration.
Polycyclic Aromatic Hydrocarbons.
Underwriters Laboratories Inc.

1
CHAPTER 1.0 INTRODUCTION
1.1 Background
Closed head foam water sprinkler systems have long been used for the protection of class B
type storage and process risks. Prescriptive standards such as NFP A-16A 1 detail the
recommended practice for the design, installation and maintenance of these systems. The use of
this technology has the advantage as the required sprinkler density needed to suppress the fire
can be reduced.
While prescriptive standards such as NFP A -16A cover the protection of a combination of class
A and B type fires, the use of class A· type foam as a means of protecting class A fires is not
covered.
In 1994 the National Fire Protection Association formulated initial plans to undertake a
programme to examine the effectiveness of a class A sprinkler system, based on large scale fire
tests. Initial thinking envisaged that such technology could be used in the protection of
potential extreme class A fires, as encountered in a high level storage warehouse facilitY. This
project currently remains dormant due to funding constraints3•
The benefits of applying class A foam to forest fires is well understood. Several researches
concluded that in wildland fire fighting activities, the application of class A foam solution is
more effective than using pure water. Various manufacturers have claimed that class A foam is
approximately five times more effective than pure water4·
5• These claims are often made
without sound scientific tests being undertaken. A range of hardware and application methods
is used in this situation, including foam solution through hose streams, compressed air foam
systems (C.A.F.S.), and monsoon buckets. Recent research has resulted in fire service crews
utilising class A foam technology to fight structural fires6•
The application of class A foam technology to a closed head, wet sprinkler system has a number
of potential applications. Often products of a class A nature are stored in industrial and
warehouse situations, to high levels. In such a case a wet pipe sprinkler system must provide a
high water application density.

2
A typical example of such a risk is rubber goods or products, block stacked vertically. The
density required to protect such a product when stacked to a height of 6.3m in accordance with
New Zealand Standard for automatic sprinkler systems (NZS 4541: 1996), requires an
application density of 22.5 l/min/m2• In such a situation the water demand would be large, ie.,
typically 7,500 1/min. This demand would require large booster pumps and an up-sized
pipework array.
In rural areas often sprinkler systems have a limited water supply available, hence the need to
utilise this supply efficiently.
In both of the aforementioned examples it would be advantageous to be able to reduce the
application density without reducing the level of fire suppression.
1.2 Aims of this Project
The goals of this research project are as follows;
• To examine the current status of class A foam systems including a review of previous
research and fire tests and to examine the findings associated with closely related subjects.
• To undertake a review of the theoretical aspects associated with class A foam sprinkle{
technology.
• To examine the likely environmental impacts associated with this technology.
• To discus suitable hardware configurations and considerations.
• To undertake a series oftests to evaluate;
~how foam expansion ratios are affected by sprinkler head pressure.
~ to examine sprinkler distribution patterns associated with class A foam compared to
plain water.
• To identify potential applications and make recommendations for further research.

3
CHAPTER2.0 LITERATURE REVIEW
2.1 Overview
A literature review was undertaken to establish the results of previous fire tests and research
findings. This exercise confirmed that little research has been done in the field of Class A foam
water sprinkler systems; hence only a minimum amount of literature has been published. In
contrast, a comprehensive number of research papers has been published relating to compressed
air foam systems (C.A.F.S.) and structural fire fighting using Class A foam technology. These
related topics have been referenced in this report as their findings are of significant interest and
closely linked to the subject matter.
2.2 Residential Sprinkler Systems Utilising Class A Foam Solution
In 1995 Underwriters Laboratories Incorporated undertook a series of fire tests for the United
States Fire Administration, with the objective of being able to reduce the quantity of water
required for residential sprinkler systems protecting mobile homes and rural housing7•
Fire tests were conducted in the living room of a manufactured home with dimensions 6.6m by
11.3m. A standard UL1626 residential fuel package, consisting of a wood crib and simulated
furniture, was used for the fire load. This arrangement was placed in the corner of the room.
Six closed head residential style sprinkles were installed on a CPVC piping network forming a
two by three array. Thermocouples were installed at various locations to monitor sprinkler
activation temperature, temperature above the wood crib, and to gauge tenability conditions.
Ten fire tests were conducted for a combination of suppression agents based on; pure water,
water with 0.3% Class A foam additive, water with antifreeze additive, water with 6% wetting
agent.

4
A fixed quantity of suppression agent (either 50 or 100 U.S. gallons) was applied to the fire and
visual observations made as to whether the fire was suppressed or not.
The tests concluded that the pre flashover fires could be suppressed with either 50 U.S. gallons
of either 6% wetting agent or 0.3% Class A foam solution.
It was not possible to suppress the fire with 50 gallons of pure water, although suppression was
achieved with 100 U.S. gallons of water. Antifreeze solution combinations with a quantity of
50 gallons of solution produced unacceptable results, but with 100 gallons were successful. In
all of the successful tests only one sprinkler head operated.
2.3 Protection Of Vertically Racked Plastic Boxes
In March 1996 German based fire equipment manufacturer Total Walther undertook two series
of full scale fire tests on high level racked plastic boxes8•
9• The objective of the tests was to
evaluate the effectiveness of "in-rack" sprinkler systems. The first series of experiments
undertook tests using plain water and 3% AFFF foam solution9• The second series of tests
evaluated the effectiveness of class A foam solution (0.5%)8•
The fire load consisted of a number of small polypropylene boxes stacked in a racking
configuration 9m wide by 'l0.7m high. The individual plastic boxes were arranged in a double,
row, within tiers 0.5m apart, as detailed in figures 2.3-1 and 2.3-2.
In-rack sprinkler heads Were located in the centre of the rack and spaced 1.45m horizontally
with rows of heads located at elevations of 3.7m, 7.2m an 10.7m. In addition to the in-rack
sprinklers, 15mm orifice heads were installed at roof level at a height of 14m. Spray type,
closed bulb, 1 Omm fast response sprinkler heads, with a nominal operating temperature of 68°C
and RTI of 50-80 my,.Sec\-\ were installed in the pendant position. Temperatures were recorded
at various locations, (refer figure 2.3-2).

5
Figure 2.3-1: Polypropylene plastic boxes rack stacked9• (Note; the yellow
triangles indicate the sprinkler positions and the white labels thermocouple locations).

6
Figure 2.3-2: Test configuration using a "in rack" sprinkler system.9
Q
@J
@
@
@l
@
@
@
@
@
@
®
®
®
® <J)
@
@
@
@
®
/

7
After three sprinklers had operated the flow rate to the heads was regulated to achieve density
requirements in accordance with the German sprinkler code for high level rack protection,
(BG4.3, extra high hazard, 10 l/min/m2). This typically resulted in the operation of two of the
lOmm orifice heads flowing approximately 150 1/min each, at a pressure of 700kPa. The
operation of three heads permitted each head to deliver approximately 50 1/min at a pressure of
about 100kPa.9
In some of the tests a steel "heat collector" device was placed above the sprinkler heads in order
to trap the rising heat and increase the rate of response.
Ignition of the plastic boxes was initiated by using a small amount of heptane in a pan. Ignition
of the fire load for all tests occurred in the same location, (ie., in the central row at low level as
shown in figure 2.3-2). Fire tests that were not controlled by the sprinkler system were
extinguished by manual means.
Table 2.3-11ists a summary of the results of the first series of fire tests.

8
Table 2.3-1: Results of full scale fire tests with racked plastic boxes (Test Series 1).9
~. ••.••• t 1. ·. ... . . • ' .. •• " ·,·· 1 · > .. . c
•·• ··.· .. · ... · • S~rlliklii' ·•••· · RoOk · Roof Qua~~~~f Jh~~& . fc~~~t' Itt Nor: );~,~~; !;ii~¥f~i~ ,:,:~~;.11 •;(~r~ifo~ 1:A~·:~t ·.:·: ?;; j } <, ;
1 No No 4 218 "3" >250 4.3 T1 = 820 No
2 Yes No
3 Yes Yes
4 No Yes
5 No Yes
3 256 T2= 58 6 TI-~
11 T4 =40 12 T6 = 128
T7=53 4 3 5
10/16 11/17 12/18 14/19
15 4 3
4 3 5
4 3
230 250
208 226
210 212 634
204 237
"6" >300 5.8
2.7
7.3
9.4
T1 = 890 T2=80 T3 =260 T4=65 T6 = 180 T7 = 155
T1 = 860 T2=58 TI=55 T4=30 T6=60 T7=36 T1 = 818 T2=46 TI =556 T4=36 T6=80 T7=44 T1 = 820 T2=60 TI=60 T4=34 T6=80 T7=45
Note; Test,
Stopped Due to
Intensity of Fire
Yes
Yes
Yes
Figures 2.3-3 shows the developing fire growth for test 3. Figure 2.3-4 shows the fire damage
associated with test number 1 (not controlled), while figure 2.3-5 shows resulting damage of
test number 3 (controlled).

9
Figure 2.3-3: Test 3 Fire Development.9

10
Figure 2.3-4: Fire Damage associated with Test 1 (Not Controlled).9
11
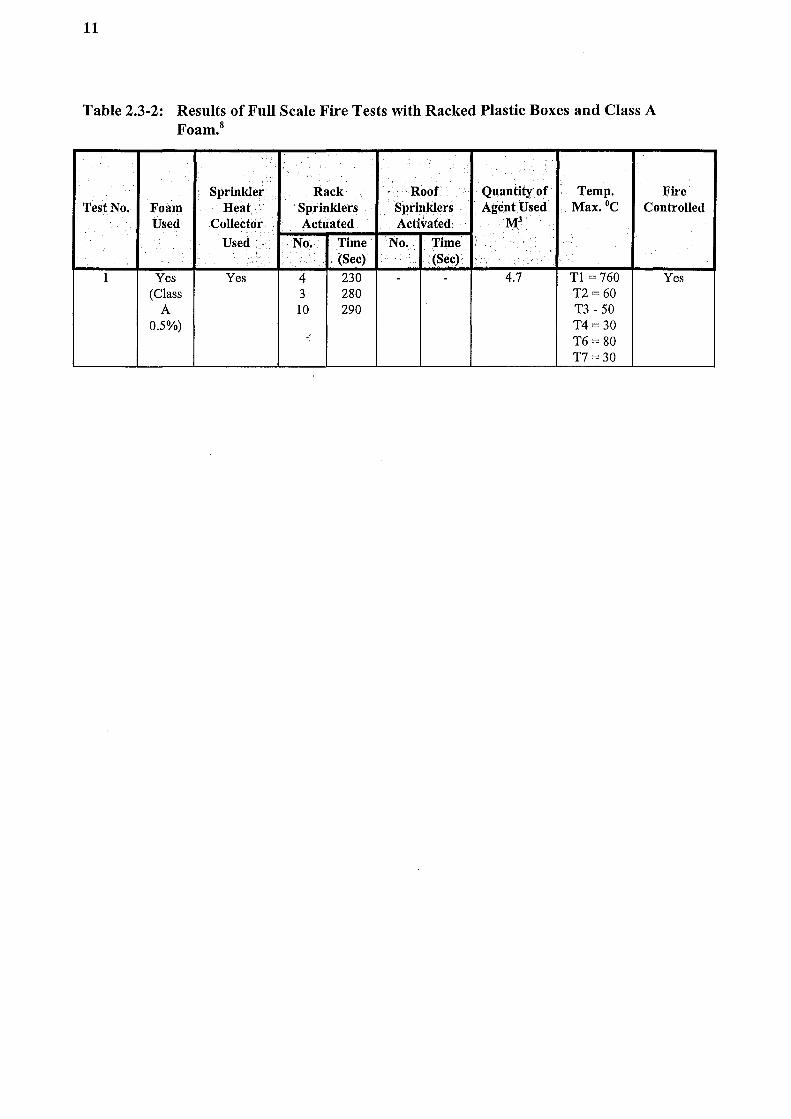
Table 2.3-2: Results of Full Scale Fire Tests with Racked Plastic Boxes and Class A Foam.8
Sprinkler Rack ··Roof Quantity of Temp. Fire Test No. Foam ·Heat.· Sprinklers Sprinklers Agent Used . Max. °C Controlled
Used Collector. Actuated Activated MJ
Used No. Time· No .. Time · ., . "~Sec) I ·(Sec)
1 Yes Yes 4 230 - - 4.7 Tl = 760 Yes (Class 3 280 T2=60
A 10 290 T3- 50 0.5%) T4=30
- T6= 80 T7=30

12
Figure 2.3-5: Fire Damage associated with Test 3 (ControlledV
The authors concluded that with the extinguishing agents and configurations used in tests 3, 4
and 5 the fire load could be controlled.9
The second series of tests utilised the same fuel load and configuration. Tests were undertaken
with a class A foam solution (Ansul Silv-ex) at a pre-mixed ratio of 0.5%.8 This addition
proved to be successful in controlling the fire. The results of this experiment are detailed in
Table 2.3-2.

13
Figure 2.3-6: Fire Damage associated with the Class A Foam Based System. 8

14
The two series of fire tests demonstrate that a fire within the storage array can be controlled by
either; plain water, 3% AFFF foam solution or 0.5% class A foam solution. In all these
successfully "controlled" cases the array requires; a minimum density of 10 l/min/m2 (as per the
German requirements GB4.3), sprinkler head heat collection devices are required and sprinkler
spacing shall be as per the test configuration.
The test series has its short comings, as with the exception of tests 4 and 5, individual tests were
not repeated in order to reconfirm the results.
The test data indicates that 3% AFFF solution (test 3) was the most effective extinguishing
medium. This test used the least amount of agent (2. 7m3) and resulted in the least fire damage,
(as viewed in the photographs). The 0.5% class A foam appears to be the next most effective
agent, where 4.7m3 of agent was used as opposed to 7.3m3 and 9.4m3 for the two "controlled"
tests which utilised plain water (tests 4 and 5). The photographs detailing the resulting fire
damage reinforce this assumption. The recorded temperatures indicate similar profiles for all
the successfully controlled fires.
2.4 Fixed Overhead Compressed Air Foam Systems
Kim and Dlugogorski10 conducted fire tests using a purpose engineered fixed overhead
compressed air foam system. Tests were performed on both Class A and B type fires, in open
space, and enclosed compartments. The fire suppression effectiveness of the overhead C.A.F.S.
system was compared to that obtained for sprinklers and water mist systems. This report will
only examine the comparable results obtained for the compartment fire tests conducted with
Class A wood crib fires.
The compartment fire tests were undertaken in an enclosure measuring 6.lm x 6.1m x 3.2m
high. The ventilation was achieved through two open windows with dimensions 1.5m by 1.2m
located 1.5m above the floor and separated by 0.25m. The door to the enclosure remained
closed following the fuel pre burning period.
15
The rate of heat release for the series of tests was determined by the readings obtained from
thermocouples distributed throughout the enclosure in conjunction with the combustion gas
concentrations obtained from an overhead oxygen consumption calorimeter.
Wood cribs constructed out of pine, ·with dimensions 0.6m x 0.6m x 0.6m; were used for the
Class A fires. These units were positioned in the center of the compartment 3m below the
nozzle array. The cribs were pre burned for a period of two minutes. The heat release rate data
confirmed that the cribs did reach the fully developed stage during the pre bum period.
The purpose engineered C.A.F.S. system discharged expanded foam, with an expansion ratio of
1:10 through specially engineered nozzles, with no impingement points. Foam flux density
tests found the appli_ed density to range from 8 1/min/m2 immediately underneath a nozzle to
11/min/m2 at the spray pattern boundary.
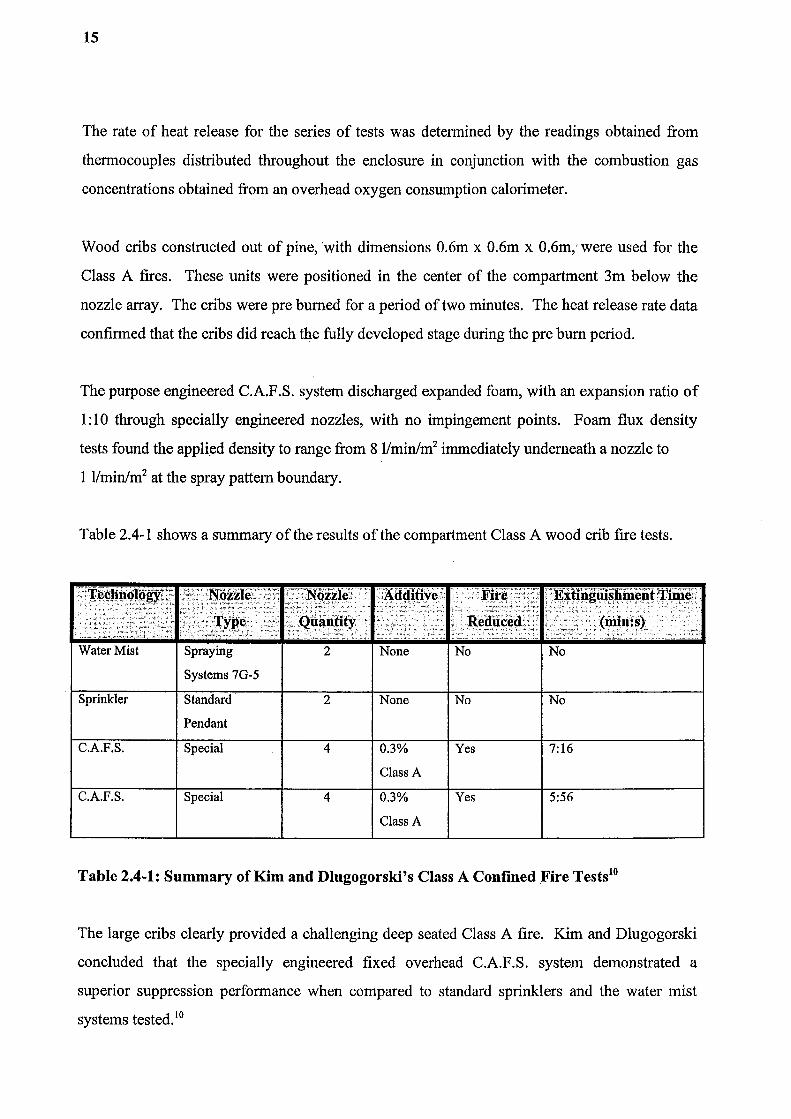
Table 2.4-1 shows a summary of the results of the compartment Class A wood crib fire tests.
~~-:'Jl~-~Jinol~ '~r;·~·Noiile\ .-.:_·_-_•:;_•_-_.~--_:_: '~":~~;N~¥~.J~;' --_"_ _. ___ ·_-_-.:..._.A •• ·.-_.a_· __ -_-_d_~_Afi_. __ Ye.•_•-•-•~_-_-_-_______ · .• ·_-_·-_-_· __ F_-_.,-.~---i·· ___ r.·_.:_~---_-__ -_---_·.--;_·.·_•-_-_-_•_'_--_.-_·_· __ -.• _·_--·~--.-_• __ : __ -.•:-·---_.-.-_·. -.·-•_-_·_:_-_E•····_---_-_x_:_•·.·_._fi ___ ·_.--.--_~_-_n ___ -__ -_~,g ___ u __ -_---•. _i_,_s_._-_._-_•li•--.~_ fu_.---.----~ __ --__ n_•·_-_J!tiin_-:e_:_•~_; . ----~-------_---~ ... _-_!.-_-_._ ... _;_J_._-.-_·•-·•_._._·_ •• -_-_-_•_•-~_"_.•-[.--~-~-··--_-_:r __ r ____ --_~_··_--_.·.;,_·· _·_;_·--•_-_-----•-·•_·._:_•._._-_-~·._:_•_·-_:-T·.··_:_-,-_··-~_-_;_•_y_.-_~_·-•_:-_•---·~ - -- _ - ---- -, _ - - .
__ _ __ .... ~""-c ·: __ ----.-__ •_-_- :·;··Qu~~~iy __ <,-- > -_ .. ~ -~~~~u-~~4,_ ~-: :...-.;;. Jm\•h~).: _ . _____ .. _ • . . · .. · ·' • • • ·.;-,."< · .:·, c••-'r: ;_ --';- :::.-'. . .'.--.C.-.•. ;·.· · -·- "·· · ·.. '· :_;,,_,-·, ___ .. _.;•.L•:··.·-' ·: · , . ;; ,. __
Water Mist Spraying
Systems 7G-5
Sprinkler Standard·
Pendant
C.A.F.S. Special
C.A.F.S. Special
2 None No No
2
4
4
None
0.3%
Class A
0.3%
Class A
No No
Yes 7:16
Yes 5:56
Table 2.4-1: Summary of Kim and Dlugogorski's Class A Confmed Fire Tests10
The large cribs clearly provided a challenging deep seated Class A fire. Kim and Dlugogorski
concluded that the specially engineered fixed overhead C.A.F.S. system demonstrated a
superior suppression performance when compared to standard sprinklers and the water mist
systems tested. 10
16
The actual amount of water consumed in each test is not published. This is a valuable
parameter when comparing the effectiveness of various suppression agents and hardware
configurations.
Tests were not undertaken to evaluate how Class A foam solution discharged through a standard
or aspirating type sprinkler head performed against the other agents tested. The paper states
that the sprinkler droplet size diameter was tested at a pressure of 180 kPa but it is unclear if the
actual tests were performed at this pressure.
2.5 Manual Fire Fighting With Class A Foam
In the evaluation of manual fire fighting techniques, a number of researchers have undertaken
tests and compared the efficiency and capacity of, plain water Class A fciam solution and
compressed air form systems. There is considerable variation in the techniques used by the
various researches to evaluate the performance of the agents and application methods.
Evaluation techniques employed by researchers include; time for suppression, quantity of agent
applied, time for a reduction in the heat release rate to a set value, normalised heat release
reduction rates, time-temperature reduction relationship or a combination of the
aforementioned.
Colletti11 describes a series of tests that were undertaken as a joint venture between Fire Service
Officials and representatives from the fire protection industry. These tests were known as the
"Salem tests". Post flashover compartment fires were performed with a fuel package which
consisted of wooden pallets and straw. Thermocouples were positioned at the ceiling level and
at an elevation of 1.2 meters above the floor. Three agents were evaluated; water, 0.5% Class A
foam solution and CAFS aspirated foam solution. The evaluation was based on the time
temperature reduction relationship. The initial fire attack was applied at high level, hence there
was little variance in the ceiling thermocouple readings for all three agents. Table 2.5-1 shows
the results of the three agents.

17
Table 2.5-1: Results of the "Salem Tests 11"
Water Foam Solution Compressed Air Foam
TUne t<> Jl.edu~~ From •538-oGt.<> 10Q0G
222.9 seconds 102.9 seconds 38.5 seconds
- : Qpantity of Agent- :
287litres 1321itres 50 litres
Colletti also claimed that there was an improvement in fire fighting visibility with the
application of the compressed air foam. This opinion was previously stated by the same author
in a previous publication12•
The UK based Home Office Fire Experimental Unit evaluated various class A water
alternatives, which were applied to a fully developed unrestricted fire, consisting of a 2 x 2 x 14
high array of wooden pallets13• Two series of tests were conducted in 1995 and 1996
respectively. The fire tests were performed under a large exhaust hood. Temperature and
radiative flux readings were recorded.
The effectiveness of the water additives was evaluated by calculating the area under the fire,
time-temperature curve. In total, thirteen class A additives were evaluated for the purposes of
structural fire fighting. The application of the agent to the fire was made with a 50 1/min high
pressure hose reel with the nozzle set to spray mode. The report concluded that none of the
additives tested produced significant advantage to fire fighting and further investigation could
not be justified14•
Underwriters Laboratories undertook a series of tests for the USDA Forest Service15• The
primary purpose of these tests was to collate test data, relative to determining a suitable method
to evaluate the performance of class A foam based fire fighting methods. These tests were
purely quantitative. Due to the range of flow rates, application pressures and crib sizes, it is
difficult to draw conclusions as to how class A solution, aspirated class A solution and plain
water compared.

18
Researchers at the University of Wuppertal in Germany have also investigated the possible use
of Class A foam for fire fighting purposes16• Compartment fire tests were undertaken in a room
with dimensions 4.75 x 3.3 x 2.62 meters. A fixed ventilation area was achieved through an
open door. The fire load consisted of a 2 x 5 high array of wooden pallets. Recordings were
made of; the time for extinguishment, quantity of agent and room and crib temperatures.
Application was achieved with a 25mm smooth bore non-aspirating nozzle. A summary of the
results, which are of interest to this project, are shown in Table 2.5-2 below.
Table 2.5-2: University of Wuppertals Room Fire Test Results16
Water 1 Water2 Class-A-foam-1 Class-A-foam-2 Class-A-foam-3
· ... •• ·} . -~Qtt!\ntitt oi;Agefit l:[Se(l'··-~ t":t~!ti,ffl_~_t():eitf.}lg1Ji~fffu¢ji,[:.;, .. · .. ·_ ~- -· ~ · ·=rudre:~f;_~ ~- -=~:- · :·•:>:E;~~~:;.r,.(~JHl~~c,r: ... i: .. :· ~ ..
107 5:30 85 6:45 59 3:00 55 3:30 84 3:45
The paper concluded that there was an advantage to using 0.5% class A solution as an
extinguishing agent, compared to water. Like Colletti, the author claimed that there was an
improvement in the fire fighting visibility, with the application of class A foam, compared with
that experienced with plain water11•
12•
Gravestock17 has also undertaken studies in this area. This work was carried out on shielded,
post flashover fires. The study examined the effectiveness of water mist, water mist with class
A foam solution and compressed air foam systems. The evaluation of the effectiveness of the
various agents was achieved by comparing the normalised heat release reduction rates obtained
by using oxygen calorimetry techniques. The fire load consisted of three kiln dried cribs with
dimensions 600 x 600 x 750 mm, which were separated by a medium density fibreboard
partition within the compartment.

19
The research concluded that there was no significant difference found in suppression
perfonnance with the three agents 17• Again, like previously mentioned, researchers findings,
observations revealed that there was an increase in visibility when the CAFS agent was applied,
compared to the other agents.
The National Fire Protection Research Foundation conducted two comprehensive series of tests
into this subject18• These tests consisted of a post flashover compartment fire, which was lined
with plywood and contained a mock furniture standard UL 1626 residential sprinkler fuel
package. Fire ventilation was achi~ved through a centrally located window with dimensions 1.5
x 1.2 m. Evaluation was undertaken with, plain water, class A foam and compressed air foam.
The measurement of perfonnance was taken as the time it took the heat release rate to reduce to
500 kW, and the amount of agent used. The report concludes that the results from the second
series of tests indicate that; "the use of class A foam solutions generally reduced the amount of
heat released from the fire and damage to the combustibles as compared to plain water." 18
Figures 2.5-1 and 2.5-2 show the results of the series II fire tests, detailing the time of agent
application until a heat release rate was reduced to 500kW.
The references mentioned above give mixed conclusions as to the effectiveness in class A foam
solution and aspirated foam solution when compared to plain water.
Due to the variations in the, evaluation techniques, fuel loads, application rates and
compartment configurations, it is not possible to compare the results of the above mentioned
references. With the exception of the Home Office Report13, all of the researchers recommend
that further testing be undertaken in this area.

20
Figure 2.5-1: R
esults of Stru
ctural F
ire Fighting -
Room
Bu
rn T
ests Phase II, T
ime of
Agent A
pplication until RH
R w
as reduced to 500kW. 18
~
(.) llJ a::
§i Q
1 ~
c.. ~
(!j \0
('(')
0 - (") - '-'
II
t-(.) UJ 0:: Q
i z ~ ~
c.. 0
\ (!)
r...: ('(')
0 '-
' ... t-(.) llJ a:: 1 Q
z
~
~
lrl ..0
c. N
(!}
' '-
' ,....

21
Figure 2.5-2: R
esults of Structural F
ire Fig
htin
g-
Room
Bu
rn T
ests Phase II, Q
uan
tity o
f A
gent Applied until R
HR
was reduced to 500kW
.18
o:
C'\J
:t: 0 C\J
§!
1-
()
lJ.J cr: 0 ~
a. (!)
0 M "
1-
()
LU cr: 0 z ~
a. (!)
0 -1-
()
lJ.J cr: 0 z :E a. (!)
r--- i ;::::. \0
M
........ ........ "-.-/
1 ;::::. 0
\ r...: M
"-.-/
i ;::::. lr
l 1.0 ~
"-.-/

22
1.6 Suppression Effectiveness of Class A Foams
The United States Fire Administration recognised that no evaluation protocol or standard test
methods exist to determine the effectiveness and perfonnance capabilities of class A foams. 19
This made it difficult for the users of class A products, such as rural fire fighting organisations,
to relate the performance of a particular agent to that of plain water or to compare various foam
agents.
The National Institute of Standards and Technology (NIST) was commissioned in order to
undertake tests and develop a suitable evaluation programme. The goals of the report were -·
categorised into four individual tasks as follows; 19
• Conduct a workshop with interested groups.
• Collate existing information on products.
• Develop methods to assess biodegradability, environmental, toxicity and physical
properties.
• Develop methods to assess and demonstrate fire fighting effectiveness.
Section 3.6 of this report references the findings of this study in relation to the foam agents fire
fighting and physical properties. The biodegradability, toxicity and environmental factors are
discussed in Section 7.0.
The NIST evaluation only tested four agents. The agents selected were deemed to be a typiqal
representation of agents that complied with U.S. Forest Service Specification 5100. The NIST
report does not reference the specific foam agent manufacturer or product name. 19
Exposure protection properties were evaluated by conducting both mass retention and ignition
inhibition experiments.20 These tests were conducted with water, foam solution and compressed
air foam (CAFS). The results of the CAFS tests are not discussed in this report as they are
outside the scope of this study.
The mass retention tests were conducted on typical residential external building materials, ie.,
unstained plywood, stained plywood and a vinyl cladding. Tests were undertaken on vertical
panels with dimensions 1.22m x 2.44m x 13mm.

23
The effectiveness of the foam solution was measured by determining the ratio of the average
mass of agent on the building material at time t, to the average mass of water on the panel at
time t, as derived by the specific water mass retention tests. The results showed that all
solutions tested had a similar performance. Foam solution was approximately four times more
effective on stained panels, and approximately two times more effective on unstained panels.
The foam solution was not as effective on vinyl panels as pure water. This is explained by the
solution having a lower surface tension, hence it is likely to run off a non-porous material at a
higher rate, compared to pure water.20
The "ignition-inhibition" experiments showed that both water and foam solution increased the
time to ignition by approximately 40%, with unstained samples and between 16% to 35% for
stained samples.20 There was found to be little to no advantage in using class A foam solution
over pure water. The author recommends further research in this area in order to quantify the
results.
NIST conducted tests to evaluate the smoke characterisation of crib fires fought with class A
foam and water.21 Two series of tests were undertaken. In the first series, wooden cribs
constructed out of "southern pine", were utilised and tests were performed to measure the levels
of polycyclic aromatic hydrocarbons (PAH's). PAH analysis determines the ratio of elemental
to organic carbon. The second series of tests evaluated the physical and chemical properties of
the smoke by determining the' concentrations of; carbon monoxide, carbon dioxide, nitrogen
oxides, hydrogen chloride and hydrogen cyanide. These tests were conducted with wooden
cribs, with plastic sticks (acrylonitrile butadien styrene and polyvinyl chloride), replacing some
of the wooden sticks within· the array. The second series of tests also analysed the mass
concentration and size distribution of the soot particles present in the smoke.
The first series of tests revealed that the fires extinguished with water only showed a high level
of the range of polycyclic aromatic hydrocarbons (PAH's) present. In contrast, when foam
solution or expanded foam (CAP's) was applied to the wooden crib fires, the formation of
P AH's with high molecular weights were suppressed. The author comments that this could be
due to the better coating or penetrating properties associated with the foam based agents.21

24
In the second series of tests the application of class A foam solution or CAP's was found to be
no more effective than plain water at suppressing the concentration levels of carbon dioxide,
carbon monoxide, nitrogen oxides, hydrogen cyanide and hydrogen chloride. The analysis
revealed similar trends for the rate of heat release, smoke mass concentration and oxygen
concentration, regardless of the extinguishing agent applied.21
The second series of tests revealed that the application of foam based solution did appear to
effect the size distribution of the smoke particulates. Smaller mean diameter particles were
generated as a result of bei9-g exposed to class A foam extinguishment agents. The author
commented that this effect may present an increase in health hazards to fire fighting crews, as
the smaller particles have the potential to penetrate further into the lungs.21
Table 2.6-1: Size Distribution of Smoke from Fire Suppressant Foam Agents · Extinguishment.21
AERODYNAMIC MASS MEAN DIAMETER, Jlm
Post-extinguishment Water Agent A Agent A (repeat) AgentB AgentC Agent C (repeat) AgentD
Notes:
1.6
1.4 0.9 1.0 1.3 1.2
Configuration 1 - 2 nozzles I 5.04 llmin I 275kPa
Configuration 2 -· 4 nozzles I 7.95 I/ min I 179kPa
Configuration 3- 4 nozzles I 6.21/min I 96kPa
(Refer to figure 2.6-1 for details of nozzle configuration).
1.8 1.2
0.8 0.6
1.0
1.0
0.8 0.6 0.8 0.7
The same pre-extinguishing samples are reported for all three extinguishing configurations.
Fire fighting crews have often commented on the amount of "white smoke" associated with
fighting a fire with class A foam based extinguishing agents. The smoke characterisation study
explained this phenomenon as being caused by the foam agents, possibly promoting the
formation of clouds by increased water content of the gases, and providing additional
condensation nuclei.21

25
The reduced surface tension of the foam solution leads to more finer droplets with reduced
mean diameter, hence the overall surface area of the extinguishing agent is increased which
translates to increased evaporation.
Fire suppression experiments were performed as part of the NIST evaluation on crib fires and
tyre fires.22 The results of the tyre fires are discussed in Chapter 9.
The cribs that were tested were constructed out of a combination of southern pine, ABS and
PVC sticks, as described in the smoke evaluation tests described above. The cribs consisted of
10 layers of sticks with dimensions (558mm x 38mm x 38mm). The overall mass of the cribs
varied between 29-34kg. The PVC sticks constituted 3.2kg of the total mass and the ABS
sticks 2.6kg.
The extinguishing agents were applied to the cribs by either two or four foam nozzles. Figure
2.6-1 outlines the crib fire test apparatus.
Figure 2.6-1: Schematic of the Nozzle Arrangement for the Crib Fire Tests.22

26
Heat release rates were derived for each crib fire situation by using a collection hood and
furniture calorimeter. The heat release curves showed there to be very little difference in the
rate of heat reduction, when comparing the application of water and class A foam extinguishing
agents.22
27
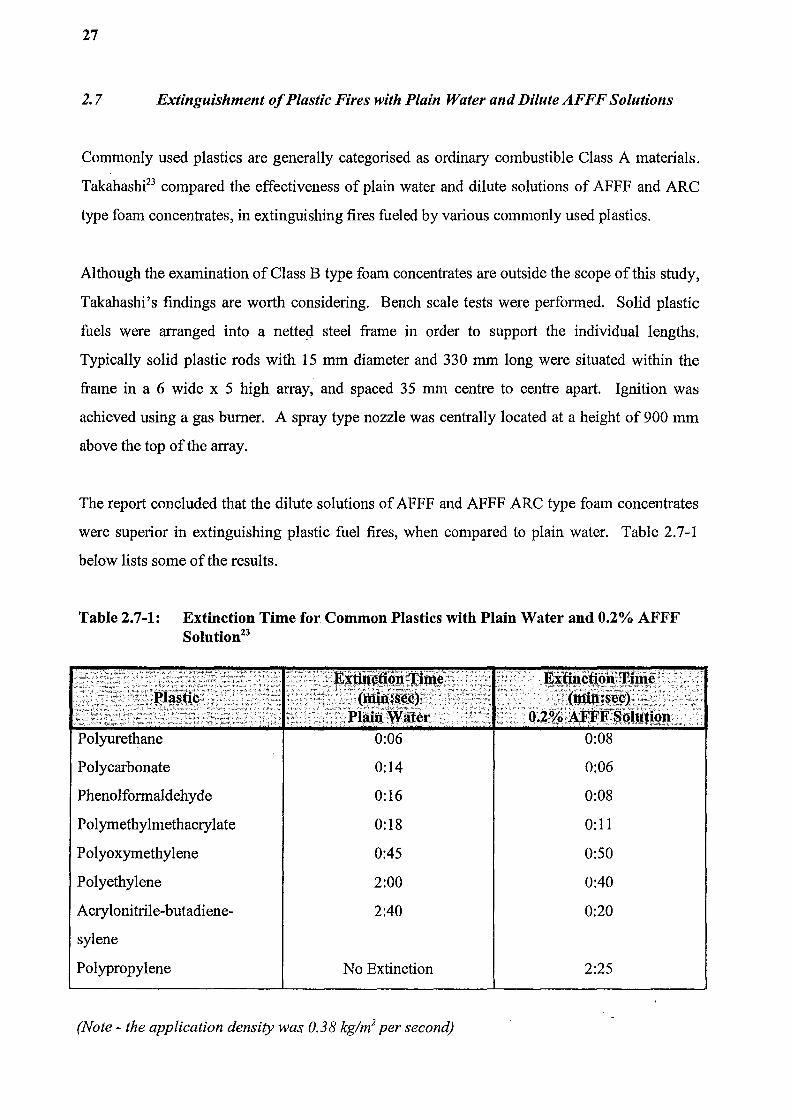
2. 7 Extinguishment of Plastic Fires with Plain Water and Dilute AFFF Solutions
Commonly used plastics are generally categorised as ordinary combustible Class A materials.
Takahashf3 compared the effectiveness of plain water and dilute solutions of AFFF and ARC
type foam concentrates, in extinguishing fires fueled by various commonly used plastics.
Although the examination of Class B type foam concentrates are outside the scope of this study,
Takahashi's findings are worth considering. Bench scale tests were performed. Solid plastic
fuels were arranged into a netteg steel frame in order to support the individual lengths.
Typically solid plastic rods with 15 mm diameter and 330 mm long were situated within the
frame in a 6 wide x 5 high array, and spaced 35 mm centre to centre apart. Ignition was
achieved using a gas burner. A spray type nozzle was centrally located at a height of 900 mm
above the top of the array.
The report concluded that the dilute solutions of AFFF and AFFF ARC type foam concentrates
were superior in extinguishing plastic fuel fires, when compared to plain water. Table 2. 7-1
below lists some of the results.
Table 2.7-1: Extinction Time for Common Plastics with Plain Water and 0.2% AFFF Solution23
Polycarbonate
Phenolformaldehyde
Polymethylmethacrylate
Polyoxymethylene
Polyethylene
Acrylonitrile-butadiene
sylene
Polypropylene
. ,-. -"-·c· ........... · __ • ____ :~.~~E.r~~~J1~i~~~-2·.-, .. ::;:~~ . ·;•: f:l~4f~W~l~tc \ ;;, .·
0:06
0:14
0:16
0:18
0:45
2:00
2:40
No Extinction
(Note- the application density was 0.38 kg/m2 per second)
0:08
0:06
0:08
0:11
0:50
0:40
0:20
2:25

28
Takahashi also examined the relationship between AFFF foam solution concentration and
extinction time. It was found that the extinction time was reduced as the concentration was
increased, but become constant beyond a certain concentration saturation level. This actual
concentration saturation level varied with the species of plastic. At concentration levels below
the saturation point it was concluded that concentration level - extinction time curves closely
followed the surface tension- concentration relationship.23

29
CHAPTER3.0 THEORY
3.1 Water As An Extinguishing Agent
Water is widely used as an extinguishing agent. This can be contributed to a number of factors
such as, plentiful supply, low cost, favourable non-toxic properties, chemical stability and good
fire suppression capabilities.
Water controls and extinguishes fires by a number of, or combination of mechanisms,
depending on the method of application. Suppression mechanisms include; cooling, oxygen
depletion, emulsification and dilution. The most dominant mechanism for suppression of Class
A solid fuel fires, with manual hose streams or sprinkler systems, is cooling. 24
The high latent heat of vaporisation (2260 kJ/kg) of water makes it an excellent cooling agent.24
Water cools the fuel surface and reduces the rate of pyrolysis of the fuel. The application of
water to a burning fuel initiates heat transfer from the fire to the water. Fire control is
established when the rate ofheat absorption to the water equals the net rate of heat release of the
fire. Suppression and water extinguishment are achieved when the rate of heat absorption of the
water exceeds the rate of heat release.24
The method of application, and type of delivery hardware, has an effect on the rate of heat
absorption by the water. Ideally, in order to maximise the amount of heat absorption, all of the
applied water should be converted into steam. Fire tests have revealed there is an optimum
droplet size (ie., 0.3-l.Omm) that should be applied to the fire.24 The smaller the droplet size the
greater the surface area, hence there is increased cooling capacity as the rate of heat absorption
is increased with the increased surface area. Limitations on droplet size exist as the individual
droplets must have sufficient mass and momentum to overcome the upward fire plume velocity
effects, and other gaseous currents which maybe present.24

30
3.2 Sprinkler Droplet Size & Distribution
Dundas25 undertook a series of experiments in order to find a relationship between the sprinkler
droplet size, head pressure and orifice diameter. Dundas' findings can be written in terms of the
Weber number, We;
dm =CD Expression 3.2-1 WeJIJ --
Where dm - mean droplet diameter (mm) D - sprinkler orifice diameter (mm) C - imperical constant (approximately 3.21) We - Weber number
We = pw U2 D Expression 3.2-2
cr
With pw - water density (1 000kg/m3)
cr -air-water interface surface tension (0.0073 Nlm) D - Sprinkler orifice diameter (mm) U - Water velocity through the sprinkler orifice (m/sec)
Since the flow through a sprinkler is given by,
Q = U1t d Expression 3.2-3
4
Where Q , - flow rate (m3 !sec)
and the dynamic pressure head term is,
P = pwr! Expression 3.2-4
Where P = orifice pressure (kglm.sec. 2)
Combining expressions 3.2-2 and 3.2-3 gives,
We= 16 pw if Expression 3.2-5
1t2 Q DJ
Combining expressions 3.2-2 and 3.2-4 gives,
We= PD Expression 3.2-6 cr
Combining expressions 3.2-1, 3.2-5 and 3.2-6 it can be shown that,
dm oc ff13 oc d Expression 3.2-7 - piiJ e/3
31
Expression 3.2-7 states that the mean droplet diameter is inversely proportional to the 1/3 power
of the water pressure and directly proportional to the 2/3 power of the sprinkler orifice diameter.
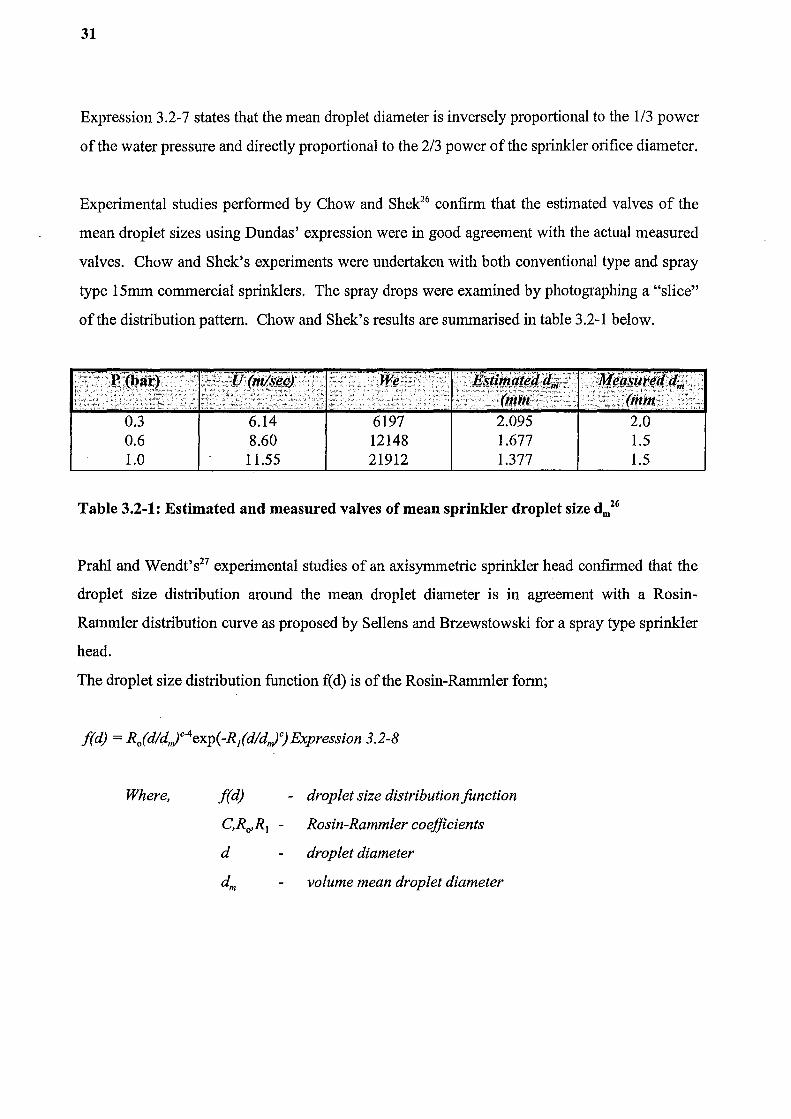
Experimental studies performed by Chow and Shek26 confirm that the estimated valves of the
mean droplet sizes using Dundas' expression were in good agreement with the actual measured
valves. Chow and Shek's experiments were undertaken with both conventional type and spray
type 15mm commercial sprinklers. The spray drops were examined by photographing a "slice"
of the distribution pattern. Chow and Shek's results are summarised in table 3.2-1 below.
;<~~j~- ;:~,"~(ll1lJ;}J~:- '.·· ~ .: -,:,-,; ····:·~)::~·:,.L:::·,/t~~;.:~;.
0.3 0.6 1.0
2.095 2.0 1.677 1.5
11.55 1.377 1.5
Table 3.2-1: Estimated and measured valves of mean sprinkler droplet size dm26
Prahl and Wendt's27 experimental studies of an axisymmetric sprinkler head confirmed that the
droplet size distribution around the mean droplet diameter is in agreement with a Rosin
Rammler distribution curve as proposed by Sellens and Brzewstowski for a spray type sprinkler
head.
The droplet size distribution function f(d) is of the Rosin-Rammler form;
f(d) = R0 (d/d,jc4 exp(-Rldldnl)Expression 3.2-8
Where, f(d) - droplet size distribution function
C,RO'R1 - Rosin-Rammler coefficients
d droplet diameter
dm volume mean droplet diameter

32
Prahl and Wendt found that with Rosin-Rammler coefficients of C=S.O, Ro = 0.6627 and R1 =
0.2651 the distribution placed 98% of the droplets sampled with their experimental work to
have diameters between 0.2mm and 3.2mm27•
Kumar et af8 concluded that the droplet diameter distribution of a commercial style
conventional sprinkler head can be seen as having a log-normal distribution.
3.3 Sprinkler Spray Distribution
Conventional or old style sprinkler heads have a deflector which is designed to distribute a
certain percentage of its water upwards in order to cool the roof or ceiling structure. Spray style
sprinklers distribute water in an umbrella hemispherical pattern, where all of the spray is
directed downwards.29 Figure 3.3-1 shows a typical distribution pattern for a standard spray
sprinkler.
Distribution pattern
from a standard spray sprinkler
4ft (1.3 m)
Figure 3.3-1: Typical spray pattern for a standard spray type sprinkler installed in the pendant position.29

33
The mass flux density of a sprinkler is a measure of an individual sprinklers radial water flux
distribution.26 Experimental work has demonstrated that the mass flux density for a standard
spray type sprinkler head will initially decrease to a minimum valve, then increase to a
maximum valve at a radial distance of approximately 1.6m. Beyond this distance the mass flux
density diminishes to zero.26 This pattern is graphically represented in Figure 3.3-2.
.~ ..
Ctatral , Middle , llemolo llertoa 1 ll.ecl•• 1 llecloa
-·' 'I
~ ~ m•lmla Q
H r:l·
!<: .. .. .. ~
' '
L2m 2m
' ",,, Spray sprinkler
Conventional sprinkler
Radial Distance
Figure 3.3-2: Variation in mass flux density as a function of radial distance from a sprinkler. 26
The spray distribution pattern for sprinklers with the same geometry and orifice size will
depend on the application pressure. The diameter of the circular coverage will increase with
increasing pressure, up to a limit, at which point it reduces and forms and elliptically shaped
pattern.3° Figures 3.3-3a, b, c, show the floor level spray patterns for a half inch nominal orifice
sprinkler with different applied pressures.

5.49m
Figure 3.3-3(a) P = 48kPa, Q = 58 lfmin
A = 2.32m2 w = 2.44 lfmin
5 49m
.-------+r--------,
E !D !D n
I
Figure 3.3-3(c) P = 1206 kPa, Q = 287lfmin
34
7.92m
r--------, .-+-+----Jc-r- - -- - -, I
I I I I I I I I I I I I I I I
-'---\-----1c-L----- ...J I ~---'"<--L-------...1
WETTED AREA
Figure 3.3-3(b) P = 483 kPa, Q = 182lfmin
A= 49m2 w = 3.75 lfmin/m2
Figures 3.3-3a, b, c: Effect of discharge pressure on floor level spray patterns.30
A= 15.79m2, A= 49m2 w = 18,35 lfmin/m
Due to obstructions caused by the arms of the sprinkler frame and the serrated edges of the
deflector, the spray pattern will not be axisymmetrical. Figure 3.3-4 shows the flow distribution ' '
pattern for a standard spray type pendant sprinkler head. High d~nsities occur in areas where
the flow contour lines are dose together.

35
Figure 3.3-4: Flow contours for a standard pendant spray sprinkler.27'
31
0 degrees

36
Prescriptive sprinkler standards require that a minimum discharge design density be achieved
by a group of sprinklers. The required design density and assumed area of operation will
depend on the potential fire load and the specific requirements of the prescriptive code.
Independent sprinkler approvals are based around this concept of achieving an average density
with a group of sprinklers. Underwriters Laboratories standard UL199 details two such tests; a
10 pan rotating table test and a fixed 16 pan test.32
3.4 Sprinkler System Suppression
Sprinkler suppression and control is based on pre-flash-over activation. Sprinklers33 can be
activated by either convective heat transfer or by radiation.
Convective heat transfer is the most dominant mode for the activation of sprinklers. This
occurs as a result of the rising fire plume interacting with the ceiling. The plume is directed
horizontally across the ceiling, forming a ceiling jet of hot gases. The immersion of the
sprinkler head in the convective hot gas layer causes the detection element of the sprinkler to
operate.30
Sprinkler heads can also be operated as a result of radiative heat transfer.33 This situation can
occur in the operation of an intermediate level sprinkler. If the sprinkler head is directly
engulfed by the rising fire plume it will be activated as a result of convective heat transfer. In
the case where the sprinkler head is not directly in the stream of the plume the radiation emitted
may be sufficient to activate the sprinkler.33 The activation response time of the sprinkler
depends on a number of factors such as; operating temperature, response time index (RTI),
height, geometry and thermal capacity of the ceiling, rate of fire growth and convective heat
output, vertical distance between the sprinkler and the ceiling, horizontal distance between the
sprinkler and the fire, and the presence of any air movement.33 A detailed analysis of the
aforementioned factors associated with detection and activation response is outside the scope of
this project.

37
The activation of the sprinkler head allows a stream of water to be directed at the impinging
deflector. The water leaves the deflector forming an umbrella shaped sheet. At some radial
distance from the sprinkler, atomisation of the sprinkler spray occurs.28 It has been reported that
a standard sprinkler will produce in the order of 108 water droplets at any one time.28 The
umbrella or hemispherical shaped discharge pattern, consisting of a range of droplet sizes, is
distributed to the immediate area.
The droplet surface area can be expressed in terms of the total flow rate and the mean droplet
diameter30
' As oc Q I dm Expression 3.4-1
Combining expressions 3.2-7 and 3.4-1 gives;
As ocP 113 Q Expression 3.4-2 D 213
The amount of heat absorbed by the sprinkler spray will depend on the total surface area of all
the water droplets, as shown in expression 3.4-2 above, and the difference in temperature
between the droplets and the ceiling hot gas layer.30 The depth of the hot gaseous layer on the
ceiling plume will also have an effect on the rate at which heat can be absorbed by the sprinkler
spray.
Sprinkler suppression or control is achieved by a combination of mechanisms. In addition to
producing cooling the discharged sprinkler droplets can assist in suppression by the depletion of
oxygen from the surrounding area.30 This suppression mechanism is applicable to small
enclosed sprinkler protected areas. In this scenario the droplets discharged by the sprinkler are
expanded to approximately 1,700 times their original volume as they are converted into water
vapor. The expanded water vapor depletes the oxygen around the fire area, thus assisting
suppression. 30
Sprinkler control of the fire is achieved by the combination of the sprinkler heads directly over
the fire operating and the adjacent heads pre-wetting the fuel. In order to achieve fire control
two energy balances must simultaneously occur, one at high level and one at the se~t of the fire.

38
At the seat of the fire sufficient water, with the correct droplet size, must be applied to reduce
the rate of combustion. At high level the spray from the sprinklers must have enough cooling
effect to absorb the heat of the fire plume and prevent the operation of unnecessary adjacent
sprinklers. If too many sprinklers are operated the sprinklers over the fire area will not be able
to apply sufficient density, hence the fire will continue to grow and control will be lost.30
3. 5 Sprinkler Suppression Model
It is useful to be able to conservatively estimate the effectiveness of sprinklers in reducing the
heat release rate of a fire. Evans has published an equation for the aforementioned scenario
which was derived by combining the results of previous experimental work undertaken by
Madrzykowski & Vettori, and Walton & Tamanini. 34 The experimental fire tests utilised a fuel
package consisting of either a 305mm or 610mm square wood crib. Suppression was achieved
using a standar4 pendant spray type sprinkler.
Madrzykowski & Vettori formulated a generic conservative equation for the reduction in heat
release rate for a series of various fuel packages. Their resulting equation is of the following
form:-
Q (t-tacJ I Q (tacJ = exp [- (t-tacJ I 435] Equation 3.5-1
Where,
Q (t-tacJ =post sprinkler activation heat release rate of the fire, kW
Q (tacJ =heat release rate at the time of sprinkler activation (tacJ; kW
This prediction has limitations as it is not applicable when the fuel is shielded from the
sprinkler spray pattern, or if the application density is less than 4.2 llmin/m2• In addition to the
above, the method proposed by Madrzykowski & Vettori does not accommodate for variations
in sprinkler density.

39
Walton35 undertook a series of tests of wood crib fires, which did account for variations in
sprinkler density. Walton's results gave an equation of the form. 34
Q (t-tacJ I Q (tacJ = exp [- (t-tacJ I 't] Equation 3.5-2
In equation 3.3-2 above, -r is a time constant for the post sprinkler activation, heat release rate
reduction.
Experiments conducted by Tamamni found that the time to extinguish a wood crib fire was
proportional to the water application rate per unit of exposed surface area.
Evans superimposed the finding of Walton's study on Tamanini's results by normalising the
crib height. These combined results gave a ''best fit" prediction for the time constraint as
Where,
-r = 2.0 x 10⁻⁵ (W" I Hcytss Equation 3.5-3
't =time constant (s)
W" = spray density (l/min/m2)
He= crib height (mm)
By substituting a value of610mm for the crib height into equation 3.5-3, equation 3.5-2 can be
rewritten as;
Q (t-tacJ = Q (tact) exp [- (t-tacJ I (3.0 I W"YI.85)] Equation 3.5-434
Equation 3.3-4 can be used to predict the reduction in the fire heat release rate of a wood crib or
furnishing fire during the suppression period, when water is applied from a standard spray type
sprinkler.34
Limitations exist to equation 3.5-4, as per Madrizykowski's & Vettori's equation, however
spray density is accounted for.

40
Figure 3.5-1 below shows the results obtained by Walton with a 61 Omm wood crib fuel package.
The results demonstrate the higher application density, the superior the rate of heat release
reduction. Walton found that extremely low application densities (ie., 2.34 l/min/m2) had no
effect on the rate of heat release reduction. 35
0. 30 r---.------r---.------r--,-----.----,,-----,-----r---,
0.27
0.24
~ 0.21
~-QJ 0.18 ..., ro a: QJ 0.15 U)
ro QJ rl QJ 0.12 a: ..., ro QJ 0.09 :I
0.06
0.03
0.00 0 50 100 150 200 250 300 350 400 450 500
Time (s)
Figure 3.5-1: 610mm wood crib heat release rates at varying densities.35
3. 6 Class A Foam Suppression
Class A foam concentrate is formulated from a mixture of specific hydrocarbon surfactants,
stabilizers, inhibitors and solvents. 4• 37 Appendix 1 lists the physical properties of various Class
A foam concentrates.

41
The addition of Class A foam concentrate to water alters the surface tension of the resultant
solution. Figure 3.6-1 below outlines the resultant surface tension values for Class A foam
solution.
SURFACE TENSION VS CONCENTRATION FOR THE AVERAGE OF SEVERAL CLASS A FOAMS
25 i 40
u; ~ " ffi .§ 301---~~-------------------~ ~ 20 ....-.. .... ..._-..~.~~•.___...-••-.. • 1-+-Averageofseverall o ~ I products . ~ ~ 10+-------------------------a:: c ~ ~ o~-.---.--.--.--.--.---.~ en- '
%CONCENTRATION
Figure 3.6-1: Surface tension valves for water and Class A foam solution.36
Note: Full details are given in Appendix 1.
42
The high surface tension properties of water causes the fonnation of large droplets or beads.
The fonnation of these larger droplets limits the contact surface area between the water and the
combustion fuel interface, thereby restricting the fire suppression ability.37
Class A foam solution, with its low surface tension, has the physical structure to spread easily
over the fuel and deeply penetrate the combustion char layer.37•
38 The increased surface area
between the suppression agent and the fuel will increase the rate of heat absorption.38
The addition of class A conc_~ntrate to water in low proportions (ie., 1 %) does not significantly
alter the specific heat capacity of the solution. Experiments conducted on two class A I%
solutions resulted in specific heat values of 4.17 J/g/K and 4.06 J/g/K respectfully. Pure water
has a specific heat value of 4.186 J/g/K. 39
Infrared imaging techniques conducted with droplets of pure water and class A solution
deposited onto a hardboard surface, show that the penetration rates of the two mediums are
within 10% of one another. These infrared tests also indicate that the average cooling rate of a
class A solution should be about 1.5 times that of pure water. This theoretical increased cooling
rate is explained by the increased area of coverage associated with the surfactants present in the
solution. The infrared imaging techniques demonstrated that the relative area of coverage of the
solutions was approximately 4 times that of the water, which remained "beaded" as a result of
its high surface tension. 39-
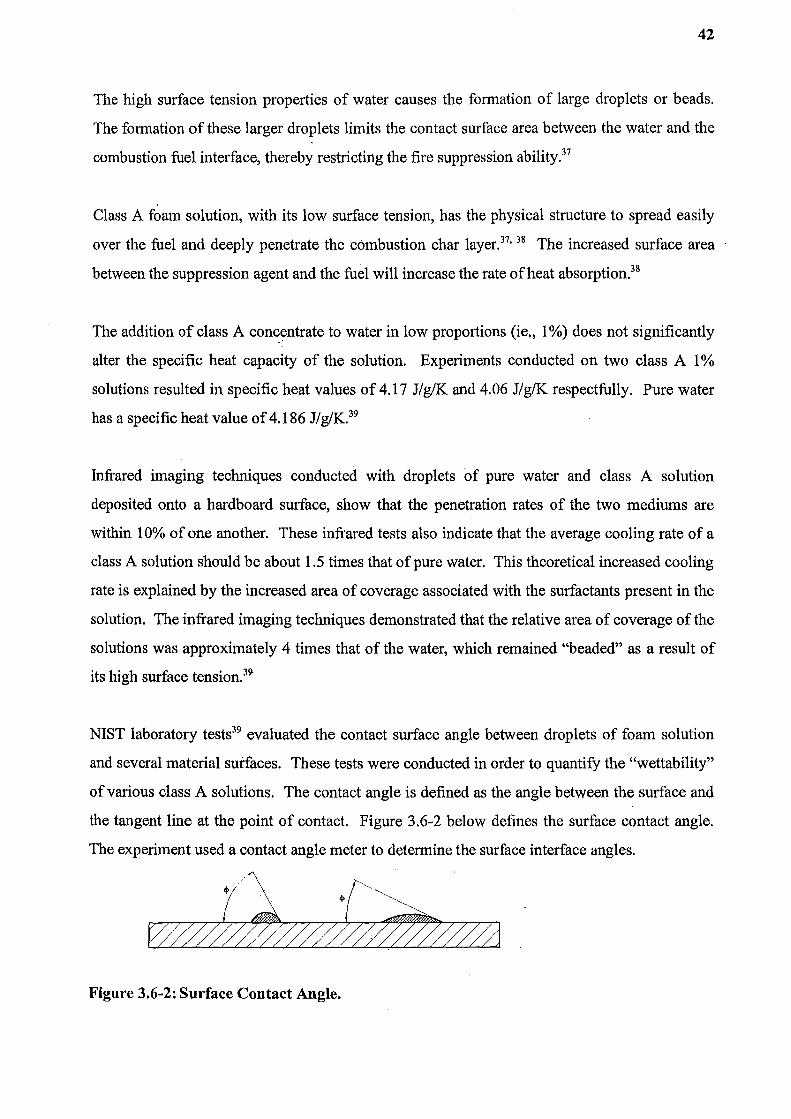
NIST laboratory tests39 evaluated the contact surface angle between droplets of foam solution
and several material surfaces. These tests were conducted in order to quantify the "wettability"
of various class A solutions. The contact angle is defined as the angle between the surface and
the tangent line at the point of contact. Figure 3.6-2 below defines the surface contact angle.
The experiment used a contact angle meter to detennine the surface interface angles.
Figure 3.6-2: Surface Contact Angle.

43
The experiments found that the class A foams had significantly reduced contact angles
compared to that of pure water. This property leads to a droplet of class A solution covering a
larger surface area compared to pure water, hence the rate of cooling will be increased.39
The reduced surface tension of class A foam solutions has the potential to produce smaller
droplets when mechanically adjacated by a fire fighting nozzle or sprinkler head, compared to
plain water. The increased number of smaller droplets would provide an overall greater surface
area, hence theoretically class A foam solutions would have superior cooling properties.
Experimental work has been und~rtaken to examine the droplets produced by a typical fire
fighting fog nozzle (at 690kPa and 36 1/min) with both plain water and various class A
solutions. In this study droplet measurements were made with an optical laser probe with the
capacity to measure droplets in the range of 30 Jlm to 1860 Jlm. The experiment produced data
for the DvO.S, Dv0.9 and Dv0.99 for the different agents and plain water at various distances
from the centre line of an overhead nozzle. These tests found that all the agent solutions tested
produced different results. In brief, the droplet diameters of a foam solution produced by a
typical fire fighting nozzle maybe larger or smaller than the droplets formed from pure water.39
The droplet diameters formed will vary with the different manufacturers agent formulations.
Colletti claims that the hydrocarbon surfactants within class A foams will be attracted to the
carbon compounds present in a class A fuel, and will therefore form a cooling foam blanket
which allows the solution to cling to the surface and provide cooling and fuel penetration over
an extended period oftime.37
Secondary fire suppression mechanisms associated with class A foam include; the suppression
of gaseous combustion products by the foam layer and the reflection of heat by the white
foam.37•
38
To date no mathematical model exists for foam extinguishment. Any future models must be
based on experimental work. 40

44
3. 7 Foam Expansion Ratio And Its Effect On Suppression
The proportioning ratio for class A foam solutions varies from 0.1% to 1%, depending on the
nature of the fuel being protected and the application hardware.
Aspirated foam is formed 'by the addition of air to foam solution prior to application discharge.
For manual fire fighting purposes this is achieved by using an aspirating type discharge nozzle
or by injecting compressed air into the foam solution as in the case of a CAPS system.
Foam water deluge systems utilise an aspirating type sprinkler head. These sprinkler heads
aspirate the foam by either entraining air into the foam solution or by mechanical adjacation
using a mesh type of diffuser. Figure 3.7-1 shows a typical foam water sprinkler. Foam
solution is first transformed into spray. The velocity of the solution then acts to entrain the
surrounding air through a venturi action.
This aspirated foam is developed in a mixing chamber. Upon exiting the mixing chamber the
aspirated foam solution is directed to the deflector which distributes the suppression agent to the
fire. This type of head requires a minimum pressure of about 207 kPa in order to be effective.40
SOLUTION
INLET\
Figure 3.7-1: Aspirated foam formation for a foam water sprinkler.41 · -

45
A mesh type diffuser head as shown in figure 3.7-2 can be used to form aspirated foam. This
type of head is dependent on mechanical interaction between the foam solution and mesh, to
break the foam solution stream and aspirate the individual droplets.
Figure 3. 7-2: Mesh type diffuser aspirating head.
Based on current technology no closed head aspirating foam sprinkler exists. For this reason
closed head foam water sprinkler systems currently use standard spray type sprinkler heads.
The expansion ratio of an aspirated foam is defined as, the ratio of final foam volume to the
original foam solution volume, as in accordance with NFPA-11.42 In mathematical form this
relationship can be represented as;
Where,
E = Va + VfsEquation 3. 7-1
Vfs
E - expansion ratio
Va - volume of air
Vfs- volume of foam solution

46
A low expansion foam is defined as having an expansion ratio of less than 20.42 The various
foam generating hardware arrangements such as CAFS, foam-water aspirating sprinklers and
standard sprinklers, all generate low expansion finished foams. The typical expansion ratios
associated with the various hardware arrangements varies considerably as listed in table 3. 7-1.
Foam-Water Sprinklers* 3.4:1-4.3:1 Standard Spray Sprinklers * 2.2:1-2.3:1 Compressed Air Foam System+ 4:1-20:1
Notes * Tests undertaken with AFFF for Hangar deluge systems tested by Factory Mutual Research Corporation40
+Tests undertaken with AFFF produced by a ftxed overhead CAFS14
Table 3.7-1: Foam expansion ratios for various discharge hardware devices.
The optimum foam expansion rate will vary for different fuel applications.38 The suppression of
a deep seated class A fire is best achieved by using a non-aspirated, or low expansion type,
foam. In this situation the reduced surface tension of the class A foam solution permits deeper
penetration into the char layer and maximises the wetting surface area.37. 38
Aspirated foam is best applied when exposure protection is required.37•
43 Aspirated type foams
are more viscous than non-aspirated foams, and tend to adhere well to vertical surfaces.38 The
aspirated foam layer forms a vapor seal on the fuel that contributes to extinction by removing
oxygen from the fuel interface boundary.38 A secondary suppression characteristic of aspirated
foam is the ability of the foam layer to insulate the fuel from the heat and flames of the fire.
The foam layer acts as a barrier by preventing radiation from the flame reaching the fuel. This
characteristic makes aspirated foam ideal for providing exposure protection. 37 Aspirated foam,
with its developed bubble structure array, provides a slow draining supply of water to cool the
fuel.
3.8 Aspirated Foam Stability
Kim et a144 has documented recent theories on aspirated foam stability and collapse based on the
findings of previous work undertaken by Lemlich, Durian, Sita et al and Guraray et al.

47
The formation of aspirated foams, by hardware devices such as sprinklers and aspirating fire
fighting nozzles, typically produces a finished foam with a large foam water distribution of
bubble sizes. Smaller bubbles have higher internal gas pressures than larger bubbles. This
pressure difference causes diffusion from small bubbles to larger bubbles, where the rate of
diffusion is proportional to the difference in pressures within the foam bubbles.
From Laplace & Young's law, it follows that44;
l!.p = 2y ( _.!._ - ..!. ) Equation 3.8-1 rs re
Where,
l!,.p = pressure difference
y = surface tension
rs = small bubble radius
re = large bubble radius
Lemlich formulated an expression for the change in size of a single bubble;
dr 1 1 -d = K (---)Equation 3.8-2
t r12 r ,
Where,
r = bubble radius
K = proportionality constant (inclusive of 11 P)
ri2 (t) = J"' r2F(r,t)dr
0
J"' rF(r,t)dr 0
F(r,t) = bubble size distribution function
Equation 3.8-2 demonstrates that aspirated foams with a large bubble distribution size will
decay more rapidly due to the internal pressure differences. This scenario results in increased
drainage rates, as the foam solution film decays to form plateau borders which join to form a
drainage network44•
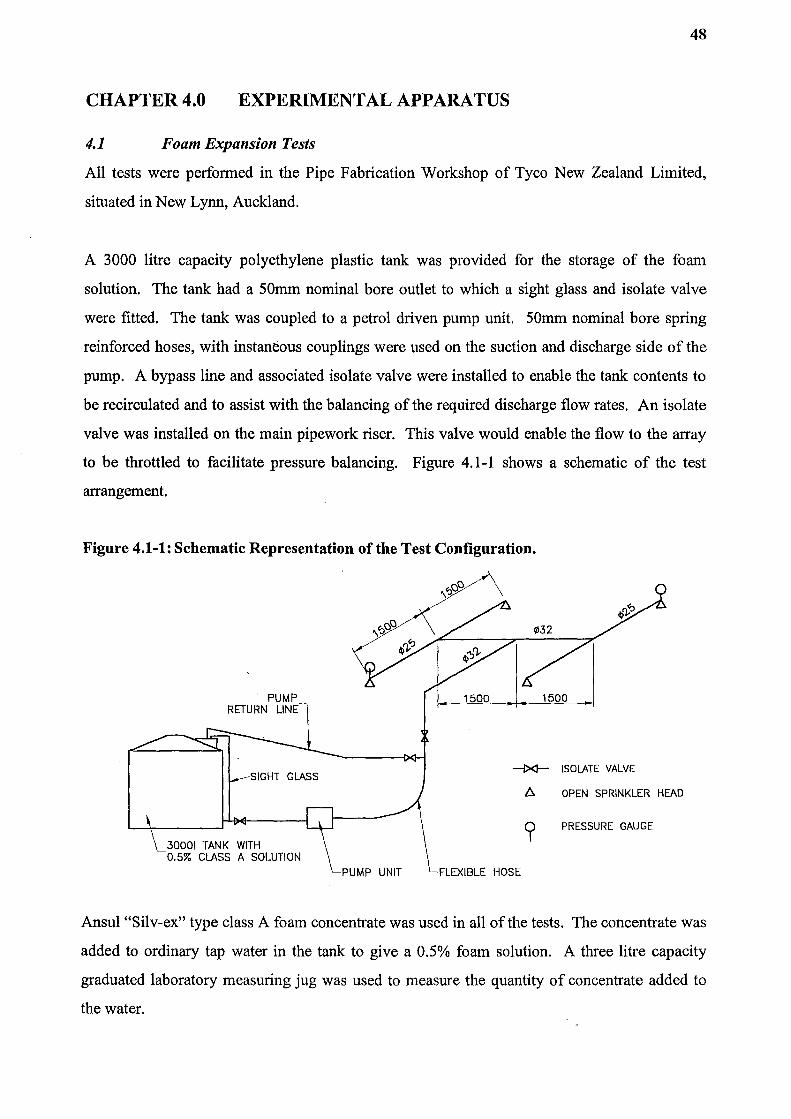
48
CHAPTER4.0 EXPERIMENTAL APPARATUS
4.1 Foam Expansion Tests
All tests were performed in the Pipe Fabrication Workshop of Tyco New Zealand Limited,
situated in New Lynn, Auckland.
A 3000 litre capacity polyethylene plastic tank was provided for the storage of the foam
solution. The tank had a 50mm nominal bore outlet to which a sight glass and isolate valve
were fitted. The tank was coupled to a petrol driven pump unit. 50mm nominal bore spring
reinforced hoses, with instaneous couplings were used on the suction and discharge side of the
pump. A bypass line and associated isolate valve were installed to enable the tank contents to
be recirculated and to assist with the balancing of the required discharge flow rates. An isolate
valve was installed on the main pipework riser. This valve would enable the flow to the array
to be throttled to facilitate pressure balancing. Figure 4.1-1 shows a schematic of the test
arrangement.
Figure 4.1-1: Schematic Representation of the Test Configuration.
1500
SIGHT GLASS -1><1- ISOLATE VALVE
6. OPEN SPRINKLER HEAD
PRESSURE GAUGE
30001 TANK WITH 0.5% CLASS A SOLUTION
PUMP UNIT
Ansul "Silv-ex" type class A foam concentrate was used in all of the tests. The concentrate was
added to ordinary tap water in the tank to give a 0.5% foam solution. A three litre capacity
graduated laboratory measuring jug was used to measure the quantity of concentrate added to
the water.

49
A balanced pipework array was constructed in accordance with UL standard 199, Part 31.32
This array had the capacity to flow four sprinklers. The array was suspended from a bracket
arrangement which was fixed to the floor and the adjacent side wall of the workshop. Two
pressure gauges, complete with gauge snubbers, were fixed to the sprinkler tees at opposite ends
of the array.
A foam slider board and collector, manufactured in accordance with the guidelines detailed in
chapter 11 of NFP A standards, 42 was used for collecting the expanded foam solution from the
overhead sprinkler array. Analysi~ of the discharged foam solution was undertaken using an
electronic scale balance, stop watch and graduated cylinder.
To assist in the containment of the discharged foam solution the perimeter of the test area was
boxed out with a temporary rough sawn timber nib wall, of approximately 200mm in height. A
plastic liner was placed on the floor and .fixed to the timber nib wall arrangement to provide a
dam to contain the discharged solution. At one end of the test area sandbags were positioned to
enable the drainage of the foam solution directly into an inlet of the towns sewer network.
Table 4.1-1lists a summary ofthe equipment used in the foam expansion experiments.
Table 4.1-l:Summary of equipment used in the Foam Expansion Experiments.
Foam Slider- collector board
Solution Storage Tank
Pump Unit
Weighing Scales Pressure Gauges
Pipework
Measuring Devices
Foam Concentrate
Manufactured in accordance with NFPA-11 (refer to figure 4.1-2 for details) 3000 litre capacity polyethylene plastic tank, 1800nun nominal diameter, 1500mm high manufactured to ASTMD standard 1998-91. Wacker model PT2 centrifuged pump directed coupled to a Honda 5Hp model GX140 petrol powered internal combustion engine. Toledo electronic scales, model no. 8581. Gauge 1 0-250kPa, 100mm full face, liquid filled. Gauge 2 0-160kPa, 1 OOmm full face, liquid filled. Manufactured to BS 1387 - medium grade, mill galvanised. • IOOOml capacity scientific graduated measuring
cylinder. • 500ml capacity scientific graduated measuring
cylinder. Ansul Silv-ex (0.5% solution).

Figure 4.1-2: Foam Slider Collector Board.
26 in. (660.4 mm)
1600-ml / foam container
( 16.5 in.
(419.1 mm)
V-ber protective guard
4.2 Foam Distribution Tests
50
The same test configuration was used for foam solution distribution tests as described in section
4.1 above. The distribution tests were based on the UL standard 199, 16 pan method.32 Sixteen
open collection pans with dimensions, (305mm x 305mm x 305mm), were located under the
centre of the array as shown in figure 4.2-1. Foam solution was supplied from the tank and
pump arrangement, described in section 4.1 above.
The electronic scale, described in table 4.1-1, was used to determine the mass of the pans before
and after the solution was discharged through the overhead array.

51
Figure 4.2-1: Foam Distribution Test Array.
1525 1525
¢25 ¢25 .. ,
""' -~ OFF N x305~ I")
16 305
COLLECTION T RAYS ---~-: "&
0 0 n N
0 0 n
¢32
""
" ~ N ..--
N I") "&
¢~ 5 ¢25
1220
PLAN VIEW
1::: l 1::: ~I •
25x 1 5 ELBOW ') AND SPRINKLER_/
16 OFF COLLECTION TRAYS
ELEVATION
L[) N L[) ..---
L[)
N L[) ..---

52
CHAPTERS.O EXPERIMENTAL PROCEDURE
5.1 Foam Expansion Tests
A series of tests were conducted to investigate the relationship between sprinkler head discharge
pressure and foam expansion ratio.
Water was added to the storage tank and the volume calculated by measuring the height of
water added and knowing the diameter. The required amount of foam concentrate was added to
give a 0.5% foam solution. With the sprinkler array isolate valve closed and the bypass valve
opened the pump was started to enable the solution to be circulated and uniformly mixed. The
bypass valve was closed following this task.
For each of the foam expansion tests the pump was started and the pipework array isolate valve
slowly opened until a steady state condition at the desired test pressure was obtained. The two
pressure gauges, located on the opposite sides of the array were monitored for the desired
pressure and adjustments made to the isolate valve if required.
Prior to undertaking the tests the mass of the collector stand and the empty collector were
determined. The collector was filled with tap water and weighted, in order to determine its
capacity.
The collection and analysis of the expanded foam was carried out in accordance with the t~st
procedures detailed in chapter 11 of NFP A standards.42 Upon a steady state condition being
reached at the desired test pressure, the foam container was positioned in the foam-slider
collection apparatus. The container was removed from the foam-slider apparatus and discharge
area once it was full. Care was taken to avoid spillage and additional solution from entering the
container during its removal from the discharge area. Using a dry cloth the solution on the
outside was wiped of the collection container. The container was placed on a purpose built
stand on the electronic scales in order to measure the gross mass of the stand, foam collector
and expanded solution.

53
Tests to determine the 25% drain time were performed by two methods. In the case of fast
draining foams, initially a 500ml calibrated container was used (ie., Tests 1-3). For later tests a
1 OOOml graduated measuring cylinder was used. Times were recorded for the drained solution
to reach various levels in the measuring cylinders. For tests (12-17) the hindsight of experience
showed that the above method was not ideal. A large proportion of the solution drained
contained expanded foam, hence the drained volume did not equate to the weight of solution
present. For these tests the decrease in mass of the original solution was recorded at various
time intervals. All expansion and 25% drain tests involved two personnel.
Due to the limiting characteristics of the pump performance curve the number of sprinklers
flowed within the array varied depending on the desired head pressures. In the case where low
pressures were required (ie., 50kPa) all four heads were operated. Foam expansion tests were
also conducted with two and single heads operating. In these situations the redundant sprinkler
elbows were plugged.
When four and two heads were operated the foam-slider collector board was located in the
centre of the array. Single head tests were conducted with the foam-slider collector board
located at a radius of 1.2m from the centre line of the sprinkler deflector and orientated so the
slope of the board faced the discharging head, (refer to figures 5.1-l(a) and (b)).
In all tests the frame arms of the individual sprinklers were orientated parallel with branch lines.
Additional foam expansion tests were performed on foam-water type sprinklers and large drop,
high challenge type sprinklers. Both of these heads operate a high discharge pressures. Ideally
it would have been advantageous to test these heads at a range of elevated pressures, however
due to the limiting capacity of the pump the heads were only tested at the highest pressure
available.

Figure 5.1-1(a): Position of Foam-Slider when operating 4 and 2 sprinklers.
1525 1525
¢25 ¢25
N 1'0 L[) s N
L[) .--
¢32 r- r--
'-- f-
L[) N
N L[)
1'0 .--s
¢25 ¢25 ~
Figure 5.1-1(b): Position of Foam-Slider when operating a single sprinkler.
¢25
1525
¢25
¢25
.. ,
L[) N L[)
L[) N L[)
54
55
5.2 Foam Distribution Tests
Foam distribution tests were conducted in accordance with UL standard 199, 16 pan method.32
Four, 15mm nominal bore orifice spray type pendant sprinklers were operated at a pressure of
52kPa in order to give the required test flow rate.
Preliminary discharge tests were conducted to obtain a steady state pressure of 52kPa at the
sprinkler heads. Following this task the sprinkler/gauge tee fittings on the discharge array were
replaced with reducing elbows as per the requirements ofUL standard 199.32
The 16 collection pans were initially permanently numbered and their dry weights recorded.
The empty pans were located in the centre of the discharge area and butted together in a four by
four array. A plumb bulb was used to check that the centre of the pan array was located in the
centre of the discharge pipework configuration.
The initial level of the foam solution storage tank was recorded. This step was performed as a
check on the overall flow rate, since the discharge time and final tank solution level could also
be determined.
The stop watch was started at the commencement of the flow of solution through the sprinklers.
The pump was allowed to run for a period of approximately 10 minutes in accordance with UL-
199.32 (Refer to chapter 6 for details).
The outside surfaces of the individual collection pans were first dried with a cloth and their
gross weights recorded. The final level of the foam solution storage tank was recorded. The
tank was refilled with foam solution and the test repeated after sprinkler heads on the opposite
ends of the discharge array were transposed.
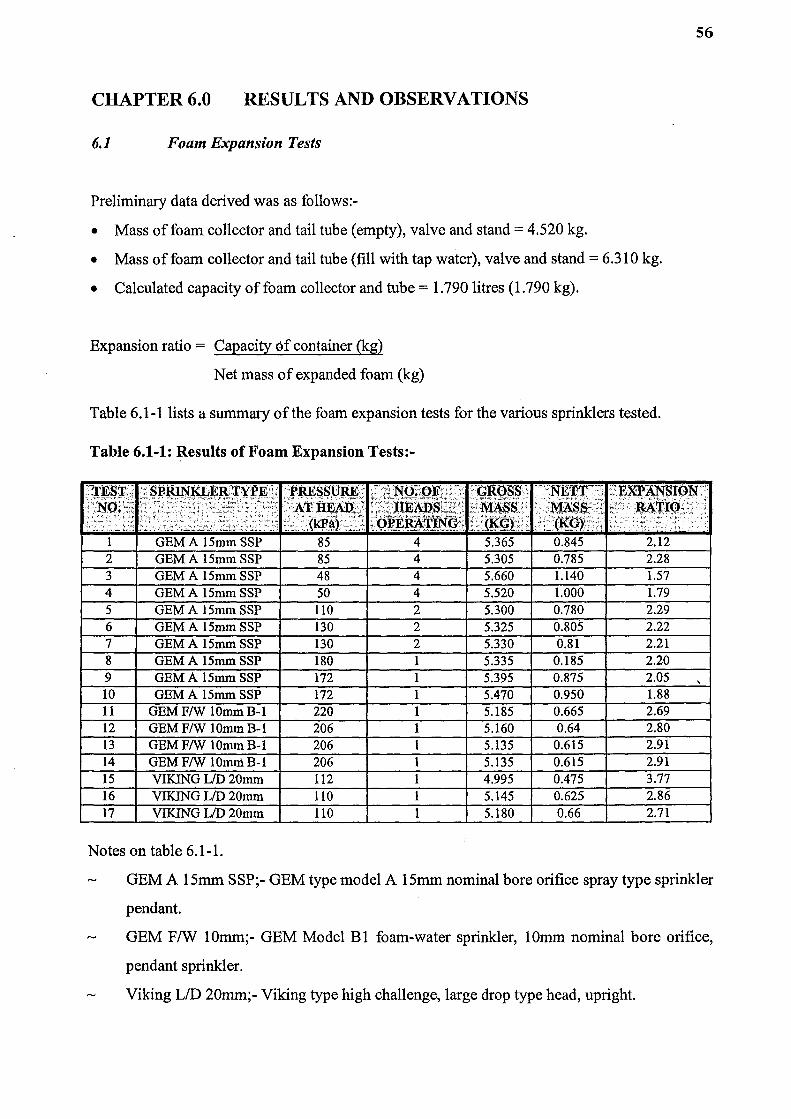
56
CHAPTER6.0 RESULTS AND OBSERVATIONS
6.1 Foam Expansion Tests
Preliminary data derived was as follows:-
• Mass of foam collector and tail tube (empty), valve and stand= 4.520 kg.
• Mass of foam collector and tail tube (fill with tap water), valve and stand= 6.310 kg.
• Calculated capacity of foam collector and tube= 1.790 litres (1.790 kg).
Expansion ratio = Capacity of container (kg)
Net mass of expanded foam (kg)
Table 6.1-1 lists a summary of the foam expansion tests for the various sprinklers tested.
Table 6.1-1: Results of Foam Expansion Tests:-
1 GEM A 15mm SSP 85 4 5.365 0.845 2.12 2 GEM A 15mm SSP 85 4 5.305 0.785 2.28 3 GEM A 1Smm SSP 48 4 5.660 1.140 1.57 4 GEM A 15mm SSP 50 4 5.520 1.000 1.79 5 GEM A 15mm SSP 110 2 5.300 0.780 2.29 6 GEM A 15mm SSP 130 2 5.325 0.805 2.22 7 GEM A 15mm SSP 130 2 5.330 0.81 2.21 8 GEM A 1Smm SSP 180 1 5.335 0.185 2.20 9 GEMA 15mm SSP 172 1 5.395 0.875 2.05 10 GEM A 15mm SSP 172 1 5.470 0.950 1.88 11 GEM F/W 10mm B-1 220 1 5.185 0.665 2.69 12 GEMF/W10mmB-1 206 1 5.160 0.64 2.80 13 GEMF/W 10mmB-1 206 1 5.135 0.615 2.91 14 GEM F/W 10mni B-1 206 1 5.135 0.615 2.91 15 VIKING UD 20mm 112 1 4.995 0.475 3.77 16 VIKINGUD20mm 110 1 5.145 0.625 2.86 17 VIKINGUD20mm 110 1 5.180 0.66 2.71
Notes on table 6.1-1.
GEM A 15mm SSP;- GEM type model A 15mm nominal bore orifice spray type sprinkler
pendant.
GEM F/W 10mm;- GEM Model B1 foam-water sprinkler, 10mm nominal bore orifice,
pendant sprinkler.
Viking LID 20mm;- Viking type high challenge, large drop type head, upright.

57
Figure 6.1-1: Expansion Ratio as a Function of Pressure.
z 0 (/)
SPRINKLER HEAD PRESSURE vs EXPANSION RATIO FOR GEM MODEL A 15mm SSP HEADS
2.50
2.00 • •
• • • • • • •
zo 1.50 <(_ C..J-
tj~ I· EXPANSION RATIO I .
1.00 :!: <( 0.50 0 u.
0.00
0 50 100 150 200
PRESSURE Kpa
Table 6.1-2: Results of25% Drain Tests.
, ... 'o;_:=_,:.,...::
2 85 2.28 13 3 GEM A 15mm SSP 48 4 1.57 21 4 GEM A 15mm SSP 50 4 1.79 25 5 GEM A 15mm SSP 110 2 2.2'9 17 6 GEM A 15mm SSP 130 2 2.22 18 7 GEM A 15mm SSP 130 2 2.21 12 8 GEM A 15mm SSP 180 1 2.20 16 9 GEM A 15mm SSP 172 1 2.05 12 10 GEM A 15mm SSP 172 1.88 13 11 GEMF/W 10mmB-1 220 2.69 14 12 GEMF/W 10mmB-1 206 2.80 17 13 GEM F/W 10mm B-1 206 2.91 31 14 GEM F/W 10mm B-1 206 2.91 36 15 VIKING LID 20mm 112 3.77 14 16 VIKING LID 20mm 110 2.86 6 17 VIKING LID 20mm 110 2.71 22
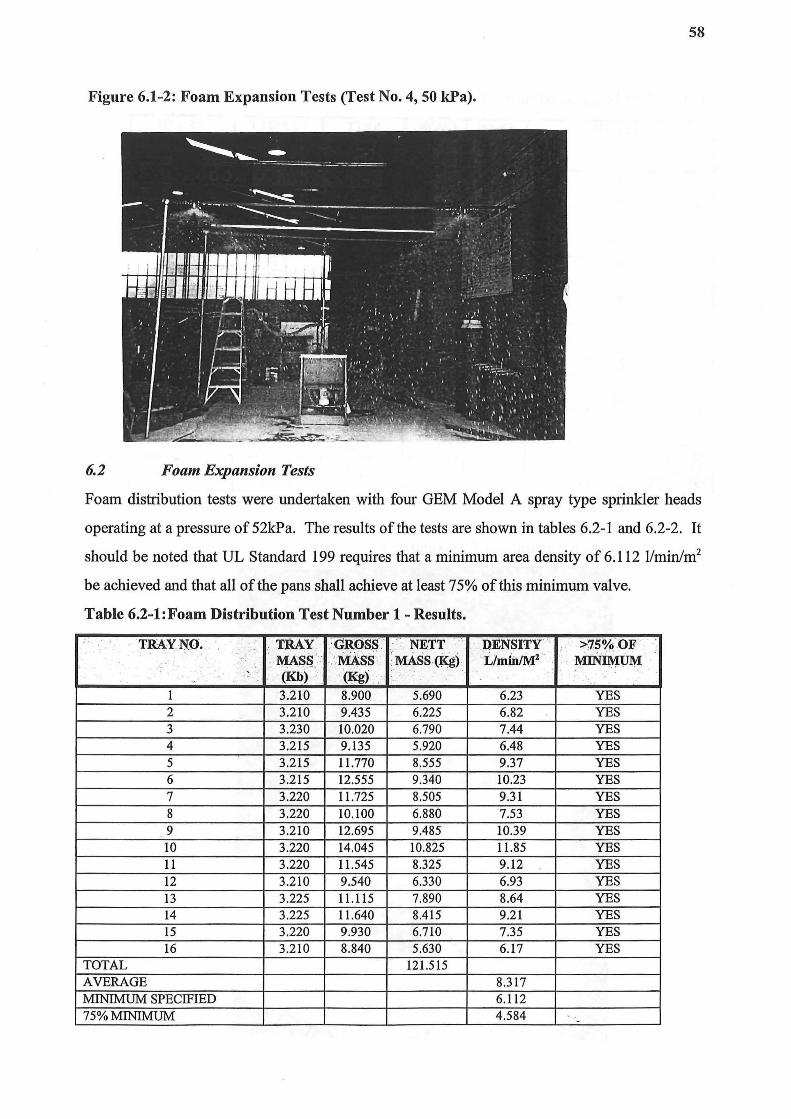
58
Figure 6.1-2: Foam Expansion Tests (Test No.4, 50 kPa).
6.2 Foam Expansion Tests
Foam distribution tests were undertaken with four GEM Model A spray type sprinkler heads
operating at a pressure of 52kPa. The results of the tests are shown in tables 6.2-1 and 6.2-2. It
should be noted that UL Standard 199 requires that a minimum area density of6.112 l/min/m2
be achieved and that all of the pans shall achieve at least 75% of this minimum valve.
Table 6.2-1:Foam Distribution Test Number 1- Results • . . · TRAY.NO. · ; . Tj'{AY ;GROSS .· NEJ'T DENSITY ·• >75%0li' ·. . . . :,-; :··.mss· M¥s~) ;'L/~·inJMz , .. . MINiMVM .. ~s~ ·. ·.·
' . · (Kb) . .'~) .. . l .
1 3.210 8.900 5.690 6.23 YES 2 3.210 9.435 6.225 6.82 YES 3 3.230 10.020 6.790 7.44 YES 4 3.215 9.135 5.920 6.48 YES 5 3.215 11.770 8.555 9.37 YES 6 3.215 12.555 9.340 10.23 YES 7 3.220 11.725 8.505 9.31 YES 8 3.220 10.100 6.880 7.53 YES 9 3.210 12.695 9.485 10.39 YES 10 3.220 14.045 10.825 11.85 YES 11 3.220 11.545 8.325 9.12 YES 12 3.210 9.540 6.330 6.93 YES 13 3.225 11.115 7.890 8.64 YES 14 3.225 11.640 8.415 9.21 YES 15 3.220 9.930 6.710 7.35 YES 16 3.210 8.840 5.630 6.17 YES
TOTAL 121.515 AVERAGE 8.317 MINIMUM SPECIFIED 6.112 75%MINIMUM 4.584 .. -

59
Table 6.2-2: Foam Distribution Test Number 2.
TRAY NO. TRAY GROSS NETT DENSITY >75% OF MASS MASS MASS (Kg) L/inin!M2 MINIMUM (Kb) (Kg)
1 3.210 7.83 4.620 4.89 YES 2 3.210 9.41 6.200 6.57 YES 3 3.230 9.55 6.320 6.69 YES 4 3.215 7.365 4.150 4.40 NO 5 3.215 8.75 5.535 5.86 YES 6 3.215 10.145 6.930 7.34 YES 7 3.220 10.52 7.300 7.73 YES 8 3.220 8.37 5.150 5.45 YES 9 3.210 9.005 5.795 6.14 YES 10 3.220 11.905 8.685 9.20 YES 11 3.220'· 15.645 12.425 13.16 YES 12 3.210 13.485 10.275 10.88 YES 13 3.225 8.51 5.285 5.60 YES 14 3.225 11.375 8.150 8.63 YES 15 3.220 17.59 14.370 15.22 YES 16 3.210 16.32 13.110 13.88 YES
TOTAL 124.300 131.65 AVERAGE 8.228 MINIMUM SPECIFIED 6.112 75%MINIMUM 4.584
Figure 6.2-1: Foam Distribution Test Number 1.

60
Figure 6.2-2: Foam Distribution Test Number 2.
6.3 Discussion
• Foam Expansion Tests
Figure 6.1-1 indicates that there is an increase in the foam expansion ratio when the applied
pressure is increased from 50kPa to 85kPa. Beyond this pressure, higher expansion ratios were
not obtained with further pressure increases.
The results of any previous experimental work relating to foam expansion, with class A foam
and standard sprinklers, could not be found. Tests undertaken by Factory Mutual Research
Corporation with 3% AFFF foam solution and standard sprinklers resulted in expansion ratios
in the range of2.2-2.3.40 These tests were conducted at a pressure of97kPa and an elevation of
18.3m. These results are very similar to the tests undertaken in this research at a similar
pressure, (ie., tests 1 and 2 gave expansion ratios of2.12 and 2.28 at a pressure of 85kPa).
There is a significant difference between the elevation level of the sprinkler heads in the Factory
Mutual tests40 (ie. , 18.3m elevation), compared to the class A foam tests conducted in this
project (ie., 2.7m elevation). The effect of elevation on expansion ratio could not be examined
in the test series due to physical limitations of the building in which the tests were conducted.

61
It was anticipated that further slight increases in the expansion ratio would have occurred as the
pressure was increased beyond 85k:Pa. The limitation associated with the pump as detailed
earlier may have had an affect on the results of the tests. In tests 1-4 the pump had the capacity
to flow all four heads at the required pressure. In the case where only two or one head was
operated the overall density associated with the discharge array would have been lower. In this
situation the time required to fill the foam collector with foam would have ·been longer. With
such a relatively low expansion foam, this additional time required to fill the foam collector
would have given the existing foam more time to drain. Such an effect would have an impact
on the 25% drain times and the expansion ratio results.
• 25% Drain Times
In all of the tests the expanded foam exhibited fast drain times. Tests undertaken with the foam
collector apparatus and pure water showed that 25% of the collector capacity could be drained
in 15 seconds. Similar times were obtained for most of the foam tests conducted, hence the
drain times can be categorised as being "instantaneous".
Tests undertaken by Factory Mutual Research Corporation with 3% AFFF and standard
sprinklers obtained 25% drain times between 0.5-1.3 minutes (30-78 seconds).40
• Distribution Tests
Tests 1 and 2 achieved average densities of 8.3 l/min/m2 and 8.21/min/m2• These valves are in
excess of the minimum average valve stipulated by UL Standard 199 (ie., 6.1 l/minlm2). Tests
conducted by Factory Mutual Research Corporation, with the same heads at the same flow rate
with pure water, gave average density figures of 10.6 l/min/m2, 11.81 l/min/m2
, 8.9 l/minlm2
and 8.6 l/min/m2 for four repetitive tests that were undertaken.45

62
UL Standard 199 also stipulates that all of the pans must achieve a minimum density of 75% of
the required average valves. 32 This requirement equates to a density of 4.58 l/min/m2 being
obtained in all collection pans. In test number 1 this minimum valve was achieved in all trays.
In test number 2 all but one of the trays (tray number 4) achieved this requirement. The density
obtained in tray number 4 was slightly under the minimum valve (ie., 4.4 l/min/m2).
The results show that there was considerable variation between the densities achieved in
identical tray numbers for the two tests. Figure 6.3-1 shows this variation graphically. No
logical explanation could be found for this variation. Tests conducted by Factory Mutual with
pure water produced results with similar valves when repeated.45 These results are shown in
figure 6.3-2.
Figure 6.3-1: Density Variation for Tests 1 and 2.
16.00
- 14.00 N ::2: 12.00 -z ::2: 10.00 ::J 8.00 -~ 6.00 en z 4.00 w 0 2.00
0.00
DENSITY VARIATION FOR TEST 1& 2
1 2 3 4 5 6 7 8 9 10 11 12 13 14 15 16
TRAY NO
lEJ TEST 1 DENSITY Llmin/M2
• TEST 2 DENSITY Llmin/M2

63
Figure 6.3-2: Density Variation for Tests Conducted by Factory Mutual with Plain Water.45
-N < ::!E -c: '§ ::J -~ en z w c
25.00
20.00
15.00
10.00
5.00
0.00
DENSITY VARIATION FOR TESTS CONDUCTED BY FMRC WITH PLAIN WATER
1 2 3 4 5 6 7 8 9 10 11 12 13 14 15 16
TRAY NO
IIi Series 1
11Series2
CHAPTER 7.0 ENVIRONMENTAL AND TOXICITY CONSIDERATIONS
7.1 Introduction
64
This chapter examines the potential environmental implications associated with a class A foam
based sprinkler system. ·Increased global environmental concerns have seen more stringent
requirements demanded by Governments and local environmental authorities. Standards and
codes of practice are increasingly changing to incorporate environmental considerations.
In relation to fire protection -practices environmental issues such as , "fire run off water" and
foam systems have been given more attention. The 1998 edition of the NFP A Standard for Low
Expansion Foam (NFPA - llt2 has incorporated a section on foam environmental issues.
NFPA Standard 298,46 has specific sections for the testing and acceptance of class A foams in
relationship to; toxicity, biodegradability and fish toxicity. The USDA Forest Service as part of
it's National Wildfire Suppression Technology Programme47 has completed a comprehensive
set of data relating to the environmental impact of several class A foams.
The discharge of foam solution from a class A foam sprinkler system into the environment
could occur as a result of a genuine fire occurring. In this situation the associated "run off'
water would be composed of class A foam solution and other contaminates associated with the
nature of the fire and goo.ds being protected. The discharge of foam solution to the environment
would also eventuate as a result of mechanical damage or the failure of maintenance and service
personnel to follow the correct isolation and test procedures. In a similar manner an
environmental discharge of foam concentrate could occur during filling or servicing activities,
or as a result of mechanical damage or failure of the associated concentrate storage tank and
pipework.

65
7.2 Toxicity
The implementation of a class A foam sprinkler system could possibly result in personnel being
in contact with foam concentrate or solution. In accordance with good health and safety
practices it.is prudent to identify and evaluate the potential hazards and establish guidelines or
design practices which would see such hazards either eliminated or minimised. The resultant
design safety features and procedures would have to meet the requirements of a number of
interest groups such as; local health authorities, union or employee groups and fire service
personnel.
The toxicity of several class A foams were examined as part of the USDA Forest Service
National Wildfire Suppression Technology Prograrnme.47 These tests were undertaken in order
to ensure that the use of class A foam did not result in increased risks to fire fighters, the
general public or the environment. This programme required that foam manufacturers disclose
all ingredients within their formula. Some manufacturers class A formulation did contain
compounds that were classified as hazardous by the USDA Forest Service, the quantities were
small hence the total risk was concluded to be insignificant.47
The USDA Forest Service study involved products being tested for acute oral and dermal
toxicity and eye irritation. Ac~te oral and acute dermal toxicity were measured in terms of the
medium lethal dose (LD50). The {LD50) is defined as the dosage, (in terms of milligrams of test
material per kilogram of body weight) at which 50 percent of the test animals die. The tests
were undertaken with laborate>ry rabbits.
NFP A - 298 lists the toxicity limits for class A foam concentrates and solutions.46 These limits
are the same as the USDA Forest Service requirements. NFP A - 298 also requires that foam
concentrate shall be tested in accordance with "Pesticide Assessment Guidelines, Subdivision F,
Hazard Evaluation: Human and Domestic Animals, US E.P.A. In Europe similar requirements
exist. German foam agents have to undergo testing by the Hygiene Institute, Des Ruhrgebiets
Gelsenkirchen. 48

66
Personnel are most likely to be exposed to foam concentrate during the handling, transferring
and testing of a class A foam sprinkler system. The USDA Forest Service report states that all
of the concentrates tested caused moderate to severe irritation to the eyes and slightly to
moderate skin irritation and chapping. 47 In order to minimise the risks to personnel, foam
manufacturers recommend that appropriate protective safety clothing and goggles be worn
when working with class A concentrate. The appendix of NFP A - 298 also recommends such
practices.
Personnel or fire service crews could be exposed to class A foam solution from the over head
sprinkler system as a result of a genuine fire or false activation resulting from mechanical
damage to sprinkler heads or pipework. In this situation it is unlikely that personnel would be
outfitted with appropriate safety equipment, hence the eyes and skin could be exposed to foam
solution.
Appendix 2 lists a summary of the toxicity effects of various class A foam solutions formulated
at 1%.
The results displayed in Appendix 2 show that all of the class A foam solutions tested by the
USDA Forest Service comply with the established requirements. The primary irritation scores
for skin irritation with the 1% solution ranged from 0.1 to 0.7 with an average score of 0.~6.
Based on these results the 1% class A solutions tested can be classified as having a "slightly
irritating" effect on exposed skin. A slightly irritating effect is defined as having a primary
irritation index between 0.1 - 0.9. Eye irritation results for the various solutions ranged between
2 - 10 in the case of ''washed eyes". Based on these scores and the definitions listed, the effects
of eye irritation can be categorised as being "minimally irritating".
The activation of a class A foam sprinkler system could result in personnel being exposed to
foam solution. The abovementioned results indicate that any detrimental health effects would
be minimum and within acceptable levels of personnel safety.

67
7.3 Biodegradability
The biodegradability of a foam solution can be defined as how "readily the chemicals in the
foam are broken down by bacteria in the environment".49 A number of methods exist for
determining foam solution biodegradability.
In Germany foam solution biodegradability requirements have been based around tests
concluded by the Hygiene Institute Des Ruhrgebiets Gelsenkirchen.48 Whiteley has reported
that the German standard may become a requirement for the rest of Europe.49 These tests
include COD (Chemical Oxygen Demand) and BOD (Biological Oxygen Demand).
The BOD test measures the amount of oxygen used by bacteria over a given period of time, as
the chemicals in a foam solution are consumed as a food source. BOD tests are based around
standard test duration's and can vary from five to twenty days. Twenty day tests are used if
there is a lag phase in the bacterial population growth curve, which occurs as a result of the
bacteria becoming acclimatised to the particular solution. The COD test is a measure of how
much oxygen would be required to completely breakdown a unit quantity of foam solution to
it's most oxidised state. With this method theoretical biodegradability is based on the ratio of
BOD/COD.
Whiteley references th~ work undertaken by the Industrial Waste Laboratory of Wesleyan
University, who concluded that a BOD/COD ratio above fifty percent is readily biodegradable.49
A product with a BOD/COD ratio less than 15 percent is considered non biodegradable.49 The
German Standard requires a BOD/COD ratio of seventy percent. De Vries reports that only one
class A foam product (Silvex - G) is approved in Germany to date.48
The USDA Forest Service have undertaken foam biodegradability tests on class A foam using
both "aerobic aquatic" and "ready" biodegradability methods. The National Fire Protection
NFP A Standard - 298 is based on "aquatic" biodegradability. This standard requires that
aerobic aquatic biodegradation tests be tested in accordance with CPR 40 part 796.3100.46 The
test determines if the foam solution is biodegradable in natural aerobic freshwater
environments.

68
The degree of biodegradation is determined by the measurement of carbon dioxide formed from
a test sample in a certain period.
"Ready" biodegradability tests are based on Organisation for Economic Co-operation and
Developments guidelines for testing chemicals.47 This test involves the inoculation of the
bacteria medium to be tested. The test method does not include a acclimatization period. The
degree of biodegradation is determined by the decrease in oxygen content over a twenty eight
day period. 5°
It is feasible that a discharge from a class A foam system would have to be treated by a
sewerage treatment plant or similar industrial facility. The operators of these plants would be
interested as to what effects class A foam solutions would have on the bacterial cultures present
in their plants. The results of the aquatic biodegradability tests would indicate contamination
tolerance levels.
Appendix 2 lists a summary of the aerobic aquatic biodegradability tests for several class A
foam solutions. These results show that only one foam product was readily biodegradable
while another was only partially biodegradable. The USDA Forest Service report states that
these results were not consistent with those undertaken independently by the foam suppliers
using the same methods, hence the authors recommended further tests.50 The German
organisation, Hygiene Institute des Ruhrgebiets, conclude that the only class A foam prodpct
approved to date is expected to have "no negative impacts on the biological section of a waste
water treatment facility". 48
The USDA Forest Service "ready" biodegradability tests show that all but two of the products
tested can be classified as being "readily biodegradable". These results are also displayed in
Appendix 2.
7.4 Fish Toxicity
The discharge of class A foam solution from a sprinkler system could flow through storm water
drains or via other avenues to potentially endanger the aquatic environment and fish species
present.

69
The potential danger of class A foam solutions endangering fish species during wildland and
forest fire fighting has resulted in toxicity studies being undertaken. The US Fish and Wildlife
Service conducted a series of tests which examined the toxicity of class A foams and other
forest fighting mediums on several aquatic organisms. These tests included green algae,
rainbow trout, flathead minnows and chinook salmon.
The tests were performed in accordance with ASTM method E-729-88a (standard guide for
conducting acute toxicity tests with fishes, macroinvertebrates and amphibians (ASTM 1989).
The tests found that within a species some life stages were more sensitive to a foam solution
than at other stages of development. Rainbow trout in a 60 day post hatch stage were selected
as a "bench mark" for other species, as they were found to be more sensitive than most
species.50
Fish toxicity is measured in terms of lethal concentration to 50.percent of the population over a
96 hour period (96 Hr LC50). Measurements are made in milligrams per litre which is
equivalent to parts per million (ppm).
Appendix 2 lists the results of the tests performed by the US National Biological Service, on
rainbow trout at various life stages with several class A foams.
These results show that all of the products tested achieved the required aquatic toxicity level of
LC50 > I 10 mg/litre of ASTM soft water after a 96 hour period.
The NFP A Standard 298 requires that fish toxicity tests should also be conducted using rainbow
trout, but tested in accordance with "Environmental Protection Series Biological Test Method:
Acute Lethality Test using Rainbow Trout", report EPSI/RM/9.46 These tests are similar to
those undertaken by the US National Biological Service.
Testing has found that the discharge of some class A foams into natural water resources can
result in the mortality of aquatic invertebrates.

70
Such organisms rely on water surface tension being present in their aquatic environment for
mobility.50 Some Class A foams have a detrimental effect on aquatic invertebrate populations
by reducing the water surface tension.
The report published by the US National Biological Service concludes that "toxicity values
suggest that accidental entry of fire fighting chemicals into aquatic environments could
adversely effect fish populations".50
7.5 Conclusion -Environmental Implications
To date no (known) scientific study has specifically examined the likely environmental impact
associated with the discharge of foam solution from a class A foam sprinkler system. The 1998
edition of the NFP A Standard 11 specifically addresses environmental considerations when
using fire fighting foam. 42 This standard recommends procedures for the collection, treatment
and disposal of foam solution following a discharge, in order to avoid adverse environmental
damage. These recommendations specifically relate to the use of class B type foams.
In general, class B type foams contain greater potential to damage the environment than class A
type foams. Class B type foams are typically applied at a concentration of 3%, while potential
class A foam systems proportioning ratio would be in the order of 0.5-1%. Synthetic type class
B concentrates such as AFFF contain flurochemical surfactants which are not readily
biodegradable.51 Class A foams typically do not contain flurochemical surfactants.48 Prott?in
based class B foams have also been reported as being potentially environmentally damaging as
they have a high ammonia nitrogen content and can cause nutrient loading, hence when
discharged in a treatment facility, can lead to "organic overload".49
The quantity of foam solution discharged from a foam water sprinkler system will be dependent
on the number of heads that operate, the sprinkler orifice size, system pressure, and the time it
takes fire service personnel to shut down the main sprinkler isolation valve. Statistics relating
to fires in sprinkler protected buildings give records of the number ofheads operated and details
of the building use. Marryatt reports that 95.24% of all fires occurring in sprinkler protected
buildings are controlled in New Zealand and Australia by eight heads or less.52 The same
quantity of heads control 87.4% of all fires in the USA.52

71
With only a small number of heads operating, the pressure applied to the heads will be much
higher than the minimum pressure required by the applicable sprinkler standard.
It follows that the unit flow rate per head will be higher, as the unit sprinkler flow is
proportional to the square root of the head pressure. The actual pressure on the heads will be a
function of the water supply available and the characteristics of the pipework array.
Table 7.5-1 lists the estimated amount of foam solution likely to be discharged from eight
sprinkler heads with 15mm orifice for various head pressures.
Table 7.5-1: Estimates of the quantity of Class A foam discharged from a sprinkler system, based on eight heads operating.
Notes
784 905
1,012 1,109
51 55
118 136 152 166
1) Solution flow rates have been estimated from eight heads, flowing at the various head pressures and
Q = K JP , where K = 8. 0, ie.,for a sprinkler with 15mm nominal orifice.
2) Concentrate quantities are based on proportioning at 0.5%.
Table 7.5-1 above has been based on the historical success in controlling fires with sprinkler
systems. Table 7.5-2 estimates solution discharge rates based on typical sprinkler design
parameters.

72
Table 7.5-2: Estimates of the quantity of Class A foam discharged from a sprinkler system based on typical sprinkler system design parameters.
7.33; 232 (1 13.85; 371 (2 20; 300 (3
Notes:
~31~~::1~~~ {?ti 17,000 34,000 51,380 102,760 60,000 120,000
1) NFPA-13 Ofl2 density/area method.
2) NFP A-13 EH2 density/area method.
3) NZS4541 Category 3, block stacked to 5.7m high.
257 300
Tables 7.5-1 and 7.5-2 above provide two approaches to the likely amount of foam solution
discharged from a Class A foam water sprinkler system.
As previously mentioned the environmental section contained in Appendix E of NFP A
Standard 11, specifically relates to Class B foams. Many Class B foam systems protecting
flammable goods warehouses or process risks are deluge systems, hence the flow rate and
quantity of solution discharged is likely to be higher than that of a closed head sprinkler system.
If the successful testing of Class A foam systems enables a density reduction compared to a
water based system, the quantity of contaminated fire run-off water would be reduced. In this
situation the installation of Class A foam sprinkler technology could potentially reduce
environmental damage.
de Vries suggests that the toxicity of fire ground run-off water is more a function of the toxicity
of the goods involved in the fire as opposed to the extinguishing agent applied.48 de Vries
assumption has been based on the work of Wieneke, 53 who collected 54 samples of fire ground
run-off water, presumably from fires fought by manual means. Wieneke also undertook tests on
a series of identical fires where the toxicity of the run-off water was evaluated for both Class A
foam and plain water extinguishing agents. Table 7.5-3 shows a summary of these results.

73
Table 7.5-3: Toxicity characteristics offrre ground run-off water and Class A foam solution.48
7,171 904 flre samples
Results ofidentical flre tests - Plan water mean 524 198 84 5.5 7.5 - 0.5 Class A foam
mean 917 2,319 229 1,180 9.6 (Source- adapted from48
)
As outlined in Section 7.3 above,-: the tests conducted by Hygiene-Institute des Ruhrgebiets
Gelsenkinchen in Germany concluded that certain foam manufacturers products are readily
biodegradable.48 In contrast to this, the USA Forest Service recommended further tests as only
one product was found to have acceptable results based on aerobic aquatic test methods, while
all but two products had acceptable biodegradability levels, based on the "readily
biodegradability test method".47 The results of fish toxicity tests described in the previous
section highlight the need to avoid discharges of foam solution into natural waterways.
The design process of a Class A foam water sprinkler system should incorporate expected flow
rate calculations. Local fire service crews should be consulted in order to assess their response
time and the likely period before the sprinkler isolation valve would be closed. This
information will give the engineer an estimate of the likely quantity of foam discharged.
The following information should be presented to the local environmental authorities and the
operators of waste treatment plants;
• Details on the proposed concentration, including biodegradability, toxicity and fish toxicity
valves.
• Estimated quantity of solution to be discharged.
• Estimated flow rates.
• Proposed method of disposal.
• Proposed method of preventing environmental damage.

74
The abovementioned organisations may require an engineered containment system. Such a
system would contain the discharged foam solution, where it could later be either forwarded to
a waste treatment facility at a prescribed rate or discharged to the environment after pre
treatment. NFP A-ll gives further guidance on such systems. The existence of "event initiated
procedures" may be adequate for the local environmental authorities requirements in lieu of a
fixed containment system. Such procedures may include either the automatic or mechanical
closing of valves associated with storm water or sewerage disposal.

75
CHAPTER8.0 SYSTEM HARDWARE AND MATERIAL COMPATIBILITY
8.1 Introduction
Foam solution has been applied successfully to sprinkler systems protecting flammable goods
warehouses for the last two decades. Recognised standards such as the 1994 edition of NFP A
Chapter 16A (Installation of Closed Head Foam Water Sprinkler Systems)1 has evolved out of
previous editions and the findings of large scale fire tests. Suitable foam hardware for the
purposes of storage, transferring and proportioning is available with independent third party
approval.
The engineering hardware arrangement of a foam water sprinkler system must take into account
many factors such as; testing requirements, material compatibility, environmental
considerations and ambient temperature extremes.
In an actual fire situation the flow rate of the system will be dependent on the number of
sprinkler heads that operate and the individual characteristics of these heads. The design flow
rate will be established from a chosen area of operation and the selected foam - water density.
To account for the range of possible flow rates within the design parameters it is advantageous
to have a balanced proportioned system.
A balanced proportioned system is engineered so that the proportioning rate will stay relatively
constant, regardless of changes in flow demands or the foam concentrate or water supply
pressure. For foam water sprinkler systems balanced proportioning is usually achieved by using
either a "balanced pressure pump" arrangement or a "bladder tank" an associated hardware.
Section 8.2 and 8.3 outline typical hardware arrangements for these two methods.
8.2 Bladder Tank Balanced Proportioning
Activation of the abovementioned system occurs when sprinkler heads (9) within the protected
area are activated by heat from a fire. The flow of water within the system will cause the alarm
(4) valve seat (or clapper) to lift.
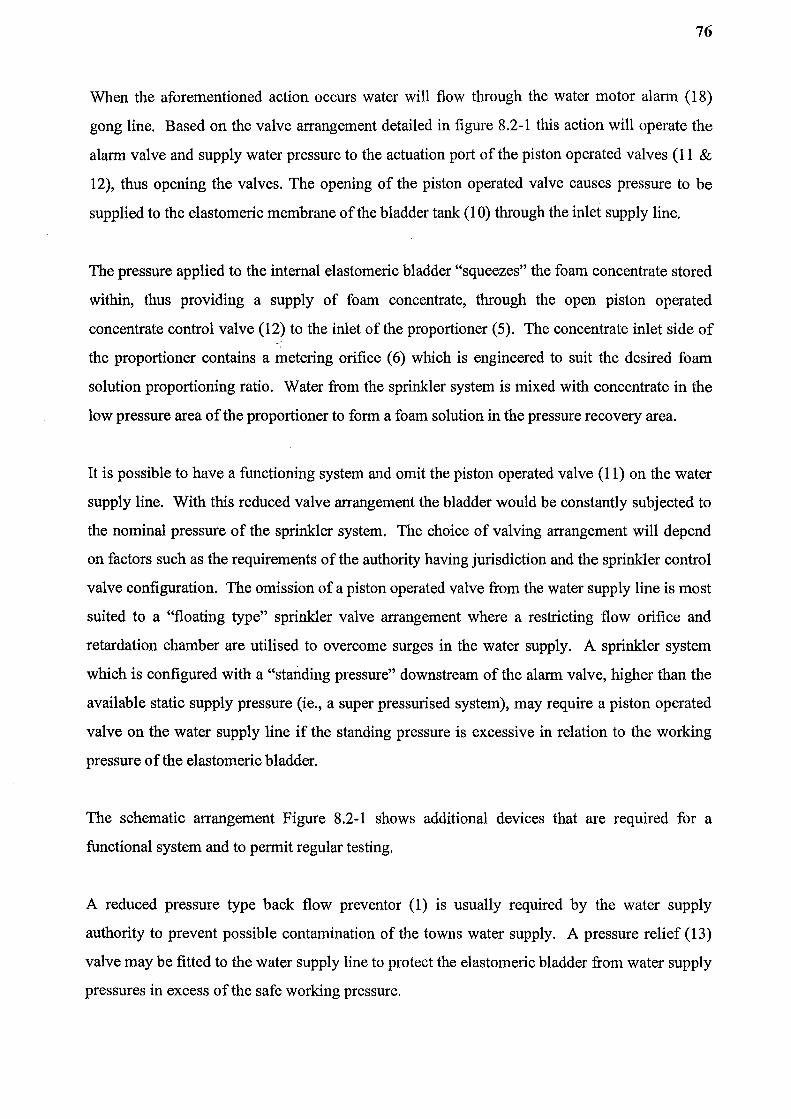
76
When the aforementioned action occurs water will flow through the water motor alarm (18)
gong line. Based on the valve arrangement detailed in figure 8.2-1 this action will operate the
alarm valve and supply water pressure to the actuation port of the piston operated valves (11 &
12), thus opening the valves. The opening of the piston operated valve causes pressure to be
supplied to the elastomeric membrane of the bladder tank (10) through the inlet supply line.
The pressure applied to the internal elastomeric bladder "squeezes" the foam concentrate stored
within, thus providing a supply of foam concentrate, through the open piston operated
concentrate control valve (12) to the inlet of the proportioner (5). The concentrate inlet side of
the proportioner contains a metering orifice ( 6) which is engineered to suit the desired foam
solution proportioning ratio. Water from the sprinkler system is mixed with concentrate in the
low pressure area of the proportioner to form a foam solution in the pressure recovery area.
It is possible to have a functioning system and omit the piston operated valve (11) on the water
supply line. With this reduced valve arrangement the bladder would be constantly subjected to
the nominal pressure of the sprinkler system. The choice of valving arrangement will depend
on factors such as the requirements of the authority having jurisdiction and the sprinkler control
valve configuration. The omission of a piston operated valve from the water supply line is most
suited to a "floating type" sprinkler valve arrangement where a restricting flow orifice and
retardation chamber are utilised to overcome surges in the water supply. A sprinkler system
which is configured with a "standing pressure" downstream of the alarm valve, higher than the
available static supply pressure (ie., a super pressurised system), may require a piston operated
valve on the water supply line if the standing pressure is excessive in relation to the working
pressure of the elastomeric bladder.
The schematic arrangement Figure 8.2-1 shows additional devices that are required for a
functional system and to permit regular testing.
A reduced pressure type back flow preventor (1) is usually required by the water supply
authority to prevent possible contamination of the towns water supply. A pressure relief (13)
valve may be fitted to the water supply line to protect the elastomeric bladder from water supply
pressures in excess of the safe working pressure.

77
In a similar manner the piston operated control valve may require a pressure reducing valve (14)
to be installed on the upstream side. The installation of a check valve (15) on the foam
concentrate line will ensure that water does not contaminate or dilute the foam concentrate
supply. The system will require an alarm signalling, and transmitting device (17) if automatic
intervention is required from the local fire service.
Good fire engineering design of the valving arrangement will facilitate regular testing of the
system to ensure that components remain functional. The bladder tank can be fitted with a sight
glass (16) to allow checks on the foam concentrate level. Testing valves can be installed to
enable the piston operated valves to be regularly operated. An isolate valve (7) and inspection
cock (8) may be required to be installed, by the authority having jurisdiction, down stream of
the proportioner to enable testing or sampling of the solution. All valves should be locked in
their "normal" operating position.
In addition, valves of critical importance to the system operation should be "supervised", hence
any interference with a valve will send a signal through to the monitoring station via the main
fire alarm panel or the sprinkler system alarm transmission device.

Figure 8.2-1: Typical schematic of hardware arrangement for class A sprinkler system, utilising a bladder tank for foam concentrate storage.
WATER JACKET
@
KEY
~
·~ ~
FOAM BIJIDDER TANK ASSEMBLY
WATER SUPPLY
ISOLATE I TEST VALVE NORMALLY OPEN
ISOLATE I TEST VALVE NORMALLY CLOSED
PRESSURE RELIEF VALVE
~ REDUCED PRESSURE BACKFLOW PREVENTOR
D :::3 FOAM PROPORTIONER
0
®
v- PIPE WORK STRAINER
~ HYDRAULICALLY OPERATED PISTON VALVE
... CHECK VALVE
CLOSED SPRINKLER
ili HEAD
78

79
8.3 Balanced Pump Proportioning
Figure 8.3-1: Typical schematic for balanced proportioning with a pumped concentrate supply and in-line pressure proportioner.
®
WATER 1-t~~~:!j--------___J SUPPLY
•
KEY ATMOSPHERIC TANK
ISOLATE / TEST VALVE NORMALLY OPEN
ISOLATE / TEST VALVE NORMALLY CLOSED
PRESSURE RELIEF VALVE
REDUCED PRESSURE BACKFLOW PREVENTOR
FOAM PROPORTIONER
CLOSED SPRINKLER HEAD
PRESSURE CONTROL VN..VE
v PIPE WORK STRAINER
..9.t HYDRAULICALLY OPERATED PISTON V/>J..VE
.. CHECK VALVE
® DUPLEX GAUGE
~ FOAM CONCENCRATE PUMP
@] PRESSURE SWITCH

80
Balanced pressure proportioning for a foam water sprinkler system can also be achieved by
utilising a hardware arrangement as detailed above. With this configuration the foam
concentrate is stored within an atmospheric tank (10). The system will be activated by a drop in
pressure within the sprinkler system as a result of sprinkler heads (9) operating. The alarm
valve clapper (4) will lift and water will flow through the water motor gong (18) line. This
action will see the gong operate and cause the piston operated hydraulic valve (12), installed on
the concentrate line, to open. A pressure switch (16) located on the down stream side of the
sprinkler alarm valve will relay a signal to the foam pump (11) controller, hence causing the
pump to start.
Pressurised foam concentrate will flow through the concentrate supply line. A pressure control
valve (14) installed on the concentrate return line, senses both the concentrate supply pressure
and the water supply pressure and regulates the concentrate supply to a higher pressure that the
water supply. This valve by-passes surplus concentrate back to the atmospheric storage tank.
A spool type valve (15) senses the concentrate and water supply pressures entering the
proportioner. This device regulates the higher concentrate supply pressure to ensure that both
mediums enter the proportioner with equal pressure. The spool valve arrangement enables a
rapid response to system pressure fluctuations and ensures accurate proportioning of the
concentrate. The proportioner (5) contains a metering orifice, low pressure area and recovery
area as described in Section 8.2 above.
Additional valves are necessary to facilitate testing and functional requirements. A pressure
relief valve (13) and associated by-pass is utilised to protect the pump casing and system
components. Provision is made for the testing of the pump through the pump test return line
(21 ). Additional provision can be made for testing the operation of the piston operated valve
and gong line by utilising test valve (22). The system hardware configuration may also
incorporate a provision for flushing, valves (20).

81
8.4 Material Compatibility and Corrosion
This section first examines the causes of deterioration and corrosion with a standard wet pipe
sprinkler system. Commonly used sprinkler materials are evaluated for the suitability with
class A foam.
Post installation investigations of standard wet pipe sprinkler systems have concluded that the
main causes of steel pipework internal deterioration are; oxygen availability, presence of
sediment or debris and galvanic couples. 54
Recent findings by the National Fire Sprinkler Association (NFSA)55 have concluded that
microbiologically influenced corrosion is a major problem for sprinkler systems.
The amount of oxygen available to a wet pipe sprinkler system will depend on the frequency in
which the static sprinkler water is drained and replaced with fresh water, containing oxygen.
The fresh oxygen introduced to the sprinkler system will initially deteriorate or corrode the steel
pipe wall through an oxidation process. The oxidation process is terminated when the available
oxygen within the system has been consumed. The initial build up of scale or corrosion forms a
protective layer which slows the rate at which further corrosion occurs. 54
Bsharae5 concluded, that most carbon steel sprinkler systems have an environment that is well
suited for microbiologically influenced corrosion to occur. Typical characteristics of
"microbiologically influenced corrosion" include, pinhole leaks with dark brown or rust
coloured slime on the interior of the piping. Microbiologically influenced corrosion can occur
as a result of either anaerobic or aerobic bacteria being present in the sprinkler system. The
stagnant water within a sprinkler system will eventually de-oxygenate. This provides a perfect
environment for anaerobic bacteria. Aerobic bacteria is likely to occur with a sprinkler system
where the water is changed frequently. In this situation fresh air, microbes and nutrients make
it possible for the aerobic bacteria to grow. 55
The amount of sediment within a sprinkler pipework array is a function of the quality of the
water supply available and the nature of the inline strainers. Sedimentary build up can result in
additional friction losses within the pipework array, hence pressure losses will be increased.

82
Galvanic corrosion occurs as a result of two dissimilar metals being in contact with each other.
This situation can be avoided by utilising materials that are compatible with one another or by
separating the materials with a neutral or passive boundary.
At present there exists no comprehensive (known) independent third party publication
specifically relating to the compatibility of materials found in a closed head sprinkler system
with class A foam solution. The US Forest Service as part of it's "National Wildfire
Suppression Technology Programme" undertook investigations into the effects of corrosion
between several metals exposed to both class A foam solution and concentrate47• The metals
and alloys selected were basee1 on materials generally found in forest fire appliances such as
fixed-wing air tankers, helicopter buckets and ground engines. The materials tested were; 2024-
T3 aluminum, 4130 steel, yellow brass and AZ31B magnesium. Tests were conducted at two
different temperatures, with specimens totally immersed and partially immersed. Several class
A foam concentrates were tested. Tables 8.4-1 and 8.4-2 list a summary of the results of the
tests for both 4130 steel and yellow brass. The results of AZ31 B magnesium, and 2024-T
aluminum have not been included in these tables as these materials are not commonly used in
sprinkler systems. Although tests were conducted at both 21 Deg. C and 49 Deg. C, only the
results of the 21 Deg. C tests are shown in tables 8.4-1 and 8.4-2, as such a temperature is more
appropriate to sprinkler systems.
Table 8.4-1: Uniform Corrosion Rates for Steel and Brass with Fresh Concentrate.47
Angus ForExpan 0.0010 0.0038 0.0005 0.0008 Ansul Filv-ex 0.0249 0.0330 0.0432 0.0432 Fire Quench 0.0069 0.0163 0.0053 0.0033 Fire-Trol FireFoam 0.0305 0.0330 0.0003 0.0003 103 Fire-Trol FireFoam 0.0279 0.0234 0.0104 0.0239 104 Phos-Chek WD 881 0.0330 0.0305 0.0003 0.0020 Phos-Chek WD 861 0.0168 0.0198 0.0074 0.0061 Pyrocap B-136 0.0193 0.0069 0.0018 0.0061 Average 0.0200 0.0208 0.0086 0.0107

83
Table 8.4-2: Uniform Corrosion Rates for Steel and Brass with 1% Foam Solution.47
· Foam Product . ·· ·.• ..•.. · st~¢1At3o · · ·. . . .•SteebU30 b3V<~~?i~n611)" _ ·. 1. To~aJlY:tlnmetsed ~ParUaJly lltlm~i-sed
· .. _:,,:,.~-·";f;~\~::< ••;, •I:/ :.~~~ .. :·::; ••. ;··-~;·.~~~-a~:-·:. Angus ForExpan 0.0036 0.0137 Ansul'Silv-ex 0.0079 0.0221 Fire Quench 0.0239 0.0236 Fire-Trol FireFoam 0.0249 0.0251 103 Fire-Tro1 FireFoam 0.0061 0.0147 104 Phos-Chek WD 861 0.0081 0.0155 Phos-Chek WD 881 00.191 0.0188 Pyrocap B-136 00.130 0.0065 Average 0.0133 0.0188
·. · Yelfow,Brass · · totally_lntnieisetf
-k1Jjeg; C ._ ,::; ni.WXe4r
0.0008 0.0003 0.0003 0.0003
0.0056
0.0097 0.0008 0.0010 0.0023
Note -Corrosion rates determined by 90 day weight loss tests.
_ ;J.'c~P~~;l,lfas,( .. Partii\IJY Im.m~arsed .
···~--~~~;a~:·;·····•::.····•··· 0.0010 0.0015 0.0005 0.0005
0.0038
0.0053 0.0008 0.0008 0.0018
The National Wildfire Suppression Programme concluded that all of the results were within the
acceptable limits of 0.0508mm to 0.127mm. The maximum corrosion rates varied for the
various fire fighting hardware devices.47 The programme also references a previous study
undertaken by "Canadair" on the compatibility of class A foam with several non-metallic
materials, such as nitrile rubber, cross linked polyethylene/nylon, PVC and fibreglass with
epoxy resin. 47 The report demonstrated that some materials showed changes in hardness or
volume following exposure to the foam. The hardness changes associated with certain
materials were within the Canadair limits, however, not all of the volume changes complied
with the minimum standard required. The authors of the National Wildfire Suppression
Programme_report concluded that further testing, and a review of the Canadair test methods, is
needed.47
NFP A-16A states that foam water sprinkler systems should be pre-primed with a foam
solution1• Pre charging the system ensures that foam solution can be immediately discharged
from the sprinkler heads. If the system was discharged with water only there would be a time
lag until solution would be applied to the fire. During this time lag stage the fire could continue
to develop.
The precharging of a class A foam water system may have an effect on the corrosion rates of the
system, hence an analysis needs to be conducted to ensure material compatibility,
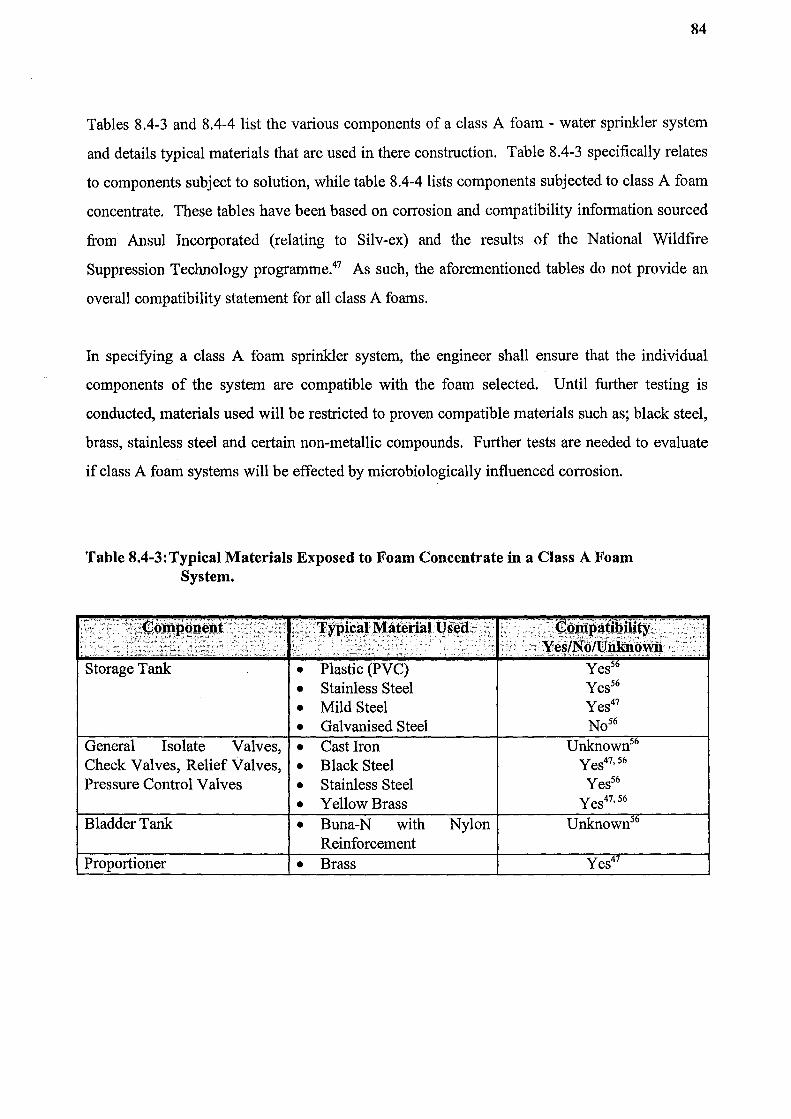
84
Tables 8.4-3 and 8.4-4 list the various components of a class A foam- water sprinkler system
and details typical materials that are used in there construction. Table 8.4-3 specifically relates
to components subject to solution, while table 8.4-4 lists components subjected to class A foam
concentrate. These tables have been based on corrosion and compatibility information sourced
from Ansul Incorporated (relating to Silv-ex) and the results of the National Wildfire
Suppression Technology programme.47 As such, the aforementioned tables do not provide an
overall compatibility statement for all class A foams.
In specifying a class A foam sprinkler system, the engineer shall ensure that the individual
components of the system are compatible with the foam selected. -Until further testing is
conducted, materials used will be restricted to proven compatible materials such as; black steel,
brass, stainless steel and certain non-metallic compounds. Further tests are needed to evaluate
if class A foam systems will be effected by microbiologically influenced corrosion.
Table 8.4-3:Typical Materials Exposed to Foam Concentrate in a Class A Foam System.
Storage Tank • Plastic (PVC) • Stainless Steel • Mild Steel • Galvanised Steel
General Isolate Valves, • Cast Iron Check Valves, Relief Valves, • Black Steel Pressure Control Valves • Stainless Steel
• Yell ow Brass Bladder Tank • Buna-N with Nylon
Reinforcement Proportioner • Brass
Yes56
Yes56
Yes47
Nos6
Unknown56 Yes47,56
Yes56 Yes47,56
Unknown 56

85
Table 8.4-4:Typical Materials Exposed to Foam Solution in a Class A Foam Sprinkler System.
Alarm Valve • Body Cast Iron (ASTM Unknown50
Roll Groove Coupling Sprinkler Head
Steel Pipe
A48) • Ring Seat-Bronze (ASTM
B62) • Clapper facing - EPDM
Rubber • EPDM • <Body-Bronze
B176) (ASTM
• Bulb Retainer-Phospher Bronze (ASTM B 103)
• Gasket Spring Plate (Beryllium Nickel)
• Deflector-Brass • Schedual40
(ANSVASTM A53) • Black • Galvanised
• British Standard BS1387 Medium Grade
• Black • Galvanised
Pipe Fittings (Roll Groove/ • Cast Malleable Iron Screwed Fittings) • Black finish
• Galvanised finish Isolate and Test Valves (large • Body-Cast Malleable Iron bore) • Gate/Ball- Stainless
• Stem - Brass Jointing Compounds • PTFE type
Unknown 56
Unknown 56
Unknown47•
56
Unknown 56
Yes56
Yes56

86
CHAPTER9.0 POTENTIAL APPLICATIONS
9.1 Introduction
This chapter examines the potential applications of a class A foam based sprinkler system.
The implementation of a class A foam based sprinkler system would be dependent on sound
scientific fire tests being undertaken with favourable results. Section 10.2 of this report
discusses the requirements for further testing and suggests typical methology that should be
employed.
To justify the installation of a class A foam based sprinkler system, such technology would
have to offer advantages over a standard sprinkler system. The potential benefits of applying
class A foam solution to sprinkler systems could arise as a result of a number of factors.
Typical gains could be of the following form;
• Cost Benefits
• Improved Fire Suppression Performance
• Environmental advantages
Cost benefits could arise as a result of reduced density requirements. Reduced density
requirements would lead to savings in labour, materials and water supply requirements.
The outcome of sound scientific tests would ultimately determine the suppression performance,
limitations and possible applications of this technology. The manufacturers of class A foam
concentrate state that the extinguishing agent can be applied to a range of class A commodities
such as; wood, paper, coal and rubber.4 The following sections consider the potential
applications of these commodities.
9. 2 Plastic Commodities
As previously mentioned, the NFPA Research Foundation had planned to undertake a study
into class A foam based sprinkler systems.3 This project was cancelled due to sponsorship
being withdrawn.

87
Initial NFPA Research Foundation discussions envisaged that the technology should be
investigated as a potential solution in protecting extreme hazard scenarios, eg., plastic racked
storage applications.2
Section 2.3 of this document details the results of fire tests undertaken with polypropylene
boxes rack stored and protected with a class A foam based sprinkler system. This combination
proved more effective in terms of minimising fire damage and using less extinguishing agent
compared to plain water.8•
9 Similar results were obtai~ed by Takahaske3 (refer section 2.7),
who demonstrated that dilute concentrations of AFFF solution were more effective on an array
of commonly used plastics than plain water.
In contrast to these results, tests undertaken by NIST on cribs constructed out of pine and
plastic sticks (as described in section 2.6), revealed no significant differences to the rate of heat
release reduction rates when applied with either water or class A foam solution.22 It should be
noted that with both the tests undertaken by Takahaski and NIST, extinguishing agents were not
applied through sprinkler system hardware.
Mass retention tests performed on vertical vinyl panels showed that water performed better than
class A foam solution. 20 This characteristic maybe an advantage or disadvantage, depending on
the orientation of the material being protected and the location of the origin of the fire. In the
case of a fire originating at the bottom of a vertical plastic storage array, protected by overhead
sprinklers, the rapid "run-off' (at high level) would assist in distributing extinguishing agent to
the seat of the fire. If the origin of the fire was at high level the application of class A foam
could have detrimental effects.
The results of the tests mentioned above do indicate that further testing to evaluate the
effectiveness of class A foam based sprinkler systems is warranted. Possible applications as a
result of successful testing could include the following;
• Racked plastic storage arrays.
• Stored plastic pallets.
• Plastic manufacturing and process industries (ie., storage protection).
• Retail outlets, specialising in plastic goods (eg., toys, household commodities, etc).

88
9.3 Paper Products and Storage
A fundamental characteristic of class A foam solution is its reduced surface tension properties,
compared to water. In the protection of paper products this could be an advantage. The applied
extinguishing agent would penetrate deeper into the surface and provide increased surface area
coverage as demonstrated by Josler with tests on wood panels.20
The storage of paper can constitute a high fire fuel load when block stacked rolls are stored end
on end or on side. 57 The storage of roll paper is common in the papermaking, newspaper and
printing industries. A number of serious, high loss fires have occurred with this commodity.57•58
Factory Mutual Research Corporation's fire records show that 458 roll paper storage fires
occurred in the 28 year period, 1962-1989.57
In brief, these fires constitute a severe hazard. The high storage configurations and the close
distance between adjacent arrays forms a series of natural chimneys, or flues, for fire to develop
within. This arrangement makes it difficult for sprinkler systems to distribute water to all
areas. 59 - A significant characteristic of these fires is the rapid initial fire spread across the
surface of the rolls. 57 Fire tests have shown that ceiling temperatures can rapidly develop to
critical levels. 60
NFPA standard 231F specifically addresses sprinkler systems for roll paper storage
configurations.59 The protection recommendations made in this prescriptive code have largyly
been based on full scale fire tests, with some extrapolation for extreme hazard scenarios. 57•60
Recent tests have shown that large drop sprinkler heads are more effective than large orifice
heads. 57
Tests have shown that the grade (weight per unit area) of paper is an important consideration in
evaluating the fire risk. In brief, as the paper weight is reduced the fire hazard is increased,
hence tissue paper constitutes more of a risk than newsprint.57 Factory Mutual Research
Corporation test results have shown that paper texture is also important. A paper product with
an absorbent or fibrous texture will have a higher flame spread rate and will absorb more
water.57
89
Factory Mutual comment that the high absorption rates of tissue type products makes them
more difficult to extinguish in certain orientations. 57 In the case where a high pile tissue paper
storage array is protected by overhead sprinklers, and a fire originates at low level, most of the
water will be absorbed by the storage array as opposed to running down the array to the seat of
the fire. 57 This situation would result in continued fire development. The above situation
indicates that the addition of class A foam solution would have further detrimental effects, as its
reduced surface tension properties would contribute to even deeper penetration in a localised
area.
The addition of class A foam could prove to be beneficial to rolled stored paper arrays, with
heavy and medium grade densities. Many individual paper rolls are wrapped with either a
heavy weight grade of paper or plastic wrapping.57 Specific fire tests would have to be
performed on individual paper grades and storage configurations, to ascertain if the addition of
class A foam would have any advantages over plain water as a suppression agent.
9.4Limited Water Supply Situations
Tests undertaken by Underwriters Laboratories (as detailed in section 2.2), concluded that the
quantity of extinguishing agent needed to control a residential fuel package with a sprinkler
system, could be halved if0.3% class A foam solution was used as opposed to pure water.7 The
successful outcome of these tests solved a specific problem relating to a limited extinguishing
agent storage capacity. This technology could be extended to other risks where a sufficient
water supply is not available.
Possible applications include the following;
• Private dwelling and other residential installation with marginal water supplies.
• Commercial and industrial facilities predominantly housing class A goods with marginal
water supplies.
In practice, economic and environmental factors would also need to be confirmed in order to
establish if the technology was providing an overall advantage. If water supplies are marginal it
maybe more cost effective to install a booster pump and or a water storage tank, as opposed to
the inclusion of class A sprinkler hardware.

90
9.5 Warehousing of Stored Rubber Tyres
A number of major fires have occurred in tyre storage facilities. In Hagersville, Canada, in
February of 1990, a fire occurred in an outside tyre storage facility as a result of arson. The fire
took 17 days to control and caused major environmental damage.61
Automobile tyres are typically manufactured from styrene-butadiene rubber. This compound is
a synthetic rubber built up from copolymerized synthetic monomers of butadiene and styrene. 62
The gross heat of combustion of rubber automobile tyres is approximately 32.6 MJ/kg. 63
Researchers have reported the average mass of an automobile tyre to be 8.3 kg,64 hence the
storage of a large number of tyres with such a high heat of combustion would constitute a
significant fire energy load. Typically a stored array of tyres will produce a fire with a rapid
growth and high temperatures.65 Such fires are typically deep seated. Their individual shape
and configuration within a storage array tends to lead to shielded fires. 64 If sufficient oxygen is
available _the size of the fire will only be limited by the quantity of fuel (amount of tyres)
present, hence such fires can be categorised as "fuel limited". Experimental work has shown
that tyres have auto-ignition temperatures in the range of200°C to 428°C.66
The National Fire Protection Association has published a specific standard (NFP A 231D) to
address the unique risk of protecting stored rubber tyres.65 This standard has a section which
specifically addresses stored tyres housed in a spinklered building. This prescriptive standard
details application density requirements which vary with storage configuration, tyre orientati~n
and height. The standard permits the use of high expansion foam as a means of reducing the
overhead sprinkler density. In the case of extreme storage hazard configurations both high
expansion foam and listed overhead sprinkler densities are required.65 The latest edition of this
standard (1994) incorporates the findings of a full scale fire test undertaken by the Factory
Mutual Research Corporation. 65•
67
Three tests were conducted by Factory Mutual. The means of suppression for all tests was a
large orifice (20mm) sprinkler array with 3.05m x 3.05m spacing and engineered to deliver a
density of24.51/minlm2•67 The sprinkler array was located at ceiling level at a height of8.53m.

91
Test 1 involved "interlaced" automobile tyres stored on open portable metal racks. Each rack
had dimensions of 1420mm x 1960mm x 1800mm. The individual racks were stacked together
to form an array as shown in figure 9.3-1. The sprinkler system failed to control the fire. In
total 77 sprinkler heads operated with a combined flow of 18,600 1/min. Structural steel ceiling
temperatures reached 830°C. A number of tyres fell out of the racks and thick black smoke was
reported to have totally obscured the view of the fire after approximately 10.5 minutes.67
The second test involved truck tyres, bulk stacked on their side, to form a pyramidal
arrangement as shown in figure 9.3-2. This configuration was controlled by the overhead
sprinkler array. In brief, nine sprinklers operated, giving a combined flow of 2146 1/min. The
ceiling structural size reached a peak temperature of 511 °C. 67
In the third test, automobile tyres were stored in palletised portable boxes. These units were
arranged to form a configuration as shown in figure 9.3-3. The overhead sprinkler was deemed
to have failed in this test as the 9eiling temperatures experienced in the structural steel were
excessive. During the test 29 sprinkler heads operated giving a total flow of7,000 1/min.67

Figure 9.5-1: Tyre Storage Test Configuration- FMRC Test 1. 67
I
t~F~-1960
I
I .11. 150 j
IGNITION
PALLEfiZED ~PORTABLE
RACKS
~,I
-
\
\_OPEN PORTAB RACKS
0 N (() [()
LE
Plan View Elevation View
Figure 9.5-2: Tyre Storage Test Configuration - FMRC Test 2. 67
7110 ~I
r-··~·~·~·~·~··-r- ·<······:······:······:······>· r-. . . . .
r-. : : : : : . -. . . . r- ·<·····<······:······:······:·· f-. . . . .
r-. : : : : : . -. . . '-- ·<······:······>·····=·····<·· f-. . . . .
f-. : : : : : . -. . . 0
~ l{)
92
0 r= . ::· r :-, r-. · I · I · I · I · I ·.- ~--~~--~--~~--~~--~---~~~:FLOOR
L ~J~LJ IGNITION
NOTE: TYRES CYLINDRICALLY STACKED
Plan View Elevation View
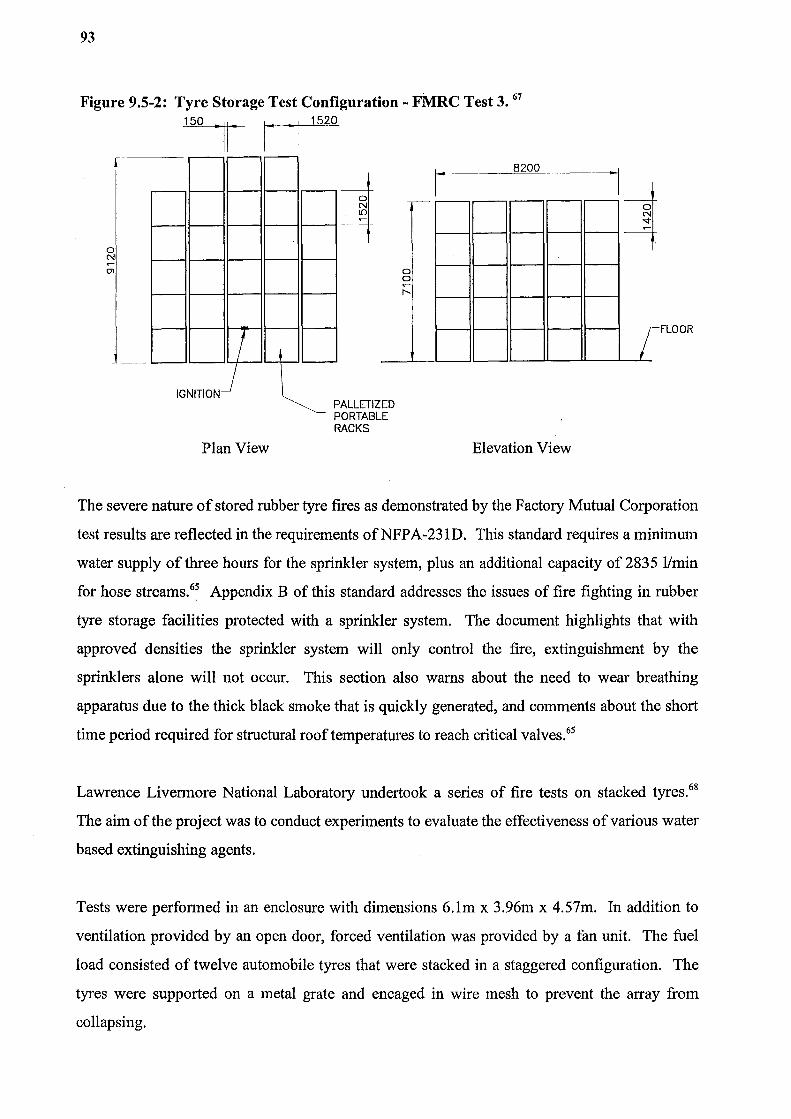
93
Figure 9.5-2: Tyre Storage Test Configuration- FMRC Test 3. 67
1 50 .. ,,.. I" . I 1520
Plan View
PALLETIZED PORTABLE RACKS
Elevation View
FLOOR
The severe nature of stored rubber tyre fires as demonstrated by the Factory Mutual Corporation
test results are reflected in the requirements ofNFPA-231D. This standard requires a minimum
water supply of three hours for the sprinkler system, plus an additional capacity of 2835 1/min
for hose streams. 65 Appendix B of this standard addresses the issues of fire fighting in rubber
tyre storage facilities protected with a sprinkler system. The document highlights that with
approved densities the sprinkler system will only control the fire, extinguishment by the
sprinklers alone will not occur. This section also warns about the need to wear breathing
apparatus due to the thick black smoke that is quickly generated, and comments about the short
time period required for structural roof temperatures to reach critical valves. 65
Lawrence Livermore National Laboratory undertook a series of fire tests on stacked tyres.68
The aim of the project was to conduct experiments to evaluate the effectiveness of various water
based extinguishing agents.
Tests were performed in an enclosure with dimensions 6.lm x 3.96m x 4.57m. In addition to
ventilation provided by an open door, forced ventilation was provided by a fan unit. The fuel
load consisted of twelve automobile tyres that were stacked in a staggered configuration. The
tyres were supported on a metal grate and encaged in wire mesh to prevent the array from
collapsing.

94
Ignition was achieved by a gas burner located at low level. A standard fire fighting spray type
nozzle was positioned and fixed to enable complete coverage of the stacked tyre array. This
device was set to deliver 58 1/min at a pressure of 550 kPa.68
The extinguishing agent was applied intermittently, ie., one minute of application followed by a
further two minutes to allow for the fire to redevelop. The extinguishing agent was reapplied
for a period of one minute if the fire redeveloped. If the fire could not be controlled after three
applications the extinguishing agent was deemed to have failed. The test series evaluated both
class A and B type foam solutions. 68 Table 9.3-1 lists the results of the class A foam solutions
tested, as detailed in the draft report.
Table 9.5-1: Draft Results of the Class A Type Foam Products Tested on Stacked Tyres.68
1:-- PIJQD_UQ~~-cc- ;=CQN"CENT.tu\TtON~ -~EX':f~Q!f!_I)IIEI)" '~~~· --Nq:(}!F:-- ;~_- ~ -;,Mj\SSt;_QSS ·' 1
> "'-:.: ------•. -: ~r. ~-,·: :%-·: -. :._ ~- ~ ~-FJRJt.-~- - :&J)fJ;C~'):l{O~S" .: -. &Q)~, Ansul - Silv-ex 0.3 Yes 3 2.30 Ansul - Silv-ex 0.6 No* 3 4.10 Chemonics-Fire- 0.3 Yes 3 3.70 trol Chemonics-Fire- 0.6 Yes 3 3.09 trol
Notes: * Fire appeared to be out but rekindled after 4:00 minutes following the third
application.
NIST researchers also undertook a series of tests to evaluate the effectiveness of foam based
extinguishing agents.64 A key objective of the study was to compare the results of the foam
based extinguishing methods to those obtained using plain water.
The fire load consisted of nine tyres stacked in a 3 x 3 array. A small quantity of diesel fuel
was used for ignition and pre-bum purposes. Suppression agents were applied through manual
techniques, with the fire fighter having unrestricted access to the tyre array. A standard
commercial jet spray nozzle was used to apply the agent at a flow rate of 30 1/min ( ± 10%).
The suppression agents were applied by three methods; spray application, aspirated nozzle
application and through a CAP's system.64 A summary of the results for the 1% solution
applications with spray and aspirated nozzles are shown in table 9.5-2.

95
Table 9.5-2:NIST Stacked Tyre Fire Test Results- Summary for 1% Solution Applications.
'FLOWRATE : 1: EXPANSION 1
TIME TO ''.trMJj:TO , I· . '/ J/Jl1m: Ri\TIQ . . SUPPRESSION:·· RE4GNlTION
,~: j' '<<; : 7 · ··- ·.. (Sec).:·, · .· : .: '(S~c) '::
Spray Application Water'i' !%Agent A A B B Average Aspirated Nozzle Application 1%Agent A A B B Average
30.3 286 364
28 28
28.8 28.8 28.4
31.1 31.1 31.1 31.1 31.1
1.5 3.5 1.6 1.6
2.05
4.6 4.6 5.4 5.4 5.0
72 95 70 75 78
75 110 85 ll1 95
125 225 230 105 171
85 70 185
None 85
Note: t, the shown results for this extinguishing medium are based on the average of 5 repetitive tests.
Tests were also performed with a compressed air foam (CAF's) application. The average time
for suppression with this application method was 73.5 seconds, while the average re-ignition
time was 1140.5 seconds. 64
The authors of the NIST study conclude that synthetic based extinguishing agents performed
better than water.64 This trend is also· reconfirmed by the draft findings undertaken by
researchers at the Lawerence Livermore National Laboratory.68
As previously detailed, full scale fire tests have shown that it is difficult to control a stored
rubber tyre array with an overhead sprinkler system.67 Manual fire fighting tests, as described
above, have demonstrated that the application of class A foam to a rubber tyre fire is more
effective than water. This combined evidence suggests that the addition of class A foam to
sprinkler systems would enhance their effectiveness. The use of this technology would be
dependent on the favourable outcome of scientifically based tests being performed to establish
fire fuel load and density parameters.

96
CHAPTER 10.0 RECOMMENDATIONS AND CONCLUSIONS
10.1 General Conclusions
Only a minimum amount of information has been published relating to class A foam-water
sprinkler systems. Tests undertaken with residential fuel packages, demonstrated that a class A
foam based sprinkler system had superior suppression properties compared to a water based
system.7 Similar findings resulted when full scale tests on vertically stacked polypropylene
plastic boxes were conducted. 8• 9
Tests conducted with a specifically engineered compressed air foam sprinkler system also
showed superior suppression performance, when evaluated against standard sprinklers and
water mist technology. 10 Researchers investigating the fire suppression performance properties
of class A foam for use in manual fire fighting, report conflicting conclusions, with most
recommending further testing.
The research programme conducted by NIST19 highlighted some favourable characteristics of
class A foam such as the:-
• Mass retention on porous materials.
• Improved suppression of polycyclic aromatic hydrocarbons present in smoke emissions.
The NIST19 tests showed· there to be very little difference compared to water with regards to:-
• The heat release rate and suppression effectiveness on a wood crib fire.
• Decomposition gas concentration suppression.
• Ignition- inhibition.
Plain water was found to have superior properties than class A foam with regards to:-
• Mass retention on non-porous materials.
• The size and distribution range of smoke particles produced.19

97
A key characteristic of class A foam solution is it's reduced surface tension characteristics.
This property accounts for the high penetration rates and increased surface contact angle. These
features give class A foam excellent wetting properties and suggest that it's use is most suited to
deep seated class A fires. Recent theories relating to foam stability,44 state that, typical low
expansion foam as produced by a class A foam sprinkler systems, will produce a finished foam
with a large distribution of bubble sizes which will have a high diffusion rate. This theory
suggests that the use of this technology is not appropriate if the specific fuel being protected
requires a stable foam.
A literature review relating to environmental issues suggests that the use of this technology will
not pose a threat to the environment if the appropriate steps are taken at the design and
implementation phase. Research has shown that some products are readily biodegradable while
others are not, hence care must be taken when selecting concentrates. Data is available to
access the likely impact on a cross section of aquatic species. Some researchers have claimed
that the use of class A foam as opposed to pure water could potentially do less environmental
damage.48 This assumption is based on the applied densities being reduced and therefore the
quantity of contaminated run off water reduced. Local environmental authorities and waste
treatment plant should be consulted prior to installing a system.
Hardware solutions already exist for the storage, transferring and proportioning of class A foam
and the integration with a wet pipe sprinkler system. Care should be taken when selecting
hardware materials in order to ensure compatibility with the proposed type of foam.
A number of potential applications are feasible with this technology. It is envisaged that the use
of class A foam in sprinkler systems would be "risk specific". "Risk specific" implies that there
use would be limited to the protection of specific fire load commodities and configurations that
had undergone sound scientific tests to determine suppression performance and limitations.
The results of previously successful fire tests indicate that this technology has the potential to
protect extreme hazard class A type commodity fires, such as the protection of certain plastic
and rubber products. The implementation of this technology could also offer advantages in
limited water supply situations if it was found that the applied density could be reduced without
lowering the overall integrity of the system.

98
Tests conducted in this project, showed that a slight increase in the foam expansion ratio,
occurred as the applied head pressure was increased from 50 to 85kPa. Further expansion ratio
increases were not obtained with higher head pressures. It is uncertain if these elevated pressure
results indicate a true characteristic trend of class A foam sprinkler systems, or if the results
obtained where influenced by the limiting performance of the pump unit used. The expansion
ratios obtained were very similar to previous tests conducted with 3% AFFF, using the same
type of sprinkler at similar pressures.40
The tests undertaken revealed near instantaneous drain times. The distribution tests showed that
the overall minimum density requirement in accordance with UL standard 199 could be
achieved. The overall density values obtained were similar to previous tests conducted using
plain water. Large density variations occurred when the contents of identically positioned
collection trays within the array were compared. Based on the results obtained, it can be
concluded that the addition of class A foam solution to a sprinkler system, does not have any
adverse detrimental effects on the distribution coverage patterns of standard type sprinkler
heads.
10.2 Future Research
As previously mentioned, it is envisaged that this technology could prove to be appropriate in
the protection of extreme hazard class A fires such as the storage of rubber tyres and certain
plastic products. The established success of a limited number of tests undertaken with such
materials suggests that this area would be a logical starting point for future research. 64·
68
In selecting suitable fire materials to test, consideration should be given to the beneficial
properties offered by class A foam such as, reduced surface tension, wetting and penetration
ability. The researcher should determine what likely effects these properties will have on the
protection of porous or non-porous materials with the orientation proposed.
Laboratory tests need to be undertaken to determine if class A foam solution will have any
detrimental corrosion effects on certain (untested) materials typically used in a sprinkler system.

99
In the evaluating the suitability of utilising this technology to protect stored rubber tyre
. installations, preliminary testing needs to be conducted in order to justify doing large scale
tests. Preliminary fire tests could be based on protecting a typical palletized portable rack unit
as detailed in NFPA-231D.65 These racks typically store 30-40 tyres. Tests should be
undertaken with an overhead sprinkler array with head spacing based on an extra high hazard
requirement. Due to the particular nature of the smoke and residue products associated with
such a fuel, tests would best be performed in an open air facility. The testing apparatus should
include a sand bed or other suitable residue collection medium as utilised in the NIST tests.64 A
partial enclosure over the tyre rack could be used to support the sprinkler array and allow for a
limited number of thermocouples to be located.
The tyre rack could be ignited and the fire allowed to develop to a stage where it is anticipated
that temperatures would have operated heads in a full height storage situation. Tests should be
performed to determine what critical application density of class A solution is required to
extinguish the fire load. Equivalent densities should be applied with pure water and evaluations
made of the two extinguishing mediums.
In addition to varying the density, a range of head pressures should be tried to see if this
parameter has any bearing on suppression capabilities. The effects of radiation heat transfer
could be assessed by locating additional tyre storage racks adjacent to the "test rack". The
separation distance between these units should be based on standard tyre storage array spacings.
If such tests prove to be beneficial, full scale tests similar to those conducted by Factory Mutual
to determine NFPA-231D requirements, should be undertaken.67 For such tests, it is envisaged
that the applied density would be based on the critical density determined in the preliminary
tests and include a suitable safety margin.

100
REFERENCES
1 NFPA 16A (1994): Installation of Closed Head Foam Water Sprinkler Systems. National Fire Protection Association, Quincy, MA.
2 Colletti, D.J. (1998). Personal Correspondence.
3 Mulhaupt, R. (1998). Personal Correspondence. National Fire Protection Association Research Foundation, Quincy Massachusetts.
4 Ansul (1997). Silv-ex "Class A Foam Concentrate". Ansul Incorporated, Marinette, WI.
5 National Foam (1998). "Litewater" (Foam Application Manual). National Foam Corporation.
6 Carey, W: (1994): National Class A Foam Research Project Technical Report. Structural Fire Fighting Room Bum Tests Phase II. National Fire Protection Research Foundation.
7 Carey, W.M. (1995). Report of Sprinkler Research, Contract EMW-94-R-4499, prepared for Federal Emergency Management Agency, United States Fire Administration, Underwriters Laboratories Inc., Project 94Nk25391/USNC226, Northbrook, Illinois.
8 Nett, H. and Hennecke, M. (1996). Brandund Loschversuch im Hochregallager mit Sprinkleranlage und Schaumzumischung Silv-ex G an KL T! Behaltem aus Polypropylene nach DIN 30820 und VDA-Empfehling 4500. (Fire and Extinguishing Tests on Racks Loaded with KLT (small plastic boxes) and Sprinkler System containing Silv-ex-G Foam Concentrate, to DIN 30820 and VDA Recommendation 450). Total Walther Germany.
9 Brand-und Loschversuche in Hoch-regallager mit sprinkleranlagen an kLT -Benaltem aus Polypropylene nach DIN 30820 und VDA-Empfehling 4500 (Fire and Extinguishing Tests on Racks Loaded with kLT (small plastic boxes) and Sprinkler Systems to DIN 30820 and VDA 4500). Total Walther Germany.
10 Kim, K.A. and Dlugogorski, B.Z (1997). Multipurpose Overhead Compryssed-Air Foam System and its Fire Suppression Performance. National Fire Laboratory. Institute for Research and Construction. National Research Council Canada. Journal of Fire Protection Engineering 8(3), 1977 pp 113-150.
11 Colletti, D.J. (1993) Quantifying the effects of Class A foam in Structural Fire Fighting, (The Salem Tests). Fire Engineering February 1993.
12 Colletti, D.J. (1992). Class A Foam for Structural Fire Fighting. Fire Engineering July 1992.

101
13 Bosley, K. (1997). Water Additives for Fighting Class A Fires. Research Report Number 3/98. Home Office Fire Research and Development Group. London U.K.
14 Drysdale, D.D. and Grant, G.B. (1997). The Suppression and Extinction of Class A Fires using Water Sprays. University of Edinburgh. Home Office Fire Research and Development Group. London U.K. p 169.
15 Pabich, M.J. and Carey, W.M. (1997). Technical Report on Delivery and Suppression Performance Evaluation of Class A Foam. Prepared by Undetwriters Laboratories Inc., Project 96NK 29338/US262.
16 de Vries, H. The use of new foams and foam equipment against solid fuel fires. University ofWuppertal.
17 Gravestock, N. (1998). Full Scale Testing of Fire Suppression Agents on Shielded Fires. University of Canterbury.
18 Carey, W.M. (1994). Structural Fire Fighting- Room Bum Tests Phase II. National Class A Foam Research Project Technical Report. Prepared by Undetwriters Laboratories Inc., for National Fire Protection Research Foundation.
19 Madrzykowski, D. and Stroup, D.W. (1998). Demonstration of Biodegradable Environmentally Safe, Non-Toxic Fire Suppression Liquids (NISTIR 6191) U.S. Department of Commerce Technology Administration, National Institute of Standards and Technology, Gaithersburg, M.D.
20 Josler, W.J. (1998). Demonstration ofBiodegradable Environmentally Safe, Non-Toxic Fire Suppression Liquids (NISTIR 619) U.S. Department of Commerce Technology Administration, National Institute of Standards and Technology, Gaithersburg, M.D., Chapter 3, Fire Exposure Protection. pp 3-1 to 3-36.
21 Bryner, N.P. (1998). Demonstration of Biodegradable Environmentally Safe, Non-Toxic Fire Suppression Liquids (NISTIR 619) U.S. Department of Commerce Technology Administration, National Institute of Standards and Technology, Gaithersburg, M.D., Chapter 4, Smoke Characterisation. pp 4.1 to 4.52.
22 Madrzykowski, D. and Stroup, D.W. (1998). Demonstration ofBiodegradable Environmentally Safe, Non-Toxic Fire Suppression Liquids (NISTIR 619) U.S. Department of Commerce Technology Administration, National Institute of Standards
.. anOTeclill.otogy;Gaitliersourg,- M;D:; eh1IpterY,-etass-A: Fjre-Suppression-Experiments-. pp 5-1 to 5-22.
23 Takahashi, S. (1993). Extinguishment of Plastic Fires with Plain Water and Wet Water. Fire Research Institute, Tokyo, Japan. Fire Safety Journal 22 (1994), pp 169-179.
24 Wahl, A.M. (1997). Water and Water Additives for Fire Fighting. Fire Protection Handbook- Eighteenth Edition. National Fire Protection Association, Quincy, Massachusetts. pp 6-5, - 6-7.

102
25 Dundas, P.H. (1974). Optimization of Sprinkler Fire Protection, Progress Report No. 10. The Scaling of Sprinkler Discharge: Prediction ofDrop Size, FMRC No. 18792, Factory Mutual Research Corp., Norwood, MA., June 1974.
26 Chow, Wik and Shet, L.C. (1993). Physical Properties of a Sprinkler Water Spray. Department of Building Services Engineering, Hong Kong Polytechnic, Hong Kong. Fire and Materials, Vol. 17. pp 279-292.
27 Prahl, J.M. and Wendt, B. (1988). Discharge Distribution Performance for an Axisymmetric Model of a Fire Sprinkler Head. Department of Mechanical and Aerospace Engineering, Case Western Reserve University, Cleveland. Fire Safety Journal, 14 (1988). pp 101-111.
28 Kumar, S., Haywood;: G.M. and Liew, S.K. (1997). Superdrop Modelling of a Sprinkler Spray in a Two Phase CFD-Particle Tracking Model. Fire Research Station, Watford, U.K. International Symposium on Fire Safety Science (5th, 1977 World Congress Centre, Melbourne).
29 Solomon, R.E. (1997). Automatic Sprinkler Systems. Section 6, Chapter 10. Fire Protection Handbook- Eighteenth Edition. National Fire Protection Association, Quincy, Massachusetts. pp 6-154.
30 Flemming, R.P. (1997). Theory of Automatic Sprinkler Performance. Section 6, Chapter 8- Fire Protection Handbook- Eighteenth Edition. National Fire Protection Association, Quincy, Massachusetts. pp 6-113-6-123.
31 Isman, K.E. (1997). Automatic Sprinklers. Section 6, Chapter 9, Fire Protection Handbook- Eighteenth Edition. National Fire Protection Association, Quincy, Massachusetts, p 6-24.
32 Underwriter Laboratories Standard UL-199 (1997). Automatic Sprinklers for Fire Protection Service. Underwriters Laboratories Inc. pp 31-33.
33 Nash, P. and Young, R.A. (1991). Automatic Sprinkler Systems for Fire Protection, 2nd Edition. pp 25-41.
34 Evans, D. (1993). Sprinkler Fire Suppression Algorithm for HAZARD. Building and Fire Research Laboratory. National Institute of Standards and Technology.
35 Walton, W.D. (1988). Suppression of Wood Crib Fires with Sprinkler Sprays: Test Results. NBSIR 88-39-696. U.S. Department of Commerce. National Bureau of Standards.
36 Johnson, C.W. and George, C.W. (1997). USDA Forest Service: Wildland, Fire Foam Characterisation, National Wildfire Suppression Technology Programme, Intermountain Fire Service Laboratory, Missoula, Montanna (Table 8).
37 Colletti, D.J. (1992). Class A Foam for Structural Firefighting. Fire Engineering, July 1992.
103
38 Gardiner, B.S., Dlugogorski, B.Z., and Jamieson, G.J. (1998). Rheology ofFirefighting Foams. Department of Chemical Engineering, The University of Newcastle, Australia. Fire Safety Journal 1998. p2.
39 Stroup, D.W., and Madrzykowski, D., and Bishop, M.J., (1998). Demonstration of Biodegradable, Environmentally Safe, Non-Toxic Fire Suppression Liquids, Chapter 2 Fire Fighting Properties. Report No. NISTIR 6191. National Institute of Standards and Technology. pp. 2-2 - 2-24.
40 Scheffey, J.L. (1997). Foam Agents and AFFF System Design Considerations. The SFPE Handbook of Fire Protection Engineers 2nd Edition. Society of Fire Protection Engineers I National Fire Protection Association. pp 4-70 to 4-98.
41 Ansul (1997). Foam System Design and Applications. Ansul Incorporated, Marinette, WI. pp 3-1.
42 NFPA-11 (1998). Standard for Low Expansion Foam. National Fire Protection Association, Quincy, Massachusetts.
43 Cowan, G. (1995): Wave of Future is Class A Foam. Fire Fighting in Canada, March 1995.
44 Kim, A.K. and Dlugogorski, B.Z. (1997). Multipurpose Overhead Compressed-Air Foam System and its Fire Suppression Performance. National Fire Laboratory Institute for Research in Construction. National Research Council, Canada. Journal of Fire Protection Engineering, Vol. 8, No.3, 1997. pp 133-1~0.
45 Factory Mutual Research Corporation (1993). File Ex1226, 16 Pan Distribution Tests, Model A Pendant. pp T13-3 to T13-4.
46 NFPA 298 (1994): Fire Fighting Foam Chemical for Class A Fuels in Rural, Suburban and Vegetated Areas. National Fire Protection Association, Quincy, MA.
47 Johnson, C.W., and George, C.W. (1997) USDA Forest Service: Wildland Fire Foam Characterisation, National Wildfire Suppression Technology Programme, Intermountain Fire Service Laboratory Missoula, Montana.
48 de Vries, H. (1998): The Use ofNew Foams and Foam Equipment Against Solid Fuel Fires, University of Wuppertal, Germany; p 16-17.
49 Whiteley, B. (1994): Fire Fighting Effects on the Environment, Fire International, August-September 1994; pp 35-36.
50 Finger, S. (1995): Environmental Implications ofFirefighting Chemicals, United States Department of Interior, National Biological Service Columbia. National Wildfire Coordinating Group. P 4-6.
51 ANSUL: Foam and the Environment, Technical Bulletin, No. 60; ANSUL Incorporated Marinette, WI 1997.

104
52 Marryatt, H.W. (1988); A Century of Automatic Sprinkler Protection in Australia and New Zealand 1886-1986; p 91.
53 Wieneke, A: Erarbeitung von Konzepten zur Beurteiling und Reiningung kontanimierter Loschwasser (Dissertation). Fortschritt-Berichte VDI Reihe 15 Nr. 166 VDI Verlag Dusseldorf Germany 1997.
54 Notarianni, K.A., and Jackson, M.A.: (1994) Comparison of Fire Sprinkler Piping Materials: Steel, Copper, Chlorinated Polyvinyl Chloride and Polybutylene, in Residential and Light Hazard Installations. Building and Fire Research Laboratory. National Institute of Standards and Technology. Gaithersburg. pp 8-11.
55 Bshart, T.K. (1998) Detection, Treatment and Prevention of Microbiologically Influenced Corrosion in Water Based Fire Protection Systems. National Fire Sprinkler Association, INC., New York.
56 Hubert, M (1999). Personal Correspondence- Ansul Incorporated.
57 Factory Mutual System (1995) Roll Paper Storage Loss Prevention Data 8-21. Factory Mutual Engineering Corporation, pp. 1-14.
58 Scoones, K. (1997). Serious Fires in the Paper Packaging and Print Industries during 1995. Fire Protection Association- UK. Fire Prevention December 1997, pp. 36-37.
59 NFPA 231F (1996). Standard for the Storage ofRoll Paper. National Fire Protection Association, Quincy, Massachusetts.
60 Smith, P.A. (1980). A Full-Scale Roll paper Fire-Test Programme. Fire JournalSeptember 1980.
61 Mawhinney, J.R. (1990). The Hagersville Tire Fire, February 12 to 28, 1990. Natiomil Research Council Canada Report No. 593.
62 Cohn, B.M. (1996). Plastics and Rubber National Fire Protection Association Handbook 181
h Edition, p. 4-123.
63 Society of Fire Protection Engineers Handbook of Fire Protection Engineering 2nd Edition. p. - A44.
64 Madrzykowski, D., and Strap, D. (1998). Class A Fire Suppression Experiments. Demonstration of Biodegradable Environmentally Safe, Non-Toxic Fire Suppressions Liquids. National Institute of Standards and Technology. pp. 5-1 - 5-22.
65 NFPA 231D (1994). Standard for the Storage of Rubber Tires. National Fire Protection Association, Quincy, Massachusetts.
66 Johnson, B.P. (1992). Additives for Hosereel Systems: Trials ofFoam on Tyre Fires. Fire Research and Development Group, Home Office, UK.

105
67 Dean, R. (1993) Rubber Tires: Investigation of a Common Protection for three types of Storage. Factory Mutual Research Corporation, Norwood, Massachusetts (FMRC J.l. OWIR3.RR).
68 Hasegawa, H.K., and Staggs, K.J. (1990). Draft- Large Scale Tests to Evaluate the Effectiveness of Various Fire Suppression Agents on Burning stacked Tires. Lawrence Livermore National Laboratory, Livermore.
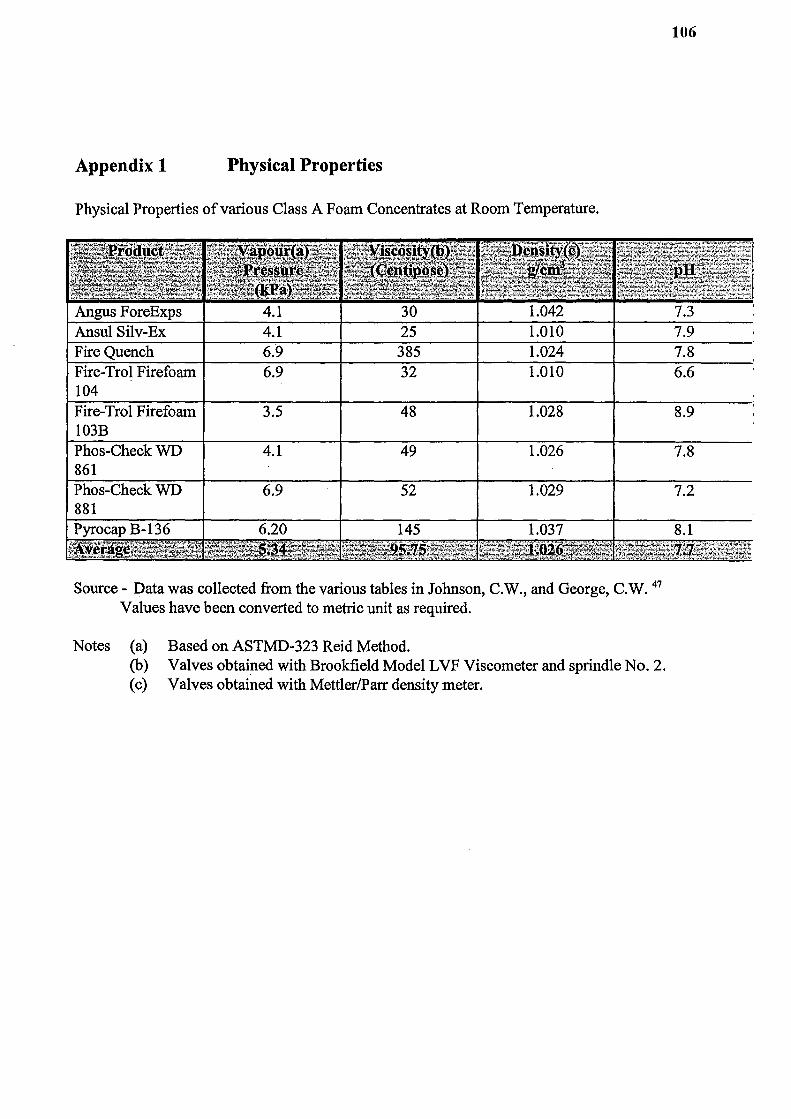
Appendix 1 Physical Properties
Physical Properties of various Class A Foam Concentrates at Room Temperature.
4.1 25
Fire-Trol Firefoam 6.9 32 104 Fire-Trol Firefoam 3.5 48 1.028 103B Phos-Check WD 4.1 49 1.026 861 Phos-Check WD 6.9 52 1.029 881
Source- Data was collected from the various tables in Johnson, C.W., and George, C.W. 47
Values have been converted to metric unit as required.
Notes (a) Based on ASTMD-323 Reid Method. (b) Valves obtai~ed with Brookfield Model L VF Viscometer and sprindle No. 2. (c) Valves obtained with Mettler/Parr density meter.
106
7.9 .8
6.6
8.9
7.8
7.2

SURFACE TENSION VS CONCENTRATION FOR CLASS A FOAMS
50-z-o Q; u; 1i) 40 - ~
ffi .§ 30 '"' ~ ~ --1-____::~~~'-~'--~~~§i~;~~;;;~;;~;~~~~~i ... ~;~~--u ~ 20 +---------------~--------~--------<( t/) u. C1)
~ ~ 10 en- D +---~~----~~--~~----~~--~l----~~--~~--~l
0.01 0.05 0.1 0.3 0.6 1 2 3
%CONCENTRATE
-+-Angus ForExp S -11- Ansul Silv-Ex
Fire Quench
~ Fire-Trol Firefoam 104
-..- Fire-Trol Fire Form 1038
-+- Phos-Check WD 861
-+- Phos-Check WD 881 8
- Pyrocap 8-136
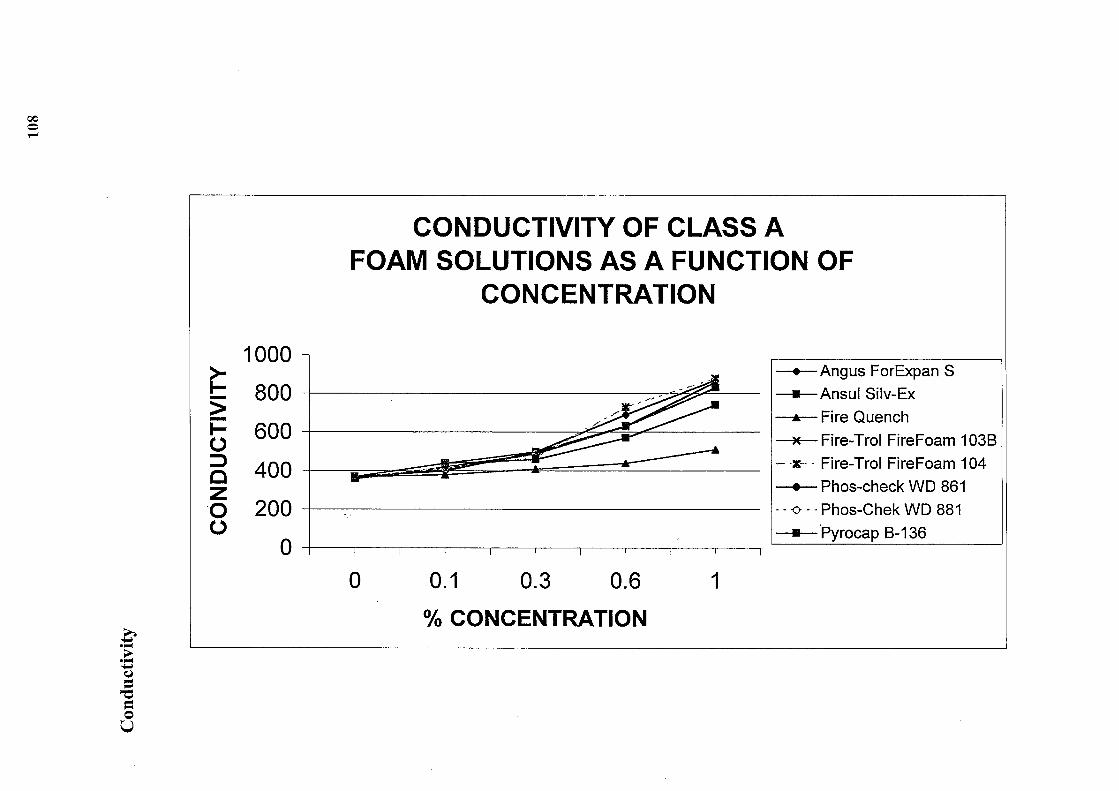
1000 ~ 800 -> -1- 600 () ::l 400 c z 0 200 ()
0
CONDUCTIVITY OF CLASS A FOAM SOLUTIONS AS A FUNCTION OF
CONCENTRATION
0 0.1 0.3 0.6 1
%CONCENTRATION
• Angus ForExpan S
• Ansul Silv-Ex
• Fire Quench
>< Fire-Trol FireFoam 1038
- -x-·-- Fire-Trol FireFoam 104
• Phos-check WD 861 -- o- · Phos-Chek WD 881
• 'Pyrocap B-136

109
Appendix 2 Environmental Properties
Toxicity of various Class A foam solutions formulated at 1% concentration. (Source - adapted from Johnson, C.W. and George, C.W.47
)
P.I. score: 0.7 Minimally Slightly irritating Irritation Score: 3.7 Toxicity category Toxicity category IV IV P.I. score: Minimally irritatmg Slightly irritating Irritation Score: 4.0 Toxicity category Toxicity category III IV
Fire Quench >5050 mg/K.g >2020 mg/K.g P.I. score: 0.1 Minimally irritating Slightly irritating Irritation score: 8.3 Toxicity category Toxicity category III IV
Fire-Trol >5050 mg/K.g >2010 mg/K.g P.I. score: 0.3 Minimally irritating FireFoam 1 03B Slightly irritating Irritation score: 4.0
Toxicity category Toxicity category III IV
Fire-Trol Fire >5050 score: Minimally irritating Foam 104A Slightly irritating Irritation score: 5 .3
Toxicity category Toxicity category III IV
>5000 mg/K.g >2000 mg/K.g P.I. score: 0.3 Slightly irritating Toxicity category Toxicity category IV IV
>5000 mg/K.g >2000 mg/K.g P.l. score: 0.3 Minimally irritating WD 881 Slightly irritating Irritation score: 2.0
Toxicity category Toxicity category III IV
Pyrocap B-136 >5050 >2020 mg/K.g P.I. score: 0.3 Minimally irritating Slightly irritating Irritation score: 3.0 Toxicity category Toxicity category IV IV
Irritation score: 4.7 Toxicity category III Minimally irritating Irritation score: 5.3 Toxicity category III
Irritation score: 10.0 Toxicity category IV Practically non-irritating Irritation score: 2.0
irritating I
Irritation score: 4.0 I
Toxicity category IV

110
Key for Skin Irritation Tests
or slight irritation
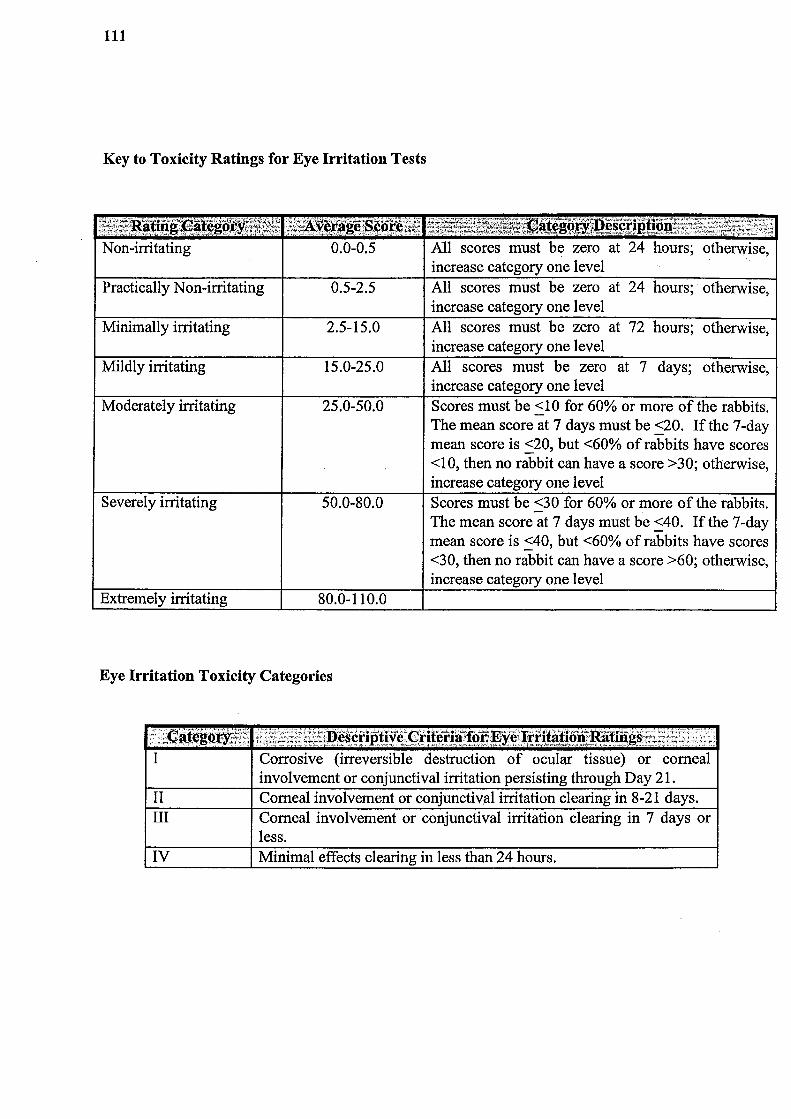
111
Key to Toxicity Ratings for Eye Irritation Tests
Non-irritating
Practically Non-irritating 0.5-2.5
Minimally irritating 2.5-15.0
Mildly irritating 15.0-25.0
25.0-50.0
Severely irritating 50.0-80.0
irritating 80.0-110.0
Eye Irritation Toxicity Categories
All scores must be zero at 24 hours; otherwise, increase category one level All scores must be zero at 72 hours; mcrease one level All scores must be zero at 7 days; otherwise, increase category one level Scores must be <1 0 for 60% or more of the rabbits. The mean score at 7 days must be <20. If the 7-day mean score is 220, but <60% of rabbits have scores <10, then no rabbit can have a score >30; otherwise, increase category one level Scores must <30 for 60% or more of the rabbits. The mean score at 7 days must be <40. If the 7-day mean score is 240, but <60% of rabbits have scores <30, then no rabbit can have a score >60; otherwise, increase one level
·:·:•:·i~:~JMg~m'i~'~ .ifn~i\1i~I.trif{~i~fi~s~rl.>'ti'\t~~rn~r.l~!t~i1®I~:~n-viifi9,W~'w.g~~;~f:i;~ .. r~\:,.\'• I Corrosive (irreversible destruction of ocular tissue) or corneal
involvement or conjunctival irritation persisting through Day 21. II Corneal involvement or conjunctival irritation clearing in 8-21 days. III Corneal involvement or conjunctival irritation clearing in 7 days or
less. IV Minimal effects clearing in less than 24 hours.

112
Summary of the "aerobic aquatic" and "ready Biodegradability" tests for serial Class A foam solutions. (Source- adapted from Johnson, C.W. and George, C.W.47
)
Ansul
Pyrocap B-136
Readily Biodegradable DOC at 28 days
Partially Biodegradable DOC at28
1 Results of the aerobic aquatic biodegradability tests are based on the initial dissolved oxygen content.
2 Results of the ready biodegradability tests have been corrected for the amount of water in the concentrate.
> 60% at 28
> 60% at 28

113
Toxicity of various Class A foam concentrates to Rainbow trout, at various life stages, for 96-HrLC502 at each life stage. (Source- adapted from Johnson, C.W. and George, C.W.47
)
Fire- FireFoam 103B
FireFoam 104
44 13 Pyrocap B-136
1 Testing was performed by National Biological Service at Yankton, SD. 2 ASTM soft water was used for all of the tests. 3 DPH = days post hatch; a deviation from nominal of+ 15 days is acceptable. 4 These tests were performed in 1996. The remaining ~ts were performed in 1993.
1
13 15 15
20

FIRE ENGINEERING RESEARCH REPORTS
95/1 Full Residential Scale Backdraft I B Bolliger
95/2 A Study of Full Scale Room Fire Experiments P AEnright 95/3 Design of Load-bearing Light Steel Frame Walls for J T Gerlich
Fire Resistance
95/4 Full Scale Limited Ventilation Fire Experiments D J Millar
95/5 An Analysis of Domestic Sprinkler Systems for Use in FRahmanian New Zealand
96/1 The Influence of Non-Uniform Electric Fields on MABelsham Combustion Processes
96/2 Mixing in Fire Induced Doorway Flows J M Clements
96/3 Fire Design of Single Storey Industrial Buildings B W Cosgrove
96/4 Modelling Smoke Flow Using Computational Fluid TN Kardos Dynamics
96/5 Under-Ventilated Compartment Fires - A Precursor to ARParkes Smoke Explosions
96/6 An Investigation of the Effects of Sprinklers on MWRadford Compartment Fires
97/1 Sprinkler Trade Off Clauses in the Approved Documents GJBarnes 97/2 Risk Ranking of Buildings for Life Safety JWBoyes
97/3 Improving the Waking Effectiveness of Fire Alarms in T Grace Residential Areas
97/4 Study of Evacuation Movement through Different Building P Holmberg Components
97/5 Domestic Fire Hazard in New Zealand KDJirwin
97/6 An Appraisal of Existing Room-Corner Fire Models D C Robertson
9717 Fire Resistance of Light Timber Framed Walls and Floors GCThomas
97/8 Uncertainty Analysis of Zone Fire Models AM Walker
97/9 New Zealand Building Regulations Five Years Later TM Pastore
98/1 The Impact of Post-Earthquake Fire on the Built Urban RBotting Environment
98/2 Full Scale Testing of Fire Suppression Agents on Unshielded MJDunn Fires
98/3 Full Scale Testing of Fire Suppression Agents on Shielded N Gravestock Fires
98/4 Predicting Ignition Time Under Transient Heat Flux Using A Henderson Results from Constant Flux Experiments
98/5 Comparison Studies of Zone and CFD Fire Simulations A Lovatt
98/6 Bench Scale Testing of Light Timber Frame Walls P Olsson
98/7 Exploratory Salt Water Experiments of Balcony Spill Plume EYYii Using Laser Induced Fluorescence Technique
99/1 Fire Safety and Security in Schools RACarter
99/2 A Review of the Building Separation Requirements of the JM Clarke New Zealand Building Code Acceptable Solutions
99/3 Effect of Safety Factors in Timed Human Egress Simulations KMCrawford
99/4 Fire Response of HV AC Systems in Multistorey Buildings: MDixon An Examination of the NZBC Acceptable Solutions
99/5 The Effectiveness of the Domestic Smoke Alarm Signal C Duncan

99/6
99/7
99/8
99/9
99/10
99/11
99/12
99/13
99/14
99/15
99/16
Post-flashover Design Fires
An Analysis of Furniture Heat Release Rates by the Nordtest
Design for Escape from Fire
Class A Foam Water Sprinkler Systems
Review of the New Zealand Standard for Concrete Structures (NZS 3101) for High Strength and Lightweight Concrete Exposed to Fire
Simple Empirical Method for Load-Bearing Light Timber Framed Walls at Elevated Temperatures
An Analytical Model for Vertical Flame Spread on Solids: An Initial Investigation
Should Bedroom Doors be Open or Closed While People are Sleeping? - A Probabilistic Risk Assessmen~
Peoples Awareness of Fire
Smoke Explosions
Reliability of Structural Fire Design
School of Engineering University of Canterbury
Private Bag 4800, Christchurch, New Zealand
Phone 643 364-2250 Fax 643 364-2758
RFeasey
J Firestone
I J Garrett
DB Hipkins
MJinwood
KHLiew
GANorth
DLPalmer
S J Rusbridge
B J Sutherland
JKS Wong