Technology spillovers and stability of international climate coalitions

CLIMATE CHANGE
Netherlands Research Programme on Climate ChangeScientific Assessment and Policy Analysis
Spillovers of Climate PolicyAn assessment of the incidence of carbon leakage and induced
technological change due to CO2 abatement measures
Report 500036 002(ECN report ECN-C--05-014)
This study has been performed in the framework of the Netherlands Research Programme on Climate Change (NRP-CC),subprogramme Scientific Assessment and Policy Analysis, project 'Carbon leakages and induced technological change:
the negative and positive spill-over impacts of stringent climate change policy'
J.P.M. Sijm, O.J. Kuik, M. Patel, V. Oikonomou, E. Worrell, P. Lako,E. Annevelink, G.J. Nabuurs, H.W. Elbersen
December 2004
2 Report 500036 002 (ECN-C--05-014)
Wetenschappelijke Assessment en Beleidsanalyse (WAB) WAB is een subprogramma van het Netherlands Research Programme on Climate Change (NRP-CC). Het doel van dit subprogramma is: • Het bijeenbrengen en evalueren van relevante wetenschappelijke informatie ten behoeve
van beleidsontwikkeling en besluitvorming op het terrein van klimaatverandering; • Het analyseren van voornemens en besluiten in het kader van de internationale klimaaton-
derhandelingen op hun consequenties. Het betreft analyse- en assessmentwerk dat beoogt een gebalanceerde beoordeling te geven van de stand van de kennis ten behoeve van de onderbouwing van beleidsmatige keuzes. Deze analyse- en assessmentactiviteiten hebben een looptijd van enkele maanden tot ca. een jaar, afhankelijk van de complexiteit en de urgentie van de beleidsvraag. Per onderwerp wordt een assessmentteam samengesteld bestaande uit de beste Nederlandse experts. Het gaat om inci-denteel en additioneel gefinancierde werkzaamheden, te onderscheiden van de reguliere, struc-tureel gefinancierde activiteiten van het consortium op het gebied van klimaatonderzoek. Er di-ent steeds te worden uitgegaan van de actuele stand der wetenschap. Klanten zijn met name de NMP-departementen, met VROM in een coördinerende rol, maar tevens maatschappelijke groeperingen die een belangrijke rol spelen bij de besluitvorming over en uitvoering van het kli-maatbeleid. De verantwoordelijkheid voor de uitvoering berust bij een consortium bestaande uit RIVM/MNP, KNMI, CCB Wageningen-UR, ECN, Vrije Universiteit/CCVUA, UM/ICIS en UU/Copernicus Insti-tuut. Het RIVM/MNP is hoofdaannemer en draagt daarom de eindverantwoordelijkheid.
Scientific Assessment and Policy Analysis The Scientific Assessment and Policy Analysis is a subprogramme of the Netherlands Research Programme on Climate Change (NRP-CC), with the following objectives: • Collection and evaluation of relevant scientific information for policy development and deci-
sion–making in the field of climate change; • Analysis of resolutions and decisions in the framework of international climate negotiations
and their implications. We are concerned here with analyses and assessments intended for a balanced evaluation of the state of the art for underpinning policy choices. These analyses and assessment activities are carried out in periods of several months to about a year, depending on the complexity and the urgency of the policy issue. Assessment teams organised to handle the various topics con-sist of the best Dutch experts in their fields. Teams work on incidental and additionally financed activities, as opposed to the regular, structurally financed activities of the climate research con-sortium. The work should reflect the current state of science on the relevant topic. The main commissioning bodies are the National Environmental Policy Plan departments, with the Minis-try of Housing, Spatial Planning and the Environment assuming a coordinating role. Work is also commissioned by organisations in society playing an important role in the decision-making process concerned with and the implementation of the climate policy. A consortium consisting of the Netherlands Environmental Assessment Agency – RIVM, the Royal Dutch Meteorological Institute, the Climate Change and Biosphere Research Centre (CCB) of the Wageningen Uni-versity and Research Centre (WUR), the Netherlands Energy Research Foundation (ECN), the Climate Centre of the Vrije Universiteit in Amsterdam (CCVUA), the International Centre for In-tegrative Studies of the University of Maastricht (UM/ICIS) and the Copernicus Institute of the Utrecht University (UU) is responsible for the implementation. The Netherlands Environmental Assessment Agency – RIVM as main contracting body assumes the final responsibility. For further information: RIVM, WAB secretariate (pb 59), P.O. Box 1, 3720 BA Bilthoven, The Netherlands, tel. +31 30 2742970, [email protected] or Jos Sijm, ECN, Postbus 1, 1755 ZG Petten, tel. +31 224 568255, email: [email protected]

Report 500036 002 (ECN-C--05-014) 3
Acknowledgement The present report is part of a research project called ‘Carbon leakage and induced technological change: the negative and positive spillover impacts of stringent climate change policy’ (or, more briefly, the so-called ‘Spillovers of climate policy’ project). This project has been conducted by a consortium of four research institutes in the Netherlands, consisting of the Energy research Centre of the Netherlands (ECN), the Institute for Environmental Studies (Vrije Universiteit Amsterdam), the Copernicus Institute (Utrecht University), and the Climate Change and Bio-sphere Research Centre (Wageningen University). The project ‘Spillover of climate policy’ has been financed by the Dutch Ministry of Housing, Spatial Planning and the Environment (VROM) as part of its National Research Programme on Climate Change (NRP-CC), particularly its sub-programme dealing with ‘scientific assessments and policy analyses’. This programme is implemented by the National Institute of Public Health and the Environment (RIVM). This final report presents and summarizes the major findings of the project ‘Spillovers of cli-mate policy’. This project has consisted of the following sub-projects: 1. A general assessment on the potential incidence of carbon leakage due to climate policy in
Annex I countries of the Kyoto protocol, based primarily on analytical model studies. 2. A general assessment on the potential incidence of induced technological change owing to
climate policy, including the diffusion of induced technological innovations to non-Annex I countries, based primarily on analytical model studies.
3. A case-study assessment on the potential incidence of climate policy spillovers in the en-ergy-intensive industry, based primarily on empirical studies of this industry.
4. A case-study assessment on the potential incidence of climate policy-induced technological spillovers in the wind power industry, based primarily on empirical studies of this industry.
5. A case-study assessment on the potential incidence of climate policy-induced technological spillovers in the biomass and bio-energy industry, based primarily on empirical studies of this industry.
The assessment studies of the sub-projects mentioned above have resulted in five separate posi-tion papers. These position papers have been presented during a workshop in The Hague (Min-istry of VROM, 2 July 2004) and reviewed by national/international experts of the issues con-cerned. The final version of these papers are both published separately by the respective re-search institutes and included integrally as Appendices 1-5 of the present report. The project ‘Spillovers of climate policy’ has been coordinated by the unit Policy Studies of the Energy Research Centre of the Netherlands (ECN), where it has been registered under no. 77599. Additional information on this report as well as on the project as a whole can be ob-tained from the project coordinator Jos Sijm (e-mail: [email protected], telephone: +31 22456 8255).
4 Report 500036 002 (ECN-C--05-014)
Abstract Besides primary effects such as reducing greenhouse gas emissions, the implementation of cli-mate policies in Annex I countries of the Kyoto protocol may have secondary (side) effects, as the resulting increase in carbon or fossil fuel costs may affect energy prices and, hence, the prof-itability of energy-using industries in Annex I versus non-Annex I countries. From a global warming point of view, these secondary effects or ‘spillovers’ of climate policy may be either negative or positive. Negative spillovers refer particularly to the incidence of carbon leakage, i.e. an increase in CO2 emissions in non-abating countries due to the implementation of climate policy in Annex I countries. Positive spillovers, on the other hand, refer especially to the in-ducement of carbon-saving technological innovations and the diffusion of these innovations, both at home and abroad. The primary objective of the present report is to provide a summary assessment of the analytical and empirical knowledge on the potential incidence of spillovers due to climate policy in Annex I countries of the Kyoto protocol. These spillovers include especially the prevalence of carbon leakage as well as the induced innovation and diffusion of carbon-saving technologies in both Annex I and non-Annex I countries. In addition, the report aims to draw lessons, conclusions and policy implications with regard to the opportunities and means to reduce potential negative spillovers of climate policy (i.e. ‘carbon leakage’) and to enhance its potential positive spill-overs (‘induced technological change’). The present report provides first of all a conceptual framework, particularly on the terms ‘spill-overs’, ‘carbon leakage’ and ‘induced technological change’. Subsequently, it presents the ma-jor findings of analytical model studies on the incidence of carbon leakage due to climate policy in Annex I countries of the Kyoto protocol, followed by similar analytical findings on the inci-dence of induced technological spillovers. Next, it presents the major findings of the three em-pirical case studies on climate policy spillovers, particularly in the energy-intensive manufactur-ing industry, the wind power industry, and the biomass and bio-energy industry. Finally, it dis-cusses the major policy implications of the project ‘Spillovers of climate policy’.

Report 500036 002 (ECN-C--05-014) 5
CONTENTS
1. INTRODUCTION 9 2. CONCEPTUAL FRAMEWORK 11
2.1 Spillovers 11 2.2 Carbon leakage 11 2.3 Induced technological change 12
3. THE INCIDENCE AND CHANNELS OF CARBON LEAKAGE 13 3.1 Introduction 13 3.2 The channels of carbon leakage 13 3.3 The potential size of carbon leakage 14 3.4 The international mobility of production factors 14 3.5 The impact of trade liberalisation on carbon leakage 15
4. THE INCIDENCE OF INDUCED TECHNOLOGICAL CHANGE 16 4.1 Introduction 16 4.2 Does climate policy induce technological change? 16 4.3 Induced technological change in top-down models of climate policy 16 4.4 Induced technological change in bottom-up models of climate policy 17
5. MAJOR FINDINGS OF EMPIRICAL CASE-STUDY ASSESSMENTS 19 5.1 Introduction 19 5.2 The energy-intensive industry 19
5.2.1 Introduction 19 5.2.2 Relocation of production structures 19 5.2.3 Comparing results of empirical and model studies 20 5.2.4 Technological spillovers 20
5.3 The wind power industry 21 5.3.1 Introduction 21 5.3.2 Spillovers of the Danish wind turbine industry 21 5.3.3 Two-factor learning for wind power 22
5.4 The biomass and bio-energy industry 22 5.4.1 Introduction 22 5.4.2 Role of climate policy and other drivers 23 5.4.3 Potential of biomass and bio-energy technologies 23 5.4.4 Barriers to development and diffusion of bio-energy technologies 24
6. POLICY IMPLICATIONS 25 6.1 Policies to reduce carbon leakage 25 6.2 Implications for post-Kyoto climate and technology policies 25 6.3 Further research 26
REFERENCES 28 APPENDIX A: SPILLOVERS OWING TO CARBON LEAKAGE 29
A.0 Summary for policymakers 31 A.1 Introduction 32 A.2 The concept of carbon leakage 33 A.3 The ‘channels’ of carbon leakage 37
A.3.1 International trade in energy goods 37 A.3.2 International trade in other goods and services 38 A.3.3 International trade in factors of production 40 A.3.4 International interaction among government policies 42 A.3.5 Conclusions 43
A.4 The potential size of carbon leakage 45 A.4.1 Economic models 45

6 Report 500036 002 (ECN-C--05-014)
A.4.2 Model estimates 45 A.4.3 Carbon leakage and trade liberalization 48
A.5 Policy implications of carbon leakage 52 A.6 Conclusions 56 A.7 References 57 A.8 Annex 61
APPENDIX B: INDUCED TECHNOLOGICAL CHANGE AND SPILLOVERS IN CLIMATE POLICY MODELLING 63
B.0 Summary for policymakers 65 B.1 Introduction 69 B.2 Conceptual framework 70
B.2.1 Induced technological change 70 B.2.2 Technological spillovers 72
B.3 The potential impact of induced technological spillovers on global carbon abatement 74
B.4 Does climate policy induce technological change? 77 B.4.1 Introduction 77 B.4.2 Empirical analyses of induced changes in green technologies 77 B.4.3 Market imperfections and green technologies 81 B.4.4 Policy issues 85
B.5 Induced technological change and spillovers in top-down approaches of climate policy modelling 89 B.5.1 Introduction 89 B.5.2 A review of top-down studies 89 B.5.3 Major differences in performance of ITC top-down studies 102 B.5.4 Major lessons and implications 104
B.6 Induced technological change and spillovers in bottom-up approaches of climate policy modelling 108 B.6.1 Introduction 108 B.6.2 Some methodological issues 108 B.6.3 Some illustrative results 112 B.6.4 An example: endogenous learning for carbon capture technologies 120 B.6.5 Emissions trading and spatial learning spillovers 122 B.6.6 Comparing two approaches on induced technological spillovers 126 B.6.7 Major similarities in performance of ITC bottom-up studies 129 B.6.8 Major lessons and implications 130
B.7 Implications for post-Kyoto climate and technology policies 132 B.8 References 134
APPENDIX C: DOES CLIMATE POLICY LEAD TO RELOCATION WITH ADVERSE EFFECTS FOR GHG EMISSIONS OR NOT? 145
C.0 Summary for policymakers 147 C.1 Introduction 150 C.2 Production trends for energy intensive products 152 C.3 Types and degrees of relocation of energy intensive industries and drivers for
investment decisions 155 C.4 Importance of production factors for the location of new production facilities 160
C.4.1 Overview of factors of production leading to relocation 160 C.4.2 Literature survey on the importance of production factors in investment
decisions 162 C.4.3 Empirical analyses on the role of environmental factors 163
C.5 Climate modelling results 167 C.5.1 Model results for the steel sector 167 C.5.2 Discussion of the usefulness of the leakage rate as a guiding indicator for
policy making 169
Report 500036 002 (ECN-C--05-014) 7
C.6 Positive spillovers 172 C.6.1 Technology development 172 C.6.2 Technology transfer patterns 176
C.7 Conclusions and further research 177 C.8 References 181 C.9 Annex 186
APPENDIX D: SPILLOVER EFFECTS FROM WIND POWER 189 D.0 Summary for policymakers 191 D.1 Introduction 192
D.1.1 Scope of the project 192 D.1.2 Background and scope of study 192 D.1.3 Current status of wind power 193 D.1.4 Guidance to the reader 194
D.2 Spillover effects of the Danish wind turbine industry 195 D.2.1 Introduction 195 D.2.2 Different types of wind turbines 195 D.2.3 Development of the wind turbine industry in Denmark 195 D.2.4 Position of the Danish wind turbine industry 196 D.2.5 Spillover effects 197
D.3 Two-factor learning for wind Power in Denmark, Germany, and the UK 199 D.3.1 Introduction 199 D.3.2 Two-factor learning 199 D.3.3 Spillover effects 202
D.4 Experience curves: a tool for energy policy assessment 203 D.4.1 Introduction 203 D.4.2 Experience curves 203 D.4.3 Spillover effects 207
D.5 Cost reduction prospects for offshore wind 209 D.5.1 Introduction 209 D.5.2 Framework of the study 209 D.5.3 Main results 209 D.5.4 Spillover effects 212 D.5.5 Policy implications 212
D.6 Conclusions and policy implications 214 D.7 References 217
APPENDIX E: CASE STUDY ON THE POTENTIAL FOR INDUCED SPILLOVERS IN A SPECIFIC CARBON NEUTRAL ENERGY SUPPLY INDUSTRY: BIOMASS AND BIO-ENERGY CHAINS 219
E.0 Summary for policymakers 221 E.1 Introduction 223
E.1.1 Rationale of the case study 223 E.1.2 Objective of the case study 224 E.1.3 Short description of the research method 224 E.1.4 Outline of this paper 225
E.2 Technology transfer in bio-energy chains based on by-products and waste 226 E.2.1 Definition of induced technological change (ITC), technological
spillovers and technology transfer 226 E.2.2 The global potential of biomass for energy 226 E.2.3 Dutch climate and energy policy that induces technology transfer in bio-
energy chains 227 E.2.4 Available conversion technology for bio-energy chains 230 E.2.5 Learning rates (LR) in bio-energy chains 231 E.2.6 Important drivers and barriers for technology transfer in bio-energy chains233

8 Report 500036 002 (ECN-C--05-014)
E.2.7 Detailed case description: technology transfer by the Biomass Technology Group 236
E.2.8 Concluding remarks on technology transfer in bio-energy chains 239 E.3 Technology transfer in the land use and forestry sector 241
E.3.1 Drivers and barriers for technology transfer in the land use and forestry sector 241
E.3.2 General examples of technology transfer in the land use and forestry sector 242
E.3.3 Detailed case description: afforestation of degraded agricultural lands in Romania 244
E.3.4 Concluding remarks on technology transfer in the land use and forestry sector concerning aspects of bio-energy 246
E.4 Conclusions 247 E.5 References 249
Report 500036 002 (ECN-C--05-014) 9
1. INTRODUCTION
Besides primary effects such as reducing greenhouse gas emissions, the implementation of cli-mate policies in Annex I countries of the Kyoto protocol may have secondary (side) effects, as the resulting increase in carbon or fossil fuel costs may affect energy prices and, hence, the prof-itability of energy-using industries in Annex I versus non-Annex I countries. From a global warming point of view, these secondary effects or ‘spillovers’ of climate policy may be either negative or positive. Negative spillovers refer particularly to the incidence of carbon leakage, i.e. an increase in CO2 emissions in non-abating countries due to the implementation of climate policy in Annex I countries. Positive spillovers, on the other hand, refer especially to the in-ducement of carbon-saving technological innovations and the diffusion of these innovations, both at home and abroad. The incidence of spillovers affects the cost-effectiveness of climate policy and, hence, the will-ingness of policy makers to design, ratify and implement international agreements to control global warming. Therefore, more knowledge on the incidence of spillovers due to climate policy and, particularly, more insight into the opportunities and means to reduce the potential negative spillovers of climate policy while enhancing its potential positive spillovers may improve the cost-effectiveness of carbon abatement agreements and, hence, the willingness of policy makers to accept and comply with such agreements. The primary objective of the present report is to provide a summary assessment of the analytical and empirical knowledge on the potential incidence of spillovers due to climate policy in Annex I countries of the Kyoto protocol. These spillovers include especially the prevalence of carbon leakage as well as the induced innovation and diffusion of carbon-saving technologies in both Annex I and non-Annex I countries. In addition, the report aims to draw lessons, conclusions and policy implications with regard to the opportunities and means to reduce potential negative spillovers of climate policy (i.e. ‘carbon leakage’) and to enhance its potential positive spill-overs (‘induced technological change’). In order to achieve these objectives, the report presents the major findings of a scientific as-sessment project called 'Carbon Leakage and Induced Technological Change: the negative and positive impacts of stringent climate policy'. This project, which has been conducted by a con-sortium of four research partners in the Netherlands, has consisted of the following sub-projects:1 1. A general assessment on the potential incidence of carbon leakage due to climate policy in
Annex I countries of the Kyoto protocol, based primarily on analytical model studies. 2. A general assessment on the potential incidence of induced technological change owing to
climate policy, including the diffusion of induced technological innovations to non-Annex I countries, based primarily on analytical model studies.
3. A case-study assessment on the potential incidence of climate policy spillovers in the en-ergy-intensive industry, based primarily on empirical studies of this industry.
4. A case-study assessment on the potential incidence of climate policy-induced technological spillovers in the wind power industry, based primarily on empirical studies of this industry.
5. A case-study assessment on the potential incidence of climate policy-induced technological spillovers in the biomass and bio-energy industry, based primarily on empirical studies of this industry.
1 The research partners participating in the consortium included the Energy research Centre of the Netherlands
(ECN), the Institute for Environmental Studies (Vrije Universiteit Amsterdam), the Copernicus Institute (Utrecht University), and the Climate Change and Biosphere Research Centre (Wageningen University).

10 Report 500036 002 (ECN-C--05-014)
As indicated, each sub-project has conducted an assessment study based primarily on available literature of existing analytical or empirical knowledge (i.e. without performing additional, own research). Beforehand, it should be noted, however, that while the analytical - i.e. model-based - knowledge on climate policy spillovers has grown steadily over the past decade, the empirical knowledge on these spillovers is often still limited - including the empirical calibration and test-ing of the analytical models concerned - as climate policy (in a strict sense) has only been im-plemented gradually since the late 1990s. Hence, the time period has generally been too short to generate adequate, conclusive empirical knowledge and information on longer term issues such as carbon leakage or induced technological spillovers. Therefore, in some sub-projects the em-pirical scope of the assessment study has occasionally been broadened to include similar poli-cies or events over the past three decades, such as environmental regulation, pollution abate-ment subsidies, energy saving measures or higher fuel prices due to either the oil shocks of the 1970s of higher energy taxes thereafter. The assessment studies of the sub-projects mentioned above have resulted in five separate posi-tion papers, which are included in the second part of the present report (Appendices 1-5).2 A summary and synthesis of the major findings and policy implications of these papers is pre-sented in the first part of this report. More specifically, the structure of the first part of the present report runs as follows. After this introduction, the next chapter provides a conceptual framework, particularly on the terms ‘spill-overs’, ‘carbon leakage’ and ‘induced technological change’. Subsequently, Chapter 4 presents the major findings of analytical model studies on the incidence of carbon leakage due to climate policy in Annex I countries of the Kyoto protocol, while similar analytical findings on the inci-dence of induced technological spillovers are discussed in Chapter 5. Next, Chapter 6 presents the major findings of the empirical case studies on climate policy spillovers, notably in the en-ergy-intensive manufacturing industry, the wind power industry, and the biomass and bio-energy industry, respectively. Finally, the major policy implications of the present report are discussed in Chapter 7.
2 These position papers have been presented during a workshop in The Hague (Ministry of VROM, 2 July 2004) and
reviewed by national/international experts of the issues concerned.

Report 500036 002 (ECN-C--05-014) 11
2. CONCEPTUAL FRAMEWORK
2.1 Spillovers The concept of spillovers originates in the literature of R&D and technological change where it has been applied under a variety of largely synonymous labels such as ‘knowledge spillovers’, ‘technological spillovers’ or equivalent terms such as ‘R&D externalities’ or ‘innovation exter-nalities’. These concepts all refer to the fact that knowledge has a high non-rival, public-good character and that, as a result, a private innovator may be unable to fully appropriate the social returns of investments in R&D and technological change. A major part of these social returns will accrue as ‘spillovers’ or ‘positive externalities’ to competitors - who will be able to use the knowledge as well - or to downstream firms and customers who purchase the innovator’s prod-uct at a price that captures only a portion of its full value (including the enhanced quality of the innovated product). This ‘appropriability problem’ or ‘spillover gap’ between the private and social returns of innovations is likely to lead to significant underinvestment by private firms in R&D, relative to the social optimum (Jaffe, et al., 2003). Recently, the concept of spillovers has been used in a wider meaning in the literature on climate policy. For instance, according to the Third Assessment Report of the IPCC, ‘spillovers from domestic mitigation strategies are the effects that these strategies have on other countries. Spill-over effects can be positive or negative and include effects on trade, carbon leakage, transfer and diffusion of environmentally sound technology, and other issues’ (IPCC, 2001). A similar definition of spillovers has been used by Grubb, et al. (2002a and 2002b). In their definition, spillovers refer to the impact of mitigation actions by the industrialised countries on the level of GHG emissions in the developing countries. They distinguish three components of international spillovers: • Spillovers due to economic substitution effects, such as price or terms-of-trade effects, re-
sulting in a leakage (or negative spillover) of emissions. • Spillovers due to the diffusion of technological innovations induced by abatement action in
the industrialised countries and transferred to the developing countries. This component cor-responds to the (narrow) definition of spillovers originating in the R&D literature mentioned above.
• Spillovers due to policy and political influence of industrialised countries mitigation efforts on developing countries abatement actions, such as the spread around the world of abolish-ing fossil fuel subsidies, accepting mitigation commitments, liberalising electricity markets or implementing other energy efficiency-enhancing measures.
In this report, a similar (but slightly less) broad definition of the term ‘spillovers’ will be used, referring to the secondary (side) effects of climate policy on the level of GHG emissions in An-nex I and non-Annex I countries, including in particular the effects of ‘carbon leakage’ and ‘in-duced technological change’ on global GHG emissions. These latter two terms will be eluci-dated in the sections below.
2.2 Carbon leakage The term carbon leakage refers to the effect that a part of the CO2 reduction that is achieved by countries that abate CO2 emissions is offset by an increase in CO2 emissions in non-abating countries.3 More strictly, given the implementation of climate policy in CO2 abating Country A
3 Note that in this report carbon leakage is defined at the national level, whereas in part of the literature - notably
dealing with JI/CDM - it is defined at the project level.

12 Report 500036 002 (ECN-C--05-014)
and the resulting rise in CO2 emissions in non-abating country NA, carbon leakage can be de-fined as the ratio of the policy-induced increase of emissions from country NA over the reduc-tion of emissions by Country A. For instance, if Country A implements measures to reduce emissions by 10 Mt of CO2 and if the emissions of country NA increase by 2 Mt of CO2 as a re-sult of A’s measures, carbon leakage is:
Increase in emissions of country NA 2 *100% 20%Reduction in emissions of country A 10
= =
As indicated above, carbon leakage is usually expressed as a percentage of emissions reduction in abating countries. Whereas some authors consider this rate as an appropriate indicator to as-sess the environmental effectiveness of climate policy in its own right, others doubt the useful-ness of this indicator alone to make comparisons or to draw meaningful policy conclusions as it does not provide the full picture of the magnitude and underlying factors of the policy-induced changes in emissions in abating and non-abating countries.4
2.3 Induced technological change The process of technological change covers the widely used Schumpeterian trilogy of invention (i.e. the first development and demonstration of a scientifically or technically new product or process), innovation (i.e. the first regular commercial production of a new technology) and dif-fusion (i.e. the spread of a new technology across its potential market). For the purpose of this report, induced technological change is defined as the component of technological change that is brought about in response to government climate policy (while the term endogenous technologi-cal change will be used in the same meaning, although in a modelling context). Climate policy is primarily aimed at controlling greenhouse gas (GHG) emissions (i.e. mitigation) and includes both market-based instruments (such as taxes, subsidies or tradable permits) and command-and-control regulations (such as setting performance- or technology-based standards for firms or households).
4 See Kuik (2004) and Oikonomou et al. (2004), included as Appendices 1 and 3 of the present report, respectively.

Report 500036 002 (ECN-C--05-014) 13
3. THE INCIDENCE AND CHANNELS OF CARBON LEAKAGE
3.1 Introduction In the previous chapter, carbon leakage has been defined as the increase in CO2 emissions in non-abating countries as a result of CO2 reduction policies in abating countries. This causality condition makes direct measurement of carbon leakage rather difficult, particularly as the avail-able methodology and database are still poorly developed. Whereas it is not particularly difficult to measure the increase in CO2 emissions in any one country, it is more difficult to decompose this increase into increases that are (i) the result of CO2 abatement policies in foreign countries, and increases that are (ii) the result of all other driving forces, including autonomous shifts in the international allocation of CO2-intensive industries. While measuring is and will probably remain problematic, some insights into the potential size of carbon leakage can be gained by better understanding the mechanisms through which it can occur. These issues will be discussed in the two sections below.5
3.2 The channels of carbon leakage In the literature, a number of distinct mechanisms or channels of carbon leakage have been iden-tified, including: 1. International trade in energy goods. Carbon reduction policies in a large region may well
have a significant negative effect on the world demand for carbon-rich fossil fuels, causing a possible fall in their world market prices. Falling prices could increase the demand for carbon-rich fuels in the rest of the world, thus increasing foreign CO2 emissions and enlarg-ing carbon leakage.
2. International trade in other goods and services. Carbon reduction policies may increase the production costs of carbon-intensive industries in abating countries and may therefore in-crease the selling prices of their goods. The demand for these goods may shift to relatively cheaper sources in non-abating countries whose costs have not been affected by carbon re-duction policies. Hence, comparative advantage would shift to industries in non-abating countries and this would affect production and trade. All else equal, this would increase CO2 emissions in these non-abating countries.
3. International trade in factors of production. Carbon reduction policies can reduce the pro-ductivity of factors that are employed in the production of fossil fuels or energy-intensive commodities. This may lead to an international reallocation of such factors to countries without such policies. In the political arena, the effect of climate and energy policies on in-ternational capital reallocation is the channel that is most discussed and feared (see also Section 3.4 below).
4. International interaction among government policies. Carbon reduction policies in a certain Annex I country may affect the income levels and cost/benefit balances of climate policies in other (non-Annex I) countries, thereby leading to a response of these policies and, hence, to a change in the levels of CO2 emissions by these countries. This change may be either positive or negative, implying that the carbon leakage due to the initial carbon reduction policies may also be either positive or negative.
Many studies have analysed the importance of these channels for the potential size of carbon leakage. Although there is ample discussion, controversy and speculation - with not much hard empirical evidence to go by - most applied modellers seem to agree that the first channel, i.e.
5 This chapter is based on Kuik (2004) – see Appendix A of the present report – and references cited there.

14 Report 500036 002 (ECN-C--05-014)
international trade in energy goods, is quantitatively the most important channel, at least in the short to medium term.
3.3 The potential size of carbon leakage As a rule, the potential size of carbon leakage is estimated by applied general equilibrium (AGE) models. Although such models provide a useful, but abstract tool for climate policy analysis, they are faced by several problems and limitations with regard to practical policy deci-sion-making, including problems such as model preselection, parameter specification, statistical testing or empirical validation. As a result, there is much debate and controversy on most of the key parameters in AGE models on carbon leakage. Several AGE models have estimated the potential size of carbon leakage between the original Annex I and non-Annex countries of the UNFCCC, notably due to the implementation of the Kyoto protocol. Most of these model estimates of the global rate of carbon leakage vary be-tween 5 and 20 percent of the required projected emission reductions in Annex I countries to meet their Kyoto commitments. However, while some observers expect a lower rate of carbon leakage owing to the implementation of emissions trading or other cost-saving measures by An-nex I countries to prevent industrial relocation, others predict a significantly higher rate due to the non-participation of major Annex I countries, such as the U.S. and Australia, and non-binding targets for Eastern Europe and the former Soviet Union. Moreover, some studies estimate that the incidence of carbon leakage will be higher in some specific energy-intensive sectors that are vulnerable to global competition, such as the chemi-cals or iron and steel industries. Finally, some experts expect that the incidence of carbon leak-age will be more significant in the long run (due to the relocation of trade and production fac-tors) depending on the stringency of post-Kyoto mitigation commitments, the number of abating versus non-abating countries, the sectors subjected to stringent abatement policies, and the inci-dence of induced technological change and other cost-reducing measures to prevent industrial relocation. In addition to the specific size of carbon leakage, there is also little consensus on the key pa-rameters that might influence its incidence. While some studies stress the importance of supply elasticities of fossil fuels - especially coal - to explain the size of carbon leakage, other studies emphasize the critical significance of other parameters, including (i) trade elasticities, (ii) input substitution elasticities, notably in the electricity and iron and steel industries in Annex I re-gions, (iii) degree of competitiveness in the world oil market, and (iv) existence of international emissions trading (Burniaux, 2001; IPCC, 2001). Moreover, apart from differences in key parameters, several authors have identified additional sources of differences among model studies that can lead to different predictions of the potential size of carbon leakage, including assumptions on the performance of international coal and oil markets; the exchange rate and monetary policies; the level of aggregation of regions, sectors and fuels; the baseline scenario, the international mobility of production factors; and the impact of trade liberalisation (Barker and Johnstone, 1998; Burniaux, 2001; Kuik and Gerlagh, 2003). The latter two factors will be discussed briefly in the two sections below.
3.4 The international mobility of production factors As noted above, a large amount of controversy exists on the potential impact of international reallocation of production factors - particularly capital - on carbon leakage. While some model-lers assume that the contribution of capital mobility will be very limited (and mainly restricted to capital flows among the more advanced Annex I countries), others stress the importance of international capital mobility in this respect, especially in the longer term.

Report 500036 002 (ECN-C--05-014) 15
Simulation studies with AGE models seem to suggest that capital flight from abating to non-abating countries will not be of major significance in the context of the Kyoto protocol, at least not during the time up to the first commitment period (2008-2012). One major factor is simply that the ‘absorptive capacity’ of developing countries for foreign capital is considered to be rela-tively small. However, while there is nearly overall consensus on the limited contribution of capital mobility to carbon leakage in the near term, some authors expect that the relocation of international in-vestment may well become the dominant source of carbon leakage in the more distant future (after 2010) in the absence of major breakthroughs in renewable energy or other, carbon-saving technologies (see also Section 5.2).
3.5 The impact of trade liberalisation on carbon leakage Another controversial issue concerns the potential impact of trade liberalisation on the incidence of carbon leakage. On the one hand, supporters of the so-called ‘Pollution Haven’ hypothesis claim that trade liberalisation will encourage the shift of carbon-intensive industries to countries without a carbon abatement target, implying that the rate of carbon leakage will increase due to trade liberalisation. On the other hand, adherents of the so-called ‘Factor Endowment’ hypothe-sis assert that when emissions are concentrated in capital-intensive industries, as is the case for CO2 emissions, then trade liberalisation will lead to a further concentration of these industries in relatively capital abundant countries, i.e. the Annex I countries, implying that the rate of carbon leakage will decrease due to trade liberalisation. As the above-mentioned controversy cannot be decided on theoretical grounds, it is a subject for empirical analysis (see Section 5.2). However, whereas some simulation studies in the late 1990s concluded that trade liberalisation would decrease the rate of carbon leakage (Babiker et al., 1997; Cole et al., 1998), a more recent study by Kuik and Gerlagh (2003) found that trade liberalisation would increase the overall rate of leakage due to the implementation of the Kyoto protocol. The latter study found also, however, that the costs of abating the trade-induced leak-age are modest relative to the welfare gains of freer trade (implying that a part of these gains could be used to finance additional carbon abatements in order to compensate the carbon leak-age).

16 Report 500036 002 (ECN-C--05-014)
4. THE INCIDENCE OF INDUCED TECHNOLOGICAL CHANGE
4.1 Introduction In addition to the potential negative side effect of carbon leakage, climate policies may also have some positive spillovers, notably the induced innovation and diffusion of technologies to control global warming in a more cost-effective manner. This chapter presents the major find-ings of both so-called ‘top-down’ and ‘bottom-up’ modelling studies on the spillover effects of climate policies on induced technological change - including the innovation and diffusion of new technologies at home and abroad - as well as, in turn, the impact of these technological spillovers on the long-term performance of these policies. First of all, however, it addresses the question whether climate policy will induce technological change, based on (i) a review of the (empirical) literature on technological change induced by environmental policies and/or higher energy prices, and (ii) a discussion of the (theoretical) literature on the relationship between market imperfections and environmental technologies.6
4.2 Does climate policy induce technological change? Based on a review of the literature, the available evidence on induced technological change by environmental policies and/or higher energy consumer prices seems to support the hypothesis that (future, stringent) climate policy will encourage the innovation and diffusion of new tech-nologies that will address the issue of controlling global warming in a more cost-effective way. However, while climate policy may induce technological change, the impact of climate policy alone will be far from optimal as the innovation and diffusion of green technologies is generally faced by two related sets of market imperfections. While climate policy may stimulate new technology as a side-effect of internalising the costs of the environmental externality (i.e. the greenhouse effect), it does not address explicitly the other set of market imperfections directly related to technological change (such as the incidence of spillover effects). On the other hand, simply relying on the promotion of technological change by technology policy alone is not enough as there must be a long-term, predictable and credible incentive in place that encourages the process of technological change to occur actually. Therefore, a balanced set of climate and technology policies is necessary to promote the innovation and diffusion of emission abatement technologies and, hence, to address the issue of global warming in an optimal way.
4.3 Induced technological change in top-down models of climate policy Top-down models are general macroeconomic models that analyse the economy - including the energy system - in highly aggregated terms, with hardly any detail on energy or mitigation tech-nologies at the sector level. Such models are particularly suitable for analysing macroeconomic effects of climate policies, including the interactions and feedback effects at the intersectoral, (inter)national, regional or global level. Over the past decade, induced technological change (ITC) has been incorporated in these models, particularly by linking the accumulation of knowl-edge and experience to changes in climate policy. In general, ITC top-down modelling studies show a wide divergence of results with regard to the impact of induced technological change and spillovers on the performance of climate policy. Whereas this impact is generally large and positive in some studies, it is relatively low or even negative in others. This divergence in the major results of top-down modelling studies with re-gard to the impact of ITC/spillovers on the performance of climate policies can be explained by 6 This chapter is based on Sijm (2004) – see Appendix B of the present report – and references cited there.
Report 500036 002 (ECN-C--05-014) 17
the methodology and data used. More specifically, besides differences in ITC channel (i.e. R&D versus learning-by-doing) and in policy optimisation criteria (i.e. the cost-effectiveness criterion versus the benefit cost criterion), these differences in outcomes can be mainly attributed to (i) the specification of some critical model functions, particularly the ITC or knowledge accumula-tion functions, (ii) model parameterisation and data use, (iii) the role of spillovers, and (iv) the role of other modelling characteristics varying among these studies such as the scope or level of aggregation (sectoral, national, regional, global), the number and type of policy instruments covered, the stringency of the abatement target, or the time horizon considered (i.e. the impact of ITC is often more significant in the long term). Despite substantial progress made over the past decade, the present ITC top-down studies are still faced by a variety of weaknesses and limitations, including: • These studies often have a highly aggregated, abstract character with little technological de-
tail and a poor, limited specification of knowledge accumulation, induced technological change and spillover effects.
• The empirical database for the parameterisation, calibration and estimation of the ITC model functions is still very weak.
• These studies are often very deterministic and hardly account for the major uncertainties of long-term policy issues in the field of global warming and technological change.
• These studies usually analyse only the impact of one ITC channel - mostly R&D, and occa-sionally learning-by-doing (LBD) - but not both channels simultaneously within one model. Moreover, these studies generally explore only one sole policy instrument - mostly a carbon tax, and occasionally emissions trading or a technology subsidy - but not a mixture of cli-mate and technology policies within one model. Therefore, it is usually hard to assess the full impact of ITC - including both R&D and LBD - on policy performance or to analyse and design a policy mix to optimise this impact. Finally, these studies usually analyse the impact of policies and ITC from a carbon abatement efficiency point of view but hardly from other socio-political considerations.
Due to these limitations and the diversity of their model outcomes, it is hard to draw firm les-sons and implications from the present ITC top-down studies. Nevertheless, a major lesson from these studies seems to be that even if climate policy induces technological change at the level of individual sectors or technologies, it does not imply that the social costs of such a policy will decline by necessity. Another lesson is that, when analysing or generating ITC, not only its im-pact on gross social costs should be considered but also its potential environmental benefits. A final implication of the present state of ITC top-down studies is that further research is neces-sary in order to draw more firm policy lessons and implications.
4.4 Induced technological change in bottom-up models of climate policy Bottom-up energy system models are usually characterised by a detailed analysis of energy technologies, including information on the costs and other performance characteristics of these technologies such as the energy efficiency or GHG emissions per unit input or output. Since the mid-1990s, technological change has been endogenised in some of these models by means of so-called learning curves that relate the costs of specific technologies to the accumulation of knowledge and experience during the innovation and diffusion stages of these technologies. In contrast to the ITC top-down studies discussed above, ITC bottom-up studies show some ma-jor similarities in performance, in terms of both methodological approach and major findings of the models used. In order to explore the interaction between climate policy and induced techno-logical change, these studies have used a detailed, bottom-up energy technology system model in which learning curves have been added to the cost functions of (some) energy technologies covered by these models. The major findings of these studies are that, due to the presence of ITC (i.e. ‘learning technologies’), (i) the investment costs of these technologies decline if they built up capacity (‘experience’), (ii) the energy technology mix changes in favour of those tech-

18 Report 500036 002 (ECN-C--05-014)
nologies that built up the relatively highest rate of learning (i.e. cost reduction), and (iii) the to-tal abatement costs of a given abatement target decline significantly. However, although there is a large degree of agreement among bottom-up studies with regard to these results, the size of the impact of ITC on, for instance, the technology mix or abatement cost may vary substantially between these studies depending on the assumed rate of technologi-cal learning, the number of learning technologies included in the analysis, the time frame con-sidered, the stringency of the mitigation target, etc. Moreover, despite significant progress made in endogenising technological change in bottom-up modelling studies over the past decade, the present state of these studies is still characterised by several weaknesses and limitations, including: • While the number of energy technologies included in bottom-up models is often relatively
large, the number of technologies characterized by endogenous learning is usually limited to a few (electricity) supply-side technologies, thereby neglecting other technologies, particu-larly at the demand side of the energy system. This leads to biased results and an underesti-mation of the full potential impact of ITC.
• The empirical database for estimating learning curves in general, and two-factor learning curves in particular, is often weak. Moreover, the estimation of (two-factor) learning curves is often faced by statistical problems and econometrical shortcomings, leading to biased re-sults. In addition, despite some growing insights, the technology learning phenomenon re-mains largely a ‘black box’ and sound models, able to identify the factors that underlie the learning effects, are still missing. As a result, it is often hard to draw firm, relevant policy implications from bottom-up studies based on estimated learning curves.
• Bottom-up studies are usually focussed on analysing mainly the diffusion of technologies (‘learning-by-doing’) and less on technological innovation through R&D investments (‘learning-by-searching’). The latter channel of ITC, however, is covered by some recent bottom-up studies, although - as indicated above - these studies often suffer from statistical and econometrical shortcomings. In addition, bottom-up studies are usually focussed on analysing the ITC impact of only one or two policy instruments, particularly an en-ergy/carbon tax or a technology subsidy. As a result, it is often hard to draw firm, relevant policy implications with regard to the choice and optimal mix of instruments, either within the field of technological innovation or the field of technological diffusion, or between these fields of technological change.
• Bottom-up studies are characterised by a limited specification of the behaviour of producers and consumers, the performance of (imperfect) markets, and the feedback effects of this be-haviour and performance at the macroeconomic level. Therefore, their estimates of GDP losses or social costs due to climate policy or ITC have to be interpreted with some pru-dence.
Due to these limitations of ITC bottom-up studies, it is hard to draw a set of firm, specific policy lessons and implications. Nevertheless, a few general lessons and implications can be formu-lated. Firstly, perhaps the most important policy message from technology learning is that new technologies require markets to become commercial. Hence, as it takes time to build up capacity (i.e. ‘learning’ or ‘experience’) and to reduce costs until a market break-even point is reached, there is a need for early policy action to accomplish the required cost and performance im-provements in the long term, including the creation of niche markets, the development of small-scale demonstration plants, targeted R&D, and the (temporary and declining) subsidization of promising technologies. Another lesson is that, owing to the presence of spillovers, the imposition of emission con-straints in the Annex I region may induce technological change and, hence, emission reductions in the non-Annex region even when the latter region does not face emission constraints itself. A final lesson or implication is that further research is needed in order to draw more concrete, firm policy conclusions from ITC bottom-up modelling studies.
Report 500036 002 (ECN-C--05-014) 19
5. MAJOR FINDINGS OF EMPIRICAL CASE-STUDY ASSESS-MENTS
5.1 Introduction Whereas the previous two chapters have largely focused on a discussion of the major results of analytical model studies on the incidence of spillovers due to climate policies in Annex I coun-tries, the present chapter presents the major findings of three empirical case-study assessments conducted as part of the project ‘Spillovers of climate policy’. These case-studies include the energy-intensive industry (Section 5.2), the wind power industry (Section 5.3), and the biomass and bio-energy industry (Section 5.4).
5.2 The energy-intensive industry
5.2.1 Introduction Energy-intensive industries play a special role in climate policy. Worldwide, industry is respon-sible for about 50 percent of greenhouse gas emissions.7 About three quarters of these emissions are caused by energy-intensive industries that produce iron and steel, aluminium, chemicals, fer-tilizers, cement and pulp and paper. The emission intensity makes these industries an important target for climate policy. At the same time these industries are particularly vulnerable if climate policy would lead to higher production costs, and if they would be unable to offset these in-creased costs. Policymakers do not want to harm the relative international competitive position of these industries due to climate policy, since it could lead to relocation (i.e. a shift of energy-intensive industries to countries with less stringent climate policies or lower energy prices). On the other hand, climate policy may improve the competitiveness of the energy-intensive indus-tries by inducing technological innovations that reduce the energy/carbon intensities of these industries. The incidence and underlying factors of these potential (negative and positive) spill-overs of climate policy are discussed briefly below.
5.2.2 Relocation of production structures Based on analysing the trends in regional production structures of energy-intensive bulk materi-als (steel, paper, aluminium, cement and fertilizers), it can be concluded that industrialised countries have been losing global market shares in the production of these materials over the past three decades. This loss in global market shares has been predominantly demand-driven, i.e. caused by the development of new markets and increasing demand in developing countries, rather than by an overall shift of competitive advantage from the industrialised countries to-wards the developing countries (and a consequent relocation of production structures in the ac-tual, strict sense of the word). More specifically, an assessment of the empirical literature on the factors affecting the interna-tional (re)location of production structures in the energy-intensive industry has resulted in the following major findings: 1. In the past, environmental policy has generally not been a significant decision criterion for
the location of investments in the energy-intensive industry and, hence, it does not represent a key explanatory factor for such investments in the developing world.
7 Section 5.2. is mainly based on Oikonomou et al. (2004) - see Appendix C of the present report - and references
cited there.
20 Report 500036 002 (ECN-C--05-014)
2. In general, compliance costs as a result of environmental policy are limited in pollution in-tensive industries, and other cost factors seem to be more decisive investment criteria, with the most important ones being market size and growth (regional demand) and the wage level. Hence, industries with increasing returns to scale will not relocate easily if the pollu-tion abatement costs do not rise more than a high threshold level.
3. The limited effect of environmental policy seems plausible also in view of the companies’ pursuit of higher value added products and their concomitant relatively low interest in con-ventional energy intensive products. It is also supported by statements of industry represen-tatives who point out that all countries that are attractive for investment have rather strin-gent environmental legislation and that, secondly, multinational enterprises would risk their reputation by investing in pollution havens. Moreover, if income levels of developing coun-tries increase, they will demand stricter environmental legislation and, hence, these coun-tries should normally not be a long-term pole of relocating energy-intensive or other, highly polluting industries. Finally, some global players tend to use the most recent technology worldwide since this minimises planning and maintenance costs, particularly in energy-intensive industries producing typical products such as basic chemicals, cement, or pulp and paper.
Hence, based on these empirical findings, it may be concluded that, in the past, environmental policy has generally not been a significant factor affecting the competitiveness and (re)location investment decisions of energy-intensive industries.
5.2.3 Comparing results of empirical and model studies The empirical results mentioned above can be compared to the analytical findings of climate policy models, notably those focusing on estimating carbon leakage in energy-intensive indus-tries. For instance, according to three models of the steel sector, even moderate climate policies – resulting in abatement cost levels of 10-25 US$/tCO2 – lead to high rates of carbon leakage, varying between 25-45 percent of the sectoral emissions reduction in the abating countries. These significant differences between the results of empirical versus analytical model studies are hard to explain fully but may be attributed to the following factors: • Model results are subject to major uncertainties and may not always be fully reliable due to
a lack of empirical validation and calibration of the model parameters. • Whereas the empirical studies are focused mainly on assessing the impact of past environ-
mental policies on the (re)location of energy-intensive industries, the model studies try to estimate the impact of future climate policies on the incidence of carbon leakage of these industries. Hence, these studies are aimed at assessing different entities that, although re-lated, are not fully comparable. Moreover, although climate policy in the example men-tioned above is rather moderate, there still may be a significant difference in stringency (and, hence, in cost effects) between the environmental policies assessed by empirical stud-ies and the climate policies assumed in model exercises.
Overall, the explanation of the different outcomes between empirical studies on (re)location of energy-industries and model studies on carbon leakage in these industries is not fully satisfac-tory. Additional research, particularly empirical and model studies on the impact of climate pol-icy on both (re)location decisions and carbon leakage in energy-intensive industries, is neces-sary to provide a more satisfactory explanation of these different outcomes (see also Section 5.2.5 below).
5.2.4 Technological spillovers The energy and carbon intensity of energy-intensive industries is rapidly declining in most de-veloping countries, reducing the 'gap' between industrialised and developing countries. Still, considerable potential for emissions reduction exists, both in developing and industrialised
Report 500036 002 (ECN-C--05-014) 21
countries. Technology development is likely to deliver further reductions in energy use and CO2 emissions, when supported in a suitable manner. While this development will mainly take place in industrialized countries, developing countries will be the most important markets for these technologies. As foreign direct investment (FDI) has become one of the more important vehicles for technol-ogy transfer, FDI may also be the future mechanism for bringing new carbon-reducing tech-nologies to a global market. Research of FDI-patterns has demonstrated that foreign-owned firms are generally less polluting than domestic companies. Despite the potential for technological spillovers in the energy-intensive industries, most of the models used in the analysis of spillovers of climate policies lack an endogenous representation of technological change for these industries. Recently, several studies have started to incorpo-rate mechanisms to simulate changes in technology performance as a function of development and deployment, but none addresses demand side technologies, and especially not in the energy-intensive industries.
5.3 The wind power industry
5.3.1 Introduction Since the 1970s, the size of the wind power industry has grown rapidly, notably in industrialised countries such as Denmark, Germany or Spain, but also in some developing countries, particu-larly in India. It is generally expected that the significance of this industry will continue to grow substantially in the coming decades, among others owing to the positive spillover effects of cli-mate policy in Annex I countries, resulting in the further development and deployment of wind power technology in these countries and the diffusion of this technology to other (non-Annex I) countries. Therefore, the wind power industry offers an interesting case-study to assess the po-tential positive (technological) spillovers of climate policy. In the sections below, some major findings of a case-study assessment of these spillovers will be discussed, based on a review of part of the literature.8
5.3.2 Spillovers of the Danish wind turbine industry After the oil crises of the 1970s, development of wind power became a cornerstone of the Dan-ish energy policy. Whereas the Danish government originally started with a two-pronged ap-proach of a Research, Development and Deployment (RD&D) programme for large wind tur-bines – with minor results – and a more market-oriented approach for small wind turbines – with major, successful results – around 1990 the Danish government switched to an ‘evolution-ary’ development of small and medium scale wind turbines. The latter approach became a suc-cess owing to a favourable policy mix, including RD&D programmes, supportive feed-in tariffs for generating wind power, export guarantees and other incentives to develop, deploy and ex-port wind turbine technologies. Hence, although sometimes hard to quantify, the Danish policy to promote wind power resulted in the following spillovers: • The development and diffusion of wind turbine technology in Denmark resulting in a thriv-
ing, domestic and exporting industry that contributes significantly to raising GDP, employ-ment and foreign exchange.
• The diffusion of Danish wind turbine technologies to other industrialised countries, notably Germany and Spain, but also to developing countries such as India.
• The adoption of favourable Danish policies and useful lessons by other countries in order to develop their own wind power industry.
8 See Lako (2004) – included as Appendix D of the present report – and references cited there.

22 Report 500036 002 (ECN-C--05-014)
Overall, these spillovers of Danish policies to encourage the development of wind power tech-nologies have resulted in a significant reduction of carbon emissions, both at home and abroad. This indicates that future (stringent) climate policies in Denmark - or other Annex I countries - may have similar, additional spillover effects in the wind power sector of these and other (non-Annex I) countries.
5.3.3 Two-factor learning for wind power Costs of new technologies such as wind power may decline steadily due to the accumulation of knowledge and experience (‘learning’), resulting in a mutually reinforcing process of further deployment, additional learning, cost decreases, etc. Governments can encourage this process by means of promoting R&D investments in these technologies and/or by stimulating their de-ployment (for instance, through implementing climate policies that raise the costs of carbon emissions). As a result, these technologies become cheaper, which may enhance their diffusion to other countries in both Annex I and non-Annex I regions. This implies that climate policies of a particular country may spill over to other countries in the form of lower (investment) costs and higher deployment rates of new technologies in these countries. A few studies have tried to estimate the impact of two-factor learning on the investment costs of wind power technologies, where two-factor learning refers to the accumulation of knowledge and experience due to both R&D investments (‘learning-by-searching’) and market deployment (‘learning-by-doing’). These studies show a wide variety of results in terms of estimated learn-ing rates - i.e. percentages of cost decrease for each doubling of cumulative installed capacity - varying from 6 to 13 percent for the ‘learning-by-searching’ rate and from 5 to 13 percent for the ‘learning-by-doing’ rate.9 These different outcomes may be attributed to differences in data, models or methodologies used, including differences in coverage of countries, time periods, cost data, etc. Nevertheless, although estimates of learning rates have to be treated with caution, they indicate that climate policy - through either stimulating R&D investments or promoting market deploy-ment of new technologies - may lead to substantial cost reductions of these technologies, thereby encouraging their transfer and diffusion to other countries.10
5.4 The biomass and bio-energy industry
5.4.1 Introduction Similar to the case of wind power discussed above, it is widely expected that a stringent climate policy in Annex I countries will lead to technological innovation in the biomass and bio-energy industry and that this technological innovation could also benefit non-Annex I countries and thus lead to a global reduction of CO2 emissions. Hence, this industry offers an additional inter-esting case study to assess the potential positive (technological) spillovers of climate policy. In the sections below, some major findings of a case-study assessment of these spillovers will be discussed, focusing on the impact of Dutch (climate) policies and other drivers on the develop-ment and diffusion of new technologies in the biomass and bio-energy industry.11
9 These studies and estimates of one/two-factor learning are discussed in Appendices B and D of the present report
(Sijm, 2004; and Lako, 2004). 10 See Appendix D (Lako, 2004) for a further discussion of learning rates/curves for both onshore and offshore wind
power technologies in several (EU) countries, and the implied cost reductions for these technologies. 11 See Appendix E of the present report (Annevelink et al., 2004), and references cited there.

Report 500036 002 (ECN-C--05-014) 23
5.4.2 Role of climate policy and other drivers Since the mid-1990s, the energy and climate policy framework in the Netherlands has certainly been favourable for stimulating the development and transfer of biomass and bio-energy tech-nologies. In brief, this framework includes: • Special programmes to encourage the R&D of biomass and bio-energy technologies. • Fiscal instruments to lower investment costs of renewable energy projects. • Production subsidies or, since mid-2003, feed-in tariffs (MEP) to stimulate electricity gen-
eration from renewable resources. • An energy tax on the use of natural gas and electricity generated from fossil fuels, thereby
promoting the consumption of energy from renewable resources. • A fully liberalised market for green electricity (since mid-2001), with free consumer choice
and a tradable green certificate system for renewable energy. • The implementation of the EU Emissions Trading Scheme (starting from 2005), which
raises the costs of carbon fuels and, hence, encourages the use of bio-energy and other car-bon-saving fuels.
• The use of JI and CDM to meet the Dutch Kyoto commitments, including projects that transfer biomass and bio-energy technologies to JI/CDM host countries.
It should be acknowledged, however, that in both Annex I and non-Annex I countries the devel-opment and diffusion of bio-energy technologies have been promoted for a variety of other rea-sons besides climate policies (even long before these policies became in fashion since the mid-1990s). In short, these other drivers include: • The energy crises of the 1970s which encouraged (import) substitution of fossil fuels by
(self-sufficiency in) bio-fuels in order to reduce the dependence on expensive (foreign) sources of energy supply.
• The solving of waste disposal problems by a better utilisation of (agricultural) waste and by-products - such as bagasse, sawdust, rice husks, straw, palm shells, etc. - including other en-vironmental gains from reduced waste streams.
• The incidence of economic or commercial reasons (i.e. the opportunity to earn money with bio-energy technologies).
• The need to be able to process regionally available biomass more efficiently on a local scale. • The need to meet rural energy needs and to achieve rural electrification by means of decen-
tralised power and heat generation, particularly in those areas of non-Annex I countries that are not connected to a public electricity and/or heat grid.
5.4.3 Potential of biomass and bio-energy technologies Estimates of the global potential of biomass for energy vary widely, ranging from 35 to 1135 EJ/year (to compare: the global consumption of oil, natural gas, coal, nuclear energy and hydro electricity in the period of 1999-2000 was about 365 EJ/year, while global biomass consumption for energy in the same period is estimated to be 35-55 EJ/year). These large differences can be explained generally by two important parameters that are very uncertain: land availability and biomass productivity (i.e. yield levels in energy crop production). More specifically, biomass availability for energy purposes depends on six crucial factors, including (i) future demand for food, (ii) type of food production systems, (iii) productivity of forests and energy crops, (iv) (in-creased) use of bio-materials, (v) availability of degraded land, and (vi) competing land use types. During the last decade, a wide range of technologies and expertise has been developed to con-vert biomass into heat, electricity and bio-fuels. The categories of biomass conversion technolo-gies likely to be involved in technology transfer between countries are thermo-chemical tech-niques (particularly combustion and co-combustion, gasification, pyrolysis, and hydro thermal upgrading), and bio-chemical techniques (notably anaerobic digestion, and hydrolysis followed by fermentation). These biomass technologies are in different development-stages. Anaerobic

24 Report 500036 002 (ECN-C--05-014)
digestion, (co-)combustion and hydrolysis followed by fermentation are commercially available conversion technologies and therefore in an implementation phase, whereas gasification and py-rolysis are more in a pre-commercial demonstration phase. Hydro thermal upgrading is still at the end of a research and development phase, entering a demonstration phase. A major barrier for a widespread diffusion of (some) bio-energy technologies is that they are still quite expensive. The costs of these technologies, however, may decline rapidly if their de-ployment expands rapidly, as indicated by the learning rates/curves of these technologies. Esti-mates of (scarcely available) learning rates for bio-energy technologies vary widely (from 5 to 30 percent), depending on the type of technology, the stage of development of the technology, or other factors such as the data or methodology used. Moreover, besides their wide variation, estimates of learning rates - and their derived learning curves - are faced by a variety of limita-tions (see Section 4.4). As a result, it is hard to draw firm policy implications based on such es-timates.
5.4.4 Barriers to development and diffusion of bio-energy technologies In addition, other barriers to the transfer and diffusion of bio-energy technologies to developing countries and countries in transition include (i) financial obstacles such as lack of investment funds or the perceived risks for financiers, (ii) lack of biomass availability for energy purposes, among other due to alternative uses of biomass, (iii) lack of knowledge and understanding, (iv) lack of management skills, (v) lack of access to the grid, and (vi) institutional difficulties, nota-bly the lack of supporting institutions in developing countries.

Report 500036 002 (ECN-C--05-014) 25
6. POLICY IMPLICATIONS
6.1 Policies to reduce carbon leakage Carbon leakage reduces the global cost-effectiveness of CO2 reduction policies by abating coun-tries. At any leakage rate below 100 percent, national CO2 reduction policies contribute to global CO2 reductions, but the higher the rate of leakage, the lower the net effect on global emissions and the higher the cost per ton of net, global CO2 reduction. There are several options, however, to control or even reduce carbon leakage. The first-best pol-icy to reduce carbon leakage is to increase the size of the group of abating countries. To reduce global carbon leakage, it is not important that additional countries to any international agree-ment are forced to substantial reductions; it is enough if they agree to any binding target (which might be a zero reduction target with respect to their baseline emissions, i.e. an allowed increase of emissions from, say, 1990 levels). Without such broader participation, it might be worth considering whether domestic or regional (EU) reduction policies could be designed in a manner to reduce carbon leakage. The second-best policy would be to implement import and export taxes for the international trade of CO2-intensive products with non-abating countries. It is commonly believed that such a form of trade discrimination would not be allowed under the rules and disciplines of the WTO, but there are precedents by the way of multilateral environmental agreements with (discriminating) trade provisions that have not (yet) been challenged before the WTO. Nevertheless, it appears that the participating countries to the Kyoto protocol do not actively investigate this second-best policy. A third-best policy would be to differentiate the stringency of domestic CO2 reduction policies among sectors. On the basis of their CO2-intensity and sensitivity to international trade, eco-nomic sectors can be classified into ‘exposed’ and ´sheltered’. In general, sheltered sectors may be less vulnerable to leakage than exposed sectors, although differences among sectors and even among firms within these broad classes may be significant. Any policy that would simply shift a part of the CO2 reduction burden from the exposed to the sheltered sectors could reduce leakage, but would probably increase aggregate national abatement costs. This increase in costs could be justified from a global cost-effectiveness perspective if the relative increase in costs would be less (in absolute terms) than the resulting reduction in leakage rate. As most researchers argue, however, that leakage in the short to medium term is primarily caused by changes in relative prices of energy goods (the energy trade channel) and not by in-dustrial relocation, an alternative option would be accept an ‘unavoidable’ rate of leakage in the short to medium term and concentrate on action to avoid leakage by industrial relocation in the longer term. The most obvious course of action would be to stimulate innovation to improve the CO2–efficiency of exposed sectors in order to remain or even enhance their competitiveness on the world market. This issue of encouraging technological progress is discussed further in the next section.
6.2 Implications for post-Kyoto climate and technology policies The discussion in the previous chapters on the incidence of induced technological change raises some major considerations and implications for the post-Kyoto agenda on climate and technol-ogy policies. Firstly, as argued in Chapter 4, the market for developing and diffusing environ-mental technologies is characterised by two related sets of imperfections (i.e. environmental ex-ternalities and technology market failures). Moreover, both the greenhouse effect and the spill-

26 Report 500036 002 (ECN-C--05-014)
over externality of technological change have a highly international, global character. Therefore, a well-balanced package of internationally coordinated climate and technology policies is nec-essary to deal with these two sets of market imperfections, in particular as long as climate policy alone is not able to address the greenhouse externality in an adequate way. In addition, it should be noted that technology policy alone will not be able to cope adequately with the issue of global warming, since an incentive - for instance a carbon tax or emission limit - is necessary to induce technological change in the direction of developing and diffusing emission-saving tech-nologies. Moreover, international technological cooperation without any commitment to emis-sions control may not lead to a sufficient abatement of greenhouse gas concentrations Secondly, it is sometimes suggested that technology diffusion should be used as an incentive in the international climate negotiations, for instance by excluding certain countries from the bene-fits of technology diffusion (or by including these countries in the Annex I climate coalition by exchanging these benefits for the willingness to accept emission limitations). It may be ques-tioned, however, whether such a strategy - notably the ‘exclusion option’ - will be feasible and efficient, because technological knowledge has a highly public (international) character, while restricting technology diffusion is not in the interest of the climate coalition for both environ-mental and technology learning (i.e. cost reduction) reasons. Indeed, this strategy of ‘issue link-age’ is most likely not cost-effective, or even counter-productive, since nobody will benefit. Rather than excluding other countries from the knowledge on emission-saving technologies, it is better to pursue an optimal diffusion of such technologies. Thirdly, the considerations above raise the question how the innovation and diffusion of emis-sion-saving technologies can be stimulated internationally by the climate coalition. The major options include: • International co-operation on Research, Development, Demonstration and Deployment ac-
tivities (summarised as RD3), for instance by creating an international subsidy fund for the innovation and diffusion of renewable energy technologies.
• Since diffusion of technology often occurs through international trade and foreign direct in-vestments, it can be promoted through general policies such as pursuing a fair open trading system or taking care of adequate financial and legal means in developing countries.
• Stimulating technology diffusion through emissions trading, notably the Clean Development Mechanism (CDM), and sound technology transfer strategies emphasizing, among others, local activities and sound technology capacity building that enables countries to assimilate and adapt experience accumulated somewhere else).
• Promoting the innovation and diffusion of carbon-saving technologies by means of volun-tary agreements (‘covenants’) between governments of the climate coalition and a few inter-national firms that dominate R&D and technological change in certain areas, for instance the international automobile industry or the international ‘bulk power’ technology generating industry. If such covenants turn out to be not effective, the imposition of well-designed in-ternational technology standards could be considered.
These options should be part of the post-Kyoto agenda in order to enhance the potential positive interaction between climate policy, induced technological change and international spillovers, including the potential positive impact of this interaction on mitigating global greenhouse gas emissions and reducing total abatement costs.
6.3 Further research With regard to the availability and performance of existing studies on ‘spillovers of climate pol-icy’, the major findings on the present assessment project on this issue are that: • The availability of empirical studies on this issue is still scarce.

Report 500036 002 (ECN-C--05-014) 27
• The findings of analytical model studies have to be interpreted with caution as they lack empirical calibration and testing. Moreover, these findings are often expressed at a highly abstract and aggregated level and, hence, hard to translate to concrete, disaggregated policy implications and actions.
• The findings of studies on spillovers of climate policy are often ambiguous or even contra-dictory, both between different analytical studies as well as between analytical model stud-ies on the one hand and empirical (case) studies on the other hand.
Hence, besides the empirical calibration, testing and further development of analytical model studies on spillovers of climate policy, additional research in the field of positive and negative spillovers of climate policy warranted given. This additional (empirical) research should be fo-cused on the role of climate policy versus other factors in affecting (i) the (re)location of pro-duction structures and investment decisions of internationally competing firms, particularly in energy-intensive industries, (ii) the consequent carbon leakages of these industries in abating countries, and (iii) the development and diffusion of new technologies to reduce the carbon in-tensities of these industries and to improve their international competitiveness. The findings of this additional research could help to construct improved models for projecting the incidence of carbon leakage and induced technological change, and to design more effective instruments and measures to improve the balance between these negative and positive spillovers of climate pol-icy.

28 Report 500036 002 (ECN-C--05-014)
REFERENCES
Babiker, M., K. Maskus, and T. Rutherford (1997): Carbon taxes and the global trading system. Laxenbourg: Paper prepared for presentation at the International Energy Workshop and Energy Modelling Forum Meeting at IIASA, June 23-25, 1997.
Barker, T., and N. Johnstone, (1998): International competitiveness and carbon taxation. In T. Barker and J. Kohler (Eds.), International competitiveness and environmental policies. Cheltenham, UK/Northampton, MA.: Edward Elgar.
Burniaux, J.-M. (2001): International trade and investment leakage associated with climate change mitigation. West Lafayette, in Center for Global Trade Analysis, Purdue University, Fourth Annual Conference on Global Economic Analysis, Vol. II, pp. 1-24.
Cole, M., A. Rayner, and J. Bates (1998): Trade liberalisation and the environment: The case of the Uruguay Round. The World Economy, Vol. 21, 337-347.
Grubb, M., C. Hope, and R. Fouquet (2002a): Climatic Implications of the Kyoto Protocol: The Contribution of International Spillover. Climatic Change, Vol. 54, pp. 11-28.
Grubb, M., J. Köhler, and D. Anderson (2002b): Induced Technical Change in Energy and Environmental Modelling: Analytic Approaches and Policy Implications. Annual Review of Energy and the Environment. Vol. 27, pp. 271-308.
IPCC (2001): Climate Change 2001: Mitigation, Contribution of Working Groups III to the Third Assessment Report of the Intergovernmental Panel on Climate Change. Cambridge University Press, Cambridge.
Jaffe, A., R. Newell, and R. Stavins (2003): Technological Change and the Environment. In: Mäler, K.G., and J. Vincent (eds.), Handbook of Environmental Economics, Volume 1, Chapter 11, North-Holland/Elsevier Science, Amsterdam, pp. 461-516.
Kuik, O., and R. Gerlagh (2003): Trade liberalization and carbon leakage. The Energy Journal, Vol. 24, 97-120.

Report 500036 002 (ECN-C--05-014) 29
APPENDIX A: SPILLOVERS OWING TO CARBON LEAKAGE
O.J. Kuik
Institute for Environmental Studies Vrije Universiteit Amsterdam

30 Report 500036 002 (ECN-C--05-014)
Report 500036 002 (ECN-C--05-014) 31
A.0 Summary for policymakers The term carbon leakage is used for the effect that a part of the CO2 reduction that is achieved by countries that abate CO2 emissions is offset by an increase in CO2 emissions in non-abating countries. CO2 reduction policies may increase the costs of producing CO2-intensive goods and services, increase their price and reduce the rewards for factors and commodities intensive in their production. While these cost increases might stimulate innovation and technological change (Sijm, 2004b), they might also lead to changes in international patterns of trade and in-vestment and might thus change the international pattern of CO2 emissions: reducing them in abating countries and increasing them in non-abating countries. The size of carbon leakage because of the implementation of the Kyoto Protocol is still uncer-tain: it is estimated that between 5 and 20 percent of CO2 mitigation in Annex I countries will be offset by increases in emissions by non-Annex I countries. Some observers expect a lower rate of leakage because they expect that governments of Annex I countries will take active measures to prevent industrial relocation. A higher rate of leakage may, however, be caused by the non-participation of major Annex I countries such as the U.S. and Australia and non-binding targets for Eastern Europe and the former Soviet Union. In the literature, a number of distinct mechanisms or 'channels' of carbon leakage have been identified. The most important channels can be grouped under the following four headings: i) international trade in energy goods, ii) international trade in other goods and services, iii) inter-national trade in factors of production, and iv) international interaction among government poli-cies. There seems to be some consensus among researchers that while changes in the interna-tional markets of energy goods is the dominant source of carbon leakage in the short to medium term, the relocation of international investment and industrial relocation may well become the dominant source of carbon leakage in the more distant future. Carbon leakage reduces the global cost-effectiveness of domestic and EU CO2 mitigation meas-ures. The first-best policy to counteract leakage is increasing country participation in interna-tional greenhouse gas mitigation agreements. The second-best policy is applying trade measures to the import and export of CO2-intensive manufactures in the international trade with non-participants to the above agreements. The third-best policy is to design and implementation of domestic or European emission reduction schemes that combine an effective ‘abatement effect’ with a weak ‘output-substitution’ effect for ‘exposed’ sectors. International emissions trading is a valuable option in this respect. An alternative option would be to accept a certain ‘unavoidable’ rate of leakage in the short to medium term (which is believed to be primarily caused by relative changes in the prices of en-ergy goods) and concentrate on action to avoid leakage through industrial relocation in the long run. In the long run, sustainable innovation in the energy system, competitiveness and leakage reduction should go hand in hand.
32 Report 500036 002 (ECN-C--05-014)
A.1 Introduction The term carbon leakage is used for the effect that a part of the CO2 reduction that is achieved by countries that abate CO2 emissions is offset by an increase in CO2 emissions in non-abating countries. CO2 reduction policies may increase the costs of producing CO2-intensive goods and services, increase their price and reduce the rewards for factors and commodities intensive in their production. While these cost increases might stimulate innovation and technological change, they might also lead to changes in international patterns of trade and investment and might thus change the international pattern of CO2 emissions: reducing them in abating coun-tries and increasing them in non-abating countries. Model predictions of the rates of carbon leakage due to the implementation of the Kyoto Protocol range from very small to very large. This report presents a structured assessment of the academic literature on carbon leakage and formulates its potential implications for policy. The structure of the report is as follows. Section 0 introduces the concept of carbon leakage and explains why carbon leakage can be character-ized as an international ‘distortion’. Section 0 identifies different ‘channels’ of carbon leakage and discusses the main findings in the literature on each of these channels. Section 0 presents a brief overview of the modelling approaches towards the estimation of the size of carbon leakage in specific policy scenarios. Section 0 also presents some estimates of the size of carbon leakage and discusses their validity and limitations Section 0 presents some ideas on the policy implica-tion of carbon leakage in international climate change policies, while Section 0 offers overall conclusions.

Report 500036 002 (ECN-C--05-014) 33
A.2 The concept of carbon leakage Carbon leakage is defined as the increase in CO2 emissions in non-abating countries as the re-sult of CO2 emission reduction policies in countries that abate CO2 emissions. Figure A.1 gives a schematic representation of international climate change policies in the context of an open world economy. The representation is extremely simplified, abstracting from (important) things such as time, the extremely complicated physical relationships between emissions and climate change, the so-called flexibility mechanisms of climate change policy, and other policies. Moreover, the world of Figure A.1 consists of only two countries, but these two countries can be taken to represent two groups of countries. The aim of this schematic representation is to highlight the most important relationships between the economy and the climate system that are the subject of this study. Arrows depict these relationships. At the bottom of Figure A.1 international climate change policies are formulated, motivated by scientific evidence on changes in the earth’s climate and man’s contributions to these changes. The negotiations among nations at the international level lead to an agreement on emissions re-duction targets for individual nations. These individual country targets differ. Figure A.1 distin-guishes between two countries (or groups of countries): Country A agrees to a binding reduction target, while country NA does not. The internationally agreed reduction targets are adopted by domestic policy-makers who design and implement domestic policies to meet the internationally agreed targets. These policies seek to achieve their goal by affecting production and consumption decisions, directly – through command-and-control instruments – or indirectly – through market-based instruments. The do-mestic policies will in general lead to changes in the pattern of international trade. For example, as policy measures in Country A – such as a carbon tax – increase the production costs of its in-dustries that produce CO2-intensive goods, consumers in Country A may shift from the more expensive domestic supplies of CO2-intensive goods to imports of these goods from country NA that has not implemented such cost-increasing policies. The international climate change policy would then indirectly – through changes in national policies and their effects on production and consumption – affect the pattern of international trade. If a producer of CO2-intensive goods in Country A decides to move his factory to country NA in order to avoid the cost-increasing policy measures in Country A, then there would also be an effect on international capital and investment flows. Either through changes in trade or in-vestment, country NA would now produce a larger share of the world production of CO2-intensive goods. Hence, all else being equal, the national emissions of country NA would rise. Given then the CO2 reduction policy in Country A and the policy-induced rise in CO2 emissions in country NA, the rate of carbon leakage is the ratio of the policy-induced increase of emissions from country NA over the reduction of emissions by Country A. That is, if Country A imple-ments measures to reduce emissions by 10 Mt of CO2 and if the emissions of country NA in-crease by 2 Mt of CO2 as a result of A’s measures, the rate of carbon leakage is: Increase in emissions of country NA 2 *100% 20%Reduction in emissions of country A 10
= = .
Carbon leakage is an example of an international pollution externality whose theoretical impli-cations have been studied in the literature (see, e.g., Markusen, 1975; Hoel, 1996). Markusen analysed how the existence of an international pollution externality (such as CO2 emissions) would affect the optimality of free trade. He used an analytical two-commodity, two country general equilibrium model.

34 Report 500036 002 (ECN-C--05-014)
Global emissions
Economy
National climate change policy
Economy
WTO trade rules
International climate change policies
Trade and investment
National emissions National emissions
Country A Country NA
Climate
Figure A.1 A schematic representation of international climate change policies in the context of
the world economy Take the two countries of Figure A.1 as an example. Country A abates CO2 emissions, while country NA does not. Each country produces two commodities, say, food and manufactures. It is assumed that the international pollution externality is a fixed by-product of one of these com-modities, say, of manufactures. Country A wants to abate the international externality because it is an argument in its social welfare function, that is, the citizens of Country A have a positive preference for a stable climate. The pollution externality is an additive function of the pollution of both countries. It is assumed that country NA has no pollution tax or that it does not optimally adjust its tax rate in response to actions of Country A. In this two-country, two-commodity model, the world price ratio between food and manufactures depends on the foreign offer schedules of the two countries. The simple mechanism is that the more of a commodity that is offered on the world market, the lower will be its price in relation to the other commodity, and vice versa. It is assumed, for simplicity, that the domestic price ratio in country NA is identical to the world price ratio. Suppose that Country A is a net exporter of manufactures. The optimal tariff argument says that Country A could improve its terms of trade by taxing its exports of manufactures. The export tax will make it less attractive for Country A manufacturing firms to export and they will offer fewer exports to the world market. In this two-country model total world market supply will fall. The reduced world market supply of manufactures will increase the world market price of manufactures in terms of food. Hence, Country A could buy more food from country NA for less manufactures: its terms of trade would increase. In the case that Country A is a net importer of manufactures, it should, for analogues reasons, tax the imports of manufactures (apply a tariff). Given knowledge on all relevant supply and demand elasticities it is possible to calculate an ‘optimal’ tariff for Country A that maximizes its income in terms of manufactures and food.12 12 In this example, the ‘optimal’ tariff of Country A reduces the terms of trade of country B: country B can buy less
manufactures in terms of food. The possibility of retaliation by country B reduces the practical attractiveness of the optimal tariff argument for Country A.
Report 500036 002 (ECN-C--05-014) 35
If the production of manufactures produces an international pollution externality as a by-product, the optimal tariff should not only take account of the terms of trade effect, but also of its effect on foreign pollution. In the case that Country A is a net exporter of manufactures, the optimal tariff argument advocates an export tax that will increase the world market price ratio of manufactures. This increase in price ratio, however, will also affect the production equilibrium in country NA, where resources will be shifted from agriculture to the now more profitable manufactures sector. This shift causes additional pollution, which will negatively affect con-sumers in Country A through its effect on the social welfare function. In the case that Country A is a net importer of manufactures, the ‘optimal’ tariff has an opposite effect on the world market price ratio, hence decreasing foreign pollution. Markusen (1975) showed that the optimal tax structure for Country A in the case of an interna-tional externality (e.g., transboundary pollution) consists of a production (or pollution)13 tax on manufactures and a tariff. The optimal production (or pollution) tax is a conventional Pigovian tax14 whose rate is equal to the domestic marginal damage of the pollution. The tariff is made up of two terms: an optimal tariff term – to take advantage of a country’s market power – and a foreign pollution term. The foreign pollution term takes account of the domestic environmental damage due to foreign emissions. In the case that Country A is a net exporter of manufactures, the foreign pollution term is negative. This is because the optimal tariff would increase the world market price of manufactures and would therefore stimulate its foreign production and pollution. Because of its transboundary nature, a part of this induced foreign pollution would cause damage in Country A. Country A must therefore make a trade-off between improved terms of trade and increased environmental damage. Markusen (1975) showed that it would be optimal for Country A to reduce its optimal tariff below the rate that would be optimal without the international externality. In the case that Country A is a net importer of manufactures, its ‘optimal’ tariff (import tax) on manufactures should be increased. Moreover, Markusen also showed that in case the government cannot make use of the tariff in-strument (because its use is for example restricted by international agreement within the General Agreement on Tariffs and Trade (GATT)15), the optimal production (or pollution) tax would, in the case of an international externality, in general differ from the conventional Pigovian tax. Hoel (1996) developed this argument further and directly applied it to the climate change policy problem. The major extension of Hoel’s model is that he introduced a carbon tax that can be levied on fossil fuels both as a consumption good and as an input to production. Furthermore, he extended the number of commodities that are produced in both countries. Although Hoel him-self did not use the term, the foreign pollution effect in Hoel’s model can be called carbon leak-age. The first-best domestic policy for Country A in Hoel’s model is similar to that of Mar-kusen’s: an equal carbon tax for all domestic users of fossil fuels and an ‘optimal tariff’ that takes account of its impact on international carbon leakage. Hoel (1996) noted that carbon leak-age might be large, even if the influence of Country A on world prices is small (a large elasticity of foreign demand). This is because even a small increase in a large volume of foreign emis-sions may generate a large increase in foreign emissions relative to the volume of emissions re-duction of Country A. The analyses of Markusen and Hoel make clear that carbon leakage is an international distor-tion. The distortion is caused by a lack of global cooperation on climate change policies. Be-cause of this distortion, the optimality of free trade is compromised. In principle, Markusen’s optimal tariff could rectify this allocative distortion, but in practice there seems to be little scope for such tariffs because of legal, political and computational/informational reasons. The second-
13 In this case, where pollution is assumed to be a fixed by-product of production, there is no difference between a
pollution tax and a production tax. 14 A Pigovian tax is named after the economist A.C. Pigou (1877-1959) who, in 1912, first suggested that govern-
ments could, through a mixture of taxes and subsidies, correct market failures caused by external effects or ‘inter-nalise the externalities’.
15 The GATT is one of the trade agreements administered by the World Trade Organization (WTO).

36 Report 500036 002 (ECN-C--05-014)
best alternative of differentiating carbon taxes across sectors to take account of carbon leakage may be even more difficult in practice, as Hoel pointed out in a thoughtful discussion of his ana-lytical results (Hoel, 1996). One computational/informational issue is the actual size of carbon leakage. Carbon leakage has been defined as the increase in CO2 emissions in non-abating countries as a result of CO2 reduc-tion policies in abating countries. The causality makes direct measurement extremely difficult. While it is not particularly difficult to measure the increase in CO2 emissions in any one coun-try, it is extremely difficult to decompose this increase into increases that are i) the result of CO2 abatement policies in foreign countries and increases that are ii) the result of all other driving forces, including autonomous shifts in the international allocation of CO2-intensive industries. While measuring is and will probably remain problematic, some insights into the potential of carbon leakage can be gained by better understanding the mechanisms through which it can oc-cur. The next section discusses these mechanisms.
Report 500036 002 (ECN-C--05-014) 37
A.3 The ‘channels’ of carbon leakage In the literature, a number of distinct mechanisms or ‘channels’ of carbon leakage have been identified. The most important channels can be grouped under the following four headings: 1. International trade in energy goods 2. International trade in other goods and services; 3. International trade in factors of production; 4. International interaction among government policies. Below, the specific mechanisms underlying each channel are explained and selected research findings on carbon leakage are presented for each channel.
A.3.1 International trade in energy goods CO2 reduction policies in a large region may well have a significant negative effect on the world demand for carbon-rich fossil fuels, causing a possible fall in their world market prices. Falling prices could increase the demand for carbon-rich fuels in the rest of the world, thus increasing foreign CO2 emissions and enlarging carbon leakage. OECD (1999) referred to this mechanism of carbon leakage as the ‘energy channel’. Of key relevance to the quantitative importance of the energy channel are assumptions on the effects of CO2 reduction policies on the demand for specific fuels, changes in world market prices, the supply response of fossil fuel producers, and the demand response of energy users in non-constrained countries. These assumptions are sum-marized in the parameters that reflect the: • Trade elasticities of fossil fuels; • Supply elasticities of fossil fuels; and • Substitution elasticities in production among different fuels and between fuels and other fac-
tors of production; Trade elasticities reflect the level of integration of the world market for a specific product. With large trade elasticities, market changes in one country or region give rise to relatively large ef-fects on world trade and therefore to relatively large market changes in other regions. Hence, all else being equal, large trade elasticities for fossil fuels generate a large rate of leakage. The relevance of the supply elasticity of fossil fuels, and thus, indirectly, the supply elasticity of carbon becomes clear if one realizes that, ultimately, the volume of energy-related carbon that is emitted to the atmosphere is exactly equal to the volume of carbon contained in fossil fuels that is mined or extracted from the earth and supplied to the market and combusted. Assuming elas-tic demand, if the supply of fossil fuels (and thus carbon) would be completely inelastic, there is no quantity response to a price change, and any amount of CO2 emission reduction in some re-gion must be matched by an equal amount of additional emissions in another region. Hence, the more inelastic the supply elasticity, the higher the rate of carbon leakage and vice versa (OECD, 1999). The sensitivity of carbon leakage to supply elasticities of fossil fuels, and especially to the supply elasticity of coal, is generally acknowledged in the literature (Light, Kolstad, & Rutherford, 1999). Coal has the highest carbon content of fossil fuels, and changes in the international trade in coal may therefore have a relatively large effect on carbon leakage. It is sometimes argued that na-tional coal markets are not very well integrated into a world coal market. Reasons for this in-clude its relatively high transportation costs and the cost and time that are needed for building-up infrastructure for storage and distribution. If national markets are not well integrated, a lower price of coal in, for example, the U.S. or Australia would not directly lead to lower prices of coal in, for example, China or India and would therefore not directly lead to additional demand for coal (and associated emissions) in these non-Annex I countries. In such a case, ‘coal leak-

38 Report 500036 002 (ECN-C--05-014)
age’ may be minimal, even if its elasticity of supply would be very small. If the demand for coal in abating countries would fall, a small elasticity of supply would mean that its price would have to fall sharply in order to restore the equilibrium between demand and supply. Without a proper world market and hence low trade elasticities, the price fall could be restricted to the na-tional market.16 The elasticity of substitution between inputs in the production of goods and services can also play a role in the explanation of carbon leakage. There are two elasticities that are potentially important: • The elasticity of substitution among fuels with a different carbon content: the inter-fuel elas-
ticity; • The elasticity of substitution between energy and other factors of production (capital, la-
bour): the inter-factor elasticity. Burniaux and Oliveira Martins (2000) found a U-shaped relationship between inter-fuel substi-tution elasticity and the rate of leakage. At relatively low inter-fuel substitution elasticities, the demand for all carbon-based fuels in abating countries will decrease almost proportionally. Given the supply elasticities in their economic model17 (high for coal, lower for oil), the world market price of oil will fall more than the price of coal, and producers in non-abating countries will shift their fuel mix towards the cheaper oil to the extent that is determined by their inter-fuel substitution possibilities. The net result is that at relatively low values of the inter-fuel sub-stitution elasticity, an increase of that elasticity leads to a reduction of leakage. At relatively high inter-fuel substitution elasticities, the demand for fossil fuels in abating countries will de-crease in proportion to the carbon-content of fuels. That is, the demand for coal will fall more than that for oil and gas. The demand for oil and gas may even increase. Given the relative low elasticity of supply of oil and gas, their prices might rise relative to the price of coal. The price effect is then the reverse of that in the previous case, and demand for coal will increase in the non-abating countries, inducing an increase in carbon leakage. At these higher values of inter-fuel substitution elasticity, an increase in that elasticity leads to an increase in leakage. Similar results are found for the inter-factor elasticity of substitution (Burniaux & Oliveira Martins, 2000). It is sometimes assumed that energy producers (such as those participating in OPEC) have enough market power to maintain energy prices by restricting output in the face of falling de-mand. In such a case, the elasticity of supply might be so large as to prevent any price effects. Babiker and Jacoby (1999) have examined this assumption, but found that OPEC coordination action is not very likely because 'the [high] elasticities of demand of importing countries, and of supply of non-OPEC exporters, combine to produce a market condition where efforts to resist a fall in oil price resulting from Kyoto restrictions lead to still lower OPEC revenue.' (Babiker & Jacoby, 1999: 15). In other words, Babiker and Jacoby argued that under these market condi-tions OPEC would in fact be worse off if it tried to maintain oil prices by reducing supply.
A.3.2 International trade in other goods and services Carbon reduction policies may increase the production costs of carbon-intensive industries in abating countries and may therefore increase the selling prices of their goods. The demand for these goods may shift to relatively cheaper sources in non-abating countries whose costs have not been affected by carbon reduction policies. Hence, comparative advantage would shift to
16 This would lead to an increased national uptake of coal, but this would not lead to higher national emissions be-
cause these emissions are assumed to be ‘capped’ by the Kyoto Protocol. This could lead to substitution between coal and other fuels and subsequent effects on the world markets of these other fuels. These and related interactions between markets are major reasons for the frequent use of applied general equilibrium models to study carbon leakage.
17 The GREEN model, see Annex.
Report 500036 002 (ECN-C--05-014) 39
industries in non-abating countries and this would affect production and trade. All else being equal, this would increase CO2 emissions in these non-abating countries. Two parameters are of key importance with respect to carbon leakage through this ‘trade channel’. They are: • The substitution elasticity between domestic and imported goods; and • The degree of international capital mobility; The elasticity of substitution between domestic and imported goods (and between imported goods of different origin) in applied general equilibrium (AGE) models is typically finite. This is a modeller’s convention, following the approach suggested by Armington (1969) to treat goods of different origin as different, non-homogeneous goods.18 The elasticity of substitution is therefore also called the Armington elasticity. Burniaux and Oliveira Martins (2000) found that carbon leakage is not very sensitive to the value of the Armington elasticities. This finding is, however, contested by others and may be model-specific. For example, Böhringer and Ruther-ford (2000) and Paltsev (2001) found that the values of the Armington elasticities have a sig-nificant impact on the rate of leakage: the larger the trade elasticities (the more homogeneous the goods), the larger the rate of leakage. While the above studies, with the exception of Babiker and Jacoby (1999), examined carbon leakage in perfectly competitive markets, different mechanisms are responsible for carbon leak-age in imperfectly competitive markets. Examples of such imperfectly competitive markets are oligopolistic markets and monopolistic competition. In an oligopolistic market, a small number of firms compete directly with each other. In making price and quantity decisions a firm in such a market must take account, not only of responses of consumers, but also of the responses of their competitors, whose responses depend, in their turn, on their expectations of the firm’s behaviour (Krugman & Obstfeld, 2000: Chapter 6). If a firm in an oligopolistic international market reduces its supply because of the cost-increasing effects of CO2 reduction policies in one country, competitors in other countries may have a direct stra-tegic incentive to expand their supplies (and emissions). An overview of carbon leakage through oligopolistic interaction among firms is given by Ulph (1997). An important result of the oli-gopolistic interaction research is that the type of policy instrument matters in these circum-stances, i.e., the incentive for strategic environmental policy is larger when emission taxes are used than when emission standards (fixed emissions ceilings) are used. This is the case because the purpose of the strategic intervention is to let the output of a domestic industry expand at the expense of foreign competitors. In the case of a fixed emission tax per unit of pollution, the en-vironmental costs of a firm rise proportionally with output. In the case of an emission standard, environmental costs may rise more-than-proportionally with output if the marginal abatement cost curve is sloping upwards (each additional unit of abatement is more expensive than the previous unit). Gürtzen and Rauscher (2000) examined the effects of climate change policies in the case of mo-nopolistic competition. In a monopolistic market structure, firms produce a continuum of differ-entiated goods, each firm produces a specific variety (say, a 'Volvo' car). Consumers prefer va-riety over uniformity. In the case of a CO2 reduction policy, the production costs of firms in-crease and the number of domestic firms that can operate profitably decreases.19 This would lead to a decrease of variety in the domestic market. Because a decrease of variety reduces the substitution possibilities between any two varieties, the mark-ups that (foreign) producers can
18 The Armington specification of international trade has the advantage that intra-industry trade can be accounted for
and that unrealistically strong specialization effects due to changes in trade policy are avoided. In AGE models on CO2 reduction policies, only crude oil is often assumed to be a perfectly homogeneous good.
19 Gürtzen and Rauscher (2000) also discussed conditions under which the number of firms increases due to a tight-ening of environmental policy. Although this may indeed be a consequence of their model, this possibility seems to be extremely ‘counter-intuitive’ and of little relevance. An increase in the number of monopolistic firms in the abating country may lead to negative leakage.

40 Report 500036 002 (ECN-C--05-014)
charge in excess of marginal costs increases20 and therefore the number of foreign firms (and foreign emissions) increases. Hence, this market structure effect may be an additional channel of carbon leakage. Carbon leakage through the trade channel can also be influenced by the degree of international capital mobility. As is well known from the international trade literature, trade in goods and trade in factors of production (e.g., capital) can be substitutes or complements. If trade in goods and trade in factors are substitutes, an increase in one will reduce the other. For example, start-ing from a situation with free trade in goods, but restrictions on the free international movement of capital, the liberalization of the international capital market would reduce the international trade in goods. A car company may, for example, start a foreign subsidiary to produce for a for-eign market instead of shipping the cars abroad from its home production plant. If trade in goods and trade in factors of production are complements, an increase in one will increase the other. For example, the car company may invest in a dealer network in the foreign country (a capital transfer) to increase the sale of its home-made cars (Markusen, Melvin, Kaempfer et al., 1995: Chapter 21; Rauscher, 1997: Chapter 3). Thus, international capital mobility can reduce or increase international trade in goods and services and hence carbon leakage through this channel. The channel of international trade in factors of production is also interesting in its own right. The next paragraph considers international trade in factors of production in more detail.
A.3.3 International trade in factors of production Carbon reduction policies can reduce the productivity of factors that are employed in the pro-duction of fossil fuels or energy-intensive commodities. This may lead to an international real-location of such factors to countries without such policies. In the political arena, the effect of climate and energy policies on international capital reallocation is the 'channel' that is most dis-cussed and feared.21 Although the effect of international capital mobility on carbon leakage would seem to be fairly obvious, its potential importance in current climate change policies is an issue of some controversy in the academic literature. Conventional economic analysis of trade and environment interactions has been challenged on the grounds that it did not take (enough) account of international capital mobility, a phenome-non that is supposedly rapidly growing in importance and is closely linked to the issue of glob-alisation. In a critical assessment of conventional analysis, Daly (1993) asserted that the conclu-sions of this conventional analysis hinged on the critical assumption of the immobility of factors of production (especially capital). He basically asserted that the theorem of comparative advan-tage would be dependent upon the assumption of the immobility of factors, while mobility of factors would imply that the international allocation of production would be governed by abso-lute advantage (Daly, 1993). The idea that the assumption of international immobility of capital is critical to the theory of international trade and therefore also to its extensions to environ-mental externalities, is still echoed in more recent academic literature (see, e.g., Batra, Beladi, & Frasca, 1998).
20 The mark-up that a monopolistic firm can charge is inversely related to the absolute value of the demand elasticity
of its produced variety. 21 For example, in the early 1990s the Dutch Wolfson Commission predicted a large-scale reallocation of energy-
intensive industries (or parts thereof) if energy taxes of the size that were under discussion then would be imple-mented (Herzberg & Minne, 1992). To put the findings of the Wolfson Commission in perspective, two remarks can be made. First, the Commission examined the effect of energy taxes (not CO2 taxes) so that substitution possi-bilities in production within firms would be limited (and were in fact neglected), and second, the size of the energy taxes examined (up to 100 percent of then current energy prices) was orders-of-magnitude larger than the implied increases in energy prices because of CO2 emissions restrictions that are currently under discussion.

Report 500036 002 (ECN-C--05-014) 41
The theory of international trade has, however, dealt with the international mobility of factors. Already in 1957, Mundell (1957) showed that trade in goods and trade in factors were perfect substitutes in the classical Heckscher-Ohlin (comparative advantage) model of international trade. Mundell showed that in this model, equalization of commodity prices and factor prices could be brought about by trade in goods without capital mobility or by capital mobility without trade in goods. If both trade in goods and trade in factors lead to the same prices and allocation of resources, there can also be no differences in environmental outcomes between the two. Hence, it is justified in this kind of model to only consider trade in goods alone, or only trade in factors, or, indeed, any combination of both. When, however, some assumptions of the standard Heckscher-Ohlin model of international trade are relaxed, e.g., perfect competition, common level of technology across countries, con-stant-returns-to-scale technologies, and the absence of domestic distortions, the equivalence be-tween trade in goods and trade in factors may break down. In some cases, trade in goods and trade in factors of production may even become complementary (Markusen et al., 1995). Springer (2000) discussed the exact conditions under which trade in goods and trade in factors can be complements rather than substitutes. In the case of complementarity, the internationally allocative effects of climate change policies may be magnified by international capital mobility. Neglecting this magnifying effect could lead to a biased (under-) estimate of international car-bon leakage. The location choice of firms is the subject of an extensive body of research that is known as ‘new economic geography’ (see for instance Fujita et al., 1999). Although this literature is not directly related to environmental issues, its overall conclusions are relevant (see also Elbers and Withagen, 2004) or transferable to the environmental literature. Baldwin and Krugman (2000) for instance analysed the effect of corporate taxation in the presence of agglomeration forces in falling trade costs. With agglomeration forces, the location choice of a firm is not irrelevant. These authors showed for instance that 'integration need not lead to falling tax rates, and might well be consistent with the maintenance of large welfare states'. If one is willing to equate cor-porate taxation with environmental taxation (or carbon policies), the presence of agglomeration forces might be one element that would limit the leakage problem. Other literature that could be mentioned here includes Albrecht (1998), Jeppesen and Folmer (2001), and List et al. (2003). In general, imperfect competition and agglomeration effects could reduce or increase relocation effects and carbon leakage due to environmental policies. The potential environmental impact of international capital mobility has been well recognized in the theoretical literature, also within the framework of the (broadly-defined) comparative advan-tage model of international trade. The extent of this potential impact has been the subject of econometric estimation and model simulation. The first question that needs to be answered relates to the international mobility of capital: how mobile is capital internationally? In the popular image capital is extremely mobile across coun-tries, but research has found surprisingly little evidence of international mobility of real capital. Researchers have found limited international portfolio diversification, a high correlation be-tween domestic savings and investments and significant real interest differentials across coun-tries (Gordon & Bovenberg, 1996). Wang and Winters (2001) surveyed an extensive literature on the impacts of locational factors on foreign direct investment (FDI) decisions of multilateral companies. These locational factors include tax concessions and government policies, labour cost differentials and environmental factors. Wang and Winters concluded from this literature i) that the relative level of taxation is just one variable that affects FDI, but is rarely a primary mo-tive, ii) that labour costs differentials (accounting for differences in labour productivity) is also a factor, though not of major significance, and iii) that the studies seem to suggest 'quite strongly' that there is little evidence for industrial flight from countries with strict environmental stan-dards. The authors therefore conjectured that 'it would be very difficult to believe that imposing

42 Report 500036 002 (ECN-C--05-014)
a carbon tax (of around 100 USD/tC) in the OECD will cause serious industrial flight from OECD to non-OECD countries.' (Wang & Winters, 2001 :151). The empirical literature on the effect of environmental regulation on firm relocation is ambigu-ous and highly sensitive to empirical specification, data (cross-sectional or panel data, level of aggregation), and a host of specific assumptions regarding the exact design of the policy meas-ure and other variables (Jeppeson, List, and Folmer, 2002). Jeppeson, List and Folmer con-cluded on the basis of an extensive meta-analysis of the empirical literature that it is as yet im-possible to draw any firm conclusions on the effect of environmental regulations on [interna-tional] capital flows (Jeppeson, List, and Folmer, 2002: 36). Simulation studies with applied general equilibrium models seem to suggest that capital flight from abating to non-abating countries will not be of major significance in the context of the Kyoto Protocol, at least not during the time up to the first commitment period (2008-2012) (McKibbin, Ross, Shackleton et al., 1999; Burniaux et al., 2000; Babiker, 2001; Burniaux, 2001; Paltsev, 2001). One major factor is simply that the ‘absorptive capacity’ of developing countries for foreign capital is considered to be relatively small (McKibbin et al., 1999). An-other factor may be that carbon leakage in non-abating countries would be basically ‘self-financed’ because of the relative fall of fossil fuel prices on the world market (Babiker, 2001). Because of reduced input costs (for fuels) and stable or higher output prices, energy-intensive industries in non-abating countries would see their profits rise and could therefore easily finance the expansion of their production out of these extra profits. In this sense, carbon leakage would not really require any additional capital flows. While there is nearly overall consensus on the limited contribution of capital mobility to carbon leakage in the near term, Burniaux (2001) asserted that the relocation of international invest-ment may well become the dominant source of carbon leakage in the more distant future (after 2010) in the absence of major breakthroughs in renewable energy technologies. In a paper for the International Energy Agency, Gielen and Karbuz (2003) also expected that industrial reloca-tion might be the primary source of leakage in the long term. When CO2 reduction policies would become more stringent, relocation could become a serious threat, especially to specific, CO2-intensive sectors.
A.3.4 International interaction among government policies Up till this point in this overview, the policies of abating and non-abating countries were as-sumed to be given: a country either had a given emissions reduction target or not. However, when this assumption is relaxed and countries may be assumed to choose carbon reduction poli-cies on the basis of some trade-off between costs and benefits, this may also affect carbon leak-age. Copeland and Taylor (2003) examined the response of a country to another country’s CO2 reduction policies, when the citizens of this country would not only be interested in the con-sumption of market goods and services, but would also derive utility from environmental ser-vices, such as those provided by a stable climate. The government of this country is assumed to maximize the utility or welfare of its citizens. Copeland and Taylor (2003) showed that the re-sponse of the country contains two additional terms in addition to the changes in trade and in-vestments that were discussed above:22 The first additional term measures the free rider effect. The free rider effect captures the idea that one’s willingness to contribute to the provision of a public good is negatively affected by the willingness of others to contribute to this good. The optimal level of CO2 reduction for a country is that level that equates the marginal abatement costs of emissions reduction to the
22 In fact, Copeland and Taylor also distinguish a substitution effect in consumption, that would increase the demand
for the environmental good (climate quality) if the relative prices of consumption goods would rise (because of en-vironmental taxes).
Report 500036 002 (ECN-C--05-014) 43
marginal damages of CO2 emissions, which is a function of both domestic and foreign emis-sions. If foreign emissions fall, the marginal damages of CO2 emissions fall, and hence the op-timal level of domestic abatement falls.23 The free rider effect is the only term of the response function that would also exist in autarky (in the absence of international trade). In autarky, do-mestic and foreign emissions are strategic substitutes. That is, the welfare-maximizing strategy of a government is to react on a foreign change in emissions by a change in domestic emissions in the opposite direction. Hence, through the free rider effect, the domestic country would al-ways increase its emissions due to a foreign emissions reduction policy. The second additional term is a pure income effect, which Copeland and Taylor (2003) called the ‘bootstrapping effect’. Whether the bootstrapping effect is positive or negative depends on the trading pattern of the domestic country. If the domestic country is a net exporter of CO2-intensive goods (or a net importer of fossil fuels), its terms-of-trade will improve and its real in-come will rise (its domestic production has increased in value at world market prices: one unit of exports will buy more imports). If environmental quality is a normal good, a rise in income will increases the demand for environmental quality so the government will tighten environ-mental policy and reduce emissions. Conversely, if the domestic country is a net importer of CO2-intensive goods (or a net exporter of fossil fuels), its real income will fall, demand for envi-ronmental quality will fall, and emissions will increase. The effect of the bootstrapping effect on carbon leakage is thus ambiguous. All terms together (trade/investment, free-riding, bootstrapping) determine the ‘optimal’ (i.e., welfare-maximizing) change in domestic emissions in response to a foreign reduction policy. The sign of this ‘optimal’ change is ambiguous. Copeland and Taylor (2003) stressed that car-bon leakage might be negative under the assumption of endogenous policies, when the boot-strapping effect dominates the free rider and the trade/investment effects. How relevant is the assumption of endogenous policies to international climate change policies? Copeland and Taylor argued that while the graduation of developing countries into the abating countries under the Kyoto Protocol (the Annex I countries) 'may seem unlikely at present, it is unwise to rule out such possibilities a priori especially when the policy experiment under con-sideration involves extremely large time horizons and potentially large changes in income.' (Copeland & Taylor, 2003: 17).
A.3.5 Conclusions A number of channels of carbon leakage may be distinguished: • Through changes in the pattern of international trade of energy commodities • Through changes in the pattern of international trade of CO2-intensive goods and services. • Through the international relocation of capital • Through the interactions of government policies. Many studies have analysed one or more of these channels, both from theoretical and empirical perspectives. It is not easy to summarize the main findings of scientific research in this area, as there is ample discussion, controversy and speculation, and there is not much hard empirical evidence to go by. However, a few points can be mentioned. Most applied modellers seem to agree that the ‘energy commodity’ channel is quantitatively the most important channel, at least in the short to medium term. It should be noted, however, that most ‘leakage’ studies do not take much account of possible strategic behaviour of large energy suppliers. If suppliers of fossil fuels could effectively restrict their total supply in response to diminishing demand in an attempt to stabilize market prices, there would be a smaller price ef-fect and hence less leakage. 23 Only, of course, under certain (but fairly standard) assumptions on the signs of the first derivatives of the abate-
ment and damage functions.

44 Report 500036 002 (ECN-C--05-014)
The effect of trade in CO2-intensive goods and services on carbon leakage is generally believed to be limited, but here too is a need for studies that employ alternative assumptions on market structure. A large amount of controversy exists on the effect of international reallocation of capital on car-bon leakage. While some modellers assume that the contribution of capital mobility will be very limited (and mainly restricted to capital flows among the more advanced Annex I countries), others stress the importance of international capital mobility in this respect, especially in the longer term. At least from a theoretical point of view, a ‘negative’ rate of leakage is very well possible, but there is not yet much support for this thesis from more empirical research.

Report 500036 002 (ECN-C--05-014) 45
A.4 The potential size of carbon leakage The potential size of carbon leakage has been estimated by a number of economic models. In this section, a number of these estimates are presented. Differences between the estimates will, if possible, be related to differences in the underlying models, and especially by differences in their relevant parameters. These include the parameters that were discussed in Section 0. This section ends with a discussion on the sources of variance among leakage estimates.
A.4.1 Economic models For an ex-ante estimate of carbon leakage, one has to rely on economic models. As yet, carbon leakage has not been measured econometrically. Economic models are simplifications of eco-nomic reality and their results should be interpreted with caution. There are various types of economic models. Analytical models, such as those of Markusen and Hoel that were discussed in Section 0, may reveal the causes and consequences of carbon leakage, but they cannot esti-mate its size. Numerical models include macro-econometric and applied general equilibrium (AGE) models. Both types of models have their specific strengths and weaknesses. The main difference between these types of models is that AGE models explicitly model the behaviour of each economic agent that is distinguished in the model, while macro-econometric models base their equations on the historically observed (and econometrically estimated) outcomes of this behaviour in markets. While AGE models are more firmly based in micro-economic theory, macro-econometric models are sometimes praised for their greater level of realism. All model estimates of carbon leakage that are presented below are derived by AGE models, although one the models (G-Cubed) can perhaps better be described as a hybrid between an AGE and a macro-econometric model. For this assessment no estimates of carbon leakage were found that were derived by strictly macro-econometric models.
A.4.2 Model estimates Studies on carbon leakage provide no consensus on the size and distribution of the leakages generated by the implementation of the Kyoto Protocol (OECD, 1999). Estimates of the size of leakage vary considerably. Table A.1 reports on a number of estimates of carbon leakage be-tween the original Annex I and non-Annex I countries of the Kyoto Protocol under the assump-tion that there will be no emissions trading among Annex I countries. The rates of leakage range between 5 percent in OECD’s GREEN model to 20 – 21 percent in WorldScan and the model by Light et al. It was suggested in Section 0, that some part of the differences could be explained by examining the model’s assumptions on trade elasticities, especially those of energy goods, and supply elas-ticities of fossil fuels, especially those of coal. Table A.2 presents trade and supply elasticities for a number of the above-mentioned models. Most models make use of the ‘Armington ap-proach’ to model substitution in trade (Armington, 1969). Commonly, a difference is made be-tween the elasticity of substitution of imports from different sources, σM, and the elasticity of substitution between the 'composite' import and the domestic good, σD. The convention in most models is to use an elasticity of substitution of imports from different sources, σM, of twice the value of the elasticity of substitution between the composite import and the domestic good, σD. This has been reported as an 'empirical regularity' (Hertel, 1997) and has not been rejected by recent empirical work (Hertel, Hummels, Ivanic et al., 2003; Liu, Arndt, & Hertel, 2001). The Armington substitution elasticities between domestic and imported goods (σD) is infinity when considering perfectly homogeneous goods. In the GREEN model, oil is treated as such. In GTAP-E, oil is fairly elastic (σD=10).

46 Report 500036 002 (ECN-C--05-014)
Table A.1 Some model estimates of rates of carbon leakage of CO2 reductions in Annex I countries according to Kyoto targets, without emissions trading
Carbon leakage rates in a number of models Model Carbon leakage (%)
Light et al. 1999 21 %
WorldScan 20 %
MERGE 20 %
GTAP-E 15%
GTAP-EG 11.5%
MIT-EPPA 6 %
G-Cubed 6 %
GREEN 5 %
Sources: Burniaux and Oliveira Martins (2000), Paltsev (2001), and Kuik and Gerlagh (2003). The supply elasticities of fossil fuels (ηS) indicate the rate of decreasing returns in the produc-tion of fossil fuels. There is some disagreement among models: while GREEN and MIT-EPPA assume an elastic supply response for coal and a less elastic supply for gas, WorldScan assumes the reverse. It is clear that additional research on (long-term) supply response of fossil fuel sec-tors could prove beneficial. Comparing the elasticities in Table A.2 to the leakage rates in Table A.1 it appears that varia-tions in assumptions on the supply elasticities of coal can explain differences in leakage rates to a certain extent. The models with the lowest rate of leakage (GREEN and MIT-EPPA) have the highest supply elasticities of coal (ηs = 20 and 5.4, respectively). The reverse is not completely true, however. While Light et al. indeed combines a high rate of leakage (21%) with a low elas-ticity of supply of coal (ηs = 0.5), WorldScan combines a high rate of leakage (20%) with a rela-tively high supply elasticity of coal (ηs = 1.8). In was suggested in Section 0 that assumptions on trade elasticities in the models could also ex-plain some of the variation in the leakage results. Many models take the assumption that oil is a homogeneous commodity with either infinite (GREEN) of very high (WorldScan, GTAP-E) trade elasticities. Trade elasticities for other energy goods (coal and gas) range from σD = 1 in G-Cubed to σD= 4 in Light et al., GREEN and GTAP-EG. It thus seems that assumptions on trade elasticities of energy goods do not explain differences in leakage across models very well. The same seems to apply to differences in trade elasticities of other goods. Somewhat apart from the other models are MERGE and G-Cubed. MERGE combines a detailed energy supply sector and an aggregate representation of the rest of the economy. Trade among regions is only possible for oil, gas and a composite ‘energy-intensive basic materials’ good. The energy channel and the non-energy trade channel (energy-intensive basic materials) each account for about half of the leakage in 2010.24 Policy-induced relocation of production in en-ergy-intensive basic materials is determined by the equalization of marginal supply costs across regions, assuming an upward sloping supply curve in each region and assuming no change in demand. G-Cubed is the only model of Table A.1 that explicitly accounts for international bor-rowing and lending of countries in relation to their current account deficits and surpluses. Re-lated to this focus on financial markets is the result that the international relocation of (financial) capital is an important indirect source of leakage in G-Cubed. G-Cubed, however, predicts a low
24 See Manne and Richels (1999), Figure 7.

Report 500036 002 (ECN-C--05-014) 47
rate of leakage to non-Annex I countries because it assumes a low absorptive capacity for capi-tal investments in these countries in the short to medium term. The models of Table A.1 are briefly discussed in the Annex to this chapter. Table A.2. Key elasticities in some AGE models that have been used to estimate carbon leakage σD: Armington substitution be-
tween domestic and importedgoods
σM: Armington substitu-tion among imports
ηS: supply elasticity
Model Oil Other goods Oil Other goods Coal Oil Gas
Light et al. 4 4 8 8 0.5 0.5 0.5
WorldScan 16 2-10 1) 1.8 1.9 9.0
MERGE2)
GTAP-E 10 2.8 20 5.6 0.5 0.5 0.53)
GTAP-EG 4 4 8 8 1.0 1.0 1.0
MIT-EPPA 3 3 4) 4 5 5) 5.4 6) 1.2 7) 1.8
G-Cubed 1 1 1 1 –8) –8) –8)
GREEN ∞ 4 ∞ 5 20.0 1.0 1.0
1) Substitution elasticity of 2 for coal and gas, 5 for services, 6 for consumption goods, and 10 for agricultural com-modities. 2) MERGE has a different structure, see text. 3) For gas extraction, excluding transport and distribution. 4) Except electricity: 0.3 5) Except electricity: 0.5, other energy goods: 4, refined oil: 6. 6) Except for China: 4.4 and India: 3.4. 7) Except for energy exporting developing countries: 0.3 and Former Soviet Union: 0.6. 8) Could not be found in the documentation of the model. What other factors could explain the differences in leakage rate across the models? The Third Assessment Report of IPCC (2001) also reported a range of leakage estimates in the literature of 5–20 percent. It noticed that some reduction in variance among the estimates of different studies has occurred in recent years. IPCC was, however, reluctant to accept this reduction of variance as a sign of increased scientific certainty on this issue. IPCC (2001) flagged the following pa-rameters to be of critical significance to carbon leakage: • Trade elasticities; • Input substitution elasticities in the electricity and iron and steel industries in Annex I re-
gions; • Degree of competitiveness in the world oil market; • International emissions trading. Burniaux and Oliveira Martins (2000) and Burniaux (2001) offered a slightly different list of critical parameters. At the top of their list was the supply elasticity of fossil fuels, especially coal. Light et al. (1999) and Burniaux (2001) also stressed the importance for the size of carbon leakage of assumptions on the integration of the international coal market. Hence, there seems to be little consensus on the size of carbon leakage as well as on the key parameters that might influence it. Apart from differences in key elasticities, Barker and Johnstone (1998) identified additional sources of differences among the models that can lead to different predictions of car-bon leakage: assumptions on exchange rate and monetary policies, international factor mobility, market power in the oil sector, expectations and adjustment, revenue recycling, the level of ag-gregation of regions, sectors and fuels, technological change and strategic behaviour. It is clear that no single study can address all these issues at the same time.
48 Report 500036 002 (ECN-C--05-014)
Grubb et al. (2002) cited the IPCC range of 5–20 percent for the leakage rate, but they com-mented that this rate would probably be lower in reality, because they assumed a relatively high supply elasticity of international coal and oil supply relative to the elasticity of demand and ac-tive government intervention to minimize industrial reallocation (or trade effects for the energy-intensive sectors) (Grubb, Hope, & Fouquet, 2002). Paltsev (2001) carried out a decomposition of carbon leakage to regions and industries. Paltsev’s aim was not to estimate the size of carbon leakage, but to examine which regions and industries would be most sensitive to leakage. Paltsev accepted that the absolute size of carbon leakage is still very uncertain and, with the current tools of analysis, mainly dependent upon model struc-ture and parameterisation. Using the GTAP-EG model, he found a leakage rate of 11.5 per cent as a central estimate for a policy scenario that was based on the full implementation of the Kyoto Protocol (including participation by the US). More important than this central estimate, however, Paltsev found that leakage would be most sensitive to CO2 reduction measures in the chemicals and iron and steel industries. With respect to geographical distribution, actions in the European Union could be responsible for about half of global carbon leakage (36-51%), fol-lowed by the United States (28-34%) and Japan (13-18%). On the receiving side, the largest in-creases in CO2 emissions could be expected in China (24-32% of carbon leakage) and the Mid-dle East (24-30%) (Paltsev, 2001). Kuik and Gerlagh (2003) studied the effects of trade liberalization on carbon leakage. They found that GTAP-E’s central estimate of carbon leakage of 11 percent would increase by 4 per-centage-points to 15 percent if the global tariff reductions of the Uruguay Round of multilateral trade negotiations of the WTO would be taken into account (see also Section 0 below). The estimates of Table A.1 apply to carbon leakage between the original Annex I and non-Annex I countries of the Kyoto Protocol. The estimates do not include potential leakage to An-nex I countries without binding emissions reduction targets (Eastern European countries and FSU), nor to Annex I countries that have subsequently withdrawn from the Protocol, such as the US and Australia. Without effective CO2 mitigation policies in these countries, the overall leak-age rate from, for example, Europe might be higher. In their assessment of the Kyoto protocol, Lejour and Manders (1999), estimated leakage to unconstrained Eastern European countries at 3.3 percent. Bollen et al. (2002) estimated that non-participation of the USA to the Kyoto Proto-col could increase leakage from the participating countries from 14 to 22 percent.
A.4.3 Carbon leakage and trade liberalization Carbon leakage has been identified as an international distortion in Section 0. Several mecha-nisms or 'channels' of carbon leakage have been identified in Section 0. The common character-istic of all these channels is that they operate through international trade in goods or factors. It is obvious that there would be no leakage without international trade. This does not imply that in-ternational trade is the cause of carbon leakage, but it is a necessary condition for leakage. A question that would seem to logically follow from this observation is whether a certain degree of liberalization of trade, as for example through multilateral trade agreements, would increase the rate of carbon leakage. If this would be the case, the conventional gains-from-trade would be compromised and there would perhaps be a reason for negotiators of multilateral or other free trade agreements to take the effect of trade liberalization on carbon leakage into account when formulating their agreements (or at least to coordinate their actions with environmental policy-makers). Before an overview of the literature on this subject is presented, it should be noted that the the-ory of international trade is built on two important ideas from the founding fathers of econom-ics. The first is the idea of comparative advantage, developed by David Ricardo (1821), who ar-

Report 500036 002 (ECN-C--05-014) 49
gued that relative cost differences between countries (and not absolute cost differences) were the cause of profitable international trade.25 The second idea, in fact the older one, is the concept of economies of scale, which can be traced back to Adam Smith (1776), and his proposition that the degree of profitable specialization of labour depends on the size of the market. In modern times, the idea of comparative advantage has been formalized first, resulting in the now classical Heckscher-Ohlin theorem of international trade. For some decades, the theory of international trade has been, in fact, a theory of comparative advantage. The theoretical formalization of the idea of economies of scale as an important cause of trade is from a later date. Although the im-portance of both ideas is now fully recognized in the theory of international trade (see, e.g., Krugman and Obstfeld (2000)), the idea of comparative advantage has led to the most devel-oped and consistent theoretical models of international trade, and underlies most of the applied modelling in this field. The idea of economies of scale has led to a series of important and illu-minating theoretical models, but as yet, not to a unified and coherent model with the same power as the comparative advantage model. Most of the environment-and-trade literature is built on the classical, comparative-advantage model of international trade. The effects of freer trade on the environment have been the subject of a significant body of theoretical and empirical research. It is beyond the scope of this section to give an exhaustive overview of this literature. For excellent overviews the interested reader is referred to Rauscher (1997) and Dean (1992; 2002). In the early 1970s, several authors began to examine the conse-quences of the existence of environmental externalities for standard trade theory, especially with respect to the theorem of comparative advantage and the gains from trade. Markusen (1975)26 and Pethig (1976) were among the first to formalize the problem of environmental externalities in the standard two-sector, two-country general equilibrium model of international trade. A gen-eral conclusion from this literature was that domestic environmental externalities could reduce the conventional gains from trade, but that the first-best solution to deal with this problem was not to restrict trade, but to ‘internalise’ the environmental externalities through appropriate gov-ernment intervention. This work could therefore also be read as a theoretical justification of OECD’s famous ‘Polluter Pays Principle’ of 1972. Theoretical and applied work on the environmental effects of trade liberalization were greatly stimulated by the controversies surrounding the preparations and conclusion of the North American Free Trade Agreement (NAFTA) in the early 1990s. One important study of that time decomposed the impacts of trade liberalization on the environment into three effects: the effects of changes in scale, composition and technique (Grossman & Krueger, 1991). The general am-biguity of theoretical models that dealt with environment-and-trade interactions could be ex-plained by the fact that in many situations the three distinct effects would not all point in the same direction. The scale effect is proportionally related to the overall expansion (or contrac-tion) of an economy after the liberalization of trade. In most cases this effect will be positive, hence pollution will increase. The composition effect is related to the changes in sectoral com-position of an economy after trade liberalization. It may be the case that an economy moves to-wards an increased specialization in polluting sectors, or, alternatively, towards clean sectors. Finally, the technique effect is related to the mix of polluting and clean inputs that is used by the economy. Trade liberalization may affect this mix in two ways. First, trade liberalization may affect the price ratio between polluting and clean inputs, thereby changing the optimal mix for producers and consumers. Second, if trade liberalization increases the incomes of consumers, they may want to spend (some of) their additional income on more protection of the environ-ment in order to enjoy better environmental quality. The government can meet this demand by imposing stricter environmental standards on polluting production processes, thereby indirectly
25 For an excellent, non-technical and very amusing introduction to the idea of comparative advantage, see Krugman
(2001). 26 For a discussion of Markusen’s paper, see Section A.2. Markusen’s paper stands somewhat apart from other early
contributions as it dealt explicitly with international environmental externalities, while the other contributions pri-marily dealt with domestic environmental externalities.

50 Report 500036 002 (ECN-C--05-014)
affecting the ‘technique’ of production.27 Antweiler, et al. (2001) put the ‘scale, composition and technique’ decomposition in a theoretical model framework and provide econometric esti-mates of their magnitudes in the case of sulphur dioxide concentrations in over forty countries. They found that a one percent increase in per capita GDP due to trade liberalization reduces concentrations of sulphur dioxide by one per cent, due to a particularly strong ‘technique’ effect (due to stricter environmental regulations). In the same article, Antweiler, et al. (2001) presented two opposing theoretical views on the en-vironmental effects of trade liberalization. The first view, the Pollution Haven hypothesis, sug-gests that trade liberalization will make countries with less stringent environmental regulations dirtier. Unilateral emission restrictions, as in the Kyoto Protocol, increase the comparative ad-vantage of non-abating countries in ‘dirty goods’ production. Trade liberalization encourages specialization according to comparative advantages and hence encourages the shift of carbon-intensive industries to countries without a carbon dioxide reduction target. In contrast, the second view, the Factor Endowment hypothesis, suggests that when emissions are concentrated in capital-intensive industries, as is the case for carbon dioxide emissions, then trade liberalization would lead to a further concentration of these industries in relatively capital abundant countries, i.e., the Annex-I countries. Non-Annex-I countries would be encouraged to specialize according to their traditional comparative advantages, i.e., in labour and natural re-source-intensive industries that are, on average, not carbon-intensive. To illustrate the Factor Endowment hypothesis, Copeland and Taylor (1994) examined a two-sector, two-country gen-eral equilibrium 'specific factors' model, in which both sectors in each country use pollution as a factor of production, and each sector uses a specific factor for production, capital or labour, re-spectively. Capital and pollution are assumed complementary, that is, the capital-intensive in-dustry is also pollution-intensive. One country, the ‘North’, is assumed to be relatively capital abundant and it has stricter emission controls than the other country, the ‘South’. Copeland and Taylor showed that trade increases production of the capital-intensive good in the North and its exports to the South, whereas the South expands its intensive-intensive production. Freer trade reduces pollution in the South, and in the context of climate change, this model suggests that it would be possible, under certain circumstances, for trade liberalization to reduce carbon leakage to non-Annex-I countries.28 Antweiler, et al. (2001) argued, however, that it cannot be determined on formal grounds whether the Pollution Haven hypothesis or the Factor Endowment hypothesis will hold. It is therefore a subject for empirical analysis. Cole et al. (1998) assessed the global impacts on emissions of the trade policy changes that were agreed upon in the Uruguay Round. First, Cole et al. estimated the impacts of the Uruguay Round on the regional output of various industries and on per capita incomes. In a second stage, Cole et al. estimated the effect on emissions (that is, the composition effect), and then use econometrically estimated relationships between per capita income and emissions to estimate a combined scale and technique effect. They found, for industrialized countries, that the composi-tion effect increases the emissions of four traditional air pollutants (nitrogen dioxide, sulphur dioxide, carbon monoxide, and suspended particulate matter). In contrast, in most developing 27 To avoid confusion, the concept ‘technique’ is different from the concepts of ‘technological development’ or
‘technical change’. The ‘technique’ of production refers to the specific mix of inputs that a firm (or industry, or economy) uses to produce one unit of output. Note that the ‘inputs’ include emissions of environmental pollut-ants. The concepts ‘technological development’ or ‘technical change’ usually refer to an increase in knowledge so that less inputs are required to produce a given amount of output, or equivalently, that more output can be produced with the same inputs. Environmental technical change means that a given amount of output can be pro-duced with less input of emissions of environmental pollutants and a non-increasing amount of other inputs. This study does not address the causes and consequences of technological development or technical change.
28 It has to be pointed out that the ‘pollution’ in Copeland and Taylor’s model is purely domestic, and that endoge-nous environmental policies in both countries set optimal emission levels. In contrast, the climate change prob-lem is truly global in nature, and it is not apparent that Copeland and Taylor’s results carry over.
Report 500036 002 (ECN-C--05-014) 51
countries (except for Latin America), the composition effect reduces these emissions. Trade lib-eralization encourages the expansion of energy-intensive industries in industrialized countries, while developing countries specialize in intensive-intensive manufactures, such as textiles. In other words, regarding the issue of climate change, the study by Cole et al. suggested that the Factor Endowment hypothesis might dominate the Pollution Haven hypothesis. That is, freer trade might reduce the rate of carbon leakage. Babiker et al. (1997) assessed, before the conclusion of the Kyoto Protocol, the mutual effects that trade policies and CO2 reduction policies can have on each other. They used a static 26-region, 13-sector computable general equilibrium model of the global economy that was origi-nally constructed for the analysis of the economic impacts of changes in trade policies (the Uru-guay Round), but that was extended with a representation of energy markets and carbon flows. They found that global trade liberalization as agreed in the Uruguay Round, in isolation (with-out carbon reduction policies), would increase global CO2 emissions. In combination with uni-lateral CO2 emissions reduction of Annex-I countries, however, trade liberalization would re-duce global emissions and carbon leakage. Unfortunately, the authors did not explain this result in great detail and the mechanisms underlying their result remain unclear. Kuik and Gerlagh (2003) assessed the rates of carbon leakage under the Kyoto Protocol with and without freer trade by means of import tariff reductions agreed to in the Uruguay Round of multilateral trade negotiations. They found that the implementation of these import tariff reduc-tions increases the overall rate of leakage, suggesting that previous studies may structurally have underestimated the rate of carbon leakage under the Kyoto Protocol. They also found, however, that the costs of abating the trade-induced leakage are modest relative to the welfare gains of freer trade. Analysis of the trade-induced carbon leakage showed large differences between leakage caused by reductions of import tariffs on energy goods (high leakage) and by reductions of import tariffs on non-energy goods (low leakage). It also showed large differences in emis-sion responses among developing country regions, with the largest responses by (and therefore the largest leakage to) Brazil and the Middle East and the smallest responses by (and the small-est leakage to) net energy exporting developing countries and the dynamic Asian economies (excluding China) (Kuik & Gerlagh, 2003).
52 Report 500036 002 (ECN-C--05-014)
A.5 Policy implications of carbon leakage Carbon leakage decreases the net effect of domestic CO2 emissions reduction on the concentra-tion of greenhouse gases in the atmosphere. It therefore reduces the effectiveness and also the cost-effectiveness of CO2 reduction policies. If, for example, the Netherlands would, because of the Kyoto Protocol, restrict its CO2 emissions in 2010 by 13 million tons in comparison to busi-ness as usual, a leakage rate of 20 percent would limit the Netherlands’ net contribution to global emissions reductions to (13 - 0.2 * 13) = 10.4 million tons. Alternatively, if abatement costs in the Netherlands would be € 20 per ton of CO2 reduced domestically, it would be 13/10.4 * 20 = € 25 per ton of CO2 reduced globally. Whether a leakage rate of 5, 10, 20 or 40 percent or more is acceptable or not is a political judgment. At any leakage rate below 100 percent, Dutch CO2 reduction policies contribute to global CO2 reductions, but the higher the rate of leakage, the lower the net effect on global emissions and the higher the cost per ton of net, global, CO2 reduction. The first-best policy to reduce carbon leakage is to increase the size of the group of abating countries. To reduce global carbon leakage, it is not important that additional countries to any international agreement are forced to substantial reductions; it is enough if they agree to any binding target (which might be a zero reduction target with respect to their baseline emissions, i.e., an allowed increase of emissions from, say, 1990 levels). Therefore, it would generally im-prove the effectiveness of the successor of the Kyoto Protocol, if currently non-participating Annex I countries (USA, Australia) and (at least) the larger developing countries (China, India and Brazil) would effectively participate with binding (although not necessarily very restrictive) reduction targets. Without such broader participation (or in anticipation of such broader participation), it might be worth considering whether domestic or regional (EU) reduction policies could be designed in a manner to reduce carbon leakage. The second-best policy would be to implement import and export taxes for the international trade of CO2-intensive products with non-abating countries. It is commonly believed that such a form of trade discrimination would not be allowed under the rules and disciplines of the WTO, but there are precedents by the way of Multilateral Environ-mental Agreements with (discriminating) trade provisions that have not (yet) been challenged before the WTO. Nevertheless, it appears that the participating countries to the Kyoto Protocol do not actively investigate this second-best policy.29 If this trade policy would not be feasible, a third-best policy would be to differentiate domestic CO2 reduction policies among sectors. On the basis of their CO2 intensity and sensitivity to in-ternational trade, economic sectors can be classified into ‘exposed’ and ‘sheltered’ (Berkhout, Felso, Ferrer-Carbonell et al., 2001). In general, ‘sheltered’ sectors may be less vulnerable to leakage than ‘exposed’ sectors (Paltsev, 2001), although differences among sectors and even among firms within these broad classes may be significant. Any policy that would simply shift a part of the CO2 reduction burden from the ‘exposed’ to the ‘sheltered’ sectors could reduce leakage, but would probably increase aggregate national abatement costs. This increase in costs could be justified from a global cost-effectiveness per-spective if the relative increase in costs would be less (in absolute terms) than the resulting re-duction in leakage rate.
29 Perhaps it is worth mentioning, as one of the reviewers of an earlier version of this report suggested, that the WTO
makes a specific and clear claim that the organization does not deal with environmental protection. The WTO’s role is to liberalise trade. Its only dealing with environmental policies is to ensure that these policies do not act as obstacles to trade, and that trade rules do not stand in the way of adequate domestic environmental protection. (http://www.wto.org/english/tratop_e/envir_e/envir_backgrnd_e/c1s3_e.htm).

Report 500036 002 (ECN-C--05-014) 53
Most European governments do have special arrangements in their environmental policies for energy-intensive manufacturing industries (Ekins & Speck, 1999). In the Netherlands, these in-dustries are subject to voluntary agreements on energy efficiency and CO2 emissions, the so-called Benchmarking Covenants. It is generally believed that the targets in these voluntary agreements are not very strict (Kuik & Mulder, 2004; Sijm, 2004a), so that the net costs of CO2 reduction measures in the energy-intensive manufacturing industries will be small – or even negative (Sijm, 2004a). While such special arrangements could reduce leakage, they also might leave some cost-effective mitigation options in the energy-intensive manufacturing industries untapped, thereby potentially increasing total mitigation costs for the economy. Moreover, lax standards for the energy-intensive manufacturing sectors will not stimulate technological inno-vation and diffusion of CO2-efficient production techniques. On the issue of lax environmental standards, Petrakis and Xepapadeas (2003) argued that envi-ronmental policy faced a time inconsistency problem: as long as a firm has not invested in a country, a government has an incentive to keep emission taxes low. However, if the investment has been completed, governments maximizing welfare could have an incentive to increase taxes. In terms of carbon leakage, this would imply that firms, who are aware of this time inconsis-tency, would rather invest in a non-abating country. One way out of this problem would be to use instruments that pre-commit a government to some level of environmental taxation. Pre-commitment could be an option to limit carbon leakage through international capital mobility. The objective of the EU Emissions Trading Scheme (ETS) is to reduce greenhouse gas emis-sions throughout Europe at the lowest cost. In the first phase (2005-2007), the ETS focuses on the greenhouse gas CO2 only, and on a number of energy-intensive industries (or rather: ‘instal-lations’).30 In principle, the ETS could lead to lower mitigation costs in energy-intensive manu-facturing industries, thereby reducing the potential of leakage. In any case, emissions trading is very likely to reduce negative impact on the international competitiveness of energy-intensive industries, and is therefore likely to reduce the risk of international relocation of firms. It is too early to tell, however, how effective the ETS will become, especially in its first phases (Kruger & Pizer, 2004; Sijm, 2004a). A Dutch advisory commission on emissions trading recently proposed to subject ‘exposed’ sec-tors to CO2-intensity standards, so-called Performance Rate Standards (PSRs) (Commissie CO2-handel, 2002), while ‘sheltered’ sectors would be subject to an absolute ceiling. For the exposed sectors, the system would not be based on an absolute ceiling (an absolute volume of CO2 emis-sions), but on a relative ceiling, i.e., CO2 emissions per unit of output.31 Gielen et al. (2002) ar-gued on the basis of a small theoretical model that such a dual system would, on the one hand, provide the right incentive for the exposed sectors to carry out all cost-effective mitigation measures, but would on the other hand, work as an output subsidy for the exposed sectors, so that their output would be less reduced than under an undifferentiated system with an absolute ceiling on national emissions. While such a dual system might be less efficient from a purely domestic perspective, its propen-sity to reduce leakage could make it (perhaps) more efficient from a global perspective.32 The
30 Combustion plants > 20 MW, oil refineries, coke ovens, ferrous metals, cement clinker, pulp from timber, glass
and ceramics (Sijm, 2004a). 31 The UK Emissions Trading System allows for both absolute and relative (rate-based) targets. Participants to the so-
called Climate Change Levy Agreement can opt for relative targets. A complicated mechanism (the ‘Gateway’) has been set-up to regulate the trade of emission allowances between the ‘absolute’ and ‘relative’ sectors (Baron et al., 2002).
32 Gielen et al. (2002) argued that the costs of meeting a specified domestic target increase under this dual system. Economic instruments, such as a CO2 tax or emissions trading have two effects: an abatement effect (reducing emissions per unit of output) and an output-substitution effect (reducing the share of CO2-intensive output in total national output). In comparison with emissions trading under an absolute ceiling, the dual system with an absolute ceiling for the sheltered sectors and relative ceilings for the exposed sectors would produce the same abatement ef-fect but a smaller output-substitution effect. Because emissions trading under an absolute ceiling can, under certain
54 Report 500036 002 (ECN-C--05-014)
system also provides incentives for technological innovation and diffusion of CO2-efficient pro-duction techniques because the existence of a market for emissions allowances (the sheltered sector), so that any reduction in CO2 intensity (CO2 emissions per unit of output) can directly be ‘sold’ in the form of the sale of emissions allowances. The linkage between a ‘relative’ (rate-based) sector and an ‘absolute’ sector poses some administrative difficulties that have to be solved before such a system can work in practice (Baron & Bygrave, 2002).33 An interesting question is whether public support for energy R&D34 in the energy-intensive manufacturing sectors could lead to increased innovation and technology spillovers as well as reduced leakage. Could energy R&D be a ‘double-edged sword’? Technology spillovers is the subject of the accompanying report of Sijm (2004b). To summarize an important point very briefly, there are two alternative views on the relationship between induced technological change and the cost of climate policy. The first view states that climate policy lead to a more rapid technological change and, therefore, to a lower cost of climate policy. The second view refers to the fact that ‘climate-related’ R&D would absorb funds from the other research areas and, therefore, the cost for the society from the climate policy is going to be higher with induced technological change. This discussion is, however, beyond the scope of this report, and here we will focus on the relationship between R&D and leakage only.35 Government support for of innovation can be divided into (at least) three different categories: i) the sponsoring of research and development activities for new technologies, ii) the stimulation of market adoption of new technologies, and iii) investment and exploitation subsidies for adopted new technologies. It is especially the third category of public stimulation of R&D that has a direct effect on marginal costs of production and therefore on international competitive-ness and leakage. The first two categories of stimulation could increase competitiveness only in the longer term, when technological innovations might potentially reduce marginal costs. If the mitigation of leakage (also in the short term) would become an important objective of public support for R&D, this might lead to a shift in support from basic R&D (i) to investment and ex-ploitation subsidies (iii). The balance between basic R&D and investment and exploitation sub-sidies is, however, already heavily tilted towards the latter in Dutch R&D policies. Because cli-mate change is a long-term problem, it would probably be unwise to let short term concerns (competitiveness and leakage) shift attention away from long-term solutions that are likely to require an increased research effort by the energy community.36 In the long run, increased energy R&D and competitiveness can and should go hand in hand. We do not, however, advocate the deployment of R&D instruments to protect competitiveness and to reduce leakage in the short run. In the short to medium term leakage could be reduced through i) increasing country participation in international greenhouse gas mitigation agree-ments, ii) applying trade measures to the import and export of CO2-intensive manufactures in the international trade with non-participants to the above agreements, and iii) the design and implementation of domestic or European emission reduction schemes that combine an effective ‘abatement effect’ with a weak ‘output-substitution’ effect for the most ‘exposed’ sectors. However, as most researchers argue that leakage in the short to medium term is primarily caused by changes in relative prices of energy goods (the energy trade channel) and not by in-dustrial relocation, one could also accept an ‘unavoidable’ rate of leakage in the short to me-dium term and concentrate on action to avoid leakage by industrial relocation in the longer term.
assumptions, lead to a least-cost solution for emissions reduction, the dual system must lead to a higher-cost solu-tion. The ‘certain assumptions’ are important, however. They include, for instance, the absence of distorting taxes on energy goods in the initial equilibrium. Also, Gielen et al. do not address the magnitude of the cost increase.
33 See also footnote 31 above. 34 Or, as it is called in recent policy jargon, RD&D (Research, Development and Deployment). 35 We will also not address the question of the effectiveness of public support for (energy) R&D. This is a crucial
question on which very little is known. 36 The World Energy Council has stated that energy-related R&D expenses are 'dangerously low' in comparison to
other technology-intensive sectors.

Report 500036 002 (ECN-C--05-014) 55
The most obvious course of action would be to stimulate innovation to improve the CO2–efficiency of exposed sectors in order for them to remain competitive on the world market. In an accompanying report, Sijm (2004b) examines the options and barriers for technological progress in this respect.
56 Report 500036 002 (ECN-C--05-014)
A.6 Conclusions Carbon leakage refers to the effect that a part of the CO2 reduction that is achieved by countries that abate CO2 emissions is offset by an increase in CO2 emissions in non-abating countries. Carbon leakage can either occur through a combination of changes in relative energy prices, changes in international trade of energy-intensive goods, international reallocation of capital and because of interactions between government climate change policies. The size of carbon leakage because of the implementation of the Kyoto Protocol is still uncertain: it is estimated that be-tween 5 and 20 percent of CO2 mitigation in Annex I countries will be offset by increases in emissions by non-Annex I countries. Some observers expect a lower rate of leakage because they expect that governments of Annex I countries will take active measures to prevent indus-trial relocation. A higher rate of leakage may, however, be caused by the non-participation of major Annex I countries such as the U.S. and Australia and non-binding targets for Eastern Europe and the former Soviet Union. Carbon leakage reduces the global cost-effectiveness of domestic and EU CO2 mitigation meas-ures. The first-best policy to counteract leakage is increasing country participation in interna-tional greenhouse gas mitigation agreements. The second-best policy is applying trade measures to the import and export of CO2-intensive manufactures in the international trade with non-participants to the above agreements. The third-best policy is to design and implementation of domestic or European emission reduction schemes that combine an effective ‘abatement effect’ with a weak ‘output-substitution’ effect for the most ‘exposed’ sectors. This is no easy task, however. An alternative option would be to accept a certain ‘unavoidable’ rate of leakage in the short to medium term (which is believed to be primarily caused by relative changes in the prices of energy goods) and concentrate on action to avoid leakage through industrial relocation. The EU Emissions Trading Scheme and other international emissions trading initiatives can poten-tially reduce negative effects on the international competitiveness of energy-intensive industries. In the long run, sustainable innovation in the energy system, competitiveness and leakage reduc-tion should go hand in hand.
Report 500036 002 (ECN-C--05-014) 57
A.7 References
Albrecht, J. (1998). Environmental policy and the inward investment position of US 'dirty' in-dustries. Intereconomics, 33 (4), 186-194
Annevelink, B., Nabuurs, G.J. & Elbersen, W. (2004): Case study on the potential for induced technological spillovers in a specific carbon neutral energy supply industry, Climate Change and Biosphere Research Centre (CCB), Wageningen UR.
Antweiler, W., Copeland, B.R., & Taylor,M.S. (2001). Is free trade good for the environment? The American Economic Review, 91, 877-908.
Armington, P.A. (1969). A theory of demand for products distinguished by place of production. IMF Staff Papers, 16, 159-178.
Babiker, M.H. (2001). Subglobal climate-change actions and carbon leakage: the implications of international capital flows. Energy Economics, 23, 121-139.
Babiker, M. H., & Jacoby, H. D. (1999). Developing country effects of Kyoto-type emissions restrictions. Report No. 53, Cambridge, MA.: MIT Joint program on the Science and Policy of Global Change.
Babiker, M. H., Maskus, K. E., & Rutherford, Th. F. (1997). Carbon taxes and the global trad-ing system. Laxenbourg: Paper prepared for presentation at the International Energy Workshop and Energy Modelling Forum Meeting at IIASA, June 23-25, 1997.
Babiker, M. H., Reilly, J. M., Mayer, M., Eckhaus, R. S., Wing, I. S., & Hyman, R. C. (2001). The MIT emissions prediction and policy analysis (EPPA) model: revisions, sensitivi-ties, and comparisons of results. Report no. 71, Cambridge, MA.: MIT Joint Program on the Science and Policy of Global Change.
Baldwin, R., Krugman, P. (2000). Agglomeration, integration and tax harmonization, CEPR Discussion Paper 2630.
Barker, T., & Johnstone, N. (1998). International competitiveness and carbon taxation. In T. Barker & J. Kohler (Eds.), International competitiveness and environmental policies. Cheltenham, UK/Northampton, MA.: Edward Elgar.
Baron, R., & Bygrave, S. (2002). Towards international emissions trading: design implications for linkages. Paris: OECD/IEA.
Batra, R., Beladi, H., & Frasca, R. (1998). Environmental pollution and world trade. Ecological Economics, 27, 171-182.
Berkhout, P. F., Felso, A., Ferrer-Carbonell, A., & Theeuwes, J. J. M. (2001). Afbakening af-geschermde sectoren. SEO paper, Amsterdam: SEO.
Bohringer, Ch.,& Rutherford, Th. F. (2000). Decomposing the cost of Kyoto: A global CGE analysis of multilateral policy impacts. Crete: Tenth Annual Conference of the Euro-pean Association of Environmental and Resource Economists, June 29-July 2 2000
Bollen, J., Groot, H. L. F. d., Manders, T., Tang, P. J. G., Vollenbergh, H. R. J., & Withagen, C. A. (2002). Klimaatbeleid en Europese concurrentieposities. Report no. 24, The Hague: CPB Netherlands Bureau for Economic Policy Analysis.
Bollen, J., Manders, T., & Timmer, H. (2000). Decomposing carbon leakage. Melbourne: Third Annual Conference on Global Economic Analysis, June 27-30:

58 Report 500036 002 (ECN-C--05-014)
Burniaux, J.-M. (2001). International trade and investment leakage associated with climate change mitigation. (Vol. Fourth Annual Conference on Global Economic Analysis, Volume II, pp. 1-24). West Lafayette, IN.: Center for Global Trade Analysis, Purdue University.
Burniaux, J.-M., Martin, J. P., Nicoletti, G., & Oliveira Martins, J. (1992). GREEN - a multi-sector, multi-region dynamic general equilibrium model for quantifying the costs of curbing CO2 emissions: a technical manual. Report No.116, Paris: OECD.
Burniaux, J.-M., & Oliveira Martins, J. (2000). Carbon emission leakage: A general equilibrium view. ECO/WKP(2000)15, Paris: OECD.
Burniaux, J.-M., & Truong, T. P. (2002). GTAP-E: an energy-environmental version of the GTAP model. Technical paper no. 16, West Lafayette, IN: Purdue University.
Cole, M.A., Rayner, A.J., & Bates, J.M. (1998). Trade liberalisation and the environment: The case of the Uruguay Round. The World Economy, 21, 337-347.
Commissie CO2-handel. (2002). Handelen voor een beter milieu (Trading for a better environ-ment). De Meern: KPMG Milieu.
Copeland, B. R., & Taylor, M. S. (2003). Free trade and global warming: A trade theory view of the Kyoto Protocol. Revised version. http://econ.ucalgary.ca/fac-files/st/KyotoMarch13.pdf
Copeland, B.R., & Taylor, S.M. (1994). North-South trade and the environment. The Quarterly Journal of Economics, 109, 755-787.
CPB. (1999). WorldScan: the core version. The Hague: CPB Netherlands Bureau for Economic Policy Analysis.
Daly, H. (1993). The perils of free trade. Scientific American, 24-29.
Dean, J. M. (1992). Trade and the environment: a survey of the literature. In P. Low (Ed.), In-ternational trade and the environment (pp. 15-28). Washington, D.C.: The World Bank.
Dean, J. M. (2002). International trade and the environment. Aldershot UK: Ashgate Publish-ing.
Elbers, C. & Withagen, C. (2004). Environmental policy, population dynamics and agglomera-tion. Contributions to Economic Analysis & Policy, 3(2), 1-21
Ekins, P., & Speck, S. (1999). Competitiveness and exemptions from environmental taxes in Europe. Environmental and Resource Economics, 13, 369-396.
Fujita, M., Krugman, P., Venables, A. (1999). The Spatial Economy: cities, regions and interna-tional trade, Cambridge, the MIT Press, 367 p.
Gielen, A., Koutstaal, P., & Vollebergh, H. R. J. (2002). Comparing emission trading with abso-lute and relative targets. London: Paper presented to the second CATEP Workshop, 25-26 March 2002.
Gielen, D., & Karbuz, S. (2003). Challenges in energy and environment modelling: a materials perspective. EET/2003/05, Paris: OECD/IEA.
Gordon, R.H., & Bovenberg, A.L. (1996). Why is capital so immobile internationally? Possible explanations and implications for capital income taxation. The American Economic Re-view, 86, 1057-1075.
Grubb, M., Hope, C., & Fouquet, R. (2002). Climatic implications of the Kyoto Protocol: the contribution of international spillover. Climatic Change, 54, 11-28.
Gürtzen,N., & Rauscher,M. (2000). Environmental policy, intra-industry trade and transfrontier pollution. Environmental and Resource Economics, 17, 59-71.

Report 500036 002 (ECN-C--05-014) 59
Hertel, Th. W. (1997). Global trade analysis: modelling and applications. Cambridge: Cam-bridge University Press.
Hertel, Th. W., Hummels, D., Ivanic, M., & Keeney, R. (2003). How confident can we be in CGE-based assessments of free trade agreements?. GTAP Working Paper No. 26, West Lafayette: GTAP Purdue University.
Herzberg, V., & Minne, B. (1992). Nederlandse industrie en regulerende energieheffing. Report No. 90, The Hague: CPB Netherlands Bureau for Economic Policy Analysis.
Hoel, M. (1996). Should a carbon tax be differentiated across sectors? Journal of Public Eco-nomics, 59, 17-32.
IPCC. (2001). Climate Change 2001: Mitigation. Cambridge: Cambridge University Press.
Jeppesen T. & Folmer, H. (2001). The confusing relationship between environmental policy and location behaviour of firms: a methodological review of selected case studies. Annals of Regional Science, 35, 523-546.
Jeppesen, T., List, J. & Folmer, H. (2002). Environmental regulations and new plant location decisions: evidence from a meta-analysis. Journal of Regional Science, 42, 19-49.
Kruger, J., & Pizer, W. A. (2004). The EU Emissions Trading Directive: opportunities and po-tential pitfalls. Discussion paper 04-24, Washington, D.C.: Resources for the Future.
Krugman, P. (2001). Ricardo's difficult idea. http://web.mit.edu/krugman/www/ricardo.htm.
Krugman, P., & Obstfeld, M. (2000). International economics: theory and policy. (Fifth edition ed.). Reading: Addison-Wesley Publishing Company.
Kuik, O.J., & Gerlagh, R. (2003). Trade liberalization and carbon leakage. The Energy Journal, 24, 97-120.
Kuik, O.J., & Mulder, M. (2004). Emissions trading and competitiveness: pros and cons of rela-tive and absolute schemes. Energy Policy, 32, 737-745.
Lako, P. (2004): Spillover effects from wind power, case study in the framework of ‘Spillover study’(draft June 23rd, 2004), Petten/Amsterdam: Energy Research Centre of the Neth-erlands (ECN).
Lejour, A., & Manders, T. (1999). How carbon-proof is Kyoto? Carbon leakage and hot air. CPB report 99/4, The Hague: CPB Netherlands Bureau for Economic Policy Analysis.
Light, M. K., Kolstad, C. D., & Rutherford, Th. F. (1999). Coal markets and the Kyoto Protocol. Boulder, CO: University of Colorado.
List, J., McHone W. W. & Millimet, D.L. (2003). Effects of air quality regulation on the desti-nation choice of relocating plants. Oxford Economic Papers, 55, 657-678.
Liu, J., Arndt, C., & Hertel, Th. W. (2001). Parameter estimation and measures of fit in a global, general equilibrium model. Purdue, West Lafayette, IN.: Paper submitted to the Fourth Annual Conference on Global Economic Analysis.
MERGE [Computer Software]. (2000). Manne, A.S., & Richels,R.G.
Markusen, J.R. (1975). International externalities and optimal tax structures. Journal of Interna-tional Economics, 5, 15-29.
Markusen, J. R., Melvin, J. R., Kaempfer, W. H., & Maskus, K. E. (1995). International trade. New York: McGraw-Hill Inc.
McKibbin, W.J., Ross, M.T., Shackleton,R., & Wilcoxen, P.J. (1999). Emissions trading, capital flows and the Kyoto Protocol. The Energy Journal, (Special issue on the Kyoto Proto-col), 287-333.

60 Report 500036 002 (ECN-C--05-014)
McKibbin, W. J., & Wilcoxen, P. J. (1995). The theoretical and empirical structure of the G-Cubed model. Washington D.C.: Brookings Discussion Papers in International Econom-ics No. 118.
Mundell, R. (1957). International trade and factor mobility. American Economic Review, 67, 321-335.
OECD. (1999). Action against climate change: The Kyoto Protocol and beyond. Paris: OECD.
Oikonomou, V., Patel, M. & Worrell, E. (2004): Does climate policies lead to relocation with adverse effects for GHG emissions or not? A first assessment of the spillovers of cli-mate policy for energy-intensive industry. Utrecht: Department of Science, Technology and Society (STS), Copernicus Institute, Utrecht University.
Paltsev, S.V. (2001). The Kyoto Protocol: regional and sectoral contributions to the carbon leak-age. The Energy Journal, 22, 53-79.
Pethig, R. (1976). Pollution, welfare, and environmental policy in the theory of comparative ad-vantage. Journal of Environmental Economics and Management, 2, 160-169.
Petrakis, E., Xepapadeas, A. (2003). Location decisions of a polluting firm and the time consis-tency of environmental policy. Resource and Energy Economics 25, 197-214.
Rauscher, M. (1997). International Trade, Factor Movements, and the Environment. Oxford: Clarendon Press.
Ricardo, D. (1821). On the principles of political economy and taxation. (Third edition ed.).
Rutherford, Th. F. (1998). GTAPinGAMS: the dataset and static model. Boulder: University of Colorado, Department of Economics.
Sijm, J. (2004a). Implementing emissions trading in the EU: how to optimise its economic bene-fits? In ECN (Ed.), Dutch energy policies from a European perspective: Major devel-opments in 2003 (pp. 33-44). Petten: Publication Services ECN.
Sijm, J. (2004b). Induced technological change and spillovers in climate policy modelling: an assessment. Amsterdam: ECN.
Smith, A. (1776). An inquiry into the nature and causes of the wealth of nations. Edinburgh.
Springer, K. (2000). Do we have to consider international capital mobility in trade models?. Kiel Working Paper No. 964, Kiel: Kiel Institute of World Economics.
Ulph, A. (1997). Environmental policy and international trade: a survey of recent economic analysis. In H. Folmer & T. Tietenberg (Eds.), International Yearbook of Environmental and Resource Economics. Cheltenham : Edward Elgar.
Wang, Z. K., & Winters, L. A. (2001). Carbon taxes and industrial location: evidence from the multinationals literature. In A. Ulph (Ed.), Environmental Policy, International Agree-ments, and International Trade (pp. 135-151). Oxford: Oxford University Press.
Report 500036 002 (ECN-C--05-014) 61
A.8 Annex This Annex contains a brief description of a number of AGE models that were discussed in this report. Light et al. (Light et al., 1999). This is a comparative-static model with eight goods and thirteen regions (7 developed and 6 developing). It is based on Rutherford’s GTAPinGAMS model (Rutherford, 1998) with a special treatment of the world markets of coal and oil. Light et al. (1999) argue that the global rate of leakage is particularly sensitive to the way that the world coal market is modelled. Usually, the assumption is made that coal is differentiated by region of origin (the ‘Armington assumption’). That is, coal supplies from different regions are heteroge-neous goods and no perfect substitutes. However, the alternative assumption of one integrated world market for coal as one homogeneous good would dramatically increase the global rate of leakage (from 20 to 40 percent in the Light model).
WorldScan (CPB, 1999). WorldScan is a dynamic AGE for the world economy. Its core model contains seven sectors and twelve regions, but for specific applications its sectoral and regional aggregation can be adjusted. It is used for long-run scenario studies ('Scanning the Future') and for specific policy problems, including climate change policies. Bollen et al. (2000) examined the sensitivity of WorldScan’s predicted rate of carbon leakage with respect to trade and substi-tution elasticities. Lower trade elasticities lead to lower leakage. Changing substitution elastic-ities among fuels and other inputs in production gives ambiguous results. In the case of lower substitution elasticities in production, a larger carbon tax is necessary to achieve a certain reduc-tion in emissions. This will shift production to non-regulated countries and increase leakage. However, there is also less downward pressure on fuel prices, thus reducing leakage.
MERGE (Manne & Richels, 2000). MERGE is a dynamic Integrated Assessment Model of global warming. In comparison to the other models discussed here, it includes the feedbacks of the climate system on the economy. It is very detailed in its representation of the energy sectors. It also contains information on a richer set of greenhouse gases (CO2, CH4 and N2O) and sinks. It contains information on six tradable goods and nine regions. Carbon leakage is the result of trade in composite energy-intensive goods (EIS) among regions. Because of its alternative struc-ture, MERGE is not readily comparable to the other AGE models discussed here.
MIT-EPPA (Babiker, Reilly, Mayer et al., 2001). The MIT Emissions Prediction and Policy Analysis (EPPA) dynamic AGE model has a particularly rich set of greenhouse gases (CO2, CH4, N2O, HFCs, PFCs, SF6) and other climatically important gases such as aerosols, nitrogen oxides, carbon monoxide, ammonia and non-methane volatile organic compounds. EPPA can be run in a stand-alone mode, or in combination with a full Integrated Global Simulation Model that includes atmospheric chemistry, climate processes and dynamic terrestrial ecosystems processes. The EPPA model contains information on 8 sectors and 12 regions. Apart from cur-rent energy commodities, it also contains assumptions on future energy options (shale oil, coal, gas, and renewables). Babiker and Jacoby (1999) report a global rate of leakage of 6 percent for 2010, in line with OECD’s GREEN model (see below) and G-Cubed (see below), but somewhat lower than other studies. Babiker and Jacoby (1999) suggest that one reason for their relatively low rate of carbon leakage would be that MIT-EPPA phases-out energy subsidies and balance-of–payment deficits along its baseline projection. Maintaining existing energy subsidies in MIT-EPPA would increase carbon leakage by 2 percentage-points. Babiker and Jacoby (1999) esti-mated that 30 percent of carbon leakage would be due to increases in emissions in China alone, while 60 percent of carbon leakage would be due to emission increases in just five countries (China, India, Brazil, South Korea and Mexico).
G-Cubed (McKibbin & Wilcoxen, 1995). G-Cubed is a dynamic AGE model that, in contrast to the other models discussed here, includes information on financial markets and monetary vari-

62 Report 500036 002 (ECN-C--05-014)
ables. G-cubed contains information on twelve production sectors, one financial sector, and eight regions. In its simulations of the effects of the Kyoto Protocol, changes in exchange rates and international capital flows play big roles (McKibbin et al., 1999). As most of the interna-tional capital flows that are induced by the Kyoto Protocol are predicted to be among Annex I countries, carbon leakage to non-Annex I countries is relatively modest. A peculiar result of sensitivity analysis with G-Cubed, reported by McKibbin et al. (1999), is that carbon leakage declines when G-Cubed’s trade elasticity parameters are increased. McKibben et al. attribute this decline to the substitution between international trade and goods and capital in G-Cubed. With larger trade elasticities, less international capital transfers are needed to restore interna-tional equilibrium in G-Cubed.
GREEN (Burniaux, Martin, Nicoletti et al., 1992). GREEN is a dynamic AGE model of the OECD that is used for the simulation of environmental policies. It contains information on eight production sectors and twelve regions. Its energy set includes three so-called 'backstop' fuels (that are supposed to be in infinite supply in the future at a certain price): carbon-based backstop fuel, carbon-free backstop fuel and a backstop electric option. The GREEN model makes spe-cial assumptions on capital investments over time.37 Burniaux and Oliveira-Martins (2000) ex-amined carbon leakage in the GREEN model and found that the key parameter in explaining carbon leakage was the supply elasticity of fossil fuels, and especially that of coal. In the ex-treme case of zero supply elasticity all adjustment would be through prices and there would be no adjustment in quantities. In that case, any unilateral reduction in carbon emissions would be completely offset by increases of carbon emissions elsewhere, i.e., a leakage rate of 100 per cent. With a large elasticity of supply, most adjustment works through quantities and leakage is modest. The GREEN model employs large supply elasticities for fossil fuels (around 20), which may explain its relatively low rate of carbon leakage. The problems are that empirical estimates of supply elasticities are conflicting and that there are large opportunities for strategic behaviour on the supply side, especially in the oil market.
GTAP-EG (Paltsev, 2001). The comparative-static GTAP-EG model is another spin-off from Rutherford’s GTAPinGAMS model (Rutherford, 1998). The full GTAP-EG dataset contains in-formation on 23 sectors and 45 regions. For carbon leakage experiments this dataset was aggre-gated to 23 sectors and 13 regions. A summary of the results of Paltsev’s carbon leakage ex-periments is presented in this report.
GTAP-E (Burniaux & Truong, 2002). The comparative-static GTAP-E model is an application of the Global Trade Analysis Project (GTAP) (Hertel, 1997). GTAP’s dataset is updated every three of four years. The current GTAP-E dataset – version 5 – contains information on 57 sec-tors and 66 regions in the base year 1997. Energy data in the GTAP dataset is derived from the International Energy Agency. Kuik and Gerlagh (2003) used a precursor of the current GTAP-E model to assess the impact of trade liberalization on carbon leakage.
37 It contains a so-called putty/semi-putty production structure. This is similar to the investment model used in WorldScan.
Report 500036 002 (ECN-C--05-014) 63
APPENDIX B: INDUCED TECHNOLOGICAL CHANGE AND SPILL-OVERS IN CLIMATE POLICY MODELLING
J.P.M Sijm
Energy research Centre of the Netherlands (ECN)

64 Report 500036 002 (ECN-C--05-014)

Report 500036 002 (ECN-C--05-014) 65
B.0 Summary for policymakers Besides primary effects such as reducing greenhouse gas emissions, climate policies may have secondary (side) effects - called ‘spillovers’ - such as the induced innovation and diffusion of new technologies, both nationally and internationally. These spillovers of climate policies, in turn, may affect the (long-term) performance of these policies, for instance in terms of abate-ment costs or emission reductions, both at home and abroad. The aim of this report is to provide a critical assessment of the available literature of both so-called ‘top-down’ and ‘bottom-up’ modelling studies on the spillover effects of climate policies on induced technological change - including the innovation and diffusion of new technologies at home and abroad - as well as, in turn, the impact of these technological spillovers on the long-term performance of these policies. Potential impact of induced technological spillovers After a review of its central concepts ‘induced technological change’ and ‘technological spill-overs’, the present assessment report discusses a paper by Grubb et al. (2002b) on the potential impact of induced technological spillovers on global carbon abatement. By means of some sim-ple (optimistic) assumptions and numerical illustrations, this paper shows that spillover effects from mitigation actions in the industrialised, Annex I countries can exert a huge leverage effect on reducing global emissions, and that over time the diffusion of abatement innovations, in-duced by mitigation actions in the Annex I countries, outweighs the leakage of emissions due to the relocation of production to other, developing countries (also induced by Annex I actions). On balance, the overall result of mitigation actions in the industrialised countries is to reduce emissions in the developing countries as well. The outcome of the exercise by Grubb et al. (2002b), however, depends highly on the (implicit) assumption that mitigation actions in the industrialised countries will induce a large variety of (relatively cheap) abatement technologies that are not only widely adopted in industrialised countries but also in developing countries (even if these latter countries do not have a climate policy incentive to adopt these technologies themselves). Moreover, the study of Grubb et al. (2002b) is based on the critical (but unreal) assumption of no emissions trading between Annex I and non-Annex I countries. This implies that the costs (or GDP losses) to meet the Annex I mitigation target for the year 2100 will be rather high, notably because this target is rather strin-gent, while there is no opportunity to meet this target by means of cheaper emissions reductions in non-Annex I regions through CDM-based trading. Climate policy encourages innovation and diffusion of technologies Subsequently, the present report addresses the question whether climate policy will induce tech-nological change by (i) reviewing the (empirical) literature on technological change induced by environmental policies and/or higher energy prices, and (ii) discussing the (theoretical) literature on the relationship between market imperfections and environmental technologies. The most important finding is that the available evidence on induced technological change by environ-mental policies and/or higher energy prices seems to support the hypothesis that (future, strin-gent) climate policy will encourage the innovation and diffusion of new technologies that will address the issue of controlling global warming in a more cost-effective way. Some qualifica-tions, however, can be added to this general finding. Firstly, the impact of climate policies on the promotion of emission abatement technologies will vary depending on the time period and type of technological change considered. Secondly, cli-mate policy may not only induce technological change but, in turn, the innovation and diffusion of more cost-effective abatement technologies may affect the optimal target, timing and/or in-strument choice of climate policy. Thirdly, although climate policy may induce abatement tech-nologies that are more cost-effective, that does not necessarily imply that the costs of this policy

66 Report 500036 002 (ECN-C--05-014)
are lower, depending on the definition of ‘costs’ and whether the abatement target is fixed or not. Fourthly, the fact that climate policy will induce technological change does not say any-thing about which (mix of) instruments will be more or less cost-effective to do so. A final, but perhaps most important qualification is that, while climate policy may induce tech-nological change, the impact of climate policy alone will be far from optimal as the innovation and diffusion of green technologies is generally faced by two related sets of market imperfec-tions. While climate policy may stimulate new technology as a side-effect of internalising the costs of the environmental externality (i.e. the greenhouse effect), it does not address explicitly the other set of market imperfections directly related to technological change (such as the inci-dence of spillover effects). On the other hand, simply relying on the promotion of technological change by technology policy alone is not enough as there must be a long-term, predictable and credible climate policy-induced incentive in place that encourages the process of technological change to occur actually in the direction of innovating and diffusing improved carbon abatement technologies. Therefore, a balanced set of climate and technology policies is necessary to pro-mote the innovation and diffusion of emission abatement technologies and, hence, to address the issue of global warming in an optimal way. It should be acknowledged, however, that the proc-ess of technological change is not only characterised by potential market failures but also by po-tential policy or government failures such as the lack of public information, the incidence of free-riding, and the risk of ‘picking the winners/losers’ (e.g. in case of subsidising/taxing spe-cific technologies). Assessment of ‘top-down’ and ‘bottom-up’ studies Thereafter, the report provides a critical assessment of existing studies on induced technological change and spillovers in ‘top-down’ and ‘bottom-up’ approaches of climate policy modelling. Top-down models are general macroeconomic models that analyse the economy - including the energy system - in highly aggregated terms, with hardly any detail on energy or mitigation tech-nologies at the sector level. Such models are particularly suitable for analysing macroeconomic effects of climate policies, including the interactions and feedback effects at the intersectoral, (inter)national, regional or global level. Over the past decade, induced technological change has been incorporated in these models, particularly by linking the accumulation of knowledge and experience to changes in climate policy. Induced technological change in top-down modelling studies In general, ITC top-down modelling studies show a wide divergence of results with regard to the impact of induced technological change and spillovers on the performance of climate policy. Whereas this impact is generally large and positive in some studies, it is relatively low or even negative in others. This divergence in the major results of top-down modelling studies with re-gard to the impact of ITC/spillovers on the performance of climate policies can be explained by the methodology and data used. More specifically, besides differences in ITC channel (i.e. R&D versus learning-by-doing) and in policy optimisation criteria (i.e. the cost-effectiveness criterion versus the benefit-cost criterion), these differences in outcomes can be mainly attributed to (i) the specification of some critical model functions, particularly the ITC or knowledge accumula-tion functions, (ii) model parameterisation and data use, (iii) the role of spillovers, and (iv) the role of other modelling characteristics varying among these studies such as the scope or level of aggregation (sectoral, national, regional, global), the number and type of policy instruments covered, the stringency of the abatement target, or the time horizon considered (i.e. the impact of ITC is often more significant in the long term). Despite substantial progress made over the past decade, the present ITC top-down studies are still faced by a variety of weaknesses and limitations. Due to these limitations and the diversity of their model outcomes, it is hard to draw firm lessons and implications from these studies. Nevertheless, a major lesson from these studies seems to be that even if climate policy induces technological change at the level of individual sectors or technologies, it does not imply that the social costs of such a policy will decline by necessity. Another lesson is that, when analysing or

Report 500036 002 (ECN-C--05-014) 67
generating ITC, not only its impact on gross social costs should be considered but also its poten-tial environmental benefits. A final implication of the present state of ITC top-down studies is that further research is necessary in order to draw more firm policy lessons and implications. Induced technological change in bottom-up modelling studies On the other hand, bottom-up energy system models are usually characterised by a detailed analysis of energy technologies, including information on the costs and other performance char-acteristics of these technologies such as the energy efficiency or GHG emissions per unit input or output. Since the mid-1990s, technological change has been endogenised in some of these models by means of so-called learning curves that relate the costs of specific technologies to the accumulation of knowledge and experience during the innovation and diffusion stages of these technologies. In contrast to the ITC top-down studies, the ITC bottom-up studies reviewed in the present re-port show some major similarities in performance, in terms of both methodological approach and major findings of the models used. In order to explore the interaction between climate pol-icy and induced technological change, these studies have used a detailed, bottom-up energy technology system model in which learning curves have been added to the cost functions of (some) energy technologies covered by these models. The major outcomes of these studies are that, due to the presence of ITC (i.e. ‘learning technologies’), (i) the investment costs of these technologies decline if they built up capacity (‘experience’), (ii) the energy technology mix changes in favour of those technologies that built up the relatively highest rate of learning (i.e. cost reduction), and (iii) the total abatement costs of a given abatement target decline signifi-cantly. However, although there is a large degree of agreement among bottom-up studies with regard to these results, the size of the impact of ITC on, for instance, the technology mix or abatement cost may vary substantially between these studies depending on the assumed rate of technologi-cal learning, the number of learning technologies included in the analysis, the time frame con-sidered, the stringency of the mitigation target, the setting of market penetration limits, etc. Moreover, despite significant progress made in endogenising technological change in bottom-up modelling studies over the past decade, the present state of these studies is still characterised by too many weaknesses and limitations to draw a set of firm, specific policy lessons and implica-tions. Nevertheless, a few general lessons and implications can be formulated. Firstly, perhaps the most important policy message from technology learning is that new technologies require markets to become commercial. Hence, as it takes time to build up capacity (i.e. ‘learning’ or ‘experience’) and to reduce costs until a market break-even point is reached, there is a need for early policy action to accomplish the required cost and performance improvements in the long term, including the creation of niche markets, the development of small-scale demonstration plants, targeted R&D, and the (temporary and declining) subsidization of promising technolo-gies. Another lesson is that, owing to the presence of spillovers, the imposition of emission con-straints in the Annex I region may induce technological change and, hence, emission reductions in the non-Annex region even when the latter region does not face emission constraints itself. A final lesson or implication is that further research is needed in order to draw more concrete, firm policy conclusions from ITC bottom-up modelling studies.
68 Report 500036 002 (ECN-C--05-014)
Implications for post-Kyoto agenda Finally, this assessment report considers briefly some implications for the post-Kyoto agenda on climate and technology policies. In general, it concludes that a well-balanced package of inter-nationally coordinated climate and technology policies is necessary to deal with the two sets of international market imperfections in the field of abatement technologies (i.e. environmental ex-ternalities and technology market failures). More specifically, it suggests that the innovation and diffusion of emission-saving technologies can be stimulated by the following options: • International co-operation on Research, Development, Demonstration and Deployment ac-
tivities (R&D3). • Encouraging technology diffusion through trade, investment and other general, macroeco-
nomic policies. • Stimulating technology diffusion through emissions trading, notably the Clean Development
Mechanism (CDM), and sound technology transfer strategies, including the improvement of the absorptive capacity for technological innovation and diffusion in developing countries.
• Promoting the innovation and diffusion of carbon-saving technologies by means of volun-tary agreements (‘covenants’) between governments of the climate coalition and a few inter-national firms that dominate R&D and technological change in certain areas, for instance the international automobile industry.
These options should be part of the post-Kyoto agenda in order to enhance the potential positive interaction between climate policy, induced technological change and international spillovers, including the potential positive impact of this interaction on mitigating global greenhouse gas emissions and reducing total abatement costs.
Report 500036 002 (ECN-C--05-014) 69
B.1 Introduction Besides primary effects such as reducing greenhouse gas emissions, climate policies may have secondary (side) effects - called ‘spillovers’ - such as the induced innovation and diffusion of new technologies, both nationally and internationally.38 These spillovers of climate policies, in turn, may affect the (long-term) performance of these policies, for instance in terms of abate-ment costs or emission reductions, both at home and abroad. The aim of this report is to provide a critical assessment of the available literature of both so-called ‘top-down’ and ‘bottom-up’ modelling studies on the spillover effects of climate policies on induced technological change - including the innovation and diffusion of new technologies at home and abroad - as well as, in turn, the impact of these technological spillovers on the long-term performance of these policies. The structure of the present report runs as follows. First, Chapter 2 provides a conceptual framework, particularly with regard to the terms ‘induced technological change’ and ‘techno-logical spillovers’. Subsequently, Chapter 3 discusses a study by Grubb et al. (2002b) on the po-tential impact of induced technological spillovers on global carbon abatement. Next, Chapter 4 tries to answer the question whether climate policy will induce technological change by (i) re-viewing the (empirical) literature on technological change induced by environmental policies and/or higher energy prices, and (ii) discussing the (theoretical) literature on the relationship be-tween market imperfections and environmental technologies. Thereafter, Chapters 5 and 6 as-sess existing studies on induced technological change and spillovers in ‘top-down’ and ‘bottom-up’ approaches of climate policy modelling, respectively. Finally, Chapter 7 discusses the im-plications of the present assessment report for the post-Kyoto agenda on climate and technology policies.
38 Another example of spillovers due to climate policy concerns ‘carbon leakage’. See Kuik (2004) and Chapter 2 of
the present study.

70 Report 500036 002 (ECN-C--05-014)
B.2 Conceptual framework
B.2.1 Induced technological change The notion of induced technological change was first introduced by Hicks (1932) who noted that changes in relative prices of production factors such as labour or capital would spur the de-velopment and diffusion of new technologies in order to economise on the usage of the more expensive production factor. Starting from the 1960s, this notion of induced (or ‘endogenous’) technological change has been used by the so-called endogenous or ‘new’ growth theory in or-der to account for economic growth and technological changes endogenously within a macro-economic model.39 Subsequently, the idea of induced technological change has been applied to a variety of other disciplines, such as energy or environmental economics. More recently, i.e. since the mid-1990s, it has also been used in the field of climate policy modelling.40 In this paper, the process of technological change covers the widely used Schumpeterian trilogy of invention (i.e. the first development and demonstration of a scientifically or technically new product or process), innovation (i.e. the first regular commercial production of a new technol-ogy) and diffusion (i.e. the spread of a new technology across its potential market).41 For the purpose of this paper, induced technological change is defined as the component of technologi-cal change that is brought about in response to government climate policy (while the term en-dogenous technological change will be used in the same meaning, although in a modelling con-text). Climate policy is primarily aimed at controlling greenhouse gas (GHG) emissions (i.e. mitigation) and includes both market-based instruments (such as taxes, subsidies or tradable permits) and command-and-control regulations (such as setting performance- or technology-based standards for firms or households). Basically, there are two channels through which induced technological change can be imple-mented, i.e. via ‘research and development’ (R&D) and ‘learning-by-doing’ (LBD). Although these two channels are mostly treated quite exclusively in the literature of energy and climate policy modelling, in practice they seem rather complementary in the sense that the invention and innovation stage of technological change are covered largely through the channel of R&D and the diffusion stage via LBD. In the first case, i.e. through R&D, the introduction of climate policies such as a carbon tax or standard increases the market for carbon-mitigation technologies and, hence, creates an incen-tive for increased R&D investments in these technologies. In modelling terms, these increased 39 In this paper, the terms ‘induced technological change’ (ITC) and ‘endogenous technological change’ (ETC) will
be largely used interchangeably, although the concept ITC refers primarily to technological changes due to changes in policy or economic conditions (in contrast to ‘autonomous’ technological changes which are not induced spe-cifically by changes in policy or economic conditions). On the other hand, the term ECT is primarily used as a modelling concept, referring to technological changes that are explained within a scientific model (in contrast to ‘exogenous’ technological changes which are treated as ‘given’ and remain unexplained within the model). It should be noted, however, that in a small part of the literature, the terms ETC and ITC refer to different concept in the sense that ETC refers to the broad notion of (neutral) technological progress that responds to economic incen-tives (in order to account for changes in the general stock of knowledge and R&D that affect overall economic growth), while ITC refers specifically to the bias or direction of technological innovations in response to changes in relative prices or other economic conditions (Jaffe et al., 2003). For instance, Buonanno et al. (2003) distinguish between ETC, referring to changes in the general stock of knowledge that affect the overall productivity of capital and labour, and ITC, referring specifically to changes in the emissions output ratio that are induced by changes in the general stock of knowledge.
40 For a discussion of the evolution of the theory of induced technological change and endogenous economic growth, see Hayami and Ruttan (1985), Grübler et al. (2002), and Mulder 2003.
41 Occasionally, another stage called ‘niche market’ is distinguished as a separate stage between the innovation and (wide-spread) diffusion stages in the process of technological change. The term ‘niche market’ refers to the first phase of diffusion of a new technology in a special, separate market (i.e. with high positive demand) in which a new technology can relatively easily spread, even though the production costs are still high (Grübler and Messner 1998; Grübler and Gritsevskyi, 2002; and Gerlagh et al., 2004).
Report 500036 002 (ECN-C--05-014) 71
investments lead to an increase of the knowledge capital stock, which is part of the production or innovation function of a firm, sector, country or region. In the second case, i.e. via LBD, climate policies encourage primarily the adoption of GHG-mitigation technologies, resulting in declining costs of these technologies due to the accumula-tion of knowledge and experience among producers and users as the installed capacity of these technologies expands (where the declining costs further encourage their adoption, etc.). In mod-elling terms, this process of technological change is expressed by a learning or experience curve that relates the costs of a technology to its cumulative installed capacity. This capacity is used as a measure of the accumulation of knowledge and experience during the manufacturing stage of the technology (‘learning-by-doing’).42 The speed of learning is usually expressed by the progress rate (PR) or its complementary learn-ing rate (LR=1-PR), defined as the rate at which the costs of a newly installed technology de-clines each time its cumulative installed capacity doubles. For instance, a progress ratio of 0.8 (or a learning rate of 0.2) means that the costs per unit of a newly installed capacity (e.g. a wind turbine) decrease by 20 percent each time its cumulative installed capacity is doubled (Seebregts et al., 2000). The impact of technological change induced by climate policy is usually analysed by two broad approaches for modelling the interaction between the economy, energy and environment: bot-tom-up (BU) versus top-down (TD).43 These approaches differ mainly with regard to the em-phasis placed on a detailed, technologically based treatment of the energy system, and a theo-retically based treatment of the general economy. Bottom-up models are partial models of the energy sector, lacking adequate interactions with the rest of the economy. In general, these models are characterised by a detailed analysis of the energy system, covering a wide variety of energy technologies, including data on the costs and other performance characteristics of these technologies (such as the energy efficiency or GHG emissions per unit output). Bottom-up models are mostly used to compute the least-cost option of meeting an exogenous demand for final energy services subject to various system constraints such as a GHG mitigation target. In addition, they often analyse the deployment or market penetration of specific energy technolo-gies based on (policy-induced changes in) their costs and other performance characteristics. Technological change occurs as one technology is substituted by another (Löschel, 2002). Top-down models, on the other hand, are general macroeconomic models that analyse the econ-omy - including the energy system - in highly aggregated terms, with hardly any detail on en-ergy or mitigation technologies at the sector level. Such models are particularly suitable for ana-lysing macroeconomic effects of climate policies, including the interactions and feedback ef-fects at the intersectoral, (inter)national, regional or global level (Sijm et al., 2002). Top-down models, however, do not provide much insight in the process of innovation and diffusion of concrete, individual technologies. In such models, technological change is usually expressed at an abstract, aggregated level through a change in the production or innovation function, either exogenously - i.e. by means of autonomous efficiency parameters - or endogenously, i.e. by means of an induced change in the knowledge stock or learning capacity of an economy.
42 In some parts of the literature, a distinction is made between three basic types of learning: learning in the R&D
stage of a technology (‘learning-by-searching’), learning at the production or manufacturing stage (‘learning-by-doing’) and learning as a result of using the technology (‘learning-by-using’). See Mulder (2003), and Jaffe et al., (2003 and 2004).
43 This section is based on Löschel (2002). For a further discussion of the characteristics and performance of these two modelling approaches, see Hourcade et al. (1996); Weyant and Hill (1999); IPPC (2001) and Sijm et al. (2002). These references discuss also some ‘mixed’ approaches which link a top-down representation of the econ-omy with a bottom-up description of technologies in the energy sector, See, for instance, Criqui et al. (1999) or Manne and Richels (2004).

72 Report 500036 002 (ECN-C--05-014)
In bottom-up models, induced technological change is generally effectuated via the channel of learning-by-doing (LBD). In top-down models, on the other hand, it is usually implemented via the channel of R&D, although a few top-down approaches have relied on the LBD channel, ei-ther exclusively or including alternately (but not simultaneously) the LBD and R&D channel (see Chapters 5 and 6 for a further assessment of the performance of different modelling ap-proaches in analysing induced technical change).
B.2.2 Technological spillovers The concept of spillovers originates in the literature of R&D and technological change - includ-ing the innovation and endogenous growth theories - where it has been applied under a variety of largely synonymous labels such as ‘R&D spillovers’, ‘knowledge spillovers’, ‘technological spillovers’, ‘innovation spillovers’ or equivalent terms such as ‘R&D or knowledge external-ities’. These concepts all refer to the fact that knowledge has a high non-rival, public-good char-acter and that, as a result, a private innovator may be unable to fully appropriate the social re-turns of investments in R&D and technological change. A major part of these social returns will accrue as ‘spillovers’ or ‘positive externalities’ to competitors - who will be able to use the knowledge as well - or to downstream firms and customers who purchase the innovator’s prod-uct at a price that captures only a portion of its full value (including the enhanced quality of the innovated product). This ‘appropriability problem’ or ‘spillover gap’ between the private and social returns of innovations is likely to lead to significant underinvestment by private firms in R&D, relative to the social optimum (Jaffe et al., 2003).44 This paper will use the concept ‘technological spillovers’ defined as ‘any positive externality that results from purposeful investment in technological innovation or development’ (Weyant and Olavson, 1999). They can be distinguished with regard to the level at which they occur: technological spillovers may be intra- or intersectoral, varying from the local to the international level. Moreover, they can be either embodied in tradable goods or disembodied, i.e. not directly related to the flows of intermediate and end-use products.45 More specifically, in the field of global GHG mitigation, technological spillovers can take place through a wide variety of chan-nels, including local or international trade of goods and services, foreign direct investments, R&D collaboration at the sectoral and international level, personal communications, technologi-cal and scientific upgrading through relevant literature and business networks, JI/CDM transac-tions, and the migration of scientists and skilled labour forces. Recently, the concept of spillovers has been used in a wider meaning in the literature on climate policy. For instance, according to the Third Assessment Report of the IPCC, ‘spillovers from domestic mitigation strategies are the effects that these strategies have on other countries. Spill-over effects can be positive or negative and include effects on trade, carbon leakage, transfer and diffusion of environmentally sound technology, and other issues’ (IPCC, 2001). A similar definition of spillovers has been used by Grubb et al. (2002a and 2002b; see also Grubb, 2000). In their definition, spillovers refer to the impact of mitigation actions by the industrialised coun-tries on the level of GHG emissions in the developing countries. They distinguish three compo-nents of international spillovers:
44 Besides spillovers, there are a variety of other externalities and imperfections in the markets for investments in
R&D and technical change such as uncertainties, imperfect information, capital constraints, ‘rent-stealing’ or ‘common-pool’ effects, and network (or ‘positive adoption) externalities. For a discussion of these market imper-fections and their implications for private investments and public interventions in the field of environmental R&D and technological change, see Section 4.4. below as well as Parry (2001), Grubb and Ulph (2002), and Jaffe et al. (2002, 2003 and 2004).
45 Similar distinctions of ‘embodied’ versus ‘disembodied’ spillovers concern ‘market’ or ‘rent’ spillovers versus ‘pure knowledge’ spillovers. For these and other distinctions of spillovers, see Griliches (1992), Jaffe (1998), Wey-ant and Olavson (1999), Keller (2001), Grünfeld (2002), and Cincera and Van Pottelsberghe de Potterie (2002).
Report 500036 002 (ECN-C--05-014) 73
• Spillovers due to economic substitution effects, such as price or terms-of-trade effects, re-sulting in a leakage (or negative spillover) of emissions.46
• Spillovers due to the diffusion of technological innovations induced by abatement action in the industrialised countries and transferred to the developing countries. This component cor-responds to the (narrow) definition of spillovers originating in the R&D literature mentioned above.
• Spillovers due to policy and political influence of industrialised countries mitigation efforts on developing countries abatement actions, such as the spread around the world of abolish-ing fossil fuel subsidies, accepting mitigation commitments, liberalising electricity markets or implementing other energy efficiency-enhancing measures.
Whereas the first component implies a negative spillover, the other two components are in most cases sources of positive spillovers. According to the quantitative analysis of Grubb et al. (2002b), the positive spillovers of climate policies may over time far outweigh the negative spillovers (see Chapter 3 for a discussion of this quantitative analysis).
46 In their definition of (the first component of) international spillovers, Grubb et al. (2002) are merely focused on the
physical implications of international spillovers, i.e. on the impact of abatement efforts by the industrialised coun-tries (‘carbon leakage’), including the impact on global average temperature and long-term sea level rise. In con-trast, Böhringer and Rutherford (2002 and 2004) focus their analysis on the welfare implications of international spillovers, i.e. the impact of carbon abatement policies of industrialised countries on international market prices, the allocation of economic resources and, hence, on the costs and benefits of these policies accruing to other coun-tries.
74 Report 500036 002 (ECN-C--05-014)
B.3 The potential impact of induced technological spillovers on global carbon abatement
Recently, Grubb et al. (2002b) have estimated the potential impact of international spillovers due to mitigation actions by the industrialised countries on the level of GHG emissions in the developing countries. As noted in Section 2.2, they employ a broad definition of international spillovers, including three components. Spillovers due to economic substitution (‘emission leak-age’), spillovers due to the diffusion of technological innovation, and spillovers due to policy and political influence of industrialised countries' mitigation efforts on developing countries' abatement actions. In their quantitative analysis, they represent international spillover in terms of its impact on the relative emissions intensity, defined as the ratio of CO2 emissions to GDP, in different parts of the world (based on Grubb, 2000). More specifically, by means of a simple equation that links emission intensities in the industrial-ised, Annex I region to those in the developing, non-Annex I region, Grubb et al. (2002b) repre-sent international spillover in terms of the relative convergence of these regional emissions in-tensities over the 21st century by an aggregate spillover parameter σ (which includes the three components of international spillovers mentioned above). If σ = 0 there is no spillover effect, representing the case in which the emission intensities of the developing countries is completely independent of those in the industrialised counties. On the other hand, if σ = 1, there is full or perfect spillover, representing the case in which average emission intensities in the non-Annex I region converges to the same level of the (declining) emissions intensity in the Annex I region by the end of the 21st century. In order to illustrate the potential impact of spillover effects on the emission level of developing countries, Grubb et al. (2002b) take as their reference case the SRES A2 scenario of the IPCC (2000a), modified by the assumed mitigation commitments of the industrialised countries, i.e. the Kyoto commitments until 2012 followed by a decline in Annex I emissions by 1% per year thereafter. In this ‘stringent’ mitigation scenario, carbon emissions of the industrialised coun-tries decrease from about 4000 MtC in 2000 to less than 1600 MtC by the end of the 21st cen-tury (see Figure B.1). In the absence of international spillovers (σ = 0), emission intensities in the developing countries are projected roughly to halve in the business-as-usual case by 2050 (when they will reach roughly the levels of the industrialised world in 1990). By 2100, in this case, emission intensities in the developing, non-Annex I region will be about five times those in the industrialised, Annex I region. In the case of full international spillovers (σ = 1), on the contrary, non-Annex I intensities will decline roughly twice as fast until 2050 and, as indicated, they will converge to the levels of the industrialised region by 2100, while the abatement tech-nologies and practices induced by the mitigation actions in this region diffuse through the de-veloping world (Grubb, 2000; Grubb et al. 2002a). Figure B.1 illustrates the potential spillover effects of stringent mitigation actions in the indus-trialised countries in total developing country emissions over the 21st century. It shows that these effects can be very large. For instance, in case of no spillover (σ = 0), total non-Annex I emissions increase steadily from 2,100 MtC in 2000 to 13,000 MtC in 2100, while in case of full spillover (σ = 1), they are stabilised around mid century and start to decline slowly thereaf-ter, amounting to some 2,100 MtC again in 2100 (i.e. about one-sixth of their level in case of no spillover). By means of the PAGE95 integrated assessment model, Grubb et al. (2002b) are able to esti-mate the potential implications of international spillovers in terms of cumulative emissions, at-mospheric CO2 concentrations, and changes in mean global temperature or long-term sea level rise. In the stringent mitigation scenario (Kyoto + 1%/yr decline of Annex I emissions), unitary spillover reduces total cumulative emissions in 2100 by almost 700 GtC, from 1480 GtC (zero spillover) to 800 GtC. The corresponding changes in atmospheric CO2 concentrations by 2100

Report 500036 002 (ECN-C--05-014) 75
amount to a decline of 170 parts per million by volume (ppmv), from 740 ppmv (σ = 0) to 570 ppmv (σ = 1). This would imply a change in mean global temperature from pre-industrial levels by 2100 of 2.7°C in case of full spillovers (compared to 4.2°C if σ = 0), resulting in a re-duction of the mean sea level rise in 2100 by about 40 cm. As sea level continues to rise for many decades after concentrations have stabilised, the impact of full spillovers upon sea level rise in the 22nd century would be even greater (Grubb et al. 2002b).
0
2000
4000
6000
8000
10000
12000
14000
2000 2025 2050 2075 2100
MtC
DCs LDCs: no spilloverLDCs: 50% spillover LDCs: full spillover
Source: Grubb et al. (2002b). Figure B.1 Spillover effects of stringent mitigation actions of industrialised countries (DCs) on
total emissions of developing countries (LDCs) over the period 2000-2100 (in MtC) Overall, the analysis of Grubb et al. shows that spillover effects from mitigation actions in the industrialised countries can exert a huge leverage effect on reducing global emissions, and that even relatively low levels of technological and institutional spillovers are sufficient to offset the (negative) spillover of carbon leakage. Over time, the diffusion of abatement innovations, in-duced by mitigation actions in the Annex I countries, outweighs the leakage of emissions due to the relocation of production to other, developing countries (also induced by Annex I actions). On balance, the overall result of mitigation actions in the industrialised countries is to reduce emissions in the developing countries as well (Grubb et al. 2002a and 2002b). The results of Grubb et al., however, depend critically on the value of the aggregated spillover variable (σ). Based on some historical reflections and some assumptions with regard to the long-term future, they argue that zero or negative international spillovers, as assumed in many other studies, is ‘not credible’ and that the most likely range for the spillover variable in their model is 0.5-1.0. However, the empirical database or parameterisation of this aggregate variable, includ-ing its constituent components, is weak and highly uncertain.

76 Report 500036 002 (ECN-C--05-014)
More specifically, the (optimistic) outcome of the analysis by Grubb et al. depends highly on the (implicit) assumption that mitigation actions in the industrialised countries will induce a large variety of relatively cheap abatement innovations that are not only widely adopted in in-dustrialised countries but also in developing countries (even if these latter countries do not ac-cept mitigation commitment themselves). Only if these innovations are relatively cheap, carbon leakage from the industrialised countries will be low while their diffusion among developing countries will be high, resulting in a relatively high value of the aggregate spillover variable (in the range of 0.5-1.0). If not, carbon leakage will be high while developing countries (with no mitigation commitments) will lack the incentive to adopt cleaner, but more expensive technolo-gies, leading to relatively low values of the spillover parameter (0.1-0.2 or even negative). Al-though there is some evidence that stringent climate policies in industrialised countries may in-duce cost-reducing abatement innovations in these countries (and, hence, reduce carbon leakage from these countries), little is known about the relative cost aspects and adoption rates of these innovations in developing countries. Therefore, although the analysis of Grubb et al. is quite il-lustrative with regard to the potential implications of spillover effects on global emissions, at present it lacks empirical validation and, hence, it may turn out to be too optimistic. Another limitation of the paper of Grubb et al. is that it is based on the critical (but unreal) as-sumption of no emissions trading between Annex I and non-Annex I countries, and that it does not consider the implications of this assumption. The major implication of this assumption, however, is that the costs (or GDP losses) to meet the Annex I mitigation target for the year 2100 will be rather high, notably because this target is rather stringent, while there is no oppor-tunity to meet this target by means of cheaper emissions reductions in non-Annex I regions through CDM-based trading. Allowing such trading (as agreed by the Kyoto protocol) would reduce these costs substantially. In addition, however, it would also imply that the impact of in-ternational technology spillovers on total, global emissions would be nullified as it would allow non-Annex I countries to sell their emission reductions - resulting from these spillovers - to An-nex I regions, which could subsequently raise their emissions accordingly. Hence, there seems to be a trade-off between the impact of emissions trading on total abatement costs and total emissions reductions (see also the discussion in Chapter 6 on emissions trading and global tech-nological spillovers).

Report 500036 002 (ECN-C--05-014) 77
B.4 Does climate policy induce technological change?
B.4.1 Introduction This chapter reviews some of the existing literature on energy and environmental policies in or-der to deal with the basic question whether climate policy induces technological change. More specifically, it addresses the following issues: • What is the empirical evidence with regard to the induced innovation and diffusion of
‘green’ technologies, i.e. technologies that are favourable to protecting the environment in general and to controlling global warming in particular (Section 4.2)?
• What are the major market imperfections and other factors affecting the inducement of tech-nological change (Section 4.3)?
• What are the major policy implications of the two issues mentioned above (Section 4.4)? Beforehand, it should be emphasized that the empirical literature on the evidence of induced technological change by climate policies as such is still extremely limited as these policies have only been introduced in Annex I countries over the past few years. Hence, this period has gener-ally been too short to observe and explore major examples of technological innovation and dif-fusion induced by climate policies. Therefore, in order to assess the potential role of climate policies versus other factors affecting technological innovation and diffusion, the scope of the literature review in this chapter will be focused on studies dealing with changes in similar (‘green’) technologies induced by similar policies or events over the past three decades such as environmental regulation, pollution abatement subsidies, energy saving measures or higher fuel prices due to either the oil shocks of the 1970s or higher energy taxes thereafter.47
B.4.2 Empirical analyses of induced changes in green technologies Induced innovation Empirical studies on the progress of green technologies have used a variety of proxy variables to explore the relationship between environmental policies and induced changes of these tech-nologies. For instance, in Lanjouw and Mody (1996), pollution abatement expenditures serve as a proxy for the stringency of environmental regulation while the rate of patenting in related technology fields is used as an indicator for induced innovation. By means of country-level data on these variables, they found a significant correlation across nations between environmental regulation and induced innovation of pollution abatement technologies. Similarly, Jaffe and Palmer (1997) explored the relationship between pollution abatement expenditures and indica-tors of innovation across industries, using US data. They found a significant correlation between these expenditures and the level of R&D spending, as indicated by the estimated elasticity of pollution control R&D with respect to pollution control expenditures of 0.15. However, when estimating the same relationship using patents as the indicator of innovation, they did not find an impact of pollution control expenditures on overall patenting. Other studies have used energy prices or related regulations as the mechanism of induced inno-vation, notably in the field of energy saving. Although the observed price changes might not be policy related, the results can also be applied to situations where policy affects prices, such as energy or carbon taxation. For instance, Newell et al. (1999) analysed the impact of both energy prices and energy saving regulations on technological innovations in energy efficiency of home appliances - such as air conditioners and gas water heaters - in the US over the period 1958-1993. They found that a substantial portion (estimated at 62 per cent) of the overall change in energy efficiency of these products could be associated with ‘autonomous’ factors rather than with ‘induced’ or ‘endogenous’ variables such as energy prices or regulations. Nevertheless, a 47 The sections below are based on review studies of the relevant literature by Jaffe et al. (2002, 2003 and 2004), and
Grubb et al. (1995 and 2002a), supplemented by other studies mentioned in the main text.
78 Report 500036 002 (ECN-C--05-014)
significant amount of innovation was still due to these endogenous variables, with energy prices accounting for the largest inducement effect (mainly because changes in energy prices induced both commercialisation of new models and elimination of old models, whereas regulations worked largely only through energy-inefficient models being dropped). Moreover, this effect of energy price increases on model substitution was particularly strong after product-labelling re-quirements became operative in the US. Indeed, simulations by Newell et al. (1999) suggest that the post-1973 energy price increases account for one-quarter to one-half of the observed im-provements in the mean energy efficiency of models offered for sale over the period 1973-93. Hence, besides autonomous factors, a significant amount of innovation in terms of enhancing energy efficiency of home appliances can be ascribed to endogenous variables, notably energy price increases combined with regulations to inform customers on the energy efficiency of dif-ferent models of these appliances. The relationship between energy prices and energy-selected innovation has been explored more broadly by Popp (2001, 2002, 2003a and 2004c; see also Chapter 5). He uses the number of suc-cessful US patents sorted by application date as an indicator of innovative activity. Perhaps the most striking result of this empirical work is the speed at which innovative activity responds to incentives. By correlating US data on energy prices and patenting activity for various energy technologies over the years 1970-93, he shows that innovation responds strongly and quickly to price incentives. For instance, following the first energy crisis of the early 1970s, the number of successful patents for solar energy (sorted by their application data) jumped from 10 in 1972 to 36 in 1973, 104 in 1974, 218 in 1975, and a peak of 367 patents in 1977 (Popp, 2002 and 2003a). This result suggests that part of the first wave of innovation after the energy crisis of the early 1970s was not due to new ideas being discovered, but rather the introduction of existing, technologically feasible ideas that may simply have been taken ‘off the shelf' and brought to market when the conditions were right. In addition, some other relevant findings of the empirical work of Popp on the relationship be-tween energy price and induced innovation include: • Estimates of the long-run elasticity of energy R&D with respect to changes in energy prices
suggests that the response is inelastic (i.e. 0.35)48. Hence higher energy prices (or similar policies that increase the cost of using fossil fuels) can be expected to stimulate new re-search on energy saving, although less than proportionally.
• There are diminishing returns to energy R&D within a given field of technological innova-tions. Although energy prices peaked in the early 1980s, patenting activity in energy-related technologies began to drop already during the late 1970s. Popp (2002 and 2003a) provides evidence that this decline can be explained by diminishing returns to R&D over time. Hence, the inducement effect of energy prices on technological innovation in a given field will fall over time (Popp, 2004c).
• In order to estimate the impact of technological innovations on energy use, Popp (2001) uses patent data to create stocks of knowledge of 13 energy intensive industries. He found that approximately one-third of the overall response of energy use to changes in energy prices is associated with induced innovation, with the remaining two-thirds associated with factor substitution, i.e. a movement along a given production function by substituting energy for other production factors such as capital or labour (see also Popp, 2003a as well as Jaffe et al. 2002).
Some qualifications, however, have to be added to the work of Popp (and other authors) with regard to the use of patent data as a proxy for innovative activity. In order to explore the in-ducement effect of (energy) prices or policies on innovative activity, ideally one would need de-tailed, reliable data on public and private R&D activities and the performance of these activities in generating specific (successful) innovations, including data on the importance of these inno-
48 As mentioned above, in a similar study, Jaffe and Palmer (1997) estimated a comparable elasticity of pollution
control R&D with respect to pollution control expenditures of 0.15.

Report 500036 002 (ECN-C--05-014) 79
vations in terms of potential or actual adoption rates and impact on, for instance, the average cost, energy or emission savings of a sector. As the present database is generally far away from this ideal situation, proxy variables have to be used as an indicator of innovative activity. Using patent data as an indicator of innovative activity offers some advantages (Popp, 2003a). Firstly, unlike more aggregate data on R&D expenditures, patents provide a detailed record of each invention. Moreover, economists have found that, to some degree, patent counts not only serve as a measure of innovative output, but are also indicative of the level of R&D activity it-self. In addition, patent data are available from many different countries and can be used to ex-amine levels of innovative activity across countries or to track patterns of diffusion. Finally, when a patent is granted, it contains citations to earlier patents that are related to the current in-vention. As a result, the previous patents cited by a new patent should be a good indicator of previous knowledge that was utilized by the inventor.49 On the other hand, using patent data has some limitations (Popp, 2002 and 2003a; Schmitz, 2001). Firstly, the quality or importance of individual patents varies widely. Some inventions are extremely valuable, whereas others are of hardly any value in terms of commercial success or output performance, including energy or emission savings. Hence, a peak of patenting activ-ity in a certain year following a price hike may represent a large number of minor, hardly valu-able innovations (‘taken from the shelf’), while a trough of such activities five years later may contain a major, time-consuming breakthrough. Secondly, another limitation is that not all successful R&D results are patented. In return for re-ceiving a patent, the inventor is required to publicly disclose the invention. Rather than make this disclosure, firms may prefer to keep an invention secret in order to avoid other firms ‘in-venting around’ the new technology or, secondly, to prevent the product from being copied once the exclusive property rights expire (Popp 2003a and Schmitz, 2001). Finally, a related limitation or difficulty of using patent data is that the ‘propensity to patent’ - and, hence, the correlation between R&D and patenting activity - varies significantly amongst technological fields and industries as well as over time. These variations can be due to different and changing patenting laws, patenting costs (compared to potential patent revenues) and the degree of ‘R&D opportunities’ in the surrounding scientific network (Schmitz, 2001, Popp, 2002). Therefore, because of these limitations, patent (or similar) data as an indicator of innova-tive activity have to be used with due care. Another qualification to the work of Popp is offered by Schmitz (2001) who also uses patent data to estimate the effect of energy prices on energy-efficient innovations. In contrast to Popp, however, Schmitz found that energy prices had no significant positive impact on innovative ac-tivity as measured by patents. To some degree, this difference in outcome can be attributed to differences in data and methodologies used. More interestingly, however, is that Schmitz did find a significant positive relation between innovative activity and energy taxes (expressed as the ratio of taxes in energy prices). According to Schmitz, this result points to the importance of taxes in price signals as one might regard the tax ratio as an indicator of public concern about ecological problems related to energy consumption. Hence, following this interpretation, the tax ratio is a better indicator of real expectations than mere prices since price movements may be regarded as temporary, whereas energy taxes can normally be expected to be of a more perma-nent nature. Therefore, perhaps, the most important result of Schmitz (2001) - and qualification of Popp (2002) - is that, if energy shows any price increases, then only long-term predictable ones have a significant impact on major innovations, which support a credible tax policy such as the ‘eco-taxation’ of energy use in several European countries.
49 Interestingly, Popp (2003a) mentions a study on citations made to NASA patents, which concludes that aggregate
citation patters represent knowledge spillovers.

80 Report 500036 002 (ECN-C--05-014)
Up to now, the studies considered above have all explored the link between innovative activity and variables such as energy prices or environmental policies, which are either directly or indi-rectly related to and comparable with climate policies. As mentioned in Section 1, the empirical literature on the evidence of induced technological change by climate policies as such is still ex-tremely limited as these policies have only been introduced in Annex I countries over the past few years. A noticeable exception is the study of Christiansen (2001), who assesses the impact of Norwegian carbon taxes - the key instrument in Norway’s climate policy - on technological innovation in the petroleum sector. The balance of evidence suggests that the imposition of car-bon taxes has provided some incentive for innovation that has shifted upstream petroleum op-erations in a less emission-intensive direction. The pattern of technological change pertains mostly to small, incremental process innovations, cumulative improvements, and adaptations of technologies already available, such as technologies to reduce and eliminate flaring. In addition a few examples of more radical innovations encouraged by carbon taxation are mentioned by Christiansen (2001), notably the application of carbon capture and storage technologies in oil and gas production. Induced diffusion In the field of pollution abatement and energy efficiency, there are several empirical studies on the inducement effect of environmental policies or energy prices on the diffusion of ‘green’ technologies.50 For instance, US studies on the reduction of SO2 emissions or the elimination of lead in gasoline show that the introduction of a tradable permit system has provided a strong in-centive for the diffusion and adoption of cost-effective technologies to deal with these environ-mental issues. Other studies have found a positive effect of fuel price increases on the adoption of new fuel-saving technologies in the transport sector, the power-generating sector and the energy-intensive industrial sectors. A similar, although often less strong effect has been found in the residential sector with regard to the diffusion of energy-saving appliances and thermal insulation technolo-gies. In general, the adoption of these residential technologies turns out to be more sensitive to the level or changes of the up-front installation costs than the level or changes of energy prices and other longer-term operational expenditures. This indicates that subsidies on installation costs may be more effective than ‘equivalent’ energy taxes in encouraging technology diffusion in the residential sector (Jaffe et al., 2002; see also Section 4.4 below). In addition, there is a lot of empirical evidence on the positive inducement effect of market or price policies on the diffusion of green technologies, notably renewable energy technologies. For instance, turbines for generating wind power have been adopted widely over the past 15 years in countries such as Denmark, Germany and Spain owing to a favourable policy package, including ‘eco-taxation’ of fossil fuel-generated electricity and/or supportive measures for wind-generated electricity such as granting subsidies or relatively high feed-in tariffs (Sijm, 2002; Lako 2004). On the other hand, studies that have explored the inducement effect of command-and-control instruments on technology diffusion have shown ambiguous results depending on the stringency of these instruments, including the differentiation of this stringency among old versus new sources of environmental pollution. In the US, some standards - for instance, on automobile fuel use - have been very effective, whereas others - for instance, on state building codes - have shown no discernable effect as they were hardly binding relative to existing standards of typical practice. In some cases, notably when pollution abatement regulations have been set more strin-gent for new sources than for existing ones, these regulations have even exerted a negative im-pact on the diffusion of new, green technologies by encouraging firms to postpone the retire-
50 For a review of these studies see Grubb et al. (2002a) and, particularly, the publications of Jaffe et al. (2002, 2003
and 2004).

Report 500036 002 (ECN-C--05-014) 81
ment of older, dirtier installations (see Jaffe et al., 2002, 2003 and 2004 for a review of these studies). At the international level, there are hardly any studies on diffusion of green technologies (let alone on the international diffusion of technologies induced by climate policies). A major ex-ception is offered by Lanjouw and Mody (1996), who show that green technologies have indeed diffused from developed to developing countries in three ways, i.e. through (i) imports of tech-nologies embodied in pollution abatement or energy saving equipments, (ii) imports of disem-bodied environmental technology, i.e. foreign patents registered and used in developing coun-tries, and (iii) development of domestic patents geared towards adapting imported technology to local conditions. In addition, a few other available studies have provided some examples of the international dif-fusion of green technologies, including (a) the development of more fuel efficient cars in Japan in response to the oil price shocks and, subsequently, the diffusion of these cars to foreign mar-kets, (b) the diffusion of more fuel-efficient, steel-making technologies among developed and developing countries, and (c) the international diffusion of bio-energy and other renewable en-ergy technologies, for instance wind turbines from Denmark to other countries, encouraged by the learning effects and resulting decreases in specific investment costs of these technologies owing to the expansion of the (domestic) installed capacity of these technologies (see Grubb et al., 1995 and 2002b, as well as the companion papers of the spillover project, notably Oikono-mou et al., 2004; Annevelink et al., 2004, and Lako, 2004). To conclude, there is ample empirical evidence on the inducement effect of policies and prices on the innovation and diffusion of ‘green’ technologies to support the hypothesis that (future, stringent) climate policy will indeed induce technological change. The available evidence, how-ever, seems to be less ambiguous with regard to the induced diffusion of green technologies than to their induced innovation, notably of major, fundamental breakthroughs (compared to the evidence on a variety of minor, commercial applications of induced innovations). Moreover, the performance of induced technological change seems to depend not only on the choice (and stringency) of alternative policy instruments but also on a variety of other factors, such as the prevalence of market imperfections, which will be discussed further in the sections below.
B.4.3 Market imperfections and green technologies Introduction A fundamental aspect of environmental issues such as climate change is that when it comes to developing and diffusing technologies to address these issues, there are basically two mutually reinforcing sets of market imperfections at work, which make it very likely that the rate of in-vestment in the development and diffusion of such technologies is less than would be socially optimal (Jaffe et al., 2004). The first set of market imperfections concerns the existence of so-called ‘environmental externalities’, while the second set refers to the prevalence of market fail-ures and other, related factors that inhibit the socially optimal development and diffusion of technologies to address environmental issues such as climate change. While the present section will briefly outline these two sets of market imperfections, the subsequent section will discuss the policy implications of the prevalence of these imperfections for the optimal inducement of these green technologies. Environmental externalities An economic or social activity may have a harmful consequence on the environment, which is borne (at least in part) by a party or parties other than the party who controls this activity. In the

82 Report 500036 002 (ECN-C--05-014)
field of environmental economics, such a consequence is usually denoted as a negative ‘external effect’ or ‘externality’.51 For instance, a firm or car that pollutes the air without bearing the full consequences or costs of this negative impact on the environment causes an externality. As the firm or car owner does not have an economic incentive to minimize the ‘external’ costs of this pollution (by restricting or changing its underlying activity), the market - i.e. Adam Smith’s ‘invisible hand’ - allows too much of it and, hence, does not operate to produce an outcome that is socially desirable. There-fore, such an environmental externality is an example of a so-called ‘market failure’ or ‘market imperfection’. At their core, all environmental policy interventions are designed to deal with the above-mentioned externality problem, either by internalising environmental costs so that polluters will make socially efficient decisions regarding their consumption of environmental inputs (for in-stance, by eco-taxing these inputs), or by imposing a level of environmental pollution that pol-icy makers believe to be more socially efficient than that otherwise chosen by firms or car own-ers (for instance, by imposing an emission cap or pollution standard). A socially efficient envi-ronmental policy requires, firstly, the comparison of the marginal cost of reducing pollution with the marginal benefit of a cleaner environment and, subsequently, the abatement of this pol-lution as far as at its marginal cost is lower or equal to its marginal benefit (Jaffe et al., 2004). Market imperfections regarding technological change New, green technologies improve the terms of the trade-off between the marginal costs of pollu-tion abatement and its social benefits. This means that not only a specific level of pollution abatement can be achieved at lower costs to society but also that it will be more efficient to en-hance this level than would be efficient if pollution abatement were more expensive (Jaffe et al., 2004). On the other hand, it also implies that environmental policy interventions will have two effects: they reduce pollution by addressing the environmental externality problem explained above, while they also change the incentives to develop and adopt new technologies to reduce pollution by changing the environmental cost/benefit ratio. Hence a socially efficient environ-mental policy requires not only the weighing of the static costs and benefits of reducing pollu-tion but also the consideration of the dynamic interaction between environmental policy and in-duced technological change. Technological change, however, is not itself free, but costly as both innovation and diffu-sion/adoption of new technologies demand the investment of resources, for instance to conduct R&D and to purchase, adapt and learn about new technologies (compared to using available, cheaper but dirtier technologies). Therefore, a socially efficient technology policy requires, first of all, the comparison of the marginal cost of technological change with its marginal benefits and, subsequently, the promotion of technological change as far as its marginal cost is lower or equal to its marginal benefits. This raises the question whether the market or ‘invisible hand’ will choose the optimal level of investment in the process of technological change (or whether technology policy interventions can, in principle, be justified on social efficiency grounds). It turns out that, independent of the prevalence of environmental externalities, both the innovation and diffusion of technology are characterised by a variety of market imperfections. More specifically, the most important mar-ket failures with regard to technological innovation include (Parry, 2001; Grubb and Ulph, 2002; and Jaffe et al., 2002, 2003 and 2004): • Knowledge externalities or spillover effects. As explained in Section 2.2, this category of
market imperfections refers to the fact that, due to the high public-good character of knowl-
51 More generally, Jaffe et al. (2004) define an externality as 'an economically significant effect of an activity, the
consequences of which are borne (at least in part) by a party or parties other than the party who controls the exter-nality-producing activity'.

Report 500036 002 (ECN-C--05-014) 83
edge, a private firm may be unable to fully appropriate the social benefits of investments in R&D, leading to underinvestment in technological innovation by the private sector, relative to the social optimum. Hence, whereas a social or economic activity creates usually a nega-tive environmental externality - of which the market allows too much - investments in R&D and technological innovation generally creates a positive externality, of which the invisible hand produces too little.
• Capital market failure. Investments in R&D are characterised by large risks and uncertain-ties due to the wide and specific variation of their expected returns (i.e. often low-profitability but high-value outcomes). In addition, the asset produced by the R&D invest-ment process is specialised, sunk and intangible, so that it cannot be mortgaged or used as collateral. This combination of great uncertainty and intangible outcomes makes financing of R&D through capital market mechanisms more difficult than for traditional investment. The difficulty of securing financing for research from outside sources may lead to under-investment in R&D, particularly for small firms that have less internally generated cash and/or less access to financial markets (Jaffe et al., 2003).
• Rent-stealing or ‘common-pool’ effects. This category refers to the problem that a firm may not take into account that its investments in R&D may reduce the potential rents of a pat-entable innovation of other firms investing in similar R&D. This problem is analogous to the over-exploitation of a fishery: individual fishermen do not take into account their effect on depleting the stock of fish and hence reducing the expected catch of other fishermen (Parry, 2001). The prevalence of this ‘rent-stealing’ or ‘common-pool’ effect may result in an over-investment in R&D. Overall, the empirical evidence suggests that the rent-stealing effect is dominated by the two other categories of market imperfections, notably by the positive spillover effect, leading to social rates of return to R&D that are substantially higher than the private rates of return (Griliches, 1992; Parry, 2001). Hence, in order to optimise social effi-ciency, there seems to be scope for policy interventions to encourage technological innova-tions (see Section 4.4 below).
In addition, there are some market imperfections with regard to the diffusion and adoption of new technologies. These imperfections are due to the following causes (Jaffe et al., 2002, 2003 and 2004): • Inadequate information. Information plays a particularly important role in the diffusion and
adoption of technologies. Firstly, information is a public good that may be expected in gen-eral to be underprovided by markets. Secondly, to the extent that the adoption of technology by some users is itself an important mode of information transfer to other parties, adoption creates a positive externality and is therefore likely to proceed at a socially sub optimal rate.
• Agency problems. Related to inadequate information are so-called agency problems that can inhibit the adoption of superior technology. An example of an external agency problem would be a landlord/tenant relationship, in which a tenant pays for utilities, but the landlord makes decisions regarding which applications to purchase.52 Internal agency problems can arise in organisations where the individual or department responsible for equipment pur-chase or maintenance differs from the individual or department whose budget covers utility costs. Agency problems are probably also part of the basis for the hypothesis that energy-saving investments are ignored simply because energy is too small a fraction of overall costs to justify management attention and decision-making (Jaffe et al., 2003).
• Risk and uncertainty. The expected returns of adopting new technologies are risky and un-certain. This uncertainty about future returns means that there is an ‘option value’ associated with postponing the adoption of new technology (Jaffe et al., 2002; Mulder, 2003). The prevalence of risks and uncertainties may also explain why purchasers of energy efficiency
52 For instance, a builder or landlord chooses the level of investment in energy efficiency in a building, but the energy
bills are paid by a later purchaser or tenant. If the purchaser has incomplete information about the magnitude of the resulting energy savings, the builder or landlord may not be able to recover the cost of such investments, and hence might not undertake them (Jaffe et al., 2004).

84 Report 500036 002 (ECN-C--05-014)
technologies appear to use relatively high discount rates in evaluating these technologies (which may further slow down their diffusion and adoption).
• Capital market imperfections. Adoption of new technologies with significant capital costs may be constrained by inadequate access to financing, notably for households and small firms. And in some countries, lack of foreign exchange or other important barriers may in-hibit the adoption of embodied/disembodied technology from other countries.
• Adoption externalities. For a number of reasons, the cost or value of a new technology to one user may depend on how many other users have adopted the technology. In general, us-ers will be better off the more people use the same technology. This benefit associated with the overall scale of technology adoption is sometimes referred to as ‘dynamic increasing re-turns’ (Jaffe et al., 2004). These returns can be generated by learning-by-using, learning-by-doing or network externalities. ‘Learning-by-using’ refers to the phenomena that an adopter of a new technology creates a positive externality for others, in the form of the generation of information about the existence, characteristics and the successfulness of the new technol-ogy. The supply-side counterpart, ‘learning-by-doing’, describes how production costs tend to fall as manufacturers gain production experience (see Chapter 6). If this learning spills over to benefit other manufacturers it can represent an additional adoption externality. Fi-nally, ‘network externalities’ exist if a product is technologically more valuable to an indi-vidual user as other users adopt a compatible product (for example, telephone and computer networks). Altogether, the prevalence of adoption externalities and dynamic increasing re-turns with regard to the adoption of a particular technology or system may result in a ‘lock-in’ or ‘path dependency’ of such technology or system, meaning that once a particular stan-dard has been chosen, the barriers of switching to another one may be prohibitively high (Jaffe et al., 2003). It should be noted, however, that increasing returns and technology lock-in do not necessarily imply market imperfections, leading to social inefficiencies. In cases where they may, the question becomes which policy interventions, if any, can reduce such inefficiencies (see Section 4.4 below).
The prevalence of market imperfections may explain certain characteristics of the diffusion of new technologies, which may be insightful for policy makers and analysts interested in under-standing and optimising (induced) technological change. For instance, a major characteristic of the adoption process of new energy-saving technologies is that these technologies often diffuse slowly although they are efficient at current prices (the so-called ‘energy efficiency paradox’). This paradox can be explained by the prevalence of market imperfections - inadequate informa-tion, uncertainties, agency problems, etc. - together with the incidence of adjustment costs or other factors. For instance, a major additional factor to explain the energy efficiency paradox is the so-called ‘complementary effect’ (Mulder, 2003; Mulder et al., 2003). This effect refers to the fact that different technologies to produce a similar product (e.g. electricity or steel) may not only differ with regard to their energy efficiency but also to other qualities such as differences in variable versus fixed cost structures, flexibility with respect to inputs (different technologies use different types of fuels or raw materials), or required managerial and organisational skills. Be-cause of this variety in different qualities, it may be beneficial to use several (both old and new) technologies next to each other to produce a similar product. Hence, beside the incidence of market imperfections, this complementarity effect may offer an additional explanation for the energy efficiency paradox as many new technologies pass through a life cycle, in which they initially complement older technologies, and only subsequently (and often slowly) substitute for older technologies (Mulder et al., 2003). This specific explanation of the slow diffusion of energy saving technologies leads to a more general qualification to the factors affecting the process of (induced) technological change in the field of energy/environmental policies. Besides the interaction between market imperfections and inducement factors - including (environmental) policies, (energy) prices, relative factor scarcities and market expectations - the process of technological change may be influenced by a variety of other factors such as the size of the market for new technologies, the available set of technological opportunities to be exploited, the role of technological networks and vested inter-
Report 500036 002 (ECN-C--05-014) 85
ests, or the achievement of other objectives besides profit or welfare maximisation (Criqui et al., 2000; Luiten, 2001). These factors have to be accounted for when considering the policy impli-cations of the interaction between market imperfections and inducement factors for the process of technological change in addressing environmental issues such as controlling global warming (see Section 4.4 below as well as similar sections on policy implications in Chapter 5 and 6).
B.4.4 Policy issues Based on the findings of the previous sections, some policy issues will be indicated briefly be-low, while some of these issues will be discussed further in Chapters 5 and 6. A major finding of the sections above is that the available evidence on induced technological change by environmental policies and/or higher energy prices seems to support the hypothesis that (future, stringent) climate policy will encourage the innovation and diffusion of new tech-nologies that will address the issue of controlling global warming in a more cost-effective way. Some qualifications, however, can be added to this general finding. Firstly, the impact of climate policies on the promotion of emission abatement technologies will vary depending on the time period and type of technological change considered. For instance, in the short term this impact will most likely be higher on R&D investments in commercial appli-cations and diffusion of minor, specific innovations that are already largely available (‘lying on the shelf’) than on general, major innovative breakthroughs (which may take a long-term set of incentives, including a supportive package of technological and climate policies). Secondly, climate policy may not only induce technological change but, in turn, the innovation and diffusion of more cost-effective abatement technologies may affect the optimal target, tim-ing and/or instrument choice of climate policy. For instance, while some instruments - com-pared to others - may be more efficient in controlling global warming in a dynamic than static sense, owing to this dynamic efficiency it may be beneficial to postpone abatement actions or to set a higher abatement target for a certain period. Thirdly, although climate policy may induce abatement technologies that are more cost-effective, that does not necessarily imply that the costs of this policy are lower, depending on the definition of ‘costs’ and whether the abatement target is fixed or not. For instance, if the abatement target is based optimally on cost-benefit considerations, technological change may lead to a more stringent climate policy and, hence, to higher marginal and/or gross total abate-ment costs, whereas net costs - i.e. after subtracting social environmental benefits of abatement - will generally, be lower, depending on the slope of the marginal cost-benefit curves of emission abatement. But even if the abatement target is fixed, induced technological change is not neces-sarily welfare improving due to the potential adverse effects of climate policies on (i) the alloca-tion of R&D resources to other types of technological change (‘crowding-out effect’) and (ii) the turnover of emission-intensive industries, which may reduce their R&D budgets and, hence, their future productivity (notably when R&D budgets are determined as a fixed percentage of output and hardly responsive to changes in climate policies). Therefore, although the available evidence points to substantial scope for induced technological change at the level of individual sectors or technologies, the implications of this finding for the macroeconomic cost of climate policy remains unclear (see Sue Wing, 2003, and other studies discussed in Chapter 5). Fourthly, the fact that climate policy will induce technological change does not say anything about which (mix of) instruments will be more or less cost-effective to do so. Actually, climate policy may consist of a variety of instruments, usually distinguished between (i) ‘market-based instruments’ such as taxes, subsidies, tradable permits, and some types of information pro-grammes, and (ii) ‘command-and-control’ regulations notably technology- or performance stan-dard for production or end-use purposes. Although there seems to some (theoretical) evidence and consensus among several scientists - particularly economists - that, in general, market-based

86 Report 500036 002 (ECN-C--05-014)
policy instruments are more efficient than command-and-control regulations (not only from a static but also a dynamic point of view), this consensus has been contended by other scientist. Moreover, there seems to be even less empirical evidence and consensus with regard to the dy-namic efficiency of market-based instruments, including the ‘ranking’ of these instruments (i.e. which instrument is most efficient, second best, third best, etc.), or the optimal mix of climate policy instruments to achieve an abatement target most efficiently from both a static and dy-namic point of view.53 A final, but perhaps most important qualification is that, while climate policy may induce tech-nological change, the impact of climate policy alone will be far from optimal as the innovation and diffusion of green technologies is generally faced by two related sets of market imperfec-tions (Grubb and Ulph, 2002; Golombek and Hoel (2003); Jaffe et al., 2004). While climate pol-icy may stimulate new technology as a side effect of internalising the costs of the environmental externality (i.e. the greenhouse effect), it does not address explicitly the other set of market im-perfections directly related to technological change (such as the incidence of spillover effects and adoption externalities). On the other hand, simply relying on the promotion of technological change by technology policy alone is not enough as there must be a long-term, predictable and credible incentive in place that encourages the process of technological change to occur actually (Popp, 2002 and 2004c; Schmitz, 2001). Moreover, as shown recently by Buchner and Carraro (2004), international technological cooperation – without any commitment to emissions control – may not lead to a sufficient abatement of greenhouse gas concentrations. Therefore, a bal-anced set of climate and technology policies is necessary to promote the innovation and diffu-sion of emission abatement technologies and, hence, to address the issue of global warming in an optimal way. More specifically, in order to stimulate the innovation of new technologies, a government can use several R&D policy instruments of which the performance can vary widely, depending on the specific incidence and relative importance of market imperfections or other constraints to promote innovation. These instruments and their performance include: • Granting patents. In theory, this instrument can deal effectively with the problem of imper-
fect appropriability of R&D by offering exclusive property rights to private innovators. In practice, however, the effectiveness of the patent system is often limited either because other firms can invent around the patent by developing their own imitations or because innovators prefer not to patent in order to avoid the disclosure of patent information to rival firms. On average, innovators appear to appropriate very roughly 50 percent of the full social benefit from new technologies (Griliches, 1992; Parry, 2001).54
• Subsidising R&D ex ante, through research tax credits or research contracts to private or (semi-) public institutions, or awarding prizes ex post for new technologies. If there were no uncertainties over the costs and benefits of R&D, the optimal amount of R&D could be in-duced by one of these instruments. In practice, however, there is usually a situation of asymmetric information as firms know more about the costs and benefits of their own R&D than the government. As a result, by using one of these instruments, the government may pay too much or too little and, hence, encourage R&D too much or too little. If asymmetric information is the most important market imperfection, a patent system can be preferable on efficiency grounds, while research contracts and prizes may be more efficient if imperfect appropriability is a more important problem (Parry, 2001). Moreover, besides the problem of asymmetric information, other potential disadvantages of subsidizing R&D are (i) the danger of ‘picking a winner’ and becoming ‘locked-in’ an inefficient technology system, (ii) the use of scarce public resources, and (iii) the opportunity of technological spillovers to
53 For a review of studies on the dynamic efficiency of instrument choice in the field of environmental policies, see
Jaffe et al. (2002, 2003 and 2004), as well as Parry (2001), Popp (2003a and 2003b), Stavins (2002), Driessen (2003), and Philibert (2003).
54 Another disadvantage of patents is that they may discourage the diffusion of new technologies, including the spill-over effects to other countries.

Report 500036 002 (ECN-C--05-014) 87
other countries (which requires international cooperation of national R&D support in other to reduce this effect).
• Encouraging joint research ventures among firms, for instance, by removing the threat of anti-trust prosecutions if firms openly collude over research strategies (rather than pricing strategies). To some extent, this would allow firms to internalise technology spillovers. However, joint research ventures may not be feasible when a large number of firms can benefit from new technologies (Parry, 2001; Grubb and Ulph, 2002).
• Subsidizing education and training of scientists and engineers in appropriate areas. This in-strument can be particularly effective if the supply of appropriately trained scientists and engineers is relatively inelastic in the short run, thereby avoiding the danger that any in-creased expenditure on R&D in a given area will be at least partly consumed by an increase in wages rather than going to more research effort (Jaffe et al., 2003). Besides demanding scarce public resources, however, this instrument does not address the problem of imperfect appropriability or other imperfections in the R&D market.
To conclude, a variety of R&D policy instruments may be used to promote technological inno-vations cost-effectively. However, although the optimal mix of these instruments may depend on country- and technology-specific situations, unfortunately limited evidence is available to determine this policy mix in practice. In addition, a government can use a variety of policy instruments to promote the diffusion and adoption of new technologies, including: • Providing information, including technology demonstration and deployment. This instru-
ment will be most appropriate to promote technologies that appear cost-effective, but are not yet widely used due to imperfect information. On the other hand, it will be hardly appropri-ate to deal with other market imperfections.
• Setting command-and-control regulations. If implemented at an appropriate level, setting technology- or performance standards for production or end-use purposes may be very ef-fective to force the diffusion of particular technologies, if only by removing ‘inferior’ tech-nologies from the market (Jaffe et al., 2004). However, if set too low, they may be hardly binding, whereas if set too stringent, they may become very expensive and inefficient (in-cluding the danger of ‘carbon leakage’ or other forms of plant closure and relocation).
• Subsidizing the adoption of green technologies (or taxing competing ‘dirty’ technologies). This instrument may be very appropriate to encourage the adoption of green technologies that at present are more expensive then competing ‘dirty’ technologies (or face up-front capital constraints), especially if these green technologies show major learning effects and resulting cost reductions to ‘break-even’ points within an acceptable time period. However, similar to subsidizing R&D (as discussed above), it raises some problems, notably (i) the danger of ‘picking a winner’ and becoming ‘locked-in’ a certain technology system, (ii) the scarcity of public resources, including the problem of a low efficiency of public expendi-tures to subsidize the purchase of a new technology since customers who would have pur-chased the technology even in the absence of the subsidy still receive it, and (iii) the prob-lem that learning effects and the resulting cost reductions of deploying new technologies may spill over to other countries even if they have not contributed to finance the support of adopting and deploying new technologies. The first problem of ‘picking a winner’ can be reduced by means of a ‘technology neutral’ policy of portfolio diversification that supports a wide cluster of related technologies, but such a policy may be either very expensive or hardly effective, while sacrificing the increasing returns by focusing on a small number of technologies. The second ‘fiscal’ problem can be resolved by taxing dirty technologies (rather than subsiding green technologies), but such a policy may harm industrial competi-tiveness or social equity and, hence, it may be politically hard to accept. Finally, the ‘spill-over problem’ may be reduced by international coordination of supporting the diffusion of green technologies, but such a policy may be time-consuming and hard to realize in practice.

88 Report 500036 002 (ECN-C--05-014)
• Purchasing new technologies by the government itself. As the government (and, more gen-erally, the public sector as a whole) is a very large landlord, vehicle operator and user of many other kinds of equipment, its decision to purchase certain technologies for its own use could have a significant effect on the rate of diffusion of that technology through the crea-tion of niche markets and the achievement of any associated benefits of dynamic increasing returns (Jaffe et al., 2004). However, as purchasing new technologies at high market prices - compared to those of existing technologies - is similar to subsidizing the adoption of these technologies, it raises similar problems as discussed above.
The discussion above on the technology policy instruments to encourage the innovation and dif-fusion of technologies to control global warming raises the question whether a specific technol-ogy policy in the field of climate change can be justified once the external costs of the green-house effect have been fully internalised by climate policy alone, e.g. by means of emissions trading or taxing, thereby meeting the overall abatement target. In theory, such a specific tech-nology policy is hard to justify as the greenhouse externality will be fully addressed by climate policy alone (with a ‘spillover’ or ‘side-effect’ on technological change) and, hence, only gen-eral technology policies and instruments can be justified to deal with the other, remaining set of potential market imperfections in the field of technological change. In practice, however, some specific technology policies or instruments in the field of climate change may still be justified if this field is characterized by the incidence of specific market imperfections (compared to other fields of technology interests, for instance the prevalence of specific forms of imperfect infor-mation or specific uncertainties due to the long-term, international character of controlling global warming). In addition, specific technology policies in the field of climate change may be justified - or even necessary - due to a lack of public resources, which raises the need to set pri-orities with regard to the ex ante subsidization of technological innovation and diffusion. More-over, some specific technologies - for instance solar PV or wind power - may be encouraged for a variety of other reasons besides controlling global warming. Hence, even if the abatement tar-get is fully met by climate policy alone, the innovation and diffusion of these technologies may still be continued, justified by other policy considerations. Some of the policy issues outlined above, including their policy implications, will be discussed further in Chapter 5 and 6 below, dealing with an assessment of induced technological change in top-down and bottom-up approaches of climate policy modelling, respectively.

Report 500036 002 (ECN-C--05-014) 89
B.5 Induced technological change and spillovers in top-down approaches of climate policy modelling
B.5.1 Introduction As outlined in Chapter 2, top-down models are general macroeconomic models that analyse the economy - including the energy system - in highly aggregated terms, with hardly any detail on energy or mitigation technologies at the sector level. Such models are particularly suitable for analysing macroeconomic effects of climate policies, including the interactions and feedback effects at the intersectoral, (inter)national, regional or global level. Over the past decade, in-duced technological change has been incorporated in these models, particularly by linking the accumulation of knowledge and experience to changes in climate policy. This chapter will assess the performance of some major top-down models with regard to en-dogenising technological change and the implications for CO2 abatement policies. Section 5.2 will first of all review the performance of individual studies using such models. Subsequently, Section 5.3 will compare and evaluate the performance of these studies. Finally, Section 5.4 will discuss some lessons and implications following from the assessment in this chapter.
B.5.2 A review of top-down studies Goulder and Mathai (2000) A comprehensive and pioneering study in the field of analysing the impact of induced techno-logical change (ITC) on climate policy is the work of Goulder and Mathai (2000). Their study employs analytical and numerical simulation models to explore the implications of ITC for the optimal design of CO2 abatement policies, notably for the design of optimal abatement and car-bon tax profiles (i.e. the timing and level of carbon taxes and abatement). Goulder and Mathai derive these profiles under different model specifications for the channels through which knowl-edge is accumulated (both R&D and LBD) and under two different policy optimisation criteria: the cost-effectiveness criterion of obtaining by a specified date and thereafter maintaining, at minimum cost, a given target for the atmospheric CO2 concentration; and the benefit-cost crite-rion, under which they also choose the optimal concentration target, thus obtaining the benefits from avoided climate damages net of abatement costs.55 In order to design the optimal CO2 abatement policies, Goulder and Mathai develop a simple (partial) ‘cost-function’ model in which a central planner decides on the optimal carbon tax and abatement patterns to minimise the discounted costs of abatement and knowledge investment subject to a carbon concentration constraint (Weyant and Olavson, 1999). ITC is incorporated in the abatement cost function (C) that depends on the level of abatement (A) and the stock of knowledge (H). As noted, the accumulation of knowledge may be either R&D of LBD based. In the first case, the evolution of the knowledge stock is a function of R&D investments, whereas in the second case it is a function of the level of abatement. While knowledge accumulation is costly in the R&D-based case, it is free in the LBD-based representation (Goulder and Mathai, 2000; Löschel, 2002). The analytical model results of Goulder and Mathai reveal that the presence of ITC generally implies a lower time profile of optimal carbon taxes, i.e. compared to a situation with no ITC, the level of carbon taxation over a certain time path to meet the abatement target is generally lower.56 The impact of ITC on the optimal abatement path varies, depending on the channel of
55 This is equivalent to minimizing the sum of abatement costs and CO2-related damages to the environment (Goulder
and Mathai, 2000). 56 However, under the benefit-cost criterion, this result depends on the assumption of a convex damage function in
the atmospheric CO2 concentration (which Goulder and Mathai think most reasonable). If this function is assumed to be concave, the opposite result could be true in a benefit-cost setting.

90 Report 500036 002 (ECN-C--05-014)
knowledge accumulation. When knowledge is gained through R&D investments, ITC makes it preferable to shift some abatement from the present to the future. The reason is that ITC lowers the costs of future abatement relative to current abatement, making it more cost-effective to place more emphasis on future abatement. However, when the channel for knowledge accumu-lation is LBD, the timing of abatement is analytically ambiguous. On the one hand, ITC makes future abatement less costly but, on the other hand, there is an added value effect to current abatement because such abatement contributes to LBD and helps reduce the costs of future abatement. Which of these two opposing effects dominates, depends on the specification (and underlying assumption) of the knowledge accumulation function (Goulder and Mathai, 2000; IPCC, 2001). If the LBD effect is strong enough, initial abatement rises (which in fact happens in most of the numerical simulations presented by Goulder and Mathai). When the government (i.e. the central planner) employs the benefit-cost policy criterion, the presence of ITC justifies greater overall (cumulative) abatement than would be warranted in its absence. This does not imply, however, that ITC encourages more abatement in every period. When knowledge accumulation results from R&D expenditures, the presence of ITC implies a reduction of near-term abatement, despite the overall increase in the scale of abatement over time. The illustrative numerical simulations of Goulder and Mathai reinforce the qualitative predic-tions of their analytical model. The quantitative impact of ITC depends critically on whether the government is adopting the cost-effectiveness criterion or the benefit-cost criterion. This impact on overall abatement costs and optimal carbon taxes can be quite large in a cost-effectiveness setting but typically is much smaller under a benefit-cost criterion. This weak effect on the tax rate in the benefit-cost setting reflects the relatively trivial impact of ITC on optimal CO2 con-centrations, associated marginal damages, and (hence) the optimal tax rate (Goulder and Mathai, 2000). As for the optimal abatement path, the impact of ITC on the timing of abatement is very weak, but the effect on cumulative abatement over time (applicable in the benefit-cost case) can be very large, particularly when knowledge is accumulated via LBD. Although the work of Goulder and Mathai offers some valuable contributions and useful in-sights with regard to the analysis of the ITC impact on climate policy, it suffers from some limi-tations. As indicated by sensitivity analyses, the outcomes of their analytical and numerical simulation models depend highly on the specification, the parameterisation and the underlying assumptions of some critical functions such as the abatement cost function, the CO2 concentra-tion damage function and the knowledge accumulation function. Goulder and Mathai assume that these model functions are perfectly known and that knowledge accumulation and techno-logical change are deterministic processes. Actually, however, these functions and processes are highly uncertain (which affects the policy outcomes of ITC). Moreover, the empirical database for the parameterisation and calibration of these model functions is still very weak. Another major limitation of the model study of Goulder and Mathai concerns the assumed pres-ence of a central planner, i.e. a single agent who actually represents a single source (a firm, a sector or a region) of CO2 emissions, abatement, knowledge accumulation and technological change. As a result, this type of model studies sidesteps the possibility of technological spill-overs and related issues such as the problem of R&D appropriability and lack of R&D invest-ment incentives.57 Similarly, as the model of Goulder and Mathai examines only a sole policy instrument available to the central planner (i.e. a tax on CO2 emissions), it does not explore the
57 Goulder and Mathai acknowledge that they disregard the market failure associated with knowledge spillovers, i.e.
the inability of firms to appropriate the full social returns on their investments in knowledge (Goulder and Mathai, 2000, page 4, note 6). Nevertheless, on page 29 of their paper they discuss the sensitivity of a variable that governs the intertemporal knowledge spillovers. This latter term refers to the question whether knowledge accumulation to-day makes future accumulation easier (‘standing-on-shoulders’) or more difficult (‘fished-out’ pool). However, these are not real knowledge spillovers in the sense of an externality, i.e. the appropriability problem, as discussed in Section 2.2.
Report 500036 002 (ECN-C--05-014) 91
potential of other, additional instruments such as a R&D subsidy, a technological ‘command-and-control’ standard or an optimal policy mix of these instruments. Finally, in the model of Goulder and Mathai, ITC comes in addition to (not instead of) autono-mous technological change. This means that the ITC scenario is a more technology optimistic scenario than the scenario without ITC. It would have been interesting to also explore the im-pact of replacing autonomous technological change with ITC (see Rosendahl, 2002, as dis-cussed below). Goulder and Schneider (1999) In this study, Goulder and Schneider (1999) investigate the significance of ITC for the attrac-tiveness of CO2 abatement policies. More specifically, they explore the impact of carbon abate-ment policies on R&D expenditures and resulting ITC across different industries as well as the implications of this ITC for the total GDP costs of these policies. When analysing these implica-tions, Goulder and Schneider made a distinction between the costs of a given abatement target (with a flexible carbon tax rate) and the costs of a given carbon tax rate (with a flexible abate-ment level). In addition, they made a distinction between gross social costs (i.e. the social costs of carbon abatement without considering the environmental gains) and net social benefits (i.e. the environmental benefits of carbon abatement minus gross social costs). Moreover, they ana-lyse these costs in both the presence and absence of knowledge spillovers and other inefficien-cies in the R&D market. In order to analyse these cost implications, Goulder and Schneider construct a dynamic general equilibrium model in which abatement policies affect R&D investment of private firms and consequent changes in knowledge accumulation, technological innovations and input require-ments across different industries. Notably, the model distinguishes between fossil-based and al-ternative fuel-based industries, and energy-intensive materials and ‘other’ materials industries. For each representative firm in these industries, R&D investments result in knowledge accumu-lation, which generates productivity-enhancing technologies and, hence, reduces the require-ments for intermediate inputs, including conventional and alternative energy fuels, energy-intensive and other materials, as well as other inputs such as capital or labour. Knowledge ac-cumulation is costly and only partly appropriable. Intersectoral spillovers are represented in the model through the accumulation of knowledge capital enjoyed by all firms in a specific indus-try. Although the model has been primarily developed to gain qualitative, analytical insights in the cost implications of ITC for abatement policies, it has been extended by some numerical simulations - based on data from US economic activities in 1995 - in order to explore these im-plications more closely. The overall finding of Goulder and Schneider (1999) is that 'ITC generally makes climate poli-cies more attractive'. In their study, however, the cost implications of ITC diverge significantly, depending on the different cases distinguished, namely the distinction between (i) the costs of a given carbon tax versus the costs of a given abatement target, (ii) the gross costs versus the net benefits of carbon abatement, and (iii) the abatement costs in the absence versus the presence of inefficiencies in the R&D market. More specifically, assuming no distortions in the R&D mar-ket, the main findings of Goulder and Schneider are: • For a given carbon tax, the gross abatement costs in terms of GDP losses are higher in the
presence of ITC. This is the consequence of the twin assumption that knowledge accumula-tion through R&D investments is costly (i.e. such investments have an opportunity cost) and that the R&D market is in equilibrium (i.e. no distortions): the rate of return on R&D is equal across sectors and equals the rate of return in other sectors (Azar and Dowlatabadi, 1999; Löschel, 2002). Although a carbon tax stimulates R&D in the low- or free-carbon en-ergy industry - leading to cheaper abatement technologies and higher sectoral output - it tends to discourage R&D in other industries. Overall, the carbon tax results in a fall in the aggregate levels of R&D and GDP (relative to the baseline of no ITC). Hence, ITC studies
92 Report 500036 002 (ECN-C--05-014)
that ignore these substitution or ‘crowding-out’ effects in the R&D market are likely to un-derstate the gross GDP costs from a carbon tax.
• For a given carbon tax, the net benefits of abatement are larger in the presence of ITC, even though - as noted above - the gross costs are raised as well. Since a carbon tax induces cheaper abatement technologies, a higher optimal level of abatement can be achieved, re-sulting in an increase of environmental benefits. Goulder and Schneider show that the addi-tional benefits of the additional abatement outweigh the higher social costs. Overall, for a given carbon tax, net benefits of abatement are higher with ITC (compared to no ITC). Hence, ITC studies that ignore these environmental benefits are likely to overstate the net GDP costs from a carbon tax.
• For a given abatement target, the required carbon tax and, hence, the gross cost are lower in the presence of ITC. Unfortunately, however, for this case Goulder and Schneider do not indicate the cost implications of potential ‘crowding-out’ effects in the R&D market (or of potential inefficiencies in this market, as discussed below).
Finally, Goulder and Schneider show that the costs implications of ITC depend on the preva-lence of inefficiencies in R&D markets prior to the introduction of CO2 policies. These ineffi-ciencies result from a mismatch between the external benefits of knowledge spillovers from R&D and the value of subsidies to R&D, reflected in differences between the private and social (opportunity) costs of R&D. For instance, in case of relatively high spillovers but no subsidies to R&D in the conventional energy industry, prior to imposing a carbon tax, the marginal social value of R&D is relatively higher in that industry than in others. Hence, in this case, the oppor-tunity cost of reallocating R&D towards other industries by imposing a carbon tax is especially high.58 The results of Goulder and Schneider turn out to be quite sensitive to the parameterisation of their model, notably the substitution elasticities of their knowledge accumulation and production functions. In sum, whenever parameters are changed to make stock of knowledge more impor-tant as a productive input, cheaper to acquire, or more easily substitutable which other factors, GDP costs of a given carbon tax rise and the costs of reaching given abatement targets fall (Goulder and Schneider, 1999). A major strength of the model of Goulder and Schneider is the distinction between different in-dustries, which allows the model to begin to address the importance of heterogeneity of firms and investment incentives (Weyant and Olavson, 1999). Another strength is that the model cov-ers explicitly intrasectoral (but no international) knowledge spillovers, and that the study offers some major qualitative insights in the cost implications of ITC for CO2 abatement policies. The study, however, does not explore the implications of the existence of knowledge spillovers for CO2 abatement and emission levels, while adequate quantitative estimates of the impact of ITC on the performance of climate policies are largely missing due to a lack of empirical data. Moreover, despite the long-term character of the analyses (covering 60-80 years), the model is deterministic - firms are assumed to have perfect foresight - and does not allow for uncertainty in the markets for ITC and carbon abatement.59 Another limitation of the study of Goulder and Schneider is that it is only focused on R&D-based ITC and ignores learning-by-doing (LBD). However, as acknowledged by Goulder and Schneider, a carbon tax may encourage LBD-based ITC related to the production of alternative (low or free carbon) fuels. On the other hand, the tax leads also to a reduction in output (and, hence, in cumulative output or ‘experience’) in other industries. This implies that in these other
58 For a discussion of the cost implications of similar and other cases of inefficiencies in R&D markets, see Goulder
and Schneider (1999). Unfortunately, however, Goulder and Schneider hardly analyse the implications of spill-overs (or other R&D inefficiencies) for the performance of climate policies.
59 For a discussion of other limitations of the study by Goulder and Schneider (1999) and a comparison with similar studies in the field of ITC and climate policy, see Weyant and Olavson (1999); Kverndokk et al. (2001); Sue Wing (2003), Gerlagh (2003); Gerlagh and Van der Zwaan (2003) and Gerlagh et al. (2004).

Report 500036 002 (ECN-C--05-014) 93
industries, the rate of technological change from LBD is lower than otherwise would be the case. Hence, climate policies that promote LBD in some industries also reduce the rate of LBD in other industries. However, as recognised by Goulder and Schneider, industries most harmed by a carbon tax - namely, the conventional energy industries - tend to be mature industries where LBD effects could be fairly small. Nordhaus (2002) In order to analyse the impact of induced innovations on the performance of climate policies, Nordhaus (2002) incorporates R&D-based ITC in an updated version of his globally aggregated DICE model, called R&DICE.60 In the basic neoclassical DICE model, carbon intensity is af-fected by substitution of capital and labour for carbon energy, i.e. an increase in the price of carbon energy relative to other inputs induces users to purchase more fuel-efficient equipment or employ less energy-intensive products and services. In the R&DICE model, on the contrary, carbon intensity is affected by induced technological change, i.e. an increase in the price of car-bon energy will induce firms to invest in R&D in order to develop new processes and products that are less carbon intensive. Nordhaus assumes that there is an initial rate of improvement in carbon energy-efficiency, or a rate of reduction in the elasticity of output with respect to energy carbon inputs. ITC is incorporated in the model by letting this rate of energy-efficiency im-provement vary in proportion to the additional R&D investments in the energy sector. Hence, the mechanism of carbon abatement is through either energy-efficiency improving R&D (in R&DICE) or factor substitution of capital and labour for energy inputs (in DICE). By compar-ing the results of these two models, Nordhaus is able to compare the impact of ITC versus factor substitution in carbon abatement. The primary conclusion of Nordhaus (2002) is that ITC is likely to be a less powerful factor in influencing the performance of climate policies than substitution of energy by capital and la-bour. Some other major findings and conclusions of this study include: • The reduction in carbon intensity in the ITC case is quite modest in the early decades. The
reduction in emissions from ITC is about 6 percent over the first five decades and about 12 percent after a century. At the beginning, the reduction in emissions from substitution is substantially larger than the reduction from ITC. The ‘cross-over point’, at which ITC be-comes more important in reducing emissions than factor substitution, does not come until about 2230 (although the exact timing is sensitive to the model specification).
• The optimal carbon taxes for both the ITC and substitution cases are virtually identical as there is so little impact on the path of climate change.
• The benefits of positive welfare implications of ITC policies are a fraction (about 40 per-cent) compared to those of substitution policies. This result, however, depends highly on the assumption that the benefits from additional R&D investments in the energy sector (includ-ing spillovers) are fully offset by less R&D investments in other sectors.
According to Nordhaus (2002), the primary reason for the small impact of ITC on the overall path of climate change is that R&D investments are too small to make a difference unless the social returns to these investments are much larger than the already supernormal returns applied in the analysis. R&D expenditures are about 2 percent of output in the energy sector, while con-ventional investments are close to 30 percent of output. Even with supernormal returns, the small fraction devoted to R&D is unlikely to outweigh other investments. Another, perhaps more important explanation for the outcomes of Nordhaus’ study is its limited specification of ITC. The driving force for R&D investments and technological innovations is not so much emission abatement but rather energy conservation (i.e. improvements in energy
60 DICE (Dynamic Integrated model of Climate and the Economy) is an integrated assessment model developed by
Nordhaus to analyse the economics of global warming. An updated, eight-region version of this model is RICE-99 (Regional Integrated model of Climate and the Economy). For a brief description of these models see Nordhaus and Boyer (1999) and Nordhaus (2002).

94 Report 500036 002 (ECN-C--05-014)
efficiency). In fact, only departures from the assumed path of energy efficiency improvements are endogenised in the model, as there is only one energy input available characterised by a fixed (high) emission factor. Hence, the opportunity of developing and using alternative, low-carbon fuels is omitted. A richer specification of ITC opportunities would definitely enhance the modelling and data complications of Nordhaus’ study but may result in a more significant im-pact of ITC on the performance of controlling climate change. In addition, other limitations of Nordhaus (2002) are that it uses a highly aggregated (global) model, it assumes full crowding out of R&D, and it does not explicitly explore the implications of technological spillovers, for instance at the interregional level (although the study implicitly acknowledges the existence of sectoral spillovers by assuming that the social rates of return in R&D investments are far larger than the private rates of return).61 Buonanno et al. The implications of ITC for climate policy have been a major topic for a group of scientists re-lated to the Italian research institute Fondazione Eni Enrico Mattei (FEEM; see, for instance, Buonanno et al., 2000 and 2003; Galeotti et al., 2002 and 2003; Buchner et al., 2003; and Carraro, 2003). In order to explore these implications, they have developed a top-down model called FEEM-RICE.62 This model is an extended version of Nordhaus’ model RICE, the region-ally disaggregated version of his DICE model (see above). Compared to Nordhaus’ RICE, which includes only exogenous technological change, FEEM-RICE is characterised by the extension of two factors. The first extension concerns the introduc-tion of endogenous technological change (ETC), affecting the overall productivity of capital and labour at the firm level. This is done by adding a stock of knowledge in each production func-tion and by relating this stock to R&D investments of profit-maximising firms. Secondly in-duced technological change (ITC) is introduced by allowing the stock of knowledge to affect also the emission-output ratio. Hence, more knowledge through profit-motivating R&D invest-ments will help firms to increase their overall productivity (ETC) and to reduce their negative impact on the environment (ITC).63 Therefore, in contrast to Nordhaus, who assumes that en-ergy R&D fully crowds out other R&D, Buonanno et al. assume that policy-induced R&D en-hances both environmental ITC and overall factor productivity (i.e. no crowding out). In addition to these general factors, the FEEM-RICE model has usually been extended by spe-cific factors depending on the application of the model to address specific issues. Examples of some major extensions concern: • Technological spillovers. In order to account for the international spillovers of disembodied
technological change, a stock of world knowledge is introduced in both the production func-tion and the emission-output ration equation of FEEM-RICE (Buonanno et al., 2003; Buchner et al., 2003; Carraro, 2003).
• Emissions trading. In order to explore the potential impact of the Kyoto mechanisms, the opportunity of emissions trading has been introduced in the model by adding equations in-cluding regional emission targets and the net demand for emissions permits (Buonanno et al., 2000; and Galeotti et al., 2002 and 2003).
• Learning-by-doing. In addition to R&D-based ITC in the basic version of FEEM-RICE, Galeotti et al. (2003) have added LBD-driven ITC to the model by assuming that learning -
61 For comments on Nordhaus (2002) and a comparison with other studies see Weyant and Olavson (1999); Goulder
and Schneider (1999); Goulder and Mathai (2000); Gerlagh (2003); Gerlagh and Van der Zwaan (2003) and Zon and Yetkiner (2003).
62 This model is also often called ETC-RICE or ITC-RICE in order to indicate two sub-versions that account for the difference made by the FEEM authors between endogenous and induced technological change (see main text). For a detailed explanation of the model, see Buonanno et al. (2000) and 2003; Galeotti et al. (2003); Buchner et al. (2003) and Carraro (2003).
63 As outlined in Section 2.3, this distinction in FEEM-RICE between ETC versus ITC as the (overall) rate and the (specific) direction of technological change diverts from the more general definition of these concepts in which they are highly synonymous, except that the term ETC is mostly used in a modelling context.
Report 500036 002 (ECN-C--05-014) 95
i.e. free knowledge accumulation - occurs as a side effect of the accumulation of new physi-cal capital (in the production function) and by allowing for the emission-output ratio to de-pend upon this accumulated capacity. As a result, they have been able to compare the im-pact of R&D- versus LBD-based ITC, but they did not explore hybrid forms of knowledge formation, i.e. situations in which R&D and LBD are jointly present.
FEEM-RICE is basically a single sector top-down model disaggregated to 6-8 regions in the world. Within each region, a central planner maximises the utility or net present value of per capita consumption by optimally setting the value of four strategic variables (investments, R&D, abatement effort and demand for permits), subject to individual resource and capital con-straints and the climate module for a given emission abatement strategy of all global players.64 The FEEM-RICE model has been used to explore the implications of ITC (and international spillovers) for a variety of short- and long-term issues, such as (i) the compliance costs of the Kyoto protocol, (ii) the effects on equity and efficiency of different degrees of restrictions (‘ceilings’) on emissions trading, or (iii) the consequences of the US withdrawal from the Kyoto protocol on the price of emission permits and abatement costs. Some of the main findings and conclusions of studies employing this model include: a) Direct abatement costs generally decrease when ITC is allowed for regardless the emissions
trading regime (Buonanno et al., 2003). However, abatement and R&D are substitutes in general, and R&D efforts are increased when environmental technical change is endogen-ised. Hence, according to Buonanno et al. (2003), the impact on total abatement costs, which include R&D costs, cannot be predicted a priori. In their simulations total costs of comply-ing with the Kyoto protocol are higher with ITC.
b) Technological spillovers reduce the incentive to carry out R&D, thus increasing the price of a permit (Buonanno et al., 2003). As for the impact on total costs, the reduced R&D effort is offset by a greater increase in abatement costs. According to Buonanno et al. (2003), ‘though a priori unclear, in our simulations costs turn out to be often higher when spillovers are present’.
c) When the environmental technology is endogenous, caps on CO2 emissions prompt R&D investments, and trigger the ‘engine of growth’. Kyoto mechanisms such as JI, CDM or emissions trading help in reducing the overall abatement costs, but actually slowdown the R&D accumulation of the most polluting high-income regions, while they spur Russia and Eastern European countries to strategically over-invest in R&D in order to provide the mar-kets with a huge amount of permits, so performing large economic gains from emissions trading (Galeotti et al., 2002).
d) Restrictions (or ‘ceiling’) on the use of the Kyoto mechanisms are likely to increase R&D expenditures (relative to GNP) in OECD countries, i.e. countries which are going to buy permits, but they reduce them in the Former Soviet Union (FSU), China and other develop-ing countries - the seller countries - where the greatest stimulus to carry out abatement R&D comes from the possibility to trade emission permits without restrictions. But even if the presence of ceilings stimulates R&D-based ITC, the overall impact on abatement costs and economic growth appears to be detrimental. According to Buonanno et al. (2000), the ex-planation is related to the relative importance of cost effects and innovation effects. In their model, the cost reduction achieved through unrestricted emissions trading seems to stimu-late growth more than the increase of R&D-driven innovations achieved through trade ceil-ings. Moreover, in the presence of ITC, the Kyoto mechanisms increase equity, while the highest equity levels are achieved without ceilings, both in the short and in the long run. The main reason is that developing countries receive important transfers from developed coun-tries through the trading of permits, and this tends to reduce income inequalities. In addition, the introduction of R&D-based ITC offers developing countries the opportunity to use R&D strategically also to increase their sale of permits (Buonanno et al., 2000). Hence, these find-
64 As there is no international trade in the model, regions are interdependent through climate variables (Buonanno et
al., 2000; and Buchner et al., 2003)

96 Report 500036 002 (ECN-C--05-014)
ings do not support proposals to impose restrictions on emissions trading for efficiency or equity reasons in the presence of R&D-driven ITC.
e) In the presence of ITC, the US withdrawal from the Kyoto protocol, by reducing the demand for permits and their price, lowers the incentives to undertake energy-saving R&D. As a consequence, emissions increase in other Annex I countries and feedback on the demand and supply of permits of these countries. As a result, the fall of the price of a permit after the US withdrawal is much smaller than the one identified in studies ignoring the impact of R&D-based ITC. Moreover, the presence of spillovers provides an additional contribution to this feedback effect. The US defection induces a strong reduction of domestic energy-saving R&D investments. This reduction spills over to other countries by reducing the world stock of knowledge, thus increasing the emission-output ratio resulting in an increase of the price of a permit. This feedback effect also partially offsets the initial fall of the permit price in-duced by the US defection. Hence, the final equilibrium price of a permit is higher than the one usually estimated in studies ignoring induced technological innovations and spillovers (Buchner et al., 2003 and Carraro, 2003).
A major strength of FEEM-RICE is that it is a regionally disaggregated model, accounting for ITC, international spillovers and/or (ceilings on) emissions trading. On the other hand, major limitations of this model concern its deterministic character - i.e. no uncertainty in ITC and en-vironmental markets - and its restricted specification of the ITC function (i.e. modelling only one form of technology and not accounting for potential crowding-out effects). Gerlagh and Van der Zwaan An alternative top-down model to explore the role of ITC in controlling climate change has been developed by Gerlagh and Van der Zwaan. This macroeconomic model, called DEME-TER, is a computable general equilibrium (CGE) model for the integrated assessment of global warming and induced technological change, characterised by the following features (Gerlagh et al., 2004; and Van der Zwaan and Gerlagh, 2002):65 • The model includes two competing energy technologies, one of which has net zero CO2
emissions. This feature allows for emission reductions to be achieved by a transition to-wards a carbon-free technology (the energy transition option) in addition to those resulting from the substitution of energy by capital and labour (the energy saving option).
• It distinguishes old from new capital in such a way that substitution possibilities between production factors only apply to new capital stocks. This so-called ‘vintage’ or ‘putty-clay’ approach allows for different short and long-term substitution elasticities and can, in par-ticular, describe a slow diffusion process.
• The model includes learning-by-doing through the use of learning curves. In this way, a transition towards alternative technologies leads to lower energy production costs for these technologies, and thereby enhances their market opportunities and accelerates the transition and learning process. This feature of the top-down model DEMETER is based on bottom-up models such as MESSAGE or MARKAL (see Chapter 6).66
• It includes niche markets, in which new technologies can relatively easily spread - even though costs are initially high - before these technologies are fully matured.
Gerlagh and Van der Zwaan have used DEMETER to analyse the impact of a stringent climate policy aimed at limiting the global average atmospheric temperature increase to two degrees Celsius in the presence of ITC on a variety of issues, including (i) the impact on abatement costs, energy use, gross world product and aggregate consumption (Gerlagh and Van der Zwaan, 2003), (ii) the impact on the optimal timing of CO2 abatement, carbon tax levels and non-carbon subsidies (Van der Zwaan et al., 2002), or (iii) the impact of carbon taxes on emis- 65 DEMETER stands for the DE-carbonisation Model with Endogenous Technologies for Emission Reductions. For a
description and specification of this model see Gerlagh and Van der Zwaan (2003); Gerlagh et al. (2004); Van der Zwaan et al. (2002) and Van der Zwaan and Gerlagh (2003).
66 In recent (preliminary) working papers, Gerlagh (2003) has analysed the impact of R&D driven ITC, while Ger-lagh and Lise (2003) have explored the implications of both R&D- and LBD-based ITC.

Report 500036 002 (ECN-C--05-014) 97
sion levels when niche markets exist for new carbon-free technologies that experience LBD ef-fects (Gerlagh et al., 2004). In general, Gerlagh and Van der Zwaan find that the inclusion of ITC in their model simulations has a large impact on the issues mentioned above (compared to scenarios excluding ITC as well as to other, similar ITC studies discussed in this chapter). More specifically, the main findings and conclusions of studies conducted by means of DEMETER concern: a) Including ITC implies substantially earlier emission reductions to meet the stringent climate
policy constraint, compared to efficient reduction paths calculated with models that do not include ITC. This can be achieved by imposing a carbon tax on fossil-fuel technologies and/or subsidising investments in non-carbon energy technologies such as wind or solar en-ergy (Van der Zwaan et al., 2002).
b) During the entire simulation period, i.e. the 21st century, the optimal path of carbon taxes to meet the stringent CO2 emissions constraint is substantially lower, compared to the case without ITC and niche markets (Gerlagh et al., 2004).
c) Over time, the induced transition towards a progressively cheaper non-carbon energy tech-nology positively affects aggregate consumption and decreases the costs of the stringent climate policy. Overall cumulative abatement costs amount to only 0.06 percent of the net value of aggregate consumption, i.e. substantially lower than the estimated costs in case of no ITC or the costs estimated by similar studies (Gerlagh and Van der Zwaan, 2003).
d) The numerical results on the costs and timing of emissions reductions appear most sensitive to the parameters that characterise (i) the learning curve of the non-carbon energy source, and (iii) the substitution possibilities between this energy source and the fossil-fuel energy source. Compared to the central parameters of the model simulations, a relatively low (high) learning rate for the non-fossil energy technology increases (decreases) abatement costs, and implies a delay (acceleration) of a transition towards the non-carbon energy source and, hence a delay (acceleration) of emissions reductions. Similarly, a relatively low (high) elasticity of substitution between the two energy sources decreases (increases) the estimated abatement costs and decreases (increases) the potential of a transition policy to-wards the non-carbon energy source (Van der Zwaan and Gerlagh, 2002). Since limited empirical evidence is available to determine the proper value of the parameters, notably of the substitution elasticity, the empirical correctness of the numerical results generated by DEMETER is uncertain.
Strong points of the ITC studies conducted by Gerlagh and Van der Zwaan are the inclusion of niche markets, LBD-curves and two energy technologies in their top-down model and the exten-sive sensitivity analysis of their numerical results (which provides an indication of the uncer-tainty of these results). On the other hand, a major limitation of their approach concerns its highly aggregated, global character, which excludes the analysis of policy actions and effects at the sectoral or regional level (including international spillover effects). Moreover, as indicated above, the numerical results of the model simulations depend highly on the underlying assump-tions and choices for the various parameters, for which there are only limited empirical data, no-tably with regard to the substitution of fossil-fuel energy sources for non-carbon energy tech-nologies. Popp (2004c) In order to account for ITC in the energy sector, Popp (2004c) uses a modified version of Nord-haus’ DICE model, called ENTICE (for ENdogenous Technological change). In this model ITC is channelled through R&D accumulations of knowledge that relates to improvements in energy efficiency. A distinguishing feature of ENTICE is that several R&D parameters have been cali-brated by means of existing empirical studies on induced innovation in the energy sector. For instance, based on data of R&D expenditures by the US industries from 1972-1998, Popp as-sumes a partial crowding out effect of energy R&D on other R&D of 50 percent. This is a key difference compared to Nordhaus, who assumes that there is a fixed amount of total R&D spending in the economy (100 percent crowding out) and Buonanno et al., who assume that pol-

98 Report 500036 002 (ECN-C--05-014)
icy-induced R&D accumulations enhance both environmental ITC and overall factor productiv-ity (no crowding out).67 In first instance, Popp applies ENTICE to estimate the welfare costs of an optimal carbon tax policy in the presence of ITC.68 Ignoring ITC overstates these costs by 8.3 percent. However, cost-savings - rather than increased environmental benefits - appear to drive the welfare gains, as the effect of ITC on emissions and mean global temperature is small. In fact, after a century the temperature is just 0.04 percent lower when the role of ITC is included. Subsequently, however, Popp applies ENTICE predominantly to explore the sensitivity of his policy simulations to key assumptions on R&D parameters used to calibrate the model. The main findings and conclusions of this exercise with regard to the major R&D parameters in-clude: a) The opportunity costs of R&D. Completely removing crowding out of R&D increases the
welfare gain from ITC in the optimal policy simulation from 8.3 percent to 43.6 percent. Similarly, simulations with complete crowding out lead to just 1.8 percent gain from ITC. These results suggest that assumptions about the opportunity costs of R&D are a key factor in explaining differences in outcomes among ITC models.
b) Deviation between the private and social rate of return. The base model sets the social rate of return on R&D to be four times greater than the private rate. Simulations removing this ‘spillover gap’ - for instance by granting government R&D subsidies to correct this market failure - suggest that the returns on such subsidies could be quite significant as the welfare gain from ITC for the optimal policy improves from 8.3 percent to 14 percent. Hence, inter-nalising spillovers enhances welfare when ITC is present.
c) Decay rate. Many models of R&D assume that the stock of accumulated knowledge decays over time, due to obsolescence. The base model assumes no such decay. Not surprisingly, however, adding decay decreases the welfare gains from ITC, although the effect is not large.
d) Return to energy R&D. In the base model, it is assumed that each dollar of energy R&D leads to $4 of energy savings. As expected, reducing potential energy savings in half re-duces the potential welfare gains by about one-half.
e) Elasticity of R&D. The base model assumes that the elasticity of energy R&D with respect to energy prices, including carbon taxes, is 0.35 in 2005 and declines over time. Doubling this elasticity in the optimal policy case does not have a large impact on welfare, partly be-cause some of the gains are cancelled by potential crowding out.
Although the results of the policy simulations and sensitivity analyses generated by ENTICE are quite insightful from a qualitative point of view, quantitatively they have to be treated with some prudence as the model is faced by some limitations. Firstly, by modelling the world as a single region, the ENTICE model simplifies policy dramatically as it ignores regional variation in innovative effects and technology diffusion. Secondly, the ENTICE model only includes in-novation designed to improve energy efficiency but does not consider alternative, emission-free energy technologies. Finally, the ENTICE model does not include uncertainty (Popp, 2004c). Rosendahl (2002) In his paper, Rosendahl (2002) investigates the implications of ITC for a cost-effective climate policy, if at least some of the induced learning effects are external to the emission source (i.e. if some of these effects spill over from a firm, industry or region to another firm, industry or re-gion). In order to deal with this issue, the model structure used in this paper is based on Goulder
67 A recently updated version of ENTICE – called ÉNTICE-BR – includes a backstop technology (see Popp, 2004a). 68 In an optimal climate policy, the marginal costs of carbon abatement are equal to the marginal environmental bene-
fits of reduced carbon emissions. In addition, Popp (2004c) estimates the welfare costs of a more stringent policy, i.e. restriction global emissions to 1995 levels.

Report 500036 002 (ECN-C--05-014) 99
and Mathai (2000). The main extensions are the inclusion of different emission sources and the presence of knowledge spillover effects. Rosendahl assumes that ITC occurs through current abatement efforts, i.e. through learning-by-doing (LBD). By using simple numerical simulations, he investigates to what degree a cost-effective climate policy differs from a free, global quota market approach, assuming external LBD effects in the industrialised (Annex I) region that spill over to the developing world. The results indicate that optimal carbon taxes may be significantly higher in the Annex I region than in the non-Annex I region. Hence, a cost-effective environmental policy does not imply equal taxes across emission sources, if external LBD effects exist (Rosendahl, 2002). Moreover, the Annex I share of global abatement may be higher in a cost-effective scenario than in a free quota market. In addition, global cost savings may be significant, at least if the international spillover effects are substantial. As outlined above, Goulder and Mathai (2000) showed that introducing internal LBD effects implies that the optimal carbon tax is reduced. The simulations by Rosendahl on the contrary, indicate that with complete spillover effects in Annex I, the optimal carbon tax in this region is increased for the next 70 years. Even with partial spillover effects, the optimal tax level is in-creased for some decades. Hence, the impact of introducing LBD on optimal taxes depends cru-cially on the degree of spillover effects (Rosendahl, 2002). Finally, Rosendahl shows that a fully flexible implementation of the Kyoto protocol may be far from cost-effective, as potential spillover effects of technological change in the industrialised world are not internalised in a free quota market. Some abatement in the non-Annex I region is optimal but the abatement share of Annex I should be significantly higher than what the free quota market generates. With diffusion of technology implemented into Rosendahl’s model, the full flexibility regime is actually more costly than a regime with no abatement in non-Annex I, but full flexibility within Annex I. This is in contrast with the study by Buonanno et al. (2000), who conclude that emissions trade restrictions are not cost-effective even with endogenous R&D investments. However, they incorporate neither spillover effects nor diffusion in their model, which are essential in the study of Rosendahl (2002). Bollen (2004) In his thesis, Bollen (2004) analyses the impact of R&D spillovers on the production and in-come effects of carbon abatement. To estimate this impact, he uses Worldscan, i.e. a multi-regional, multi-sectoral and applied general equilibrium model, which can simulate long-term growth and trade in the world economy. ITC is included in the model by assuming that at the sectoral level R&D expenditures grow at an equal rate with production, implying that the R&D intensities stay constant over time. Accumulation of the knowledge stocks leads to enhancing the overall factor productivity of a sector and thus to lowering its unit costs of production. Moreover, accumulation of knowledge in one sector spills over to other sectors (sectoral spill-overs), as well as to similar or even other sectors in other regions (regional or international spillovers). In addition to different technology cases, i.e. with or without ITC/spillovers, Bollen (2004) dis-tinguishes between different policy regimes, notably with or without full emissions trading, as-suming that Annex I countries meet their Kyoto targets for the year 2010 (and kept constant be-yond 2010).69 Some of his major results include: • The inclusion of induced technological change and spillovers magnifies the production and
income effects of climate policies such as the implementation of the Kyoto protocol. Al-though these effects are generally negative (notably for Annex I regions such as Western
69 In addition, Bollen (2004) distinguishes two other policy cases, including and excluding the participation of the US
in the Kyoto protocol (both with and without full emissions trading).

100 Report 500036 002 (ECN-C--05-014)
Europe), they might be (slightly) positive for some sectors/regions (due to carbon leakage or other shifts in sectoral/regional production incurred by the Kyoto protocol). The magnifica-tion impacts due to ITC/spillovers are usually not huge, but significant (and tend to rise over time, because of the accumulation of the knowledge stock). In Western Europe, for instance, the presence of ITC/spillovers magnifies the income losses of the Kyoto protocol by some 5 percent in the year 2015 (in the case of no emissions trading) compared to 12 percent for the US (if they would participate in the Kyoto protocol).70
• The sectoral spillovers constitute the largest factor for the R&D magnification effect on the income losses of carbon tax. This directly follows from the values of the estimated parame-ters that link the knowledge stock to technological change. The second important factor is the accumulation of the own knowledge stock related to own R&D investments, and least important are the international spillovers.
• Emissions trading alleviates the magnification effect. Hence, the existence of ITC and spill-overs offers an additional incentive to high cost countries to argue for efficient solutions of the climate problem.
The results of Bollen (2004) depend highly on some key assumptions of his model. Firstly, the model assumes that R&D intensities are fixed, implying that R&D expenditures are solely af-fected by production changes. However, if it is assumed that R&D investments are based on the optimal allocation of resources in order to maximise the profits of the firm, these investments may respond positively to climate policies such as higher energy prices or carbon taxes even if these policies lead to a decline in sectoral production. As a result, the presence of ITC and spill-overs may not magnify but rather reduce the negative income and production effects of abate-ment policies. Similarly, R&D expenditures on energy saving technologies are not included in the analysis, while R&D intensities are set to zero for energy sectors, because for these sectors data are hardly available or almost zero. Therefore, this study does not deal with energy efficiency im-provements due to ITC. However, as noted, the presence of ITC with regard to energy saving technologies may reduce the negative production and income effects of CO2 abatement. Sue Wing (2003) In his paper, Sue Wing (2003) investigates the potential for a carbon tax to induce R&D, and for the consequent induced technological change (ITC) to lower the macroeconomic costs of abat-ing CO2 emissions. To deal with these issues, he uses a multi-sector computable general equilib-rium (CGE) model of the U.S. economy. This model numerically simulates the effects of a car-bon tax on the level and composition of aggregate R&D investments, the rate of accumulation of an aggregate stock of knowledge, and the inter-sectoral reallocation and intra-sectoral substi-tution of the knowledge services derived there from. A key feature of the model is that knowledge services are a homogeneous ‘super factor’ that substitute for all other commodities and factors - notably energy - in the economy. Hence, knowledge can move among sectors in response to relative price changes and differences in knowledge-energy substitution possibilities. ITC, therefore, results from two separate effects: • An ‘accumulation effect’ in which price-induced changes in R&D investments alter the rate
of accumulation of the stock of knowledge and the aggregate endowment of knowledge ser-vices.
• A ‘substitution effect‘ in which price changes alter the allocation of the endowment of knowledge services among production sectors so as to reduce the costs of abatement. For instance, due to a carbon tax or an emission constraint, knowledge is reallocated away from
70 In some sectors/regions, the production or income effects of the Kyoto protocol are positive and, hence, these posi-
tive effects are magnified by the inclusion of ITC (due to the assumed fixed relationship between sectoral produc-tion and R&D investments), but often partly nullified by the (negative) spillover effects from other sectors/regions.

Report 500036 002 (ECN-C--05-014) 101
output-constrained fossil-fuel sectors toward input-constrained sectors where its marginal product is greater due to its ability to substitute for limited energy inputs.
Contrary to other studies - such as Goulder and Mathai (2000) or Nordhaus (2002) - Sue Wing (2003) finds that the impact of ITC is large, positive and dominated by the above-mentioned substitution effect, which mitigates most of the welfare or ‘deadweight’ losses due to the impo-sition of a carbon tax. More specifically, the losses in income and output incurred by the carbon tax are slightly exacerbated by the accumulation effects as these losses reduce aggregate R&D investments, causing a slowing of knowledge accumulation and the rate of technological pro-gress. At the same time, however, the relative price effects of the carbon tax induce substantial intra-sectoral substitution and inter-sectoral reallocation of knowledge inputs, enabling the economy to adjust in a more elastic manner. The consequent increase in gross input substitut-ability on the supply side of the economy ends up mitigating the bulk of the deadweight losses due to the tax. As the (positive) substitution effect far outweighs the (negative) accumulation effect, the overall impact of ITC on reducing the macroeconomic costs of CO2 abatement is positive and large (Sue Wing, 2003).71 The outcomes of Sue Wing’s model simulations depend highly on the underlying assumptions and parametrical estimates affecting the accumulation and substitution effects of a carbon tax on ITC. If, as applies to Sue Wing’s study, the (direct) price effect of a carbon tax on R&D invest-ments is less important than its (indirect) income or output effect, the accumulation effect of the carbon tax on ITC is, on balance, negative. However, depending on the parameterisation of the model, if the price effect turns out to be more important that the income effect (and the crowd-ing-out effect of R&D is less than 1), a carbon tax may result in a positive impact on aggregate R&D investment and the accumulation of knowledge stocks (thereby further enhancing the positive substitution effect of a carbon tax on ITC). On the other hand, it may be questioned whether knowledge services are a homogeneous ‘super factor’ that substitute for all other commodities and factors in the economy (as assumed by Sue Wing). If knowledge turns out to be rather sector or commodity specific, its substitutability across the economy will be significantly restricted, thereby reducing the substitution effect of a carbon tax on ITC accordingly. Kverndokk et al. (2001 and 2003) In their papers, Kverndokk et al. (2001 and 2003) investigate the implications of the presence of ITC and spillovers for the optimal mixture and timing of two policy instruments, i.e. taxing car-bon emissions and subsidising carbon-reducing technologies. To address this issue, they use a simple dynamic general equilibrium model, including learning-by-doing with regard to the car-bon-reducing technologies. Although quite simple, the analysis of Kverndokk et al. produces some insightful results. Firstly, if the existing/new energy technologies do not create any positive spillovers, a subsidy on these technologies can not be justified and, hence, the optimal policy to deal with a negative environmental externality such as CO2 emissions is just a carbon tax. Secondly, a mixture of a carbon tax and a technology subsidy can be justified in the combined case of a negative externality (i.e. climate change) and a positive externality, i.e. the presence of spillovers from technological innovations to control climate change. Kverndokk et al. (2003) show that in such a case a technology subsidy, combined with an optimal carbon tax, has a big impact on improving the cost efficiency of CO2 abatement. In addition, they show that the great-est return to learning-by-doing and, hence, the highest optimal subsidy occurs when a technol-
71 Sue Wing adds that when the revenues of a carbon tax are recycled in order to subsidise R&D (or remove pre-
exiting taxes on R&D), the sign of the accumulation effect becomes also positive. This issue, however, belongs more to the ongoing debate on the potential ‘double dividend’ of a carbon tax rather that its impact on ITC.

102 Report 500036 002 (ECN-C--05-014)
ogy is first being applied. Moreover, compared to a uniform subsidy over time, the costs of CO2 abatement are significantly reduced under an optimal subsidy policy, i.e. a subsidy which is highest when a technology is first being applied but declines steadily thereafter (Kverndokk et al. 2003). However, in an earlier paper (Kverndokk et al. 2001), they found that even if there are positive spillovers from existing, carbon-reducing technologies, the granting of subsidies to these tech-nologies may be questioned. Subsidising existing technologies may discriminate against new, less polluting innovations when spillovers from these innovations are not rewarded, resulting in a situation of ‘locking-in’ existing technologies and ‘crowding- or locking-out’ better perform-ing innovations. This argument is strengthened in rigid policy schemes where it is hard to re-move old subsidies, as well as to introduce new ones. Hence, in a second best world with uncer-tainty or incomplete information about nascent technologies or with rigid policy schemes, sub-sidising an existing technology amounts to ‘picking a winner’ (Kverndokk et al. 2001).
B.5.3 Major differences in performance of ITC top-down studies The previous section has shown a wide divergence of the major results of top-down modelling studies on the impact of induced technological change and spillovers on the performance of cli-mate policy (for a comparative summary, see Table B.1 on pages 106-107). Whereas this impact is generally large and positive in some studies, it is relatively low or even negative in others. More specifically, with regard to the impact of ITC/spillovers on various performance indicators of climate policy, the major differences of the studies reviewed in the previous section include: • Abatement costs. The impact of ITC/spillovers on total abatement cost savings varies from
‘large and positive’ (Sue Wing, 2000), ‘substantial’ (Gerlagh and Van der Zwaan) or ‘sig-nificant’ (Popp, 2004c) to ‘relatively low’ (Nordhaus, 2002) or even ‘negative’ in terms of magnifying the income losses of carbon taxation policies (Bollen, 2004). In Goulder and Mathai (2000), this impact varies from ‘large’ under their cost-effectiveness (CE) scenario to ‘small’ under their benefit-cost (BC) scenario.
• Carbon emissions. As most of the studies reviewed apply a CE scenario (with a given abatement target for a certain period), they have not analysed the impact of ITC on emission reductions or on similar environmental indicators such as carbon concentration ratios or changes in global warming or sea rise level. For those studies applying a BC scenario, this impact has varied from ‘high’ (Goulder and Schneider, 1999; Van der Zwaan et al. 2002) to ‘low’ or ‘small’ (Nordhaus, 2002; Popp, 2004c).
• Optimal timing of carbon abatement. When the channel for knowledge accumulation and ITC is learning-by-doing (LBD), it results in substantially earlier emission reductions in Van der Zwaan et al. (2002), whereas the optimal timing of carbon abatement is ambiguous in Goulder and Mathai (2000). However, if the LBD effect is strong enough, initial abatement rises (which in fact happens in most of the numerical simulations presented by Goulder and Mathai). On the other hand, when the channel for knowledge accumulation and ITC is R&D, it is preferable to shift some abatement from the present to the future (Goulder and Mathai, 2000).
• Optimal pattern of carbon taxation. Compared to a situation with no ITC, the presence of ITC implies that the level of carbon taxation over a certain time path to meet a certain abatement target is substantially lower in some studies (Goulder and Mathai, 2000; Van der Zwaan et al., 2002), whereas it is hardly changed for a long-term period in Nordhaus (2002) or even significantly higher in the Annex I region for the next 70 years (Rosendahl, 2002).
• Efficiency effects of emissions trading. In a situation with ITC/spillovers, restrictions on emissions trading between Annex I and non-Annex I regions appear to be inefficient in Rosendahl (2002), whereas they are not cost-effective in Buonanno et al. (2000).
Explaining the differences in modelling outcomes
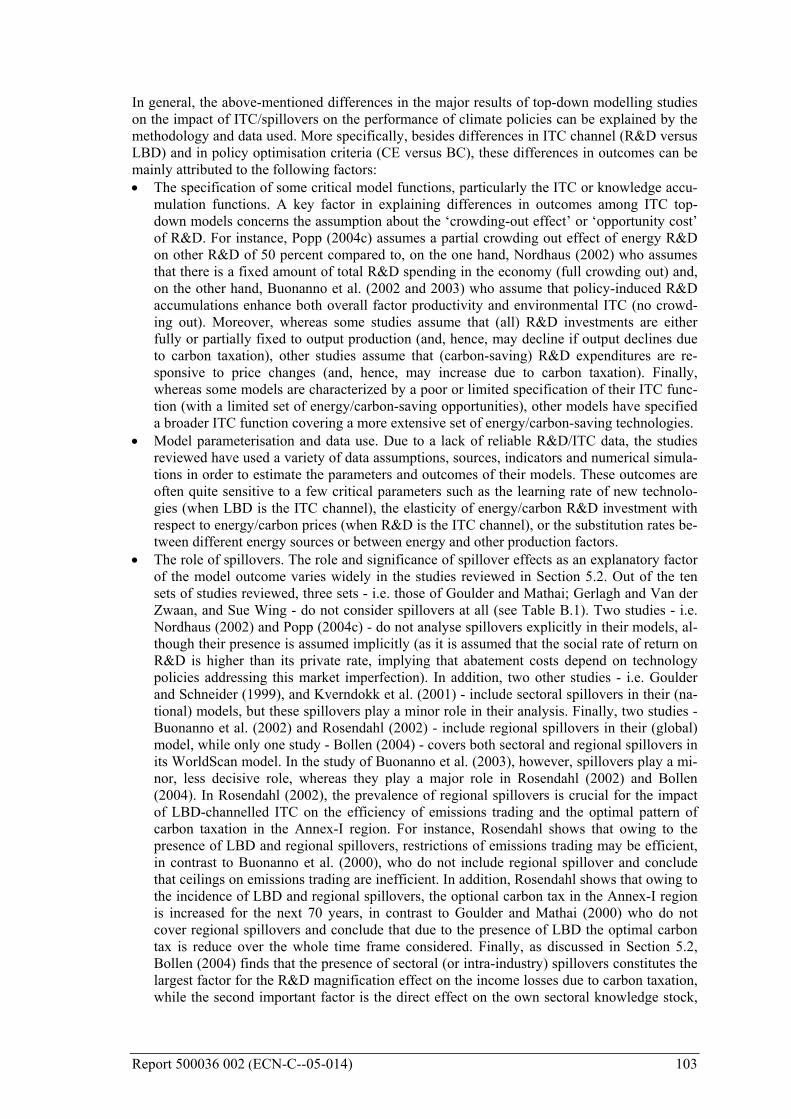
Report 500036 002 (ECN-C--05-014) 103
In general, the above-mentioned differences in the major results of top-down modelling studies on the impact of ITC/spillovers on the performance of climate policies can be explained by the methodology and data used. More specifically, besides differences in ITC channel (R&D versus LBD) and in policy optimisation criteria (CE versus BC), these differences in outcomes can be mainly attributed to the following factors: • The specification of some critical model functions, particularly the ITC or knowledge accu-
mulation functions. A key factor in explaining differences in outcomes among ITC top-down models concerns the assumption about the ‘crowding-out effect’ or ‘opportunity cost’ of R&D. For instance, Popp (2004c) assumes a partial crowding out effect of energy R&D on other R&D of 50 percent compared to, on the one hand, Nordhaus (2002) who assumes that there is a fixed amount of total R&D spending in the economy (full crowding out) and, on the other hand, Buonanno et al. (2002 and 2003) who assume that policy-induced R&D accumulations enhance both overall factor productivity and environmental ITC (no crowd-ing out). Moreover, whereas some studies assume that (all) R&D investments are either fully or partially fixed to output production (and, hence, may decline if output declines due to carbon taxation), other studies assume that (carbon-saving) R&D expenditures are re-sponsive to price changes (and, hence, may increase due to carbon taxation). Finally, whereas some models are characterized by a poor or limited specification of their ITC func-tion (with a limited set of energy/carbon-saving opportunities), other models have specified a broader ITC function covering a more extensive set of energy/carbon-saving technologies.
• Model parameterisation and data use. Due to a lack of reliable R&D/ITC data, the studies reviewed have used a variety of data assumptions, sources, indicators and numerical simula-tions in order to estimate the parameters and outcomes of their models. These outcomes are often quite sensitive to a few critical parameters such as the learning rate of new technolo-gies (when LBD is the ITC channel), the elasticity of energy/carbon R&D investment with respect to energy/carbon prices (when R&D is the ITC channel), or the substitution rates be-tween different energy sources or between energy and other production factors.
• The role of spillovers. The role and significance of spillover effects as an explanatory factor of the model outcome varies widely in the studies reviewed in Section 5.2. Out of the ten sets of studies reviewed, three sets - i.e. those of Goulder and Mathai; Gerlagh and Van der Zwaan, and Sue Wing - do not consider spillovers at all (see Table B.1). Two studies - i.e. Nordhaus (2002) and Popp (2004c) - do not analyse spillovers explicitly in their models, al-though their presence is assumed implicitly (as it is assumed that the social rate of return on R&D is higher than its private rate, implying that abatement costs depend on technology policies addressing this market imperfection). In addition, two other studies - i.e. Goulder and Schneider (1999), and Kverndokk et al. (2001) - include sectoral spillovers in their (na-tional) models, but these spillovers play a minor role in their analysis. Finally, two studies - Buonanno et al. (2002) and Rosendahl (2002) - include regional spillovers in their (global) model, while only one study - Bollen (2004) - covers both sectoral and regional spillovers in its WorldScan model. In the study of Buonanno et al. (2003), however, spillovers play a mi-nor, less decisive role, whereas they play a major role in Rosendahl (2002) and Bollen (2004). In Rosendahl (2002), the prevalence of regional spillovers is crucial for the impact of LBD-channelled ITC on the efficiency of emissions trading and the optimal pattern of carbon taxation in the Annex-I region. For instance, Rosendahl shows that owing to the presence of LBD and regional spillovers, restrictions of emissions trading may be efficient, in contrast to Buonanno et al. (2000), who do not include regional spillover and conclude that ceilings on emissions trading are inefficient. In addition, Rosendahl shows that owing to the incidence of LBD and regional spillovers, the optional carbon tax in the Annex-I region is increased for the next 70 years, in contrast to Goulder and Mathai (2000) who do not cover regional spillovers and conclude that due to the presence of LBD the optimal carbon tax is reduce over the whole time frame considered. Finally, as discussed in Section 5.2, Bollen (2004) finds that the presence of sectoral (or intra-industry) spillovers constitutes the largest factor for the R&D magnification effect on the income losses due to carbon taxation, while the second important factor is the direct effect on the own sectoral knowledge stock,
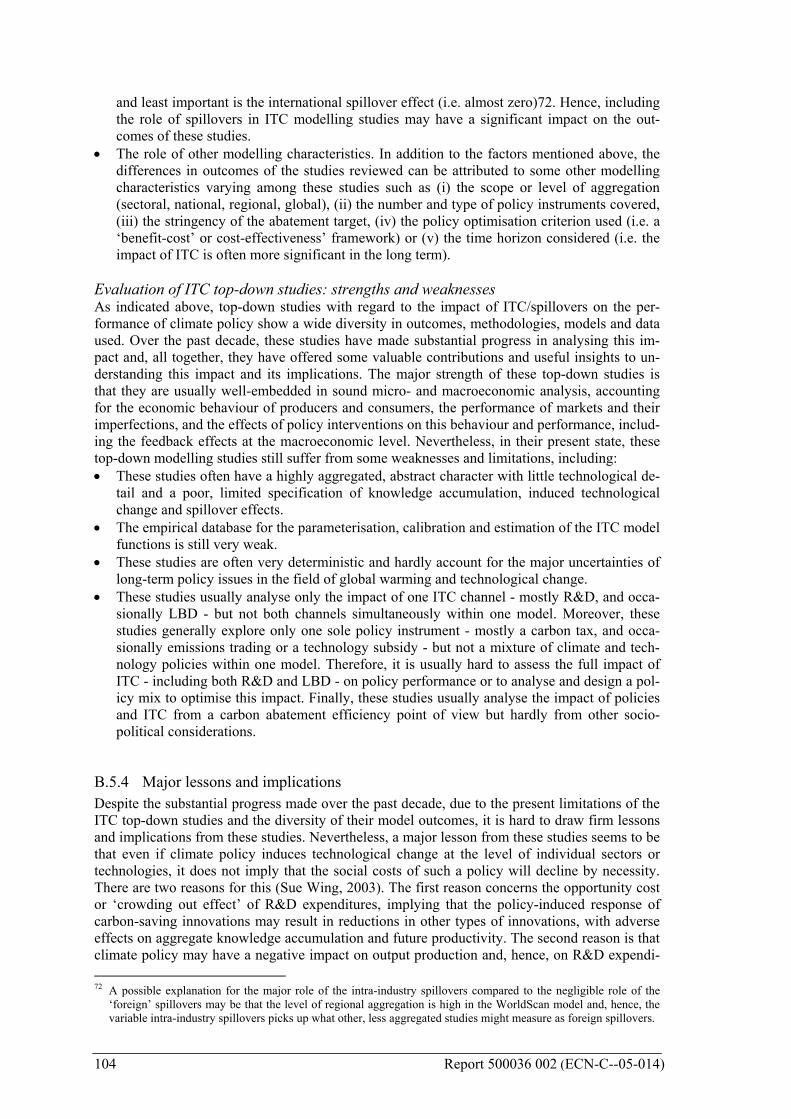
104 Report 500036 002 (ECN-C--05-014)
and least important is the international spillover effect (i.e. almost zero)72. Hence, including the role of spillovers in ITC modelling studies may have a significant impact on the out-comes of these studies.
• The role of other modelling characteristics. In addition to the factors mentioned above, the differences in outcomes of the studies reviewed can be attributed to some other modelling characteristics varying among these studies such as (i) the scope or level of aggregation (sectoral, national, regional, global), (ii) the number and type of policy instruments covered, (iii) the stringency of the abatement target, (iv) the policy optimisation criterion used (i.e. a ‘benefit-cost’ or cost-effectiveness’ framework) or (v) the time horizon considered (i.e. the impact of ITC is often more significant in the long term).
Evaluation of ITC top-down studies: strengths and weaknesses As indicated above, top-down studies with regard to the impact of ITC/spillovers on the per-formance of climate policy show a wide diversity in outcomes, methodologies, models and data used. Over the past decade, these studies have made substantial progress in analysing this im-pact and, all together, they have offered some valuable contributions and useful insights to un-derstanding this impact and its implications. The major strength of these top-down studies is that they are usually well-embedded in sound micro- and macroeconomic analysis, accounting for the economic behaviour of producers and consumers, the performance of markets and their imperfections, and the effects of policy interventions on this behaviour and performance, includ-ing the feedback effects at the macroeconomic level. Nevertheless, in their present state, these top-down modelling studies still suffer from some weaknesses and limitations, including: • These studies often have a highly aggregated, abstract character with little technological de-
tail and a poor, limited specification of knowledge accumulation, induced technological change and spillover effects.
• The empirical database for the parameterisation, calibration and estimation of the ITC model functions is still very weak.
• These studies are often very deterministic and hardly account for the major uncertainties of long-term policy issues in the field of global warming and technological change.
• These studies usually analyse only the impact of one ITC channel - mostly R&D, and occa-sionally LBD - but not both channels simultaneously within one model. Moreover, these studies generally explore only one sole policy instrument - mostly a carbon tax, and occa-sionally emissions trading or a technology subsidy - but not a mixture of climate and tech-nology policies within one model. Therefore, it is usually hard to assess the full impact of ITC - including both R&D and LBD - on policy performance or to analyse and design a pol-icy mix to optimise this impact. Finally, these studies usually analyse the impact of policies and ITC from a carbon abatement efficiency point of view but hardly from other socio-political considerations.
B.5.4 Major lessons and implications Despite the substantial progress made over the past decade, due to the present limitations of the ITC top-down studies and the diversity of their model outcomes, it is hard to draw firm lessons and implications from these studies. Nevertheless, a major lesson from these studies seems to be that even if climate policy induces technological change at the level of individual sectors or technologies, it does not imply that the social costs of such a policy will decline by necessity. There are two reasons for this (Sue Wing, 2003). The first reason concerns the opportunity cost or ‘crowding out effect’ of R&D expenditures, implying that the policy-induced response of carbon-saving innovations may result in reductions in other types of innovations, with adverse effects on aggregate knowledge accumulation and future productivity. The second reason is that climate policy may have a negative impact on output production and, hence, on R&D expendi- 72 A possible explanation for the major role of the intra-industry spillovers compared to the negligible role of the
‘foreign’ spillovers may be that the level of regional aggregation is high in the WorldScan model and, hence, the variable intra-industry spillovers picks up what other, less aggregated studies might measure as foreign spillovers.

Report 500036 002 (ECN-C--05-014) 105
tures tied to this production, thereby further lowering future productivity (Goulder and Schnei-der, 1999; Sue Wing, 2003; Popp, 2004c; and Bollen, 2004). Hence, ITC studies that ignore these potential effects in the R&D market are likely to underestimate the gross social costs from climate policy. A major policy implication might be that, in order to reduce the potential crowd-ing out effect of climate policy on R&D expenditures, this policy could be accompanied by other, technology or education policies to improve the supply of R&D facilities and well-trained scientists and engineers. Another lesson is that, when analysing or generating ITC, not only its impact on gross social costs should be considered but also its potential environmental benefits. Since climate policy may induce cheaper abatement technologies, a higher optimal level of abatement can be achieved, resulting in an increase of environmental benefits. These benefits may even outweigh potential higher social costs of such a policy (Goulder and Schneider, 1999). Hence, ITC studies that ignore these environmental benefits are likely to overstate the net social costs from climate policy. A final implication of the present state of ITC top-down studies is that further research is neces-sary in order to draw more firm policy lessons and implications. The major suggestions for fur-ther additional research include (i) improving the empirical database for ITC top-down model-ling studies, (ii) improving the specification of the ITC model functions, for instance by broad-ening or diversifying the set of energy/carbon-saving technologies covered by these functions, (iii) including both ITC channels simultaneously in top-down analyses, and expanding or diver-sifying the number of policy instruments in these analyses, (iv) accounting for uncertainties in the field of global warming and technological change, and last but not least (v) disaggregating top-down modelling studies, including the analysis of spillover effects and diffusion of tech-nologies at the (intra)sectoral and (inter)national level.

106 Report 500036 002 (ECN-C--05-014)
Table B.1 Overview of top-down modelling approaches on the impact of induced technological change and spillovers on climate policy performance Study Model ITC
channel Spillovers Policy
instrument Focus of analysis Major results (impact of ITC) Comments
Goulder and Mathai (2000)
Partial cost-function model with central planner
R&D LBD
No Carbon tax Optimal carbon tax profile Optimal abatement profile
Lower time profile of optimal carbon taxes Impact on optimal abatement varies depending on ITC channel Impact on overall costs and cumulative abatement varies, but may be quite large
Deterministic One instrument High aggregation Weak database
Goulder and Schneider (1999)
General equilibrium multi-sectoral model
R&D Yes (sectoral)
Carbon tax Abatement costs and benefits
Gross costs increase due to R&D crowding-out effect Net benefits decrease
Lack of empirical calibration Focus on U.S. Full ‘crowding out’ effect
Nordhaus (2002)
R&DICE (global IAM, Top-down, neoclassical)
R&D Implicit (social > private rate of return)
Carbon tax Factor substitution versus ITC Carbon intensity Optimal carbon tax
ITC impact is lower than substitution impact and quite modest in early decades
Deterministic Full ‘crowding out’ of R&D High aggregation (global, one sector)
Buonanno et al(various)a
FEEM-RICE (6-8 regions, single sector) Top-down
R&D (and occasionally LBD)
Yes Rate of carbon control Emissions Trading (plus ceilings)
Compliance costs of Kyoto protocol Impact of ET (+ restrictions)
Direct abatement costs are lower, but total costs are higher ET ceilings have adverse effects on equity and efficiency
Includes international spillovers No crowding-out effect
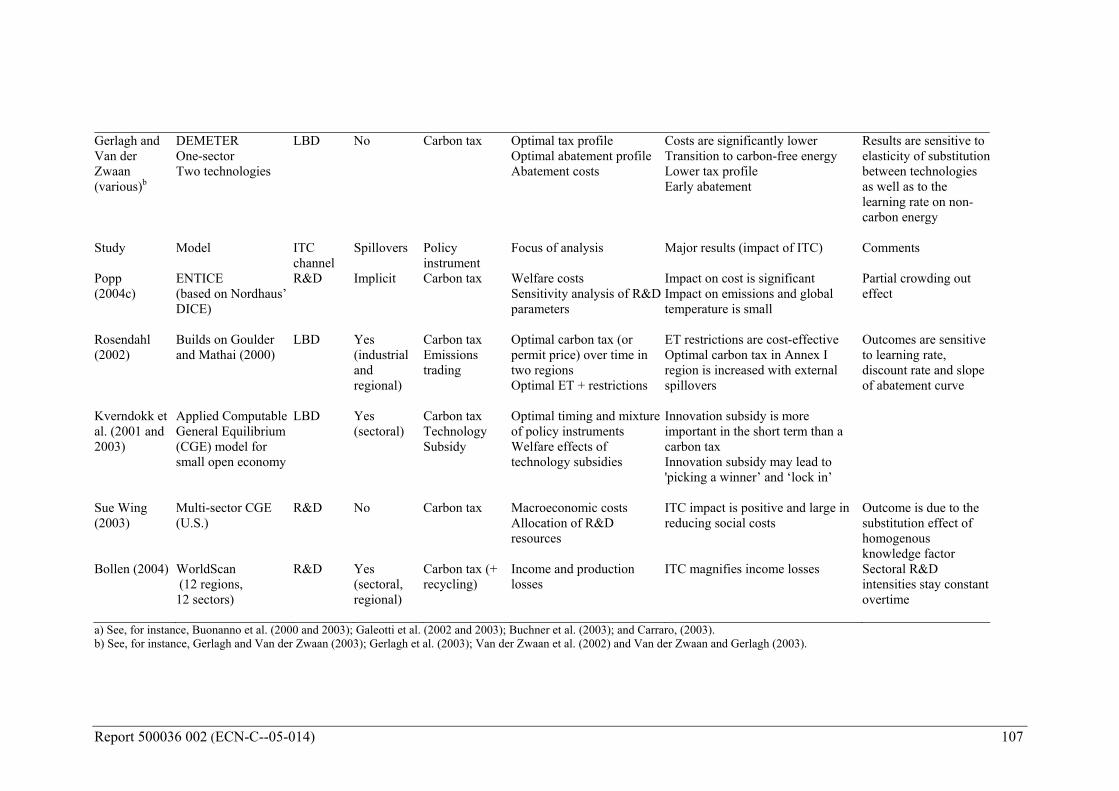
Report 500036 002 (ECN-C--05-014) 107
Gerlagh and Van der Zwaan (various)b
DEMETER One-sector Two technologies
LBD No Carbon tax Optimal tax profile Optimal abatement profile Abatement costs
Costs are significantly lower Transition to carbon-free energy Lower tax profile Early abatement
Results are sensitive to elasticity of substitution between technologies as well as to the learning rate on non-carbon energy
Study Model ITC channel
Spillovers Policy instrument
Focus of analysis Major results (impact of ITC) Comments
Popp (2004c)
ENTICE (based on Nordhaus’ DICE)
R&D Implicit Carbon tax Welfare costs Sensitivity analysis of R&D parameters
Impact on cost is significant Impact on emissions and global temperature is small
Partial crowding out effect
Rosendahl (2002)
Builds on Goulder and Mathai (2000)
LBD Yes (industrial and regional)
Carbon tax Emissions trading
Optimal carbon tax (or permit price) over time in two regions Optimal ET + restrictions
ET restrictions are cost-effective Optimal carbon tax in Annex I region is increased with external spillovers
Outcomes are sensitive to learning rate, discount rate and slope of abatement curve
Kverndokk et al. (2001 and 2003)
Applied Computable General Equilibrium (CGE) model for small open economy
LBD Yes (sectoral)
Carbon tax Technology Subsidy
Optimal timing and mixture of policy instruments Welfare effects of technology subsidies
Innovation subsidy is more important in the short term than a carbon tax Innovation subsidy may lead to 'picking a winner’ and ‘lock in’
Sue Wing (2003)
Multi-sector CGE (U.S.)
R&D No Carbon tax Macroeconomic costs Allocation of R&D resources
ITC impact is positive and large in reducing social costs
Outcome is due to the substitution effect of homogenous knowledge factor
Bollen (2004) WorldScan (12 regions, 12 sectors)
R&D Yes (sectoral, regional)
Carbon tax (+ recycling)
Income and production losses
ITC magnifies income losses Sectoral R&D intensities stay constant overtime
a) See, for instance, Buonanno et al. (2000 and 2003); Galeotti et al. (2002 and 2003); Buchner et al. (2003); and Carraro, (2003). b) See, for instance, Gerlagh and Van der Zwaan (2003); Gerlagh et al. (2003); Van der Zwaan et al. (2002) and Van der Zwaan and Gerlagh (2003).

108 Report 500036 002 (ECN-C--05-014)
B.6 Induced technological change and spillovers in bottom-up approaches of climate policy modelling
B.6.1 Introduction As outlined in Chapter 2, bottom-up energy system models are usually characterised by a detailed analysis of energy technologies, including information on the costs and other per-formance characteristics of these technologies such as the energy efficiency or GHG emis-sions per unit input or output. Since the mid-1990s, technological change has been endogen-ised in some of these models by means of so-called learning curves that relate the costs of specific technologies to the accumulation of knowledge and experience during the innova-tion and diffusion stages of these technologies. This chapter will assess the performance of some major bottom-up energy system models with regard to endogenising technological change and the implications for CO2 abatement policies. Section 6.2 will first of all review briefly some methodological issues, while sec-tion 6.3 will discuss some results of major bottom-up models of endogenous technological change. Subsequently, Section 6.4 will give an example of the potential impact of a specific learning technology, namely carbon capture and sequestration, while Section 6.5 will dis-cuss the impact of induced technological change in the presence of emissions trading and global technological spillovers. Next, Section 6.6 will compare a bottom-up approach on the analysis of international technological spillovers with the approach conducted by Grubb et al. (2002b) as discussed in Chapter 3. Thereafter, Section 6.7 will compare and evaluate the performance of the bottom-up studies reviewed in the present chapter. Finally, Section 6.8 will discuss some lessons and implications following from the assessment in this chapter.
B.6.2 Some methodological issues Learning curves Learning or experience curves describe how the specific investment costs of a given tech-nology are reduced through one or more factors representing the accumulation of knowl-edge and experience related to the R&D, production and use of that technology. These fac-tors are the cumulative installed capacity of a certain technology in the so-called one-factor learning curve (1FLC), as well as the cumulative R&D expenditures or knowledge stock with regard to that technology in the two-factor learning curve (2FLC).73 A typical one-factor learning curve can be expressed simply as: SCt = a * CCt
-b Where: SCt: Specific cost in period t CCt: Cumulative capacity in period t a: Initial specific cost at unit cumulative capacity (t=0) b: Learning index The learning index b can be used to calculate the progress ratio (PR = 2-b) or its comple-mentary learning rate (LR = 1–PR = 1–2-b), i.e. the rate at which the investment cost of a technology declines each time its cumulative capacity doubles. For instance, a progress ra-tio of 0.8 (or a learning rate of 0.2) means that the investment cost, per unit of a newly in-
73 For a more extensive discussion of one-factor and two-factor learning curves, see Seebregts et al. (1999 and
2000), Kouvaritakis et al. (2000a and 2000b), Bahn and Kypreos (2003), Barreto and Kypreos (2004a), de Fe-ber et al. (2003), Miketa and Schrattenholzer (2004), and Turton and Barreto (2004).

Report 500036 002 (ECN-C--05-014) 109
stalled technology (e.g. a wind turbine) decreases by 20 percent each time its cumulative installed capacity is doubled. A major shortcoming of a one-factor learning curve is that it does not adequately account for the variety of factors explaining cost reductions of technological innovations - notably the role of R&D - and, hence that it does not offer adequate, relevant insights and implica-tions for policy makers. Therefore, some studies have developed a two-factor learning curve, where cumulative capacity and cumulative R&D (or ‘knowledge stock’) are used to represent market experience (learning-by-doing) and knowledge accumulated through R&D activities, respectively (Kouvaritakis et al., 2000a and 2000b; Bahn and Kypreos, 2003; Barreto and Kypreos, 2003; Miketa and Schrattenholzer, 2004; and Turton and Barreto, 2004).74 For a specific technology such a two-factor learning curve can be formulated as: SCt = a * CCt
-b * KSt-c
Where: SCt: Specific cost in period t CCt: Cumulative capacity in period t KSt: Knowledge stock in period t75 a: Initial specific cost at unit cumulative capacity b: Learning-by-doing index c: Learning-by-searching index Instead of the learning-by-doing and learning-by-searching indexes, corresponding rates of learning-by-doing (LDR) and learning-by-searching (LSR) can be defined as follows: LDR = 1–2-b
LSR = 1–2-c
It should be noted that the LDR does not correspond to the learning rate (LR) described above for the 1FLC. In the 2 FLC, two variables - i.e. cumulative capacity and knowledge stock - are used to explain the cost trend that the 1 FLC tries to capture using only cumula-tive capacity as explanatory variable (Barreto and Kypreos, 2004b; Turton and Barreto, 2004). Cluster of technologies and learning spillovers Technologies often do not learn alone but in interaction with other technologies sharing common key components. In order to deal with this phenomenon of interdependent learning between technologies, the concept of clusters of technologies has been used in bottom-up energy modelling studies (Seebregts et al., 1999 and 2000; de Feber, 2002 and 2003; Bar-reto, 2003; Smekens, 2004; Turton and Barreto, 2004). A cluster of technologies is defined
74 Due to data and methodological problems (and the resulting disappointing performance of a 2FLC), an alter-
native approach to account for the role of R&D in the process of technological change has been suggested by de Feber et al. (2003). They propose to treat the impact of public R&D indirectly, i.e. exogenously to the model, by estimating the linear relationship between the learning rate of a 1FLC and the R&D intensity of a technology. R&D intensity is defined as the ratio between public R&D expenditures over a period and the turnover of a technology: R&D intensity = (amount of R&D/amount of R&D + turnover). This approach as-sumes that increasing R&D intensity will increase the learning rate of technology. It has been applied in the MARKAL model in order to assess the impact of an additional R&D budget (an R&D shock) on the penetra-tion of emerging technologies (de Feber et al. 2003; see also Barreto and Kypreos, 2004a).
75 An alternative variable would be the cumulative R&D expenditures in period t (CRDt). The advantage of the variable KSt is that it may account for the depreciation of the knowledge stock as well as for time lags be-tween R&D expenditures and knowledge accumulation (Barreto and Kypreos, 2004a; and Miketa and Schrat-tenholzer, 2004)

110 Report 500036 002 (ECN-C--05-014)
as a group of technologies sharing a common essential learning component. This compo-nent, which can be a technology in itself, is called the ‘key technology’. For instance, the gas turbine is a key technology used in a cluster of technologies such as the integrated coal gasification power plant, the gas combined cycle power plant or the gas turbine CHP plant. Other examples of key technologies are fuel cells, photovoltaic modules, wind turbines, burners and boilers (Seebregts et al., 2000). For a single technology, the investment costs may consist of several learning components as well as a non-learning part. The learning components may have different learning rates, while the share of these components in the total cost structure may vary between technolo-gies. Moreover, the learning does not necessarily have to take place through a specific tech-nology. Due to the clustering of technologies, spillovers of learning between technologies may occur, as related or complementary technologies benefit from the learning processes of each other. These clustering and spillover effects may result in the (further) deployment and lock-in of certain technologies, while others may be locked-out from the energy system (de Feber et al., 2002 and 2003, Barreto, 2003; Smekens, 2004; and Turton and Barreto, 2004; see also Section 6.3 below). Spatial dimensions of technological learning and spillovers The impact of endogenising technological change in bottom-up energy system models de-pends partly on the assumptions made with regard to the spatial dimensions of technological learning and spillovers. For instance, the cost reductions and, hence, the deployment or dif-fusion of new technologies depend partly on assumptions concerning the scale or domain of technological learning (global, regional or national) as well as on assumptions whether technological learning at the regional or national level spill over to other regions or coun-tries. As will be illustrated in Section 6.3 below, including spatial spillovers of learning in a bottom-up energy system model offers the possibility that the imposition of emission con-straints in a given region may induce technological change in other regions, even when they do not face emission restrictions themselves, or that the effects of emissions trading on the process of induced technological change may be altered (see also Barreto, 2001 and 2003; Barreto and Kypreos, 2000 and 2004a; and Barreto and Klaassen, 2004). Technological learning and uncertainty Uncertainty is a pervasive element in the use of energy models in order to assess the impact of technological learning in long-term emission scenarios. This uncertainty refers specifi-cally to the progress or learning rates, resulting from methodological shortcomings and lack of adequate data to estimate these rates properly. But even if the historical values of the learning rates could be estimated adequately, their long-term future values would remain uncertain. Besides this specific ‘learning’ uncertainty, other uncertainties (with perhaps more impact) are present in bottom-up energy models dealing with long-term emission sce-narios and technical change. The most pronounced and often mentioned sources of uncer-tainty concern future energy demand, fuel resources, fuel prices, economic/environmental policies, discount rates and various technology characteristics such as the availability and efficiency of new technologies.76 In order to account for these uncertainties and to assess their potential impact on the model’s outcomes, a variety of methodological practices and techniques have been used such as developing different scenarios, sensitivity analyses, sto-chastic programming, or specific methods to analyse data uncertainty in scientific models, e.g. the Monte Carlo Analysis (de Feber et al., 2003). Emission scenarios and policy cases Bottom-up energy system studies have used a variety of emission scenarios and policy cases to analyse the impact of endogenising technological change in their models. In addition to a
76 For a discussion of these and other uncertainties in climate-energy-economic models see Van der Zwaan and
Seebregts (2004), Grübler and Gritevski (2002), and Grübler et al. (1999a and 1999b).

Report 500036 002 (ECN-C--05-014) 111
reference or baseline scenario, for instance one of the emission scenarios developed by IPCC/SRES (2000a), these studies have assumed one or more policy constrained emission scenarios based on either the Kyoto protocol, the achievement of a long-term abatement target or the implementation of specific policy measures such as the imposition of an energy or carbon tax. Moreover, some studies have included emissions trading in their models at the regional/global level. By both including and excluding technological learning in these different emission scenarios and policy cases, these studies have been able to illustrate the impact of endogenising technological change in their models (see Section 6.3). Models used In order to endogenise technological change, a variety of bottom-up energy-system models have been used. The major versions of such models include: • ERIS (Energy Research and Investment Strategies). ERIS is a multi-regional bottom-up
energy-systems optimisation model that endogenises technological change by means of learning curves. The model has been developed as a joint effort between the Interna-tional Institute for Applied Systems Analysis (IIASA), the Paul Scherrer Institute (PSI) and the National Technical University of Athens (NTUA) during the EC-sponsored TEEM and SAPIENT research projects. Originally, ERIS provided a simplified multi-regional representation of the global electricity generation system, including thirteen different electricity generation technologies in each region (of which six technologies were characterised by endogenous learning). Gradually, however, the model has been extended and restructured by, for instance (i) including a cluster approach to techno-logical learning, (ii) adding the non-electric sector in a detailed and disaggregated way, (iii) adding an energy carrier production sector, including hydrogen (iv) incorporating non-CO2 emissions and abatement options, notably for CH4, N2O and SO2, and (v) in-cluding geological and terrestrial carbon storage (for details on ERIS, see Kypreos et al., 2000; Barreto and Kypreos, 2000; Barreto and Klaassen, 2004; and Tuton and Bar-reto, 2004).
• MARKAL (acronym for MARKet ALlocation). MARKAL is a widely applied bottom-up, dynamic energy system model developed by the Energy Technology Systems Analysis Programme (ETSAP) of the International Energy Agency (IEA). It actually covers a large family of models for analysing the role of technology in energy planning and policy strategies to reduce the environmental impacts – notably of carbon emissions – from energy and materials consumption. In addition to the standard linear program-ming model, which provides extensive detail on energy supply and demand technolo-gies, the MARKAL family has been enlarged over the past two decades by models to deal with material flows, uncertainties, multiple regions, emissions trading, macroeco-nomic feedback effects, and endogenous energy demand responsive to price changes (Seebregts et al., 2001). Experience from MARKAL models with endogenous techno-logical change has been gained by including learning parameters for a selected set of technologies in a compact multi-regional model of the global energy system (Barreto, 2001; Barreto and Kypreos, 2004a) as well as in a large-scale model covering Western Europe (Seebregts et al., 2000; de Feber et al., 2003; Smekens, 2004).
• MERGE (Model for Evaluating the Regional and Global Effects of GHG reduction policies). MERGE is a multi-region, multi-technology model for analysing regional and global climate policy issues. It actually combines a top-down and bottom-up approach of climate policy modelling. The top-down part of MERGE covers the macroeconomic linkages between the demand side of the energy system and the rest of the economy, while the bottom-up part provides some technological detail of the energy supply sector in a given region, particularly the generation of electricity and the production of non-electric energy (fossil fuels, synthetic fuels and renewables). Originally, MERGE has been developed in the 1990s at the Stanford University by Manne et al., who recently have added endogenous learning-by-doing to a few power generating technologies of the model (see, for instance, Manne and Richels, 2004 and 2003, or Manne and Barreto,

112 Report 500036 002 (ECN-C--05-014)
2004).77 Similarly, Bahn and Kypreos of the Paul Scherrer Institute (PSI) have also added endogenous technological learning (ETL) to a new version of MERGE (called MERGE-ETL), through either a one-factor learning curve (Kypreos and Bahn, 2003a) or a two-factor learning curve (Bahn and Kypreos, 2002 and 2003).78
• MESSAGE (Model for Energy Supply Strategy Alternatives and their General Envi-ronmental Impact). MESSAGE is a bottom-up system engineering optimisation model used for medium- to long-term energy system planning and policy analysis. It deter-mines how much of the available resources and technologies are actually used to satisfy a particular end-use demand, subject to various constraints, while minimising total dis-counted energy system costs. MESSAGE has been developed by the International Insti-tute for Applied Systems Analysis (IIASA). It exists in many versions, including one that provides a wide variety of detailed information at both a multi-technology and multi-regional level, one that is linked to a top-down macroeconomic model (MES-SAGE-MACRO), one that incorporates endogenous technological learning (ETL), one that accounts for uncertainties, and versions that merge ETL with uncertainties or ETL with MESSAGE-MACRO (for details, see Messner, 1997; Grübler and Messner, 1998; Grübler et al., 1999a and 1999b; and Riahi et, al., 2004).
B.6.3 Some illustrative results Learning rates In order to explore the impact of induced technological change, bottom-up energy system models have used a variety of learning rates for different individual energy technologies (notably electricity generating technologies; see Table B.2). These rates have been either assumed or estimated econometrically, based on expert knowledge or empirical studies.79 Estimates of learning rates may show a large range of values, even for the same technology, depending on the methodology and data used. For instance, Table B.2 shows that the esti-mates of the learning rate for wind power vary from 8 to 15 percent, and for solar PV from 18 to 28 percent.80 On the other hand, the variance of the learning rate for other technolo-gies mentioned in Table B.2 is often smaller, while there seems to be some consensus that this rate is relatively low for new nuclear (4-7%), and for advanced coal-based power gen-erating technologies, notably the integrated, combined cycle gasification system (5-7%).
77 For a description and documentation of MERGE, see the website: http://www.stanford.edu/group/MERGE. 78 In MERGE-ETL, endogenous technological progress is applied to eight energy technologies: six power plants
(integrated coal gasification with combined cycle, gas, turbine with combined cycle, gas fuel cell, new nuclear designs, wind turbine and solar photovoltaic) and two plants producing hydrogen (from biomass and solar photovoltaic). Furthermore, compared to the original MERGE model, Bahn and Kypreos (2002 and 2003) have introduced two new power plants (using coal and gas) with CO2 capture and disposal into depleted oil and gas reservoirs.
79 For a review of the literature on learning curves, including 42 learning rates of energy technologies, see McDonald and Schrattenholzer, 2002.
80 For a discussion and explanation for similar (and even wider) variations in estimated learning rates for wind power, see Söderholm and Sundqvist (2003) and Neij et al. (2003a and 2003b).

Report 500036 002 (ECN-C--05-014) 113
Table B.2 Learning rates of electricity generating technologies in bottom-up energy system models: one-factor learning curve Technology ERIS
[%] MARKAL
[%] MERGE-ETL
[%] MESSAGE
[%] Advanced coal 5 6 6 7 Natural gas combined cycle 10 11 11 15 New nuclear 5 4 4 7 Fuel cell 18 13 19 - Wind power 8 11 12 15 Solar PV 18 19 19 28 Source: Messner (1997), Seebregts et al. (1999), Kypreos and Bahn (2003a), and Barreto and Klaassen (2004). The learning rates in Table B.2 are all derived for one-factor learning curves. Similar rates for two-factor learning curves (2FLCs) are more scarce. Some available estimates of learn-ing rates for energy technologies derived from 2FLCs are presented in Table B.3.81 For each technology and model considered, the learning-by-searching rate (LSR) is significantly lower than the learning-by-doing rate (LDR). Note that the LDRs used by the MERGE-ETL model are similar to the comparable learning rates from the 1FLCs while the LDRs used by the ERIS model are even higher than the comparable 1F learning rates (although one would expect intuitively that the LDRs would be lower than the comparable 1F learning rates as the LDRs are designed to explain only part of the specific technology cost decreases ex-plained by conventional 1F learning rates). Investment costs When considering induced technological change, the specific costs of a given technology decrease with the accumulation of knowledge that occurs through the increase of the cumu-lative installed capacity (in 1 FLC), and through as well as the increase of the cumulative R&D expenditures (in the 2FLC). As an illustration, Table B.4 reports on the reduction of specific investment costs as a learning process for electricity generating technologies over the period 2000-2050 in both a baseline scenario and a CO2 mitigation scenario.82 For in-stance, in case of a 1FLC, the investment costs for a fuel cell power plant decreases from 5096 US$/kW in 2000 to 884 US$/kW in 2050 under the baseline scenario and even to 856 US$//kW under the mitigation scenario (as the total installed capacity of fuel cell power plant increases even further under the latter scenario). Owing to the accumulation of R&D expenditures, these costs decline even more in case of a 2FLC, i.e. to 826 and 819 US$/kW in 2050 under the baseline and emission scenario, respectively. Note that in case of the 1FLC baseline scenario the investment costs of a solar PV plant do not decline (as no ca-pacity is installed under this scenario), while under the mitigation scenario these costs are higher in the 2FLC case than in the 1FLC (as the other power plants benefit more from R&D spending than solar PV, resulting in less installed capacity of solar PV in case of the 2FLC mitigation scenario).
81 For additional estimates of learning rates from 2FLCs, see Kouvaritavis et al. 2000a; Söderholm and
Sundqvist, 2003; and Miketa and Schrattenholzer, 2004. 82 According to the baseline scenario, the global amount of energy elated CO2 emissions increases from 6.55
GtC in 1990 to 15.6 GtC in 2050, whereas the mitigation scenario implies a reduction of these emissions to a level of 10 GtC in 2050 (Bahn and Kypreos, 2003). Similar illustrations of cost reductions for learning tech-nologies are reported by Messner (1997), Seebregts et al. (2000), and Nakicenovic (2002).
114 Report 500036 002 (ECN-C--05-014)
Table B.3 Learning rates of electricity generating technologies in bottom-up energy sys-tem models: two factor learning curves in [%]
ERIS
MERGE-ETL LDR
LSR LDR LSR Advanced coal 11 5 6 4 Natural gas combined cycle 24 2 11 1 New nuclear 4 2 4 2 Fuel cell 19 11 19 11 Wind power 16 7 12 6 Solar PV 25 10 19 10 Source: Barreto (2001). Barreto and Kypreos (2004b), and Bahn and Kypreos (2003). Mix of primary energy use As illustrated in Table B.4, accounting for induced technological chance (ITC) implies a decline of energy production costs over time, as knowledge and experience in the different learning technologies builds up. In other words, the production factor energy becomes less expensive over time and, thus, it can substitute partly for other production factors such as labour or capital. Consequently, as illustrated by Bahn and Kypreos (2003), primary energy use is higher in the baseline and mitigation scenarios including ITC compared to similar scenarios excluding ITC. Comparing the 1FLC and 2FLC cases, primary energy use is lower under the 2FLC baseline scenario (B2F) compared to the 1FLC baseline scenario (B1F), whereas the opposite takes place under the mitigation scenarios (i.e. primary energy use is higher in M2F than M1F). This is due to opposite variations in overall GDP (see Bahn and Kypreos, 2003, and the dis-cussion below on the impact on abatement costs). Moreover, the reduction of primary en-ergy use due to carbon mitigation is lower when considering ITC: 15% reduction in the mitigation scenario compared to the baseline scenario (both excluding ITC), 9% in the M1F case compared to B1F, and only 7% in M2F compared to B2F (Bahn and Kypreos, 2003).
Table B.4 Reductions of specific investments costs as a learning process for electricity generating technologies over the period 2000-2050 (in US dollars at constant 2000 prices per unit installed capacity: US$/kW)
Baseline scenario
Mitigation scenario 2000 (2050) (2050) 1FLC
2FLC 1FLC 2FLC Advanced coal 2020 1355 1254 1349 1252 Gas combined cycle 713 513 503 514 505 New nuclear 3999 2454 2366 2460 2371 Fuel cell 5096 884 826 856 819 Wind power 887 564 525 562 520 Solar PV 6075 6075 5022 1775 5022 Source: Bahn and Kypreos (2003).
ITC affects also the primary energy mix, as illustrated by Bahn and Kypreos (2003). Firstly, the share of fossil fuels decreases, notably coal in the baseline cases and oil in the carbon mitigation cases (where coal is already significantly reduced compared to the baseline). Secondly, the share of nuclear increases, particularly in the baseline cases. Thirdly, the share of renewables increases, especially biomass and wind, to reach 22 percent by 2050 in the M2F case. Finally, these trends are stronger when considering also knowledge accumu-lated through R&D spending (i.e. the 2F cases).

Report 500036 002 (ECN-C--05-014) 115
Electricity generation: output and technology mix The impact of ITC on primary energy use in the cases mentioned above is similar on elec-tricity generation, i.e. it is higher in the learning (ITC) cases compared to the no-ITC cases. Electricity generation is also always higher in the 2F cases compared to the 1F cases. This means in particular that in the B2F case, where primary energy use is slightly lower than in B1F, electricity substitutes partly for non-electric energy following relative price changes in energy markets. Moreover, similar to primary energy use, the reduction of electricity gen-eration due to carbon mitigation is lower when considering ITC. Indeed, power generating costs decrease over time for learning technologies, as do non-electric energy production costs. Electricity (and non-electric energy) can thus substitute partly for capital and labour as production factors (Bahn and Kypreos, 2003). With regard to the technology mix for generating electricity in the cases mentioned above, ITC favours the deployment of the advanced learning power plants, largely at the expense of using conventional coal and other, non-learning technologies. In the baseline learning cases, these plants include particularly integrated coal gasification with combined cycle (IGCC), gas combined cycle (GCC), new nuclear (NNU) and wind turbine (WND), whereas in the mitigation cases they refer mainly to GCC, NNU and WND (Bahn and Kypreos, 2003). The above findings regarding the power generating technology mix in the study of Bahn and Kypreos - who used the MERGE-ETL model - confirm largely similar results of a pre-vious study by Messner (1997), applying the MESSAGE model. However, in contrast to Bahn and Kypreos (2003), the output demand for generating electricity is fixed in the study of Messner, while she compares the technological learning case with two alternative ways of modelling technological change. The first variant, the ‘static’ case, is the least realistic of the three cases (and comparable to the ‘no-ITC’ or ‘no-learning’ case of Bahn and Kypreos). In this variant, it is assumed that the investment costs of the new technologies remain at their 1990 levels over the entire time horizon. The second variant, the ‘learning’ case, assumes that the investment costs of the new technologies decline over the years 1990-2050 according to the progress ratios provided in Table B.2 for the MESSAGE model.83 Finally, the ‘dynamic’ case assumes the same degree of cost reductions over the period 1990-2050 as in the ‘learning’ case, but the reductions are exogenous (‘autono-mous’), occurring at continuous rates between 1990 and 2050. This dynamic case corre-sponds to the most common approach of dealing with technological change in long-term energy system modelling (Nakicenovic, 2002). According to the static case of Messner (1997), the technology mix of global electricity generation in 2050 relies primarily on established technologies such as standard coal and nuclear power plants. In the dynamic case, however, these standard technologies are largely replaced by natural gas combined-cycle, new nuclear, solar and wind technologies. As these latter technology improvements are exogenous in the dynamic case, the shift in investments from traditional to new technologies changes in line with the evolving cost reductions. Compared to the dynamic case, the technology mix in the year 2050 is hardly different in the learning case, except a slight shift from new nuclear and solar thermal systems to solar PV systems. This outcome is hardly surprising as a similar structure in cost reductions for the new technologies in the year 2050 has been assumed for both cases. In contrast to the dynamic case, however, in the learning case investments in new technologies have to be made up-front, when these technologies are much costlier than the conventional alterna-tives, if they are to become cheaper with cumulative experience as installed capacity in-creases. Hence, in the decades preceding the year 2050, there might be a significant differ-ence between the dynamic and learning cases, depending on the timing and speed of in-vestments in new, promising technologies (Messner, 1997; Nakicenovic, 2002; see also
83 In addition to the technologies recorded in Table B.2, Messner (1997) assumes a learning rate for solar ther-
mal of 15 percent.

116 Report 500036 002 (ECN-C--05-014)
Grübler and Messner, 1998 and Grübler et al., 1999a and 1999b, as well as the sections be-low on the timing of abatement investments). Clustering of learning technologies The importance of clustering learning technologies has been illustrated by the Energy re-search Centre of the Netherlands in a MARKAL model for Western Europe (Seebregts et al. 2000; de Feber et al., 2002; Smekens, 2004). The database of this model covers detailed in-formation of some 500 technologies used in different supply and demand sectors of the en-ergy system. In a first set of experiments, clustering was restricted to 28 learning technolo-gies, of which 21 technologies in the power generating sector and 7 end-use technologies in the transport sector (Seebregts et al. 2000). These 28 technologies were clustered to 5 ‘key technologies’: wind turbines, solar PV modules, fuel cells, gasifiers, and gas turbines. The cluster fuel cells combines 3 technologies applied in the power sector and 7 applications in the transport sector, while the other clusters refer to technologies applied in the power sec-tor only. In the first run by the MARKAL model, the fuel cell transport applications were not in-cluded in the cluster of fuel cell power technologies. As a result, fuel cells become not cost-effective over the period 1990-2050 and, hence, they are ‘locked-out’ from the technology mix to generate electricity during this period (both in the baseline and carbon mitigation scenarios). In the second run, however, when the fuel cell technologies in the power and transport sectors are clustered to one key technology, fuel cell applications in the power sec-tor become cost-effective in the carbon mitigation scenario - due to the widespread applica-tion of fuel cells in the transport sector - and account for a major share in the power generat-ing technology mix in 2050. This example illustrates the importance of clustering learning technologies as the experience (i.e. cost reductions) gained by some applications in one sec-tor may benefit the deployment of related applications in other sectors. In a second set of experiments, the number of clusters of key technologies was enlarged from five to ten (representing 59 individual MARKAL learning technologies). During these experiments, the number of clusters included in the model runs was varied from 2 to 10 in order to assess the impact on the cumulative installed capacity of key technologies such as solar PV or fuel cells (de Feber et al., 2002). Depending on this number of clusters, these key technologies were either ‘locked-in’ or ‘locked-out’ from the energy system. This find-ing further illustrates the complex interactions in a detailed energy technology model such as MARKAL and the importance of a proper and balanced identification of clusters of learning technologies. The timing of investments Messner (1997) has analysed differences in timing (or pathways) of investments in new electricity generating technologies in two alternative cases: the dynamic case with exoge-nous cost reductions and the technological learning case with endogenous cost reductions (see also Grübler and Messner, 1998). The most striking differences are that, compared to the dynamic case, the learning case shows higher up-front investment costs in the period 1990-2015, but lower investment costs in the years 2015-50, while over the total period 1990-2050 the discounted systems costs are lower. This finding illustrates a generic differ-ence between the two approaches of modelling future technology costs and performance (Nakicenovic, 2002). In the dynamic case, it pays to postpone some investments in new technologies until the costs are reduced (exogenously). In the learning case, there is no time to waste. Higher levels of costly investments are made immediately to accrue sufficient ex-perience to be able to reap the benefits of cost reductions at some point further along the learning curve. Nevertheless, as mentioned above, despite higher initial investments, the overall discounted costs are lower in the learning case compared to the dynamic case. This result implies that early actions to promote new technologies may be able to reduce the overall discounted costs of long-term mitigation strategies even if similar rates of ‘autono-
Report 500036 002 (ECN-C--05-014) 117
mous’ technological improvements are assumed in the case without learning. In reality, however, the exogenous cost reductions are unlikely to occur unless someone else invests instead (Nakicenovic, 2002). The timing of CO2 abatement The above findings of Messner, Grübler and Nakicenovic, with regard to the optimal timing of investments in new (abatement) technologies seem to contradict comparable findings of Manne and Richels (2004) as well as Kypreos and Bahn (2003b) regarding the optimal tim-ing of carbon abatement, notably when the mitigation target is to reach cost-effectively a certain CO2 concentration level at a certain point in time (say 550 ppmv in 2100).84 Accord-ing to Manne and Richels (2004), the inclusion of learning-by-doing (LBD) does not have a significant impact on the overall timing of carbon abatement in order to reach a concentra-tion level of 550 ppmv in 2100, while Kypreos and Bahn (2003b) even conclude that LBD postpones strong actions in carbon abatement to later periods in the 21st century. These dif-ferences in findings between ‘bottom-up’ studies seem to confirm the ‘top-down’ approach of Goulder and Mathai (2000), who found that the timing of abatement is analytically am-biguous when the channel for knowledge accumulation is LBD (see Section 5.2). To some degree, these differences in findings may be due to differences in model specifica-tion and parameterisation, notably of the learning curve. When the cost reductions due to LBD are high, early investments are warranted (and initial abatement rises), whereas there is less inducement for early investments (and abatement) when these reductions are low (Manne and Richels, 2004; Goulder and Mathai, 2000). However, the above mentioned differences in findings may also be partly due to differences in meaning and interpretation of ‘timing of abatement action’, where one party is primarily focused on ‘timing of investment’ and the other on ‘timing of emission reduction’. Actually, there seems to be some consensus on the timing of abatement policies. For instance, accord-ing to Grübler and Messner (1998), abatement action needs to start in the short run, but this does not necessarily mean aggressive short-term emissions reductions but rather enhanced research & development and technology demonstration (R&DD) efforts that stimulate tech-nological learning. On the other hand, Kypreos and Bahn (2003b), who conclude that LBD postpones strong actions in carbon abatement by a few decades, notice that early policies in form of R&DD support for the new and carbon-free technologies are implicitly assumed in their approach. Hence, there seems to be some consensus between ‘bottom-up’ approaches on LBD with regard to the need of early timing of R&DD abatement policies. Nevertheless, there still seems to be some obscurity and controversy with regard to the meaning and inter-pretation of the ‘timing of abatement actions’ and, hence, further research and clarification on this issue seems to be warranted. Abatement costs Compared to the abovementioned issue on the timing of CO2 abatement, there seems to be much more consensus among bottom-up approaches with regard to the impact of induced
84 It will be clear that if the mitigation target is specified as a certain (declining) limit of CO2 emissions per 5 or
10 year period (starting in 2010), the inclusion of endogenous learning does not have an impact on the timing of carbon abatement (as this is fixed per period), but only on the costs of reaching this target. In addition, it may also be clear that if there are no mitigation targets at all, the inclusion of endogenous learning does not have an impact of the ‘optimal timing’ of carbon emissions as such but rather of the actual outcome of these emissions in the baseline scenario, depending on the difference in assumptions between exogenous and en-dogenous technological change. For instance, in the baseline scenario of Kypreos and Bahn (2003b) global CO2 emissions in 2100 are 44 percent lower when endogenous learning is included (compared to the baseline excluding technological learning). In Manne and Richels (2004), the reduction in baseline carbon emissions varies roughly between 10 and 70 percent, depending on whether learning-by-doing (LBD) will result in low or high cost savings of electricity generating technologies, compared to the no-LBD case. In Grübler et al. (1999a and 1999b), baseline carbon emissions in 2100 are 66 percent lower due to the inclusion of techno-logical learning.

118 Report 500036 002 (ECN-C--05-014)
technological change on the costs of carbon abatement. In general, technological learning has a very significant impact on the reduction of these costs, with the size of this impact de-pending on the assumed rate of technological learning (compared to the assumptions on technological change in the baseline), the number of learning technologies included in the analysis, the year or period considered, the stringency of the mitigation target, the opportu-nity of emissions trading, as well as the discount rate and the indicator used to express abatement costs, i.e. either in terms of marginal costs or as an amount/percentage of total (discounted) costs/GDP losses. In terms of reducing marginal abatement costs, the impact of endogenous learning has been estimated at 20-40 percent for the years 2020-2050 (Seebregts et al., 200; Manne and Richels, 2004; Bahn and Kypreos, 2003). For the year 2100, this impact has even been es-timated at 60-80 percent (Grübler and Messner, 1998; Kypreos and Bahn, 2003b). For in-stance, in the static technology case of Grübler and Messner (1998), the marginal abatement costs of the carbon constraint increase continuously from 10 US$/tC in the year 2002 to some 1200 US$/tC towards the end of the 21st century. In the endogenous learning case, these costs are much lower, levelling off at US$500/tC.85 In terms of total (discounted) abatement costs/GDP losses, estimates of cost reductions due to technological learning vary by period (and study) considered, i.e. 10 percent for the period 1990-2050 (Seebregts et al., 2000), 40-60 percent for the period 2000-2050 (Barreto and Kypreos, 2000), 40-70 percent for the period 2000-2100, in case of a maximum concentration level of 550 ppmv (Manne and Richels, 2004), and 50-70 percent for the year 2050 only (Bahn and Kypreos, 2003). As LBD implies investment costs in early periods and (rising) benefits in later periods, the rate of cost reductions due to technological learning is generally higher when later periods are considered. In addition, the cost impact of LBD is higher if the discount rate is lower. Moreover, according to the estimates of Barreto and Kypreos (2000), cost reductions due to endogenous learning are higher in case of full emissions trading (60%), compared to no trading (40%). As expected, these cost reductions are also higher in case of technologies characterised by higher learning rates, compared to lower learning rates (Manne and Richels, 2004). With regard to stringency of the mitigation target, the impact of LBD on cost reductions seems analytically ambiguous. If the CO2 concentration level is lower (i.e. more stringent), cost reductions due to technological learning are higher in an absolute sense. However, in a relative sense (i.e. expressed as a % of abatement costs without LBD), they may either decline (Manne and Richels, 2004) or rise (Kypreos, 2003) if the concentra-tion level is lower. Finally, in the cases studied by Bahn and Kypreos (2003), induced technological change has a dual impact on GDP. Compared to the baseline scenario without learning, ITC yields GDP growth in the baseline cases including either one-factor or two-factor learning (as the production of energy becomes cheaper due to LBD/ITC). Compared to the baseline cases (both including and excluding learning), ITC reduces GDP losses in the mitigation cases (both including and excluding learning). For instance, Bahn and Kypreos (2003) estimate the GDP loss in 2050 due to carbon abatement at 1 percent in the mitigation case without learning (compared to the baseline without learning), at 0.5 percent in the mitigation case with 1FL (compared to the baseline with 1FL), and at 0.3 percent in the mitigation case with 2FL (compared to the baseline with 2FL). Hence, due to technological learning, abatement costs are reduced by 50% in case of 1FL and even by 70% in case of 2FL (com-pared to the mitigation case without learning). Notice, however, that total GDP in the miti-gation cases with learning may be higher than the baseline scenario without learning, as the
85 Notice that these marginal abatement costs compare to a carbon tax or price of an emission permit at the same
level. Notice also that for long-term time intervals such as the 21st century it would be more realistic to com-pare the difference in marginal abatement costs between an endogenous learning case and an exogenous tech-nology dynamics case (rather than a static technology case).

Report 500036 002 (ECN-C--05-014) 119
(reduced) GDP losses due to carbon mitigation may be surpassed by the growth in GDP due to technological learning. The allocation of R&D expenditures Recently, two studies using two-factor learning curves within the ERIS model have ex-plored the role and allocation of R&D expenditures in energy technology processes (Barreto and Kypreos, 2004b; Miketa and Schrattenholzer, 2004). Based on estimated learning-by-doing rates (LDRs) and assumed learning-by-searching rates (LSRs) for solar PV and wind, Miketa and Schrattenholzer (2004) present the optimised levels of R&D for these learning technologies up to 2080 in the hypothetical situation of an unlimited R&D budget. Addi-tional sensitivity analyses show that the learning rates affect the optimised R&D levels in opposite ways. Higher LSRs result in higher optimised R&D expenditures, implying that more R&D investments pay off. Accordingly, investment cost reductions are steeper when LSRs are high. In contrast, higher LDRs lead to lower optimised R&D expenditures. This is because when learning-by-doing is more effective than learning-by-searching, cost reduc-tions can be achieved better through capacity accumulation while R&D funds can be saved rather than being spent to reduce costs (Miketa and Schrattenholzer, 2004). Another interesting finding of Miketa and Schrattenholzer is that the optimised R&D allo-cation for one technology is independent of the presence and learning parameters of the other technology. Hence, they identified a situation in which the often-cited phenomena of ‘lock-in’ (i.e. the dominance of one learning technology at the expense of the other as a consequence of increasing returns to scale) and ‘crowding-out’ (i.e. a limited R&D budget that leaves room for supporting only one technology) were not observed. Similarly, Barreto and Kypreos (2004b) have estimated the optimal allocation of R&D ex-penditures for six learning technologies based on assumed LDRs and LSRs (see Table B.3) and a fixed R&D budget up to 2050 (although the total available budget was not fully spent in most years and cases considered). As expected, the technologies with the highest LSR - such as solar PV, gas fuel cells and wind turbines - appear to be more attractive for expend-ing R&D resources than other learning technologies (such as the gas combined cycle, clean coal or new nuclear technology). However, other factors such as the LDR, the maximum growth rates allowed and the presence or absence of a constraint on emissions, which may force low-carbon technologies into the solution, play also an important role. Moreover, sen-sitivity analyses reveal that a higher depreciation rate of the knowledge stock may favour allocating more R&D funds to currently competitive technologies in order to avoid or miti-gate their ‘forgetting-by-not-doing’ process -implying that if no R&D efforts are made on a given technology its investment cost may increase - rather than allocating these funds to currently expensive technologies that are promising in the long run (Barreto and Kypreos, 2004b). Uncertainty and sensitivity analyses Most of the results presented above are highly uncertain due to the interaction of a variety of modelling, methodological and parameter uncertainties (Van der Zwaan and Seebregts, 2004). In order to assess the sensitivity of the results to these uncertainties and the assump-tions made, several authors have conducted uncertainty and sensitivity analyses. In addition to some findings of such analyses already recorded above, a few other outcomes are re-corded below: • In the deterministic case with no uncertainty, a new technology enters the market earlier
and diffuses faster. In the stochastic case, however, when learning is uncertain, diffu-sion is more gradual and market entry is later. Moreover, experiments with the stochas-tic version of MESSAGE have shown that, if the uncertainties concerning future tech-nology performance are incorporated, the model tends to spread risks by diversifying investment strategies over more technologies (Messner, 1997; Grübler and Messner, 1998; Grübler et al., 1999a and 1999b; and Barreto and Kypreos, 2000).
120 Report 500036 002 (ECN-C--05-014)
• The impact of technological learning depends highly on the future learning rates of new technologies that, as indicated above, are highly uncertain. As illustrated by, for in-stance, Capros and Chryssochoides (2000) or Seebregts et al. (2000), if the learning rate turns out to be higher (or lower) than assumed, it may have a major mutually reinforc-ing impact on trends in cost reduction deployment, installed capacity and experience (i.e. cost reduction) of a technology and hence on the technology mix of an energy sys-tem and the level/costs of carbon abatement. Moreover, as shown by Capros and Chrys-sochoides (2000), each technology has a different sensitivity with respect to the learn-ing rate.
• Capros and Chryssochoides (2000) have also analysed the sensitivity of the benefits from endogenous technological learning with respect to fluctuations in fuel prices. They show that this sensitivity is noticeable, but not very high, as a 100% change in prices re-sulted in a 25% change in the carbon cost savings of learning.
B.6.4 An example: endogenous learning for carbon capture technologies In a recent paper, Riahi et al. (2004) have analysed the impact of technological learning for carbon capture and sequestration technologies (CCTs) on the performance of different CO2 mitigation scenarios by including (learning) CCTs for power plants in the energy supply op-timisation model MESSAGE-MACRO (in which MACRO calculates the macroeconomic feedback effects of mitigation measures on energy prices and the demands for energy and other production factors). For this purpose, they selected two baseline scenarios of the IPCC Special Report of Emissions Scenarios (SRES) as their reference scenarios, called A2 and B2 (IPCC, 2000a). For each, they developed two carbon mitigation scenarios (one with and one without CCT learning) aiming at the stabilisation of atmospheric carbon concentrations at about 550 ppmv by the end of the 21st century.86 A major difference between the baseline scenarios A2 and B2 is that the estimated figures on population, GDP and GHG emissions in 2100 are higher in A2 than B2. Hence given the same abatement target for each scenario (i.e. 550 ppmv in 2100), the mitigation scenario A2-550 can be considered as implying more stringent carbon abatement policies than under mitigation scenario B2-550. In order to design a learning curve for CCTs, Riahi et al. (2004) calculated the initial total carbon reduction costs of CCTs at 196 US$/tC for a standard coal power plant and 137 US$/tC for a natural gas combined cycle power plant. Moreover, due to a lack of data, they assumed a learning date for the investment costs for CCT of 13 percent, based on an esti-mate for a comparable technology, i.e. capture of sulphur dioxide (SO2) emissions from coal-fired power plants. In addition to carbon storage and sequestration, Riahi et al. (2004) considered two other mitigation options to meet the required stabilization target, namely fuel switching and en-ergy demand reduction (through enhanced energy conservation). The carbon reductions of these options as well as other characteristics and results of the emission scenarios analysed by Riahi et al. (2004) are summarised in Table B.5. More specifically, their major findings and conclusions with regard to the impact of learning CCTs on the performance of carbon abatement scenarios during the 21stcentury include: • In all mitigation scenarios, the comparatively largest contribution to carbon reductions
comes from fuel switching, notably shifting away from coal. The second most impor-tant contribution is due to carbon capture and sequestration, where the emissions reduc-tions are particularly high in the case of learning CCTs.
• During the 21st century, total carbon reduction costs of CCTs remain constant in the mitigation scenarios with static CCTs (A2-550s and B2-220s), while they decline in the mitigation scenarios with learning CCTs (A2-550t and B2-550t) from 196 to 41-61
86 For a comparable study, see Riahi et al. (2003), which analyses the impact of introducing (learning) CCT in
the baseline scenario A2 only (without any specific mitigation target).
Report 500036 002 (ECN-C--05-014) 121
US$/tC for a standard coal power plant and from 137 to 34-38 US$/tC for a natural gas combined cycle power plant (Table B.5).
• Comparing the diffusion of CCTs in scenarios with declining costs due to learning with those assuming costs of static technologies shows that the market penetration of CCT is accelerated due to technological learning. Particularly, the carbon capture from coal technologies benefits considerably from the learning effect, leading to global market shares of more than 90 percent in 2100, compared to 60-70 percent in the case of static costs. At the end of the century, almost all fossil power plants are equipped with carbon capture technologies in the case of learning (Riahi et al., 2004).
• A major characteristic of all four mitigation scenarios is the comparatively late diffu-sion of CCTs. It requires decades for them to diffuse widely. Large-scale applications first emerge as late as in the 2030s. In all scenarios, the entire diffusion of CCTs, from the initial introduction to saturation, spans about 50 years.
• Cumulative carbon sequestration is higher in the case of the A2 mitigation scenarios compared to the B2 mitigation scenarios, and higher in scenarios with learning CCTs than in those with static cost assumptions. In the case of learning, CCT’s cumulative carbon emissions over the years1990-2100 range between 137 and 243 GtC (compared to 90 and 167 GtC in the scenarios with constant CCT costs).
• In the mitigation scenarios, the marginal costs of carbon abatement rise steadily from 20 US$/tC in 2000 to about 400-500 US$/tC in 2100. Although these costs are lower in scenarios with learning CCTs, compared to those with static technologies, a remarkable finding is that these cost differences are relatively small, notably in the A2 mitigation scenarios (with static versus learning CCTs). A similar striking result was found with regard to total abatement costs/GDP losses, where the differences in GDP losses are particularly small in the B2 mitigation scenarios (see Table B.5).87
87 The explanation for this striking result offered by Riahi et al. 2004) is vague and demanding: ‘‘There seem to
be no direct relationship between total amounts of cumulative carbon sequestration and GDP losses, indicat-ing that the macroeconomic stabilization cost is the result of a more complex price formation, in which CCTs are just one influencing factors among many. CCT cost contribute to the progression of prices, but do not completely determine them.’’ (Riahi et al., 2004). An additional, alternative explanation might be that their analysis includes only CCTs as learning technologies, whereas differences in marginal/total abatement costs between scenarios with different technology assumptions may become larger if more learning technologies are included.

122 Report 500036 002 (ECN-C--05-014)
Table B.5 Major characteristics and results of emissions scenarios with different assump-tions regarding carbon storage and sequestrations technologies (CCTs, 1990-2100)a
Year
Baseline
scenarios
Mitigation scenarios
(550 ppmv in 2100)
(without CCTs) Static CCTs Learning CCTs
A2 B2 A2-550s B2-550s A2-550t B2-550t
Global GDP (trillion 1990 US$)
2100 242.8 234.9 236.4 230.8 236.6 230.9
Population (billion) 2100 15.1 10.4 15.1 10.4 15.1 10.4Primary energy (EJ) 2100 1921 1357 1571 1227 1636 1257Cumulative carbon emissions (GtC)
2100 1527 1212 992 948 990 950
Cumulative carbon se-questration (GtC)
1990-2100
- - 167 90 243 137
Carbon concentrations (ppmv)
2100 783 603 550 550 550 550
Carbon reductions by (GtC):
• energy conservation 2100 - - 3.6 1.3 3.7 1.5• fuel switching 2100 - - 12.5 3.9 9.5 4.0• carbon sequestration 2100 - - 5.8 3.0 8.9 4.0• total 2100 - - 21.9 8.2 22.0 9.5Carbon reduction costs (US$/tC)
• coal-based CCTs 2100 - - 196 196 41 61• gas-based CCTs 2100 - - 137 137 34 38Abatement costs: • marginal (US$/tC) 2100 - - 496 447 490 406• total/GDP losses
(trillion 1990 US$) 2100 - - 6.4 4.1 6.2 4.0
a Compare with 1990 values for GDP (20.9 trillion US$), population (5.3 billion), primary energy use (352 EJ). and carbon concentrations (354 ppmv).
Source: Riahi et al. (2004). Based on their findings, Riahi et al. conclude that ‘‘climate policies need to be extended to include technology policies, in order to make the diffusion of environmentally sound tech-nologies operational in the long run... This calls for early action to accomplish the required cost and performance improvements in the long term, including the creation of niche mar-kets, the development of small-scale demonstration plants, and targeted R&D’’ (Riahi et al., 2004). This conclusion, however, may be questioned as the authors did not study the per-formance of mitigation scenarios excluding CCTs (or other ‘environmentally sound tech-nologies’), while the comparison of the mitigation scenarios with static versus learning CCTs shows that the differences in marginal/abatement costs are relatively low, thereby raising doubts whether early action and investment in these technologies can be justified.
B.6.5 Emissions trading and spatial learning spillovers In most bottom-up energy systems studies, the impact of endogenous technological change is analysed in the context of a scenario assuming global learning. This means that capacities

Report 500036 002 (ECN-C--05-014) 123
of energy technologies deployed across all regions considered are added up to obtain the global cumulative capacity, which is used for the computation of corresponding investment costs. Assuming global learning, however, has an important implication for the diffusion of the learning technologies (Barreto and Kypreos, 2002). With all regions contributing to the cost reduction, deploying an energy technology in one of them translates into a reduction of the specific investment costs to all of them. Hence, through these so-called ‘spatial learning spillovers’ investments in expanding the installed capacity of a learning technology in a given region will contribute to render this technology more cost-effective also in other re-gions, thereby affecting the energy technology mix and the corresponding system costs and carbon emissions in these regions. In a different, but comparable way, CO2 emissions trading affects not only abatement costs and carbon emissions at the regional level but also the development, diffusion and deploy-ment of new, carbon-saving technologies. Moreover, through the deployment of these tech-nologies, emissions trading also influences their regional learning and spillover effects, while these effects may in turn affect emissions trading at the regional level, resulting in a complex, but intriguing interaction of the impact of spatial learning spillovers and emissions trading on the diffusion and deployment of new technologies and the corresponding carbon emissions at the regional and global levels. Recently, two bottom-up energy system studies have analysed the above-mentioned interac-tion and impact of emissions trading and learning spillovers on the regional performance of technology deployment in the global electricity generating sector (Barreto and Kypreos, 2004a; and Barreto and Klaassen, 2004).88 Although the focus and methodology of these studies are highly comparable, there are some differences as well, notably: • Both studies use a multi-regional bottom-up energy-systems optimisation model. How-
ever, while Barreto and Kypreos (2004a) use a 5-region MARKAL model of the global energy system, Barreto and Klaassen (2004) apply an 11-region ERIS model.
• While both studies are focussed on analysing the impact of emission trading and learn-ing spillovers on technology deployment in the global electricity sector, Barreto and Klaassen explore also the effects on regional emission patterns and mitigation costs.
• Both studies cover 6 learning technologies, out of 13 power-generating technologies in Barreto and Kypreos (2004a) and out of 14 such technologies in Barreto and Klaassen (2004).
• Both studies consider an unconstrained baseline (or reference) scenario and a CO2 con-strained mitigation scenario. However, the ‘Kyoto-for-ever’ mitigation scenario of Bar-reto and Klaassen is less stringent for the Annex B region (excluding the US) than the ‘Kyoto-trend’ mitigation scenario of Barreto and Kypreos for the Annex I regions (in-cluding the US).89 In the latter scenario, the Annex I regions are compelled to reach their Kyoto target in 2010 and to follow, from this target, a linear reduction of 5% per decade until the end of the horizon. In both studies, the other regions (called either ‘non-Annex B’ or ‘non-Annex I’), are not subject to emissions reduction but they can-not exceed their emissions in the unconstrained case (implying that both studies exclude the opportunity of ‘carbon leakage’).
• In both studies, the mitigation scenario distinguishes between three variants of emission trading, namely (i) no emissions trading across regions, (ii) restricted inter-regional emissions trading, i.e. only between the regions of ‘Annex B’ or ‘Annex I’, and (iii) full-free emissions trading between all regions.90
88 These papers build on previous work of Barreto (2001) and Barreto and Kypreos (2000 and 2002). 89 Officially, Annex I refers to the developed countries listed in Annex I of the United Nations Framework Con-
vention on Climate Change (UNFCCC), while Annex B concerns the developed countries mentioned in An-nex B of the Kyoto protocol (i.e. those developed countries that accepted an emission limitation target at the Kyoto conference). Annex B includes all countries recorded in Annex I, except Belarus and Turkey.
90 Notice that an emission trading refers to all trade in emission permits generally and does not distinguish par-ticularities of the flexible mechanisms considered under the Kyoto protocol (ET, JI and CDM).
124 Report 500036 002 (ECN-C--05-014)
• Besides a global learning scenario, the studies consider cases of regional learning, in which regions learn separately, i.e. technologies in one region cannot benefit from ca-pacity accumulating in another region. However, whereas Barreto and Klaassen (2004) explores only one case of regional learning (i.e. Annex B versus non-Annex B), Barreto and Kypreos (2004a) considers three cases of regional learning that represent a geo-graphical fragmentation of the learning process in (i) Annex I/non-Annex I, (ii) IND/EIT/DEV, i.e. industrialised, economies-in transition and developing countries), and (iii) single-region learning domains, respectively.
As noted, besides some differences, the focus and methodology of the two studies are highly similar, resulting in a set of findings and conclusions that on the one hand are highly comparable, but on the other hand supplement and, to some extent, qualify each other as well. The major findings and conclusions of these two studies will be discussed briefly be-low. Firstly, the presence and geographical scale of learning spillovers affect the deployment and ranking of different technologies in individual regions and, hence, the resulting technology mix in these regions. For instance, Barreto and Klaassen (2004) show that in the reference case with global learning, technologies such as solar PV or advanced coal plants are widely used by the end of the 21st century in the Annex B regions, while with regional (Annex B/non-Annex B) learning, these technologies remain ‘locked out’ of the electricity generat-ing mix. For solar PV, a similar pattern of ‘lock-in’ versus ‘lock-out’ is observed in the ‘Kyoto-for-ever’ mitigation scenario under full emissions trading with global versus re-gional learning. Similar differences in technology deployment due to differences in learning spillovers were found by Barreto and Kypreos (2004a) for the year 2050, although for solar PV in the Annex I region they observed this difference in deployment only for their ‘Kyoto-trend’ mitigation scenario (for both the full trade and Annex I trade cases, however), but not for their reference scenario. It should be noticed, however, that in most other cases analysed by these two studies the differences in technology deployment between global versus re-gional learning were either absent, small or less pronounced (‘lock-in’ versus ‘lock-out’) than in the case of solar PV in the developed regions. Secondly, the emissions trading regime may not only have a direct effect on technology de-ployment in different regions, but also an indirect effect as it may affect the relationship or impact of the presence and geographical scale of learning spillovers on the deployment and mix of different technologies in individual regions. For instance, Barreto and Kypreos (2004a) show that under the ‘Kyoto-trend’ mitigation scenario with global learning the de-ployment of solar PV in the non-Annex I region for the year 2050 is much higher in the full trading scheme than the no-trading regime. Besides, in both trading schemes this deploy-ment is much higher in the case of global learning than in the three cases of regional learn-ing (which, in turn, also show major differences in solar PV deployment). Thirdly, the imposition (and stringency) of a carbon constraint may not only have a direct effect on technology deployment in different regions, but also an indirect effect as it may affect the relationship or impact of the presence and geographical scale of learning spill-overs on the deployment and mix of different technologies in individual regions. For in-stance, Barreto and Klaassen (2004) show that in case of regional learning the deployment of solar PV in the Annex B region for the year 2050 is much higher in the ‘Kyoto-for-ever’ mitigation scenario than the reference scenario. Besides, in both emission scenarios, this deployment in higher is the case of global learning, compared to regional learning. Fourthly, the presence and scale of learning spillovers may not only affect technology de-ployment at the regional level but, hence, also the amount of carbon permits traded. For in-stance, as illustrated by Barreto and Kypreos (2004a), the volume of CO2 permits sold by the region Asia in the ‘Kyoto-trend’ scenario is significantly higher in 2050 in case of
Report 500036 002 (ECN-C--05-014) 125
IND/EIT/DEV regional learning (compared to global learning), while it is significantly lower in the case of Annex I/non-Annex I learning. Fifthly, the presence and scale of learning spillovers may also affect the total abatement costs of the different mitigation cases. In general, as illustrated by Barreto and Klaassen (2004), these costs are highest in the case of no trading, less in the case of Annex B trading only and lowest in case of full global trading (although the cost differences in the trading cases of Barreto and Klaassen are relatively small as the mitigation target of their ‘Kyoto-for-ever’ scenario is weak). In addition, however, they show that for each case considered, the abatement costs are lower in the case of global learning, compared to regional (Annex B/non-Annex B) learning. Finally, the presence and scale of learning spillovers may also have an impact on the amount of emissions at the regional level - notably in the non-Annex B regions - and, de-pending on the trade regime, at the global level as well. As illustrated by Barreto and Klaas-sen (2004), this impact is in relative sense the largest in case of the ‘Kyoto-trend’ scenario with no emissions trading. In this case, the Annex B regions have to deploy low-carbon technologies in order to curb their emissions (except the US as it remains outside the Kyoto protocol). Such deployment leads to cost reductions of these technologies that, assuming global spillovers, are shared by the non-Annex B regions. As a result, these technologies become more attractive in the non-Annex B regions and, hence, they become more de-ployed, resulting in less CO2 emissions in this region. However, in case of no emissions trading and no or regional (Annex B/non-Annex B) learning spillovers, mitigation efforts in the Annex B regions do no lead to cost reductions of technology deployment in the non-Annex B regions and, hence, to no changes in the technology mix and corresponding emis-sions of the non-Annex B regions. Therefore, owing to the presence of global learning spillovers, the imposition of emission constraints in the Annex B regions may induce car-bon-sharing technological change and, thus, less CO2 emissions in the non-Annex B re-gions, even when the latter regions do not face carbon constraints. However, although of all cases considered by Barreto and Klaassen (2004) the impact of the presence of global learn-ing spillovers on non-Annex B emissions is the largest in the case of the ‘Kyoto-trend’ sce-nario with no emissions trading, the size of this impact is limited to approximately 1 GtC in 2100 (about 10 percent of the non-Annex B baseline emissions in the late 21st century) be-cause the reduction target of this scenario is weak and the learning mechanism can be ob-served only in electricity generation technologies. In contrast, in the case considered above, the impact of the presence of global learning spill-overs is much smaller (or almost absent) on Annex B emissions. This is due to the fact that for the Annex B regions (except the US), the level of emissions is determined by the mitiga-tion target of the ‘Kyoto-trend’ scenario and, hence, the presence or absence of global learn-ing spillovers has little impact on the carbon emissions of these regions (although, as indi-cated above, it may affect the costs of achieving the emission target). Therefore, in the case of no emissions trading, the impact of global learning spillovers on total, global carbon emissions is hardly determined by its impact on Annex B emissions but predominantly by its effect on non-Annex B emissions, as outlined above. However, when global emissions trading is introduced, the impact of global learning spill-overs on non-Annex B (and global) emissions becomes much smaller (or even zero). This is due to the fact that emissions trading lowers the amount of (high-cost) emission reductions in the Annex B regions, resulting in less deployment of carbon-saving technologies in these permit-buying regions and, hence, to less learning spillovers to non-Annex B regions. Moreover, any emission reduction realised in non-Annex B regions (either due to emissions trading or global learning spillovers) can be traded to Annex B regions, thereby leaving global emissions unaffected.

126 Report 500036 002 (ECN-C--05-014)
B.6.6 Comparing two approaches on induced technological spillovers The section above has discussed some major findings by Barreto et al. (Barreto and Klaas-sen, 2004; Barreto and Kypreos, 2004a) on the impact of induced technological spillovers on carbon emissions in (unconstrained) developing regions, while Chapter 3 has dealt with comparable findings by Grubb et al. (2002a and 2002b). A comparison of these two ap-proaches of induced technological spillovers offers some useful insights on this issue, nota-bly with regard to the implications of the underlying assumptions and methodologies for the major findings of these studies. Firstly, as noted above, of all cases considered by Barreto and Klaassen (2004), the impact of induced technological spillovers on carbon emissions in (unconstrained) developing re-gions is the largest in the case of the ‘Kyoto-for-ever’ scenario with global learning spill-overs and no emissions trading, in which case this impact is approximately 1 Gt in 2100 (i.e. about 10% of the assumed baseline emissions of these regions). In contrast, as indi-cated in Chapter 3 (Figure B.1), Grubb et al. (2002b) estimate this impact in their case of full spillover (σ = 1) at about 11 Gt in 2100 (i.e. some 85% of the assumed baseline emis-sions of the non-Annex B regions). These differences in impact of induced technological spillovers on carbon emissions in (unconstrained) developing regions can be attributed to the following factors: • The character of the two studies. The findings of Barreto and Klaassen (2004) are based
on a sound analysis of the interaction between emissions trading and induced techno-logical spillovers by means of a well-established scientific model, whereas the results of Grubb et al (2002b) are based on simple, hardly tested assumptions on the presence of international spillovers in order to provide a numerical illustration of the potential role and significance of these spillovers.
• The assumed baseline scenario. Barreto and Klaassen (2004) base their estimate of the reference emissions in developing regions for the year 2100 on the SRES-B2 scenario (developed with the MESSAGE model), while Grubb et al. (2002b) take as their base-line the SRES A2 scenario of the IPCC (2000a). However, this factor can explain only a small part of the difference in impact of induced technological spillovers found by these studies as the reference emissions in developing regions for the year 2100 are estimated at approximately 11 GtC in the SRES-B2 scenario and about 13 GtC in the SRES-A2 scenario.
• The stringency of the carbon constraint in the developed regions (i.e. either ‘Annex B’ or ‘Annex I’ regions). In Barreto and Klaassen (2004), the mitigation target for the year 2100 is relatively weak (‘Kyoto-for-ever’), while in Grubb et al. (2002b) it is rather stringent (i.e. Kyoto until 2012 followed by a decline in Annex I emissions by 1% per year thereafter). Moreover, in the analyses of Barreto and Klaassen (2004), the US re-mains outside the Kyoto Protocol, whereas in the illustrative example of Grubb et al. (2002b), it participates in the stringent mitigation commitments for the Annex I regions. Therefore, compared to Barreto and Klaassen (2004), the incentives for induced techno-logical change in developed regions are much larger in Grubb et al. (2002b).
• The meaning and implication of the concept ‘global/international technological spill-overs’. As outlined in Section 2.2, Grubb et al. (2002b) employ a broad definition of this concept, including (i) spillovers due to economic substitution (‘carbon leakage’), (ii) spillovers due to diffusion of technological innovations, and (iii) spillovers due to policy and political influence of developed countries’ mitigation efforts on developing coun-tries’ abatement actions. In their case of full spillover (σ = 1), this definition covers the full, global diffusion of all energy/carbon-saving innovations at both the supply and de-mand side of the whole economic system, including cost reductions and other perform-ance improvements of these technologies such as enhancing energy/carbon efficiency. On the other hand, in Barreto and Klaassen (2004; as well as in almost all other bottom-up energy system studies), the concept of global technological spillovers refers particu-larly to the fact that the benefits of technological learning (i.e. cost reductions) due to

Report 500036 002 (ECN-C--05-014) 127
the deployment of a given technology in a certain region also spread to other regions, thereby improving the attractiveness of deploying this technology also in these regions. More specifically, in the case of global technological spillovers studied by Barreto and Klaassen, this concept refers only to the cost reduction effects of a few learning tech-nologies on the supply side of the electricity generating system, while ignoring all other energy/carbon technologies of the economic system as well as all other aspects of im-proving the performance of these technologies besides cost reduction, notably enhanc-ing carbon/energy efficiency. Moreover, in the study of Barreto and Klaassen, the diffu-sion of carbon-saving technologies in developing regions may be restricted due to cost-competitive considerations and, hence, the power-generating technology mix in these regions may divert significantly from this mix in developed regions (see also the discus-sion below). In the study of Grubb et al., however, it is assumed that in case of full global technological spillovers the average carbon intensity in developing regions con-verges to the same level of the (declining) carbon intensity in the developed regions by the end of the 21st century. Hence, whereas in Grubb et al. (2002b), the average carbon intensity in the year 2100 is assumed to be the same in developing and developed re-gions, in Barreto and Klaassen (2004) this intensity may be substantially higher in de-veloping, carbon-unconstrained regions than in developed, carbon-constrained regions due to different cost considerations in these regions. Therefore, the concept global/international technological spillovers has a far broader meaning and implication in Grubb et al. (2002b) than in Barreto and Klaassen (2004).
Together, these factors - notably the multiplication of the third and fourth factor mentioned above - explain the large difference in impact of induced technological spillovers on carbon emissions in developing regions for the year 2100 as estimated in the considered cases of Barreto and Klaassen (at approximately 1 Gt) and Grubb et al. (about 11 GtC). Secondly, another useful insight offered by comparing the studies of Grubb et al. and Bar-reto et al. concerns the role of incentives in deploying emission-saving technologies in case of no emissions trading between developed, constrained regions and developing, uncon-strained regions. In the studies of Barreto et al., these technologies are deployed in devel-oped regions as far as they become more attractive than alternative, more carbon-intensive technologies due to endogenous, global learning effects (i.e. cost reductions) of emission-reducing technologies as well as endogenous, climate policy induced effects of raising the costs of alternative technologies, while in the developing regions only the global learning effects apply. In the study of Grubb et al., however, emission-saving technologies are dif-fused in developed regions due to autonomous and endogenous factors, notably stringent policy-induced carbon constraints. In case of full global technology spillovers and no emis-sions trading between developed and developing regions, these technologies are assumed to be widely deployed in developing regions regardless their cost implications compared to alternative technologies that might be more carbon-intensive, but cheaper. However, why should developing countries in such a case deploy emission-reducing technologies, for in-stance carbon storage or fuel switching technologies for generating electricity, if cheaper, but more carbon-intensive alternatives are available? Of course, incentives to encourage the diffusion of emission-saving technologies in developing regions could be enhanced by in-troducing carbon constraints in these regions and/or allowing emissions trading between developed and developing regions. However, allowing such trading has a variety of coun-teracting effects on the performance of climate policy and induced technological change (as discussed below), while introducing effective carbon constraints in developing countries may be politically hard to realise, particularly in the short and medium term (and it dis-charges the politically attractive statement that, owing to global technology spillovers, emis-sions in developing regions can be reduced substantially without introducing carbon con-straints in these regions).

128 Report 500036 002 (ECN-C--05-014)
Finally, an additional useful insight offered by comparing the studies of Grubb et al. and Barreto et al. refers to the interrelated effects of emissions trading on the performance of climate policies and induced technological change. More specifically, these effects can be distinguished into: • The impact of emissions trading on technology deployment and learning effects. As dis-
cussed above, emissions trading lowers the amount of high-cost emission reductions in constrained regions, resulting in less deployment of carbon-saving technologies in these permit-buying regions and, in case of (global) learning effects, in less cost reductions of these technologies (and less spillovers to other regions). In the permit-selling regions, however, the deployment of (other) carbon-saving technologies is encouraged, including their potential (global) learning effects. Hence, emissions trading has two counter-acting effects on the process of technology deployment and learning at the regional level, and the final outcome depends, among other things, on the relative weights of these two ef-fects (Barreto and Klaassen, 2004; Barreto and Kypreos, 2004a).91
• The impact of emissions trading on regional and global carbon levels. In the absence of technological spillovers, emissions trading has no impact on the total amount of global carbon emissions but only on its distribution among participating regions. However, when technological spillovers are present, emissions trading between constrained and unconstrained regions does have an impact on the total amount of global carbon emis-sions as any carbon reduction in unconstrained regions due to technological spillovers can be traded to constrained regions, thereby enhancing emissions in these constrained regions as well as at the global level, compared to the case when such trading is not al-lowed. Actually, the potentially high impact of full global technological spillovers on global emissions, as illustrated by Grubb et al. (2002b), depends critically on the as-sumption of no emissions trading between constrained and unconstrained regions (al-though, paradoxically, CDM-based emissions trading might be a major channel to pro-mote full international technology spillovers to unconstrained regions). If they would have allowed such trading, global carbon emissions would have been much higher (the same applies to the technology spillovers explored by Barreto and Klaassen, although the size of these spillovers are much smaller). Hence, in the presence of global techno-logical spillovers, global emissions are lowest when emissions trading between con-strained and unconstrained regions is not allowed.
• The impact of emissions trading on abatement costs. In general the (static) costs or GDP losses of achieving a given mitigation target are lowest when full, unrestricted emissions trading is allowed on a global scale (Weyant and Hill, 1999; Sijm et al. 2000). This im-plies that an abatement strategy that does not allow such trading ends up in higher costs. This applies particularly for the strategy illustrated by Grubb et al. (2002b) as its abate-ment target for the year 2100 is rather stringent for the constrained regions while it does not allow emissions trading between constrained and unconstrained regions. Hence, the costs or GDP losses of this strategy could most likely be reduced substantially if such trading would be allowed. However, as explained above, allowing emissions trading be-tween constrained and unconstrained regions implies that global emissions levels will be higher (as it allows unconstrained regions to trade their emission reductions resulting from global technological spillovers). Therefore, in the presence of global technological spillovers, there seems to be a trade-off between an abatement strategy with full, unre-stricted emissions trading - which implies lower costs - and an abatement strategy with no or restricted emissions trading (which implies lower global emissions). The optimal outcome of this trade-off may be hard to determine as it depends on the size of the global spillover effects versus the amount of cost savings owing to full emissions trad-
91 For instance, in case of no emissions trading, a carbon constraint in developed regions may encourage the
deployment of wind or nuclear technologies in these regions (and through global learning effects also in de-veloping regions), while allowing CDM-based emissions trading may encourage the deployment of solar PV in developing regions (with potential learning spillovers to developed regions).

Report 500036 002 (ECN-C--05-014) 129
ing. Hence, further research on the optimal trading regime in the presence of global technological spillovers seems warranted.
• The impact of emissions trading on dynamic efficiencies. It is sometimes stated that forbidding or restricting emissions trading would stimulate induced technological change (ITC) in constrained regions, which may lead to dynamic efficiencies such as lower abatement costs and/or higher abatement levels in the long run. However, some counter-arguments to this statement can be raised. Firstly, as discussed above, with re-gard to the process of technology deployment and learning, emissions trading has counter-acting effects in constrained versus unconstrained regions, but the final outcome is ambiguous. Secondly, a similar argument can be applied with regard to R&D-based ITC, in the sense that emissions trading may discourage R&D-based ITC in constrained regions, while encouraging it in unconstrained regions. However, according to Buonanno et al. (2000), even if restrictions on emissions trading stimulate, on balance, R&D-based ITC, the impact on overall abatement costs and economic growth appears to be detrimental as the cost savings achieved through unrestricted emissions trading seems to stimulate growth more than the increase of R&D-driven innovations achieved through trade ceilings (as discussed in Section 5.2). Finally, as emissions trading lowers the short-term (static) costs of an abatement target, governments may be willing to ac-cept a more stringent target, which may enhance the inducement of developing and dif-fusing carbon-saving innovations.
To conclude, emissions trading has a variety of counter-acting and counter-balancing ef-fects on the performance of abatement policies in the presence of induced technological change and international spillovers. Although insights in these effects have grown over the past years, little is still known about the final, empirical outcome of these effects and, hence, additional research seems to be warranted.
B.6.7 Major similarities in performance of ITC bottom-up studies In contrast to the ITC top-down studies (see previous chapter, notably Section 5.3), the ITC bottom-up studies reviewed in the present chapter show some major similarities in perform-ance, in terms of both methodological approach and major findings of the models used. In order to explore the interaction between climate policy and induced technological change (ITC), these studies have used a detailed, bottom-up energy technology system model in which learning curves have been added to the cost functions of (some) energy technologies covered by these models. The major findings of these studies are that, due to the presence of ITC (i.e. ‘learning technologies’), (i) the investment costs of these technologies decline if they built up capacity (‘experience’), (ii) the energy technology mix changes in favour of those technologies that built up the relatively highest rate of learning (i.e. cost reduction), and (iii) the total abatement costs of a given abatement target decline significantly.92 However, although there is a large degree of agreement among bottom-up studies with re-gard to these results, the size of the impact of ITC on, for instance, the technology mix or abatement cost may vary substantially between these studies depending on the assumed rate of technological learning, the number of learning technologies included in the analysis, the time frame considered, the stringency of the mitigation target, etc. Evaluation of ITC bottom-up studies: strengths and weaknesses The major strength of ITC bottom-up studies is that they provide a detailed, and rather con-crete picture of the process of induced technological change, particularly of the diffusion
92 In general, bottom-up ITC studies assume a given abatement target in their mitigation scenarios and, hence,
they do not analyse the impact of ITC on emission reductions or similar global warming indicators (although they sometimes explore this impact in their baseline scenario by comparing this scenario with and without ITC).

130 Report 500036 002 (ECN-C--05-014)
and deployment of energy and carbon-saving technologies due to learning-by-doing (in con-trast to the often highly aggregated, and rather abstract paintings generated by ITC top-down studies that are often focussed on technology innovation through R&D). Moreover, some recent bottom-up studies have offered valuable contributions and useful insights with regard to analysing the interaction between ITC, emissions trading and learning spillovers. On the other hand, bottom-up ITC studies are usually faced by some weaknesses and limita-tions, including: • While the number of energy technologies included in bottom-up models is often rela-
tively large, the number of technologies characterized by endogenous learning is usually limited to a few (electricity) supply-side technologies, thereby neglecting other tech-nologies, particularly at the demand side of the energy system (Laitner and Sanstad, 2004). This leads to biased results and an underestimation of the full potential impact of ITC.
• The empirical database for estimating learning curves in general, and two-factor learn-ing curves in particular, is often weak. Moreover, the estimation of (two-factor) learning curves is often faced by statistical problems and econometrical shortcomings, leading to biased results. In addition, despite some growing insights, the technology learning phe-nomenon remains largely a ‘black box’ and sound models, able to identify the factors that underlie the learning effects, are still missing (Barreto, 2003). As a result, it is often hard to draw firm, relevant policy implications from bottom-up studies based on esti-mated learning curves.
• Bottom-up studies are usually focussed on analysing mainly the diffusion of technolo-gies (‘learning-by-doing’) and less on technological innovation through R&D invest-ments (‘learning-by-searching’). The latter channel of ITC, however, is covered by some recent bottom-up studies, although - as indicated above - these studies often suffer from statistical and econometrical shortcomings. In addition, bottom-up studies are usu-ally focussed on analysing the ITC impact of only one or two policy instruments, par-ticularly an energy/carbon tax or a technology subsidy. As a result, it is often hard to draw firm, relevant policy implications with regard to the choice and optimal mix of in-struments, either within the field of technological innovation or the field of technologi-cal diffusion, or between these fields of technological change.
• Bottom-up studies are characterised by a limited specification of the behaviour of pro-ducers and consumers, the performance of (imperfect) markets, and the feedback effects of this behaviour and performance at the macroeconomic level. Therefore, their esti-mates of GDP losses or social costs due to climate policy or ITC have to be interpreted with some prudence.
B.6.8 Major lessons and implications Despite significant progress made in endogenising technological change in bottom-up mod-elling studies over the past decade, the present state of these studies is still characterised by too many weaknesses and limitations to draw a set of firm, specific policy lessons and im-plications. Nevertheless, a few general lessons and implications can be formulated. Firstly, according to Gielen et al. (2003), 'the most important policy message from technology learning is that new technologies require markets to become commercial…. The out-standing feature of technology learning is that there are no substantial cost reductions without market interaction'. Hence, as it takes time to build up capacity (i.e. ‘learning’ or ‘experience’) and to reduce costs until a market break-even point is reached, there is a need for early policy action 'to accomplish the required cost and performance improvements in the long term, including the creation of niche markets, the development of small-scale dem-onstration plants, and targeted R&D' (Riahi et al., 2004). In addition, the (temporary and declining) subsidization of promising technologies may be considered, although the dangers of ‘picking a winner’ and becoming ‘locked-in’ an inefficient technology system have to be

Report 500036 002 (ECN-C--05-014) 131
reduced by broadly supporting a general package of renewable energy and carbon saving technologies rather than heavily subsidizing a specific technology. Even then, however, there is still the risk of ‘rent-seeking’ and ‘rent-keeping’, i.e. the incidence of political lob-bies to introduce and maintain subsidies at a fixed level. Another lesson is that, owing to the presence of spillovers, the imposition of emission con-straints in the Annex I region may induce technological change and, hence, emission reduc-tions in the non-Annex region even when the latter region does not face emission con-straints itself (Barreto and Kypreos, 2004a; Barreto and Klaassen, 2004). A major policy implication is that Annex I governments may improve the operation of spillovers and the resulting diffusion of technologies to non-Annex I countries, for instance by means of an open, fair international trading regime - including emissions trading - or by upgrading the absorptive capacity in non-Annex I countries for the transfer, deployment and further de-velopment of new technologies. It is hard, however, to draw more firm, specific policy im-plications given the trade-offs and still limited knowledge with regard to the intriguing, but complicated interaction between emissions trading, induced technological change and the presence of spillovers, including the impact of this interaction on total abatement cost and global emission reductions. A final lesson or implication is that further research is needed in order to draw more con-crete, firm policy conclusions from ITC bottom-up modelling studies. More specially, the major suggestions for additional research include: • Improving the empirical database for bottom-up studies, particularly to improve the es-
timation and interpretation of (two-factor) learning curves. • Expanding the number of learning technologies in bottom-up modelling studies, includ-
ing technologies at the demand side of the energy system. • Enlarging the focus of analysis from technology diffusion and a few related policy in-
struments to technology innovation and other instruments in order to draw firm, relevant policy implications with regard to the choice and optimal mix of policy instruments, ei-ther within the field of technological innovation or the field of technological diffusion, or between these fields of technological change.
• Intensifying the analysis of the impact of climate policy on international spillovers, in-cluding the interaction between emissions trading, induced technological change and the presence of spillovers, as well as the impact of this interaction on total abatement cost and global emission reductions.
132 Report 500036 002 (ECN-C--05-014)
B.7 Implications for post-Kyoto climate and technology policies The discussion in the previous chapters raises some major considerations and implications for the post-Kyoto agenda on climate and technology policies.93 Firstly, as argued in Chap-ter 4, the market for developing and diffusing environmental technologies is characterised by two related sets of imperfections (i.e. environmental externalities and technology market failures). Moreover, both the greenhouse effect and the spillover externality of technologi-cal change have a highly international, global character. Therefore, a well-balanced package of internationally coordinated climate and technology policies is necessary to deal with these two sets of market imperfections, in particular as long as climate policy alone is not able to address the greenhouse externality in an adequate way. In addition, it should be noted that technology policy alone will not be able to cope adequately with the issue of global warming, since an incentive - for instance a carbon tax or emission limit - is neces-sary to induce technological change in the direction of developing and diffusing emission-saving technologies.94 Secondly, it is sometimes suggested that technology diffusion should be used as an incen-tive in the international climate negotiations, for instance by excluding certain countries from the climate coalition and, thus, from the benefits of technology diffusion (or by includ-ing these countries by exchanging these benefits for the willingness to accept emission limi-tations). It may be questioned, however, whether such a strategy - notably the ‘exclusion option’ - will be feasible and efficient, because technological knowledge has a highly public (international) character, while restricting technology diffusion is not in the interest of the climate coalition for both environmental and technology learning (i.e. cost reduction) rea-sons (Tol et al., 2000 and 2001; Golombek and Hoel, 2003, and Koops, 2003). Indeed, Tol et al. (2000 and 2001) show that this strategy of ‘issue linkage’ is not cost-effective, or even counter-productive, since nobody will benefit. Rather than excluding other countries from the knowledge on emission-saving technologies, it is better to pursue an optimal diffusion of such technologies. Thirdly, the considerations above raise the question how the innovation and diffusion of emission-saving technologies can be stimulated internationally by the climate coalition. The major options include: • International co-operation on Research, Development, Demonstration and Deployment
activities (summarised as RD3; see Barreto and Klaassen, 2004). For instance, De Groot and Tang (2001) suggest the option of an international subsidy fund for the innovation and diffusion of renewable energy technologies.
• Encouraging technology diffusion through trade and other, general policies. Since diffu-sion of technology often occurs through international trade and foreign direct invest-ments, it can be promoted through general policies such as pursuing a fair open trading system or taking care of adequate financial and legal means in developing countries (IPCC, 2000b; Koops, 2003).
• Stimulating technology diffusion through emissions trading, notably the Clean Devel-opment Mechanism (CDM), and sound technology transfer strategies emphasizing, among others, local activities and sound technology capacity building that enables coun-tries to assimilate and adapt experience accumulated somewhere else (Barreto and Klaassen, 2004).
93 Besides the previous chapters, the discussion of the present chapter is based particularly on Koops (2003), as
well as relevant contributions made by IPCC (2000b), Tol et al. (2000 and 2001), Groot and Tang (2001), Buchner et al. (2002b), Grubb et al. (2002a and 2002b), Golombek and Hoel (2003), and Barreto and Klaas-sen (2004).
94 Moreover, as shown recently by Buchner and Carraro (2004), international technological cooperation without any commitment to emissions control may not lead to a sufficient abatement of greenhouse gas concentra-tions.

Report 500036 002 (ECN-C--05-014) 133
• Promoting the innovation and diffusion of carbon-saving technologies by means of vol-untary agreements (‘covenants’) between governments of the climate coalition and a few international firms that dominate R&D and technological change in certain areas, for instance the international automobile industry or the international ‘bulk power’ tech-nology generating industry (Grubb et al., 2002b; Koops, 2003). If such covenants turn out to be not effective, the imposition of well-designed international technology stan-dards could be considered.
These options should be part of the post-Kyoto agenda in order to enhance the potential positive interaction between climate policy, induced technological change and international spillovers, including the potential positive impact of this interaction on mitigating global greenhouse gas emissions and reducing total abatement costs.

134 Report 500036 002 (ECN-C--05-014)
B.8 References Annevelink, B., G.J. Nabuurs, and W. Elbersen (2004): Case Study on the Potential for Induced
Technological Spillovers in a Specific Carbon Neutral Energy Supply Industry, Climate Change and Biosphere Research Centre (CCB), Wageningen UR.
Arrow, K. (1962): 'The Economic Implications of Learning by Doing', Review of Economic Studies, Vol. 29, pp. 155-173.
Azar, C., and H. Dowlatabadi (1999): 'A Review of Technical Change in Assessment of Climate Policy', Annual Review of Energy and the Environment, Vol. 24, pp. 513-44
Bahn, O., and S. Kypreos (2002): MERGE-ETL: An Optimisation Equilibrium Model with Two Different Endogenous Technological Learning Formulations, General Energy Research Department, ENE, PSI Bericht Nr. 02-16.
Bahn, O., and S. Kypreos (2003): 'Incorporating Different Endogenous Learning Formulations in MERGE', International Journal of Global Energy Issues, Vol. 19, No. 4, pp. 333-358.
Barreto, L. (2001): Technical Learning in Energy Optimisation Models and Deployment of Emerging Technologies, Ph.D.-dissertation submitted to the Swiss Federal Institute of Technology, Zurich.
Barreto, L. (2003): Gaps and Needs in Technology Diffusion Models: The Perspective of an En-ergy –systems Modeller, IIASA, Laxenburg, paper presented to the Workshop on Clean Technologies Diffusion Modelling, IPTS, Seville, November 14, 2003.
Barreto, L., and G. Klaassen (2004): 'Emissions Trading and the Role of Learning-by-doing Spillovers in the 'Bottom-up' Energy-Systems ERIS Model', International Journal of Energy Technology and Policy, Vol. 2, No. 1-2, pp. 70-95.
Barreto, L., and S. Kypreos (2000): 'A post-Kyoto Analysis with the ERIS model Prototype', International Journal of Global Energy Issues, Vol. 14, Nos. 1-4, pp. 262-280.
Barreto, L., and S. Kypreos (2002): The Role of Spillovers of Technological Learning in a 'Bot-tom-up' MARKAL Model of the Global Energy System, Paul Scherrer Institute, Villigen.
Barreto, L., and S. Kypreos (2004a): 'Emissions Trading and Technology Deployment in an En-ergy-Systems 'Bottom-up' Model with Technology Learning', European Journal of Op-erational Research, Vol. 158, No. 1, pp. 243-261.
Barreto, L., and S. Kypreos (2004b): 'Endogenizing R&D and market Experience in the 'Bot-tom-up' Energy-Systems ERIS Model', Technovation, Vol. 24, No. 8, pp. 615-629.
Böhringer, C., and T. Rutherford (2002): 'Carbon Abatement and International Spillovers', Envi-ronmental and Resource Economics, Vol. 22, No.3, pp. 391-417.
Böhringer, C., and T. Rutherford (2004): 'Who Should Pay How Much? Compensating for In-ternational Spillovers form Carbon Abatement Policies to Developing Countries - A Global CGE Assessment', Computational Economics, Vol. 23, pp. 71-103.
Bollen, J. (2004): A trade View on Climate Change Policies, a multi-region multi-sector ap-proach, Ph.D-dissertation, Netherlands Institute of Public Health and the Environment (RIVM), Bilthoven.
Buchner, B., and C. Carraro (2004): Economic and Environmental Effectiveness of a Technol-ogy-based Climate Protocol, Nota di Lavoro 61.2004, Fondazione Eni Enrico Mattei (FEEM), Milan.

Report 500036 002 (ECN-C--05-014) 135
Buchner, B., C. Carraro, and I. Cerosimo (2002): 'Economic Consequences of the U.S. With-drawal from the Kyoto/Bonn Protocol', Climate Policy, Vol. 2, No. 4, pp. 273-292.
Buchner, B., C. Carraro, I. Cerosimo, and C. Marchiori (2002): Back to Kyoto? Participation and the Linkage between R&D and Climate Cooperation, FEEM, University of Venice.
Buonanno, P., C. Carraro, and M. Galeotti (2003): 'Endogenous Induced Technical Change and the Costs of Kyoto', Resource and Energy Economics, Vol. 25, No.1, pp. 11-34.
Buonanno, P., C. Carraro, E. Castelnuovo, and M. Galeotti (2000): 'Emission Trading Restric-tions with Endogenous Technological Change', International Environmental Agree-ments: Politics, Laws and Economics, Vol. 1, No. 3, pp. 379-395.
Capros, P., and A. Chryssochoides (2000): 'Further Experiments with ERIS Model Prototype Sensitivity Analysis for Post-Kyoto', International Journal of Global Energy Issues, Vol. 14, Nos. 1-4, pp. 281-288.
Capros, P., and E. Vouyoukas (2000): 'Technology Evolution and Energy Modelling: Overview of Research and Findings', International Journal of Global Energy Issues, Vol. 14, Nos. 1-4, pp. 1-32.
Capros, P., and L. Mantzos (2000): 'Endogenous Learning in European Post-Kyoto Scenarios: Results form Applying the Market Equilibrium Model PRIMES', International Journal of Global Energy Issues, Vol. 14, No. 1-4, pp. 249-261.
Carraro, C. (2003): Economic Impacts and Environmental Effectiveness of the Present Climate Regime, University of Venice and Fondazione Eni Enrico Mattei (FEEM).
Carraro, C., R. Gerlagh, and B. van der Zwaan (2003): 'Endogenous Technical Change in Envi-ronmental Macroeconomics', Resource and Energy Economics, Vol. 25, pp. 1-10.
Christiansen, A.C. (2001): 'Climate Policy and Dynamic Efficiency Gains - A Study on Norwe-gian CO2-taxes and Technological Innovation in the Petroleum Sector', Climate Policy, Vol. 1, No. 4, pp. 499-515.
Cincera, M., and B. van Pottelsberghe de la Potterie (2002): International R&D Spillovers: A Survey.
Coe, D., and E. Helpman (1995): 'International R&D Spillovers', European Economic Review, Vol. 39, pp. 859-887.
Coe, D., E. Helpman, and A. Hoffmaister (1997): 'North-South R&D Spillovers', The Economic Journal, Vol. 107, pp. 134-149.
Criqui, P., J.M. Martin, L. Schrattenholzer, T. Kram, L. Soete, and A. van Zon (2000): 'Energy Technology Dynamics', International Journal of Global Energy Issues, Vol. 14, Nos. 1-4, pp. 65-103.
Criqui, P., S. Mima, and L. Viguier (1999): 'Marginal abatement costs of CO2 emission reduc-tions, geographical flexibility and concrete ceilings: an assessment using the POLES model', Energy Policy. Vol. 27, pp. 585-601.
Dowlatabadi, H. (1998): 'Sensitivity of Climate Change Mitigation Estimates to Assumptions about Technical Change', Energy Economics, Vol. 20, No. 5-6, pp. 473-493.
Driessen, D. (2003): 'Does Emissions Trading Encourage Innovation?', Environmental Law Re-porter, Vol. 32 (January).
Feber, M. de, G.J. Schaeffer, A. Seebregts, and K. Smekens (2003): Enhancements of Endoge-nous Technology Learning in the Western European MARKAL model; Contributions to the EU SAPIENT Project, ECN-C--03-032, Energy research Centre of the Netherlands (ECN), Petten/Amsterdam.
136 Report 500036 002 (ECN-C--05-014)
Feber, M., A. Seebregts, and K. Smekens (2002): Learning in Clusters - Methodological Issues and Lock-out Effects, Paper presented at the International Energy Workshop (IEW), Stanford University, 18-20 June 2002.
Fischer, C., I. Parry, and W. Pizer (2003): 'Instrument Choice for Environmental Protection when Technological Innovation is Endogenous', Journal of Environmental Economics and Management, Vol. 23, pp. 237-255.
Galeotti, M., E. Castelnuovo, G. Gambarelli, and S. Vergalli (2003), Learning by Doing vs Learning by Researching in a Model of Climate Change Policy Analysis, FEEM, Nota di Lavoro 11.2003, Milan.
Galeotti, M., N. Cantore, C. Carraro, and I. Cerosimo (2002): Endogenous Technical Change in Climate Policy Models - An Application with the FEEM-RICE Model, FEEM, Milan.
Gerlagh, R. (2003): Induced Technological Change under Technology Competition, Institute for Environmental Studies, Working Paper D02-01, Vrije Universiteit, Amsterdam (also available as Note di Lavoro 5.2003, FEEM, Milan).
Gerlagh, R., and B. van der Zwaan (2003): 'Gross World Product and Consumption in a Global Warming Model with Endogenous Technological Change', Resource and Energy Eco-nomics, Vol. 25, No.1, pp. 35-57.
Gerlagh, R., and B. van der Zwaan (2004): 'A Sensitivity Analysis of Timing and Costs of Greenhouse Gas Emissions Reductions under Learning Effects and Technology Compe-tition', Climate Change, Vol. 65, pp. 39-71.
Gerlagh, R., and W. Lise (2003): Induced Technological Change under Carbon Taxes, FEEM Nota di Lavoro 84.2003, Institute for Environmental Studies, Amsterdam.
Gerlagh, R., B. van der Zwaan, M. Hofkes, and G. Klaassen (2004): 'Impacts of CO2 Taxes in an Economy with Niche Markets and Learning-By-Doing', Environmental and Re-source Economics, Vol. 28, pp. 367-394.
Gielen, D., N. Mattsson, F. Unander, and C.O. Wene (2003): Technology Learning in the IEA ETP Project – A Discussion Paper, Paper presented at the EU/IEA workshop 'Experi-ence Curves: Tool for Energy Policy Analysis and Design', January 22-24, 2003, IEA. Paris.
Golombek, R., and M. Hoel (2003): Climate Policy and Technology Spillover, Memorandum No. 22/2003, Department of Economics, University of Oslo.
Goulder, L., and K. Mathai (2000): 'Optimal CO2 Abatement in the Presence of Induced Tech-nological Change', Journal of Environmental Economics and Management, Vol. 39, No. 1, pp. 1-38.
Goulder, L., and S. Schneider (1999): 'Induced Technological Change and the Attractiveness of CO2 Abatement Policies', Resource and Energy Economics, Vol. 21, No. 3-4, pp. 211-253.
Griliches, Z. (1992): 'The Search for R&D Spillovers', Scandinavian Journal of Economics, Vol. 94, Supplement, pp. S29-S47.
Gritsevskyi, A., and N. Nakicenovic (2000): 'Modelling Uncertainty of Induced Technological Change', Energy Policy, Vol. 28, No. 13, pp. 907-921.
Groot, H. de, and P. Tang (2001): 'Klimaatbeleid: Nu of Later?', Economisch Statistische Be-richten (ESB), Vol. 86, No. 4328, 11-10-2001, pp. D12-13.
Grubb, M. (2000a): 'Economic Dimensions of Technological and Global Responses to the Kyoto Protocol', Journal of Economic Studies, Vol. 27, No. 1-2, pp. 111-125.

Report 500036 002 (ECN-C--05-014) 137
Grubb, M. (2000b): The Kyoto Protocol: An Economic Appraisal, FEEM Working Paper No. 30.00, Imperial College, London.
Grubb, M., and D. Ulph (2003): 'Energy, the Environment, and Innovation, Oxford Review of Economic Policy, Vol. 18, No. 1, pp. 92-106.
Grubb, M., C. Hope, and R. Fouquet (2002b): 'Climatic Implications of the Kyoto Protocol: The Contribution of International Spillover', Climatic Change, Vol. 54, pp. 11-28.
Grubb, M., J. Köhler, and D. Anderson (2002a): 'Induced Technical Change in Energy and En-vironmental Modelling: Analytic Approaches and Policy Implications', Annual Review of Energy and the Environment, Vol. 27, pp. 271-308.
Grübler, A., and A. Gritsevskyi (2002): 'A Model of Endogenous Technological Change through Uncertain Returns on Innovation', in: Grübler, A., N. Nakicenovic, and W.D. Nordhaus (eds.), Technological Change and the Environment, Resources for the Future, (RFF) Washington DC, and International Institute for Applied Systems Analysis (IIASA), Laxenburg, pp. 280-319.
Grübler, A., and S. Messner (1998): 'Technological Change and the Timing of Mitigation Measures', Energy Economics, Vol. 20, No. 5-6, pp. 495-512.
Grübler, A., N. Nakicenovic, and D. Victor (1999a): 'Dynamics of Energy Technologies and Global Change', Energy Policy, Vol. 27, pp. 247-280.
Grübler, A., N. Nakicenovic, and D. Victor (1999b): 'Modelling Technological Change: Impli-cations for the Global Environment', Annual Review of Energy and the Environment, Vol. 24, pp. 545-569.
Grübler, A., N. Nakicenovic, and W. Nordhaus (2002): 'Induced Technological Change and the Environment: An Introduction', in: Grübler, A., N. Nakicenovic, and W.D. Nordhaus (eds.), Technological Change and the Environment, Resources for the Future (RFF), Washington DC, and International Institute for Applied Systems Analysis (IIASA), Laxenburg, pp. 1-8.
Grünfeld, L. (2002): International R&D Spillovers and the Effect of Absorptive Capacity - An Empirical Study, NUPI Paper no. 630, Norwegian Institute of International Affairs, Oslo.
Hayami, Y., and V. Ruttan (1985): Agricultural Development - An International Perspective, Johns Hopkins University Press.
Hicks, J. (1932): The Theory of Wages, MacMillan, London.
Hourcade, J. et al. (1996): Estimating the Costs of Mitigating Greenhouse Gases. In: Bruce, J., H. Lee, and E. Haites (eds.): Climate Change 1995- Economic and Social Dimensions of Climate Change. IPCC, Cambridge University Press, pp. 263-296.
IEA (2000): Experience Curves for Energy Technology Policy, OECD/IEA, Paris.
IEA (2003): Creating Markets for Energy Technologies, OECD/IEA, Paris.
IPCC (2000a): Emissions Scenarios, Special Report on Emissions Scenarios (SRES). Intergov-ernmental Panel on Climate Change (IPCC), Cambridge University Press, Cambridge.
IPCC (2000b): Methodological and Technological Issues in Technology Transfer, Special Re-port. Intergovernmental Panel on Climate Change (IPCC), Cambridge University Press, Cambridge.
IPCC (2001): Climate Change 2001: Mitigation, Contribution of Working Groups III to the Third Assessment Report of the Intergovernmental Panel on Climate Change, Cam-bridge University Press, Cambridge.
138 Report 500036 002 (ECN-C--05-014)
Jaffe, A. (1998): 'The Importance of 'Spillovers' in the Policy Mission of the Advanced Tech-nology Program', Journal of Technology Transfer, Vol.23, No.2, pp.11-19.
Jaffe, A., and K. Palmer (1997): 'Environmental Regulation and Innovation', Review of Econom-ics and Statistics, Vol. 79, No. 4, pp. 610-19.
Jaffe, A., R. Newell, and R. Stavins (2000): Induced Invention, Innovation and Diffusion: An Integrated Application to Energy-Saving Technology, Working Paper, Resources for the Future, Washington, D.C.
Jaffe, A., R. Newell, and R. Stavins (2003): 'Technological Change and the Environment', in: Mäler, K.G., and J. Vincent (eds.), Handbook of Environmental Economics, Volume 1, Chapter 11, North-Holland/Elsevier Science, Amsterdam, pp. 461-516.
Jaffe, A., R. Newell, and R. Stavins (2004): 'Technology Policy for Energy and the Environ-ment', Innovation Policy and the Economy, Vol. 4, pp. 35-68.
Jaffe, A., R. Newell, and R. Stavins (2002): 'Environmental Policy and Technological Change', Environmental and Resource Economics, Vol. 22, pp. 41-69.
Keller, W. (2001): International Technology Diffusion, NBER Working Paper 8573, National Bureau of Economic Research, Cambridge.
Kelly, D., and C. Kolstad (1998): 'Integrated Assessment Models for Climate Change Control', in: Folmer, H., and T. Tietenberg (eds.), International Yearbook of Environmental and Resource Economics 1999/2000: A Survey of Current Issues, Edward Elgar, Chelten-ham, UK.
Kemfert, C. (2004): Induced Technological Change in a Multi-Regional, Multi-Sectoral Inte-grated Assessment Model (WIAGEM), DIW Discussion Paper No. 435, German Insti-tute for Economic Research (DIW), Berlin (forthcoming in Ecological Economics, Spring 2005).
Klaassen, G., A. Miketa, K. Riahi, and L. Schrattenholzer (2001): Targeting Technological Progress towards Sustainable Development, Environmentally Compatible Energy Strategies (ECS) Project, International Institute for Applied Systems Analysis (IIASA), Laxenburg.
Kohler, J. (2002): Modelling Technological Change, Technical Report No. 3, Tyndall Centre for Climate Change Research.
Koops, K. (2003): Technologiebeleid, interne notitie, Ministerie van Economische Zaken, Di-rectie Energiestrategie en Verbruik, Den Haag.
Kooten, G. van (2004): Climate Change Economics – Why International Agreements Fail, Ed-ward Elgar Publishing Ltd, Cheltenham.
Kouvaritakis, N., A. Soria, and S. Isoard (2000a): 'Modelling Energy Technology Dynamics: Methodology for Adaptive Expectations Models with Learning by Doing and Learning by Searching', International Journal of Global Energy Issues, Vol. 14, Nos. 1-4, pp. 104-115.
Kouvaritakis, N., A. Soria, S. Isoard, and C. Thonet (2000b): 'Endogenous Learning in World post-Kyoto Scenarios: Application of the POLES Model under Adaptive Expectations', International Journal of Global Energy Issues, Vol. 14, Nos. 1-4, pp. 222-248.
Kram, T., A. Seebregts, G.J. Schaeffer, L. Barreto, S. Kypreos, S. Messner, and L. Schratten-holzer (2000): 'Technology Dynamics in Energy Systems Models with Perfect Fore-sight', International Journal of Global Energy Issues, Vol. 14, Nos. 1-4, pp. 48-64.
Report 500036 002 (ECN-C--05-014) 139
Kratena, K., and S. Schleicher (1999): Emissions Reduction Policies and Induced Technological Change: Microeconomic Evidence and Macroeconomic Impacts of the Austrian Kyoto Policy Package, Austrian Institute of Economic Research and Economics Department, University of Graz.
Kuik, O. (2004): Spillovers owing to Carbon Leakage, Assessment for the National Research Programme on Climate Change (Third Draft: June 2004), Institute for Environmental Studies, Vrije Universiteit, Amsterdam.
Kverndokk, S., K. Rosendahl, and T. Rutherford (2001): Climate Policies and Induced Techno-logical Change: Which to Choose the Carrot or the Stick? Memorandum No.26/2001, Department of Economics, University of Oslo.
Kverndokk, S., K. Rosendahl, and T. Rutherford (2003): Climate Policies and Induced Techno-logical Change: The Impacts of Timing of Policy Instruments, Ragnar Risch Centre for Economic Research, Oslo.
Kypreos, S., and O. Bahn (2003a): 'A MERGE Model with Endogenous Technological Pro-gress', Environmental Modelling and Assessment, Vol. 8, pp. 249-259.
Kypreos, S., and O. Bahn (2003b): Optimal Timing in Carbon Abatement Policies under En-dogenous Technological Learning (ETL) Considerations, Paul Scherrer Institute, Villi-gen.
Kypreos, S., L. Barreto, P. Capros, and S. Messner (2000): 'ERIS: A Model Prototype with En-dogenous Technological Learning', International Journal of Global Energy Issues, Vol. 14, Nos. 1-4, pp. 374-397.
Kypreos. S. (2002): Modelling Experience Curves in MERGE, Paul Scherrer Institute (PSI), Villigen.
Laitner, J., and A. Sanstad (2004): 'Learning-by-Doing on Both the Demand and the Supply Sides: Implications for Electricity Utility Investments in a Heuristic Model', Interna-tional Journal of Energy Technology and Policy, Vol. 2, No. 1-2, pp. 142-152.
Lako, P. (2004): Spillover Effects from Wind Power, Case study in the framework of ‘Spillover study’ (draft June 23rd, 2004), Energy Research Centre of the Netherlands (ECN), Pet-ten/Amsterdam.
Lanjouw, J., and A. Mody (1996): 'Innovation and the International Diffusion of Environmental Responsive Technology', Research Policy, Vol. 25, No. 4, pp. 549-571.
Löschel, A. (2002): 'Technological Change in Economic Models of Environmental Policy: A Survey', Ecological Economics, Vol. 43, No. 2-3, pp. 105-126.
Luiten, E. (2001): Beyond Energy Efficiency - Actors, Networks and Government Intervention in the Development of Industrial Process Technologies, Ph.D.-dissertation, Utrecht Uni-versity.
Luiten, E., and K. Blok (2004): 'Stimulating R&D of Industrial Energy-Efficient Technology. Policy Lessons – Impulse Technology', Energy Policy, Vol. 32, pp. 1087-1108.
Manne, A., and L. Barreto (2004): 'Learning-by-doing and Carbon Dioxide Abatement', Energy Economics, Vol. 26, No. 4, pp. 621-633.
Manne, A., and R. Richels (2000): International Carbon Agreements, EIS Trade and Leakage, Stanford University and Electric Power Research Institute.
Manne, A., and R. Richels (2003): MERGE – Presentation to EMF 21, Stanford University and Electric Power Research Institute.
Manne, A., and R. Richels (2004): 'The Impact of Learning-by-doing on the Timing and Costs of CO2 Abatement', Energy Economics, Vol. 26, No. 4, pp. 603-619.

140 Report 500036 002 (ECN-C--05-014)
McDonald, A., and L. Schrattenholzer (2001a): 'Learning Curves and Technology Assessment', International Journal of Technology Management, Vol. 23, No. 7/8, pp. 718-745.
McDonald, A., and L. Schrattenholzer (2001b): 'Learning Rates for Energy Technologies', En-ergy Policy, Vol. 29, pp. 255-261.
Messner, S. (1997): 'Endogenized Technological Learning in an Energy Systems Model', Jour-nal of Evolutionary Economics, Vol. 7, No. 3, pp. 291-313.
Miketa, A., and L. Schrattenholzer (2004), 'Experiments with a Methodology to Model the Role of R&D Expenditures in Energy Technology Learning Processes; First Results', Energy Policy, Vol. 32, No. 15, pp. 1679-1692.
Mulder, P. (2003), On the Economics of Technology Diffusion and Energy Efficiency, Ph.D.-dissertation, Ponsen & Looijen.
Mulder, P., H. de Groot, and M. Hofkes (2003): 'Explaining Slow Diffusion of Energy-Saving Technologies; a Vintage Model with Returns to Diversity and Learning-by-using', Re-source and Energy Economics, Vol. 25, No.1, pp. 105-126.
Nakicenovic, N. (2002): 'Technological Change and Diffusion as a Learning Process', in: Grübler, A., N. Nakicenovic, and W.D. Nordhaus (eds.), Technological Change and the Environment, Resources for the Future (RFF), Washington DC, and International Insti-tute for Applied Systems Analysis (IIASA), Laxenburg, pp. 160-181.
Neij, L., P. Andersen, and M. Durstewitz (2003b): The Use of Experience Curves for Assessing Energy Policy Programmes, Paper presented at the EU/IEA workshop 'Experience Curves: Tool for Energy Policy Analysis and Design', January 2003, IEA. Paris.
Neij, L., P. Andersen, M. Durstewitz, P. Helby, M. Hoppe-Kilpper, and P. Morthorst (2003a): Experience Curves: A Tool for Energy Policy Assessment, Environmental and Energy Systems Studies, Lund University, Sweden.
Newell, R., A. Jaffe, and R. Stavins (1999): 'The Induced Innovation Hypothesis and Energy-Saving Technological Change', The Quarterly Journal of Economics, August, Vol. 114, No. 3, pp. 941-975.
Nordhaus, W. (2002), 'Modelling Induced Innovation in Climate Change Policy', in: Grübler, A., N. Nakicenovic, and W.D. Nordhaus (eds.), Technological Change and the Envi-ronment, Resources for the Future (RFF), Washington DC, and International Institute for Applied Systems Analysis (IIASA), Laxenburg, pp. 182-209.
Nordhaus, W., and J. Boyer (1999): Roll the DICE Again: The Economics of Global Warming, MIT Press.
Oikonomou, V., M. Patel, and E. Worrell (2004): Does Climate Policy lead to Relocation with Adverse Effects for GHG Emissions or Not? A First Assessment of the Spillovers of Climate Policy for Energy-Intensive Industry, Department of Science, Technology and Society (STS), Utrecht University, Copernicus Institute, Utrecht.
Parry, I. (2001): On the Implications of Technological Innovation for Environmental Policy, Re-sources for the Future, Washington, D.C.
Parry, I., W. Pizer, and C. Fischer (2001): How Large are the Welfare Gains from Technologi-cal Innovation Induced by Environmental Policies?, Resources for the Future, Washing-ton, D.C.
Popp, D. (2001): 'The Effect of New Technology on Energy Consumption', Resource and En-ergy Economics, Vol. 23, No. 3, pp. 215-239.
Popp, D. (2002): 'Induced Innovation and Energy Prices', American Economic Review, Vol. 92, No. 1, pp. 160-180.
Report 500036 002 (ECN-C--05-014) 141
Popp, D. (2003a): Lessons from Patents: Using Patents to Measure Technological Change in Environmental Models, NBER Working Paper 9978, National Bureau of Economic Re-search, Cambridge, USA.
Popp, D. (2003b): 'Pollution Control Innovations and the Clean Air Act of 1990', Journal of Policy Analysis and Management, Vol. 22, No. 4, pp. 641-660.
Popp, D. (2004c): ENTICE: Endogenous Technical Change in de DICE Model of Global Warm-ing, NBER Working Paper 9762, National Bureau of Economic Research, Cambridge, USA.
Popp, D. (2004a): ENTICE-BR: The Effect of Backstop Technology R&D on Climate Policy Models, NBER Working Paper 10285, National Bureau of Economic Research, Cam-bridge, USA.
Popp, D. (2004b): R&D Subsidies and Climate Policy: Is there a 'Free Lunch'?, Syracuse Uni-versity, New York, and National Bureau of Economic Research, Cambridge, USA.
Riahi, K., E. Rubin, M. Taylor, L. Schrattenholzer, and D. Hounshelt (2004): 'Technological Learning for Carbon Capture and Sequestration Technologies', Energy Economics, Vol. 26, No. 4, pp. 539-564.
Riahi, K., L. Barreto, and S. Rao (2003): Long-term Perspectives for Carbon Capture in Power Plants: A Scenario for the 21st Century', Interim Report submitted to Carnegie Mellon University, IIASA Reference 00-133 ECS, Laxenburg.
Rosendahl, K. (2002): Cost-Effective Environmental Policy: Implications of Induced Techno-logical Change, Discussion Paper No. 314, Statistics Norway, Research Department.
Schmitz, S. (2001): Do Energy Prices Induce Progress in Energy-related Technology? An Em-pirical Study, HWWWA Discussion Paper No. 147, Hamburg Institute of International Economics, Hamburg.
Schneider, S., and L. Goulder (1997): 'Achieving Low-Cost Emissions Targets', Nature, Vol. 389, pp. 13-14.
Schrattenholzer, L. (2002): Analysing the Case Studies from the Perspective of the R&D and Deployment Model, The Rapporteur’s Report, Environmentally Compatible Energy Strategies (ECS) Project, International Institute for Applied Systems Analysis (IIASA), Laxenburg.
Schrattenholzer, L., Y. Fuije, P. Criqui, L. Soete, and A. van Zon (2000): 'A Longer-Term Out-look on Future Energy Systems', International Journal of Global Energy Issues, Vol. 14, Nos. 1-4, pp. 348-373.
Seebregts, A, T. Kram, Schaeffer, G.J., and A. Bos (2000): 'Endogenous Learning and Technol-ogy Clustering: Analysis with MARKAL model of the Western European Energy Sys-tem', International Journal of Global Energy Issues, Vol. 14, Nos. 1-4, pp. 289-319.
Seebregts, A., G. Goldstein, and K. Smekens (2001): Energy/Environmental Modelling with the MARKAL Family of Models', ECN-RX-01-039, Energy research Centre of the Nether-lands (ECN), Petten.
Seebregts, A., T. Kram, G.J. Schaeffer, A. Stoffer, S. Kypreos, L. Barreto, S. Messner, and L. Schrattenholzer (1999): Endogenous Technological Change in Energy Systems Models - Synthesis of Experience with ERIS, MARKAL, and MESSAGE, ECN-C--99-025, Energy research Centre of the Netherlands (ECN), Petten.
Sijm, J. (2002): The Performance of Feed-in Tariffs to Promote Renewable Electricity in Euro-pean Countries, ECN-C--02-083, Energy Research Centre of the Netherlands (ECN), Petten/Amsterdam.

142 Report 500036 002 (ECN-C--05-014)
Sijm, J., F. Ormel, J. Martens, S. van Rooijen, M. Voogt, M. van Wees, and C. de Zoeten-Dartenset (2000): Kyoto Mechanisms - The Role of Joint Implementation, the Clean De-velopment Mechanism and Emissions Trading in Reducing Greenhouse Gas Emissions, ECN-C--00-026, Energy Research Centre of the Netherlands (ECN), Pet-ten/Amsterdam.
Sijm, J., L. Brander, and O. Kuik (2002): Cost Assessments of Mitigation Options in the Energy Sector - Conceptual and Methodological Issues, ECN-C--O2-040, Energy research Centre of the Netherlands (ECN), Petten/Amsterdam, and Institute for Environmental Studies, Vrije Universiteit, Amsterdam.
Smekens, K. (2004): Clean Technology Diffusion Modelling: Gaps and Needs – Technological change in the MARKAL Model, Energy research Centre of the Netherlands (ECN), Pet-ten.
Smekens, K., P. Lako, and A. Seebregts (2003): Technologies and Technology Learning, Con-tributions to IEA's Energy Technology Perspectives, ECN-C--03-046, Energy Research Centre of the Netherlands (ECN), Petten.
Smulders, S., and M. de Mooij (2003): 'The Impact of Energy Conservation on Technology and Economic Growth', Resource and Energy Economics, Vol. 25, pp. 59-79.
Söderholm, P., and T. Sundqvist (2002): Learning Curve Analysis for Energy Technologies: Theoretical and Econometric Issues, Lucea University of Technology, Lucea, and In-ternational Institute of Applied Systems Analysis (IIASA), Laxenburg.
Stavins, R. (2002): Experience with Market-Based Environmental Policy Instruments, FEEM Working Paper No. 52.2002, Kennedy School of Government, Harvard University, pre-pared for The Handbook of Environmental Economics, edited by K.G. Mäler and J. Vincent, North-Holland/Elsevier Science, Amsterdam.
Sue Wing, I. (2003): Induced Technical Change and the Cost of Climate Policy, Report No. 102, Boston University and MIT Joint Program on the Science and Policy of Global Change, Boston.
Tol, R., W. Lise and B. van der Zwaan (2000), Technology Diffusion and the Stability of Cli-mate Coalitions, Note di Lavoro 20.2000, FEEM, Milan.
Tol, R., W. Lise, B. Morel, and B. van der Zwaan (2001): Technology Development and Diffu-sion and Incentives to Abate Greenhouse Gas Emissions, Research Unit Sustainability and Global Change, FNU-6, Centre for Marine and Climate Research, Hamburg Uni-versity, Hamburg.
Turton, H., and L. Barreto (2004): The Extended Energy-Systems ERIS Model: An Overview, Interim Report IR-04-010, IIASA, Laxenburg.
Weyant, J., and J. Hill (1999): 'Introduction and Overview', in: Energy Journal (Special Issue on ‘The Costs of the Kyoto Protocol: A Multi-Model Evaluation’): pp. 1-24.
Weyant, J., and T. Olavson (1999): 'Issues in Modelling Induced Technological Change in En-ergy, Environment, and Climate Change', Environmental Modelling and Assessment, Vol. 4, No. 2 and 3, pp. 67-85.
Wigley, T., R. Richels, and J. Edmonds (1996): 'Economic and Environmental Choices in the Stabilization of Atmospheric CO2 Concentrations', Nature, Vol. 379, 18 January 1996, pp. 240-243.
Zon, A. van, and I. Yetkiner (2003): 'An Endogenous Growth Model with Embodied Energy-Saving Technical Change', Resource and Energy Economics, Vol. 25, pp. 81-103.

Report 500036 002 (ECN-C--05-014) 143
Zwaan, B. van der, and R. Gerlagh (2002): A Sensitivity Analysis of Timing and Costs of Green-house Gas Emission Reductions under Learning Effects and Niche Markets – A Study with DEMETER, ECN-C—02-067, Energy research Centre of the Netherlands (ECN), Petten/Amsterdam.
Zwaan, B. van der, R. Gerlagh, G. Klaassen, and L. Schrattenholzer (2002): 'Endogenous Tech-nological Change in Climate Change Modelling', Energy Economics, Vol. 24, No. 1, pp. 1-19.
Zwaan, B. van der, and A. Seebregts (2004), 'Endogenous Technological Change in Climate-Energy-Economic Models: An Inventory of Key Uncertainties', International Journal of Energy Technology and Policy, Vol. 2, No. 1-2, pp. 130-141.

144 Report 500036 002 (ECN-C--05-014)

Report 500036 002 (ECN-C--05-014) 145
APPENDIX C: DOES CLIMATE POLICY LEAD TO RELOCATION WITH ADVERSE EFFECTS FOR GHG EMISSIONS OR NOT?
V. Oikonomou M. Patel
Department of Science, Technology and Society (STS) Copernicus Institute/Utrecht University
E. Worrell
Energy Analysis Department Environmental Energy Technologies Division
Lawrence Berkeley Laboratory Berkeley, USA

146 Report 500036 002 (ECN-C--05-014)
Report 500036 002 (ECN-C--05-014) 147
C.0 Summary for policymakers This paper is part of the 'Spillovers form climate policy' project that contains a number of parallel assessment case studies on carbon leakages and induced technological change, as a result of climate change policies. In this case study we focussed on the positive and nega-tive impacts of the climate policies on the energy intensive industry, based on existing stud-ies and empirical results. Energy-intensive industries play a special role in climate policy. Worldwide, industry is re-sponsible for about 50% of greenhouse gas emissions. The emission intensity makes these industries an important target for climate policy. At the same time these industries are par-ticularly vulnerable if climate policy would lead to higher energy costs, and if they would be unable to offset these increased costs. The side effects of climate policy on GHG emis-sions in foreign countries are typically referred to as 'spillovers'. Negative spillovers reduce the effectiveness of a climate policy, while positive spillovers increase its effectiveness. This paper provides a review of the literature on the spillover effects of climate policy for carbon intensive industries. Based on the historical development of the regional production of energy intensive products by regions, we can conclude that industrialized countries have been losing global market shares of energy-intensive bulk materials in the last decades. We reviewed the production factors that drive investment decisions to favour location in developing countries and tried to extract their significance. The factors of production are changing globally, so that the his-torical comparative advantages of a country cannot be considered as given for an invest-ment. As a consequence of globalisation and the advent of multinational corporations in de-veloping countries, the production factors seem to be converging across the globe. It was, however, not possible to conduct a comparative analysis of investment decision criteria for industrialized versus developing countries because the required data, especially on produc-tion costs, were not available. In order to be comprehensive, such an analysis would also need to account for other factors such as the vicinity to customers and the endowment with domestic raw materials. Furthermore, we examined the effect of the environmental regulations on relocation of the energy intensive sectors. In theory, environmental regulations drive up fixed and variable costs, which should result in lower profitability and hence a reduction of competitiveness. However, available studies have shown that environmental policy in the past generally has not been a significant decision criterion for the location of the investment and hence does not represent a key explanatory factor for the investments in the developing world (reloca-tion). This conclusion was drawn based on the outcome of empirical analyses on the so-called 'pollution haven' hypothesis. According to this hypothesis industries relocate produc-tion facilities to countries with less stringent environmental requirements. The empirical studies show that the cost effects of the environmental regulation are very small, or even negligible. In general, compliance costs as a result of environmental policy are limited in pollution intensive industries, and other cost factors seem to be more decisive investment criteria, with the most important ones being market size and growth (regional demand) and the wage level. Empirical analyses have failed to prove an effect of environmental regula-tions on the relocation of high polluting industries. Hence, there is no significant evidence that more stringent environmental regulation promotes the relocation of polluting industries. The limited effect of environmental policy seems plausible also in view of the companies’ pursuit of higher value added products and their concomitant relatively low interest in con-ventional energy intensive products. It is also supported by statements of industry represen-tatives who point out that all countries that are attractive for investment have rather strin-gent environmental legislation and that secondly, the multinationals would risk their reputa-

148 Report 500036 002 (ECN-C--05-014)
tion by investing in pollution havens. Moreover, most global players tend to use the most recent technology worldwide since this minimises planning cost and maintenance cost (typical examples: basic chemicals, cement, pulp and paper). We compared these empirical findings with results from climate policy models. We focus-sed on models that explicitly address energy intensive industries (for the steel sector). Ac-cording to these models even very moderate climate policies (tax or allowance levels of 10-25 $/tonne of CO2) lead to severe leakage (and hence also to substantial relocation). This is in contrast to the empirical studies on pollution control and raises questions about the reliability of the models. Since the climate policy models do not seem to account espe-cially for differences in elasticities across countries/regions and time periods (past, present, future), we conclude that the modelling results are subject to major uncertainties. Another reason for doubting the reliability of the results is that none of the models reviewed seems to be have been calibrated for longer periods in the past (no publications are known on this subject matter). Moreover, if environmental policy has so far been a decision criterion of subordinate importance (according to the pollution haven literature) one would expect this to be even more the case for climate policy; the reason is that CO2 emissions can be avoided by energy efficient technologies, not rarely even at by lower production cost. In contrast, traditional emissions can often only reduced by add-on-technologies, which generally in-crease production cost. At the same time it needs to be kept in mind that globalisation is gradually changing the business conditions. In addition, climate policy has been rather soft in the past and this applies also to most other environmental policies, which have led to the implementation of end-of-pipe technologies and inherently cleaner and more efficient proc-esses. In contrast, climate policy, if undertaken seriously, could have a stronger impact on business decisions in future. However, this argument seems to explain only partly the con-tradictory results of empirical analyses and models since according two of the three steel models reviewed, substantial leakage rates are to be expected even at (very) low CO2 tax levels. One of the key factors, which seem to be undervalued in current models, is the fact that the location of production facilities is determined to a large extent by the demand for the products. Factoring this element into the model would lead to clearly less drastic results for relocation. The results obtained with energy and emission models when simulating the consequences of climate policy is often reported by means of a compact indicator called 'leakage rate' or 'leakage'. Leakage is defined as the ratio of the increased GHG emissions in Non-Annex I countries relative to the decrease of GHG emissions in Annex I countries. Leakage hence quantifies how much of the policy-induced emission reduction in Annex I countries is 'eaten up' by emission increase in Non-Annex I countries. While the concept of this indicator seems plausible, its usefulness for policy making is nevertheless limited. This has to do with the fact that leakage is a derived indicator, which does not provide the full picture (see Chapter 5.2). It is therefore not advisable to make comparisons and to draw policy conclu-sions on the basis of the indicator 'leakage' only. The energy and carbon intensity of energy-intensive industries is rapidly declining in most developing countries, reducing the 'gap' between industrialized and developing countries. Still, considerable potential for emission reduction exists, both in developing and industrial-ized countries. Technology development is likely to deliver further reductions in energy use and CO2 emissions, when supported in a suitable manner. While, this development will mainly take place in industrialized countries, developing countries will be the most impor-tant markets for these technologies. Despite the potential for positive spillovers in the energy-intensive industries, none of the models used in the analysis of spillovers of climate policies has an endogenous representa-tion of technological change for the energy-intensive industries. Recently, several groups
Report 500036 002 (ECN-C--05-014) 149
have started to incorporate mechanisms to simulate changes in technology performance as a function of development and deployment, but none addresses demand side technologies, and especially not in the energy-intensive industries. The ambiguous results of the empirical studies in both positive and negative spillovers with the modelling results warrant further research in this field. Empirical research is needed to improve the understanding of technology development in industry, especially focusing on the role of policy and international technology transfer patterns (e.g. global suppliers, changing trade patterns, role of FDI, and potential spillovers on local firms). Further re-search needs to be conducted to better understand the production factors and their impor-tance for investment decisions. This could be carried out with interview-based and bottom-up analyses of the drivers, revealing the relevance of each of the production factors and evaluating the macro and microeconomic variables. This could help modellers to construct more realistic mechanisms for projecting carbon leakage and technological change in cli-mate models. To summarize, the main policy-relevant conclusions are: • that the indicator 'leakage rate' (or 'leakage') is, per se, insufficient for policy making • that the beneficial effect of technology transfer to developing countries on the reduction
of greenhouse gas emissions (positive spillovers) is substantial for energy-intensive in-dustries (but has so far not been quantified in a reliable manner)
• that environmental policy has been a subordinate criterion for investment decisions • that even in a world of pricing CO2 emissions, there is a good chance that net spillover
effects are positive given the unexploited no-regret potentials and the technology and know-how transfer by foreign trade and educational impulses from Annex I countries to Non-Annex I countries.

150 Report 500036 002 (ECN-C--05-014)
C.1 Introduction Energy-intensive industries play a special role in climate policy. World-wide, industry is responsible for about 50% of greenhouse gas (GHG) emissions (Price et al., 1998). About three quarters of these emissions are caused by energy-intensive industries (estimate based on IEA, 2003a and 2003b) that produce iron and steel, aluminium, chemicals, fertilizers, cement and pulp and paper.95 The emission intensity makes these industries an important target for climate policy. At the same time these industries are particularly vulnerable if climate policy would lead to higher energy costs, and if they would be unable to offset these increased costs. Policymakers do not want to harm the relative international competitive po-sition of these industries due to climate policy, since it could lead to relocation. Firm reloca-tion is a particular form of location adjustment of firms due to changes in markets, envi-ronmental regulations, technological progress etc. (Pellenbarg et al, 2002)96. In the context of this paper we refer to relocation as the move of industries to countries with less stringent climate policies or lower energy prices. It has therefore been the goal of policymakers to design and implement policy instruments, which avoid or at least minimize the risk of relo-cation. However, since there is so far hardly any experience with the effects of climate poli-cies (and therefore a lack of quantitative information), this paper first analyses the effect of past environmental regulations and then draws conclusions for future climate policy. The side effects of climate policy on GHG emissions in foreign countries are typically re-ferred to as 'spillovers'. Negative spillovers reduce the effectiveness of a climate policy, while positive spillovers increase its effectiveness (IPCC, 2001). Negative spillovers of climate policy, which are also referred to as carbon leakage, can be caused by: • Relocation of energy-intensive industries to countries with a less stringent climate pol-
icy, which potentially could lead to lower production costs. However, energy-efficiency improvement due to climate policy may lower the energy costs and provide ancillary (productivity) benefits to energy-intensive industries.
• Increased net imports of energy-intensive goods from countries which have no or a less stringent climate policies and more carbon intensive production structures.
• Reduction in global energy prices due to reduced demand in climate-constrained coun-tries, reducing the incentive for energy-efficiency improvement for energy-intensive in-dustries in countries without climate targets.
Positive spillovers of climate policy can be caused by: • Development of energy efficient and low-GHG technologies in climate-restrained coun-
tries and implementation of these technologies around the world including countries that are not participating in climate stabilization regimes.
95 The power sector is sometimes also considered as energy intensive sector but it has been excluded from the
analysis presented in this paper since relocation of the power sector over large distances has not been ob-served so far. The main reasons are technical and economic obstacles due to grid losses and grid capacity and, moreover, supply security considerations.
96 Another way of paraphrasing the term relocation is 'the move of a manufacturing process from one place to another' (Mucielli and Saucier, 1997) which is in contrast to 'expansion investments' of an industry (Sleuwae-gen and Pennings, 2004). Pellenbarg et al. (2002) distinguish firm relocation from firm location, where relo-cation explicitly takes into account that one location is substituted for another. Different schools of relocation theories are 1) the neoclassical approach: see Nakosten and Zimmer, (1987), Krumme (1969), Krugman (1995), Pellenbarg (1995), Louw (1996), Neary (2001); 2) the behavioural approach, see Pred (1969), Meester (1999), Pellenbarg (1985), Schmenner (1982), Scott (2000); and 3) the institutional approach, see Krumme (1969), Abler et al. (1971), Ball (1998).

Report 500036 002 (ECN-C--05-014) 151
Developing countries are not expected to implement climate policies in the short term. Spillovers may therefore occur between industrialized countries with climate policies and developing countries. Since not all industrialized countries are introducing climate policies in the short term, spillovers could also occur between industrialized countries with and without climate policies. Moreover, even among industrialized countries with climate poli-cies, spillovers could occur. Two cases can be distinguished, namely that • uniform policy measures are implemented while all other (economic) factors of produc-
tion differ without, in total, compensating each other or that • diverse policy measures are implemented, again without being compensated by the spe-
cific national conditions. The extent of positive and negative spillovers is likely to differ in all these cases. It is cur-rently unclear whether these are predominantly negative or positive (IPCC, 2001). In this report we attempt to answer this question, thereby primarily using published analyses and a limited amount of empirical work. While parts of the report deal with the energy intensive industry in general we describe and analyse the developments using the example of the iron and steel industry. In Chapter 2, we set out with a description of production trends for energy intensive prod-ucts. This leads us in Chapter 3 to a categorization of different types of relocation and we make an attempt to identify the relocation type for the steel industry. In Chapter 4, the im-portance of production factors for relocation is discussed. This is followed by a discussion of the results of three detailed models for the steel sector in Chapter 5. Chapter 6 deals with potential positive spillovers of climate policy. We end with conclusions in Chapter 7 and a bibliography.

152 Report 500036 002 (ECN-C--05-014)
C.2 Production trends for energy intensive products In the context of globalisation, the relocation of industries and services to countries with more advantageous production factors is currently widely discussed. While climate policy is sometimes considered as one of the drivers, it is widely acknowledged that this is not the only factor. To put the discussion around climate policy induced developments into per-spective, it is hence useful to study the macro-trends over time, reaching back to periods when climate policy was not yet implemented. Figure C.1 shows the global production shares of industrialized countries (without ex-USSR) for five important energy intensive products. In OECD countries, these five prod-ucts together account for approximately 80% of the total energy use of the energy intensive sectors (OECD, 2002). On average, the industrialized countries’ global production shares have decreased from 87% to 76% for paper (1971-2000), from 80% to 57% for aluminium (1981-2000), from 89% to 57% for steel (1971-2000), from 67% to 46% for nitrogenous fertilizers (1981-1996) and from 63% to 26% for cement (1981-2000). In the respective pe-riods, production of steel and cement increased in the industrialized countries to levels of 420-480 Mt97 (steel) and 442-498 Mt (cement) respectively. Between 1981and 2000, the production of paper and aluminium in industrialized countries (without ex-USSR) increased by substantial 110-245 Mt (paper) and 2-14 Mt (aluminium) respectively. Still, the produc-tion in developing countries and the former USSR grew even faster as is shown by the negative slope of the curves in Figure C.1.
0%
10%
20%
30%
40%
50%
60%
70%
80%
90%
100%
1971
1973
1975
1977
1979
1981
1983
1985
1987
1989
1991
1993
1995
1997
1999
Prod
uctio
n in
indu
stria
lized
cou
ntrie
s*) /
Glo
bal p
rodu
ctio
n (t/
t)
SteelPaperAluminiumCementFertilizers
*) Without countries of the former USSR.
Figure C.1 Global production shares of energy-intensive products in industrialized coun-
tries
97 Megatonnes = million tonnes (metric)

Report 500036 002 (ECN-C--05-014) 153
The breakdown per region for steel presented in Figure C.2 shows that the increase of the developing countries’ share from 10.8% to 42.8% was primarily caused by the growth of production in China and that the entire remaining developing world except for Sub-Saharan Africa increased their shares substantially. The share of North America decreased (by 14%) which reflects severe restructuring of the sector. In contrast, the share of Asia Pacific OECD increased slightly and that of Europe (33 countries) decreased sharply (by 16%). This shows that there have been considerable differences in competitiveness of the steel in-dustry in industrialized countries. It is foreseeable that the industrialized countries’ share of global steel production will decline further. This is due primarily to the developments in China which is currently projected to account for 61% (58 Mt) of the forecasted two-year global increase of 94 Mt in 2004 and 2005 (IISI, 2004).
0%
10%
20%
30%
40%
50%
60%
70%
80%
90%
100%
1971 2002
Asia Pacific OECD
North America
Europe-33
Former USSR
China
Latin America All
South Asia
Other Asia Pacific
Africa Sub Sahara
North Africa and MiddleEast
Developing countries
Countries in transition
Industrialized countries
Shar
e of
glo
bal s
teel
pro
duct
ion
Figure C.2 Global production shares of steel in 1971 and 2002 in mass terms Source: IISI, 1980 and IISI, 2003 One can derive from Figure C.1 and 2 that a considerable shift in production shares has been taking place in the last decades. Climate policy has been in force since the mid to end 1990s, while in a few countries first steps were already taken in the early 1990s. It could possibly be argued that the global market shares losses observed for these energy intensive products were at least partially caused by environmental policies. On the other hand, the developments in the other years and for the other materials fit rather well with the trends in earlier periods when climate policy was not yet in force (see especially the decrease for ce-ment between 1985 and 1986). Based on the developments of global production shares, we draw as preliminary conclu-sions that firstly the effect of environmental policy in the recent past has not been very ob-vious and may have been rather low and that secondly climate policy, if (partially) respon-sible, has not been the sole driver for relocation.

154 Report 500036 002 (ECN-C--05-014)
It is not easy to derive conclusions for the future if the nature of implemented environ-mental policy becomes more stringent and/or if the boundary conditions in developing countries and/or in industrialized countries change. Both seem to be the case. The latter has to do with 'autonomous' developments, i.e. developments that are not related to climate pol-icy. In the following two chapters, we discuss the drivers and effects of autonomous devel-opments in order to understand their importance relative to environmental and climate pol-icy.

Report 500036 002 (ECN-C--05-014) 155
C.3 Types and degrees of relocation of energy intensive industries and drivers for investment decisions
As a first step to better understand the importance of climate policy for the relocation of en-ergy-intensive industries this chapter distinguishes between two extreme cases of relocation, namely • Full relocation • Zero relocation Full relocation refers to the decision of the energy intensive industry to shift its whole pro-duction to another country, e.g. from an industrialized country to a developing country. Such a transfer will take place only if the difference of production costs is very large. Full relocation can be seen as capital flight, which, in our example, would lead to a decrease of CO2 emissions in the industrialized Country And a rise by a similar amount in the host country, provided that the company uses comparable technology. Zero relocation is the other case where companies expand domestically in order to satisfy an increasing demand from abroad. Both full relocation and zero relocation have, to our knowledge, been rather limited for bulk commodity materials. In a real world, the extreme cases have limited relevance since the respective advantages and disadvantages of industrialized versus developing countries are generally not so obvi-ous. Moreover, the term 're-location' points to the shift of existing plants in industrialized countries to developing countries. It hence seems less adequate to talk about relocation whenever increased production shares in developing countries are caused by larger domes-tic demand. We therefore distinguish two drivers for changes in global market shares, namely: A) predominantly competition-based decrease of the global production share of Annex-1
countries: here the main driver is the advantage of production factors in non-Annex 1 countries (wages, energy cost, land, infrastructure etc.)
B) predominantly demand-driven decrease of the global production share of Annex-1 countries, which is mainly caused by the development of new markets in the developing world.
Environmental or climate policy has an influence on the production factors (e.g., the price of energy commodities) and hence falls under Type A, i.e. the predominantly competition-based decrease of global production shares. In contrast, the predominantly demand-driven decrease of global production shares according to Type B is rather a consequence of autonomous developments, especially the industrialization of developing countries.98 We have developed two indicators, which can help us to decide whether changes in global pro-duction shares of energy-intensive products are predominantly competition-based or pre-dominantly demand-driven (see Table C.1). According to indicator I1 in Figure C.3 the production (increase) in Non-Annex 1 countries has been mainly demand-driven for steel, paper and cement while it has been strongly ex-port-driven for aluminium. The latter has been the case since the beginning of the 1980s and the development in recent years does not indicate that environmental policy in Annex 1 countries played a major role. According to indicator I2 Annex 1 countries have lost some market share for aluminium in their own region at the beginning of the 1990s but this de-velopment came to stop very quickly, with the consequence that the ratio of net imports to Annex 1 countries to the consumption in Annex 1 countries has been constant since then. Since no meaningful trend for I2 can be observed for the other materials we conclude that,
98 With 'autonomous' we intend to express that the development is not linked to climate or environmental policy.

156 Report 500036 002 (ECN-C--05-014)
in general, there is no significant loss of market shares for Annex-1 countries in their own region (this is identical with the statement that Non-Annex 1 countries have generally not been gaining market shares in the rest of the world). Table C.1 Indicators for identifying the main drivers for observed changes in global mar-
ket shares Type A
Predominantly com-petition-based de-crease of global pro-duction share of An-nex-1 countries
Type B Predominantly de-mand-driven decrease of global production share of Annex-1 countries
Indicator 1: I1 = (PROD in NA1) / (CONS in NA1) = 1 + (NET_EXP from NA1 to A1) / (CONS in NA1) Is the production increase in Non-Annex 1 countries mainly de-mand-driven or is it largely export-driven?
>1 Export-driven
≤1 Demand-driven
Indicator 2: I2 = NET_IMP to A1 from NA1 / CONS in A1 Are Annex 1 countries losing market shares in their own region? (Identical with: Are Non-Annex 1 countries gaining market shares in the rest of the world?)
Yes
No/hardly
Notes: PROD: Production CONS: Consumption NET_EXP: Net exports A1: Countries with climate policy (Annex 1 countries) NET_IMP: Net imports NA1: Countries without climate policy (Non-Annex 1 countries) The analysis for the five energy-intensive materials in the last two to three decades indicates that the decrease of global production shares of Annex-1 countries has been driven pre-dominantly by the development of new markets and demand in the developing world (Type B)99. While certain production factors may be more favourable in some developing coun-tries, the developments to date do not seem to indicate that production in developing coun-tries is clearly more cost competitive. We conclude from these observations that so far, en-vironmental policies are unlikely to have influenced the industrialized countries’ global market shares to a noticeable extent. In other words, there are no clear signs of relocation (in the actual sense of the word). So far, we have discussed only the developments of and the drivers for changes in global production shares of energy intensive products for industrialized versus developing coun-tries. We have so far not addressed the question by whom the related investments are made: these could either be companies in developing countries or companies in industrialized countries. In the latter case, typically multinational enterprises (MNE’s) take the leading role. MNE’s in principle try to benefit from ownership, acquisition, location and internalisa-tion advantages (Dunning, 1977). They either set up own activities in developing countries by incurring greenfield investments or acquiring other local companies or they form joint ventures with local companies (Mergers and Acquisitions, see e.g. Blostrom et al, 2000) (see also Box C.1). For investments from abroad, some insight into past and current ongo-ing developments can be obtained by studying Foreign Direct Investment (FDI) across re-gions. The Greenfield investments open further the competition in the local markets through new entrants that try to acquire a share in the given market allocation (Gorg, 2000). On the other hand, Mergers and Acquisitions are mainly related to purchases of former public en-terprises that are available in the market after privatisation has taken place in the developing countries. As Figure C.4 shows that developing countries’ share of total FDI has changed quite considerably over time: While developing countries received a rather low share of to-tal FDI until around 1990, their share increased substantially until 1997 when the trend re-
99 Demand-driven shifts in global market shares are also known from non-energy intensive manufacturing indus-
try. For example, Heinrich von Pierer, until recently CEO of Siemens, explained: 'We grow wherever our business grows' (Lamparter, 2004).
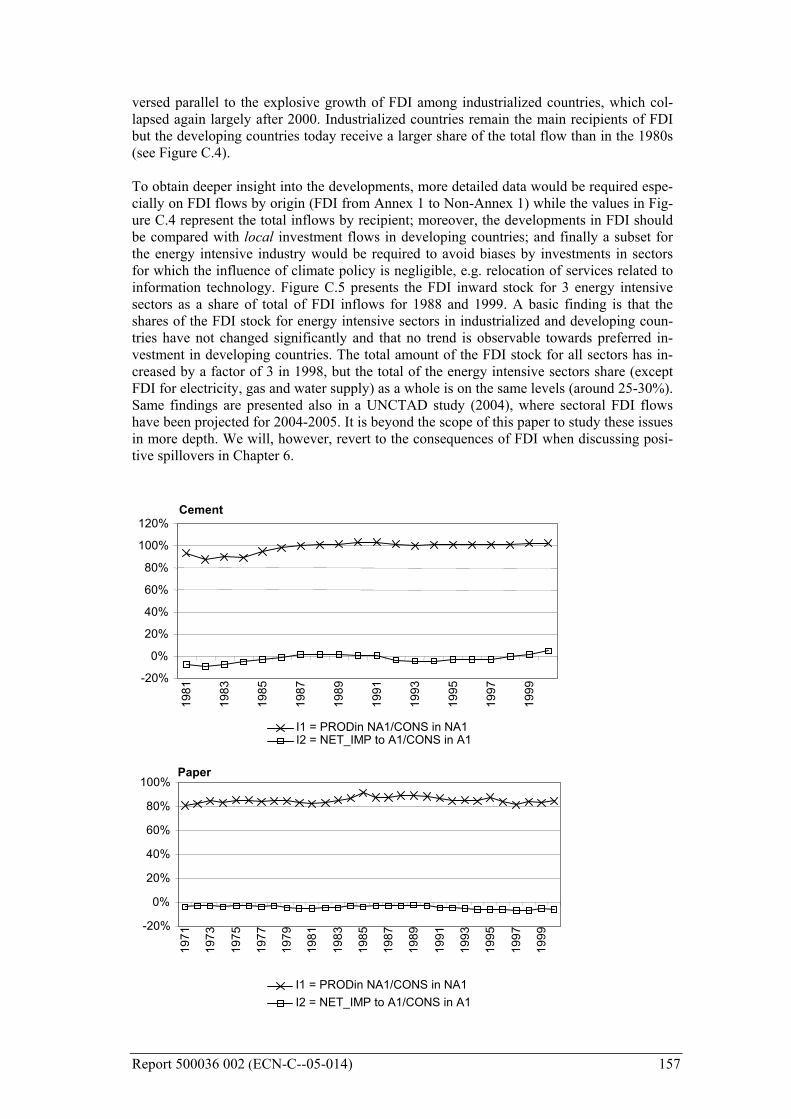
Report 500036 002 (ECN-C--05-014) 157
versed parallel to the explosive growth of FDI among industrialized countries, which col-lapsed again largely after 2000. Industrialized countries remain the main recipients of FDI but the developing countries today receive a larger share of the total flow than in the 1980s (see Figure C.4). To obtain deeper insight into the developments, more detailed data would be required espe-cially on FDI flows by origin (FDI from Annex 1 to Non-Annex 1) while the values in Fig-ure C.4 represent the total inflows by recipient; moreover, the developments in FDI should be compared with local investment flows in developing countries; and finally a subset for the energy intensive industry would be required to avoid biases by investments in sectors for which the influence of climate policy is negligible, e.g. relocation of services related to information technology. Figure C.5 presents the FDI inward stock for 3 energy intensive sectors as a share of total of FDI inflows for 1988 and 1999. A basic finding is that the shares of the FDI stock for energy intensive sectors in industrialized and developing coun-tries have not changed significantly and that no trend is observable towards preferred in-vestment in developing countries. The total amount of the FDI stock for all sectors has in-creased by a factor of 3 in 1998, but the total of the energy intensive sectors share (except FDI for electricity, gas and water supply) as a whole is on the same levels (around 25-30%). Same findings are presented also in a UNCTAD study (2004), where sectoral FDI flows have been projected for 2004-2005. It is beyond the scope of this paper to study these issues in more depth. We will, however, revert to the consequences of FDI when discussing posi-tive spillovers in Chapter 6.
-20% 0%
20% 40% 60% 80%
100% 120%
1981
1983
1985
1987
1989
1991
1993
1995
1997
1999
I1 = PRODin NA1/CONS in NA1I2 = NET_IMP to A1/CONS in A1
Cement
-20% 0%
20% 40% 60% 80%
100%
1971
19
73
1975
1977
19
79
1981
19
83
1985
19
87
1989
19
91
1993
19
95
1997
19
99
I1 = PRODin NA1/CONS in NA1I2 = NET_IMP to A1/CONS in A1
Paper
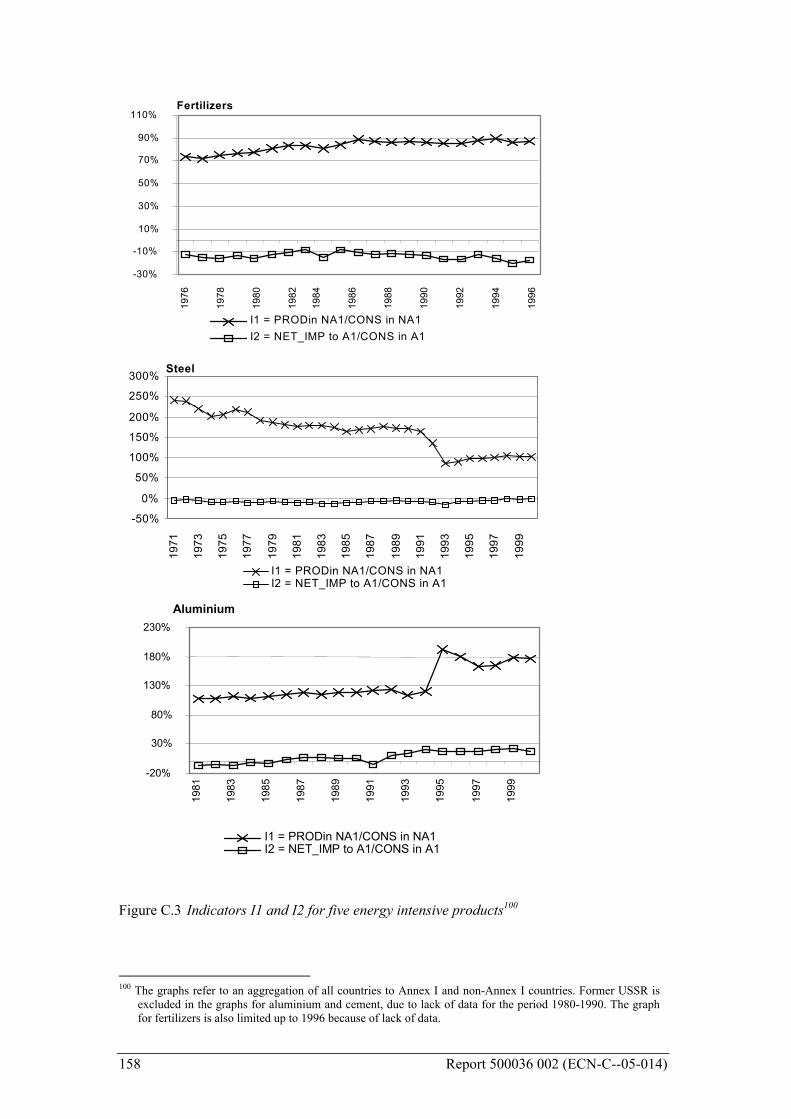
158 Report 500036 002 (ECN-C--05-014)
-30% -10% 10% 30% 50% 70% 90%
110%
1976
1978
1980
1982
1984
1986
1988
1990
1992
1994
1996
I1 = PRODin NA1/CONS in NA1 I2 = NET_IMP to A1/CONS in A1
Fertilizers
-50% 0%
50% 100% 150% 200% 250% 300%
1971
19
73
1975
19
77
1979
19
81
1983
19
85
1987
1989
19
91
1993
19
95
1997
1999
I1 = PRODin NA1/CONS in NA1I2 = NET_IMP to A1/CONS in A1
Steel
-20%
30%
80%
130%
180%
230%
1981
1983
1985
1987
1989
1991
1993
1995
1997
1999
I1 = PRODin NA1/CONS in NA1I2 = NET_IMP to A1/CONS in A1
Aluminium
Figure C.3 Indicators I1 and I2 for five energy intensive products100
100 The graphs refer to an aggregation of all countries to Annex I and non-Annex I countries. Former USSR is
excluded in the graphs for aluminium and cement, due to lack of data for the period 1980-1990. The graph for fertilizers is also limited up to 1996 because of lack of data.
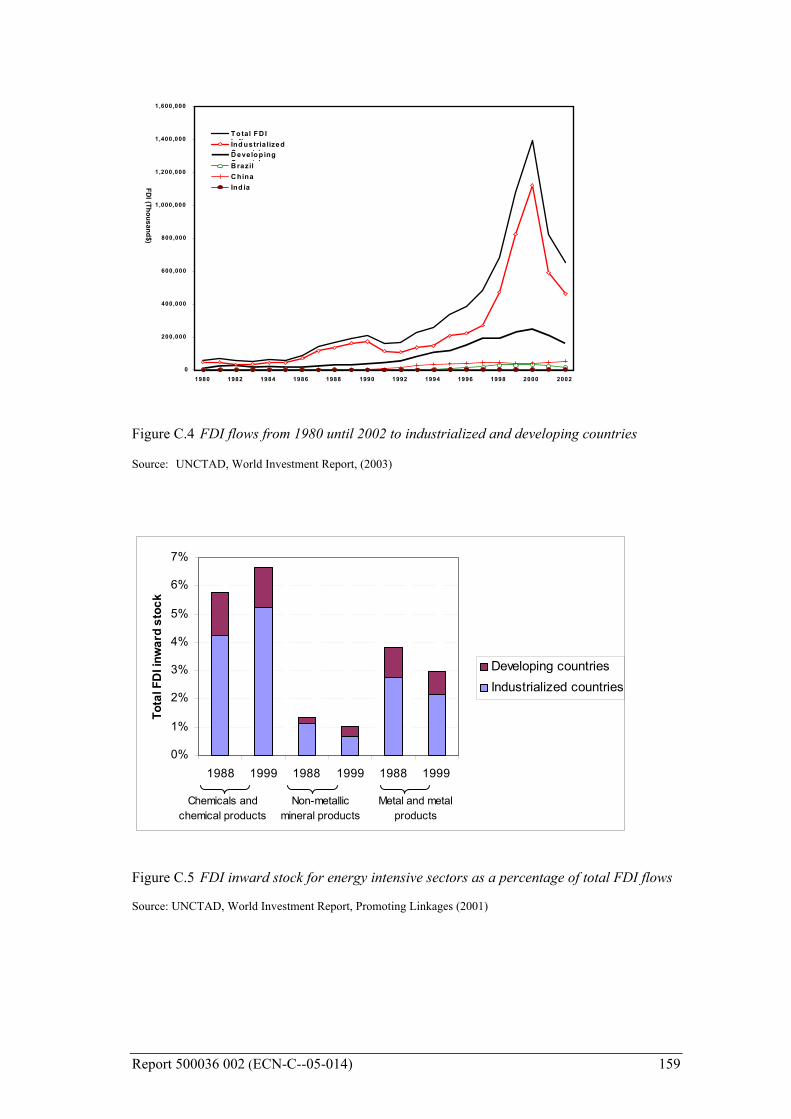
Report 500036 002 (ECN-C--05-014) 159
0
200,000
400,000
600,000
800,000
1,000,000
1,200,000
1,400,000
1,600,000
1980 1982 1984 1986 1988 1990 1992 1994 1996 1998 2000 2002
FDI (Thousand$)
T o tal F D I i flInd ustria lized C t iD evelo p ing C t iB razil C hina Ind ia
Figure C.4 FDI flows from 1980 until 2002 to industrialized and developing countries Source: UNCTAD, World Investment Report, (2003)
0%
1%
2%
3%
4%
5%
6%
7%
1988 1999 1988 1999 1988 1999
Tota
l FD
I inw
ard
stoc
k
Developing countriesIndustrialized countries
Non-metallic mineral products
Metal and metal products
Chemicals and chemical products
Figure C.5 FDI inward stock for energy intensive sectors as a percentage of total FDI flows Source: UNCTAD, World Investment Report, Promoting Linkages (2001)

160 Report 500036 002 (ECN-C--05-014)
C.4 Importance of production factors for the location of new production facilities
While we have so far taken a rather phenomenological approach of interpreting past trends in production volumes, production locations and investment flows, this chapter takes the perspective of investment decision making in energy intensive industries. First we provide an overview of production factors which are of key relevance for invest-ment decisions in the energy intensive sectors and we briefly discuss how these production factors differ between industrialized countries and developing countries and how they have been changing in the latter. Second we present the outcome of a literature survey on the relative importance of the various factors of relocation. Third we summarize empirical analyses on the importance of environmental regulation for the decision about the invest-ment location. And fourth, we draw conclusions from this chapter.
C.4.1 Overview of factors of production leading to relocation In each relocation investment decision, apart from the elements determined in a company’s cost calculation for a given product there are also intangible or hidden costs (or benefits) which do not directly enter cost but are taken into account. In this section we take the most important investment criteria into account, as they were, for example, distinguished in EBRD studies (Bevan and Estrin, 2000) and the assessment method applied by the U.S. Country Assessment Service of Business International, as described by Wheeler and Moddy (1991). Figure C.6 provides a stylised overview of production factors for industrial production and the influence of these production factors on total production costs in industrialized and de-veloping countries. Labour, energy (including taxes and environmental expenses) and – de-pending on the product and the country – raw materials and auxiliaries are often cheaper in developing countries compared to industrialized countries, while other production factors tend to be more expensive, with considerable margins in some cases. For example, with re-gard to investment cost, Yachir (1988) stated that monopolistic prices were charged for equipment to investors in the Third World (see also below). Transportation cost tended to be high for the same reason (monopolistic prices charged by shipping companies) and/or because of lacking critical mass and inadequate infrastructure in the developing country. The economies of scale in the developing countries can be enhanced through investments for promotion of specialized inputs (e.g., technology infrastructure, specialized labour, mar-keting etc), which hence reduce the average variable costs of the new incoming industries. Depending on the product and the policy regime, import barriers are either to the benefit of the developing country or the industrialized country. With the increasing implementation of WTO agreements, trade related barriers are, however, being reduced (Rumbauch and Blancher, 2004). Other important factors are export subsidies and public guarantees (for ex-ports), capital flow restrictions and price controls. In the case of less advanced technology, disadvantages for developing countries can accrue from lower efficiencies. Smaller plants in developing countries (due to smaller markets or lack of capital) lack the economies of scale that their competitors in industrialized countries can exploit. Intangible production factors (political and economic risk, expropriation risk and the adaptability to technological changes which is related to the extent of human capital and research facilities and the qual-ity of the technology/business relationships) tend(ed) to work out unfavourably for investors in developing countries. In total, these factors typically lead to higher production costs in developing countries com-pared to industrialized countries explaining why – until recently – there was rather limited
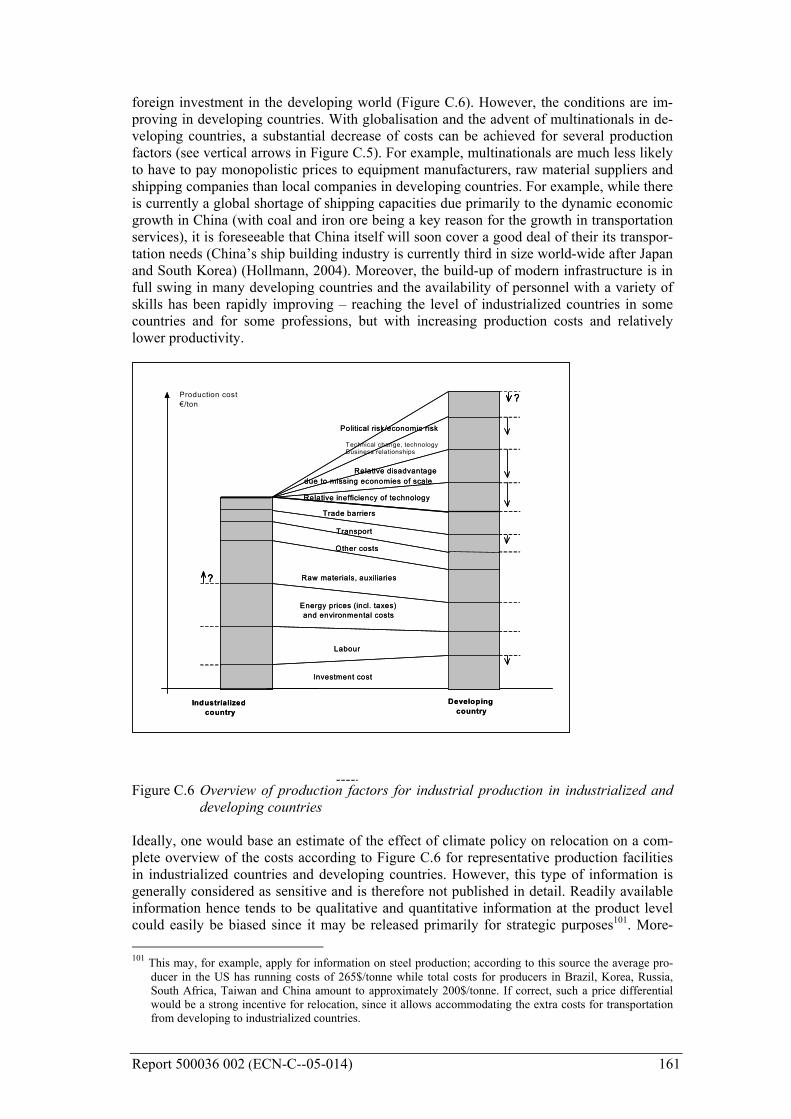
Report 500036 002 (ECN-C--05-014) 161
foreign investment in the developing world (Figure C.6). However, the conditions are im-proving in developing countries. With globalisation and the advent of multinationals in de-veloping countries, a substantial decrease of costs can be achieved for several production factors (see vertical arrows in Figure C.5). For example, multinationals are much less likely to have to pay monopolistic prices to equipment manufacturers, raw material suppliers and shipping companies than local companies in developing countries. For example, while there is currently a global shortage of shipping capacities due primarily to the dynamic economic growth in China (with coal and iron ore being a key reason for the growth in transportation services), it is foreseeable that China itself will soon cover a good deal of their its transpor-tation needs (China’s ship building industry is currently third in size world-wide after Japan and South Korea) (Hollmann, 2004). Moreover, the build-up of modern infrastructure is in full swing in many developing countries and the availability of personnel with a variety of skills has been rapidly improving – reaching the level of industrialized countries in some countries and for some professions, but with increasing production costs and relatively lower productivity.
Investment cost
Labour
Energy prices (incl. taxes) and environmental costs
Raw materials, auxiliaries
Transport
Other costs
Relative inefficiency of technology
Relative disadvantage due to missing economies of scale
Trade barriers
Political risk/economic risk
Technical change, technology Business relationships
Industrialized country
Developing country
Production cost €/ton
?
?
Investment cost
Labour
Energy prices (incl. taxes) and environmental costs
Raw materials, auxiliaries
Transport
Other costs
Relative inefficiency of technology
Relative disadvantage due to missing economies of scale
Trade barriers
Political risk/economic risk
Industrialized country
Developing country
? ?
??
Figure C.6 Overview of production factors for industrial production in industrialized and
developing countries Ideally, one would base an estimate of the effect of climate policy on relocation on a com-plete overview of the costs according to Figure C.6 for representative production facilities in industrialized countries and developing countries. However, this type of information is generally considered as sensitive and is therefore not published in detail. Readily available information hence tends to be qualitative and quantitative information at the product level could easily be biased since it may be released primarily for strategic purposes101. More- 101 This may, for example, apply for information on steel production; according to this source the average pro-
ducer in the US has running costs of 265$/tonne while total costs for producers in Brazil, Korea, Russia, South Africa, Taiwan and China amount to approximately 200$/tonne. If correct, such a price differential would be a strong incentive for relocation, since it allows accommodating the extra costs for transportation from developing to industrialized countries.
162 Report 500036 002 (ECN-C--05-014)
over, in order to be comprehensive, such an analysis would also need to account for market access, customer relations, resource availability, the innovation potential and many other factors. Among the scarce quantitative information related to production factors is the data on cost categories by industrial sector as published by statistics offices. With regard to relocation induced to climate and energy policy, the most relevant indicator that can be extracted from this source is the share of energy cost as a fraction of total cost. For the Dutch energy inten-sive industry, this fraction is around 15% for bricks and tiles, 12% for iron and steel, 8% for basic chemicals, 9.5% for pulp and paper, 7% for glass and 6% for cement (Ramirez et al, 2004). While the comparison of this type of information for developing countries and coun-tries in transition could provide some insight, a meaningful cross-Country Analysis would need to correct for important differences across countries, especially the product mix, the extent of further processing and the importance of non-productive activities such as trade and engineering services. The feasibility and usefulness of such an analysis should be fur-ther explored.
C.4.2 Literature survey on the importance of production factors in investment de-cisions
There are several studies analysing the importance of the various production factors for in-vestment decisions related to manufacturing. Quantitative analyses are typically based on regression analyses that try to present the statistical significance of each of the parameters. Many studies conclude that low wages and large market size (in million tonnes) and/or high market growth (in % GDP growth) that capture potential economies of scale are very deci-sive investment criteria (Bevan and Estrin, 2000; Brainard, 1993, Lankes and Venables, 1996, Patlbandla, 2001, Singh and Hun, 1995). In this context, proximity of product to mar-ket customers is a key criterion since it (partly) compensates for other cost factors. For en-ergy intensive industries, the FDI flows to countries with high market growth, like China (8%), India (5%), Korea (5%) and less to the rest of Asia (UNCTAD, 2001). These factors should hence also be most significant for explaining relocation. Another production factor identified in the studies is the volatility of exchange rate. Devel-oping markets under appreciation of their currency102, can import iron ore and other raw materials at lower real cost than other countries. It has been argued in the past (when reloca-tion was no issue) that this advantage can be compensated by overpriced equipment and raw materials sold to Third World countries (Yachir, 1988). As argued in Section 4.1, these dif-ferences have been decreasing or have even disappeared, hence giving more weight to the influence of exchange rates and other factors. In the past the exchange rates favoured ex-ports from the developing Asian countries, but during the past months Thailand, Indonesia and Taiwan have sold their currencies for dollars, thus weakening their currency (IWA, 2003). Since appreciation is a benefit for imports while it is a disadvantage for exports, the exchange rates that are typical for many developing countries favour the establishment of industries for serving local demand but not export driven investments (competition-based decrease of the production share of Annex-1 countries, compare Chapter 3). To conclude, exchange rates seem to have an ambiguous effect with regard to investment decisions since they depend on the development stage of a country, its fiscal policy and world economics.
102 A typical example is China, that from 1988-1993 had a dual exchange rate system, where the fixed rate with
the U.S. $ coexisted with a market determined rate in the swap centers. In 1994, the official rate was deval-ued and unified with the market rate. Since 1995, China has a floating exchange rate system (i.e. appreciated rate until 1997) although the Chinese Yuan/$ rate is set. (IMF, 2004)
Report 500036 002 (ECN-C--05-014) 163
As mentioned earlier trade barriers can - at least theoretically - influence significantly deci-sions about relocation. These barriers consist mainly of tariff measures (most commonly an ad valorem duty) or non-tariff measures that include quotas, regulations, specific policies, which are common practice in the energy intensive sectors (International Trade Administra-tion, 2000). However, no studies were found that deal explicitly with the significance of import tariffs or other political parameters. This is rather amazing since it does not seem very plausible that market mechanisms alone would be able to keep the net imports of en-ergy-intensive materials to industrialized countries at the negligible level shown in Figure C.3. Further research seems warranted also in this issue. To summarize, it is rather difficult to sketch a complete picture about the drivers for in-vestments in energy-intensive production facilities in developing countries. The basic ob-stacle is the lack of concrete quantitative information that could lead to robust conclusions. In order to reduce this uncertainty, further research through interviews should be conducted and specific cases of industries should be examined.
C.4.3 Empirical analyses on the role of environmental factors In this section we discuss the effects of environmental regulation and climate policy on re-location. All empirical data on the impact of environmental policy on industry location is based on environmental regulation, and not climate change policies. There are distinct dif-ferences between climate policy and environmental regulations. Environmental regulation often resulted in end-of-pipe technology or fuel switching, which increased production costs. In contrast, climate policy may also lead to cost savings due to improved energy-efficiency, while implementation of energy-efficient technologies may also result in ancil-lary benefits (Worrell et al., 2003).. Strong environmental regulations drive up fixed and variable costs by requiring certain equipment, increasing company costs, e.g. for auxiliaries and for waste disposal and by prohibiting or setting limits to the use of certain polluting in-puts (Xing and Kolstad, 1998). This results in lower profitability and hence a reduction of competitiveness. However, an interesting point stated by Neumayer (2001) is that both the World Bank and the World Economic forum do not include environmental compliance costs in the competitiveness indicators (referred to as attractiveness to invest in a country) they publish (World Bank, 1998b), (WEF, 1999). On the other hand, the Porter Hypothesis suggests that unilateral environmental regulation might enhance the competitiveness of domestic firms and raise profits (Porter and van der Linde, 1995). Porter argues that firms complying with environmental regulation will simul-taneously deal with X-inefficiencies103 of production that have accumulated over time. Still, there is not enough empirical evidence to prove this hypothesis (Bouman, 1998). There is a body of work testing the hypothesis that industries relocate production facilities to countries with less stringent environmental requirements. This work is generally referred to as literature on the 'pollution haven' or 'race to the bottom' hypothesis104. Most of these studies apply a similar methodology: They establish panel data for several countries (mainly including the US) and several decades. They conduct a regression analysis to understand up to which level the environmental requirements and the other production factors can play a
103 In economics, x-inefficiency is the lack of effectiveness, with which a given set of inputs is used
to produce outputs. If a firm is not producing the maximum output it can, given the resources it employs, such as men and machinery, and the best technology available, it is said to be x-inefficient. In terms of policy implications, it means that the industries face higher production costs than their optimal level.
104 Another hypothesis not explicitly examined in this paper is the 'industrial flight' (Leonard, 1988) hypothesis that refers to the 'push' of the energy intensive industries out of the industrialized countries. It is based on the push factors of relocation and therefore it is analysed parallel to the pollution haven hypothesis.

164 Report 500036 002 (ECN-C--05-014)
role. As last steps, they show the statistical significance of their results and conduct sensi-tivity analyses. The major part of this type of analysis seems to be referring to production processes which require end-of-pipe emission or waste treatment; however, it is usually not very clear to which extent energy intensive processes are included. We will revert to this point at the end of this subchapter. The prevailing conclusion of the pollution haven literature is that environmental require-ments have a rather small effect on relocation. Xing and Kolstad (1998) actually do provide some evidence that especially energy intensive production105 facilities tend to relocate to countries with less environmental obligations (see below).In contrast, Smarzynska and Wei prove through an extensive literature study that there is little evidence for supporting this case (Smarzynska and Wei, 2001)106. The latter argue also that the driving factor for reloca-tion is primarily economic growth in developing countries, thus leading to decreasing mar-ket shares of producers in industrialised countries. The developing countries that do not implement stringent environmental policies might pos-sess a comparative advantage in more polluting industries. In general, environmental costs as a result of environmental policy are rather limited in pollution intensive industries and the rest of the factors, explained in the previous chapter seem to be more decisive. Leonard (1988) and Albrecht (1998) dealt explicitly with the US and present the same re-sults.Albrecht (1998) especially observed the investment flows in relation to lower envi-ronmental standards for the period 1991-1995 for a category of industries (clean, medium polluting and dirty industries) and concluded that more polluting industries are not signifi-cantly attracted by pollution havens. Furthermore, it is strongly argued that the pollution haven hypothesis cannot be tested since it lacks empirical coverage for a number of reasons (Neumayer, 2001). Firstly, pollution abatement costs, as calculated by OECD, are considered to account for less than 2% of the GDP for most countries107. The same expenditures as a percentage of total gross fixed capi-tal formation amount (only in one case) up to 1.9. From these figures thus the extra expen-ditures of the industries are not significant to justify relocation (OECD, 2003). In this con-text, industries with increasing returns to scale will not relocate easily, if the pollution abatement costs do not rise more than a high threshold level (Markusen et al, 1995). An-other reasoning in the study of Neumayer (2001) is that even when environmental costs are high, international investors might not be deterred, as long as these standards provide clear market rules. In the developing countries the uncertainty of policy changes is much higher. The dominant empirical studies show that the cost effects of the environmental regulation are very small, or even negligible, but that increased environmental quality results in lower social costs108. Similar results appear even in the studies that initially present that invest-ment decision can be a function of environmental regulations (Xing and Koldstad, 1998). However, they also mention in their study 'it would not be appropriate to conclude that en-vironmental regulation alone can decide the direction of FDI for a polluting industry', since
105 Referred to as pollution intensive industries. However, this term is subject to a wide variety of interpreta-
tions (Leonard, 1988). In some studies, they are identified as the ones that carry the highest cost burden of pollution measures and/or incur higher pollution expenditures in proportion to total new capital expenditures that most of the industries face, see Gladwin, (1980), Mani (1996). From this criterion, five sectors are dis-tinguished: Iron and steel, non-ferrous metals, industrial chemicals, paper and pulp and non-metallic mineral products.
106 For relevant literature see Dean (1992), Zarsky (1999), Eskeland and Harrisson (1997), Letchumanan and Kodama (2000), Wheeler (2000) and others.
107 This study distinguishes between expenditure from the public and business sector. For the public sector, they range from 0.2-1.4% of the GDP, while for the business sector from 0.1-1.2% of the GDP.
108 Such exhaustive literature provided by Xing and Koldstad can be found in Walter (1982), Leonard and Duerksen (1980), Pearson (1987), Bartik (1988), Leonard (1988), McConnell and Schwab (1990), Lucas, Wheeler and Hememela (1992), Low and Yeates (1992) and Tobey (1992).

Report 500036 002 (ECN-C--05-014) 165
they assume that all the rest of the parameters (tax rates, market size and profitability) are constant across the host countries and the number of observations is low. The same evi-dence is presented by Eskeland and Harisson109 who conclude that cost differences related to pollution abatement are insignificant for investment decisions and foreign investments in high-polluting sectors are not more than those for 'cleaner' sectors (1997). The relationship of pollution havens with low-wage havens for the energy intensive indus-tries was examined in depth in a study of Mani and Wheeler (1997). The basic finding is that indeed energy intensive industries shifted part of their production to non-OECD economies, when their marginal abatement cost was rising. On the other hand, they clearly state that the pollution haven effect did not have major significance for a number of reasons. In contrast pollution haven was identified as key driver to cover the demand in the develop-ing countries was covered by domestic production. Furthermore, a significant part of the steel production share in the developing countries is shown to be a result of high income elasticities for basic industrial inputs that lead to growth. When the income in the long run grows, then these elasticities decline. Finally, the pollution havens share the same property with the low wage havens. Through the increase of the income, the developing countries demand stricter environmental regulations and therefore these countries should normally not be a long-term pole of attracting new steel industries. A general result stemming from most of the empirical studies is that there is no significant evidence that more stringent environmental regulation promotes the relocation of energy intensive industries. The only case where investment from energy intensive multinational firms as a share of total inward FDI is smaller for host countries with higher environmental standards is when the latter participate in international environmental treaties however, these findings do not survive sensitivity and robustness checks (Smarzynska and Wei, 2001). There are two important limitations when drawing conclusions from the pollution haven lit-erature for relocation due to environmental policy. Firstly, the pollution haven work mainly focuses on abatement technologies that are included in the fixed cost, (e.g. end-of-pipe technologies) and cannot capture integrated solutions of environmental technology proc-esses, resulting hence in an underestimation of the abatement cost (Bouman, 1998). As mentioned above, the pollution abatement costs are not presented significantly high. Since the share of energy cost amounts to about 10% in energy intensive industries in industrial-ized countries (see Section 4.2) ambitious environmental policy could lead to higher extra expenditures than 2%. Besides, most global players tend to use the most recent technology worldwide since this minimises planning and maintenance cost (typical examples: basic chemicals, cement, pulp and paper). Secondly, as pointed out in Section 4.1, the competi-tiveness of plants in developing countries is nowadays higher than in the period to which most of the pollution haven analyses refer. In total, we conclude that the existing studies cannot provide a clear picture about the effect of environmental policy on the relocation of energy intensive industries; but they do indicate that - if a relation between environmental policy and relocation should exist - it is statistically weak. There is need for further research of future trends in production costs and environmental (and climate) policy compliance.
109 Eskeland and Harrison examined the FDI flows patterns for Mexico, Morocco, Cote D’Ivoire and Vene-
zuela.

166 Report 500036 002 (ECN-C--05-014)
Box C.1 Trends in the steel sector
Historically, the iron and steel industry has been an industry with a strong national base. In contrast to other industries, the steel industry has only recently witnessed the emergence of multi-national corporations. This development first started with securing low-cost, high-quality raw materials (e.g. iron ore deposits in Brazil), followed by investments in the U.S. market by Asian companies (e.g. Nippon Steel, POSCO) and European companies (e.g. British Steel, Usinor) through joint ventures. These investments followed the shortage of specific steel products in the U.S. market, the re-location of steel consuming companies into the U.S. (e.g. Toyota, Honda), and the need for state-of-the-art technology to upgrade outdated plants in the U.S. (Barringer and Pierce, 2000). Investments were mainly directed at final product lines and mini-mills. This development can be seen as the start of the globalisation trend in the steel in-dustry. More recently, the globalisation trend has been led by the re-structuring of the European steel companies (e.g. Corus). However, companies like USX (the largest integrated steel maker in the US) are also becoming global operations with the investment in an integrated iron and steel plant in Slovakia. This trend is reflected in the increasing concentration of steel production by a limited number of regional and global companies (based on annual statistics of IISI). Inter-esting in this development is also the emergence of large companies based in developing coun-tries. For example, originally based in India, ISPAT has bought older integrated steel making operations in the U.S., Canada, Mexico, Trinidad, France, Germany, Kazakhstan, Algeria, Romania, Czech Republic, South Africa and Indonesia and now produces approx. 40 million tonnes per year or around 15% of global production. Also, a few Chinese steel producers have joint ventures in other countries, mainly in other Asian countries, or in U.S. iron ore deposits. Globalisation and rationalization is a recent trend in the steel industry. In the past this trend was fuelled by the relocation of important clients demanding specific high quality products. The demand for high quality steel products is also the main driver for the current international trade in steel products, and location of the steel industry. The U.S. is a net importer of steel, but mainly from industrialized countries, as the imports are mainly cold-rolled and specialty steels. Even China, although the fastest growing and largest steel producer in the world, is still a net importer, especially of high-quality cold-rolled steel. It is not necessarily clear what the future will bring. Trade globalisation will affect the iron and steel industry in China, of which parts are expected not to be competitive, which has led to a restructuring of the iron and steel industry in China. However, it is clear that the global iron and steel industry is going through a period of rapid change, restructuring and globalisation. One important trend is the continued concentration which could eventually lead to around five steel producers world-wide (expectation of ISPAT, Gehrmann, 2004); this concentration process may lead to accelerated diffusion of advanced technology (technology spillover). On the other hand, further globalisation, for example, is likely to facilitate the trade with commodity products which may lead to substantial relocation. Furthermore, oligopolies may develop which would require global policy responses in order to be effective. These few examples show that the analysis of leakage due to future climate policy is an extremely difficult task.

Report 500036 002 (ECN-C--05-014) 167
C.5 Climate modelling results In the past numerous models have been developed and applied to project future develop-ments of economic activity, trade, energy use and greenhouse gas emissions. Models have also been used to estimate the extent of carbon leakage as a function of various policy measures. A basic difference with the previous chapter in this report is that the models refer explicitly to climate policies and not on environmental regulations in general. For instance, in most of the studies a comparison of traditional measures in the economic sectors for en-ergy efficiency improvement and emission reduction takes place takes place, such as taxes and subsidies with modern market based instruments like emissions trading (Hoel, 1996, Maestad, 1998). While most of these models not even distinguish between different sectors of the economy, a very limited number of models distinguishes between the total of all en-ergy-intensive sectors (grouped) on the one hand and the total of all non-energy intensive sectors on the other.110 Even less models deal with single energy intensive sectors. In this chapter we dealt with the latter hereby limiting ourselves to the steel sector (Section 5.1). We do not include the models that deal with the energy intensive as a whole, since even if in many cases they calculate the effects of climate policy on disaggregated sectors of the economy, the results refer to the economy as a whole. In the next section, we conclude with some principal considerations about the usefulness of the indicator 'leakage rate' for policy making (Section 5.2).
C.5.1 Model results for the steel sector We have identified only three models, which study the steel sector in detail. These are the models SIM (Steel Industry Model) (Mathiessen and Moestad, 2002), STEAP (Steel Envi-ronmental strategy Assessment Program) (Gielen and Moriguchi, 2001) and POLES (Pro-spective Outlook for the Long term Energy System) (Hidalgo et al, 2003). All three models (see also Annex C.9) take different steel production technologies into account.111 The key parameters included are:112 • Elasticity of demand for steel • Elasticity of supply for steel • Elasticity of supply for production inputs (iron ore, coal, scrap) • Armington elasticities for the trade of steel products • Elasticity of substitution of production inputs. Table C.2 provides an overview of important features of the three models and Figure C.7 presents results for carbon leakage. Carbon leakage (more precisely referred to as leakage ratio) is defined as the ratio of the increase in GHG emissions in Non-Annex I countries (or: total of all countries without climate policy) relative to the decrease of GHG emissions in Annex I countries (alternatively: total of all countries with climate policy). The logic of this indicator is that it quantifies how much of the policy-induced emission reduction in Annex I countries is 'eaten up' by emission increase in Non-Annex I countries. If the leakage is 100%, the net effect of climate policy is negligible. In SIM, the level of the tax is set to 25$/ton CO2, an estimation corresponding to the ex-pected price of the permits under Kyoto Protocol before the US withdrawal (Weyant et al, 1999). For the STEAP model and the POLES, the results for different taxation scenarios are presented in Figure C.6. 110 For a further model discussion, see Kuik (2004) and Sijm (2004). 111 They encompass three ways of producing steel; the basic oxygen furnace (BOF), the electric arc furnace
(EAF) and the open hearth furnace (OHF). The dominant form in the world production is the BOF, with 58% share, then EAF, 34% and OHF with other technologies (8%) (IISI, 2001).
112 However, values of these parameters are not always revealed in the studies. The values used in the current study are presented in Annex I.
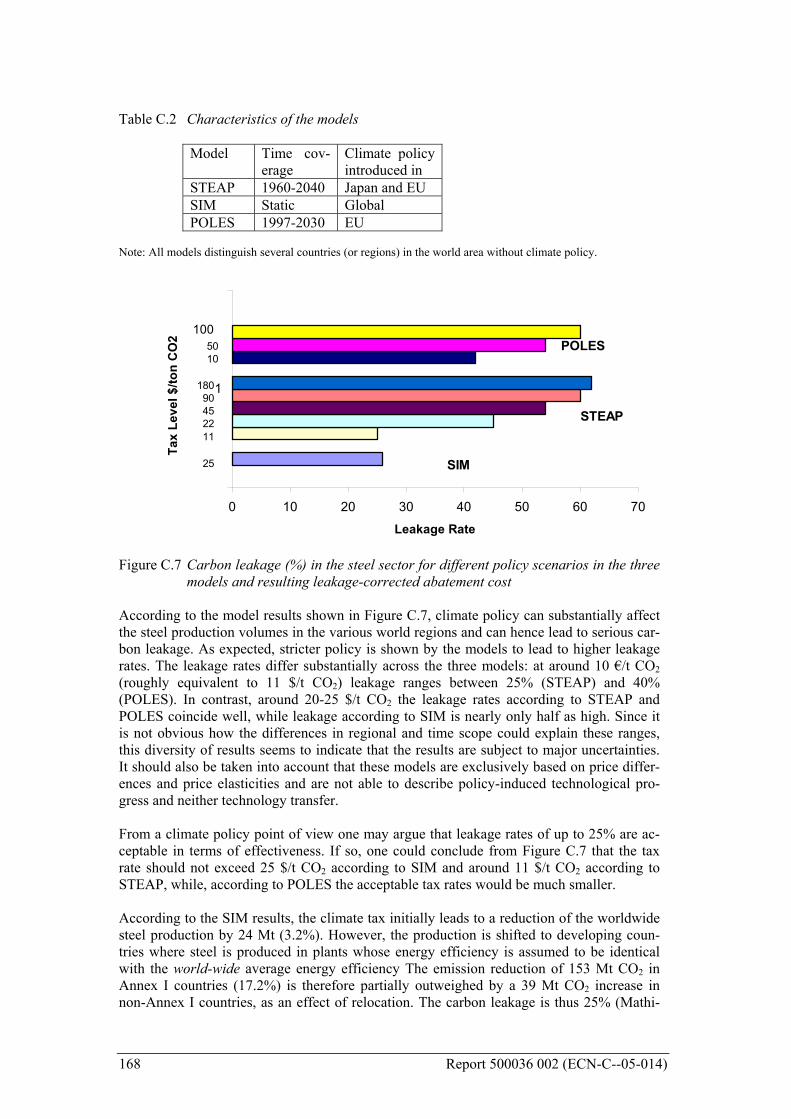
168 Report 500036 002 (ECN-C--05-014)
Table C.2 Characteristics of the models
Model Time cov-erage
Climate policy introduced in
STEAP 1960-2040 Japan and EU SIM Static Global POLES 1997-2030 EU
Note: All models distinguish several countries (or regions) in the world area without climate policy.
0 10 20 30 40 50 60 70
1
Tax
Leve
l $/to
n C
O2
Leakage Rate
SIM
STEAP
POLES
25
180 90 45 2211
100 50 10
Figure C.7 Carbon leakage (%) in the steel sector for different policy scenarios in the three
models and resulting leakage-corrected abatement cost According to the model results shown in Figure C.7, climate policy can substantially affect the steel production volumes in the various world regions and can hence lead to serious car-bon leakage. As expected, stricter policy is shown by the models to lead to higher leakage rates. The leakage rates differ substantially across the three models: at around 10 €/t CO2 (roughly equivalent to 11 $/t CO2) leakage ranges between 25% (STEAP) and 40% (POLES). In contrast, around 20-25 $/t CO2 the leakage rates according to STEAP and POLES coincide well, while leakage according to SIM is nearly only half as high. Since it is not obvious how the differences in regional and time scope could explain these ranges, this diversity of results seems to indicate that the results are subject to major uncertainties. It should also be taken into account that these models are exclusively based on price differ-ences and price elasticities and are not able to describe policy-induced technological pro-gress and neither technology transfer. From a climate policy point of view one may argue that leakage rates of up to 25% are ac-ceptable in terms of effectiveness. If so, one could conclude from Figure C.7 that the tax rate should not exceed 25 $/t CO2 according to SIM and around 11 $/t CO2 according to STEAP, while, according to POLES the acceptable tax rates would be much smaller. According to the SIM results, the climate tax initially leads to a reduction of the worldwide steel production by 24 Mt (3.2%). However, the production is shifted to developing coun-tries where steel is produced in plants whose energy efficiency is assumed to be identical with the world-wide average energy efficiency The emission reduction of 153 Mt CO2 in Annex I countries (17.2%) is therefore partially outweighed by a 39 Mt CO2 increase in non-Annex I countries, as an effect of relocation. The carbon leakage is thus 25% (Mathi-

Report 500036 002 (ECN-C--05-014) 169
esen and Maestad, 2002. According to the STEAP model (and to a lower extent, also ac-cording to POLES) marginal tax increases lead to much higher increases of leakage at low tax levels (10-50 $/t CO2) than at high tax levels (around 100 $/t CO2 and beyond). This non-linear behaviour indicates a strong sensitivity of leakage to small tax increases com-pared to the status quo. At low tax rates the impact on leakage is even stronger according to the POLES model as compared to the STEAP model (compare leakage for 10 €/t CO2 and 11 $/t CO2 respectively) while leakage increases less severely with higher tax rates com-pared to STEAP. At the high end of carbon taxes, both STEAP and POLES indicate very substantial leakage rates of 50% to more than 60%.
C.5.2 Discussion of the usefulness of the leakage rate as a guiding indicator for policy making
As explained above the (carbon) leakage rate (or simply: leakage) is defined as the ratio of the increased GHG emissions in Non-Annex I countries relative to the decrease of GHG emissions in Annex I countries. The leakage rate hence quantifies how much of the policy-induced emission reduction in Annex I countries is 'eaten up' by emission increase in Non-Annex I countries. If the leakage is 100%, the net effect of climate policy is nihil. While the concept of this indicator seems plausible, its usefulness for policy making is nevertheless limited which is discussed in this section. Figure C.7 shows in a hypothetical example which effects the introduction of a climate pol-icy in a selected Annex 1 country (e.g., the Netherlands) could have for this Country And for all Non-Annex 1 countries. Parallel to discussing this example, various indicators for measuring the effectiveness of climate policy are gradually introduced which are summa-rized in Table C.3. In our example, possible effects caused by interactions between the se-lected Annex 1 Country And other Annex 1 countries are neglected. For simplicity, we re-gard Figure C.7 as depicting the changes in one selected sector (e.g., the steel sector) and we assume that there are only two companies in this sector in the Annex 1 country studied. In the base year these two companies emit 100 Mt CO2 (indicator Eo in Table C.3; enters indicator N and n). The introduction of the climate policy in the Annex-1 country is as-sumed to have two consequences: • The smaller of the two companies, emitting 20 Mt CO2 in the base year, closes down
('climate policy induced relocation'). This company produces a certain grade X of steel and the technology applied to date is assumed to be average to mediocre (making it dif-ficult for the company to remain competitive). In future, the Annex 1 country will have to import this steel grade since it is not being produced by the second producer.
• The second, larger company in the Annex 1 country emits 80 Mt CO2 in the base year. As a consequence of the climate policy, this company improves its energy efficiency and reduces its emissions by 10 Mt CO2.
Table C.3 Metrics for measuring the effectiveness of climate policy D Gross climate policy-induced change (expected: Decrease) of CO2 emissions
in Annex 1 countries, in absolute terms (Mt CO2) I Gross climate-policy induced change (expected: Increase) of CO2 emissions
in Non-Annex 1 countries, in absolute terms (Mt CO2) N = D – I
Net benefit of the climate policy worldwide, in absolute terms (Mt CO2). We can also write: N = Eo – E with Eo = world-wide Emissions before in-troduction of climate policy, in absolute terms (Mt CO2) and E = world-wide Emissions after introduction of climate policy
L = I/D Leakage rate (as generally defined) n = N/Eo
net effect of climate policy, in relative terms with Eo = global Emissions be-fore introduction of climate policy, in absolute terms (Mt CO2)
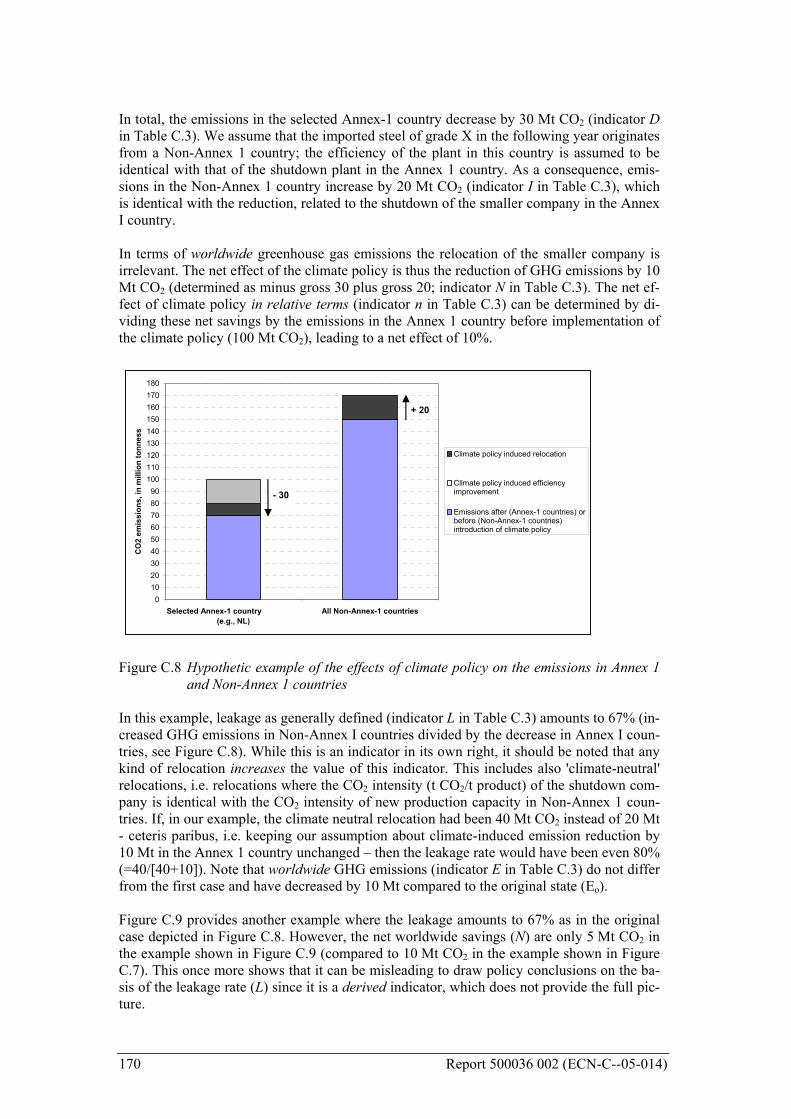
170 Report 500036 002 (ECN-C--05-014)
In total, the emissions in the selected Annex-1 country decrease by 30 Mt CO2 (indicator D in Table C.3). We assume that the imported steel of grade X in the following year originates from a Non-Annex 1 country; the efficiency of the plant in this country is assumed to be identical with that of the shutdown plant in the Annex 1 country. As a consequence, emis-sions in the Non-Annex 1 country increase by 20 Mt CO2 (indicator I in Table C.3), which is identical with the reduction, related to the shutdown of the smaller company in the Annex I country. In terms of worldwide greenhouse gas emissions the relocation of the smaller company is irrelevant. The net effect of the climate policy is thus the reduction of GHG emissions by 10 Mt CO2 (determined as minus gross 30 plus gross 20; indicator N in Table C.3). The net ef-fect of climate policy in relative terms (indicator n in Table C.3) can be determined by di-viding these net savings by the emissions in the Annex 1 country before implementation of the climate policy (100 Mt CO2), leading to a net effect of 10%.
0102030405060708090
100110120130140150160170180
Selected Annex-1 country (e.g., NL)
All Non-Annex-1 countries
CO
2 em
issi
ons,
in m
illio
n to
nnes
s
Climate policy induced relocation
Climate policy induced efficiencyimprovement
Emissions after (Annex-1 countries) orbefore (Non-Annex-1 countries)introduction of climate policy
- 30
+ 20
Figure C.8 Hypothetic example of the effects of climate policy on the emissions in Annex 1
and Non-Annex 1 countries In this example, leakage as generally defined (indicator L in Table C.3) amounts to 67% (in-creased GHG emissions in Non-Annex I countries divided by the decrease in Annex I coun-tries, see Figure C.8). While this is an indicator in its own right, it should be noted that any kind of relocation increases the value of this indicator. This includes also 'climate-neutral' relocations, i.e. relocations where the CO2 intensity (t CO2/t product) of the shutdown com-pany is identical with the CO2 intensity of new production capacity in Non-Annex 1 coun-tries. If, in our example, the climate neutral relocation had been 40 Mt CO2 instead of 20 Mt - ceteris paribus, i.e. keeping our assumption about climate-induced emission reduction by 10 Mt in the Annex 1 country unchanged – then the leakage rate would have been even 80% (=40/[40+10]). Note that worldwide GHG emissions (indicator E in Table C.3) do not differ from the first case and have decreased by 10 Mt compared to the original state (Eo). Figure C.9 provides another example where the leakage amounts to 67% as in the original case depicted in Figure C.8. However, the net worldwide savings (N) are only 5 Mt CO2 in the example shown in Figure C.9 (compared to 10 Mt CO2 in the example shown in Figure C.7). This once more shows that it can be misleading to draw policy conclusions on the ba-sis of the leakage rate (L) since it is a derived indicator, which does not provide the full pic-ture.

Report 500036 002 (ECN-C--05-014) 171
To summarize, the direct effect of climate-neutral relocation on the leakage rate appears to be a serious limitation for deriving policy-relevant conclusions because relocation – while being undesirable for Annex 1 countries from an economic and societal perspective - is ir-relevant from a climate point of view as long as the efficiency of the technology applied world-wide is identical.113 On the other hand, it can be seen as simultaneous goal of climate policies to protect local industry – or at least not to aggravate its situation. From this per-spective climate policy should generally attempt to avoid relocation (of any type): failure in this respect results in higher values for the leakage rate. The generally accepted definition of the leakage rate may hence be seen as useful but it should then be realized (and taken into account in interpretation) that it is not strictly focussed on the consequences for CO2 worldwide emissions. Another important aspect concerns the emissions in the reference case. In our example, the net effect of the climate policy amounts to 10% relative to the total emissions in the Annex 1 country before implementation of the climate policy. If, instead of totalling 100 Mt CO2, this total had been 1 000 Mt CO2 the net effect would obviously have only been 1%. On the other hand, the generally accepted definition for leakage does not account for the level of this reference flow (the value remains at 67% irrespective of the size of the reference flow). This can be seen as another shortcoming. To summarize, the usefulness of the 'leakage rate' as a criterion for designing climate policy is limited for two reasons: the fact that it divides gross changes of emissions by each other and does not address the net effect; and secondly, because it does not relate the changes to the absolute emission flow before implementation of the climate policy. These shortcom-ings can be compensated by taking other indicators into account in decision making. In gen-eral, it is, however, not advisable to make comparisons and to draw conclusions on the basis of the indicator 'leakage' only. As an exception it seems possible to draw conclusions if the values for leakage are low because correcting for climate neutral relocation would lead to even smaller values.
0102030405060708090
100110120130140150160170
Selected Annex-1 country (e.g., NL)
All Non-Annex-1 countries
CO
2 em
issi
ons,
in m
illio
n to
nnes
s
Climate policy induced relocation
Climate policy induced efficiencyimprovement
Emissions after (Annex-1 countries) orbefore (Non-Annex-1 countries)introduction of climate policy
- 15
+ 10
- 5- 10
Figure C.9 Second hypothetic example of the effects of climate policy on the emissions in
Annex I and non-Annex I countries (with lower net benefit of the climate policy compared to the first case in Figure C.7)
113 More precisely: as long as the emission intensity in t CO2/t product is identical worldwide.

172 Report 500036 002 (ECN-C--05-014)
C.6 Positive spillovers While this report has so far focussed primarily on the negative effects of climate policy for carbon emissions, this chapter deals with the positive spillover effects. The main positive spillover is the potential 'technological spillover' from increased efforts in industrialized countries (with a GHG-emission reduction policy) to implement and develop technologies with a relatively lower GHG-intensity. This spillover can take three forms (IPCC, 2001): 1. R&D will refocus on low-GHG development paths for technology development. This
enhanced focus will lead to reductions in countries that do and that do not participate in policy regimes to reduce GHG emissions
2. Increased market share of low-GHG technologies will result in technology improve-ment and reduce the costs of these technologies
3. GHG-policies in countries that focus on technology performance will send a strong sig-nal to foreign competitors.
Some analysts have argued that these positive spillovers will counteract or even offset the negative spillovers or leakage (IPCC, 2001). For example, if new production capacity in non-Annex 1 countries would use state-of-the-art technology to replace the reduced produc-tion in Annex 1 countries, the total emissions could be lower if they replace older inefficient plants in Annex 1 countries. Also, as modern energy-or carbon-intensive114 production technology is mainly developed and produced in industrialized countries, policies in these countries will affect technology development and transfer paths worldwide. Empirical data and analysis are still very weak in the area of positive spillovers. Preliminary studies sug-gest that the positive spillover effect may be dominant over time (Grubb and Koehler, n.d.). There is limited data on technology spillovers of environmental and climate policy within the energy-intensive industries. Given the important role of these industries in the discus-sion of negative spillovers, this is an area that needs more attention. In this section we dis-cuss the likelihood and potential of technological spillovers within carbon-intensive indus-tries based on empirical studies and anecdotal evidence. Based on this we recommend re-search for modelling the positive spillovers in climate models. We start with a discussion of technology development, energy and carbon intensity in se-lected energy intensive industries. We especially focus on the iron and steel industry as multiple modellers have focused on this industry and argued that it is likely to contribute to the total leakage (Section 6.1). This is followed in Section 6.2 by a discussion of empirical studies on technology transfer. In section 6.3 we discuss future research directions. As the available body of literature is large we focus on those affecting the carbon-intensive indus-tries. Furthermore a companion report (Sijm., 2004) provides a more general and in-depth discussion of the role of technology development and transfer on the sign and magnitude of the spillover effect.
C.6.1 Technology development Trends in energy intensity Technology development and diffusion is seen as one of the most important factors contrib-uting to a reduction in energy and carbon intensity of energy-intensive industries. A trend analysis of energy intensity in the IEA member countries (IEA, 2004) demonstrates the im-portant impact of energy intensity reductions in slowing the growth of energy consumption
114 The terms energy-intensive and carbon (or GHG) intensive industries are used indistinguishable. Energy-
intensive industries are by definition also GHG-intensive industries, except for those industries that use elec-tricity from low-GHG technologies (e.g. hydropower) or fuels of renewable origin.
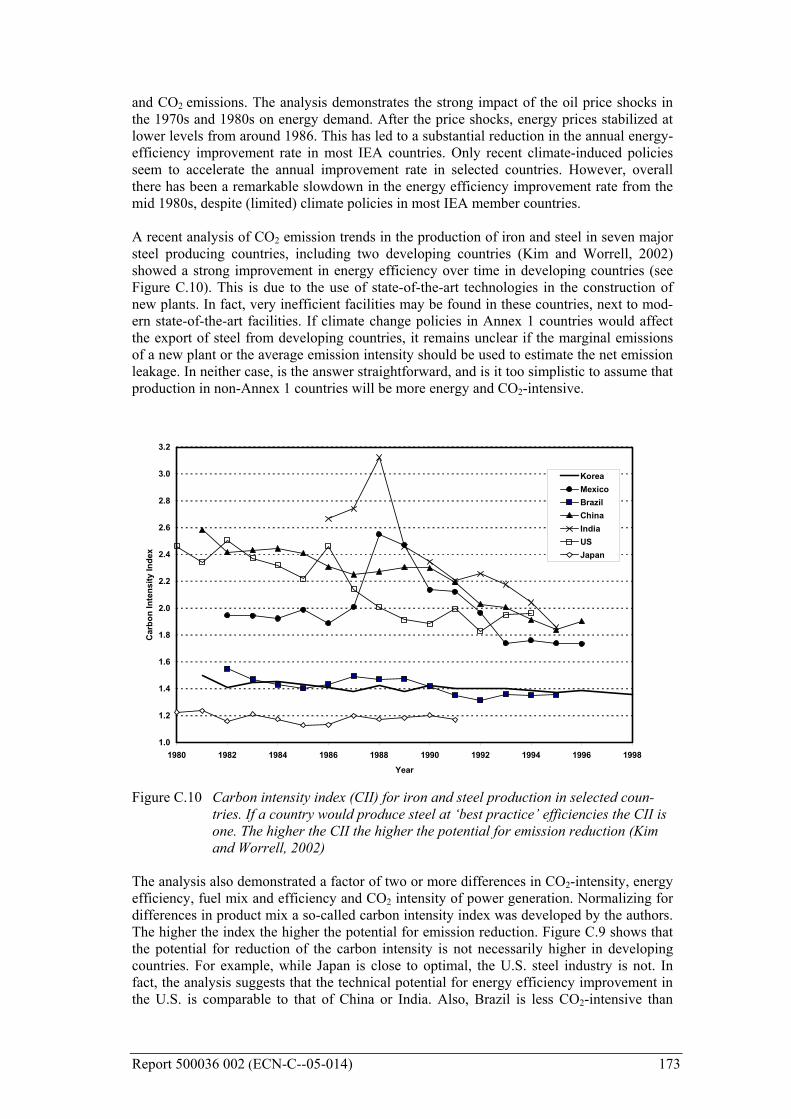
Report 500036 002 (ECN-C--05-014) 173
and CO2 emissions. The analysis demonstrates the strong impact of the oil price shocks in the 1970s and 1980s on energy demand. After the price shocks, energy prices stabilized at lower levels from around 1986. This has led to a substantial reduction in the annual energy-efficiency improvement rate in most IEA countries. Only recent climate-induced policies seem to accelerate the annual improvement rate in selected countries. However, overall there has been a remarkable slowdown in the energy efficiency improvement rate from the mid 1980s, despite (limited) climate policies in most IEA member countries. A recent analysis of CO2 emission trends in the production of iron and steel in seven major steel producing countries, including two developing countries (Kim and Worrell, 2002) showed a strong improvement in energy efficiency over time in developing countries (see Figure C.10). This is due to the use of state-of-the-art technologies in the construction of new plants. In fact, very inefficient facilities may be found in these countries, next to mod-ern state-of-the-art facilities. If climate change policies in Annex 1 countries would affect the export of steel from developing countries, it remains unclear if the marginal emissions of a new plant or the average emission intensity should be used to estimate the net emission leakage. In neither case, is the answer straightforward, and is it too simplistic to assume that production in non-Annex 1 countries will be more energy and CO2-intensive.
1.0
1.2
1.4
1.6
1.8
2.0
2.2
2.4
2.6
2.8
3.0
3.2
1980 1982 1984 1986 1988 1990 1992 1994 1996 1998
Year
Car
bon
Inte
nsity
Inde
x
KoreaMexicoBrazilChinaIndiaUSJapan
Figure C.10 Carbon intensity index (CII) for iron and steel production in selected coun-
tries. If a country would produce steel at ‘best practice’ efficiencies the CII is one. The higher the CII the higher the potential for emission reduction (Kim and Worrell, 2002)
The analysis also demonstrated a factor of two or more differences in CO2-intensity, energy efficiency, fuel mix and efficiency and CO2 intensity of power generation. Normalizing for differences in product mix a so-called carbon intensity index was developed by the authors. The higher the index the higher the potential for emission reduction. Figure C.9 shows that the potential for reduction of the carbon intensity is not necessarily higher in developing countries. For example, while Japan is close to optimal, the U.S. steel industry is not. In fact, the analysis suggests that the technical potential for energy efficiency improvement in the U.S. is comparable to that of China or India. Also, Brazil is less CO2-intensive than

174 Report 500036 002 (ECN-C--05-014)
most of the other countries due to the use of biomass in iron production and hydropower for electricity generation. The import and use of modern state-of-the-art technology is one of the drivers for the large changes in energy intensity that have been observed in developing countries. Price et al. (2002) analysed energy demand for steel production in China, and showed that with the dramatic increase in production, energy intensity has been falling continuously (see also Figure C.9). From 1980 till 1996 the primary energy intensity per ton of steel produced in China dropped from 43 to 35 GJ/ton steel (Price et al., 2002). Furthermore, the energy in-tensity of so-called key plants (that generally use imported technology) is around 27-28 GJ/ton steel (compared to one of world’s most efficient plants of 19 GJ/ton steel). In other sectors (e.g. bricks) or countries (e.g. China, India), domestic technology may still be an important factor. Often, this technology is less efficient or produces a lower quality product. For example, iron and steel plants in China using domestically built blast furnaces and other technology are smaller and less efficient. The lack of modern control equipment results in a lower quality product that is only suitable for specific applications, and is unlikely to be exported to industrialized countries. Similar observations have been made for cement and other products produced using domestic technologies.115 However, the lower quality of these products generally limits export, and most certainly to industrialized coun-tries. While there is an active market in used industrial equipment from industrialized to develop-ing countries116, there is merely anecdotal information on this phenomenon. A recent survey of the trade in used industrial equipment estimated a global market of $100 Billion (German Council for Sustainable Development, 2004), and showed that practices very widely by in-dustry and country. There are companies that broker and/or trade in total plants or equip-ment, and the major equipment suppliers do retrofit and upgrading of used equipment (Jochem and Averbeck, 2003). However, there has been no systematic analysis of the im-pact of this trade on energy use and GHG emissions and this type of capacity building plays a subordinate role in Non-Annex 1 countries if compared to the total capacity increase. Future Technology Development Industrial technology development focuses on productivity improvements. Productivity im-provements often include reduced energy costs. In the energy intensive industries the sup-pliers of major process technology are more and more concentrated. Moreover, production technology for most materials is predominantly developed in industrialized countries. Hence, it can be expected that increased attention to climate policy in industrialized coun-tries on the short term, and in developing countries in the long term will affect technology development through increased attention to reduction of energy costs and GHG emissions. Iron and steel plant technology is developed mainly by four major globally operating com-panies based in Austria, Germany, Italy and Japan. Ammonia production technology (the most energy intensive step in nitrogen fertilizer production) is made by companies located in Denmark, Germany, the United States and a few other countries. Similarly, modern ce-ment plant technology is developed by three companies based in Denmark, Germany and Japan. The concentration of key technology suppliers is also taking place in other sectors, resulting in the global availability of the technology. While there are domestic technology developers and suppliers in developing countries for selected industrial processes, the de-signs are not advanced and have generally a lower productivity. Countries possessing a higher technical capability are faster to replicate and develop new technology. The exam-
115 In the case of China and India, the lower quality of domestic technology has been recognized, and was one
of the drivers to allow increased openness of the economy for foreign investors. 116 For example, a heavy plate mill closed by Hoogovens (Corus) in IJmuiden, The Netherlands, is now operat-
ing at the Jinan Iron and Steel Corporation in Jinan, China.

Report 500036 002 (ECN-C--05-014) 175
ples of the FINEX smelt reduction process development for steel making in South-Korea (Joo et al., 1998), as well as the development of the HYL direct reduction process for iron making in Mexico (Zervas et al.,1996), illustrate the capability of firms in Newly Industrial-ized Countries (NICs) to develop a new process. The advanced FINEX project is an exam-ple of technology co-operation between the Austrian supplier and the Korean industry. Also, technology production does not necessarily take place in industrialized countries. For example, one global supplier of the cement industry is manufacturing large parts of cement kilns and mills in Malaysia to reduce costs. Modern state-of-the-art facilities worldwide use technologies developed and marketed by these global suppliers. Hence, the world’s most efficient cement plant may be found in In-dia, and not necessarily in an industrialized country. Similarly, new integrated steel plants are only constructed in developing countries. China is the fastest growing iron and steel producer. In its expansion it imports modern state-of-the-art technology from various sup-pliers, and also uses domestic technology (e.g. in coke making and small blast furnaces) and imports used technology. The used technology is sometimes upgraded with help of the same international technology suppliers. The increased openness of the economies in developing countries is not only allowing the import of state-of-the-art technology, but also increases the pressure to use highly productive technology. China’s accession to the WTO has already led to increased pressure in iron and steel companies to reorganize, and improve productiv-ity. It is yet unclear what the likely magnitude of climate policy will be on the rate of energy-efficiency improvement for advanced technologies in the energy-intensive industries. Re-search in the energy sector suggests that technological change in this sector is induced in response to market conditions (Grubb and Koehler, n.d.). Hence, it is likely that climate pol-icy will affect technology development patterns. Selected climate modellers have modelled endogenous technological change. Van der Zwaan et al. (2002) incorporated endogenous technological change as a function of cumulative capacity, and show that this reduces the costs for CO2 emission reduction considerably. Lutz et al (forthcoming) have modelled en-dogenous technological change in the German iron and steel industry, and found a strong improvement in energy efficiency, accompanied by a change towards less energy-intensive production processes, on the longer term (beyond 2010) in reaction to climate policy (mod-elled as a carbon tax). A recent IEA report found that only a few measurements of experience curves for energy technologies are reported and that these are concentrated in a few supply technologies (IEA, 2000; 2003). Laitner and Sanstad (2003) have demonstrated significantly different results when learning is limited to supply-side technologies compared to scenarios that include learning for both end-use and supply-side technologies. Some empirical work on price-induced change in industry is emerging. Celikkol and Stefanou (1999) examine induced change in the food processing industry, but not for energy efficiency. Although, experience curves studies of manufacturing sectors are numerous (e.g. Lieberman, 1984; Landau and Rosenberg, 1994; Jarmin, 1994 ; Yin, 1994 ; Gruber, 1992 ; Bahk and Gort, 1993). Similarly, R&D is expected to reduce costs and improved performance of technology. R&D is generally seen as an investment with a high payback (Nelson, 1982), but the risk of full appropriation of the benefits leads to under-investment in R&D (Cohen and Noll, 1994). Few case studies exist of the development of industrial technologies and the assessment of R&D investments on technology performance (Luiten, 2001). Martin et al. (2000) identified 180 emerging energy-efficient technologies in industry. De Beer et al. (1998) studied the future potential for energy efficiency improvement in the iron and steel industry. The study demonstrated that there is still considerable potential for efficiency improvement through technological change, both for integrated primary and for secondary steel making. Similar studies for the pulp and paper, and fertilizer industry also demonstrate the existence of fu-
176 Report 500036 002 (ECN-C--05-014)
ture potential for these sectors (De Beer, 1998). Most of the technologies do not only reduce energy use but show promise to further reduce production costs. However, analysis of the R&D process of energy-efficient technologies shows that development and commercialisa-tion of these technologies is not a given (Luiten, 2001). While climate policy and other policies may provide the right direction signals for the developers to invest in further tech-nology development, dedicated support, especially in the pre-competitive development stage may be needed to realize the promise of new technology. In short, society is currently not running out of energy-efficient technologies and opportuni-ties for energy efficiency improvement in energy-intensive industries, and neither will it in the future. A suitable policy framework is essential to support the development and uptake of these technologies.
C.6.2 Technology transfer patterns Positive spillovers may be due to increased transfer of low-GHG technologies to non-Annex 1 countries. Key to understanding this effect and its contribution to emission reduc-tion is technology transfer to non-Annex 1 countries. There is not much empirical analysis on technology transfer of energy-efficient or low-GHG technologies (IPCC, 2000). Trends in industrial investments are difficult to translate to technology choice and transfer. It is ob-vious, though, that increasing international investments influence the rate of technology transfer, although it gives no information on the way and what technology is transferred. Generally, the majority of investments in many developing countries seem to be in low-technology industries, though the share of high-technology industries is increasing (UNIDO, 1997). Hence, we rely on indirect indicators such as energy intensity development in energy-intensive industries, as well as trends in investments. As discussed, future growth of basic industries will, to a large extent, occur in developing countries. However, while developing countries are the most important markets for new and energy efficient processes, technology is still primarily developed in industrialized coun-tries, despite the fact that the absolute demand for such technologies is stagnating or rela-tively low. Industrialized countries will be less favourable theatres for innovation of tech-nologies for the primary materials processing industries, if there are limited applications for such in industrialized countries. However, investments in materials processing industries in developing countries are often made by or on behalf of transnational corporations headquar-tered in industrialized countries, and facing peer, and sometimes even shareholder, pressure to adopt equally innovative technologies for their business ventures in developing countries. This demonstrates the need for improved empirical analysis of trade patterns, technology choice and development of energy and GHG-intensity of production. The trend analysis of indicators for energy and carbon efficiency demonstrated that devel-oping countries adopt more and more energy efficient state-of-the-art technologies. This process is not necessarily driven by energy prices or climate concerns, but the consequence of the natural development paths within those countries, if these countries have access to the technology. This highlights the role of technology transfer in the discussion of spillovers and in understanding the future trends. Generally, foreign direct investment is credited with a large contribution to transfer of mod-ern technology in industry. Case studies from various countries demonstrated the impor-tance of FDI and multi-national corporations in the transfer technologies (Damijan et al., 2003; Veugelers and Cassiman, 2004). Eskeland and Harrison (2003) have shown that for-eign-owned firms in developing countries are generally less polluting than domestic indus-tries. The study may indicate that increased FDI may accelerate the adoption of clean and energy-efficient technology in non-Annex 1 countries.
Report 500036 002 (ECN-C--05-014) 177
The rapidly increasing role of transnational companies, and foreign direct investment (UNCTAD, 1997), may change the patterns of technology transfer. Although FDI is only a small part of total investments in developing countries117, in the industrial sector foreign di-rect investment is an important mechanism to transfer technology (IPCC, 2000) and can be seen as an indicator for the access to modern production technology. FDI to developing countries steadily increased until 2000, and then was reduced following the global trend in FDI. While industrialized countries remain the main recipients of FDI, developing countries to-day receive a larger share of the total flow. Among the developing countries, China is the main recipient. The strong inflow of FDI by transnational corporations also provides access to modern technology. A large part of the FDI is directed towards energy intensive activities (including energy developments) (IPCC, 2000). Increased trade liberalization is likely to influence the flow of FDI and the transfer of modern energy-efficient technology. However, the overall effect on leakage and spillovers is difficult to evaluate (Kuik and Gerlagh, 2003). Further analysis in this area with specific attention to energy intensity and GHG emissions is needed to provide more data to allow improved modelling of these interactions. Increased capital flows and technology transfer would change the modelling parameters un-der a climate policy regime. The long-term challenge of climate change would most likely lead to increased availability of low GHG-emitting technologies. The only way that an in-crease in carbon intensity in non-Annex 1 countries could be observed if technology designs would be dumped or if increased trade in used industrial equipment would be the source of new production capacity in non-Annex 1 countries. Also, increased FDI may result in spillovers on domestic companies that will improve pro-ductivity (and often energy efficiency in the process). While analyses of FDI and productiv-ity improvements show mixed results (Calderon et al., 2004, Smarzynska, 2002, Damijan et al., 2003), one analysis for China showed that there are spillovers on local companies (Liu, 2002). The ambiguity of the results of the studies warrants the need for further analysis. C.7 Conclusions and further research In the analysis of the spillover effect it is only possible to talk over a net result of the spill-over effect. However, as there is no empirical basis to analyse the impact of spillovers of climate policy, we decomposed the spillover effect in negative (e.g. relocation of energy in-tensive industries to non-Annex 1 countries, increasing energy intensity in non-Annex 1) and positive spillovers (e.g. increased development and deployment of energy-efficient technologies). Based on the historical development of the production of energy intensive products by re-gions, we conclude that the global production shares have been falling continuously in the last decades. We reviewed the production factors that drive investment decisions to favour location in developing countries and tried to extract their significance. The factors of pro-duction are changing globally, so that the historical comparative advantages of a country cannot be considered as a given for an investment. As a consequence of globalisation and the advent of multinational corporations in developing countries, the production factors seem to be converging across the globe. It was, however, not possible to conduct a com-parative analysis of investment decision criteria for industrialized versus developing coun-tries because especially the required data on production costs were not available.
117 The vast majority of investment in developing countries is still generated by domestic resources, and not by
foreign direct investment, equity investment or official development aid.

178 Report 500036 002 (ECN-C--05-014)
Furthermore, we examined the effect of the environmental regulations on relocation of the energy intensive sectors. In theory, environmental regulations drive up fixed and variable costs, which should result in lower profitability and hence a reduction of competitiveness. However, available studies have shown that environmental policies in the past generally have not been a significant decision criterion for the location of the investment and hence do not represent a key explanatory factor for the investments in the developing world (relo-cation). This conclusion on the insignificant effect of environmental on relocation observed in the past was drawn based on the outcome of empirical analyses on the so-called 'pollution haven' hypothesis. According to this hypothesis industries relocate production facilities to countries with less stringent environmental requirements. The empirical studies show that the cost effects of the environmental regulation are very small, or even negligible. In gen-eral, compliance costs as a result of environmental policy are limited in pollution intensive industries, and other cost factors seem to be more decisive investment criteria, with the most important ones being market size and growth (regional demand) and the wage level. Empirical analyses have failed to prove an effect of weaker or stronger environmental regu-lations on industrial location for high polluting (i.e. energy intensive) industries. Hence, there is no significant evidence that more stringent environmental regulation promotes the relocation of polluting industries. There are distinct differences between climate policy and environmental regulations. Environmental regulation often resulted in end-of-pipe technol-ogy or fuel switching, which increased production costs. In contrast, climate policy may also lead to cost savings due to improved energy-efficiency, while implementation of en-ergy-efficient technologies may also result in ancillary benefits. The limited effect of environmental policy seems plausible also in view of the companies’ pursuit of higher value added products and their concomitant relatively low interest in con-ventional energy intensive products. It is also supported by statements of industry represen-tatives who point out that countries that are attractive for foreign investment have rather stringent environmental legislation and that secondly, multinationals would risk their repu-tation by investing in pollution havens (Veenenbos, 2004). There might even be a cost ar-gument for global players to use the most recent technology worldwide since this minimises planning cost and maintenance cost (typical examples: basic chemicals, cement, pulp and paper). We compared these empirical findings with results from climate models. We focussed on models that explicitly address energy intensive industries (for the steel sector). According to these models even very moderate climate policies (tax or allowance levels of 10-25 $/tonne of CO2) lead to severe leakage (and hence also to substantial relocation). This is in contrast to the empirical studies on pollution control and raises questions about the reliability of the models. Since the models do not seem to account especially for differ-ences in elasticities across countries/regions and time periods (past, present, future) , we conclude that the modelling results are subject to major uncertainties. Another reason for doubting the reliability of the results is that none of the models reviewed seems to be have been calibrated for longer periods in the past (no publications are known on this subject matter). At the same time it needs to be kept in mind that globalisation is gradually chang-ing the business conditions. In addition, climate policy has been rather soft in the past and this applies also to most other environmental policies, which have led to the implementation of end-of-pipe technologies and inherently cleaner and more efficient processes. In contrast, climate policy, if undertaken seriously, could have a stronger impact on business decisions in future. However, this argument seems to explain only partly the contradictory results or empirical analyses and models since according two of the three steel models reviewed, sub-stantial leakage rates are to be expected even at (very) low CO2 tax levels (see Figure C.7). One of the key factors which is undervalued in current models seems to be that the location of production facilities is determined to a large extent by the demand for the products. Fac-toring this element into the model would lead to clearly less drastic results for relocation.

Report 500036 002 (ECN-C--05-014) 179
The results obtained with energy and emission models when simulating the consequences of climate policy is often reported by means of a compact indicator called 'leakage rate' or 'leakage'. Leakage is defined as the ratio of the increased GHG emissions in Non-Annex I countries relative to the decrease of GHG emissions in Annex I countries. Leakage hence quantifies how much of the policy-induced emission reduction in Annex I countries is 'eaten up' by emission increase in Non-Annex I countries. While the concept of this indicator seems plausible, its usefulness for policy making is nevertheless limited. This has to do with the fact that leakage is a derived indicator, which does not provide the full picture (see Chapter 5.2). It is therefore not advisable to make comparisons and to draw policy conclu-sions on the basis of the indicator 'leakage' only. The energy and carbon intensity of energy-intensive industries is rapidly declining in most developing countries, reducing the 'gap' between industrialized and developing countries. Still, considerable potential for emission reduction exists, both in developing and industrial-ized countries. Technology development is likely to deliver further reductions in energy use and CO2 emissions, when supported in a suitable manner. While, this development will mainly take place in industrialized countries, developing countries will be the most impor-tant markets for these technologies. As FDI has become one of the more important vehicles for technology transfer, FDI may also be the future mechanism for bringing these new technologies to a global market. Re-search of FDI-patterns has demonstrated that foreign owned firms are generally less pollut-ing than domestic companies. Despite the potential for positive spillovers in the energy-intensive industries, none of the models used in the analysis of spillovers of climate policies has an endogenous representa-tion of technological change for the energy-intensive industries. Recently, several groups have started to incorporate mechanisms to simulate changes in technology performance as a function of development and deployment, but none addresses demand side technologies, and especially not in the energy-intensive industries. The ambiguous results of the empirical studies in both positive and negative spillovers with the modelling results warrant further research in this field. In our view, the negative spill-over effects are overestimated in current models while the positive spillover effects are un-derestimated. Empirical research is needed to improve the understanding of technology de-velopment in industry, especially focusing on the role of policy and international technol-ogy transfer patterns (e.g. global suppliers, changing trade patterns, role of FDI, and poten-tial spillovers on local firms). Further research needs to be conducted to better understand the production factors and their importance for investment decisions. This could be carried out with interview-based and bottom-up analyses of the drivers, revealing the relevance of each of the production factors and evaluating the macro and microeconomic variables. This could help modellers to construct more realistic mechanisms for projecting carbon leakage and technological change in climate models. To summarize, the main policy-relevant conclusions are • that the indicator 'leakage rate' (or 'leakage') is, per se, insufficient for policy making • that the beneficial effect of technology transfer to developing countries on the reduction
of greenhouse gas emissions (positive spillovers) is substantial for energy-intensive in-dustries (but has so far not been quantified in a reliable manner)
• that environmental policy has so far been a subordinate criterion for investment deci-sions
• that even in a world of pricing CO2 emissions, there is a good chance that net spillover effects are positive given the unexploited no-regret potentials and the technology and

180 Report 500036 002 (ECN-C--05-014)
know-how transfer by foreign trade and educational impulses from Annex I countries to Non-Annex I countries
Report 500036 002 (ECN-C--05-014) 181
C.8 References
Albrecht J., 1998, Environmental policy and the inward investment position of the US 'dirty' industries, Intereconomics, July/August: p. 186-194
Bahk BH, Gort M. 1993. Decomposing Learning by Doing in New Plants. Journal of Politi-cal Economy 101: 561-583.
Barringer, W.H. and K.J. Pierce. 2000. Paying the Price for Big Steel. Washington, DC: American Institute for International Steel.
Bevan A., Estrin S., Meyer K., 2000. Institution Building and the integration of eastern Europe in international production, One Europe or Several? Working Paper p0016
Bevan A., Estrin S., 2000. The determinants of foreign direct investment in transition economies, CEPR Discussion Paper No. 2638
Bouman M., Environmental costs and capital flight, Tinbergen Institute Research Series n. 177, 1988
Calderon C., Loayza N., Serven L., 2004. Greenfield Foreign Direct Investment and merg-ers and acquisitions: Feedback and macroeconomic effects, World Bank Working Paper 3192
Calderon, C., N. Loayza, and L. Serven. 2004. Greenfield Foreign Direct Investment and Mergers and Acquisitions: Feedback and Macroeconomic Effects. World Bank Pol-icy Research Working Paper 3192, The World Bank, Washington, DC.
Celikkol P, Stefanou S. 1999. Measuring the impact of price-induced innovation on techno-logical progress: Application to the US food processing and distribution sector. Journal of Productivity Analysis 12: 135-51.
Co C., Folmer H., Jeppesen T., List J., McHone W., 2002. The impact of environmental regulations on capital flows: some methodological considerations, with John A. List, in L. Marsiliani, M. Rauscher, and C. Withagen (eds.), Environmental Eco-nomics and the International Economy, Kluwer Publishers.
Cohen LR, Noll RG. 1994. Privatising Public Research. Scientific American, Sept: 72-77.
Damijan, J.P., M. Knell, B. Majcen and M. Rojec. 2003. The Role of FDI, R&D Accumula-tion and Trade in Transferring Technology to Transition Countries: Evidence from Firm Panel Data for Eight Transition Countries. Economic Systems 27 pp.189-204.
De Beer J, Worrell E, Blok K. 1998. Future Technologies for Energy Efficient Iron and Steel making. Ann. Rev. Energy Env. 23: 123-205.
De Beer, J. 1998. Potential for Industrial Energy-Efficiency Improvement in the Long Term. Ph.D. Thesis, Utrecht University, Utrecht, The Netherlands
Dees S., 1998. Foreign Direct Investment in China: Determinants and Effects, Economics of Planning 31: p.175-194
Eskeland, GS and A.E. Harrison. 2003. Moving to Greener Pastures? Multinationals and the Pollution Haven Hypothesis. Journal of Development Economics 70 pp.12-23.
Gehrmann, W.: Ganz heiss auf Eisen. DIE ZEIT, No. 13, 18 March 2004, p.32
German Council for Sustainable Development (Nachhaltigkeitsrat), 2004. The Export of Second-Hand Goods and the Transfer of Technology. Geschäftsstelle des Rates für Nachhaltige Entwicklung, Berlin, Germany.

182 Report 500036 002 (ECN-C--05-014)
Gielen D.J., Moriguchi Y. 2001. Environmental Strategy design for the Japanese Iron and Steel industry, a global perspective. Working document. NIES, Tsukuba. Draft.
Gladwin T., 1980. Patterns of Environmental Conflict over industrial facilities in the United States, 1970-1978, Natural Resources Journal 20 p.249
Grether J-M., Melo J., 2002. Globalisation and dirty industries: Do pollution havens mat-ter?, NBER Working Paper No. w9776
Grossman G.M., Helpman E., 1991. Innovation and growth in the global economy, Cam-bridge MA, MIT Press
Grubb, M. and J. Koehler. Not dated. Induced Technical Change: Evidence and Implica-tions for Energy-Environmental Modelling and Policy. Working paper. Department of Economics, Cambridge University, Cambridge, UK.
Gruber H. 1992. The learning Curve in the production of semiconductor memory chips. Ap-plied Economics 24: 885-894.
IEA (International Energy Agency): Energy Balances of Non-OECD countries 2000-2001. IEA/OECD, Paris, 2003b
IEA (International Energy Agency): Energy Balances of OECD countries 2000-2001. IEA/OECD, Paris, 2003a
IISI. Multiple years. Steel Statistical Yearbook, Brussels: International Iron and Steel Insti-tute.
Intergovernmental Panel on Climate Change (IPCC). 2000. Methodological and Techno-logical Issues in Technology Transfer. Cambridge University Press, Cambridge, UK.
Intergovernmental Panel on Climate Change (IPCC). 2001. Climate Change 2001, Mitiga-tion (WG III). Cambridge University Press, Cambridge, UK.
International Energy Agency. 2000. Experience Curves for Energy Technology Policy, Paris, France: IEA.
International Energy Agency. 2003. Experience Curves: A Tool for Energy Policy Analysis and Design, Joint workshop organized by the EU project 'Experience curves: a tool for energy policy programme assessment EXTOOL' and the international network on 'Experience curves for Energy Technology Policy EXCEPT', 22-24.January.2003, Paris, France: IEA.
International Energy Agency. 2004. Oil Crises and Climate Change, 30 Years of Energy Use in IEA Countries. Paris, France: IEA.
Jarmin RS. 1994. Learning by doing and competition in early rayon industry. RAND Jour-nal of Economics 25: 441-454.
Jochem, E. and Averbeck, C.: Recommendations of the Council for Sustainable Development to the German Government with regard to Exports of used products from industrial-ised countries and the prevailing practise of construction in developing countries – Chances and risks for sustainable development (in German; original title: Empfehlungen des Rates für Nachhaltige Entwicklung an die Bundesregierung zum Thema 'Exporte von Gebrauchtgütern aus Industrieländern und Baupraxis von Ge-bäuden in Entwicklungsländern- und Schwellenländern - Chancen und Gefahren für eine nachhaltige Entwicklung'). German Council for Sustainable Development, Octo-ber 2003
Joo, S., Shin, M.K., Cho, M., Lee, S.D., Lee, J.H., Lee, I.O., Schenk, J.L., Kepplinger, W.L., Wallner, F., Gennari, U.R., Hauzenberger, F., and Nagle, M. 1998. Direct Use of Fine Iron Ore in the Corex® Process. Iron & Steel Maker 7 25: pp.39-43.

Report 500036 002 (ECN-C--05-014) 183
Kim, Y. and E. Worrell. 2002. International Comparison of CO2 Emission Trends in the Iorn and Steel Industry. Energy Policy 30 pp.827-838.
Kuik, O. and R. Gerlagh. 2003. Trade Liberalization and Carbon Leakage. The Energy Journal 3 24 pp.97-120.
Laitner JS, Sanstad AH. 2003. Learning to capture progress on both the demand and the supply side: implications for electric utility investments. Proc. Workshop on Ex-perience Curves: A Tool for Energy Policy Analysis and Design, Paris, January 22-24, 2003. Paris, France: IEA.
Lamparter, D. H.: Einer will gewinnen. DIE ZEIT, No. 23, 27 May 2004, p.21
Landau R, Rosenberg N. 1994. Innovation in the Chemical Procession Industry. In Explor-ing the Black Box: Technology, Economics, and History. Cambridge, Cambridge University Press: pp. 190-202.
Lankes H.P., Venables A.G., 1997. Foreign Direct Investment in Economic Transition: the changing pattern of investments, Economics of Transition 4, pp.331-347
Leonard J.H., 1988. Pollution and the Struggle for the World Product, Cambridge Univer-sity Press.
Lieberman MB. 1984. The Learning Curve and Pricing in the Chemical Processing Indus-tries. Rand Journal of Economics 15: 213-28.
List J., Millimet D., 2002. Measuring the effects of environmental regulations on manufac-turing plant births: a new empirical paradigm, with John A. List, in L. Marsiliani, M. Rauscher, and C. Withagen (eds.), Environmental Economics and the Interna-tional Economy, Kluwer Publishers.
Liu, Z. 2002. Foreign Direct Investment and Technology Spillover: Evidence from China. Journal of Comparative Economics 30 pp.579-602.
Löschel, A. 2002. Technological Change in Economic Models of Environmental Policy: A Survey. Ecological Economics 43 pp.105-126.
Luiten EEM. 2001. Beyond Energy Efficiency. Ph.D. Thesis. Utrecht, The Netherlands: Ut-recht University.
Lutz, C., B. Meyer, C, Nathani and J. Schleich. Forthcoming. Endogenous Technological Change and Emissions: The Case of the German Steel Industry. Energy Policy (forthcoming).
Maestad O., 2000. International climate policy - consequences for shipping, Centre for In-ternational Economics and Shipping, SNF report 82/2000
Mani M., Wheeler D., 1999. In search of pollution havens? Dirty industry in the world economy: 1960-1995, background document OECD Conference on FDI and Envi-ronment (1999), World Bank Discussion Paper, No. 402
Mani M, Muthukumara S., 1996. Environmental Tariffs on polluting imports: An empirical study, Environmental and Resource Economics 7, p. 391-411
Markusen J.R., Morey E.R., Olewiler N., 1995. Competition in regional environmental policies when plant locations are endogenous, Journal of Public economics 56, p.55-77
Martin N, Worrell E, Ruth M, Price L, Elliott RN, Shipley AM, Thorne J. 2000. Emerging Energy-Efficient Industrial Technologies. Berkeley, CA/Washington, DC: Law-rence Berkeley National Laboratory/American Council for an Energy-Efficient Economy (LBNL-46990).

184 Report 500036 002 (ECN-C--05-014)
Mucchielli J.L, Thisee F., 1997. Operating flexibility, global manufacturing and the option value of a multinational network, Management Science 40, p.123-139
Nelson RR. Ed. 1982. Government and Technical Progress. Pergamon Press, New York, NY.
Neumayer E., 2001. Pollution havens: Why be afraid of international capital mobility?, presentation at Environmental Economics, org. by Jak Smulders and E. Bulte, Til-burg University
OECD, 2002, Energy Balances for OECD countries, Organisation for Economic Coopera-tion and Development, Paris
OECD, 2003. Pollution abatement and control expenditure in OECD countries, Organisa-tion for Economic Cooperation and Development, Paris
Pellenbarg P.H., Wissen L.J.G., Dijk J. van, 2002. Firm relocation: State of the art and re-search prospects, Univ. Groningen, Research Report 02D31
Porter M.E., Linde van der C., Toward a new conception of the environmental competitive-ness, 1995, Journal of Economic Perspectives 9 (4), p. 97-118
Price, L., J. Sinton, E. Worrell, D. Phylipsen, X. Hu and J. Li. 2002. Energy Use and Car-bon Dioxide Emissions from Steel Production in China. Energy 27 pp.429-446
Ramirez CA, Patel M, Blok K. The non-energy intensive manufacturing sector. An energy analysis relating to the Netherlands. In: Energy (in press).
Roy, J., J. Sathaye, A. Sanstad, P. Mungia, and K. Schumacher. 1999. Productivity Trends in India’s Energy Intensive Industries. The Energy Journal 3 20 pp.33-61.
Singh H., Hungh K.W., 1995. Some new evidence on determinants of foreign direct in-vestment in developing countries, Policy Research Working Paper 1531, World Bank
Sleuwaegen L., Pennings E., 2003, New empirical evidence on the international relocation of production, DWTC project SE/01/003
Smarzynska B., Wei S-J., 2001. Pollution Havens and Foreign Direct Investment: Dirty Se-cret or popular myth?, NBER Working Paper No. w8465
Smarzynska, B.K. 2003. Does Foreign Direct Investment Increase the Productivity of Do-mestic Firms? In Search of Spillovers through Backward Linkages. World Bank Policy Research Working Paper 2923, The World Bank, Washington, DC.
United Nations Conference on Trade and Development 1997. World Investment Report 1997, Transnational Corporations, Market Structure and Competition Policy, United Nations, New York and Geneva.
United Nations Conference on Trade and Development (UNCTAD), World Investment Re-port, 2003, FDI policies for development: National and International Perspectives, United Nations, New York and Geneva.
United Nations Industrial Development Organization 1997. Industrial Development - Global Report 1997, Oxford University Press, Oxford, UK.
Van der Zwaan BCC van der, Gerlagh R, Klaassen G, Schrattenholzer L. 2002. Endogenous Technological Change in Climate Change Modelling. Energy Economics 24: 1-19.
Veenenbos, H., VNCI: Public comment on the results of the SPILLOVER project. SPILL-OVER Workshop, Den Haag, 2 July 2004
Veugelers, R. and B. Cassiman. 2004. Foreign Subsidiaries as a Channel of International Technology Diffusion: Some Direct Firm Level Evidence from Belgium. European Economic Review 48 pp. 455-476.

Report 500036 002 (ECN-C--05-014) 185
Waldkirch A., 2002. Foreign Direct Investment in a Developing Country: An empirical in-vestigation, Oregon State University
Wang K.Z., Winters L.A., 1993. EC imports from eastern Europe: iron and steel, EBRD, CEPR discussion papers 825
Wang T., China: Sources of Real Exchange Rate Fluctuations, IMF Working Paper WP/04/18
Wheeler D., Mody A., 1991. International investment location decisions: The case of US firms, Journal of International Economics 33: p. 57-76
Worrell E.., Laitner J.A., Ruth M. and Finman H., 2003. Productivity Benefits of Industrial Energy Efficiency Measures. Energy 11 28 pp.1081-1098.
World Bank 1998b. Competitiveness Indicators, World Bank, Washington DC
World Economic Forum, 1999. Global Competitiveness report, Geneva, Switzerland.
Wu Y., Recent Developments in the Chinese Steel Industry: A survey, WACETRF
Xing Y., Kolstad C. 1998. Do lax environmental regulations attract foreign direct invest-ment? Department of Economics, UCSB, Departmental Working Papers. Paper wp28-98pt1.
Yachir F. 1988. Mining in Africa today, The United Nations University/Third World Forum studies in African political economy; 5, 1988
Yin JZ. 1994. Managing Process Innovation through Incremental Improvements: Empirical Evidence in the Petroleum Refining Industry. Technological Forecasting and So-cial Change 47: 265-76.
Zervas, T., J.T. McMullan, and B.C. Williams. 1996. Gas-Based Direct Reduction Proc-esses for Iron and Steel Production Int. J. of Energy Research 2 20 pp.157-185.
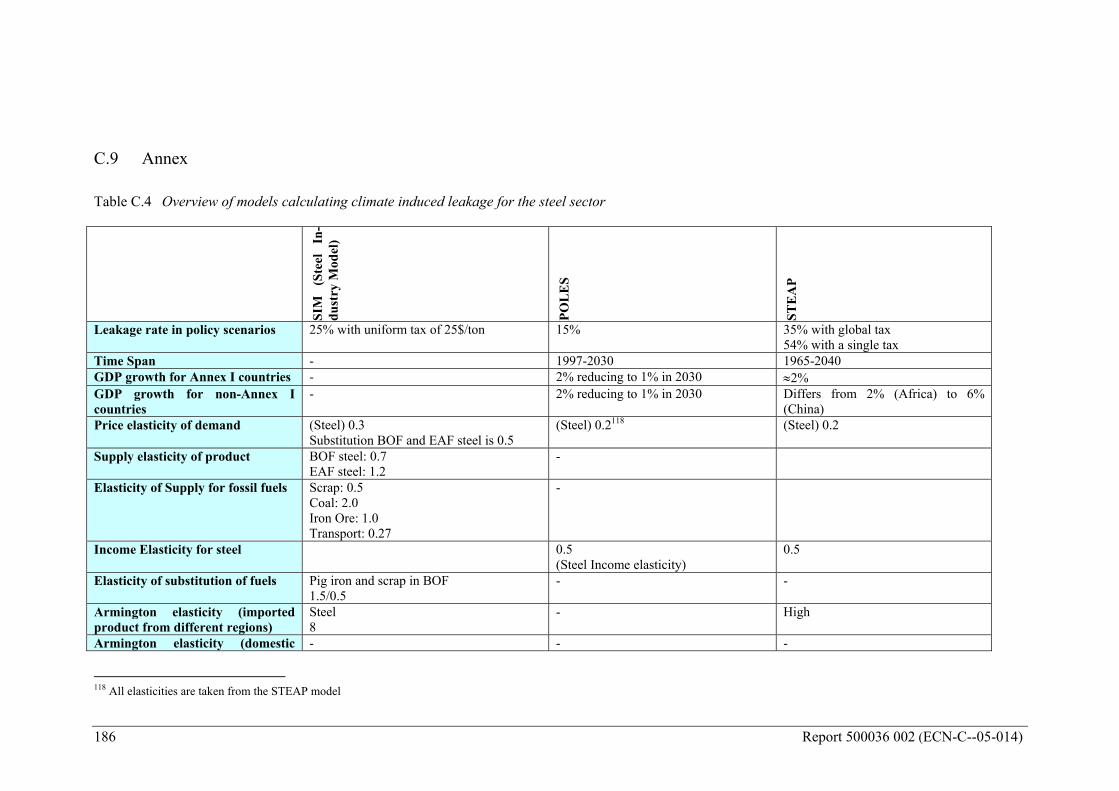
186 Report 500036 002 (ECN-C--05-014)
C.9 Annex Table C.4 Overview of models calculating climate induced leakage for the steel sector
SIM
(S
teel
In
-du
stry
Mod
el)
POL
ESP
OL
ES
STE
AP
Leakage rate in policy scenarios 25% with uniform tax of 25$/ton
15% 35% with global tax 54% with a single tax
Time Span - 1997-2030 1965-2040 GDP growth for Annex I countries - 2% reducing to 1% in 2030 ≈2% GDP growth for non-Annex I countries
- 2% reducing to 1% in 2030 Differs from 2% (Africa) to 6% (China)
Price elasticity of demand (Steel) 0.3 Substitution BOF and EAF steel is 0.5
(Steel) 0.2118 (Steel) 0.2
Supply elasticity of product BOF steel: 0.7 EAF steel: 1.2
-
Elasticity of Supply for fossil fuels Scrap: 0.5 Coal: 2.0 Iron Ore: 1.0 Transport: 0.27
-
Income Elasticity for steel 0.5 (Steel Income elasticity)
0.5
Elasticity of substitution of fuels Pig iron and scrap in BOF 1.5/0.5
- -
Armington elasticity (imported product from different regions)
Steel 8
- High
Armington elasticity (domestic - - -
118 All elasticities are taken from the STEAP model
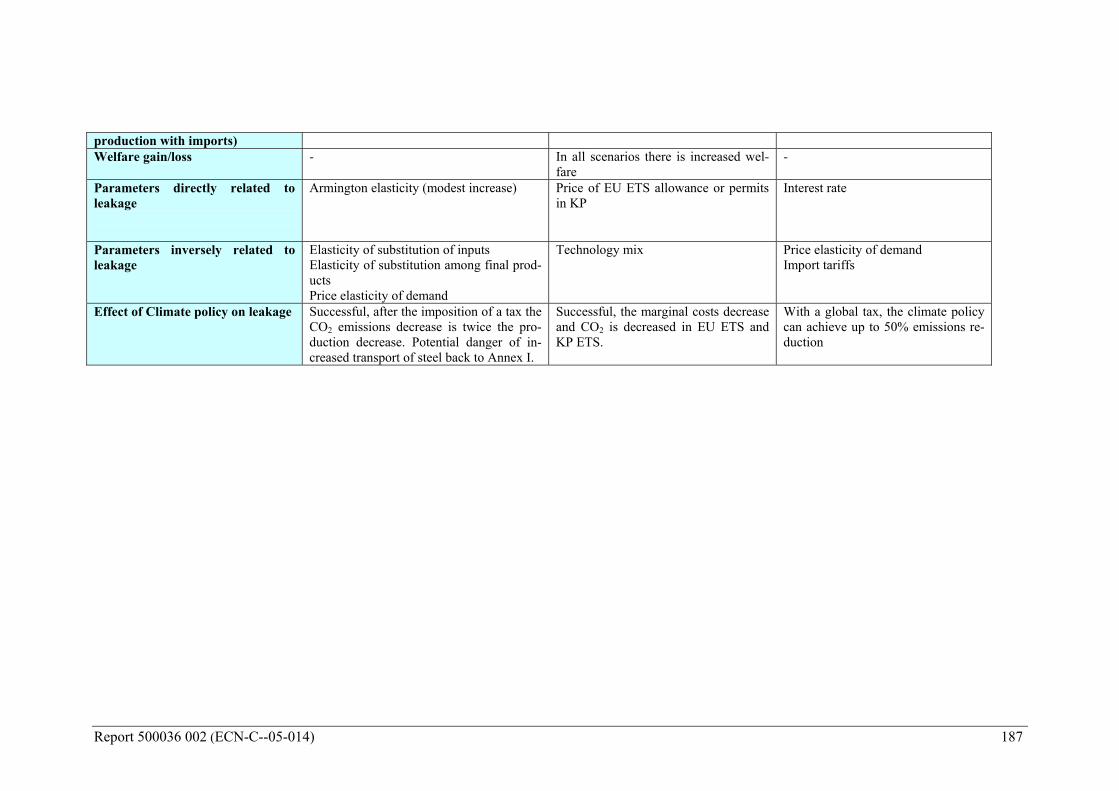
Report 500036 002 (ECN-C--05-014) 187
production with imports) Welfare gain/loss - In all scenarios there is increased wel-
fare -
Parameters directly related to leakage
Armington elasticity (modest increase)
Price of EU ETS allowance or permits in KP
Interest rate
Parameters inversely related to leakage
Elasticity of substitution of inputs Elasticity of substitution among final prod-ucts Price elasticity of demand
Technology mix Price elasticity of demand Import tariffs
Effect of Climate policy on leakage Successful, after the imposition of a tax the CO2 emissions decrease is twice the pro-duction decrease. Potential danger of in-creased transport of steel back to Annex I.
Successful, the marginal costs decrease and CO2 is decreased in EU ETS and KP ETS.
With a global tax, the climate policy can achieve up to 50% emissions re-duction


Report 500036 002 (ECN-C--05-014) 189
APPENDIX D: SPILLOVER EFFECTS FROM WIND POWER
P. Lako
Energy research Centre of the Netherlands (ECN)

190 Report 500036 002 (ECN-C--05-014)

Report 500036 002 (ECN-C--05-014) 191
D.0 Summary for policymakers This case study presents an analysis of spillover effects in the development of wind power, based on a review of four recent studies on the development of onshore and offshore wind in EU countries. The concept of spillover originates in the literature of R&D and technical change where it has been applied under a variety of other labels such as ‘R&D spillovers’, ‘knowledge spillovers’, ‘technological spillovers’, and ‘innovation spillovers’. Three EU countries - Denmark, Germany, and Spain - are regarded as the cradle of the modern wind turbine industry, next to the US and to a lesser extent other EU countries. In Denmark, development of wind energy became a cornerstone of the Danish energy policy after the oil crisis of 1974. Soon, Danish wind turbine manufacturers became market leaders. It is realistic to assume that spillover effects from wind turbine technology in Denmark to other countries have occurred in the period 1980-2000. Wind turbine manufacturers in other countries profited from the Danish wind energy technology: Nordex is a mixed Danish/German wind turbine manufacturer, and Gamesa Eólica (Spain) is a former subsidiary of Vestas (Denmark). Although spillover may have occurred, the magnitude of these effects is difficult to quantify. Knowledge spillover to non-Annex 1 countries has been far less important than between Annex 1 countries, as most developing countries - except India - are in an early stage of the development of their wind resources. A second type of spillover effect has to do with the adoption of policies favouring wind energy. Also in this respect countries learned from the experience of the Danish government, by implementing R&D policies, feed-in tariffs, etc. One of the literature sources refers to spillover effects in several ways: • Knowledge spillover from Denmark to Germany is explicitly mentioned, in particular with
regard to small wind turbines. • Part of the price reduction for wind turbines in the UK is related to importing wind tur-
bines, the prices of which have declined as a result of domestic sales. In particular spillover from Denmark to the UK is taken into account.
In the so-called EXTOOL project experience curves were established for wind power in Den-mark, Germany, Spain, and Sweden. The study also provides insight in spillover effects, e.g. from Denmark to Germany and Spain. The successful deployment in the 1990s of proprietary wind turbine technologies by e.g. the German Enercon was based on both company funding and dedicated federal RD&D support. In Spain, no wind turbines from indigenous wind turbine manufacturers were commercially available until 1992. Right from the start in 1983, the Spanish company Ecotècnia had to have the technology right in order to generate financing. Ecotècnia depended mostly on national budget subsidies for its early growth. Up to the mid-1990s, practically all wind power projects in Spain received some kind of ‘RD&D support’. Knowledge spillover is observed from the wind turbine industry in the US and Denmark to manufacturers like Made and Ecotècnia. Finally, spillover effects in the development of offshore wind power are shortly addressed. Long-term stable offshore prospects may support cost reductions, especially for the installation costs, but also for wind turbines. No single country has the potential to create an offshore wind market on its own. Thus, a joint European policy regarding the stimulation of offshore wind farms might be a great benefit both to ensure diffusion of offshore wind and cost reductions.
192 Report 500036 002 (ECN-C--05-014)
D.1 Introduction
D.1.1 Scope of the project This case study focuses on spillover effects in the development of wind power. It is part of a re-search project called ‘Carbon leakages and induced technological change: the negative and posi-tive spillover impacts of stringent climate change policy’ (or, more briefly, the so-called ‘Spill-overs of climate policy’ project). The concept of spillover originates in the literature of R&D and technical change - including the innovation and endogenous growth theories - where it has been applied under a variety of largely synonymous labels such as ‘R&D spillovers’, ‘knowledge spillovers’, ‘technological spillovers’, ‘innovation spillovers’ or equivalent terms such as ‘R&D or knowledge external-ities’. These concepts all refer to the fact that knowledge has a high non-rival, public-good char-acter and that, as a result, a private innovator may be unable to fully appropriate the social re-turns of investments in R&D and technological change (Sijm, 2004). In the ‘Spillovers of climate policy’ project, a consortium of four research partners in the Neth-erlands, has conducted research on the following subjects: 1. A general assessment on the potential incidence of carbon leakage due to climate policy in
Annex I countries of the Kyoto protocol, based primarily on analytical model studies. 2. A general assessment on the potential incidence of induced technological change owing to
climate policy, including the diffusion of induced technological innovations to non-Annex I countries, based primarily on analytical model studies.
3. A case-study assessment on the potential incidence of climate policy spillovers in the en-ergy-intensive industry, based primarily on empirical studies of this industry.
4. A case-study assessment on the potential incidence of climate policy-induced technological spillovers in the wind power turbine industry, based primarily on empirical studies of this industry (the present study).
5. A case-study assessment on the potential incidence of climate policy-induced technological spillovers in the biomass and bio-energy industry, based primarily on empirical studies of this industry.
These studies and case-studies have been summarised by the project leader Sijm of ECN Policy Studies in (Sijm et al., 2004).
D.1.2 Background and scope of study For a number of reasons, the development of wind power is an interesting case of spillover ef-fects: • Wind power is a relatively young renewable energy source, besides hydropower and bio-
mass. Its ‘track record’ is sufficiently long to analyse spillover effects. • Three EU countries - Denmark, Germany, and Spain - are regarded as the cradle of the
modern wind turbine industry, next to the US and to a lesser extent other EU countries. Only recently, the wind turbine industry became a global industry. There is dominant posi-tion for wind turbine manufacturers in the EU and the US.
• The EU countries try to develop wind power into a thriving industry. The EU-15 has the ob-ligation to reduce its greenhouse gas emissions by 8% in 2008-2012 compared to 1990. Also, the EU-15 has formulated a target to increase the share of renewables from 6% of gross inland energy consumption in 1990 to 12% in 2010. Recent evidence (Environment Daily, 2004; Jansen et al., 2004) indicates that the share of renewables in electricity genera-tion will be 18-19% instead of the targeted 22%, and that the share of renewables in energy consumption will be 10 instead of 12% in 2010. Only if member states would initiate more vigorous policies with regard to renewable heating sources (solar heating, geothermal en-ergy), the original targets could be met.
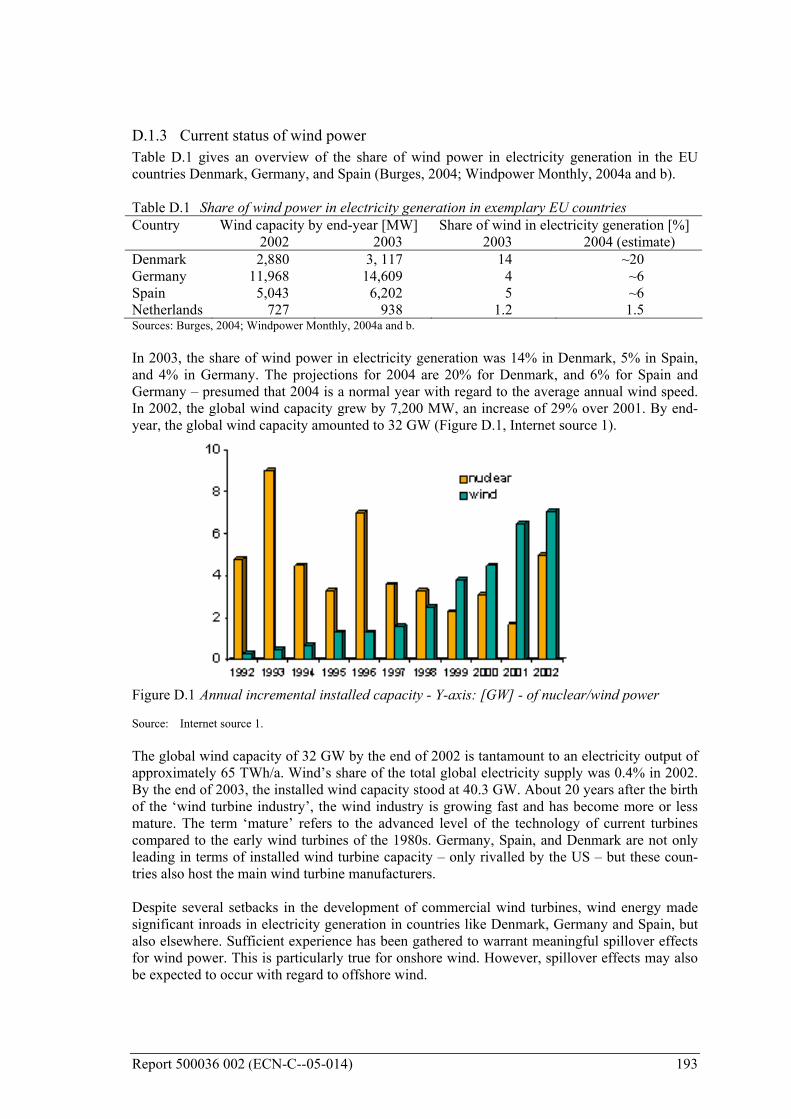
Report 500036 002 (ECN-C--05-014) 193
D.1.3 Current status of wind power Table D.1 gives an overview of the share of wind power in electricity generation in the EU countries Denmark, Germany, and Spain (Burges, 2004; Windpower Monthly, 2004a and b). Table D.1 Share of wind power in electricity generation in exemplary EU countries Country Wind capacity by end-year [MW] Share of wind in electricity generation [%]
2002 2003 2003 2004 (estimate) Denmark 2,880 3, 117 14 ~20 Germany 11,968 14,609 4 ~6 Spain 5,043 6,202 5 ~6 Netherlands 727 938 1.2 1.5 Sources: Burges, 2004; Windpower Monthly, 2004a and b. In 2003, the share of wind power in electricity generation was 14% in Denmark, 5% in Spain, and 4% in Germany. The projections for 2004 are 20% for Denmark, and 6% for Spain and Germany – presumed that 2004 is a normal year with regard to the average annual wind speed. In 2002, the global wind capacity grew by 7,200 MW, an increase of 29% over 2001. By end-year, the global wind capacity amounted to 32 GW (Figure D.1, Internet source 1).
Figure D.1 Annual incremental installed capacity - Y-axis: [GW] - of nuclear/wind power Source: Internet source 1. The global wind capacity of 32 GW by the end of 2002 is tantamount to an electricity output of approximately 65 TWh/a. Wind’s share of the total global electricity supply was 0.4% in 2002. By the end of 2003, the installed wind capacity stood at 40.3 GW. About 20 years after the birth of the ‘wind turbine industry’, the wind industry is growing fast and has become more or less mature. The term ‘mature’ refers to the advanced level of the technology of current turbines compared to the early wind turbines of the 1980s. Germany, Spain, and Denmark are not only leading in terms of installed wind turbine capacity – only rivalled by the US – but these coun-tries also host the main wind turbine manufacturers. Despite several setbacks in the development of commercial wind turbines, wind energy made significant inroads in electricity generation in countries like Denmark, Germany and Spain, but also elsewhere. Sufficient experience has been gathered to warrant meaningful spillover effects for wind power. This is particularly true for onshore wind. However, spillover effects may also be expected to occur with regard to offshore wind.

194 Report 500036 002 (ECN-C--05-014)
D.1.4 Guidance to the reader The following chapters review four studies dealing with certain aspects of spillover effects in the wind power sector in EU countries. In Chapter 2, the focus is on spillover effects from the Danish wind turbine industry, based on publications by Kamp (2002). These publications give a detailed analysis of the development of wind energy in Denmark and the Netherlands. Chapter 3 focuses on two-factor learning applied to wind energy in Denmark, Germany, and the UK by Klaassen et al. (2003). Chapter 4 presents a review of the publications by Neij et al. (2003a and 2003b) on the use of experience curves for wind energy in Denmark, Germany, Spain, and Sweden. Chapter 5 covers technological developments and cost reduction in the wind sector, with emphasis on offshore wind, by Junginger et al. (2004). Finally, Chapter 6 presents conclusions and policy implications with regard to spillover effects in the development of onshore and offshore wind power.

Report 500036 002 (ECN-C--05-014) 195
D.2 Spillover effects of the Danish wind turbine industry
D.2.1 Introduction The Ph.D thesis (Kamp, 2002) and the article (Kamp et al., 2004) based on this thesis give an in-depth analysis of the development of wind power in Denmark and the Netherlands. This Chapter focuses on spillover effects of the Danish wind turbine industry, largely based on this thesis. In order to understand the spillover effects in the development of wind power, it is neces-sary to analyse the wind turbine industry during the last few decades. According to (Kamp, 2002), technological learning is important, particularly in the case of tech-nologies like wind turbines that consist of several interacting parts and have to function in changing environments. Variations on a dominant design are introduced in what is called the ‘selection environment’. The most promising variations are selected. The selection environment is a broader concept than the market: it includes regulations, norms, beliefs and expectations of multiple actors, government policies, taxes and subsidies. Research, Development, and Demonstration (RD&D) programs on a national and supranational scale (EU, IEA) have been important for the technological development of wind power. Also, financial measures for introduction and marketing of wind turbines proved to be indispensable. These driving forces may be observed in EU countries that are leading with regard to wind power – Denmark, Germany, and Spain – and in countries with a less thriving wind industry. It is important to analyse the specific driving forces in order to qualify the spillover effects. §2.2 gives a brief introduction to different types of wind turbines. §2.2 presents an overview of the development of the wind turbine industry in Denmark. In §2.3, the position of the Danish wind turbine industry is shortly addressed. §2.4 presents some results from (Kamp, 2002) with regard to spillover effects of the Danish wind turbine industry.
D.2.2 Different types of wind turbines The mechanical power output of a wind turbine depends on the wind speed and the pitch angle. There are basically two types of power control (Koch et al., 2003): 1. Stall regulation
The pitch angle in a stall-controlled turbine is fixed. The rotor is designed in such a way that it stalls at wind over-speed, thereby protecting the turbine from mechanical damage. Within the normal range of wind speeds, the power generation is determined by the actual wind speed.
2. Pitch regulation In pitch-controlled turbines the pitch angle enables the continuous control of the power out-put despite the stochastically varying wind speed. Normally the pitch angle is adjusted for maximum output except under conditions of wind over-speed during which the output power is limited to the rated value by the pitch angle control.
Stall has proved to be appropriate for power control of medium scale turbines (≤ 1 MW). For larger turbines, other mechanisms are used: active stall – the turbine blades are pitched at low wind speeds until the stall position is reached – and full blade pitching with variable rotor speed.
D.2.3 Development of the wind turbine industry in Denmark After the first oil crisis in 1973, the US and several European countries, among which Denmark, Germany, and the Netherlands, embarked on wind energy RD&D programs. From the 1980s, a nascent wind turbine industry in Denmark started to produce small wind turbines (<100 kW)

196 Report 500036 002 (ECN-C--05-014)
that were coupled to the electric grid. Already in the 1950s, the Danes had become worried about growing dependence on imported fossil fuels for the first time, and the wind turbines of the 1980s were small-scale copies of the 200 kW Gedser turbine (in service from 1957 to 1967). As the Danish government was poised to reduce the dependence on imported oil, development of wind power became a cornerstone of the Danish energy policy. The Danish government de-cided to support the development of large wind turbines with a capacity of hundreds of kW or MWs of an advanced type, and to foster market introduction of smaller conventional wind tur-bines by local industries. In (Kamp, 2002), the policy of the Danish government to support development of large wind turbines is highlighted. This program on large wind turbines (1977-1990) included turbines with full blade pitching. The proved stall mechanism of the Danish Gedser turbine (operational from 1957 to 1967) was applied to the small Danish turbines of the early 1980s. Table D.2 shows fea-tures of wind turbines developed in the program for large wind turbines. Table D.2 Wind turbines developed in Danish RD&D program on large wind turbines Location Commissioned Capacity Rotor diameter Power regulation Cost
[kW] [m] [million DKK]Nibe A 1979 630 40 Stall Nibe B 1980 630 40 Pitch Koldby 1982 265 N/A Pitch }70.5
Masnedø 1987 5 x 750 N/A Pitch 50.0 Tjæreborg 1988 2,000 60 Pitch 65.0 Total 1977-1990 7,275 185.5 Source: Kamp, 2002. These large wind turbines were built according to technical requirements from the Danish utili-ties. The technical objectives of the program – building and operating large, advanced wind tur-bines – were met. However, the turbines proved to be not marketable. Also in other countries – the US, Germany, and the Netherlands – developing MW-scale turbines ‘from scratch’ into marketable turbines proved to be too ambitious: governments sometimes spent substantial sums on ‘kick-starting’ an industry of MW wind turbines, but the results were rather disappointing. Also, the EU gave financial support to several demonstration wind turbines in the MW class. The results of programs like the Danish program for large wind turbines (1977-1990) were not satisfactory. Large and advanced turbines, developed and demonstrated in the framework of this program proved to be ‘a bridge too far’. After a while, the Danes realised – and with them the wind community around the world – that it was easier to develop small wind turbines than to leapfrog by developing MW turbines ‘from scratch’. In 1990, the Danish government termi-nated the program for large wind turbines. This may be regarded as a sign that the Danish wind turbine industry had become more or less grown-up.
D.2.4 Position of the Danish wind turbine industry Energy and industrial policy governed the development of wind energy in Denmark until the late 1980s. At that time, Danish utilities placed large orders and technological development had made wind turbines more and more competitive. Also, export of turbines was a prerequisite for a healthy Danish wind turbine industry. The export increased based on guarantees from the Danish state. The wind turbine industry introduced MW-scale turbines around 1995 (Table D.3).

Report 500036 002 (ECN-C--05-014) 197
Table D.3 Prototype MW turbines commissioned by (Danish) wind turbine manufacturers Wind turbine manufacturer
Country of origin Commissioned Capacity Rotor diameter
Power regu-lation
[kW] [m] NEG-Micon Denmark 1995 1,500 60 Stall Vestas Denmark 1996 1,500 63 Active stall Bonus Denmark 1998 2,000 72 Active stall NEG-Micon Denmark 1999 2,000 72 Pitch Nordex Denmark/Germany 2000 2,500 80 Pitch Source: Kamp, 2002. The Danish manufacturers NEG-Micon, Vestas, and Bonus switched to pitch-control for their largest wind turbines. This shift in technology had its roots in technical-economic considera-tions: pitch control offers a significantly higher output at lower wind speeds than stall regula-tion. Also, pitch-controlled turbines have to be designed to lower loads than stall-controlled tur-bines of the same capacity. Danish manufacturers incorporated pitch control in the 2 MW tur-bines, just like Nordex (Denmark-Germany) and GE Wind Power (US) did. Whereas the Danish government originally started with a two-pronged approach of an RD&D program for large wind turbines and a more market-oriented approach for small wind turbines, around 1990 the Danish government switched to an ‘evolutionary’ development of small and medium scale wind turbines. This does not mean that all the money spent on large wind turbines had gone to waste, but it was a logical conclusion from the results emerging from the two-pronged approach.
D.2.5 Spillover effects The evolution of the wind turbine industry may be illustrated by data from (EurObserver, 2004) with regard to the wind turbine market in 2002 (Table D.4). Table D.4 Key data of wind turbine manufacturers in 2002 Rank Wind turbine
manufacturer Country of origin Sold Market share
(2002) Turnover
(2002) Employees
(2002) [MW] [%] [million €] 1 Vestas119 Denmark 1,640 21.8 1,394 5,974 2 Enercon Germany 1,333 17.7 1,200 6,800 3 NEG-Micon1 Denmark 1,030 13.7 842 2,180 4 Gamesa Eólica Spain 924 12.3 583 1,398 5 GE Wind Power US 638 8.5 N/A 1,700 6 Bonus Denmark 509 6.8 279 800 7 Nordex Denmark/Germany 504 6.7 445 791 8 Made Spain 247 3.3 N/A N/A 9 Repower Germany 223 3.0 251 390 10 Ecotècnia Spain 120 1.6 N/A 350 Others 371 4.9 N/A N/A Total 7,539 100.0 ~ 6,000 ~ 22,000 Table D.4 shows that Denmark, Germany, Spain, and the US are leading with regard to wind turbine manufacturing. It is quite realistic to assume that spillover effects from wind turbine technology in Denmark to other countries have occurred in the period 1980-2000. Before 1980, the development of wind energy was primarily a national activity. After 2000, the scale of wind turbine manufacturing became so large that the importance of national boundaries dwindled.
119 In 2003, the companies Vestas and NEG-Micon merged into the largest global wind turbine company, called
Vestas.

198 Report 500036 002 (ECN-C--05-014)
In the timeframe considered – 1980-2000 – wind turbine manufacturers in other countries prof-ited from the Danish wind energy technology: Nordex is a mixed Danish/German wind turbine manufacturer, and Gamesa Eólica (Spain) is a former subsidiary of Vestas (Denmark). There-fore, spillover effects from Denmark to e.g. Germany and Spain may have occurred, but the magnitude of these effects is difficult to quantify. Countries opened their markets to Danish wind turbines, as Denmark offered a superior wind turbine technology. This speeded up the technological development of an indigenous wind turbine industry in those countries. Spillover effects have probably been significant between Annex 1 countries, but not from An-nex 1 to developing countries. Spillover effects to non-Annex 1 countries were small, because most of these countries were still in an early stage of the development of their wind resources. India, however, is an example of a non-Annex 1 country with a successful wind turbine program and an indigenous wind turbine manufacturer, viz. Suzlon. As a matter of fact, Suzlon will build a prototype 2 MW wind turbine in southern India in the second half of 2004 (Windpower Monthly, 2004c). The second type of spillover effect has to do with the adoption of policies favouring wind en-ergy. Also in this respect, countries like Germany, Spain, and the Netherlands, learned from the experience of the Danish government, by implementing R&D policies, feed-in tariffs, etc. In some cases, e.g. feed-in tariffs, this spillover effect may have been important. However, there are also notable exceptions: in the UK tendering was favoured over feed-in tariffs.

Report 500036 002 (ECN-C--05-014) 199
D.3 Two-factor learning for wind Power in Denmark, Germany, and the UK
D.3.1 Introduction Two-factor learning is described by (Klaassen et al., 2003) for wind power in Denmark, Ger-many, and the UK. The analysis, performed by researchers of IIASA and the Royal Institute of Technology of Sweden, focuses on the contribution of public R&D and cumulative sales on the cost reduction of wind turbines. In the conventional learning literature, the focus is often only on the effect of capacity expansion (possibly stimulated by procurement policy) of the cost-reducing innovation. In contrast, Klaassen et al. extend the scope to the effect of public R&D120. In §3.2, the results of the analysis by (Klaassen et al., 2003) are briefly summarised. The results are also discussed within the context of wind energy development and policies in the countries of interest. §3.3 presents notions on spillover effects described by (Klaassen et al., 2003).
D.3.2 Two-factor learning Main results In order to analyse the relationship between the development of the investment costs over time on the one hand and cumulative capacity and the knowledge stock (based on public R&D) on the other, Klaassen et al. collected the following data: • The (average) investment costs per kW. (Figure D.2) • Cumulative capacity. (Figure D.3) • Annual public R&D expenditures. (Figure D.4) Figure D.2 shows the investment costs based on data collected in Denmark, Germany, and the UK. These costs also cover grid connections, foundations, and electrical connections.
Figure D.2 Specific investment cost, including grid connection, etc., of wind turbines In 1992, there was only one project in the UK, whereas data for the other years are generally av-erages of various projects. This is the explanation for the ‘bumpy’ curve in the period 1991- 120 Note that in (Sijm, 2004) ample examples are given of models and studies covering either this learning-by-doing
or learning-by-searching, but only occasionally both types of learning at the same time.

200 Report 500036 002 (ECN-C--05-014)
1993. Differences in the level of the costs across the countries are not only related to country-specific factors but also reflect differences in the average size of the wind turbines installed. Figure D.3 shows the cumulative wind capacity of Denmark, Germany, and the UK (Internet source 1; Windpower monthly, 2004a and b) for the timeframe 1990-2003 - the original graph in (Klaassen et al., 2003) referred to 1990-2000.
0
2000
4000
6000
8000
10000
12000
14000
16000
1990
1991
1992
1993
1994
1995
1996
1997
1998
1999
2000
2001
2002
2003
Germany
Denmark
UK
[MW]
Figure D.3 Cumulative wind capacity in Denmark, Germany, and the UK Sources: Internet source 1; Windpower Monthly, 2004a and b. Figure D.4 shows the development of the annual public R&D expenditures on wind power based on IEA data (IEA, 2000a).
Figure D.4 Public energy R&D expenditures for wind power Sources: IEA, 2000; Klaassen et al., 2003. In order to translate the annual public R&D expenditures from Figure D.4 into the development of a knowledge stock, assumptions are needed on the time lag between R&D expenditures and their addition to the knowledge stock as well as the depreciation of the knowledge stock. Initial estimates by IIASA of the time lag for solar PV and wind turbines on a global base indicated that time lags of 2 to 3 years and depreciation rates of around 5% lead to acceptable statistical

Report 500036 002 (ECN-C--05-014) 201
results. Klaassen et al. assume that the knowledge stock depreciates by 3%/a and that the time lag between public R&D expenditure and addition to the knowledge stock is 2 years. Figure D.5 depicts the development of the R&D based knowledge stock for wind power.
Figure D.5 Development of the R&D based knowledge stock for wind power Source: Klaassen et al., 2003. In the UK, public R&D expenditures have been relatively large compared to the scale of its wind turbine market. It is noteworthy that the effect of reducing R&D expenditures in the UK since the beginning of the 1990s becomes noticeable and the depletion effect of old knowledge overweighs the creation of the new knowledge in the very recent years. This is not yet the case in Germany due to the time lags and the depreciation rate of public (R&D-based) knowledge. Learning rates of 5.4% (PR = 0.946) for learning-by-doing and 12.6% (PR = 0.874) for the R&D based learning-by-searching for each doubling of cumulative installed capacity give the best fit with the development of wind power in Denmark, Germany, and the UK (1990-2000). Discussion The concept of knowledge stock with regard to RD&D on wind power is interesting, as public RD&D has been one of the cornerstones of e.g. the Danish energy policy (Chapter 2). This is also true for countries like Germany, Spain, and the Netherlands. A few comments to this study may be useful. Klaassen et al. note that their study was restricted to the 1990s due to data limitations especially on investment costs. Also, it was restricted to an evaluation of public R&D expenditures and did not take into account private R&D expenditures as a separate factor. Another limitation of the study is the special situation in the UK. Relatively high public R&D expenditures may have been a necessary condition for the growth of wind power in the UK, in the absence of a signifi-cant indigenous wind turbine industry. The slow demand growth of wind power in the UK was one of the reasons why indigenous wind turbine manufacturers did not get a firm foothold in that country. So, the wind turbine market in the UK was quite different from that in Denmark and Germany. Inclusion of a country like the UK in the dataset may easily distort the equation in which the effects of cumulative capacity and knowledge stock are weighted. Also, (Kamp, 2002) showed that the Danish government did much effort to create a more or less stable wind turbine market in Denmark and to foster the export market. The effect of financial incentives for wind power cannot easily be overestimated for Denmark and Germany. Financial
202 Report 500036 002 (ECN-C--05-014)
incentives trigger more wind turbine sales, and indirectly more private R&D spending. This mechanism may have become rather important in Denmark and Germany in the second half of the 1990s. Generally, it is doubtful whether R&D is a constant factor in the development of a technology from the pilot stage to the commercial stage. In the UK the mechanism of triggering private R&D through financial incentives was much less important, as the wind turbine market didn’t unfold as expected. Thus, it is conceivable that the ratio between learning-by-doing and R&D based learning-by-searching is different when private R&D is included. Put it in another way, commercialisation of technologies is intimately linked with R&D (Lako, 2001). Or, as Wene formulated it in (IEA, 2000b): ‘The cycle reinforces itself; it is a ‘virtuous cycle’. There is a double boost from the sales on the market and from the improvement of knowledge through R&D’.
D.3.3 Spillover effects Klaassen et al. refer to spillover effects in several ways: • Knowledge spillover from Denmark to Germany is explicitly mentioned, in particular with
regard to small wind turbines. • Part of the price reduction for wind turbines in the UK is related to importing wind tur-
bines, the prices of which have declined as a result of domestic sales. More than 95% of the wind turbines installed in the UK were imported and 80% were imported from Den-mark in the timeframe considered. Therefore, in particular spillover from Denmark to the UK is taken into account.
• More analysis is deemed worthwhile by the authors with regard to the treatment of spill-over effects between the three countries.
Klaassen et al. attribute much weight to spill-over effects from Denmark to Germany and the UK. This is in accordance with intuitive findings in § 2.4, partially based on (Kamp, 2002).

Report 500036 002 (ECN-C--05-014) 203
D.4 Experience curves: a tool for energy policy assessment
D.4.1 Introduction The study (Neij et al., 2003a) and the articles (Neij et al., 2003b; Neij, 2004; Neij et al., 2004) based on it give an analysis of experience curves for wind power in Denmark, Germany, Spain, and Sweden. These publications present results of the so-called EXTOOL project on behalf of the EC. §4.2 gives some results of the project and presents a discussion taking into account the development of wind power in the countries that are considered. §4.3 presents notions on spill-over effects in the framework of the study.
D.4.2 Experience curves (Neij et al., 2003a) gives an analysis of the development of experience curves (also called learn-ing curves), of different sources of cost reduction, and of the effect of different energy policy programmes in relation to the experience curve, e.g. the effect on the ride down the experience curve, the effect on the experience curve itself, and the cost effectiveness of different pro-grammes measured by the experience curve. The result of the project describes the advantages and disadvantages, the potential and limitations and the relevance of using experience curves as a tool for different energy policy programmes assessment. In the project, the development of the experience curve methodology is based on case studies of wind power and analysis of cost reduction due to different wind policy programmes. The wind policy programmes in Europe in the 1990s have resulted in a major development and deploy-ment of wind turbines. Therefore, a case study based on wind power enables the development of experience curves and the analysis of the policies involved. An experience curve describes the cost reduction of a technology as a function of cumulative experience in terms of units produced, units sold, etc. However, experience per se does not lead to cost reductions, but rather provides opportunities for cost reductions. The cost reduction, and the experience gained, will depend on market demand and market enlargement. Experience curves have originally been used to analyse the historical trend in cost reductions. More recently, experience curves have been extrapolated and used to analyse future cost reduc-tions in strategic decision making (e.g. Seebregts et al., 2000; Schaeffer et al., 2004121). Experi-ence curves are often based on price data and not on cost data. This is because analysts do not always have access to cost data. Substitution of cost data by price data is only a fair approxima-tion, if price/cost margins remain constant over time. If they do not, differences in e.g. price margins have to be considered explicitly. Experience curves are also used for analysing future energy costs and the potential of commercialisation of new energy technologies. Such analyses provide policy makers with important information on the trend of cost reduction of new energy technologies. The extrapolation of experience curves has also been integrated into complex en-ergy modelling for future energy scenarios. Although the experience curve shows a simple quantitative relationship between price and cu-mulative production or use of a technology, the curve must be seen as the combination of sev-eral parameters that effect cost reduction. Neij et al. show how different energy policy measures effect cost reduction and how they effect the experience curve of wind power.
121 Schaeffer et al. (2004) performed a recently completed study on solar PV with a similar scope as the so-called
EXTOOL project.
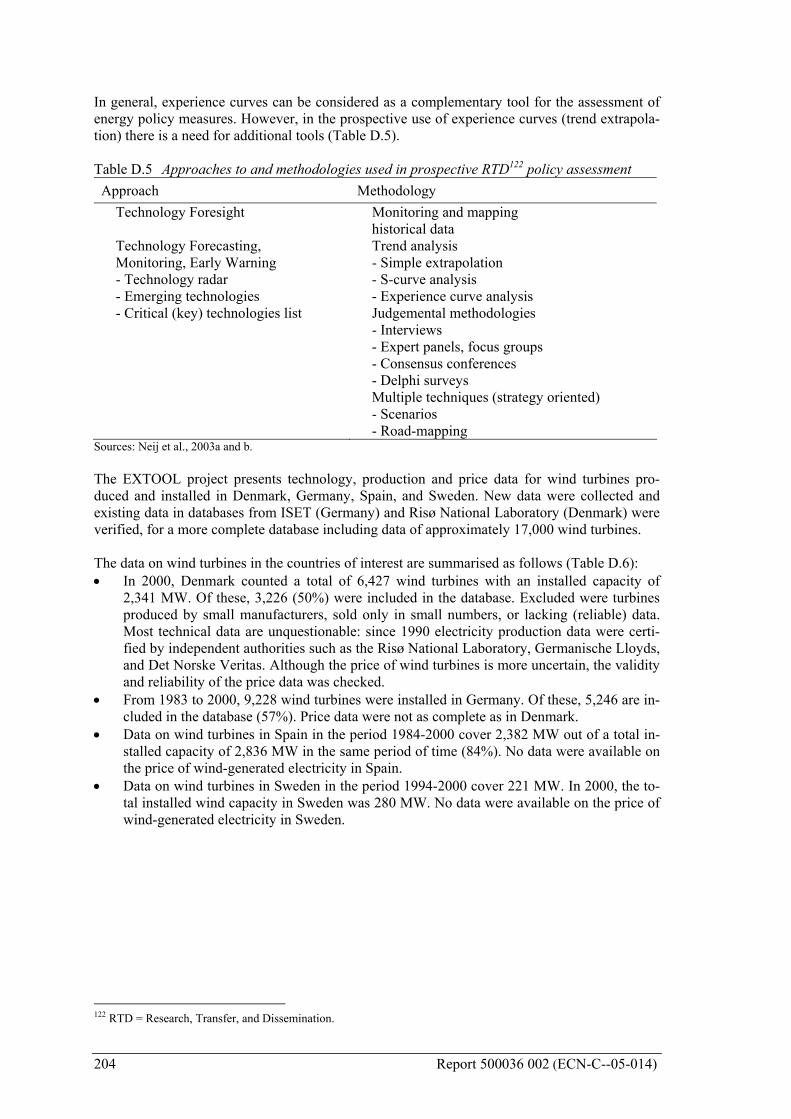
204 Report 500036 002 (ECN-C--05-014)
In general, experience curves can be considered as a complementary tool for the assessment of energy policy measures. However, in the prospective use of experience curves (trend extrapola-tion) there is a need for additional tools (Table D.5). Table D.5 Approaches to and methodologies used in prospective RTD122 policy assessment Approach Methodology
Technology Foresight Monitoring and mapping historical data Technology Forecasting, Trend analysis Monitoring, Early Warning - Simple extrapolation - Technology radar - S-curve analysis - Emerging technologies - Experience curve analysis - Critical (key) technologies list Judgemental methodologies - Interviews - Expert panels, focus groups - Consensus conferences - Delphi surveys Multiple techniques (strategy oriented) - Scenarios - Road-mapping
Sources: Neij et al., 2003a and b. The EXTOOL project presents technology, production and price data for wind turbines pro-duced and installed in Denmark, Germany, Spain, and Sweden. New data were collected and existing data in databases from ISET (Germany) and Risø National Laboratory (Denmark) were verified, for a more complete database including data of approximately 17,000 wind turbines. The data on wind turbines in the countries of interest are summarised as follows (Table D.6): • In 2000, Denmark counted a total of 6,427 wind turbines with an installed capacity of
2,341 MW. Of these, 3,226 (50%) were included in the database. Excluded were turbines produced by small manufacturers, sold only in small numbers, or lacking (reliable) data. Most technical data are unquestionable: since 1990 electricity production data were certi-fied by independent authorities such as the Risø National Laboratory, Germanische Lloyds, and Det Norske Veritas. Although the price of wind turbines is more uncertain, the validity and reliability of the price data was checked.
• From 1983 to 2000, 9,228 wind turbines were installed in Germany. Of these, 5,246 are in-cluded in the database (57%). Price data were not as complete as in Denmark.
• Data on wind turbines in Spain in the period 1984-2000 cover 2,382 MW out of a total in-stalled capacity of 2,836 MW in the same period of time (84%). No data were available on the price of wind-generated electricity in Spain.
• Data on wind turbines in Sweden in the period 1994-2000 cover 221 MW. In 2000, the to-tal installed wind capacity in Sweden was 280 MW. No data were available on the price of wind-generated electricity in Sweden.
122 RTD = Research, Transfer, and Dissemination.

Report 500036 002 (ECN-C--05-014) 205
Table D.6 Coverage of wind turbines in Denmark, Germany, Spain, and Sweden Country Number of wind turbines 2000 Cumulative capacity 2000 [MW] Total number Database Total cumulative Database Denmark Produced 6,427 3,226 2,341 N/A Germany Produced 9,228 5,246 6,107 5,667 Spain Installed N/A N/A 2,836 2,382 Sweden Installed N/A N/A 280 221 Sources: Neij et al., 2003a and b; Neij, 2004. Figure D.6 shows the development of the average price of wind turbines from Denmark and Germany as a function of time.
0
200
400
600
800
1000
1200
1400
1600
1800
1980
1982
1984
1986
1988
1990
1992
1994
1996
1998
2000
Denmark
Germany
[Euro/kW]
Figure D.6 Price of wind turbines (€2000) from Denmark and Germany as a function of time Source: Neij et al., 2003a. Figure D.7 is based on the cumulative global sales of the Danish wind turbine industry in the period 1981-2000 and price data for a representative selection of Danish wind turbines.
100
1,000
10,000
10 100 1,000 10,000
[Euro/kW]
[MW]
Figure D.7 Experience curve for wind turbines (price ex works, €2000) from Denmark Source: Neij et al., 2003a.

206 Report 500036 002 (ECN-C--05-014)
Similarly, Figure D.8 shows the experience curve based on cumulative global sales of the Ger-man wind turbine industry in the period 1987-2000.
100
1,000
10,000
1 10 100 1,000 10,000
[Euro/kW]
[MW]
Figure D.8 Experience curve for wind turbines (price ex works, €2000) from Germany Source: Neij et al., 2003a. The Progress Ratio (PR) of wind turbines produced by the Danish wind turbine industry is 0.92, and the PR of German wind turbines is 0.94. The data for Denmark allow Neij et al. to extend the experience curve to the levelised production cost (unit: Euro/kWh); such an experience curve for Danish wind turbines shows a PR of 0.83. Experience curves for the specific invest-ment cost (e.g. Figure D.7 and 4.3) may be used for extrapolation. However, experience curves for the levelised production cost may not be extrapolated, as current wind turbines are so ad-vanced that improvement of the capacity factor will not be significant, at least at constant hub height. Figure D.9 presents experience curves for the total installed cost of wind turbines as a function of the cumulative installed capacity in Denmark, Spain, and Sweden.
100
1,000
10,000
1.E-02 1.E-01 1.E+00 1.E+01 1.E+02 1.E+03 1.E+04
DenmarkSpainSweden
[Euro/kW]
[MW]
Figure D.9 Experience curve for total cost of installed wind turbines in EU countries (€2000) Sources: Neij et al., 2003a and b.

Report 500036 002 (ECN-C--05-014) 207
Figure D.9 shows that the cost reduction of the total installed cost (including civil cost, cabling, etc.) in Denmark and Spain is roughly comparable. The database for the total installed cost of wind turbines in Sweden is not so large, but the trend is similar to that in Denmark and Spain. Finally, Table D.7 summarises the public expenses for wind power in the four EU countries. Table D.7 Cumulative expenses for wind power in four EU countries [million €] Denmark Germany Spain Sweden Governmental RD&D Before 1990 47 177 32 100 1990-2000 53 50 27 28 EU RD&D - - - - Private R&D - - - - Investment subsidies 57 69 150 60 Production subsidies 332 131 - 27 ‘Feed-in law’ N/A 997 318 - Total >489 1,424 527 215 Sources: Neij et al., 2003b; Neij, 2004. The authors conclude that the high public expenses for RD&D in Germany and Sweden, in comparison to Denmark, might not have been necessary for the development of wind power. However, in §2.3 it was noted that not all the money spent on the Danish RD&D program for large wind turbines had gone to waste. This is also true for programs in Germany and Sweden.
D.4.3 Spillover effects (Neij et al., 2003a) provide insight in spillover effects from Denmark and the US to Germany and Spain. In the period 1985-2000, Germany witnessed a successful combination of: • Favourable market policy for electricity generated by wind turbines. • Favourable loans for wind turbine projects. • Subsidies to investors. • A monitoring program. Neij et al. note that successful deployment in the 1990s of proprietary wind turbine technologies by e.g. Enercon was based on both company funding and dedicated federal RD&D support. In Spain, no wind turbines from indigenous wind turbine manufacturers were commercially available until 1992. Right from the start in 1983, the Spanish company Ecotècnia had to have the technology right in order to generate financing. Ecotècnia depended mostly on national budget subsidies for its early growth. The Spanish government did not provide generous subsi-dies for indigenous wind turbine manufacturers, as in Denmark and Germany. Up to the mid-1990s, practically all wind power projects in Spain received some kind of ‘RD&D support’. With regard to spillover effects, Neij et al. make the following observation:
‘In general, Made and Ecotècnia have both adopted the practical strategy of com-bining technology transfer from the USA and Denmark with internal technology development. Thus the development of the Spanish industry has not solely been dependent on domestic RD&D efforts, but has made use of inputs from abroad’.
From 1991, the Swedish government offered investment subsidies for wind turbines. Danish wind turbine manufacturers entered the Swedish market with their medium-sized wind turbines. In the framework of an RD&D program on large wind turbines, Swedish industries developed and demonstrated several MW-scale turbines. However, these wind turbines proved to be not

208 Report 500036 002 (ECN-C--05-014)
marketable at that time. It must be acknowledged that the Swedish industry did not have a large home market as the Danish wind turbine industry did. Spillover effects from the Danish wind turbine industry to Swedish wind turbine manufacturers are not reported by Neij et al. However, this does not imply that such effects did not occur.

Report 500036 002 (ECN-C--05-014) 209
D.5 Cost reduction prospects for offshore wind
D.5.1 Introduction (Junginger et al., 2004) analyse technological developments and cost reduction trends in the on-shore and offshore wind sector. Based on a bottom-up analysis they estimate future investment costs of offshore wind farms. §5.2 presents the framework of their study, and §5.3 the main re-sults. In §5.4, spillover effects in the development of offshore wind are addressed., and in §5.5, policy implications from (Junginger et al., 2004) and other studies on this subject.
D.5.2 Framework of the study According to (Junginger et al., 2004), offshore wind has several advantages over onshore wind: • Due to the higher average wind speed offshore, offshore wind farms may yield up to 50%
more than onshore wind farms of equal capacity (and hub height). • Onshore wind farms may meet public resistance from visual impact, noise, and shadow
casting; offshore wind farms, sufficiently distant from the shore, meet less resistance. • Offshore wind has a very large potential compared to onshore wind. The potential of on-
shore wind is often curtailed by considerations of conservation of landscape. Junginger et al. explore the range of reductions of the initial investment cost of offshore wind by a bottom-up analysis of technological improvements and cost reduction options. Important un-derlying drivers are identified for cost reductions. Apart from drivers directly related to the de-velopment of offshore wind, they explore exogenous developments in the offshore oil and gas sector and offshore experience with High-Voltage Direct Current (HVDC) transmission.
D.5.3 Main results Table D.8 present the following overview of the main components of the cost of offshore wind. Table D.8 Overview of relevant factors behind cost reductions of offshore wind farms Specific offshore wind developments Exogenous developments Wind turbine Upscaling Further development of Improved design onshore wind turbines Standardization Steel price Economies of scale Grid connection Standardised design of HVDC cables Applicability of XLPE1 insulation to HVDC cables Advances in valve technology and power electronics Foundations Standardisation Steel price Economies of scale Design regarding dynamic loads Installation Learning-by-doing Oil price (oil rigs) Development and structural deployment of purpose-built ships Standardisation of turbines and equipment
Note XLPE = Cross Linked Poly Ethylene. Source: Junginger et al., 2004.

210 Report 500036 002 (ECN-C--05-014)
Parameters for modelling of specific investment cost of offshore wind are shown in Table D.9. Table D.9 Overview of parameters for the base case offshore wind farm Parameter Unit Value Wind turbine capacity [MW] 5 Hub height [m] 90 Rotor diameter [m] 125 Number of wind turbines 100 Wind farm capacity [MW] 500 Water depth [m] 20 Distance to shore [km] 40 Foundations Steel monopiles Power transfer to the shore Type HVDC Capacity converter station [MW] 500 Initial investment costs Wind turbines (47%) [€2001/kW] 752 Foundation (12%) [€2001/kW] 192 Internal grid (4%) [€2001/kW] 64 Grid connection (19%) [€2001/kW] 304 Installation (12%) [€2001/kW] 192 Miscellaneous (6%) [€2001/kW] 96 Total [€2001/kW] 1,600
Source: Junginger et al., 2004. A PR of 0.81-0.85 is assumed for the wind turbines of offshore wind farms. This level is mainly based on cost reduction experienced with large wind farms in Spain and small wind farms in the UK. In Figure D.10 Junginger et al. show the specific investment cost of wind farms in these two countries as a function of the global cumulative installed wind capacity in each year.
Figure D.10 Experience curves for wind farms as a function of global cumulative capacity
(MW) Source: Junginger et al., 2004.

Report 500036 002 (ECN-C--05-014) 211
Junginger et al. make several assumptions with regard to cost reduction of main components, viz. wind turbines, grid connection, foundation, installation, and miscellaneous. They distin-guish two deployment scenarios, viz. ‘Sustained diffusion’ and ‘Stagnating growth’ (Table D.10). Table D.10 Summary of quantitative cost reduction trends in two deployment scenarios Scenario ‘Sustained diffusion’ Scenario ‘Stagnating growth’ Wind turbine Annual growth rate of onshore Annual growth rate of onshore and offshore wind declining from and offshore wind declining from 27.5% in 2003 to 15% in 2020 27.5% in 2003 to 10% in 2020 PR = 0.81 PR = 0.85 Grid connection High growth rates of HVDC Moderate growth rates of HVDC converter stations and submarine converter stations and submarine cables cables PRs of 0.62 and 0.71 respectively PRs of 0.62 and 0.71 respectively Foundation Cost of steel reduced by 2%/a Cost of steel reduced by 1%/a Installation PR = 0.77 PR = 0.77 Miscellaneous PR = 0.95 PR = 0.95
Source: Junginger et al., 2004. In ‘Sustained diffusion’ the current high growth rate is assumed to decrease slowly by about 0.5%/a from 27.5%/a in 2003 to 15%/a in 2020. This is in accordance with the study Wind force 12 (EWEA, 2003a and b) from EWEA and Greenpeace. Scenario ‘Sustained diffusion’ would imply an offshore wind capacity of 50,000 MW in Europe, and 70,000 MW worldwide in 2020. Scenario ‘Stagnating growth’ presumes a growth of the global installed wind capacity declining to 10%/a in 2020 instead of 15%/a in scenario ‘Sustained diffusion’, and a more conservative PR is used for the wind turbine as the main component of offshore wind farms. Also, the diffu-sion of High-Voltage Direct Current (HVDC) is assumed to be slower than in scenario ‘Sus-tained diffusion’. Finally, it is assumed that the cost of steel will decline by 1%/a instead of 2%/a. Figure D.11 shows the resulting cost reduction for offshore wind farms in the two scenarios.
Figure D.11 Specific investment cost of offshore wind farms in two deployment scenarios Source: Junginger et al., 2004.

212 Report 500036 002 (ECN-C--05-014)
According to Junginger et al., the specific investment cost of offshore wind farms would come down from €1,600/kW in 2003 to €980/kW in 2020 in ‘Sustained diffusion’, and to €1,160/kW in ‘Stagnating growth’. Such large cost reductions in a relatively short timeframe appear to be rather sensitive to assumptions on the PR of wind turbines. Neij et al. indicate a PR for Danish wind turbines (1981-2000) of 0.92 and for German wind turbines (1987-2000) of 0.94. If such PR’s would be applied to the scenarios of Junginger et al., the cost level of €980 – 1,160/kW would probably be reached in 2030 rather than 2020, as may be concluded from (Lako, 2002).
D.5.4 Spillover effects Junginger et al. do not explicitly address spillover effects in the development of offshore wind power to other world regions. However, they pay attention to the geopolitical dimension of off-shore wind. Their analysis shows that long-term stable offshore prospects may support cost re-ductions, especially for the installation costs, but also for (offshore) wind turbines. No single (European) country has the potential to create an offshore wind market on its own. Therefore, a European policy regarding the stimulation of offshore wind farms is recommended, as this might be a great benefit both to ensure diffusion of offshore wind and cost reductions.
D.5.5 Policy implications The development of offshore wind power is in such an early stage that spillover effects may be hardly distinguished. However, assessments of the potential of offshore wind in the EU indicate a potential along the European coasts of some 300-350 TWh/a (BTM Consult, 2003; de Noord, et al., 2004). Assuming an average capacity factor of 40% (Table D.11), the offshore potential in Europe would amount to 85-100 GW. According to (BTM Consult, 2003), this potential could be realised around 2020. The market could peak with an annual demand of 1,000 turbines of 5 MW each. There would be room for two or three suppliers in the European offshore market. It may be expected, however, that offshore wind energy will also be developed outside the EU, e.g. in the US, India, etc. Also, the market for onshore and offshore wind cannot be regarded as totally independent. Therefore, in the near future spillover effects from offshore wind turbine technology will probably prove to be significant. EU countries with offshore wind potential and the EU may be interested to support offshore wind power, not only for reasons of reducing greenhouse gas emissions and creating employ-ment in indigenous wind turbine business, but also in view of the potential of offshore wind in other parts of the world. Therefore, EU countries and the EU could consider possible spillover effects from offshore wind turbine technology. For other world regions, it would be a sensible strategy to open up their markets for offshore wind technology becoming available from the EU and the US. Just like for onshore wind, it would be beneficial for these regions to profit from the high technological level of offshore wind turbines etc. developed in the EU and the US. Other world regions would then act as ‘late adaptors’, with the advantages of higher reliability, lower costs, etc. Although these regions would then rely on import of offshore wind technology for some time, there could also be scope for development of an indigenous offshore wind industry.
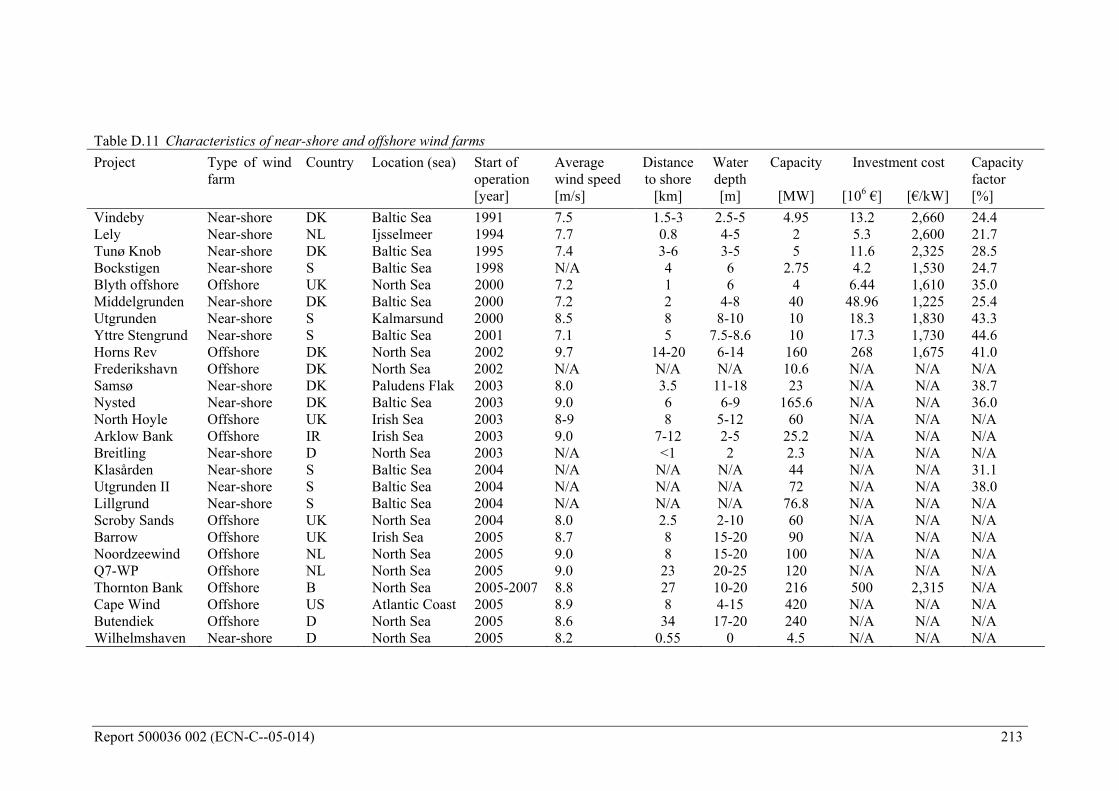
Report 500036 002 (ECN-C--05-014) 213
Table D.11 Characteristics of near-shore and offshore wind farms Project Type of wind
farm Country Location (sea) Start of
operation Average wind speed
Distance to shore
Water depth
Capacity Investment cost Capacity factor
[year] [m/s] [km] [m] [MW] [106 €] [€/kW] [%] Vindeby Near-shore DK Baltic Sea 1991 7.5 1.5-3 2.5-5 4.95 13.2 2,660 24.4 Lely Near-shore NL Ijsselmeer 1994 7.7 0.8 4-5 2 5.3 2,600 21.7 Tunø Knob Near-shore DK Baltic Sea 1995 7.4 3-6 3-5 5 11.6 2,325 28.5 Bockstigen Near-shore S Baltic Sea 1998 N/A 4 6 2.75 4.2 1,530 24.7 Blyth offshore Offshore UK North Sea 2000 7.2 1 6 4 6.44 1,610 35.0 Middelgrunden Near-shore DK Baltic Sea 2000 7.2 2 4-8 40 48.96 1,225 25.4 Utgrunden Near-shore S Kalmarsund 2000 8.5 8 8-10 10 18.3 1,830 43.3 Yttre Stengrund Near-shore S Baltic Sea 2001 7.1 5 7.5-8.6 10 17.3 1,730 44.6 Horns Rev Offshore DK North Sea 2002 9.7 14-20 6-14 160 268 1,675 41.0 Frederikshavn Offshore DK North Sea 2002 N/A N/A N/A 10.6 N/A N/A N/A Samsø Near-shore DK Paludens Flak 2003 8.0 3.5 11-18 23 N/A N/A 38.7 Nysted Near-shore DK Baltic Sea 2003 9.0 6 6-9 165.6 N/A N/A 36.0 North Hoyle Offshore UK Irish Sea 2003 8-9 8 5-12 60 N/A N/A N/A Arklow Bank Offshore IR Irish Sea 2003 9.0 7-12 2-5 25.2 N/A N/A N/A Breitling Near-shore D North Sea 2003 N/A <1 2 2.3 N/A N/A N/A Klasården Near-shore S Baltic Sea 2004 N/A N/A N/A 44 N/A N/A 31.1 Utgrunden II Near-shore S Baltic Sea 2004 N/A N/A N/A 72 N/A N/A 38.0 Lillgrund Near-shore S Baltic Sea 2004 N/A N/A N/A 76.8 N/A N/A N/A Scroby Sands Offshore UK North Sea 2004 8.0 2.5 2-10 60 N/A N/A N/A Barrow Offshore UK Irish Sea 2005 8.7 8 15-20 90 N/A N/A N/A Noordzeewind Offshore NL North Sea 2005 9.0 8 15-20 100 N/A N/A N/A Q7-WP Offshore NL North Sea 2005 9.0 23 20-25 120 N/A N/A N/A Thornton Bank Offshore B North Sea 2005-2007 8.8 27 10-20 216 500 2,315 N/A Cape Wind Offshore US Atlantic Coast 2005 8.9 8 4-15 420 N/A N/A N/A Butendiek Offshore D North Sea 2005 8.6 34 17-20 240 N/A N/A N/A Wilhelmshaven Near-shore D North Sea 2005 8.2 0.55 0 4.5 N/A N/A N/A

214 Report 500036 002 (ECN-C--05-014)
D.6 Conclusions and policy implications The development of wind power is an interesting case of spillover effects because: • Wind power is a relatively young renewable energy source, besides hydropower and bio-
mass. Its ‘track record’ is sufficiently long to analyse spillover effects. • Three EU-15 countries – Denmark, Germany, and Spain – are regarded as the cradle of the
modern wind turbine industry, next to the US and other EU countries. • The EU-15 countries try to develop wind energy into a thriving industry. The EU-15 has
the obligation to reduce its greenhouse gas emissions by 8% in 2008-2012 compared to 1990. Also, the EU-15 has formulated a target to increase the share of renewables from 6% of gross inland energy consumption in 1990 to 12% in 2010.
1. (Kamp, 2002) and (Kamp et al., 2004) present an in-depth analysis of the development of wind power in Denmark and the Netherlands. Technological learning is important, particularly in the case of technologies like wind turbines that consist of several interacting parts and have to function in changing environments. Variations on a dominant design are introduced in what is called the ‘selection environment’. The most promising variations are selected. The selection environment is a broader concept than the market: it includes regulations, norms, beliefs and expectations of multiple actors, government policies, taxes and subsidies. Most likely, spillover effects in wind power technology occurred from Denmark to other coun-tries in the period 1980-2000. Countries opened their markets to Danish wind turbines, and this speeded up the technological development of wind turbine manufacturing: Nordex is a mixed Danish/German wind turbine manufacturer, and Gamesa Eólica (Spain) is a former subsidiary of Vestas (Denmark). The magnitude of spillover effects is difficult to quantify. Spillover to non-Annex 1 countries was less important, as most of these countries, except India, are still in an early stage of the development of their wind resources. Also spillover in terms of the adop-tion of policies favouring wind power has occurred (R&D policies, feed-in tariffs, etc.). 2. Two-factor learning is described by (Klaassen et al., 2003) for wind energy in Denmark, Germany, and the UK. The analysis focuses on the contribution of public R&D and cumulative sales on the cost reduction of wind turbines. In the conventional learning literature, focus is mostly given on the effect of capacity expansion (possibly stimulated by procurement policy) of the cost-reducing innovation. In contrast, Klaassen et al. extend the scope to the effect of public R&D123. Learning rates of 5.4% for learning-by-doing and 12.6% for the R&D based learning-by-searching for each doubling of cumulative installed capacity give the best fit with the devel-opment of wind power in Denmark, Germany, and the UK for the period 1990-2000. Klaassen et al. refer to spillover effects in several ways: • Knowledge spillover from Denmark to Germany is explicitly mentioned, in particular with
regard to small wind turbines. • Part of the price reduction for wind turbines in the UK is related to importing wind tur-
bines, the prices of which have declined as a result of domestic sales. In particular spillover from Danish wind turbine manufacturing to the UK is taken into account.
3. (Neij et al., 2003a and 2003b) give an analysis of the development of experience curves, of sources of cost reduction, and of the effect of different energy policy programmes in relation to the experience curve. The result of the project describes the advantages and disadvantages, the potential and limitations and the relevance of using experience curves as a tool for different en-ergy policy programmes assessment. The Progress Ratio (PR) of the investment cost of wind
123 Note that in (Sijm, 2004) ample examples are given of models and studies covering either this learning-by-doing
or learning-by-searching, but only occasionally both types of learning at the same time.
Report 500036 002 (ECN-C--05-014) 215
turbines produced by the Danish wind turbine industry is 0.92, and the PR of German wind tur-bines is 0.94. Neij et al. also provide insight in spillover effects from Denmark and the US to Germany and Spain. In the period 1985-2000, Germany witnessed a successful combination of: • Favourable market policy for electricity generated by wind turbines. • Favourable loans for wind turbine projects. • Subsidies to investors. • A monitoring program. Neij et al. note that successful deployment in the 1990s of proprietary wind turbine technologies by e.g. Enercon was based on both company funding and dedicated federal RD&D support. In Spain, no wind turbines from indigenous wind turbine manufacturers were commercially available until 1992. Up to the mid-1990s, practically all wind power projects in Spain received some kind of ‘RD&D support’. Neij et al. refer to spillover effects from the wind turbine indus-try in the US and Denmark to Spanish turbine manufacturers like Made and Ecotècnia. From 1991 on, the Swedish government offered investment subsidies for wind turbines. Danish wind turbine manufacturers entered the Swedish market with their medium-sized wind turbines. Spillover effects from the Danish wind turbine industry to Swedish wind turbine manufacturers are not been reported by Neij et al. However, this does not imply that such effects did not occur. 4. According to (Junginger et al., 2004), offshore wind has several advantages over onshore wind: • Due to the higher average wind speed offshore, offshore wind farms may yield up to 50%
more than onshore wind farms of equal capacity (and hub height). • Onshore wind farms may meet public resistance from visual impact, noise, and shadow
casting; offshore wind farms, sufficiently distant from the shore, meet less resistance. • Offshore wind has a very large potential compared to onshore wind. The potential of on-
shore wind is often curtailed by considerations of conservation of landscape. Junginger et al. assume that the PR for wind turbines is 0.81-0.85, based on cost reduction of large wind farms in Spain and small wind farms in the UK. The specific investment cost of off-shore wind farms would come down from €1,600/kW in 2003 to €980 – 1,160/kW in 2020. Such large cost reductions in a relatively short timeframe appear to be rather sensitive to as-sumptions on the PR of wind turbines. According to Neij et al. the PR for wind turbines from Denmark was 0.92 (1981-2000) and for turbines from Germany 0.94 (1987-2000). If such PR’s would be applied, the aforementioned cost range would be attained in 2030 rather than in 2020. They also pay attention to the geopolitical dimension of offshore wind. Long-term stable off-shore prospects may support cost reductions, especially for the installation costs, but also for wind turbines. No single country has the potential to create an offshore wind market on its own. Therefore, a European policy regarding the stimulation of offshore wind farms is recommended, as this might be a great benefit both to ensure diffusion of offshore wind and cost reductions. 5. The development of offshore wind power is in such an early stage that spillover effects may be hardly distinguished. Nevertheless, EU countries with offshore wind potential and the EU may be interested to support offshore wind power, not only for reasons of reducing greenhouse gas emissions and creating employment in indigenous wind turbine business, but also in view of the potential of offshore wind in other parts of the world. Therefore, EU countries and the EU could consider possible spillover effects from offshore wind turbine technology. For other world regions, it would be a sensible strategy to open up their markets for offshore wind technology becoming available from the EU and the US. Just like for onshore wind, it would be beneficial

216 Report 500036 002 (ECN-C--05-014)
for these regions to profit from the high technological level of offshore wind turbines etc. devel-oped in the EU and the US. Other world regions would then act as ‘late adaptors’, with the ad-vantages of higher reliability, lower costs, etc. Although these regions would then rely on im-port of offshore wind technology for some time, there could also be scope for development of an indigenous offshore wind industry.

Report 500036 002 (ECN-C--05-014) 217
D.7 References Annevelink, B., G.J. Nabuurs, and W. Elbersen (2004): Case study on the potential for
induced technological spillovers in a specific carbon neutral energy supply industry. Climate Change and Biosphere Research Centre (CCB), Wageningen UR, 2004
BTM Consult (2003): International wind energy development – world market update 2002. BTM Consult ApS, March 2003.
Burges, K. (2004): Dynamic modelling of wind farms in transmission networks. Http://www.irish-energy.ie/uploads/documents/upload/publications/technical_ paper_modelling_wind_KBu_mar_04.pdf.
Environment Daily (2004): Environment Daily 1654, 26 April 2004.
EurObserver (2004): EurObserver, Press Release April 2004.
EWEA (2003a): Wind force 12 – a blueprint to achieve 12% of the world’s electricity from wind power by the year 2020. European Wind Energy Association/Greenpeace, 2003.
EWEA (2003b): Wind power targets for Europe 75,000 MW by 2010. Briefing of the European Wind Energy Association, October 2003.
IEA (2000a): IEA Technology R&D Statistics. IEA, Paris, 2000. Http://www.iea.org/stats/files/R&D.htm.
IEA (200b): Experience curves for energy technology policy. IEA, Paris, 2000.
Jansen, J.C. et al. (2004): A fragmented market on the way to harmonization? EU policy-making on renewable energy promotion. Energy for Sustainable Development, No. 1, March 2004, pp. 93-107.
Junginger, M. et al. (2004): Cost reduction prospects for offshore wind farms. Wind Engineering, Vol. 28, 1, 2004, pp. 97-118.
Kamp, L.M. (2002): Learning in wind turbine development – a comparison between the Netherlands and Denmark. Thesis Utrecht University, 25 November 2002. Http://www.library.uu.nl/digiarchief/dip/diss/2002-1128-170921/inhoud.htm.
Kamp, L.M. et al. (2004): Notions on learning applied to wind turbine development in the Netherlands and Denmark. Energy Policy, 32 (2004), pp. 1625–1637.
Koch, F.W. et al. (2003): Dynamic interaction of large offshore wind farms with the electric power system. Http://www.uni-duisburg.de/FB9/EAUN/doku/koch/Bologna_IEEE_Full-Paper_2003.pdf.
Klaassen, G. et al. (2003): Public R&D and innovation: the case of wind energy in Denmark, Germany and the United Kingdom. IIASA, IR-03-011, Laxenburg, Austria, May 2003.
Kuik, O. (2004): Spillovers owing to carbon leakage. Assessment for the national research programme on climate change. Institute for Environmental Studies, Vrije Universiteit, Amsterdam, 2004.
Lako, P. (2002): Learning and diffusion for wind and solar power. ECN, Petten, the Netherlands, ECN-C-02-001, April 2002.

218 Report 500036 002 (ECN-C--05-014)
Neij, L. et al. (2003a): Experience curves: a tool for energy policy assessment. Final report project ENG1-CT2000-00116, The European Commission within the Fifth Framework: Energy, Environment and Sustainable Development, 2003.
Neij, L. et al. (2003b): The use of experience curves for assessing energy policy programmes. EU/IEA Workshop ‘Experience curves: a tool for energy policy analysis and design’, January 22-24, 2003, IEA, Paris.
Neij, L. (2004): The development of the experience curve concept and its application in energy policy assessment. Int. J. Energy Technology and Policy, Vol. 2, 1 / 2, 2004, pp. 3-14.
Neij, L. et al. (2004): Experience curves for wind power. Int. J. Energy Technology and Policy, Vol. 2, 1 / 2, 2004, pp. 15-32.
Noord, M. de et al. (2004): Potentials and costs fore renewable electricity generation. ECN-C-03-006, ECN, Petten, the Netherlands, February 2004.
Oikonomou, V., M. Patel, and E. Worrell (2004): Does climate policy lead to relocation with adverse effects for GHG emissions or not? A first assessment of the spillovers of climate policy for energy-intensive industry. Department of Science, Technology and Society (STS), Utrecht University, Copernicus Institute, Utrecht, 2004.
Seebregts, A.J. et al. (2000): Endogeneous learning and technology clustering: analysis with MARKAL model of the Western European energy system. ECN-RX-00-028, ECN, Petten, the Netherlands, March 2000.
Schaeffer, G.J. et al. (2004): Learning from the sun; Analysis of the use of experience curves for energy policy purposes: The case of photovoltaic power. Final report of the Photex project, ECN-C-04-035, ECN, Petten, the Netherlands, August 2004.
Sijm, J.P.M. (2004): Induced technological change and spillovers in climate policy modeling: an assessment. ECN, Petten, the Netherlands, ECN-C-04-073, October 2004.
Sijm, J.P.M. et al. (2004): Spillovers of climate policy. An assessment of the incidence of carbon leakage and induced technological change due to CO2 abatement measures. ECN, Petten, the Netherlands, ECN-C--05-014, November 2004.
Windpower Monthly (2004a): Windpower Monthly, April 2004, p. 70.
Windpower Monthly (2004b): Windpower Monthly, May 2004, p. 29.
Windpower Monthly (2004c): Windpower Monthly, June 2004, pp. 38-40.
Internet sources 1. Http://www.bp.com/genericarticle.do?categoryId=117&contentId=2001227.

Report 500036 002 (ECN-C--05-014) 219
APPENDIX E: CASE STUDY ON THE POTENTIAL FOR INDUCED SPILLOVERS IN A SPECIFIC CARBON NEUTRAL ENERGY SUPPLY INDUSTRY: BIOMASS AND BIO-ENERGY CHAINS
B. Annevelink G.J. Nabuurs W. Elbersen
Climate Change and Biosphere Research Centre (CCB) Wageningen UR

220 Report 500036 002 (ECN-C--05-014)

Report 500036 002 (ECN-C--05-014) 221
E.0 Summary for policymakers This paper is part of a project that contains a number of parallel assessment studies on carbon leakages and induced technological change as a result of stringent climate change policies. The rationale behind this specific case study on biomass and bio-energy chains (Figure E.1) is the thought that a stringent climate change policy in Annex 1 countries will lead to technological innovation in these chains and that this technological innovation could also benefit non-Annex 1 countries (spillover) and thus lead to reduced CO2 emissions. In this case study we review the current knowledge with regard to international spillover effects, both of industrialised countries between themselves as well as between industrialised and non-industrialised countries. The ob-jective of this specific case study is: • to explore climate policy induced technological change within biomass and bio-energy
chains; • to explore possible positive spillover effects from technological innovations within biomass
and bio-energy chains to countries in transition and to developing countries. In this assessment special attention was paid to technological innovations in Dutch bio-energy chains that may spillover (transfer) to candidates of Dutch Joint Implementation (JI) projects in countries in transition in Eastern Europe and Clean Development Mechanism (CDM) projects in developing countries. The general assumption is that developing countries can implement new biomass technologies and associated production and delivery chains faster and possibly on a larger scale than developed countries, because their energy system is often only rudimentary de-veloped. This, together with fast economic growth and an associated energy demand allows fast introduction of new technologies in developing countries. Furthermore large quantities of under and non-utilised residues exist in developing countries which can easily be allocated towards bio-fuels or bio-energy production. This is in contrast to developed countries where energy in-frastructure is well developed and by-products often have some sort of (be it sub-optimal) appli-cation already. Both primary biomass (land use and forestry) and secondary biomass (by-products and waste) based bio-energy chains require the development of new technologies for more rational produc-tion and use of biomass, and therefore both types of bio-energy chains were included in the re-view. For both types of biomass and bio-energy chains a general review of recent examples in literature of biomass technology spillover (transfer) is given. This general review is then fol-lowed by a more detailed case study that shows important drivers, barriers and so on. In most literature with respect to biomass and bio-energy chains the notion technology transfer was found rather than technology spillover. Wilkins (2002) defines technology transfer as: ‘the diffusion and adoption of new technical equipment, practices and know-how between actors (e.g. private sector, government sector, finance institutions, NGO’s, research bodies, etc.) within a region or from one region to another’. Therefore the notion technology transfer is used in this case study rather than technology spillover. Role of the climate and energy policy framework (and other drivers) In the Netherlands the climate and energy policy framework is certainly favourable for stimulat-ing technology transfer for biomass and bio-energy chains. A favourable system to promote the production of renewable energy (MEP) and many R&D programmes have a positive influence on many conversion technologies (either proven or still under development). The oil crisis in the 1970’s and 1980’s was a very important driver for the development of technology for biomass and bio-energy chains. So technology development itself was not specifically climate policy driven, but at the moment climate policy certainly is one of the important drivers for technology transfer. However, many other drivers also play an important role during the process of technol-ogy transfer, such as economy, solving other environmental problems (such as waste disposal),

222 Report 500036 002 (ECN-C--05-014)
securing a locally available and inexpensive energy source (biomass) to lower local energy costs, and meeting rural energy requirements. Possibility of synergy with CDM and JI projects JI is one of the flexible instruments under the Kyoto Protocol, that the Dutch government has chosen to implement to fulfil its obligation to reduce its emissions by 6% (40 Mtonnes of CO2-equivalent per year). CDM is another flexible instrument that has the potential to create greater opportunities for investment to bring about this technology transfer. Under CDM so-called Cer-tified Emission Reductions (CERs) will be purchased by the Dutch government from sustain-able projects in developing countries. Specific JI and CDM projects will become important mechanisms for technology transfer in biomass and bio-energy chains. Many examples of pro-jects are being started at the moment. Barriers for the introduction in developing countries and countries in transition The actual financing of bio-energy technology transfer projects still remains a problem at the moment. Investors tend to focus on proven biomass technology (risk reduction) so it is rather difficult to transfer new technology. Other barriers are biomass availability, project performance risks, and institutional difficulties, such as the lack of supporting institutions in the developing countries. Barriers that were found for the land use and forestry sector are: local laws (social and environmental), local opposition because of increased pressure on scarce land, uncertain ratifi-cation process of the Kyoto Protocol, protocol’s rules, for monitoring and implementation, bu-reaucracy as imposed by the CDM executive Board, slow procedures in land use planning and land value deterioration under afforestation. Potential for use in non-Annex 1 countries Important reasons for technology transfer to non-Annex 1 countries is either to reduce CO2 emissions in the receiving non-Annex 1 country or to take advantage of biomass export possi-bilities to Annex 1 countries that want to reduce their own CO2 emissions. Import substitution of fossil fuels by bio-fuels is another important driver in many developing countries. An important driver to introduce biomass technology in non-Annex 1 countries is also to be able to process regionally available biomass more efficiently on a local scale. De-central power generation is yet another important reason for introducing small scale biomass and bio-energy technology in non-Annex 1 countries. Many regions in developing countries are not connected to a public electricity and/or heat grid. This means that electricity and heat should be produced locally, and bio-energy technology is very suited for that. Large opportunities in the land use and forestry sector can be found where existing problems (degradation, erosion, water quality, rural poverty) can be solved at the same time as when the climate goals are achieved, so when multiple goals can be achieved, such as a combination with bio-energy chains. The potential impact on CO2 abatement A large potential exists for the reduction of GHG emissions by substituting fossil fuels by CO2 neutral biofuels both in Annex 1 and non Annex 1 countries.

Report 500036 002 (ECN-C--05-014) 223
E.1 Introduction
E.1.1 Rationale of the case study This paper is part of a project that contains a number of parallel assessment studies on different issues of key significance with respect to carbon leakages and induced technological change as a result of stringent climate change policies. A balance between the risks of carbon leakages and the benefits of induced technological change must be found. The rationale behind this specific case study on the potential for 'induced technological change (ITC)' spillover effects concerning 'biomass and bio-energy chains' is the thought that a stringent climate change policy in Annex 1 countries will lead to technological innovation in the whole biomass and bio-energy chain and that this technological innovation could also benefit non-Annex 1 countries and thus lead to re-duced CO2 emissions. Climate change policy (Kyoto) is the main driver for CO2 neutral fuel development for electric-ity and heat production and for transport in most developed countries. Biomass and bio-energy production chains (Figure E.1) for these fuels, from biomass sources to the end-user, are being developed all over Europe at the moment. Development of these biomass chains includes devel-opment and implementation of conversion technology for the utilisation of bio-fuels, but may also include technology in other links of the chain such as the production of biomass, biomass logistics and storage, and bio-fuel production.
Technical/ Social interaction Social economic aspects, public perception, LCA, policy development, ethical aspects, chain development, regulatory issues
Biomass sources Land use & forestry Residues food industry Import (Multifunctional) production
Logistics and storage Pre-treatment Storage Transportation Planning and modeling
Bio-fuel production Solid bio-fuelsLiquid bio-fuelsGaseous bio-fuels
Energy Electricity Heat Transport
The biomass chain
Green raw materials andproducts
Figure E.1 Schematic representation of the biomass and bio-energy chain. Climate policy aimed at increasing the bio-energy share in the total energy production can have positive spillover effects internationally. I.e. the need to produce more biomass for bio-energy can also stimulate technological innovations for the utilization of by-products and waste and in land use and forestry in other regions or countries. Here we review the current knowledge with regard to these climate policy induced positive technology spillover effects on biomass residues (by-products and waste) and on the land use and forestry sector (including energy crops). We review international spillover effects, both of industrialised countries between themselves as well as between industrialised and non-industrialised countries.

224 Report 500036 002 (ECN-C--05-014)
E.1.2 Objective of the case study The objective of this specific case study is: • to explore climate policy induced technological change within biomass and bio-energy
chains; • to explore possible positive spillover effects from technological innovations within biomass
and bio-energy chains to countries in transition and to developing countries.
E.1.3 Short description of the research method Stringent climate policy in Annex 1 countries will presumably have secondary economic, social and environmental impacts (positive and negative). In this assessment special attention was paid to technological innovations in Dutch bio-energy chains that may spillover (transfer) to candi-dates of Dutch Joint Implementation (JI) projects in countries in transition in Eastern Europe and CDM projects in developing countries. The assessment focuses on countries with some ex-perience with biomass land use and bio-energy chains within CDM and JI projects. The general assumption is that developing countries can implement new biomass technologies and associated production and delivery chains faster and possibly on a larger scale than devel-oped countries, because their energy system is often only rudimentary developed. This, together with fast economic growth and an associated energy demand allows fast introduction of new technologies in developing countries. Furthermore large quantities of under and non-utilised residues exist in developing countries which can easily be allocated towards bio-fuels or bio-energy production. This is in contrast to developed countries where energy infrastructure is well developed and by-products often have some sort of (be it sub-optimal) application already. In the Netherlands existing bio-energy chains are aimed at supplying biomass to recently built bio-energy plants, for example the 27 MW electrical power plant in Cuijk (Rasmussen et al., 2002), that was connected to the grid in 1999 and the 1.5 MWe / 6.5 MWth power plant Lelystad. The biomass transition process currently instigated by the Ministry of Economic Affairs has led to a description of several transition paths towards future bio-energy chains requiring new tech-nologies. These views of a transition to the future were therefore taken into account as examples of technological innovation in the Netherlands. A precondition for the choice of the studied bio-energy chains was that they should be less car-bon-intensive than traditional fossil fuel chains and that opportunities should exist to export the technology to other countries. Another selection criterion that was used to structure this review study was the type of biomass used in the bio-energy chain. Here we can distinguish between primary and secondary biomass: • Primary biomass production systems are being developed and coming into use in Europe at
the moment. They consist of annual arable biomass production systems for example for the production of bio-fuels such as biodiesel (rape, sunflower) and bio-ethanol (wheat, sugar beet, corn) and perennial biomass production systems for electricity and heat production (willow, Miscanthus, hemp, switchgrass). Besides these new dedicated biomass production systems traditional forestry is another important source of biomass in the form of forestry by-products. All these land use and forestry production systems still require a significant amount of inputs and therefore technological innovations are focusing on further improve-ment of their performance (both on the economic, social and environmental level).
• Secondary biomass consists of residues in the form of by-products and waste like bagasse, sawdust, rice husks, straw, palm shells, palm fibres, etc. This type of biomass is already more commonly used in Europe in bio-energy chains for production of bio-electricity and heat and for bio-fuels. Re-using by-products and waste leads to more rational and efficient use of biomass from other production chains (food & feed industry), consequently increas-ing the added value of the total production chain (or rather network).

Report 500036 002 (ECN-C--05-014) 225
Both primary biomass (land use and forestry sector) and secondary biomass (by-products and waste) based bio-energy chains require the development of new technologies for more rational production and use of biomass, and therefore both types of bio-energy chains were included in the review. The following topics will be discussed in this paper: • role of policy framework on technological innovations; • possibility of synergy with CDM and JI projects; • barriers for the introduction of technological innovations in developing countries and coun-
tries in transition; • potential for use of technological innovations in non-Annex 1 countries; • the potential impact of technological innovations on CO2 abatement.
E.1.4 Outline of this paper Section 2 gives a general review of recent examples in literature of biomass technology spill-over (transfer) for bio-energy chains based on by-products and waste. This general review is fol-lowed by a detailed case study showing important drivers, barriers and so on. In section 3 the same topics are discussed but now for the land-use and forestry sector. Section 4 gives some general conclusions based on the reviewed literature and the detailed case descriptions.

226 Report 500036 002 (ECN-C--05-014)
E.2 Technology transfer in bio-energy chains based on by-products and waste
E.2.1 Definition of induced technological change (ITC), technological spillovers and technology transfer
This section defines the three key notions that are important for the further understanding of this specific case study: induced technological change (ITC), technological spillover and technology transfer. Induced technological change (ITC) According to Sijm (2004a) induced technological change (ITC) in general refers to technologi-cal changes due to changes in policy or economic conditions. However for the purpose of the project he defines ITC as ‘the component of technological change that is brought about in re-sponse to government climate policy. Climate policy is primarily aimed at controlling green-house gas (GHG) emissions (i.e. mitigation) and includes both market-based instruments (such as taxes, subsidies or tradable permits) and command-and-control regulations (such as setting performance- or technology-based standards for firms or households).’ Technological spillover In his paper Sijm (2004a) defines the concept of technological spillovers as ‘any positive exter-nality that results from purposeful investment in technological innovations or development’. So it should be emphasized that we are dealing with a positive spillover in contrast to leakage of GHG emissions, which is a negative spillover. Furthermore Sijm states that ‘in the field of global GHG mitigation, technological spillovers can take place through a wide variety of chan-nels, including local or international trade of goods and services, foreign direct investments, R&D collaboration at the sectoral and international level, personal communications, technologi-cal and scientific upgrading through relevant literature and business networks, JI/CDM transac-tions, and the migration of scientists and skilled labour forces’. So the concept technology should be seen much broader than only technical installations. Technology transfer In most literature with respect to biomass and bio-energy chains the notion technology transfer was found rather than the notion technology spillover. In her book ‘Technology transfer for re-newable energy; overcoming barriers in developing countries’ Wilkins (2002) defines technol-ogy transfer as: ‘the diffusion and adoption of new technical equipment, practices and know-how between actors (e.g. private sector, government sector, finance institutions, NGO’s, re-search bodies, etc.) within a region or from one region to another’. According to her ‘Technol-ogy should be regarded not only as the equipment, but also the information, skills and know-how which are needed to fund, manufacture, install, operate and maintain the equipment. Trans-fer should be regarded as putting the technical concepts into practice locally in a sustainable framework so that local people can understand the technology, use it in a sustainable manner and replicate projects to speed up successful implementation’. It is unclear if the technology transfer examples that were found in literature for biomass and bio-energy chains are examples of technology spillover in the true sense of the definition (in-duced by stringent climate policies). Therefore the notion technology transfer is often used in the following sections rather than technology spillover.
E.2.2 The global potential of biomass for energy Berndes et al. (2003) give a review of 17 studies on the future global potential of biomass for energy. Although the biomass potential is huge, it varies widely between these studies from be-
Report 500036 002 (ECN-C--05-014) 227
low 100 EJ/year to above 400 EJ/year in 2050. For comparison: the global consumption of oil, natural gas, coal, nuclear energy and hydro electricity in the period of 1999-2000 was about 365 EJ/year, while global biomass consumption for energy in the same period is estimated to be 35-55 EJ/year. Berndes et al. (2003) explain these large differences by two important parameters that are very uncertain: land availability and yield levels in energy crop production. Most stud-ies consider biomass plantations as the most important source of biomass for energy, but the biomass supply from plantations in 2050 ranges from 47 to 238 EJ/year. The differences can also partly be explained by the degree in which the types of biomass were taken into account or not by these studies: biomass plantations, utilization of forest wood, residues from agriculture, (manure and food crop residues) and agro-processing residues. Berndes et al. (2003) emphasize that the interaction of an expanding bio-energy sector with other types of land use, such as food production and forestry (for materials) should be taken into account more carefully when estimating the global potential of biomass for energy. Further-more, the environmental and socio-economic consequences should also be analysed more thor-oughly. Hoogwijk et al. (2003) gives six crucial factors for the biomass availability for energy: • future demand for food; • type of food production systems; • productivity of forests and energy crops; • (increased) use of bio-materials; • availability of degraded land; • competing land use types. The analysis of Hoogwijk et al. (2003) shows a biomass energy potential of 35 to 1135 EJ/year, which is mainly determined by the potential of energy farming, that is the result of land avail-ability and biomass productivity.
E.2.3 Dutch climate and energy policy that induces technology transfer in bio-energy chains
Dutch Climate and Energy Policy The first oil crisis (1972-1973) led to the incorporation of renewable energy in Dutch energy policy in the First White Paper on energy policies in 1974 (Kwant et al., 2004; Junginger, 2004c; van Rooijen & van Wees, 2004). Interests in renewable energy decreased in the late 80s when energy prices decreased. But in the Dutch Government’s Third White Paper on energy policy of 1995 new targets were adapted. The renewable energy share in the Netherlands should be 5% (168 PJ) of the total Dutch energy consumption in 2010 and 10% in 2020. Bio-energy has to contribute to 43% of these renewable energy targets. In 2004 only 1.5% of the total Dutch energy consumption is produced from renewable resources. This is small compared to some other European Countries that have other renewable energy sources such as hydropower or that have larger biomass resources. For renewable electricity a separate target was set, namely 9% of the electricity consumption in 2010 (11.2 TWh). According to Kwant et al. (2004) the main elements of the Dutch energy policy in the last decade to promote renewable energy (including bio-energy) were: • energy tax on the use of electricity and natural gas; • fiscal instruments to lower investment costs; • voluntary agreements with the energy sector and industry and; • various subsidy schemes to increase the attractiveness of new initiatives. In 2001 two other instruments were added: • a fully liberalized market for green electricity with free consumer choice and; • a tradable certificate for renewable energy.

228 Report 500036 002 (ECN-C--05-014)
In 1996 the regulatory energy tax or ecotax (REB) was introduced. Producers of renewable en-ergy received support from the collected regulatory energy tax and consumers of green energy were exempted from paying the regulatory energy tax. This has lead to an enormous increase of the demand of green electricity from 250,000 customers in 2001 to 2.2 million (32% of the households) in October 2003 (de Lange & Uyterlinde, 2004). Unfortunately there also were un-intended negative effects. The favourable tariffs under the REB in the Netherlands led to a strong increase of imported renewable energy from other European countries like Austria, Finland, Germany, Norway, Sweden and the UK. The effects of this were considerable tax revenues losses for the Dutch Government and no substantial investments in Dutch production capacity for renewable energy. Therefore on July 1st 2003 an improved system was introduced, the ‘environmental quality of electricity production’ (MEP). The ecotax exemption will be re-duced in steps to 0.0 €ct/kWh in January 2005, the production subsidy was stopped and feed-in tariffs to support renewable electricity were introduced (7.0 €ct/kWh for biomass power plants > 50 MW and 9.7 €ct/kWh for biomass power plants < 50 MW), to support domestic production. This will be financed through an annual levy on electricity connections. This way investors will be provided with more certainty to realize projects in the Netherlands. Renewable electricity imports are made less attractive in MEP and this is expected to reduce the loss of tax-income. Therefore MEP is expected to have a positive impact on further biomass technology develop-ment and implementation in the Netherlands, thus leading to new possibilities for technology development and transfer in the future. Subsidy schemes play an important role in relation to biomass technology development and im-plementation in the Netherlands and thus for technology transfer to foreign countries. Previ-ously the subsidy schemes were implemented through two different organisations Novem and Senter, that have merged in 2004 to one organisation SenterNovem. Novem was the agency for implementing Dutch research, development and demonstration policy. One of the topics is sus-tainable energy (CO2 reduction and energy from waste and biomass). Novem funds technology research, demonstration and implementation projects. The New Energy Research (NEO) pro-gramme aims at new, non-conventional energy research. The Sustainable Energy in the Nether-lands (DEN) programme supports initiatives from the market to apply sustainable energy, such as energy from biomass. One of its explicit goals is to stimulate innovation aimed at the applica-tion of renewable energy technologies. Apart from implementing biomass for electricity and/or heat it can also be used in bio-energy chains for the production of biofuels for transport. Although the output/input balance of biofuels for transport is less favourable than that for electricity and/or heat, biofuels are the only option to reduce CO2 in the transport sector. Therefore the 'Biofuels Directive 2003/30/EC' was adopted by the European Community in 2003 with indicative targets of 2% biofuels in 2005 and 5.75% in 2010. For the Netherlands this corresponds to 9.2 PJ biofuels/year in 2005 and 29 PJ biofuels/year in 2010 (Ecofys, 2003). The Gaseous and Liquid Energy carriers (GAVE) pro-gramme of Novem is aimed at developing and demonstrating new technologies for chains that produce bio-fuels for transport. The main goal is to investigate the possibilities to develop cli-mate neutral fuels. Joint Implementation (JI) Joint Implementation (JI) is one of the flexible instruments under the Kyoto Protocol, that the Dutch government has chosen to implement to fulfil its obligation to reduce its emissions by 6% (40 Mtonnes of CO2-equivalent per year). Senter, an agency for the Ministry of Economic Af-fairs focused on industry is responsible for implementing subsidy-, credit- and fiscal regulations in the areas of technology, energy, environment, export and international cooperation (Senter, 2004). Senter International is responsible for implementing the JI programme for the Dutch government (Senter International, 2002). The carboncredits.nl team was founded to purchase the reduction in greenhouse gas emissions (carbon credits) that are generated by projects in Central and Eastern Europe, aiming at energy efficiency, renewable energy, waste processing and affor-estation/ reforestation. This way the return on investment of these projects is improved. The

Report 500036 002 (ECN-C--05-014) 229
Emission Reduction Unit Procurement Tender (ERU-PT) was started in 2000 to implement JI and several tenders were issued since then (Coninck & van der Linden, 2003). The call for ERUPT-5 was published 11 May 2004. The minimum amount of carbon credits per (portfolio of) project(s) is 250,000 tonnes of CO2 equivalents. Projects cannot generate carbon credits until the first commitment period of the Kyoto protocol, 2008-2012, but Senter International is pay-ing some of the investments in advance. There is a focal point in the targeted Annex-1 host countries for JI in Central and Eastern Europe: Baltic states, Bulgaria, Croatia, Czech Republic, Hungary, Poland, Romania, Russian Federation, Slovak Republic and Ukraine. Beside the re-duction of carbon emissions, other advantages (drivers) for the host Country Are sustainable economic growth, reduction of local pollution, improved reliability of the electricity grid and technological innovation. So far the following carbon credits projects that involve biomass have been contracted: • Biomass project portfolio, Czech Republic (ERU 00/11; see paragraph 2.7.3 for a further
description); • Biomass retrofit at Borsod Power Plant, Hungary (ERU 01/27); • Ajka Biomass project, Hungary (ERU 03/08). The following biomass project is still under evaluation: • Biomass Heat and Power project at Füzföi Erömü Kft, Hungary (ERU 04/10); Besides the ERUPT programme the Netherlands have also created a carbon trading fund which is managed by the European Bank for Reconstruction and Development (EBRD). This fund will purchase greenhouse gas emissions for the Netherlands. Clean Development Mechanism (CDM) Industrialized countries have played a leading role in developing renewable energy technology. According to Wilkins (2002) the transfer of this renewable energy technology to developing countries is of interest to many organizations all over the world, considering a concern over poverty reduction, energy security and climate change. She argues that environmentally sound, appropriate, sustainable and commercially proven technologies have to be transferred to devel-oping countries, in order to prevent heavy pollution and environmental degradation. The Clean Development Mechanism (CDM) has the potential to create greater opportunities for investment to bring about this technology transfer. In the Netherlands the Ministry of Housing, Spatial Planning and the Environment (VROM) is responsible for climate change and for implementing the CDM. VROM is the Designated Na-tional Authority (DNA). For investments under CDM in developing countries in Asia, Africa and Latin America, a Dutch programme called Certified Emission Reduction Unit Procurement Tender (CERUPT) was initiated. Under this programme Certified Emission Reductions (CERs) will be purchased by the Dutch government from sustainable projects in developing countries. Host countries for CDM can be all non-Annex1 countries. Memoranda of Understanding (MoUs) had been signed by February 2003 with: Colombia, Costa Rica, El Salvador, Guate-mala, Nicaragua, Panama & Uruguay. Biomass projects that were accepted under CERUPT so far are: • 6.5 MW Biomass project in Maharashtra, India (CER 01/59); • Electricity from biomass in Rajasthan, India (CER 01/65). Besides the CERUPT programme the Netherlands are also participating in the Prototype Carbon Fund (PCF) of the World bank (see section 3.2). Following an EC Directive an EU Emissions trading Scheme (EU ETS) will start on January 1st 2005. According to Sijm (2004b) one of the benefits in theory could be that it will encourage the development of cost-saving abatement technologies in the long run. However, in practice this depends among others on linkages with other emission trading and credit schemes. EU ETS al-

230 Report 500036 002 (ECN-C--05-014)
lows participants to convert emission credits from JI and CDM into EU allowances. Therefore EU ETS will influence projects under JI. Senter (2004) concludes that projects that fall directly under EU ETS can only participate in JI if the project has been approved by the host country be-fore 31 December 2004.
E.2.4 Available conversion technology for bio-energy chains During the last decade a wide range of technologies and expertise have been developed to con-vert biomass into heat, electricity and bio-fuels (Sims, 2002). The categories of biomass conver-sion technologies likely to be involved in technology transfer between countries are thermo-chemical techniques: • combustion and co-combustion; • gasification; • pyrolysis; • Hydro Thermal Upgrading (HTU);
and bio-chemical techniques: • anaerobic digestion; • hydrolysis followed by fermentation. Each type of conversion technology has its specific characteristics that impose certain restric-tions on the biomass. The main requirements concern moisture content, degree of pollution/ash content, chemical composition, structure and shape and required pre-treatments. These biomass technologies are in different development-stages. (Co-)combustion, anaerobic digestion and hy-drolysis followed by fermentation are commercially available conversion technologies and therefore in an implementation phase, whereas gasification and pyrolysis are more in a pre-commercial demonstration phase. HTU is still at the end of a research and development phase, entering a demonstration phase. The domestic power production in the Netherlands is mainly from co-combustion of biomass in coal fired power plants. Of the biomass conversion technolo-gies, combustion is more suitable for large scale power plants than gasification, according to van de Beld (2004). Gasification needs a lot of technical effort to achieve a somewhat higher energy efficiency. For small scale power plants gasification could be an option because combus-tion is not an alternative in that case. The operation of a gasification installation on the other hand does require certain skills. The production of syngas does make gasification an interesting option. For raising the bio-energy share on the short term (until 2010) the Dutch Ministry of Economics Affairs (2003) has written the so-called Bio-energy Action Plan. This concludes that more ef-forts have to be made in the field of waste incineration, co-firing of biomass in coal fired power plants and using biomass in small scale combined heat and power stations in order to increase the domestic production of renewable energy from biomass. In 2004 a Bio-energy Realisation Forum (BERK) was appointed by the minister that is going to investigate several important is-sues such as: the financial support system, legislation and procedures for permission, biomass availability, technology (identifying the best current technologies at the lowest risk), communi-cation and creating a level playing field. For the longer term development of biomass and bio-energy (until 2040) the Ministry of Eco-nomics Affairs initiated the so-called Biomass Transition project in 2002 (Kwant et al., 2004; Ministry of Economic Affairs, 2004a & 2004b). The project is aimed at achieving a major shift towards a large-scale and sustainable application of biomass for energy generation, transport fu-els and bio-based products. The Biomass Transition project has led to the description of several transition paths that are needed to achieve an ambitious goal: 30% of the energy supply in the Netherlands in 2040 should be provided by biomass. This should contribute to a considerable reduction in greenhouse gas emissions, but this still needs further technology development.

Report 500036 002 (ECN-C--05-014) 231
Six transition paths were chosen by the Ministry of Economic Affairs for a follow-up with mar-ket-oriented experiments: • pyrolysis oil (converting biomass into bio-oil, using pyrolysis technology); • ethanol from biomass (as a bio-fuel for transport or as a basic material for the chemical in-
dustry); • bioplastics (replacing fossil fuels); • HTU chain (converting watery and polluted biomass into HTU diesel via HTU technology); • biomass and coal (using biomass to partly replace fossil fuels in new generations of coal-
based electricity plants); • bio saline or saltwater agriculture (producing biomass with salt-tolerant plants). Furthermore four other transition paths were recommended to be included in the Dutch long-term Energy Research Strategy (ERS): • BioSyngas (converting biomass into synthetic gas with gasification technologies); • aquatic biomass (biomass production and extraction); • hydrogen from biomass (developing supercritical gasification techniques); • bio-refining (separating and converting raw biomass into components). All these transition paths will lead to further development of biomass (conversion) technologies that have a potential for transfer and spillover to non-Annex 1 countries, and for implementation in CDM and JI projects. For this case study one transition path, namely pyrolysis oil, was cho-sen as an example for technology transfer. The transition path pyrolysis oil offers the Nether-lands the opportunity to play a leading role as builder and supplier of bio-oil production plants, in the trade and processing of bio-oil as a worldwide commodity and as a consumer of the pro-duced bio-oil as a means to realize its renewable energy targets. The Biomass Technology Group BV (a Dutch private company) is involved in the process of biomass pyrolysis technol-ogy transfer to developing countries. This is described in more detail in the case study in para-graph 2.7.2.
E.2.5 Learning rates (LR) in bio-energy chains Sijm (2004a) mentions two channels through which induced technological change can be im-plemented: ‘research and development (R&D)’ and ‘learning-by-doing (LBD)’. In the first case climate policies increase R&D investments in new carbon-mitigation technologies and in the second case they encourage the actual adoption of these technologies, leading to an accumula-tion of knowledge and experience. According to Sijm (2004a) induced technological change in so-called bottom-up (BU) economical models is mostly modelled by the channel of LBD. These BU-models are partial models of the energy sector, characterised by a detailed analysis of the energy system, covering a wide variety of energy technologies. Experiences or learning curves in these models can be an analytical tool for the design and de-ployment of policies for environmentally friendly technologies such as biomass (IEA, 2000 & 2003). Experiences curves can be used to make rough estimates of subsidies needed to support learning investments on the way towards the take-off of a technology in commercial markets. They show the investment necessary to make a technology, such as biomass, competitive, but they do not forecast when the technology will be break-even. For major technologies such as biomass the market dominates the learning investments through providing resources. However, government deployment programmes can stimulate these investments. According to IEA (2000) policy measures in the European Union have indeed provided access to learning opportunities and stimulated learning investments for biomass technology. This is also necessary because biomass technology often requires considerable improvements in performance before this tech-nology can compete with fossil fuel technology. The increased use of biomass for district heat-ing in Sweden is such an example, viz of the use of carbon tax in the heating sector.

232 Report 500036 002 (ECN-C--05-014)
The assumption for experiences curves is that the cost of a technology decreases with increasing penetration of the technology (Junginger, 2004a). A learning or experience curve can be used to relate the costs of a new technology to its cumulative installed capacity. Costs tend to decline almost at a fixed rate with every doubling of the cumulative production. The Progress Rate (PR) defines the speed of learning. The complementary Learning Rate (LR = 1 - PR) defines the rate (percentage) at which the costs of a newly installed technology declines each time its cumula-tive installed capacity doubles. For example a PR of 85% equals a LR of 15%, so a 15% cost reduction for each doubling of the cumulative capacity. Four main types of learning curves for renewable electricity are given by Harmsen & van Sambeek (2003): • cumulative capacity installed or produced (MW) vs. price of capacity (euro/MW); • cumulative production (kWh) vs. price of electricity (euro/kWh); • cumulative capacity installed or produced (MW) vs. price of electricity (euro/kWh); • cumulative amount of production plants installed or produced (#) vs. price of electricity
(euro/kWh). So prices can be used as an approximation of production costs. However, care should always be taken to check the validity of that approximation. McDonald & Schrattenholzer (2001) describe the pattern for the introduction a new process or product: the production costs decrease at a con-stant rate, but price reductions can be divided into four stages. In the first two stages, ‘develop-ment’ and ‘price umbrella’, the price drops at a slower rate than the production costs. In the ‘shake out’ stage the price drops at a faster rate and in the ‘stability’ stage at the same rate as the production costs. So a learning rate calculated in terms of prices will also differ between these stages. IEA (2000) also emphasizes that the different phases of a technology should be taken into account, when determining the LR. High LRs may occur when a new technology searches a niche market, but when the market is saturated the learning rate may fall close to zero. Although learning curves are often mentioned as a suitable tool to predict future cost reduction, some limitations of this approach are given by Harmsen & van Sambeek (2003). Learning curves only have a limited predictive power, they are sensitive to misinterpretation (the choice of a certain time period to construct the learning curve can have consequences for the outcome), they cannot always be compared to each other, they are influenced by stimulating policies and finally they lack a time path (it is highly uncertain in which year the next doubling of capacity will be achieved). LRs for a broad range of different energy technologies are given by IEA (2000) and McDonald & Schrattenholzer (2001). Experience curves are quite often used for specific forms of renew-able energy, such as wind energy and Photo Voltaic (PV) electricity, but they are less com-monly used for bio-energy chains. LRs and PRs for biomass-specific technologies are given in Table E.1. The PR for biomass liquefaction is conservatively estimated to be 82% by IEA (2000), based on the average PR of 80% for bio-ethanol in Brazil (see further on). The PR for electricity or heat from biomass is roughly estimated to be 92%. This is an educated guess lying between the so-called ATLAS data that give a PR of 85% for electricity from biomass and the PR of 96% measured for wind power. McDonald & Schrattenholzer (2001) give an overview of learning rates for energy technologies that are used in models to asses long-term energy strategies and related greenhouse gas emis-sions. They find that the median value of 16-17% for the LR of energy technologies is not far below the 19-20% median value for manufacturing firms. However, they can give only one ex-ample of a LR for a bio-energy chain, viz the learning rate for bio-ethanol of sugarcane in Bra-zil. The National Alcohol Programme (PROALCOOL), was launched in Brazil in 1975 to sub-stitute (imported) gasoline used as a transport fuel with locally produced alcohol from renew-able resources (Metz et al., 2000). The objective was to guarantee a steady fuel supply in the Country And to encourage technological development in connection with the production of sugar cane and alcohol. For the period of 1979-1995 the average PR for bio-ethanol in Brazil is 80% (McDonald & Schrattenholzer, 2001; IEA, 2000). This number originates from a paper of

Report 500036 002 (ECN-C--05-014) 233
Goldemberg (1996). The PR in this original paper was divided into two periods: a PR of 70% for the period 1982-1990 (a great expansion in the yearly production) and for the period 1990-1995 the PR changes to 90% indicating that the level of production stagnated. However, in a more recent paper Goldemberg et al. (2004) re-divide the learning period differ-ently into two new sub-periods with different outcomes for the progress ratio: a PR of 93% for the period 1980-1985, and a PR of 71% for the period 1985-2002. So now bio-ethanol starts with a slow growth and after that a more rapid growth. This indicates that the choice of the time period influenced the value of the calculated PR and it is clearly an example of the limitations of experience curves, viz that of misinterpretation mentioned by Harmsen & van Sambeek (2003). McDonald & Schrattenholzer (2001) also emphasize the risk of taking prices as an imperfect measure of production costs. In the Brazilian case the price paid to the ethanol producers was taken as a measure of costs. However, these prices depended partially on the international oil prices, so they did not always represent the change of production costs accurately. More recently two examples of PRs for two parts of the bio-energy chain are described by Jung-inger et al. (2004a & 2004b). First of all they state that in their opinion the experience curve ap-proach is somewhat less suited for large scale biomass-fuelled power plants, due to less avail-able data and a large spread of investment costs caused by individual power plant layouts. How-ever, in their first paper Junginger et al. (2004a) investigate if the experience curve approach is suitable for Primary Forest Fuel (PFF) production. They studied the relation between the cumu-lative production of PFF in Sweden and the prices of forest fuels. They conclude that the prices of wood fuel chips do follow an experience curve from 1975-2003 resulting in a PR of 85.6%. In their second paper Junginger et al. (2004b) find that it is also possible to apply the experience curve concept to biomass-fuelled combined heat and power (CHP) generation systems in Swe-den. The experience curve on electricity production costs, based on investment costs, fuel costs and increasing full-load hours, results in a PR of 95% for the period 1990-2002. They indicate that the cost reduction potential may strongly vary per component of the combustion technol-ogy. Biomass-specific fluidised-bed boilers have been developed more recently and therefore have a higher learning potential. From Table E.1 it can be concluded that a large range exists between the LRs of different bio-mass technologies (LRs from 5 to 30), but also the LRs of a specific biomass technology such as the production of bio-ethanol show some variation (LRs from 7 to 30), sometimes depending on the stage of development of the technology. This variation in LRs, together with other problems such as data availability and comparability of installed biomass technologies make it difficult to make general statements about the current value of the experience curve method, for judging the climate policy induced technological change within biomass and bio-energy chains. More re-search will have to be done to find more reliable technology specific LRs for different regions of the world (e.g. specific non Annex-1 countries).
E.2.6 Important drivers and barriers for technology transfer in bio-energy chains Examples of technology transfer in bio-energy chains In literature examples can be found of technology transfer of proven biomass conversion tech-nology (such as combustion, anaerobic digestion and fermentation) in bio-energy chains. The examples described in this section are not specifically Dutch, but still they give some general insight in the main drivers and barriers for technology transfer in bio-energy chains based on by-products and waste. Metz et al. (2000) describe the Swedish Government Programme for Biomass Boiler Conversions in the Baltic States as an example of combustion technology trans-fer. Wilkins (2002) describes three examples of grid-connected biomass cogeneration systems based on residues: rice husks in Thailand, palm oil waste in Indonesia and bagasse in India. Metz et al. (2000) also describe an example of anaerobic digestion technology transfer (dis-semination of biogas digester technology from China to Africa and the Asia-Pacific region) and an example of fermentation technology transfer (the Brazilian fuel alcohol programme).

234 Report 500036 002 (ECN-C--05-014)
Table E.1. Learning Rates (LRs) and Progress Rates (PRs) for technology components of bio-
energy chains. Technology Country Time period LR (%) PR (%) Reference Biomass liquefac-tion
EU unknown 18 82 IEA (2000)
Electricity or heat from biomass
EU unknown 8 92 IEA (2000)
Ethanol Brazil 1979-1995 22 78 IEA (2000), based on a safe average of Goldemberg (1996)
Ethanol Brazil 1982-1990 1990-1995
30 10
70 90
Goldemberg (1996)
Ethanol Brazil 1980-1985 1985-2002
7 29
93 71
Goldemberg et al. (2004)
Primary Forest Fuel (PFF) production
Sweden 1975-2003 14.4 85.6 Junginger et al. (2004a)
Biomass-fuelled combined heat and power (CHP)
Sweden 1990-2002 5 95 Junginger et al. (2004b)
Drivers and barriers for biomass technology transfer Climate change policy (reduction of CO2, SO2, and NOx emissions through cost-effective pro-jects) is certainly mentioned as a driver for biomass technology transfer in some of the above-mentioned cases. However, in many cases there is no direct influence of climate change policy on the development of the biomass technology, but climate change policy is certainly seen as a new driver for implementing and exporting (transferring) the technology in the near future. Of-ten several other drivers were regarded more important for technology transfer in these cases (Table E.2). The drives and barriers can be more or less attributed to a specific link of the bio-mass chain (Figure E.1).

Report 500036 002 (ECN-C--05-014) 235
Table E.2. Overview of important drivers and barriers for technology transfer in specific links of bio-energy chains based on by-products and waste (based on Metz et al., 2000 & Wilkins, 2002)
Drivers Barriers Biomass Sources
• A general strengthening of the agricultural sector;
• Higher revenues for crop & forestry residues and by-products and waste;
• Reducing the demand for commercial fertilisers;
• Solving waste disposal problems by a better utilisation of a waste products (including other environmental gains from reduced waste streams);
• Difficulties to secure fuel supply; • Difficult to determine a base price
for fuels; • Seasonal and geographical
availability and price of biomass; • Alternative use of biomass; • Missing management skills;
Logistics and storage
• Guarantee a steady fuel supply in the country;
•
Bio-fuel production
• Displaced use of conventional fuels: substitution of (imported) gasoline used as a transport fuel with (locally produced) bio-fuels from renewable resources;
•
Energy • The energy crisis in the 70s; • Self-sufficiency in heat and power
production; • Reducing power deficits; • Meeting renewable energy deployment
targets; • Prospect of large-scale, grid-connected
renewable electricity capacity to meet the increasing energy demand of developing countries;
• Meeting rural energy requirements and achieving rural electrification by embedded power generation from agricultural activities such as processing mills;
• Unavailability of the technology; • Lack of knowledge and
understanding; • Complicated to run power plants by
small owners; • No access to the grid;
Technical/ social interaction
• Climate change policy; • Economy (earning money with the
technology); • Encouraging partnerships between
firms; • Encouraging technological
development, knowledge export and technology transfer;
• Mobilizing private-sector investment in power generation.
• Financial barriers such as the lack of financial analysis, the perceived risk for financiers and the lack of financing;
• The use of inappropriate project appraisal methods;
• Project performance risks; • Lack of competitive-bidding
procurement capabilities; • The lack of a successful commercial
track record and experience; • Institutional difficulties and no
supporting institutions; • Government plans and targets for
electricity from renewable resources; • The lack of incentives for developers
and entrepreneurs.
236 Report 500036 002 (ECN-C--05-014)
E.2.7 Detailed case description: technology transfer by the Biomass Technology Group
Introduction to the Biomass Technology Group (BTG) Biomass Technology Group BV (BTG) is a Dutch private firm (50 persons) that develops and implements biomass technology on a world-wide basis (BTG, 2004). It is specialised in the conversion of biomass into bio-fuels and bio-energy. The fields of expertise of BTG include en-ergy conversion processes, production of solid and liquid bio-fuels, biomass and bio-fuels logis-tics and biomass based decentralised rural electrification. Among others, services are provided on technical and economic aspects of bio-energy systems. Research & Development at BTG is aimed at developing marketable technologies for the pro-duction of heat, electricity, transportation fuels and chemicals from biomass. It is always driven by the potential to commercialise the developed biomass technology. The R&D group of BTG has a patent for a new type of technology, the so-called rotating-cone reactor for flash pyrolysis. One of the R&D activities is to develop this flash pyrolysis process for the production of bio-oil from biomass and bio-waste. The application of the produced bio-oil is also a topic of R&D. Bio-oil can either be combusted in boilers for industrial and district heat generation and in en-gines for transportation power or it can be gasified for the production of synthetic gas or hydro-gen. This case will be described in section 2.7.2, based on an interview with van de Beld (2004). BTG’s Process Engineering and Implementation group stands as an interface between R&D and the public sector. The implementation and commercialisation of bio-energy technologies is per-formed in co-operation with Dutch and international equipment suppliers and customers. Re-cently installed bio-energy systems outside the Netherlands that were managed or supported by BTG include: • Wood-fired combustion systems for industrial or district heating, substituting brown-coal
fired units in Central and Eastern European countries; • Briquette and/or charcoal production and bio-fuel trading facilities in China, Estonia and
Ghana; • Anaerobic digestion units for coffee industry waste water treatment, municipal sewage
plants and animal farms in Costa Rica, Hungary, Moldavia and Ukraine. When a technology reaches technical maturity BTG’s Business development Group tries to en-sure that it reaches the market successfully. They have used Joint Implementation (JI) and Clean Development Mechanism (CDM) schemes to achieve this. An example is a 50 million euro portfolio of 28 candidate bio-energy projects in the Czech Republic. The Dutch Government has purchased the CO2 emission reductions credits of this project that will be further described in section 2.7.3 based on literature. An example of new biomass technology transfer: pyrolysis Pyrolysis is an old technology that already existed at the end of the 1800s (van de Beld, 2004). It was amongst others a method to produce methanol from wood. Biomass as a raw material has been displaced by fossil fuels during the last century in most Western countries. Internationally research on pyrolysis started again in the beginning of the 1980s. At the Technical University Twente in the Netherlands research on pyrolysis started at the end of the 1980’s and it was aimed especially at reactor development (Wagenaar, 1994 and others). In 1993/1994 further de-velopment was continued by BTG. Pyrolysis is a thermal process that converts hard-to-handle, low energetic density biomass into a versatile liquid product, a bio-oil that can be used for many purposes. Not one unique biomass conversion technology exists that offers the best solution to all problems, but pyrolysis-oil has a number of advantages. It is a fluid fuel, it is easier to store and transport, it is a cleaner fuel than raw biomass (when combusted) and minerals can be left behind in the region. Furthermore bio-oil has a high energy density compared to raw biomass.

Report 500036 002 (ECN-C--05-014) 237
In the Netherlands bio-oil could well be co-fired in coal- or gas-fired power plants for the pro-duction of green electricity and to replace coal and fossil natural gas. When developing a pyro-lysis installation the choice of scale is important. On the one hand the principle of economy-of-scale is important, but the logistics of the biomass collection limits this size. BTG is thinking of installations with a scale of 2 - 20 tonnes/hour. This equals 15,000 to 150,000 tonnes of biomass per year. The biomass can then be collected on a regional scale, for example in developing countries, where inexpensive biomass is available in large quantities. Pyrolysis is used to trans-form the biomass in a universal fluid (bio-oil). Subsequently one pyrolysis installation can either supply some 30 local small-scale boilers/combined heat power units with bio-fuel, or the pro-duction of several regional pyrolysis installations can be combined on a central location where the bio-oil is further processed in a large-scale installation, e.g. to produce syngas. The pyrolysis concept is actually a step in an ‘oil trade’ concept. Biomass technology development and introduction Technology development is a long-term process, in which a company such as BTG has to fol-low its own course, while also complying with the goals and developments of society. A com-pany often remains developing the ‘same’ concept under different drivers of different financiers. The energy producing and supplying sector in the Netherlands invests in renewable energy be-cause they expect to make money with this product. At the moment the market for pyrolysis technology stands at the beginning of an expected demand. Many energy companies show inter-est in the new technology, but their demand still has to become more concrete. At a certain point of technology development a company such as BTG needs specific contracts as a proof of the demand. Therefore a co-combustion experiment with bio-oil was performed in 2002 at the natu-ral gas-fired energy plant of Electrabel in Harculo, the Netherlands. This was a time-consuming affair, but it also was an interesting step forwards in the technology development route. The sat-isfying results of this experiment led to a turnaround in demand as Electrabel now plans to buy bio-oil produced in the future. This enables BTG to start building production plants, with a sale-guarantee for the bio-oil. Pilot pyrolysis plant for the production of bio-oil from organic materials At this moment BTG’s pyrolysis technology development is in the phase of building a demon-stration production plant, that can deliver facts and figures about operating a real-scale installa-tion in practice. This also includes organizational aspects like getting the operating permits. At the moment a medium-scale 2 tonnes/hour, continuous operation pilot plant for the production of bio-oil from biomass and bio-waste with the flash pyrolysis process is being developed by BTG. In 1990-1994 the proof of principle of the rotating cone technology was given with a 10 kg/hour lab-scale installation and in 1997-2001 a small-scale pilot plant was built on a continu-ous 250 kg/hour scale. Several types of biomass were tested such as various types of wood, grasses (like Miscanthus and straw) and residues (like rice husk, bagasse and oil palm). The fi-nancing of this small-scale pilot plant was done by National funds and the European Commu-nity. The final scale of the technology will be a production plant of 50 - 100 tonnes/day of bio-mass, producing 35 - 70 tonnes/day bio-oil. At the moment BTG’s pyrolysis technology mainly uses residues and by-products as feedstock. Growing biomass in the form of energy crops is not yet an option. Drivers in foreign countries An important driver in foreign countries to introduce biomass technology is to be able to proc-ess regionally available biomass more efficiently on a local scale. Another driver is to increase the standard of living of the local population. De-central power generation is also a driver. At the end of the eighties of the last century scarcity of fossil fuels was still an issue, but since then the environment also became an important driver in the beginning of the nineties. Climate poli-cies might play a certain part in foreign countries that import biomass technology, but economic motives often are the main driver. An example of an economic driver is the possibility to make money with residues from a production process. Another economic driver is to lower local en-
238 Report 500036 002 (ECN-C--05-014)
ergy costs, through replacement of fossil fuels by cheap local biomass and to gain income through the possible export of bio-oil to the European Community (e.g. the Netherlands). Drivers in the Netherlands At the moment when BTG got involved in pyrolysis research, climate policy was the main driver in the form of financial support from the government. Without climate policy pyrolysis technology would not have been developed any further by BTG. However, the main driver for BTG as a technology exporting company was of course to make a profit from this new biomass technology. For example by acquiring a strong patent position. The main driver for the energy producing and supplying companies in the Netherlands to purchase bio-oil is to produce green electricity with this fuel and thus make a profit. Financing technology development and transfer The financing of the biomass technology development and transfer projects of BTG came from the World Bank, foreign subsidy channels and the FAO (since 1993). The Dutch government was not the main financier. As a matter of fact pyrolysis technology was not taken very seri-ously at the beginning of the nineties. The European Community did finance some of the pro-jects (since 1995) both from Climate programmes and (sustainable) energy programmes, such as Joule and FAIR. Dutch export subsidies for most countries are not substantial (their purpose is to cover the risks) and besides they are not specifically climate policy related. The green electricity market is driven through climate policy. The possibility to export the bio-oil to the Netherlands will be a future driver for foreign financiers to invest regionally in pyroly-sis technology and thus climate policy is an indirect driver for this technology transfer. Bio-oil export is then a financial basis for future projects. The power plants of the Dutch energy pro-ducers do not need much investment to be able to co-combust bio-oil. Bio-oil might also be sold on more profitable markets, e.g. as base material for chemicals. For specialties no direct contri-bution is made to CO2 reduction (the climate driver is less important in that case). However, al-ternative products will only emerge when sufficiently profitable. The actual financing of new pyrolysis production plants still remains a problem at the moment. Financiers could be: banks, governments or venture capitalists. The latter only want to partici-pate in projects with a high risk combined with a high profit expectation or in projects with a low risk with a low profit expectation. However, at the moment most bio-energy projects have a high risk but not an extremely high profit expectation. Therefore investors focus on proven biomass technology (risk reduction) so the first requirement is to build a demonstration plant in the case of pyrolysis. Van de Beld (2004) emphasises that Dutch Government should support development and export of biomass technologies more strongly. The problem is that subsidies exist in the Netherlands both for inventing an innovative biomass technology (initial phase), and for exporting a proven biomass technology (final phase). However, no subsidies exist for the in-termediate phase where an innovation has to be developed for use on a practical scale. What is needed therefore is some sort of an instrument to finance the implementation phase. At the mo-ment this is a barrier in the financing route. Biomass technology importing countries In the eighties BTG aimed only at developing countries and not at the Dutch market. The Neth-erlands has natural gas so there was hardly any interest in starting with bio-energy. Furthermore the Dutch market alone is too small to develop new biomass technology for, and therefore they were forced to export. Developing countries have large biomass resources which makes them more suitable to use the technology. Often small villages in the poorer developing countries have little local capital, spare parts can hardly be obtained and qualified technicians are scarce. This restricts the introduction of new biomass technology. Therefore BTG aims more at further developed countries such as Eastern Europe (a.o. Baltic States), South America (Brazil) and Asia (Malaysia). Those countries have capital, technicians and biomass supplies. The introduc-tion of pyrolysis technology in foreign countries (rather than in the Netherlands) is partly based
Report 500036 002 (ECN-C--05-014) 239
on coincidence although BTG is always looking for optimal circumstances. Customers are found world-wide and they also approach BTG themselves. BTG does have a preference for cer-tain countries, e.g. due to the local possibilities to protect patent rights. CO2-emission reduction potential Within two years the demonstration phase of the pyrolysis transition path will only lead to a small reduction of about 10 ktonnes CO2-emission per year (Ministry of Economic Affairs, 2004b). However, it is expected that a CO2-emission reduction of more than 10 Mtonnes per year will be possible in the Netherlands in 2040 through the co-combustion of bio-oil in large power plants. This will even be several times larger when bio-oil will also be used as renewable transport fuel, as a basic material for the production of bio-chemicals and for Combined Heat Power installations. Amounts of 30 to 80 Mtonnes are then possible. An example of proven biomass technology transfer: combustion BTG was involved in developing bio-energy strategies for emerging markets in Central and Eastern Europe (Meuleman et al., 2001). They constructed a bio-energy investment portfolio of 50 million euro of bio-energy projects in the Czech Republic to supply carbon credits to the Dutch government under a Joint Implementation (JI) scheme (ERUPT/ carboncredits.nl) that was established in 2000. The Czech Republic has a high potential for JI because of the heat de-mand of the district heating sector, the current fossil fuel orientation, and the availability of biomass. The portfolio consists of 28 projects, in which old brown coal or natural gas fired boil-ers will be replaced by modern, efficient biomass fired systems (wood or straw). The biomass fuels are forestry or agricultural residues, that are currently burned at the site of their production, dumped or ploughed down. The power systems range from 0.6 to 24 MWth and the total capac-ity is 130 MWth. The total CO2 reduction in 2008-2012 is between 500 and 1,200 ktonnes CO2. The total investment costs are 32 million euro. Financers are the Czech State Environmental Fund, ERUPT payments and municipal resources. The main driver for the portfolio project in the Czech Republic is CO2-trade. The drivers for the municipalities that own the boilers were (Meuleman et al., 2001): • securing a locally available and inexpensive energy source (biomass); • financial benefits by using biomass as a fuel; • developing a modern and secure energy system; • contribution to the environmental and social development of rural areas; • availability of financial support. The technology used is combustion. This is proven technology that is supplied by partners This project is clearly connected with the Dutch climate policy. In order to be suitable for CO2-trade a portfolio should contain large projects, which is thus a barrier for smaller projects.
E.2.8 Concluding remarks on technology transfer in bio-energy chains Role of the climate and energy policy framework (and other drivers) In the Netherlands the climate and energy policy framework is certainly favourable for stimulat-ing technology development, implementation and transfer for biomass and bio-energy chains. This holds both for the short term and the long term. A favourable system to promote the pro-duction of renewable energy (MEP) and many R&D programmes have a positive influence on many conversion technologies (either proven or still under development). The oil crisis in the 1970’s and 1980’s was a very important driver for the development of tech-nology for biomass and bio-energy chains. In the last 10 years this technology got a new im-pulse through climate change policy. So technology development itself was not specifically cli-mate policy driven, but at the moment climate policy certainly is one of the important drivers for technology transfer. However, many other drivers also play an important role during the process of technology transfer, such as economy, solving other environmental problems (such as
240 Report 500036 002 (ECN-C--05-014)
waste disposal), securing a locally available and inexpensive energy source (biomass) to lower local energy costs, and meeting rural energy requirements. Possibility of synergy with CDM and JI projects Specific Joint Implementation and Clean Development Mechanism projects will become impor-tant mechanisms for technology transfer in biomass and bio-energy chains. Many examples of projects are being started at the moment. Barriers for the introduction in developing countries and countries in transition The actual financing of bio-energy technology transfer projects still remains a problem at the moment. Investors tend to focus on proven biomass technology (risk reduction) so it is rather difficult to transfer new technology. Other barriers are biomass availability, project performance risks, and institutional difficulties, such as the lack of supporting institutions in the developing countries. Potential for use in non-Annex 1 countries Important reasons for technology transfer to non-Annex 1 countries is either to reduce CO2 emissions in the receiving non-Annex 1 country or to take advantage of biomass export possi-bilities to Annex 1 countries that want to reduce their own CO2 emissions. Import substitution of fossil fuels by bio-fuels is another important driver in many developing countries. An important driver to introduce biomass technology in non-Annex 1 countries is to be able to process regionally available biomass more efficiently on a local scale. De-central power genera-tion is also an important reason for introducing small scale biomass and bio-energy technology in non-Annex 1 countries. Many regions in developing countries are not connected to a public electricity and/or heat grid. This means that electricity and heat should be produced locally, and bio-energy technology is very suited for that. The costs and benefits of specific biomass technology always depend on regional differences. Therefore newly developed biomass technology will not be economically feasible everywhere. In the Netherlands for example many of the electricity companies have chosen to apply rather traditional biomass co-firing conversion technology, because it is not profitable to upgrade ex-isting coal-fired power stations completely with the latest technology. However, a rather new technology like pyrolysis has more potential in developing non-Annex 1 countries, because there the opportunity exists to start from scratch and large amounts of biomass are available. The potential impact on CO2 abatement A large potential exists for the reduction of GHG emissions by substituting fossil fuels by CO2 neutral biofuels both in Annex 1 and non Annex 1 countries. This case study does not go into the exact amounts of CO2 abatement, but all of the described biomass and bio-energy technolo-gies can certainly contribute to a reduction of the CO2 emissions. The level of the emissions can be positively influenced by organizing the biomass and bio-energy production chains in an op-timal way. This means integrating all the links of the chain (Figure E.1), taking into account the local circumstances and choosing the right technology (type and scale) that fits locally.

Report 500036 002 (ECN-C--05-014) 241
E.3 Technology transfer in the land use and forestry sector
E.3.1 Drivers and barriers for technology transfer in the land use and forestry sector The land use and forestry sector plays an important role in the global carbon cycle, which is recognised in the Kyoto Protocol. Since the Kyoto Protocol was set up, investments have taken place in the land use and forestry sector either through afforestation projects, or through forest protection. These are mostly technology and institutional transfer projects. Spillover where the technology leads to additional sinks beyond the credits that the funding country obtains cannot be proven at the moment. Most of the projects in the land use and forestry sector have remained in the project scale (sev-eral hundreds to hundred thousands of hectares per project). All in all estimates provide total ar-eas covered under JI and CDM in the range of a few million hectares. This, despite large poten-tials that have always been provided by global studies. Still the Intergovernmental Panel on Climate Change (IPCC) Special Report on Land use, Land-use change and Forestry (Watson et al., 2001), and the IPCC Third Assessment report (Kauppi et al., 2001) provided global potential estimates in the range of a sink of 1 to 1.5 billion tonnes of carbon. In order to achieve this, hundreds of millions of hectares would have to be managed in a specific carbon friendly way. The reality seems very different where funding organisations, countries, the United Nations Framework Convention on Climate Change (UNFCCC), and private companies are entangled in a web of uncertainty concerning the future of the Kyoto Protocol in combination with a web of bureaucracy around credits obtained in land use and forestry projects. This explains why later estimates of the potential (realistic) options for af/reforestation under the CDM are much more modest: Waterloo et al. (2003) came to an estimate of only 14 million tonnes C per year during the first commitment period on five continents. By 2050 this may have risen to just over 100 million tonnes C per year. For forest protection, they claimed a modest contribution of another 14 million tonnes C per year during the commitment period 2008-2012.
Figure E.2. Carbon sequestration (rate per year) of af-/reforestation projects for different re-
gions. Assuming a 25% increase in planting rates due to the CDM, a 35-year rota-tion period and all threshold criteria adopted (Waterloo et al., 2003).
0
50
100
150
200
250
300
1 6 11 16 21 26 31 36 41 46 51 56 61 66 71 76 81 86 91 96
Time (years)
Car
bon
sequ
este
red
(Mt)
South America Oceania Asia Africa C. America/Caribbean

242 Report 500036 002 (ECN-C--05-014)
Still, most estimates for costs of carbon sequestration in the land use and forestry sector are very low: in the range of small negative costs to some 10 US$ per tonne C. Thus, it seems that other large barriers prevent large scale adoption of land use and forestry measures under the CDM. Generally, we can say that it is most specific to the land use sector (and foremost forestry) that it is not a high-tech intensive sector and that innovations are adopted slowly or hardly at all. This has to do with ecological characteristics of forests namely that decisions once taken have an im-pact of several years to many decades, but also with socio-economic characteristics. Barriers to innovation and technology transfer specific to the forestry sector are: • The long time period between adoption of a technique and achieving results is often a large
barrier. Large initial investment costs may thus accumulate through interest rates. • The forestry sector in a country often deals with millions of forest owners, each owning a
few hectares. Costly innovations are impossible to achieve for them. • Land owners attitude often need to be changed in order to adopt innovations. These are long
and intense processes that often require the socio-economic circumstances of the owner to be changed. Extension agencies and capacity building are needed for this, but they also need to gain credibility.
• Often indigenous and rural households depend on forests for their livelihood, and top down decisions will adversely affect them.
• But also in temperate countries, forestry fulfils a multitude of functions, where it is impos-sible to adopt innovations just for one function of the forest.
• Forest management is subject to natural disturbances. Forests and plantations are subjected to fire, drought, pests and diseases.
• Climate and location specificity of technologies. Forestry technologies vary among tropical, temperate and boreal regions, as well as with varying forest and plantation types, precipita-tion regions and socio-economic pressures.
• Forestry technologies generally have a low economic return. This impedes the investments from private (commercial) sectors.
• Local participation is required for implementing mitigation projects where local communi-ties currently reside in or depend on the forests.
E.3.2 General examples of technology transfer in the land use and forestry sector The categories of technologies likely to be involved in technology transfer between countries consist of underlying ongoing processes that aim at sustainable land use and forestry (e.g. im-proved agriculture, or Sustainable Forest Management, SFM), or projects directly aimed at C sequestration. The first is a group of projects in which The Netherlands has played a large role historically already. These are e.g. capacity building through FAO networks, or through direct development aid work. Examples are: • silvicultural practices for high yields; • genetic stock for planting; • practices for Sustainable Forest Management and Protected-Area Management; • efficiency improvements; • agroforestry and; • industrial forest products processing. Examples of projects directly aimed at C sequestration are: • afforestation or reforestation projects through the FACE Foundation; • monitoring and verification of C flows in forestry projects; • modelling for projecting changes in carbon stock and forest area; • fossil fuel substitution techniques.

Report 500036 002 (ECN-C--05-014) 243
The forestry sector shows an enormous variety of projects aimed at improving management and sustainability. Often these projects have side benefits to climate change. Organisations as FAO, UNDP, World bank, CGIAR, DG Development of the EU, Embassies, etc, are very active in this field. An example is given in the case description below. Practices for Sustainable Forest Management The FAO Regional Project on assistance for the implementation of the Model Forest Approach for sustainable forest management in the Asia-Pacific region, is an example of a project aimed at sustainable land use and forestry. This project assists China, Myanmar, Philippines and Thai-land in strengthening national and community-level capacities in the development and imple-mentation of field-level Model Forests. Its development objective is strengthened national framework and capacity in the four countries to develop and implement national forest pro-grams, and appropriate national forest policies for sustainable forest management and integrated land use. The Model Forests (MF) aim to address the diverse demands placed on the forests through the development of partnerships of all concerned stakeholders. Particular emphasis is directed at the development of mechanisms for the effective participation of all stakeholders, including local and forest-dependent communities, NGOs and the private sector; promoting 'best practices' for Sustainable Forest Management and other land uses; development and use of lo-cal-level criteria and indicators for Sustainable Forest Management; and providing continuous feedback on policy. It will also provide technical, training and other support at the local and na-tional levels; identify and access additional technology or resources for Model Forests activities, develop local, national and regional networks, and publish and disseminate appropriate field manuals, guidelines and newsletters for sharing information, technology and experiences and optimising use of available resources. The Project is financed by the Government of Japan and will operate from 2000 to 2002 for a period of 30 months. An example of a Dutch project directly aimed at C sequestration is described below. Afforestation or reforestation projects through the FACE Foundation The FACE Foundation (of Dutch Electricity Generating Board) started a carbon forestry pro-gramme in 1990, planning to undertake forest plantings on 150,000 ha of new forest to absorb the Generating Board's GHG emissions. For example FACE started a project for the develop-ment of efficient propagation of native dipterocarp high-value timber from cuttings, not seed-lings, in Sabah, Malaysia. FACE contracted Innoprise Corp. of the Sabah Foundation to estab-lish 5,000 ha of dipterocarps. Propagation was limited by supply of seedlings that flowered only every few years (Jones, 1996). Other projects of FACE are in Uganda (forest restoration) or Ec-uador (afforestation). The projects are ongoing. However, since the Kyoto Protocol is still not in force, the credits market is very weak. This uncertainty, plus uncertainty over the additionality of FACE’s projects has put FACE in a difficult position even though it is recognised as a ‘early experience’ institution and even though it serves as the execution institute for the Dutch land use carbon credits system. FACE uses three main criteria to identify projects: additionality, so-cial acceptability and cost effectiveness. These preconditions have been applied since FACE was established, and they can still be directly translated into the conditions that are currently ap-plied under the Kyoto Protocol and the Marrakech Accords. FACE has its projects certified so that their sustainability and reliability are clear to clients and the general public. Some projects have been certified in accordance with the guidelines of the Forest Stewardship Council (FSC) that has support from WWF. All projects are validated and verified in accordance with the crite-ria adopted by SGS in its GHG Project Verification and Certification. FACE uses an extensive monitoring programme to assess and optimise project progress. The monitoring is done in col-laboration with international and local experts. Truly climate policy induced examples of technology transfer in the forestry sector are scarce! However, climate policy induced afforestation projects are increasingly being carried out, e.g. under the Prototype Carbon Fund (PCF) of the World bank. The total area under these types of
244 Report 500036 002 (ECN-C--05-014)
projects lies in the range of several hundred thousand hectares worldwide. The PCF was estab-lished in 2000 in response to these opportunities. It is a public and private partnership to miti-gate climate change. Its aim is to pioneer the market for project based greenhouse gas emissions reductions within the framework of the Kyoto Protocol and to contribute to sustainable devel-opment. Six countries (among which the Government of the Netherlands) and seventeen private sector entities (among which the Rabobank) set up the PCF and committed US$180 million to the fund for the purchase of emissions reductions124. The PCF stimulates the pilot production of Emission Reductions within the framework of Joint Implementation (JI) and the Clean Devel-opment Mechanism (CDM). We describe one PCF project in Romania, showing the rules and guidelines (barriers) that need to be followed.
E.3.3 Detailed case description: afforestation of degraded agricultural lands in Roma-nia
Description Prototype Carbon Fund project of the World Bank The project (Phillips, 2002; World bank, 2003) concerns the afforestation of degraded agricul-tural lands in the south-west and south-east of the Romanian Plain and the ecological recon-struction of part of the Lower Danube floodplain (Braila and Olt Counties) through the planting of native tree species and the sale of the carbon sequestered by the newly established forests to the PCF. Species selection was based on local site conditions and management objectives (fertility, soil stabilization, ecological reconstruction). The main species for degraded lands is Robinia (Robinia pseudoaccacia), a naturalized tree species which has been planted extensively in Ro-mania on such lands over the past century. Where site conditions permit, oak and other broad-leaf tree and shrub species will be planted to restore the natural type of vegetation. On the Lower Danube Floodplain native Poplars (Populus alba and Populus nigra) will be planted with some native Willow (Salix spp). Within the floodplain, the species proportion will be circa 80% Poplar, and 20% Willow. Of the Poplar planting circa 90% will be Populus alba and 10% Popu-lus nigra. The total afforestation area included in the project is 6,728 hectares (net of roads and buildings etc.) and is spread across seven counties. The net carbon sequestered by the afforestation will be purchased by the Prototype Carbon Fund over a 15 year purchase period. All lands are under the stewardship of the National Forest Administration (NFA), with some 5,000 ha being transferred from the State Domain Agency (SDA) in June of this year. The planned afforestation conforms to overall state forest policy and strategy that identifies degraded agricultural lands for afforestation. There is an estimated 2 to 3 million hectares of degraded ag-ricultural lands in Romania. The afforestation is planned to take place over a four-year period (2002-2005) and the species and potential site productivity class reflect the inherent low fertility status of the soils. Environmental Impact Assessment In order to describe the potential environmental impacts of the project, a modified scored check-list approach was adopted to articulate the potential positive and negative environmental im-pacts envisaged both with and without the project, in the absence of any mitigation measures.
124 Prototype Carbon Fund Annual Report 2001 (http://www.prototypecarbonfund.org)

Report 500036 002 (ECN-C--05-014) 245
Without Project The Baseline Study indicated that the soils in both areas used for occasional grazing and agri-cultural areas were low in carbon. Over time, the likelihood is that an increasing proportion of the area will become abandoned and / or used for poor quality grazing. Increased grazing with sheep, in the absence of proper grassland management, has the potential to accelerate soil ero-sion. The increase in fertilizer and chemical inputs necessary to produce decreasing amounts of agricultural crops will lead to leaching of chemicals to the ground water. This will have an im-pact on water quality in the surrounding area. In the short term, the continuation of current land use will not impact on flora or fauna. The social assessment due diligence report showed that overall there is positive support for a change of land use among communities. It also showed that there were concerns among communities regarding the degradation and erosion due to con-tinuation of current land use and its potential impact on adjoining lands being worked by them. With Project The soil cultivation (ploughing and disking) will have a short term negative impact on soils through the release of soil carbon. The removal of vegetation ( circa 200 ha of Amorpha on Lit-tle Island of Braila) will have an immediate negative impact on both flora and fauna, however with the replacement by native tree species, this impact will be reversed over time. The accumu-lation of soil carbon affected by the tree crops will, over time, have a significant and lasting positive impact, together with the accompanying increase in soil microbial activity. The only major likely impact is in the event of pest/ disease infestation in the Poplar/ Willow areas, if spraying is used as a control measure. The use of the crop protection chemical Decis (deltame-thrin) which is toxic to aquatic life is likely to have a negative impact on water quality. Initially the soil preparation on abandoned lands and those used for occasional grazing will have a nega-tive impact on flora and fauna. This initial negative impact will be reversed over time as the for-est becomes established and supports an increasing and diverse flora and fauna. The planting of native species will have a significant positive impact on flora and fauna as these areas become established and support a more natural and native range of flora and fauna. The possibilities for temporary employment during the initial establishment phase and subsequently during mainte-nance and harvesting will have a positive social impact. In the Robinia areas, the newly estab-lished forests will add structural diversity to the existing landscape and is regarded as having a positive impact. Monitoring Monitoring of all sites will take place in the Autumn of Years 1, 2, 3 and 4 and thereafter in the Autumn every 3 years. In the event of the necessity to implement disease control measures, monitoring will be required in the year of spraying, prior to the commencement of spraying and in the following year. It should be remembered, that in addition to the monitoring under the project, the afforestation and future forest activities will be subject to monitoring and compliance with the Romanian regulatory framework by the Forest Inspection in the Ministry of Agriculture, Forestry and Fisheries (MAFF). Carbon impact Simulated carbon impact of one hectare of Robinia afforestation is depicted in Figure E.3. Concluding it can be stated that the Romanian case is one of the more successful carbon projects in the land use and forestry sector. However, even this project is a case of technology transfer mainly, and not spillover. Once this project gets accepted locally and neighbouring communities see the advantages, then further spillover may occur. However, that will only be the case after some 2 to 3 decades.

246 Report 500036 002 (ECN-C--05-014)
0
50
100
150
200
250
0 50 100 150 200
Time (y)
Car
bon
stoc
k (M
g C
ha-1
)
biomass soiltotal
Figure E.3. Carbon stock development in one hectare (Mg C ha-1) of Robinia afforestation in the
World bank project in Romania. If all of the area would be afforested with Robinia, 938 ktonnes C is sequestered in 95 years. These simulations are carried out with CO2FIX (Phillips, 2002).
E.3.4 Concluding remarks on technology transfer in the land use and forestry sector concerning aspects of bio-energy
This example project combines the rehabilitation of degraded soils and ecological reconstruction of lower Danube floodplain with the opportunity to avail of measures under the Kyoto Protocol for the sale of emission reductions. Only under these circumstances where multiple goals can be achieved, a project can be successful. Large opportunities in the land use and forestry sector can thus be found where existing problems (degradation, erosion, water quality, rural poverty) can be solved at the same time as when the climate goals are achieved. This is where the opportuni-ties are, certainly where projects can benefit from existing capacity building networks as e.g. implemented by FAO. However, despite many studies that depict that in principle hundreds of million of hectares worldwide would be suitable to carry out carbon sequestration projects, the area under existing projects is very meagre at the moment. Seven different barriers have been identified: • local laws (social and environmental); • local opposition because of increased pressure on scarce land; • uncertain ratification process of the Kyoto Protocol; • protocol’s rules, for monitoring and implementation; • bureaucracy as imposed by the CDM executive Board; • slow procedures in land use planning; • land value deterioration under afforestation. Many of these barriers will remain, and can only be reduced through project by project analyses of stakeholders and problems. Only where the right combination of goals can be identified, the land use and forestry sector can benefit from and facilitate spillover effects. Often, combinations with bio-energy chains (previous section) provide options to lift a land use project to a level where execution becomes possible.

Report 500036 002 (ECN-C--05-014) 247
E.4 Conclusions The following conclusions for technology transfer induced by climate change policies are based on both biomass and bio-energy chains and the land use and forestry sector. The main conclu-sions are: Role of the climate and energy policy framework (and other drivers) • In the Netherlands the climate and energy policy framework is certainly favourable for
stimulating technology transfer for biomass and bio-energy chains. A favourable system to promote the production of renewable energy (MEP) and many R&D programmes have a positive influence on many conversion technologies (either proven or still under develop-ment).
• The oil crisis in the 1970’s and 1980’s was a very important driver for the development of technology for biomass and bio-energy chains. So technology development itself was not specifically climate policy driven, but at the moment climate policy certainly is one of the important drivers for technology transfer.
• However, many other drivers also play an important role during the process of technology transfer, such as economy, solving other environmental problems (such as waste disposal), securing a locally available and inexpensive energy source (biomass) to lower local energy costs, and meeting rural energy requirements.
Possibility of synergy with CDM and JI projects • Specific Joint Implementation and Clean Development Mechanism projects will become
important mechanisms for technology transfer in biomass and bio-energy chains. Many ex-amples of projects are being started at the moment.
Barriers for the introduction in developing countries and countries in transition • The actual financing of bio-energy technology transfer projects still remains a problem at
the moment. Investors tend to focus on proven biomass technology (risk reduction) so it is rather difficult to transfer new technology.
• Other barriers are biomass availability, project performance risks, and institutional difficul-ties, such as the lack of supporting institutions in the developing countries.
• Barriers that were found for the land use and forestry sector are: local laws (social and envi-ronmental), local opposition because of increased pressure on scarce land, uncertain ratifica-tion process of the Kyoto Protocol, protocol’s rules, for monitoring and implementation, bu-reaucracy as imposed by the CDM executive Board, slow procedures in land use planning and land value deterioration under afforestation.
Potential for use in non-Annex 1 countries • Important reasons for technology transfer to non-Annex 1 countries are either to reduce CO2
emissions in the receiving non-Annex 1 country or to take advantage of biomass export pos-sibilities to Annex 1 countries that want to reduce their own CO2 emissions. Import substitu-tion of fossil fuels by bio-fuels is another important driver in many developing countries.
• An important driver to introduce biomass technology in non-Annex 1 countries is to be able to process regionally available biomass more efficiently on a local scale.
• De-central power generation is also an important reason for introducing small scale biomass and bio-energy technology in non-Annex 1 countries. Many regions in developing countries are not connected to a public electricity and/or heat grid. This means that electricity and heat should be produced locally, and bio-energy technology is very suited for that.
• The costs and benefits of specific biomass technology always depend on regional differ-ences. Therefore newly developed biomass technology will not be economically feasible everywhere.

248 Report 500036 002 (ECN-C--05-014)
• Large opportunities in the land use and forestry sector can be found where existing prob-lems (degradation, erosion, water quality, rural poverty) can be solved at the same time as when the climate goals are achieved, so when multiple goals can be achieved, such as a combination with bio-energy chains.
The potential impact on CO2 abatement
• A large potential exists for the reduction of GHG emissions by substituting fossil fuels by CO2 neutral biofuels both in Annex 1 and non Annex 1 countries.
Report 500036 002 (ECN-C--05-014) 249
E.5 References Beld, B. van der, 2004 Interview on the role of BTG concerning technology transfer with the emphasis on py-
rolysis, 26 April. Berndes, G., M. Hoogwijk & R. van den Broek, 2003 The contribution of biomass in the future global energy supply: a review of 17 studies.
Biomass and Bioenergy, Vol. 25, 1-28. BTG, 2004 www.btgworld.com Coninck, H.C. de & N.H. van der Linden, 2003 An overview of carbon transactions; general characteristics and specific peculiarities.
ECN Publication, ECN-C--03-022, 25 pp. Ecofys, 2003 Biofuels in the Dutch market: a fact-finding study. 2GAVE03.12, Novem, Utrecht, 312
pp. Golemberg, J., 1996 The evolution of ethanol costs in Brazil. Energy Policy, Vol. 24, pp. 1127-1128. Golemberg, J., S.T. Coelho, P.M. Nastari & O. Lucon, 2004 Ethanol learning curve – the Brazilian experience. Biomass and Bioenergy, Vol. 26,
301-304. Harmsen, R. & E.J.W. van Sambeek, 2003 Costs of renewable electricity. ECN Publication, ECN-C--03-074/H, 20 pp. Hoogwijk, M., A. Faaij, R. van den Broek, G. Berndes, D. Gielen & W. Turkenburg, 2003 Exploration of the ranges of the global potential of biomass for energy. Biomass and
Bioenergy, Vol. 25, 119-133. IEA, 2000 Experience curves for energy technology policy. Report, Organisation for Economic
Co-operation and Development & International Energy Agency, Paris, France, 127 pp. IEA, 2003 Creating markets for energy technologies. Report, Organisation for Economic Co-
operation and Development & International Energy Agency, Paris, France, 170 pp. Jones, D.J., 1996 Criteria for AIJ Project Design in Forestry: The Private Sector Perspective. In Regional
Workshop on Activities Implemented Jointly. Proceedings of a workshop in Jakarta, In-donesia, June 25-27.
Junginger, M., A. Faaij & R. Björheden, 2004a (in press) Technological learning and cost reductions in woodfuel supply chains. In: Proocedings
of the 2nd World Conference and Technology Exhibition on Biomass for Energy, Indus-try and Climate Protection, Rome, 10-14 May 2004, 4 pp.
Junginger, M., E. de Visser A. Faaij & U. Claeson Colpier, 2004b (in press) Technological learning and cost reductions of biomass CHP combustion plants – The case
of Sweden. In: Proocedings of the 2nd World Conference and Technology Exhibition on Biomass for Energy, Industry and Climate Protection, Rome, 10-14 May 2004, 6 pp.
Junginger, M., S. Agterbosch, A. Faaij & W. Turkenburg, 2004c Renewable electricity in the Netherlands. Energy Policy, Vol. 32, 1053-1073.

250 Report 500036 002 (ECN-C--05-014)
Kauppi P., R.J. Sedjo, M. Apps, C. Cerri, T. Fujimori, H. Janzen, O. Krankina, W. Makundi, G. Marland, O. Masera, G.J. Nabuurs, W. Razali & N.H. Ravindranath, 2001
Technical and Economic Potential of Options to Enhance, Maintain and Manage Bio-logical Carbon Reservoirs and Geo-engineering. Mitigation 2001. The IPCC Third as-sessment report. In: Metz, B. et al. (Eds.), Cambridge, Cambridge University Press.
Kwant, K, E. van den Heuvel & G. Kupers, 2004 Biomass in the Netherlands; Policy and actors in the transition to a renewable and sus-
tainable bio-based infrastructure for heat, power, fuels and products. Holland Brochure for the 2nd World Conference and Technology Exhibition on Biomass for Energy, In-dustry and Climate Protection, Rome, 10-14 May 2004, 39 pp.
Lange, Th. de & M. Uyterlinde, 2004 Shaping the EU renewable energy market: which road to harmonisation. In: Dutch en-
ergy policies from a European perspective; Major developments in 2003, ECN Publica-tion, ECN-P--04-001, 7-17.
McDonald, A & L. Schrattenholzer, 2001 Learning rates for energy technologies. Energy Policy, Vol. 29, pp. 255-261. Metz, B., O.R. Davidson, J.-W. Martens, S.N.M. van Rooijen & L. van Wie McGrory, 2000 Methodological and technical issues in technology transfer. Intergovernmental Panel on
Climate Change, Cambridge University Press, UK, 432 pp. (http://www.grida.no/climate/ipcc/tectran/)
Meuleman, B., M. Cmiral & J. Mika, 2001 Biomass energy portfolio for Czech Republic; a baseline study. Biomass Technology
Group B.V., Enschede, 35 pp. Ministry of Economic Affairs, 2003 Bio-energy Action Plan; working together on bio-energy (in Dutch). Report 03ME22,
Ministry of Economic Affairs, The Hague, 25 pp. Ministry of Economic Affairs, 2004a The Netherlands: Biomass in 2040: The green driving force behind a knowledge econ-
omy and sustainability … a vision. Information leaflet. 4 pp. (www.energietransitie.nl) Ministry of Economic Affairs, 2004b Biomass: green tool for energy transition in the Netherlands. Report Ministry of Eco-
nomic Affairs, The Hague, 59 pp. Phillips, H., 2002 Afforestation of Degraded Agricultural Land in Romania. Prototype Carbon Fund,
Technical, Financial and Environmental Assessment Report. World bank, Washington DC. 26 pp.
Rasmussen, C., M. Fischer & L. Stiemsma, 2002 Biomass power plant Cuijk – In many ways a successful and pathbreaking project for
climate change. In: Proceedings of the 12th European Conference for Energy, Industry and Climate Protection, 17-21 June 2002, Amsterdam, The Netherlands, 956-959.
Rooijen, S.N.M. van & M.T. van Wees, 2004 (in press) Green electricity policies in the Netherlands: an analysis of policy decisions. Energy
Policies, 12 pp. Senter International, 2002 Carboncredits.nl Joint Implementation; information. Brochure, 4 pp. Senter, 2004 Information on carboncredits.nl on website www.senter.nl

Report 500036 002 (ECN-C--05-014) 251
Sijm, J., 2004a Induced technological change and spillovers in climate policy modeling. ECN Publica-
tion, ECN-C--04-73 pp. Sijm, J., 2004b Implementing emissions trading in the EU: how to optimise its economic benefits? In:
Dutch energy policies from a European perspective; Major developments in 2003, ECN Publication, ECN-P--04-001, 33-44.
Sims, R.E.H., 2002 The brilliance of bioenergy in business and in practice. James & James, London, UK,
316 pp. Wagenaar, B.M., 1994 The Rotating Cone Reactor, For rapid thermal solids processing. Thesis. Waterloo, M.J., P.H. Spiertz, H. Diemont, I. Emmer, E. Aalders, R. Wichink-Kruit & P. Kabat,
2003 Criteria, potentials and costs of forestry activities to sequester carbon within the frame-
work of the clean development mechanism. Wageningen : Alterra, Green World Re-search, Report 777, 134 p
Watson, R.T., I.R. Noble, B. Bolin, N.H. Ravindranath, D.J. Verardo & D.J. Dokken, 2001 IPCC Special Report on Land Use, Land-Use Change and Forestry. (http://www.grida.no/climate/ipcc/land_use/) Wilkins, G., 2002 Technology transfer for renewable energy; overcoming barriers in developing countries.
The Royal Institute of International Affairs (RIIA), UK, 237 pp. World bank, 2003 Monitoring plan for changes in carbon stocks in forest plantations (afforestation of de-
graded agricultural land project in Romania) Between the national forest administration - romsilva - and the prototype carbon fund (pcf Administered by the international bank for reconstruction and development). Washington DC, 43 pp.
Copyright © 2022 FDOKUMEN