Spies et al 2020 (Pacific cod genetics, EBS and NBS).pdf
14
362 | Evolutionary Applications. 2020;13:362–375. wileyonlinelibrary.com/journal/eva 1 | INTRODUCTION Several recent studies have confirmed the prediction that increases in water temperature driven by climate change can cause range shifts of marine species toward higher latitudes and contraction at lower latitudes (Booth, Bond, & Macreadie, 2011; Pinsky, Worm, Fogarty, Sarmiento, & Levin, 2013; Sunday, Bates, & Dulvy, 2012). As productive, commercially fished species move northward, under‐ standing the effect of changes in climate on species range shifts into higher latitudes and movement into marginal habitat will be partic‐ ularly challenging. Even understanding whether habitat is marginal is difficult as conditions shift under climate change. Nevertheless, understanding changes in distribution is important for their conser‐ vation through dynamic fisheries management, to engage in deci‐ sion‐making that is based on the best estimates of stock dynamics and spatial distribution. Populations in marginal habitats are expected to be less abun‐ dant than those in core habitats, and survival and reproductive rates may be lower (Kawecki, 2008; MacCall, 1990; Sexton et al., 2016). Newly established marginal populations are less well adapted, with low reproduction and survival, and must be main‐ tained by migration from the core (Kawecki, 2008). Marginal populations may then adapt to local conditions but are still prone to local extinctions and can act as demographic sinks (Kawecki, Received: 31 July 2019 | Revised: 14 September 2019 | Accepted: 18 September 2019 DOI: 10.1111/eva.12874 ORIGINAL ARTICLE Genetic evidence of a northward range expansion in the eastern Bering Sea stock of Pacific cod Ingrid Spies 1 | Kristen M. Gruenthal 2,3 | Daniel P. Drinan 2 | Anne B. Hollowed 1 | Duane E. Stevenson 1 | Carolyn M. Tarpey 2 | Lorenz Hauser 2 This is an open access article under the terms of the Creative Commons Attribution License, which permits use, distribution and reproduction in any medium, provided the original work is properly cited. © 2019 The Authors. Evolutionary Applications published by John Wiley & Sons Ltd 1 Alaska Fisheries Science Center, National Oceanic Atmospheric Administration, Seattle, Washington 2 School of Aquatic and Fishery Sciences, University of Washington, Seattle, Washington 3 Office of Applied Science, Wisconsin Department of Natural Resources, Wisconsin Cooperative Fishery Research Unit, University of Wisconsin‐ Stevens Point, Stevens Point, Wisconsin Correspondence Ingrid Spies, National Oceanic Atmospheric Administration, Alaska Fisheries Science Center, 7600 Sand Point Way NE, Seattle, WA 98115. Email: [email protected] Funding information Norton Sound Fund Abstract Poleward species range shifts have been predicted to result from climate change, and many observations have confirmed such movement. Poleward shifts may repre‐ sent a homogeneous shift in distribution, seasonal northward movement of specific populations, or colonization processes at the poleward edge of the distribution. The ecosystem of the Bering Sea has been changing along with the climate, moving from an arctic to a subarctic system. Several fish species have been observed farther north than previously reported and in increasing abundances. We examined one of these fish species, Pacific cod, in the northern Bering Sea (NBS) to assess whether they mi‐ grated from another stock in the eastern Bering Sea (EBS), Gulf of Alaska, or Aleutian Islands, or whether they represent a separate population. Genetic analyses using 3,599 single nucleotide polymorphism markers indicated that nonspawning cod col‐ lected in August 2017 in the NBS were similar to spawning stocks of cod in the EBS. This result suggests escalating northward movement of the large EBS stock during summer months. Whether the cod observed in the NBS migrate south during winter to spawn or remain in the NBS as a sink population is unknown. KEYWORDS climate change, fisheries management, population dynamics, population genetics – empirical
-
Upload
khangminh22 -
Category
Documents
-
view
4 -
download
0
Transcript of Spies et al 2020 (Pacific cod genetics, EBS and NBS).pdf

362 | Evolutionary Applications. 2020;13:362–375.wileyonlinelibrary.com/journal/eva
1 | INTRODUCTION
Several recent studies have confirmed the prediction that increases in water temperature driven by climate change can cause range shifts of marine species toward higher latitudes and contraction at lower latitudes (Booth, Bond, & Macreadie, 2011; Pinsky, Worm, Fogarty, Sarmiento, & Levin, 2013; Sunday, Bates, & Dulvy, 2012). As productive, commercially fished species move northward, under‐standing the effect of changes in climate on species range shifts into higher latitudes and movement into marginal habitat will be partic‐ularly challenging. Even understanding whether habitat is marginal is difficult as conditions shift under climate change. Nevertheless,
understanding changes in distribution is important for their conser‐vation through dynamic fisheries management, to engage in deci‐sion‐making that is based on the best estimates of stock dynamics and spatial distribution.
Populations in marginal habitats are expected to be less abun‐dant than those in core habitats, and survival and reproductive rates may be lower (Kawecki, 2008; MacCall, 1990; Sexton et al., 2016). Newly established marginal populations are less well adapted, with low reproduction and survival, and must be main‐tained by migration from the core (Kawecki, 2008). Marginal populations may then adapt to local conditions but are still prone to local extinctions and can act as demographic sinks (Kawecki,
Received: 31 July 2019 | Revised: 14 September 2019 | Accepted: 18 September 2019
DOI: 10.1111/eva.12874
O R I G I N A L A R T I C L E
Genetic evidence of a northward range expansion in the eastern Bering Sea stock of Pacific cod
Ingrid Spies1 | Kristen M. Gruenthal2,3 | Daniel P. Drinan2 | Anne B. Hollowed1 | Duane E. Stevenson1 | Carolyn M. Tarpey2 | Lorenz Hauser2
This is an open access article under the terms of the Creative Commons Attribution License, which permits use, distribution and reproduction in any medium, provided the original work is properly cited.© 2019 The Authors. Evolutionary Applications published by John Wiley & Sons Ltd
1Alaska Fisheries Science Center, National Oceanic Atmospheric Administration, Seattle, Washington2School of Aquatic and Fishery Sciences, University of Washington, Seattle, Washington3Office of Applied Science, Wisconsin Department of Natural Resources, Wisconsin Cooperative Fishery Research Unit, University of Wisconsin‐Stevens Point, Stevens Point, Wisconsin
CorrespondenceIngrid Spies, National Oceanic Atmospheric Administration, Alaska Fisheries Science Center, 7600 Sand Point Way NE, Seattle, WA 98115.Email: [email protected]
Funding informationNorton Sound Fund
AbstractPoleward species range shifts have been predicted to result from climate change, and many observations have confirmed such movement. Poleward shifts may repre‐sent a homogeneous shift in distribution, seasonal northward movement of specific populations, or colonization processes at the poleward edge of the distribution. The ecosystem of the Bering Sea has been changing along with the climate, moving from an arctic to a subarctic system. Several fish species have been observed farther north than previously reported and in increasing abundances. We examined one of these fish species, Pacific cod, in the northern Bering Sea (NBS) to assess whether they mi‐grated from another stock in the eastern Bering Sea (EBS), Gulf of Alaska, or Aleutian Islands, or whether they represent a separate population. Genetic analyses using 3,599 single nucleotide polymorphism markers indicated that nonspawning cod col‐lected in August 2017 in the NBS were similar to spawning stocks of cod in the EBS. This result suggests escalating northward movement of the large EBS stock during summer months. Whether the cod observed in the NBS migrate south during winter to spawn or remain in the NBS as a sink population is unknown.
K E Y WO RD S
climate change, fisheries management, population dynamics, population genetics – empirical
| 363SPIES Et al.
2008). If the new population represents a founder effect, in which a small number of colonizers establish a new self‐sustaining pop‐ulation, the resulting population may exhibit reduced genetic diversity as well as genetic similarity to its population of origin. Adaptation to marginal habitat may also be countered by high im‐migration from core populations, an effect known as migration swamping (Kirkpatrick & Barton, 1997; Kawecki, 2008; Sexton et al., 2016). If dispersal is high, gene flow may prevent differentia‐tion between the core and marginal populations. In this case, both marginal and core populations could evolve toward intermediate trait values, not optimized for either habitat, with loss of fitness in the core population (Kawecki, 2008).
Changing climate conditions have recently been observed in the Bering Sea and Gulf of Alaska (GOA), and range shifts of several commercially important fish species have been observed in the Bering Sea (Stevenson & Lauth, 2012, 2019). There has also been a change in the Bering Sea from high annual variability in the extent of spring (March–April) sea ice from 1972 to 2000 to prolonged warm intervals with low spring ice extent from 2001 to 2006 followed by more extensive sea ice from 2007 to 2013 (Alabia et al., 2018; Stabeno et al., 2012). Since 2014, the eastern Bering Sea (EBS) has exhibited anomalously warm temperatures (Alabia et al., 2018). As a result, the “cold pool,” water below 2°C that remains along the EBS shelf during the summer following sea ice retreat, has been re‐stricted to the northern parts of the EBS. Most recently, in 2018, the National Marine Fisheries Service (NMFS) survey of the EBS observed the smallest cold pool in the survey history (1982–2018), with only 1% of the total area of the EBS shelf bottom at less than
2°C (Siddon & Zador, 2018; Stabeno et al., 2018). The cold pool is an important factor affecting species distributions; for example, walleye pollock (Gadus chalcogrammus), Pacific cod (Gadus macro‐cephalus), and most flatfishes avoid it (Hollowed, Planque, & Loeng, 2013; Sigler et al., 2016; Stevenson & Lauth, 2019). Reductions in marine mammal and benthic prey populations have been observed in the northern Bering Sea (NBS) concurrent with increases in pe‐lagic fish, as the NBS is shifting from arctic to subarctic conditions (Grebmeier et al., 2006).
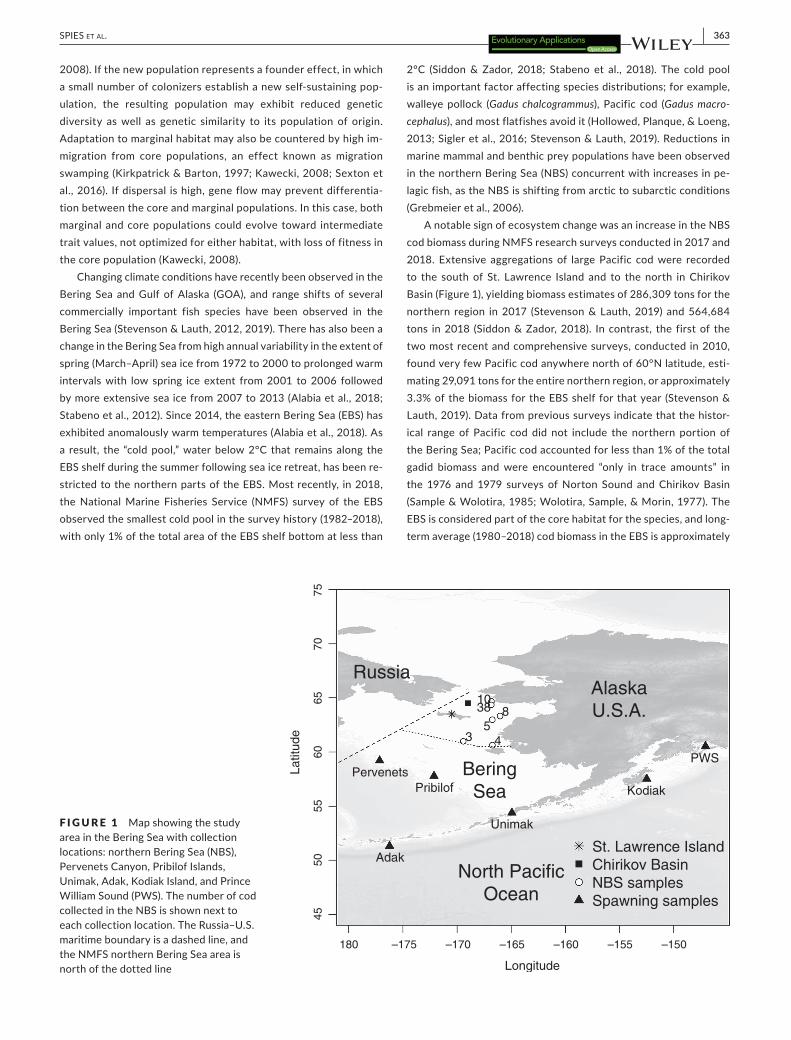
A notable sign of ecosystem change was an increase in the NBS cod biomass during NMFS research surveys conducted in 2017 and 2018. Extensive aggregations of large Pacific cod were recorded to the south of St. Lawrence Island and to the north in Chirikov Basin (Figure 1), yielding biomass estimates of 286,309 tons for the northern region in 2017 (Stevenson & Lauth, 2019) and 564,684 tons in 2018 (Siddon & Zador, 2018). In contrast, the first of the two most recent and comprehensive surveys, conducted in 2010, found very few Pacific cod anywhere north of 60°N latitude, esti‐mating 29,091 tons for the entire northern region, or approximately 3.3% of the biomass for the EBS shelf for that year (Stevenson & Lauth, 2019). Data from previous surveys indicate that the histor‐ical range of Pacific cod did not include the northern portion of the Bering Sea; Pacific cod accounted for less than 1% of the total gadid biomass and were encountered “only in trace amounts” in the 1976 and 1979 surveys of Norton Sound and Chirikov Basin (Sample & Wolotira, 1985; Wolotira, Sample, & Morin, 1977). The EBS is considered part of the core habitat for the species, and long‐term average (1980–2018) cod biomass in the EBS is approximately
F I G U R E 1 Map showing the study area in the Bering Sea with collection locations: northern Bering Sea (NBS), Pervenets Canyon, Pribilof Islands, Unimak, Adak, Kodiak Island, and Prince William Sound (PWS). The number of cod collected in the NBS is shown next to each collection location. The Russia–U.S. maritime boundary is a dashed line, and the NMFS northern Bering Sea area is north of the dotted line Longitude
Latit
ude
4550
5560
6570
75
180 –175 –170 –165 –160 –155 –150
35
4
81038
AlaskaU.S.A.
Russia
BeringSea
North PacificOcean
Unimak
KodiakPribilofPervenets
Adak
PWS
St. Lawrence IslandChirikov BasinNBS samplesSpawning samples

364 | SPIES Et al.
800,000 t, ten times higher than the Aleutian Islands and three times larger than the GOA (Barbeaux et al., 2017; Schmidt et, 2019). However, the cod biomass measured by the NMFS EBS shelf survey declined 37% between 2016 and 2017, representing the largest de‐cline since the survey began in 1982. Strikingly, the 2017 summer cod biomass in the NBS was equal to 83% of the reduction in bio‐mass in the EBS in the same year and by 2018, summer cod biomass was higher in the NBS than the EBS (Figure 2, Table S2; Thompson, 2018).
The life history of Pacific cod is characterized by seasonal move‐ment between summer feeding and winter spawning locations (Shimada & Kimura, 1994). This seasonal movement coupled with genetic evidence for population structure among spawning groups indicates that natal homing and spawning site fidelity are part of Pacific cod life history, and thus, collections of spawning samples are representative of a population while samples collected during summer migrations may be mixed. Spawning areas have been iden‐tified along the Bering Sea shelf, Aleutian Islands, and Gulf of Alaska (Figure 1; Neidetcher, Hurst, Ciannelli, & Logerwell, 2014). It is doubt‐ful that cod have historically spawned in the NBS, since seasonal sea ice typically covers the northern part of the Bering Sea shelf during January–May, even in warm years, and historical surveys observed few cod in the NBS (Sample & Wolotira, 1985; Stabeno et al., 2017; Wolotira et al., 1977).
Shifts in the spatial distribution of commercial species have the potential to disrupt fisheries with challenging implications for sustainable management (Karp et al., 2019; Pinsky et al., 2018). In the Bering Sea, Pacific cod fisheries are rationalized and managed through a complex catch share program involving a diverse suite of fishing sectors (Fina, 2011; Ono et al., 2017; Stram & Evans, 2009). Of particular importance to our study, the northern region of the Bering Sea shelf is closed to commercial trawling, limiting access of one sector of the fleet when the population shifts north. The trawl fishery primarily operates during the fall and winter when fish have returned to the south to spawn. If climate change dis‐rupts or retards this southward migration, fishing opportunities
would diminish the catch potential for this portion of the fleet. Likewise, if cod in the northeastern Bering Sea represented a new distinct stock, additional measures to sustainably manage the northern and southern stocks would be necessary as mandated by current US legislation (Magnuson‐Stevens Fishery Conservation and Management Act; Cadrin et al., 2013). However, as in many other marine species, the mechanisms of northward shifts and the status of new northern populations are currently unknown.
The goal of this study was to examine the mechanisms and genetic effects of shifts in the abundance of Pacific cod in the northern portion of its range within the context of our current un‐derstanding of range expansions into marginal habitat. This work built upon baseline information (Drinan et al., 2018), which showed that spawning populations of Pacific cod were sufficiently dis‐criminated by SNP loci for successful assignment to population of origin. We used 3,599 single nucleotide polymorphism (SNP) mark‐ers obtained through restriction‐site associated DNA sequencing (RADseq) to compare a sample of Pacific cod taken from the NBS during a 2017 research survey to spawning fish from three loca‐tions in the EBS and three additional populations throughout their range in Alaska (Figure 1). We tested several hypotheses to explain the origin of increasing abundances of Pacific cod in the NBS, spe‐cifically whether the NBS cod stock represents: 1. an isolated pre‐existing population, 2. a new population established via a founder event, 3. a range shift from core habitat elsewhere in the range of Pacific cod, 4. a sink population that is maintained by immigra‐tion from core habitat elsewhere in the range of Pacific cod, or 5. an extension of summer feeding migrations. Hypothesis 1 would be consistent with significant genetic differentiation among NBS samples and other known Pacific cod populations, hypothesis 2 would suggest a reduction in relative genetic diversity in NBS cod, while hypotheses 3, 4, and 5 would indicate genetic similarity with the stock of origin. Distinguishing among hypotheses 3, 4, and 5 will require additional research, but the management implications among them are significant. Therefore, results are discussed in the context of other relevant biological information that may provide some further insight and context for the current and future status of the population.
2 | METHODS
2.1 | Sample collection
Fin clips from spawning aggregations in Prince William Sound (March 2012, n = 48), near Kodiak Island (March 2003, n = 47), and near Adak Island (March 2006, n = 49) were collected as de‐scribed in Drinan et al. (2018). Additional fin clips were collected onboard fishing vessels from spawning aggregations of Pacific cod in Pervenets Canyon (March 2016, n = 48), Pribilof Canyon (April 2017, n = 48), and Unimak Pass (February 2018, n = 48); these fish included spawning, mature, and prespawning individu‐als (Table 1, Figure 1). Sampling locations were named based on the closest large geographical feature. Lengths were not collected
F I G U R E 2 Pacific cod biomass estimates from the eastern Bering Sea (“expanded area”) survey from 1987 to 2018 and the northern Bering Sea survey (2010, 2017, and 2018)
1990 1995 2000 2005 2010 2015
0
50
100
150
200
Year
Bio
mas
s es
timat
e (x
10,0
00 t) Eastern Bering Sea survey
Northern Bering Sea survey

| 365SPIES Et al.
from spawning fish from Adak, Kodiak, or Prince William Sound, as these were collected opportunistically on fishing vessels. Length frequencies for the NBS, Pervenets, Pribilof, and Unimak collec‐tions are shown in Figure 3. Fin clips were also collected from non‐spawning fish in the NBS during the NMFS bottom trawl survey in August 2017 (Table 1). Previously published sequences (Drinan et al., 2018) were combined with new data for a total of 360 individu‐als (Table 1).
2.2 | RAD sequencing
Fin clips were preserved in 100% nondenatured ethanol. For the NBS collection, Pervenets, Pribilof, and Unimak, RAD libraries were prepared as described in Drinan et al. (2018) and sequenced in 100 bp single‐end reads on three lanes on a HiSeq4000 (Illumina, Inc.) at the University of Oregon Genomics and Cell Characterization Core Facility (GC3F).
Location Month/Year Lat. Long. N
Adak Island* Mar. 2006 51°40′N 176°36′W 45(4)
Kodiak Island* Mar. 2003 57°48′N 152°31′W 45(2)
Prince William Sound* Mar. 2012 60°32′N 147°4′W 47(1)
Northern Bering Sea Aug. 4, 2017 60°59′N 169°26′W 3
Aug. 18, 2017 60°37.8′N 166°44.8′W 4
Aug. 18, 2017 62°59′N 166°45′W 5
Aug. 18, 2017 63°19′N 166°02′W 8
Aug. 23, 2017 64°40′N 166°50′W 10
Aug. 23, 2017 64°21′N 166°50′W 38
68(4)
Pervenets Canyon Mar. 28 2016 59°21′N 177°13′W 48
Pribilof Canyon Apr. 10 2017 57°47′N 172°8′W 48
Unimak Pass Feb. 7 2018 54°35′N 165°15′W 47(1)
Note: Samples marked with an asterisk * were sequenced previously (Drinan et al., 2018). N represents the number of samples that passed data quality checks, and numbers in parentheses represent the number removed.
TA B L E 1 Collection locations and dates for samples analyzed in this study
F I G U R E 3 Frequency histogram of fork length (cm) of the 68 fish analyzed from the northern Bering Sea, as well as length frequencies of cod sampled from Pervenets, Pribilof, and Unimak
Length (cm)
Fre
quen
cy
02468
30 35 40 45 50 55 60 65 70 75 80 85 90 95
NBS
Length (cm)
Fre
quen
cy
0123456
30 35 40 45 50 55 60 65 70 75 80 85 90 95
Pervenets
Length (cm)
Fre
quen
cy
012345
30 35 40 45 50 55 60 65 70 75 80 85 90 95
Pribilof
Length (cm)
Fre
quen
cy
012345
30 35 40 45 50 55 60 65 70 75 80 85 90 95
Unimak

366 | SPIES Et al.
2.3 | STACKS pipeline and data analysis
Data sequenced on the Illumina HiSeq 4000 were downloaded from the GC3F website. Individuals from Prince William Sound, near Kodiak Island, and near Adak Island were previously sequenced on an Illumina HiSeq 2000 (Drinan et al., 2018). Raw reads were filtered and demultiplexed using the STACKS v. 1.44 (Catchen, Hohenlohe, Bassham, Amores, & Cresko, 2013) component program process_radtags with flags (−r −c –q), which rescued barcodes, removed any read with an uncalled base, and discarded reads with low‐quality scores (<90% probability of being correct). Reads were trimmed to 92 bp, based on sequence quality scores using FastQC v.0.11.5 (Andrews, 2010). Reads were aligned to the gadMor2 Atlantic cod genome (Tørresen et al., 2017) using bowtie legacy 1.2 software v.2.3.4.1 (Langmead & Salzberg, 2012), using options (−v 3, −k 2), where −v is the number of mismatches permitted regardless of qual‐ity and −k is the number of valid alignments to report. The STACKS pipeline was run with –m 3 in pstacks, −g in cstacks, and –m 3, −r 0.8 in populations using a population map based on collection loca‐tion. STACKS processing parameters (−m 3 in pstacks and –m 3 in populations) were used to effectively combine datasets run on dif‐ferent platforms, given typically lower stack depth from the HiSeq 2000. Loci with a minor allele frequency (MAF) <0.05 and >0.45 were removed. The loci with MAF 0.45 and higher were typically heterozygous in all individuals and may have been paralogous loci. A single SNP at each locus with the highest MAF was retained for further analysis.
Conformation of genotype proportions to Hardy–Weinberg ex‐pectations (HWE) was tested by chi‐squared tests in pegas (Paradis, 2010) for each collection separately. Loci were removed if they were not present in at least six of the seven populations, significantly out of HWE following correction for multiple testing by the false discov‐ery rate (FDR) method (Benjamini & Hochberg, 1995), or out of HWE in two or more populations.
Pairs of SNPs displaying linkage disequilibrium within popula‐tions were identified with the squared correlation statistic r2 using PLINK software v1.90b5.3 (Purcell et al., 2007). Groups of SNPs linked with an r2 threshold >0.8 were found using the custom func‐tion in R SNPpruner.R (https ://github.com/31ing rid/SNPpr uner). The 0.8 threshold for r2 has been used in previous studies and was intended to balance losing SNPs of interest, if lower, with including physically linked loci, if higher (Jasonowicz, Goetz, Goetz, & Nichols, 2016). Within groups, or clusters of linked SNPs, the linked SNP with the least missing data was retained and the remainder was pruned from the dataset. Further pruning took place in PLINK to identify and remove loci with missing call rates >25% (‐‐geno 0.25) and indi‐viduals with missing data >0.3 (‐‐mind 0.3).
We applied OutFLANK v0.2 (Whitlock & Lotterhos, 2015) and BayeScan v2.1 (Foll & Gaggiotti, 2008) to test for the presence of candidate loci under selection in the full dataset (seven populations) and a Bering Sea only dataset (Pervenets, Pribilof, Unimak, and NBS). BayeScan uses differences in allele frequencies between popula‐tions to identify loci under selection via a q‐value, a stringent FDR
analog of the p‐value. OutFLANK infers the distribution of neutral markers from a trimmed distribution of FST values and uses that dis‐tribution to detect outliers. BayeScan was run for a total of 100,000 iterations, a burnin of 50,000, and thinning interval 10, for a total sample size of 5,000. The prior odds for the neutral model was set to 100 and α = .05 (FDR). OutFLANK was run with left and right trim fractions 0.05, minimum heterozygosity required to include a locus 0.1, and a q‐threshold 0.05. Linkage group and position were taken from the stacks output file sumstats.tsv and aligned with all four GadMor2 annotation files (https ://osf.io/4qsdw/ ) (Tørresen et al., 2017) using the Bioconductor package GenomicRanges (Lawrence et al., 2013).
FIS and Fisher's exact tests for differentiation were calculated using genepop with dememorization of 10,000; 1,000 batches; and 5,000 iterations per batch (Rousset, 2008). The number of alleles per population and expected heterozygosity (He) were calculated using adegenet (Jombart & Ahmed, 2011). Effective population size was estimated for each population using NeEstimator v2.01 with the random mating model, linkage disequilibrium method, parametric 95% confidence intervals, and minimum allele frequency cutoff of 0.05 (Do et al., 2014). Hierfstat (Goudet, 2005) was used to calculate rarefied allelic counts and pairwise FST (Weir & Cockerham, 1984). Global FST and pairwise FST with 95% confidence intervals were calcu‐lated using diveRsity (Keenan, McGinnity, Cross, Crozier, & Prodöhl, 2013). Deviation of each FST estimate from zero was estimated by 1,000 random permutations over individuals and over loci, with sig‐nificance over individuals estimated as the proportion of permuted pairwise FST estimates greater than the true FST. Significance was cal‐culated by permuting over loci using StAMPP (Pembleton, Cogan, & Forster, 2013).
Discriminant analysis of principal components (DAPC) in ade‐genet (Jombart & Ahmed, 2011) was used to visualize spatial rela‐tionships in the data. The number of principal components used in the DAPC was determined by comparing reassignment to empirical clusters with that to random clusters using the function optim.a.score in adegenet. Two DAPC plots were generated, one with all samples and a second with only samples from the Bering Sea.
A mixed stock analysis was performed to identify possible source populations for the NBS collection, with the remaining collections used as reference populations, in RUBIAS (Moran & Anderson, 2019). RUBIAS is a Bayesian hierarchical genetic stock assignment approach that ac‐counts for population structure among baseline populations (Anderson, Waples, & Kalinowski, 2008). Posterior density curves and 95% cred‐ible intervals for mixture proportions were created from MCMC out‐put. A Z‐score was computed from each individual's log‐likelihood and compared with a simulated normal density to test whether individuals in the NBS originated from populations outside the reference set (e.g. from Russia); Z‐scores similar to the normal density provide evidence that the mixture sample came from one of the reference populations. A Kolmogorov–Smirnov test was used to compare the Z‐score with the normal density. The mixture analysis was performed on six reference datasets, each of which included three collections not from the Bering Sea (Adak, Prince William Sound, and Kodiak) as well as follows: (a) EBS

| 367SPIES Et al.
individuals (Pervenets, Priblof, and Unimak) combined into a single population; (b) EBS individuals as separate populations; (c) all EBS pop‐ulations excluded; (d) Pervenets excluded; (e) Pribilof excluded; and (f) Unimak excluded. The accuracy of the individual assignment analysis was evaluated by testing self‐assignment of simulated individuals of known origin. Known simulated proportions for each reporting group were compared with the numbers estimated by RUBIAS to test the ac‐curacy of the individual assignment analysis.
3 | RESULTS
Data processed on the Illumina HiSeq 4000 averaged 3.8 × 10⁸ total sequences per library, 5.4% ambiguous barcode drops, 0.6% low‐quality read drops, and 88.5% retained read rate. Data processed on an Illumina HiSeq 2000 presented lower average scores: 1.9 × 10⁸ total sequences per library, 13.0% ambiguous barcode drops, 8.0% low‐quality read drops, and 53.1% retained read rate. A total of
6,133 loci were retained following initial STACKS v1.44 data pro‐cessing. Five individuals were removed during the STACKS pipeline due to insufficient data (Table S1).
There were 3,731 loci remaining after selection for loci present in at least six out of seven populations and in HWE by population. Sixty‐six loci were removed due to linkage disequilibrium, and the largest linked cluster consisted of three loci. Seven individuals were removed with more than 30% missing data (Table S1). An additional 66 loci were removed that contained more than 25% missing data over all individuals (geno > 0.25). A total of 3,599 loci and 348 indi‐viduals remained in the final dataset, with 2.52% missing data, after data quality checks. The number of individuals per location in the final dataset ranged from 45 to 48, with the exception of the NBS collection, which contained 68 individuals that ranged in fork length from 33 to 78 cm (Table 1, Figure 3).
FIS was generally low and positive, indicating a heterozygote de‐ficiency, which can be due to inbreeding or allelic dropout (Table 2). Global FST over all samples was 0.0059 (0.0044, 0.0078) and pairwise
Sampling location N A AR FIS He Ne (95% CI)
Adak 45 7,166 1.9817 −0.0160 0.287 1,691 (1,432; 2,064)
Kodiak 45 7,165 1.9768 0.0222 0.281 2,868 (2,223; 4,036)
Prince William Sd.
47 7,186 1.9852 0.0079 0.287 3,746 (2,814; 5,594)
N. Bering Sea 68 7,142 1.9731 0.0225 0.285 15,130 (8,147; 104,559)
Pervenets 48 7,133 1.9714 0.0203 0.283 6,198 (4,095; 12,709)
Pribilof 48 7,126 1.9725 0.0165 0.286 22,432 (7,789; ∞)
Unimak 47 7,135 1.9717 0.0150 0.283 ∞ (63,413; ∞)
TA B L E 2 Summary statistics for each collection location: number of individuals analyzed (N), number of alleles (A), the rarefied allelic richness (AR), the inbreeding statistic FIS, expected heterozygosity He, and effective population size with 95% confidence intervals
TA B L E 3 Below diagonal: pairwise FST estimates for all sample locations: Adak, Kodiak, Prince William Sound (PWS), northern Bering Sea (NBS), Pervenets, Pribilof, and Unimak
Adak Kodiak PWS NBS Pervenets Pribilof Unimak
Adak 0.0930 *** *** 0.000 0.000 0.000
Kodiak 0.0096** (0) 0.000 0.166 0.406 0.412 0.911
PWS 0.0074** (0) 0.0051**(0)
*** *** *** 0.855
NBS 0.0136** (0) 0.0033** (0) 0.0100**(0) 1.000 1.000 1.000
Pervenets 0.0136**(0)
0.0037** (0) 0.0102** (0) 0.0002(0.197)
1.000 1.000
Pribilof 0.0137**(0) 0.0033** (0) 0.0103**(0) 0.0002(0.202)
0.0007* (0.016) 1.000
Unimak 0.0142** (0) 0.0032** (0) 0.0095** (0) 0.0002(0.279)
0.0008*(0.011)
0.0006*(0.021)
Note: Significance estimates for FST bootstrapped over loci are presented as asterisks (** = p < .001, * = p < .05), and p‐values are shown in parenthe‐ses for bootstraps over individuals. Above diagonal: p‐values from Fisher's exact tests for differentiation over all loci; *** indicates highly significant.

368 | SPIES Et al.
FST ranged from 0.0002 to 0.0142 across all comparisons (Table 3). DAPC was optimized for all samples using 12 principal components and distinguished four clusters: Prince William Sound, Adak, Kodiak, and the eastern Bering Sea (Figure 4a). A DAPC limited to Bering Sea samples showed no further structure (Figure 4b) with 46 principal components.
Of the 3,599 loci in the final dataset, 3,543 aligned to linkage groups in the Atlantic cod genome (GadMor2) and the remainder aligned to genomic scaffolds. The loci were represented rela‐tively evenly across all 23 linkage groups (LG), ranging from 81 on LG17 and 192 on LG14 (Table S3). OutFLANK identified 218 outlier loci in the full dataset and four in the Bering Sea dataset, while BayeScan identified 90 outlier loci in the full dataset and
one in the Bering Sea dataset. All but one of the candidate loci for selection identified by BayeScan in the full dataset was also identified with OutFLANK. These 89 loci mapped to a limited number of linkage groups: LG2, 6, 8, 9, 11, 14, and 15, suggesting that some linkage groups may contain more genes under selec‐tion than others (Table S3). One of these SNPs, with FST = 0.11245 and α = 0, mapped to LG9, position 24,173,727, was located within the zona pellucida subunit 3 gene sequence. Other gene functions were not identified, but several of the highest FST loci were found in similar locations along LG6. A single SNP locus was identified to be a candidate for selection with BayeScan and OutFLANK in the Bering Sea dataset. This mapped to LG6, position 11,812,308, but gene function was not annotated. Alpha was positive for all
F I G U R E 4 (a) DAPC scatterplot of samples from the northern Bering Sea, Pervenets Canyon, Pribilof Islands, Unimak Pass, Adak, Kodiak Island, and Prince William Sound. Note: Samples from the northern Bering Sea, Pervenets Canyon, Pribilof Islands, and Unimak Pass overlap. Insets indicate the number of principal components retained (PC = 12). (b) DAPC scatterplot of samples from the Bering Sea only (northern Bering Sea, Pervenets, Pribilof, and Unimak), PC = 46. Note: Pervenets is in teal green
Kodiak
Adak
Prince William Sound
Northern Bering Sea thern BeringP
ttsPervenetPribilofP
ern Beringern BeringttP ibil f
Unimak ee
Pribilof
Unimak
PNorthern Bering Sea
DA eigenvalues
PCA eigenvalues
DA eigenvalues
PCA eigenvalues
(a)
(b)

| 369SPIES Et al.
SNPs identified as outliers, indicating diversifying selection rather than balancing. BayeScan results are shown visually for the full and Bering Sea datasets, with log10(q‐value) plotted versus FST, and a vertical line depicting the threshold level for significance (Figure S1).
Effective population size estimates were generally large and ranged from 1,691 in the Adak population to over 5,000 in samples from the Bering Sea, although results are likely imprecise as some values could not be estimated (Table 2). The Unimak effective pop‐ulation size could not be estimated (expressed as infinity), although the lower bound of the 95% confidence interval was 63,413. Overall, estimates of effective population sizes of islands and inlets tended to be smaller than shelf populations. The range of rarefied allelic richness was narrow, 1.971–1.985, and the NBS collection had the highest allelic richness out of all EBS populations.
Significance estimates obtained by bootstrapping FST over loci and over individuals were comparable (Table 3, below diagonal). All pairwise FST estimates except those between the NBS and EBS were significant over loci and individuals, providing support for sig‐nificant differentiation among all spawning populations (p < .001). Comparison of the northern Bering Sea collections to Pervenets, Pribilof, and Unimak were not significant (p > .05), while comparisons among Bering Sea collections were significant at p < .05 (Table 3). Spawning collections from the Bering Sea were genetically distinct, but could not be distinguished from the NBS collection when mea‐sured by FST. This result was consistent with the NBS collection being a mixture of several Bering Sea spawning populations.
Genetic differentiation among collections measured by Fisher's exact test for differentiation and FST were generally congruent with a few exceptions. Fisher's exact tests were more conservative than FST in differentiating among populations (Table 3, above diagonal). The NBS collection was not genetically distinguishable from the EBS populations (Pervenets, Pribilof, and Unimak) under FST or Fisher's exact tests (Table 3); we cannot reject the null hypothesis that alleles from NBS and EBS populations were drawn from the same distribu‐tion. However, unlike FST, Fisher's exact tests among the Bering Sea collections (Pervenets vs. Pribilof, Pervenets vs. Unimak, and Pribilof vs. Unimak) did not show significant differences among collections.
The estimated posterior density for the RUBIAS mixture propor‐tion of the NBS individuals was over 98% (0.957, 1.000) EBS when individuals from Pervenets, Pribilof, and Unimak were combined into a single EBS reference population (Figure 5a, Table 4a). When Pervenets, Pribilof, and Unimak were treated as separate reference populations, the mixture proportions were 30% Pervenets, 19% Pribilof, and 50% Unimak (Figure 5b), with <1% for populations out‐side of the EBS (Table 4b).
Comparison of the Z‐scores to the normal distribution provided information on whether the NBS collection came from a population not represented by reference populations. The Kolmogorov–Smirnov test rejected the null hypothesis that the log‐likelihood Z‐score came from a normal distribution when all EBS samples were excluded from the reference but not otherwise (Table 5). Removal of Pervenets, Pribilof, or Unimak from the reference dataset did not significantly change the Z‐score, even though each had a high probability of as‐signment from the NBS (Table 5). Simulations indicated that mixture proportions were highly accurate for all reference groups when EBS collections were combined (Figure 6a). When considered separately, there was a definitive loss of accuracy in the mixture proportions of Pervenets, Pribilof, and Unimak populations (Figure 6b), which was likely associated with low levels of differentiation among those populations.
4 | DISCUSSION
We found evidence for large‐scale summer redistribution of Pacific cod from their historical range in the southern EBS to ~1,000 km north during anomalously warm conditions between 2010 and
F I G U R E 5 Posterior density of the probability of assignment of the northern Bering Sea sample to reference spawning populations, labeled as “Population” in the legend. In panel (a), Bering Sea reference populations (Pervenets, Pribilof, and Unimak) were applied separately and in panel (b), Bering Sea reference populations were combined. Note: PWS = Prince William Sound
0
10
20
30
40
50
0.0 0.2 0.4 0.6
Reference population
Den
sity
Population
AdakKodiakPWSPervenetsPribilofUnimak
0
10
20
30
40
50
0.00 0.25 0.50 0.75 1.00
Reference population
Den
sity
Population
AdakKodiakPWSEBS
(a)
(b)

370 | SPIES Et al.
2017. Movement appeared to be most likely from spawning popu‐lations in the EBS core habitat into the NBS, which has historically been marginal habitat as is evidenced by low encounter rates for surveys conducted in the region before 2017 (Bakkala et al., 1992; Bakkala, Traynor, Teshima, Shimada, & Yamaguchi, 1985; Goddard & Zimmermann, 1993; Sample & Wolotira, 1985; Stevenson & Lauth, 2012, 2019; Walters et al., 1988; Wolotira et al., 1977; Wolotira, Sample, Noel, & Iten, 1993). Individual cod collected from the NBS in August of 2017 assigned to EBS spawning popula‐tions with high levels of certainty (>98%) and not to the Aleutian Islands or the GOA (Figure 5; Table 4). This indicated support for hypotheses 3, 4, and 5; the movement into the NBS represented either a large‐scale redistribution (hypothesis 3), a sink population (hypothesis 4) from EBS cod spawning populations, or an exten‐sion of the northward feeding migration of the EBS stock (hypoth‐esis 5). It is difficult to distinguish among hypotheses 3, 4, and 5 without further analyses, but a feeding migration is the simplest and most consistent with known cod life history. Pacific cod sam‐pled in the NBS had above average condition in 2018, and anecdo‐tal observations indicated their stomachs were full of snow crab,
Chionoecetes opilio (Siddon & Zador, 2018). The northern Bering Sea may represent a new location for summer feeding migrations of EBS cod in years with a diminished cold pool. If cod migrate northward to feed during the summer, they may either undergo long migrations back to their spawning location of origin (hypoth‐esis 5) or perhaps overwinter in the NBS if conditions allow (hy‐potheses 3 or 4).
It is possible that the NBS collection, or some portion thereof, could have originated from Russian waters or another unsampled location, if that population were genetically similar to the reference populations from the EBS. Pacific cod spawn along the Bering Sea shelf, and fishing takes place along the shelf on both sides of the Russia—U.S. maritime boundary during spawning season. It is un‐likely that cod in Russian water adjacent to the Pervenets sampling location are strongly genetically distinct from other EBS cod, but this has not been tested. Nonetheless, Pervenets, Pribilof, and Unimak represent the largest and most geographically proximate known spawning areas in the EBS and are therefore the most likely sources of the NBS collection (Neidetcher et al., 2014).
Results indicate against hypothesis 1, a founder event, and hy‐pothesis 2, that large numbers of cod in the NBS originated from a pre‐existing population in the region. Genetic results did not provide evidence that cod observed in the NBS were genetically distinct from populations of cod in the EBS (Tables 2 and 3). The level of allelic richness was not lower in the NBS collection than any of the EBS populations, which would be expected in the case of a founder effect. Rather, slightly higher allelic richness in the NBS may indicate that it represents a mixture of other stocks, a reasonable assumption considering that stocks of cod likely mix during the summer feeding season (Table 2). Further, surveys indi‐cated very low abundance of Pacific cod in the NBS prior to 2010. The length–frequency distribution of cod collected in the NBS was also similar to that of the EBS population, although slightly larger (Stevenson & Lauth, 2019), which could be due to better feeding conditions or if cod preferentially undertake more distant summer migrations as they grow.
Our results provide strong evidence of large‐scale northward movement of eastern Bering Sea Pacific cod into the NBS during summer months. There are significant management implications based on whether the entire life history of the NBS cod has shifted northward (hypothesis 3), whether it represents a sink population
TA B L E 4 Probability (p) of assignment of the northern Bering Sea sample to reference populations, with low and high 95% credible intervals (low CI, high CI), for (a) eastern Bering Sea samples combined as a single “EBS” population, and (b) EBS samples used as separate reference populations
Assignment to reference population p Low CI High CI
(a)
Adak .003 5 × 10⁻⁹ 0.025
Kodiak .004 7 × 10⁻⁹ 0.025
Prince William Sound .004 2 × 10⁻⁹ 0.024
Eastern Bering Sea .989 0.957 1.000
(b)
Adak .003 4 × 10–13 0.022
Kodiak .007 3 × 10–11 0.039
Prince William Sound .002 1 × 10–11 0.018
Pervenets .302 0.2 0.421
Pribilof .186 0.1 0.290
Unimak .500 0.4 0.620
Scenario K‐S p‐value
EBS individuals combined into a single reference population 0.2014
EBS individuals incorporated as separate reference populations 0.7828
All EBS individuals excluded from reference population 3.91e−10
Pervenets excluded from reference population 0.3247
Pribilof excluded from reference population 0.4664
Unimak excluded from reference population 0.5700
Note: Similarity among total log‐likelihood and simulated normal densities (significant test scores) are an indication of whether northern Bering Sea collection could have come from the reference populations.
TA B L E 5 The p‐values associated with the null hypothesis that the total log‐likelihood was drawn from the reference distribution, or the simulated normal density, based on the Kolmogorov–Smirnov test, for several reference population scenarios of the mixture analysis

| 371SPIES Et al.
with its source the EBS stock (hypothesis 4), or simply an extension of summer feeding migrations (hypothesis 5). Under a distributional shift (hypothesis 3), spawning activity would also shift north, and roughly half of the fishing takes place on spawning stocks; whereas under hypothesis 4 or 5, the spawning stock would remain along the EBS shelf. Almost no knowledge exists on winter (spawning) distri‐butions, as there is no winter survey and no fishing in the NBS.
Oceanographic evidence provides a mechanism for northward transport of juveniles. It is unknown why younger fish would move
northward, but it has been shown that young fish follow older fish to learn migration routes (Dodson, 1988). The smallest fish collected from spawning populations was 46 cm from Pervenets and could have been a maturing 3 or 4 years old, as 50% maturity is estimated at 4.8 years in EBS cod (Figure 3, Thompson, 2018). The smallest fish sampled in the Northern Bering Sea were 33 cm and 2 years old, likely too small to swim 600–1,000 km if they originated along the Bering Sea shelf (Figure 3). There is evidence to suggest that larval fish can position themselves in the water column to take advantage
F I G U R E 6 Comparison of true mixture proportion and simulation mixture contributions for each of the four reporting groups for (a) a reference dataset with eastern Bering Sea reference populations considered separately and (b) the reference dataset with Pervenets, Pribilof, and Unimak combined into a single eastern Bering Sea group
Pervenets Pribilof Unimak
Adak Kodiak PWS
0.0 0.2 0.4 0.6 0.8 0.0 0.2 0.4 0.6 0.8 0.0 0.2 0.4 0.6 0.8
0.0
0.2
0.4
0.0
0.2
0.4
True mixture proportion
Sim
ulat
ed m
ixtu
re p
ropo
rtio
n
Population
AdakKodiakPWSPervenetsPribilofUnimak
PWS EBS
Adak Kodiak
0.00 0.25 0.50 0.75 1.00 0.00 0.25 0.50 0.75 1.00
0.00
0.25
0.50
0.75
1.00
0.00
0.25
0.50
0.75
1.00
True mixture proportion
Sim
ulat
ed m
ixtu
re p
ropo
rtio
n
PopulationAdakKodiakPWSEBS
(a)
(b)
372 | SPIES Et al.
of current patterns, suggesting a possible mechanism for northward movement of juvenile cod. Juvenile walleye pollock use a northward baroclinic flow along the 100 and 200 m isobaths of the middle and outer Bering Sea shelf (Duffy‐Anderson et al., 2017; Hurst et al., 2009; Stabeno, Danielson, Kachel, Kachel, & Mordy, 2016). More research is needed to understand under which conditions cod juve‐niles may use currents for northward transport.
Evidence based on fish condition, recruitment, and catch may inform the current dynamics of the stock in the Bering Sea. Anomalously high catch per unit effort (CPUE) in the March 2018 EBS winter trawl fishery may be interpreted as evidence that spawners return to the eastern Bering Sea, or it may represent a decline in spawning activity. High CPUE can be associated with low biomass (hyperstability) if a species exhibits hyperaggrega‐tion. Normalized CPUE in March 2018 was more than double1 any other CPUE in the March trawl fishery since 1991 (Thompson, 2018). Hyperaggregation occurred in Atlantic cod in the Bonavista Corridor off Newfoundland, Canada, where the density of cod from 1990 to 1993 was fourfold that of the 1980s even though abundance had declined fivefold (Rose & Kulka, 1999). While hy‐peraggregation has been documented in Atlantic cod and other fish species (Erisman et al., 2011; Neuenhoff et al., 2018), it has not yet been evaluated in Pacific cod. Length–weight residuals, used as a proxy for fish condition, have declined in Pacific cod in the EBS since 2003 but increased in the NBS in 2018 relative to the EBS population (Siddon & Zador, 2018), indicating that NBS summer feeding is favorable for cod. Although the spawning stock was large in 2018, estimated annual recruitment has been below average since 2013 (Thompson, 2018). Anomalously low recruit‐ment may be an indication of a disruption in typical spawning be‐havior or a reduced spawning stock, although estimates of total spawning biomass have appeared relatively stable since 1990s (Figure 1.21, Thompson, 2018). Together, this evidence points to reduced recruitment or reduced spawning activity in the EBS, but high‐quality foraging in the NBS.
Significant stock status changes, likely coupled to environmental change, have occurred recently in other parts of the range of Pacific cod, as well. In the GOA, Pacific cod encountered a different fate than Bering Sea cod during the recent warm period. During 2016–2017, warmer temperatures led to increased metabolic demands in Pacific cod, which may have exceeded energetic consumption and resulted in lower body condition (Barbeaux et al., 2017). Indeed, this elevated mortality was likely the cause of a 58% decline in Pacific cod biomass in the GOA estimated from NMFS biomass trawl survey data in 2017 relative to 2016, the lowest estimate from the time series (1984–2017) of standardized surveys by more than half (Barbeaux et al., 2017). In addition, at the southern end of their range in Puget Sound, WA, abundance declined as predicted in a range contraction typical for ectotherms in general (Sunday et al., 2012). Catches of cod in Puget Sound averaged approximately 2 million pounds from 1958
to 1967 (Alderdice & Forrester, 1971). Today, however, few cod cur‐rently reside in Puget Sound, and abundance estimates from WDFW trawl surveys are considered unreliable due to the infrequency of cod encounters within most Puget Sound sub‐basins (Pacunski, R., WDFW, pers. comm.).
Several tangential results are worth mentioning that provide potentially useful management information. Significant FST values among EBS shelf populations were present even though the mag‐nitude of FST was too small to distinguish among those populations using assignment testing. Fisher's exact test has been shown to have low statistical power for SNPs; therefore, the significant levels deter‐mined using pairwise FST are considered more reliable (Ryman et al., 2006). The significant pairwise FST estimates among EBS populations (Pervenets, Pribilof, and Unimak) warrant further research on the level of genetic differentiation among those populations, perhaps using a more powerful dataset, such as whole‐genome sequencing. A lack of differentiation among the NBS collection and Bering Sea spawning populations provides support that those fish represented a mixture of Bering Sea populations. Overall, effective population size estimates are likely inaccurate, and larger sample sizes are likely required to obtain more precise estimates (Marandel et al., 2019). Even so, effective population sizes support independent population size estimates that indicate the Bering Sea stock is larger than either the Gulf of Alaska or the Aleutian Islands. The data used in this study consisted of primarily selectively neutral loci, with roughly 89 loci in the full dataset identified as candidates for diversifying selection. Assignment testing is not commonly applied to marine populations, which are typified by low levels of FST. Incorporating a combination of neutral SNPs and SNPs under diversifying selection is a useful technique to improve assignment success, as in Drinan et al. (2018). The dataset used here included many of the same loci in that study, including one SNP found within the zona pellucida subunit 3 coding sequence.
The results of this study are directly relevant to the management of this valuable resource underscoring the growing importance of genetics as a tool for sustainable management in a changing cli‐mate. Our study supports the hypothesis that climate change will extend the range for many subarctic species including Pacific cod (Cheung, Reygondeau, & Frölicher, 2016). However, our study does not support the hypothesis that climate‐induced shifts in suitable habitat will also result in increased catch potential. If the low recruit‐ment trend is not abated, the stock and the future catch potential will decline despite the expansion of suitable habitat. The findings supported continued single stock management in the eastern Bering Sea, although observations of cod along border of the United States and Russia suggests that transboundary management agreements may be necessary for the future (Pinsky et al., 2018). Results also emphasize the need for ecosystem‐based fisheries management as a holistic approach that encompasses all interactions within the ecosystem rather than a single‐species approach. In addition to ge‐netics, tagging studies and continued research surveys are essential for understanding how a shifting climate will influence the extent of postspawning migrations in existing populations (e.g. from the EBS)
1 CPUE was 5.703 kg per 1,000 hooks, with all months for 1991–2018 normalized to a mean of one (Thompson, 2018).

| 373SPIES Et al.
or whether cod will ultimately colonize new spawning areas in the NBS.
ACKNOWLEDGEMENTS
We thank those who helped collect samples for this study and pro‐vided funding: Alisa Abookire, Asia Beder, Lyle Britt, Pat Burns, Craig Cross, Dave Fraser, Elliott Hammond, Pam Jensen, Simon Kineen, Sandra Lowe, Krista Milani, Sean Rooney, Chris Schaeffer, Chad See, Dawn Wehde, the Alaska Department of Fish and Game, Blue North Fisheries, the Freezer Longline Coalition, North Pacific Seafoods, and the Norton Sound Fund. We gratefully acknowledge the NOAA Saltonstall Kennedy Program for financial support. Steve Barbeaux, Kirstin Holsman, and two anonymous reviewers provided thoughtful comments on drafts of this manuscript.
CONFLICT OF INTEREST
None declared.
DATA AVAILABILITY STATEMENT
The data that support the findings of this study are available in the Sequence Read Archive (SRA), which is accessible from National Center for Biotechnology Information (NCBI) at http://www.ncbi.nlm.nih.gov/biopr oject/ 558810, BioProject ID PRJNA558810 (Spies et al., 2019).
ORCID
Ingrid Spies https://orcid.org/0000‐0002‐5177‐276X
Kristen M. Gruenthal https://orcid.org/0000‐0002‐1985‐5071
Daniel P. Drinan https://orcid.org/0000‐0002‐4518‐1074
Anne B. Hollowed https://orcid.org/0000‐0002‐4225‐6026
Duane E. Stevenson https://orcid.org/0000‐0003‐0967‐8400
Carolyn M. Tarpey https://orcid.org/0000‐0002‐0478‐2156
Lorenz Hauser https://orcid.org/0000‐0002‐9238‐654X
REFERENCES
Alabia, I. D., García Molinos, J., Saitoh, S. I., Hirawake, T., Hirata, T., & Mueter, F. J. (2018). Distribution shifts of marine taxa in the Pacific Arctic under contemporary climate changes. Diversity and Distributions, 24(11), 1583–1597. https ://doi.org/10.1111/ddi.12788
Alderdice, D. F., & Forrester, C. R. (1971). Effects of salinity, temperature, and dissolved oxygen on early development of the Pacific cod (Gadus macrocephalus). Journal of the Fisheries Research Board of Canada, 28, 883–902.
Anderson, E. C., Waples, R. S., & Kalinowski, S. T. (2008). An improved method for predicting the accuracy of genetic stock identification. Canadian Journal of Fisheries and Aquatic Sciences, 65(7), 1475–1486. https ://doi.org/10.1139/F08‐049
Andrews, S. (2010). FastQC: A quality control tool for high throughput se‐quence data. Retrieved from http://www.bioin forma tics.babra ham.ac.uk/proje cts/fastqc
Bakkala, R. G., Karp, W. A., Walters, G. F., Sasaki, T., Wilson, M. T., Sample, T. M., … Armistead, C. E. (1992). Distribution, abundance, and biological characteristics of groundfish in the eastern Bering Sea based on results of U.S.‐Japan bottom trawl and midwater surveys during June–September 1988. U.S. Dep. Commer., NOAA Tech. Memo. NMFS F/NWC‐213, p. 362.
Bakkala, R. G., Traynor, J. J., Teshima, K., Shimada, A. M., & Yamaguchi, H. (1985). Results of cooperative U.S.‐Japan groundfish investigations in the eastern Bering Sea during June–November 1982. U.S. Dep. Commer., NOAA Tech. Memo. NMFS F/NWC‐87, p. 448.
Barbeaux, S., Aydin, K., Fissel, B., Holsman, K., Palsson, W., Shotwell, K., … Zador, S. (2017). Assessment of the Pacific cod stock in the Gulf of Alaska. Stock assessment and fishery evaluation report for the ground‐fish resources of the Bering Sea/Aleutian Islands regions. Retrieved form https ://www.afsc.noaa.gov/REFM/Stock s/asses sments.htm
Benjamini, Y., & Hochberg, Y. (1995). Controlling the false discovery rate: A practical and powerful approach to multiple testing. Journal of the Royal Statistical Society. Series B, 57(1), 289–300.
Booth, D. J., Bond, N., & Macreadie, P. (2011). Detecting range shifts among Australian fishes in response to climate change. Marine and Freshwater Research, 62(9), 1027–1042. https ://doi.org/10.1071/MF10270
Cadrin, S. X., Kerr, L. A., & Mariani, S. (Eds.), (2013). Stock identification methods: Applications in fishery science (2nd ed., pp. 588). Burlington, MA: Academic Press.
Catchen, J., Hohenlohe, P. A., Bassham, S., Amores, A., & Cresko, W. A. (2013). Stacks: An analysis tool set for population genomics. Molecular Ecology, 22(11), 3124–3140. https ://doi.org/10.1111/mec.12354
Cheung, W. W., Reygondeau, G., & Frölicher, T. L. (2016). Large ben‐efits to marine fisheries of meeting the 1.5 C global warming tar‐get. Science, 354(6319), 1591–1594. https ://doi.org/10.1126/scien ce.aag2331
Do, C., Waples, R. S., Peel, D., Macbeth, G. M., Tillett, B. J., & Ovenden, J. R. (2014). NeEstimator v2: Re‐implementation of software for the estimation of contemporary effective population size (Ne) from ge‐netic data. Molecular Ecology Resources, 14(1), 209–214.
Dodson, J. J. (1988). The nature and role of learning in the orientation and migratory behavior of fishes. Environmental Biology of Fishes, 23(3), 61–182. https ://doi.org/10.1007/BF000 04908
Drinan, D. P., Gruenthal, K. M., Canino, M. F., Lowry, D., Fisher, M. C., & Hauser, L. (2018). Population assignment and local adaptation along an isolation‐by‐distance gradient in Pacific cod (Gadus macrocepha‐lus). Evolutionary Applications, 11(8), 1448–1464.
Duffy‐Anderson, J. T., Stabeno, P. J., Siddon, E. C., Andrews, A. G., Cooper, D. W., Eisner, L. B., … Yasumishii, E. C. (2017). Return of warm condi‐tions in the southeastern Bering Sea: Phytoplankton‐Fish. PLoS ONE, 12(6), e0178955. https ://doi.org/10.1371/journ al.pone.0178955
Erisman, B. E., Allen, L. G., Claisse, J. T., Pondella, D. J., Miller, E. F., & Murray, J. H. (2011). The illusion of plenty: Hyperstability masks collapses in two recreational fisheries that target fish spawning ag‐gregations. Canadian Journal of Fisheries and Aquatic Sciences, 68(10), 1705–1716. https ://doi.org/10.1139/f2011‐090
Fina, M. (2011). Evolution of catch share management: Lessons from catch share management in the North Pacific. Fisheries, 36, 164–177. https ://doi.org/10.1080/03632 415.2011.564509
Foll, M., & Gaggiotti, O. E. (2008). A genome scan method to identify selected loci appropriate for both dominant and codominant mark‐ers: A Bayesian perspective. Genetics, 180, 977–993. https ://doi.org/10.1534/genet ics.108.092221
Goddard, P., & Zimmermann, M. (1993). Distribution, abundance, and bi‐ological characteristics of groundfish in the eastern Bering Sea based on

374 | SPIES Et al.
results of the U.S. bottom trawl survey during June–September 1991. AFSC Processed Rep. 93‐15, p. 324.
Goudet, J. (2005). Hierfstat, a package for R to compute and test hier‐archical F‐statistics. Molecular Ecology Notes, 5(1), 184–186. https ://doi.org/10.1111/j.1471‐8286.2004.00828.x
Grebmeier, J. M., Overland, J. E., Moore, S. E., Farley, E. V., Carmack, E. C., Cooper, L. W., … McNutt, S. L. (2006). A major ecosystem shift in the northern Bering Sea. Science, 311(5766), 1461–1464. https ://doi.org/10.1126/scien ce.1121365
Hollowed, A. B., Planque, B., & Loeng, H. (2013). Potential movement of fish and shellfish stocks from the sub‐Arctic to the Arctic Ocean. Fisheries Oceanography, 22(5), 355–370. https ://doi.org/10.1111/fog.12027
Hurst, T. P., Cooper, D. W., Scheingross, J. S., Seale, E. M., Laurel, B. J., & Spencer, M. L. (2009). Effects of ontogeny, temperature, and light on vertical movements of larval Pacific cod (Gadus macrocephalus). Fisheries Oceanography, 18(5), 301–311.
Jasonowicz, A. J., Goetz, F. W., Goetz, G. W., & Nichols, K. M. (2016). Love the one you're with: Genomic evidence of panmixia in the sa‐blefish (Anoplopoma fimbria). Canadian Journal of Fisheries and Aquatic Sciences, 74(3), 377–387.
Jombart, T., & Ahmed, I. (2011). adegenet 1.3‐1: New tools for the anal‐ysis of genome‐wide SNP data. Bioinformatics, 27(21), 3070–3071. https ://doi.org/10.1093/bioin forma tics/btr521
Karp, M. A., Peterson, J. O., Lynch, P. D., Griffis, R. B., Adams, C. F., Arnold, W. S., … Link, J. S. (2019). Accounting for shifting distribu‐tions and changing productivity in the development of scientific ad‐vice for fishery management. ICES Journal of Marine Science, 76(5), 1305–1315. https ://doi.org/10.1093/icesj ms/fsz048
Kawecki, T. J. (2008). Adaptation to marginal habitats. Annual Review of Ecology, Evolution, and Systematics, 39, 321–342
Keenan, K., McGinnity, P., Cross, T. F., Crozier, W. W., & Prodöhl, P. A. (2013). diveRsity: An R package for the estimation of population ge‐netics parameters and their associated errors. Methods in Ecology and Evolution, 4(8), 782–788.
Kirkpatrick, M., & Barton, N. H. (1997). Evolution of a species' range. The American Naturalist, 150(1), 1–23.
Langmead, B., & Salzberg, S. L. (2012). Fast gapped‐read alignment with Bowtie 2. Nature Methods, 9(4), 357. https ://doi.org/10.1038/nmeth.1923
Lawrence, M., Huber, W., Pages, H., Aboyoun, P., Carlson, M., Gentleman, R., … Carey, V. J. (2013). Software for computing and annotating ge‐nomic ranges. PLoS Computational Biology, 9(8), e1003118. https ://doi.org/10.1371/journ al.pcbi.1003118
MacCall, A. D. (1990). Dynamic geography of marine fish populations. Washington Sea Grant Program (p. 200). Seattle, WA: University of Washington Press.
Marandel, F., Lorance, P., Berthelé, O., Trenkel, V. M., Waples, R. S., & Lamy, J. B. (2019). Estimating effective population size of large ma‐rine populations, is it feasible? Fish and Fisheries, 20(1), 189–198. https ://doi.org/10.1111/faf.12338
Moran, B. M., & Anderson, E. C. (2019). Bayesian inference from the conditional genetic stock identification model. Canadian Journal of Fisheries and Aquatic Sciences, 76(4), 551–560. https ://doi.org/10.1139/cjfas‐2018‐0016
Neidetcher, S. K., Hurst, T. P., Ciannelli, L., & Logerwell, E. A. (2014). Spawning phenology and geography of Aleutian Islands and east‐ern Bering Sea Pacific cod (Gadus macrocephalus). Deep Sea Research Part II: Topical Studies in Oceanography, 109, 204–214. https ://doi.org/10.1016/j.dsr2.2013.12.006
Neuenhoff, R. D., Swain, D. P., Cox, S. P., McAllister, M. K., Trites, A. W., Walters, C. J., & Hammill, M. O. (2018). Continued decline of a collapsed population of Atlantic cod (Gadus morhua) due to preda‐tion‐driven Allee effects. Canadian Journal of Fisheries and Aquatic Sciences, 76(1), 168–184.
Ono, K., Haynie, A. C., Hollowed, A. B., Ianelli, J. N., McGilliard, C. R., & Punt, A. E. (2017). Management strategy analysis for multispe‐cies fisheries, including technical interactions and human behavior in modelling management decisions and fishing. Canadian Journal of Fisheries and Aquatic Sciences, 75(8), 1185–1202. https ://doi.org/10.1139/cjfas‐2017‐0135
Paradis, E. (2010). pegas: An R package for population genetics with an integrated‐modular approach. Bioinformatics, 26, 419–420. https ://doi.org/10.1093/bioin forma tics/btp696
Pembleton, L. W., Cogan, N. O., & Forster, J. W. (2013). StAMPP: An R package for calculation of genetic differentiation and structure of mixed‐ploidy level populations. Molecular Ecology Resources, 13(5), 946–952. https ://doi.org/10.1111/1755‐0998.12129
Pinsky, M. L., Reygondeau, G., Caddell, R., Palacios‐Abrantes, J., Spijkers, J., & Cheung, W. W. (2018). Preparing ocean governance for species on the move. Science, 360(6394), 1189–1191. https ://doi.org/10.1126/scien ce.aat2360
Pinsky, M. L., Worm, B., Fogarty, M. J., Sarmiento, J. L., & Levin, S. A. (2013). Marine taxa track local climate velocities. Science, 341(6151), 1239–1242. https ://doi.org/10.1126/scien ce.1239352
Purcell, S., Neale, B., Todd‐Brown, K., Thomas, L., Ferreira, M. A., Bender, D., … Sham, P. C. (2007). PLINK: a tool set for whole‐genome associ‐ation and population‐based linkage analyses. The American journal of human genetics, 81(3), 559–575.
Rose, G. A., & Kulka, D. W. (1999). Hyperaggregation of fish and fisher‐ies: How catch‐per‐unit‐effort increased as the northern cod (Gadus morhua) declined. Canadian Journal of Fisheries and Aquatic Sciences, 56(S1), 118–127.
Rousset, F. (2008). Genepop'007: A complete re‐implementation of the genepop software for Windows and Linux. Molecular Ecology Resources, 8(1), 103–106. https ://doi.org/10.1111/j.1471‐8286.2007. 01931.x
Ryman, N., Palm, S., André, C., Carvalho, G. R., Dahlgren, T. G., Jorde, P. E., … Ruzzante, D. E. (2006). Power for detecting ge‐netic divergence: Differences between statistical methods and marker loci. Molecular Ecology, 15(8), 2031–2045. https ://doi.org/10.1111/j.1365‐294X.2006.02839.x
Sample, T. M., & Wolotira, R. J. (1985). Demersal fish and shellfish resources of Norton Sound and adjacent waters during 1979. U.S. Department of Commerce, NOAA Technical Memorandum NMFS F/NWC‐89, p. 208.
Schmidt, J. O., Bograd, S. J., Arrizabalaga, H., et al. (2019). Future ocean observations to connect climate, fisheries and marine ecosystems. Frontiers in Marine Science, 6, 550.
Sexton, J. P., Hufford, M. B., C.Bateman, A., Lowry, D. B., Meimberg, H., Strauss, S. Y., & Rice, K. J. (2016). Climate structures genetic varia‐tion across a species' elevation range: A test of range limits hypoth‐eses. Molecular Ecology, 25(4), 911–928. https ://doi.org/10.1111/mec.13528
Shimada, A., & Kimura, D. (1994). Seasonal movements of Pacific cod Gadus macrocephalus in the eastern Bering Sea and adjacent waters based on tag‐recapture data. Fishery Bulletin, 92, 800–816.
Siddon, E., & Zador, S. (2018). Ecosystem status report 2018: Eastern Bering Sea, stock assessment and fishery evaluation report. Anchorage, AK: North Pacific Fishery Management Council.
Sigler, M. F., Napp, J. M., Stabeno, P. J., Heintz, R. A., Lomas, M. W., & Hunt, G. L. (2016). Variation in annual production of copepods, eu‐phausiids, and juvenile walleye pollock in the southeastern Bering Sea. Deep‐sea Research Part II: Topical Studies in Oceanography, 134, 223–234. https ://doi.org/10.1016/j.dsr2.2016.01.003
Spies, I., Gruenthal, K. M., Drinan, D. P., Hollowed, A. B., Stevenson, D. E., Tarpey, C. M., & Hauser, L. (2019). Northward shift of eastern Bering Sea Pacific cod, July 24, 2019. Bethesda, MD: National Center for Biotechnology Information (NCBI). PRJNA558810. Retrieved from https ://www.ncbi.nlm.nih.gov/sra/PRJNA 558810

| 375SPIES Et al.
Stabeno, P., Bell, S., Bond, N., Kimmel, D., Mordy, C., & Sullivan, M. (2018). Distributed Biological Observatory Region 1: Physics, chem‐istry and plankton in the northern Bering Sea. Deep Sea Research Part II: Topical Studies in Oceanography, 1, 8–21. https ://doi.org/10.1016/j.dsr2.2018.11.006
Stabeno, P. J., Danielson, S. L., Kachel, D. G., Kachel, N. B., & Mordy, C. W. (2016). Currents and transport on the eastern Bering Sea shelf: An integration of over 20 years of data. Deep Sea Research Part II: Topical Studies in Oceanography, 134, 13–29. https ://doi.org/10.1016/j.dsr2.2016.05.010
Stabeno, P. J., Duffy‐Anderson, J. T., Eisner, L. B., Farley, E. V., Heintz, R. A., & Mordy, C. W. (2017). Return of warm conditions in the southeastern Bering Sea: Physics to fluorescence. PLoS ONE, 12(9), e0185464.
Stabeno, P. J., Kachel, N. B., Moore, S. E., Napp, J. M., Sigler, M., Yamaguchi, A., & Zerbini, A. N. (2012). Comparison of warm and cold years on the southeastern Bering Sea shelf and some implications for the ecosys‐tem. Deep‐sea Research Part II: Topical Studies in Oceanography, 65, 31–45. https ://doi.org/10.1016/j.dsr2.2012.02.020
Stevenson, D. E., & Lauth, R. R. (2012). Latitudinal trends and tempo‐ral shifts in the catch composition of bottom trawls conducted on the eastern Bering Sea shelf. Deep Sea Research Part II: Topical Studies in Oceanography, 70, 251–259. https ://doi.org/10.1016/j.dsr2.2012.02.021
Stevenson, D. E., & Lauth, R. R. (2019). Bottom trawl surveys in the northern Bering Sea indicate recent shifts in the distribution of ma‐rine species. Polar Biology, 42, 407–421. https ://doi.org/10.1007/s00300‐018‐2431‐1
Stram, D. L., & Evans, D. C. K. (2009). Fishery management responses to climate change in the North Pacific. ICES Journal of Marine Science, 66(7), 1633–1639. https ://doi.org/10.1093/icesj ms/fsp138
Sunday, J. M., Bates, A. E., & Dulvy, N. K. (2012). Thermal tolerance and the global redistribution of animals. Nature Climate Change, 2(9), 686.
Thompson, G. (2018). Assessment of the Pacific cod stock in the east‐ern Bering Sea. Stock assessment and fishery evaluation report for the groundfish resources of the Bering Sea/Aleutian Islands regions. Retrieved from https ://www.afsc.noaa.gov/REFM/Stock s/asses sments.htm
Tørresen, O. K., Star, B., Jentoft, S., Reinar, W. B., Grove, H., Miller, J. R., … Nederbragt, A. J. (2017). An improved genome assembly uncovers
prolific tandem repeats in Atlantic cod. BMC Genomics, 18(1), 95. https ://doi.org/10.1186/s12864‐016‐3448‐x
Walters, G. E., Teshima, K., Traynor, J. J., Bakkala, R. G., Sassano, J. A., Halliday, K. L., … Smith, D. M. (1988). Distribution, abundance, and bi‐ological characteristics of groundfish in the eastern Bering Sea based on results of the U.S.‐Japan triennial bottom trawl and hydroacoustic sur‐veys during May‐September, 1985. U.S. Dep. Commer., NOAA Tech. Memo. NMFS F/NWC‐154, p. 401.
Weir, B. S., & Cockerham, C. C. (1984). Estimating F‐statistics for the analysis of population structure. Evolution, 38(6), 1358–1370.
Whitlock, M. C., & Lotterhos, K. E. (2015). Reliable detection of loci responsible for local adaptation: Inference of a null model through trimming the distribution of FST. The American Naturalist, 186(S1), S24–S36.
Wolotira, R. J. Jr, Sample, T. M., & Morin, M. Jr (1977). Demersal fish and shellfish resources of Norton Sound, the southeastern Chukchi Sea, and adjacent waters in the baseline year 1976. NWAFC Processed Rep. (p. 69). Seattle, WA: Northwest and Alaska Fisheries Center, National Marine Fisheries Service, NOAA.
Wolotira, R. J. Jr, Sample, T. M., Noel, S. F., & Iten, C. R. (1993). Geographic and bathymetric distributions for many commercially important fishes and shellfishes off the west coast of North America, based on research survey and commercial catch data, 1912‐84. U.S. Dep. Commer., NOAA Tech. Memo. NMFS‐AFSC‐6, p. 184.
SUPPORTING INFORMATION
Additional supporting information may be found online in the Supporting Information section at the end of the article.
How to cite this article: Spies I, Gruenthal KM, Drinan DP, et al. Genetic evidence of a northward range expansion in the eastern Bering Sea stock of Pacific cod. Evol Appl. 2020;13: 362–375. https ://doi.org/10.1111/eva.12874