Diversity, Distribution, and Ancient Taxonomic Relationships Within the TIR and Non-TIR NBS-LRR...
15
Diversity, Distribution, and Ancient Taxonomic Relationships Within the TIR and Non-TIR NBS-LRR Resistance Gene Subfamilies Steven B. Cannon, 1 Hongyan Zhu, 4 Andrew M. Baumgarten, 1 Russell Spangler, 3 Georgiana May, 1,3 Douglas R. Cook, 5 Nevin D. Young 1,2 1 Department of Plant Biology, University of Minnesota, St. Paul, MN 55108, USA 2 Department of Plant Pathology, University of Minnesota, St. Paul, MN 55108, USA 3 Department of Ecology, Evolution, and Behavior, University of Minnesota, St. Paul, MN 55108, USA 4 Graduate Program in Genetics, Texas A&M University, College Station, TX 77843, USA 5 Department of Plant Pathology, University of California, Davis, Davis, CA 95616, USA Received: 13 June 2001 / Accepted: 22 October 2001 Abstract. Phylogenetic relationships among the NBS- LRR (nucleotide binding site–leucine-rich repeat) resis- tance gene homologues (RGHs) from 30 genera and nine families were evaluated relative to phylogenies for these taxa. More than 800 NBS-LRR RGHs were analyzed, primarily from Fabaceae, Brassicaceae, Poaceae, and So- lanaceae species, but also from representatives of other angiosperm and gymnosperm families. Parsimony, maxi- mum likelihood, and distance methods were used to clas- sify these RGHs relative to previously observed gene subfamilies as well as within more closely related se- quence clades. Grouping sequences using a distance cut- off of 250 PAM units (point accepted mutations per 100 residues) identified at least five ancient sequence clades with representatives from several plant families: the pre- viously observed TIR gene subfamily and a minimum of four deep splits within the non-TIR gene subfamily. The deep splits in the non-TIR subfamily are also reflected in comparisons of amino acid substitution rates in various species and in ratios of nonsynonymous-to-synonymous nucleotide substitution rates (K A /K S values) in Arabidop- sis thaliana. Lower K A /K S values in the TIR than the non-TIR sequences suggest greater functional constraints in the TIR subfamily. At least three of the five identified ancient clades appear to predate the angiosperm– gymnosperm radiation. Monocot sequences are absent from the TIR subfamily, as observed in previous studies. In both subfamilies, clades with sequences separated by approximately 150 PAM units are family but not genus specific, providing a rough measure of minimum dates for the first diversification event within these clades. Within any one clade, particular taxa may be dramati- cally over- or underrepresented, suggesting preferential expansions or losses of certain RGH types within par- ticular taxa and suggesting that no one species will pro- vide models for all major sequence types in other taxa. Key words: NBS-LRR disease resistance gene — Multigene families — Protein sequence evolution — Glycine max — Medicago truncatula — Birth and death model Introduction The nucleotide binding site–leucine-rich repeat (NBS- LRR) gene family contains the majority of plant disease resistance genes (R genes) identified to date (reviewed by Baker et al. 1997; Bent 1996; Hammond-Kosack and Jones 1997; Staskawicz et al. 1995). R gene homologues (RGHs) are abundant in plants. Approximately 161, for example, are present in the Arabidopsis thaliana genome Correspondence to: Steven Cannon; email: [email protected] J Mol Evol (2002) 54:548–562 DOI: 10.1007/s0023901-0057-2 © Springer-Verlag New York Inc. 2002
Transcript of Diversity, Distribution, and Ancient Taxonomic Relationships Within the TIR and Non-TIR NBS-LRR...

Diversity, Distribution, and Ancient Taxonomic Relationships Within theTIR and Non-TIR NBS-LRR Resistance Gene Subfamilies
Steven B. Cannon,1 Hongyan Zhu,4 Andrew M. Baumgarten,1 Russell Spangler,3 Georgiana May,1,3
Douglas R. Cook,5 Nevin D. Young1,2
1 Department of Plant Biology, University of Minnesota, St. Paul, MN 55108, USA2 Department of Plant Pathology, University of Minnesota, St. Paul, MN 55108, USA3 Department of Ecology, Evolution, and Behavior, University of Minnesota, St. Paul, MN 55108, USA4 Graduate Program in Genetics, Texas A&M University, College Station, TX 77843, USA5 Department of Plant Pathology, University of California, Davis, Davis, CA 95616, USA
Received: 13 June 2001 / Accepted: 22 October 2001
Abstract. Phylogenetic relationships among the NBS-LRR (nucleotide binding site–leucine-rich repeat) resis-tance gene homologues (RGHs) from 30 genera and ninefamilies were evaluated relative to phylogenies for thesetaxa. More than 800 NBS-LRR RGHs were analyzed,primarily from Fabaceae, Brassicaceae, Poaceae, and So-lanaceae species, but also from representatives of otherangiosperm and gymnosperm families. Parsimony, maxi-mum likelihood, and distance methods were used to clas-sify these RGHs relative to previously observed genesubfamilies as well as within more closely related se-quence clades. Grouping sequences using a distance cut-off of 250 PAM units (point accepted mutations per 100residues) identified at least five ancient sequence cladeswith representatives from several plant families: the pre-viously observed TIR gene subfamily and a minimum offour deep splits within the non-TIR gene subfamily. Thedeep splits in the non-TIR subfamily are also reflected incomparisons of amino acid substitution rates in variousspecies and in ratios of nonsynonymous-to-synonymousnucleotide substitution rates (KA/KS values) in Arabidop-sis thaliana. Lower KA/KS values in the TIR than thenon-TIR sequences suggest greater functional constraintsin the TIR subfamily. At least three of the five identifiedancient clades appear to predate the angiosperm–
gymnosperm radiation. Monocot sequences are absentfrom the TIR subfamily, as observed in previous studies.In both subfamilies, clades with sequences separated byapproximately 150 PAM units are family but not genusspecific, providing a rough measure of minimum datesfor the first diversification event within these clades.Within any one clade, particular taxa may be dramati-cally over- or underrepresented, suggesting preferentialexpansions or losses of certain RGH types within par-ticular taxa and suggesting that no one species will pro-vide models for all major sequence types in other taxa.
Key words: NBS-LRR disease resistance gene —Multigene families — Protein sequence evolution —Glycine max — Medicago truncatula — Birth and deathmodel
Introduction
The nucleotide binding site–leucine-rich repeat (NBS-LRR) gene family contains the majority of plant diseaseresistance genes (R genes) identified to date (reviewedby Baker et al. 1997; Bent 1996; Hammond-Kosack andJones 1997; Staskawicz et al. 1995). R gene homologues(RGHs) are abundant in plants. Approximately 161, forexample, are present in the Arabidopsis thaliana genomeCorrespondence to: Steven Cannon; email: [email protected]
J Mol Evol (2002) 54:548–562DOI: 10.1007/s0023901-0057-2
© Springer-Verlag New York Inc. 2002

(the Functional and Comparative Genomics of DiseaseResistance Gene Homologs database; http://niblrrs.ucdavis.edu/). The evolution and maintenance of suchlarge numbers of genes in this agronomically importantmultigene family are of interest for both theoretical andpractical reasons. Do all gene lineages in this diversegene family show similar evolutionary histories? Whatlevels of RGH sequence homology are found betweenincreasingly distant plant lineages? How have particulargroups of paralogues expanded or contracted in variousplant taxa? To what extent can orthology be determinedin this gene family? These questions are made more dif-ficult in a gene family comprised of hundreds of par-alogues in many plant species (Meyers et al. 1999;Young 2000; Pan et al. 2000a). This study addressesthese questions and focuses particularly on the evolution-ary histories of RGHs in 11 species in Fabaceae.
NBS-LRR gene products are characterized by a vari-able N-terminal domain of approximately 200 amino ac-ids, followed by a putative nucleotide binding site do-main of approximately 300 amino acids (Traut 1994)and, finally, by a more variable tandem array of approxi-mately 10 to 40 short LRR motifs (Kajava 1998; Jonesand Jones 1997). The NBS-LRR gene family has beensubdivided into two broad subfamilies, based on a groupof motifs within and N-terminal to the NBS (reviewed byMeyers et al. 1999; Pan et al. 2000a; Young 2000). In theTIR (Toll–Interleukin receptor-like regions) subfamily,the approximately 200 amino acid residues N-terminal tothe NBS domain are similar to the Drosophila Toll andmammalian Interleukin receptor-like regions (Qureshi etal. 1999). In the non-TIR subfamily, the correspondingN-terminal domain generally has a coiled-coil (CC) orleucine zipper (LZ) structure (Pan et al. 2000a; Lupas1996; Baker et al. 1997). The NBS is also called theNBD (nucleotide binding domain) or NB-ARC domain(ARC after the mammalian Apaf-1 R protein and Ced-4domains) (Traut 1994; Li et al. 1997; van der Biezen etal. 2000). The NBS domain is believed to participate insignal transduction (van der Biezen et al. 2000), whilethe LRR domain appears to be responsible primarily forelicitor recognition (Jones and Jones 1997).
Using conserved motifs within the NBS domain, de-generate PCR primers have been designed to amplify,clone, and sequence RGHs from a wide variety of plantspecies (e.g., Leister et al. 1996; Kanazin et al. 1996; Yuet al. 1996). This approach, together with genomic andEST projects, has generated more than 1000 RGHs thatspan at least part of the NBS domain. RGHs come fromdiverse taxa, offering an opportunity to examine the evo-lution of this gene family (Meyers et al. 1999; Young2000; Richter and Ronald 2000; Pan et al. 2000a).
Although the TIR and non-TIR sequence subfamiliesare ancient in origin (Meyers et al. 1999; Pan et al.2000b), evolutionary relationships predating the radia-tion of modern plant families have been difficult to dis-
cern in RGH data. To resolve early phylogenetic patternspredating radiation into modern plant families, we used avariety of methods, using as much of the gene length aswas practical for phylogenetic analysis. Protein distancemeasures were used to associate larger numbers of RGHsequences with phylogenetic trees than would have beenfeasible using more computationally intensive phyloge-netic methods. We also examined sequences from Faba-ceae in detail, classifying RGHs from eight legume gen-era in the Papillionid subfamily. We used degeneratePCR primers and targeted cloning efforts to retrieve se-quences not previously observed in soybean (Glycinemax) or in the model legume Medicago truncatula andevaluated the distribution of sequence types in these spe-cies. We examined the evolutionary dynamics of thislarge and apparently rapidly evolving gene family in re-lation to plant systematic relationships. Dramatically dif-fering counts of RGHs from various plant lineages withsimilar times of origin suggest frequent expansions, con-tractions, or extinctions of lineages of sequence types.This analysis also suggests the potential and limits forthe use of resistance genes from one plant family to serveas sequence-based models for RGHs in other families.
Methods
Overview
NBS-LRR RGH sequences were collected and analyzed using severalmethods, with different objectives (Fig. 1). Sequences were gatheredfrom nucleotide and protein databases using both BLAST and a hiddenMarkov model (HMM) search method. Additional data were generatedusing PCR amplification with degenerate primers in Medicago trun-catula and Glycine max. An analysis of the complete set of these genesin Arabidopsis was also carried out. The HMM search was made on theGenBank protein NR database, with the primary purpose of generatinga high-quality “scaffold” alignment of diverse plant sequences, towhich a larger number of partial-length sequences could be aligned andgiven distance scores. The scaffold alignment was used to calculateclade-specific consensus sequences (Fig. 2) and a multitaxon phyloge-netic tree illustrating major clades in this gene family (Fig. 3). TheBLAST search and PCR work focused on a smaller portion of the NBSdomain, with the primary purpose of examining relationships among alarger set of genes from species at different nested taxonomic levels(Figs. 4A and B). Because of the size of this data set (more than 380sequences), the phylogenetic analysis was carried out in two steps: first,a distance-based tree was used to choose representative sequences formore rigorous analysis; and, second, parsimony and maximum likeli-hood methods were used on the selected subset. Although this phylo-genetic analysis does place a large number of sequences into an evo-lutionary context, many other RGH sequences spanning differentportions of the gene are available, primarily from degenerate amplifi-cation using conserved primer regions and from EST projects. To helpclassify these, sequences were screened for redundancy, and alignedand scored relative to the scaffold alignment, to produce counts of 600RGH sequences by taxon and clade (Table 1). Finally, full-length Ara-bidopsis RGH protein sequences were used to make alignments, whichwere then used to make codon-based nucleotide alignments and tocalculate rates of synonymous and nonsynonymous substitutions. ThisArabidopsis information, together with branch length statistics from the
549

other trees in the study, was used to evaluate evolutionary rate differ-ences in the TIR and non-TIR subfamilies.
Sequence selection and alignment for sequences retrieved usingBLAST searches and PCR amplification TBLASTN (Altschul et al.1997) were used to query the GenBank NR and the TIGR soybean,Medicago truncatula, corn, rice, tomato, and Arabidopsis thaliana geneindices in September 2000. Twenty R genes and RGHs, representingdiverse TIR and non-TIR sequence types, were chosen from previouslypublished gene trees (Meyers et al. 1999; Pan et al. 2000a) and used asBLAST queries. Sequences retrieved using BLAST were trimmed tostart and end at the P-loop and GLPL motifs to facilitate accuratealignments [see Figs. 1 and 2 and Meyers et al. (1999) for motifdescriptions]. PCR-generated sequences for this region were added tothe data set. RGHs were cloned and sequenced from Medicago trun-catula genotype Jemalong A17 and from Glycine max cv. Faribaultusing degenerate primers, as described by Zhu et al. (submitted). Se-quences were submitted under GenBank accession numbersAZ773476–AZ773519 (Medicago) and AZ773513–AZ773514 (Gly-cine). Trimmed sequences were used to produce HMMs and alignmentsfor subsequent alignment of the TIR and non-TIR sequences using
HMMPro (NetID.com; Baldi et al. 1994). Indel sites and the P-loop andGLPL primer regions were excluded from the phylogenetic analysis, toavoid bias introduced by primer regions. Alignments are available inSupplementary Materials.
Sequence Selection and Alignment for SequencesRetrieved Using HMM Searches
The HMM-based search was carried out in November 2000, using theNicotiana N (TIR) and the tomato I2 (non-TIR) R genes as initial seedsto build two HMMs using the SAM-T99 database search (Park et al.1998; Karplus et al. 1998). The first 1000 positions of these genes wereused for the search. This covers the majority of the length of NBS-LRRgenes, which range from about 800 to 2000 amino acids in Arabidopsis,with an average of length of 992 for RGH genes listed in http://niblrrs.ucdavis.edu/. Residues missed from the C-terminal end of longRGH genes come from the LRR, which is inherently difficult to alignbecause of the imperfect repeats in this domain. The initial BLAST
Fig. 1. Data and methods used in this study. Top: NBS-LRR domain organization, conserved motifs, and regions used for analysis in this paper.Motifs shown are those that are commonly used for PCR amplification within the NBS domain (e.g., Leister et al. 1996; Kanazin et al. 1996; Yuet al. 1996). Motif names are according to Meyers et al. (1999). Bottom: Data sets, goals, processes, and outcomes of the analyses.
550
cutoff for the search was 0.001, although most of the hits were subse-quently filtered out according to the following more stringent criteria.Sequences from these searches were evaluated for length and extent ofmatch to the model and retrieved sequences were considered in twogroups. First, a “scaffold” set was chosen that spanned the majority ofthe 1000 position HMM (members were required to match at least 75%of the positions in each of the second, third, fourth, and fifth blocks of100 hundred amino acid match states in the model). Insertion-state siteswere removed and then the first 1000 positions from the resultingmodels were aligned relative to one another using the “profiles” align-ment option of ClustalX (Thompson et al. 1997). These sequences were
used to calculate a consensus alignment (Fig. 2) and phylogenetic tree(Fig. 3). Second, to classify shorter sequences relative to the scaffoldsequences (Table 1), the criteria for inclusion were that the sequences(1) matched at least 100 positions in the 1000-position models, (2)matched at least 50 positions in the core NBS domain (within the thirdand fourth 100 positions of the model), and (3) were no more than 250point accepted mutation (PAM) units from at least one sequence in thescaffold group (which itself had members as distant as 470 PAM unitsfrom one another). Two hundred fifty PAM units represents an averageof 2.50 expected amino acid changes per amino acid site, allowing forreversals (Dayhoff 1979).
Fig. 2. Subfamily- and clade-specific consensus sequences for the TIR and non-TIR NBS-LRR RGHs. Sequences cover the entire NBS domain,as defined in the Pfam hidden Markov model for NB-ARC sequences (http://pfam.wustl.edu/cgi-bin/getdesc?name�NB-ARC). Sequences werealigned using a hidden Markov model, by the T-99 UCSC SAM database and alignment server. Indel sites have been removed. Amino acid residuesare shown wherever more than 60% of the residues at that site were identical across all sequences in the included sequence set. Other symbolsindicate when at least 60% of the residues at a site are aromatic, aliphatic, hydrophobic, or positively or negatively charged. Conserved motifs arethose identified by Meyers et al. (1999). Sequences included in each consensus set matched at least 300 amino acids of a hidden Markov modelthat spans the 400 amino acids in the NBS domain.
551
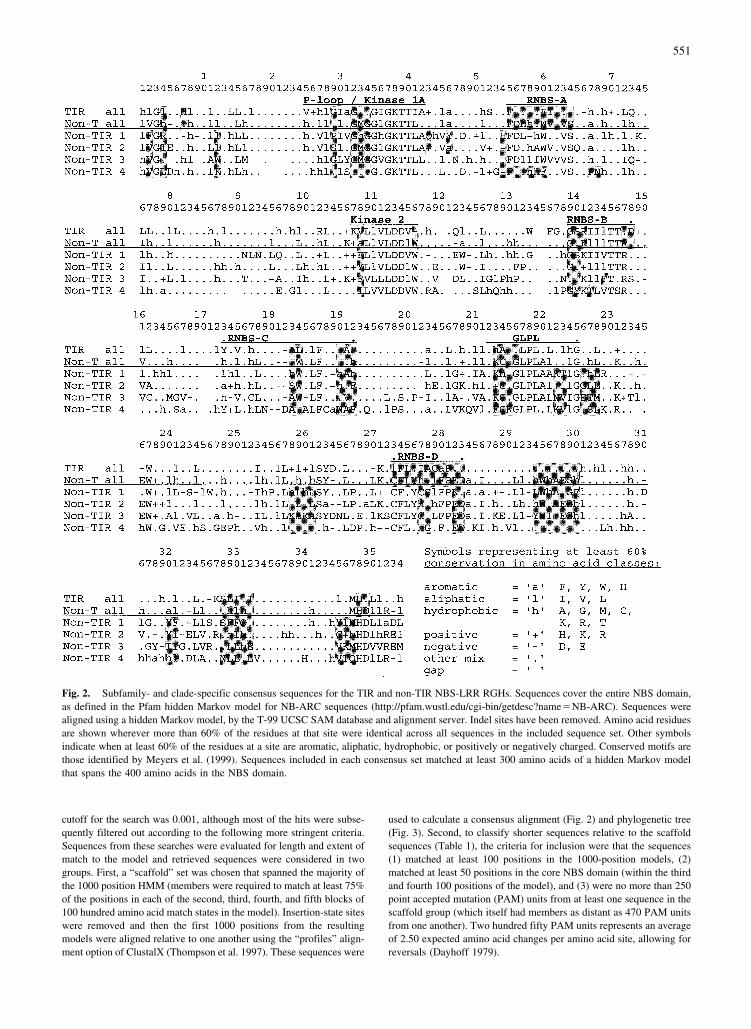
Fig. 3. Maximum parsimony tree with maximum likelihood branch length calculations, based on 400 amino acid positions spanning the NBSdomain. Sequences were gathered using the SAM-T99 hidden Markov model alignment and database search tool. Distances are in PAM units, ascalculated by the Puzzle program (Strimmer and von Haesler 1999), based on a maximum parsimony topology calculated using ProtPars in Phylip(Felsenstein 2000). Bootstrap values are the percentage of 1000 neighbor joining bootstrap replicates. Bootstrap values at or above 70% are shown.Bootstrap values in parentheses are for a similar tree without inclusion of the partial-length pine sequences in the respective subtrees. Bars on theright represent multifamily clades discussed in the text. Counts are numbers of sequences from the indicated plant taxa. Counts for Fabaceae* areprimarily from Medicago and Glycine, and counts for Brassicaceae* are primarily from Arabidopsis. See Table 1 for family and genus names anddetailed counts by clade.
552

Fig. 4. Maximum parsimony tree with maximum likelihood branch length calculations for NBS domains (between the P-loop and the GLPLmotifs) from representative sequences and most available legume RGHs. A Non-TIR sequences. B TIR sequences. The maximum parsimony treewas calculated using ProtPars in Phylip (Felsenstein 2000), with branch lengths calculated using maximum likelihood [Tree-Puzzle program(Strimmer and von Haeseler 1999)]. Bootstrap values are the percentage of 1000 neighbor joining bootstrap replicates. Bootstrap values at or above68% are shown. Bars on the right represent multifamily and legume-specific clades discussed in the text. Counts are numbers of legume sequencesfrom Glycine, Medicago, and other legume genera, by sequence clade. Where counts are higher than in the figure, additional sequences have beenidentified in these clades on the basis of distance scores using regions other than the P-loop–GLPL region used here. The complete list of sequencesis available in Supplementary Materials.
553

Analysis of Sequences Retrieved Using BLAST andPCR Amplification
Initially, a neighbor joining (NJ) tree was constructed using approxi-mately 600 amino acid sequences from BLAST spanning the core NBSdomain. ClustalX (Thompson et al. 1997) was used to produce the
alignment, with the gap opening penalty set at 10 and the gap extensionpenalty set at 0.10, and the Gonnet 250 protein weight matrix. Thealignment was used to produce a NJ tree (without further distancecorrection), which was in turn used to refine the initial alignment andthen to produce a final NJ tree. The resulting tree was used to identifyall sequences as part of the TIR or non-TIR clade and to help excludenearly identical sequences from later analyses. TIR and non-TIR se-
554

quences were then analyzed separately, but each was rooted by usingone sequence from the other subfamily (e.g., a non-TIR sequence toroot the TIR sequences, and vice versa) as an outgroup. For each set ofsequences, we used ProtDist in the Phylip package (Felsenstein 2000)to calculate pairwise protein distances using PAM matrices appropriatefor the approximate level of divergence of each protein pair. Between-site rate heterogeneity was allowed (with a coefficient of variation of0.5), and missing characters were excluded from the distance calcula-tions. These pairwise distances were used to produce Fitch–Margoliash(1967) trees, using the Fitch program in the Phylip package. This treeis available in Supplementary Materials.
To reduce this large data set to a smaller set for parsimony andmaximum likelihood analysis (Fig. 4), we chose representatives ofclades from the Fitch–Margoliash trees. We also included all availablelegume sequences that spanned the NBS domain to evaluate phyloge-netic relationships in detail for sequences from Fabaceae, includingthose harvested using PCR amplification. The TIR and non-TIR align-ments were then used in maximum parsimony searches, using the Phy-lip program ProtPars. One of two most-parsimonious trees was arbi-trarily chosen from the TIR set, and one of four most-parsimonioustrees was chosen from the non-TIR set. The TIR and non-TIR tree fileswere combined (by replacing the respective TIR and non-TIR out-groups with the other data set) and used as a topology for maximumlikelihood branch length calculation using the Tree-Puzzle program,version 4.02 (Strimmer and von Haeseler, 1999). Settings for Tree-Puzzle were as follows: the Dayhoff (1979) model was used for aminoacid substitution probabilities; amino acid frequencies were estimatedfrom the data set; and rate heterogeneity was allowed, with gamma-distributed rates in four rate categories and a gamma distribution pa-rameter estimated from the data set. Bootstrap support was calculatedusing PAUP*, from the consensus of 1000 NJ trees based on randomsamples from the original data set (Swofford 2000).
Phylogenetic Analysis and Statistics for SequencesRetrieved Using HMM Searches
Phylogenetic analysis for sequences from the SAM-T99 search alsobegan with the selection of a set of “scaffold sequences.” These weretrimmed to include 400 match state positions from the longer HMMdescribed above. The TIR and non-TIR sequences, which had beenharvested using separate HMMs, were aligned relative to one anotherusing the “profile alignment” option in ClustalX. We added the trans-lated pine EST sequences Gi9993033 (Pinus taeda), AU084895 (Cryp-tomeria japonica), Gi2708523 (Pinus radiata), and Gi10191935 (Pinustaeda) to the alignment. These taxa were not identified by the HMMsearch of the GenBank protein database. Inclusion of these sequencesdoes not substantially affect the topology of the tree, and they wereincluded in the analysis only to test the placement of these examples ofgymnosperm RGHs. Parsimony computations were carried out sepa-rately on the TIR and non-TIR sequences, as described above. Maxi-mum likelihood branch lengths for one of each of the most-parsimonious TIR and non-TIR trees were calculated using Tree-Puzzle (same settings as described in the previous section). Bootstrapsupport was calculated using NJ trees based on 1000 bootstrap samples,with and without the partial-length pine sequences (Fig. 3).
Consensus Sequences
Consensus sequences were calculated for the 400-amino acid models(described above), for the TIR and non-TIR sequences, and for multi-family non-TIR clades using the Consensus program (http://www.bork.embl-heidelberg.de:8088/Alignment/consensus.html). Theoutput of the program (Fig. 2) shows consensus amino acids for modelT
able
1.C
ount
sof
NB
S-L
RR
RG
Hs
byfa
mily
,ge
nus,
and
clad
ea
Cla
de
Faba
ceae
Bra
ssic
acea
eC
ucSo
lana
ceae
Ast
erFl
axPo
acea
ePa
lmPi
nace
ae
Caj
Cic
Gly
Lot
Med
Pha
Pis
Vig
Ara
Bra
Cuc
Cap
Lyc
Nic
Sol
Hel
Lac
Lin
Aeg
Ave
Hor
Ory
Pen
Sac
Sor
Tri
Zea
Ela
Cry
Pin
Tot
al
N1
31
1923
84
22
32
14
48
591
17
62
160
N2
22
12
292
415
53
112
242
15
13
114
N3
26
11
395
32
21
12
22
69N
45
81
115
TIR
36
291
326
35
121
13
42
17
11
133
242
Tot
al8
752
268
158
719
98
38
201
171
413
77
2184
31
68
114
16
600
Fam
ilyto
tal
167
207
346
513
148
47
600
aFo
rcl
ade
desc
ript
ions
,se
eFi
gs.
3an
d4.
Num
bers
inea
chca
tego
ryar
eno
nred
unda
ntco
unts
ofse
quen
ces
from
all
sour
ces
desc
ribe
din
the
text
,cl
assi
fied
bypr
otei
ndi
stan
cesc
ore
rela
tive
tore
pres
enta
tive
sequ
ence
ssh
own
inFi
g.3.
Caj
,Caj
anus
;C
ic,C
icer
;G
ly,G
lyci
ne;
Lot
,Lot
us;
Med
,Med
icag
o;Ph
a,P
hase
olus
;Pi
s,P
isum
;V
ig,V
igna
;A
ra,A
rabi
dops
is;
Bra
,Bra
ssic
a;C
uc,C
ucum
is(i
nC
ucur
bita
ceae
);C
ap,
Cap
sicu
m;L
yc,L
ycop
ersi
con;
Nic
,Nic
otia
na;S
ol,S
olan
um;H
el,H
elia
nthu
s;L
ac,L
actu
ca;L
in,L
inum
;Aeg
,Aeg
ilop
s;A
ve,A
vena
;Hor
,Hor
deum
;Ory
,Ory
za;P
en,P
enes
etum
;Sac
,Sac
char
um;S
or,S
orgh
um;
Tri
,T
riti
cum
;E
la,
Ela
eis;
Cry
,C
rypt
omer
ia;
Pin,
Pin
us.
555

positions with more than 60% identity among included sequences, andother symbols describe conserved sites with less than 60% identity.Motifs identified by Meyers et al. (1999) are evident as blocks ofconserved residues.
Choice of Clade Distance Cutoffs
Sequence membership was determined by a distance cutoff of approxi-mately 250 PAM units between any two members for major clades, and150 PAM units for minor clades, relative to 33 full-length sequences inthe 400-position SAM T99 tree (Fig. 3). These distance cutoffs weremeasured for averaged sequence lengths within a clade, to avoid undueinfluence from unusually long terminal branches.
Counts of Sequences by Clade and Taxon (Table 1)
To generate counts of sequences in clades, ProtDist (Felsenstein 2000)was used to calculate pairwise distances between the nearly full-lengthsequences from the HMM search and alignment and partial sequencesfrom the Sam-T99 database search. Redundant sequences were re-moved when overlap regions showed 100% identity. Coincidentalmatches of unrelated sequences were reduced by considering only se-quences that (1) matched at least 100 positions in the HMM, (2)matched at least 50 positions in the core NBS domain, and (3) werewithin 250 PAM units of one of the nearly full-length scaffold se-quences. Sequences clearly not in the Sam-T99 database search set butretrieved in BLAST searches were added to counts by taxon and clade,using the same distance criteria. The results are listed in Table 1.
Analysis of Arabidopsis RGHs
Arabidopsis RGH sequences are those identified in the Functional andComparative Genomics of Disease Resistance Gene Homologs data-base (http://niblrrs.ucdavis.edu/) from the MIPS Arabidopsis GenomeInitiative database (http://mips.gsf.de/proj/thal/). Protein sequenceswere aligned using T-Coffee, version 1.37 (Notredame et al. 2000),using the multiple alignment default settings, and trimmed to includethe N-terminal and NBS domains, through the RNBS-D motif (Fig. 1)(described by Meyers et al. 1999). Indel regions were removed. TIRand non-TIR sequences were aligned separately. Phylogenetic analysiswas carried out as described for Figs. 3 and 4 and is available inSupplementary Materials. The resulting tree was used to calculate treebranch statistics for the TIR and non-TIR subtrees. Nucleotide se-quences were also aligned relative to the protein sequences using a Perlprogram, TranslateAlign.pl (courtesy of Dan Kortshak, Adelaide Uni-versity). Pairwise distances were calculated using Kimura’s (1980)two-parameter model. Nonsynonymous-to-synonymous nucleotidesubstitution (KA/KS) ratios were calculated using MEGA version 2.1(Kumar et al. 2001), using the method of Li (1993) and Pamilo andBianchi (1993).
Results
Overview
The primary goals of this study were to look for recentand ancient evolutionary patterns in the NBS-LRR genefamily in plants by comparing gene lineages with known
lineages of plant taxa. An analysis was also made ofbranch lengths and KA/KS ratios in the non-TIR and TIRsequences to investigate apparent differences in thesetwo sequence subfamilies. A large data set of RGHs wasassembled using searches of public databases, as well asamplification of RGHs using degenerate PCR primers.The BLAST searches of the TIGR and GenBank data-bases, together with new sequences amplified usingPCR, produced more than 860 sequences. Approxi-mately 400 of these were nonredundant and of sufficientquality and overlap to be used in phylogenetic analysis.The HMM-based search of the GenBank protein data-base and the PDB returned more than 810 plant se-quences, of which 472 appear to be unique, and approxi-mately 200 were high quality and not redundant withsequences from the BLAST search and PCR amplifica-tion. The phylogenetic analysis of the core NBS domain,which included RGHs from a large number of taxa, al-lowed us to compare gene divergence, expansion, andloss with patterns of plant lineage diversification, par-ticularly in the legumes. The trees also revealed severalmultifamily clades in the non-TIR group that have anapparently ancient origin.
Phylogenetic Tree Based on 400 Amino Acid Positions(Fig. 3)
A subset of 108 non-redundant sequences from theSAM-T99 HMM database search was chosen for phylo-genetic analysis (Fig. 3) on the basis of the length ofamino acid matches to the HMM. Notably, the TIR andnon-TIR sequences are deeply separated, and there areno RGHs from grasses or other monocot species in theTIR subfamily, as noted previously by Meyers et al.(1999) and Pan et al. (2000b). Other features include therelatively short branch lengths of the TIR group, in con-trast to the deeply divided and divergent non-TIR group.The most basal of these non-TIR clades (identified asN1, N2, N3, and N4 in Figs. 3 and 4A) all contain RGHsfrom two or more plant families—even orders in the caseof N1, N2, and N3. Thus, the origin of non-TIR R genesappears to predate the common ancestor of angiospermsand Pinaceae. The most recent clades (of 150 PAM unitsor less) contain sequences from only one plant family.
A distance cutoff of 250 PAM units reveals approxi-mately four non-TIR and one TIR clade. Clades N1 andN2 both contain sequences from Poaceae, Fabaceae,Brassicaceae, Solanaceae, and Asteraceae. Despite beingderived clades in Figs. 3 and 4A, both clades containrepresentatives from the rosids (Fabaceae and Brassica-ceae), the asterids (Solanaceae and Asteraceae), and themonocots, suggesting that they are, in fact, quite ancient.We found no sequences from Poaceae or other monocotsin N4, despite specific searches in GenBank and in theTIGR corn and rice EST databases in January 2001.
556

Clades N1.1 and N1.2 are grouped together on thebasis of bootstrap support and distance criteria [calcu-lated using either a maximum likelihood (Puzzle) or apairwise protein distance matrix (ProtDist) method].These clades also have moderately strong bootstrap sup-port: the two appear as sister clades in Figs. 3 and 4A,with 84 and 73% support, respectively. Clade N2 hasgenerally poor bootstrap support (below 70% in Figs. 3and 4) and may warrant division into separate clades.However, sequences in N2 are clearly separated fromN1.1, N1.2, and N3, at least on the basis of distancecriteria (all are within 250 PAM units of one another, andbeyond this distance for sequences in other clades). Thenext two clades, N3 and N4, show relatively long initialbranch lengths (approximately 50 PAM units for each).Both clades also contain sequences from diverse taxa:dicots, monocots, and Pinaceae in N3 and dicots andPinaceae in N4. The pine sequences Gi9993033 (Pinustaeda), AU084895 (Cryptomeria japonica), Gi2708523(Pinus radiata), and Gi10191935 (Pinus taeda) are po-sitioned near the bases of the TIR and the N3 and N4clades, in both the parsimony and the NJ bootstrap analy-ses. Because these are partial-length sequences, trans-lated from ESTs, their placement on the tree (Fig. 3) willhave more error than for sequences with more informa-tive sites. Bootstrap values were calculated both with andwithout the inclusion of these sequences. The four pinesequences are at greater distances relative to other se-quences in their respective clades (approximately 250PAM units to the nearest sequences in other families), aswould be expected from known plant lineage relation-ships.
Phylogenetic Tree of Representative RGHs and AllAvailable Legume RGHs (Fig. 4)
A set of sequences was chosen to explore taxonomicrelationships of RGHs below the family level within le-gumes. We included all available RGHs spanning thecore NBS domain from eight genera and 11 species inthe Faboideae subfamily (formerly Papilionoideae), aswell as smaller numbers of sequence representativesfrom a set of 380 sequences included in the larger NJ andFitch–Margoliash trees (in Supplementary Materials).These sequences were analyzed using parsimony andwith maximum likelihood branch length calculations.Trees based on this limited data set (Figs. 4A and B)have a topology similar to that of trees produced fromthe 400-amino acid data set (Fig. 3). Table 1 extendsthe counts of RGH types by heirarchical lineages, asdescribed below. Using a distance cutoff of approxi-mately 150 PAM units, we observe nine legume-specificnon-TIR clades (A–I) and five TIR clades (J–N) (Figs.4A and B). These apparently family-specific cladesfrequently but not always contain members fromall well-sampled species (Glycine, Medicago, andPhaseolus).
The following branch length statistics were also cal-culated for the TIR and non-TIR subtrees in Fig. 4, toquantify shape differences. The TIR tree has a totallength of 3760 PAM, or 44.2 PAM per sequence. Thenon-TIR tree has a total length of 6640 PAM, or 63.3PAM per sequence. The ratio of tree length per sequencefor the TIR non-TIR trees is 0.698, which supports thevisual impression that the TIR tree is more compact thanthe non-TIR tree. This difference is also present in morerecently evolved sequences, as sister-terminal branchesfrom single species in the TIR tree have an averagelength of 8.9, while the corresponding average tip lengthin the non-TIR tree is 12.4.
Counts of RGHs by Major Cladesand by Genus and Family
Protein distances were calculated between nearly full-length sequences and unique partial sequences, as de-scribed under Methods. These pairwise distances wereused to classify 600 NBS-LRR RGHs, as listed in Table1. Natural distance cutoffs for clades would ideally bechosen to identify biologically meaningful groupings ofsequences or taxa and to occur at long internal brancheswith strong bootstrap support. Although arbitrary, the150- and 250-PAM cutoffs do correspond approximatelyto positions in the trees immediately predating largenumbers of paralogous duplications. For example, the150-PAM cutoff corresponds in Figs. 4A and B withlong branches supporting clades A, B, C, D, E, J, K, L,and N. Distributions of RGHs by taxon are highly un-even. For example, we found 19 Glycine and 23 Medi-cago RGHs in N1 and 2 Glycine max and 2 Medicagotruncatula RGHs in N2—but found the opposite rela-tionship in Arabidopsis thaliana sequences: 2 sequencesin N1 and 18 in N2. Differences this large seem unlikelyto be sampling artifacts alone, even considering thatsome of the difference may reflect sampling biases inthe two legume species. It is also possible that someof these sequences are placed in the incorrect clade byphylogenetic reconstruction. The PAM-based groupsin Table 1 are probably prone to error because of thehigh degree of divergence among sequences, and somecaution should be used in the interpretation of thisdata. Bootstrap scores in Figs. 3 and 4 provide somemeasure of the likelihood of this type of error. For ex-ample, misplacement of sequences between clade N1.1and clade N1.2 is more likely than between N1.1 andN3 or N4. The likelihood of this source of error is less-ened in many cases by high bootstrap scores for family-specific clades that nest deeply within the major clades.Additionally, dicot sequences in N1.1, for example,are unlikely to be inappropriately placed in N1.2,which to date appears to contain only members fromPoaceae.
557

Analysis of Arabidopsis RGHs
RGH protein sequences from Arabidopsis thaliana werealigned and used in turn to align the correspondingnucleotide sequences. The main objective was to evalu-ate rates of synonymous and nonsynonymous substitu-tion in the TIR and non-TIR subtrees and to comparethese results with other branch length statistics for thetwo trees.
Branch length statistics calculated for the TIR andnon-TIR Arabidopsis parsimony/maximum likelihoodtrees (Supplementary Materials) are as follows: the TIRtree has a total length of 3420 PAM for 99 sequences, or34.5 PAM per sequence. The non-TIR tree has a totallength of 1970 PAM for 48 sequences, or 40.9 PAM persequence. The ratio of tree length per sequence for theTIR/non-TIR trees is 0.842, which supports the visualimpression that the TIR tree is more compact than thenon-TIR tree. To test whether this difference in treeshape may be due to different selection pressures in thetwo gene subfamilies, KA/KS ratios were calculated forthe region of the non-TIR sequences from the N-terminalthrough the RNBS-D motif (Fig. 1) (described by Mey-ers et al. 1999). The KA/KS ratio for the TIR and non-TIRsequences is 0.335 and 0.429, respectively, using themethod of Li (1993) and Pamilo and Bianchi (1993). TheKA/KS ratio for the TIR sequences is 78% as high as thatfor the non-TIR sequences, suggesting higher selectivepressure in the TIR gene subfamily. This difference ishighly significant in a two-tailed t test (p < 0.001), if thestandard errors for the KA/KS ratios for TIR and non-TIRsequences are conservatively estimated as the average ofthe standard errors of KA and KS for the respective sub-families. For the TIR sequences, KA is 0.517 (SE �0.021) and KS is 1.545 (SE � 0.031). For the non-TIRsequences, KA is 0.700 (SE � 0.034) and KS is 1.631(SE � 0.041).
Because the average KA/KS values for the two sub-families may be influenced by high levels of saturation atsynonymous sites, we also calculated average KA/KS val-ues for sequence pairs within distances of 0.5 inferredchanges per nucleotide of one another [calculated usingthe Kimura (1980) two-parameter model]. Although theaverage distances for all sequences in the TIR and non-TIR sequences are 0.7 and 1.1 units, respectively (afterexcluding sequences at “infinite distance”), the KA/KS
values for sequence pairs within 0.5 unit of one anotherare very similar to the average ratios calculated for allsequences. The KA/KS ratio for TIR and non-TIR se-quence pairs within 0.5 unit of one another is 0.351 and0.450, respectively. The KA/KS for the TIR sequences is78% as high as that for the non-TIR sequences, againsuggesting higher selective pressure in the TIR gene sub-family. As above, this difference is highly significant ina two-tailed t test (p < 0.001). For the TIR sequences, KA
is 0.205 (SE � 0.041) and KS is 0.566 (SE � 0.148). For
the non-TIR sequences, KA is 0.286 (SE � 0.073) andKS is 0.630 (SE � 0.160).
Discussion
Ancient Evolutionary Relationships in the Non-TIRRGHs: Ancient Sequences and Birth and Death
This study focuses on evolutionary relationships withinthe established TIR and non-TIR NBS-LRR gene sub-families. Examining sequences from long-diverged taxa,including grasses, a variety of dicots, and several gym-nosperms, helps to place the origin of sequence lineagesrelative to speciation events. Maximum likelihood dis-tance estimates suggest more highly resolved early rela-tionships than have been reported in previous studies,particularly in the non-TIR subfamily. There appear to beat least four distinct, multi-plant-family clades within thenon-TIR subfamily. As several of these clades containsequences from both angiosperm and Pinaceae species,these sequence types apparently originated before theradiation of the angiosperms.
As observed by Meyers et al. (1999) and Pan et al.(2000b), no representatives from Poaceae have yet beenrecovered within the TIR gene subfamily, despite thenearly completed rice genome sequence and extensivesequencing from corn and other grasses. This suggestsloss of the TIR branch of sequences predating the evo-lution of the grasses and, perhaps, other monocots—orthe unlikely parallel gain of this sequence type in allsampled nonmonocots. We were also unable to findmonocot sequences in clade N4. Current phylogeniesbased on molecular evidence place the monocots amongearly angiosperm lineages (Doyle 1998; Mathews andDonoghue 1999; Savolainen et al. 2000; Soltis and Soltis2000). A hypothesis based on the presence of Pinaceaeand dicot sequences in the TIR and N3 and N4 cladescombined with the apparent lack of monocot sequencesfrom the TIR and N4 clades is that the latter sequencetypes were lost somewhere along the monocot lineage.Further work is needed to narrow the timing of the pre-sumed loss and to test against alternative hypotheses.Another example of R gene clade loss is the possible lossfrom at least some dicot families of the monocot-specificRGH clade N1.2, or the “birth” in the monocots of thisnovel sequence type. In general, these results suggestseveral instances of the “death” of ancient lineages ofRGHs within particular plant families.
Unevenness in the distribution of different RGH se-quences within different plant lineages can be seen in acomparison of sequences from several species in Bras-sicaceae and Fabaceae. RGH sequences from Arabidop-sis contain two sequences in clades N1 and at least 18 inN2 (separate loci from the Arabidopsis Genome Initia-tive sequence assembly), while Glycine max and Medi-
558

cago truncatula contain at least 23 and 19 (respectively)in N1 and 2 each in N2. Even considering possiblesample biases in the legume species, sequences fromArabidopsis seem to be underrepresented in N1 (2 vs 23and 19) and overrepresented in N2 (18 vs 2 and 2).Legume RGHs are not well represented in clade N2,despite the fact that there have been independent effortsusing multiple legume taxa to amplify NBS-LRR RGHsusing degenerate primers (Creusot et al. 1999; Jeong etal. 2001; Kanazin et al. 1996; Meyers et al. 1999; Pe-nuela et al., submitted; Rivkin et al. 1999; Yu et al. 1996;Zhu et al., submitted). EST sampling is also extensive inGlycine max and Medicago truncatula, with 126,583and 88,906 ESTs, respectively, in the TIGR Gene Indicesasof December 21, 2000 (http://www.tigr.org/tdb/GeneIndexPages; Quackenbush et al. 2000). We also detectno group-specific primer bias in the P-loop and GLPL do-mains for these groups, which might otherwise bias therecovery of RGHs from some sequence types. This is ap-parent in Fig. 3 in the common primer regions (P-loop,kinase 2, GLPL, and RNBS-D motifs) and in the alignmentin the Supplementary Materials.
Relationships of RGHs Below the Family Level
At the generic rank, Medicago truncatula and Glycinemax RGHs have been relatively well sampled (with 68and 52 nonredundant sequences in our data set, respec-tively). Proportions of these RGHs in the N1–N4 andTIR clades are similar (a chi-square test does not rejectthe independence of sequence counts by genus andclade). However, distributions in finer-level clades (e.g.,for sequences within no more than 150 PAM from oneanother) are more uneven. For example, hybridizationresults suggest that clade C (Fig. 4A) contains more than20 sequences in M. truncatula (Zhu et al., submitted) andnone in G. max (Cannon, unpublished data). This appar-ent loss from Medicago or gain in Glycine would beconsistent with high rates of birth and death in thesegenes (Michelmore and Meyers 1998; Michelmore2000). Nevertheless, in the 14 legume-specific cladesidentified in Fig. 4, Medicago sequences are present in12, suggesting that the ranks of genus or tribe are rea-sonable levels at which to look for homologues in thisgene family.
Despite both incomplete gene sampling and the likelyloss of some sequence types from species or genera on ashort time scale, protein distance relationships betweensequences from relatively closely related taxa frequentlydo follow patterns expected from lineage relationships.In the relatively well-sampled TIR legume clades L andN (Fig. 4B), for example, sequences from Medicago sa-tiva (Ms) and Medicago truncatula (Mt) are the mostclosely related to one another, followed by Pisum sa-tivum (Ps) (in the closely related tribes Trifolieae andVicieae, respectively). At greater distances are sequences
from Phaseolus vulgaris (Pv) and Glycine max (Gm),which are both members of Phaseoleae. All of these re-lationships mirror those predicted on the basis of rbcLdata (Doyle 1994).
The Choice of Phylogenetic Methods Is Important
The trees in Figs. 3 and 4 were obtained using a parsi-mony search, followed by maximum likelihood inferenceof branch lengths. Maximum likelihood methods provideless biased estimates of branch lengths than NJ, whichtends to underestimate the lengths of internal branchesand overestimate the lengths of terminal branches, par-ticularly for large sequence sets (Wishart 1999; Graurand Li 2000). NJ trees are usually similar to more com-putationally intensive minimum evolution trees when thenumber of sequences is small, but if the number is large,topological and branch length differences can be sub-stantial in comparison to minimum evolution trees(Rzhetsky and Nei 1993). NJ trees computed using manysequences typically have disproportionately short basalbranches and long terminal branches, as interior branchesproduced late in the clustering process receive smallerproportions of the total tree length (Wishart 1999). Theproblem is most pronounced if distances are not cor-rected for multiple substitutions. Previous cladisticanalyses of this gene family have also relied primarily onthe core 150 to 200 NBS domain amino acids, whichmay be insufficient to resolve some early taxonomic re-lationships. In this study, we used protein distance matrixmethods, maximum parsimony, maximum likelihood,and the Fitch–Margoliash distance method (reviewed byGraur and Li 2000; Page and Holmes 1998), using ap-proximately 400 amino acid positions, to distinguish ma-jor clades.
Also critical in the reconstruction of accurate phylog-enies are alignment methods. In comparisons of align-ment methods (data not shown), we observed fewerquestionably aligned regions near insertion sites inHMM-based alignments (Karplus et al. 1998) than inmultiple alignments with ClustalX (Thompson et al.1997). In regions of apparently independent insertions,the Clustal method tends to align islands of amino acidsto the longest insertion, while the HMM alignments con-sign the independent insertions to insertion states ratherthan to match states in the alignment model. A thirdmultiple alignment method, T-Coffee, has been ratedhighly in alignment tests (Notredame et al. 2000) andwas used to align the full-length Arabidopsis thalianaRGHs.
With all available phylogenetic methods, and particu-larly with parsimony searches, long-branch attraction canbe a problem (Felsenstein 1978). The likelihood of long-branch attraction is generally lower for large data setsthan for smaller data sets, as shown in simulation studiesof 228 angiosperm 18S ribosomal DNA sequences and
559

subsets from these data (Hillis 1996). In data sets withmany sequences (such as the RGHs in this study),branches with covarying homoplasies are likely to beseparated by intervening sequences. One portion of thetrees in Figs. 3 and 4A that may show long branch at-traction is in the deeply split clade N4, which has onlyeight sequences. The addition of more sequences to thisclades will help determine appropriate internal branchlengths and will indicate whether N4 should be subdi-vided again into separate clades.
Evolutionary Histories Appear to be Different for theTIR and Non-TIR Gene Subfamilies
The topologies of the TIR and non-TIR trees are differ-ent in some important respects. Branch lengths in theTIR subfamily are all comparatively short, with se-quences separated by at most 350 PAM units. In contrast,the non-TIR subfamily is deeply divided into clades con-taining multiple-plant family sequences that are sepa-rated from one another by approximately 500 PAM units.This level of difference is nearly as great as that betweensequences from the two gene subfamilies. The apparentbranch length differences are measurable. The tree lengthper sequence (sum of all branch lengths divided by num-ber of sequences) is 44.2 PAM for the TIR sequences inFig. 4B and 63.3 PAM for the non-TIR sequences in Fig.4A. Thus, the TIR tree length per sequence is 69.8% ofthe non-TIR tree length per sequence. The correspondingratio for a similarly computed tree of all ArabidopsisNBS-LRR RGH sequences is 84.2%.
This difference in subtree topologies might be dueeither to greater constraints and selective pressure on theTIR sequences or to higher rates of sequence exchange(and homogenization). Both factors appear to play a role.Purifying selection acting on many sites in a set of ho-mologues may slow the evolutionary rates for thesegenes, keeping terminal branch lengths short. Purifyingselection might be expected, particularly in the NBS do-main, which has numerous highly conserved regions andis believed to serve as an effector domain for other com-ponents of a signal transduction cascade (Parker et al.1996; van der Beizen et al. 2000). A comparison of theratios of nonsynonymous changes to synonymouschanges in the TIR and non-TIR sequences also indicateshigher selective pressure on Arabidopsis TIR sequences.We found that the KA/KS ratio for the TIR sequences(from the N-terminal through the NBS domain) is 78%as high as that for the non-TIR sequences (the KA/KS
ratios are 0.335 for the TIR and 0.429 for the non-TIRsequences; p < 0.001). This ratio is also 78% for moreclosely related sequence pairs in the two subfamilies(within 0.5 distance unit of one another, using Kimura’stwo-parameter calculation of average changes pernucleotide).
Additionally, the evolution of these groups of genesmight be constrained by homogenization due to geneconversion or recombination. Within Arabidopsis, re-combination and conversion appear to be frequent insome RGH clusters (Noel et al. 1999; Stahl et al. 1999;Stahl and Bishop 2000) and may help to explain bothsome of the homogeneity and the apparent recent originin the large groups of Brassica or legume TIR RGHs. Forexample, the RPP5-containing clade of Arabidopsis con-tains more than 50 sequences (11 of which are shown inFig. 4B). Most of these are within 150 PAM units of oneanother, and the clade is deeply separated from se-quences from other taxa. It will be interesting to learnhow rates of expansion, loss, and sequence exchange inparticular lineages of RGHs are affected by the hetero-geneity of complex R gene loci (Bergelson et al. 2001)and by factors such as diversifying selection (Ellis et al.2000), organization of RGHs, and intervening noncodingsequences within clusters (Parniske and Jones 1999).
Arabidopsis (or Any Other Single Plant Species) MayNot be a Good Model at the Sequence Level forNBS-LRR RGHs in Other Taxa
The highly uneven distribution of sequence types in dif-ferent plant lineages indicates that some sequence typeshave few or no close homologues in sister plant clades.The most dramatic illustration of this is in the apparentlycomplete absence of TIR sequences in the grasses (andpossibly from other monocots). Similarly, clade N1 inthe non-TIR group is represented by very few Arabidop-sis sequences (two in Table 1: AB028617 and AL049862).Furthermore, the Arabidopsis sequences in N1 are rela-tively distant (more than 200 PAM units) from the nu-merous legume RGHs in this clade.
Clades with long branch lengths for each taxon withinthe non-TIR subfamily may in fact turn out to encode forproteins with important mechanistic differences. By wayof analogy, it has been established that at least some ofthe non-TIR and TIR NBS—LRR resistance genes func-tion via different signal transduction pathways (Aarts etal. 1998). Arabidopsis TIR R genes require a functionalEDS1 allele to activate the hypersensitive cell death dis-ease response (Parker et al. 1996), while non-TIR Rgenes require a functional NDR1 allele to provide diseaseresistance. Within the non-TIR group, the NBS domainof the Arabidopsis TIR R gene RPP5 (Fig. 4B) has beenshown to interact with At-RSH1, which is homologous tothe bacterial proteins Re1A/SpoT (van der Biezen et al.2000). The Re1A/SpoT proteins regulate the level ofguanosine tetra- and pentaphosphate, (p)ppGpp, whichare the effector nucleotides of the prokaryotic stringentresponse. Although this study did not focus on the struc-tural features in these gene lineages, the substantial dif-ferences in clade-specific consensus sequences (Fig. 2)
560

argue for caution in generalizing about signaling inter-actions among members of this diverse gene family.
The discrepancy in numbers of sequence types acrossvarious taxa has practical implications both for the po-tential use of agronomically beneficial genes in othertaxa and for the study of the evolution of particularclasses of RGHs. Lineage-specific NBS-LRR genes ex-hibit restricted taxonomic functionality as shown for thecloned R genes Bs2 from pepper and RPS2 from Arabi-dopsis. Both of these genes function in related specieswithin the same plant lineage but not in species outsideof the lineage (Tai et al. 1999). Furthermore, low-copygenes in one species may undergo different evolutionarydynamics than homologous high-copy genes in otherspecies. For example, although we found only two Ara-bidopsis RGHs in clade N1, most of the Medicago andGlycine RGHs in clade N1 are located in clusters thatcontain numerous closely related homologues (Zhu et al.,submitted; Penuela and Young, submitted; Jeong et al.2001; Creusot et al. 1999). RGHs in clusters are morelikely than isolated genes to be strongly shaped bymechanisms such as frequent gene duplication, loss, con-version, and ectopic recombination (Michelmore andMeyers 1998; Meyers et al. 1998; Parniske and Jones1999).
Conclusion
This study investigated relationships between gene fam-ily and plant lineage diversification in the NBS-LRRresistance gene homologues, providing a context for theincreasing numbers of these putative genes that are beingrecovered by sequencing projects. The study finds thatthe non-TIR branch of the NBS-LRR gene family ishighly diverse, with several clades having originatedprior to the split between gymnosperms and angiospermsand, also, having protein distances almost as far fromother non-TIR sequences as from TIR-containing se-quences. The TIR subfamily is more homogeneous, sug-gesting either later divergence, more extensive structuralconstraints, or more concerted evolution than in the non-TIR subfamily. Within several of the major non-TIRclades, some well-sampled plant taxa are poorly repre-sented or contain no RGHs, suggesting either loss ofparticular RGH lineages in these taxa or growth or spe-cialization in these RGH lineages in other taxa. Thisobservation supports a birth and death model of the evo-lution of this gene family and indicates that no singleplant species is likely to be a good model at the sequencelevel for all sequence types in the NBS-LRR RGH genefamily.
Supplementary Material
Supplementary material may be obtained at our website(http://www.tc.umn.edu/∼cann0010/CannonEtAl_R_genes.html).
Acknowledgments. We thank A.W. Dickerman, K. Silverstein, E.Stahl, and anonymous reviewers for their critical reading of the manu-script and for helpful suggestions. S. Penuela generously provided PCRprimers and advice on the isolation of RGHs from G. max and M.truncatula. This work was supported by a USDA National Needs fel-lowship to S.B.C. and by NSF Plant Genome Grants DBI-9872565 andDBI-9872664.
References
Aarts MG, Hekkert B, Holub EB, Beynon JL, Stiekema WJ, Pereira A(1998) Identification of R-gene homologous DNA fragments ge-netically linked to disease resistance loci in Arabidopsis thaliana.Mol Plant Microbe Interact 11:251–258
Altschul SF, Madden TL, Schaffer AA, Zhang Z, Miller W, Lipman DJ(1997) Gapped BLAST and PSI-BLAST: A new generation ofprotein database search programs. Nucleic Acids Res 25:3389–3402
Baker B, Zambryski P, Staskawicz B, Dinesh-Kumar SP (1997) Sig-naling in plant-microbe interactions. Science 276:726–733
Baldi P, Chauvin Y, Hunkapiller T, McClure TA (1994) HiddenMarkov models of biological primary sequence information. ProcNatl Acad Sci USA 91(2):1059–1063
Bent AF (1996) Plant disease resistance genes: Function meets struc-ture. Plant Cell 8:1757–1771
Bergelson J, Kreitman M, Stahl EA, Tian D (2001) Evolutionary dy-namics of plant R-genes. Science 292:2281–2285
Berman HM, Westbrook J, Feng Z, Gilliland G, Bhat TN, Weissig H,Shindyalov IN, Bourne PE (2000) The Protein Data Bank. NucleicAcids Res 28:235–242
Creusot F, Macadre C, Cana EF, Riou C, Geffroy V, Sevignac M, DronM, Langin T (1999) Cloning and molecular characterization ofthree members of the NBS-LRR subfamily located in the vicinity ofthe Co-2 locus for anthracnose resistance in Phaseolus vulgaris.Genome 42(2):254–264
Dayhoff MO (ed) (1979) Atlas of protein sequences and structure, Vol5, Suppl 3. National Biomedical Research Foundation, WashingtonDC, pp 353–358
Doyle JJ (1994) Phylogeny of the legume family: An approach tounderstanding the origins of nodulation. Annu Rev Ecol Syst 25:325–349
Doyle JA (1998) Phylogeny of vascular plants. Annu Rev Ecol Syst29:567–599
Ellis J, Dodds P, Pryor T (2000) Structure, function and evolution ofplant disease resistance genes. Curr Opin Plant Biol 3(4):278–284
Felsenstein J (1978) Cases in which parsimony or compatibility meth-ods will be positively misleading. Syst Zool 27:401–410
Felsenstein J (2000) PHYLIP (phylogeny inference package) version36. Distributed by the author. Department of Genetics, Universityof Washington, Seattle
Fitch WM, Margoliash E (1967) Construction of phylogenetic trees Amethod based on mutation distances as estimated from cytochromec sequences is of general applicability. Science 155:279–284
Graur D, Li W-H (2000) Fundamentals of molecular evolution.Sinauer, Sunderland, MA
Hammond-Kosack KE, Jones JDG (1997) Plant disease resistancegenes. Annu Rev Plant Physiol Plant Mol Biol 48:575–607
Hillis DM (1996) Inferring complex phylogenies Nature 383:130–131Jeong SC, Jayes AJ, Biyashev RM, Saghai Maroof MA (2001) Diver-
sity and evolution of a non-TIR-NBS sequence family that clustersto a chromosomal “hotspot” for disease resistance genes in soy-bean. Theor Appl Genet 103:406–414
Jones DA, Jones JDG (1997) The role of leucine-rich repeat proteins inplant defences. Adv Bot Res 24:90–167
Kajava AV (1998) Structural diversity of leucine-rich repeat proteins.J Mol Biol 277(3):519–527
561
Kanazin V, Marek LF, Shoemaker RC (1996) Resistance gene analogsare conserved and clustered in soybean. Proc Natl Acad Sci USA93:11746–11750
Karplus K, Barrett C, Hughey R (1998) Hidden Markov models fordetecting remote protein homologies. Bioinformatics 14(10):846–856
Kimura M (1980) A simple method for estimating evolutionary rate ofbase substitutions through comparative studies of nucleotide se-quences. J Mol Evol 16:111–120
Kumar S, Tamura K, Jakobsen IB, Nei M (2001) MEGA2: Molecularevolutionary genetics analysis software. Arizona State University,Tempe
Leister D, Ballvora A, Salamini F, Gebhardt C (1996) A PCR-basedapproach for isolating pathogen resistance genes from potato withpotential for wide application in plants. Nature Genet 14:421–429
Li P, Nijhawan D, Budihardjo I, Srinivasula SM, Ahmad M, AlnemriES, Wang X (1997) Cytochrome c and dATP-dependent formationof Apaf-1/caspase-9 complex initiates an apoptotic protease cas-cade. Cell 91:479–489
Li W-H (1993) Unbiased estimation of the rates of synonymous andnonsynonymous substitution. Mol Biol Evol 6:424–435
Lupas A (1996) Coiled coils: New structures and new functions. TrendsBiochem Sci 21:375–382
Mathews S, Donoghue MJ (1999) The root of angiosperm phylogenyinferred from duplicate phytochrome genes. Science 286:947–950
Meyers BC, Shen KA, Rohani P, Gaut BS, Michelmore RW (1998)Receptor-like genes in the major resistance locus of lettuce aresubject to divergent selection. Plant Cell 11:1833–1846
Meyers BC, Dickerman AW, Michelmore RW, Sivaramakrishnan S,Sobral BW, Young ND (1999) Plant disease resistance genes en-code members of an ancient and diverse protein family within thenucleotide-binding superfamily. Plant J 20:317–332
Michelmore R (2000) Genomic approaches to plant disease resistance.Curr Opin Plant Biol 3(2):125–131
Michelmore RW, Meyers BC (1998) Clusters of resistance genes inplants evolve by divergent selection and a birth-and-death process.Genome Res 8:1113–1130
Noel L, Moores TL, van Der Biezen EA, Parniske M, Daniels MJ,Parker JE, Jones JDG (1999) Pronounced intraspecific haplogypedivergence at the RPP5 complex disease resistance locus of Ara-bidopsis. Plant Cell 11:2099–2112
Notredame C, Higgins D, Heringa J (2000) T-Coffee: A novel methodfor multiple sequence alignments. J Mol Biol 30:205–217
Page RD, Holmes EC (1998) Molecular evolution: A phylogeneticapproach. Blackwell Science, Oxford
Pamilo P, Bianchi NO (1993) Evolution of the ZFX and ZFY genes:Rates and interdependence between the genes. Mol Biol Evol 10:271–278
Pan Q, Wendel J, Fluhr R (2000a) Divergent evolution of plant NBS-LRR resistance gene homologues in dicot and cereal genomes. JMol Evol 50:203–213
Pan Q, Liu YS, Budai-Hadrian O, Sela M, Carmel-Goren L, Zamir D,Fluhr R (2000b) Comparative genetics of nucleotide binding site-leucine rich repeat resistance gene homologues in the genomes oftwo dicotyledons: Tomato and Arabidopsis. Genetics 155:309–322
Park J, Karplus K, Barrett C, Hughey R, Haussler D, Hubbard T,Chothia C (1998) Sequence comparisons using multiple sequencesdetect twice as many remote homologues as pairwise methods. JMol Biol 284(4):1201–1210
Parker JE, Holub EB, Frost LN, Falk A, Gunn ND, Daniels MJ (1996)Characterization of eds1, a mutation in Arabidopsis suppressingresistance to Peronospora parasitica specified by several differentRPP genes. Plant Cell 8:2033–2046
Parniske M, Jones JDG (1999) Recombination between diverged clus-ters of the tomato Cf-9 plant disease resistance gene family. ProcNatl Acad Sci USA 96(10):5850–5855
Quackenbush J, Liang F, Holt I, Pertea G, Upton J (2000) The TIGRgene indices: Reconstruction and representation of expressed genesequences. Nucleic Acids Res 28:141–145
Qureshi ST, Gros P, Malo D (1999) Host resistance to infection: Ge-netic control of lipopolysaccharide responsiveness by TOLL-likereceptor genes. Trends Genet 15:291–294
Richter TE, Ronald PC (2000) The evolution of disease resistancegenes. Plant Mol Biol 42:195–204
Rivkin MI, Vallejos CE, McClean PE (1999) Disease-resistance relatedsequences in common bean. Genome 42(1):41–47
Rzhetsky A, Nei M (1993) Theoretical foundation of the minimum-evolution method of phylogenetic inference. Mol Biol Evol 10:1073–1095
Savolainen V, Chase MW, Hoot SB, Morton CM, Soltis DE, Bayer C,Fay MF, de Bruijn AY, Sullivan S, Qiu Y-L (2000) Phylogeneticsof flowering plants based upon a combined analysis of plastid atpBand rbcL gene sequences. Syst Biol 46:306–362
Soltis DE, Soltis PS (2000) Contributions of plant molecular system-atics to studies of molecular evolution. Plant Mol Biol 42:45–75
Stahl EA, Bishop JG (2000) Plant-pathogen arms races at the molecularlevel. Curr Opin Plant Biol 3(4):299–304
Stahl EA, Dwyer G, Mauricio R, Kreitman M, Bergelson J (1999)Dynamics of disease resistance polymorphism at the RPM1 locusof Arabidopsis. Nature 400:667–671
Staskawicz BJ, Ausubel FM, Baker BJ, Ellis JG, Jones DG (1995) Mo-lecular genetics of plant disease resistance. Science 268:661–667
Strimmer K, von Haeseler A (1999) Tree-Puzzle version 402. Distrib-uted by the authors. Max-Planck-Institute for Evolutionary Anthro-pology, Leipzig, Germany
Swofford DL, (2000) PAUP*, phylogenetic analysis using parsimony (*and other methods), version 4. Sinauer Associates, Sunderland, MA
Tai TH, Dahlbeck D, Clark ET, Gajiwala P, Pasion R, Whalen MC,Stall RE, Staskawicz BJ (1999) Expression of the Bs2 pepper geneconfers resistance to bacterial spot disease in tomato. Proc NatlAcad Sci USA 96(24):14153–14158
Thompson JD, Gibson TJ, Plewniak F, Jeanmougin F, Higgins DG(1997) The ClustalX windows interface: Flexible strategies formultiple sequence alignment aided by quality analysis tools.Nucleic Acids Res 24:4876–4882
Traut TW (1994) The functions and consensus motifs of nine types ofpeptide segments that form different types of nucleotide-bindingsites. Eur J Biochem 222:9–19
van der Biezen EA, Sun J, Coleman MJ, Bibb MJ, Jones JD (2000)Arabidopsis RelA/SpoT homologs implicate (p)ppGpp in plant sig-naling. Proc Natl Acad Sci USA 97:3747–3752
Wishart D (1999) Clustan Graphics primer: A guide to cluster analysis.Clustan, Edinburgh, Scotland
Young ND (2000) The genetic architecture of resistance. Curr OpinPlant Biol 3:285–290
Yu YG, Buss GR, Saghai Maroof MA (1996) Isolation of a superfamilyof candidate disease-resistance genes in soybean based on a con-served nucleotide-binding site. Proc Natl Acad Sci USA 93:11751–11756
562