Specific features in the ferroelectric properties of Sr 0.75 Ba 0.25 Nb 2 O 6 crystals
7
1063-7834/03/4511- $24.00 © 2003 MAIK “Nauka/Interperiodica” 2171 Physics of the Solid State, Vol. 45, No. 11, 2003, pp. 2171–2177. Translated from Fizika Tverdogo Tela, Vol. 45, No. 11, 2003, pp. 2067–2073. Original Russian Text Copyright © 2003 by Gladkiœ, Kirikov, Volk, Isakov, Ivanova. 1. INTRODUCTION Oxide solid solutions with perovskite-like crystal structure (general formula ABO 3 ) [1–4] are highly inho- mogeneous materials with structural disorder which reveal unusual ferroelectric properties. Such crystals have been named relaxor ferroelectrics (or relaxors). In particular, structural disorder in Sr x B 1 - x Nb 2 O 6 crystals with tungsten bronze structure, which are the subject of the present study, originates from 1/6 of the A-cation positions being unfilled [2, 3], with the degree of disor- der being determined by the pattern of filling of the A2 structural channel by Ba and Sr ions [5]. The structural disorder brings about inhomogeneous strains and inter- nal electric fields in the bulk of the crystal, due to which the local site symmetry is reduced and the symmetric double-minimum local free energy function of polar- ization transforms into an asymmetric function, with a random distribution of its parameters over the crystal volume [4]. As a result, dielectric hysteresis loops acquire (as shown to be valid for SBN crystals of vari- ous compositions [6–8]) an anomalous shape with open and nonreproducing first polarization switching cycles and with clear indications of the absence of a definite coercive field. The actual degree of diffuseness of the phase transition and the relaxor properties of the SBN compounds are determined by the chemical composi- tion. Increasing the Sr content [2, 3] and doping the compound with rare-earth elements [9] lowers the tem- perature of the maximum of dielectric permittivity con- siderably increases the diffuseness of the phase transi- tion, and makes the characteristic properties of the relaxors more pronounced. The goal of the present work was to investigate the polarization processes occurring in the relaxor ferro- electric SBN-0.75. The behavior of the various proper- ties of SBN-0.75, in particular, of the dispersion char- acteristics of its dielectric permittivity in the region of the phase transition, has been a subject of many publi- cations (see, e.g., [10]). Research has been focused on SBN-0.75 because it has the largest diffuseness of the phase transition and the most clearly pronounced relaxor properties of this composition among all other SBN compounds. It is in SBN-0.75 that nanodomains [11] known to be specific to relaxor ferroelectrics have been observed. At the same time, polarization processes (polarization kinetics, quasi-static dielectric hysteresis loops), whose investigation in other compositions have revealed a number of features characteristic of relaxors [6–8], have not been studied in the SBN-0.75. Our present investigation of polarization processes in SBN-0.75 was performed in various field regimes, namely, under the application of dc, slowly varying (quasi-static), and pulsed electric fields. Measurements in dc and quasi-static fields make it possible to obtain a response of longest lived metastable states of a crystal and polarizations which most closely approach levels of thermodynamic equilibrium. The experimental tech- nique employed in our previous studies [6, 7] offered the possibility of investigating the slow part of the polarization kinetics for times in excess of 15 s. The broadened scope of techniques employed in this study also made it possible to explore the kinetics of the fast stage of the process. 2. EXPERIMENTAL TECHNIQUES The polarization variation in dc and quasi-static fields was measured with an equal-arm electrometric bridge, with the sample under study and the source of polarizing voltage V connected in one arm, a reference capacitor C and the source of compensating voltage v connected in the other, and a V7-29 electrometer serving as a null indicator when balancing the bridge across the bridge diagonal. The voltage compensation across the diagonal was attained automatically with an IBM PC and Specific Features in the Ferroelectric Properties of Sr 0.75 Ba 0.25 Nb 2 O 6 Crystals V. V. Gladkiœ, V. A. Kirikov, T. R. Volk, D. V. Isakov, and E. S. Ivanova Shubnikov Institute of Crystallography, Russian Academy of Sciences, Leninskiœ pr. 59, Moscow, 119333 Russia Received April 9, 2003 Abstract—The dielectric properties of strontium–barium niobate crystals with a strontium concentration of 0.75, which corresponds to the most smeared ferroelectric phase transition, were measured. The dielectric hys- teresis loops and the polarization relaxation are shown to exhibit clearly pronounced features characteristic of crystals with structural disorder and a broad distribution of a random internal electric field. The measurements were performed in dc, slowly varying (quasi-static), and pulsed electric fields. The experimental data obtained are used to construct the distribution function for the coercive field in the crystal bulk. © 2003 MAIK “Nauka/Interperiodica”. MAGNETISM AND FERROELECTRICITY
Transcript of Specific features in the ferroelectric properties of Sr 0.75 Ba 0.25 Nb 2 O 6 crystals

Physics of the Solid State, Vol. 45, No. 11, 2003, pp. 2171–2177. Translated from Fizika Tverdogo Tela, Vol. 45, No. 11, 2003, pp. 2067–2073.Original Russian Text Copyright © 2003 by Gladki
œ
, Kirikov, Volk, Isakov, Ivanova.
MAGNETISM AND FERROELECTRICITY
Specific Features in the Ferroelectric Properties of Sr0.75Ba0.25Nb2O6 Crystals
V. V. Gladkiœ, V. A. Kirikov, T. R. Volk, D. V. Isakov, and E. S. IvanovaShubnikov Institute of Crystallography, Russian Academy of Sciences, Leninskiœ pr. 59, Moscow, 119333 Russia
Received April 9, 2003
Abstract—The dielectric properties of strontium–barium niobate crystals with a strontium concentration of0.75, which corresponds to the most smeared ferroelectric phase transition, were measured. The dielectric hys-teresis loops and the polarization relaxation are shown to exhibit clearly pronounced features characteristic ofcrystals with structural disorder and a broad distribution of a random internal electric field. The measurementswere performed in dc, slowly varying (quasi-static), and pulsed electric fields. The experimental data obtainedare used to construct the distribution function for the coercive field in the crystal bulk. © 2003 MAIK“Nauka/Interperiodica”.
1. INTRODUCTION
Oxide solid solutions with perovskite-like crystalstructure (general formula ABO3) [1–4] are highly inho-mogeneous materials with structural disorder whichreveal unusual ferroelectric properties. Such crystalshave been named relaxor ferroelectrics (or relaxors). Inparticular, structural disorder in SrxB1 − xNb2O6 crystalswith tungsten bronze structure, which are the subject ofthe present study, originates from 1/6 of the A-cationpositions being unfilled [2, 3], with the degree of disor-der being determined by the pattern of filling of the A2structural channel by Ba and Sr ions [5]. The structuraldisorder brings about inhomogeneous strains and inter-nal electric fields in the bulk of the crystal, due to whichthe local site symmetry is reduced and the symmetricdouble-minimum local free energy function of polar-ization transforms into an asymmetric function, with arandom distribution of its parameters over the crystalvolume [4]. As a result, dielectric hysteresis loopsacquire (as shown to be valid for SBN crystals of vari-ous compositions [6–8]) an anomalous shape with openand nonreproducing first polarization switching cyclesand with clear indications of the absence of a definitecoercive field. The actual degree of diffuseness of thephase transition and the relaxor properties of the SBNcompounds are determined by the chemical composi-tion. Increasing the Sr content [2, 3] and doping thecompound with rare-earth elements [9] lowers the tem-perature of the maximum of dielectric permittivity con-siderably increases the diffuseness of the phase transi-tion, and makes the characteristic properties of therelaxors more pronounced.
The goal of the present work was to investigate thepolarization processes occurring in the relaxor ferro-electric SBN-0.75. The behavior of the various proper-ties of SBN-0.75, in particular, of the dispersion char-acteristics of its dielectric permittivity in the region of
1063-7834/03/4511- $24.00 © 22171
the phase transition, has been a subject of many publi-cations (see, e.g., [10]). Research has been focused onSBN-0.75 because it has the largest diffuseness of thephase transition and the most clearly pronouncedrelaxor properties of this composition among all otherSBN compounds. It is in SBN-0.75 that nanodomains[11] known to be specific to relaxor ferroelectrics havebeen observed. At the same time, polarization processes(polarization kinetics, quasi-static dielectric hysteresisloops), whose investigation in other compositions haverevealed a number of features characteristic of relaxors[6–8], have not been studied in the SBN-0.75.
Our present investigation of polarization processesin SBN-0.75 was performed in various field regimes,namely, under the application of dc, slowly varying(quasi-static), and pulsed electric fields. Measurementsin dc and quasi-static fields make it possible to obtain aresponse of longest lived metastable states of a crystaland polarizations which most closely approach levelsof thermodynamic equilibrium. The experimental tech-nique employed in our previous studies [6, 7] offeredthe possibility of investigating the slow part of thepolarization kinetics for times in excess of 15 s. Thebroadened scope of techniques employed in this studyalso made it possible to explore the kinetics of the faststage of the process.
2. EXPERIMENTAL TECHNIQUES
The polarization variation in dc and quasi-staticfields was measured with an equal-arm electrometricbridge, with the sample under study and the source ofpolarizing voltage V connected in one arm, a referencecapacitor C and the source of compensating voltage vconnected in the other, and a V7-29 electrometer servingas a null indicator when balancing the bridge across thebridge diagonal. The voltage compensation across thediagonal was attained automatically with an IBM PC and
003 MAIK “Nauka/Interperiodica”

2172
GLADKIŒ
et al
.
controllable peripherals. The maximum bridge sensitiv-ity in voltage was 20 µV, and in charge, 2 × 10⁻⁹ µC(C = 10 pF). The compensating voltage v displayed onthe monitor, the time t, the field strength E = V/d, andthe polarization P are related through the expressionv (t) = SP(t)/C + ESt/ρC, where S is the sample elec-trode area and ρ is the sample electrical resistivity.After estimating the smallest possible value of ρ forlong times, where the relaxation of the polarization Ppractically stops and the v (t) curve becomes a straightline (v (t) = ESt/ρC), the polarization P was calculated.For a high electrical resistivity ρ, the electrical conduc-tivity may be neglected and we can write P(t) = Cv (t)/Sto sufficient accuracy. All measurements of the SBN-
30
20
10
0
ε ×
103
20 40 60 80 100T, °C
2
1
Fig. 1. Temperature behavior of the dielectric permittivity εof (1) SBN-0.61 and (2) SBN-0.75.
2.0
1.0
0.5
0
∆P, µ
C/c
m2
250 260 280 300 320T, K
1.5
2.5
Fig. 2. Variation of the polarization ∆P of the SBN-0.75crystal with temperature in a zero electric field.
PH
0.75 polarization were corrected for the electrical con-ductivity. The computerized bridge used for electro-metric measurements of the polarization is described inconsiderable detail in [12, 13]. The polarization wasmeasured in two electric field variation modes; in oneof them, the polarization relaxation after switching onand switching off the dc field (the polarization anddepolarization processes) was investigated, and in theother, the polarization was measured under a slow peri-odic field variation (quasi-static loops of the dielectrichysteresis). The fast component of the polarizationrelaxation was determined under application of pulsedfields by measuring the switching currents using theMerz technique [2]. We used pulsed fields with a lead-ing edge of not longer than 25 × 10–9 s and a durationfrom 3 × 10⁻⁴ to 10 s; the highest field strength was 10–12 kV/cm. The signal was measured with a high-fre-quency ADC board interfaced with an IBM PC, and thevariation of the polarization (switching) current withtime, i(t), was displayed in real time on the monitor.The maximum signal resolution was 2 × 10⁻⁸ s. Thedielectric permittivity was measured using the standardbridge method at a frequency of 1 kHz. The sampleused in the studies was a rectangular plate 3 × 3 ×0.5 mm in size whose major faces were perpendicularto the Z axis. Electrodes were deposited on these faceswith conducting silver paste.
The ferroelectric characteristics of the crystals stud-ied are displayed graphically in Figs. 1 and 2. Figure 1presents temperature dependences of the dielectric per-mittivity ε33 of SBN-0.75 and SBN-0.61 crystals. Thegreater part of the diffuseness in ε33(T) for SBN-0.75 isin agreement with the data reported in [2, 3, 10]. Thevariation of the polarization with temperature in theSBN-0.75 sample was measured in a zero electric fieldis shown in Fig. 2 (the pyroelectric effect); the variationis seen to extend over a broad temperature range includ-ing the maximum in dielectric permittivity as a result ofthe total sample polarization being uncompensated (theunipolarity). We readily see that the polarization growsnearly linearly with temperature under cooling and thatthe pyroelectric coefficient is a constant and does notexhibit any anomalies; furthermore, there is a clearlypronounced temperature hysteresis. The pyroelectriccoefficient is 0.04 µC/K.
3. RESULTS AND DISCUSSION
Recall that in conventional homogeneous ferroelec-trics that are described satisfactorily in terms of theLandau–Ginzburg–Devonshire theory [1, 2] the freeenergy F = α0(T – Θ)P2/2 + βP4/4 in the polar phase atT < Θ has the form of a double-minimum function ofpolarization P, where α0 and β are constants; the spon-taneous polarization Ps = [α0(T – Θ)/2β]1/2 and thecoercive field Ec = [2α0(T – Θ)/3][2α0(T – Θ)/3β]1/2,which is equal to one half the width of the dielectrichysteresis loop, are unambiguously defined, while the
YSICS OF THE SOLID STATE Vol. 45 No. 11 2003
SPECIFIC FEATURES IN THE FERROELECTRIC PROPERTIES 2173
15
10
5
0 50 100 150
P, µC/cm2
(a)
t, min
0 1 2 3 4 5
2
4
6
(b)11.2
10.8
10.4
10.0
9.6
0 50 100 t, min
0.04
0.08
0.12
g(t)
0 5 10 15 20 ln(τ/t0)
(c)
0.20
0.15
0.10
0.05
00 5 10 15 ln(τ/t0)
(d)
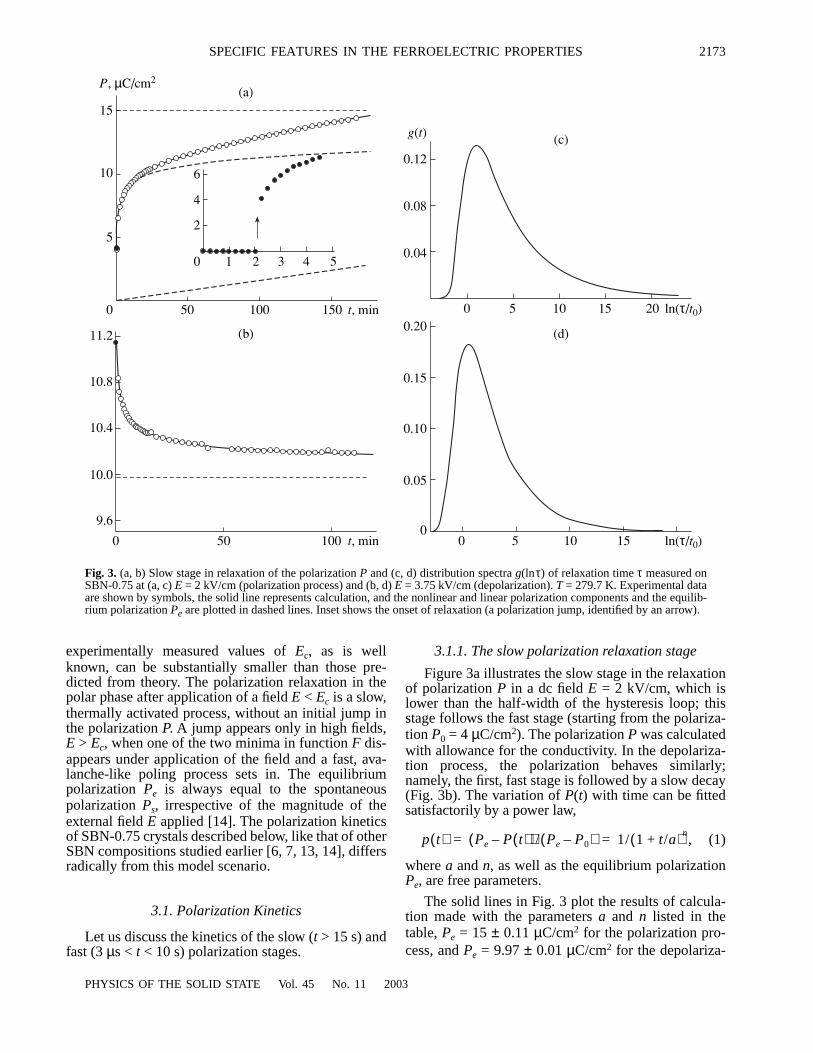
Fig. 3. (a, b) Slow stage in relaxation of the polarization P and (c, d) distribution spectra g(lnτ) of relaxation time τ measured onSBN-0.75 at (a, c) E = 2 kV/cm (polarization process) and (b, d) E = 3.75 kV/cm (depolarization). T = 279.7 K. Experimental dataare shown by symbols, the solid line represents calculation, and the nonlinear and linear polarization components and the equilib-rium polarization Pe are plotted in dashed lines. Inset shows the onset of relaxation (a polarization jump, identified by an arrow).
experimentally measured values of Ec, as is wellknown, can be substantially smaller than those pre-dicted from theory. The polarization relaxation in thepolar phase after application of a field E < Ec is a slow,thermally activated process, without an initial jump inthe polarization P. A jump appears only in high fields,E > Ec, when one of the two minima in function F dis-appears under application of the field and a fast, ava-lanche-like poling process sets in. The equilibriumpolarization Pe is always equal to the spontaneouspolarization Ps, irrespective of the magnitude of theexternal field E applied [14]. The polarization kineticsof SBN-0.75 crystals described below, like that of otherSBN compositions studied earlier [6, 7, 13, 14], differsradically from this model scenario.
3.1. Polarization Kinetics
Let us discuss the kinetics of the slow (t > 15 s) andfast (3 µs < t < 10 s) polarization stages.
PHYSICS OF THE SOLID STATE Vol. 45 No. 11 200
3.1.1. The slow polarization relaxation stage
Figure 3a illustrates the slow stage in the relaxationof polarization P in a dc field E = 2 kV/cm, which islower than the half-width of the hysteresis loop; thisstage follows the fast stage (starting from the polariza-tion P0 = 4 µC/cm2). The polarization P was calculatedwith allowance for the conductivity. In the depolariza-tion process, the polarization behaves similarly;namely, the first, fast stage is followed by a slow decay(Fig. 3b). The variation of P(t) with time can be fittedsatisfactorily by a power law,
(1)
where a and n, as well as the equilibrium polarizationPe, are free parameters.
The solid lines in Fig. 3 plot the results of calcula-tion made with the parameters a and n listed in thetable, Pe = 15 ± 0.11 µC/cm2 for the polarization pro-cess, and Pe = 9.97 ± 0.01 µC/cm2 for the depolariza-
p t( ) Pe P t( )–( )/ Pe P0–( ) 1/ 1 t/a+( )n,= =
3

2174 GLADKIΠet al.
Relaxation parameters (a, n) of SBN-0.75 crystals
Processa n
fast stage slow stage fast stage slow stage
Polarization, E = 2 kV/cm 0.68 µs 0.52 ± 0.008 min 0.035 0.206 ± 0.004
Depolarization 0.51 ± 0.02 min 0.32 ± 0.01
tion process. The symbols indicate experimental data.The nonexponential relaxation p(t) is related to the nor-malized distribution function f(τ) of relaxation times τ(assuming the relaxation centers to be independent)through
(2)
and the normalized dimensionless function g(lnτ) =τf(τ), which characterizes the lnτ distribution, or the
p t( ) f τ( ) t/τ–( ) τ ,dexp
0
∞
∫=
0.3
i, A
/cm
2
0.2
0.1
0 50 100 150 200 250 300t, µs
(a)
6
4
2
∆P, µ
C/c
m2
0 50 100 150 200t, µs
0
5
10
15
20
25
30
∆P, µ
C/c
m2
4
3
2
1
56
7(b)
Fig. 4. Evolution (a) of the switching current i and (b) of thepolarization P in the fast polarization relaxation stageobtained on an SBN-0.75 crystal in various pulsed electricfields E: (1) 1, (2) 2, (3) 4, (4) 6, (5) 7, (6) 8, and (7) 9 kV/cm.
4
5
6
7
PH
distribution of barrier energies for relaxation centersU = kTln(τ/τ0), is connected with the power-law relax-ation (1) through the Laplace transform [15] and can bewritten as
(3)
Broad g(lnτ) functions including very large values of τcharacteristic of relaxors are also presented in Fig. 3 forthe polarization and depolarization processes.
3.1.2. The fast polarization relaxation stage
Figure 4 displays the fast stage of the polarization(polarization jump) in SBN-0.75, which ends at the ini-tial point P0 of the slow relaxation in Fig. 3. In contrastto homogeneous ferroelectrics [1, 2], where switchingcurrents for E > Ec exhibit characteristic maxima indi-cating a change in polarization with acceleration, inSBN-0.75 crystals an abrupt process starts, as a rule, infields far exceeding the half-width of the dielectric hys-teresis loop or is not observed altogether up to break-down fields. Figure 4a illustrates the dependence of theswitching currents i(t) on time in an (originally polydo-main) SBN-0.75 crystal. An abrupt process, qualita-tively similar to that observed to occur in homogeneousferroelectrics, starts in fields considerably in excess ofthe coercive field Ec (the quantity Ec is discussedbelow). In lower fields, including those less than thehalf-width of the hysteresis loop, the switching currentsdecay rapidly and nonexponentially. The variation ofpolarization P(t) with time for this interval of fields(Fig. 4b) follows power-law relation (1) to sufficientaccuracy. The parameters a and n of the polarizationrelaxation are listed in the table. Figure 5 displays theP(E) relations for the original poly- and single-domaincrystals; these relations were obtained by integratingthe current i(t) (Fig. 4) with respect to time. The P(E)relations are characterized in all the crystals by asmooth growth of P with increasing field (up to E @ Ec
in polydomain samples, which indicates the increase inthe poled volume with the field), with the saturatedvalue of the switched charge P in the single-domainstate being far less than that in the polydomain state. Itshould be stressed that the P(E) curves obtained onsamples of the same composition differ strongly inshape; therefore, the case illustrated in Fig. 4 is notactually characteristic of the given composition. Theabsence of a switching fields maximum over a broadinterval of currents in SBN crystals may be accounted
g τln( ) 1/Γ n( )( ) a/τ( )na/τ–( ).exp=
YSICS OF THE SOLID STATE Vol. 45 No. 11 2003

SPECIFIC FEATURES IN THE FERROELECTRIC PROPERTIES 2175
for qualitatively as being due to the broad distributionof relaxation times within the volume of an inhomoge-neous crystal. The abrupt process observed to occur inhigher fields, which qualitatively resembles that seen inhomogeneous ferroelectrics, likewise cannot be dis-cussed in terms of the switching times, the languageaccepted for a model description of the process [2],because the polarization P (proportional to the poledvolume) grows as the field increases.
Summing up the above studies of the fast and slowpolarization stages, one may conclude that the polingkinetics in external fields, both less and larger than thehalf-width of the hysteresis loop, can be fitted satisfac-torily, on the whole, by power law (1). The table liststhe polarization relaxation parameters for the fast andslow stages calculated for a field of 2 kV/cm.
3.2. Quasi-Static Dielectric Hysteresis Loops
Structural disorder, which is responsible for the gen-eration in relaxor ferroelectrics of an internal electricfield randomly distributed over the crystal volume, notonly smears the dielectric permittivity maximum andthe phase transition to the polar state but also bringsabout an anomalous shape of the dielectric hysteresisloops. Figure 6 displays hysteresis loops in the depen-dence of polarization P on field E obtained in SBN-0.75 in a slowly varying (quasi-static) periodic fieldwith a period of 1 h, which corresponds to a frequencyof 10–4 Hz, and in a 60-Hz field at T = 275.7 K. Theloops obtained in the quasi-static field feature anunusual shape; indeed, the first cycles are open nonre-producing trajectories with a gradually decreasingpolarization amplitude, after which the amplitude prac-tically ceases to decrease, thus making all subsequentcycles reproducing. The first cycles obtained in a 60-Hzac field are not fixed; therefore, the loops have the com-
25
15
5
0
∆P, µ
C/c
m2
2 4 6 8 10E, kV/cm
35
2
1
Fig. 5. Switchable polarization P plotted vs. electric field Efor (1) a polydomain and (2) a single-domain SBN-0.75crystal.
PHYSICS OF THE SOLID STATE Vol. 45 No. 11 20
mon elongated, nonsquare shape typical of most con-ventional ferroelectrics and their amplitude is smallbecause only part of the crystal volume is involved inpolarization switching in the field of chosen strengthand frequency. Both loops have unipolarity of the samesign, which sets in in the sample after the first fewswitching cycles. Note that the difference in the polar-ization amplitudes between the first few quasi-staticdielectric hysteresis loops and the diffuseness of thephase transition are particularly large in SBN-0.75 andSBN-0.61 doped by La and Ce [6, 7].
The randomly distributed internal field Ei can quitepossibly affect the observed shape of the quasi-statichysteresis loop. The field Ei distorts the symmetric dou-ble-minimum free-energy function, which becomesasymmetric with minima of different depth correspond-
15
10
5
0
–5
–10
–15
P, µC/cm2
–4–8 4 8E, kV/cm
(a)
4
2
0
–2
–4
–4–8 4 8E, kV/cm
(b)
Fig. 6. Dielectric hysteresis loops obtained in SBN-0.75 in(a) a quasi-static and (b) a 60-Hz electric field.
03

2176 GLADKIΠet al.
ing to a metastable and a stable state. Because Ei is arandom quantity, the depths of the minima, their mutualpositions in the sample volume, and the heights of thebarriers separating these states are likewise randomquantities. Before application of an external electricfield, the crystal sample resides in a mixed state, withone part of the crystal being in the stable and the otherin the metastable state, with a deep and a shallow min-imum, respectively. After a field of a given strength andduration has been switched on, transitions from meta-stable to stable states with deep minima start in the vol-ume of the crystal and will be accompanied by anincrease in the polarization opposing the applied field.The reverse transition in an oppositely directed field ofa limited magnitude may turn out impossible in prac-tice, because the barriers are too high, as a result ofwhich part of the crystal will not be capable of partici-pating in further polarization switching and the loopamplitude will decrease [6]. It may also be conjecturedthat at certain fields the deep minima act as local traps,or pinning centers for the polarization, thus eliminatingit from the further process [8]. Complete susceptibilityof the loop can possibly be reached if the external fieldis so strong that the internal fields Ei are exceededthroughout the crystal volume.
3.3. Distribution of the Coercive Field in a Relaxor
Investigation of the relaxation within a broad rangeof dc electric fields E shows that relaxors do not have adefinite coercive field Ec, because (unlike the case of a
0.15
0.10
0.05
D(Ec)
0 5 10 15 20Ec, kV/cm
0
5
10
15
20
P, µC/cm2
12
Fig. 7. (1) Dependence of polarization P on field E and(2) distribution D(Ec) of the coercive field Ec in the SBN-0.75 crystal. Circles are experimental data on P, solid line isthe calculated power-law dependence of P on E, squares arejumps in P upon sudden application of a field E, and dashedlines relate to the linear and nonlinear components of thepolarization P(E).
PH
homogeneous ferroelectric), irrespective of the field E,a large part of the initial variation of the polarization ina relaxor is always a fast (jumplike) process whichapparently takes place in the crystal regions where theshallow metastable minimum of the local free energy ina field E is either very small or altogether absent (seeSection 3.1). Our experimental data, complementedwith fairly simple assumptions, make it possible to con-struct a possible distribution of the coercive field overthe SBN-0.75 crystal volume. The fractional volumewith a definite coercive field Ec is proportional to theamplitude of the fast polarization appearing abruptlyupon application of a field E = Ec, without taking intoaccount its linear component along this field. Figure 7presents, in graphical form, the dependence of polariza-tion P on field E, which is one quarter of the period ofthe hysteresis loop shown in Fig. 6a. The values of P areclose to those of the jumps in P denoted by squares inFig. 7, which permits us to assume that the P(E) depen-dence roughly reflects the behavior of the fast part ofpolarization under application of the field E. The P(E)dependence can be satisfactorily described by the samepower-law function as the polarization relaxation P(t):
(4)
where Pn(E) = P∞ – (P∞ – P0)/(1 + E/b)c is the nonlinearcomponent, P∞ is the limiting value of Pn for E ∞,and P∞, b, and c are free parameters used in fitting theexperimental data. The solid line in Fig. 7 is a calcu-lated curve with parameters χ = 0.44–0.47 µC/kV cm,P∞ = 15.3–14.7 µC/cm2, b = 2.0–3.5 kV/cm, and c =1.4–2.7, and the circles are the experimental data. Con-
sider the integral = P∞. Because Pn(E)
may be considered proportional to the fraction of thecrystal volume becoming poled under the application offield E, which is the coercive field for this volume frac-tion (Pn = kv ), and P∞ = kV (V is the total volume of thecrystal), the function D(Ec) = dv /VdEc = dPn/P∞dEc
characterizes the probability density of the coercive
field Ec in the crystal and = 1; i.e., this
function is normalized. The most probable value of Ec
coinciding with the maximum in the D(Ec) distributionis seen to correspond to 2 kV/cm.
The probability density D(Ec) of Ec should varyslightly, because the P(E) curves used to construct itare, generally speaking, not reproducing. In particular,the P(E) curves and the distribution functions D(Ec)will be different in the cases where a crystal is polarizedfrom initial polydomain and single-domain states. Notethat homogeneous ferroelectrics with a slim cantedhysteresis loop may also have broad coercive-field dis-tributions [16] (in contrast to a homogeneous ideal fer-roelectric with a square-shaped hysteresis loop, whoseD(Ec) is always a delta function).
P E( ) Pn E( ) χE,+=
Pn E( )dEd
----------------- Ed0
∞∫
D Ec( ) Ecd0
∞∫
YSICS OF THE SOLID STATE Vol. 45 No. 11 2003

SPECIFIC FEATURES IN THE FERROELECTRIC PROPERTIES 2177
4. CONCLUSIONS
Thus, the features observed in the dielectric proper-ties of SBN-0.75 crystals and reported here are indica-tions of a structural disorder characteristic of ferroelec-tric relaxors. These features are most pronounced inthis composition of the strontium–barium niobate solidsolution and may be considered as a measure of disor-der in the structure. Because of the long relaxationtimes and of the broad distribution spectrum of thesetimes in the crystal volume, they are reliably revealedonly in slow measurements.
ACKNOWLEDGMENTS
This study was supported by the Russian Founda-tion for Basic Research (project no. 02-02-16823) andINTAS (grant no. 01-0173).
REFERENCES
1. G. A. Smolenskiœ, V. A. Bokov, V. A. Isupov, N. N. Kraœ-nik, R. E. Pasynkov, and M. S. Shur, Ferroelectrics andAntiferroelectrics (Nauka, Leningrad, 1971), p. 355.
2. M. E. Lines and A. M. Glass, Principles and Applica-tions of Ferroelectrics and Related Materials (OxfordUniv. Press, Oxford, 1977; Mir, Moscow, 1981).
3. Yu. S. Kuz’minov, Ferroelectric Crystals for Control-ling Laser Radiation (Nauka, Moscow, 1982), p. 400.
4. L. E. Cross, Ferroelectrics 76, 241 (1987).
5. T. S. Chernaya, B. A. Maksimov, T. R. Volk, et al., Fiz.Tverd. Tela (St. Petersburg) 42, 1668 (2000) [Phys. SolidState 42, 1716 (2000)].
6. V. V. Gladkiœ, V. A. Kirikov, S. V. Nekhlyudov, et al.,Pis’ma Zh. Éksp. Teor. Fiz. 71 (1), 38 (2000) [JETP Lett.71, 24 (2000)].
PHYSICS OF THE SOLID STATE Vol. 45 No. 11 20
7. V. V. Gladkiœ, V. A. Kirikov, T. R. Volk, and L. I. Ivleva,Zh. Éksp. Teor. Fiz. 120 (3), 678 (2001) [JETP 93, 596(2001)].
8. T. Granzow, V. Dorfler, Th. Woike, et al., Phys. Rev. B63, 174101 (2001).
9. T. R. Volk, V. Yu. Salobutin, L. I. Ivleva, et al., Fiz.Tverd. Tela (St. Petersburg) 42 (11), 2006 (2000) [Phys.Solid State 42, 2129 (2000)].
10. W. H. Huang, D. Viehland, and R. R. Neurgaonkar,J. Appl. Phys. 76, 490 (1994); R. R. Neurgaonkar,J. R. Oliver, W. K. Cory, et al., Ferroelectrics 160, 269(1994).
11. D. Viehland, Z. Xu, and W.-H. Huang, Philos. Mag. A71, 205 (1995).
12. V. V. Gladkiœ, V. A. Kirikov, S. V. Nekhlyudov, andE. S. Ivanova, Fiz. Tverd. Tela (St. Petersburg) 39 (11),2046 (1997) [Phys. Solid State 39, 1829 (1997)].
13. V. V. Gladkiœ, V. A. Kirikov, S. V. Nekhlyudov, et al., Fiz.Tverd. Tela (St. Petersburg) 42 (7), 1296 (2000) [Phys.Solid State 42, 1334 (2000)].
14. V. V. Gladkiœ, V. A. Kirikov, and T. R. Volk, Fiz. Tverd.Tela (St. Petersburg) 44 (2), 351 (2002) [Phys. SolidState 44, 365 (2002)].
15. V. I. Ditkin and A. P. Prudnikov, Handbook on Opera-tional Calculus (Vysshaya Shkola, Moscow, 1965),p. 466.
16. V. V. Gladkiœ, V. A. Kirikov, S. V. Nekhlyudov, andE. S. Ivanova, Fiz. Tverd. Tela (St. Petersburg) 41 (3),499 (1999) [Phys. Solid State 41, 447 (1999)].
Translated by G. Skrebtsov
03