ABSTRACT STATUS : Till March 2008 - Uttarakhand Pollution ...
Sp
BLB
a
ARR1A
KPRNCog
1
ma2pcg1lirgpaaTdPbb
0d
Applied Soil Ecology 61 (2012) 305– 319
Contents lists available at SciVerse ScienceDirect
Applied Soil Ecology
journa l h o me page: www.elsev ier .com/ locate /apsoi l
pecific enumeration and analysis of the community structure of culturableseudomonads in agricultural soils under no-till management in Argentina
etina Agaras, Luis G. Wall, Claudio Valverde ∗
aboratorio de Bioquímica, Microbiología e Interacciones Biológicas en el Suelo, Departamento de Ciencia y Tecnología, Universidad Nacional de Quilmes. Roque Sáenz Pena 352,1876BXD, Buenos Aires, Argentina
r t i c l e i n f o
rticle history:eceived 22 June 2011eceived in revised form6 November 2011ccepted 21 November 2011
eywords:seudomonas
a b s t r a c t
Members of the Pseudomonas genus have been isolated and identified worldwide as plant probioticmicroorganisms. Little is known about the dynamics of pseudomonads population in extensive agri-cultural systems under the influence of biotic and abiotic factors. As part of the national consortiumBIOSPAS devoted to study soil biology and its relationship with productivity, our lab began to character-ize pseudomonad populations in agricultural soils under no-till management. We here report the set upand application of a combination of selective plating and PCR-RFLP analysis of the genus specific gacA andoprF genes, to quantify and study the community structure of culturable pseudomonads in bulk soil and
hizosphereo-tillageommunity structureprFacA
rhizosphere samples. The specificity of both methods has been verified by 16S rDNA and oprF sequencing.The application of selective plating and gacA/oprF PCR-RFLP analyses revealed differences in the amountand predominant type of culturable pseudomonads among geographical locations, among treatments,and between rhizospheric and bulk soil. The results indicate that these simple methods prove useful tosystematically monitor pseudomonads structure in bulk and rhizospheric soils along sampling periods
nd ag
covering crop rotations a. Introduction
Bacteria are key players in soil ecosystems as participants inajor nutrient cycles and interactions with other microorganisms
nd eukaryotes as components of the food web (Cho and Tiedje,000). In particular, bacteria have important roles in determiningroductivity of agricultural systems because certain species canause crop diseases whereas other species can promote plantrowth and/or health (Raaijmakers et al., 2009; Schippers et al.,987). Among plant-beneficial bacteria, the pseudomonads have
ong been recognized as a group of plant probiotic microorgan-sms (Mercado-Blanco and Bakker, 2007), because of their goodoot-colonizing habit and a variety of mechanisms for plantrowth stimulation or plant protection, including phytohormoneroduction, phosphate solubilization, induced systemic resistancend production of antibiotics (Haas and Defago, 2005; Lugtenbergnd Kamilova, 2009; Preston, 2004; Richardson et al., 2009).hese traits make pseudomonads attractive microorganisms forevelopment of agricultural inputs (Walsh et al., 2001). The genus
seudomonas comprises motile Gram negative and oxidase positiveacilli that are almost ubiquitous in Earth, and it is characterizedy its intrinsic genetic and physiological diversity (Peix et al.,∗ Corresponding author. Tel.: +54 11 4365 7100x4313; fax: +54 11 4365 7132.E-mail address: [email protected] (C. Valverde).
929-1393/$ – see front matter © 2011 Elsevier B.V. All rights reserved.oi:10.1016/j.apsoil.2011.11.016
ricultural practices at different locations.© 2011 Elsevier B.V. All rights reserved.
2009). Representative species usually found in soil include theplant probiotic P. fluorescens, P. putida, P. chlororaphis and P. stutzeri(Haas and Defago, 2005), and the plant pathogens P. syringae, P.cicchorii and P. savastanoi (Peix et al., 2009). Specific plant probioticstrains appear to be enriched in the rhizosphere of different plants(Picard and Bosco, 2008).
No-till agriculture dominates cropping practices in Argentina(ca. 25 millions ha), representing more than 75% of the total cul-tivated area (source: AAPRESID; www.aapresid.org.ar). Comparedto conventional tillage, this conservative practice tends to preservesoil carbon and water content, to reduce soil erosion and to improvesoil aggregation (Derpsch et al., 2010). There are however, someconcerns about the success of no-till practice related to the nega-tive impact of market-driven monoculture (in particular, soybean)and to inadequate nutrient management. Consequently, agricul-tural producers recognized the need to promote good agriculturalpractices, including crop rotations and nutrient maintenance, inparallel to monitoring soil health to ensure long term productiv-ity. Contrary to well established physical and chemical indicatorsof soil properties, biological indicators of soil quality and produc-tivity are lacking. In this context, a national public–private researchinitiative (The BIOSPAS project) started in 2009 to identify biolog-
ical indicators of soil quality and productivity in agricultural soilsunder no-till management in Argentina (Wall, 2011).Despite the number of pseudomonads isolates characterizedso far, their contribution to soil ecology is largely unexplored,
3 oil Eco
pesiapBllgttSnpiemsNlBiscraagaag
2
2
i1e
2
ge(fCaptn
mAr1ic0a0s
06 B. Agaras et al. / Applied S
articularly in extensive agricultural systems. Evidence gath-red from various cropping systems at diverse geographical sitestrongly suggest that the structure of pseudomonads communitiesn soil is influenced by the plant species, soil conditions, crop man-gement system, and interactions with other biological agents likeredators and competitors (Picard and Bosco, 2008). As part of theIOSPAS consortium, we aim to characterize pseudomonad popu-
ations in soil and the influence that soil type, crop rotations andand management have on the community structure. To meet theseoals, we rely on specific detection methods. For pseudomonads,hree genes have been utilized for phylogenetic diversity studies athe genus levels: 16S rDNA, gacA and oprF (Bodilis et al., 2004; deouza et al., 2003; Pesaro and Widmer, 2006). gacA encodes the cog-ate transcriptional regulator of the membrane associated sensorrotein GacS. The GacS/GacA two-component system is involved
n control of secondary metabolism, biocontrol and adaptation tonvironmental stresses (Heeb and Haas, 2001). oprF encodes theajor outer membrane porin, possibly involved in the slow non-
pecific transmembrane diffusion of solutes (De Mot et al., 1994;estorovich et al., 2006). The oprF gene sequence has been uti-
ized to characterize pseudomonads isolates (Bodilis et al., 2004;odilis et al., 2006), but it has not been exploited yet to character-
ze the structure of pseudomonads communities in environmentalamples. We here report: (1) the procedure to study the size andommunity structure of culturable pseudomonads in bulk soil andhizospheric soil samples from agricultural plots under no-till man-gement in Argentina, based on a combination of selective platingnd PCR-RFLP analyses using newly designed oligonucleotides tar-eting the genus specific gacA and oprF genes; (2) the results of thenalysis of the first sampling of the BIOSPAS project that serve as
starting point of a future study of the dynamics of this bacterialroup according to site and soil management.
. Methods
.1. Bacterial strains
The typed strains used to set up the PCR protocols are listedn Table 1. All strains were cultured on S1 medium (Gould et al.,985) and on nutrient agar (NA; 40 g/L blood agar base; 5 g/L yeastxtract), at 28 ◦C.
.2. Primer design and PCR amplification
Oligonucleotides targeting conserved regions within oprF andacA genes were designed manually, based on the alignment of ref-rence sequences of both genes retrieved from GenBank databaseApril 2010; Supplementary Table S1). The alignments were per-ormed with ClustalX version 1.64b (Thompson et al., 1994).andidate primers were tested in silico using AmplifiX v.1.5.4 (avail-ble at http://ifrjr.nord.univ-mrs.fr/AmplifX), and the best primerairs for each gene were evaluated in vitro by PCR, using a collec-ion of target and non-target strains (Table 1). The properties of theewly designed primers are shown in Table 3.
PCR conditions were optimized to obtain a single amplified frag-ent. Typically, 25 �l-reaction mixtures contained 1× buffer (PB-L,rgentina), 0.2 mM dNTPs (PB-L, Argentina), 0.8 �M primers (Invit-ogen, USA), 2.0 mM MgCl2, 5% (v/v) DMSO (only for gacA PCR), and
U of Taq polymerase (PB-L, Argentina). The PCR cycle consistedn an initial denaturation step of 5 min at 94 ◦C, followed by 35ycles of 1 min at 92 ◦C, 0.75 min at 57 ◦C (oprF) or 56 ◦C (gacA), and
.75 min at 72 ◦C; and a final extension step at 72 ◦C for 5 min. Aftermplification, 2 �l of each reaction was run in 1% agarose gels in.5× Tris–borate–EDTA (TBE) at 10 V/cm for 50 min. The gel wastained with ethidium bromide and visualized under UV light.logy 61 (2012) 305– 319
2.3. PCR-RFLP
Restriction analysis of oprF and gacA genes was set up in sil-ico with Clone Manager 7 v7.11 (Scientific & Educational Software,USA), using the expected amplicons generated with the designedprimers (Table 3) on reference oprF and gacA sequences. A set ofclassical enzymes was tested to identify those producing differen-tial RFLP patterns for each reference Pseudomonas species.
PCR-RFLP assays were carried out in a final volume of 20 �l,containing 10 �l of PCR mix and 2 U of the endonucleases HaeIII(Promega) or TaqI (Fermentas) for oprF amplicons; and HaeIII orMboI (Fermentas) for gacA products. Reactions were incubated at37 ◦C (HaeIII and MboI) or 62 ◦C (TaqI) for 3 h. The restriction prod-ucts were separated by electrophoresis in 2% agarose gels in 0.5×TBE at 6 V/cm for 2 h. Gels were stained with ethidium bromide andDNA banding patterns were visualized under UV light.
2.4. Double check of Gould’s S1 medium selectivity and oprFprimer specificity
Fifty isolates (Table 2) from a variety of soils and plant root sys-tems were randomly selected from S1 agar plates, trying to pickup different fluorescent or non fluorescent colony morphologies,to confirm the selective power of S1 medium and the specificityof the designed oprF primers. To this end, the 16S rDNA gene wasPCR amplified with primers P0 and P6 (Picard et al., 2000) and theoprF gene was amplified with oprF-FW2 and oprF-Rev2 primers(Table 3). Partial DNA sequencing was carried out by Macrogen Inc.(Seoul, Korea) with primers P0 for 16S rDNA amplicons, and oprF-FW2 for oprF amplicons. The complete set of partial 16S rDNA andoprF sequences have been submitted to GenBank under Submis-sion code 1461082. The obtained 16S rDNA sequences were usedto query the Seqmatch tool of the Ribosomal database project II(Cole et al., 2009). Partial oprF sequences were analyzed with theBlastN tool, in the NCBI database.
Phylogenetic analyses were carried out with the partial 16srRNA and oprF sequences of isolates. Sequences of reference strainsobtained from GenBank were also included. Neighbor-joining treeswere inferred from evolutionary distances calculated with theKimura 2-parameter formula, using the software MEGA v4 (Tamuraet al., 2007). Confidence analyses were undertaken using 1000bootstrap replicates. All positions containing alignment gaps andmissing data were eliminated only in pairwise sequence compar-isons (Pairwise deletion option). Phylogenetic analysis was alsoperformed on sequence concatenation of conserved regions of the16s rRNA (300 nt, from position 225 to 524 of the P. fluorescens Pf-5 16s rRNA gene; AJ417072), and oprF (276 nt, from position 282to 558 of the P. fluorescens Pf-5 oprF gene; NC004129). This wasdone with the 50 isolates and some of the reference strains usedfor oprF gene phylogeny (when both sequences were available fromGenBank), and following the same methodology.
2.5. Soil and plant root samples
The soil and root samples used to estimate pseudomonadscounts were collected in agricultural fields located across a west-east transect in the most productive region in the ArgentineanPampas, specifically at Bengolea, Córdoba Province (33◦01′31′′S;63◦37′53′′W); Monte Buey, Córdoba Province (32◦58′14′′S;62◦27′06′′W); Pergamino, Buenos Aires Province (33◦56′36′′S;60◦33′57′′W); and Viale, Entre Ríos Province (31◦52′59′′S;59◦40′07′′W). In each location, three treatments were defined:
(1) “Good Agricultural Practices” (GAP): sustainable agriculturalmanagement under no-till, subjected to intensive crop rotation,nutrient replacement, and minimized agrochemical use (herbi-cides, insecticides and fungicides); (2) “Bad Agricultural Practices”
B. Agaras et al. / Applied Soil Ecology 61 (2012) 305– 319 307
Table 1Strains used to set up PCR-RFLP protocols.
Strain designation Origin Reference or source
PseudomonadsP. fluorescens CHA0 Tobacco rhizosphere, Payerne, Switzerland Stutz et al. (1986)P. fluorescens Pf-5 Cotton rhizosphere, Texas, USA Howell and Stipanovic (1979)P. aeruginosa PAO1 Clinical isolate; human wound; Melbourne, Australia Holloway (1969)P. aeruginosa Hex1T Hydrocarbon-contaminated soil Pezza et al. (2002)P. aeruginosa sp. Clinical isolate; Hospital de Ninos de La Plata, Argentina Diego Noseda (CINDEFI – La Plata)P. syringae pv. maculicola ES4326 Radish rhizosphere, USA Dong et al. (1991)P. putida KT2440 Grass rhizosphere, mt-2 derivative, Japan Nakazawa (2002)P. putida ATCC 17399 Psycrophilic; Western Utilization Research and
Develop-ment Division of the US. Department ofAgriculture, Albany, California
Stanier et al. (1966)
P. stutzeri AN10 Polluted marine sediments; western Mediterranean Sea Rossello et al. (1991)P. stutzeri ATCC 17588 Clinical isolate; human spinal fluid; Copenhagen, Denmark Stanier et al. (1966)P. stutzeri 2014 Clinical isolate, intrahospitalary infection, Buenos Aires,
ArgentinaDr. D. Centrón (Facultad de Medicina, UBA)
P. stutzeri 2018 Clinical isolate, intrahospitalary infection, Buenos Aires,Argentina
Dr. D. Centrón (Facultad de Medicina, UBA)
P. mendocina 2013 Clinical isolate, intrahospitalary infection, Buenos Aires,Argentina
Dr. D. Centrón (Facultad de Medicina, UBA, Argentina)
P. mendocina 2019 Clinical isolate, intrahospitalary infection, Buenos Aires,Argentina
Dr. D. Centrón (Facultad de Medicina, UBA, Argentina)
Pseudomonas sp. LDe Salina Grande, Jujuy, Argentina Ordonez et al. (2009)Pseudomonas sp. N23 Laguna Negra, Catamarca, Argentina Ordonez et al. (2009)Pseudomonas sp. CF5 Faeces from extreme high altitute wetland Dr. M.E. Farías (LIMLA, Tucumán, Argentina)
Non pseudomonadsEscherichia coli K12 MG1655 W1485 derivative, F− �− Bachmann (1987)E. coli K12 TR1-5 BW3414 derivative, csrA::kan Romeo et al. (1993)Burkholderia cepacia Environmental isolate Diego Noseda (CINDEFI – La Plata)Agrobacterium tumefaciens NTL4 Derivative of NT1, �tetC58 Luo et al. (2001)Serratia marcescens AS-1 Soil isolate, AHL producer, Japan Morohoshi et al. (2007)Bacillus subtilis Microbiología General, Universidad Nacional de Quilmes Reference strain, lab stock.Bacillus cereus Microbiología General, Universidad Nacional de Quilmes Reference strain, lab stock.
t nodu
(wa“splailrti4Iho5a1cosvepc
tstm
Shinorizobium meliloti 2011 Derivative of strain SU47, alfalfa rooAzospirillum brasilense ATCC 29710 Mangrove rhizosphere
BAP): non-sustainable agricultural management under no-tillith high crop monoculture, low nutrient replacement and high
grochemical use (herbicides, insecticides and fungicides); (3)Natural Environment” (NE): as reference, natural grassland waselected in an area of approximately 1 ha close to the cultivatedlots (less than 5 km), where no cultivation was practiced for (at
east) the last 30 years. All sites were managed under no-till fort least the last 5 years, with the exception of 1 year (2004/2005)n Bengolea where the BAP site was chisel plowed. In the fourocalities GAP plots had on average 62% more maize in the cropotation than the BAP plots. GAP had in the last 5 years 50% ofhe winters with crop whereas the BAP had only 20%. In addition,n the GAP, cover crops have been planted in winter in 3 out of
localities. The intensity of rotation expressed as the Rotationndex, calculated as the number of cultures per year, was alwaysigher in GAP than in BAP in each location with average valuesf 1.58 and 1.17, respectively. Soils under BAP used in the last
years 36% more herbicides than GAP. Soybean yield was onverage 24.7% higher in GAP than in BAP whereas maize yield was49.9% higher in GAP. In terms of soil texture there is increasinglay and decreasing sand content from Bengolea to Viale. Valuesf soil organic matter follow the relation NE > GAP > BAP at allites, except in Pergamino where GAP and BAP showed similaralues. Soil N content also followed the same pattern with thexception of Bengolea where GAP had higher values than NE. TheH values varied between 5.5 and 6.7 in all treatments with nolear pattern.
Soil samples were collected in February 2010 (summer) as
riplicates for each treatment-site in three 5-m2 sampling pointseparated at least 50 m from other, taking care not to followhe sowing line in the field. Each sample of the top 10 cm ofineral soil was collected as a composite of 16–20 randomly
les, Australia Meade and Signer (1977)Tarrand et al. (1978)
selected subsamples. Soil subsamples were combined and homog-enized in the field and transported to the laboratory at 4 ◦C.Within 3 days after collection, samples were sieved through 2-mm mesh to remove roots and plant detritus, and stored at 4 ◦Cuntil processing. For root systems, a patch of ca. 300 cm2 of nat-ural pasture was collected per replicate in NE treatment, and1–10 plant specimens per replicate of GAP and BAP treatments,depending on the plant species (maize, soybean) and its size.Care was taken to get the root system together with the sur-rounding soil to avoid root desiccation. Samples were transportedto the lab at 4 ◦C and processed within 1 week after collec-tion.
2.6. Processing of soil and root samples for counting plates
To estimate the population size of culturable Pseudomonasspp. we essentially followed a reported procedure (Raaijmakersand Weller, 2001). Approximately 1 g of sieved soil (2-mmmesh; wet weight) was suspended in 9 ml of saline solu-tion (SS; 0.85%, w/v NaCl), in 15-ml screwed-cap tubes. Tubeswere shaken vigorously for 1 min in a vortex, and immersedfor 1 min in a sonication bath (40 kHz, 160 W, Testlab TB04,Argentina).
We operationally define rhizospheric soil as the biologicalmaterial recovered from thorough washings of roots that havebeen previously shaken by hand to remove loosely adheredsoil. Thus, it is expected that our “rhizospheric soil” sus-pensions contain bacteria from soil particles tightly adhered
to roots as well as from microcolonies present on the rootsurface. To obtain rhizospheric samples, randomly selectedplant roots were harvested from each replicate, and treatedaccording to the definition described above. Approximately 2 g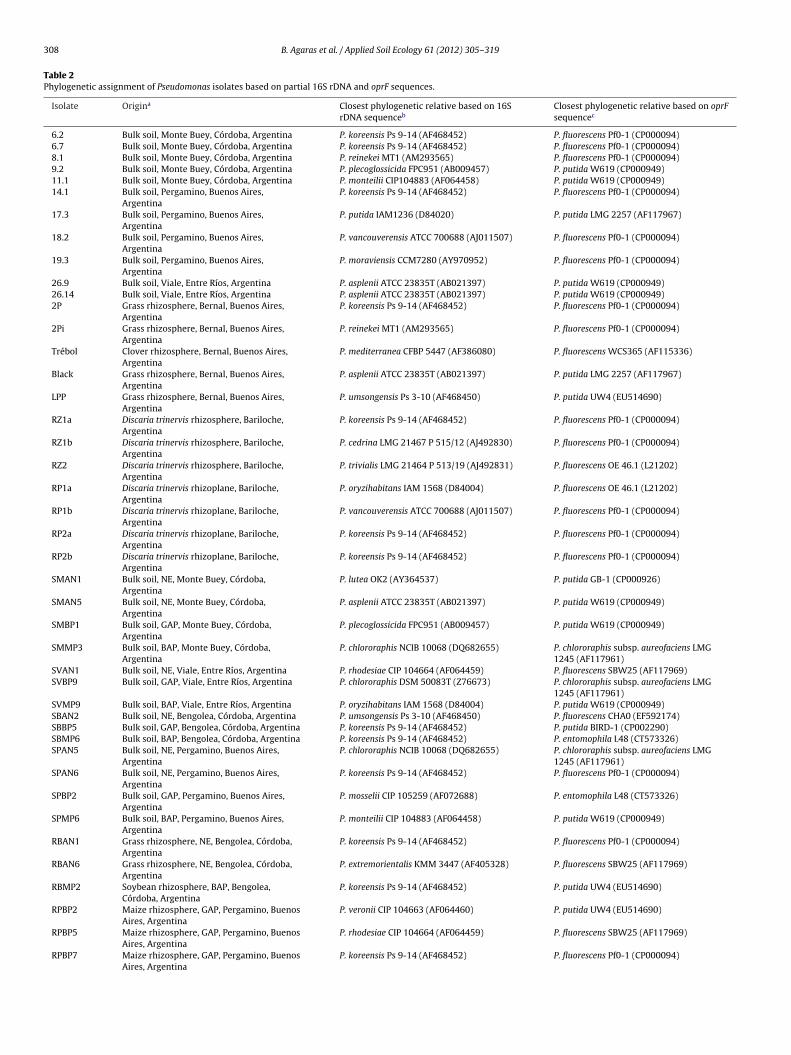
308 B. Agaras et al. / Applied Soil Ecology 61 (2012) 305– 319
Table 2Phylogenetic assignment of Pseudomonas isolates based on partial 16S rDNA and oprF sequences.
Isolate Origina Closest phylogenetic relative based on 16SrDNA sequenceb
Closest phylogenetic relative based on oprFsequencec
6.2 Bulk soil, Monte Buey, Córdoba, Argentina P. koreensis Ps 9-14 (AF468452) P. fluorescens Pf0-1 (CP000094)6.7 Bulk soil, Monte Buey, Córdoba, Argentina P. koreensis Ps 9-14 (AF468452) P. fluorescens Pf0-1 (CP000094)8.1 Bulk soil, Monte Buey, Córdoba, Argentina P. reinekei MT1 (AM293565) P. fluorescens Pf0-1 (CP000094)9.2 Bulk soil, Monte Buey, Córdoba, Argentina P. plecoglossicida FPC951 (AB009457) P. putida W619 (CP000949)11.1 Bulk soil, Monte Buey, Córdoba, Argentina P. monteilii CIP104883 (AF064458) P. putida W619 (CP000949)14.1 Bulk soil, Pergamino, Buenos Aires,
ArgentinaP. koreensis Ps 9-14 (AF468452) P. fluorescens Pf0-1 (CP000094)
17.3 Bulk soil, Pergamino, Buenos Aires,Argentina
P. putida IAM1236 (D84020) P. putida LMG 2257 (AF117967)
18.2 Bulk soil, Pergamino, Buenos Aires,Argentina
P. vancouverensis ATCC 700688 (AJ011507) P. fluorescens Pf0-1 (CP000094)
19.3 Bulk soil, Pergamino, Buenos Aires,Argentina
P. moraviensis CCM7280 (AY970952) P. fluorescens Pf0-1 (CP000094)
26.9 Bulk soil, Viale, Entre Ríos, Argentina P. asplenii ATCC 23835T (AB021397) P. putida W619 (CP000949)26.14 Bulk soil, Viale, Entre Ríos, Argentina P. asplenii ATCC 23835T (AB021397) P. putida W619 (CP000949)2P Grass rhizosphere, Bernal, Buenos Aires,
ArgentinaP. koreensis Ps 9-14 (AF468452) P. fluorescens Pf0-1 (CP000094)
2Pi Grass rhizosphere, Bernal, Buenos Aires,Argentina
P. reinekei MT1 (AM293565) P. fluorescens Pf0-1 (CP000094)
Trébol Clover rhizosphere, Bernal, Buenos Aires,Argentina
P. mediterranea CFBP 5447 (AF386080) P. fluorescens WCS365 (AF115336)
Black Grass rhizosphere, Bernal, Buenos Aires,Argentina
P. asplenii ATCC 23835T (AB021397) P. putida LMG 2257 (AF117967)
LPP Grass rhizosphere, Bernal, Buenos Aires,Argentina
P. umsongensis Ps 3-10 (AF468450) P. putida UW4 (EU514690)
RZ1a Discaria trinervis rhizosphere, Bariloche,Argentina
P. koreensis Ps 9-14 (AF468452) P. fluorescens Pf0-1 (CP000094)
RZ1b Discaria trinervis rhizosphere, Bariloche,Argentina
P. cedrina LMG 21467 P 515/12 (AJ492830) P. fluorescens Pf0-1 (CP000094)
RZ2 Discaria trinervis rhizosphere, Bariloche,Argentina
P. trivialis LMG 21464 P 513/19 (AJ492831) P. fluorescens OE 46.1 (L21202)
RP1a Discaria trinervis rhizoplane, Bariloche,Argentina
P. oryzihabitans IAM 1568 (D84004) P. fluorescens OE 46.1 (L21202)
RP1b Discaria trinervis rhizoplane, Bariloche,Argentina
P. vancouverensis ATCC 700688 (AJ011507) P. fluorescens Pf0-1 (CP000094)
RP2a Discaria trinervis rhizoplane, Bariloche,Argentina
P. koreensis Ps 9-14 (AF468452) P. fluorescens Pf0-1 (CP000094)
RP2b Discaria trinervis rhizoplane, Bariloche,Argentina
P. koreensis Ps 9-14 (AF468452) P. fluorescens Pf0-1 (CP000094)
SMAN1 Bulk soil, NE, Monte Buey, Córdoba,Argentina
P. lutea OK2 (AY364537) P. putida GB-1 (CP000926)
SMAN5 Bulk soil, NE, Monte Buey, Córdoba,Argentina
P. asplenii ATCC 23835T (AB021397) P. putida W619 (CP000949)
SMBP1 Bulk soil, GAP, Monte Buey, Córdoba,Argentina
P. plecoglossicida FPC951 (AB009457) P. putida W619 (CP000949)
SMMP3 Bulk soil, BAP, Monte Buey, Córdoba,Argentina
P. chlororaphis NCIB 10068 (DQ682655) P. chlororaphis subsp. aureofaciens LMG1245 (AF117961)
SVAN1 Bulk soil, NE, Viale, Entre Ríos, Argentina P. rhodesiae CIP 104664 (AF064459) P. fluorescens SBW25 (AF117969)SVBP9 Bulk soil, GAP, Viale, Entre Ríos, Argentina P. chlororaphis DSM 50083T (Z76673) P. chlororaphis subsp. aureofaciens LMG
1245 (AF117961)SVMP9 Bulk soil, BAP, Viale, Entre Ríos, Argentina P. oryzihabitans IAM 1568 (D84004) P. putida W619 (CP000949)SBAN2 Bulk soil, NE, Bengolea, Córdoba, Argentina P. umsongensis Ps 3-10 (AF468450) P. fluorescens CHA0 (EF592174)SBBP5 Bulk soil, GAP, Bengolea, Córdoba, Argentina P. koreensis Ps 9-14 (AF468452) P. putida BIRD-1 (CP002290)SBMP6 Bulk soil, BAP, Bengolea, Córdoba, Argentina P. koreensis Ps 9-14 (AF468452) P. entomophila L48 (CT573326)SPAN5 Bulk soil, NE, Pergamino, Buenos Aires,
ArgentinaP. chlororaphis NCIB 10068 (DQ682655) P. chlororaphis subsp. aureofaciens LMG
1245 (AF117961)SPAN6 Bulk soil, NE, Pergamino, Buenos Aires,
ArgentinaP. koreensis Ps 9-14 (AF468452) P. fluorescens Pf0-1 (CP000094)
SPBP2 Bulk soil, GAP, Pergamino, Buenos Aires,Argentina
P. mosselii CIP 105259 (AF072688) P. entomophila L48 (CT573326)
SPMP6 Bulk soil, BAP, Pergamino, Buenos Aires,Argentina
P. monteilii CIP 104883 (AF064458) P. putida W619 (CP000949)
RBAN1 Grass rhizosphere, NE, Bengolea, Córdoba,Argentina
P. koreensis Ps 9-14 (AF468452) P. fluorescens Pf0-1 (CP000094)
RBAN6 Grass rhizosphere, NE, Bengolea, Córdoba,Argentina
P. extremorientalis KMM 3447 (AF405328) P. fluorescens SBW25 (AF117969)
RBMP2 Soybean rhizosphere, BAP, Bengolea,Córdoba, Argentina
P. koreensis Ps 9-14 (AF468452) P. putida UW4 (EU514690)
RPBP2 Maize rhizosphere, GAP, Pergamino, BuenosAires, Argentina
P. veronii CIP 104663 (AF064460) P. putida UW4 (EU514690)
RPBP5 Maize rhizosphere, GAP, Pergamino, BuenosAires, Argentina
P. rhodesiae CIP 104664 (AF064459) P. fluorescens SBW25 (AF117969)
RPBP7 Maize rhizosphere, GAP, Pergamino, BuenosAires, Argentina
P. koreensis Ps 9-14 (AF468452) P. fluorescens Pf0-1 (CP000094)

B. Agaras et al. / Applied Soil Ecology 61 (2012) 305– 319 309
Table 2 (Continued)
Isolate Origina Closest phylogenetic relative based on 16SrDNA sequenceb
Closest phylogenetic relative based on oprFsequencec
SPSA1 Bulk soil, NE, Pergamino, Buenos Aires,Argentina
P. chlororaphis NCIB 10068 (DQ682655) P. chlororaphis subsp. chlororaphis LMG5004 (AF117962)
SPSA2 Bulk soil, NE, Pergamino, Buenos Aires,Argentina
P. chlororaphis NCIB 10068 (DQ682655) P. chlororaphis subsp. aureofaciens LMG1245 (AF117961)
SPSA5 Bulk soil, NE, Pergamino, Buenos Aires,Argentina
P. tremae CFBP 6111 (AJ492826) P. fluorescens CHA0 (EF592174)
RMAN3 Grass rhizosphere, NE, Monte Buey,Córdoba, Argentina
P. libanensis CIP 105460 (AF057645) P. fluorescens NRRL B-15132 (L21197)
RMAN4 Grass rhizosphere, NE, Monte Buey,Córdoba, Argentina
P. libanensis CIP 105460 (AF057645) P. fluorescens NRRL B-15132 (L21197)
RMAN5 Grass rhizosphere, NE, Monte Buey,Córdoba, Argentina
P. libanensis CIP 105460 (AF057645) P. fluorescens NRRL B-15132 (L21197)
RMAN6 Grass rhizosphere, NE, Monte Buey,Córdoba, Argentina
P. libanensis CIP 105460 (AF057645) P. fluorescens NRRL B-15132 (L21197)
a NE, natural non-disturbed environment; BAP, field plot under bad agricultural practices; GAP, field plot under good agricultural practices.b The closest type strain was identified with the SeqMatch tool of the Ribosomal Database Project (http://rdp.cme.msu.edu/index.jsp), using the following set up for the
s enclat using
p
o1acTanr
wtBmiacp
2
aictTTarctda
TO
earch: strain: type; source: isolate; size: >1200 bp; quality: good; taxonomy: nomc The closest pseudomonad relative was identified with the BlastN tool (NCBI),
arenthesis.
f roots and associated rhizosphere soil were suspended in8.0 ml of SS, subsequently shaken vigorously for 15 min on
rotary platform at 250 rpm to facilitate release of bacterialells adhered to root surface, and then sonicated for 1 min.hereafter, tubes with soil or root samples were centrifugedt 50 × g at room temperature for 1 min, and the super-atant was recovered in a new clean 15-ml or 50-ml tube,espectively.
Serial dilutions of each soil or rhizosphere suspensionsere plated in triplicate on Gould’s S1 plates to count cul-
urable pseudomonads, and on 10% TSA (tryptone-soy agar,iokar) to count total heterotrophic mesophilic bacteria. Bothedia were supplemented with cycloheximide (100 �g/ml) to
nhibit growth of fungi and yeasts. Colony counts were donefter 48 h of incubation at 28 ◦C. The proportion of fluores-ent colonies under UV light (290 nm) was determined on S1lates.
.7. Total DNA from culturable population
To study the community structure of culturable pseudomonads,ll colonies from S1 agar plates (n = 100–200) were resuspendedn a volume of deionized water proportional to the number ofolonies grown on each plate, collected in 1.5-ml tubes, andreated at 100 ◦C in boiling water during 15 min to lyse the cells.reated suspensions were centrifuged at 14,000 rpm for 2 min.he supernatants were recovered in new clean 1.5-ml tubesnd conserved at −20 ◦C until used as a source of DNA for PCReactions. Supernatants lysates from each site and treatment repli-
ate were combined to get only one representative sample perreatment at each geographical site. Typically, 3 �l of 1000-foldiluted lysates were used as template. RFLP assays were dones described above. DNA banding patterns were analyzed withable 3ligonucleotides targeting Pseudomonas spp. gacA and oprF genes for PCR-RFLP analysis.
Gene Function Ampliconsize (bp)a
Primer Se
oprF Non-specific porin 602–683 oprF-FW2oprF-Rev2
ACC
gacA Response regulator 480 gacA-FWgacA-REV
TGA
a The size of the oprF and gacA amplicons were estimated from the genomic sequencesb Melting temperatures were calculated using Oligo Calculator v.3.26 with salt concent
ural. The GenBank entry of the closest match is indicated within parenthesis. default parameters. The GenBank entry of the closest match is indicated within
Bionumerics 4.0 (Applied Maths, Kortrijk, Belgium) by correlationbased clustering (Rademaker et al., 1999).
2.8. Statistics
For every geographical site (four), and for every treatment(three) within each geographical site, the number of replicate sam-ples was three (n = 3). These replicate samples were collected at adistance of ca. 50 m each, and each one corresponded to a compos-ite of 16–20 soil cylinders. Plant roots were sampled in parallelto have 3 replicates per treatment and per site. So, the sam-pling consisted in a total of 4 sites × 3 treatments × 3 replicates = 36soil samples, and an equivalent number of rhizosphere samples.Every sample was processed and plated in triplicate plates. Thus,the data shown in Tables 4 and 5 correspond to averages of3 replicate plates × 3 replicate samples = 9 replicates per treatmentand per site. CFU values were log10-transformed prior to statisticalanalyses. Analysis of variance (ANOVA) was followed, when appro-priate, with Tukey “Honestly Significantly Different” tests withStatistix 8 (version 8.0, Analytical Software, St. Paul, MN) to evalu-ate significant differences between values. Statistics were done atP < 0.05.
3. Results
3.1. Selective power of the Gould’s S1 medium and unbiasedrecovery of pseudomonads from soil and root samples
Among reported media, we chose the Goulds’ S1 selectivemedium (Gould et al., 1985) based on previous publications report-
ing successful recovery of a wide range of pseudomonads fromdifferent habitats (Johnsen et al., 1999; Johnsen and Nielsen, 1999).As there are no commercial S1 formulations available, we veri-fied the selectivity of the S1 medium formulated in our lab byquence (5′ → 3′) Meltingtemperature (◦C)b
Annealingtemperature (◦C)
TCGGYTACTTCHTBACHGANACGGAGTCRGTRTGRCC
52.3–60.560.5–68.7
5757
ATTARGGKSYTRGTDGTCGTCATCARSGCRATCTGGAT
37.0–54.546.9–53.2
5656
of available Pseudomonas spp. genomes in GenBank by 15 March 2011.ration adjusted to 50 mM.
310 B. Agaras et al. / Applied Soil Ecology 61 (2012) 305– 319
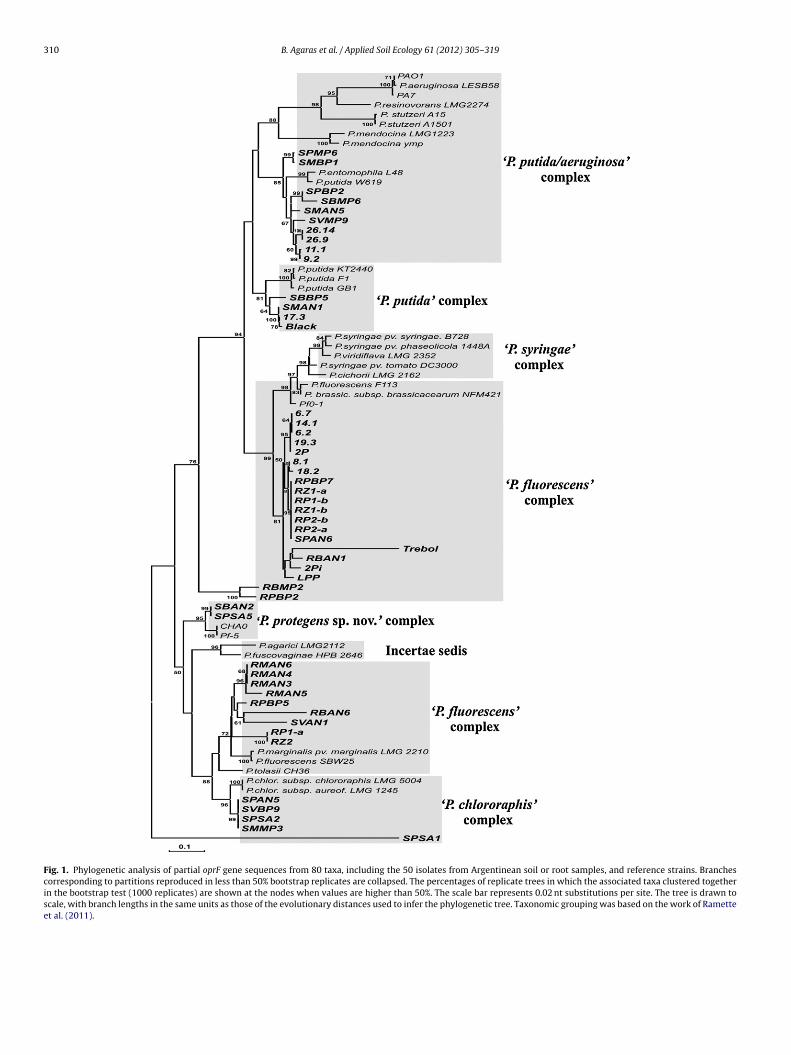
Fig. 1. Phylogenetic analysis of partial oprF gene sequences from 80 taxa, including the 50 isolates from Argentinean soil or root samples, and reference strains. Branchescorresponding to partitions reproduced in less than 50% bootstrap replicates are collapsed. The percentages of replicate trees in which the associated taxa clustered togetherin the bootstrap test (1000 replicates) are shown at the nodes when values are higher than 50%. The scale bar represents 0.02 nt substitutions per site. The tree is drawn toscale, with branch lengths in the same units as those of the evolutionary distances used to infer the phylogenetic tree. Taxonomic grouping was based on the work of Rametteet al. (2011).

B. Agaras et al. / Applied Soil Ecology 61 (2012) 305– 319 311
F ncluda
piSct5sfg(giS
ig. 2. Phylogenetic analysis of 16s rRNA-oprF concatenated genes from 63 taxa, inalysis.
lating either typed pseudomonads or bacterial strains belong-ng to other genera (Table 1). All typed pseudomonads grew in1 medium but none of the non-pseudomonads strains developedolonies after 24–48 h at 28 ◦C. In order to confirm the utility ofhe S1 medium to recover pseudomonads, we built a collection of0 untyped bacterial isolates able to grow in S1 medium, i.e., pre-umably Pseudomonas spp. (Table 2). The isolates were obtainedrom diverse bulk soil and rhizospheric soil samples, from differenteographic locations in Argentina and from different plant species
Table 2). The partial sequences of the 16S rDNA gene and of theenus specific marker gene oprF confirmed that all isolates arendeed members of the Pseudomonas genus (Figs. 1 and 2; Table 2;upplementary Fig. S1). The phylogenetic analyses of 16S rDNA anding the 50 isolates and reference strains. See legend to Fig. 1 for details about the
oprF genes sequences of the 50 pseudomonads isolates confirm thedistribution of these isolates within different Pseudomonas clades(Figs. 1 and 2; Supplementary Fig. S1).
3.2. Specific detection of pseudomonads with improved PCRoligonucleotides targeting gacA and oprF genes
Both gacA and oprF genes are considered specific for the Pseu-domonas genus (Bodilis and Barray, 2006; de Souza et al., 2003). For
gacA we initially tested published oligonucleotides pairs designedto target the genus specific gene (Costa et al., 2007), but thePCR gave unspecific amplicons (data not shown). Thus, we gen-erated new gacA primers to improve the PCR specificity. A set of
312B.
Agaras
et al.
/ A
pplied Soil
Ecology 61 (2012) 305– 319
Table 4Total culturable pseudomonads counts in soil samples from agricultural plots under no-till management in Argentina.
Geographical site Agricultural treatment
NE GAP BAP
TH TPy FPz TH TPy FPz TH TPy FPz
Bengolea 6.81 ± 0.07a 5.57 ± 0.36d
(3.6)4.44 ± 0.4g
(9.9)6.63 ± 0.08b 4.17 ± 0.32e
(0.7)3.89 ± 0.19h
(64.5)6.56 ± 0.07b 3.89 ± 0.38e
(0.3)3.67 ± 0.56h
(68.2)Monte Buey 6.66 ± 0.13a 4.21 ± 0.13e
(0.2)3.85 ± 0.3h
(50.1)6.17 ± 0.18c 4.30 ± 0.61e
(0.7)3.91 ± 0.3h
(69.5)6.49 ± 0.12b 4.96 ± 0.27d
(1.5*)4.85 ± 0.28g
(76.0)Pergamino 6.61 ± 0.11a 5.03 ± 0.12d
(2.8)4.61 ± 0.2g
(47.1)6.27 ± 0.16c 3.96 ± 0.37f
(0.7)3.75 ± 0.38i
(64.1*)6.43 ± 0.03b 4.51 ± 0.27e
(1.7*)4.11 ± 0.22h
(39.1)Viale 6.60 ± 0.45a 4.57 ± 0.68d
(1.2)4.55 ± 0.6g
(95.8)6.26 ± 0.19b 3.54 ± 1.11e
(0.6)3.31 ± 0.9h
(67.5)6.42 ± 0.17ab 3.54 ± 0.48e
(0.2)3.24 ± 0.54h
(66.1)
NE, natural environment; GAP, good agricultural practices; BAP, bad agricultural practices; TH, total heterotrophic mesophyles; TP, total pseudomonads; FP, fluorescent pseudomonads. Values are expressed in log CFU/g dry soiland correspond to averages from n = 9 replicate platings per site and per treatment, ±: its standard deviation. Different superscript letters indicate significant statistical difference (P < 0.05) between average CFUs for each site andbacterial group (a,b,c for TH; d,e,f for TP and g,h,i for FP). (y) The percentage of TP in relation to TH is indicated between parenthesis; (z) The percentage of FP in relation to TP is indicated between parenthesis. Asterisks indicate thehigher % between GAP and BAP treatments, for n = 3 replicates per site (P < 0.2). For the statistical comparison, the % values were subjected to an angular transformation.
Table 5Total culturable pseudomonads counts in rhizosphere samples from agricultural plots under no-till management in Argentina.
Geographical site Agricultural treatment
NE GAP BAP
TH TPy FPz TH TPy FPz TH TPy FPz
Bengolea Pasture Soybean Maize9.99 ± 0.05a 8.03 ± 0.16e
(1.0)7.95 ± 0.12h
(83.7)9.63 ± 0.12b 8.61 ± 0.49d
(14.1*)8.51 ± 0.45g
(81.4*)8.15 ± 0.12c 6.19 ± 0.32f
(1.2)5.71 ± 0.67i
(46.4)
Monte Buey Soybean Soybean Soybean8.89 ± 0.21a 7.63 ± 0.56e
(6.1)7.43 ± 0.6h
(78.9)8.98 ± 0.11a 8.28 ± 0.34d
(7.6)8.18 ± 0.4g
(80.2*)8.90 ± 0.11a 7.27 ± 0.40e
(2.7)7.09 ± 0.46h
(64.7)
Pergamino Pasture Maize Soybean8.48 ± 0.13c 7.38 ± 0.14f
(6.1)7.27 ± 0.18i
(78.7)8.95 ± 0.08b 8.05 ± 0.18e
(7.6)7.89 ± 0.28h
(74.8)9.72 ± 0.07a 9.12 ± 0.14d
(2.8)8.92 ± 0.05g
(66.1)
Viale Soybean Soybean Soybean8.80 ± 0.09b 7.19 ± 0.60e
(6.9)6.99 ± 0.63h
(68.1)9.00 ± 0.28a 8.36 ± 0.39d
(24.1*)8.06 ± 0.4g
(57.9*)8.89 ± 0.14ab 7.69 ± 0.59e
(7.4)6.57 ± 1.41h
(42.2)
NE, natural environment; GAP, good agricultural practices; BAP, bad agricultural practices; TH, total heterotrophic mesophyles; TP, total pseudomonads; FP, fluorescent pseudomonads. Values are expressed in log CFU/g of freshroots, and correspond to averages from n = 9 replicate platings per site and per treatment, ±: its standard deviation. The crop or vegetation present in the sampled plots is indicated for each site and treatment. Different superscriptletters indicate significant statistical difference (P < 0.05) between average CFUs for each site and bacterial group (a,b,c for TH; d,e,f for TP and g,h,i for FP). (y) The percentage of TP in relation to TH is indicated between parenthesis;(z) The percentage of FP in relation to TP is indicated between parenthesis. Asterisks indicate the higher % between GAP and BAP treatments, for n = 3 replicates per site (P < 0.2). For the statistical comparison, the % values weresubjected to an angular transformation.

oil Eco
ssutPeBttsyg
Tpatddltofifpf
3s
tcaWtacocabiu2saupiFprr
tewwaspcdrb
B. Agaras et al. / Applied S
equences encoding gacA and oprF from a range of Pseudomonaspecies was obtained from GenBank (Supplementary Table S1) andsed to identify highly conserved regions from multiple alignmentshat would serve as suitable targets for oligonucleotide annealing.articular attention was paid to select primer pairs that would gen-rate amplicons from different pseudomonads groups (Bodilis andarray, 2006) that could be distinguished by their restriction pat-ern (RFLP). Based on the sequence of the available Pseudomonasype strains, the restriction enzymes HaeIII, TaqI and MboI wereelected to obtain the corresponding RFLPs, because in silico anal-sis generated distinguishable fragment patterns for both markerenes from different strains (Supplementary Fig. S2a).
The designed primer pairs and their features are shown inable 3. The specificity of the primers was tested with typedseudomonad isolates (Table 2), which produced the expectedmplicons without unspecific bands (Fig. 3a). Note that the size ofhe oprF amplicon may differ in ca. 50–80 bp among certain pseu-omonads due to the presence of an internal deletion in the centralomain of the OprF polypeptide (Bodilis et al., 2006). A set of iso-
ates belonging to bacterial genera other than Pseudomonas failedo amplify oprF and gacA gene fragments (Fig. 3a). The RFLP patternsbtained for a subset of tested strains matched the expected pro-les deduced from the in silico analysis of oprF and gacA sequence
ragments (Supplementary Fig. S2b). In addition, the RFLP bandingatterns were able to distinguish different pseudomonas speciesor which the gacA and oprF genes were not available (Fig. 3b).
.3. Counts of culturable pseudomonads in soil and rhizosphereamples from no-till plots
Upon confirmation of the selective properties of the S1 medium,he amount of culturable pseudomonads in samples from agri-ultural plots was estimated by plating appropriate dilutions ofqueous suspensions from bulk soil or rhizospheric soil samples.e introduced a low-speed (50 × g) centrifugation step before dilu-
ion of the suspensions, to reduce the interference of soil particlesnd root material. We tested that both the sonication as well as theentrifugation steps do not affect CFU counts with cell suspensionsf P. fluorescens CHA0. Sonication for up to 10 min did not signifi-antly affect CFU counts (data not shown), whereas centrifugationt 50 × g for 1 min did only reduce the CFU titers in the supernatanty 13% (data not shown). There was, on the other hand, a strong
mpact of soil drying on pseudomonads CFU counts and its pop-lation structure. We observed that air-dried soils suffered up to-log10 reduction in total pseudomonads CFU counts in compari-on to fresh soils temporarily stored at 4 ◦C and processed withoutir-drying (Supplementary Table S2). In addition, we noted thatpon a 24-h period of rehydration of air-dried soil, the soil sus-ensions resulted in S1 plates with colonies that were all similar
n aspect, suggesting a strong selective effect of the dryness stress.or this reason, we have decided to process soil samples as soon asossible from the time of sampling. In the same vein, we sampledoot systems taking care to bring soil patches around the roots toeduce humidity loss during sample transport.
Table 4 reports the CFU counts obtained for soil samples fromhe set of agricultural plots under study. Total mesophilic het-rotrophic counts were quite similar for all sites and treatments,ith an overall average of 6.2log10 CFU/g. Total pseudomonads loadas on average 4.3log10 CFU/g, representing 1.2% of the cultur-
ble heterotrophic bacteria (range of 0.2–3.6%, depending on theite and treatment). There was, however, higher variability in totalseudomonads counts among samples compared to heterotrophic
ounts. The proportion of pseudomonads that produced fluorescentiffusible pigments under UV light (i.e., fluorescent pseudomonads)anged 10–96% of total colonies in S1 medium. For the collectedulk soils, we did not detect a systematic difference in the numberlogy 61 (2012) 305– 319 313
of total pseudomonads and fluorescent pseudomonads betweenGAP and BAP treatments for each geographical site (Table 4).
Independently of site and treatment, CFU counts of suspen-sions from rhizospheric soil samples (Table 5) had, on average,higher bacterial loads than bulk soil samples (9.0log10 CFU/g versus6.2log10 CFU/g; P < 0.05). Total pseudomonads also were enrichedin the root proximity, although the increment was proportion-ally higher than that of heterotrophic bacteria, rising from 1.2%(0.2–3.6%; Table 4) to 7.3% (1.0–24.1%) (Table 5). There was ageneralized enrichment of pseudomonads associated with rootsas the total pseudomonads counts were 2.3–4.8 log10-fold higherthan in the corresponding bulk soil, independently of the samplingsite, treatment and plant type (Tables 4 and 5). The proportion offluorescent pseudomonads ranged from 42% to 84% of total pseu-domonads from root samples. Interestingly, all samples from GAPplots showed higher % of total pseudomonads and % of fluorescentpseudomonads than in the corresponding BAP plots. These datawere statistically different in Bengolea and Viale samples (Table 5).
The NE (natural environment) sampling sites of all locationshad natural pastures, but in Monte Buey and Viale NE plots wedeliberately introduced soybean in a limited portion of each plot,allowing the comparison of soybean root colonization by pseu-domonads among different treatments. For both locations, the totalpseudomonads counts were higher in soybean root samples fromGAP plots, than those from NE and BAP plots (P < 0.05; Table 5). Thesame trend was observed for the % of fluorescent pseudomonadscounts. For the other two sites (Bengolea and Pergamino), soybeanroot colonization by pseudomonads and fluorescent pseudomon-ads was higher than for maize, independently of the treatment(Table 5).
3.4. Community structure of culturable pseudomonads in soil andrhizosphere samples from no-till plots
The number of CFU per g of soil or root samples alone may notnecessarily reflect the influence of agronomic practices or envi-ronmental factors. Moreover, similar CFU counts may be achievedwith similar or different community structure. We thus applied theaforementioned gacA and oprF PCR-RFLP protocols and analyzedthe banding patterns derived from the most abundant culturablepseudomonads present in the soil and root samples that werealready used to quantify pseudomonad CFUs (Tables 4 and 5).For comparison of the treatments within sites, we analyzed thePCR-RFLP banding pattern of a pooled lysate prepared with colonysuspensions from the three replicate platings of each site and treat-ment (see Section 2). The banding pattern from the pooled lysatewas representative of the combination of banding patterns of thepseudomonads present in each replicate (Supplementary Fig. S3). Inaddition, the profiles were reproducible in independent PCR-RFLPreactions (Supplementary Fig. S4).
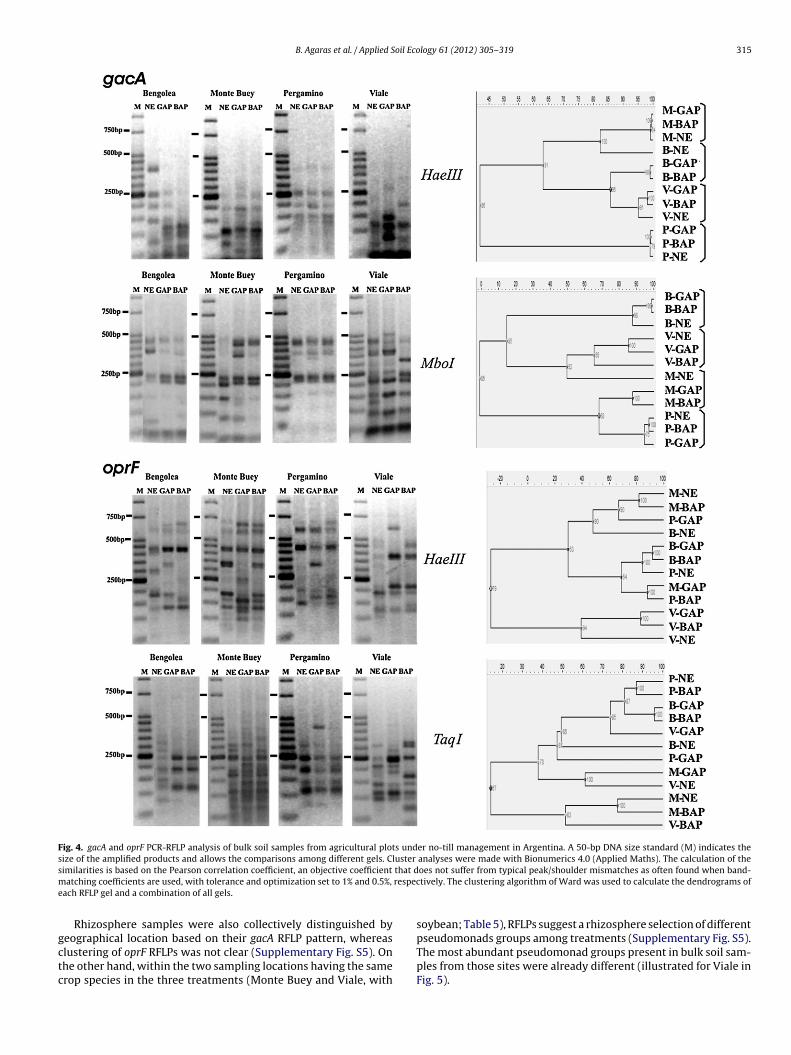
Both gacA and oprF RFLP patterns revealed changes in thepseudomonads population structure of bulk soil associated withcropping in all sites (Fig. 4). In some cases the differences weremore evident between agricultural treatments as for oprF RFLP pat-terns from BAP and GAP samples in comparison to NE samples forViale and Bengolea sites (Fig. 4). Clustering analysis of gacA band-ing patterns resulted in a preferential grouping according to thegeographical origin of the soil samples (Fig. 4). In contrast, the oprFbanding patterns from the same S1 platings did not follow the sametrend, as we could not detect a clear grouping by sample location(Fig. 4). Soils from the GAP treatment had slightly higher diversity
of pseudomonads based on the Shannon index of the RFLP pro-files compared to the BAP treatment (Fig. 4), and also exhibitedhigher plant productivity. Any causal relationship between thesetwo factors requires further study.
314 B. Agaras et al. / Applied Soil Ecology 61 (2012) 305– 319
Fig. 3. Set up of PCR-RFLP protocols targeting Pseudomonas oprF and gacA genes. (a) PCR of oprF and gacA genes with positive and negative controls. Reactions were carriedout with primers listed in Table 3; (b) RFLP patterns of positive controls. Strains were as follows: 1, P. fluorescens CHA0; 2, P. fluorescens Pf-5; 3, P. aeruginosa PAO1; 4, P.aeruginosa Hex1T; 5, P. aeruginosa sp.; 6, P. syringae pv. maculicola ES4326; 7, P. putida KT2440; 8, P. putida ATCC 17399; 9, P. stutzeri AN10; 10, P. stutzeri ATCC 17588; 11, P.stutzeri 2014; 12, P. stutzeri 2018; 13, P. mendocina 2013; 14, P. mendocina 2019; 15, P. sp. CF5; 16, P. sp. LDe; 17, P. sp. N23; 18, E. coli K12 MG1655; 19, E. coli K12 TR1-5; 20,B. cereus; 21, B. subtilis; 22, S. marcescens AS-1; 23, B. cepacia; 24, S. meliloti 2011; 25, A. tumefaciens NTL4; 26, A. brasilense ATCC 29710; 27, negative control (without DNA).Markers (M) are 100-bp DNA ladder (PB-L, Argentina) (a) or 50-bp DNA ladder (PB-L, Argentina) (b).
B. Agaras et al. / Applied Soil Ecology 61 (2012) 305– 319 315
Fig. 4. gacA and oprF PCR-RFLP analysis of bulk soil samples from agricultural plots under no-till management in Argentina. A 50-bp DNA size standard (M) indicates thesize of the amplified products and allows the comparisons among different gels. Cluster analyses were made with Bionumerics 4.0 (Applied Maths). The calculation of thes that dm respece
gctc
imilarities is based on the Pearson correlation coefficient, an objective coefficient
atching coefficients are used, with tolerance and optimization set to 1% and 0.5%,
ach RFLP gel and a combination of all gels.
Rhizosphere samples were also collectively distinguished by
eographical location based on their gacA RFLP pattern, whereaslustering of oprF RFLPs was not clear (Supplementary Fig. S5). Onhe other hand, within the two sampling locations having the samerop species in the three treatments (Monte Buey and Viale, withoes not suffer from typical peak/shoulder mismatches as often found when band-tively. The clustering algorithm of Ward was used to calculate the dendrograms of
soybean; Table 5), RFLPs suggest a rhizosphere selection of different
pseudomonads groups among treatments (Supplementary Fig. S5).The most abundant pseudomonad groups present in bulk soil sam-ples from those sites were already different (illustrated for Viale inFig. 5).
316 B. Agaras et al. / Applied Soil Ecology 61 (2012) 305– 319
F spherD ompa
ptctpgatqgrda
4
4
aapigtswGrsstacapOgogrobt1
ig. 5. A comparison of gacA/MboI and oprF/TaqI PCR-RFLP analysis of soil and rhizoNA size standard (M) indicates the size of the amplified products and allows the c
When the RFLP patterns of root and soil samples were com-ared for each location and treatment, a rhizospheric effect onhe composition of the most abundant pseudomonads could belearly observed in Viale for each treatment (Fig. 5), suggestinghat in addition to the quantitative enrichment of rhizosphericseudomonads (Table 5), there was a specific selection of certainroups by soybean roots. In contrast, Pergamino had the least vari-ble patterns between rhizospheric and bulk soil samples of allreatments (Fig. 5), being the rhizospheric effect restricted to auantitative enrichment of the most abundant soil pseudomonadroups (Table 5 and Fig. 5). For Monte Buey and Bengolea, thehizospheric effect on the community structure of culturable pseu-omonads was clearer for NE plots than for GAP or BAP sites (Fig. 4nd Supplementary Fig. S5).
. Discussion
.1. Platings on S1 medium and oprF PCR for specific counts
In order to get an accurate picture of the amount and diversity of specific taxonomic microbial group, appropriate culturing mediand reliable genetic markers are required. Plate counts are a routinerocedure to estimate the size of bacterial populations in biolog-
cal samples, and selective media must be used to narrow downrowth of competitive bacteria present in complex substrates. Inhis work, the density of culturable pseudomonads in soil and rhizo-phere samples from agricultural plots under no-till managementas determined by plating suspensions on the selective mediumould’s S1 (Gould et al., 1985). 16S rDNA sequencing of 50 colonies
andomly picked up from S1 plates from different soil and rhizo-phere sources (Table 2), confirmed that the S1 medium is strictlyelective for Pseudomonas spp. (Supplementary Fig. S1). In addi-ion, all the 50 randomly selected S1 colonies gave a single PCRmplicon for the genus marker gene oprF (Fig. 1). This is the firstorrelation of growth in S1 medium and PCR detection of the oprFllele, thus demonstrating a simpler procedure for confirming theresence of pseudomonads compared to colony blotting with anprF antiserum (Kragelund et al., 1996). Moreover, as Pseudomonasenomes contain only one oprF allele, qRT-PCR protocols targetingprF would be more appropriate to estimate total pseudomonadsenomic units in soil and rhizosphere than methods based on 16SDNA alleles (Lloyd-Jones et al., 2005). Soil and rhizosphere platings
n Gould’s S1 medium were not biased to particular subpopulationsecause we isolated both fluorescent and non fluorescent represen-atives from most phylogenetic pseudomonad clusters defined by6S rDNA sequence (Supplementary Fig. S1). The only exception ise samples from agricultural plots under no-till management in Argentina. A 50-bprisons among different gels.
the P. syringae clade, which may be related to the fact that thesespecies are plant pathogens usually colonizing the phyllosphere(Hirano and Upper, 2000). Our data on partial sequencing of the oprFallele (n = 119 isolates) revealed that 89% of the isolates originatedfrom bulk soil belongs to the oprF type I and 11% belongs to the oprFtype II (Bodilis et al., 2006), whereas 22% of the rhizospheric iso-lates possess type II oprF alleles. This matches previous reports onniche preference (soil versus rhizosphere) of pseudomonad strains(Bodilis et al., 2006). Another interesting observation derived fromthe comparative phylogenetic analysis, is that the oprF phylogenycould detect the recently proposed group P. protegens (Rametteet al., 2011) as a separate clade distinct from members of the P. flu-orescens complex (Fig. 1). This fact reinforces the taxonomic powerof the oprF gene (Figs. 1 and 2).
4.2. Pseudomonads CFU counts in bulk soil and rhizospheric soilsamples
The total pseudomonads load of sampled sites ranged from3.5 to 5.6 log10 CFU/g with higher average counts in non culti-vated control soils (NE) than in the corresponding plots underno-till cropping management (GAP and BAP) (Table 4). Overall,the number of culturable pseudomonads in bulk soil (Table 4) iscomparable to what has been reported for agricultural soils inother geographical locations (Funnell-Harris et al., 2010; Garbevaet al., 2004a; Johnsen and Nielsen, 1999; Kwon et al., 2005; Meyeret al., 2010; Thirup et al., 2001). Within each sampling location,cropping seems to be associated with a reduction in the % of pseu-domonads in relation to total heterotrophic mesophyles in NEplots (Table 4). Plate counts confirmed the “rhizosphere effect” forpseudomonads (Heijnen et al., 1993; Meyer et al., 2010), i.e., thetotal number of S1 CFU/g of rhizospheric soil material of differentcrops is higher by at least two orders of magnitude compared tothe respective bulk soil (Tables 4 and 5). As previously described(Kragelund et al., 1996), our results support the idea that pseu-domonads are relevant components of the rhizosphere community,since they represent on average nearly 10% of the heterotrophic cul-turable population (Table 5). Furthermore, the data indicate that therhizosphere effect is stronger for pseudomonads than for other cul-turable groups, because there was a generalized increase in the %of pseudomonads in relation to total heterotrophs for rhizospherecompared to bulk soil, for all sites and treatments (Tables 4 and 5).
In two sampling locations (Monte Buey and Viale), we could com-pare the rhizospheric load of the same crop species (soybean) inthe three treatment plots, and observed that in both locationsthe rhizospheric counts of total and fluorescent pseudomonads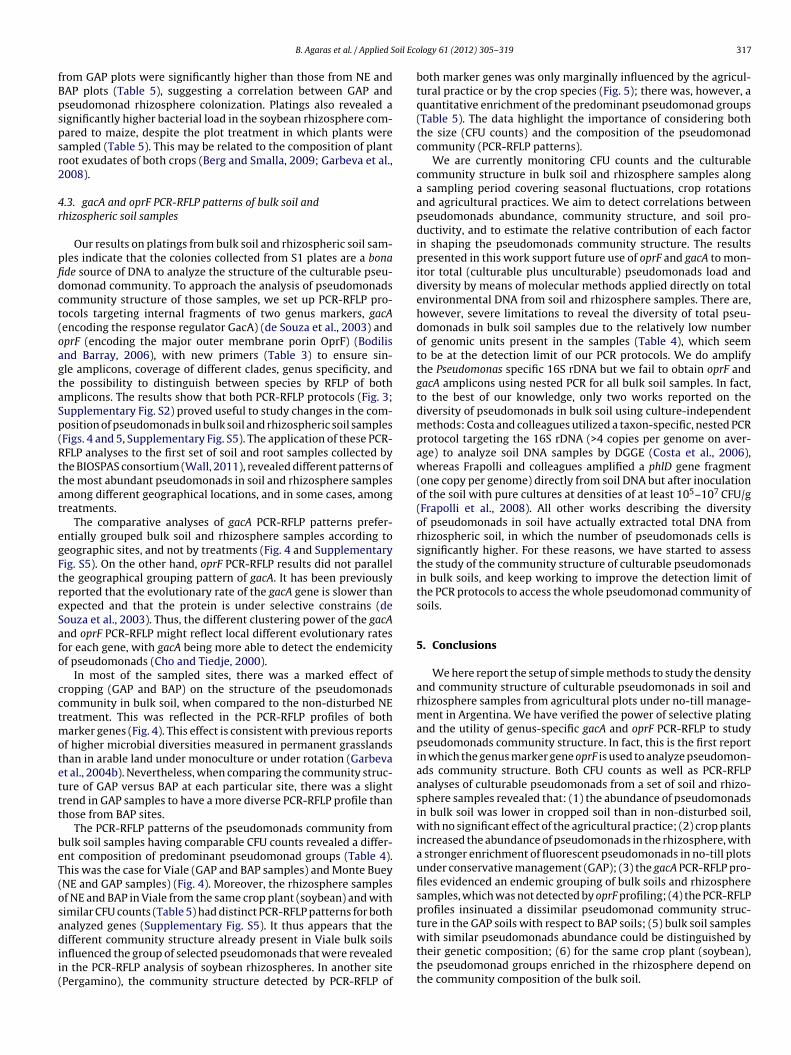
oil Eco
fBpspsr2
4r
pfidct(oagtaSp(Rttat
egFtreSafo
cctmotettt
beT(osadii(
B. Agaras et al. / Applied S
rom GAP plots were significantly higher than those from NE andAP plots (Table 5), suggesting a correlation between GAP andseudomonad rhizosphere colonization. Platings also revealed aignificantly higher bacterial load in the soybean rhizosphere com-ared to maize, despite the plot treatment in which plants wereampled (Table 5). This may be related to the composition of plantoot exudates of both crops (Berg and Smalla, 2009; Garbeva et al.,008).
.3. gacA and oprF PCR-RFLP patterns of bulk soil andhizospheric soil samples
Our results on platings from bulk soil and rhizospheric soil sam-les indicate that the colonies collected from S1 plates are a bonade source of DNA to analyze the structure of the culturable pseu-omonad community. To approach the analysis of pseudomonadsommunity structure of those samples, we set up PCR-RFLP pro-ocols targeting internal fragments of two genus markers, gacAencoding the response regulator GacA) (de Souza et al., 2003) andprF (encoding the major outer membrane porin OprF) (Bodilisnd Barray, 2006), with new primers (Table 3) to ensure sin-le amplicons, coverage of different clades, genus specificity, andhe possibility to distinguish between species by RFLP of bothmplicons. The results show that both PCR-RFLP protocols (Fig. 3;upplementary Fig. S2) proved useful to study changes in the com-osition of pseudomonads in bulk soil and rhizospheric soil samplesFigs. 4 and 5, Supplementary Fig. S5). The application of these PCR-FLP analyses to the first set of soil and root samples collected byhe BIOSPAS consortium (Wall, 2011), revealed different patterns ofhe most abundant pseudomonads in soil and rhizosphere samplesmong different geographical locations, and in some cases, amongreatments.
The comparative analyses of gacA PCR-RFLP patterns prefer-ntially grouped bulk soil and rhizosphere samples according toeographic sites, and not by treatments (Fig. 4 and Supplementaryig. S5). On the other hand, oprF PCR-RFLP results did not parallelhe geographical grouping pattern of gacA. It has been previouslyeported that the evolutionary rate of the gacA gene is slower thanxpected and that the protein is under selective constrains (deouza et al., 2003). Thus, the different clustering power of the gacAnd oprF PCR-RFLP might reflect local different evolutionary ratesor each gene, with gacA being more able to detect the endemicityf pseudomonads (Cho and Tiedje, 2000).
In most of the sampled sites, there was a marked effect ofropping (GAP and BAP) on the structure of the pseudomonadsommunity in bulk soil, when compared to the non-disturbed NEreatment. This was reflected in the PCR-RFLP profiles of both
arker genes (Fig. 4). This effect is consistent with previous reportsf higher microbial diversities measured in permanent grasslandshan in arable land under monoculture or under rotation (Garbevat al., 2004b). Nevertheless, when comparing the community struc-ure of GAP versus BAP at each particular site, there was a slightrend in GAP samples to have a more diverse PCR-RFLP profile thanhose from BAP sites.
The PCR-RFLP patterns of the pseudomonads community fromulk soil samples having comparable CFU counts revealed a differ-nt composition of predominant pseudomonad groups (Table 4).his was the case for Viale (GAP and BAP samples) and Monte BueyNE and GAP samples) (Fig. 4). Moreover, the rhizosphere samplesf NE and BAP in Viale from the same crop plant (soybean) and withimilar CFU counts (Table 5) had distinct PCR-RFLP patterns for bothnalyzed genes (Supplementary Fig. S5). It thus appears that the
ifferent community structure already present in Viale bulk soilsnfluenced the group of selected pseudomonads that were revealedn the PCR-RFLP analysis of soybean rhizospheres. In another sitePergamino), the community structure detected by PCR-RFLP of
logy 61 (2012) 305– 319 317
both marker genes was only marginally influenced by the agricul-tural practice or by the crop species (Fig. 5); there was, however, aquantitative enrichment of the predominant pseudomonad groups(Table 5). The data highlight the importance of considering boththe size (CFU counts) and the composition of the pseudomonadcommunity (PCR-RFLP patterns).
We are currently monitoring CFU counts and the culturablecommunity structure in bulk soil and rhizosphere samples alonga sampling period covering seasonal fluctuations, crop rotationsand agricultural practices. We aim to detect correlations betweenpseudomonads abundance, community structure, and soil pro-ductivity, and to estimate the relative contribution of each factorin shaping the pseudomonads community structure. The resultspresented in this work support future use of oprF and gacA to mon-itor total (culturable plus unculturable) pseudomonads load anddiversity by means of molecular methods applied directly on totalenvironmental DNA from soil and rhizosphere samples. There are,however, severe limitations to reveal the diversity of total pseu-domonads in bulk soil samples due to the relatively low numberof genomic units present in the samples (Table 4), which seemto be at the detection limit of our PCR protocols. We do amplifythe Pseudomonas specific 16S rDNA but we fail to obtain oprF andgacA amplicons using nested PCR for all bulk soil samples. In fact,to the best of our knowledge, only two works reported on thediversity of pseudomonads in bulk soil using culture-independentmethods: Costa and colleagues utilized a taxon-specific, nested PCRprotocol targeting the 16S rDNA (>4 copies per genome on aver-age) to analyze soil DNA samples by DGGE (Costa et al., 2006),whereas Frapolli and colleagues amplified a phlD gene fragment(one copy per genome) directly from soil DNA but after inoculationof the soil with pure cultures at densities of at least 105–107 CFU/g(Frapolli et al., 2008). All other works describing the diversityof pseudomonads in soil have actually extracted total DNA fromrhizospheric soil, in which the number of pseudomonads cells issignificantly higher. For these reasons, we have started to assessthe study of the community structure of culturable pseudomonadsin bulk soils, and keep working to improve the detection limit ofthe PCR protocols to access the whole pseudomonad community ofsoils.
5. Conclusions
We here report the setup of simple methods to study the densityand community structure of culturable pseudomonads in soil andrhizosphere samples from agricultural plots under no-till manage-ment in Argentina. We have verified the power of selective platingand the utility of genus-specific gacA and oprF PCR-RFLP to studypseudomonads community structure. In fact, this is the first reportin which the genus marker gene oprF is used to analyze pseudomon-ads community structure. Both CFU counts as well as PCR-RFLPanalyses of culturable pseudomonads from a set of soil and rhizo-sphere samples revealed that: (1) the abundance of pseudomonadsin bulk soil was lower in cropped soil than in non-disturbed soil,with no significant effect of the agricultural practice; (2) crop plantsincreased the abundance of pseudomonads in the rhizosphere, witha stronger enrichment of fluorescent pseudomonads in no-till plotsunder conservative management (GAP); (3) the gacA PCR-RFLP pro-files evidenced an endemic grouping of bulk soils and rhizospheresamples, which was not detected by oprF profiling; (4) the PCR-RFLPprofiles insinuated a dissimilar pseudomonad community struc-ture in the GAP soils with respect to BAP soils; (5) bulk soil samples
with similar pseudomonads abundance could be distinguished bytheir genetic composition; (6) for the same crop plant (soybean),the pseudomonad groups enriched in the rhizosphere depend onthe community composition of the bulk soil.
3 oil Eco
A
2iPtLapmePI
A
t
R
B
B
B
B
B
C
C
C
C
D
d
D
D
F
F
G
G
G
G
18 B. Agaras et al. / Applied S
cknowledgements
This work was supported by grants PAE 36976-PID 52 and PME006-1730 (Agencia Nacional de Promoción Científica y Tecnológ-
ca, Argentina), PIP 112-200801-02271 (CONICET, Argentina) andUNQ 0395/07 (Universidad Nacional de Quilmes, Argentina). Wehank Dr. L. Fernández (UNS), Dr. L. Raiger Iustman (UBA), Dr. E.ewkowicz (UNQ), Dr. D. Centrón (UBA), Dr. D. Golombek (UNQ),nd Dr. M. E. Farías (UNT) for providing isolates 6.2 to 26.14, P.utida KT2440, P. stutzeri ATCC 17588, P. stutzeri 2014 and 2018, P.endocina 2013 and 2019, P. syringae pv. maculicola ES4326, and
xtremophile Pseudomonas spp. strains, respectively. BA holds ah.D. fellowship from CONICET. LGW and CV are members of CON-CET.
ppendix A. Supplementary data
Supplementary data associated with this article can be found, inhe online version, at doi:10.1016/j.apsoil.2011.11.016.
eferences
achmann, B.J., 1987. Derivations and genotypes of some mutant derivatives ofEscherichia coli K-12. In: Ingraham, J.L., Low, K.B., Magasanik, B., Schaechter, M.,Umbarger, H.E. (Eds.), Escherichia coli and Salmonella typhimurium: Cellular andMolecular Biology. American Society for Microbiology, Washington, DC.
erg, G., Smalla, K., 2009. Plant species and soil type cooperatively shape the struc-ture and function of microbial communities in the rhizosphere. FEMS Microbiol.Ecol. 68, 1–13.
odilis, J., Barray, S., 2006. Molecular evolution of the major outer-membrane proteingene (oprF) of Pseudomonas. Microbiology 152, 1075–1088.
odilis, J., Calbrix, R., Guerillon, J., Merieau, A., Pawlak, B., Orange, N., Barray, S.,2004. Phylogenetic relationships between environmental and clinical isolatesof Pseudomonas fluorescens and related species deduced from 16S rRNA geneand OprF protein sequences. Syst. Appl. Microbiol. 27, 93–108.
odilis, J., Hedde, M., Orange, N., Barray, S., 2006. OprF polymorphism as a markerof ecological niche in Pseudomonas. Environ. Microbiol. 8, 1544–1551.
ole, J.R., Wang, Q., Cardenas, E., Fish, J., Chai, B., Farris, R.J., Kulam-Syed-Mohideen,A.S., McGarrell, D.M., Marsh, T., Garrity, G.M., Tiedje, J.M., 2009. The RibosomalDatabase Project: improved alignments and new tools for rRNA analysis. NucleicAcids Res. 37, D141–D145.
osta, R., Gomes, N.C., Krogerrecklenfort, E., Opelt, K., Berg, G., Smalla, K., 2007. Pseu-domonas community structure and antagonistic potential in the rhizosphere:insights gained by combining phylogenetic and functional gene-based analyses.Environ. Microbiol. 9, 2260–2273.
osta, R., Salles, J.F., Berg, G., Smalla, K., 2006. Cultivation-independent analysis ofPseudomonas species in soil and in the rhizosphere of field-grown Verticilliumdahliae host plants. Environ. Microbiol. 8, 2136–2149.
ho, J., Tiedje, J., 2000. Biogeography and degree of endemicity of fluorescent pseu-domonas strains in soil. Appl. Environ. Microbiol 66, 5448–5456.
e Mot, R., Schoofs, G., Roelandt, A., Declerck, P., Proost, P., Van Damme, J., Van-derleyden, J., 1994. Molecular characterization of the major outer-membraneprotein OprF from plant root-colonizing Pseudomonas fluorescens. Microbiology140, 1377–1387.
e Souza, J.T., Mazzola, M., Raaijmakers, J., 2003. Conservation of the response reg-ulator gene gacA in Pseudomonas species. Environ. Microbiol. 5, 1328–1340.
erpsch, R., Friedrich, T., Kassam, A., Li, H., 2010. Current status of adoption of no-tillfarming in the world and some of its main benefits. Int. J. Agric. Biol. Eng. 3, 1–25.
ong, X., Mindrinos, M., Davis, K.R., Ausubel, F.M., 1991. Induction of Arabidopsisdefense genes by virulent and avirulent Pseudomonas syringae strains and by acloned avirulence gene. Plant Cell 3, 61–72.
rapolli, M., Moenne-Loccoz, Y., Meyer, J., Defago, G., 2008. A new DGGE protocol tar-geting 2,4-diacetylphloroglucinol biosynthetic gene phlD from phylogeneticallycontrasted biocontrol pseudomonads for assessment of disease-suppressivesoils. FEMS Microbiol. Ecol. 64, 468–481.
unnell-Harris, D.L., Pedersen, J.F., Sattler, S.E., 2010. Soil and root populations offluorescent Pseudomonas spp. associated with seedlings and field-grown plantsare affected by sorghum genotype. Plant Soil 335, 439–455.
arbeva, P., van Elsas, J., van Veen, J.A., 2008. Rhizosphere microbial community andits response to plant species and soil history. Plant Soil 302, 19–32.
arbeva, P., van Veen, J.A., van Elsas, J.D., 2004a. Assessment of the diversity, andantagonism towards Rhizoctonia solani AG3, of Pseudomonas species in soil fromdifferent agricultural regimes. FEMS Microbiol. Ecol. 47, 51–64.
arbeva, P., van Veen, J.A., van Elsas, J.D., 2004b. Microbial diversity in soil: selec-
tion microbial populations by plant and soil type and implications for diseasesuppressiveness. Annu. Rev. Phytopathol. 42, 243–270.ould, W.D., Hagedorn, C., Bardinelli, T.R., Zablotowicz, R.M., 1985. New selectivemedia for enumeration and recovery of fluorescent pseudomonads from varioushabitats. Appl. Environ. Microbiol 49, 28–32.
logy 61 (2012) 305– 319
Haas, D., Defago, G., 2005. Biological control of soil-borne pathogens by fluorescentpseudomonads. Nat. Rev. Microbiol. 3, 307–319.
Heeb, S., Haas, D., 2001. Regulatory roles of the GacS/GacA two-component system inplant-associated and other gram-negative bacteria. Mol. Plant Microbe Interact.14, 1351–1363.
Heijnen, C.E., Hok-A-Hin, C.H., Van Elsas, J., 1993. Root colonization by Pseudomonasfluorescens introduced into soil amended with bentonite. Soil Biol. Biochem. 25,239–246.
Hirano, S.S., Upper, C.D., 2000. Bacteria in the leaf ecosystem with emphasis onPseudomonas syringae – a pathogen, ice nucleus, and epiphyte. Microbiol. Mol.Biol. Rev. 64, 624–653.
Holloway, B.W., 1969. Genetics of Pseudomonas. Bacteriol. Rev. 33, 419–433.Howell, C.R., Stipanovic, R.D., 1979. Control of Rhizoctonia solani on cotton seedlings
with Pseudomonas fluorescens and with an antibiotic produced by the bacterium.Phytopathology 69, 480–482.
Johnsen, K., Enger, O., Jacobsen, C.S., Thirup, L., Torsvik, V., 1999. Quantitative selec-tive PCR of 16S ribosomal DNA correlates well with selective agar plating indescribing population dynamics of indigenous Pseudomonas spp. in soil hotspots. Appl. Environ. Microbiol. 65, 1786–1788.
Johnsen, K., Nielsen, P., 1999. Diversity of Pseudomonas strains isolatedwith King’s B and Gould’s S1 agar determined by repetitive extragenicpalindromic-polymerase chain reaction, 16S rDNA sequencing and Fouriertransform infrared spectroscopy characterisation. FEMS Microbiol. Lett. 173,155–162.
Kragelund, L., Leopold, K., Nybroe, O., 1996. Outer membrane protein heterogeneitywithin Pseudomonas fluorescens and P. putida and use of an OprF antibody as aprobe for rRNA homology group I pseudomonads. Appl. Environ. Microbiol. 62,480–485.
Kwon, S.W., Kim, J.S., Crowley, D.E., Lim, C.K., 2005. Phylogenetic diversity of fluo-rescent pseudomonads in agricultural soils from Korea. Lett. Appl. Microbiol. 41,417–423.
Lugtenberg, B., Kamilova, F., 2009. Plant-growth-promoting rhizobacteria. Annu.Rev. Microbiol. 63, 541–546.
Luo, Z.Q., Clemente, T.E., Farrand, S.K., 2001. Construction of a derivative of Agrobac-terium tumefaciens C58 that does not mutate to tetracycline resistance. Mol.Plant Microbe Interact. 14, 98–103.
Lloyd-Jones, G., Laurie, A.D., Tizzard, A.C., 2005. Quantification of the Pseudomonaspopulation in New Zealand soils by fluorogenic PCR assay and culturing tech-niques. J. Microbiol. Methods 60, 217–224.
Meade, H.M., Signer, E.R., 1977. Genetic mapping of Rhizobium meliloti. Proc. Natl.Acad. Sci. U.S.A. 74, 2076–2078.
Mercado-Blanco, J., Bakker, P.A., 2007. Interactions between plants and beneficialPseudomonas spp.: exploiting bacterial traits for crop protection. Anton. Leeuw.Int. J. G. 92, 367–389.
Meyer, J.B., Lutz, M.P., Frapolli, M., Pechy-Tarr, M., Rochat, L., Keel, C., Defago, G., Mau-rhofer, M., 2010. Interplay between wheat cultivars, biocontrol pseudomonads,and soil. Appl. Environ. Microbiol. 76, 6196–6204.
Morohoshi, T., Shiono, T., Takidouchi, K., Kato, M., Kato, N., Kato, J., Ikeda, T., 2007.Inhibition of quorum sensing in Serratia marcescens AS-1 by synthetic analogsof N-acylhomoserine lactone. Appl. Environ. Microbiol. 73, 6339–6344.
Nakazawa, T., 2002. Travels of a Pseudomonas, from Japan around the world. Environ.Microbiol. 4, 782–786.
Nestorovich, E.M., Sugawara, E., Nikaido, H., Bezrukov, S.M., 2006. Pseudomonasaeruginosa porin OprF: properties of the channel. J. Biol. Chem. 281,16230–16237.
Ordonez, O.F., Flores, M.R., Dib, J.R., Paz, A., Farias, M.E., 2009. Extremophile culturecollection from Andean lakes: extreme pristine environments that host a widediversity of microorganisms with tolerance to UV radiation. Microb. Ecol. 58,461–473.
Peix, A., Ramirez-Bahena, M.H., Velazquez, E., 2009. Historical evolution and currentstatus of the taxonomy of genus Pseudomonas. Infect. Genet. Evol. 9, 1132–1147.
Pesaro, M., Widmer, F., 2006. Identification and specific detection of a novelpseudomonadaceae cluster associated with soils from winter wheat plotsof a long-term agricultural field experiment. Appl. Environ. Microbiol. 72,37–43.
Pezza, R.J., Smania, A.M., Barra, J.L., Argarana, C.E., 2002. Nucleotides and heterodu-plex DNA preserve the active conformation of Pseudomonas aeruginosa MutS bypreventing protein oligomerization. Biochem. J. 361, 87–95.
Picard, C., Bosco, M., 2008. Genotypic and phenotypic diversity in populationsof plant-probiotic Pseudomonas spp colonizing roots. Naturwissenschaften 95,1–16.
Picard, C., Di Cello, F., Ventura, M., Fani, R., Guckert, A., 2000. Frequency and biodiver-sity of 2,4-diacetylphloroglucinol-producing bacteria isolated from the maizerhizosphere at different stages of plant growth. Appl. Environ. Microbiol. 66,948–955.
Preston, G.M., 2004. Plant perceptions of plant growth-promoting Pseudomonas.Philos. Trans. R. Soc. Lond. B Biol. Sci. 359, 907–918.
Raaijmakers, J., Paulitz, T.C., Steinberg, C., Alabouvette, C., Moënne-Loccoz, Y., 2009.The rhizosphere: a playground and battlefield for soilborne pathogens and ben-eficial microorganisms. Plant Soil 321, 341–361.
Raaijmakers, J.M., Weller, D.M., 2001. Exploiting genotypic diversity of
2,4-diacetylphloroglucinol-producing Pseudomonas spp.: characterizationof superior root-colonizing P fluorescens strain Q8r1-96. Appl. Environ.Microbiol. 67, 2545–2554.Rademaker, J., Louws, L., Rossbach, U., de Bruijn, F., 1999. Computer assisted patternanalysis of molecular fingerprints and data base construction. In: Akkermans,
oil Eco
R
R
R
R
S
S
S
topathogens: from functional genomics to commercial exploitation. Curr. Opin.Biotechnol. 12, 289–295.
B. Agaras et al. / Applied S
A., van Elsas, J., de Bruijn, F. (Eds.), Molecular Microbial Ecology Manual. KluwerAcademic Publishers, Dordrecht, pp. 1–33.
amette, A., Frapolli, M., Fischer-Le Saux, M., Gruffaz, C., Meyer, J.M., Défago,G., Sutra, L., Moenne-Loccoz, Y., 2011. Pseudomonas protegens sp. nov.,widespread plant-protecting bacteria producing the biocontrol compounds2,4-diacetylphloroglucinol and pyoluteorin. Syst. Appl. Microbiol. 34, 180–188.
ichardson, A.E., Barea, J.-M., McNeill, A.N., Prigent-Combaret, C., 2009. Acquisitionof phosphorus and nitrogen in the rhizosphere and plant growth promotion bymicroorganisms. Plant Soil 321, 305–339.
omeo, T., Gong, M., Liu, M.Y., Brun-Zinkernagel, A.M., 1993. Identification andmolecular characterization of csrA, a pleiotropic gene from Escherichia coli thataffects glycogen biosynthesis, gluconeogenesis, cell size, and surface properties.J. Bacteriol. 175, 4744–4755.
ossello, R., García-Valdés, E., Lalucat, J., Ursing, J., 1991. Genotypic and phenotypicdiversity of Pseudomonas stutzeri. Syst. Appl. Microbiol. 14, 150–157.
chippers, B., Bakker, A.W., Bakker, P.A., 1987. Interactions of deleterious and ben-eficial rhizosphere microorganisms and the effect of cropping practices. Annu.Rev. Phytopathol. 25, 339–358.
tanier, R.Y., Palleroni, N.J., Doudoroff, M., 1966. The aerobic pseudomonads: a tax-onomic study. J. Gen. Microbiol. 43, 159–271.
tutz, E.W., Défago, G., Kern, H., 1986. Naturally occurring fluorescent pseudomon-ads involved in suppression of black root rot of tobacco. Phytopathology 76,181–185.
logy 61 (2012) 305– 319 319
Tamura, K., Dudley, J., Nei, M., Kumar, S., 2007. MEGA4: molecular evolu-tionary genetics analysis (MEGA) software version 4.0. Mol. Biol. Evol. 24,1596–1599.
Tarrand, J.J., Krieg, N.R., Dobereiner, J., 1978. A taxonomic study of the Spirillumlipoferum group, with descriptions of a new genus, Azospirillum gen. nov. andtwo species, Azospirillum lipoferum (Beijerinck) comb. nov. and Azospirillumbrasilense sp. nov. Can. J. Microbiol. 24, 967–980.
Thirup, L., Johnsen, K., Winding, A., 2001. Succession of indigenous Pseudomonasspp. and actinomycetes on barley roots affected by the antagonistic strain Pseu-domonas fluorescens DR54 and the fungicide imazalil. Appl. Environ. Microbiol.67, 1147–1153.
Thompson, J.D., Higgins, D.G., Gibson, T.J., 1994. CLUSTAL W: improving the sensi-tivity of progressive multiple sequence alignment through sequence weighting,position-specific gap penalties and weight matrix choice. Nucleic Acids Res. 22,4673–4680.
Walsh, U.F., Morrissey, J.P., O’Gara, F., 2001. Pseudomonas for biocontrol of phy-
Wall, L.G., 2011. The BIOSPAS consortium: soil biology and agricultural production.In: de Bruijn, F. (Ed.), Handbook of Molecular Microbial Ecology I: Metagenomicsand Complementary Approaches. John Wiley & Sons, Inc., pp. 299–306.
Copyright © 2022 FDOKUMEN