Species, tissue and gender-related organochlorine bioaccumulation in white-sided dolphins, pilot...
22
Species, tissue and gender-related organochlorine bioaccumulation in white-sided dolphins, pilot whales and their common prey in the Northwest Atlantic A.V. Weisbrod a,b, *, D. Shea b , M.J. Moore c , J.J. Stegeman c a Procter & Gamble, Sharon Woods Technical Center, 11530 Reed Hartman Highway, Cincinnati, OH 45241-2422, USA b Department of Toxicology, North Carolina State University, Box 8604, Raleigh, NC 27606, USA c Biology Department, Woods Hole Oceanographic Institution, Mailstop 33, Woods Hole, MA 02543, USA Received 7 January 1999; received in revised form 16 January 2000; accepted 21 January 2000 Abstract Organochlorine concentrations were measured in white-sided dolphins, pilot whales, and their prey from the Gulf of Maine and used to identify species, tissue, and gender dierences, and trophic transfer trends, in bioaccumulation. Polychlorinated biphenyl concentrations ([PCB]) in dolphin blubber (137.1 mg/g fresh wt.) were twice those in pilot whales, but pes- ticide concentrations (2013 mg/g fresh) were similar between species. 4,4 0 -DDE, trans-non- achlor, Cl 6 (153) and Cl 6 (138) concentrations were highest. Skin tissues had more recalcitrant organochlorines than the internal organs. Male dolphins bioaccumulated higher concentra- tions of nonmetabolizable PCBs and hexachlorocyclohexane (HCH) isomers, whereas pilot whales had no gender-related dierences in bioaccumulation. Pilot whales, mackerel, and herring had proportionately higher concentrations of DDTs, whereas [PCB] were higher in dolphins and squid. Although these odontocetes feed at the same trophic level and store a similar suite of contaminants, dolphins bioaccumulated higher and potentially hazardous 4,4 0 - DDE and PCB concentrations from food in their more geographically restricted range. # 2000 Elsevier Science Ltd. All rights reserved. Keywords: PCB; DDE; Whale; Invertebrate; Fish; Bioaccumulation; Trophic transfer; Dolphin; Squid Marine Environmental Research 51 (2001) 29–50 www.elsevier.com/locate/marenvrev 0141-1136/00/$ - see front matter # 2000 Elsevier Science Ltd. All rights reserved. PII: S0141-1136(00)00032-5 * Corresponding author. Tel:. +1-513-626-5301; fax: +1-513-626-3522. E-mail address: [email protected] (A.V. Weisbrod).
Transcript of Species, tissue and gender-related organochlorine bioaccumulation in white-sided dolphins, pilot...
Species, tissue and gender-related organochlorinebioaccumulation in white-sided dolphins,pilot whales and their common prey in the
Northwest Atlantic
A.V. Weisbrod a,b,*, D. Shea b, M.J. Moore c, J.J. Stegeman c
aProcter & Gamble, Sharon Woods Technical Center, 11530 Reed Hartman Highway,
Cincinnati, OH 45241-2422, USAbDepartment of Toxicology, North Carolina State University, Box 8604, Raleigh, NC 27606, USA
cBiology Department, Woods Hole Oceanographic Institution, Mailstop 33, Woods Hole, MA 02543, USA
Received 7 January 1999; received in revised form 16 January 2000; accepted 21 January 2000
Abstract
Organochlorine concentrations were measured in white-sided dolphins, pilot whales, andtheir prey from the Gulf of Maine and used to identify species, tissue, and gender di�erences,and trophic transfer trends, in bioaccumulation. Polychlorinated biphenyl concentrations
([PCB]) in dolphin blubber (13�7.1 mg/g fresh wt.) were twice those in pilot whales, but pes-ticide concentrations (20�13 mg/g fresh) were similar between species. 4,40-DDE, trans-non-achlor, Cl6(153) and Cl6(138) concentrations were highest. Skin tissues had more recalcitrantorganochlorines than the internal organs. Male dolphins bioaccumulated higher concentra-
tions of nonmetabolizable PCBs and hexachlorocyclohexane (HCH) isomers, whereas pilotwhales had no gender-related di�erences in bioaccumulation. Pilot whales, mackerel, andherring had proportionately higher concentrations of DDTs, whereas [PCB] were higher in
dolphins and squid. Although these odontocetes feed at the same trophic level and store asimilar suite of contaminants, dolphins bioaccumulated higher and potentially hazardous 4,40-DDE and PCB concentrations from food in their more geographically restricted range.
# 2000 Elsevier Science Ltd. All rights reserved.
Keywords: PCB; DDE; Whale; Invertebrate; Fish; Bioaccumulation; Trophic transfer; Dolphin; Squid
Marine Environmental Research 51 (2001) 29±50
www.elsevier.com/locate/marenvrev
0141-1136/00/$ - see front matter # 2000 Elsevier Science Ltd. All rights reserved.
PI I : S0141-1136(00 )00032 -5
* Corresponding author. Tel:. +1-513-626-5301; fax: +1-513-626-3522.
E-mail address: [email protected] (A.V. Weisbrod).

1. Introduction
Between June 1987 and March 1988, over 740 bottlenose dolphin (Tursiops trun-catus) of the eastern US coastal migratory stock stranded along the coastline afterapparently succumbing to a morbillivirus and/or bacterial infections (Kuehl, Hae-bler & Potter, 1991). Their tissue concentrations of multiple polychlorinated biphe-nyls (PCBs) and chlorinated pesticides were greater than in other dolphin speciesmeasured during the period (Kuehl et al., 1991). PCB and DDT mixtures have beenimplicated in immune system suppression in bottlenose dolphin, striped dolphin(Stenella coeruleoalba), harbor porpoise (Phocoena phocoena), and harbor seals(Phoca vitulina) (Aguilar & Borrell, 1994; de Swart, Ross, Vos & Osterhaus, 1996;Kuiken et al., 1994; Lahvis et al., 1995; Ross et al., 1995). Although residues of>150 compounds have been detected in the tissues of several whale and pinnipedspecies in eastern North America, we do not know whether Northwest (NW)Atlantic marine mammal populations are exposed to or a�ected by hazardous con-centrations of toxicants (Lake et al., 1995; Martineau, Beland, Desjardins & Lagace,1987; Muir et al., 1988,1990; Weisbrod, Shea, Moore & Stegeman, 2000a,b; West-gate, Muir, Gaskin & Kingsley, 1997). We expect that the animals most likely to beexposed to and a�ected by high organochlorine concentrations are coastal, longer-lived, top predators such as dolphins.White-sided dolphins (WSD), Lagenorhynchus acutus, from the Gulf of Maine are
conceivably among the highly exposed cetacea (Waring et al., 1997). They are sigh-ted along the coast and continental shelf from the Gulf of Maine to Delaware Bay(Fig. 1) (Mate & Sta�ord, 1994; Selzer & Payne, 1988; Waring et al., 1997). Thiscorresponds to a major shipping corridor and the densely populated and indus-trialized megalopolis extending through Boston and New York City. These dolphinsare at the top of their food web and consume a variety of local and migratory prey
Fig. 1. The location of sample collections. Whale samples were collected from animals stranded along
Cape Cod Bay (inset): white-sided dolphins (*) and pilot whales (*). Squid were collected in a trawl near
Nantucket Sound (SQ); mackerel and herring were taken from a weir o� Grand Manan (X).
30 A.V. Weisbrod et al. /Marine Environmental Research 51 (2001) 29±50
including the Atlantic herring (Clupea harengus), mackerel (Scromber scrombus),sand lance (Ammodytes sp.), silver hake (Merluccius bilinearis), and short-®nnedsquid (Illex sp.) (Selzer & Payne, 1998; Sergeant, St. Aubin & Geraci, 1980). Similarto other dolphin species, the life span of the WSD is expected to be greater than 20years (Sergeant et al., 1980). The North American populations stretch from Virginiato the Gulf of St. Lawrence and are estimated to have 27,200 individuals (Waring etal., 1997).The NW Atlantic population of the long-®nned pilot whale (PW), Globicephala
melas, overlaps with the WSD for part of its migration range and food web. PWs aredistributed along the continental shelf and slope from Cape Hatteras, NC throughthe Gulf of Maine (Payne & Heinemann, 1993). From spring through fall, they aremost abundant from Cape Cod Bay through the Bay of Fundy (Payne & Heine-mann 1993). It is unclear whether the eastern North American population encom-passes a single group of 8000 animals extending from Virginia to the Gulf of St.Lawrence or has smaller subpopulations (Nelson & Lien, 1994). PWs live more than40 years (Desportes & Mouritsen, 1993). The PWs near Newfoundland prey onshort-®nned squid (Illex sp.), whereas the whales o� the US coast appear to con-sume many prey species, including the long-®nned squid (Loligo pealei), mackerel,herring, silver hake, dog®sh (Squalus acanthias), and short-®nned squid (Ommas-trephicae) (Fair®eld, Waring & Sano, 1993; Gannon, Read & Mead, 1997; Payne &Heinemann, 1993). Due to its range, sample availability, top trophic position, andknown population parameters, the PW has been proposed as a model for con-taminant study for migrating NW Atlantic cetacea (Weisbrod et al., 2000a).WSDs could be exposed to greater contaminant concentrations through their food
than other cetacea because they inhabit waters closer to major anthropogenic sour-ces. Due to their smaller geographical range, the Gulf of Maine WSDs might beexposed to more consistent concentrations of contaminants than whales thatmigrate larger distances. For seasonal periods, other migratory whales sharing theWSD food web should also be exposed to the region-speci®c concentrations ofcontaminants. Indeed, Stellwagen Bank Marine Mammal Sanctuary is an importantfeeding ground where many species congregate during the spring through fall,including the endangered right whale (Eubalaena glacialis), humpback (Megapteranovaeangliae), PWs and dolphins (Waring et al., 1997). Cetacean distributionappears to be related to surface water temperature and bottom topography and, asexempli®ed by Stellwagen Bank, is thought to re¯ect prey distributions (Selzer &Payne, 1988).The purpose of this study was to determine the signi®cance of food source and
geographic range to organochlorine bioaccumulation by two NW Atlantic whalepopulations and their common prey. The objectives were to: (1) measure the con-centrations of 30 PCBs and 20 chlorinated pesticides in seven tissues of strandedWSDs, PWs and their common prey; (2) identify patterns in organochlorine bioac-cumulation between species, tissues, life stages, and genders; and (3) interpret thebioaccumulation patterns into trophic transfer trends for these NW Atlantic odon-tocetes. The results might be applied in bioaccumulation models to predict the dif-ferent hazards faced by other marine mammals that inhabit versus transiently feed
A.V. Weisbrod et al. /Marine Environmental Research 51 (2001) 29±50 31
o� of the New England coast. The results also might indicate which members of amarine mammal population face the greatest risk of toxicity due to biomagni®edpollutants.
2. Materials and methods
2.1. Sample collection
WSD samples were collected from three stranding events along Cape Cod Bay(Fig. 1). Four animals stranded at Rock Harbor, Orleans, MA USA (30 December1994). Samples from two individuals were collected in Well¯eet, MA (21 January1996) and from one female stranded in Truro, MA (11 December 1996). Body lengthand gender was recorded. Age, reproductive status, time between death and sam-pling, and body sampling locations were mostly unknown. Approximately 3±10-gsamples were cut from the liver and outer blubber mantle; samples of kidney andlung were taken from the two individuals that stranded on January 1996 as well asthe liver and brain of a fetus in the December 1996 stranded female. Samples werealso collected from 11 juvenile and adult PWs that stranded along Cape Cod Bay (12December 1990; 28 September 1991; 11 December 1996) and from two adults caughtin drift nets (12 June 1996). These samples have been previously described (Weis-brod et al., 2000a).Eight Atlantic mackerel and 15 herring were collected from a wier o� Grand
Manan, NB, Canada (22 August 1995). Twenty long-®nned squid were taken intrawls near Menemsha, MA and Nantucket Sound USA (14�53.60; 43�89.90 and14�20.00; 43�80.50 on 29 August 1995). Large mackerel, herring, and squid (>20 cmlength, >50 g) were prepared individually; smaller squid of the same size werepooled.Samples were immediately wrapped in aluminum foil or put into clean glass jars
on ice and stored at ÿ25�C.
2.2. Extraction and gas chromatograph (GC) analysis
All individual organochlorine standards, other chemicals, water, and similarextraction and quantitation procedures have been previously described (Weisbrod etal., 2000a,b). Brie¯y, all equipment were baked overnight (300�C for >10 h) orrinsed three times each with acetone, dichloromethane (DCM), and hexane prior tocontact with a sample. Contamination and analyte recovery was monitored in eachbatch by the inclusion of a solvent blank, a solvent spiked with all analytes (blankspike), and either a sample and duplicate spiked with all analytes (matrix spike) or astandard reference material (SRM 1945) of pilot whale blubber. Three surrogateinternal standards were added to each sample to follow analyte recovery throughoutthe extraction.For the comparison of organochlorine bioaccumulation by di�erent skin layers,
slices of the black dense epidermis (0.9±6.2 g) were cut from the outer blubber
32 A.V. Weisbrod et al. /Marine Environmental Research 51 (2001) 29±50
mantle samples. Similarly, muscle (0.4±2.6 g) beneath the blubber was removed.The small amount of pink blubber underlying the skin and overlying the muscle wasdiscarded. Cubes of blubber (0.5±9.8 g) were sectioned from the middle of thesample.All samples were weighed just prior to extraction and homogenization with
sodium sulfate, a 1:1 ratio of acetone and DCM, and the internal standards. Sam-ples in Te¯on1 bottles were extracted for 6±14-h periods on a shaker table. Solventfrom three extractions was combined for each sample and reduced. Extracts under-went alumina (neutral AlO4) column clean-up and contaminant separation preced-ing the lipid content determinations.For the extractions of 1990±94 samples (four WSDs, 11 PWs), the lipid fraction of
the sample was determined gravimetrically on 10 ml of the sample extract. Theremainder (>100 ml) was reduced to 0.5 ml, solvent-exchanged to hexane, andvortexed with 0.5±2.0 ml sulfuric acid (18 M) to digest lipids. The process alsodestroyed dieldrin; other organochlorines were con®rmed to be una�ected. Dieldrinconcentrations are not reported for these samples. The hexane portion was removedand a recovery internal standard was added to this ®nal extract.Extracts from the 1995±96 samples (three WSDs, two PWs, prey), however, were
reduced to 2 ml and injected onto a gel permeation chromatography (GPC) systemto separate lipids from the pollutant fraction. The ®rst 26-ml fraction containing thesample's lipids was reduced and the lipid fraction was determined gravimetrically asabove. The ®nal 52-ml fraction, containing the compounds of interest, was reducedand the recovery internal standard was added. Extracts were stored at ÿ25�C untilGC analyses.Organochlorines were detected using a Hewlett Packard 5890 Series II Gas
Chromatograph with Electron Capture Detection (GC/ECD) and DB5/17 dual col-umns. A description of the GC conditions and the concentration calculations werepreviously reported (Weisbrod et al., 2000a,b). By using the dual DB5/17 columnsand a 115-min run time, the retention times on both 30-m columns were used tocon®rm an analyte0s single elution and concentration compared to those of indivi-dual organochlorine standards. Since the DB17 column had fewer coeluting peaks,data derived from the DB17 column are reported in ng/g sample fresh weight. Thehighest minimum detection limit (MDL) of the organochlorines in the whaleextracts was 0.2 ng/g sample fresh weight, and 0.01 ng/g fresh weight for the preysamples (Keith, 1991). Calculated concentrations for other compounds below theseMDL are not reported.For the WSD samples, analyte concentrations were corrected for extraction e�-
ciency by multiplying the average recovery of the three internal standards by eachanalyte concentration detected in the sample. Prey and PW concentrations were notcorrected for extraction e�ciency because the average recoveries were >90%.
2.3. Statistical analyses
Di�erences in organochlorine concentrations between species, gender, life stageand tissues were evaluated using multiple statistical techniques. Several compound
A.V. Weisbrod et al. /Marine Environmental Research 51 (2001) 29±50 33
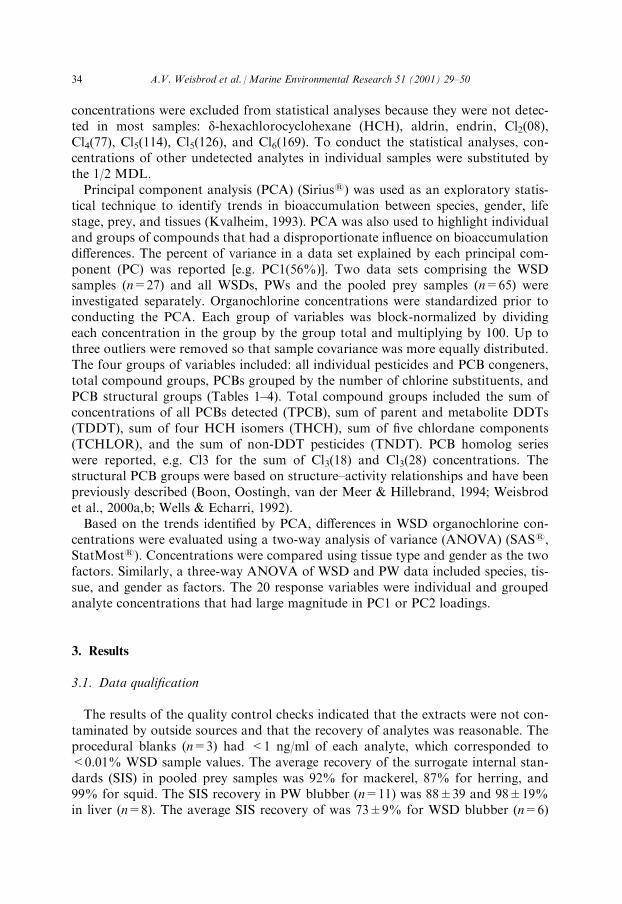
concentrations were excluded from statistical analyses because they were not detec-ted in most samples: d-hexachlorocyclohexane (HCH), aldrin, endrin, Cl2(08),Cl4(77), Cl5(114), Cl5(126), and Cl6(169). To conduct the statistical analyses, con-centrations of other undetected analytes in individual samples were substituted bythe 1/2 MDL.Principal component analysis (PCA) (Sirius1) was used as an exploratory statis-
tical technique to identify trends in bioaccumulation between species, gender, lifestage, prey, and tissues (Kvalheim, 1993). PCA was also used to highlight individualand groups of compounds that had a disproportionate in¯uence on bioaccumulationdi�erences. The percent of variance in a data set explained by each principal com-ponent (PC) was reported [e.g. PC1(56%)]. Two data sets comprising the WSDsamples (n=27) and all WSDs, PWs and the pooled prey samples (n=65) wereinvestigated separately. Organochlorine concentrations were standardized prior toconducting the PCA. Each group of variables was block-normalized by dividingeach concentration in the group by the group total and multiplying by 100. Up tothree outliers were removed so that sample covariance was more equally distributed.The four groups of variables included: all individual pesticides and PCB congeners,total compound groups, PCBs grouped by the number of chlorine substituents, andPCB structural groups (Tables 1±4). Total compound groups included the sum ofconcentrations of all PCBs detected (TPCB), sum of parent and metabolite DDTs(TDDT), sum of four HCH isomers (THCH), sum of ®ve chlordane components(TCHLOR), and the sum of non-DDT pesticides (TNDT). PCB homolog serieswere reported, e.g. Cl3 for the sum of Cl3(18) and Cl3(28) concentrations. Thestructural PCB groups were based on structure±activity relationships and have beenpreviously described (Boon, Oostingh, van der Meer & Hillebrand, 1994; Weisbrodet al., 2000a,b; Wells & Echarri, 1992).Based on the trends identi®ed by PCA, di�erences in WSD organochlorine con-
centrations were evaluated using a two-way analysis of variance (ANOVA) (SAS1,StatMost1). Concentrations were compared using tissue type and gender as the twofactors. Similarly, a three-way ANOVA of WSD and PW data included species, tis-sue, and gender as factors. The 20 response variables were individual and groupedanalyte concentrations that had large magnitude in PC1 or PC2 loadings.
3. Results
3.1. Data quali®cation
The results of the quality control checks indicated that the extracts were not con-taminated by outside sources and that the recovery of analytes was reasonable. Theprocedural blanks (n=3) had <1 ng/ml of each analyte, which corresponded to<0.01% WSD sample values. The average recovery of the surrogate internal stan-dards (SIS) in pooled prey samples was 92% for mackerel, 87% for herring, and99% for squid. The SIS recovery in PW blubber (n=11) was 88�39 and 98�19%in liver (n=8). The average SIS recovery of was 73�9% for WSD blubber (n=6)
34 A.V. Weisbrod et al. /Marine Environmental Research 51 (2001) 29±50
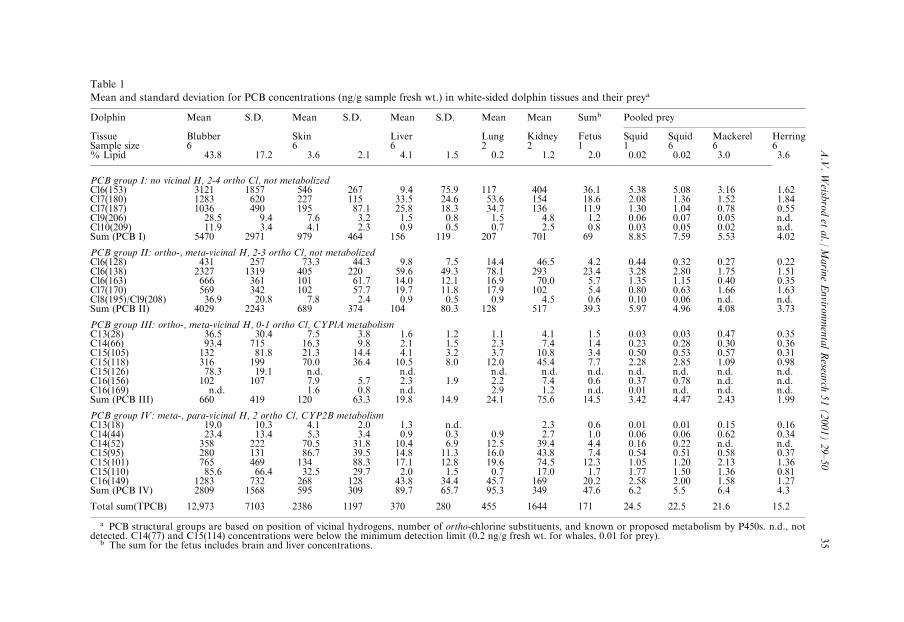
Table 1
Mean and standard deviation for PCB concentrations (ng/g sample fresh wt.) in white-sided dolphin tissues and their preya
Dolphin Mean S.D. Mean S.D. Mean S.D. Mean Mean Sumb Pooled prey
Tissue Blubber Skin Liver Lung Kidney Fetus Squid Squid Mackerel HerringSample size 6 6 6 2 2 1 1 6 6 6% Lipid 43.8 17.2 3.6 2.1 4.1 1.5 0.2 1.2 2.0 0.02 0.02 3.0 3.6
PCB group I: no vicinal H, 2-4 ortho Cl, not metabolizedCl6(153) 3121 1857 546 267 9.4 75.9 117 404 36.1 5.38 5.08 3.16 1.62Cl7(180) 1283 620 227 115 33.5 24.6 53.6 154 18.6 2.08 1.36 1.52 1.84Cl7(187) 1036 490 195 87.1 25.8 18.3 34.7 136 11.9 1.30 1.04 0.78 0.55Cl9(206) 28.5 9.4 7.6 3.2 1.5 0.8 1.5 4.8 1.2 0.06 0.07 0.05 n.d.Cl10(209) 11.9 3.4 4.1 2.3 0.9 0.5 0.7 2.5 0.8 0.03 0.05 0.02 n.d.Sum (PCB I) 5470 2971 979 464 156 119 207 701 69 8.85 7.59 5.53 4.02
PCB group II: ortho-, meta-vicinal H, 2-3 ortho Cl, not metabolizedCl6(128) 431 257 73.3 44.3 9.8 7.5 14.4 46.5 4.2 0.44 0.32 0.27 0.22Cl6(138) 2327 1319 405 220 59.6 49.3 78.1 293 23.4 3.28 2.80 1.75 1.51Cl6(163) 666 361 101 61.7 14.0 12.1 16.9 70.0 5.7 1.35 1.15 0.40 0.35Cl7(170) 569 342 102 57.7 19.7 11.8 17.9 102 5.4 0.80 0.63 1.66 1.63Cl8(195)/Cl9(208) 36.9 20.8 7.8 2.4 0.9 0.5 0.9 4.5 0.6 0.10 0.06 n.d. n.d.Sum (PCB II) 4029 2243 689 374 104 80.3 128 517 39.3 5.97 4.96 4.08 3.73
PCB group III: ortho-, meta-vicinal H, 0-1 ortho Cl, CYPlA metabolismC13(28) 36.5 30.4 7.5 3.8 1.6 1.2 1.1 4.1 1.5 0.03 0.03 0.47 0.35C14(66) 93.4 715 16.3 9.8 2.1 1.5 2.3 7.4 1.4 0.23 0.28 0.30 0.36C15(105) 132 81.8 21.3 14.4 4.1 3.2 3.7 10.8 3.4 0.50 0.53 0.57 0.31C15(118) 316 199 70.0 36.4 10.5 8.0 12.0 45.4 7.7 2.28 2.85 1.09 0.98C15(126) 78.3 19.1 n.d. n.d. n.d. n.d. n.d. n.d. n.d. n.d. n.d.C16(156) 102 107 7.9 5.7 2.3 1.9 2.2 7.4 0.6 0.37 0.78 n.d. n.d.C16(169) n.d. 1.6 0.8 n.d. 2.9 1.2 n.d. 0.01 n.d. n.d. n.d.Sum (PCB III) 660 419 120 63.3 19.8 14.9 24.1 75.6 14.5 3.42 4.47 2.43 1.99
PCB group IV: meta-, para-vicinal H, 2 ortho Cl, CYP2B metabolismC13(18) 19.0 10.3 4.1 2.0 1.3 n.d. 2.3 0.6 0.01 0.01 0.15 0.16C14(44) 23.4 13.4 5.3 3.4 0.9 0.3 0.9 2.7 1.0 0.06 0.06 0.62 0.34C14(52) 358 222 70.5 31.8 10.4 6.9 12.5 39.4 4.4 0.16 0.22 n.d. n.d.C15(95) 280 131 86.7 39.5 14.8 11.3 16.0 43.8 7.4 0.54 0.51 0.58 0.37C15(101) 765 469 134 88.3 17.1 12.8 19.6 74.5 12.3 1.05 1.20 2.13 1.36C15(110) 85.6 66.4 32.5 29.7 2.0 1.5 0.7 17.0 1.7 1.77 1.50 1.36 0.81C16(149) 1283 732 268 128 43.8 34.4 45.7 169 20.2 2.58 2.00 1.58 1.27Sum (PCB IV) 2809 1568 595 309 89.7 65.7 95.3 349 47.6 6.2 5.5 6.4 4.3
Total sum(TPCB) 12,973 7103 2386 1197 370 280 455 1644 171 24.5 22.5 21.6 15.2
a PCB structural groups are based on position of vicinal hydrogens, number of ortho-chlorine substituents, and known or proposed metabolism by P450s. n.d., notdetected. C14(77) and C15(114) concentrations were below the minimum detection limit (0.2 ng/g fresh wt. for whales, 0.01 for prey).
b The sum for the fetus includes brain and liver concentrations.
A.V.Weisb
rodet
al./
Marin
eEnviro
nmentalResea
rch51(2001)29±50
35
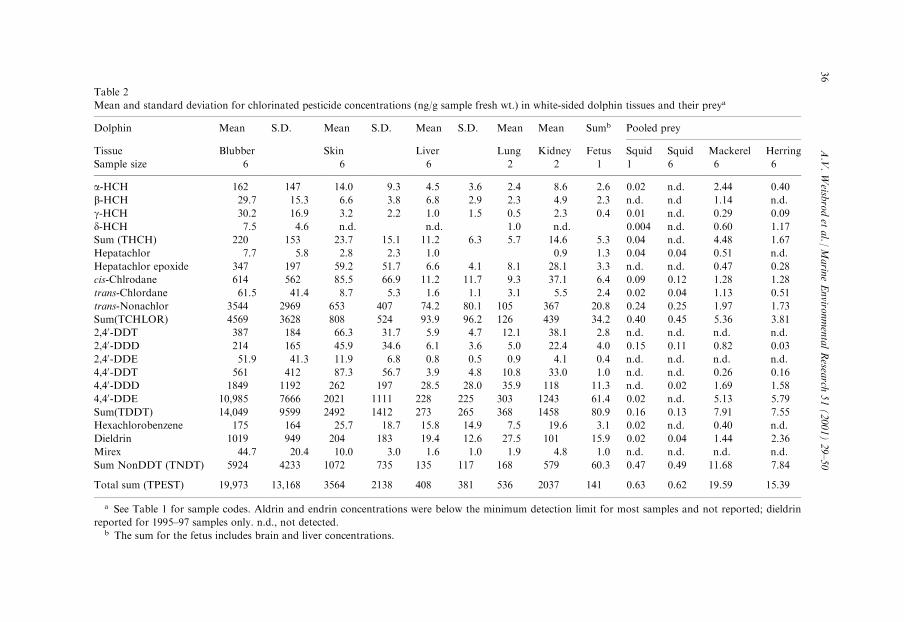
Table 2
Mean and standard deviation for chlorinated pesticide concentrations (ng/g sample fresh wt.) in white-sided dolphin tissues and their preya
Dolphin Mean S.D. Mean S.D. Mean S.D. Mean Mean Sumb Pooled prey
Tissue Blubber Skin Liver Lung Kidney Fetus Squid Squid Mackerel Herring
Sample size 6 6 6 2 2 1 1 6 6 6
a-HCH 162 147 14.0 9.3 4.5 3.6 2.4 8.6 2.6 0.02 n.d. 2.44 0.40
b-HCH 29.7 15.3 6.6 3.8 6.8 2.9 2.3 4.9 2.3 n.d. n.d 1.14 n.d.
g-HCH 30.2 16.9 3.2 2.2 1.0 1.5 0.5 2.3 0.4 0.01 n.d. 0.29 0.09
d-HCH 7.5 4.6 n.d. n.d. 1.0 n.d. 0.004 n.d. 0.60 1.17
Sum (THCH) 220 153 23.7 15.1 11.2 6.3 5.7 14.6 5.3 0.04 n.d. 4.48 1.67
Hepatachlor 7.7 5.8 2.8 2.3 1.0 0.9 1.3 0.04 0.04 0.51 n.d.
Hepatachlor epoxide 347 197 59.2 51.7 6.6 4.1 8.1 28.1 3.3 n.d. n.d. 0.47 0.28
cis-Chlrodane 614 562 85.5 66.9 11.2 11.7 9.3 37.1 6.4 0.09 0.12 1.28 1.28
trans-Chlordane 61.5 41.4 8.7 5.3 1.6 1.1 3.1 5.5 2.4 0.02 0.04 1.13 0.51
trans-Nonachlor 3544 2969 653 407 74.2 80.1 105 367 20.8 0.24 0.25 1.97 1.73
Sum(TCHLOR) 4569 3628 808 524 93.9 96.2 126 439 34.2 0.40 0.45 5.36 3.81
2,40-DDT 387 184 66.3 31.7 5.9 4.7 12.1 38.1 2.8 n.d. n.d. n.d. n.d.
2,40-DDD 214 165 45.9 34.6 6.1 3.6 5.0 22.4 4.0 0.15 0.11 0.82 0.03
2,40-DDE 51.9 41.3 11.9 6.8 0.8 0.5 0.9 4.1 0.4 n.d. n.d. n.d. n.d.
4,40-DDT 561 412 87.3 56.7 3.9 4.8 10.8 33.0 1.0 n.d. n.d. 0.26 0.16
4,40-DDD 1849 1192 262 197 28.5 28.0 35.9 118 11.3 n.d. 0.02 1.69 1.58
4,40-DDE 10,985 7666 2021 1111 228 225 303 1243 61.4 0.02 n.d. 5.13 5.79
Sum(TDDT) 14,049 9599 2492 1412 273 265 368 1458 80.9 0.16 0.13 7.91 7.55
Hexachlorobenzene 175 164 25.7 18.7 15.8 14.9 7.5 19.6 3.1 0.02 n.d. 0.40 n.d.
Dieldrin 1019 949 204 183 19.4 12.6 27.5 101 15.9 0.02 0.04 1.44 2.36
Mirex 44.7 20.4 10.0 3.0 1.6 1.0 1.9 4.8 1.0 n.d. n.d. n.d. n.d.
Sum NonDDT (TNDT) 5924 4233 1072 735 135 117 168 579 60.3 0.47 0.49 11.68 7.84
Total sum (TPEST) 19,973 13,168 3564 2138 408 381 536 2037 141 0.63 0.62 19.59 15.39
a See Table 1 for sample codes. Aldrin and endrin concentrations were below the minimum detection limit for most samples and not reported; dieldrin
reported for 1995±97 samples only. n.d., not detected.b The sum for the fetus includes brain and liver concentrations.
36
A.V.Weisb
rodet
al./
Marin
eEnviro
nmentalResea
rch51(2001)29±50
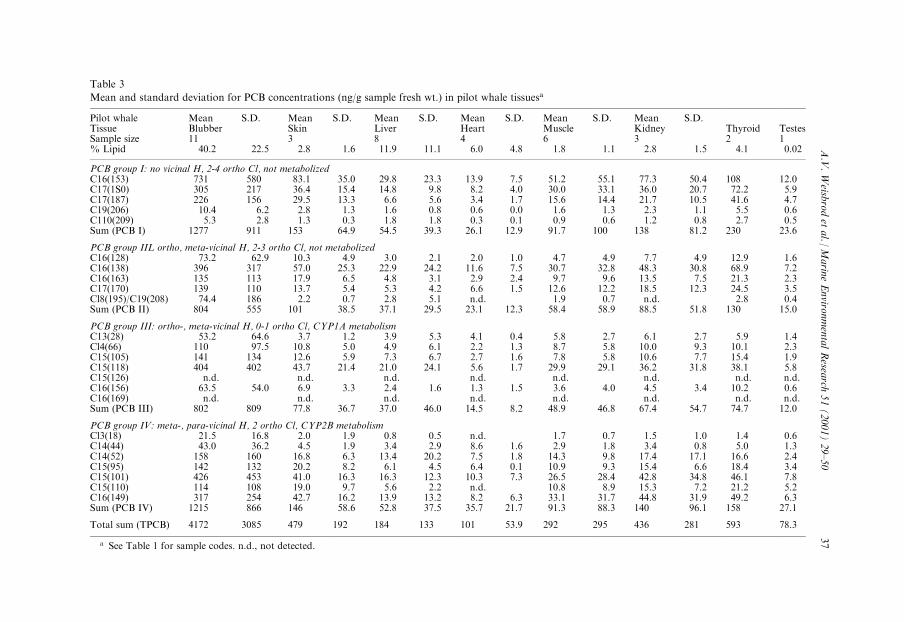
Table 3
Mean and standard deviation for PCB concentrations (ng/g sample fresh wt.) in pilot whale tissuesa
Pilot whale Mean S.D. Mean S.D. Mean S.D. Mean S.D. Mean S.D. Mean S.D.Tissue Blubber Skin Liver Heart Muscle Kidney Thyroid TestesSample size 11 3 8 4 6 3 2 1% Lipid 40.2 22.5 2.8 1.6 11.9 11.1 6.0 4.8 1.8 1.1 2.8 1.5 4.1 0.02
PCB group I: no vicinal H, 2-4 ortho Cl, not metabolizedC16(153) 731 580 83.1 35.0 29.8 23.3 13.9 7.5 51.2 55.1 77.3 50.4 108 12.0C17(1S0) 305 217 36.4 15.4 14.8 9.8 8.2 4.0 30.0 33.1 36.0 20.7 72.2 5.9C17(187) 226 156 29.5 13.3 6.6 5.6 3.4 1.7 15.6 14.4 21.7 10.5 41.6 4.7C19(206) 10.4 6.2 2.8 1.3 1.6 0.8 0.6 0.0 1.6 1.3 2.3 1.1 5.5 0.6C110(209) 5.3 2.8 1.3 0.3 1.8 1.8 0.3 0.1 0.9 0.6 1.2 0.8 2.7 0.5Sum (PCB I) 1277 911 153 64.9 54.5 39.3 26.1 12.9 91.7 100 138 81.2 230 23.6
PCB group IIL ortho, meta-vicinal H, 2-3 ortho Cl, not metabolizedC16(128) 73.2 62.9 10.3 4.9 3.0 2.1 2.0 1.0 4.7 4.9 7.7 4.9 12.9 1.6C16(138) 396 317 57.0 25.3 22.9 24.2 11.6 7.5 30.7 32.8 48.3 30.8 68.9 7.2C16(163) 135 113 17.9 6.5 4.8 3.1 2.9 2.4 9.7 9.6 13.5 7.5 21.3 2.3C17(170) 139 110 13.7 5.4 5.3 4.2 6.6 1.5 12.6 12.2 18.5 12.3 24.5 3.5Cl8(195)/C19(208) 74.4 186 2.2 0.7 2.8 5.1 n.d. 1.9 0.7 n.d. 2.8 0.4Sum (PCB II) 804 555 101 38.5 37.1 29.5 23.1 12.3 58.4 58.9 88.5 51.8 130 15.0
PCB group III: ortho-, meta-vicinal H, 0-1 ortho Cl, CYP1A metabolismC13(28) 53.2 64.6 3.7 1.2 3.9 5.3 4.1 0.4 5.8 2.7 6.1 2.7 5.9 1.4Cl4(66) 110 97.5 10.8 5.0 4.9 6.1 2.2 1.3 8.7 5.8 10.0 9.3 10.1 2.3C15(105) 141 134 12.6 5.9 7.3 6.7 2.7 1.6 7.8 5.8 10.6 7.7 15.4 1.9C15(118) 404 402 43.7 21.4 21.0 24.1 5.6 1.7 29.9 29.1 36.2 31.8 38.1 5.8C15(126) n.d. n.d. n.d. n.d. n.d. n.d. n.d. n.d.C16(156) 63.5 54.0 6.9 3.3 2.4 1.6 1.3 1.5 3.6 4.0 4.5 3.4 10.2 0.6C16(169) n.d. n.d. n.d. n.d. n.d. n.d. n.d. n.d.Sum (PCB III) 802 809 77.8 36.7 37.0 46.0 14.5 8.2 48.9 46.8 67.4 54.7 74.7 12.0
PCB group IV: meta-, para-vicinal H, 2 ortho Cl, CYP2B metabolismCl3(18) 21.5 16.8 2.0 1.9 0.8 0.5 n.d. 1.7 0.7 1.5 1.0 1.4 0.6C14(44) 43.0 36.2 4.5 1.9 3.4 2.9 8.6 1.6 2.9 1.8 3.4 0.8 5.0 1.3C14(52) 158 160 16.8 6.3 13.4 20.2 7.5 1.8 14.3 9.8 17.4 17.1 16.6 2.4C15(95) 142 132 20.2 8.2 6.1 4.5 6.4 0.1 10.9 9.3 15.4 6.6 18.4 3.4C15(101) 426 453 41.0 16.3 16.3 12.3 10.3 7.3 26.5 28.4 42.8 34.8 46.1 7.8C15(110) 114 108 19.0 9.7 5.6 2.2 n.d. 10.8 8.9 15.3 7.2 21.2 5.2C16(149) 317 254 42.7 16.2 13.9 13.2 8.2 6.3 33.1 31.7 44.8 31.9 49.2 6.3Sum (PCB IV) 1215 866 146 58.6 52.8 37.5 35.7 21.7 91.3 88.3 140 96.1 158 27.1
Total sum (TPCB) 4172 3085 479 192 184 133 101 53.9 292 295 436 281 593 78.3
a See Table 1 for sample codes. n.d., not detected.
A.V.Weisb
rodet
al./
Marin
eEnviro
nmentalResea
rch51(2001)29±50
37
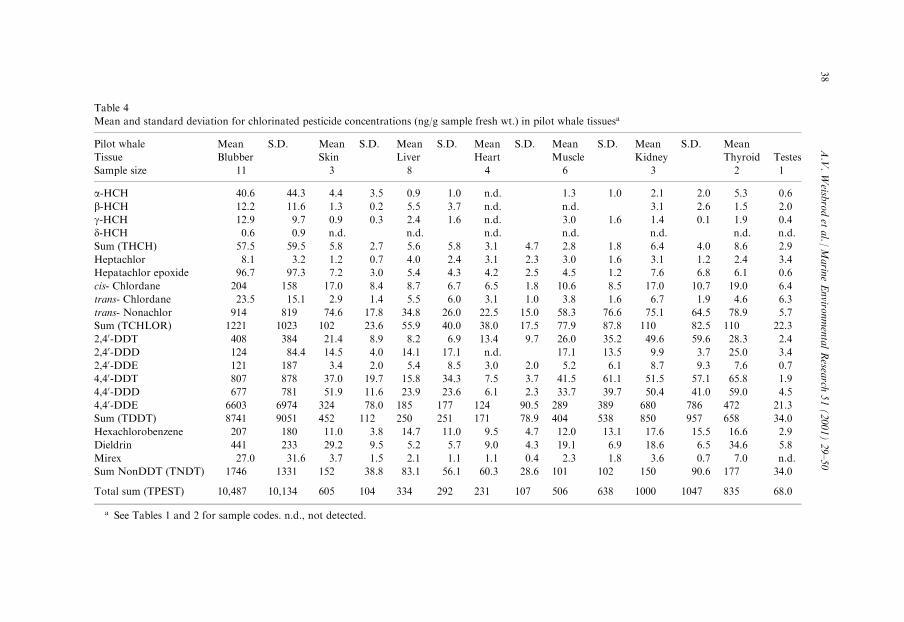
Table 4
Mean and standard deviation for chlorinated pesticide concentrations (ng/g sample fresh wt.) in pilot whale tissuesa
Pilot whale Mean S.D. Mean S.D. Mean S.D. Mean S.D. Mean S.D. Mean S.D. Mean
Tissue Blubber Skin Liver Heart Muscle Kidney Thyroid Testes
Sample size 11 3 8 4 6 3 2 1
a-HCH 40.6 44.3 4.4 3.5 0.9 1.0 n.d. 1.3 1.0 2.1 2.0 5.3 0.6
b-HCH 12.2 11.6 1.3 0.2 5.5 3.7 n.d. n.d. 3.1 2.6 1.5 2.0
g-HCH 12.9 9.7 0.9 0.3 2.4 1.6 n.d. 3.0 1.6 1.4 0.1 1.9 0.4
d-HCH 0.6 0.9 n.d. n.d. n.d. n.d. n.d. n.d. n.d.
Sum (THCH) 57.5 59.5 5.8 2.7 5.6 5.8 3.1 4.7 2.8 1.8 6.4 4.0 8.6 2.9
Heptachlor 8.1 3.2 1.2 0.7 4.0 2.4 3.1 2.3 3.0 1.6 3.1 1.2 2.4 3.4
Hepatachlor epoxide 96.7 97.3 7.2 3.0 5.4 4.3 4.2 2.5 4.5 1.2 7.6 6.8 6.1 0.6
cis- Chlordane 204 158 17.0 8.4 8.7 6.7 6.5 1.8 10.6 8.5 17.0 10.7 19.0 6.4
trans- Chlordane 23.5 15.1 2.9 1.4 5.5 6.0 3.1 1.0 3.8 1.6 6.7 1.9 4.6 6.3
trans- Nonachlor 914 819 74.6 17.8 34.8 26.0 22.5 15.0 58.3 76.6 75.1 64.5 78.9 5.7
Sum (TCHLOR) 1221 1023 102 23.6 55.9 40.0 38.0 17.5 77.9 87.8 110 82.5 110 22.3
2,40-DDT 408 384 21.4 8.9 8.2 6.9 13.4 9.7 26.0 35.2 49.6 59.6 28.3 2.4
2,40-DDD 124 84.4 14.5 4.0 14.1 17.1 n.d. 17.1 13.5 9.9 3.7 25.0 3.4
2,40-DDE 121 187 3.4 2.0 5.4 8.5 3.0 2.0 5.2 6.1 8.7 9.3 7.6 0.7
4,40-DDT 807 878 37.0 19.7 15.8 34.3 7.5 3.7 41.5 61.1 51.5 57.1 65.8 1.9
4,40-DDD 677 781 51.9 11.6 23.9 23.6 6.1 2.3 33.7 39.7 50.4 41.0 59.0 4.5
4,40-DDE 6603 6974 324 78.0 185 177 124 90.5 289 389 680 786 472 21.3
Sum (TDDT) 8741 9051 452 112 250 251 171 78.9 404 538 850 957 658 34.0
Hexachlorobenzene 207 180 11.0 3.8 14.7 11.0 9.5 4.7 12.0 13.1 17.6 15.5 16.6 2.9
Dieldrin 441 233 29.2 9.5 5.2 5.7 9.0 4.3 19.1 6.9 18.6 6.5 34.6 5.8
Mirex 27.0 31.6 3.7 1.5 2.1 1.1 1.1 0.4 2.3 1.8 3.6 0.7 7.0 n.d.
Sum NonDDT (TNDT) 1746 1331 152 38.8 83.1 56.1 60.3 28.6 101 102 150 90.6 177 34.0
Total sum (TPEST) 10,487 10,134 605 104 334 292 231 107 506 638 1000 1047 835 68.0
a See Tables 1 and 2 for sample codes. n.d., not detected.
38
A.V.Weisb
rodet
al./
Marin
eEnviro
nmentalResea
rch51(2001)29±50
and 52�38% for liver (n=6). After correcting for extraction e�ciency, the WSDliver matrix spike and duplicate had 97�23% grand mean recovery of all analytesand a 3% relative percent di�erence (RPD). Similarly, the two squid matrix spikeshad 52�10% recovery with 5% RPD and the ®sh matrix spikes had 76�27%recovery with 18% RPD. Two of seven samples of SRM 1945 analyzed between1995 and 1997 were processed with the WSD and PW batches. These two SRMsamples had grand mean analyte recoveries of 101�40 and 96�46% compared tothe National Institute of Standards and Technology (NIST) certi®ed values. For allseven SRMs, the grand mean analyte recovery was 86�48% compared to the cer-ti®ed values.Within each tissue, males and females had similar tissue lipid content and thus,
lipid content was unrelated to the organochlorine concentration di�erences detectedbetween sexes. The percent lipid content in WSD blubber was 65�12% (n=6),4.7�1.5% (n=6) in liver, and 3.6�2.1% (n=6) in skin. The fetus had signi®cantlylower lipid content than the adult animals with 1.4% lipid in the brain and 0.7%lipid in liver. PW had a lower blubber lipid content of 41�22% and higher liverlipid of 12�11% than the dolphins. Lipid content in the prey samples did not varyamong species but was extremely low in squid (< 1%) compared to ®sh (3±4%).Therefore, bar charts use fresh weight-normalized data (ng/g fresh wt.) to clearlyshow the organochlorine signatures across trophic levels. Lipid content is listedseparately (Tables 1 and 3). Due to the standardization of data for PCA, PCAresults were una�ected by data normalization to lipid content or fresh weight.Although the level of signi®cance di�ered, the ANOVA results were consistentbetween lipid- and fresh weight-normalized contaminant concentrations.
3.2. Organochlorine concentrations in prey
Organochlorine concentrations in the pooled prey samples were one to threeorders of magnitude less than in the dolphin and PW samples (Tables 1 and 2).Mackerel had equivalent concentrations of TPCB (22 ng/g fresh wt.) and TPEST.The main contributors were 4,40-DDE, trans-nonachlor, a-HCH, 4,40-DDD, diel-drin, Cl5(101), Cl5(118), Cl6(138), Cl6(149), Cl6(153), Cl7(170) and Cl7(180). Simi-larly, concentrations of TPCB and TPEST in herring were equivalent (15 ng/g freshwt.), with 4,40-DDE and 4,40-DDD (7.4 ng/g fresh wt.) contributing half of the pes-ticide burden. Unlike mackerel, the a-HCH and b-HCH concentrations in herringwere lower than d-HCH. Compared to the ®sh, squid had disproportionately highTPCB concentrations (23 ng/g fresh wt.) compared to the TDDT (0.1 ng/g fresh wt.)and other pesticides (0.5 ng/g fresh wt. TPEST).
3.3. Organochlorine concentrations in odontocetes
Pesticide concentrations were higher than PCB concentrations in the dolphin tis-sues due to the 4,40-DDE concentration (11�7.7 mg/g fresh wt. blubber and 0.2�0.2mg/g fresh wt. liver) (Tables 1 and 2). TPCB was 13�7.1 mg/g fresh wt. in blubber,0.4�0.3 mg/g fresh wt. in liver, and was equivalent to TDDT concentrations in those
A.V. Weisbrod et al. /Marine Environmental Research 51 (2001) 29±50 39
tissues. TCHLOR was one-third the concentration of TDDT. Concentrations oftrans-nonachlor, Cl6(153), Cl6(138), 4,40-DDD, Cl7(180), Cl6(149), Cl7(187) anddieldrin were one-®fth to one-tenth that of 4,40-DDE. Relative to blubber, liver hadhigher proportions of some metabolizable compounds, such as hexachlorobenzene(HCB), Cl4(52), Cl5(95), Cl5(101), Cl5(118), and the more recalcitrant Cl6(128),Cl6(163), and Cl7(170). Generally, WSD skin samples had lower organochlorineconcentrations than blubber, but both had higher concentrations than the other sixtissues sampled. On a fresh weight basis, kidney appeared to store greater organo-chlorine concentrations than lung; however, after normalization to lipid content, theconcentrations were equivalent for the two organs. Of all the dolphin tissues, thefetus had the lowest TPCB and TPEST concentrations.Although dolphins and PWs feed at the same trophic level and share common
prey, albeit at unknown relative proportions, PCB concentrations in PW tissueswere one-third the concentration in WSD (Tables 3 and 4). Pesticide concentrations,however, were more similar in the two odontocetes, especially in liver and kidney.4,40-DDE concentrations were also the highest of the organochlorines measured inPW. PW blubber samples had 4.2�3.1 mg/g fresh wt. TPCB, 8.7�9.1 mg/g fresh wt.TDDT, and 1.2�1.0 mg/g fresh wt. TCHLOR. Liver had lower concentrations thanblubber with 0.2�0.1 mg/g fresh wt. TPCB, 0.3�0.3 mg/g fresh wt. TDDT and0.06�0.04 mg/g fresh wt. TCHLOR. PWs had the same PCB congeners, trans-non-achlor and HCB that were prevalent in dolphin tissues. Also, heptachlor, trans- andcis-chlordane concentrations were higher than other pesticide concentrations in PWliver. Like the dolphins, PW skin concentrations were lower than blubber, buthigher than their internal organs that were sampled. Of all PW tissues, heart had thelowest organochlorine concentrations.For the PCB groups and ®ve representative pesticides (a-HCH, HCB, cis-chlor-
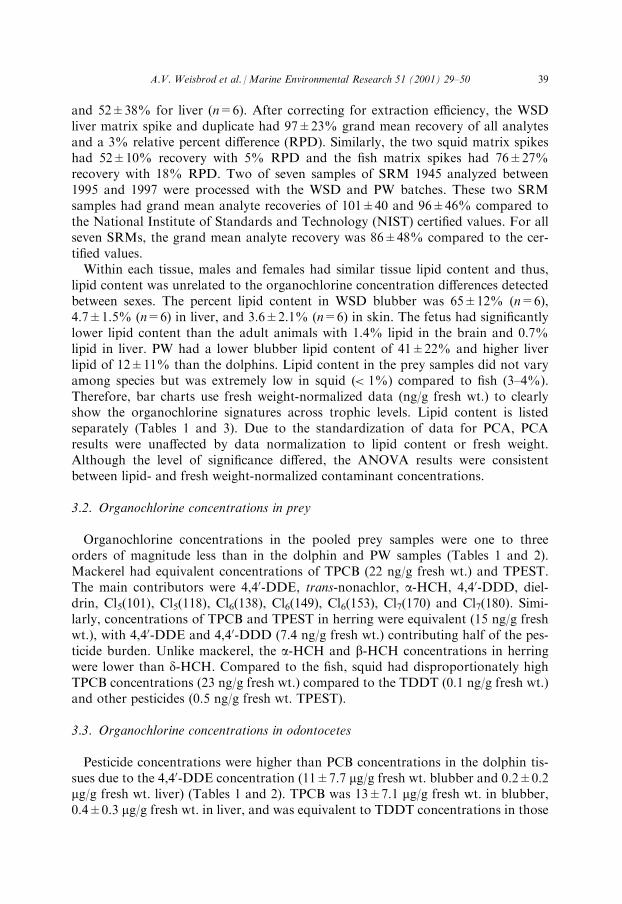
dane, trans-nonachlor, 4,40-DDE), the proportions of organochlorine concentra-tions (i.e. pro®le) seemed consistent between tissues of an odontocete species (Fig.2). PWs had the same PCB pro®le across tissues. Likewise, WSDs had a consistentPCB pro®le across tissues that was distinct from the PW pro®le. The dolphin tissuesappeared to have lower PCB group III and higher TPCB concentrations than PWs.Only the concentration of nonmetabolizable PCB group II was signi®cantly greaterin WSDs than PWs (Table 5). As expected from the similar level of pesticide con-tamination in the odontocetes, the pro®le of the ®ve pesticides appeared similaracross tissues and species.
3.4. Bioaccumulation patterns of WSD
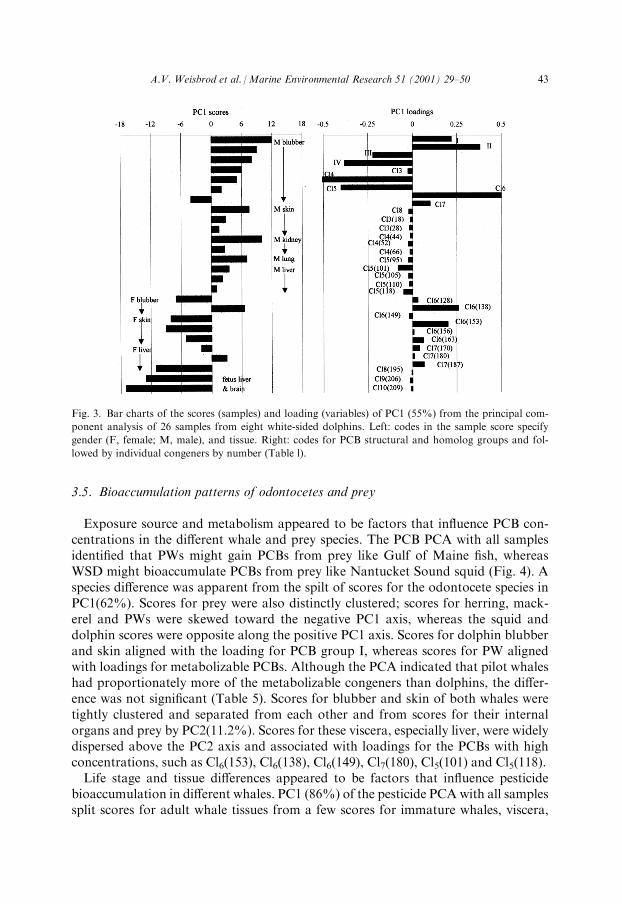
Gender-related trends in PCB bioaccumulation were identi®ed with the PCA. Thedi�erence between male and female dolphins seemed related to structure±activityrelationships and congener prevalence. Scores for samples from males and femaleswere separated in the PCA of the PCB data (Fig. 3). Fifty-®ve percent of the varia-tion in PCB concentrations was explained by the observed gender di�erence in PC1.Scores for blubber and males were skewed toward the positive x-axis for PC1, whichaligned with loadings for the nonmetabolizable PCB groups I, II, Cl6, Cl7, Cl6(153)
40 A.V. Weisbrod et al. /Marine Environmental Research 51 (2001) 29±50
and Cl6(138). In contrast, scores of females corresponded to loadings for metabo-lizable PCB groups III, IV, Cl5, Cl4, Cl5(101) and Cl5(118). ANOVA con®rmedthat tissues from males were enriched with the most recalcitrant congeners in PCBgroups I and II and the HCH isomers (Table 5). The tissue and gender-related
Fig. 2. Mean and standard deviation for PCB and pesticide concentrations (mg/g fresh wt.) in dolphin and
pilot whale tissues. The x-axis sample code lists species and tissue: W, white-sided dolphin; P, pilot whale;
B, blubber; S, skin; K, kidney; Liver; N, lung; F, fetus; M, muscle; and H, heart.
A.V. Weisbrod et al. /Marine Environmental Research 51 (2001) 29±50 41
bioaccumulation trends observed were anticipated from the organochlorine con-centrations: male blubber>female blubber>male skin>female skin>male liver>-female liver>fetal brain>fetal liver (Table 1).Although PCB bioaccumulation was in¯uenced by gender, bioaccumulation of the
whole suite of organochlorines was not. Tissue and individual, not gender, di�er-ences were important factors accounting for the variation of all organochlorineconcentrations in dolphins. In the PCA of combined pesticide and PCB data, load-ings for 4,40-DDE and 4,40-DDD had the largest magnitude in PC1 (83%) and thus,individual variance in 4,40-DDE and 4,40-DDD concentrations governed tissuebioaccumulation di�erences (not shown). Like the PCB PCA, PC1 of the PCA ofpesticide data split scores for blubber and skin from those for internal organs andthe fetus (not shown). Blubber scores corresponded to loadings for trans-nonachlor,dieldrin, 4,40-DDE and 4,40-DDD. In contrast, scores for liver and fetus sampleswere placed in the same quadrant as loadings for less lipophilic or dominant com-pounds, such as HCB, cis-chlordane, 2,40-DDT, 2,40-DDD, and the HCH isomers.
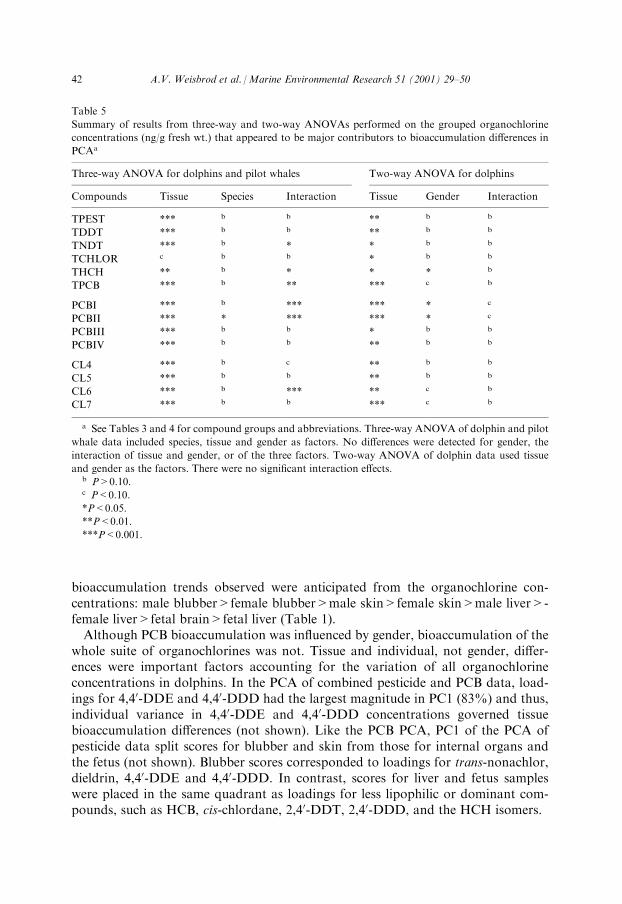
Table 5
Summary of results from three-way and two-way ANOVAs performed on the grouped organochlorine
concentrations (ng/g fresh wt.) that appeared to be major contributors to bioaccumulation di�erences in
PCAa
Three-way ANOVA for dolphins and pilot whales Two-way ANOVA for dolphins
Compounds Tissue Species Interaction Tissue Gender Interaction
TPEST *** b b ** b b
TDDT *** b b ** b b
TNDT *** b * * b b
TCHLOR c b b * b b
THCH ** b * * * b
TPCB *** b ** *** c b
PCBI *** b *** *** * c
PCBII *** * *** *** * c
PCBIII *** b b * b b
PCBIV *** b b ** b b
CL4 *** b c ** b b
CL5 *** b b ** b b
CL6 *** b *** ** c b
CL7 *** b b *** c b
a See Tables 3 and 4 for compound groups and abbreviations. Three-way ANOVA of dolphin and pilot
whale data included species, tissue and gender as factors. No di�erences were detected for gender, the
interaction of tissue and gender, or of the three factors. Two-way ANOVA of dolphin data used tissue
and gender as the factors. There were no signi®cant interaction e�ects.b P>0.10.c P<0.10.
*P<0.05.
**P<0.01.
***P<0.001.
42 A.V. Weisbrod et al. /Marine Environmental Research 51 (2001) 29±50
3.5. Bioaccumulation patterns of odontocetes and prey
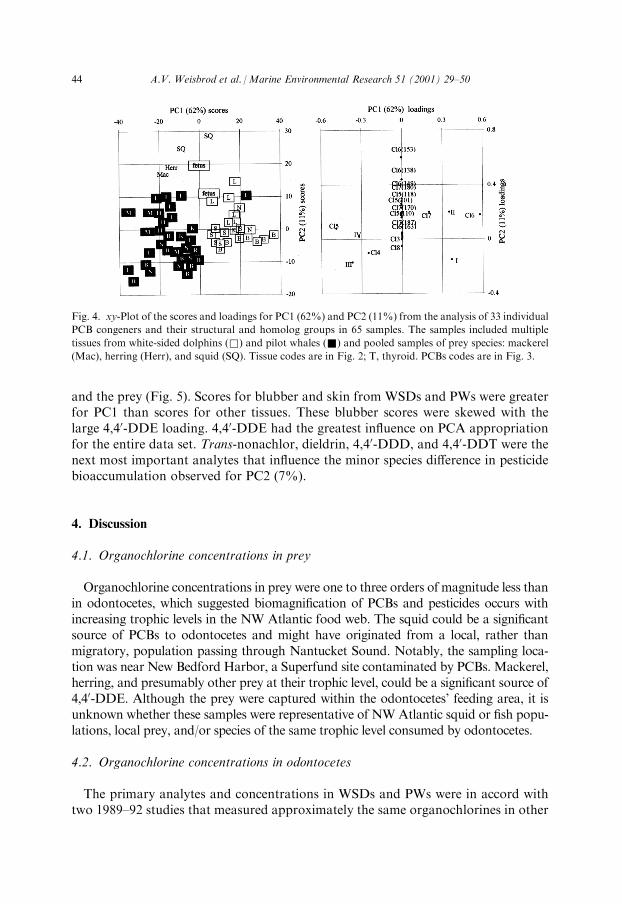
Exposure source and metabolism appeared to be factors that in¯uence PCB con-centrations in the di�erent whale and prey species. The PCB PCA with all samplesidenti®ed that PWs might gain PCBs from prey like Gulf of Maine ®sh, whereasWSD might bioaccumulate PCBs from prey like Nantucket Sound squid (Fig. 4). Aspecies di�erence was apparent from the spilt of scores for the odontocete species inPC1(62%). Scores for prey were also distinctly clustered; scores for herring, mack-erel and PWs were skewed toward the negative PC1 axis, whereas the squid anddolphin scores were opposite along the positive PC1 axis. Scores for dolphin blubberand skin aligned with the loading for PCB group I, whereas scores for PW alignedwith loadings for metabolizable PCBs. Although the PCA indicated that pilot whaleshad proportionately more of the metabolizable congeners than dolphins, the di�er-ence was not signi®cant (Table 5). Scores for blubber and skin of both whales weretightly clustered and separated from each other and from scores for their internalorgans and prey by PC2(11.2%). Scores for these viscera, especially liver, were widelydispersed above the PC2 axis and associated with loadings for the PCBs with highconcentrations, such as Cl6(153), Cl6(138), Cl6(149), Cl7(180), Cl5(101) and Cl5(118).Life stage and tissue di�erences appeared to be factors that in¯uence pesticide
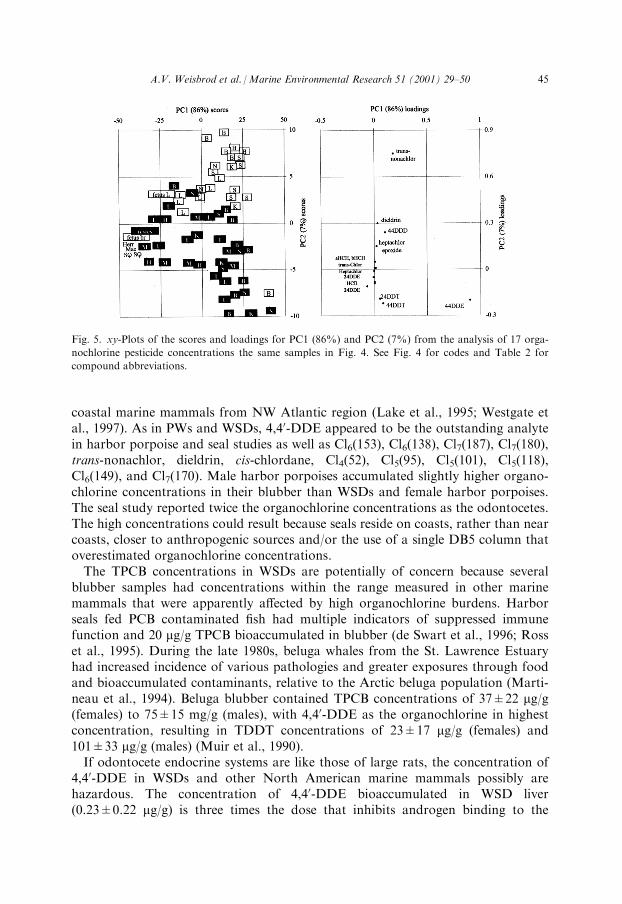
bioaccumulation in di�erent whales. PC1 (86%) of the pesticide PCA with all samplessplit scores for adult whale tissues from a few scores for immature whales, viscera,
Fig. 3. Bar charts of the scores (samples) and loading (variables) of PC1 (55%) from the principal com-
ponent analysis of 26 samples from eight white-sided dolphins. Left: codes in the sample score specify
gender (F, female; M, male), and tissue. Right: codes for PCB structural and homolog groups and fol-
lowed by individual congeners by number (Table l).
A.V. Weisbrod et al. /Marine Environmental Research 51 (2001) 29±50 43
and the prey (Fig. 5). Scores for blubber and skin from WSDs and PWs were greaterfor PC1 than scores for other tissues. These blubber scores were skewed with thelarge 4,40-DDE loading. 4,40-DDE had the greatest in¯uence on PCA appropriationfor the entire data set. Trans-nonachlor, dieldrin, 4,40-DDD, and 4,40-DDT were thenext most important analytes that in¯uence the minor species di�erence in pesticidebioaccumulation observed for PC2 (7%).
4. Discussion
4.1. Organochlorine concentrations in prey
Organochlorine concentrations in prey were one to three orders of magnitude less thanin odontocetes, which suggested biomagni®cation of PCBs and pesticides occurs withincreasing trophic levels in the NW Atlantic food web. The squid could be a signi®cantsource of PCBs to odontocetes and might have originated from a local, rather thanmigratory, population passing through Nantucket Sound. Notably, the sampling loca-tion was near New Bedford Harbor, a Superfund site contaminated by PCBs. Mackerel,herring, and presumably other prey at their trophic level, could be a signi®cant source of4,40-DDE. Although the prey were captured within the odontocetes' feeding area, it isunknown whether these samples were representative of NWAtlantic squid or ®sh popu-lations, local prey, and/or species of the same trophic level consumed by odontocetes.
4.2. Organochlorine concentrations in odontocetes
The primary analytes and concentrations in WSDs and PWs were in accord withtwo 1989±92 studies that measured approximately the same organochlorines in other
Fig. 4. xy-Plot of the scores and loadings for PC1 (62%) and PC2 (11%) from the analysis of 33 individual
PCB congeners and their structural and homolog groups in 65 samples. The samples included multiple
tissues from white-sided dolphins (&) and pilot whales (&) and pooled samples of prey species: mackerel
(Mac), herring (Herr), and squid (SQ). Tissue codes are in Fig. 2; T, thyroid. PCBs codes are in Fig. 3.
44 A.V. Weisbrod et al. /Marine Environmental Research 51 (2001) 29±50
coastal marine mammals from NW Atlantic region (Lake et al., 1995; Westgate etal., 1997). As in PWs and WSDs, 4,40-DDE appeared to be the outstanding analytein harbor porpoise and seal studies as well as Cl6(153), Cl6(138), Cl7(187), Cl7(180),trans-nonachlor, dieldrin, cis-chlordane, Cl4(52), Cl5(95), Cl5(101), Cl5(118),Cl6(149), and Cl7(170). Male harbor porpoises accumulated slightly higher organo-chlorine concentrations in their blubber than WSDs and female harbor porpoises.The seal study reported twice the organochlorine concentrations as the odontocetes.The high concentrations could result because seals reside on coasts, rather than nearcoasts, closer to anthropogenic sources and/or the use of a single DB5 column thatoverestimated organochlorine concentrations.The TPCB concentrations in WSDs are potentially of concern because several
blubber samples had concentrations within the range measured in other marinemammals that were apparently a�ected by high organochlorine burdens. Harborseals fed PCB contaminated ®sh had multiple indicators of suppressed immunefunction and 20 mg/g TPCB bioaccumulated in blubber (de Swart et al., 1996; Rosset al., 1995). During the late 1980s, beluga whales from the St. Lawrence Estuaryhad increased incidence of various pathologies and greater exposures through foodand bioaccumulated contaminants, relative to the Arctic beluga population (Marti-neau et al., 1994). Beluga blubber contained TPCB concentrations of 37�22 mg/g(females) to 75�15 mg/g (males), with 4,40-DDE as the organochlorine in highestconcentration, resulting in TDDT concentrations of 23�17 mg/g (females) and101�33 mg/g (males) (Muir et al., 1990).If odontocete endocrine systems are like those of large rats, the concentration of
4,40-DDE in WSDs and other North American marine mammals possibly arehazardous. The concentration of 4,40-DDE bioaccumulated in WSD liver(0.23�0.22 mg/g) is three times the dose that inhibits androgen binding to the
Fig. 5. xy-Plots of the scores and loadings for PC1 (86%) and PC2 (7%) from the analysis of 17 orga-
nochlorine pesticide concentrations the same samples in Fig. 4. See Fig. 4 for codes and Table 2 for
compound abbreviations.
A.V. Weisbrod et al. /Marine Environmental Research 51 (2001) 29±50 45

androgen receptor and leads to reduced androgen-induced transcriptional activity inrat liver cells (0.064 mg/g) (Kelce et al., 1995). Delayed puberty in male rats is linkedto higher 4,40-DDE concentrations administered by ingestion (Kelce et al., 1995).The concentration in PW liver (0.11�0.12 mg/g) is twice the e�ective dose.
4.3. Bioaccumulation patterns of NW Atlantic odontocetes
For extrapolating the bioaccumulation patterns to other marine mammals, thePCA and ANOVA indicate WSD and PW blubber do not contain similar propor-tions or concentrations of organochlorines as their visceral tissues, and that speciesdi�erences are signi®cant. Bar charts of concentrations of organochlorine classesshowed consistency across tissues within an odontocete species; however, PCA andANOVA identi®ed that blubber contained higher organochlorine concentrationsand higher proportions of the more prevalent, recalcitrant, and lipophilic PCBs andpesticides than viscera. The bioaccumulation patterns in WSD blubber were morelike PW blubber than they were to their internal organs. The use of blubber to organratios of individual organochlorine concentrations, ingestion rates and organo-chlorine concentrations of common prey for di�erent genders or life stages wouldallow reasonable extrapolation of a population's bioaccumulation patterns.Greater toxicant concentrations in males have been observed in marine mammals
inhabiting coastal regions (Muir et al., 1990; Westgate et al., 1997). Females arethought to reduce their body burden by transferring contaminants to o�spring viapregnancy and lactation (Addison & Brodie, 1977). Also, males and females of sev-eral cetacea have di�erent migration routes and food preferences, and thus expo-sures, at di�erent life stages (Felleman, Heimlich-Boran & Osborne, 1991; Kraus &Slay, 1998; Lockyer, 1993). In contrast to some dolphins, NW Atlantic right andPWs have long migration routes and do not appear to have signi®cant gender dif-ferences in organochlorine bioaccumulation (Weisbrod et al., 2000a,b). For WSDs,the gender di�erence was evident in that males had signi®cantly higher HCH, PCB Iand II concentrations, but not other contaminant classes. Individual variation in4,40-DDE concentrations, for example, exceeded the in¯uence of gender or otherparameters on its bioaccumulation pattern in WSDs. Given the speci®city of thegender pattern, it is conceivable that male WSD not only lack the pregnancy/lacta-tion elimination for nonmetabolizable PCBs of females, but that males might pre-ferentially consume higher PCB concentrations from PCB-rich food, like NantucketSound squid.From their continuous exposure to polluted prey living along the New England
coast, WSDs bioaccumulate higher organochlorine concentrations and have moredistinct life stage and gender patterns than PWs that migrate along the mid-Atlanticcontinental slope. The signi®cantly higher concentrations of PCB group II con-geners in WSD might also represent their more restricted range and bioaccumula-tion from the Gulf of Maine prey, compared to PWs with their inferred migrationbetween Cape Hatteras and the Bay of Fundy. In the PCB PCA, the proximity ofscores for ®sh and PWs indicated that PCB bioaccumulation was similar amongthese species, and di�ered from dolphins. In addition to being a proposed food
46 A.V. Weisbrod et al. /Marine Environmental Research 51 (2001) 29±50
source for PW, Atlantic mackerel and herring might be similarly exposed to orga-nochlorines during their migrations along the continental shelf.
4.4. Organochlorine transfer
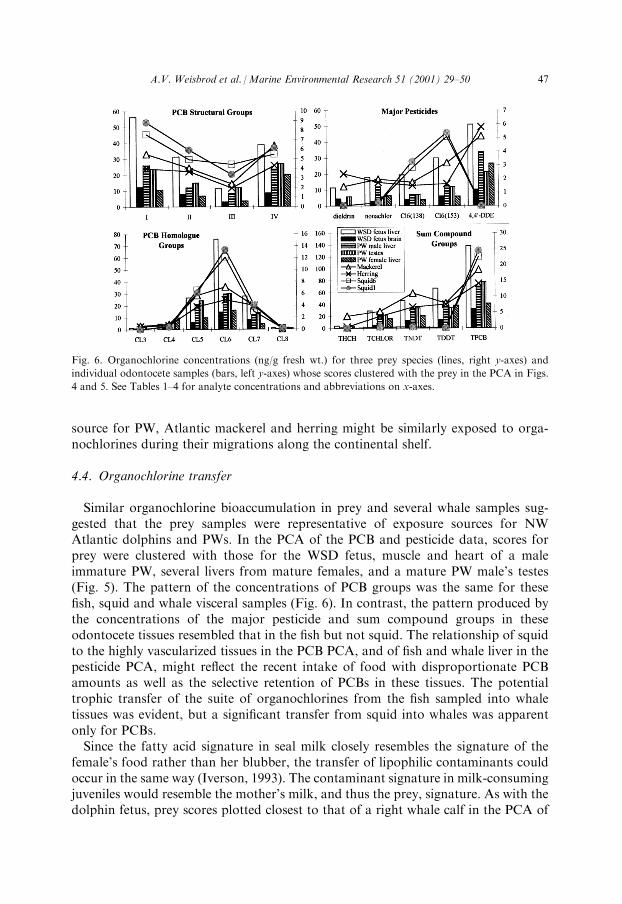
Similar organochlorine bioaccumulation in prey and several whale samples sug-gested that the prey samples were representative of exposure sources for NWAtlantic dolphins and PWs. In the PCA of the PCB and pesticide data, scores forprey were clustered with those for the WSD fetus, muscle and heart of a maleimmature PW, several livers from mature females, and a mature PW male's testes(Fig. 5). The pattern of the concentrations of PCB groups was the same for these®sh, squid and whale visceral samples (Fig. 6). In contrast, the pattern produced bythe concentrations of the major pesticide and sum compound groups in theseodontocete tissues resembled that in the ®sh but not squid. The relationship of squidto the highly vascularized tissues in the PCB PCA, and of ®sh and whale liver in thepesticide PCA, might re¯ect the recent intake of food with disproportionate PCBamounts as well as the selective retention of PCBs in these tissues. The potentialtrophic transfer of the suite of organochlorines from the ®sh sampled into whaletissues was evident, but a signi®cant transfer from squid into whales was apparentonly for PCBs.Since the fatty acid signature in seal milk closely resembles the signature of the
female's food rather than her blubber, the transfer of lipophilic contaminants couldoccur in the same way (Iverson, 1993). The contaminant signature in milk-consumingjuveniles would resemble the mother's milk, and thus the prey, signature. As with thedolphin fetus, prey scores plotted closest to that of a right whale calf in the PCA of
Fig. 6. Organochlorine concentrations (ng/g fresh wt.) for three prey species (lines, right y-axes) and
individual odontocete samples (bars, left y-axes) whose scores clustered with the prey in the PCA in Figs.
4 and 5. See Tables 1±4 for analyte concentrations and abbreviations on x-axes.
A.V. Weisbrod et al. /Marine Environmental Research 51 (2001) 29±50 47

organochlorine data from 71 right whales and their zooplankton prey (Weisbrod etal., 2000b). For the WSD fetus and the right whale calf, the scores in PCA were alsoin close proximity to those of their mothers, which supports the notion that o�springalso receive contaminants during gestation relative to its mother's body burdens.
Acknowledgements
We thank the anonymous technical reviewers, D. Eggleston and R. Leidy (NorthCarolina State University, Raleigh, NC), S. Kraus, P. Hamilton and G. Early (NewEngland Aquarium, Boston, MA), G. Waring and D. Potter (National MarineFisheries Service, National Oceanic and Atmospheric Administration [NOAA],Woods Hole, MA), and A. Read (Duke University, NC; Grand Manan MarineMammal and Seabird Station). This work is a result of research sponsored by theNOAA National SeaGrant College Program O�ce (Grant No. NA46RG0470,WHOI SeaGrant Project No. R/P-61), the Regional Marine Research Program forthe Gulf of Maine (GMR-25), and a 3-year fellowship for A.V.W. provided byBASF Corporation. The views expressed herein are those of the authors and do notnecessarily re¯ect the views of NOAA, its subagencies, or other sponsors.
References
Addison, R. F., & Brodie, P. F. (1977). Organochlorine residues in maternal blubber, milk and pup
blubber from grey seals (Halichoerus grypus) from Sable Island, Nova Scotia. Journal of Fisheries of
Research Board of Canada, 34, 937±941.
Aguilar, A., & Borrell, A. (1994). Abnormally high polychlorinated biphenyl levels in striped dolphins (Ste-
nella coeruleoalba) a�ected by the 1990±1992 Mediterranean epizootic. Science of the Total Environment,
154, 237±247.
Boon, J. P., Oostingh, I., van der Meer, J., & Hillebrand, M. T. J. (1994). A model for the bioaccumula-
tion of chlorobiphenyl congeners in marine mammals. European Journal of Pharmacology: Environ-
mental Toxicology and Pharmology, 270, 237±251.
de Swart, R. L., Ross, P. S., Vos, J. G., & Osterhaus, A. D. M. E. (1996). Impaired immunity in harbor
seals (Phoca vitulina) exposed to bioaccumulated environmental contaminants: review of a long-term
feeding study. Environmental Health Perspectives, 194(4), 823±828.
Desportes, G., & Mouritsen, R. (1993). Preliminary results on the diet of long-®nned pilot whales o� the
Faroe Islands. In G. P. Donovan, C. H. Lockyer, & A. R. Martin, Biology of northern hemisphere pilot
whales (pp. 305±324). Cambridge, UK: International Whaling Commission.
Fair®eld, C. P., Waring, G. T., & Sano, M. H. (1993). Pilot whales incidentally taken during the distant
water ¯eet Atlantic mackerel ®shery in the Mid-Atlantic Bight, 1984±88. In G. P. Donovan,
C. H. Lockyer, & A. R. Martin, Biology of northern hemisphere pilot whales (pp. 107±116). Cambridge,
UK: International Whaling Commission.
Felleman, F. L., Heimlich-Boran, J. R., & Osborne, R. W. (1991). The feeding ecology of killer whales
(Orcinus orca) in the Paci®c Northwest. In K. Pryor, & K. S. Norris, Dolphin societies (pp. 113±147).
Berkeley, CA, USA: University of California Press.
Gannon, D. P., Read, A. J., & Mead, J. G. (1997). Stomach content of long-®nned pilot whales (Globi-
cephala melas) stranded on the U.S. mid-Atlantic coast. Marine Mammal Science, 13(3), 405±418.
Iverson, S. J. (1993). Milk secretion in marine mammals in relation to foraging: can milk fatty acids pre-
dict diet? Zoological Society of London Symposium, 66, 263±291.
48 A.V. Weisbrod et al. /Marine Environmental Research 51 (2001) 29±50
Keith, L. (1991). Environmental sampling and analysis: a practical guide. Baton Rouge, LA, USA: Lewis
Publishers, CRC Press.
Kelce, W. R., Stone, C. R., Laws, S. C., Gray, L. E., Kemppainen, J. A., &Wilson, E. M. (1995). Persistent
DDT metabolite p,p0-DDE is a potent androgen receptor antagonist. Nature, 375(15 June), 581±585.
Kraus, S. and Slay, C. (1998). North Atlantic right whales: why go South is you are big and fat? InPro-
ceedings: World Marine Mammal Science Congress. Monaco: Society of Marine Mammalogy and Eur-
opean Cetacean Society
Kuehl, D. W., Haebler, R., & Potter, C. (1991). Chemical residues in dolphins from the U. S. Atlantic
coast including Atlantic bottlenose obtained during the 1987/88 mass mortality. Chemosphere, 22(11),
1071±1084.
Kuiken, T., Bennett, P. M., Allchin, C. R., Kirkwood, J. P., Baker, J. R., Lockyer, C. H., Walton, M. J.,
& Sheldrick, M. C. (1994). PCBs, cause of death and body condition in harbor porpoises (Phocoena
phocoena) from British waters. Aquatic Toxicology, 28, 128±134.
Kvalheim, O. M. (1993). Sirius for Windows. Bergen Norway: Patterns Recognition Systems a/s.
Lahvis, G. P., Wells, R. S., Kuehl, D. W., Stewart, J. L., Rhinhart, H. L., & Via, C. S. (1995). Decreased
lymphocyte responses in free-ranging bottlenose dolphins (Tursiops truncatus) are associated with
increased concentrations of PCBs and DDT in peripheral blood. Environmental Health Perspectives,
103(4), 67±72.
Lake, C. A., Lake, J. L., Haebler, R., McKinney, R., Boothman, W. S., & Sadove, S. S. (1995). Con-
taminant levels in harbor seals from the Northeastern United States. Archives of Environmental Con-
tamination and Toxicology, 29, 128±134.
Lockyer, C. H. (1993). Seasonal changes in body fat condition of Northeast Atlantic pilot whales and
their biological signi®cance. In G. P. Donovan, C. H. Lockyer, & A. R. Martin, Biology of northern
hemisphere pilot whales (pp. 325±349). Cambridge: International Whaling Commission.
Martineau, D., Beland, P., Desjardins, C., & Lagace, A. (1987). Levels of organochlorine chemicals in
tissues of beluga whales (Delphinapterus leucus) from the St. Lawrence Estuary, Quebec, Canada.
Archives of Environmental Contamination and Toxicology, 16, 137±147.
Martineau, D., DeGuise, S., Fournier, M., Shugart, L., Girard, C., Lagace, A., & Beland, P. (1994).
Pathology and toxicology of beluga whales from the St. Lawrence Estuary, Quebec, Canada: past,
present, and future. Science of the Total Environment, 154, 201±215.
Mate, B. R., & Sta�ord, K.M. (1994). Movements and dive behavior of a satellite-monitored Atlantic white-
sided dolphin (Lagenorhynchus acutus) in the Gulf of Maine.Marine Mammal Science, 10(1), 116±121.
Muir, D. C. G., Ford, C. A., Steward, R. E., Smith, T. G., Addison, R. F., Zinck, M. E., & Beland, P.
(1990). Organochlorine contaminants in belugas, Delphinapterus leucus, from Canadian water. In
T. St. Aubin, D. St. Aubin, & J. Geraci, Advances in research on the beluga whale, Delphinapterus leu-
cus (pp. 165±190). Ottawa, ON, Canada: Canada Communication Group Ð Publishing Supply and
Services Canada.
Muir, D. C. G., Wagemann, R., Grift, N. P., Norstrom, R. J., Simon, M., & Lien, J. (1988). Organo-
chlorine chemical and heavy metal contaminants in white-beaked dolphins (Lagenorhynchus albirostris)
and pilot whales (Globicephala melaena) from the coast of Newfoundland. Canadian Archives of
Environmental Contamination and Toxicology, 17, 613±629.
Nelson, D., & Lien, J. (1994). The status of the long-®nned pilot whale, Globicephala melas, in Canada.
Canadian Field-Naturalist, 110(3), 511±524.
Payne, P. M., & Heinemann, D. W. (1993). The distribution of pilot whales (Globicephala spp.) in the
shelf/shelf-edge and slope waters of the Northeastern Unites States, 1978±1988. In G. P. Donovan,
C. H. Lockyer, & A. R. Martin, Biology of northern hemisphere pilot whales (pp. 51±68). Cambridge,
UK: International Whaling Commission.
Ross, P. S., de Swart, R. L., Reijnders, P. J. H., van Loveren, H., Vos, J. G., & Osterhaus, A. D. M. E.
(1995). Contaminant-related suppression of delayed type hypersensitivity and antibody responses in
harbor seals fed herring from the Baltic Sea. Environmental Health Perspectives, 103, 162±167.
Selzer, L. A., & Payne, P. M. (1998). The distribution of white-sided dolphin (Lagenorhynchus acutus) and
common dolphins (Delphinus delphis) vs. environmental features of the continental shelf of the North-
eastern United States. Marine Mammal Science, 4(2), 141±153.
A.V. Weisbrod et al. /Marine Environmental Research 51 (2001) 29±50 49
Sergeant, D. E. (1962). The biology of the pilot or pothead whale, Globicephala melaena (Traill), in New-
foundland waters. Ottawa, ON, Canada: Bulletins of the Fisheries Research Board of Canada Ð 132.
Sergeant, D. E., St. Aubin, D. J., & Geraci, J. R. (1980). Life history and Northwest Atlantic status of the
Atlantic white-sided dolphin, Lagenorhynchus acutus. Cetology, 27, 1±12.
Waring, G. T., Palka, D. L., Mullin, K. D., Hain, J. H. W., Hansen, L. J. & Bisack, K. D. (1997). U. S.
Atlantic and Gulf of Mexico marine mammal stock assessments Ð 1996 (Technical Memorandum
NMFS-NE-114). Woods Hole, MA, USA: National Oceanic and Atmospheric Administration.
Weisbrod, A. V., Shea, D., Moore, M. J. & Stegeman, J. J. (2000a). Bioaccumulation patterns of PCB and
chlorinated pesticides in Northwest Atlantic pilot whales. Environmental Toxicology Chemistry, 19(3),
667±677.
Weisbrod, A. V., Shea, D., Moore, M. J. & Stegeman, J. J. (2000b). Organochlorine exposure and
bioaccumulation in the endangered Northwest Atlantic right whale (Eubalaena glacialis) polulation.
Environmental Toxicology Chemistry, 19(3), 654±666.
Wells, D.E, & Echarri, I. (1992). Determination of individual chlorobiphenyls (CBs) including non-ortho,
ad mono-ortho chloro-substituted CBs in marine mammals from Scottish waters. International Journal
of Environmental Analytical Chemistry, 47, 75±97.
Westgate, A. J., Muir, D. C. G., Gaskin, D. E., & Kingsley, M. C. S. (1997). Concentrations and accu-
mulation patterns of organochlorine contaminants in the blubber of harbor porpoises, Phocoena pho-
coena, from the coast of Newfoundland, the Gulf of St. Lawrence and the Bay of Fundy/Gulf of Maine.
Environmental Pollution, 95(1), 105±119.
50 A.V. Weisbrod et al. /Marine Environmental Research 51 (2001) 29±50