Species and acoustic diversity of bats in a paleotropical wet evergreen forest in southern India
11
RESEARCH ARTICLES CURRENT SCIENCE, VOL. 107, NO. 4, 25 AUGUST 2014 631 *For correspondence. (e-mail: [email protected]) Species and acoustic diversity of bats in a palaeotropical wet evergreen forest in southern India H. Raghuram 1,2, *, M. Jain 1,3 and R. Balakrishnan 1 1 Centre for Ecological Sciences, Indian Institute of Science, Bangalore 560 012, India 2 Present address: Post Graduate and Research Department of Zoology, The American College, Madurai 625 002, India 3 Present address: Department of Biological Sciences, Indian Institute of Science Education and Research, Knowledge City, Sector 81, S.A.S. Nagar, Mohali 140 306, India The Western Ghats of India is among the top 25 bio- diversity hotspots in the world. About 43% of the re- ported 117 bat species in India are found in this region, but few quantitative studies of bat echoloca- tion calls and diversity have been carried out here thus far. A quantitative study of bat diversity was therefore conducted using standard techniques, inclu- ding mist-netting, acoustical and roost surveys in the wet evergreen forests of Kudremukh National Park in the Western Ghats of Karnataka. A total of 106 bats were caught over 108 sampling nights, representing 17 species, 3 belonging to Megachiroptera and 14 to Microchiroptera. Acoustical and roost surveys added three more species, two from Microchiroptera and one from Megachiroptera. Of these 20 species, 4 belonged to the family Pteropodidae, 10 to Vespertili- onidae, 3 to Rhinolophidae, 2 to Megadermatidae and 1 to Hipposideridae. We recorded the echolocation calls of 13 of the 16 microchiropteran species, of which the calls of 4 species (Pipistrellus coromandra, Pipistrellus affinis, Pipistrellus ceylonicus and Harpio- cephalus harpia) have been recorded for the first time. Discriminant function analyses of the calls of 11 spe- cies provided 91.7% correct classification of individuals to their respective species, indicating that the echolo- cation calls could be used successfully for non-invasive acoustic surveys and monitoring of bat species in the future. Keywords: Bats, echolocation, species diversity, wet evergreen forest. BATS are among the most diverse and the only group of mammals that have achieved true self-powered flight. More than 1100 species belonging to 18 families and 201 genera of bats are known worldwide, making up about one quarter of all living mammals 1 . They serve as excel- lent indicator species in tropical rainforests because they are speciose, trophically diverse, abundant, widespread and often predictably responsive to environmental change and habitat destruction 2–4 . The species richness of bats is well documented in the Neotropics, including Central and South America 5–7 . Studies in the palaeotropics have how- ever largely been restricted to Southeast Asia 8 . On the basis of these studies, it is concluded that bat species richness is higher in the Neotropics than in the paleotrop- ics 5,9 . However, estimates of bat diversity in the Palaeo- tropics have not included the Indian subcontinent, largely due to the lack of quantitative surveys employing appro- priate sampling methods. Such studies are lacking in India and are urgently needed to assess both the local and global diversity of bats. In the Indian sub-continent, the order Chiroptera is presently represented by 117 species belonging to 39 genera and 8 families 10 . However, the distribution, eco- logy and echolocation calls of most bat species in India is still poorly known 11 , hampering conservation efforts. The Western Ghats is among the top 25 global biodiversity hotspots for conservation and is regarded as one of the highly endangered eco-regions of the world 12 . Although the total area is less than 6% of the land area of India, the Western Ghats contains more than 30% of the Indian fauna and flora with a high degree of endemism 13 . Several studies have documented the species diversity of plants, insects, frogs and birds in the Western Ghats 14 . Kudremukh National Park (KNP) is situated in the southern Western Ghats in Karnataka and consists of a complex vegetation mosaic of tropical evergreen forest and montane grasslands. Radhakrishnan 15 recently re- viewed the current status of the fauna of KNP. Despite the diversity of bat species in the Western Ghats 11,16 , only five species have thus far been described in KNP 17 . These are Cynopterus sphinx, Pteropus giganteus, Megaderma lyra, Pipistrellus ceylonicus and Rhinolophus pusillius, which were identified by direct observation at roosts and from dead specimens collected on the roadside 17 . Other than Rhinolophus pusillius, the species previously descri- bed are all widely distributed in India 11 . Thus far, no quantitative survey of bats has been carried out in KNP. About 80% of the world’s bat species consists of micro- chiropteran bats possessing well-developed echolocation
-
Upload
iisermohali -
Category
Documents
-
view
3 -
download
0
Transcript of Species and acoustic diversity of bats in a paleotropical wet evergreen forest in southern India

RESEARCH ARTICLES
CURRENT SCIENCE, VOL. 107, NO. 4, 25 AUGUST 2014 631
*For correspondence. (e-mail: [email protected])
Species and acoustic diversity of bats in a palaeotropical wet evergreen forest in southern India H. Raghuram1,2,*, M. Jain1,3 and R. Balakrishnan1 1Centre for Ecological Sciences, Indian Institute of Science, Bangalore 560 012, India 2Present address: Post Graduate and Research Department of Zoology, The American College, Madurai 625 002, India 3Present address: Department of Biological Sciences, Indian Institute of Science Education and Research, Knowledge City, Sector 81, S.A.S. Nagar, Mohali 140 306, India
The Western Ghats of India is among the top 25 bio-diversity hotspots in the world. About 43% of the re-ported 117 bat species in India are found in this region, but few quantitative studies of bat echoloca-tion calls and diversity have been carried out here thus far. A quantitative study of bat diversity was therefore conducted using standard techniques, inclu-ding mist-netting, acoustical and roost surveys in the wet evergreen forests of Kudremukh National Park in the Western Ghats of Karnataka. A total of 106 bats were caught over 108 sampling nights, representing 17 species, 3 belonging to Megachiroptera and 14 to Microchiroptera. Acoustical and roost surveys added three more species, two from Microchiroptera and one from Megachiroptera. Of these 20 species, 4 belonged to the family Pteropodidae, 10 to Vespertili-onidae, 3 to Rhinolophidae, 2 to Megadermatidae and 1 to Hipposideridae. We recorded the echolocation calls of 13 of the 16 microchiropteran species, of which the calls of 4 species (Pipistrellus coromandra, Pipistrellus affinis, Pipistrellus ceylonicus and Harpio-cephalus harpia) have been recorded for the first time. Discriminant function analyses of the calls of 11 spe-cies provided 91.7% correct classification of individuals to their respective species, indicating that the echolo-cation calls could be used successfully for non-invasive acoustic surveys and monitoring of bat species in the future. Keywords: Bats, echolocation, species diversity, wet evergreen forest. BATS are among the most diverse and the only group of mammals that have achieved true self-powered flight. More than 1100 species belonging to 18 families and 201 genera of bats are known worldwide, making up about one quarter of all living mammals1. They serve as excel-lent indicator species in tropical rainforests because they are speciose, trophically diverse, abundant, widespread and often predictably responsive to environmental change
and habitat destruction2–4. The species richness of bats is well documented in the Neotropics, including Central and South America5–7. Studies in the palaeotropics have how-ever largely been restricted to Southeast Asia8. On the basis of these studies, it is concluded that bat species richness is higher in the Neotropics than in the paleotrop-ics5,9. However, estimates of bat diversity in the Palaeo-tropics have not included the Indian subcontinent, largely due to the lack of quantitative surveys employing appro-priate sampling methods. Such studies are lacking in India and are urgently needed to assess both the local and global diversity of bats. In the Indian sub-continent, the order Chiroptera is presently represented by 117 species belonging to 39 genera and 8 families10. However, the distribution, eco-logy and echolocation calls of most bat species in India is still poorly known11, hampering conservation efforts. The Western Ghats is among the top 25 global biodiversity hotspots for conservation and is regarded as one of the highly endangered eco-regions of the world12. Although the total area is less than 6% of the land area of India, the Western Ghats contains more than 30% of the Indian fauna and flora with a high degree of endemism13. Several studies have documented the species diversity of plants, insects, frogs and birds in the Western Ghats14. Kudremukh National Park (KNP) is situated in the southern Western Ghats in Karnataka and consists of a complex vegetation mosaic of tropical evergreen forest and montane grasslands. Radhakrishnan15 recently re-viewed the current status of the fauna of KNP. Despite the diversity of bat species in the Western Ghats11,16, only five species have thus far been described in KNP17. These are Cynopterus sphinx, Pteropus giganteus, Megaderma lyra, Pipistrellus ceylonicus and Rhinolophus pusillius, which were identified by direct observation at roosts and from dead specimens collected on the roadside17. Other than Rhinolophus pusillius, the species previously descri-bed are all widely distributed in India11. Thus far, no quantitative survey of bats has been carried out in KNP. About 80% of the world’s bat species consists of micro-chiropteran bats possessing well-developed echolocation

RESEARCH ARTICLES
CURRENT SCIENCE, VOL. 107, NO. 4, 25 AUGUST 2014 632
Figure 1. Map of Kudremukh National Park (KNP) indicating the study area and recording sites (Wiki-mapia.org). Boundaries of the Western Ghats are indicated by dark lines in Peninsular India.
abilities to aid in both prey capture and general orienta-tion18. The echolocation signals of bats are relatively con-served within species, but vary in spectral (frequency) and temporal features (such as duration, duty cycle) among species19. These differences are large enough in some bat species to facilitate species identification20,21. Thus, recording echolocation calls and establishing a library of reference calls can help identify, survey and monitor bat species in the field20–23. Echolocation calls may also help to better discriminate cryptic species or to discover new species24–27. In India, more than 107 species of echolocating bats are known from the suborder Micro-chiroptera10,11, but information on their echolocation calls is restricted to about 39 species25–32. A library of echolo-cation calls of Indian bats would be a first step towards developing an appropriate framework for acoustic identi-fication and monitoring of bat species21,33,34. The echolo-cation calls of bats in the Western Ghats are available
only for 13 species25–32. Our aim was thus to record and characterize echolocation calls of as many species as pos-sible in the evergreen forests of KNP, while simultane-ously examining bat species diversity. Characterization of echolocation calls, acoustic identification and monitoring have largely focused on bats of the temperate regions33,34 and there are few studies in the palaeotropics, especially in the Indian sub-continent, that have recorded the calls of entire bat species assemblages or tested the efficacy of acoustic species identification25–28,32.
Materials and methods
Study site
KNP is located in Karnataka, from 1301N to 1329N lat. and 7501E to 7525E long. (Figure 1), covering an area

RESEARCH ARTICLES
CURRENT SCIENCE, VOL. 107, NO. 4, 25 AUGUST 2014 633
Table 1. Recording sites, forest vegetation and sampling effort for bats in Kudremukh National Park (KNP)
No. of No. of Net- No. of Net- Height category Location Altitude (m) Forest vegetation type sites sampled nights sampled hours bats caught hour/bat
Low elevation Mulluru, Erinje 86–108 Semi-evergreen 12 36 180 39 4.6 Mid elevation Abascut, Ekunje 409–512 Evergreen 12 36 180 29 6.2 High elevation MPCA, South 860–880 Evergreen, grasslands, Kendra border montane evergreen 12 36 180 38 4.7 Total 36 108 540 106 5.0
of approximately 600 sq. km. The altitude ranges from 134 to 1892 m amsl, the highest point being the Kudre-mukh peak, which is situated in the southern portion of the Park. The temperature recorded (Kestrel Pocket Weather Station, USA) during the dry season (December to May) was 26.7 1.26C (n = 30) and 26.4 0.68C (n = 30) in the wet season (June to November). The rain-fall during the study period ranged from 21 to 63 mm in dry season and 573 to 813 mm in the wet season, recorded for three consecutive years, 2007–2009 (Karkala Rain Gauge, Indian Meteorological Station). The Park vegeta-tion consists mainly of tropical rainforest with evergreen and semi-evergreen forest trees. The low elevation rain-forest is primarily of the Dipterocarpus–Humboldtia–Poeciloneuron type, whereas in the southern region, the mid elevation rainforest is of the Cullenia–Mesua–Palaquium type35.
Diversity estimation
The study was conducted in and around KNP over a two-year period, from December 2007 to May 2008 and from November 2008 to February 2009. We captured bats using mist nets for a total of 108 nights at three different elevations: low (approx 100 m), middle (400–500 m) and high (800–900 m; Figure 1). At each elevation, we selected 12 different sites separated from each other by 100–500 m and at each site we carried out mist netting for three nights (Table 1). On each of the three nights of sampling, different habitat types were sampled in a randomized order. These habitats were uncluttered (open clearings), semi-cluttered (streams) and cluttered space (among forest trees). We sampled bats for five hours each night from 1800 to 2300 h using a nylon mist net of 9 m length and 2 m height with a mesh size of 38 mm (Avinet-Dryden, USA). The trapping effort for bats at each elevation is given in Table 1. One mist net hour represents one mist net open for one hour. Nets were checked at least once every 15 min to reduce the chance of trapped bats becoming badly entangled. We retrieved the bats immediately from the net and kept them in holding bags made of clean soft cloth. All the bats were sexed, weighed and external measurements were recorded. We identified bats to species
level based on their external morphology and key charac-teristics (Appendix 1). The echolocation calls of micro-chiropteran bats were recorded using the procedure given below. We released all the bats at the site of capture imme-diately after taking measurements and recording their calls. Bat species inventories were analysed through the con-struction of species accumulation curves, where the measure of sampling effort (number of nights) was plot-ted against the cumulative number of species captured36. To eliminate the effect of temporal biases in sampling effort on the accumulation curve, the sample order was randomized 50 times using EstimateS software37. This produces smoothed species accumulation curves by repeated reordering of the samples. To estimate the com-pleteness of the inventory relative to the sampling effort invested, we fitted a Clench equation38 to the observed species accumulation data using nonlinear least square curve fitting in R v.2.9 (The R Foundation for Statistical Computing). The Clench equation is an asymptotic model and assumes that the probability of adding species to the list decreases with the number of species already recor-ded, but increases over time: S(t) = at/(1 + bt), where S(t) is the predicted number of species at t, t is a measure of sampling effort, a is the rate of increase at the beginning of sampling, and b represents the accumulation of species. From this nonlinear model we obtained the coefficient of determination (r2) between the observed and predicted values39. The Clench model is well suited to our data because our sampling areas were large (> 50 sq. km)38,39. To assess the completeness of our bat inventory, the following steps were followed39: (1) We calculated the asymptote of the curve a/b, that represents the predicted total number of species. (2) The proportion of observed number of species (calculated from the predicted asymp-totic species numbers) was calculated as PSobs = TSobs/ (a/b), where PSobs is the proportion of observed number of species and TSobs is the total number of observed species. (3) The sampling effort required to reach a 90% level of completeness39 was calculated as: t0.90 = 0.90/(b (1 – 0.90)).

RESEARCH ARTICLES
CURRENT SCIENCE, VOL. 107, NO. 4, 25 AUGUST 2014 634
Table 2. Temporal and spectral features of echolocation calls of 13 bat species recorded inside KNP. For each variable, mean SD, range (or values separated by commas in case of two individuals) are shown
Species Call structure No. of bats FMax (kHz) FMin (kHz) FMaxE (kHz) Duration (ms)
Scotophilus kuhlii FM 3 117.4 9.2 41.0 0.6 52.8 4.6 3.2 0.5 (107.5–125.7) (40.2–41.4) (47.8–56.9) (2.7–3.7) Pipistrellus ceylonicus FM 4 101.7 2.0 32.8 0.4 44.0 4.0 1.4 0.4 (98.7–103.8) (32.4–33.3) (41.3–49.9) (1.1–1.9) Pipistrellus coromandra* FM 6 122.8 3.90 38.8 3.0 50.2 3.6 1.6 0.4 (116.7–127.6) (35.9–43.1) (47.3–56.5) (1.2–2.1) Pipistrellus affinis FM 2 132, 122 55.0, 55.1 82.4, 73.4 2.4, 2.2 Pipistrellus tenuis† FM/QCF 3 60.8 11.5 35.1 6.0 37.8 8.4 8.6 1.5 (51.4–73.6) (31.5–42.0) (32.8–47.5) (7.6–10.3) Murina cyclotis FM 1 135.5 49.5 89.2 1.4 Harpiocephalus harpia FM 1 111.5 32.5 57.0 1.0 Megaderma lyra FM 2 113.1, 119.2 33.8, 33.6 46.8, 44.8 1.0, 0.6 Megaderma spasma FM 3 106.6 5.3 30.2 8.3 69.2 9.4 1.0 0.1 (100.4–110.1) (20.6–35.8) (58.4 75.0) (0.9–1.1) Hipposideros galeritus* CF/FM 6 126.5 2.1 107.2 9.4 126.7 2.1 6.5 1.4 (123.2–128.3) (94.8–119.9) (123.2–128.5) (4.9–9.0) Rhinolophus rouxii FM/CF/FM 6 79.8 0.34 61.5 2.6 80.0 0.1 41.4 10.2 (79.4–80.2) (58.2–64.4) (79.8–80.1) (27.4–53.2) Rhinolophus lepidus FM/CF/FM 5 94.9 1.3 74.9 4.0 95.2 1.4 32.2 9.4 (93.1–97.0) (63.3–78.0) (93.2–96.8) (16.8–42.4) Rhinolophus beddomei FM/CF/FM 2 38.2, 38.3 31.4, 31.0 38.5, 38.7 58.0, 48.2 †Recorded in ambient noise. *Bats captured from the roost and recorded. Others captured in mist nets and recorded.
Echolocation call recording and analysis
Immediately after the bats were caught, they were re-leased in a flight tent (4 m length 4 m breadth 6 m height) made of acoustically transparent nylon mesh. The echolocation calls of the bats flying inside the flight tent were recorded using a D980 Ultrasound Detector (Pettersson Elektronik AB, Uppsala, Sweden: custom-made microphone with frequency range 1–200 kHz) using the high frequency (HF) output. The HF output of the D980 bat detector represents the direct output of the microphone preamplifier before any processing by the bat detector. It is the direct analogue output from the micro-phone and provides the most complete acoustic informa-tion. The gain was adjusted such that there was no clipping for most of the recordings. The HF output of the ultrasound detector was digitized and acquired on a laptop computer (IBM ThinkPad, Pentium IV 1.50 GHz proces-sor, 256 MB RAM) using an A/D Converter DAS 16/330 (Measurement Computing, USA) at a sampling rate of 330 kHz. Data were stored as .dat files using Labview v.6 (National Instruments, Bangalore, India). Clipped re-cordings were identified and not used for analysis. The stored .dat files were converted into .wav files using Matlab v.6. The .wav files were high-pass filtered at 10 kHz (filter type: Butterworth, filter order: 8) using BatSound Pro v.2 (Pettersson Elektronik AB, Uppsala, Sweden). Five echolocation calls were selected at random from each bat and analysis was carried out for 13 species (Table 2). We have not presented here the echolocation calls of the other three species, Myotis horsefieldii,
Hesperotenus tickelli and Tyloncycteris pachypus. The intensity of echolocation calls of Myotis horsefieldii and Tyloncycteris pachypus was very low and therefore it was difficult to get clear recordings. Due to technical pro-blems with the bat detector in the field, we failed to record the calls of Hesperotenus tickelli. From the oscillograms, we measured call duration (DUR), i.e. time from onset to offset of the call. The peak frequency, FMAXE (frequency with maximum energy) of the dominant harmonic was measured using power spec-tra. The highest (FMAX) and lowest frequencies (FMIN) of calls were obtained from spectrograms. In BatSound Pro, for both spectrogram and power spectra, we gener-ated fast Fourier transforms of 512 samples in a Hanning window that was set at a low threshold of 3–6 to get a fine resolution. The oscillograms were analysed simulta-neously with spectrograms in a combined window display of oscillogram (above) and spectrogram (below) in BatSound. The values of each feature were averaged for five calls for each bat and the results presented as mean of means of all bats for each species. The general descrip-tions of various types of echolocation calls of insectivo-rous bats are given in Figure 2. Standard discriminant function analysis (DFA) of the acoustic signals was carried out to test for the discrimin-ability of the calls of the different species using classifi-cation functions33,34. DFA analyses were carried out using Statistica 7 (Statsoft Inc., USA) with four call features: DUR, FMAX, FMIN and FMAXE. The efficacy of the classification functions was tested using assignments of individuals to species categories based on their call
RESEARCH ARTICLES
CURRENT SCIENCE, VOL. 107, NO. 4, 25 AUGUST 2014 635
features and depicted as a classification matrix. Based on this, the proportion of individuals correctly assigned was calculated.
Roost survey and ambient noise recordings
In addition to mist netting bats, roost surveys and ambi-ent noise recordings were conducted. To locate the roosts, possible roosting places such as caves, rock crevices, hol-low tree trunks, palm fronds, fig trees (in case of flying foxes), tree holes, cracks in walls and the underside of bridges were examined in and around KNP. After the dis-covery of roosts of bats, they were trapped, identified and the echolocation calls were recorded in flight tents as described above. We recorded the ambient noise (acoustical sampling) inside KNP for 12 nights using the recording set-up described above, at the following sites: Mulluru (low ele-vation), Abascut and Ekunje (mid elevation) and MPCA (high elevation) respectively (Figure 1). Within each location we randomly selected three sites and at each site we made a total of 24 recordings (each recording being 20 sec long) between 1800 and 2300 h. For 12 sites a to-tal time of 96 min of ambient noise recording was carried out. Ambient noise recordings were basically intended to identify additional species that may have been missed in the mist-netting and roost surveys, particularly for species that were hard to trap.
Results and discussion
Bat species richness of KNP
In 540 mist net hours, 106 bats of 17 species were caught, of which 14 species belonged to the Microchiroptera and 3 species to the Megachiroptera (Tables 1 and 3). Of the
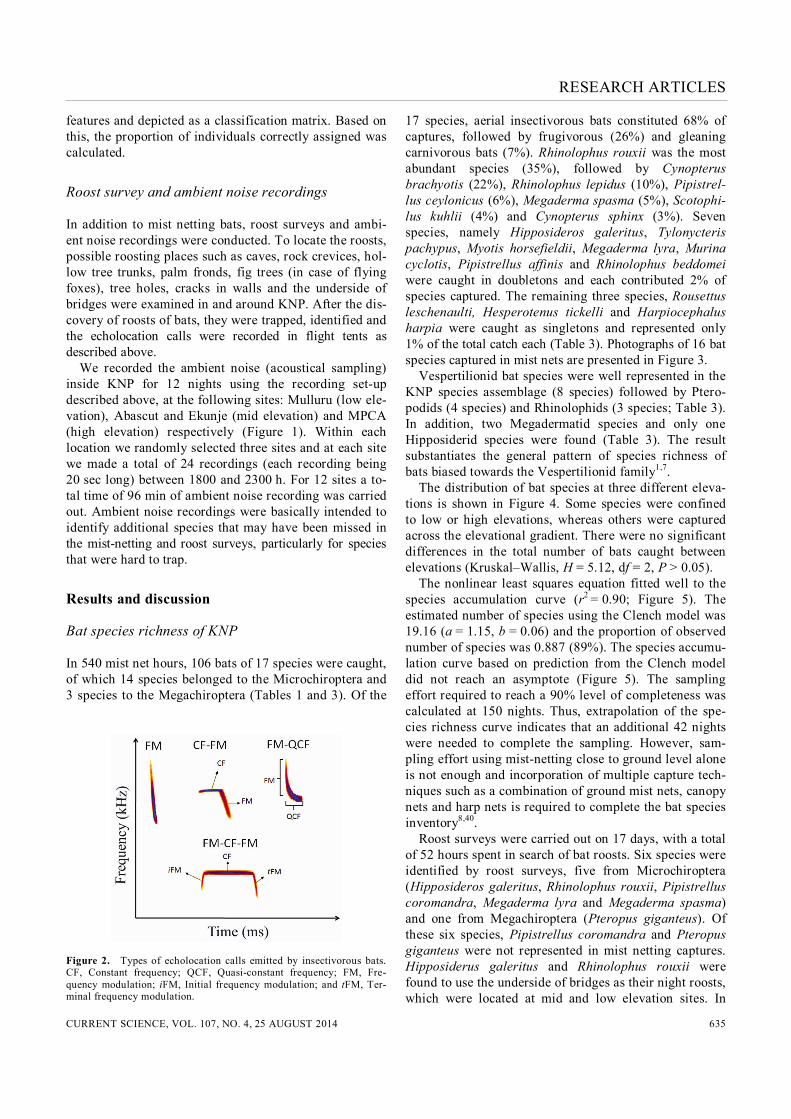
Figure 2. Types of echolocation calls emitted by insectivorous bats. CF, Constant frequency; QCF, Quasi-constant frequency; FM, Fre-quency modulation; iFM, Initial frequency modulation; and tFM, Ter-minal frequency modulation.
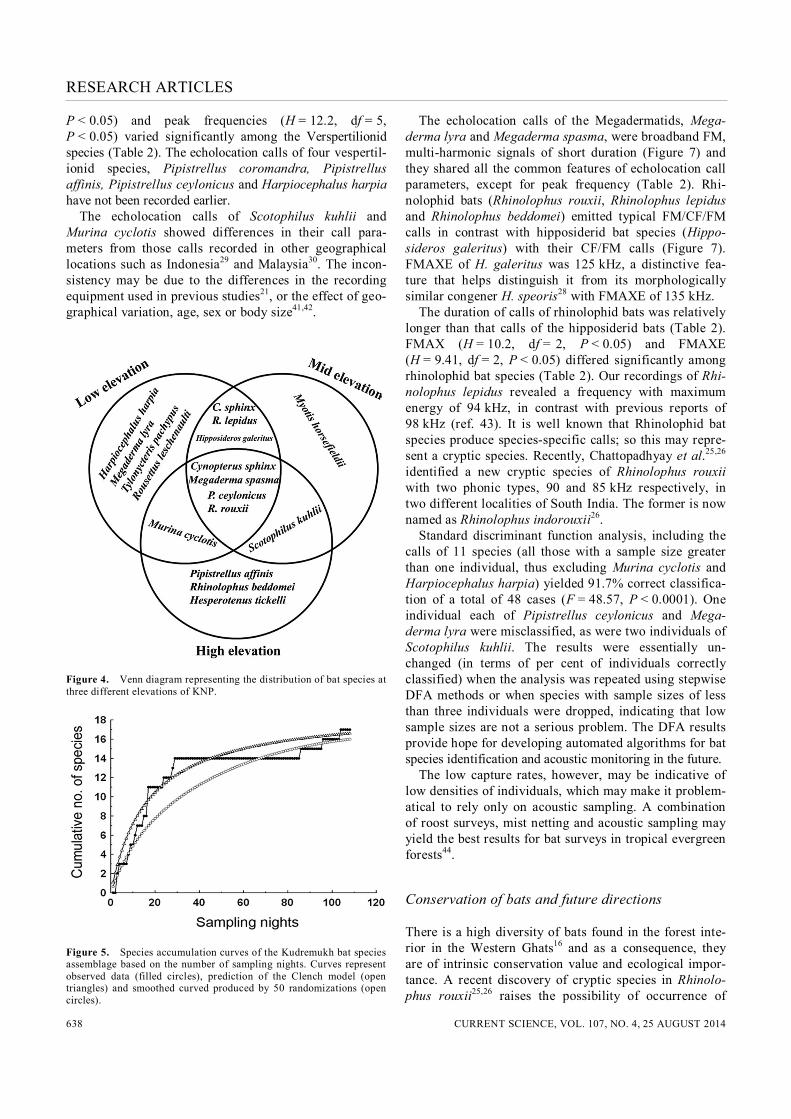
17 species, aerial insectivorous bats constituted 68% of captures, followed by frugivorous (26%) and gleaning carnivorous bats (7%). Rhinolophus rouxii was the most abundant species (35%), followed by Cynopterus brachyotis (22%), Rhinolophus lepidus (10%), Pipistrel-lus ceylonicus (6%), Megaderma spasma (5%), Scotophi-lus kuhlii (4%) and Cynopterus sphinx (3%). Seven species, namely Hipposideros galeritus, Tylonycteris pachypus, Myotis horsefieldii, Megaderma lyra, Murina cyclotis, Pipistrellus affinis and Rhinolophus beddomei were caught in doubletons and each contributed 2% of species captured. The remaining three species, Rousettus leschenaulti, Hesperotenus tickelli and Harpiocephalus harpia were caught as singletons and represented only 1% of the total catch each (Table 3). Photographs of 16 bat species captured in mist nets are presented in Figure 3. Vespertilionid bat species were well represented in the KNP species assemblage (8 species) followed by Ptero-podids (4 species) and Rhinolophids (3 species; Table 3). In addition, two Megadermatid species and only one Hipposiderid species were found (Table 3). The result substantiates the general pattern of species richness of bats biased towards the Vespertilionid family1,7. The distribution of bat species at three different eleva-tions is shown in Figure 4. Some species were confined to low or high elevations, whereas others were captured across the elevational gradient. There were no significant differences in the total number of bats caught between elevations (Kruskal–Wallis, H = 5.12, df = 2, P > 0.05). The nonlinear least squares equation fitted well to the species accumulation curve (r2 = 0.90; Figure 5). The estimated number of species using the Clench model was 19.16 (a = 1.15, b = 0.06) and the proportion of observed number of species was 0.887 (89%). The species accumu-lation curve based on prediction from the Clench model did not reach an asymptote (Figure 5). The sampling effort required to reach a 90% level of completeness was calculated at 150 nights. Thus, extrapolation of the spe-cies richness curve indicates that an additional 42 nights were needed to complete the sampling. However, sam-pling effort using mist-netting close to ground level alone is not enough and incorporation of multiple capture tech-niques such as a combination of ground mist nets, canopy nets and harp nets is required to complete the bat species inventory8,40. Roost surveys were carried out on 17 days, with a total of 52 hours spent in search of bat roosts. Six species were identified by roost surveys, five from Microchiroptera (Hipposideros galeritus, Rhinolophus rouxii, Pipistrellus coromandra, Megaderma lyra and Megaderma spasma) and one from Megachiroptera (Pteropus giganteus). Of these six species, Pipistrellus coromandra and Pteropus giganteus were not represented in mist netting captures. Hipposiderus galeritus and Rhinolophus rouxii were found to use the underside of bridges as their night roosts, which were located at mid and low elevation sites. In

RESEARCH ARTICLES
CURRENT SCIENCE, VOL. 107, NO. 4, 25 AUGUST 2014 636
Table 3. Bat species identified based on mist netting, ambient noise recording (acoustic sampling) and roost surveys
Total no. Taxon Common name of bats captured IUCN status Sampling method
Sub-order: Megachiroptera Family: Pteropodidae Pteropus giganteus Flying fox – LC Roost survey Cynopterus sphinx Greater short nosed-fruit bat 3 LC Mist netting Cynopterus brachyotis Lesser short nosed-fruit bat 23 LC Mist netting Rousettus leschenaulti Fulvous fruit bat 1 LC Mist netting Sub-order: Microchiroptera Family: Megadermatidae Megaderma spasma Lesser false vampire bat 5 LC Mist netting Megaderma lyra Greater false vampire bat 2 LC Mist netting Family: Vespertilionidae Myotis horsefieldii Horsefield’s bat 2 LC Mist netting Pipistrellus ceylonicus Kelaart’s pipistrelle 6 LC Mist netting Pipistrellus affinis Chocolate pipistrelle 2 NT Mist netting Pipistrellus tenuis Pygmy bat – LC Acoustic sampling Pipistrellus coromandra Coromandel pipistrelle – LC Roost survey Tylonycteris pachypus Bamboo bat or flat-headed bat 2 NT Mist netting Murina cyclotis Round tube-nosed bat 2 LC Mist netting Hesperotenus tickelli Tickell’s bat 1 LC Mist netting Harpiocephalus harpia Hairy-winged bat 1 NT Mist netting Scotophilus kuhlii Asiatic yellow house bat 4 LC Mist netting Family: Hipposideridae Hipposideros galeritus Cantor’s leaf-nosed bat 2 NT Mist netting Family: Rhinolophidae Rhinolophus beddomei Lesser woolly horseshoe bat 2 NT Mist netting Rhinolophus rouxii Rufous horseshoe bat 37 NT Mist netting Rhinolophus lepidus Blyth’s horseshoe bat 11 LC Mist netting
LC, Least concern; NT, Near threatened45.
Mulluru (low elevation site), we found a colony of eight Megaderma spasma, roosting underneath the roof inside a house, which they used as night and day roost. Pipistrel-lus coromandra used crevices in the walls of mud houses at Mulluru as their roosting sites, where 2–8 bats were found to roost together in one crevice. We located a col-ony of Pteropus giganteus with 55–75 bats roosting in a Ficus tree at Mala village, adjacent to KNP. From a total of 288 ambient noise file recordings, only 38 recorded files had echolocation calls. Among these only one file contained the calls of Rhinolophus rouxii, whereas the rest of the recordings consisted of calls of a common species, Pipistrellus tenuis (= P mimus)28. Its frequency range was 20–60 kHz with the typical quasi-constant frequency call associated with an FM sweep (Figures 2 and 6)28. The calls of Pipistrellus tenuis were similar for all the three elevations. Of the two species identified by acoustic sampling, Rhinolophus rouxii was represented in roost surveys and mist net sampling. A total of 20 bat species were recognized by the various sam-pling methods, which include 17 by mist netting, 2 by roost surveys and 1 from ambient noise recordings (Tables 2 and 3). Species richness in bats is generally higher at single localities in the Neotropics than the Palaeotropics5,9. The highest count comes from an Amazonian bat assemblage, Tiputini Biodiversity Station, with 90 species6. This is in
contrast with the Palaeotropics: 52 species were recorded in Ulu Gombak9 and 45 species were identified in Krau Wildlife Reserve in Malaysia8. Our palaeotropical local-ity in South India showed even lower species richness with 20 species. However, this count is likely to be an underestimate due to the limited number of trapping techniques used. Insectivorous bats constituted 75% of the bat species in the tropical rain forests of KNP, which is not surprising since species richness of fruit bats is generally low in the palaeotropics10,11. These results were in close agreement with studies of bats in Ulu Gombak, Malaysia, where insectivorous bats accounted for 81% of the bat fauna9. However, this contrasts with the Neotropics, where frugivorous and nectarivorous bats (Phyllostomi-dae) dominate the rain forest biome6,7.
Echolocation calls of bats of KNP
The echolocation calls of the seven Vespertilionid bat species were characterized by broadband, frequency-modulated (FM) signals of short duration (Figure 6; Table 2). However, Pipistrellus tenuis had long calls because of the presence of a quasi-constant frequency (Figures 2 and 6; Table 2). This characteristic feature of quasi-constant frequency in Pipistrellus tenuis calls helped distinguish it from its morphologically similar

RESEARCH ARTICLES
CURRENT SCIENCE, VOL. 107, NO. 4, 25 AUGUST 2014 637
Figure 3. Chiropteran species diversity of KNP based on mist netting. a, Cynopterus sphinx; b, Cynopterus brachyotis; c, Megaderma lyra; d, Megaderma spasma; e, Murina cyclotis; f, Harpiocephalus harpia; g, Hesperotenus tickelii; h, Myotis horse-fieldii; i, Scotophilus kuhlii; j, Pipistrellus affinis; k, Pipistrellus ceylonicus; l, Tylonycteris pachypus; m, Hipposideros galeritus; n, Rhinolophus rouxii; o, Rhinolophus lepidus; p, Rhinolophus beddomei. Families: a, b, Pteropodidae; c, d, Megadermatidae; e–l, Ves-pertilionidae; m, Hipposideridae and n–p, Rhinolopidae. The species Rousettus leschenaulti was not presented here. c, was taken by Ashok Mallick (CES, IISc) and others by one of the authors (M.J.).
congener, Pipistrellus coromandra that has only pure FM calls28. These species were originally discriminated by cranial characters, baculum lengths and body sizes, where Pipistrellus coromandra is larger than Pipistrellus tenuis11. The calls of Scotophilus kuhlii, Pipistrellus cey-lonicus and Pipistrellus coromandra had two harmonics,
whereas calls of Murina cyclotis, Harpiocephalus harpia and Pipistrellus affinis did not show a distinct harmonic structure (Figure 6). In all seven species, the first har-monic contained the most energy (FMaxE). All the major echolocation call parameters, the start (Kruskal–Wallis, H = 15.6, df = 5, P < 0.05), end (H = 10.0, df = 5,
RESEARCH ARTICLES
CURRENT SCIENCE, VOL. 107, NO. 4, 25 AUGUST 2014 638
P < 0.05) and peak frequencies (H = 12.2, df = 5, P < 0.05) varied significantly among the Verspertilionid species (Table 2). The echolocation calls of four vespertil-ionid species, Pipistrellus coromandra, Pipistrellus affinis, Pipistrellus ceylonicus and Harpiocephalus harpia have not been recorded earlier. The echolocation calls of Scotophilus kuhlii and Murina cyclotis showed differences in their call para-meters from those calls recorded in other geographical locations such as Indonesia29 and Malaysia30. The incon-sistency may be due to the differences in the recording equipment used in previous studies21, or the effect of geo-graphical variation, age, sex or body size41,42.
Figure 4. Venn diagram representing the distribution of bat species at three different elevations of KNP.
Figure 5. Species accumulation curves of the Kudremukh bat species assemblage based on the number of sampling nights. Curves represent observed data (filled circles), prediction of the Clench model (open triangles) and smoothed curved produced by 50 randomizations (open circles).
The echolocation calls of the Megadermatids, Mega-derma lyra and Megaderma spasma, were broadband FM, multi-harmonic signals of short duration (Figure 7) and they shared all the common features of echolocation call parameters, except for peak frequency (Table 2). Rhi-nolophid bats (Rhinolophus rouxii, Rhinolophus lepidus and Rhinolophus beddomei) emitted typical FM/CF/FM calls in contrast with hipposiderid bat species (Hippo-sideros galeritus) with their CF/FM calls (Figure 7). FMAXE of H. galeritus was 125 kHz, a distinctive fea-ture that helps distinguish it from its morphologically similar congener H. speoris28 with FMAXE of 135 kHz. The duration of calls of rhinolophid bats was relatively longer than that calls of the hipposiderid bats (Table 2). FMAX (H = 10.2, df = 2, P < 0.05) and FMAXE (H = 9.41, df = 2, P < 0.05) differed significantly among rhinolophid bat species (Table 2). Our recordings of Rhi-nolophus lepidus revealed a frequency with maximum energy of 94 kHz, in contrast with previous reports of 98 kHz (ref. 43). It is well known that Rhinolophid bat species produce species-specific calls; so this may repre-sent a cryptic species. Recently, Chattopadhyay et al.25,26 identified a new cryptic species of Rhinolophus rouxii with two phonic types, 90 and 85 kHz respectively, in two different localities of South India. The former is now named as Rhinolophus indorouxii26. Standard discriminant function analysis, including the calls of 11 species (all those with a sample size greater than one individual, thus excluding Murina cyclotis and Harpiocephalus harpia) yielded 91.7% correct classifica-tion of a total of 48 cases (F = 48.57, P < 0.0001). One individual each of Pipistrellus ceylonicus and Mega-derma lyra were misclassified, as were two individuals of Scotophilus kuhlii. The results were essentially un-changed (in terms of per cent of individuals correctly classified) when the analysis was repeated using stepwise DFA methods or when species with sample sizes of less than three individuals were dropped, indicating that low sample sizes are not a serious problem. The DFA results provide hope for developing automated algorithms for bat species identification and acoustic monitoring in the future. The low capture rates, however, may be indicative of low densities of individuals, which may make it problem-atical to rely only on acoustic sampling. A combination of roost surveys, mist netting and acoustic sampling may yield the best results for bat surveys in tropical evergreen forests44.
Conservation of bats and future directions
There is a high diversity of bats found in the forest inte-rior in the Western Ghats16 and as a consequence, they are of intrinsic conservation value and ecological impor-tance. A recent discovery of cryptic species in Rhinolo-phus rouxii25,26 raises the possibility of occurrence of

RESEARCH ARTICLES
CURRENT SCIENCE, VOL. 107, NO. 4, 25 AUGUST 2014 639
Figure 6. Spectrograms of echolocation calls of FM bats recorded in KNP. A representative echolocation call from each species is shown.
Figure 7. Spectrograms of echolocation calls of three FM-CF-FM bats (Rhinolophidae) and one CF-FM bat (Hipposideridae). A representative echolocation call from each species is shown.
several phonic types in other Rhinolophid species and possibly in other bat families. Further studies on the echolocation calls of the bats of KNP may reveal more cryptic species and a higher diversity than previously suspected. Our study provides information on the occur-rence of six species that are under the status ‘Near Threatened’45 and constitute 30% of KNP bat fauna
(Table 3). However, these species are highly susceptible to habitat disruption. The species most likely to be at risk from habitat disturbances in the KNP may be Tylo-nycteris pachypus, since it requires bamboo thickets for shelter11 and all over the Western Ghats there is intense harvesting of bamboo for commercial use16. The roosts of Megaderma spasma and Megaderma lyra in KNP were

RESEARCH ARTICLES
CURRENT SCIENCE, VOL. 107, NO. 4, 25 AUGUST 2014 640
Appendix 1. Morphological parameters of bats used in species identification (based on Bates and Harrison11)
Species Identifying characters
Cynopterus sphinx Medium-sized fruit bat. Presence of ear margins. Cynopterus brachyotis Smaller than Cynopterus sphinx. Absence of ear margins. Rousettus leschenaulti Larger than Cynopterus sphinx, relatively shorter and slender muzzle. Fulvous brown on the crown, head, back and throat regions. Pteropus giganteus Extremely larger among all fruit bats, roosting gregariously in fig trees. Presence of blackish-brown pelage on the back with white hairs. Megaderma lyra Comparatively large ears, presence of noseleaf characterized by large straight longitudinal ridges and simple horizontal base. Megaderma spasma Smaller than Megaderma lyra. Noseleaf is convex sided with short longitudinal ridges and a distinct heart-shaped base. Myotis horsefieldii Large ears and feet compared to pipistrelle bats. Dorsal pelage is black and wings attached to outer metarsal of each foot. Pipistrellus ceylonicus Large forearm (average 38 mm), pelage on ventral side conspicuously paler than on dorsal side. Interfemoral membrane is slightly haired. Pipistrellus affinis Large pipistrelle (forearm >40 mm). Pelage is soft, relatively long, dark brown. Ears and face are uniform blackish/brown. Pipistrellus tenuis Smaller in size, forearm length (average 28 mm), interfemoral membrane is not haired. Pipistrellus coromandra Slightly larger than Pipistrellus tenuis, forearm length exceeds Pipistrellus tenuis averaging 30 mm. Interfemoral membrane is haired. Tylonycteris pachypus Forearm length averaging 27.8 mm, smaller than Pipistrellus tenuis. Presence of circular pads in the soles of the feet and base of thumbs. Pelage is shades of golden brown and little paler mid dorsally. Murina cyclotis Forearm length averaging 32 mm. Nose exactly resembles a tube and ears are rounded. Dorsal pelage is orange with pale grey hairs and ventral pelage is mid-grey. Hesperotenus tickelli Large Vespertilionid bat (forearm length >50 mm). Muzzle is broad, blunt swollen on the sides and essentially naked anteriorly. Ears are thick without ridges and tragus is about half the length of pinna. Dorsal pelage with distinct yellowish tinge. Harpiocephalus harpia Ears are evenly rounded on their anterior and posterior borders. Tragus slightly convex anteriorly and concave on the posterior border. The muzzle is hairy, except for the nostrils. Teeth resembles those of fruit bats. Scotophilus kuhlii Forearm length averages 49 mm and distinguished from congeneric species Scotophilus heathi by its smaller size. Ventral pelage buffy brown.
mostly associated with man-made structures such as houses or temples. The presence of bats in their houses is favoured by people living in these rural human settle-ments and they thus help conserve bats in these regions. Additional studies are needed to better understand the roosting, social organization and foraging habits of bat species inside KNP and to further describe the natural history of Indian bats.
1. Simmons, N. B., Order Chiroptera. In Mammal Species of the World: A Taxonomic and Geographic Reference (eds Wilson, D. E. and Reeder, D. M.), John Hopkins University Press, Maryland, 2005, pp. 312–529.
2. Clarke, F. M., Pio, D. V. and Racey, P. A., A comparison of log-ging systems and bat diversity in the Neotropics. Conserv. Biol., 2005, 19, 1194–1204.
3. Clarke, F. M., Rostant, L. V. and Racey, P. A., Life after logging: post-logging recovery of a neotropical bat community. J. Appl. Ecol., 2005, 42, 409–420.
4. Jones, G., Jacobs, D. S., Kunz, T. H., Willig, M. R. and Racey, P. A., Carpe noctem: the importance of bats as bioindicators. Endang. Species Res., 2009, 8, 93–115.
5. Findley, J. S., Bats: A Community Perspective, Cambridge Uni-versity Press, Cambridge, 1993.
6. Clarke, F. M. and Downie, J. R., A bat (Chiroptera) survey of Mora rainforest in Trinidad’s Victoria–Mayaro forest reserve. Bio-divers. Conserv., 2001, 10, 725–736.
7. Rex, K., Kelm, D. H., Wiesner, K., Kunz, T. H. and Voigt, C. C., Species richness and structure of three Neotropical bat assem-blages. Biol. J. Linn. Soc., 2008, 94, 617–629.
8. Kingston, T., Francis, C. M., Akbar, Z. and Kunz, T. H., Species richness in an insectivorous bat assemblage from Malaysia. J. Trop. Ecol., 2003, 19, 67–79.
9. Heller, K. G. and Volleth, M., Community structure and evolution of insectivorous bats in the Paleotropics and Neotropics. J. Trop. Ecol., 1995, 11, 429–442.
10. Talmale, S. and Pradhan, M. S., A checklist of valid Indian bat species (Chiroptera: Mammalia). Online version, Zoological Survey of India, Kolkata, 2009; www.zsi.gov.in/checklist/Indian_ Chiroptera.pdf
11. Bates, P. J. J. and Harrison, D. L., Bats of the Indian Subcontinent, Harrison Zoological Museum Publication, Sevenoaks, United Kingdom, 1997.
12. Myers, N., Mittermeier, R. A., Mittermeier, C. G., Fonseca, G. A. B. and Kent, J., Biodiversity hotspots for conservation priorities. Nature, 2000, 403, 853–858.
13. Das, A., Krishnaswamy, J., Bawa, K. S., Kiran, M. C., Srinivas, V., Samba Kumar, N. and Karanth, U., Prioritisation of conservation areas in the Western Ghats, India. Biol. Conserv., 2006, 133, 16–31.
14. Aravind, N. A., Tambat, B., Ravikanth, G., Ganeshaiah, K. N. and Shaanker, R. U., Patterns of species diversity discovery in the Western Ghats, a megadiversity hot spot in India. J. Biosci., 2007, 32, 781–790.
15. Radhakrishnan, C., Fauna of Kudremukh National Park, Conser-vation Area Series 32, Zoological Survey of India, New Delhi, 2007.
16. Korad, V., Yardi, K. and Raut, R., Diversity and distribution of bats in the Western Ghats of India. Zoos’ Print J., 2007, 22, 2752–2758.
17. Palot, M. J. and Radhakrishnan, C., Mammalia. In Fauna of Kudremukh National Park (ed. Radhakrishnan, C.), Conservation Series 32, Zoological Survey of India, New Delhi, 2007, pp. 193–205.
18. Schnitzler, H.-U. and Kalko, E. K. V., Echolocation by insect-eating bats. Bioscience, 2001, 51, 557–569.
19. Fenton, M. B., Portfors, C. V., Rautenbach, I. L. and Waterman, J. M., Compromises: sound frequencies used in echolocation by aerial feeding bats. Can. J. Zool., 1998, 76, 1174–1182.

RESEARCH ARTICLES
CURRENT SCIENCE, VOL. 107, NO. 4, 25 AUGUST 2014 641
20. Fenton, M. B. and Bell, G. P., Recognition of species of insectivo-rous bats by their echolocation calls. J. Mammal., 1981, 62, 233–243.
21. Rydell, J., Arita, H. T., Santos, M. and Granados, J., Acoustic identification of insectivorous bats (order Chiroptera) of Yucatan, Mexico. J. Zool., 2002, 257, 27–36.
22. Fenton, M. B., Science and the conservation of bats. J. Mammal., 1997, 78, 1–14.
23. MacSwiney, M. C., Clarke, F. M. and Racey, P. A., What you see is not what you get: the role of ultrasonic detectors in maximising inventory completeness and maximising inventory completeness in neotropical bat assemblage studies. J. Appl. Ecol., 2008, 45, 1364–1371.
24. Jones, G. and van Parijs, S. M., Bimodal echolocation in pipis-trelle bats: are cryptic species present? Proc. R. Soc. London, Ser. B., 1993, 251,119–125.
25. Chattopadhyay, B., Schuller, G., Garg, K. M. and Sripathi, K., A new phonic type of the rufous horseshoe bat Rhinolophus rouxii from southern India. Curr. Sci., 2010, 99, 114–118.
26. Chattopadhyay, B., Garg, K. M., Vinoth Kumar, A. K., Doss, D. P. S., Ramakrishnan, U. and Kandula, S., Sibling species in South Indian populations of the rufous horse-shoe bat Rhinolophus rouxii. Conserv. Genet., 2012, 13, 1435–1445.
27. Schuller, G., Hearing characteristics and Doppler shift compensa-tion in South Indian CF-FM bats. J. Comp. Physiol. A, 1980, 139, 349–356.
28. Neuweiler, G., Singh, S. and Sripathi, K., Audiograms of a South Indian bat community. J. Comp. Physiol. A, 1984, 154, 133–142.
29. McKenzie, N. L., Gunnell, A. C., Yani, M. and Williams, M. R., Correspondence between flight morphology and foraging ecology in some Paleotropical bats. Aust. J. Zool., 1995, 43, 241–257.
30. Kingston, T., Jones, G., Akbar, Z. and Kunz, T. H., Echolocation signal design in Kerivoulinae and Murininae (Chiroptera: Vesper-tilionidae) from Malaysia. J. Zool., 1999, 249, 359–374.
31. Zhang, L., Liang, B., Parsons, S., Wei, L. and Zhang, S., Mor-phology, echolocation and foraging behaviour in two sympatric sibling species of bat (Tylonycteris pachypus and T. robustula) (Chiroptera: Vespertilinidae). J. Zool., 2007, 271, 344–351.
32. Sripathi, K., Raghuram, H. and Nathan, P. T., Echolocation sounds of the painted bat Kerivoula picta (Vespertilionidae). Curr. Sci., 2006, 91, 1145–1147.
33. Parsons, S. and Jones, G., Acoustic identification of twelve spe-cies of echolocating bat by discriminant function analysis and arti-ficial neural networks. J. Exp. Biol., 2000, 203, 2641–2656.
34. Russo, D. and Jones, G., Identification of twenty-two bat species (Mammalia: Chiroptera) from Italy by analysis of time-expanded recordings of echolocation calls. J. Zool., 2002, 258, 91–103
35. Pascal, J. P., Wet Evergreen Forests of the Western Ghats of India: Ecology, Structure, Floristic Composition and Succession, Institut Francaise de Pondicherry, Puducherry, 1988.
36. Colwell, R. K. and Coddington, J. A., Estimating terrestrial biodi-versity through extrapolation. Philos. Trans. R. Soc. London, Ser. B., 1994, 345, 101–118.
37. Colwell, R. K., EstimateS: statistical estimation of species rich-ness and shared species from samples, version 8, 2006; http://viceroy.eeb.uconn.edu/estimates
38. Soberón, M. and Llorente, B., The use of species accumulation functions for the predictions of species richness. Conserv. Biol., 1993, 7, 480–488.
39. Moreno, C. E. and Halffter, G., Assessing the completeness of bat biodiversity inventories using species accumulation curves. J. Appl. Ecol., 2000, 37, 149–158.
40. Larsen, R. J., Boegler, K. A., Genoways, H. H., Masefield, W. P., Kirsch, R. A. and Pedersen, S. C., Mist netting bias, species accumulation curves, and the rediscovery of two bats on Montser-rat (Lesser Antilles). Acta Chiropterol., 2007, 9, 423–435.
41. Jones, G., Gordon, T. and Nightingale, J., Sex and age differences in the echolocation calls of lesser horseshoe bat, Rhinolophus hipposideros. Mammalia, 1992, 56, 189–193.
42. O’Farrell, M., Corben, C. and Gannon, W. L., Geographic varia-tion in the echolocation calls of the hoary bat (Lasiurus cinereus). Acta Chiropterol., 2000, 2, 185–196.
43. Francis, C. M. and Habersetzer, J., Interspecific and intraspecific variation in echolocation call frequency and morphology of horse-shoe bats, Rhinolophus and Hipposideros. In Bat Biology and Conservation (eds Kunz, T. H. and Racey, P. A.), Smithsonian Institution Press, New York, 1998, pp. 169–179.
44. O’Farrell, M. and Gannon, W. L., A comparison of acoustic versus capture techniques for the inventory of bats. J. Mammal., 1999, 80, 24–30.
45. Molur, S. et al. (eds), In Status of South Asian Chiroptera: Con-servation Assessment and Management Plan (C.A.M.P.) Work-shop Report. Zoo Outreach Organization, CBSG South Asia and WILD, Coimbatore, 2002.
ACKNOWLEDGEMENTS. We thank the two anonymous referees for their valuable suggestions on an earlier version of this manuscript. This study complied with current laws and funded by the Ministry of Environment and Forests, New Delhi. We also thank the Karnataka State Forest Department for permission to carry out our studies in Kudremukh National Park and Rittik Deb for help with data analysis, and Sudhakar Gowda and Sekhar for field assistance. H.R. thanks the Council for Scientific and Industrial Research, New Delhi for a Re-search Associate fellowship. Received 13 October 2013; revised accepted 27 June 2014