Spatio-temporal analysis of rainfall trends over a maritime state (Kerala) of India during the last...
10
Spatio-temporal analysis of rainfall trends over a maritime state (Kerala) of India during the last 100 years Archana Nair a, * , K. Ajith Joseph a , K.S. Nair a, b a Nansen Environmental Research Centre (India), 6A, Oxford Business Centre, Kochi 682016, Kerala, India b Centre for Earth Research and Environment Management, Kochi 682036, Kerala, India highlights The rainfall trend and seasonality index is evaluated for Kerala state of India. The trend is evaluated on a monthly, seasonal and annual timescale. The rainfall trend is decreasing significantly in almost all regions. Skewness in rainfall is found in the state by seasonality index test. article info Article history: Received 11 December 2013 Accepted 25 January 2014 Keywords: Rainfall variability Trend Seasonality index Kerala abstract Kerala, a maritime state of India is bestowed with abundant rainfall which is about three times the national average. This study is conducted to have a better understanding of rainfall variability and trend at regional level for this state during the last 100 years. It is found that the rainfall variation in northern and southern regions of Kerala is large and the deviation is on different timescales. There is a shifting of rainfall mean and variability during the seasons. The trend analysis on rainfall data over the last 100 years reveals that there is a significant (99%) decreasing trend in most of the regions of Kerala especially in the month of January, July and November. The annual and seasonal trends of rainfall in most regions of Kerala are also found to be decreasing significantly. This decreasing trend may be related to global anomalies as a result of anthropogenic green house gas (GHG) emissions due to increased fossil fuel use, land-use change due to urbanisation and deforestation, proliferation in transportation associated at- mospheric pollutants. We have also conducted a study of the seasonality index (SI) and found that only one district in the northern region (Kasaragod) has seasonality index of more than 1 and that the dis- tribution of monthly rainfall in this district is mostly attributed to 1 or 2 months. In rest of the districts, the rainfall is markedly seasonal. The trend in SI reveals that the rainfall distribution in these districts has become asymmetric with changes in rainfall distribution. Ó 2014 Elsevier Ltd. All rights reserved. 1. Introduction The state of Kerala, situated along the west coast of India be- tween the Arabian Sea on the west and the Western Ghats moun- tains on the east occupies 1.18% of Indian landmass. Geographically, Kerala is roughly divided into three climatically distinct regions. These include the eastern highlands (rugged and cool mountainous terrain), the central midlands (rolling hills) and the western low lands (coastal plains). This geographical feature of Kerala makes it more vulnerable to changes in climate. Rainfall in these areas varies both spatially and temporally on monthly and seasonal timescales. Simon and Mohankumar (2004) have shown that the state can be divided into three rainfall regions having a similar covariance structure of annual rainfall. It is also shown that stations north of 10 N receive more rainfall (65% of the annual rainfall during the southwest monsoon) than stations south of 10 N (25e30% of annual rainfall in northeast monsoon). Recently Krishnakumar et al. (2009) studied the rainfall trends over the Kerala region in the twentieth century. They have shown that there is a significant decrease in southwest monsoon rainfall while an increase in the post monsoon rainfall was noticed. The studies on the trend and variability of different regions of a state in India are meagre in the context of regional variabilities in rainfall and Kerala is no excep- tion. To list, Deshmukh and Lunge (2013) recently studied the trends in temperature and rainfall of Buldana district of Vidharbha * Corresponding author. E-mail address: [email protected] (A. Nair). Contents lists available at ScienceDirect Atmospheric Environment journal homepage: www.elsevier.com/locate/atmosenv 1352-2310/$ e see front matter Ó 2014 Elsevier Ltd. All rights reserved. http://dx.doi.org/10.1016/j.atmosenv.2014.01.061 Atmospheric Environment 88 (2014) 123e132
-
Upload
independent -
Category
Documents
-
view
0 -
download
0
Transcript of Spatio-temporal analysis of rainfall trends over a maritime state (Kerala) of India during the last...
lable at ScienceDirect
Atmospheric Environment 88 (2014) 123e132
Contents lists avai
Atmospheric Environment
journal homepage: www.elsevier .com/locate/atmosenv
Spatio-temporal analysis of rainfall trends over a maritime state(Kerala) of India during the last 100 years
Archana Nair a,*, K. Ajith Joseph a, K.S. Nair a,b
aNansen Environmental Research Centre (India), 6A, Oxford Business Centre, Kochi 682016, Kerala, IndiabCentre for Earth Research and Environment Management, Kochi 682036, Kerala, India
h i g h l i g h t s
� The rainfall trend and seasonality index is evaluated for Kerala state of India.� The trend is evaluated on a monthly, seasonal and annual timescale.� The rainfall trend is decreasing significantly in almost all regions.� Skewness in rainfall is found in the state by seasonality index test.
a r t i c l e i n f o
Article history:Received 11 December 2013Accepted 25 January 2014
Keywords:Rainfall variabilityTrendSeasonality indexKerala
* Corresponding author.E-mail address: [email protected] (A. N
1352-2310/$ e see front matter � 2014 Elsevier Ltd.http://dx.doi.org/10.1016/j.atmosenv.2014.01.061
a b s t r a c t
Kerala, a maritime state of India is bestowed with abundant rainfall which is about three times thenational average. This study is conducted to have a better understanding of rainfall variability and trendat regional level for this state during the last 100 years. It is found that the rainfall variation in northernand southern regions of Kerala is large and the deviation is on different timescales. There is a shifting ofrainfall mean and variability during the seasons. The trend analysis on rainfall data over the last 100years reveals that there is a significant (99%) decreasing trend in most of the regions of Kerala especiallyin the month of January, July and November. The annual and seasonal trends of rainfall in most regions ofKerala are also found to be decreasing significantly. This decreasing trend may be related to globalanomalies as a result of anthropogenic green house gas (GHG) emissions due to increased fossil fuel use,land-use change due to urbanisation and deforestation, proliferation in transportation associated at-mospheric pollutants. We have also conducted a study of the seasonality index (SI) and found that onlyone district in the northern region (Kasaragod) has seasonality index of more than 1 and that the dis-tribution of monthly rainfall in this district is mostly attributed to 1 or 2 months. In rest of the districts,the rainfall is markedly seasonal. The trend in SI reveals that the rainfall distribution in these districts hasbecome asymmetric with changes in rainfall distribution.
� 2014 Elsevier Ltd. All rights reserved.
1. Introduction
The state of Kerala, situated along the west coast of India be-tween the Arabian Sea on the west and the Western Ghats moun-tains on the east occupies 1.18% of Indian landmass. Geographically,Kerala is roughly divided into three climatically distinct regions.These include the eastern highlands (rugged and cool mountainousterrain), the central midlands (rolling hills) and the western lowlands (coastal plains). This geographical feature of Kerala makes itmore vulnerable to changes in climate. Rainfall in these areas variesboth spatially and temporally on monthly and seasonal timescales.
air).
All rights reserved.
Simon and Mohankumar (2004) have shown that the state can bedivided into three rainfall regions having a similar covariancestructure of annual rainfall. It is also shown that stations north of10�N receive more rainfall (65% of the annual rainfall during thesouthwest monsoon) than stations south of 10�N (25e30% ofannual rainfall in northeast monsoon). Recently Krishnakumaret al. (2009) studied the rainfall trends over the Kerala region inthe twentieth century. They have shown that there is a significantdecrease in southwest monsoon rainfall while an increase in thepost monsoon rainfall was noticed. The studies on the trend andvariability of different regions of a state in India are meagre in thecontext of regional variabilities in rainfall and Kerala is no excep-tion. To list, Deshmukh and Lunge (2013) recently studied thetrends in temperature and rainfall of Buldana district of Vidharbha

Fig. 1. Map showing different districts of Kerala.
Table 1Seasonality index (SI) classes and the associated different rainfall regime.
Rainfall regime Seasonality index (SI)
Very equable �0.19Equable but with a definite wetter season 0.20e0.39Rather seasonal with a short drier season 0.40e0.59Seasonal 0.60e0.79Markedly seasonal with a long drier season 0.80e0.99Most rain in three months or less 1e1.19Extreme almost all rain in 1 � 2 �1.2
A. Nair et al. / Atmospheric Environment 88 (2014) 123e132124
state using long term data. The trend and variability of rainfall overvarious districts of Maharashtra state was done by Guhathakurtaand Saji (2013) where long data series (1901e2006) has beenused to analyse significant long term changes over the districts. Inthe southern part of India, the rainfall trend and pattern analysishas been carried out by Rathod and Arunchamy (2010) for theKongu Upland of Tamilnadu state in which the spatial distributionand variability through different seasons were performed.
It is important to have detailed information on rainfall charac-teristics at the district level for a better planning of disaster man-agement and water resource management through application ofregional climate models with downscaling. This information willprovide the district administration to deal with extreme hydrolog-ical conditions. However, so far there has been no in-depth study ondistrict rainfall climatology, its variability and the changing patternof rainfall using a long period of data over the state of Kerala.Therefore, in this paper we aim to analyse the rainfall trend andpattern over different regions of Kerala on monthly, seasonal andannual timescale. The paper is arranged in away such that Section 2describes the data and methodology and Section 3 portrays theuseful results. The study has been concluded in Section 4.
2. Data and methodology
2.1. Data
The state of Kerala is divided into 14 (Fig. 1) revenue districts. Onthe basis of geographical, historical and cultural similarities, thedistricts are generally grouped mainly into three regions. TheMalabar, (North Kerala districts of Kasaragod, Kannur, Wayanad,Kozhikode, Palakkad andMalappuram) the Central Kerala districtsof Thrissur, and Eranakulam and Travancore, (South Kerala districts
of Thiruvananthapuram, Kollam, Alappuzha, Pathanamthitta, Kot-tayam, and Idukki). The monthly rainfall data of this state (for 100years from 1901 to 2000) is collected from theMinistry of Earth andScience (MoES), and the India Meteorological Department (IMD).From this data, seasonal and total rainfall for various districts ofKerala is estimated. The collected data has been processed, ana-lysed and interpreted by using GIS maps and diagrams.
2.2. Methodology
2.2.1. Long term variabilityThe long term variability of rainfall for the 14 districts of Kerala
has been studied by evaluating the mean and coefficient of varia-tion on monthly, seasonal and annual timescale. The monthly(seasonal or annual) mean of the districts is the average of rainfallvalues whereas the coefficient of variation is the ratio of standarddeviation to the mean.
2.2.2. Long term trendIn order to estimate the trend in rainfall, the ManneKendall test
is used which is a non-parametric test.
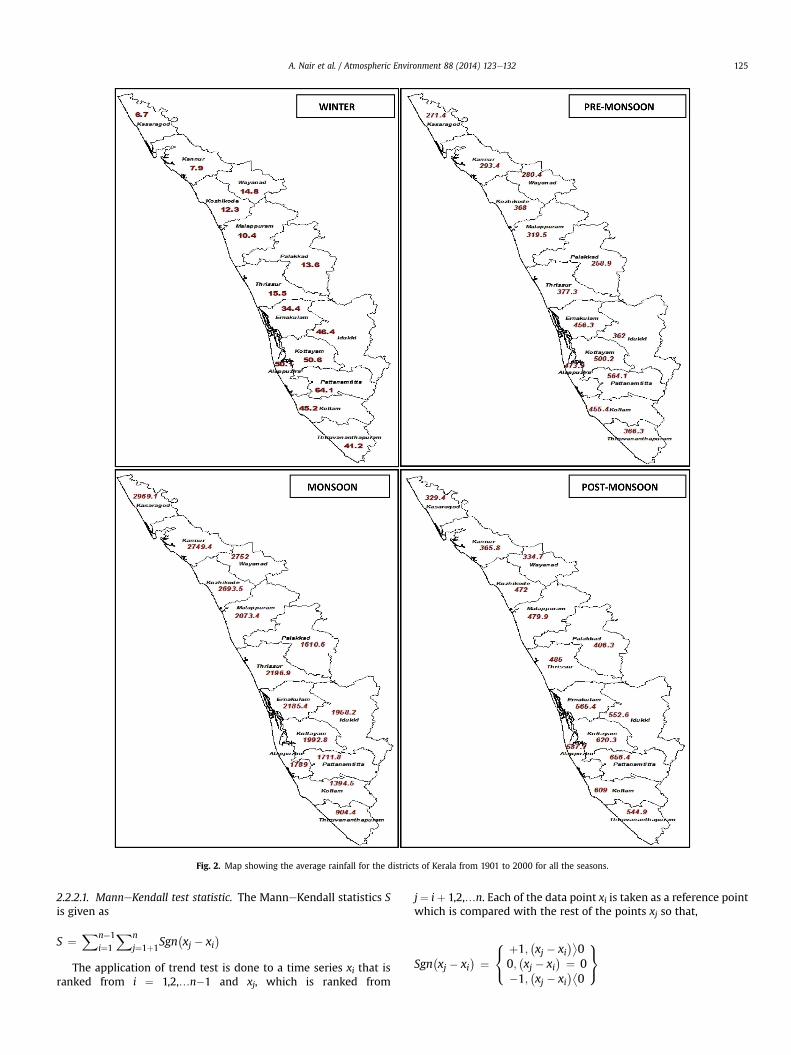
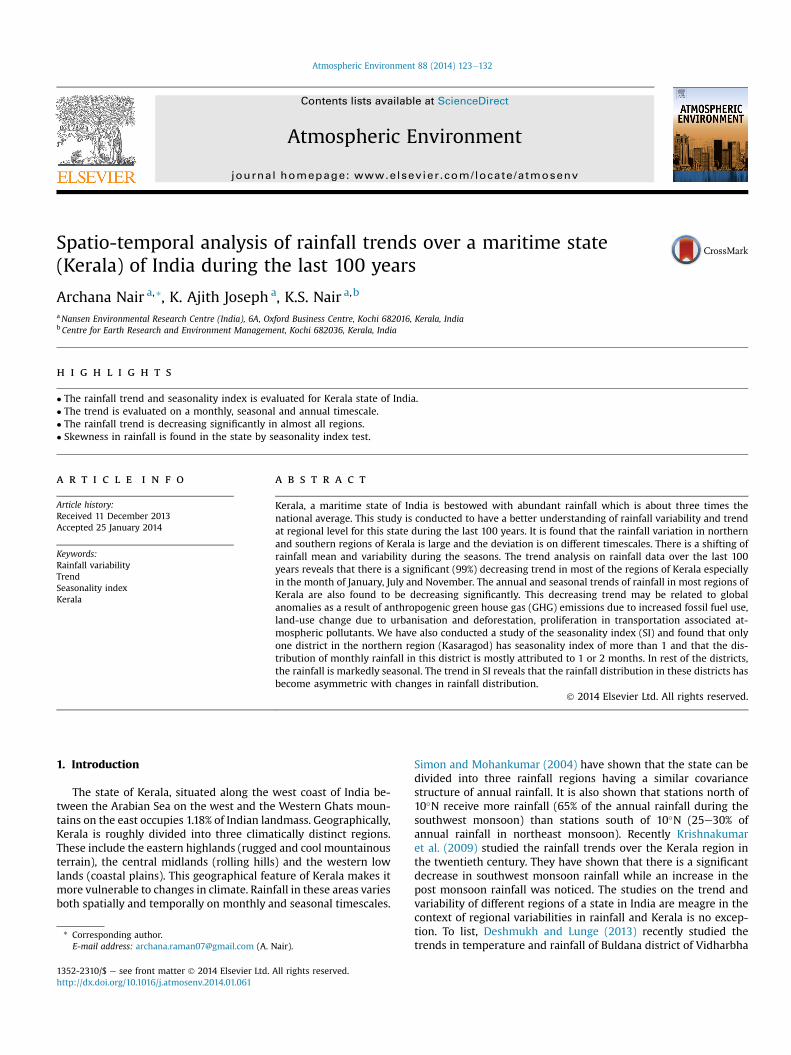
Fig. 2. Map showing the average rainfall for the districts of Kerala from 1901 to 2000 for all the seasons.
A. Nair et al. / Atmospheric Environment 88 (2014) 123e132 125
2.2.2.1. ManneKendall test statistic. The ManneKendall statistics Sis given as
S ¼Xn¼1
i¼1
Xn
j¼1þ1Sgn xj � xi
� �
The application of trend test is done to a time series xi that isranked from i ¼ 1,2,.n�1 and xj, which is ranked from
j ¼ i þ 1,2,.n. Each of the data point xi is taken as a reference pointwhich is compared with the rest of the points xj so that,
Sgn�xj � xi
� ¼8<:
þ1;�xj � xi
��0
0;�xj � xi
� ¼ 0�1;
�xj � xi
��0
9=;
A. Nair et al. / Atmospheric Environment 88 (2014) 123e132126
The variance statistic is given as
Pn
Fig. 3. Map showing the mean for the districts of Kerala from 1901 to 2000 annually.
VarðSÞ ¼ nðn� 1Þð2nþ 5Þ � i¼1 tiðiÞði� 1Þð2iþ 5Þ18
where ti is considered as the number of ties upto sample i. The teststatistic Zc is compared as
Zc ¼
8>>>><>>>>:
S�1ffiffiffiffiffiffiffiffiffiffiffiVarðSÞ
p ; S > 0
0; S ¼ 0Sþ1ffiffiffiffiffiffiffiffiffiffiffiVarðSÞ
p ; S < 0
9>>>>=>>>>;
Zc here follows a standard normal distribution. A positive(negative) value of Zc signifies an upward (downward) trend. Asignificance level a is also utilised for testing either an upward ordownward monotone trend (a two tailed test). If Zc appears greaterthan Za/2 where a depicts the significance level, then the trend isconsidered as significant (Kendall (1975)).
2.2.2.2. Seasonality index. Seasonality index (SI) is an index whichhelps in identifying the rainfall regimes on the monthly distribu-tion of rainfall. Moreover, this index quantifies the degree of vari-ability in monthly rainfall through the year. It is simply the sum ofabsolute deviations of mean monthly rainfall from the overallmonthly mean, divided by the mean annual rainfall (Walsh andLawer, 1981; Guhathakurta and Saji, 2013). The computation of SIis done using the following formula
SI ¼ 1R
X12n¼1
�����Xn � R12
�����
where Xn is the mean rainfall of month n and R is the mean annualrainfall. Theoretically, the SI can vary from zero (if all the monthshave equal rainfall) to 1.83 (if all the rainfall occurs in one month).Table 1 shows the different class limits of SI and representativerainfall regimes (Kanellopoulou, 2002).
3. Results and discussion
3.1. Analysis of spatial variability of rainfall
The spatial variation (average rainfall) of rainfall for all the dis-tricts of Kerala from 1901 to 2000 is shown in Fig. 2. The figureshows the variability of rainfall for all the seasons. The seasons arecharacterised according to the classification of India MeteorologicalDepartment as winter (January and February), pre-monsoon(MarcheAprileMay), monsoon (JuneeJulyeAugusteSeptember)and post-monsoon (OctobereNovembereDecember).
During winter (JanuaryeFebruary), all the districts of northernKerala received low rainfall of around 6e15 mm on an averagewhile the southern part received more rainfall (the average rangingfrom 30 to 50 mm). Among all the districts, Pathanamthitta (southKerala) received the highest rainfall whereas the least rainfall isobserved for Kasaragod district (northern Kerala). Districts in thecentral part of Kerala received 15.5 (Thrissur) and 34.4 mm (Erna-kulam) of average rainfall in winter season. The rainfall during pre-monsoon season shows increase in amount in each district withsimilar rainfall feature as in winter. More rainfall is observed oversouthern regions of Kerala than Northern regions. The least rainfallin post monsoon season is observed in the Palakkad district(258.9 mm) and the highest is observed in the Pathanamthittadistrict (564.1 mm).
During monsoon period, the maximum rain zone shifts tonorthern regions of Kerala with almost every district showing very
heavy rainfall in the range of 1600e2900 mm. Southern regionsreceived less amount of rain (900 mm- 2000 mm). The rainfall overErnakulam and Thrissur districts in the central region (the coastaldistricts) shows values of 2185.4 and 2196 mm of rainfall respec-tively. The highest rainfall is obtained in Kasaragod (2969.1 mm)district of northern Kerala and the lowest rainfall is recorded inThiruvananthapuram district (904.4 mm) of southern Kerala. Theleast rainfall in the northern Kerala is observed in Palakkad district(1610.6 mm) whereas the highest rainfall in south central Kerala isobserved in Kottayam district (1992.8 mm).
In the post monsoon season (OcteDec), the rainfall is more oversouthern region (around 540 mme660 mm). The highest amountof rainfall is found over Pathanamthitta (656.4 mm) district. Therainfall over northern region is less compared to the southern re-gion (around 320e480 mm). The least rainfall is observed inKasaragod (329.4 mm) district and the highest is observed inMalappuram (479.9 mm) district of northern Kerala. This asym-metry of rainfall in south and north Kerala has been attributed tovarious factors and brought to limelight in studies such as Simon &Mohankumar, 2004.
The main reason for this difference in seasonal rain is the ge-ography of Kerala where the orography plays an important role indetermining the amount of rain. Since the southwest monsoon isthe principal rainy season, during active spells of rainfall the northKerala falls in the cyclonic shear of low level jet whereas the southKerala is in anticyclonic shear which gives heavy rainfall overnorthern Kerala (Simon & Mohankumar, 2004). In another studyby Nair (2006), it is reported that orography play a vital role inmodulating the rainfall over Kerala state and the increased rainfallactivity over the northern Kerala during southewest monsoonmonths are due to the influence of these terrain differences. Therainfall in other months (pre-monsoon) are mainly contributed bythundershowers since there is an increased thunderstorm activityin the southern tip of Kerala state from March onwards, increasing
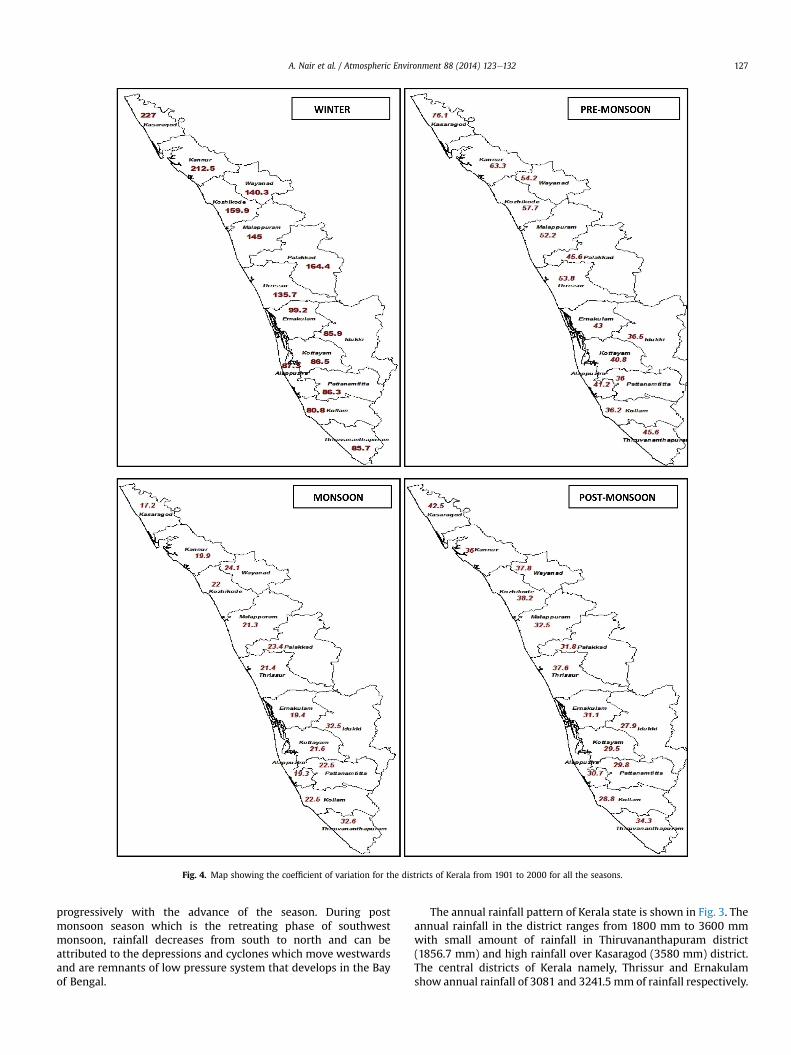
Fig. 4. Map showing the coefficient of variation for the districts of Kerala from 1901 to 2000 for all the seasons.
A. Nair et al. / Atmospheric Environment 88 (2014) 123e132 127
progressively with the advance of the season. During postmonsoon season which is the retreating phase of southwestmonsoon, rainfall decreases from south to north and can beattributed to the depressions and cyclones which move westwardsand are remnants of low pressure system that develops in the Bayof Bengal.
The annual rainfall pattern of Kerala state is shown in Fig. 3. Theannual rainfall in the district ranges from 1800 mm to 3600 mmwith small amount of rainfall in Thiruvananthapuram district(1856.7 mm) and high rainfall over Kasaragod (3580 mm) district.The central districts of Kerala namely, Thrissur and Ernakulamshow annual rainfall of 3081 and 3241.5 mm of rainfall respectively.
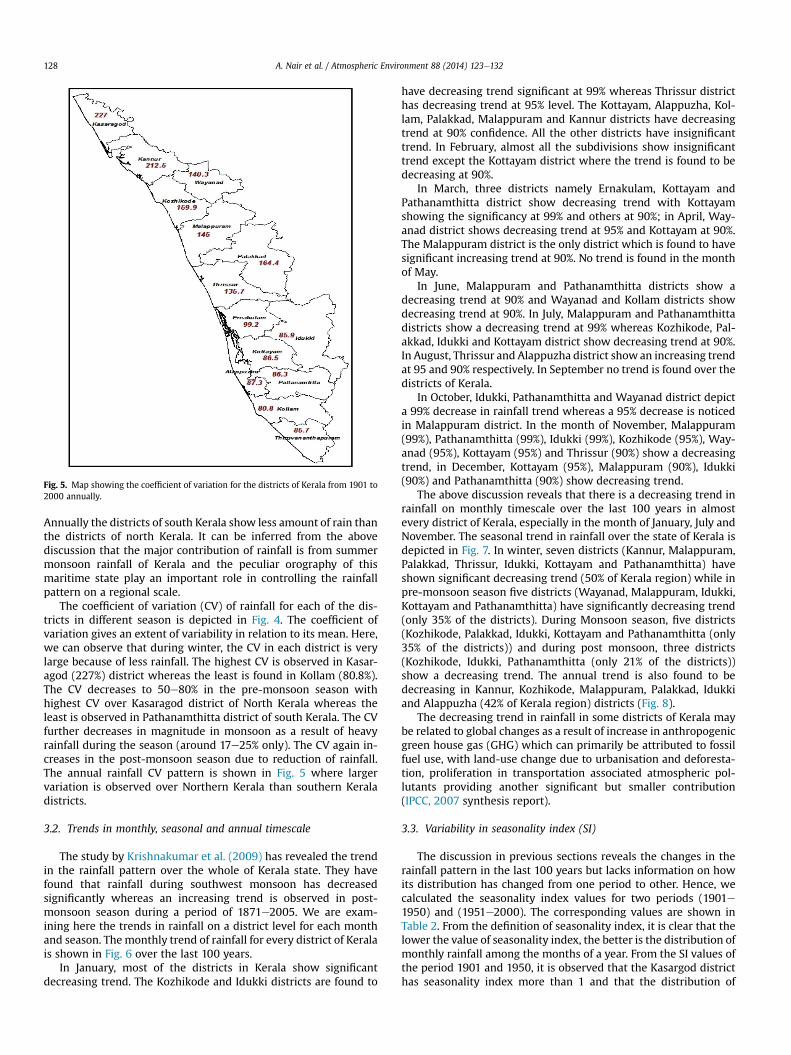
Fig. 5. Map showing the coefficient of variation for the districts of Kerala from 1901 to2000 annually.
A. Nair et al. / Atmospheric Environment 88 (2014) 123e132128
Annually the districts of south Kerala show less amount of rain thanthe districts of north Kerala. It can be inferred from the abovediscussion that the major contribution of rainfall is from summermonsoon rainfall of Kerala and the peculiar orography of thismaritime state play an important role in controlling the rainfallpattern on a regional scale.
The coefficient of variation (CV) of rainfall for each of the dis-tricts in different season is depicted in Fig. 4. The coefficient ofvariation gives an extent of variability in relation to its mean. Here,we can observe that during winter, the CV in each district is verylarge because of less rainfall. The highest CV is observed in Kasar-agod (227%) district whereas the least is found in Kollam (80.8%).The CV decreases to 50e80% in the pre-monsoon season withhighest CV over Kasaragod district of North Kerala whereas theleast is observed in Pathanamthitta district of south Kerala. The CVfurther decreases in magnitude in monsoon as a result of heavyrainfall during the season (around 17e25% only). The CV again in-creases in the post-monsoon season due to reduction of rainfall.The annual rainfall CV pattern is shown in Fig. 5 where largervariation is observed over Northern Kerala than southern Keraladistricts.
3.2. Trends in monthly, seasonal and annual timescale
The study by Krishnakumar et al. (2009) has revealed the trendin the rainfall pattern over the whole of Kerala state. They havefound that rainfall during southwest monsoon has decreasedsignificantly whereas an increasing trend is observed in post-monsoon season during a period of 1871e2005. We are exam-ining here the trends in rainfall on a district level for each monthand season. The monthly trend of rainfall for every district of Keralais shown in Fig. 6 over the last 100 years.
In January, most of the districts in Kerala show significantdecreasing trend. The Kozhikode and Idukki districts are found to
have decreasing trend significant at 99% whereas Thrissur districthas decreasing trend at 95% level. The Kottayam, Alappuzha, Kol-lam, Palakkad, Malappuram and Kannur districts have decreasingtrend at 90% confidence. All the other districts have insignificanttrend. In February, almost all the subdivisions show insignificanttrend except the Kottayam district where the trend is found to bedecreasing at 90%.
In March, three districts namely Ernakulam, Kottayam andPathanamthitta district show decreasing trend with Kottayamshowing the significancy at 99% and others at 90%; in April, Way-anad district shows decreasing trend at 95% and Kottayam at 90%.The Malappuram district is the only district which is found to havesignificant increasing trend at 90%. No trend is found in the monthof May.
In June, Malappuram and Pathanamthitta districts show adecreasing trend at 90% and Wayanad and Kollam districts showdecreasing trend at 90%. In July, Malappuram and Pathanamthittadistricts show a decreasing trend at 99% whereas Kozhikode, Pal-akkad, Idukki and Kottayam district show decreasing trend at 90%.In August, Thrissur and Alappuzha district showan increasing trendat 95 and 90% respectively. In September no trend is found over thedistricts of Kerala.
In October, Idukki, Pathanamthitta and Wayanad district depicta 99% decrease in rainfall trend whereas a 95% decrease is noticedin Malappuram district. In the month of November, Malappuram(99%), Pathanamthitta (99%), Idukki (99%), Kozhikode (95%), Way-anad (95%), Kottayam (95%) and Thrissur (90%) show a decreasingtrend, in December, Kottayam (95%), Malappuram (90%), Idukki(90%) and Pathanamthitta (90%) show decreasing trend.
The above discussion reveals that there is a decreasing trend inrainfall on monthly timescale over the last 100 years in almostevery district of Kerala, especially in the month of January, July andNovember. The seasonal trend in rainfall over the state of Kerala isdepicted in Fig. 7. In winter, seven districts (Kannur, Malappuram,Palakkad, Thrissur, Idukki, Kottayam and Pathanamthitta) haveshown significant decreasing trend (50% of Kerala region) while inpre-monsoon season five districts (Wayanad, Malappuram, Idukki,Kottayam and Pathanamthitta) have significantly decreasing trend(only 35% of the districts). During Monsoon season, five districts(Kozhikode, Palakkad, Idukki, Kottayam and Pathanamthitta (only35% of the districts)) and during post monsoon, three districts(Kozhikode, Idukki, Pathanamthitta (only 21% of the districts))show a decreasing trend. The annual trend is also found to bedecreasing in Kannur, Kozhikode, Malappuram, Palakkad, Idukkiand Alappuzha (42% of Kerala region) districts (Fig. 8).
The decreasing trend in rainfall in some districts of Kerala maybe related to global changes as a result of increase in anthropogenicgreen house gas (GHG) which can primarily be attributed to fossilfuel use, with land-use change due to urbanisation and deforesta-tion, proliferation in transportation associated atmospheric pol-lutants providing another significant but smaller contribution(IPCC, 2007 synthesis report).
3.3. Variability in seasonality index (SI)
The discussion in previous sections reveals the changes in therainfall pattern in the last 100 years but lacks information on howits distribution has changed from one period to other. Hence, wecalculated the seasonality index values for two periods (1901e1950) and (1951e2000). The corresponding values are shown inTable 2. From the definition of seasonality index, it is clear that thelower the value of seasonality index, the better is the distribution ofmonthly rainfall among the months of a year. From the SI values ofthe period 1901 and 1950, it is observed that the Kasargod districthas seasonality index more than 1 and that the distribution of

Fig. 6. Map showing the monthly trend in every district of Kerala. Here decreasing trend is abbreviated as D and the increasing trend by I. The insignificant trend is denoted as N.The corresponding level of significance is also mentioned with the abbreviation. The May and September months do not have any trend in any district.
A. Nair et al. / Atmospheric Environment 88 (2014) 123e132 129
monthly rainfall in this district is mostly attributed to1 or 2months.The SI index in Kannur, Thrissur, Kozhikode, Malappuram, Palakkadand Wayanad districts is 0.99 indicating that the rainfall distribu-tion in these districts is markedly seasonal and is distributed in 3e4months period with long dry season. All the other districts have SIvalues between 0.6 and 0.7, reflecting the rainfall in these districtsis purely seasonal with rainfall occurring evenly in 3e4 months.
In the period of 1951e2000, the SI over Kasargod districts hasdecreased and it belongs to the category of markedly seasonalrainfall whereas the districts which were having markedly seasonalrainfall during the period (1901e1950) remained in the category ofmarkedly seasonal only. The other districts also show purely sea-sonal rainfall in this period. This discussion is much clearer fromFig. 9 where the difference in SI values in the two periods (1901e1950 and 1951e2000) is shown. It is clear from the figure that thenorth Kerala region is having the difference in SI as negative whichindicates that the SI in recent period has decreased from previousperiod (1901e1950) whereas in central part of south Kerala, thedifference in SI values are positive which implies that the SI hasincreased with a change in distribution of rainfall. In Kollam andThiruvananthapuram district of south Kerala, the SI values havedecreased. In order to find out, whether these changes are
significant or not, we have further carried out trend testing inseasonality index for each of the districts, the formula is given by
SIK ¼ 1RK
X12n¼1
����Xnk �RK12
����
where Xnk is the rainfall of month n of the year k and RK is the totalannual rainfall for the year k. This trend analysis is done for each ofthe districts for a period of 1901e2000. Fig. 10 depicts the trend inSI for all the districts of Kerala. It is seen that the SI index isincreasing in the districts viz. Kottayam (99%), Pathanamthitta(95%), Idukki (95%), Thrissur (95%) and Wayanad (90%). In all theother subdivisions the trend is not significant. The increase in SItrend reveals that the rainfall distribution in these districts hasbecome asymmetric with a loss in seasonality that resulted inchanges in rainfall characteristic viz intensity and duration.Goswami et al. (2006) in their study have also reported an increasein heavy rainfall intensities over central India. Similarly, Dash et al.(2012) analysed rainfall characteristics over nine agro-meteorological divisions and found that heavy intensity rainfallspells are increasing. Hence, we recommend a much more detailedand comprehensive study to figure out the changes in distribution
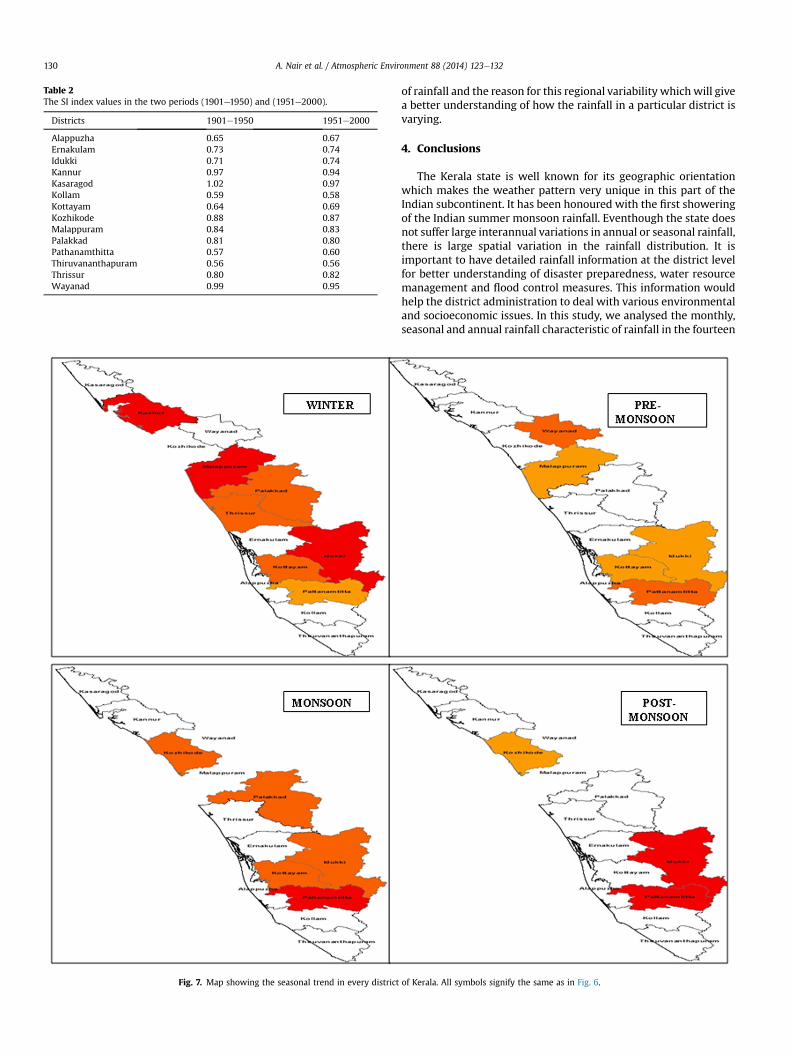
Table 2The SI index values in the two periods (1901e1950) and (1951e2000).
Districts 1901e1950 1951e2000
Alappuzha 0.65 0.67Ernakulam 0.73 0.74Idukki 0.71 0.74Kannur 0.97 0.94Kasaragod 1.02 0.97Kollam 0.59 0.58Kottayam 0.64 0.69Kozhikode 0.88 0.87Malappuram 0.84 0.83Palakkad 0.81 0.80Pathanamthitta 0.57 0.60Thiruvananthapuram 0.56 0.56Thrissur 0.80 0.82Wayanad 0.99 0.95
Fig. 7. Map showing the seasonal trend in every district
A. Nair et al. / Atmospheric Environment 88 (2014) 123e132130
of rainfall and the reason for this regional variability which will givea better understanding of how the rainfall in a particular district isvarying.
4. Conclusions
The Kerala state is well known for its geographic orientationwhich makes the weather pattern very unique in this part of theIndian subcontinent. It has been honoured with the first showeringof the Indian summer monsoon rainfall. Eventhough the state doesnot suffer large interannual variations in annual or seasonal rainfall,there is large spatial variation in the rainfall distribution. It isimportant to have detailed rainfall information at the district levelfor better understanding of disaster preparedness, water resourcemanagement and flood control measures. This information wouldhelp the district administration to deal with various environmentaland socioeconomic issues. In this study, we analysed the monthly,seasonal and annual rainfall characteristic of rainfall in the fourteen
of Kerala. All symbols signify the same as in Fig. 6.
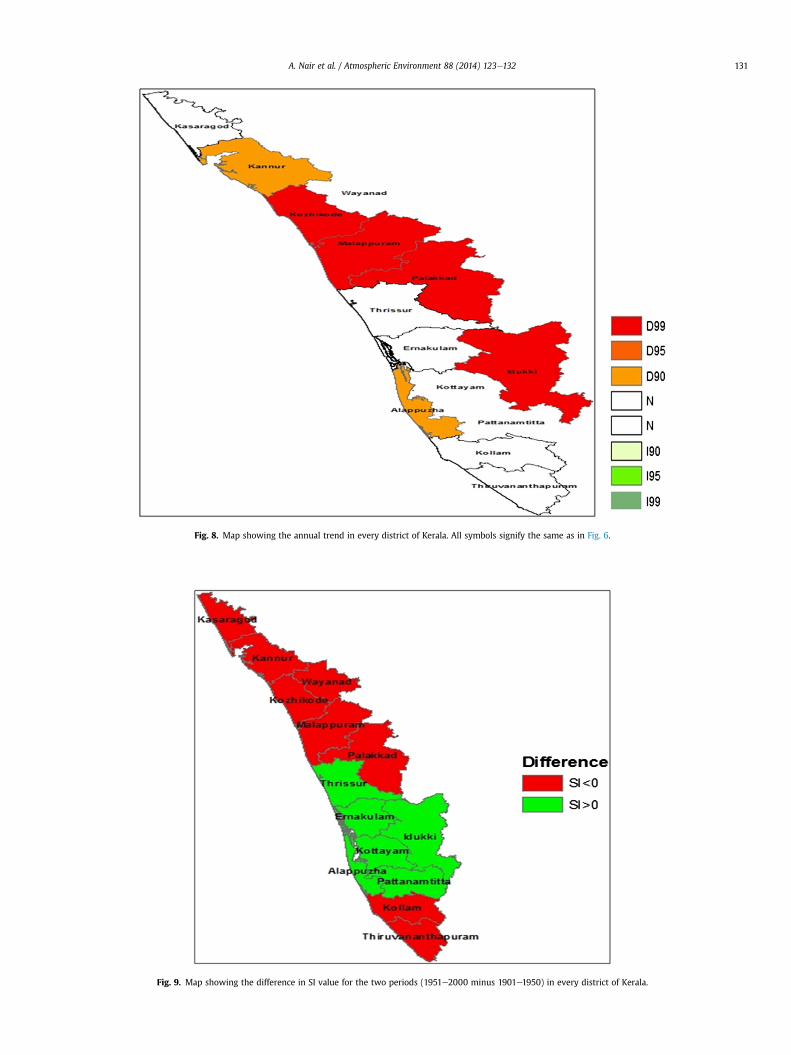
Fig. 8. Map showing the annual trend in every district of Kerala. All symbols signify the same as in Fig. 6.
Fig. 9. Map showing the difference in SI value for the two periods (1951e2000 minus 1901e1950) in every district of Kerala.
A. Nair et al. / Atmospheric Environment 88 (2014) 123e132 131

Fig. 10. Map showing the trend in SI values from 1901 to 2000 in every district ofKerala. All symbols signify the same as in Fig. 6.
A. Nair et al. / Atmospheric Environment 88 (2014) 123e132132
districts of Kerala. The mean rainfall, coefficient of variation andtrend for each of the districts are found in different timescales. Anew index known as seasonality index of rainfall has also beenevaluated. The main findings from the study are penned down:
1. It is found that in the winter (JanuaryeFebruary), pre-monsoon(MarcheAprileMay) and post-monsoon (OctobereNovembereDecember) season the average rainfall maximum is found overthe southern districts of Kerala whereas in the monsoon (JuneeJulyeAugusteSeptember) season the maximum rainfall regimeshift to northern districts of Kerala. The rainfall change in thisperiod can be attributed to the orography of this state whichplays an important role in determining the amount of rain. Theannual rain also shows maximum zone over the northern dis-tricts of Kerala.
2. The examination of coefficient of variation (CV) in differentseasons illustrates the changes in rainfall variability during theseasons. It is seen that variability is very high during winter, pre-monsoon and post monsoon over southern districts of Keralawhereas in monsoon it is found to be less. As compared tonorthern districts, the southern districts have high values of CVannually.
3. The rainfall trend in these districts is judged by ManneKendalltest. It is found that overall the trend is decreasing monthly,
seasonal and in annual timescale. Almost all the districts arefound to have decreasing trend in themonth of January, July andNovember. The trend is significantly decreasing in the differentseasons as well. Annually also the rainfall trend is found to be insignificant decreasing mode in almost every district of Kerala.This decreasing trend in rainfall can be attributed to increasein GHG concentration and changes in land use, proliferationin transportation associated atmospheric pollutants anddeforestation.
4. The contribution of monthly rainfall to the total rainfall isevaluated by seasonality index (SI) which serves as a tool tosummarise the amount of rain attributed by monthly andannual rainfall. It is found that out of 14 districts, only one dis-trict (Kasaragod) shows the contribution of only one or twomonths rain to annual rain. Rest all the other districts showmarkedly seasonal and purely seasonal rainfall distribution.
5. The trend analysis of SI index also reveals an interesting fact thatthe rainfall distribution in Kottayam, Pathanamthitta, Idukki,Thrissur and Wayanad districts has become asymmetric withchange in its distribution. Hence, a more detailed study isrequired to figure out the changes in characteristics of rainfallover Kerala region.
Acknowledgements
The authors would like to thank UNEP-APFED for the financialsupport. The first author also acknowledges NERCI for the researchfacilities and MOES-IMD for the rainfall data.
References
Dash, S.K., Nair, A.A., Kulkarni, M.A., Mohanty, U.C., 2012. Characteristic changes inthe long and short spells of different rain intensities in India. Theoretical andApplied Climatology. http://dx.doi.org/10.1007/s00704-011-0416-x.
Deshmukh, D.T., Lunge, H.S., 2013. A study of temperature and rainfall trends inBuldana district of Vidharbha, India. Internal Journal of Scientific and Tech-nology 2 (2), 67e73.
Goswami, B.N., Venugopal, V., Sengupta, D., Xavier, P.K., Madhusoodanan, M.S.,2006. Increasing trend of extreme rain events over India in a warming envi-ronment. Science 314 (5804), 1442e1445, 1 December.
Guhathakurta, P., Saji, E., 2013. Detecting changes in rainfall pattern and seasonalityindex vis a vis increasing water scarcity in Maharashtra. Journal of Earth Systemand Science 122 (3), 639e649.
IPCC, 2007. Synthesis Report. http://www.ipcc.ch/pdf/assessment-report/ar4/syr/ar4_syr.pdf.
Kanellopoulou, E.A., 2002. Spatial distribution of rainfall seasonality in Greece.Weather 57, 215e219.
Kendall,M.G.,1975. RankCorrelationMethods, fourth ed. CharlesGriffin, London,U.K.Krishnakumar, K.N., Prasada Rao, G.S.L.H.V., Gopakumar, C.S., 2009. Rainfall trends
in twentieth century and Kerala, India. Atmospheric Environement 43 (2),1940e1944.
Nair, V.G., 2006. http://dyuthi.cusat.ac.in/xmlui/bitstream/handle/purl/21/Dyuthi-T0116.pdf?sequence¼8.
Rathod, I.M., Arunchamy, S., 2010. Rainfall trends and pattern of Kongu Upland,Tamilnadu. India Using GIS Techniques 1 (2), 109e122.
Simon, A., Mohankumar, K., 2004. Spatial variability and rainfall characteristics ofKerala. Earth Planetary Science 113, 211e221.
Walsh, R.P.D., Lawer, D.M., 1981. Rainfall seasonality: description, spatial patternsand change through time. Weather 36, 201e208.