Limiting Diffusion Coefficients for Ions and Nonelectrolytes in ...
Upload
georgetownCategory
view
0download
0
Spatially resolved absolute diffusereflectance measurements for noninvasivedetermination of the optical scattering andabsorption coefficients of biological tissue
Alwin Kienle, Lothar Lilge, Michael S. Patterson, Raimund Hibst, Rudolf Steiner,and Brian C. Wilson
2304 APPLIED OPTICS @
The absorption and transport scattering coefficients of biological tissues determine the radial depen-dence of the diffuse reflectance that is due to a point source. A system is described for making remotemeasurements of spatially resolved absolute diffuse reflectance and hence noninvasive, noncontactestimates of the tissue optical properties. The system incorporated a laser source and a CCDcamera. Deflection of the incident beam into the camera allowed characterization of the source forabsolute reflectance measurements. It is shown that an often used solution of the diffusion equationcannot be applied for these measurements. Instead, a neural network, trained on the results of MonteCarlo simulations, was used to estimate the absorption and scattering coefficients from the reflectancedata. Tests on tissue-simulating phantoms with transport scattering coefficients between 0.5 and 2.0mm21 and absorption coefficients between 0.002 and 0.1 mm21 showed the rms errors of this techniqueto be 2.6% for the transport scattering coefficient and 14% for the absorption coefficients. The opticalproperties of bovine muscle, adipose, and liver tissue, as well as chicken muscle 1breast2, were alsomeasured ex vivo at 633 and 751 nm. For muscle tissue it was found that the Monte Carlo simulationdid not agree with experimental measurements of reflectance at distances less than 2 mm from theincident beam.Key words: Tissue optics, reflectance, Monte Carlo, neural network. r 1996 Optical Society of
America
1. Introduction
Understanding the propagation and the distributionof light in biological tissue is essential for effectiveand safe applications in medical diagnostics andtherapeutics.1,2 Light propagation in biological tis-sue, which is an optically turbid 1i.e., scattering and
A. Kienle, R. Hibst, and R. Steiner are with the Institut furLasertechnologien in der Medizin, Ulm, Germany; L. Lilge andM.Patterson are with the Hamilton Regional Cancer Centre andMcMaster University, Hamilton, Ontario, Canada; B. C. Wilson iswith the Ontario Laser and Lightwave Research Centre, Toronto,Ontario, Canada. L. Lilge and B. C. Wilson are also with theOntario Cancer Institute@PrincessMargaret Hospital andDepart-ment of Medical Biophysics, University of Toronto, Toronto,Ontario, Canada.Received 16 March 1995; revised manuscript received 7 August
1995.0003-6935@96@132304-11$10.00@0r 1996 Optical Society of America
Vol. 35, No. 13 @ 1 May 1996
absorbing2 medium, can be described by the Boltz-mann transport equation.3 This involves three opti-cal properties: the absorption coefficient µa, thescattering coefficient µs, and the scattering phasefunction. In the diffusion approximation3 to theBoltzmann equation, the phase function is repre-sented by the mean cosine of the scattering angle g,which is combined with the scattering coefficient togive the reduced 1or transport2 scattering coefficientµs8 5 µs11 2 g2.The various methods of measuring the optical
properties of tissues have been recently reviewed byWilson4 and Cheong et al.5 Substantial discrepan-cies are evident in the published data, which may beattributed, at least in part, to the different experimen-tal methods employed and the theoretical modelsused to analyze the measurements. A number ofthese methods are invasive, requiring excised tissuespecimens.6,7 Minimally invasive or noninvasivetechniques include interstitial measurements with
isotropic detectors,8 time-domain9 and frequency-domain10 measurements of 1laser2 light reflectance ortransmittance, or coherent backscattering.11Steady-state spatially resolved measurement of
diffuse reflectance from a point source or narrowcollimated beam has also been investigated12 by theuse of multiple fiber-optic detectors in contact withthe tissue surface at varying distances from thesource. This has the advantage of requiring rela-tively simple technology compared with that of thetime-dependent techniques. However, measure-ments are made at only a limited number of points1typically 6–82 so that the estimates of the derivedoptical properties may be biased by local tissueinhomogeneities. Pressure that is due to the con-tact probe may also affect the optical propertiesderived, for example, because of altered local bloodcontent. Recently Bolt and ten Bosch13,14 intro-duced an alternative diffuse reflectance technique1video reflectometry2 based on a remote, noncontact,video camera detector, which potentially may over-come these limitations. Jacques et al.15 used thismethod for measurements on ex vivo tissue. Re-sults obtained with similar systems have also beenreported by Splinter et al.16 and by Dogariu andAsakura.17In either the remote or the contact diffuse reflec-
tance techniques, a model of light transport in tissueis required for relating the diffuse reflectance valuesto the optical absorption and reduced scatteringcoefficients of the tissue in order to extract thesecoefficients. This is usually done in an iterativefashion by using the model to fit the measured data,with the optical properties as free parameters.Various authors have used solutions of the diffusionequation for this purpose.12 Because diffusiontheory restricts the degree of anisotropy in theradiance within the tissue, a particular problemarises in handling the boundary conditions at thetissue surface, where the radiance pattern is chang-ing rapidly. Different models of varying degrees ofsophistication have been developed to describe theseboundary conditions. A primary objective of thepresent work was to investigate the accuracy ofthese analytic models, by the use of both simulatedreflectance data generated by a Monte Carlo codeand experimental measurements made in opticalphantoms and tissues with a video reflectometrysystem similar to that of Jacques et al.15In those cases in which an analytic model does not
accurately represent the reflectance, more exactmodels of light propagation may be applicable. Thealternative approaches of using either higher-orderanalytic solutions to the Boltzmann equation orusing Monte Carlo simulation of photon paths aregenerally too complex or computationally expensiveto be used in iterative fitting of reflectance data.8In an earlier paper19 we have demonstrated the useof a neural network trained with data generated by adiffusion model to derive the optical scattering andabsorption properties from spatially resolved diffuse
reflectancemeasurements. Such networksmay alsobe trained by the use of either Monte Carlo simu-lated data or experimental phantom data generatedover the range of optical properties of interest. Thisapproach does not rely on any approximate model ofradiation transport, and, once the network is trained,it is computationally fast.In the work of Farrell et al.,19 the neural network
was applied to a contact-probe instrument, and,because of the possible variation in the opticalcoupling between the fibers and the tissue, only therelative shape of the reflectance versus the distancecurve was used, not the absolute values of localreflectance. Furthermore, there are limitations onthe shortest radial distance at which measurementscan be made with a fiber-optic probe. Potentialadvantages of video reflectometry are that absolutemeasurements are possible and that the full range ofdistances on the surface can be used.To assess this potential, we have made spatially
resolved absolute diffuse reflectance measurementsat two different wavelengths in tissue-simulatingphantoms of known optical properties by using aCCD camera video reflectometer. We found thatdiffusion theory12 did not provide an accurate predic-tion of the absolute local reflectance calculated byMonte Carlo simulations, and its application gavepoor estimates of the optical properties. Thereforea Monte Carlo trained neural network was used toanalyze the results. Experimental measurementsof representative mammalian soft tissues ex vivowere alsomade for comparisonwith published values.For tissues, we found that even Monte Carlo simula-tions did not always provide a good description of thereflectance close to the source. When absolute reflec-tance data for 2–12-mm distances are used in theneural network, we estimate that the transportscattering coefficient can be determined with 3%–4%accuracy and the absorption coefficient can be deter-mined with 10–15% accuracy.
2. Theory and Modeling
In this section we describe the two models of radia-tion transport that were used to derive the absorp-tion and scattering coefficients from the spatiallyresolved measurements of diffuse reflectance. Thefirst was a Monte Carlo simulation of photon trans-port that involves no physical approximations butthat produces estimates of the reflectance subject tostatistical uncertainties. Reducing these uncertain-ties to acceptable values, especially for locations farfrom the source, requires that many photon historiesbe traced. The time required for this precludes theuse of iterative Monte Carlo simulations, so, asdescribed below, results of many simulations wereused to train a neural network to derive µa and µs8from experimental data. An alternative approachis to use an approximate transport model to generatean analytic expression for the spatially resolvedreflectance. Physical approximationsmust bemade,but results can be generated quickly, so that conven-
1 May 1996 @ Vol. 35, No. 13 @ APPLIED OPTICS 2305
tional least-squares techniques can be used to gener-ate best estimates of µa and µs8. We used a diffusionmodel to generate analytical expressions for thereflectance.The principles of Monte Carlo simulation of par-
ticle transport have been thoroughly described,20,21so we point out only the salient features of oursimulations. The tissue was assumed to be a semi-infinite half-space with scattering coefficient µs, ab-sorption coefficient µa, and index of refraction n,which was n 5 1.4 for the simulations.22 Thescattering phase function was that originally used byHenyey andGreenstein23 inwhich the angular depen-dence is described by one parameter, g. All photonswere assumed to be normally incident at the origin;the influence of the actual incident-beam shape wasincorporated by convolution, as described below.Specular reflection at the tissue–air boundary washandled with the assumption that the usual Fresnelequations could be used to calculate the fraction ofphoton weight transmitted and reflected.Because we wish to calculate the absolute signal
received by the detector, it is necessary to estimatethe fraction of diffusely reflected photons that entersthe aperture of the detector. This can be done intwo ways. One is to track the direction of photonsthat are emitted from the tissue surface and to scoreonly those that intercept the detector aperture.Because most photons will not be detected, this isinefficient. We accelerated theMonte Carlo simula-tions with a variance-reduction method called lastflight estimation.7,24 In thismethod, at each interac-tion point the probability that the photon will escapethe medium without further interaction and inter-cept the detector is calculated. This variance-reduction method is valid if the solid angle of detec-tion is small 1i.e., the detector size is much smallerthan the distance from the detector to the sample, asis the case in our experiment2. An alternative ap-proach is to score all photons that are emitted from asurface element but to assume that the reflectance isLambertian so that all directions are equally prob-able. The detected signal is then derived from thesolid angle subtended by the aperture. Because allemitted photons contribute to the calculated signal,this method is computationally efficient, and itsvalidity was tested by a comparison of calculationsmade with both techniques.Another way to improve the efficiency of Monte
Carlo calculations is to employ the principle ofsimilarity. It has long been known that differentcombinations of g and µs will yield similar results fordependent quantities, such as the diffuse reflec-tance.25 The simplest relationship, which is incorpo-rated in diffusion theory, is that conservation of thequantity 11 2 g2µs will ensure similarity. We testedthis relationship to determine whether Monte Carlosimulations performed with one value of the anisot-ropy parameter g were sufficient to derive µa and µs8for materials with a range of µs and g.
2306 APPLIED OPTICS @ Vol. 35, No. 13 @ 1 May 1996
Two neural networks were set up to solve theinverse problems. One 1NN12 consisted of 11 inputnodes, representing the reflectance at 11 distances,and 11 hidden nodes linked to two output nodes.The other 1NN22 had 9 input and hidden nodes withtwo output nodes. In principle these output nodescould represent µa and µs8 directly, but we followedthe alternative approach described in detail by Far-rell et al.19 Instead of training the network with thereflectance as a function of distanceR1r2, the functionloge3r2R1r24 was used. This function has two distinc-tive features: a peak a few millimeters from thesource and a roughly exponential decrease far fromthe source. The position of the peak dependsstrongly on µt8 5 µs8 1 µa, and the slope of theexponential part depends on the effective attenua-tion coefficient µeff. In the diffusion approximation,µeff 5 33µa1µa 1 µs8241@2. The neural networks weretrained with µt8 and µeff as the output nodes, as theseare the recognizable features of the loge3r2R1r24 versusr curve. The coefficients µa and µs8 were thencalculated from these values. NN1 was trainedwith the reflectance data at r 5 2, 3, 4, . . . , 12 mm,and NN2 was trained with the data at r 5 2, 2.5,3, . . . , 6 mm. The use of two networks accommo-dates the wide range of attenuation encountered inreal tissues. 120 Monte Carlo simulations wereperformed that covered the range of 0.2 , µs8 , 2.5mm21 and 0.001 , µa , 0.5 mm21. The number ofphotons N used in each Monte Carlo simulation wascalculated from the empirical formula
N [ 31µa@µs821@241@2 3 106
in order to give comparable statistics over the re-quired distance range. The radial bin in the MonteCarlo simulations was 40 µm. If the ratio of reflec-tance at 12 mm to the reflectance at the origin wasgreater than 3 3 1025, the data from that simulationwere used to train NN1; if the ratio was less than 23
1024, the data formed part of the training set for NN21note that a few simulations were used to train bothnetworks2. After training, the rms error in µeff andµt8were 4.6% for NN1 and 3.5% for NN2. Assumingthat the errors in µt8 and µeff are uncorrelated, theexpected errors in µa and µs8 would be approximately8% and 5%, respectively, for NN1 and approximately6% and 4% for NN2. The reasons for using dataonly for distances greater than 2 mm are discussedbelow.The diffusion model used to generate an analytic
expression for the reflectance has been described byFarrell et al.12 The final result is
R1r2 5a8
4p 31
µt8 1µeff 11
r12exp12µeffr12
r12
1 1 1µt8 1 2zb21µeff 11
r22exp12µeffr22
r22, 112
where
r1 5 31 1µt822
1 r241@2
,
r2 5 31 1µt8 1 2zb22
1 r241@2
,
a8 5 µs8@1µa 1 µs82,
and zb is the distance from the tissue surface to anextrapolated boundary at which the fluence rate isforced to be 0. In deriving Eq. 112 it was assumedthat all incident photons are isotropically scatteredat a depth 1@µt8. As described by Farrell et al.,12calculations were also performed with an extendedsource,
S1z2 5 a8µt8 exp12µt8z2, 122
where the initial scatter events are exponentiallydistributed along the z axis. Acylindrically symmet-ric three-dimensional source function was also ap-plied:
S1r, z2 59a8µt3
2pexp32µt1z 1 3r24. 132
We used a three-dimensional convolution to calcu-late the spatially resolved reflectance from Eq. 132.
3. Materials and Methods
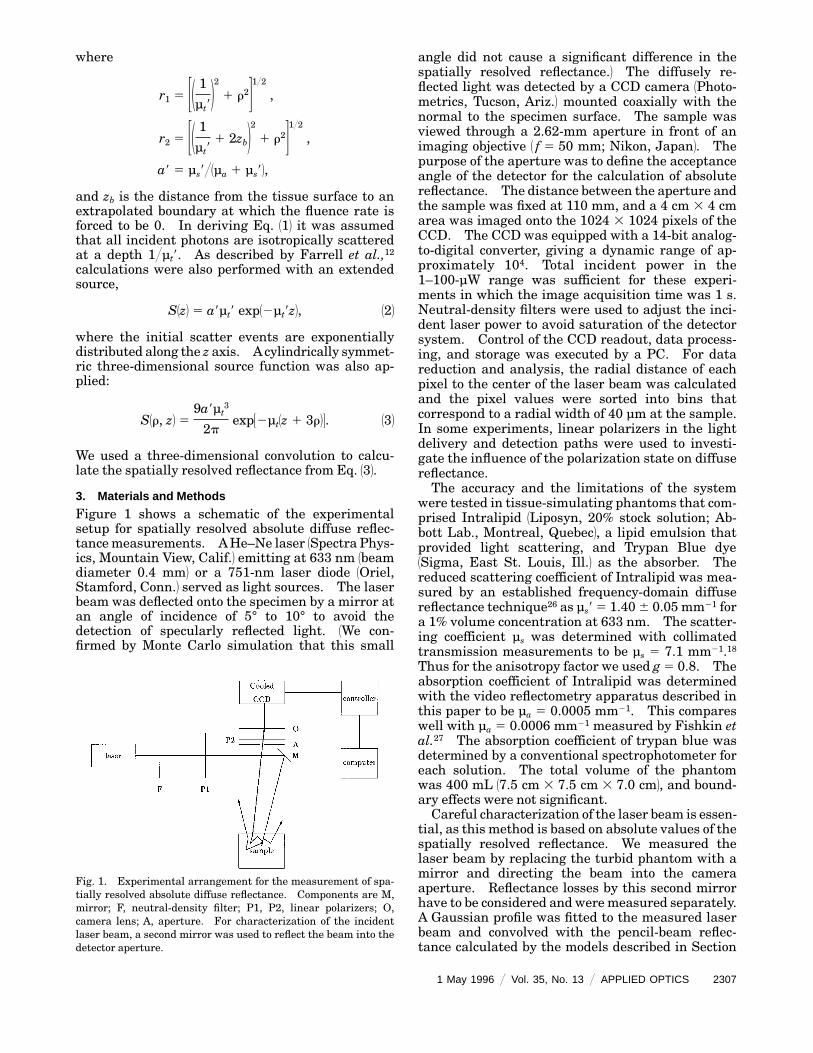
Figure 1 shows a schematic of the experimentalsetup for spatially resolved absolute diffuse reflec-tancemeasurements. AHe–Ne laser 1Spectra Phys-ics, Mountain View, Calif.2 emitting at 633 nm 1beamdiameter 0.4 mm2 or a 751-nm laser diode 1Oriel,Stamford, Conn.2 served as light sources. The laserbeam was deflected onto the specimen by a mirror atan angle of incidence of 5° to 10° to avoid thedetection of specularly reflected light. 1We con-firmed by Monte Carlo simulation that this small
Fig. 1. Experimental arrangement for the measurement of spa-tially resolved absolute diffuse reflectance. Components are M,mirror; F, neutral-density filter; P1, P2, linear polarizers; O,camera lens; A, aperture. For characterization of the incidentlaser beam, a second mirror was used to reflect the beam into thedetector aperture.
angle did not cause a significant difference in thespatially resolved reflectance.2 The diffusely re-flected light was detected by a CCD camera 1Photo-metrics, Tucson, Ariz.2 mounted coaxially with thenormal to the specimen surface. The sample wasviewed through a 2.62-mm aperture in front of animaging objective 1 f 5 50 mm; Nikon, Japan2. Thepurpose of the aperture was to define the acceptanceangle of the detector for the calculation of absolutereflectance. The distance between the aperture andthe sample was fixed at 110 mm, and a 4 cm 3 4 cmarea was imaged onto the 1024 3 1024 pixels of theCCD. The CCD was equipped with a 14-bit analog-to-digital converter, giving a dynamic range of ap-proximately 104. Total incident power in the1–100-µW range was sufficient for these experi-ments in which the image acquisition time was 1 s.Neutral-density filters were used to adjust the inci-dent laser power to avoid saturation of the detectorsystem. Control of the CCD readout, data process-ing, and storage was executed by a PC. For datareduction and analysis, the radial distance of eachpixel to the center of the laser beam was calculatedand the pixel values were sorted into bins thatcorrespond to a radial width of 40 µm at the sample.In some experiments, linear polarizers in the lightdelivery and detection paths were used to investi-gate the influence of the polarization state on diffusereflectance.The accuracy and the limitations of the system
were tested in tissue-simulating phantoms that com-prised Intralipid 1Liposyn, 20% stock solution; Ab-bott Lab., Montreal, Quebec2, a lipid emulsion thatprovided light scattering, and Trypan Blue dye1Sigma, East St. Louis, Ill.2 as the absorber. Thereduced scattering coefficient of Intralipid was mea-sured by an established frequency-domain diffusereflectance technique26 as µs8 5 1.40 6 0.05 mm21 fora 1% volume concentration at 633 nm. The scatter-ing coefficient µs was determined with collimatedtransmission measurements to be µs 5 7.1 mm21.18Thus for the anisotropy factor we used g 5 0.8. Theabsorption coefficient of Intralipid was determinedwith the video reflectometry apparatus described inthis paper to be µa 5 0.0005 mm21. This compareswell with µa 5 0.0006 mm21 measured by Fishkin etal.27 The absorption coefficient of trypan blue wasdetermined by a conventional spectrophotometer foreach solution. The total volume of the phantomwas 400 mL 17.5 cm 3 7.5 cm 3 7.0 cm2, and bound-ary effects were not significant.Careful characterization of the laser beam is essen-
tial, as this method is based on absolute values of thespatially resolved reflectance. We measured thelaser beam by replacing the turbid phantom with amirror and directing the beam into the cameraaperture. Reflectance losses by this second mirrorhave to be considered and weremeasured separately.A Gaussian profile was fitted to the measured laserbeam and convolved with the pencil-beam reflec-tance calculated by the models described in Section
1 May 1996 @ Vol. 35, No. 13 @ APPLIED OPTICS 2307
2. The total power in the laser beam was alsomeasured by an optical power meter 1Newport, Ir-vine, Calif.2. This measurement was repeated be-fore all sample measurements were taken so thatcorrection could be made for drifts in source power.Fresh tissue samples were obtained from a local
butcher, stored at 14 °C, and used within 8 h for theex vivo experiments. The samples had not beenfrozen nor were they treated to remove blood.Measurements were done after the samples hadreached room temperature at locations where therewere no obvious inhomogeneities.The optical properties of bovine fat, muscle, and
liver, and chicken breast were determined, andmeasurements were made at three to six differentlocations on each tissue sample. For bovine liverand chicken breast, the sample thickness was lim-ited to ,20 mm but was greater than 40 mm forbovine muscle and fat. The tissue surface wasaligned approximately horizontally.
4. Results
In this section we first present results concerningvariance reduction and similarity in theMonte Carlosimulations. This is followed by a comparison ofMonte Carlo simulations and diffusion-theory calcu-lations together with a discussion of the errorsincurred in using the diffusion model to estimate µaand µs8. Next, experimental measurements on tis-sue-simulating phantoms are presented as well asan assessment of the accuracy of the optical proper-ties derived with the Monte Carlo–neural-networkapproach. Finally, we present data obtained for arange of animal tissue ex vivo.Figure 2 shows calculations of the dependence of
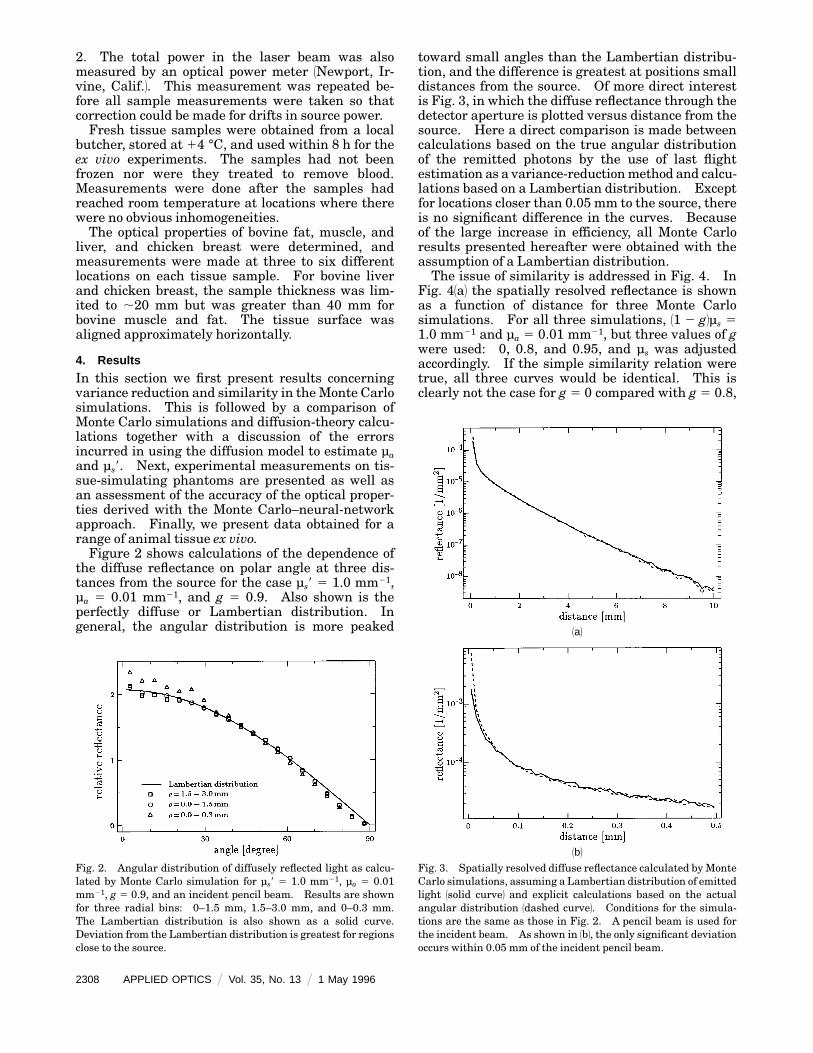
the diffuse reflectance on polar angle at three dis-tances from the source for the case µs8 5 1.0 mm21,µa 5 0.01 mm21, and g 5 0.9. Also shown is theperfectly diffuse or Lambertian distribution. Ingeneral, the angular distribution is more peaked
Fig. 2. Angular distribution of diffusely reflected light as calcu-lated by Monte Carlo simulation for µs8 5 1.0 mm21, µa 5 0.01mm21, g 5 0.9, and an incident pencil beam. Results are shownfor three radial bins: 0–1.5 mm, 1.5–3.0 mm, and 0–0.3 mm.The Lambertian distribution is also shown as a solid curve.Deviation from the Lambertian distribution is greatest for regionsclose to the source.
2308 APPLIED OPTICS @ Vol. 35, No. 13 @ 1 May 1996
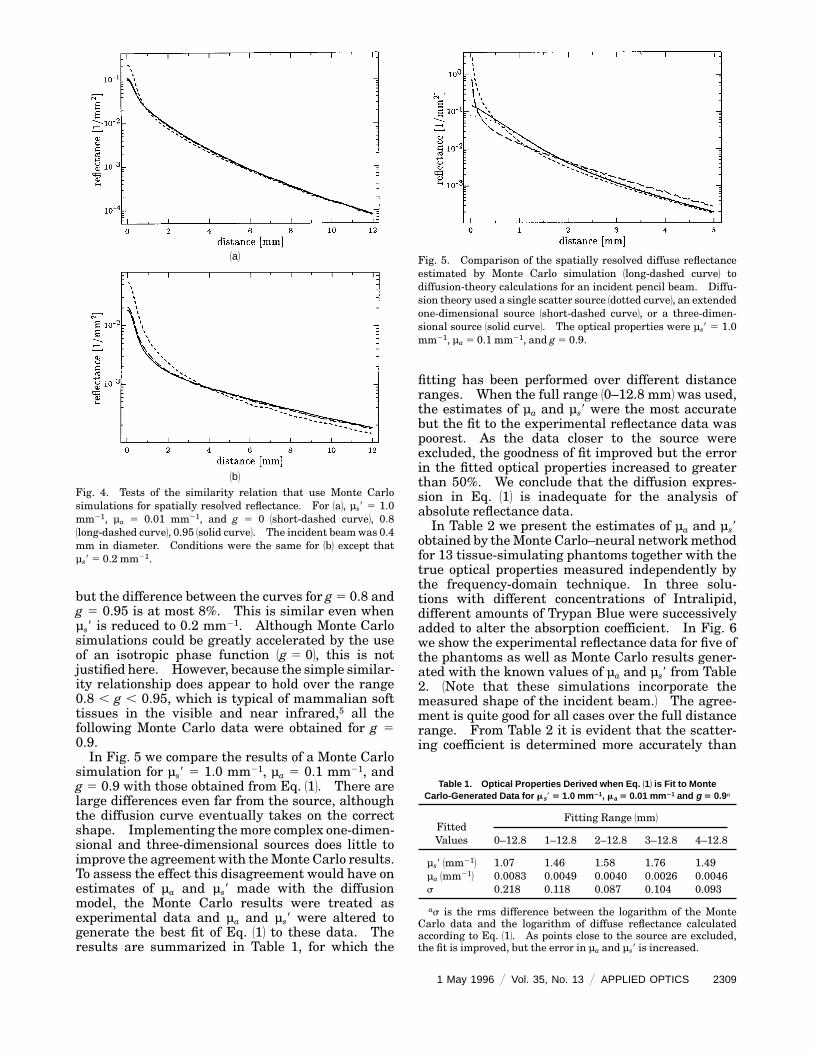
toward small angles than the Lambertian distribu-tion, and the difference is greatest at positions smalldistances from the source. Of more direct interestis Fig. 3, in which the diffuse reflectance through thedetector aperture is plotted versus distance from thesource. Here a direct comparison is made betweencalculations based on the true angular distributionof the remitted photons by the use of last flightestimation as a variance-reductionmethod and calcu-lations based on a Lambertian distribution. Exceptfor locations closer than 0.05 mm to the source, thereis no significant difference in the curves. Becauseof the large increase in efficiency, all Monte Carloresults presented hereafter were obtained with theassumption of a Lambertian distribution.The issue of similarity is addressed in Fig. 4. In
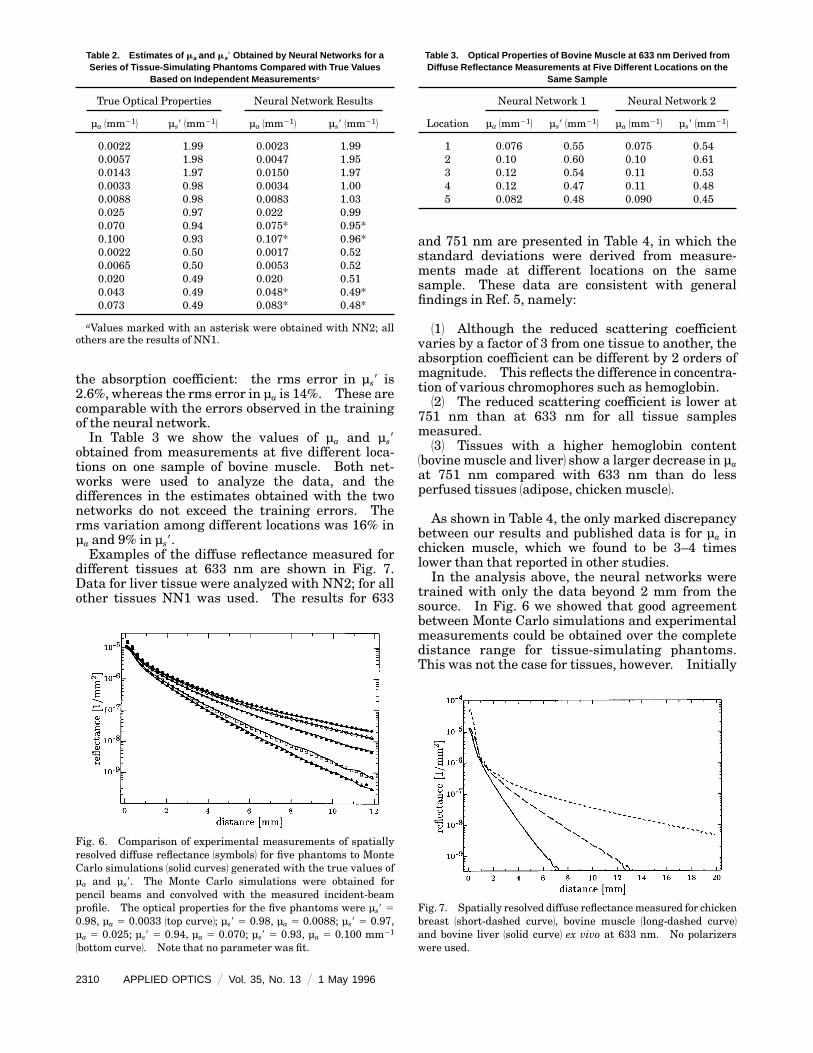
Fig. 41a2 the spatially resolved reflectance is shownas a function of distance for three Monte Carlosimulations. For all three simulations, 11 2 g2µs 51.0 mm21 and µa 5 0.01 mm21, but three values of gwere used: 0, 0.8, and 0.95, and µs was adjustedaccordingly. If the simple similarity relation weretrue, all three curves would be identical. This isclearly not the case for g 5 0 compared with g 5 0.8,
1a2
1b2
Fig. 3. Spatially resolved diffuse reflectance calculated byMonteCarlo simulations, assuming a Lambertian distribution of emittedlight 1solid curve2 and explicit calculations based on the actualangular distribution 1dashed curve2. Conditions for the simula-tions are the same as those in Fig. 2. A pencil beam is used forthe incident beam. As shown in 1b2, the only significant deviationoccurs within 0.05 mm of the incident pencil beam.
but the difference between the curves for g 5 0.8 andg 5 0.95 is at most 8%. This is similar even whenµs8 is reduced to 0.2 mm21. Although Monte Carlosimulations could be greatly accelerated by the useof an isotropic phase function 1g 5 02, this is notjustified here. However, because the simple similar-ity relationship does appear to hold over the range0.8 , g , 0.95, which is typical of mammalian softtissues in the visible and near infrared,5 all thefollowing Monte Carlo data were obtained for g 50.9.In Fig. 5 we compare the results of a Monte Carlo
simulation for µs8 5 1.0 mm21, µa 5 0.1 mm21, andg 5 0.9 with those obtained from Eq. 112. There arelarge differences even far from the source, althoughthe diffusion curve eventually takes on the correctshape. Implementing themore complex one-dimen-sional and three-dimensional sources does little toimprove the agreement with theMonte Carlo results.To assess the effect this disagreement would have onestimates of µa and µs8 made with the diffusionmodel, the Monte Carlo results were treated asexperimental data and µa and µs8 were altered togenerate the best fit of Eq. 112 to these data. Theresults are summarized in Table 1, for which the
1a2
1b2
Fig. 4. Tests of the similarity relation that use Monte Carlosimulations for spatially resolved reflectance. For 1a2, µs8 5 1.0mm21, µa 5 0.01 mm21, and g 5 0 1short-dashed curve2, 0.81long-dashed curve2, 0.95 1solid curve2. The incident beamwas 0.4mm in diameter. Conditions were the same for 1b2 except thatµs8 5 0.2 mm21.
fitting has been performed over different distanceranges. When the full range 10–12.8 mm2 was used,the estimates of µa and µs8 were the most accuratebut the fit to the experimental reflectance data waspoorest. As the data closer to the source wereexcluded, the goodness of fit improved but the errorin the fitted optical properties increased to greaterthan 50%. We conclude that the diffusion expres-sion in Eq. 112 is inadequate for the analysis ofabsolute reflectance data.In Table 2 we present the estimates of µa and µs8
obtained by theMonte Carlo–neural networkmethodfor 13 tissue-simulating phantoms together with thetrue optical properties measured independently bythe frequency-domain technique. In three solu-tions with different concentrations of Intralipid,different amounts of Trypan Blue were successivelyadded to alter the absorption coefficient. In Fig. 6we show the experimental reflectance data for five ofthe phantoms as well as Monte Carlo results gener-ated with the known values of µa and µs8 from Table2. 1Note that these simulations incorporate themeasured shape of the incident beam.2 The agree-ment is quite good for all cases over the full distancerange. From Table 2 it is evident that the scatter-ing coefficient is determined more accurately than
Fig. 5. Comparison of the spatially resolved diffuse reflectanceestimated by Monte Carlo simulation 1long-dashed curve2 todiffusion-theory calculations for an incident pencil beam. Diffu-sion theory used a single scatter source 1dotted curve2, an extendedone-dimensional source 1short-dashed curve2, or a three-dimen-sional source 1solid curve2. The optical properties were µs8 5 1.0mm21, µa 5 0.1 mm21, and g 5 0.9.
Table 1. Optical Properties Derived when Eq. A1B is Fit to MonteCarlo-Generated Data for ms8 5 1.0 mm21, ma 5 0.01 mm21 and g 5 0.9a
FittedValues
Fitting Range 1mm2
0–12.8 1–12.8 2–12.8 3–12.8 4–12.8
µs8 1mm212 1.07 1.46 1.58 1.76 1.49µa 1mm212 0.0083 0.0049 0.0040 0.0026 0.0046s 0.218 0.118 0.087 0.104 0.093
as is the rms difference between the logarithm of the MonteCarlo data and the logarithm of diffuse reflectance calculatedaccording to Eq. 112. As points close to the source are excluded,the fit is improved, but the error in µa and µs8 is increased.
1 May 1996 @ Vol. 35, No. 13 @ APPLIED OPTICS 2309
the absorption coefficient: the rms error in µs8 is2.6%, whereas the rms error in µa is 14%. These arecomparable with the errors observed in the trainingof the neural network.In Table 3 we show the values of µa and µs8
obtained from measurements at five different loca-tions on one sample of bovine muscle. Both net-works were used to analyze the data, and thedifferences in the estimates obtained with the twonetworks do not exceed the training errors. Therms variation among different locations was 16% inµa and 9% in µs8.Examples of the diffuse reflectance measured for
different tissues at 633 nm are shown in Fig. 7.Data for liver tissue were analyzed with NN2; for allother tissues NN1 was used. The results for 633
Table 2. Estimates of ma and ms8 Obtained by Neural Networks for aSeries of Tissue-Simulating Phantoms Compared with True Values
Based on Independent Measurements a
True Optical Properties Neural Network Results
µa 1mm212 µs8 1mm212 µa 1mm212 µs8 1mm212
0.0022 1.99 0.0023 1.990.0057 1.98 0.0047 1.950.0143 1.97 0.0150 1.970.0033 0.98 0.0034 1.000.0088 0.98 0.0083 1.030.025 0.97 0.022 0.990.070 0.94 0.075* 0.95*0.100 0.93 0.107* 0.96*0.0022 0.50 0.0017 0.520.0065 0.50 0.0053 0.520.020 0.49 0.020 0.510.043 0.49 0.048* 0.49*0.073 0.49 0.083* 0.48*
aValues marked with an asterisk were obtained with NN2; allothers are the results of NN1.
Fig. 6. Comparison of experimental measurements of spatiallyresolved diffuse reflectance 1symbols2 for five phantoms to MonteCarlo simulations 1solid curves2 generated with the true values ofµa and µs8. The Monte Carlo simulations were obtained forpencil beams and convolved with the measured incident-beamprofile. The optical properties for the five phantoms were µs8 5
0.98, µa 5 0.0033 1top curve2; µs8 5 0.98, µa 5 0.0088; µs8 5 0.97,µa 5 0.025; µs8 5 0.94, µa 5 0.070; µs8 5 0.93, µa 5 0.100 mm21
1bottom curve2. Note that no parameter was fit.
2310 APPLIED OPTICS @ Vol. 35, No. 13 @ 1 May 1996
and 751 nm are presented in Table 4, in which thestandard deviations were derived from measure-ments made at different locations on the samesample. These data are consistent with generalfindings in Ref. 5, namely:
112 Although the reduced scattering coefficientvaries by a factor of 3 from one tissue to another, theabsorption coefficient can be different by 2 orders ofmagnitude. This reflects the difference in concentra-tion of various chromophores such as hemoglobin.122 The reduced scattering coefficient is lower at
751 nm than at 633 nm for all tissue samplesmeasured.132 Tissues with a higher hemoglobin content
1bovine muscle and liver2 show a larger decrease in µaat 751 nm compared with 633 nm than do lessperfused tissues 1adipose, chicken muscle2.
As shown in Table 4, the only marked discrepancybetween our results and published data is for µa inchicken muscle, which we found to be 3–4 timeslower than that reported in other studies.In the analysis above, the neural networks were
trained with only the data beyond 2 mm from thesource. In Fig. 6 we showed that good agreementbetween Monte Carlo simulations and experimentalmeasurements could be obtained over the completedistance range for tissue-simulating phantoms.This was not the case for tissues, however. Initially
Table 3. Optical Properties of Bovine Muscle at 633 nm Derived fromDiffuse Reflectance Measurements at Five Different Locations on the
Same Sample
Location
Neural Network 1 Neural Network 2
µa 1mm212 µs8 1mm212 µa 1mm212 µs8 1mm212
1 0.076 0.55 0.075 0.542 0.10 0.60 0.10 0.613 0.12 0.54 0.11 0.534 0.12 0.47 0.11 0.485 0.082 0.48 0.090 0.45
Fig. 7. Spatially resolved diffuse reflectancemeasured for chickenbreast 1short-dashed curve2, bovine muscle 1long-dashed curve2and bovine liver 1solid curve2 ex vivo at 633 nm. No polarizerswere used.
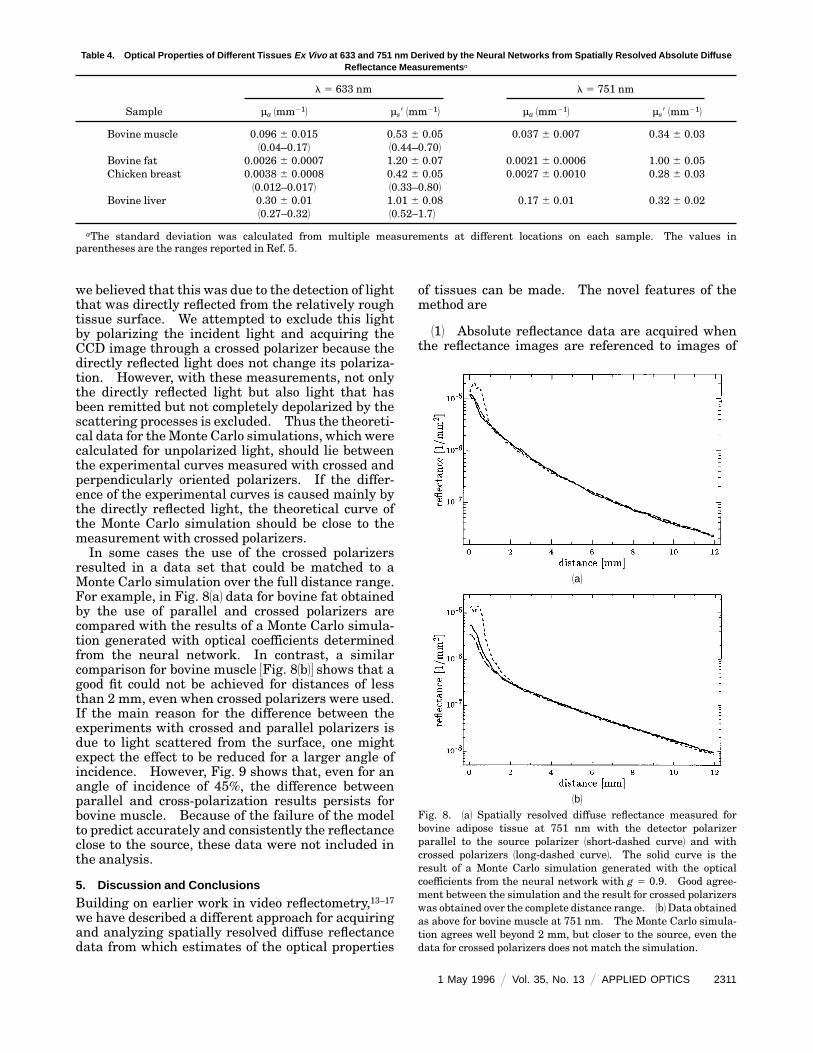
Table 4. Optical Properties of Different Tissues Ex Vivo at 633 and 751 nm Derived by the Neural Networks from Spatially Resolved Absolute DiffuseReflectance Measurements a
Sample
l 5 633 nm l 5 751 nm
µa 1mm212 µs8 1mm212 µa 1mm212 µs8 1mm212
Bovine muscle 0.096 6 0.015 0.53 6 0.05 0.037 6 0.007 0.34 6 0.0310.04–0.172 10.44–0.702
Bovine fat 0.0026 6 0.0007 1.20 6 0.07 0.0021 6 0.0006 1.00 6 0.05Chicken breast 0.0038 6 0.0008 0.42 6 0.05 0.0027 6 0.0010 0.28 6 0.03
10.012–0.0172 10.33–0.802Bovine liver 0.30 6 0.01 1.01 6 0.08 0.17 6 0.01 0.32 6 0.02
10.27–0.322 10.52–1.72
aThe standard deviation was calculated from multiple measurements at different locations on each sample. The values inparentheses are the ranges reported in Ref. 5.
we believed that this was due to the detection of lightthat was directly reflected from the relatively roughtissue surface. We attempted to exclude this lightby polarizing the incident light and acquiring theCCD image through a crossed polarizer because thedirectly reflected light does not change its polariza-tion. However, with these measurements, not onlythe directly reflected light but also light that hasbeen remitted but not completely depolarized by thescattering processes is excluded. Thus the theoreti-cal data for theMonte Carlo simulations, which werecalculated for unpolarized light, should lie betweenthe experimental curves measured with crossed andperpendicularly oriented polarizers. If the differ-ence of the experimental curves is caused mainly bythe directly reflected light, the theoretical curve ofthe Monte Carlo simulation should be close to themeasurement with crossed polarizers.In some cases the use of the crossed polarizers
resulted in a data set that could be matched to aMonte Carlo simulation over the full distance range.For example, in Fig. 81a2 data for bovine fat obtainedby the use of parallel and crossed polarizers arecompared with the results of a Monte Carlo simula-tion generated with optical coefficients determinedfrom the neural network. In contrast, a similarcomparison for bovine muscle 3Fig. 81b24 shows that agood fit could not be achieved for distances of lessthan 2 mm, even when crossed polarizers were used.If the main reason for the difference between theexperiments with crossed and parallel polarizers isdue to light scattered from the surface, one mightexpect the effect to be reduced for a larger angle ofincidence. However, Fig. 9 shows that, even for anangle of incidence of 45%, the difference betweenparallel and cross-polarization results persists forbovine muscle. Because of the failure of the modelto predict accurately and consistently the reflectanceclose to the source, these data were not included inthe analysis.
5. Discussion and Conclusions
Building on earlier work in video reflectometry,13–17we have described a different approach for acquiringand analyzing spatially resolved diffuse reflectancedata from which estimates of the optical properties
of tissues can be made. The novel features of themethod are
112 Absolute reflectance data are acquired whenthe reflectance images are referenced to images of
1a2
1b2
Fig. 8. 1a2 Spatially resolved diffuse reflectance measured forbovine adipose tissue at 751 nm with the detector polarizerparallel to the source polarizer 1short-dashed curve2 and withcrossed polarizers 1long-dashed curve2. The solid curve is theresult of a Monte Carlo simulation generated with the opticalcoefficients from the neural network with g 5 0.9. Good agree-ment between the simulation and the result for crossed polarizerswas obtained over the complete distance range. 1b2Data obtainedas above for bovine muscle at 751 nm. The Monte Carlo simula-tion agrees well beyond 2 mm, but closer to the source, even thedata for crossed polarizers does not match the simulation.
1 May 1996 @ Vol. 35, No. 13 @ APPLIED OPTICS 2311

the incident beam. Other investigators have reliedon relative reflectance data12,13 or have made anauxiliary measurement of the total diffuse reflec-tance relative to a standard.15
122 Aneural network is used to extract the opticalproperties from the reflectance data. The networkwas trained with data fromMonte Carlo simulationsso, in this sense, an exact implementation of theradiation transport equation is used rather than anapproximate model. To our knowledge, this is thefirst time a neural network trained with data fromMonte Carlo simulations had been used for determi-nation of the optical properties with reflectancemeasurements. When the neural network is used,the computation time needed for determination ofthe optical coefficients can be reduced by severalorders ofmagnitude comparedwith that for a conven-tional fit routine. The neural network could also betrained with experimental data if materials with anappropriate range of known optical properties wereavailable.
Regarding the first point, it is possible to train aneural network to use relative reflectance data 1i.e.,only the shape of the reflectance versus distancecurve2, and we have done this for a surface probe thatmimics a matched boundary.12 In the case of amismatched boundary, however, we found that thetraining errors for µt8 and µeff were ,12%, comparedwith 4% reported above for absolute reflectance data.Recalling that the rms errors associated with phan-toms were ,2.6% in µs8 and 14% in µa for absolutedata, we conclude that the uncertainty for relativemeasurements would be ,3 times larger and toohigh for many applications. As in the case ofmatched boundary conditions, this might be im-proved if points closer to the source were included.We found, however, that, for real tissues, transporttheory that did not include polarization-dependentscattering did not always provide an accurate descrip-
Fig. 9. Spatially resolved diffuse reflectance for bovine muscle at751 nm. Measurements were made with the beam incident at10° with parallel 1solid curve2 and crossed 1dotted curve2 polarizersand at 45° with parallel 1long-dashed curve2 and crossed 1short-dashed curve2 polarizers.
2312 APPLIED OPTICS @ Vol. 35, No. 13 @ 1 May 1996
tion of the reflectance close to the source, even whencrossed polarizers were used.In this study we have used a mirror to reflect the
incident beam into the camera so that it may becharacterized for themeasurement of absolute reflec-tance. An alternative approach would be to mea-sure the spatially resolved reflectance for a materialwith known optical properties. As long as the sourcecharacteristics remain unchanged, data obtained forunknownmaterials could then be referenced to thesedata at each distance. Training the neural networkon these ratios would be equivalent to using absolutereflectance values.We also demonstrated in this paper that diffusion
theory does not provide a sufficiently accurate calcu-lation of the absolute diffuse reflectance at distancesbetween 2 and 12 mm from the source if the refrac-tive index is not the same inside and outside theturbid medium. Again this is in contrast to ourprevious experience with a matched surface probe,12in which diffusion theory was adequate at distancesgreater than one transport mean-free path from thesource. This is also contrary to the experience ofJacques et al.,15 who used diffusion theory to analyzetheir measurements of spatially resolved as well astotal diffuse reflectance. Their analysis differed inthat Eq. 112 was also integrated over r to provide anexpression for the total diffuse reflectance. Be-cause a separate measurement of total diffuse reflec-tance was made, this additional information wasused to restrict the search for µa, µs8 to thosecombinations that yielded the correct total diffusereflectance. The combination chosenwas thatwhichgave the best agreement between Eq. 112 and thespatially resolved data. Jacques et al.15 did notstate specifically what distance range was used intheir fitting, but they did not include ‘‘data too closeto the point source.’’ Measurements were made ononly three phantoms, and rms errors of 3.6% in µaand 7.4% in µs8 were reported, compared with ourrms errors 1on a larger data set2 of 13.6% in µa and2.6% in µs8. It is interesting to note that Jacques etal.15 report larger errors in µs8 than in µa, whereasthe opposite was found in our study. A more com-plete comparison would be necessary to determine ifthis is characteristic of the two different methods.We assume that the separate measurement of thetotal diffuse reflectance by Jacques et al.15 mustcontribute substantially to the accuracy of theirresults because, as shown above, reliance on thespatially resolved reflectance at some distance fromthe source as calculated by diffusion theory yieldspoor results.Because our method does not rely on diffusion
theory, in principle it can be applied to any combina-tion of µs8 and µa, although we have tested it onlyover the range 0.5 , µs8 , 2.5 mm21 and 0.002 ,µs8 , 0.1 mm21. Of course, there would be practicalproblems associated with reflectance measurementson highly absorbing tissues.Reasons for the disagreement between the theoreti-
cal values and the tissue experiments at smalldistances 1i.e., less than 2 mm2 from the incidentbeam could be
112 In the Monte Carlo simulations we assumethat g 5 0.9. If the anisotropy parameter is smallerthan this value, the reflectance at small distances isgreater 1see Fig. 42 and therefore the theoreticalcurves are closer to the experimental data.122 Because the disagreement is greater formuscle
than for fat, there might be light piping effects in thefibers of the muscle that are not described by thesimulations.
132 The assumption of the Lambertian distribu-tion causes an underestimation of R1r2 at small r 1seeFig. 32.
We are currently investigating a number of im-provements that would expand the potential of thistechnique. Although data close to the source werenot used in the analysis, saturation of the pixels thatcorrespond to these positions causes blooming in thedetector and limits the exposure time. It should bepossible to mask the CCD detector to avoid thisproblem. Simultaneousmultiwavelengthmeasure-ments could also be made by using a white-lightsource and a combination of beam splitters andfilters in the detector optics. We have also begun toextend the analysis to layered tissues, althoughpreliminary studies28 indicate that additional infor-mation, such as layer thickness, must be knownbefore reasonable estimates can be made of theoptical properties of the different layers.The method we have described avoids many of the
problems inherent in contact-probe measurements.Because a full two-dimensional map of reflectance isobtained, future studies will be aimed at assessingthe heterogeneity of real tissues and the impact ofsuch heterogeneity on the estimation of averageabsorption and scattering coefficients.
This research was supported by the NationalCancer Institute of Canada. Alwin Kienle is grate-ful for a doctoral scholarship from the GermanAcademic Exchange Service.
References1. M. S. Patterson, B. C. Wilson, and D. R. Wyman, ‘‘The
propagation of optical radiation in tissue. 1. Models ofradiation transport and their application,’’ Lasers Med. Sci. 6,155–168 119912.
2. M. S. Patterson, B. C. Wilson, and D. R. Wyman, ‘‘Thepropagation of optical radiation in tissue. 2. Optical prop-erties of tissues and resulting fluence distributions,’’ LasersMed. Sci. 6, 379–390 119912.
3. A. Ishimaru, Wave Propagation and Scattering in RandomMedia 1Academic, NewYork, 19782, Chaps. 7 and 9.
4. B. C. Wilson, ‘‘Measurement of tissue optical properties:methods and theory,’’ in Optical-Thermal Response of Laser-Irradiated Tissue, A. J. Welch, and M. J. C. van Gemert, eds.1Plenum, NewYork, 19952, pp. 233–274.
5. W. Cheong, S. A. Prahl, and A. J. Welch, ‘‘A review of theoptical properties of biological tissues,’’ IEEE J. QuantumElectron. 26, 2166–2185 119902.
6. J. W. Pickering, S. A. Prahl, N. van Wieringen, J. F. Beek,H. J. C. M. Sterenborg, and M. J. C. van Gemert, ‘‘Double-integrating-sphere system for measuring the optical proper-ties of tissue,’’Appl. Opt. 32, 399–410 119932.
7. A. Kienle, R. Hibst, and R. Steiner, ‘‘The use of a neuralnetwork and Monte Carlo simulations to determine theoptical coefficients with spatially resolved transmittancemea-surements,’’ in Laser-Tissue Interaction V, S. L. Jacques, ed.,Proc. SPIE 2134, 364–371 119942.
8. L. Lilge, T. How, and B. C.Wilson, ‘‘Miniature isotropic opticalfibre probes for quantitative light dosimetry in tissue,’’ Phys.Med. Biol. 38, 215–230 119932.
9. M. S. Patterson, B. Chance, and B. C. Wilson, ‘‘Time resolvedreflectance and transmittance for the noninvasive measure-ment of tissue optical properties,’’ Appl. Opt. 28, 2331–2336119892.
10. M. S. Patterson, J. D. Moulton, B. C. Wilson, K. W. Berndt,and J. R. Lakowicz, ‘‘Frequency-domain reflectance for deter-mination of the scattering and absorption properties of tis-sue,’’Appl. Opt. 30, 4474–4476 119912.
11. G. Yoon, D. N. Ghosh Roy, and R. C. Straight, ‘‘Coherentbackscattering in biological media: measurement and esti-mation of optical properties,’’Appl. Opt. 32, 580–585 119932.
12. T. J. Farrell, M. S. Patterson, and B. C. Wilson, ‘‘A diffusiontheory model of spatially resolved, steady-state diffuse reflec-tance for the noninvasive determination of tissue opticalproperties in vivo,’’ Med. Phys. 19, 879–888 119922.
13. R. A. Bolt and J. J. ten Bosch, ‘‘Method for measuringposition-dependent volume reflection,’’ Appl. Opt. 32, 4641–4645 119932.
14. R.A. Bolt and J. J. ten Bosch, ‘‘On the determination of opticalparameters for turbid materials,’’ Waves Random Media 4,233–242 119942.
15. S. L. Jacques, A. Gutsche, J. Schwartz, L. Wang, and F. K.Tittel, ‘‘Video reflectometry to extract optical properties oftissue in vivo,’’ in Medical Optical Tomography: FunctionalImaging andMonitoring,G. Mueller, B. Chance, R. R. Alfano,S. R. Arridge, J. Beuthan, E. Gratton, M. Kaschke, B. R.Masters, S. Svanberg, and P. van der Zee, Vol. ISII of SPIEInstitute Series 1Society of Photo-Optical InstrumentationEngineers, Bellingham, Wash., 19932, pp. 211–226.
16. R. Splinter, G. A. Nanney, L. Littmann, C. H. Chuang, R. H.Svenson, J. R. Tuntelder, and G. P. Tatsis, ‘‘Monitoring tissueoptical characteristics in situ using a CCD camera,’’ LaserLife Sci. 6, 15–25 119942.
17. M. Dogariu and T. Asakura, ‘‘Reflectance properties of finite-size turbid media,’’Waves RandomMedia 4, 429–439 119942.
18. A. Kienle, ‘‘Lichtausbreitung in biologischem Gewebe,’’ Ph.Ddissertation 1University of Ulm, Germany, 19942.
19. T. J. Farrell, B. C. Wilson, and M. S. Patterson, ‘‘The use of aneural network to determine tissue optical properties fromspatially resolved diffuse reflectance measurements,’’ Phys.Med. Biol. 37, 2281–2286 119922.
20. B. C. Wilson and G. Adam, ‘‘A Monte Carlo model for theabsorption and flux distribution of light in tissue,’’Med. Phys.10, 824–830 119832.
21. L. Wang and S. L. Jacques, Monte Carlo Modeling of LightTransport in Multi-Layered Tissues in Standard C 1AndersonCancer Center, University of Texas M. P. Anderson CancerCenter, Houston, Texas, 19922.
22. F. P. Bolin, L. E. Preuss, R. C. Taylor, and R. J. Ference,‘‘Refractive index of some mammalian tissue using a fiberoptic cladding method,’’Appl. Opt. 28, 2297–2303 119892.
23. L. G. Henyey and J. L. Greenstein, ‘‘Diffuse radiation ingalaxy,’’Astrophys. J. 93, 70–83 119412.
24. L. R. Poole, D. D. Venable, and J. W. Cambell, ‘‘SemianalyticMonte Carlo radiative transfer model for oceanographic lidarsystems,’’Appl. Opt. 20, 3653–3656 119812.
1 May 1996 @ Vol. 35, No. 13 @ APPLIED OPTICS 2313

25. D. R. Wyman, M. S. Patterson, and B. C. Wilson, ‘‘Similarityrelations for anisotropic scattering in Monte Carlo simula-tions of deeply penetrating neutral particles,’’ J. Comput.Phys. 81, 137–150 119892.
26. B. C. Wilson, M. S. Patterson, and B.W. Pogue, ‘‘Instrumenta-tion for in vivo tissue spectroscopy and imaging,’’ in MedicalLasers and Systems II, D. M. Harris, C. M. Penney, and A.Katzir, eds., Proc. SPIE 1892, 132–147 119932.
27. J. B. Fishkin, P. T. C. So, A. E. Cerussi, S. Fantini, M. A.
2314 APPLIED OPTICS @ Vol. 35, No. 13 @ 1 May 1996
Franceschini, and E. Gratton, ‘‘Frequency-domain method formeasuring spectral properties in multiple-scattering media:methemoglobin absorption spectrum in a tissuelike phan-tom,’’Appl. Opt. 34, 1143–1155 119952.
28. A. Kienle, L. Lilge, M. S. Paterson, B. C. Wilson, R. Hibst, andR. Steiner, ‘‘Investigation of multi-layered tissue with in vivoreflectance measurements,’’ in Photon Transport in HighlyScattering Tissue, S. Avrillier, B. Chance, G. J. Mueller, A. V.Priezzhev, and V. V. Tuchin, eds., Proc. SPIE 2326, 212–221119942.
Copyright © 2022 FDOKUMEN