Spatial Distribution of Shear Wave Velocity for Late Quaternary Alluvial Soil
19
ORIGINAL PAPER Spatial Distribution of Shear Wave Velocity for Late Quaternary Alluvial Soil of Kanpur City, Northern India Sambit Prasanajit Naik • Nihar Ranjan Patra • Javed N. Malik Received: 18 December 2012 / Accepted: 12 September 2013 Ó Springer Science+Business Media Dordrecht 2013 Abstract Empirical correlation between standard penetration resistance (SPT-N) and shear wave veloc- ity measured by seismic downhole techniques are prepared of the alluvial soil of quaternary age for the Kanpur city. The Kanpur city is having seismic threat from Himalaya and it falls in seismic zone III according to seismic zones of India. Standard pene- tration test as well seismic downhole test has been carried out up to 30 m at twelve different locations of Kanpur city. The measured SPT-N values and shear wave velocity values are used to develop empirical correlation between SPT-N and shear wave velocity. The proposed correlations have been compared with the existing regression equations by various other investigators. It is found that the proposed correlation exhibit good performance (10 % error bar). Also the measured shear wave velocity has been used to prepare spatially distributed contour map of 50, 75 and 100 m/s using ArcGIS-9 software. It is observed that the shear wave velocity values for the northern part of Kanpur city vary from 125 to 825 m/s. In southern part, it is varying from 125 to 500 m/s where as in the central part of the city the shear wave velocity varies from 125 to 375 m/s. The eastern part of the city also shows some variation in shear wave velocity which ranges from 250 to 625 m/s. The western part of the city shows the variation of shear wave velocity from B125 to 500 m/s. The soil type of the study area are classified as per NEHRP and new Italian O.P.M.C classification system as B, C and D type soil with having site period of 0.1–0.9 s and Poisson’s ratio varying from 0.1 to 0.4. Keywords Alluvial soil Shear wave velocity Standard penetration test HFT Spatial distribution Site period List of symbols SPT-N Standard penetration resistance V s Shear wave velocity r Regression coefficient GSI Geological Survey of India PWD Public Work Department CPWD Central Public Work Department ASTM American Standard for Testing Material 1 Introduction Shear wave velocity (V s ) propagation during an earth- quake is strongly controlled by the unconsolidated sediments like those found in alluvial deposits overlying S. P. Naik N. R. Patra (&) J. N. Malik Department of Civil Engineering, Indian Institute of Technology, Kanpur 208016, Uttar Pradesh, India e-mail: [email protected] S. P. Naik e-mail: [email protected] J. N. Malik e-mail: [email protected] 123 Geotech Geol Eng DOI 10.1007/s10706-013-9698-3
Transcript of Spatial Distribution of Shear Wave Velocity for Late Quaternary Alluvial Soil

ORIGINAL PAPER
Spatial Distribution of Shear Wave Velocity for LateQuaternary Alluvial Soil of Kanpur City, Northern India
Sambit Prasanajit Naik • Nihar Ranjan Patra •
Javed N. Malik
Received: 18 December 2012 / Accepted: 12 September 2013
� Springer Science+Business Media Dordrecht 2013
Abstract Empirical correlation between standard
penetration resistance (SPT-N) and shear wave veloc-
ity measured by seismic downhole techniques are
prepared of the alluvial soil of quaternary age for the
Kanpur city. The Kanpur city is having seismic threat
from Himalaya and it falls in seismic zone III
according to seismic zones of India. Standard pene-
tration test as well seismic downhole test has been
carried out up to 30 m at twelve different locations of
Kanpur city. The measured SPT-N values and shear
wave velocity values are used to develop empirical
correlation between SPT-N and shear wave velocity.
The proposed correlations have been compared with
the existing regression equations by various other
investigators. It is found that the proposed correlation
exhibit good performance (10 % error bar). Also the
measured shear wave velocity has been used to
prepare spatially distributed contour map of 50, 75
and 100 m/s using ArcGIS-9 software. It is observed
that the shear wave velocity values for the northern
part of Kanpur city vary from 125 to 825 m/s. In
southern part, it is varying from 125 to 500 m/s where
as in the central part of the city the shear wave velocity
varies from 125 to 375 m/s. The eastern part of the city
also shows some variation in shear wave velocity
which ranges from 250 to 625 m/s. The western part of
the city shows the variation of shear wave velocity
from B125 to 500 m/s. The soil type of the study area
are classified as per NEHRP and new Italian O.P.M.C
classification system as B, C and D type soil with
having site period of 0.1–0.9 s and Poisson’s ratio
varying from 0.1 to 0.4.
Keywords Alluvial soil � Shear wave velocity �Standard penetration test � HFT � Spatial
distribution � Site period
List of symbols
SPT-N Standard penetration resistance
Vs Shear wave velocity
r Regression coefficient
GSI Geological Survey of India
PWD Public Work Department
CPWD Central Public Work Department
ASTM American Standard for Testing Material
1 Introduction
Shear wave velocity (Vs) propagation during an earth-
quake is strongly controlled by the unconsolidated
sediments like those found in alluvial deposits overlying
S. P. Naik � N. R. Patra (&) � J. N. Malik
Department of Civil Engineering, Indian Institute of
Technology, Kanpur 208016, Uttar Pradesh, India
e-mail: [email protected]
S. P. Naik
e-mail: [email protected]
J. N. Malik
e-mail: [email protected]
123
Geotech Geol Eng
DOI 10.1007/s10706-013-9698-3

hard rock terrain (Kramer 1996). It is well known that a
river site is the most favorable site for human settlement.
Due to this reason site response analysis for such sites is
an important component of the seismic design in those
sites. Moreover Vs offers a promising tool for ground
response analysis in cases where there is a lack of
availability of sufficient in situ data as conducting tests
in inaccessible locations is not possible. The present
study area is situated in the Indo-Gangetic plain and
comes under seismic zone III as per the Indian Standard
code (IS 1983Part-I 2002). The study area can face
seismic hazards due to the occurrence of far source
earthquakes in the Himalayan Frontal Fault system. In
India such studies are only confined to metropolitan
cities like Kolkata, Chennai, Mumbai, and Bangalore
(Uma et al. 2010; Boominathan et al. 2011; Rao and
Satyam 2007; Sitharam and Anbazhagan 2008; Mhaske
and Choudhury 2011). 1803 earthquake of Gharwal
Himalaya (MW 7.5) affected buildings, archeological
monuments like QutbMinar in Delhi, long standing
temple at Bhitargaon, 27 km away from Kanpur
(Rajendran and Rajendran 2005). Also this earthquake
caused damages to the oscillations in houses, roof
collapse in cities like Agra, Mathura, Delhi and Aligarh,
Kanauj (Rajendran and Rajendran 2005). So any
earthquake of more than magnitude 7 in and near
Kumaun Himalaya can affect the buildings, monuments
due to liquefaction, shaking etc. within a range of
400 km radius area from epicenter. Figure 1 shows the
epicentral distance of 1803 earthquake. Since Kanpur is
situated within a range of 300 km of epicentral distance
of Himalayan earthquake, it is essential to study the
seismic hazards and its effect on Kanpur city shown in
Fig. 1. Several correlations between both uncorrected
and corrected SPT-N value and Vs are reported by (Seed
and Idriss 1981; Sykora and Stokoe 1983; Jinan 1987;
Lee 1990; Mayne and Rix 1995; Kiku et al. 2001;
Hasancebi and Ulusay 2007; Dikmen 2009). In India
also many attempts have been made for the correlation
of Standard penetration resistance and Shear wave
velocity. Uma et al. (2010) and Boominathan et al.
(2011) had determined the shear wave velocity for
Fig. 1 The epicentral zones of Major Historical Himalayan
earthquake. Black dotted line which shows Isosesimal zone of
1803 earthquake which includes cities like Kanpur, Banaras,
Delhi, Mathura, Lucknow, Aligarh, Agra. (After Rajendran and
Rajendran 2005)
Geotech Geol Eng
123

Chennai. Sitharam and Anbazhagan (2008) have done
similar work for Bangalore. Hanumanthrao and Ram-
anna (2008) had also studied the variation of shear wave
velocity for Delhi, India. However, the methodology
adopted for determination of shear wave velocity
includes a lot of approximation Gulerce (2010). The
SPT and Shear wave velocity data measured in the same
depth in same borehole will give more accurate
correlation than the SPT values and shear wave velocity
determined from different locations Gulerce (2010). To
minimize the approximation in data collection and
calculation of shear wave velocity, the measurement of
SPT-N values and shear wave velocity have been
collected from the same depths and same boreholes.
There is no site characterization study has been carried
out before for the study area. There is no correlation
between SPT-N and shear wave velocity is available in
any literature for Kanpur city. Also, a complete shear
wave velocity profile map for the Kanpur city is still
unavailable. In the present study an attempt has been
made to prepare the shear wave velocity profile map
along with correlation between SPT-N and Shear wave
velocity with 10 % error bar for Kanpur city. Also by
using the measured shear wave velocity, seismic site
classification based on NEHRP and NEW Italian
O.P.M.C. n classification system for the alluvial soil of
Kanpur city has been carried out. The shear wave
velocities were used for the estimation of site period of
the soil of study area.
2 Geological Setting of the Study Area
Kanpur is the largest industrial city of India. It is
having 450 km2 with an approximate population of 3
million inhabitants in its area. It lies between
26.4583�N, 80.3173�E within the Indo-Gangetic
Plain. The base map of the study area is given in
Fig. 2. The general geology of the study area is
mainly sand, silt and clay deposits of Ganga, Yamuna
and Pandu River (Tripathi 2009). The Kanpur city
composed of alluvial formation of Lower Pleistocene
to Recent Deposits. Broadly the geology of the
Kanpur region is divided into two parts, the older
alluvium and the recent alluvium with Kankar. The
recent alluvial deposits are found in Upper
Fig. 2 The geological map
of the study area showing
predominance of Alluvial
deposits along with the
locations where of SPT-N
and seismic downhole tests
Geotech Geol Eng
123

Pleistocene to recent period mostly occurring along
the course of rivers. The older alluviums, alluvial
deposit mostly occurring in the central part were
deposited during lower to upper Pleistocene period.
Though Kanpur city is having alluvial deposits and
drained by two major river systems of World, the
water table is shallow. It varies from 2 to 15 m. In
monsoon season, along the course of river water table
lies at the surface level itself.
3 Methodology
The shear wave velocity for the top 30 m (Vs30) soil
deposits is mostly widely used parameter for the site
amplification studies due to ground shaking. It is also
one of the important parameter for the site character-
ization of sites having thick soil deposits with flat
topography (Holzer et al. 2005, Kanlı et al. 2006).
Therefore, boreholes were drilled at twelve locations
up to a depth of 30 m. The SPTs were carried out at
1.5 m interval up to 30 m depth as per Indian Standard
IS-2131 (1981). Disturbed and undisturbed soil sam-
ples were collected from each borehole at 1.5 m depth
intervals. Eight borehole data were collected from
Central Public Works Department (CPWD), Lucknow
and Public work Department, Kanpur (PWD). Fig-
ure 2 shows the locations of boreholes for this study.
Typical soil profile of study area from Mandhana,
Sirhi-Itara, Karibgawn, Ramaipur and Panki sites are
shown in Fig. 3. The groundwater table in the study
area is shallow and varies between 2 and 15 m. The
area contains mainly alluvial soil deposits. The
undisturbed soil specimens extracted from boreholes
were tested in the laboratory to determine the grain
size distribution and Atterberg limits as per the ASTM
code (ASTM D4318-10 2010). The detailed soil
classification of Kanpur region shows the soil deposits
of the region constitutes 30–90 % silt, 2–99 % sand
and 2–50 % clay fraction. The gravel content is
0–11 %. The specific gravity varies from 2.62 to 2.72.
The compression index values ranges from 0.01 to
0.60. The cohesion value ranges from 0.1 to 2 kg/cm2
and the angle of friction ranges from 0 to 40 degrees.
Typical geotechnical classification for Naramau site is
given in Table 1. The data from the bore log indicates
that the alluvial tract generally contains silty sand with
some patches of loose to stiff clay layer and sandy
layer. The soil specimens are classified as ML, CL, CI
and SP according to Unified Soil Classification System
(ASTM D 2487-83-04-08 1985).
In the present study, the seismic downhole tech-
nique has been used to measure in situ compression
and shear wave velocity profiles of soil. The seismic
downhole test is the most simple and cost effective
surface wave method to estimate the shear wave
velocity (Kamil 1996). Like other surface wave
method it also involves three steps: field setup,
acquisition and construction of velocity versus time
curve and calculation of shear wave velocity profile.
The seismic downhole test was carried out as per the
American Standard for Testing Material for the
downhole test ASTM D 4428, ASTM 7400-9463
(2007, 2008). The borehole depth was 30 m from the
ground surface. CS/DS-1 Model of seismic downhole
equipment supplied by Olson Instruments. Inc, USA
were used for measurement of shear wave velocity of
the alluvial soil deposits of Kanpur city. In this present
study, the triaxial geophone was lowered to the desired
depth of measurement. The sources for the measure-
ment were generated at the surface by hitting a
hammer in wooden plank which has been attached to
the accelerometer with it to generate shear and
compressional waves at desired depth where the
geophone is located. The three component geophones
are separated 4 cm and lowered together downhole.
The generated shear and compressional wave were
recorded by the geophone and collected by the
Freedom data PC attached to the geophone. The
Freedom data pc was connected to the triaxial
geophone by means of three phase channel system.
Readings were taken at a constant depth interval of
1.5 m in each borehole up to a depth of 30 m. The
spacing between the borehole and the source was
2–3 m (Hunter et al. 2002). The vertical component of
the receiver is used to capture the vertically propagat-
ing compressional waves (P) and the radial transverse
component senses the horizontally polarized shear
wave (SH). Figure 4 illustrates the picking of shear
wave and compressional wave from the seismic
downhole test by Olson Instruments Freedom Data
PC showing the aforementioned record. Channel 5 is
the vertical component of the three component
geophone, which is measuring the vertically polarized
shear wave energy. Channels 6 and 7 are the radial and
transverse components, respectively, and they mea-
sure the compressional wave energy. Typically, the
radial component is aligned with the source and is thus
Geotech Geol Eng
123

used to measure the arrival of the compressional wave
more accurately. Channel 8 is the trigger component
from the P-SV source for timing. The arrival times of
the shear wave energy were picked by the 1st split in
polarization of the waves (Fig. 4b and it is the
transverse component of the data collected in the
Fig. 3 Typical borelog showing the soil profile with water table of the study are a Mandhana, b Karibgawn, c Sirhi-Itara, d Ramaipur
and e Panki. The diagram shows the depth of water table and the abundance of alluvial soil
Geotech Geol Eng
123

Ta
ble
1T
yp
ical
geo
tech
nic
also
ilcl
assi
fica
tio
nfo
rN
aram
auS
ite,
Kan
pu
rci
ty
Dep
th
(m)
SP
T-N
Vs
(m/s
)
Den
sity
(KN
/m3)
Sp
ecifi
c
gra
vit
y
Gra
vel
%
([4
.75
mm
)
San
d%
(4.7
5–
0.0
75
mm
)
Sil
t%
(0.0
02
–0
.07
5m
m)
Cla
y%
(\0
.00
2m
m)
LL
PL
PI
/(�
)C
(kg
/cm
2)
Gro
up
sym
bo
l
1.5
01
02
35
18
.30
2.6
60
.95
41
8.4
80
.20
31
.52
5.8
6.6
51
.10
24
.7M
L
31
42
39
18
.30
2.6
61
6.9
56
4.0
61
.71
41
.53
1.9
13
.21
.23
27
.0M
L
4.5
01
42
36
17
.90
2.6
8–
–3
3.3
54
.13
6.8
22
.91
5.8
0.3
01
0.8
CL
61
72
69
17
.50
2.6
50
.38
32
.26
8.3
–3
5.8
24
.96
.86
1.5
12
3.4
ML
7.5
21
31
01
8.8
02
.65
0.3
93
5.8
65
.3–
40
26
.01
12
1.5
02
3.2
ML
91
73
00
16
.90
2.6
93
06
04
.36
37
25
17
1.4
4.1
CI
10
.52
02
67
16
.90
2.6
70
.17
22
91
0–
––
––
SM
12
17
25
41
92
.67
0.6
81
19
0–
––
––
SM
13
.52
42
78
21
.40
2.6
70
90
91
.5–
––
––
SM
15
19
25
71
9.5
02
.67
08
31
70
.2–
––
––
SM
16
.52
02
76
19
.60
2.6
70
.18
21
80
.2–
––
––
SM
18
18
24
71
9.6
82
.67
8.3
68
1.4
10
––
––
––
S
19
.51
72
41
20
.34
2.6
42
.99
11
.8–
––
––
–S
21
15
23
51
9.8
62
.64
57
39
28
18
––
––
–G
P
22
.51
42
31
21
.08
2.6
91
65
5–
28
––
––
–S
M
24
18
22
72
1.4
72
.67
0.3
97
––
––
––
–S
25
.51
72
22
21
.67
2.6
40
.17
22
62
––
––
–S
27
19
24
02
1.4
22
.67
33
77
––
––
––
–S
M
28
.51
72
51
20
.50
2.6
42
47
6–
––
––
––
S
30
17
25
61
9.6
22
.64
4.0
39
5.1
1.0
2–
––
––
–S
Geotech Geol Eng
123

field. The arrivals of compressional wave energy were
picked by the 1st break, positive or negative at a given
depth.
The travel time of the body waves (S- and P-waves)
between each geophone and the source were recorded
by the Freedom data pc. The maximum shear and
compression wave velocities (i.e., Vs and VP) of all soil
layers were determined from the recorded data using the
WinGeo-2.3 software. In the present study the direct
method was adopted for the interpretation of downhole
seismic data as reported by Batsila (1995) and Auld
(1977). By the direct method, the picked time for the
shear wave was first calculated and then the shear wave
velocity was calculated. Typical test results showing the
variation of shear wave velocity and SPT-N with depth
for sites of the city namely for Mandhana, Sirhi-Itara,
Karibgawn and Ramaipur are shown in Fig. 5. Figure 5
indicates that a very good correlation between SPT-N
and Vs exists for all sites except Karibgawn site where it
shows wide deviation of SPT-N and Vs. For Karibgawn
site also the shear wave velocity profile follows the same
trend as obtained for other sites. However, the variation
is due to presence of older alluvium.
The shear wave velocity profile of the study area
follows the lithological boundary of the soil profile to
study the effect of lithological boundaries. The typical
diagram showing the variation of shear wave velocity
with litholgical boundary of Kanpur soil (for Panki,
Sirhi-Itara and Karibgawn site) is shown in Fig. 6. In
Fig. 6b it shows the shear wave velocity decreases at a
depth of 8–20 m. This may be due to the presence of
saturated clay layer. Similarly for Fig. 6a lower values
of Vs are observed for the soil layer at depths 11–22 m.
Saturated clayey soil layer is present at depths of
11–22 m, below the water table which is overlying and
underlying by silty layers with high percentage of
Kankar. This may be the reason for recorded lower Vs
values at depths 11–22 m.
4 Correlation Between SPT-N and Shear Wave
Velocity (VS)
It is always gives better estimation of shear wave
velocity from field experiments but it is not always
economically feasible to make experimental collection
of Vs at all locations. For the effective use of the bore log
data available statistical correlation between SPT-N
(both corrected and uncorrected) and Vs developed by
the authors for three categories of soils for the Kanpur
city. In this study 120 data pairs are used for developing
the correlation for all soil, silty soil and clayey soil.
Correlation for sandy soil cannot be developed in the
study area because of very low number of data available
for sandy soil. The proposed correlation using the
uncorrected SPT-N for Kanpur soil is given in Eqs. 1, 2
and 3 for all soil, silty soil and clay soil.
Fig. 4 a Diagram showing the Screen shot of Olson Instru-
ments Freedom Data PC during the processing of data collected
from field for a seismic downhole test. b Shows the split in 1st
polarized shear waves during the processing of seismic
downhole data
Geotech Geol Eng
123

Fig. 5 Variation in
shearwave velocity and
SPT-N valuue with depth
from some of the locations
of Kanpur city a Mandhana,
b Sirhi-Itara, c Ramaipur
and d Karibgawn
Geotech Geol Eng
123

Vs ¼ 78:46N0:390 r2 ¼ 0:898� �
for all soil ð1Þ
Vs ¼ 84:08N0:368 r2 ¼ 0:866� �
for silty soil ð2Þ
Vs ¼ 81:18N0:377 r2 ¼ 0:927� �
for clay soil ð3Þ
The relationship between Vs and uncorrected SPT-
N with the coefficient of regression for all soil, silty
soil and clay soil is shown in Fig. 7.
Similarly, correlation between corrected SPT-N
and shear wave velocity has been developed for the
same soil and given in equation 4, 5 and 6.
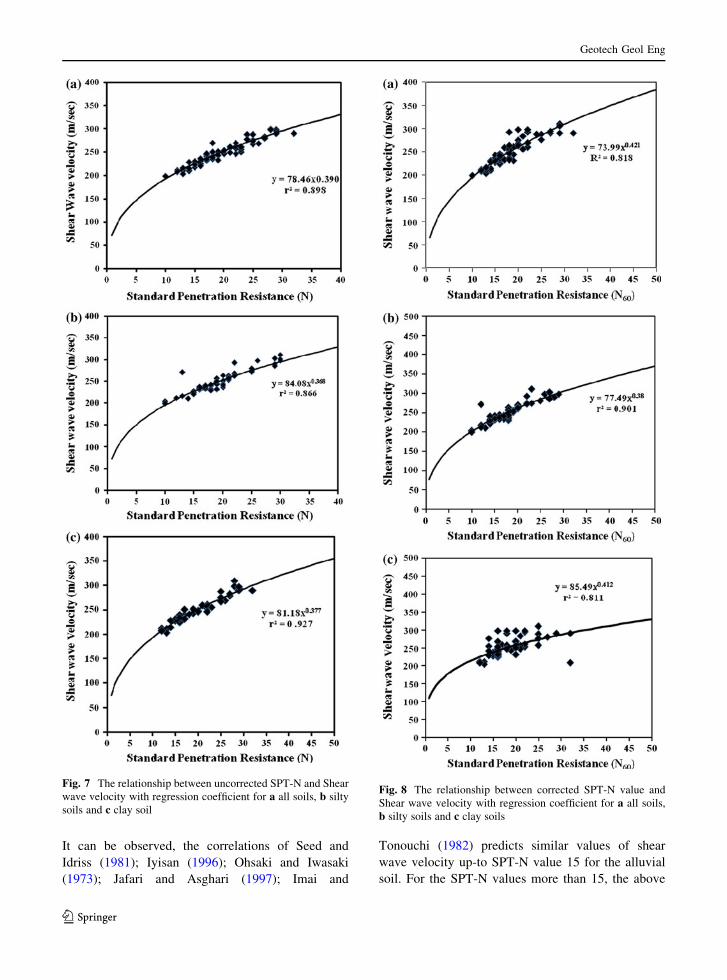
Vs ¼ 73:53N0:40060 r2 ¼ 0:884
� �for all soil ð4Þ
Vs ¼ 77:49N0:3960 r2 ¼ 0:901� �
for silty soil ð5Þ
Vs ¼ 85:49N0:41260 r2 ¼ 0:811
� �for clay soil ð6Þ
The SPT-N has been corrected for overburden
pressure, hammer energy, borehole diameter, rod
length, water table correction according to Youd
et al. (2001). The parameter taken for the correction of
SPT-N is the penetration value, water table and
hammer type. In this present study, only attention is
given to use functional form to correlate Vs to N60.
Nearly all published correlations between SPT-N and
Shear wave velocity consider only Vs to N60 without
considering the effect of vertical effective stress
including most recent one by Dikmen (2009), Has-
ancebi and Ulusay (2007), Uma et al. (2010),
Anbazhagan et al. (2013). Also Sykora and Stokoe
(1983) evaluated Vs as a function of (N1)60 and found
poor correlation and suggested correlating with N60
instead. So the present study also uses only N60 instead
of N160. The corrected SPT-N and shear wave velocity
correlation with regression coefficient is shown in
Fig. 8.
4.1 Comparison of the Present Correlation
with the Reported Correlations
The developed correlations between the shear wave
velocity and uncorrected SPT-N values for all soil, for
silty soil and for clay soil are plotted with the available
correlations reported by others (Table 2) and are
shown in Fig. 9.
In Fig. 9a, the developed correlation and the
available correlations are plotted for ‘‘all type soil’’.
Fig. 6 Typical diagram showing the variation of shear wave velocity with lithology for Panki, Sirhi-Itara and Karibgawn site of
Kanpur region
Geotech Geol Eng
123
It can be observed, the correlations of Seed and
Idriss (1981); Iyisan (1996); Ohsaki and Iwasaki
(1973); Jafari and Asghari (1997); Imai and
Tonouchi (1982) predicts similar values of shear
wave velocity up-to SPT-N value 15 for the alluvial
soil. For the SPT-N values more than 15, the above
Fig. 7 The relationship between uncorrected SPT-N and Shear
wave velocity with regression coefficient for a all soils, b silty
soils and c clay soil
Fig. 8 The relationship between corrected SPT-N value and
Shear wave velocity with regression coefficient for a all soils,
b silty soils and c clay soils
Geotech Geol Eng
123

correlations predict higher shear wave velocity. The
correlations of Kiku et al. (2001) and Fujiwara
(1972) predicts lower shear wave velocity values for
SPT-N values of 10 for the alluvial soil. All the other
correlations listed in Table 1 including the proposed
correlation are giving more or less similar shear
wave velocity values.
Similarly comparisons are made for ‘‘silty soil’’ and
‘‘clayey soil’’. For SPT-N values 10 or more than 10,
correlations of Lee (1990); Kamil (1996) and Pitilakis
et al.(1999) predict lower values of Vs for silty soil and
for SPT-N values more than 10 these correlations
predicts more or less similar shear wave velocity. For
SPT-N value 20 or more than 20 correlations given by
Jafari and Asghari (1997) predicts higher shear wave
velocity in comparison to the predicted correlations in
the present study. Similarly for SPT-N\20, it predicts
lower values of shear wave velocity than the predicted
correlations in the present study. The comparison of
reported correlations and present study for silty soil
shown in Fig. 9b. Except these reported correlations
all other correlations listed in Table 2 predicts similar
values.
For clay soil, the correlations by Lee (1990);
Pitilakis et al. (1999) predict higher values of Vs for
SPT-N values more than 15 in comparison to the
values from the present correlation. Whereas Imai and
Tonouchi (1982); Hasancebi and Ulusay (2007)
predict lower values than the values from the present
correlation (Fig. 9c).
The developed correlations between the uncor-
rected SPT-N value and shear wave velocity for all
soils for other Indian cities have been compared with
the present correlation developed for Kanpur city
(Fig. 10). For SPT-N values more than 10, correlations
by Hanumanthrao and Ramanna (2008) and Sitharam
and Anbazhagan (2008) predict higher shear wave
velocity values whereas for SPT-N values more than
10, the correlations by Uma et al. (2010) and Mhaske
and Choudhury (2011) predict lower value of Vs.
The variation of shear wave velocity may be due to
the variation of the lithology, age of the soil and also
Table 2 Existing
correlation between SPT-N
and shear wave velocity Vs
Authors Shear wave velocity (m/s)
All soil Clay soil Silty soil
Kanai (1966) 19N0.6
Ohba and Toriumi (1970) 84N0.31 85N0.310
Imai and Yoshimura (1970) 76N0.36 –
Fujiwara (1972) 92.1N0.337 –
Ohsaki and Iwasaki (1973) 82N0.39 – 59N0.47
Imai and Yoshimura (1975) 92N0.329 –
Imai (1977) 91N0.317 80.2N0.292
Ohta and Goto (1978) 85.35N0.348 –
JRA (1980) – 100N0.33
Seed and Idriss (1981) 61N0.5 –
Imai and Tonouchi (1982) 97N0.314 –
Jafari and Asghari (1997) 22N0.85 27N0.730 22N0.77
Iyisan (1996) 51.5N0.516 –
Kiku et al. (2001) 68.3N0.292 –
Hasancebi and Ulusay (2007) 90N0.308 97.89N0.269
Uma et al. (2010) 95.64N0.301 89.31N0.358
Kamil (1996) – 175 ? 3.75N
Lee (1990) – 114.43N0.310 106N0.17
Pitilakis et al. (1999) – 132N600.271 160N0.170
Hanumanthrao and Ramanna (2008) 82.6N0.43
Sitharam and Anbazhagan (2008) 78N600.4
Mhaske and Choudhury (2011) 72N0.4
Geotech Geol Eng
123

due to site-specific studies for the prediction of shear
wave velocity from SPT-N.
A graph between the scaled percentage error and
cumulative frequency of all correlations including
proposed correlation has been plotted for all soil and
shown in Fig. 11. The scaled percentage error has
been calculated using the Eq. 7.
Scaled percentage error ¼ VsðPreÞ � VsðMesÞ=VsðMesÞ� 100
ð7ÞFrom the graph it is infer that the scaled percentage
error for Kanai (1966); Kiku et al.(2001); Ohba and
Toriumi (1970); Imai and Yoshimura (1975) is more
in comparison to the present study and shows error
margin of 0 to -60. Seed and Idriss (1981) and Jafari
and Asghari (1997)shows error margin of -20 to 40 %
which more than the scaled percentage error is for
present study. Uma et al. (2010); Iyisan (1996);
Fujiwara (1972); Hasancebi and Ulusay (2007) show
the error margin of ±15–20 % which is more than the
present study. The present study shows the 95 % of the
data shows the error margin of ±10 % for all soil of
Fig. 9 Comparison between the proposed correlation and reported correlations for a all soil, b silty soil and c clayey soil
Fig. 10 Comparison between the present study and the
reported correlations from India for all soil
Geotech Geol Eng
123
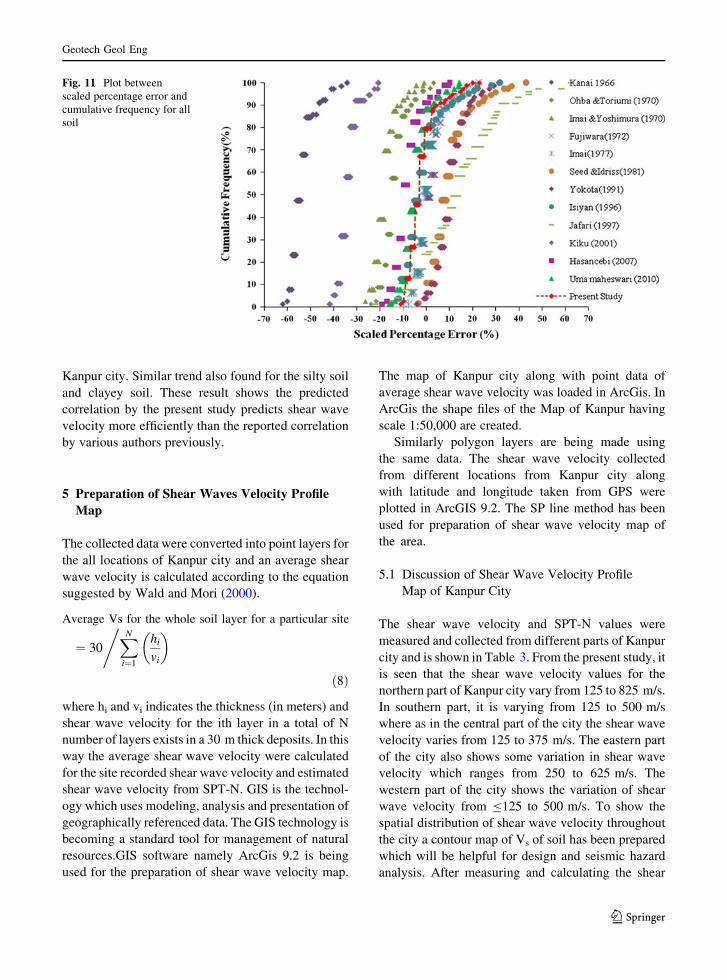
Kanpur city. Similar trend also found for the silty soil
and clayey soil. These result shows the predicted
correlation by the present study predicts shear wave
velocity more efficiently than the reported correlation
by various authors previously.
5 Preparation of Shear Waves Velocity Profile
Map
The collected data were converted into point layers for
the all locations of Kanpur city and an average shear
wave velocity is calculated according to the equation
suggested by Wald and Mori (2000).
Average Vs for the whole soil layer for a particular site
¼ 30
,XN
i¼1
hi
vi
� �
ð8Þ
where hi and vi indicates the thickness (in meters) and
shear wave velocity for the ith layer in a total of N
number of layers exists in a 30 m thick deposits. In this
way the average shear wave velocity were calculated
for the site recorded shear wave velocity and estimated
shear wave velocity from SPT-N. GIS is the technol-
ogy which uses modeling, analysis and presentation of
geographically referenced data. The GIS technology is
becoming a standard tool for management of natural
resources.GIS software namely ArcGis 9.2 is being
used for the preparation of shear wave velocity map.
The map of Kanpur city along with point data of
average shear wave velocity was loaded in ArcGis. In
ArcGis the shape files of the Map of Kanpur having
scale 1:50,000 are created.
Similarly polygon layers are being made using
the same data. The shear wave velocity collected
from different locations from Kanpur city along
with latitude and longitude taken from GPS were
plotted in ArcGIS 9.2. The SP line method has been
used for preparation of shear wave velocity map of
the area.
5.1 Discussion of Shear Wave Velocity Profile
Map of Kanpur City
The shear wave velocity and SPT-N values were
measured and collected from different parts of Kanpur
city and is shown in Table 3. From the present study, it
is seen that the shear wave velocity values for the
northern part of Kanpur city vary from 125 to 825 m/s.
In southern part, it is varying from 125 to 500 m/s
where as in the central part of the city the shear wave
velocity varies from 125 to 375 m/s. The eastern part
of the city also shows some variation in shear wave
velocity which ranges from 250 to 625 m/s. The
western part of the city shows the variation of shear
wave velocity from B125 to 500 m/s. To show the
spatial distribution of shear wave velocity throughout
the city a contour map of Vs of soil has been prepared
which will be helpful for design and seismic hazard
analysis. After measuring and calculating the shear
Fig. 11 Plot between
scaled percentage error and
cumulative frequency for all
soil
Geotech Geol Eng
123

wave velocity from developed correlations, the shear
wave velocity data were plotted on the shape file of
Kanpur city map with the help of ArcGIS 9.2 software.
To study the variation of shear wave velocity of
Kanpur city on micro, minor, and broad levels, the
spatially distributed contour maps of shear wave
velocity ‘Vs’ of soil for Kanpur city were plotted at an
intervals of 50, 75 % and 100 m/s. Figure 12 shows
the distribution of shear wave velocity with contour
interval of 50 m/s. It is found that the variation
contours of shear wave velocity are very close near
Bithoor (northern part of Kanpur) which may be due to
sudden change in soil type. The soil type of this region
is mainly silty soil, sand with calcrete/Kankar and
some patches of sand and clay layers. The water table
is shallow in this area. This area is very close to the
present channel of Ganga River. The presence of
sandy layer indicates the channel fill deposits of the
Table 3 Typical SPT-N
values with shear wave
velocity Vs of soil of some
of the locations of Kanpur
city
Locations Soil type Depth range of
borehole (m)
SPT-N
value
Measured shear
wave velocity
range (m/s)
Mandhana Silty sand 30 10–20 210–320
Naramau Silty sand 30 9–25 120–320
Panki Silty sand 30 12–28 150–400
Sirhi-Itara Sitly sand–sand–clay 30 10–31 200–300
Bakerganj Silty sand 30 6–30 200–300
Shambhua Clayey silt and sand 30 8–32 300–450
Ramaipur Silty sand 30 9–32 100–200
Karibgawn Clay–silty sand 30 12–35 200–300
Fig. 12 The contour map of shear wave velocity of interval 50 m/s for Kanpur city
Geotech Geol Eng
123

river where as the silty sand or clay type soil indicates
the flood plain deposits. This variation of soil layer
clearly tells us that the area is situated within a very
dynamic area in terms of fluvial dynamics. The
uncorrected SPT-N value for the northern part of
Kanpur city lies in between 5 and 40 with shear wave
velocity range more than 250 m/s. As a whole the
shear wave velocity of Kanpur city varies from 125 to
825 m/s. The contour map of interval 75 and 100 m/s
is shown in Figs. 13, 14 respectively.
6 Seismic Site Classifications and Site Period
Estimation of Kanpur City
The seismic site classification for the Kanpur city is
evaluated by NEHRP and new Italian O.P.C.M.n.3274/
2003 code of soil classification. The site classification
generally depends upon the geological setting and soil
thickness. According to classification the northern
part of the study area is showing higher shear wave
velocity ranges from 200 to 600 and classified as C,
and D type as per NEHRP site classification and B, C
type as per O.P.M.C site classification scheme. Higher
velocity areas (zone B and C) are shown by the
north and east part of the city which are situated near
the river bank where mostly soil type is sandy soil.
The central part and southern part of the soil
dominated by the silty and clayey soil of flood plain
deposits. The city will show moderate to low ampli-
fication according to NEHRP classification. Shear
wave velocity based classification of the soil of study
area is given in Table 4. The soil type will undergo
seismic damage during moderate to large magnitude
earthquakes.
6.1 Site Period Estimation of Kanpur Soil
First mode of vibration of the soil layer referred as site
period, one of the important parameter for seismic
microzonation. It is dependant of shear wave velocity
of the soil layer and thickness of the soil layer of the
study area. The site period is calculated by using the
expression given by Kramer (1996)
Ts ¼ 4H=Vs ð9Þ
Fig. 13 The contour map of shear wave velocity of interval 75 m/s for Kanpur city
Geotech Geol Eng
123

where, H is the total thickness of the alluvial sediments
and Vs is the average shear wave velocity of the
overburden soil. The site period calculated for the
alluvial soil using the shear wave velocity indicates
that the northern part is showing period of 0.1 s to
0.5 s where as the southern part shows 0.4–0.9. The
eastern and western part of the city shows 0.1–0.8 s.
The estimated site period indicates that the soil of the
city will undergo seismic damage. The site period of
some of the study area has been given in Table 4.
Although the soft silty clay and loose sandy deposits
are distributed in most part of the city, the observed
natural period is relatively low due to the fact that the
thickness of these deposits is relatively small and is
Fig. 14 The contour map of shear wave velocity of interval 100 m/s for Kanpur city
Table 4 NEHRP and new O.P.M.C Italian code of classification, Poisson’s ratio and site period of some of the sites of Kanpur soil
Locations Shear wave
velocity (m/s)
NEHRP
classification
O.P.M.C.n
classification
Poisson’s
ratio
Site
period (s)
IIT Kanpur 200–300 D C 0.3973 0.49
Mandhana 200–300 D C 0.3811 0.44
Naramau 200–300 D C 0.2575 0.26
Bithoor 500–700 C B 0.3239 0.27
Nankari 200–300 D C 0.3010 0.45
Panki 200–300 D C 0.2918 0.44
Army school 400–500 C B 0.2876 0.51
Shambhua 200–300 D C 0.2565 0.50
Dharmagandpur 200–300 D C 0.3127 0.43
Sirhi-Itara 200–300 D C 0.3011 0.54
Geotech Geol Eng
123

usually followed by relatively high velocity layers.
The natural period of the sites \0.6 s is the typical
period for shallow sediments (Dowrick 2003; Pitilakis
2004). Using the collected shear wave and compres-
sional wave velocity using seismic down hole test for
the alluvial soil of Kanpur were been used for the
estimation of Poisson’s Ratio coefficient of alluvial
soil. The effect of water table on Poisson’s ratio has
been studied for the study area. The estimated poison’s
ratio varies from 0.1 to 0.4. The estimated Poisson’s
ratio for different sites indicates it is having direct
relation with eater table those sites are having water
shallow water table having higher values because soils
are in saturated condition. The Poisson’s ratio for
some of the selective site has been given in Table 4.
7 Conclusions
From the above experimental and empirical analysis
of the present study the following conclusions can be
drawn.
1. Shear wave velocity measurement was carried out
by using seismic downhole technique for Kanpur
city along with standard penetration test. The
correlation between penetration values obtained
from standard penetration test and shear wave
velocity were developed for different type of soil
which is predominate in the study area i.e., silty
soil, clayey soil and all soil. The developed
correlations were compared with the empirical
equations developed by various authors for other
countries as well for Indian soil. The present study
shows the 95 % of the data shows the error margin
of ±10 % of the scaled percentage error pointing
towards a better estimation of shear wave
velocity.
2. The shear wave velocity map which will help for
the preliminary seismic hazard assessment of the
study area. The average shear wave velocity of the
alluvial soil of Kanpur city ranges from 125 to
825 m/s which indicated the soils are in loose
condition.
3. The seismic downhole technique was used for the
collection of shear wave velocity for the soil of
Kanpur city. For Kanpur city there is no shear
wave data base is available in literature. So the
present study is an attempt to make availability of
spatially distributed shear wave velocity contour
map for the Kanpur city.
4. The correlation between SPT-N and shear wave
velocity can be used for seismic hazard assess-
ment, designing of earthquake resistant structure.
The spatial distribution map will be helpful for
designers, practitioners for preliminary seismic
hazard assessment.
5. The measured shear wave velocity was used for
the seismic site classification of soil Based on
NEHRP and new Italian O.P.M.C. n code. The
soil of the study area is broadly classified as B, C
and D type soil.
6. Based on shear wave velocity data for Kanpur soil
Site period of the alluvial soil has been estimated.
The site period of Kanpur soil ranges from 0.1 to
0.9 s the site period indicates the soil will undergo
seismic shaking and the multistory buildings of
the study area are under seismic threats.
Acknowledgments The authors like to thank SERC division,
Department of Science and Technology (DST), Government of
India for providing the fund for this research work.
References
Anbazhagan P, Kumar A, Sitharam TG (2013) Seismic site
classification and correlation between standard penetration
test N value and shear wave velocity for Lucknow city in
Indo-Gangetic Basin. Pure Appl Geophys 170(3):299–318
ASTM D4428 (2007) Standard test method for Crosshole seis-
mic testing. American Society of Testing and Materials,
West Conshohocken Pennsylvania, United States
ASTM D7400 (2008) Standard test method for downhole test-
ing. American Society of Testing and Materials, West
Conshohocken, Pennsylvania, United States
ASTM D4318-10 (2010) Standard test methods for liquid limit,
plastic limit, and plasticity index of soils. American Soci-
ety of Testing and Materials, West Conshohocken Penn-
sylvania 19428-2959, United States
ASTM D 2487-83 (1985) Classification of soils for engineering
purposes. ASTM Standards: 395–408, American Society
of Testing and Materials, West Conshohocken Pennsyl-
vania, United States
Auld B (1977) Crosshole and downhole Vs by mechanical
impulse. J Geotech Eng 103:1381–1398
Batsila EV (1995) Investigations of ray path assumption on
downhole velocity profile. Master Thesis, Department of
Civil Engineering, The University of Texas Austin and
Austin. Texas (Unpublished)
Boominathan A, Dodagouder GR, Suganthi U (2011) Seismic
hazard assessment considering local site effect for
Geotech Geol Eng
123
microzonation studies of Chennai, a workshop on mi-
crozonation. Interline Publishing, Bangalore, pp 94–104
Dikmen U (2009) Statistical correlations of shear wave velocity
and penetration resistance for soils. J Geophys Eng
6:61–72
Dowrick DJ (2003) Earthquake risk reduction. Wiley, Chich-
ester, England
Fujiwara T (1972) Estimation of ground movements in actual
destructive earthquakes. In: International proceedings of
the fourth European symposium on earthquake engineer-
ing, London, pp 125–132
Geological and Mineral map of Uttarpradesh (1999) Miscella-
neous publication. Geological Survey of India
Gulerce U (2010) Discussion on use of surface waves in sta-
tistical correlations of shear wave velocity and penetration
resistance of Chennai soil by Uma Maheswari et al (2010).
J Geotech Geol Eng 28:925–927. doi:10.1007/s10706-010-
9334-4
Hanumanthrao C, Ramanna GV (2008) Dynamics soil proper-
ties for microzonation of Delhi. India J Earth Syst Sci
117(S2):719–730
Hasancebi N, Ulusay R (2007) Empirical correlations between
shear wave velocity and penetration resistance for ground
shaking assessments. Bull Eng Geol Environ
66(2):203–213
Holzer TL, Padovani AC, Bennett MJ, Noce TE, Tinsley JC
(2005) Mapping NEHRP VS30 site classes. Earthq Spect
21(2):353–370
Hunter JA, Benjamin B, Miller B, Pullan RD, Burns RA, Good
RL (2002) Surface and downhole shear wave seismic
methods for thick soil site investigations. Soil Dyn Earthq
Eng 22:931–941
Imai T (1977) P and S wave velocities of the ground in Japan.
Proc 9th Int Conf Soil Mech Found Eng 2:127–132
Imai T, Tonouchi K (1982) Correlation of N-value with S-wave
velocity and shear modulus. In: International proceedings
of the 2nd European symposium penetration testing,
Amsterdam, pp 57–72
Imai T, Yoshimura Y (1970) Elastic wave velocity and soil
properties in soft soil. Tsuchito-Kiso 18(1):17–22
Imai T, Yoshimura Y (1975) The relation of mechanical prop-
erties of soils to P and S wave velocities for ground in
Japan. Technical note, OYO Corporation
IS2131 (1981) Method for standard penetration test for soils.
Bureau of Indian standards, New Delhi
Iyisan R (1996) Correlations between shear wave velocity and
in situ penetration test results (in Turkish). Chamb Civil
Eng Turkey TeknikDergi 7(2):1187–1199
Jafari MK, Asghari AR (1997) Empirical correlation between
shear wave velocity (Vs) and SPT-N value for South
Tehran soils. In: Proceedings of the 4th International
Conference on Civil Engineering, Tehran, Iran
Japan Road Association (1980) Specification and interpretation
of bridge design for highway—Part V: resilient design
Jinan Z (1987) Correlation between seismic wave velocity and
the number of blow of SPT and depth. Chin J Geotech Eng
92–100
Kamil K (1996) Soil liquefaction evaluation using shear wave
velocity. Eng Geol 44(1–4):121–127
Kanai K (1966) Conference in cone penetrometer. The Ministry
of Public Works and Settlement, Ankara
Kanlı AI, Tildy P, Pronay Z, Pınar A, Hermann L (2006) VS30
mapping and soil classification for seismic site effect
evaluation in Dinar region, SW Turkey. Geophys J Int
165(1):223–235
Kiku H, Yoshida N, Yasuda S, Irisawa T, Nakazawa H, Shimizn
Y, Ansal A (2001) In situ penetration tests and soil profiling
in Adapazari, Turkey. In: Proceedings of the ICSMGE/
TC4 satellite conference on lessons learned from recent
strong earthquakes, pp 259–265
Kramer SL (1996) Geotechnical earthquake engineering.
Prentice Hall, New York
Lee SHH (1990) Regression models of shear wave velocities.
J Chin Inst Eng 13:519–532
Mayne PW, Rix G (1995) Correlations between shear wave
velocity and cone tip resistance in natural clays. Soil Found
35(2):107–110
Mhaske YS, Choudhury D (2011) Geospatial contour mapping
of shear wave velocity for Mumbai city. Nat Hazard
59(1):317–327. doi:10.1007/s11069-011-9758-z
Ohba S, Tourima I (1970) Dynamic response characteristics of
Osaka plain. Proceedings of Annual Meeting, AIJ (in
Japanese)
Ohsaki Y, Iwasaki R (1973) On dynamic shear module and
Poisson’s ratio of soil deposits. Soil Found 13(4):61–73
Ohta Y, Goto N (1978) Empirical shear wave velocity equations
in terms of characteristics soil indexes. Earthq Eng Struct
Dyn 6(2):167–187
Pitilakis K (2004) Site effects. In: Ansal A (ed) Recent advances
in earthquake geotechnical engineering and microzonation.
Kluwer Academic Publishers, Dordrecht, pp 139–199
Pitilakis K, Raptakis D, Lontzetidis K, Vassilikou T, Jongmans
D (1999) Geotechnical and geophysical description of
euro-seistest using field and laboratory tests and moderate
strong ground motions. J Earth Eng 3(3):381–409
Rajendran CP, Rajendran K (2005) The status of Central Seis-
mic gap: a perspective based on the spatial and temporal
aspects of large magnitude Himalayan earthquakes. Tect-
nophysics 395:19–39
Rao KS, Satyam ND (2007) Liquefaction studies for seismic
microzonation of Delhi region. Curr Sci 92(5):646–654
Seed HB, Idriss IM (1981) Evaluation of liquefaction potential
sand deposits based on observation of performance in pre-
vious earthquakes. ASCE National Convention, pp 81–544
Sitharam TG, Anbazhagan P (2008) Site characterization using
geotechnical and geophysical techniques for seismic mi-
crozonation of urban areas. International geotechnical
conference development of Urban areas and geotechnical.
engineering, Saint Petersburg, Russia I, pp 131–147
Sykora D, Stokoe, KH-II (1983) Correlations of in situ mea-
surements in sands of shear wave velocity, soil character-
istics and site conditions. Geotechnical Engineering report
GR83-33, The University of Texas and Austin
Tripathi P (2009) District Brochure of Kanpur Nagar District,
U.P. Central Ground Water Board Publication
Uma M, Boominathan R, Dodagouder A (2010) Use of surface
waves in statistical correlations of shear wave velocity and
penetration resistance of Chennai soil. J Geotech Geol Eng
28:119–137
Wald LA, Mori J (2000) Evaluation of methods for estimating
linear site-response amplifications in the Los Angeles
region. Bull Seismol Soc Am 90(B6):S32–S42
Geotech Geol Eng
123

Youd TL, Idriss IM, Andrus RD, Arango I, Castro G, Chrisian
JT, Dobry R, Liam FWD, Harder LF Jr, Hynes ME, Ishi-
hara K, Koester JP, Liao Sam SC, Marcuson William F III,
Martin GR, Mitchel JK, Moriwaki Y, Power MS, Robert-
son PK, Seed RB, Stokoe KH II (2001) Liquefaction
resistance of soils summery report from 1996 NCEER and
1998 NCEER/NSF workshops on evaluation of liquefac-
tion resistance of soils. J Geotech Geoenviron Eng ASCE
127:817–883
Geotech Geol Eng
123