
Flow convergence routing hypothesis for pool-riffle maintenance in alluvial rivers
21
Flow convergence routing hypothesis for pool-riffle maintenance in alluvial rivers Michael L. MacWilliams Jr., 1 Joseph M. Wheaton, 2,3 Gregory B. Pasternack, 3 Robert L. Street, 1 and Peter K. Kitanidis 1 Received 29 June 2005; revised 28 April 2006; accepted 19 June 2006; published 31 October 2006. [1] The velocity reversal hypothesis is commonly cited as a mechanism for the maintenance of pool-riffle morphology. Although this hypothesis is based on the magnitude of mean flow parameters, recent studies have suggested that mean parameters are not sufficient to explain the dominant processes in many pool-riffle sequences. In this study, two- and three-dimensional models are applied to simulate flow in the pool-riffle sequence on Dry Creek, California, where the velocity reversal hypothesis was first proposed. These simulations provide an opportunity to evaluate the hydrodynamics underlying the observed reversals in near-bed and section-averaged velocity and are used to investigate the influence of secondary currents, the advection of momentum, and cross-stream flow variability. The simulation results support the occurrence of a reversal in mean velocity and mean shear stress with increasing discharge. However, the results indicate that the effects of flow convergence due to an upstream constriction and the routing of flow through the system are more significant in influencing pool-riffle morphology than the occurrence of a mean velocity reversal. The hypothesis of flow convergence routing is introduced as a more meaningful explanation of the mechanisms acting to maintain pool-riffle morphology. Citation: MacWilliams, M. L., Jr., J. M. Wheaton, G. B. Pasternack, R. L. Street, and P. K. Kitanidis (2006), Flow convergence routing hypothesis for pool-riffle maintenance in alluvial rivers, Water Resour. Res., 42, W10427, doi:10.1029/2005WR004391. 1. Introduction [2] The velocity reversal hypothesis was introduced by Keller [1971] as a mechanism for understanding the main- tenance of pool-riffle sequences in alluvial streams. This hypothesis was based on observations from Dry Creek, California, that ‘‘at low flow the bottom velocity is less in the pool than in the adjacent riffles’’ and that ‘‘with increasing discharge the bottom velocity in pools increases faster than in riffles’’ [Keller, 1971, p. 754]. The velocity reversal hypothesis proposes the removal of fine sediment from riffles into pools during low flows since velocity (or shear stress) is at a maximum over riffles [Sear, 1996]. As discharge rises, the velocity in pools increases and becomes greater than over riffles, resulting in a ‘‘velocity reversal.’’ Gilbert [1914] first described this phenomenon noting that ‘‘at high stage ... the greater and smaller velocities have exchanged places,’’ though it was Keller [1969, 1971] who first used the term ‘velocity reversal’ to describe this process. Since then, the velocity reversal hypothesis has initiated significant discussion in the literature and underlies a variety of conceptual models which attempt to describe the maintenance of pool-riffle morphology. [3] Although Keller’s proposal of the hypothesis focused on mean bottom velocities, subsequent studies have expanded the hypothesis to apply to mean boundary shear stress [Lisle, 1979], section-averaged velocity [Keller and Florsheim, 1993], and section-averaged shear velocity [Carling, 1991]. Other studies have focused on point measures of velocity and shear stress [Petit, 1987, 1990]. A brief synopsis of the primary studies which have addressed the velocity reversal hypothesis, including the type of study, the parameter evaluated, and our evaluation of the authors’ support for the velocity reversal is given in the first three columns of Table 1. A more thorough discussion is presented by MacWilliams [2004]. [4] As seen in Table 1, the literature does not provide a clear consensus or single governing hypothesis for the mechanisms controlling pool-riffle morphology. Although there has been significant debate about whether a reversal of one or more flow parameters takes place, there is more general agreement that many cross-sectional average flow parameters in pools and riffles tend to converge as discharge increases [Carling and Wood, 1994]. While the literature suggests that a velocity reversal does occur in some cases, it is not clear whether a reversal of some type is a requisite for pool maintenance or whether the reversal hypothesis is applicable for all pool-riffle sequences. For example, Clifford and Richards [1992] found that a reversal or its absence could be demonstrated simultaneously for a given pool riffle sequence depending on the parameter evaluated, and the location of the measurement or cross section. 1 Environmental Fluid Mechanics Laboratory, Department of Civil and Environmental Engineering, Stanford University, Stanford, California, USA. 2 River Basin Dynamics and Hydrology Research Group, University of Wales, Aberystwyth, UK. 3 Department of Land, Air, and Water Resources, University of California, Davis, California, USA. Copyright 2006 by the American Geophysical Union. 0043-1397/06/2005WR004391$09.00 W10427 WATER RESOURCES RESEARCH, VOL. 42, W10427, doi:10.1029/2005WR004391, 2006 Click Here for Full Articl e 1 of 21
Transcript of Flow convergence routing hypothesis for pool-riffle maintenance in alluvial rivers
Flow convergence routing hypothesis for pool-riffle maintenance in
alluvial rivers
Michael L. MacWilliams Jr.,1 Joseph M. Wheaton,2,3 Gregory B. Pasternack,3
Robert L. Street,1 and Peter K. Kitanidis1
Received 29 June 2005; revised 28 April 2006; accepted 19 June 2006; published 31 October 2006.
[1] The velocity reversal hypothesis is commonly cited as a mechanism for themaintenance of pool-riffle morphology. Although this hypothesis is based on themagnitude of mean flow parameters, recent studies have suggested that mean parametersare not sufficient to explain the dominant processes in many pool-riffle sequences. In thisstudy, two- and three-dimensional models are applied to simulate flow in the pool-rifflesequence on Dry Creek, California, where the velocity reversal hypothesis was firstproposed. These simulations provide an opportunity to evaluate the hydrodynamicsunderlying the observed reversals in near-bed and section-averaged velocity and areused to investigate the influence of secondary currents, the advection of momentum, andcross-stream flow variability. The simulation results support the occurrence of a reversal inmean velocity and mean shear stress with increasing discharge. However, the resultsindicate that the effects of flow convergence due to an upstream constriction and therouting of flow through the system are more significant in influencing pool-rifflemorphology than the occurrence of a mean velocity reversal. The hypothesis of flowconvergence routing is introduced as a more meaningful explanation of the mechanismsacting to maintain pool-riffle morphology.
Citation: MacWilliams, M. L., Jr., J. M. Wheaton, G. B. Pasternack, R. L. Street, and P. K. Kitanidis (2006), Flow convergence
routing hypothesis for pool-riffle maintenance in alluvial rivers, Water Resour. Res., 42, W10427, doi:10.1029/2005WR004391.
1. Introduction
[2] The velocity reversal hypothesis was introduced byKeller [1971] as a mechanism for understanding the main-tenance of pool-riffle sequences in alluvial streams. Thishypothesis was based on observations from Dry Creek,California, that ‘‘at low flow the bottom velocity is less inthe pool than in the adjacent riffles’’ and that ‘‘withincreasing discharge the bottom velocity in pools increasesfaster than in riffles’’ [Keller, 1971, p. 754]. The velocityreversal hypothesis proposes the removal of fine sedimentfrom riffles into pools during low flows since velocity (orshear stress) is at a maximum over riffles [Sear, 1996]. Asdischarge rises, the velocity in pools increases and becomesgreater than over riffles, resulting in a ‘‘velocity reversal.’’Gilbert [1914] first described this phenomenon noting that‘‘at high stage . . . the greater and smaller velocities haveexchanged places,’’ though it was Keller [1969, 1971] whofirst used the term ‘velocity reversal’ to describe thisprocess. Since then, the velocity reversal hypothesis hasinitiated significant discussion in the literature and underlies
a variety of conceptual models which attempt to describethe maintenance of pool-riffle morphology.[3] Although Keller’s proposal of the hypothesis focused
on mean bottom velocities, subsequent studies haveexpanded the hypothesis to apply to mean boundary shearstress [Lisle, 1979], section-averaged velocity [Keller andFlorsheim, 1993], and section-averaged shear velocity[Carling, 1991]. Other studies have focused on pointmeasures of velocity and shear stress [Petit, 1987, 1990].A brief synopsis of the primary studies which haveaddressed the velocity reversal hypothesis, including thetype of study, the parameter evaluated, and our evaluation ofthe authors’ support for the velocity reversal is given in thefirst three columns of Table 1. A more thorough discussionis presented by MacWilliams [2004].[4] As seen in Table 1, the literature does not provide a
clear consensus or single governing hypothesis for themechanisms controlling pool-riffle morphology. Althoughthere has been significant debate about whether a reversal ofone or more flow parameters takes place, there is moregeneral agreement that many cross-sectional average flowparameters in pools and riffles tend to converge as dischargeincreases [Carling and Wood, 1994]. While the literaturesuggests that a velocity reversal does occur in some cases, itis not clear whether a reversal of some type is a requisitefor pool maintenance or whether the reversal hypothesisis applicable for all pool-riffle sequences. For example,Clifford and Richards [1992] found that a reversal or itsabsence could be demonstrated simultaneously for a givenpool riffle sequence depending on the parameter evaluated,and the location of the measurement or cross section.
1Environmental Fluid Mechanics Laboratory, Department of Civil andEnvironmental Engineering, Stanford University, Stanford, California,USA.
2River Basin Dynamics and Hydrology Research Group, University ofWales, Aberystwyth, UK.
3Department of Land, Air, and Water Resources, University ofCalifornia, Davis, California, USA.
Copyright 2006 by the American Geophysical Union.0043-1397/06/2005WR004391$09.00
W10427
WATER RESOURCES RESEARCH, VOL. 42, W10427, doi:10.1029/2005WR004391, 2006ClickHere
for
FullArticle
1 of 21
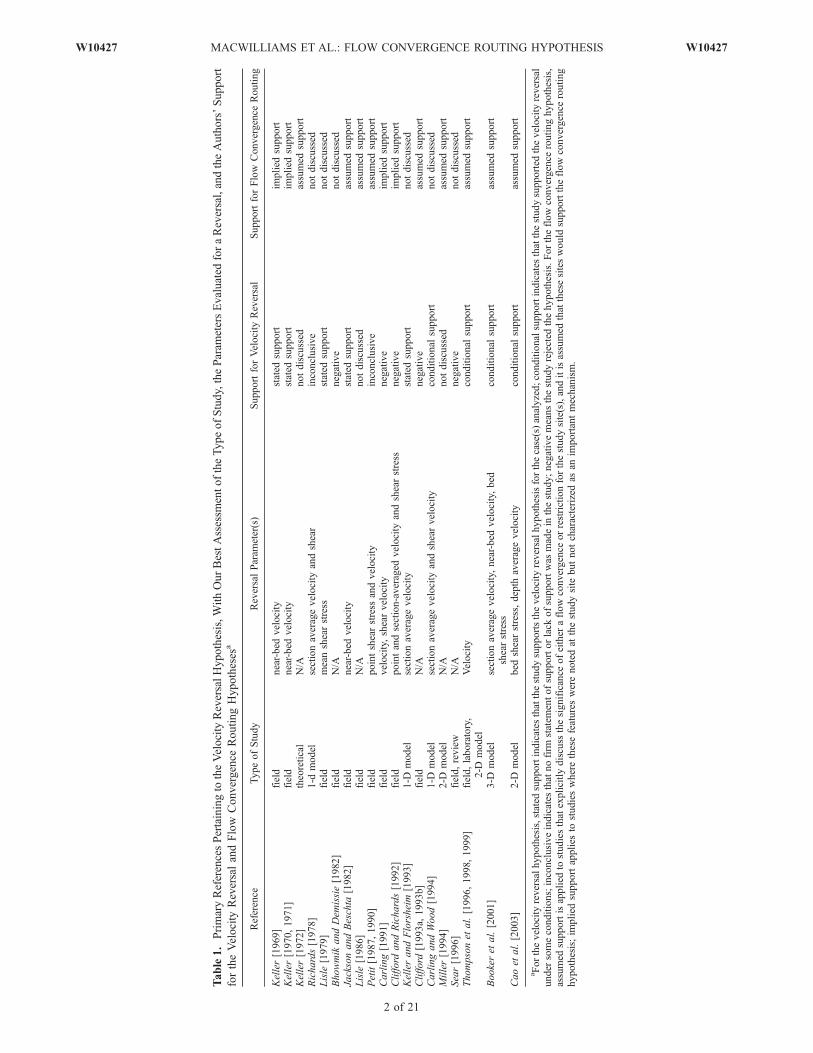
Table1.PrimaryReferencesPertainingto
theVelocity
ReversalHypothesis,WithOurBestAssessm
entoftheTypeofStudy,theParam
etersEvaluated
foraReversal,andtheAuthors’Support
fortheVelocity
ReversalandFlow
Convergence
RoutingHypotheses
a
Reference
TypeofStudy
ReversalParam
eter(s)
SupportforVelocity
Reversal
SupportforFlow
Convergence
Routing
Keller[1969]
field
near-bed
velocity
stated
support
implied
support
Keller[1970,1971]
field
near-bed
velocity
stated
support
implied
support
Keller[1972]
theoretical
N/A
notdiscussed
assumed
support
Richards[1978]
1-d
model
sectionaveragevelocity
andshear
inconclusive
notdiscussed
Lisle
[1979]
field
meanshearstress
stated
support
notdiscussed
Bhowmik
andDem
issie[1982]
field
N/A
negative
notdiscussed
JacksonandBeschta
[1982]
field
near-bed
velocity
stated
support
assumed
support
Lisle
[1986]
field
N/A
notdiscussed
assumed
support
Petit[1987,1990]
field
pointshearstress
andvelocity
inconclusive
assumed
support
Carling[1991]
field
velocity,shearvelocity
negative
implied
support
Clifford
andRichards[1992]
field
pointandsection-averaged
velocity
andshearstress
negative
implied
support
KellerandFlorsheim
[1993]
1-D
model
sectionaveragevelocity
stated
support
notdiscussed
Clifford
[1993a,
1993b]
field
N/A
negative
assumed
support
CarlingandWood[1994]
1-D
model
sectionaveragevelocity
andshearvelocity
conditional
support
notdiscussed
Miller[1994]
2-D
model
N/A
notdiscussed
assumed
support
Sear[1996]
field,review
N/A
negative
notdiscussed
Thompsonet
al.[1996,1998,1999]
field,laboratory,
2-D
model
Velocity
conditional
support
assumed
support
Bookeret
al.[2001]
3-D
model
sectionaveragevelocity,near-bed
velocity,bed
shearstress
conditional
support
assumed
support
Caoet
al.[2003]
2-D
model
bed
shearstress,depth
averagevelocity
conditional
support
assumed
support
aForthevelocity
reversalhypothesis,stated
supportindicates
thatthestudysupportsthevelocity
reversalhypothesisforthecase(s)analyzed;conditionalsupportindicates
thatthestudysupported
thevelocity
reversal
under
someconditions;inconclusiveindicates
thatnofirm
statem
entofsupportorlack
ofsupportwas
madein
thestudy;negativemeansthestudyrejected
thehypothesis.Fortheflowconvergence
routinghypothesis,
assumed
supportisapplied
tostudiesthatexplicitlydiscuss
thesignificance
ofeither
aflowconvergence
orrestrictionforthestudysite(s),anditisassumed
thatthesesiteswould
supporttheflowconvergence
routing
hypothesis;im
plied
supportapplies
tostudieswherethesefeatureswerenotedat
thestudysite
butnotcharacterizedas
anim
portantmechanism.
2 of 21
W10427 MACWILLIAMS ET AL.: FLOW CONVERGENCE ROUTING HYPOTHESIS W10427
Support for a reversal hypothesis based on reversals indifferent types of flow parameters (as seen in Table 1)should be considered as a suite of multiple working hy-potheses for explaining pool-riffle morphology rather than asingle ruling hypothesis because different maintenancemechanisms may operate in different pool-riffle sequence.However, a review of all the published field data forsediment transport in pool-riffle sequences [Sear, 1996]has shown that a velocity or shear stress reversal does notexplain all of the published evidence of sediment transport.Thus a more fundamental motivating question is that withinsystems that exhibit reversals of some kind, is the reversalan adequate explanation for pool maintenance? If not, andsome alternative maintenance mechanism is hypothesized,can that alternative hypothesis explain pool maintenance inpool-riffle sequences that do not exhibit reversals?[5] The extension of Keller’s velocity reversal hypothesis
from mean bottom velocity (as it was originally proposed)to section-averaged variables has been driven in part by theuse of one-dimensional models to analyze pool-rifflesequences. Keller and Florsheim [1993] used a one-dimensional hydraulic model (HEC-RAS) to evaluate thevelocity reversal hypothesis using Keller’s original fielddata. They found that during high flows the mean poolvelocity exceeded that of adjacent riffles, and that duringlow flows, the condition was reversed. Applying a similarmodel (HEC-2), Carling and Wood [1994] demonstrate theeffect of varying channel width, riffle spacing, and channelroughness on the shear velocity, section mean velocity, andenergy slope. However, in their results a reversal in themean velocity took place only when the riffle was consid-erably wider than the pool. Similarly a ‘‘shear velocityreversal’’ took place only when the pool was rougher thanthe riffle. Both of these conclusions severely limit theconditions when a section-averaged velocity or shearvelocity reversal could potentially occur and suggest thatother mechanisms may be necessary to explain sedimenttransport in pool-riffle sequences. Carling [1991] found aconvergence in mean velocity in pools and riffles in hisstudy site, but concluded that riffles were not sufficientlywide at high flows to accommodate the known dischargewith a velocity lower than in pools, and thus no velocityreversal was identified. Similarly, Richards [1978] found anarrowing of the difference in mean depth and velocity withdischarge, but neither of these variables, nor surface slopeor bed shear showed any tendency to equalize at the highestflow simulated. On the basis of their results, Keller andFlorsheim [1993] concluded that more sophisticated modelsof the hydraulics associated with pool-riffle sequences willbe able to explain in more detail the interaction betweenchannel form and process in pool-riffle sequences in alluvialstreams.[6] There is a growing recognition that section-averaged
data are not sufficient to explain the dynamics of pool-rifflesequences. Several studies have implemented two-dimensional models to simulate flow in pool-riffle sequen-ces [e.g., Miller, 1994; Thompson et al., 1998; Cao et al.,2003]. Although Miller [1994] focused primarily on flowaround a debris fan, his results identified the influence offlow convergence at the upstream end of the fan leading tothe development of scour holes; thus his results demonstratethe importance of flow convergence in the formation of a
riffle-pool sequence. Note that in this context ‘‘conver-gence’’ is used to define the physical process of funnelingof flow rather than in the context of a narrowing differencebetween mean parameter values as it was used previously.Similarly, Thompson et al. [1998] identified the importanceof a constriction at the head of the pool in creating a jet oflocally high velocities in the pool center, and the formationof a recirculating eddy. Cao et al. [2003] found that at lowdischarge there exists a primary peak zone of bed shearstress and velocity at the riffle tail in line with the maximumenergy slope, and a secondary peak at the pool head. Withincreasing discharge, the secondary shear stress peak at thehead of the pool increases and approaches or exceeds theprimary shear stress peak over the riffle. They also attrib-uted the existence of a flow reversal in their simulation tothe constriction at the pool head. Booker et al. [2001]applied a three-dimensional CFD model to a natural pool-riffle sequence. In their study, only three out of eightpossible pool-riffle couplets experienced a mean velocityreversal. They found a tendency for near-bed velocitydirection to route flow away from the deepest part of poolsand suggest that this flow routing may have an importantinfluence on sediment routing and the subsequent mainte-nance of pool-riffle morphology.[7] Extensive field and laboratory observations have been
made on the effects of flow constrictions on flow conver-gence and divergence, recirculating flow, and sedimentrouting. Constrictions resulting from debris fans [e.g.,Miller, 1994; Kieffer, 1985, 1989; Schmidt, 1990] havebeen characterized by a flow regime consisting of a con-vergent flow upstream of the constriction, a beginningdivergence out of the constrictions, and ultimately a down-stream state of uniform flow not influenced by the constric-tion [Kieffer, 1985,1989]. Schmidt [1990] identifies thepresence of a scour hole immediately downstream frommost channel constrictions, and notes that recirculatingcurrents can develop between the jet of flow exiting theconstriction and the bank. Thompson [2004] has usedlaboratory experiments to investigate the influence of poollength on recirculating eddies and jet strength. BothThompson [2004] and Schmidt et al. [1993] observedsignificant variation in instantaneous velocity field resultingin the recirculation zone, which indicates that average flowparameters are not sufficient to explain sediment transport.Lisle and Hilton [1992] observed nonuniform sedimentdeposition in pools which showed little correlation to waterdepth. They found that deposits were thickest under eddiesand backwaters, but were commonly absent under thethalweg. Further, Lisle and Hilton [1992, p. 380] observedthat ‘‘although some fine sediment is deposited in pools,boundary shear stress along the major sediment pathways inpools remained sufficient to maintain continued transportdownstream.’’ Similarly, Jackson and Beschta [1982] ob-served a nonuniform distribution of bedload transport acrossthe channel resulting from a relatively large increase invelocity with discharge along the channel thalweg, withrelatively little change in the lower velocities along thechannel edges. This increase in velocity did not result insignificant scour, but instead enabled bed material from theupstream riffle to be efficiently routed through the pool.These observations indicate that flow constrictions and a
W10427 MACWILLIAMS ET AL.: FLOW CONVERGENCE ROUTING HYPOTHESIS
3 of 21
W10427
resulting nonuniform distribution of flow can have a sig-nificant impact on routing of sediment through pools.[8] Drawing on this extensive literature, Thompson et al.
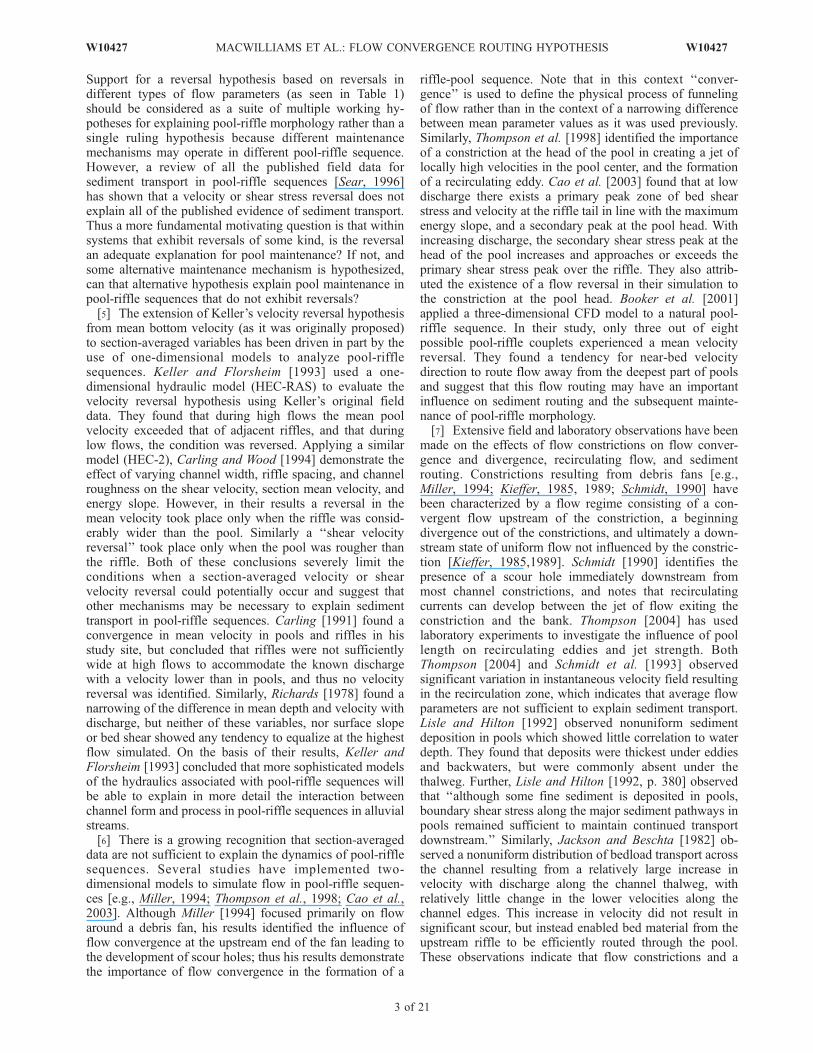
[1996, 1998] have revised the traditional velocity reversalmodel to incorporate the effects of a channel constriction atthe head of a pool. Their study demonstrated how theupstream constriction resulted in higher local velocities inthe pool in comparison to adjacent riffles, despite a similarcross-sectional area. As noted by Booker et al. [2001], thisconcept links the concept of velocity reversal with work byKeller [1972] which suggested that the regular pattern ofscour and deposition required for pools and riffles may beprovided by an alternation of convergent and divergent flowpatterns along the channel. This connection is significantbecause the pool-riffle sequence on Dry Creek has a pointbar (on the north bank between sections 22 and 20 onFigure 1) which acts as constriction at the head of the pool.Cao et al. [2003] conclude that a channel constriction can,but may not necessarily, lead to [sediment transport] com-petence reversal, depending on channel geometry, flowdischarge, and sediment properties. Booker et al. [2001]conclude that an analysis of near-bed velocity patternssuggested that the near-bed flow direction can cause routingof sediments away from the deepest part of the pools. Theirresults indicate maintenance of pool-riffle morphology by alack of sediment being routed into pools rather than anincreased ability to erode based on convergence of flow intothe pool.[9] The velocity reversal hypothesis was proposed by
Keller [1971] based on bed velocity measurements in apool-riffle sequence on Dry Creek, CA. The bed-velocitydata [Keller, 1969, 1970] support a convergence of near-bedvelocity, and a reversal in near-bed velocity is predicted forhigher discharges. Keller and Florsheim’s [1993] one-dimensional modeling study support a reversal in meanvelocity for the pool-rifle sequence on Dry Creek. Theoverall goal of this paper is to return to Keller’s originaldata set to evaluate the flow processes in a pool-rifflesequence using two-dimensional and three-dimensional nu-
merical simulations that may be able to explain the hydro-dynamic mechanics underlying the observed conditions,which was not possible by previous one-dimensional sim-ulation. Using both types of models not only provides amore complete assessment of the physical processes, but italso completes the systematic evaluation of the utility ofdifferent levels of process resolution. Specific objectivesinclude (1) identifying pool-riffle ‘‘reversals’’ in near-bedvelocity, depth-averaged velocity, section-averaged velocity,and bed shear stress, (2) evaluating the roles of secondarycirculation and width constriction at the site, and (3) assess-ing whether the velocity reversal hypothesis is an adequateexplanation for the maintenance of the pool-riffle morphol-ogy for this pool-riffle sequence. Although the study onlyinvestigates one site in detail, the hydrodynamic processessimulated in these models are transferable to other sites, andour analysis draws on both the extensive literature on pool-riffle morphology and experience on other rivers. On thebasis of our analysis, a new ‘‘flow convergence routing’’hypothesis for pool-riffle maintenance in alluvial rivers isproposed, which is consistent with Dry Creek conditionsand those observed other sites reported in the literature. Thenew hypothesis is significant for its ability to explain whypast studies on other field sites have differed in theirassessment of the originally proposed velocity reversalmechanism.
2. Methods
[10] In this study, the Dry Creek reach mapped in Keller’soriginal field study was modeled using both a two-dimensional and a three-dimensional hydrodynamic model.The models were validated using field data collected byKeller [1969] and compared against one-dimensional resultsfrom Keller and Florsheim [1993]. This approach allows fora detailed assessment of the capacity of one-, two- andthree-dimensional models to capture the hydrodynamics anda strong basis for inference of important morphologicalprocesses that operate on this pool-riffle sequence. Specif-
Figure 1. Topographic map of a riffle-pool-riffle sequence in Dry Creek near Winters, California.Contour interval is 1 foot (1 foot = 0.3048 m). Modified from Keller and Florsheim [1993]. Copyright1993 John Wiley & Sons Limited. Reproduced with permission.
4 of 21
W10427 MACWILLIAMS ET AL.: FLOW CONVERGENCE ROUTING HYPOTHESIS W10427
ically, the one-dimensional results from Keller andFlorsheim [1993] and the results from the two- andthree-dimensional models applied in this study were usedto assess whether a reversal in mean velocity occurred onDry Creek. Further, the three-dimensional model was usedto compare predicted bed velocity to the measurements fromKeller [1971] and to evaluate whether a near-bed velocityreversal occurs, as Keller originally predicted. Lastly, thepredicted bed shear stresses from the two- and three-dimensional simulations were used to evaluate whether areversal in bed shear stress occurred and whether the spatialor temporal distribution of bed shear stresses indicateany other important mechanisms that could account for areversal in sediment transport competence.
2.1. Two- and Three-Dimensional Modeling
[11] Two different numerical models were applied in thisstudy. Although the two- and three-dimensional models wereapplied independently, to the extent possible, the modelparameters used in the two- and three-dimensional simula-tions were equivalent to the model parameters used in theone-dimensional model presented by Keller and Florsheim[1993], to allow for a balanced comparison between the threemodels. The specific formulation of roughness, eddy viscos-ity, and boundary conditions were different in each modelas described below, but the parameter values were calibratedto produce equivalent water surface elevations and cross-sectional area.[12] Three-dimensional simulations were made using the
three-dimensional nonhydrostatic hydrodynamic model forfree surface flows on unstructured grids, UnTRIM, de-scribed by Casulli and Zanolli [2002]. The UnTRIM modelsolves the full three-dimensional momentum equations foran incompressible fluid under a free surface given by
@u
@tþ u
@u
@xþ v
@u
@yþ w
@u
@z� fv ¼ � @p
@xþ nh
@2u
@x2þ @2u
@y2
� �
þ @
@znv
@u
@z
� �
@v
@tþ u
@v
@xþ v
@v
@yþ w
@v
@zþ fu ¼ � @p
@yþ nh
@2v
@x2þ @2v
@y2
� �
þ @
@znv
@v
@z
� �
@w
@tþ u
@w
@xþ v
@w
@yþ w
@w
@z¼ � @p
@zþ nh
@2w
@x2þ @2w
@y2
� �
þ @
@znv
@w
@z
� �� g
where u(x, y, z, t) and v(x, y, z, t) are the velocitycomponents in the horizontal x and y directions, respec-tively; w(x, y, z, t) is the velocity component in the vertical zdirection; t is the time; p(x, y, z, t) is the normalized pressuredefined as the pressure divided by a constant referencedensity; f is the Coriolis parameter; g is the gravitationalacceleration; and nh and nv are the coefficients of horizontaland vertical eddy viscosity, respectively [Casulli andZanolli, 2002]. Conservation of mass is expressed by thecontinuity equation for incompressible fluids
@u
@xþ @v
@yþ @w
@z¼ 0:
The free surface equation is obtained by integrating thecontinuity equation over depth and using a kinematiccondition at the free surface; this yields [Casulli andZanolli, 2002]
@z@t
þ @
@x
Z z
�H0
udz
� �þ @
@y
Z z
�H0
vdz
� �¼ 0;
where h(x, y) is the prescribed bathymetry measureddownward from the reference elevation and h(x, y, t) isthe free surface elevation measured upward from thereference elevation. Thus the total water depth is given byH(x, y, t) = h(x, y) + h(x, y, t). The discretization of the aboveequations and model boundary conditions is presented indetail by Casulli and Zanolli [2002] and is not reproducedhere. The UnTRIM model was modified to include aninflow boundary condition for volume and momentum, aradiation outflow boundary condition, and a modifiedformulation of bed drag and vertical eddy viscosity asdescribed by MacWilliams [2004].[13] The two-dimensional finite element surface water
modeling system (FESWMS) was used to analyzedepth-averaged hydrodynamics following the approachof Pasternack et al. [2004]. FESWMS solves the verticallyintegrated conservation of momentum and mass equationsusing a finite element method to acquire depth averaged2D velocity vectors and water depths at each node in a finiteelementmesh. Themodel is capable of simulating both steadyand unsteady two-dimensional flow as well as subcritical andsupercritical flows. The basic governing equations for verti-cally integrated momentum in the x and y directions under thehydrostatic assumption are given by
@
@tHUð Þ þ @
@xbuuHUUð Þ þ @
@ybuvHUVð Þ þ gH
@zb@x
þ 1
2g@H2
@x
þ 1
rtbx �
@
@xHtxxð Þ � @
@yHtxy� �� �
¼ 0
and
@
@tHVð Þ þ @
@xbvuHVUð Þ þ @
@ybvvHVVð Þ þ gH
@zb@y
þ 1
2g@H2
@y
þ 1
rtby �
@
@xHtyx� �
� @
@yHtyy� �� �
¼ 0;
respectively, where H is the water depth, U and V are thedepth-averaged velocity components in the horizontal x andy directions, zb is the bed elevation, buu, buv, bvu, and bvv
are the momentum correction coefficients that account forthe variation of velocity in the vertical direction, tx
b and tyb
are the bottom shear stresses acting in the x and y directions,respectively, and txx, txy, tyx are the tyy shear stressescaused by turbulence. Conservation of mass in twodimensions is given by
@H
@tþ @
@xHUð Þ þ @
@yHVð Þ ¼ 0:
Discretization of the above equations for the FESWMSmodel is presented by Froehlich [1989], and is notreproduced here.
W10427 MACWILLIAMS ET AL.: FLOW CONVERGENCE ROUTING HYPOTHESIS
5 of 21
W10427
[14] The bathymetry for the Dry Creek field site [Keller,1969] was digitized from a plane table survey contour mapto generate a Digital Elevation Model (DEM) of the studyreach in Autodesk’s LandDesktop R3 Terrain Manager(Figure 1). The refined DEM data was then exported andinterpolated onto each of the model grids. The total reachmodeled is approximately 135 m long and ranges in widthbetween 20 and 25 m. The FESWMS model used a finiteelement mesh with an approximately uniform node spacingof 0.45 m. This resulted in a model mesh with roughly12,600 computational nodes comprising approximately3500 mixed quadrilateral and triangular elements. For theUnTRIM model, an unstructured horizontal grid consistingof 23,655 cells triangular in planform was developed usingTRIANGLE [Shewchuk, 1996]. The average grid cell sizewas 0.12 m2. The seven cross sections in the study reach(Figure 1) were preserved in the model grids by aligning theedges of the model grid cells along the section lines. Thisfacilitated direct comparison of model results with Keller’sfield data at specific cross sections. A uniform vertical gridspacing of 0.05 m was used for the UnTRIM simulations.[15] Keller [1971] found that at low flow the Manning’s n
roughness coefficient in the pool-riffle sequence was 0.040for the pool and 0.042 for the riffle. Keller and Florsheim[1993] used a roughness of 0.041 over pools and 0.043 overriffles in their simulations. Keller and Florsheim [1993] dida sensitivity analysis of bottom roughness by comparingtheir results using these values to a case where the rough-ness values were reversed and a case where a roughness of0.041 was used in both the riffles and pools, and found nochange in the relative velocities in the pools and riffles.They found that relative velocities are more dependent onchannel geometry than on variation in roughness. Specifi-cation of bed roughness in a two- and three-dimensionalmodel requires a spatially distributed roughness specified ateach grid point, rather than coefficient at each cross section.In addition, this parameter represents only the effect of bedroughness, rather than encompassing all forms of energyloss in the channel as it does in a one-dimensional model. Inthe FESWMS model and the UnTRIM model, the bedroughness value is the principal calibration parameter usedto calibrate the water surface slope. As a result, the bedroughness values were selected such that the predictedwater surface matched the observed water surface. Becausea detailed mapping of roughness for the Dry Creek site wasnot available, a constant roughness parameter was applied inboth the FESWMS and the UnTRIM simulations. In theFESWMS simulations the Manning’s n roughness wasestimated as 0.041 for entire study site. For the UnTRIMsimulations a constant zo roughness of 1.5 � 10�3 m wasapplied. On the basis of the method described byMacWilliams [2004], this roughness height corresponds toa Manning’s n value of approximately 0.041 for the range offlow depths simulated. The results from the UnTRIM andFESWMS simulations suggest that the roughness valuesselected primarily influence the water surface slope, and thatthe primary flow features are controlled by the channelgeometry. Although local variations in roughness are likelyto influence local shear stress values and bed velocityvalues, the large-scale flow features observed in this studyare primarily controlled by the geometry of the pool-rifflesequence. This corroborates Keller and Florsheim’s [1993]
conclusion that relative velocities are more dependent onchannel geometry than on variation in roughness.[16] For the FESWMS simulations, Boussinesq’s analogy
was applied to parameterize eddy viscosity, which crudelyapproximates eddy viscosity as an isotropic scalar. Doing soallows a theoretical estimate of eddy viscosity as 60 percentof the product of shear velocity and depth [Froehlich,1989]. A constant eddy viscosity value of 0.027 m2/secwas used for all FESWMS model runs. It is well known thatthe eddy viscosity has a nearly parabolic distribution withdepth in an open channel flow and that the use of a constanteddy viscosity for three-dimensional simulations is likely toyield unrealistic vertical velocity profiles [Rodi, 1993]. As aresult, in uniform open channels, the velocity profile is oftenassumed to be logarithmic, resulting in a parabolic eddyviscosity distribution [Celik and Rodi, 1988]. For theUnTRIM simulations, a parabolic vertical eddy viscositymodel was applied following the approach of Celik andRodi [1988].[17] Keller’s original field measurements [Keller, 1969,
1971] were made at discharges of 0.42, 0.97, and 4.5 m3/s.The HEC-RAS model simulations by Keller and Florsheim[1993] were conducted for five steady flow rates, includingthe three discharges measured by Keller [1969] and twolarger discharges of 8.5 and 17 m3/s. These five flow rateswere modeled as five separate steady flow simulations inFESWMS; in UnTRIM a transient simulation of each flowrate was run until the flow field reached a ‘‘steady state.’’ Inboth UnTRIM and FESWMS, the inflow discharge wasspecified at the upstream end of the channel using a uniformvelocity distribution; at the downstream end of the channel,the water surface elevation was specified based on theelevations predicted at the downstream cross section fromthe modeled results of Keller and Florsheim [1993]. Toallow direct comparison with previous studies, we evaluatedthe model results at the pool cross section (section 19,Figure 1) and riffle cross section (section 21, Figure 1) usedin the analysis of Keller [1971] and Keller and Florsheim[1993].
2.2. Model Validation
[18] The UnTRIM and FESWMS models have previouslybeen validated in a number of applications [cf. Casulliand Zanolli, 2002; MacWilliams, 2004; Froehlich, 1989;Pasternack et al., 2004]. For this application, the modelswere validated using field data collected by Keller [1969] tothe extent possible recognizing the technological limitationsand differing purpose of the original work. Validation ofdetailed numerical models against historical field data posesa significant challenge, because only sparse data are avail-able for validation purposes. At the Dry Creek field site, theprimary objective of the data collection effort was for thebed load movement experiments reported by Keller [1969,1970], and only limited point velocity and water surfaceelevation data are available. Bed velocity measurementswere made at the pool cross section (section 21) and rifflecross section (section 19) for 0.42, 0.97, and 4.5 m3/sdischarges. Velocity was also measured at 0.6 times thedepth for the 0.42 and 0.97 m3/s discharges. Observedcross-sectional areas for the pool and riffle cross sectionswere reported by Keller and Florsheim [1993], whileobserved depths at these cross sections are available onlyfor the 0.97 m3/s discharges (E. A. Keller, unpublished field
6 of 21
W10427 MACWILLIAMS ET AL.: FLOW CONVERGENCE ROUTING HYPOTHESIS W10427
notebook, 1969). The stations where these point data werecollected are measured along each cross section but theexact starting position for each transect is not preciselyreported; the alignment used was estimated using watersurface edges and depths where available. While moredetailed data collection using modern instruments wouldallow for more thorough model validation, we recognizethat the available data was collected for a different purpose,and with relatively little quality control. Where the modelresults deviate from the available data, multiple data typeshave been used to help understand these differences. Thesecomparisons highlight some potential shortcomings in theavailable data, and suggest that, while a reasonable level ofvalidation can be achieved, some remaining differences mayresult from uncertainty in available observation data ratherthan model uncertainty.
2.3. Bed and Depth-Averaged Velocity
[19] On the basis of bed velocity measurements on DryCreek, Keller [1971] predicted the occurrence of a bedvelocity reversal. Keller [1969] believed that the ‘‘bottomvelocity is much more significant in analyzing bed loadmovement than the mean velocity of the entire stream.’’Keller collected velocity measurements near the bed at threefoot intervals along each of four cross sections duringmeasured discharges of 0.42, 0.97, and 4.5 m3/s. Velocitiesnear the bed were measured with at rod-mounted, pigmyPrice current meter [Keller, 1970]. For comparison with thebottom velocity measured by Keller, the velocity predictedusing UnTRIM in the bottom two cells in each watercolumn was interpolated to estimate the average velocityat a depth of 5 cm. On the basis of the geometry of theinstrument used, this seems to be a reasonable estimate ofthe lowest height at which the velocity could feasibly be
sampled. Because the pigmy Price current meter methoddoes not measure flow direction and assumes all flow is inone direction, the overall velocity magnitude predicted byUnTRIM is used rather than only the downstream flowcomponent. This distinction is significant for areas in whichsignificant secondary circulation exists near the channelbed. Comparisons of bed velocity were not made usingthe FESWMS results, since FESWMS is a depth-averagedmodel. Depth-averaged velocities from FESWMS werecompared to velocities measured at 0.6 times the depthfor the 0.42 and 0.97 m3/s discharges.
2.4. Section-Averaged Velocity
[20] Keller and Florsheim [1993] extended Keller’s[1969] original proposal of a reversal in bed velocity to areversal in mean cross-section velocity. In their analysis, thefield measurements from Keller [1969] were averaged overthe pool and riffle cross sections and HEC-RAS was used tomodel section-averaged velocity. In this study, the predictedflow fields from FESWMS and UnTRIM at the pool andriffle cross sections were also averaged at the pool and rifflecross sections to obtain the cross-sectional average veloci-ties for each of the five flow rates. These average velocitieswere compared to the results presented by Keller andFlorsheim [1993].
2.5. Bed Shear Stress
[21] The predicted bed shear stress was calculated overthe model domain for both the UnTRIM and FESWMSsimulations. For the FESWMS simulations, the depth-averaged shear stress was calculated from depth, velocity,and bed roughness using a drag force relation [Froehlich,1989]. Bed shear stress for the FESWMS simulation wascalculated as 0.51 times the depth-averaged shear stress basedon a detailed validation study (Pasternack et al., submitted for
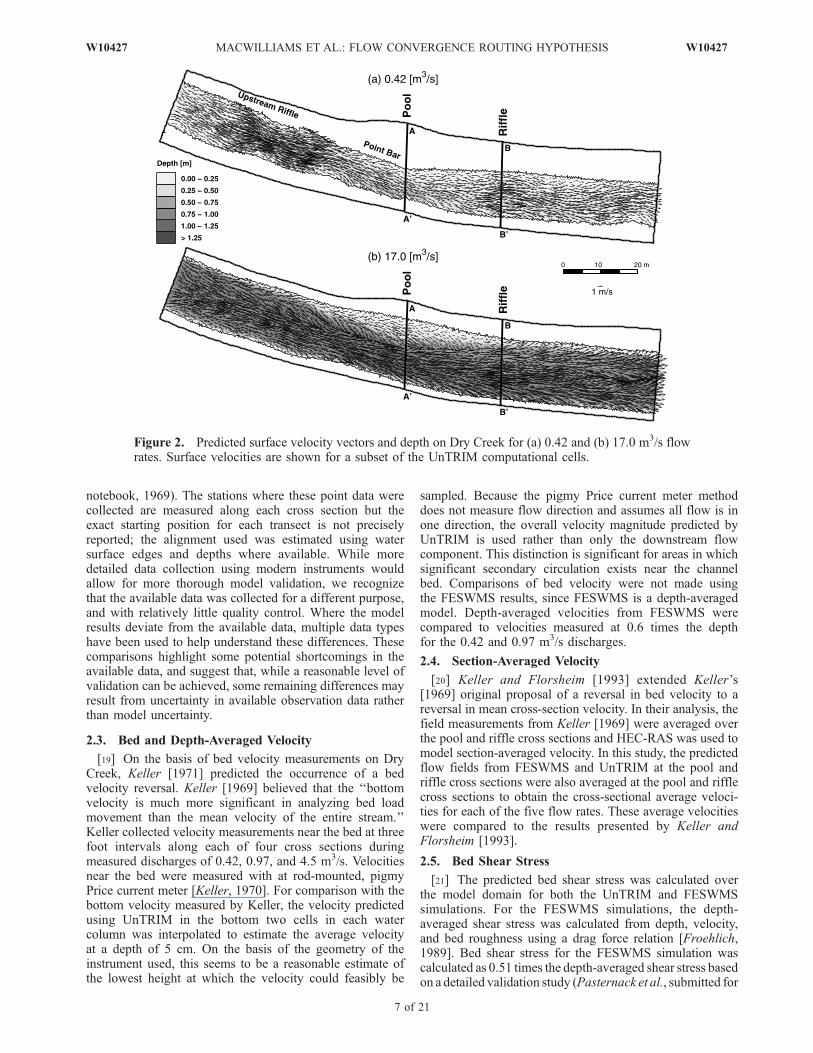
Figure 2. Predicted surface velocity vectors and depth on Dry Creek for (a) 0.42 and (b) 17.0 m3/s flowrates. Surface velocities are shown for a subset of the UnTRIM computational cells.
W10427 MACWILLIAMS ET AL.: FLOW CONVERGENCE ROUTING HYPOTHESIS
7 of 21
W10427
publication, 2005). In theUnTRIM simulations, the bed shearstress was calculated from the near-bed velocity by assuminga log law near the bed [MacWilliams, 2004].
3. Results
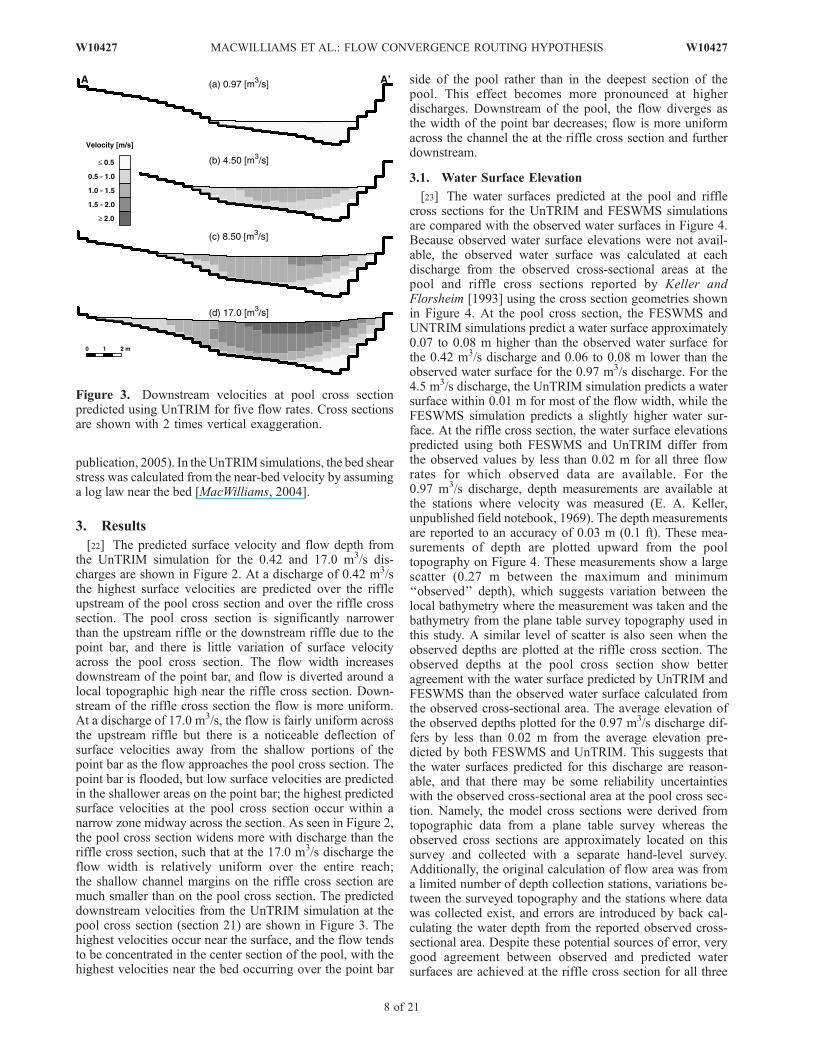
[22] The predicted surface velocity and flow depth fromthe UnTRIM simulation for the 0.42 and 17.0 m3/s dis-charges are shown in Figure 2. At a discharge of 0.42 m3/sthe highest surface velocities are predicted over the riffleupstream of the pool cross section and over the riffle crosssection. The pool cross section is significantly narrowerthan the upstream riffle or the downstream riffle due to thepoint bar, and there is little variation of surface velocityacross the pool cross section. The flow width increasesdownstream of the point bar, and flow is diverted around alocal topographic high near the riffle cross section. Down-stream of the riffle cross section the flow is more uniform.At a discharge of 17.0 m3/s, the flow is fairly uniform acrossthe upstream riffle but there is a noticeable deflection ofsurface velocities away from the shallow portions of thepoint bar as the flow approaches the pool cross section. Thepoint bar is flooded, but low surface velocities are predictedin the shallower areas on the point bar; the highest predictedsurface velocities at the pool cross section occur within anarrow zone midway across the section. As seen in Figure 2,the pool cross section widens more with discharge than theriffle cross section, such that at the 17.0 m3/s discharge theflow width is relatively uniform over the entire reach;the shallow channel margins on the riffle cross section aremuch smaller than on the pool cross section. The predicteddownstream velocities from the UnTRIM simulation at thepool cross section (section 21) are shown in Figure 3. Thehighest velocities occur near the surface, and the flow tendsto be concentrated in the center section of the pool, with thehighest velocities near the bed occurring over the point bar
side of the pool rather than in the deepest section of thepool. This effect becomes more pronounced at higherdischarges. Downstream of the pool, the flow diverges asthe width of the point bar decreases; flow is more uniformacross the channel the at the riffle cross section and furtherdownstream.
3.1. Water Surface Elevation
[23] The water surfaces predicted at the pool and rifflecross sections for the UnTRIM and FESWMS simulationsare compared with the observed water surfaces in Figure 4.Because observed water surface elevations were not avail-able, the observed water surface was calculated at eachdischarge from the observed cross-sectional areas at thepool and riffle cross sections reported by Keller andFlorsheim [1993] using the cross section geometries shownin Figure 4. At the pool cross section, the FESWMS andUNTRIM simulations predict a water surface approximately0.07 to 0.08 m higher than the observed water surface forthe 0.42 m3/s discharge and 0.06 to 0.08 m lower than theobserved water surface for the 0.97 m3/s discharge. For the4.5 m3/s discharge, the UnTRIM simulation predicts a watersurface within 0.01 m for most of the flow width, while theFESWMS simulation predicts a slightly higher water sur-face. At the riffle cross section, the water surface elevationspredicted using both FESWMS and UnTRIM differ fromthe observed values by less than 0.02 m for all three flowrates for which observed data are available. For the0.97 m3/s discharge, depth measurements are available atthe stations where velocity was measured (E. A. Keller,unpublished field notebook, 1969). The depth measurementsare reported to an accuracy of 0.03 m (0.1 ft). These mea-surements of depth are plotted upward from the pooltopography on Figure 4. These measurements show a largescatter (0.27 m between the maximum and minimum‘‘observed’’ depth), which suggests variation between thelocal bathymetry where the measurement was taken and thebathymetry from the plane table survey topography used inthis study. A similar level of scatter is also seen when theobserved depths are plotted at the riffle cross section. Theobserved depths at the pool cross section show betteragreement with the water surface predicted by UnTRIM andFESWMS than the observed water surface calculated fromthe observed cross-sectional area. The average elevation ofthe observed depths plotted for the 0.97 m3/s discharge dif-fers by less than 0.02 m from the average elevation pre-dicted by both FESWMS and UnTRIM. This suggests thatthe water surfaces predicted for this discharge are reason-able, and that there may be some reliability uncertaintieswith the observed cross-sectional area at the pool cross sec-tion. Namely, the model cross sections were derived fromtopographic data from a plane table survey whereas theobserved cross sections are approximately located on thissurvey and collected with a separate hand-level survey.Additionally, the original calculation of flow area was froma limited number of depth collection stations, variations be-tween the surveyed topography and the stations where datawas collected exist, and errors are introduced by back cal-culating the water depth from the reported observed cross-sectional area. Despite these potential sources of error, verygood agreement between observed and predicted watersurfaces are achieved at the riffle cross section for all three
Figure 3. Downstream velocities at pool cross sectionpredicted using UnTRIM for five flow rates. Cross sectionsare shown with 2 times vertical exaggeration.
8 of 21
W10427 MACWILLIAMS ET AL.: FLOW CONVERGENCE ROUTING HYPOTHESIS W10427
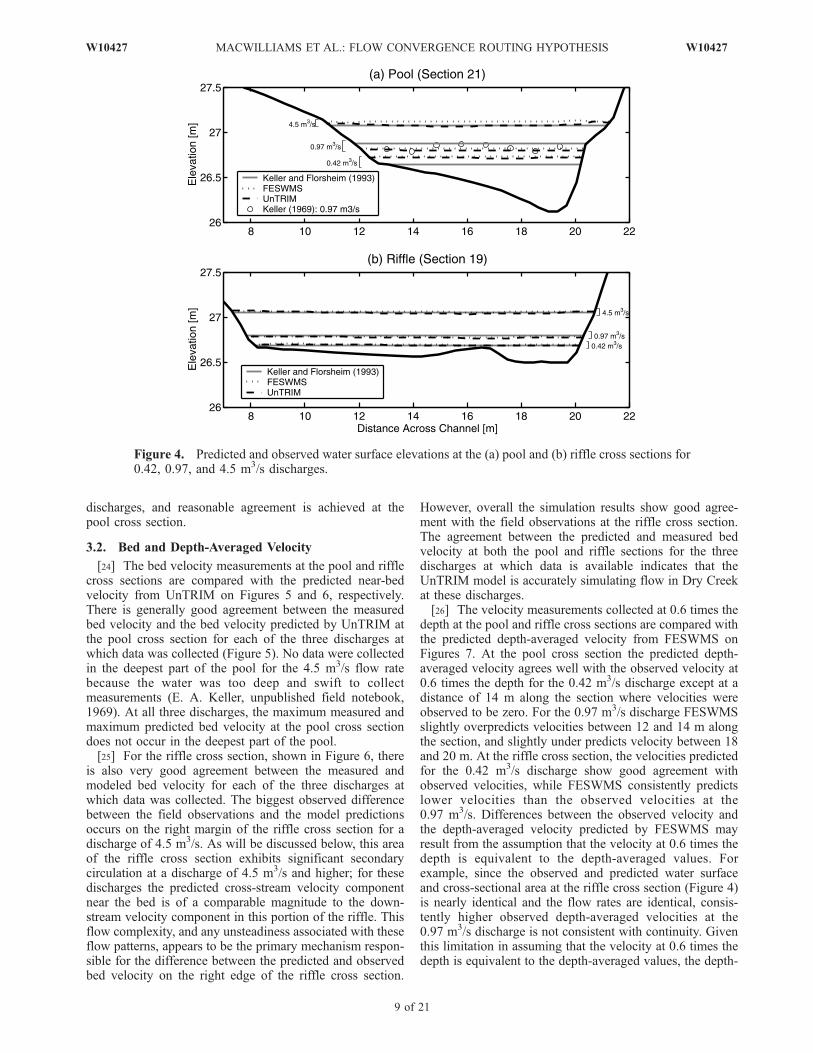
discharges, and reasonable agreement is achieved at thepool cross section.
3.2. Bed and Depth-Averaged Velocity
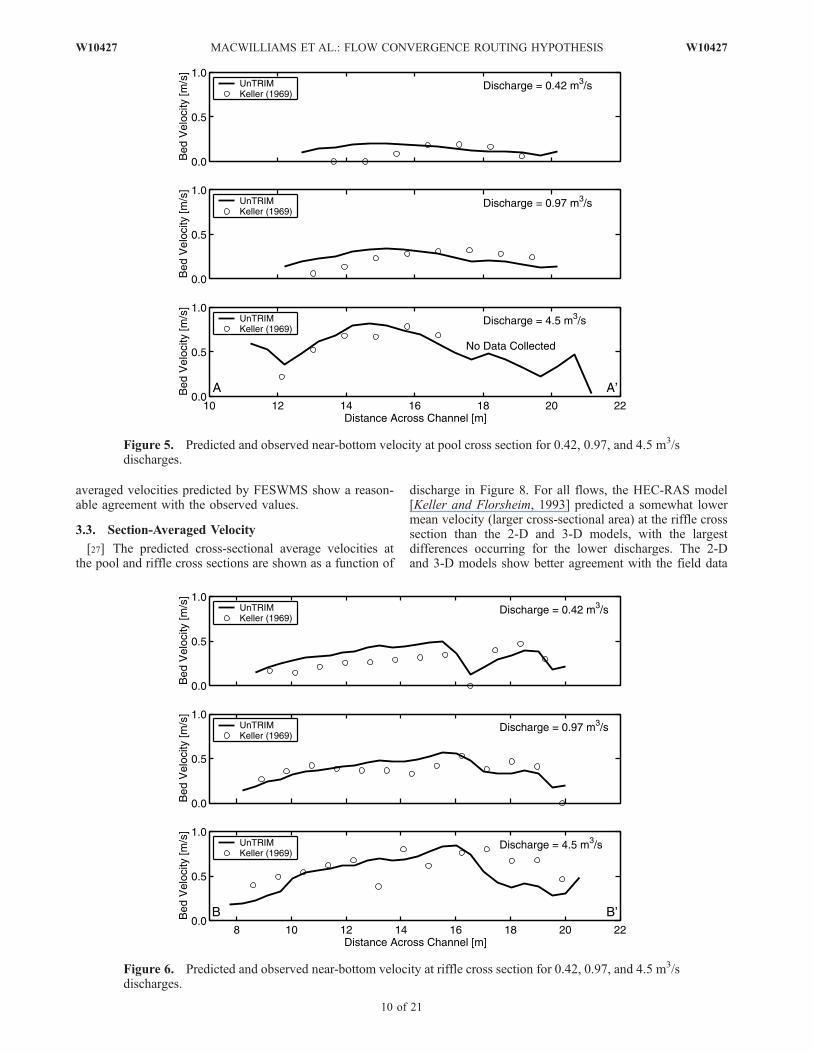
[24] The bed velocity measurements at the pool and rifflecross sections are compared with the predicted near-bedvelocity from UnTRIM on Figures 5 and 6, respectively.There is generally good agreement between the measuredbed velocity and the bed velocity predicted by UnTRIM atthe pool cross section for each of the three discharges atwhich data was collected (Figure 5). No data were collectedin the deepest part of the pool for the 4.5 m3/s flow ratebecause the water was too deep and swift to collectmeasurements (E. A. Keller, unpublished field notebook,1969). At all three discharges, the maximum measured andmaximum predicted bed velocity at the pool cross sectiondoes not occur in the deepest part of the pool.[25] For the riffle cross section, shown in Figure 6, there
is also very good agreement between the measured andmodeled bed velocity for each of the three discharges atwhich data was collected. The biggest observed differencebetween the field observations and the model predictionsoccurs on the right margin of the riffle cross section for adischarge of 4.5 m3/s. As will be discussed below, this areaof the riffle cross section exhibits significant secondarycirculation at a discharge of 4.5 m3/s and higher; for thesedischarges the predicted cross-stream velocity componentnear the bed is of a comparable magnitude to the down-stream velocity component in this portion of the riffle. Thisflow complexity, and any unsteadiness associated with theseflow patterns, appears to be the primary mechanism respon-sible for the difference between the predicted and observedbed velocity on the right edge of the riffle cross section.
However, overall the simulation results show good agree-ment with the field observations at the riffle cross section.The agreement between the predicted and measured bedvelocity at both the pool and riffle sections for the threedischarges at which data is available indicates that theUnTRIM model is accurately simulating flow in Dry Creekat these discharges.[26] The velocity measurements collected at 0.6 times the
depth at the pool and riffle cross sections are compared withthe predicted depth-averaged velocity from FESWMS onFigures 7. At the pool cross section the predicted depth-averaged velocity agrees well with the observed velocity at0.6 times the depth for the 0.42 m3/s discharge except at adistance of 14 m along the section where velocities wereobserved to be zero. For the 0.97 m3/s discharge FESWMSslightly overpredicts velocities between 12 and 14 m alongthe section, and slightly under predicts velocity between 18and 20 m. At the riffle cross section, the velocities predictedfor the 0.42 m3/s discharge show good agreement withobserved velocities, while FESWMS consistently predictslower velocities than the observed velocities at the0.97 m3/s. Differences between the observed velocity andthe depth-averaged velocity predicted by FESWMS mayresult from the assumption that the velocity at 0.6 times thedepth is equivalent to the depth-averaged values. Forexample, since the observed and predicted water surfaceand cross-sectional area at the riffle cross section (Figure 4)is nearly identical and the flow rates are identical, consis-tently higher observed depth-averaged velocities at the0.97 m3/s discharge is not consistent with continuity. Giventhis limitation in assuming that the velocity at 0.6 times thedepth is equivalent to the depth-averaged values, the depth-
Figure 4. Predicted and observed water surface elevations at the (a) pool and (b) riffle cross sections for0.42, 0.97, and 4.5 m3/s discharges.
W10427 MACWILLIAMS ET AL.: FLOW CONVERGENCE ROUTING HYPOTHESIS
9 of 21
W10427
averaged velocities predicted by FESWMS show a reason-able agreement with the observed values.
3.3. Section-Averaged Velocity
[27] The predicted cross-sectional average velocities atthe pool and riffle cross sections are shown as a function of
discharge in Figure 8. For all flows, the HEC-RAS model[Keller and Florsheim, 1993] predicted a somewhat lowermean velocity (larger cross-sectional area) at the riffle crosssection than the 2-D and 3-D models, with the largestdifferences occurring for the lower discharges. The 2-Dand 3-D models show better agreement with the field data
Figure 5. Predicted and observed near-bottom velocity at pool cross section for 0.42, 0.97, and 4.5 m3/sdischarges.
Figure 6. Predicted and observed near-bottom velocity at riffle cross section for 0.42, 0.97, and 4.5 m3/sdischarges.
10 of 21
W10427 MACWILLIAMS ET AL.: FLOW CONVERGENCE ROUTING HYPOTHESIS W10427

for the riffle cross section. At the pool cross sections, allthree models consistently underpredict the cross-sectionalaverage velocity relative to the observed value at the0.42 m3/s discharge, and overpredict the cross-sectionalaverage velocity at the 0.97 m3/s discharge. All threemodels show good agreement with the observed cross-
sectional average velocity at the pool cross section for the4.5 m3/s discharge. This is consistent with the differences inpredicted and observed cross-sectional area at the pool crosssection shown in Figure 4. Using HEC-RAS, Keller andFlorsheim [1993] predicted a reversal in mean velocity atapproximately 3.3 m3/s. The FESWMS (2-D) simulation
Figure 7. Observed velocity at 0.6 times the depth and predicted depth average velocity from FESWMSand for 0.42 and 0.97 m3/s discharges at the (a) pool and (b) riffle cross sections.
Figure 8. Mean cross-section velocity as a function of discharge at pool and riffle cross sections fromfield measurements [Keller, 1969] and predicted using a 1-D model [Keller and Florsheim, 1993], 2-Dmodel (FESWMS), and 3-D model (UnTRIM).
W10427 MACWILLIAMS ET AL.: FLOW CONVERGENCE ROUTING HYPOTHESIS
11 of 21
W10427
predicts a reversal in cross-sectional average velocity atapproximately 5.9 m3/s, and the UnTRIM (3-D) simulationresults predict a reversal in mean cross-sectional velocity ata discharge of approximately 3.8 m3/s. This analysis showsthat all three models predict a reversal in cross-sectionalaverage velocity for this pool-riffle sequence on Dry Creek.
3.4. Bed Shear Stress
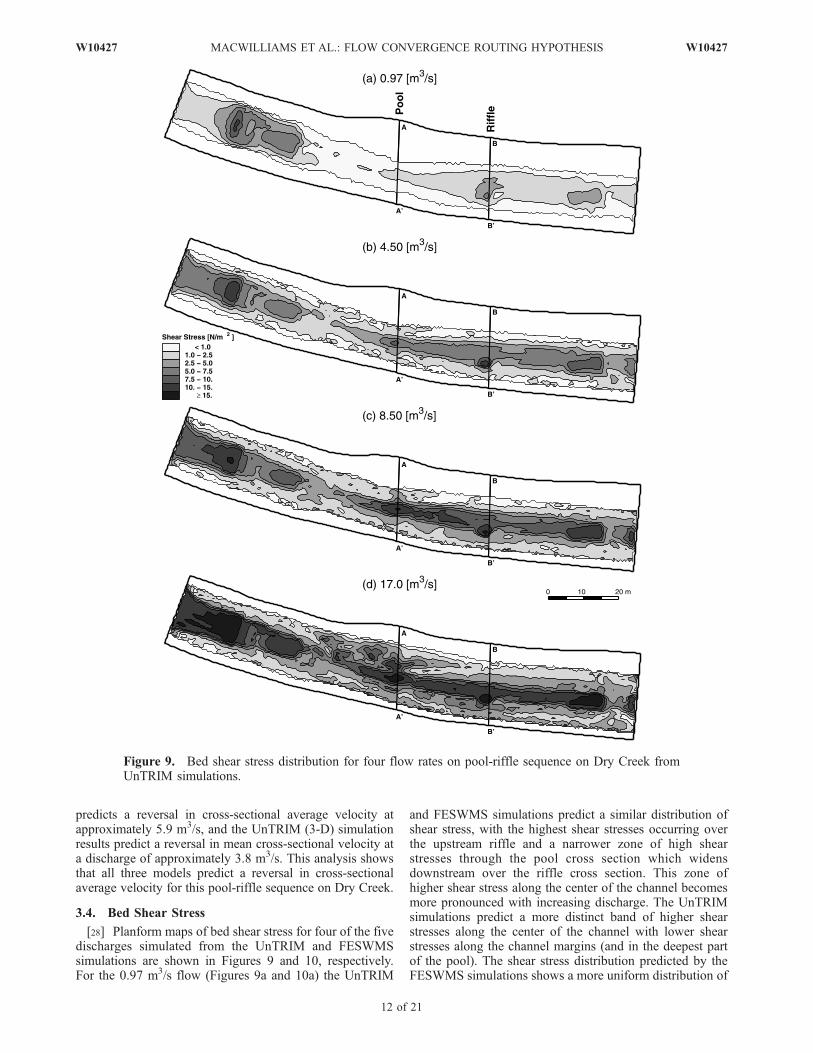
[28] Planform maps of bed shear stress for four of the fivedischarges simulated from the UnTRIM and FESWMSsimulations are shown in Figures 9 and 10, respectively.For the 0.97 m3/s flow (Figures 9a and 10a) the UnTRIM
and FESWMS simulations predict a similar distribution ofshear stress, with the highest shear stresses occurring overthe upstream riffle and a narrower zone of high shearstresses through the pool cross section which widensdownstream over the riffle cross section. This zone ofhigher shear stress along the center of the channel becomesmore pronounced with increasing discharge. The UnTRIMsimulations predict a more distinct band of higher shearstresses along the center of the channel with lower shearstresses along the channel margins (and in the deepest partof the pool). The shear stress distribution predicted by theFESWMS simulations shows a more uniform distribution of
Figure 9. Bed shear stress distribution for four flow rates on pool-riffle sequence on Dry Creek fromUnTRIM simulations.
12 of 21
W10427 MACWILLIAMS ET AL.: FLOW CONVERGENCE ROUTING HYPOTHESIS W10427
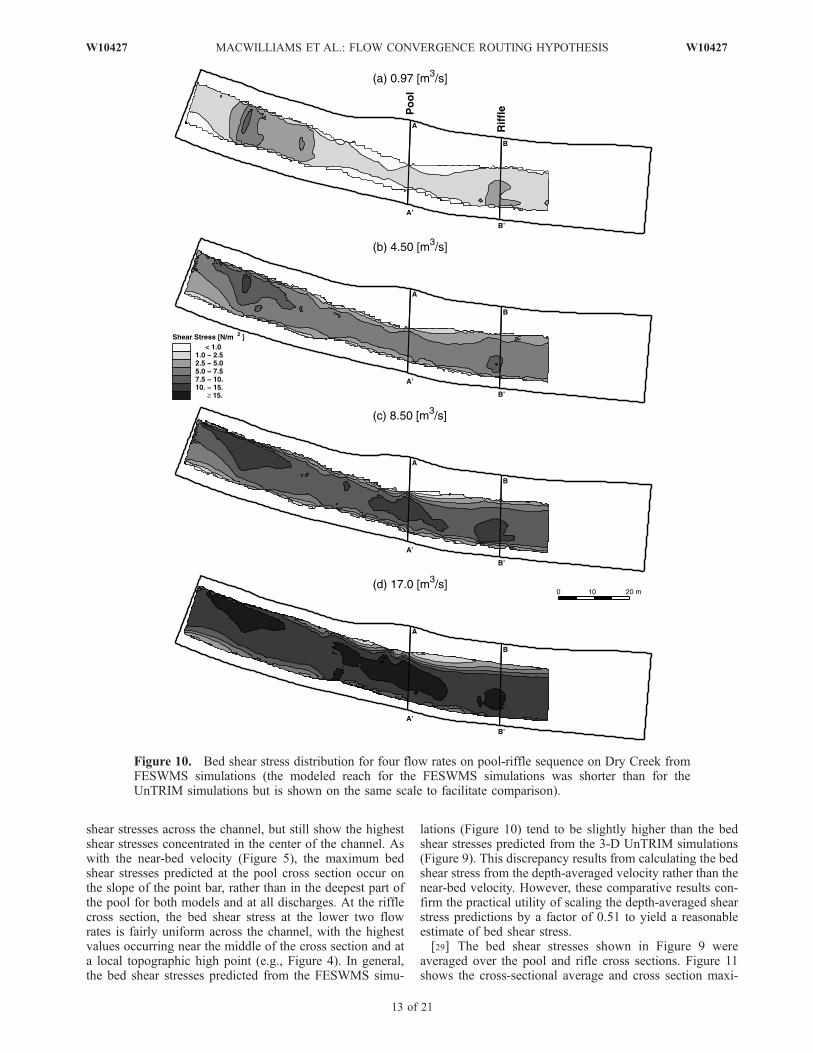
shear stresses across the channel, but still show the highestshear stresses concentrated in the center of the channel. Aswith the near-bed velocity (Figure 5), the maximum bedshear stresses predicted at the pool cross section occur onthe slope of the point bar, rather than in the deepest part ofthe pool for both models and at all discharges. At the rifflecross section, the bed shear stress at the lower two flowrates is fairly uniform across the channel, with the highestvalues occurring near the middle of the cross section and ata local topographic high point (e.g., Figure 4). In general,the bed shear stresses predicted from the FESWMS simu-
lations (Figure 10) tend to be slightly higher than the bedshear stresses predicted from the 3-D UnTRIM simulations(Figure 9). This discrepancy results from calculating the bedshear stress from the depth-averaged velocity rather than thenear-bed velocity. However, these comparative results con-firm the practical utility of scaling the depth-averaged shearstress predictions by a factor of 0.51 to yield a reasonableestimate of bed shear stress.[29] The bed shear stresses shown in Figure 9 were
averaged over the pool and rifle cross sections. Figure 11shows the cross-sectional average and cross section maxi-
Figure 10. Bed shear stress distribution for four flow rates on pool-riffle sequence on Dry Creek fromFESWMS simulations (the modeled reach for the FESWMS simulations was shorter than for theUnTRIM simulations but is shown on the same scale to facilitate comparison).
W10427 MACWILLIAMS ET AL.: FLOW CONVERGENCE ROUTING HYPOTHESIS
13 of 21
W10427
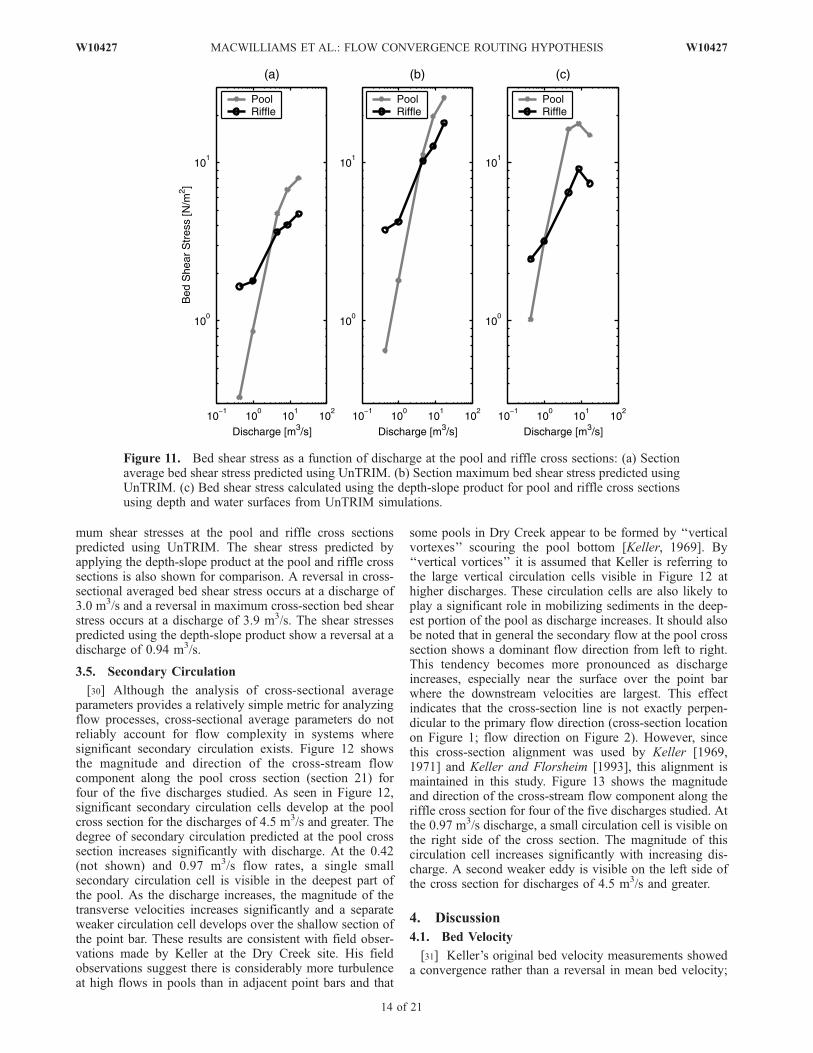
mum shear stresses at the pool and riffle cross sectionspredicted using UnTRIM. The shear stress predicted byapplying the depth-slope product at the pool and riffle crosssections is also shown for comparison. A reversal in cross-sectional averaged bed shear stress occurs at a discharge of3.0 m3/s and a reversal in maximum cross-section bed shearstress occurs at a discharge of 3.9 m3/s. The shear stressespredicted using the depth-slope product show a reversal at adischarge of 0.94 m3/s.
3.5. Secondary Circulation
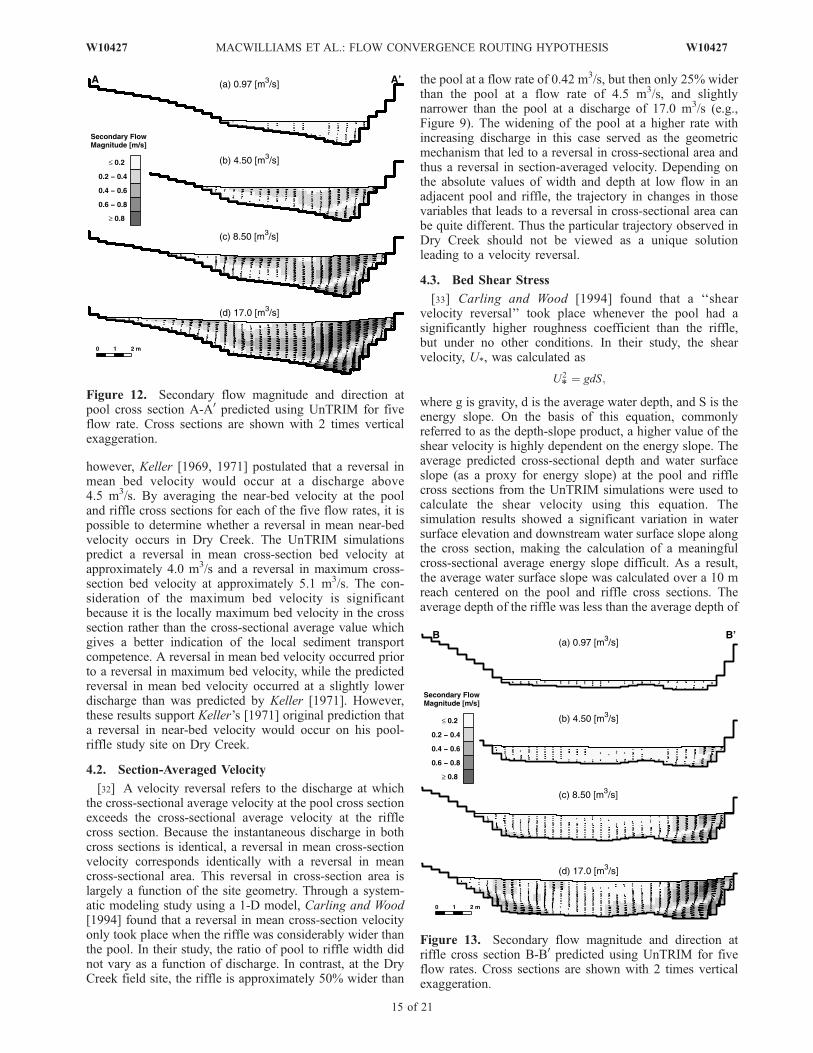
[30] Although the analysis of cross-sectional averageparameters provides a relatively simple metric for analyzingflow processes, cross-sectional average parameters do notreliably account for flow complexity in systems wheresignificant secondary circulation exists. Figure 12 showsthe magnitude and direction of the cross-stream flowcomponent along the pool cross section (section 21) forfour of the five discharges studied. As seen in Figure 12,significant secondary circulation cells develop at the poolcross section for the discharges of 4.5 m3/s and greater. Thedegree of secondary circulation predicted at the pool crosssection increases significantly with discharge. At the 0.42(not shown) and 0.97 m3/s flow rates, a single smallsecondary circulation cell is visible in the deepest part ofthe pool. As the discharge increases, the magnitude of thetransverse velocities increases significantly and a separateweaker circulation cell develops over the shallow section ofthe point bar. These results are consistent with field obser-vations made by Keller at the Dry Creek site. His fieldobservations suggest there is considerably more turbulenceat high flows in pools than in adjacent point bars and that
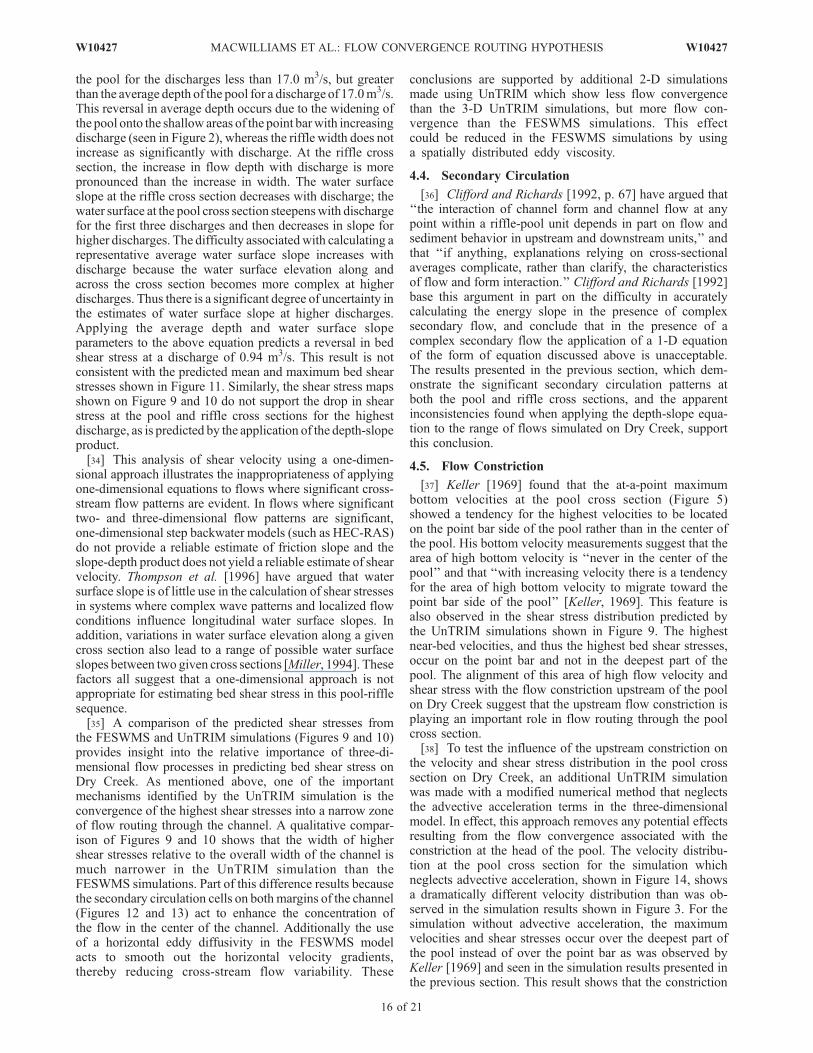
some pools in Dry Creek appear to be formed by ‘‘verticalvortexes’’ scouring the pool bottom [Keller, 1969]. By‘‘vertical vortices’’ it is assumed that Keller is referring tothe large vertical circulation cells visible in Figure 12 athigher discharges. These circulation cells are also likely toplay a significant role in mobilizing sediments in the deep-est portion of the pool as discharge increases. It should alsobe noted that in general the secondary flow at the pool crosssection shows a dominant flow direction from left to right.This tendency becomes more pronounced as dischargeincreases, especially near the surface over the point barwhere the downstream velocities are largest. This effectindicates that the cross-section line is not exactly perpen-dicular to the primary flow direction (cross-section locationon Figure 1; flow direction on Figure 2). However, sincethis cross-section alignment was used by Keller [1969,1971] and Keller and Florsheim [1993], this alignment ismaintained in this study. Figure 13 shows the magnitudeand direction of the cross-stream flow component along theriffle cross section for four of the five discharges studied. Atthe 0.97 m3/s discharge, a small circulation cell is visible onthe right side of the cross section. The magnitude of thiscirculation cell increases significantly with increasing dis-charge. A second weaker eddy is visible on the left side ofthe cross section for discharges of 4.5 m3/s and greater.
4. Discussion
4.1. Bed Velocity
[31] Keller’s original bed velocity measurements showeda convergence rather than a reversal in mean bed velocity;
Figure 11. Bed shear stress as a function of discharge at the pool and riffle cross sections: (a) Sectionaverage bed shear stress predicted using UnTRIM. (b) Section maximum bed shear stress predicted usingUnTRIM. (c) Bed shear stress calculated using the depth-slope product for pool and riffle cross sectionsusing depth and water surfaces from UnTRIM simulations.
14 of 21
W10427 MACWILLIAMS ET AL.: FLOW CONVERGENCE ROUTING HYPOTHESIS W10427
however, Keller [1969, 1971] postulated that a reversal inmean bed velocity would occur at a discharge above4.5 m3/s. By averaging the near-bed velocity at the pooland riffle cross sections for each of the five flow rates, it ispossible to determine whether a reversal in mean near-bedvelocity occurs in Dry Creek. The UnTRIM simulationspredict a reversal in mean cross-section bed velocity atapproximately 4.0 m3/s and a reversal in maximum cross-section bed velocity at approximately 5.1 m3/s. The con-sideration of the maximum bed velocity is significantbecause it is the locally maximum bed velocity in the crosssection rather than the cross-sectional average value whichgives a better indication of the local sediment transportcompetence. A reversal in mean bed velocity occurred priorto a reversal in maximum bed velocity, while the predictedreversal in mean bed velocity occurred at a slightly lowerdischarge than was predicted by Keller [1971]. However,these results support Keller’s [1971] original prediction thata reversal in near-bed velocity would occur on his pool-riffle study site on Dry Creek.
4.2. Section-Averaged Velocity
[32] A velocity reversal refers to the discharge at whichthe cross-sectional average velocity at the pool cross sectionexceeds the cross-sectional average velocity at the rifflecross section. Because the instantaneous discharge in bothcross sections is identical, a reversal in mean cross-sectionvelocity corresponds identically with a reversal in meancross-sectional area. This reversal in cross-section area islargely a function of the site geometry. Through a system-atic modeling study using a 1-D model, Carling and Wood[1994] found that a reversal in mean cross-section velocityonly took place when the riffle was considerably wider thanthe pool. In their study, the ratio of pool to riffle width didnot vary as a function of discharge. In contrast, at the DryCreek field site, the riffle is approximately 50% wider than
the pool at a flow rate of 0.42 m3/s, but then only 25% widerthan the pool at a flow rate of 4.5 m3/s, and slightlynarrower than the pool at a discharge of 17.0 m3/s (e.g.,Figure 9). The widening of the pool at a higher rate withincreasing discharge in this case served as the geometricmechanism that led to a reversal in cross-sectional area andthus a reversal in section-averaged velocity. Depending onthe absolute values of width and depth at low flow in anadjacent pool and riffle, the trajectory in changes in thosevariables that leads to a reversal in cross-sectional area canbe quite different. Thus the particular trajectory observed inDry Creek should not be viewed as a unique solutionleading to a velocity reversal.
4.3. Bed Shear Stress
[33] Carling and Wood [1994] found that a ‘‘shearvelocity reversal’’ took place whenever the pool had asignificantly higher roughness coefficient than the riffle,but under no other conditions. In their study, the shearvelocity, U*, was calculated as
U2
* ¼ gdS;
where g is gravity, d is the average water depth, and S is theenergy slope. On the basis of this equation, commonlyreferred to as the depth-slope product, a higher value of theshear velocity is highly dependent on the energy slope. Theaverage predicted cross-sectional depth and water surfaceslope (as a proxy for energy slope) at the pool and rifflecross sections from the UnTRIM simulations were used tocalculate the shear velocity using this equation. Thesimulation results showed a significant variation in watersurface elevation and downstream water surface slope alongthe cross section, making the calculation of a meaningfulcross-sectional average energy slope difficult. As a result,the average water surface slope was calculated over a 10 mreach centered on the pool and riffle cross sections. Theaverage depth of the riffle was less than the average depth of
Figure 12. Secondary flow magnitude and direction atpool cross section A-A0 predicted using UnTRIM for fiveflow rate. Cross sections are shown with 2 times verticalexaggeration.
Figure 13. Secondary flow magnitude and direction atriffle cross section B-B0 predicted using UnTRIM for fiveflow rates. Cross sections are shown with 2 times verticalexaggeration.
W10427 MACWILLIAMS ET AL.: FLOW CONVERGENCE ROUTING HYPOTHESIS
15 of 21
W10427
the pool for the discharges less than 17.0 m3/s, but greaterthan the average depth of the pool for a discharge of 17.0m3/s.This reversal in average depth occurs due to the widening ofthe pool onto the shallow areas of the point barwith increasingdischarge (seen in Figure 2), whereas the riffle width does notincrease as significantly with discharge. At the riffle crosssection, the increase in flow depth with discharge is morepronounced than the increase in width. The water surfaceslope at the riffle cross section decreases with discharge; thewater surface at the pool cross section steepenswith dischargefor the first three discharges and then decreases in slope forhigher discharges. The difficulty associatedwith calculating arepresentative average water surface slope increases withdischarge because the water surface elevation along andacross the cross section becomes more complex at higherdischarges. Thus there is a significant degree of uncertainty inthe estimates of water surface slope at higher discharges.Applying the average depth and water surface slopeparameters to the above equation predicts a reversal in bedshear stress at a discharge of 0.94 m3/s. This result is notconsistent with the predicted mean and maximum bed shearstresses shown in Figure 11. Similarly, the shear stress mapsshown on Figure 9 and 10 do not support the drop in shearstress at the pool and riffle cross sections for the highestdischarge, as is predicted by the application of the depth-slopeproduct.[34] This analysis of shear velocity using a one-dimen-
sional approach illustrates the inappropriateness of applyingone-dimensional equations to flows where significant cross-stream flow patterns are evident. In flows where significanttwo- and three-dimensional flow patterns are significant,one-dimensional step backwater models (such as HEC-RAS)do not provide a reliable estimate of friction slope and theslope-depth product does not yield a reliable estimate of shearvelocity. Thompson et al. [1996] have argued that watersurface slope is of little use in the calculation of shear stressesin systems where complex wave patterns and localized flowconditions influence longitudinal water surface slopes. Inaddition, variations in water surface elevation along a givencross section also lead to a range of possible water surfaceslopes between two given cross sections [Miller, 1994]. Thesefactors all suggest that a one-dimensional approach is notappropriate for estimating bed shear stress in this pool-rifflesequence.[35] A comparison of the predicted shear stresses from
the FESWMS and UnTRIM simulations (Figures 9 and 10)provides insight into the relative importance of three-di-mensional flow processes in predicting bed shear stress onDry Creek. As mentioned above, one of the importantmechanisms identified by the UnTRIM simulation is theconvergence of the highest shear stresses into a narrow zoneof flow routing through the channel. A qualitative compar-ison of Figures 9 and 10 shows that the width of highershear stresses relative to the overall width of the channel ismuch narrower in the UnTRIM simulation than theFESWMS simulations. Part of this difference results becausethe secondary circulation cells on bothmargins of the channel(Figures 12 and 13) act to enhance the concentration ofthe flow in the center of the channel. Additionally the useof a horizontal eddy diffusivity in the FESWMS modelacts to smooth out the horizontal velocity gradients,thereby reducing cross-stream flow variability. These
conclusions are supported by additional 2-D simulationsmade using UnTRIM which show less flow convergencethan the 3-D UnTRIM simulations, but more flow con-vergence than the FESWMS simulations. This effectcould be reduced in the FESWMS simulations by usinga spatially distributed eddy viscosity.
4.4. Secondary Circulation
[36] Clifford and Richards [1992, p. 67] have argued that‘‘the interaction of channel form and channel flow at anypoint within a riffle-pool unit depends in part on flow andsediment behavior in upstream and downstream units,’’ andthat ‘‘if anything, explanations relying on cross-sectionalaverages complicate, rather than clarify, the characteristicsof flow and form interaction.’’ Clifford and Richards [1992]base this argument in part on the difficulty in accuratelycalculating the energy slope in the presence of complexsecondary flow, and conclude that in the presence of acomplex secondary flow the application of a 1-D equationof the form of equation discussed above is unacceptable.The results presented in the previous section, which dem-onstrate the significant secondary circulation patterns atboth the pool and riffle cross sections, and the apparentinconsistencies found when applying the depth-slope equa-tion to the range of flows simulated on Dry Creek, supportthis conclusion.
4.5. Flow Constriction
[37] Keller [1969] found that the at-a-point maximumbottom velocities at the pool cross section (Figure 5)showed a tendency for the highest velocities to be locatedon the point bar side of the pool rather than in the center ofthe pool. His bottom velocity measurements suggest that thearea of high bottom velocity is ‘‘never in the center of thepool’’ and that ‘‘with increasing velocity there is a tendencyfor the area of high bottom velocity to migrate toward thepoint bar side of the pool’’ [Keller, 1969]. This feature isalso observed in the shear stress distribution predicted bythe UnTRIM simulations shown in Figure 9. The highestnear-bed velocities, and thus the highest bed shear stresses,occur on the point bar and not in the deepest part of thepool. The alignment of this area of high flow velocity andshear stress with the flow constriction upstream of the poolon Dry Creek suggest that the upstream flow constriction isplaying an important role in flow routing through the poolcross section.[38] To test the influence of the upstream constriction on
the velocity and shear stress distribution in the pool crosssection on Dry Creek, an additional UnTRIM simulationwas made with a modified numerical method that neglectsthe advective acceleration terms in the three-dimensionalmodel. In effect, this approach removes any potential effectsresulting from the flow convergence associated with theconstriction at the head of the pool. The velocity distribu-tion at the pool cross section for the simulation whichneglects advective acceleration, shown in Figure 14, showsa dramatically different velocity distribution than was ob-served in the simulation results shown in Figure 3. For thesimulation without advective acceleration, the maximumvelocities and shear stresses occur over the deepest part ofthe pool instead of over the point bar as was observed byKeller [1969] and seen in the simulation results presented inthe previous section. This result shows that the constriction
16 of 21
W10427 MACWILLIAMS ET AL.: FLOW CONVERGENCE ROUTING HYPOTHESIS W10427
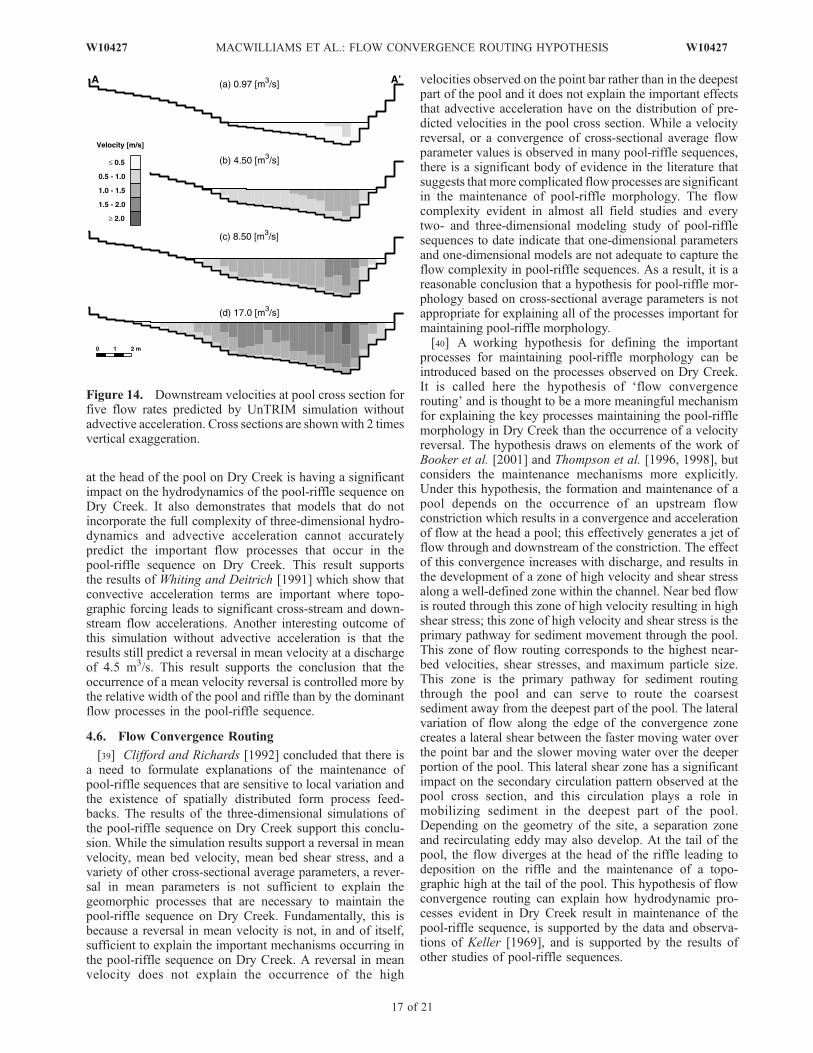
at the head of the pool on Dry Creek is having a significantimpact on the hydrodynamics of the pool-riffle sequence onDry Creek. It also demonstrates that models that do notincorporate the full complexity of three-dimensional hydro-dynamics and advective acceleration cannot accuratelypredict the important flow processes that occur in thepool-riffle sequence on Dry Creek. This result supportsthe results of Whiting and Deitrich [1991] which show thatconvective acceleration terms are important where topo-graphic forcing leads to significant cross-stream and down-stream flow accelerations. Another interesting outcome ofthis simulation without advective acceleration is that theresults still predict a reversal in mean velocity at a dischargeof 4.5 m3/s. This result supports the conclusion that theoccurrence of a mean velocity reversal is controlled more bythe relative width of the pool and riffle than by the dominantflow processes in the pool-riffle sequence.
4.6. Flow Convergence Routing
[39] Clifford and Richards [1992] concluded that there isa need to formulate explanations of the maintenance ofpool-riffle sequences that are sensitive to local variation andthe existence of spatially distributed form process feed-backs. The results of the three-dimensional simulations ofthe pool-riffle sequence on Dry Creek support this conclu-sion. While the simulation results support a reversal in meanvelocity, mean bed velocity, mean bed shear stress, and avariety of other cross-sectional average parameters, a rever-sal in mean parameters is not sufficient to explain thegeomorphic processes that are necessary to maintain thepool-riffle sequence on Dry Creek. Fundamentally, this isbecause a reversal in mean velocity is not, in and of itself,sufficient to explain the important mechanisms occurring inthe pool-riffle sequence on Dry Creek. A reversal in meanvelocity does not explain the occurrence of the high
velocities observed on the point bar rather than in the deepestpart of the pool and it does not explain the important effectsthat advective acceleration have on the distribution of pre-dicted velocities in the pool cross section. While a velocityreversal, or a convergence of cross-sectional average flowparameter values is observed in many pool-riffle sequences,there is a significant body of evidence in the literature thatsuggests that more complicated flow processes are significantin the maintenance of pool-riffle morphology. The flowcomplexity evident in almost all field studies and everytwo- and three-dimensional modeling study of pool-rifflesequences to date indicate that one-dimensional parametersand one-dimensional models are not adequate to capture theflow complexity in pool-riffle sequences. As a result, it is areasonable conclusion that a hypothesis for pool-riffle mor-phology based on cross-sectional average parameters is notappropriate for explaining all of the processes important formaintaining pool-riffle morphology.[40] A working hypothesis for defining the important
processes for maintaining pool-riffle morphology can beintroduced based on the processes observed on Dry Creek.It is called here the hypothesis of ‘flow convergencerouting’ and is thought to be a more meaningful mechanismfor explaining the key processes maintaining the pool-rifflemorphology in Dry Creek than the occurrence of a velocityreversal. The hypothesis draws on elements of the work ofBooker et al. [2001] and Thompson et al. [1996, 1998], butconsiders the maintenance mechanisms more explicitly.Under this hypothesis, the formation and maintenance of apool depends on the occurrence of an upstream flowconstriction which results in a convergence and accelerationof flow at the head a pool; this effectively generates a jet offlow through and downstream of the constriction. The effectof this convergence increases with discharge, and results inthe development of a zone of high velocity and shear stressalong a well-defined zone within the channel. Near bed flowis routed through this zone of high velocity resulting in highshear stress; this zone of high velocity and shear stress is theprimary pathway for sediment movement through the pool.This zone of flow routing corresponds to the highest near-bed velocities, shear stresses, and maximum particle size.This zone is the primary pathway for sediment routingthrough the pool and can serve to route the coarsestsediment away from the deepest part of the pool. The lateralvariation of flow along the edge of the convergence zonecreates a lateral shear between the faster moving water overthe point bar and the slower moving water over the deeperportion of the pool. This lateral shear zone has a significantimpact on the secondary circulation pattern observed at thepool cross section, and this circulation plays a role inmobilizing sediment in the deepest part of the pool.Depending on the geometry of the site, a separation zoneand recirculating eddy may also develop. At the tail of thepool, the flow diverges at the head of the riffle leading todeposition on the riffle and the maintenance of a topo-graphic high at the tail of the pool. This hypothesis of flowconvergence routing can explain how hydrodynamic pro-cesses evident in Dry Creek result in maintenance of thepool-riffle sequence, is supported by the data and observa-tions of Keller [1969], and is supported by the results ofother studies of pool-riffle sequences.
Figure 14. Downstream velocities at pool cross section forfive flow rates predicted by UnTRIM simulation withoutadvective acceleration. Cross sections are shownwith 2 timesvertical exaggeration.
W10427 MACWILLIAMS ET AL.: FLOW CONVERGENCE ROUTING HYPOTHESIS
17 of 21
W10427
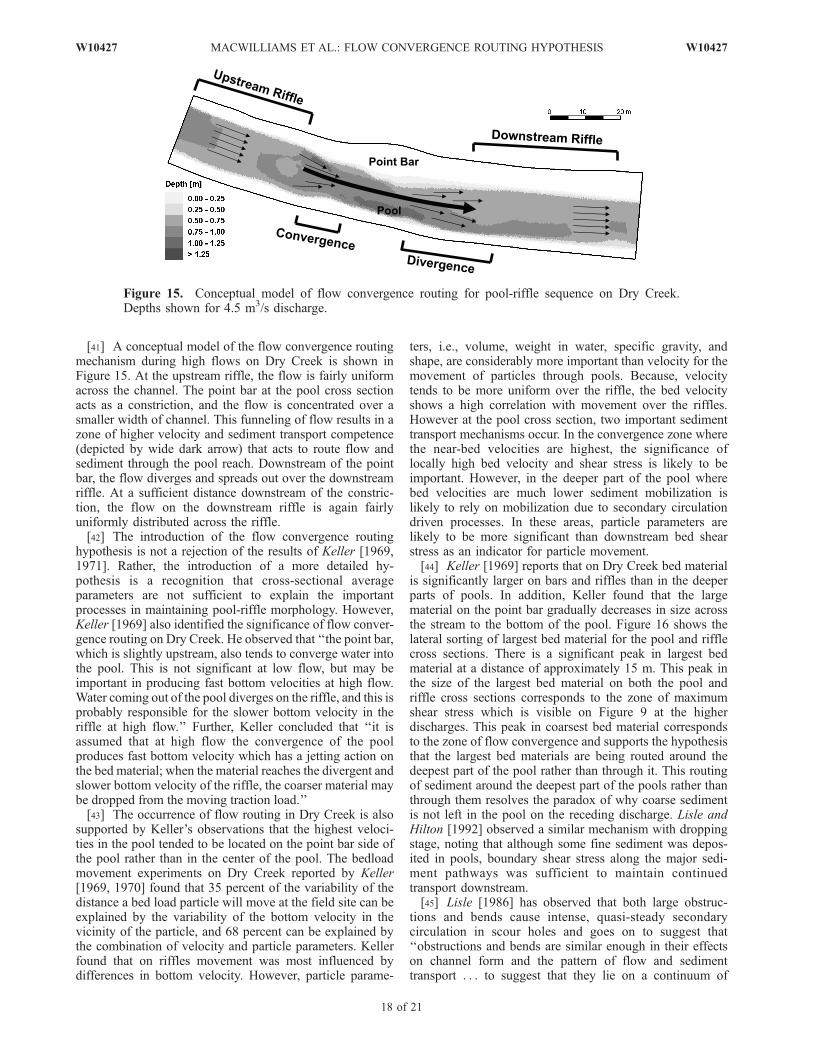
[41] A conceptual model of the flow convergence routingmechanism during high flows on Dry Creek is shown inFigure 15. At the upstream riffle, the flow is fairly uniformacross the channel. The point bar at the pool cross sectionacts as a constriction, and the flow is concentrated over asmaller width of channel. This funneling of flow results in azone of higher velocity and sediment transport competence(depicted by wide dark arrow) that acts to route flow andsediment through the pool reach. Downstream of the pointbar, the flow diverges and spreads out over the downstreamriffle. At a sufficient distance downstream of the constric-tion, the flow on the downstream riffle is again fairlyuniformly distributed across the riffle.[42] The introduction of the flow convergence routing
hypothesis is not a rejection of the results of Keller [1969,1971]. Rather, the introduction of a more detailed hy-pothesis is a recognition that cross-sectional averageparameters are not sufficient to explain the importantprocesses in maintaining pool-riffle morphology. However,Keller [1969] also identified the significance of flow conver-gence routing on Dry Creek. He observed that ‘‘the point bar,which is slightly upstream, also tends to converge water intothe pool. This is not significant at low flow, but may beimportant in producing fast bottom velocities at high flow.Water coming out of the pool diverges on the riffle, and this isprobably responsible for the slower bottom velocity in theriffle at high flow.’’ Further, Keller concluded that ‘‘it isassumed that at high flow the convergence of the poolproduces fast bottom velocity which has a jetting action onthe bed material; when the material reaches the divergent andslower bottom velocity of the riffle, the coarser material maybe dropped from the moving traction load.’’[43] The occurrence of flow routing in Dry Creek is also
supported by Keller’s observations that the highest veloci-ties in the pool tended to be located on the point bar side ofthe pool rather than in the center of the pool. The bedloadmovement experiments on Dry Creek reported by Keller[1969, 1970] found that 35 percent of the variability of thedistance a bed load particle will move at the field site can beexplained by the variability of the bottom velocity in thevicinity of the particle, and 68 percent can be explained bythe combination of velocity and particle parameters. Kellerfound that on riffles movement was most influenced bydifferences in bottom velocity. However, particle parame-
ters, i.e., volume, weight in water, specific gravity, andshape, are considerably more important than velocity for themovement of particles through pools. Because, velocitytends to be more uniform over the riffle, the bed velocityshows a high correlation with movement over the riffles.However at the pool cross section, two important sedimenttransport mechanisms occur. In the convergence zone wherethe near-bed velocities are highest, the significance oflocally high bed velocity and shear stress is likely to beimportant. However, in the deeper part of the pool wherebed velocities are much lower sediment mobilization islikely to rely on mobilization due to secondary circulationdriven processes. In these areas, particle parameters arelikely to be more significant than downstream bed shearstress as an indicator for particle movement.[44] Keller [1969] reports that on Dry Creek bed material
is significantly larger on bars and riffles than in the deeperparts of pools. In addition, Keller found that the largematerial on the point bar gradually decreases in size acrossthe stream to the bottom of the pool. Figure 16 shows thelateral sorting of largest bed material for the pool and rifflecross sections. There is a significant peak in largest bedmaterial at a distance of approximately 15 m. This peak inthe size of the largest bed material on both the pool andriffle cross sections corresponds to the zone of maximumshear stress which is visible on Figure 9 at the higherdischarges. This peak in coarsest bed material correspondsto the zone of flow convergence and supports the hypothesisthat the largest bed materials are being routed around thedeepest part of the pool rather than through it. This routingof sediment around the deepest part of the pools rather thanthrough them resolves the paradox of why coarse sedimentis not left in the pool on the receding discharge. Lisle andHilton [1992] observed a similar mechanism with droppingstage, noting that although some fine sediment was depos-ited in pools, boundary shear stress along the major sedi-ment pathways was sufficient to maintain continuedtransport downstream.[45] Lisle [1986] has observed that both large obstruc-
tions and bends cause intense, quasi-steady secondarycirculation in scour holes and goes on to suggest that‘‘obstructions and bends are similar enough in their effectson channel form and the pattern of flow and sedimenttransport . . . to suggest that they lie on a continuum of
Figure 15. Conceptual model of flow convergence routing for pool-riffle sequence on Dry Creek.Depths shown for 4.5 m3/s discharge.
18 of 21
W10427 MACWILLIAMS ET AL.: FLOW CONVERGENCE ROUTING HYPOTHESIS W10427
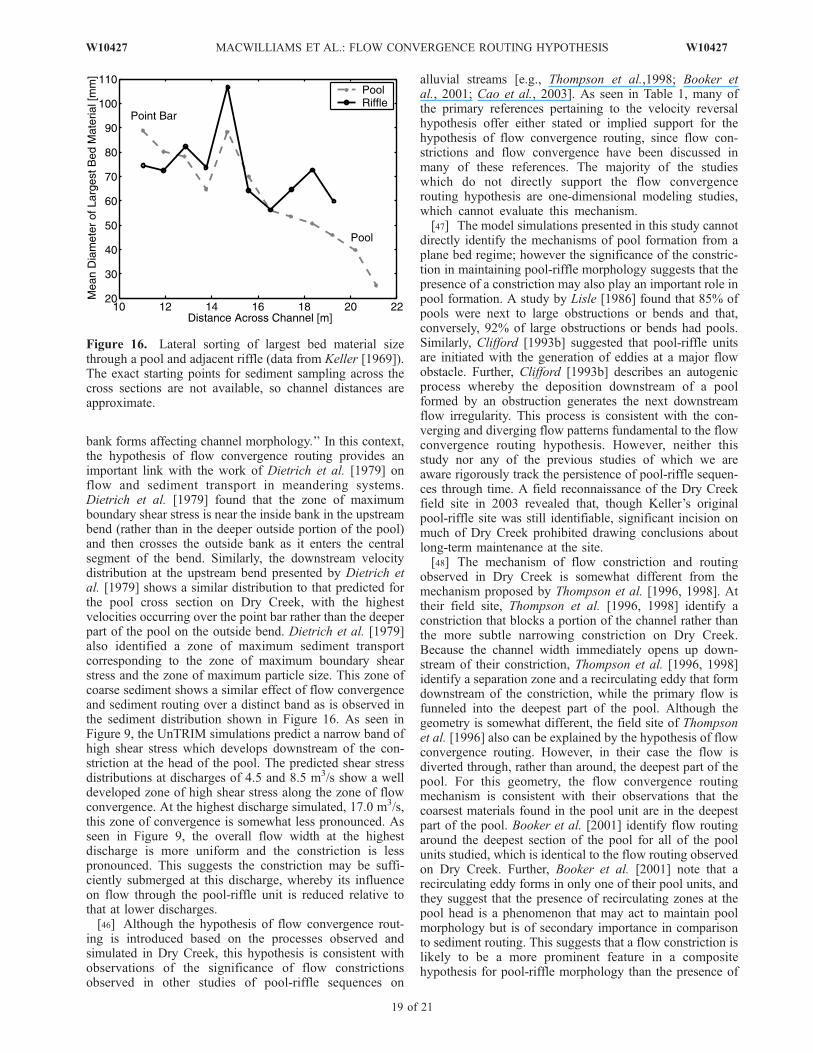
bank forms affecting channel morphology.’’ In this context,the hypothesis of flow convergence routing provides animportant link with the work of Dietrich et al. [1979] onflow and sediment transport in meandering systems.Dietrich et al. [1979] found that the zone of maximumboundary shear stress is near the inside bank in the upstreambend (rather than in the deeper outside portion of the pool)and then crosses the outside bank as it enters the centralsegment of the bend. Similarly, the downstream velocitydistribution at the upstream bend presented by Dietrich etal. [1979] shows a similar distribution to that predicted forthe pool cross section on Dry Creek, with the highestvelocities occurring over the point bar rather than the deeperpart of the pool on the outside bend. Dietrich et al. [1979]also identified a zone of maximum sediment transportcorresponding to the zone of maximum boundary shearstress and the zone of maximum particle size. This zone ofcoarse sediment shows a similar effect of flow convergenceand sediment routing over a distinct band as is observed inthe sediment distribution shown in Figure 16. As seen inFigure 9, the UnTRIM simulations predict a narrow band ofhigh shear stress which develops downstream of the con-striction at the head of the pool. The predicted shear stressdistributions at discharges of 4.5 and 8.5 m3/s show a welldeveloped zone of high shear stress along the zone of flowconvergence. At the highest discharge simulated, 17.0 m3/s,this zone of convergence is somewhat less pronounced. Asseen in Figure 9, the overall flow width at the highestdischarge is more uniform and the constriction is lesspronounced. This suggests the constriction may be suffi-ciently submerged at this discharge, whereby its influenceon flow through the pool-riffle unit is reduced relative tothat at lower discharges.[46] Although the hypothesis of flow convergence rout-
ing is introduced based on the processes observed andsimulated in Dry Creek, this hypothesis is consistent withobservations of the significance of flow constrictionsobserved in other studies of pool-riffle sequences on
alluvial streams [e.g., Thompson et al.,1998; Booker etal., 2001; Cao et al., 2003]. As seen in Table 1, many ofthe primary references pertaining to the velocity reversalhypothesis offer either stated or implied support for thehypothesis of flow convergence routing, since flow con-strictions and flow convergence have been discussed inmany of these references. The majority of the studieswhich do not directly support the flow convergencerouting hypothesis are one-dimensional modeling studies,which cannot evaluate this mechanism.[47] The model simulations presented in this study cannot
directly identify the mechanisms of pool formation from aplane bed regime; however the significance of the constric-tion in maintaining pool-riffle morphology suggests that thepresence of a constriction may also play an important role inpool formation. A study by Lisle [1986] found that 85% ofpools were next to large obstructions or bends and that,conversely, 92% of large obstructions or bends had pools.Similarly, Clifford [1993b] suggested that pool-riffle unitsare initiated with the generation of eddies at a major flowobstacle. Further, Clifford [1993b] describes an autogenicprocess whereby the deposition downstream of a poolformed by an obstruction generates the next downstreamflow irregularity. This process is consistent with the con-verging and diverging flow patterns fundamental to the flowconvergence routing hypothesis. However, neither thisstudy nor any of the previous studies of which we areaware rigorously track the persistence of pool-riffle sequen-ces through time. A field reconnaissance of the Dry Creekfield site in 2003 revealed that, though Keller’s originalpool-riffle site was still identifiable, significant incision onmuch of Dry Creek prohibited drawing conclusions aboutlong-term maintenance at the site.[48] The mechanism of flow constriction and routing
observed in Dry Creek is somewhat different from themechanism proposed by Thompson et al. [1996, 1998]. Attheir field site, Thompson et al. [1996, 1998] identify aconstriction that blocks a portion of the channel rather thanthe more subtle narrowing constriction on Dry Creek.Because the channel width immediately opens up down-stream of their constriction, Thompson et al. [1996, 1998]identify a separation zone and a recirculating eddy that formdownstream of the constriction, while the primary flow isfunneled into the deepest part of the pool. Although thegeometry is somewhat different, the field site of Thompsonet al. [1996] also can be explained by the hypothesis of flowconvergence routing. However, in their case the flow isdiverted through, rather than around, the deepest part of thepool. For this geometry, the flow convergence routingmechanism is consistent with their observations that thecoarsest materials found in the pool unit are in the deepestpart of the pool. Booker et al. [2001] identify flow routingaround the deepest section of the pool for all of the poolunits studied, which is identical to the flow routing observedon Dry Creek. Further, Booker et al. [2001] note that arecirculating eddy forms in only one of their pool units, andthey suggest that the presence of recirculating zones at thepool head is a phenomenon that may act to maintain poolmorphology but is of secondary importance in comparisonto sediment routing. This suggests that a flow constriction islikely to be a more prominent feature in a compositehypothesis for pool-riffle morphology than the presence of
Figure 16. Lateral sorting of largest bed material sizethrough a pool and adjacent riffle (data from Keller [1969]).The exact starting points for sediment sampling across thecross sections are not available, so channel distances areapproximate.
W10427 MACWILLIAMS ET AL.: FLOW CONVERGENCE ROUTING HYPOTHESIS
19 of 21
W10427
a recirculating eddy. Further consideration of the hypothesisof flow convergence routing on additional field sites islikely to yield insight into the relative importance of each ofthese processes on the maintenance of pool-riffle morphol-ogy in alluvial rivers.
5. Conclusions
[49] Two- and three-dimensional simulations of flow inthe pool-riffle sequence on Dry Creek, CA are presented.The predicted flow velocities agree well with measured bedvelocities by Keller [1969] and with average velocitiespredicted by Keller and Florsheim [1993] using a one-dimensional model. The model results show a reversal inmean velocity, mean near-bed velocity, maximum near-bedvelocity, mean bed shear stress, and maximum bed shearstress in the pool-riffle sequence at discharges between 3.0and 6.8 m3/s. These results agree well with previouspredictions of a reversal of bed velocity by Keller [1971]and a reversal in mean velocity by Keller and Florsheim[1993]. The application of the UnTRIM and FESWMSmodels to the Dry Creek pool-riffle sequence is significantbecause this field site served as the basis for the introductionof the velocity reversal hypothesis for pool-riffle sequences.[50] The results of both the two-dimensional and three-
dimensional simulations demonstrate that the presence of aflow constriction at the head of the pool results in a flowconvergence that causes the maximum velocities to occuron the point bar of the pool rather than in the deepest part ofthe pool. The three-dimensional model shows a greaterdegree of flow and shear stress convergence and furtherreveals that this flow convergence drives a significantsecondary circulation cell in the deepest part of the pool.It is believed that flow convergence serves to route sedimentacross the point bar rather than through the deepest part ofthe pool, while secondary circulation in the pool crosssection has the potential to cause mobilization of the finesediments in the deepest part of the pool.[51] Though the pool-riffle sequence on Dry Creek does
experience a reversal in cross-sectional average and near-bed parameters, the results presented in this study suggestthat the velocity reversal hypothesis does not explain theprimary mechanisms for maintaining pool-riffle morphologyon Dry Creek. In light of these results that show thatnonuniform flow effects are important in driving flow andsediment routing processes in the pool-riffle sequence, thevelocity reversal hypothesis, which is based on cross-sectional average values, does not seem to be an adequatehypothesis to explain the important processes in maintainingpool-riffle morphology at this site. Although many studies ofpool-riffle sequences have shown a convergence in meanparameters at pools and riffles, there is no evidence tosuggest that a reversal in velocity must occur, and in factmany studies have shown that reversals do not occur at allpool-riffle sequences. For a hypothesis to be meaningful itmust be able to explain the dominant processes; the velocityreversal hypothesis does not meet this criteria.[52] On the basis of the processes observed on Dry Creek,
the hypothesis of flow convergence routing is introduced asa new working hypothesis for defining the importantprocesses for maintaining pool-riffle morphology in alluvialrivers. Under this hypothesis, the formation and mainte-nance of a pool depends on the occurrence of an upstream
flow constriction which results in a convergence and accel-eration of flow at the head of a pool. Flow through the poolis routed through a narrow zone within the cross section.This zone of flow routing corresponds to the highest near-bed velocities, shear stresses, maximum particle size. Thiszone is the primary pathway for sediment routing through oraround the pool and can serve to route the coarsest sedimentaway from the deepest part of the pool. At the tail of thepool, the flow diverges at the head of the riffle leading todeposition on the riffle and the maintenance of a topograph-ic high at the tail of the pool. This hypothesis is consistentwith the field measurements and observations of Keller[1969], with the simulation results presented in this study,and with other recent studies which have identified flowconstrictions as playing a major role in defining pool-rifflemorphology.
[53] Acknowledgments. The authors would like to acknowledgeEdward Keller for providing access to his unpublished data and fieldnotebooks. The UnTRIM code was provided by V. Casulli of the Universityof Trento, Italy. This material is based upon work supported by NationalScience Foundation (grant EAR-0087842, Program Manager: L. DouglasJames). Additional funding was provided to M.L.M. by a StanfordGraduate Fellowship and a NSF Graduate Research Fellowship. Financialsupport for this work was also provided by the U.S. Fish and WildlifeService (contracting entity for CALFED Bay-Delta Ecosystem RestorationProgram: Cooperative Agreement DCN 113322G003). We thank EdwardA. Keller, Douglas M. Thompson, and an anonymous reviewer for theircareful review of the manuscript and suggestions for improvements.
ReferencesBhowmik, N. G., and M. Demissie (1982), Bed material sorting in poolsand riffles, J. Hydraul., 108, 1227–1231.
Booker, D. J., D. A. Sear, and A. J. Payne (2001), Modeling three-dimen-sional flow structures and patterns of boundary shear stress in a naturalpool-riffle sequence, Earth Surf. Processes Landforms, 26, 553–576.
Cao, Z., P. Carling, and R. Oakley (2003), Flow reversal over a naturalpool-riffle sequence: A computational study, Earth Surf. Processes Land-forms, 28, 689–705.
Carling, P. A. (1991), An Appraisal of the velocity-reversal hypothesis forstable pool-riffle sequences in the River Severn, England, Earth Surf.Processes Landforms, 16, 19–31.
Carling, P. A., and N. Wood (1994), Simulation of flow over pool-riffletopography: A consideration of the velocity reversal hypothesis, EarthSurf. Processes Landforms, 19, 319–332.
Casulli, V., and P. Zanolli (2002), Semi-implicit numerical modeling ofnon-hydrostatic free-surface flows for environmental problems, Math.Comput. Model., 36, 1131–1149.
Celik, I., and W. Rodi (1988), Modeling suspended sediment transport innonequilibrium situations, J. Hydraul. Eng., 114(10), 1157–1191.
Clifford, N. J. (1993a), Differential bed sedimentology and the maintenanceof a riffle-pool sequence, Catena, 20, 447–468.
Clifford, N. J. (1993b), Formation of riffle-pool sequences: Field evidencefor an autogenetic process, Sediment. Geol., 85, 39–51.
Clifford, N. J., and K. S. Richards (1992), The reversal hypothesis and themaintenance of riffle-pool sequences: A review and field appraisal, inLowland Floodplain Rivers: Geomorphological Perspectives, edited byP. A. Carling and G. E. Petts, pp. 43–70, John Wiley, Hoboken, N. J.
Dietrich, W. E., J. D. Smith, and T. Dunne (1979), Flow and sedimenttransport in a sand bedded meander, J. Geol., 87, 305–315.
Froehlich, D. C. (1989), Finite element surface-water modeling system:Two-dimensional flow in a horizontal plane-users manual, Rep.FHWA-RD-88–177, 285 pp., Fed. Highway Admin., Washington, D. C.
Gilbert, G. K. (1914), The transportation of debris by running water, U.S.Geol. Surv. Prof. Pap., 86.
Jackson, W. L., and R. L. Beschta (1982), A model of two-phase bedloadtransport in an Oregon coast range stream, Earth Surf. ProcessesLandforms, 7, 517–527.
Keller, E. A. (1969), Form and fluvial processes of Dry Creek, near Win-ters, California, M.S. thesis, Univ. of Calif., Davis.
Keller, E. A. (1970), Bed-load movement experiments: Dry Creek, Cali-fornia, J. Sediment. Petrol., 40, 1339–1344.
20 of 21
W10427 MACWILLIAMS ET AL.: FLOW CONVERGENCE ROUTING HYPOTHESIS W10427
Keller, E. A. (1971), Areal sorting of bed-load material: The hypothesis ofvelocity reversal, Geol. Soc. Am. Bull., 82, 753–756.
Keller, E. A. (1972), Development of alluvial stream channels: A five stagemodel, Geol. Soc. Am. Bull., 83, 1531–1536.
Keller, E. A., and J. L. Florsheim (1993), Velocity-reversal hypothesis: Amodel approach, Earth Surf. Processes Landforms, 18, 733–740.
Kieffer, S. W. (1985), The 1983 hydraulic jump in Crystal Rapid: Implica-tions for river-running and geomorphic evolution in the Grand Canyon,J. Geol., 93, 385–406.
Kieffer, S. W. (1989), Geologic nozzles, Rev. Geophys., 27, 3–38.Lisle, T. (1979), A sorting mechanism for a riffle-pool sequence, Geol. Soc.Am. Bull., Part II, 90, 1142–1157.
Lisle, T. E. (1986), Stabilization of a gravel channel by large streamsideobstructions and bedrock bends, Jacoby Creek, northwest California,Geol. Soc. Am. Bull., 97, 999–1011.
Lisle, T. E., and S. Hilton (1992), The volume of fine sediment in pools: Anindex of sediment supply in gravel-bed streams, Water Resour. Bull., 28,371–383.
MacWilliams, M. L. (2004), Three-dimensional hydrodynamic simulationof river channels and floodplains, Ph.D. dissertation, 222 pp., StanfordUniv., Stanford, Calif.
Miller, A. J. (1994), Debris-fan constrictions and flood hydraulics in rivercanyons: Some implications from two-dimensional flow modelling,Earth Surf. Processes Landforms, 19, 681–697.
Pasternack, G. B., C. L. Wang, and J. E. Merz (2004), Application of a 2Dhydrodynamic model to design of reach-scale spawning gravel replenish-ment on theMokelumne River, California, River Res. Appl., 20, 202–225.
Petit, F. (1987), The relationship between shear stress and the shaping of thebed of a pebble-loaded river La Rulles–Ardenne, Catena, 14, 453–468.
Petit, F. (1990), Evaluation of grain shear stresses required to initiate move-ment of particles in natural rivers, Earth Surf. Processes Landforms, 15,135–148.
Richards, K. S. (1978), Simulation of flow geometry in a riffle-pool stream,Earth Surf. Processes, 3, 345–354.
Rodi, W. (1993), Turbulence Models and Their Application in Hydraulics:A State-of-the-Art Review, 3rd ed., A. A. Balkema, Brookfield, Vt.
Schmidt, J. C. (1990), Recirculating flow and sedimentation in the Color-ado River in Grand Canyon, Arizona, J. Geol., 98, 709–724.
Schmidt, J. C., D. M. Rubin, and H. Ikeda (1993), Flume simulation ofrecirculating flow and sedimentation, Water Resour. Res., 29, 2925–2939.
Sear, D. A. (1996), Sediment transport processes in pool-riffle sequences,Earth Surf. Processes Landforms, 21(3), 241–262.
Shewchuk, J. R. (1996), Triangle: Engineering a 2D quality mesh generatorand Delaunay triangulator, in Applied Computational Geometry:Towards Geometric Engineering, vol. 1148, edited by M. C. Lin andD. Manocha, pp. 203–222, Springer, New York.
Thompson, D. M. (2004), The influence of pool length on local turbulenceproduction and energy slope: A flume experiment, Earth Surf. ProcessesLandforms, 29, 1341–1358.
Thompson, D. M., E. E. Wohl, and R. D. Jarrett (1996), A revised velocity-reversal and sediment sorting model for a high-gradient, pool-rifflestream, Phys. Geogr., 17(2), 142–156.
Thompson, D. M., J. M. Nelson, and E. E. Wohl (1998), Interactionsbetween pool geometry and hydraulics, Water Resour. Res., 34(12),3673–3681.
Thompson, D. M., E. E. Wohl, and R. D. Jarrett (1999), Velocity reversalsand sediment sorting in pools and riffles controlled by channel constric-tions, Geomorphology, 27, 229–241.
Whiting, P. J., and W. E. Deitrich (1991), Convective accelerations andboundary shear stress over a channel bar, Water Resour. Res., 27(5),783–796.
����������������������������P. K. Kitanidis, R. L. Street, and M. L. MacWilliams Jr., Environmental
Fluid Mechanics Laboratory, Department of Civil and EnvironmentalEngineering, Stanford University, Stanford, CA 94305-4020, USA.([email protected])
G. B. Pasternack and J. M. Wheaton, Department of Land, Air, andWater Resources, University of California, Davis, 1 Shields Avenue, Davis,CA 95616-8626, USA.
W10427 MACWILLIAMS ET AL.: FLOW CONVERGENCE ROUTING HYPOTHESIS
21 of 21
W10427