Germination and Agronomic Traits of Phaseolus vulgaris L ...
Upload
independentCategory
view
2download
0
ORIGINAL ARTICLE
Spatial distribution analysis of soil variables for agronomicdevelopment in El-Omayed Area, North-Coastal of Egypt
Kh. M. Darwish • Mohamed Rashad •
Sami Z. Mohamed • A. Gad
Received: 27 May 2014 / Accepted: 22 January 2015
� Springer-Verlag Berlin Heidelberg 2015
Abstract Geostatistical modeling has recently been de-
veloped for spatial prediction of environmental variables.
The current research aims to utilize geographic information
capabilities, remote sensing imagery and soil data, for de-
cision-making in natural resources management of El-O-
mayed area, N–W coast of Egypt. El-Omayed
geographically limited by latitudes 30�450N south and the
Mediterranean Sea at the north. The selected region repre-
sents an extended territory having an area of 102,35 ha, and
considers a promising location for future development,
keeping the ecological protectorate site as a reference. It
was possible to investigate the distribution of selected soil
variables and their relation with the actual properties to
carry out a detailed suitability evaluation for specific agri-
cultural uses. Spatial patterns of some chemical and phy-
sical soil properties were analysed. Data were investigated
both statistically and geostatistically based on the semi-
variogram analysis. Among the considered soil parameters,
the spatial distribution model varied and showed moderate
to strong spatial dependence. EC, gypsum and sand soil
texture were strongly spatially dependent. Using a
suitability model built in ALESarid software, the obtained
results indicate that the area currently lacks high suitability
classes. Following an improving soil properties program
may enhance the soil capability status. An area of 70,109 ha
(68.5 %) would become marginally suitable, then suit-
ability for different common crops land use (wheat, sun-
flower, maize, olive, fig, onion, tomato, potato and
watermelon) can elaborated. The usage of geospatial data,
distribution analysis and GIS proved to be suitable tools to
fulfill the needed large computational requirements.
Keywords Spatial distribution � Land use planning � Soil
sustainability � El-Omayed soils � Northern Coast of Egypt
Introduction
Food security and sustainable development are two fun-
damental and strategic goals in Egypt. The suitability of
soil leads to sustainable agricultural development. The
sustainable soil properties for efficient plant growth depend
mainly on the structural properties of the soil. The physical,
chemical and biological properties of soils are highly
variable over time and space (Ryel et al. 1996). The pre-
diction of soil properties and other properties such as pH,
EC, ESP, soil texture, etc. at unsampled locations creates
even more uncertainty. Spatial variability of soil properties
is somewhat inherent in nature because of variations in soil
parent materials and microclimate interface (Zhao et al.
2007). Efficiency in agriculture requires application of
farming principles based on the field variability, which
creates new requirements for estimating and mapping
spatial variability of soil properties.
Spatial distribution of soil properties is not uniform.
This uneven distribution of soil characteristics can reflect
Kh. M. Darwish � M. Rashad (&) � S. Z. Mohamed
Land and Water Technologies Department, Arid Land
Cultivation Research Institute, City of Scientific Research and
Technological Applications, Borg El-Arab, Alexandria, Egypt
e-mail: [email protected]
Kh. M. Darwish
e-mail: [email protected]
S. Z. Mohamed
e-mail: [email protected]
A. Gad
Environmental Studies and Land Use Division, National
Authority for Remote Sensing and Space Sciences, Cairo, Egypt
e-mail: [email protected]
123
Environ Earth Sci
DOI 10.1007/s12665-015-4095-2
the processes that occur within the larger ecosystem
(Corstanje et al. 2006). To model spatial variability and
delineate spatial distribution of soil properties, geostatisti-
cal variogram analysis and kriging estimation, which pro-
vides the best linear unbiased prediction at unsampled
locations, have been widely used (Duffera et al. 2007;
Sauer and Meek 2003; Holmes et al. 2005; Huang et al.
2006; Liu et al. 2008; Cambardella et al. 1994; Askin and
Kizilkaya 2006).
Characterizing spatial variability of soil properties and
crop parameters by inventorying them is needed to evaluate
the effectiveness of their management. Also, characterizing
their temporal variability by monitoring them is important
to compare different management systems for sustain-
ability and environmental quality. In addition, an under-
standing of the spatial and/or temporal variability can
provide a framework for developing effective sampling
schemes for future site management and efficient ex-
perimental designs for research approaches (Douaik et al.
2011). Geostatistical methods have become popular in soil
science, as illustrated by the increasing number of studies
reported in the literature (Geypens et al. 1999). Concerning
the field of soils salinity mapping using in particular in-
terpolation techniques, Darwish et al. (2007) did apply
cokriging interpolation technique to estimate and identify
the spatial variability of soil salinity in Bahariya oasis,
western desert, Egypt. The results suggest that sampling
cost can be dramatically reduced and estimation can be
significantly improved using cokriging. It improved the
estimations greatly by reducing mean squared error and
kriging variance up to 70 % and increasing correlation of
estimates and measurements about 25 %. Darwish and El-
Khader (2008) investigated a methodology to determine
spatial variability in a dry onion field in EL-Saff agricul-
tural farming village, Giza Governorate, Egypt, and to
produce a management strategy, which is based on spatial
variability of yield and soil components. In addition,
Nawar et al. (2011) implemented geostatistical mapping
approach to generate an accurate soil salinity map as a base
for sustainability assessment of El-Tina plain at the
northwestern part of Sinai Peninsula, Egypt. They found
that the best model to generate soil salinity map was or-
dinary kriging with spherical semivariogram model (MPE
and MSPE close to 0, and RSSPE close to 1).
Nowadays, the Egyptian’s governance is directed more
attention towards its Northern coast zone for future devel-
opment. Therefore, studies on management of natural re-
sources in such region are considered of vital importance.
Geospatial techniques create great possibilities for fast in-
ventory, monitoring and updating the natural resources
status. Shendi et al. (2006) and Mahmoud et al. (2009)
studied the natural resources management and planning the
sustainable land use in El-Hammam area, North-Western
coast of Egypt using GIS, remote sensing and soil data. They
found that the study area lacked the soil high-capability and
moderate-capability classes. In addition, the results indicate
that, the area is susceptible for potential soil loss at different
severity levels. The combination of GIS and RS proved to be
effective in management and planning studies.
The objectives of this study were to: (1) examine the
spatial distribution of certain soil variables, e.g.; soil pH,
electrical conductivity (ECe), calcium carbonate CaCO3,
organic matter O.M. %, cation exchange capacity (CEC),
gypsum content and particle size distribution in El-Omayed
area northern coast of Egypt, (2) develop maps of these
characteristics and assess the spatial correlations among
them, (3) explore associations between these mapped
characteristics and the soil types present, (4) build up a
geographic soil attributes database for managing models
needed for decision makers, and (5) to assess soil suit-
ability to plan the most sustainable land use. This would
enable the identification of areas where rehabilitation is
needed to improve crop growth and development plans.
Materials and methods
Description of the study area
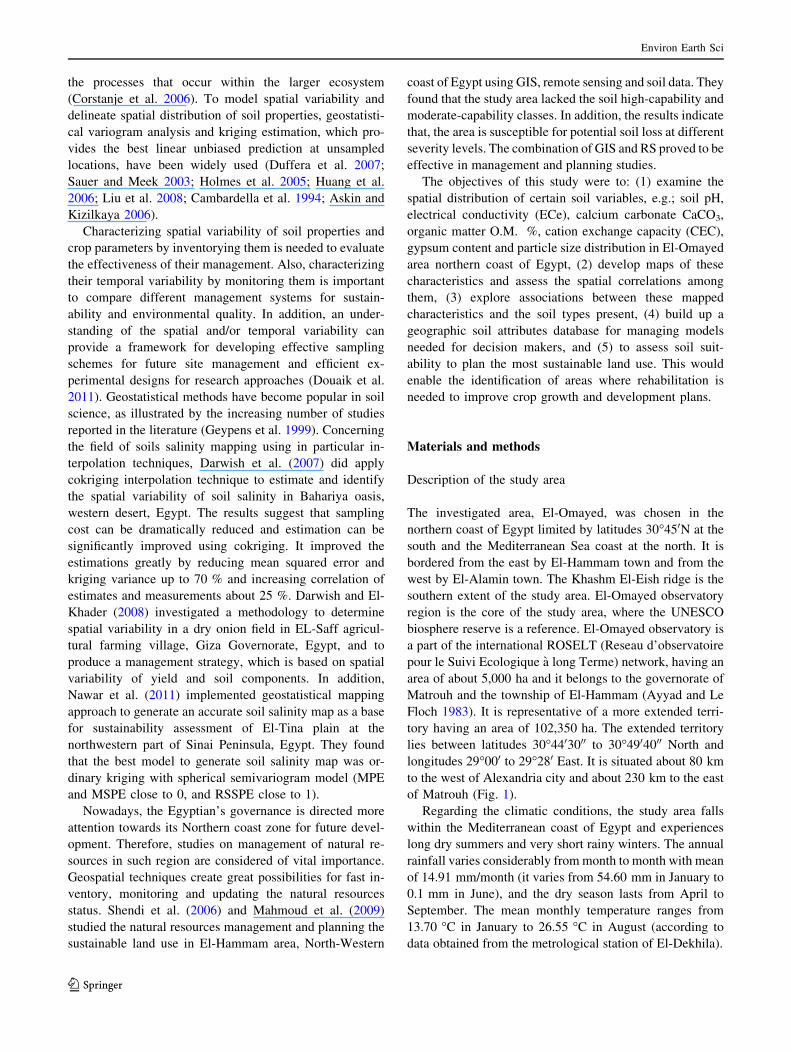
The investigated area, El-Omayed, was chosen in the
northern coast of Egypt limited by latitudes 30�450N at the
south and the Mediterranean Sea coast at the north. It is
bordered from the east by El-Hammam town and from the
west by El-Alamin town. The Khashm El-Eish ridge is the
southern extent of the study area. El-Omayed observatory
region is the core of the study area, where the UNESCO
biosphere reserve is a reference. El-Omayed observatory is
a part of the international ROSELT (Reseau d’observatoire
pour le Suivi Ecologique a long Terme) network, having an
area of about 5,000 ha and it belongs to the governorate of
Matrouh and the township of El-Hammam (Ayyad and Le
Floch 1983). It is representative of a more extended terri-
tory having an area of 102,350 ha. The extended territory
lies between latitudes 30�4403000 to 30�4904000 North and
longitudes 29�000 to 29�280 East. It is situated about 80 km
to the west of Alexandria city and about 230 km to the east
of Matrouh (Fig. 1).
Regarding the climatic conditions, the study area falls
within the Mediterranean coast of Egypt and experiences
long dry summers and very short rainy winters. The annual
rainfall varies considerably from month to month with mean
of 14.91 mm/month (it varies from 54.60 mm in January to
0.1 mm in June), and the dry season lasts from April to
September. The mean monthly temperature ranges from
13.70 �C in January to 26.55 �C in August (according to
data obtained from the metrological station of El-Dekhila).
Environ Earth Sci
123
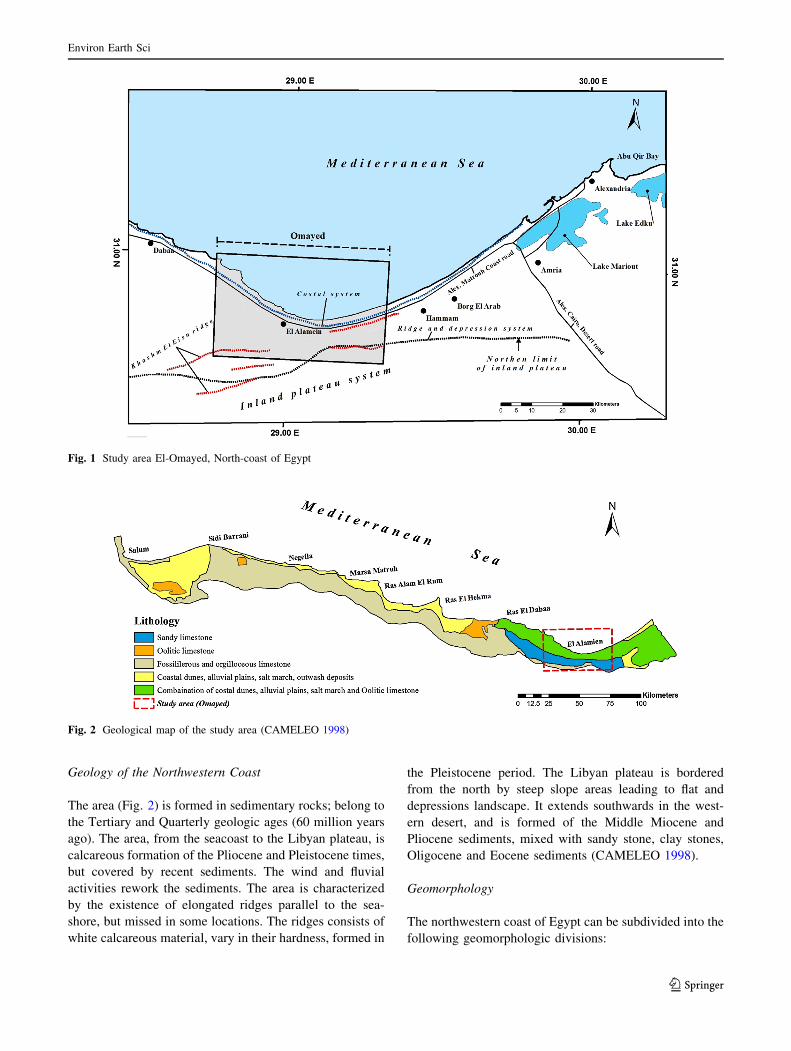
Geology of the Northwestern Coast
The area (Fig. 2) is formed in sedimentary rocks; belong to
the Tertiary and Quarterly geologic ages (60 million years
ago). The area, from the seacoast to the Libyan plateau, is
calcareous formation of the Pliocene and Pleistocene times,
but covered by recent sediments. The wind and fluvial
activities rework the sediments. The area is characterized
by the existence of elongated ridges parallel to the sea-
shore, but missed in some locations. The ridges consists of
white calcareous material, vary in their hardness, formed in
the Pleistocene period. The Libyan plateau is bordered
from the north by steep slope areas leading to flat and
depressions landscape. It extends southwards in the west-
ern desert, and is formed of the Middle Miocene and
Pliocene sediments, mixed with sandy stone, clay stones,
Oligocene and Eocene sediments (CAMELEO 1998).
Geomorphology
The northwestern coast of Egypt can be subdivided into the
following geomorphologic divisions:
Fig. 1 Study area El-Omayed, North-coast of Egypt
Fig. 2 Geological map of the study area (CAMELEO 1998)
Environ Earth Sci
123
1. Coastal plain: It is bordered by the Mediterranean Sea
to the north and by the plateau to the south, taking an
orientation east west. The width of the coast varies
from one site to another, controlled by the geologic
formations.
2. Pedomental plain: It is the interference zone between
the coastal plain and the plateau. It appears clearly
between Ras El-Hekma and Ras Alam El-Room and in
El-Salloum area. This area has a good potentiality for
agriculture expansion if the water and land resources
are well managed.
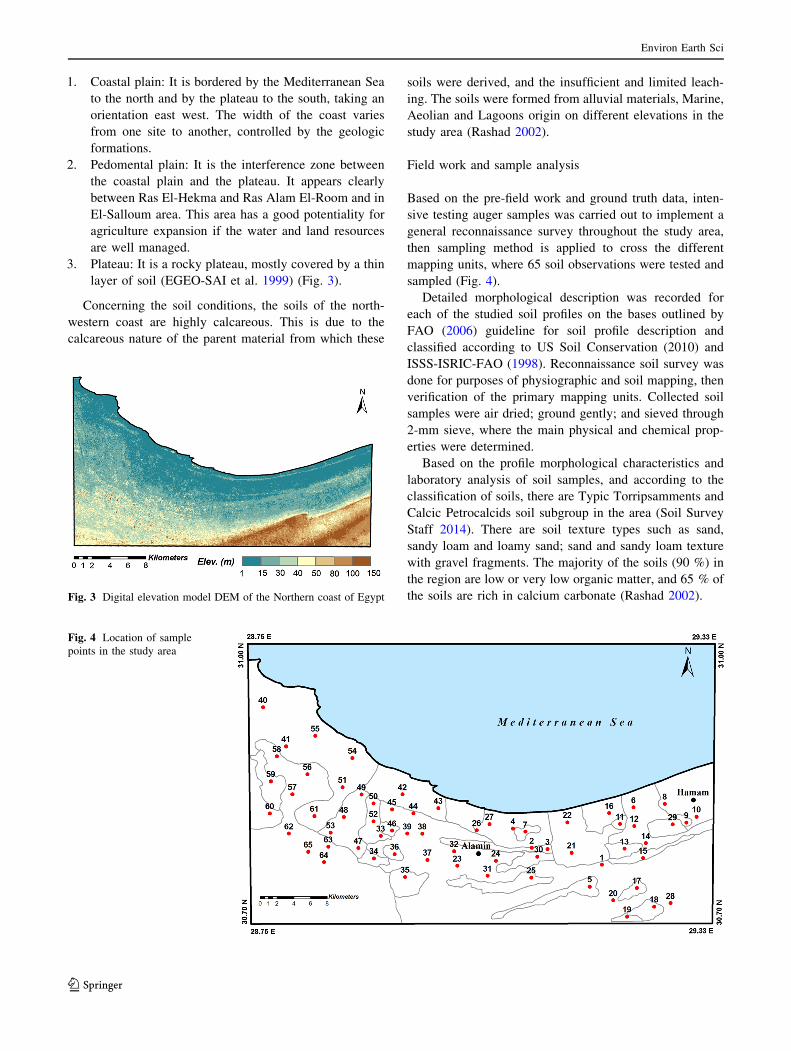
3. Plateau: It is a rocky plateau, mostly covered by a thin
layer of soil (EGEO-SAI et al. 1999) (Fig. 3).
Concerning the soil conditions, the soils of the north-
western coast are highly calcareous. This is due to the
calcareous nature of the parent material from which these
soils were derived, and the insufficient and limited leach-
ing. The soils were formed from alluvial materials, Marine,
Aeolian and Lagoons origin on different elevations in the
study area (Rashad 2002).
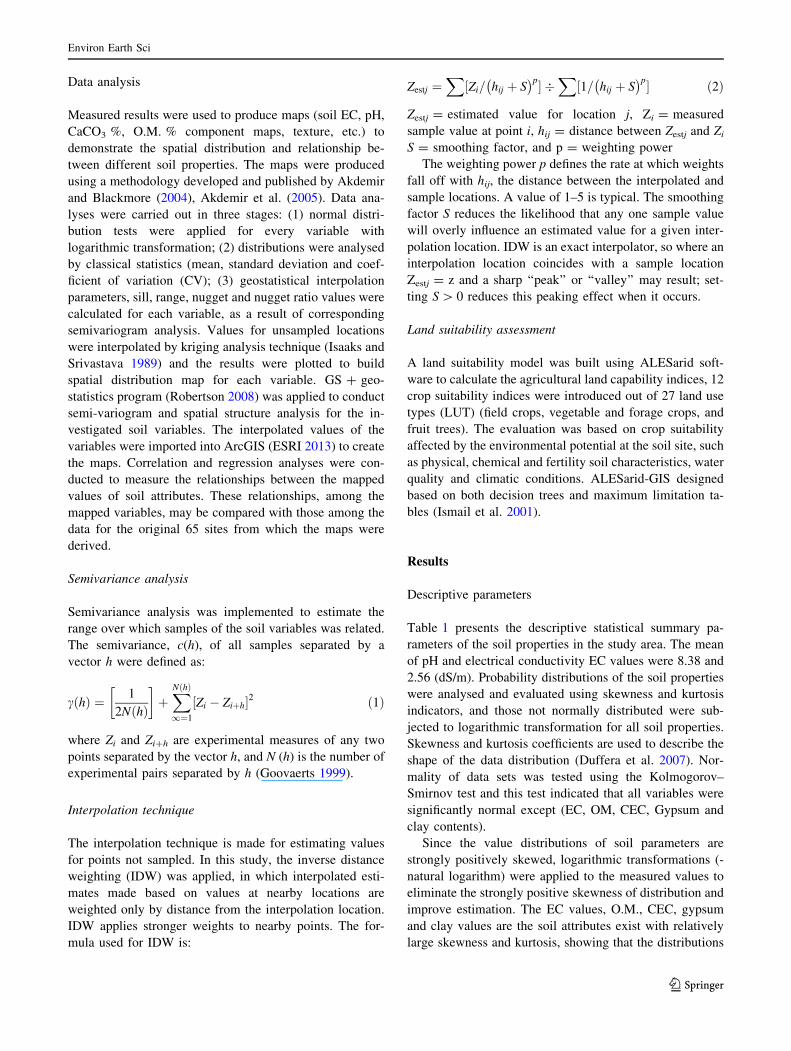
Field work and sample analysis
Based on the pre-field work and ground truth data, inten-
sive testing auger samples was carried out to implement a
general reconnaissance survey throughout the study area,
then sampling method is applied to cross the different
mapping units, where 65 soil observations were tested and
sampled (Fig. 4).
Detailed morphological description was recorded for
each of the studied soil profiles on the bases outlined by
FAO (2006) guideline for soil profile description and
classified according to US Soil Conservation (2010) and
ISSS-ISRIC-FAO (1998). Reconnaissance soil survey was
done for purposes of physiographic and soil mapping, then
verification of the primary mapping units. Collected soil
samples were air dried; ground gently; and sieved through
2-mm sieve, where the main physical and chemical prop-
erties were determined.
Based on the profile morphological characteristics and
laboratory analysis of soil samples, and according to the
classification of soils, there are Typic Torripsamments and
Calcic Petrocalcids soil subgroup in the area (Soil Survey
Staff 2014). There are soil texture types such as sand,
sandy loam and loamy sand; sand and sandy loam texture
with gravel fragments. The majority of the soils (90 %) in
the region are low or very low organic matter, and 65 % of
the soils are rich in calcium carbonate (Rashad 2002).Fig. 3 Digital elevation model DEM of the Northern coast of Egypt
Fig. 4 Location of sample
points in the study area
Environ Earth Sci
123
Data analysis
Measured results were used to produce maps (soil EC, pH,
CaCO3 %, O.M. % component maps, texture, etc.) to
demonstrate the spatial distribution and relationship be-
tween different soil properties. The maps were produced
using a methodology developed and published by Akdemir
and Blackmore (2004), Akdemir et al. (2005). Data ana-
lyses were carried out in three stages: (1) normal distri-
bution tests were applied for every variable with
logarithmic transformation; (2) distributions were analysed
by classical statistics (mean, standard deviation and coef-
ficient of variation (CV); (3) geostatistical interpolation
parameters, sill, range, nugget and nugget ratio values were
calculated for each variable, as a result of corresponding
semivariogram analysis. Values for unsampled locations
were interpolated by kriging analysis technique (Isaaks and
Srivastava 1989) and the results were plotted to build
spatial distribution map for each variable. GS ? geo-
statistics program (Robertson 2008) was applied to conduct
semi-variogram and spatial structure analysis for the in-
vestigated soil variables. The interpolated values of the
variables were imported into ArcGIS (ESRI 2013) to create
the maps. Correlation and regression analyses were con-
ducted to measure the relationships between the mapped
values of soil attributes. These relationships, among the
mapped variables, may be compared with those among the
data for the original 65 sites from which the maps were
derived.
Semivariance analysis
Semivariance analysis was implemented to estimate the
range over which samples of the soil variables was related.
The semivariance, c(h), of all samples separated by a
vector h were defined as:
c hð Þ ¼ 1
2N hð Þ
� �þXNðhÞ1¼1
½Zi � Ziþh�2 ð1Þ
where Zi and Zi?h are experimental measures of any two
points separated by the vector h, and N (h) is the number of
experimental pairs separated by h (Goovaerts 1999).
Interpolation technique
The interpolation technique is made for estimating values
for points not sampled. In this study, the inverse distance
weighting (IDW) was applied, in which interpolated esti-
mates made based on values at nearby locations are
weighted only by distance from the interpolation location.
IDW applies stronger weights to nearby points. The for-
mula used for IDW is:
Zestj ¼X½Zi= hij þ S
� �p� �X½1= hij þ S� �p� ð2Þ
Zestj = estimated value for location j, Zi = measured
sample value at point i, hij = distance between Zestj and Zi
S = smoothing factor, and p = weighting power
The weighting power p defines the rate at which weights
fall off with hij, the distance between the interpolated and
sample locations. A value of 1–5 is typical. The smoothing
factor S reduces the likelihood that any one sample value
will overly influence an estimated value for a given inter-
polation location. IDW is an exact interpolator, so where an
interpolation location coincides with a sample location
Zestj = z and a sharp ‘‘peak’’ or ‘‘valley’’ may result; set-
ting S [ 0 reduces this peaking effect when it occurs.
Land suitability assessment
A land suitability model was built using ALESarid soft-
ware to calculate the agricultural land capability indices, 12
crop suitability indices were introduced out of 27 land use
types (LUT) (field crops, vegetable and forage crops, and
fruit trees). The evaluation was based on crop suitability
affected by the environmental potential at the soil site, such
as physical, chemical and fertility soil characteristics, water
quality and climatic conditions. ALESarid-GIS designed
based on both decision trees and maximum limitation ta-
bles (Ismail et al. 2001).
Results
Descriptive parameters
Table 1 presents the descriptive statistical summary pa-
rameters of the soil properties in the study area. The mean
of pH and electrical conductivity EC values were 8.38 and
2.56 (dS/m). Probability distributions of the soil properties
were analysed and evaluated using skewness and kurtosis
indicators, and those not normally distributed were sub-
jected to logarithmic transformation for all soil properties.
Skewness and kurtosis coefficients are used to describe the
shape of the data distribution (Duffera et al. 2007). Nor-
mality of data sets was tested using the Kolmogorov–
Smirnov test and this test indicated that all variables were
significantly normal except (EC, OM, CEC, Gypsum and
clay contents).
Since the value distributions of soil parameters are
strongly positively skewed, logarithmic transformations (-
natural logarithm) were applied to the measured values to
eliminate the strongly positive skewness of distribution and
improve estimation. The EC values, O.M., CEC, gypsum
and clay values are the soil attributes exist with relatively
large skewness and kurtosis, showing that the distributions
Environ Earth Sci
123
of these characteristics were far from normal distribution.
The quite large positive skewness for those soil attributes
reflects asymmetry in the distribution caused largely by a
number of relatively high values. A natural logarithmic Ln
transformation was applied to the data for EC, O.M%,
CEC, Gypsum and clay%. After transformation, the
skewness and kurtosis of those soil variables were greatly
reduced, providing a more normally distributed data. De-
spite skewness and kurtosis of the distribution of some soil
properties, the mean and median values were similar with
means being equal to or almost equal to the median; ex-
ceptions were EC, CEC and gypsum (Table 1).
Descriptive statistics of soil variables (Table 1) illus-
trated coefficients of variation CV ranging from 5.5 % for
pH values to 130.0 % for EC. CV for most of the soil
properties exceeded 20 % (except pH and sand) that indi-
cating significant spatial variability (Table 1). The pH and
sand had the lowest CV (5.49–8.00 %); CaCO3, clay and
silt had low medium CVs (26.53–13.06–36.77 %), while
OM and CEC had relatively high medium CVs
(75.00–74.84 %); and finally, EC and gypsum had the
highest CV (130.08–123.12 %), indicating that soil prop-
erties were ordinarily heterogeneous.
Semivariance analysis
Experimental semivariances of soil properties were
calculated and modeled using GS ? software with
consideration restricted to half the maximum lag dis-
tance (Journel and Huijbregts 1978). In this research,
isotropic semivariogram models were applied to the soil
parameters data. The investigated soil properties ex-
hibited spatial autocorrelative structures, indicating that
they responded to processes that occur throughout the
study area. Nevertheless, spatial dependencies differed
among the soil attributes, as illustrated by the nugget
and sill values, as well as the ranges (Table 2). The
range establishes the outer limit at which points in space
still interact spatially and the sill represents the total
priori variance (Webster and Oliver 2000). The exam-
ined soil properties displayed differences in their spatial
structures. The organic matter OM and CEC parameters
exhibited the largest range, indicating significant spatial
structure extending over 91.1 km. Gypsum content il-
lustrated the smallest range (2.7 km). These parameters
required a nested spatial model with large ranges for the
long-scale exponential model and small (2.7 km) for the
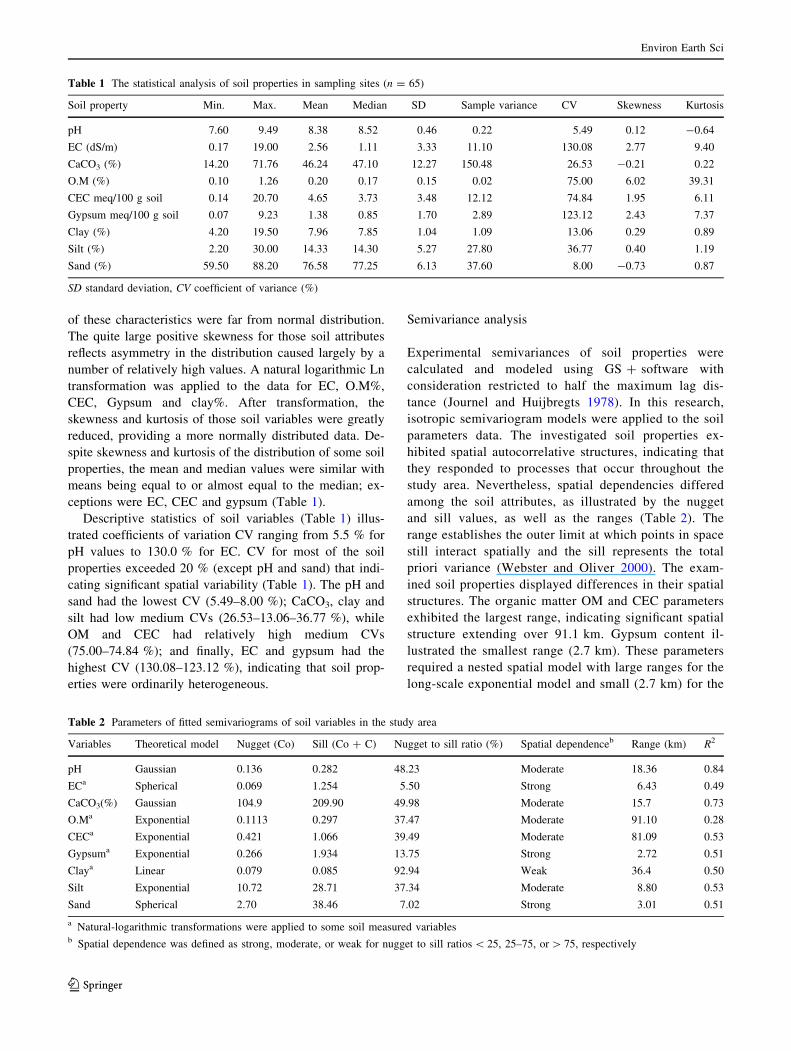
Table 1 The statistical analysis of soil properties in sampling sites (n = 65)
Soil property Min. Max. Mean Median SD Sample variance CV Skewness Kurtosis
pH 7.60 9.49 8.38 8.52 0.46 0.22 5.49 0.12 -0.64
EC (dS/m) 0.17 19.00 2.56 1.11 3.33 11.10 130.08 2.77 9.40
CaCO3 (%) 14.20 71.76 46.24 47.10 12.27 150.48 26.53 -0.21 0.22
O.M (%) 0.10 1.26 0.20 0.17 0.15 0.02 75.00 6.02 39.31
CEC meq/100 g soil 0.14 20.70 4.65 3.73 3.48 12.12 74.84 1.95 6.11
Gypsum meq/100 g soil 0.07 9.23 1.38 0.85 1.70 2.89 123.12 2.43 7.37
Clay (%) 4.20 19.50 7.96 7.85 1.04 1.09 13.06 0.29 0.89
Silt (%) 2.20 30.00 14.33 14.30 5.27 27.80 36.77 0.40 1.19
Sand (%) 59.50 88.20 76.58 77.25 6.13 37.60 8.00 -0.73 0.87
SD standard deviation, CV coefficient of variance (%)
Table 2 Parameters of fitted semivariograms of soil variables in the study area
Variables Theoretical model Nugget (Co) Sill (Co ? C) Nugget to sill ratio (%) Spatial dependenceb Range (km) R2
pH Gaussian 0.136 0.282 48.23 Moderate 18.36 0.84
ECa Spherical 0.069 1.254 5.50 Strong 6.43 0.49
CaCO3(%) Gaussian 104.9 209.90 49.98 Moderate 15.7 0.73
O.Ma Exponential 0.1113 0.297 37.47 Moderate 91.10 0.28
CECa Exponential 0.421 1.066 39.49 Moderate 81.09 0.53
Gypsuma Exponential 0.266 1.934 13.75 Strong 2.72 0.51
Claya Linear 0.079 0.085 92.94 Weak 36.4 0.50
Silt Exponential 10.72 28.71 37.34 Moderate 8.80 0.53
Sand Spherical 2.70 38.46 7.02 Strong 3.01 0.51
a Natural-logarithmic transformations were applied to some soil measured variablesb Spatial dependence was defined as strong, moderate, or weak for nugget to sill ratios \ 25, 25–75, or [ 75, respectively
Environ Earth Sci
123
short-scale exponential model. Large nugget values
relative to the sill variance were found for clay per-
centage, which suggests that extrinsic factors associated
with human activities (e.g., soil management practices,
land-use activities, farm management practices, such as
fertilization and tillage) that influence the variability of
clay particle size significantly (Wei et al. 2009). Based
on the nugget-to-sill ratio, soil variables in El-Omayed
study area can be classified into three general cate-
gories. The first category includes EC, gypsum and sand
with strong spatial dependence, which may be affected
mainly by intrinsic factors (i.e., soil formation factors,
such as soil parent material and texture). The second
category consists of pH, CaCO3, OM, CEC and silt that
showed moderate spatial dependence. The third category
is for clay, which exhibited weak spatial dependence.
Table 2 shows that the fitted parameters for semi-var-
iograms of the studied soil variables. Obviously,
athematic natural-logarithmic transformation trends
significantly reduces the contributions of long-range
components to EC, OM, CEC, gypsum and clay, which
indicates that large-scale factors (i.e., parent material,
climate and human impact) may have predominant in-
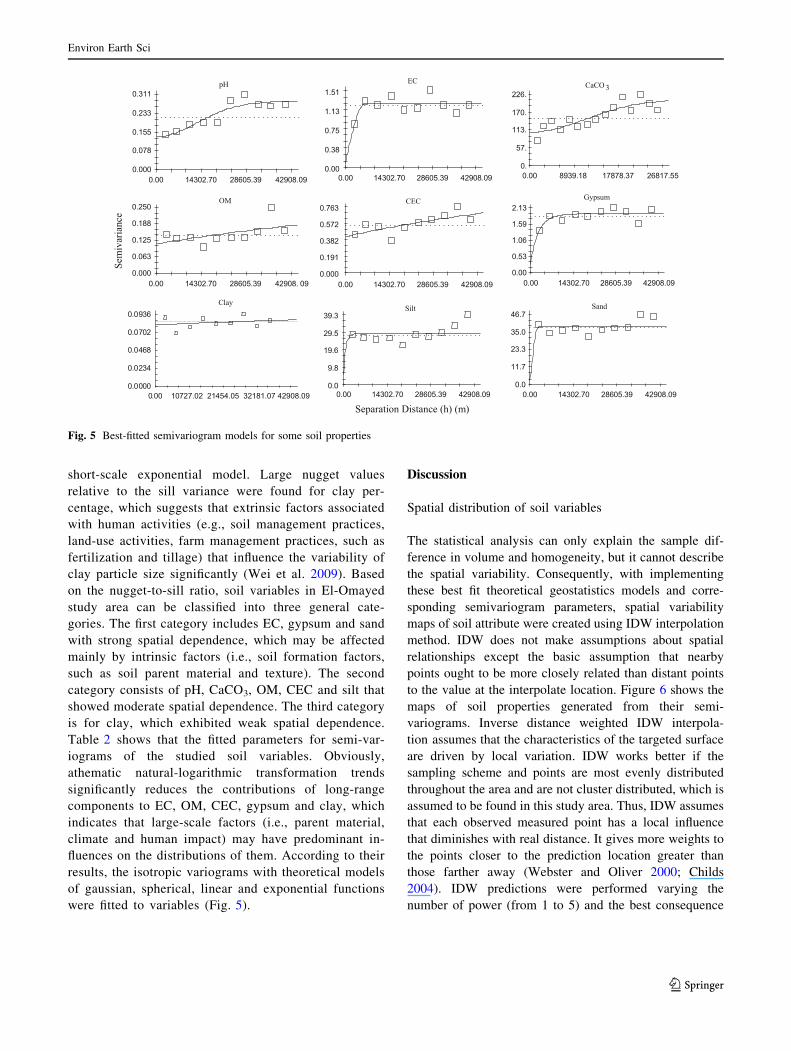
fluences on the distributions of them. According to their
results, the isotropic variograms with theoretical models
of gaussian, spherical, linear and exponential functions
were fitted to variables (Fig. 5).
Discussion
Spatial distribution of soil variables
The statistical analysis can only explain the sample dif-
ference in volume and homogeneity, but it cannot describe
the spatial variability. Consequently, with implementing
these best fit theoretical geostatistics models and corre-
sponding semivariogram parameters, spatial variability
maps of soil attribute were created using IDW interpolation
method. IDW does not make assumptions about spatial
relationships except the basic assumption that nearby
points ought to be more closely related than distant points
to the value at the interpolate location. Figure 6 shows the
maps of soil properties generated from their semi-
variograms. Inverse distance weighted IDW interpola-
tion assumes that the characteristics of the targeted surface
are driven by local variation. IDW works better if the
sampling scheme and points are most evenly distributed
throughout the area and are not cluster distributed, which is
assumed to be found in this study area. Thus, IDW assumes
that each observed measured point has a local influence
that diminishes with real distance. It gives more weights to
the points closer to the prediction location greater than
those farther away (Webster and Oliver 2000; Childs
2004). IDW predictions were performed varying the
number of power (from 1 to 5) and the best consequence
Sem
ivar
ianc
e
pH
0.000
0.078
0.155
0.233
0.311
0.00 14302.70 28605.39 42908.09
EC
0.00
0.38
0.75
1.13
1.51
0.00 14302.70 28605.39 42908.09
CaCO 3
0.
57.
113.
170.
226.
0.00 8939.18 17878.37 26817.55
OM
0.000
0.063
0.125
0.188
0.250
0.00 14302.70 28605.39 42908. 09
CEC
0.000
0.191
0.382
0.572
0.763
0.00 14302.70 28605.39 42908.09
Gypsum
0.00
0.53
1.06
1.59
2.13
0.00 14302.70 28605.39 42908.09
Clay
0.0000
0.0234
0.0468
0.0702
0.0936
0.00 10727.02 21454.05 32181.07 42908.09
Silt
0.0
9.8
19.6
29.5
39.3
0.00 14302.70 28605.39 42908.09
Sand
0.0
11.7
23.3
35.0
46.7
0.00 14302.70 28605.39 42908.09
Separation Distance (h) (m)
Fig. 5 Best-fitted semivariogram models for some soil properties
Environ Earth Sci
123
obtained using different radiuses and neighbors. In this
work, in all implementations of IDW was a good choice
among the others, which is possibly due to the relatively
inherent low skewness in all modeled soil properties, ex-
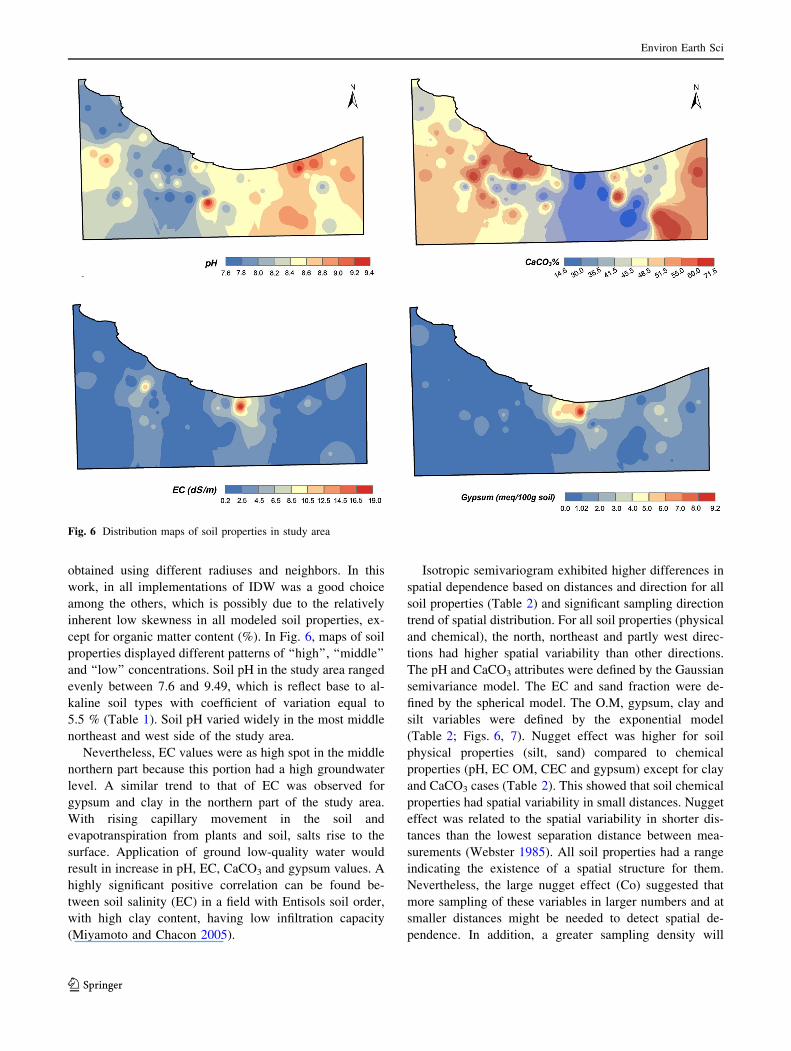
cept for organic matter content (%). In Fig. 6, maps of soil
properties displayed different patterns of ‘‘high’’, ‘‘middle’’
and ‘‘low’’ concentrations. Soil pH in the study area ranged
evenly between 7.6 and 9.49, which is reflect base to al-
kaline soil types with coefficient of variation equal to
5.5 % (Table 1). Soil pH varied widely in the most middle
northeast and west side of the study area.
Nevertheless, EC values were as high spot in the middle
northern part because this portion had a high groundwater
level. A similar trend to that of EC was observed for
gypsum and clay in the northern part of the study area.
With rising capillary movement in the soil and
evapotranspiration from plants and soil, salts rise to the
surface. Application of ground low-quality water would
result in increase in pH, EC, CaCO3 and gypsum values. A
highly significant positive correlation can be found be-
tween soil salinity (EC) in a field with Entisols soil order,
with high clay content, having low infiltration capacity
(Miyamoto and Chacon 2005).
Isotropic semivariogram exhibited higher differences in
spatial dependence based on distances and direction for all
soil properties (Table 2) and significant sampling direction
trend of spatial distribution. For all soil properties (physical
and chemical), the north, northeast and partly west direc-
tions had higher spatial variability than other directions.
The pH and CaCO3 attributes were defined by the Gaussian
semivariance model. The EC and sand fraction were de-
fined by the spherical model. The O.M, gypsum, clay and
silt variables were defined by the exponential model
(Table 2; Figs. 6, 7). Nugget effect was higher for soil
physical properties (silt, sand) compared to chemical
properties (pH, EC OM, CEC and gypsum) except for clay
and CaCO3 cases (Table 2). This showed that soil chemical
properties had spatial variability in small distances. Nugget
effect was related to the spatial variability in shorter dis-
tances than the lowest separation distance between mea-
surements (Webster 1985). All soil properties had a range
indicating the existence of a spatial structure for them.
Nevertheless, the large nugget effect (Co) suggested that
more sampling of these variables in larger numbers and at
smaller distances might be needed to detect spatial de-
pendence. In addition, a greater sampling density will
Fig. 6 Distribution maps of soil properties in study area
Environ Earth Sci
123
result in more accurate spatially distributed maps. In case
of moderate or strong spatial correlation of the soil prop-
erties distribution, the mean range of these distributions can
be given by the geostatistical range of the fitted semi-
variogram. A larger range values indicates that observed
values of the soil property are influenced by other values of
this property over greater distances (Isaaks and Srivastava
1989).
The large nugget semivariance indicates that the lag
(h) evidently did not describe the spatial variation and that
an additional sampling of these variables at smaller lag
distances is needed to decrease uncertainty. Strong spatial
dependency of soil variables may be controlled by intrinsic
variations in soil characteristics (Cambardella et al. 1994).
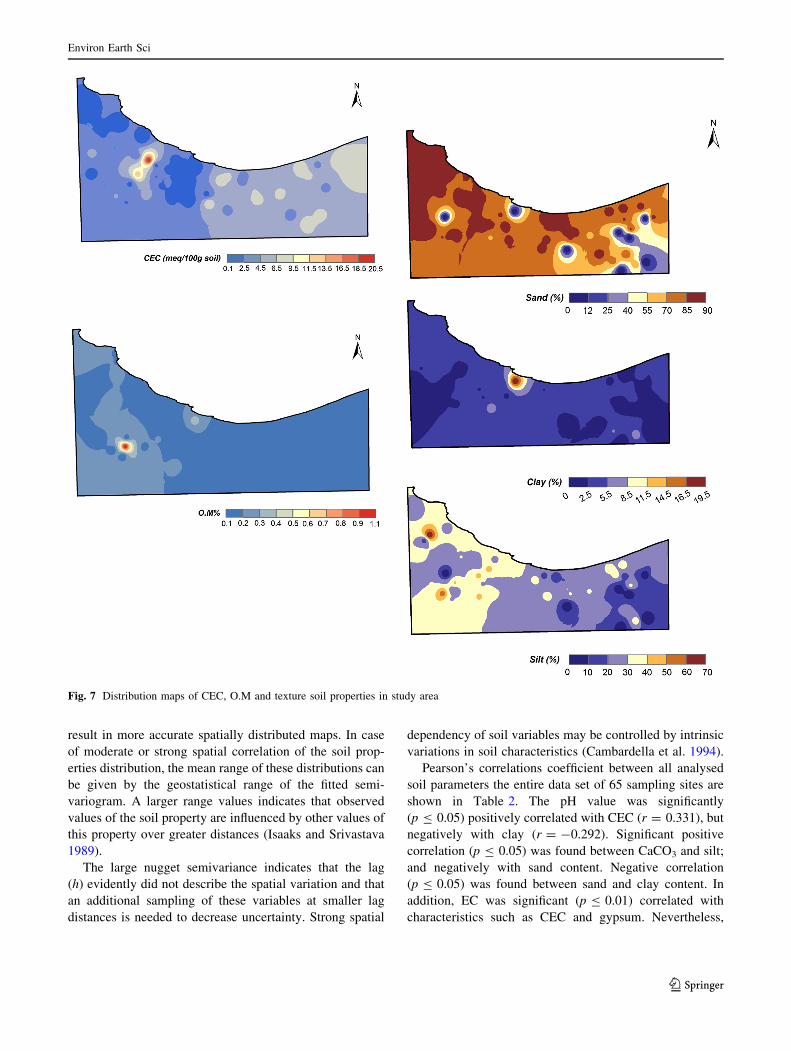
Pearson’s correlations coefficient between all analysed
soil parameters the entire data set of 65 sampling sites are
shown in Table 2. The pH value was significantly
(p B 0.05) positively correlated with CEC (r = 0.331), but
negatively with clay (r = -0.292). Significant positive
correlation (p B 0.05) was found between CaCO3 and silt;
and negatively with sand content. Negative correlation
(p B 0.05) was found between sand and clay content. In
addition, EC was significant (p B 0.01) correlated with
characteristics such as CEC and gypsum. Nevertheless,
Fig. 7 Distribution maps of CEC, O.M and texture soil properties in study area
Environ Earth Sci
123
there was significant (p B 0.01) negative correlation be-
tween sand and silt content (Table 3).
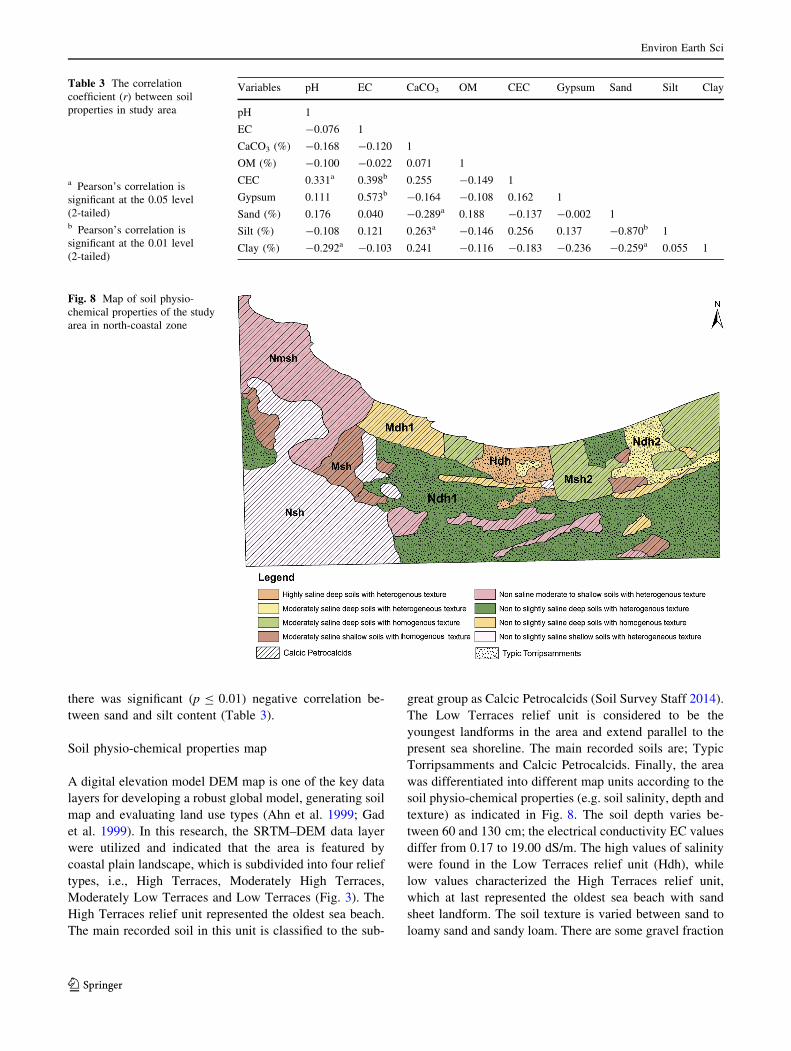
Soil physio-chemical properties map
A digital elevation model DEM map is one of the key data
layers for developing a robust global model, generating soil
map and evaluating land use types (Ahn et al. 1999; Gad
et al. 1999). In this research, the SRTM–DEM data layer
were utilized and indicated that the area is featured by
coastal plain landscape, which is subdivided into four relief
types, i.e., High Terraces, Moderately High Terraces,
Moderately Low Terraces and Low Terraces (Fig. 3). The
High Terraces relief unit represented the oldest sea beach.
The main recorded soil in this unit is classified to the sub-
great group as Calcic Petrocalcids (Soil Survey Staff 2014).
The Low Terraces relief unit is considered to be the
youngest landforms in the area and extend parallel to the
present sea shoreline. The main recorded soils are; Typic
Torripsamments and Calcic Petrocalcids. Finally, the area
was differentiated into different map units according to the
soil physio-chemical properties (e.g. soil salinity, depth and
texture) as indicated in Fig. 8. The soil depth varies be-
tween 60 and 130 cm; the electrical conductivity EC values
differ from 0.17 to 19.00 dS/m. The high values of salinity
were found in the Low Terraces relief unit (Hdh), while
low values characterized the High Terraces relief unit,
which at last represented the oldest sea beach with sand
sheet landform. The soil texture is varied between sand to
loamy sand and sandy loam. There are some gravel fraction
Table 3 The correlation
coefficient (r) between soil
properties in study area
a Pearson’s correlation is
significant at the 0.05 level
(2-tailed)b Pearson’s correlation is
significant at the 0.01 level
(2-tailed)
Variables pH EC CaCO3 OM CEC Gypsum Sand Silt Clay
pH 1
EC -0.076 1
CaCO3 (%) -0.168 -0.120 1
OM (%) -0.100 -0.022 0.071 1
CEC 0.331a 0.398b 0.255 -0.149 1
Gypsum 0.111 0.573b -0.164 -0.108 0.162 1
Sand (%) 0.176 0.040 -0.289a 0.188 -0.137 -0.002 1
Silt (%) -0.108 0.121 0.263a -0.146 0.256 0.137 -0.870b 1
Clay (%) -0.292a -0.103 0.241 -0.116 -0.183 -0.236 -0.259a 0.055 1
Fig. 8 Map of soil physio-
chemical properties of the study
area in north-coastal zone
Environ Earth Sci
123
associated with the shallow soils of the moderately low
Terraces. Soil attributes of the different mapping units are
added from the analysis results of the modal soil profiles
representing the dominant main soil.
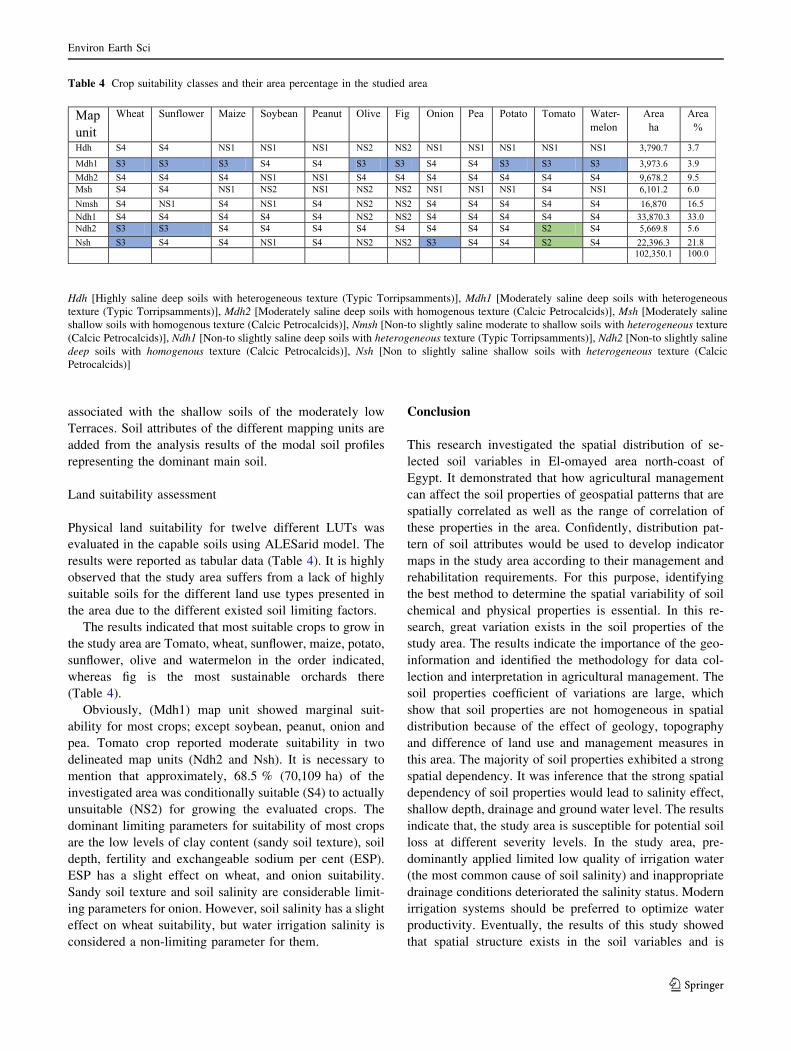
Land suitability assessment
Physical land suitability for twelve different LUTs was
evaluated in the capable soils using ALESarid model. The
results were reported as tabular data (Table 4). It is highly
observed that the study area suffers from a lack of highly
suitable soils for the different land use types presented in
the area due to the different existed soil limiting factors.
The results indicated that most suitable crops to grow in
the study area are Tomato, wheat, sunflower, maize, potato,
sunflower, olive and watermelon in the order indicated,
whereas fig is the most sustainable orchards there
(Table 4).
Obviously, (Mdh1) map unit showed marginal suit-
ability for most crops; except soybean, peanut, onion and
pea. Tomato crop reported moderate suitability in two
delineated map units (Ndh2 and Nsh). It is necessary to
mention that approximately, 68.5 % (70,109 ha) of the
investigated area was conditionally suitable (S4) to actually
unsuitable (NS2) for growing the evaluated crops. The
dominant limiting parameters for suitability of most crops
are the low levels of clay content (sandy soil texture), soil
depth, fertility and exchangeable sodium per cent (ESP).
ESP has a slight effect on wheat, and onion suitability.
Sandy soil texture and soil salinity are considerable limit-
ing parameters for onion. However, soil salinity has a slight
effect on wheat suitability, but water irrigation salinity is
considered a non-limiting parameter for them.
Conclusion
This research investigated the spatial distribution of se-
lected soil variables in El-omayed area north-coast of
Egypt. It demonstrated that how agricultural management
can affect the soil properties of geospatial patterns that are
spatially correlated as well as the range of correlation of
these properties in the area. Confidently, distribution pat-
tern of soil attributes would be used to develop indicator
maps in the study area according to their management and
rehabilitation requirements. For this purpose, identifying
the best method to determine the spatial variability of soil
chemical and physical properties is essential. In this re-
search, great variation exists in the soil properties of the
study area. The results indicate the importance of the geo-
information and identified the methodology for data col-
lection and interpretation in agricultural management. The
soil properties coefficient of variations are large, which
show that soil properties are not homogeneous in spatial
distribution because of the effect of geology, topography
and difference of land use and management measures in
this area. The majority of soil properties exhibited a strong
spatial dependency. It was inference that the strong spatial
dependency of soil properties would lead to salinity effect,
shallow depth, drainage and ground water level. The results
indicate that, the study area is susceptible for potential soil
loss at different severity levels. In the study area, pre-
dominantly applied limited low quality of irrigation water
(the most common cause of soil salinity) and inappropriate
drainage conditions deteriorated the salinity status. Modern
irrigation systems should be preferred to optimize water
productivity. Eventually, the results of this study showed
that spatial structure exists in the soil variables and is
Table 4 Crop suitability classes and their area percentage in the studied area
Map unit
Wheat Sunflower Maize Soybean Peanut Olive Fig Onion Pea Potato Tomato Water-melon
Areaha
Area%
Hdh S4 S4 NS1 NS1 NS1 NS2 NS2 NS1 NS1 NS1 NS1 NS1 3,790.7 3.7
Mdh1 S3 S3 S3 S4 S4 S3 S3 S4 S4 S3 S3 S3 3,973.6 3.9Mdh2 S4 S4 S4 NS1 NS1 S4 S4 S4 S4 S4 S4 S4 9,678.2 9.5Msh S4 S4 NS1 NS2 NS1 NS2 NS2 NS1 NS1 NS1 S4 NS1 6,101.2 6.0Nmsh S4 NS1 S4 NS1 S4 NS2 NS2 S4 S4 S4 S4 S4 16,870 16.5Ndh1 S4 S4 S4 S4 S4 NS2 NS2 S4 S4 S4 S4 S4 33,870.3 33.0Ndh2 S3 S3 S4 S4 S4 S4 S4 S4 S4 S4 S2 S4 5,669.8 5.6Nsh S3 S4 S4 NS1 S4 NS2 NS2 S3 S4 S4 S2 S4 22,396.3 21.8
102,350.1 100.0
Hdh [Highly saline deep soils with heterogeneous texture (Typic Torripsamments)], Mdh1 [Moderately saline deep soils with heterogeneous
texture (Typic Torripsamments)], Mdh2 [Moderately saline deep soils with homogenous texture (Calcic Petrocalcids)], Msh [Moderately saline
shallow soils with homogenous texture (Calcic Petrocalcids)], Nmsh [Non-to slightly saline moderate to shallow soils with heterogeneous texture
(Calcic Petrocalcids)], Ndh1 [Non-to slightly saline deep soils with heterogeneous texture (Typic Torripsamments)], Ndh2 [Non-to slightly saline
deep soils with homogenous texture (Calcic Petrocalcids)], Nsh [Non to slightly saline shallow soils with heterogeneous texture (Calcic
Petrocalcids)]
Environ Earth Sci
123
important for depicting the effect of bed management
practices on soil quality parameters.
Furthermore, land suitability evaluation was performed
with the aid of field survey data and GIS. The results
showed that more than 70,109 ha (68.5 %) in the study
area are marginally to conditionally suitable for agriculture
purposes. The most suitability land uses recommended are
wheat, sunflower, maize and olive, while onion, potato,
tomato and watermelon as recommended vegetables,
whereas fig is the most sustainable orchard cultivation. On
the other hand, there are various limitations for agricultural
use. Therefore, proper soil management is required to in-
crease the soil suitability for different crops. Amelioration
of soil physical properties (i.e., soil texture) and adjustment
of soil pH rather than increased fertilization will greatly
improve the availability of soil nutrients and the agricul-
tural productivity of El-omayed because of the funda-
mental influences of calcareous and salinity soil conditions
and pH on their spatial variability.
References
Ahn CW, Baumgardner MF, Biehl LL (1999) Delineation of soil
variability using geo-statistics and fuzzy clustering analysis of
hyperspectral data. Soil Sci Am J 63:142–150
Akdemir B, Blackmore S (2004) A methodology for production of
yield mapping. J Agric Sci 10(1):38–44
Akdemir B, Belliturk K, Sisman CB, Blackmore S (2005) Spatial
distribution in a dry onion field. A precision farming application
in Turkey. J Central Europ Agric 6(3):211–222
Askin T, Kizilkaya R (2006) Assessing spatial variability of soil
enzyme activities in pasture topsoils using geostatistics. Eur J
Soil Biol 42:230–237
Ayyad MA, Le Floch E (1983) An ecological assessment of
renewable resources for rural agricultural development in the
western Mediterranean coastal region of Egypt; case study: El-
Omayed test area. Published with the financial assistance of the
french ministry of foreign affairs and the stuff and facilities of
the mapping workshop of C.N.R.S./C.E.P.E.L. Emberger,
Montpellier
Cambardella CA, Moorman TB, Novak JM, Parkin TB, Karlen DL,
Turco RF, Konopka AE (1994) Field-scale variability of soil
properties in Central Iowa soils. Soil Sci Soc Am J
58:1501–1511
CAMELEO (1998) Changes in Arid Mediterranean Ecosystems on
the Long Term through Earth Observation. IGSR & NARSS.
CAMELEO Annual progress report—(Contract No. IC18-CT97-
0155)
Childs C (2004) Interpolation surfaces in ArcGIS spatial analyst.
ESRI education services
Corstanje R, Grunwald S, Reddy KR, Osborne TZ, Newman S (2006)
Assessment of the spatial distribution of soil properties in a
northern Everglades Marsh. J Environ Qual 35:938–949
Darwish KhM, El-Khader AA (2008) Use of statistical and spatial
analysis for investigating variations in an onion field at El-Saff,
Giza, Egypt Int. Agrophysics 22(2):103–110
Darwish KhM, Kotb MM, Ali R (2007) Mapping soil salinity using
collocated cokriging in Bayariya oasis, Egypt. In: Proceedings of
the 5th International Symposium on Spatial Data Quality, ITC
Enschede, The Netherlands, 13–15 June 2007
Douaik A, Van Meirvenne M, Toth T (2011) Statistical Methods for
the analysis of soil spatial and temporal variability. INTECH
Open Access Publisher
Duffera M, White JG, Weisz R (2007) Spatial variability of
Southeastern U.S. Coastal Plain soil physical properties: impli-
cations for site-specific management. Geoderma 137:327–339.
doi:10.1016/j.geoderma.2006.08.018
EGEO-SAI, IRD, IATA-CNR, URBT, NAARS, ORMVAO, CNT
(1999) Changes in arid mediterranean ecosystems on the long
term through earth observation, CAMELEO Annual progress
report of year 1998—(Contract N.IC18-CT97-0155)
ESRI (2013) ArcGIS. Environmental System Research Institute,
Redlands
FAO (2006) Guidelines for soil description, 4th edn. FAO, Rome
Gad A, Wahab MA, El-Taweel MI, El-Badawi MM, Abdel-Rahman
MA (1999) Develop and verify a system to evaluate the soil
degradation factors in the Nile Valley, First Annual Progress
Report of Project 1/1/1/1/4—National Research Center, Egypt
Geypens M, Vanongeval L, Vogels N, Meykens J (1999) Spatial
variability of agricultural soil fertility parameters in a gleyic
podzol of Belgium. In: Precision agriculture soil nutrients and
site-specific nutrient management ICETS2000-session 6: tech-
nology innovation and sustainable agriculture. Kluwer Academic
Publishers, The Netherlands, pp 127–131
Goovaerts P (1999) Geostatistics in soil science: state-of-the-art and
perspectives. Geoderma 89(1999):1–45
Holmes KW, Kyriakidis PC, Chadwick OA, Soares JV, Roberts DA
(2005) Multi-scale variability in tropical soil nutrients following
land-cover change. Biogeochemistry 74:173–203
Huang SW, Jin JY, Yang LP, Bai YL (2006) Spatial variability of soil
nutrients and influencing factors in a vegetable production area
of Hebei Province in China. Nutr Cycl Agroecosyst 75:201–212
Isaaks EH, Srivastava RM (1989) An introduction to applied
geostatistics. Oxford University Press, New York
Ismail HA, Morsy I, El-Zahaby EM, ElNagar FS (2001) A developed
expert system for land use planning by coupling land informa-
tion system and modeling, Alexandria. J Agric Res 46:141–154
ISSS-ISRIC-FAO (1998) World reference base for soil resources.
FAO, World Soil Re-sources Report, 84, Rome
Journel AG, Huijbregts C (1978) Mining geostatistics. Academic,
New York
Liu X, Zhao K, Xu J, Zhang M, Si B, Wang F (2008) Spatial
variability of soil organic matter and nutrients in paddy fields at
various scales in southeast China. Environ Geol 53:1139–1147
Miyamoto S, Chacon A (2005) Soil salinity of urban turf areas
irrigated with saline water: I. Soil factors. Landsc Urban Plan
71:233–241
Mahmoud A, Shendi MM, Pradhan B, Attia FA (2009) Utilization of
remote sensing data and GIS tools for land use sustainability
analysis: case study in El-Hammam area, Egypt. Cent Eur J
Geosci 1(3):347–367
Nawar S, Reda M, Farag F, El-Nahry A (2011) Mapping Soil Salinity
in El-Tina Plain in Egypt Using Geostatistical Approach. In:
Proceedings of the 11th conference of Geoinformatics Forum.
Salzburg, Austria, 5–8 July 2011, pp 81–90
Rashad M (2002) Distribution modeling of some heavy metals and
soil properties in an environmentally sensitive area. Dissertation,
Institute of Graduate Studies and Research, Alexandria Univer-
sity, Alexandria, Egypt
Robertson GP (2008) GS ? : geostatistics for the environmental
sciences. Gamma Design Software, Plainwell
Ryel RJ, Caldwell MM, Manwaring JH (1996) Temporal dynamics of
soil spatial heterogeneity in sagebrush–wheatgrass steppe during
a growing season. Plant Soil 184:299–309
Environ Earth Sci
123

Sauer TJ, Meek DW (2003) Spatial variation of plant available
phosphorus in pastures with contrasting management. Soil Sci
Soc Am J 67:826–836
Shendi MM, Mohamed AG, Attia FA (2006) Corporation of remote
sensing and GIS in water management and land use planning in
El-Hammam Area, Northern coast of Egypt. 6th International
Conference on Earth Observation and Geoinformation Sciences
in Support of Africa’s Development, Cairo, Egypt
Soil Survey Staff (2014) Keys to soil taxonomy, 12th edn. USDA-
Natural Resources Conservation Service, Washington, DC
Webster R (1985) Quantitative spatial analysis of soil in the field. Adv
Soil Sci 3:1–70
Webster R, Oliver MA (2000) Geostatistics for environmental
scientists. Wiley, New York
Wei YC, Bai YL, Jin JY, Zhang F, Zhang LP, Liu XQ (2009) Spatial
variability of soil chemical properties in the reclaiming marine
foreland to yellow sea of China. Agric Sci China 8:1103–1111
Zhao Y, Peth S, Krummelbein J, Horn R, Wang Z, Steffens M,
Hoffmann C, Peng X (2007) Spatial variability of soil properties
affected by grazing intensity in inner Mongolia grassland. Ecol
Model 205:241–254
Environ Earth Sci
123
Copyright © 2022 FDOKUMEN