Spatial coordination between cell and nuclear shape within micropatterned endothelial cells
11
ARTICLE NATURE COMMUNICATIONS | 3:671 | DOI: 10.1038/ncomms1668 | www.nature.com/naturecommunications © 2012 Macmillan Publishers Limited. All rights reserved. Received 10 Jun 2011 | Accepted 9 Jan 2012 | Published 14 Feb 2012 DOI: 10.1038/ncomms1668 Growing evidence suggests that cytoplasmic actin filaments are essential factors in the modulation of nuclear shape and function. However, the mechanistic understanding of the internal orchestration between cell and nuclear shape is still lacking. Here we show that orientation and deformation of the nucleus are regulated by lateral compressive forces driven by tension in central actomyosin fibres. By using a combination of micro-manipulation tools, our study reveals that tension in central stress fibres is gradually generated by anisotropic force contraction dipoles, which expand as the cell elongates and spreads. Our findings indicate that large-scale cell shape changes induce a drastic condensation of chromatin and dramatically affect cell proliferation. On the basis of these findings, we propose a simple mechanical model that quantitatively accounts for our experimental data and provides a conceptual framework for the mechanistic coordination between cell and nuclear shape. 1 Mechanobiology & Soft Matter Group, Laboratoire Interfaces et Fluides Complexes, CIRMAP, Faculté des Sciences, Université de Mons, 20, place du Parc, B-7000 Mons, Belgium. Correspondence and requests for materials should be addressed to S.G. (email: [email protected]). Spatial coordination between cell and nuclear shape within micropatterned endothelial cells Marie Versaevel 1 , Thomas Grevesse 1 & Sylvain Gabriele 1
-
Upload
independent -
Category
Documents
-
view
3 -
download
0
Transcript of Spatial coordination between cell and nuclear shape within micropatterned endothelial cells

ARTICLE
�nATuRE CommunICATIons | 3:671 | DoI: 10.1038/ncomms1668 | www.nature.com/naturecommunications
© 2012 Macmillan Publishers Limited. All rights reserved.
Received 10 Jun 2011 | Accepted 9 Jan 2012 | Published 14 Feb 2012 DOI: 10.1038/ncomms1668
Growing evidence suggests that cytoplasmic actin filaments are essential factors in the modulation of nuclear shape and function. However, the mechanistic understanding of the internal orchestration between cell and nuclear shape is still lacking. Here we show that orientation and deformation of the nucleus are regulated by lateral compressive forces driven by tension in central actomyosin fibres. By using a combination of micro-manipulation tools, our study reveals that tension in central stress fibres is gradually generated by anisotropic force contraction dipoles, which expand as the cell elongates and spreads. our findings indicate that large-scale cell shape changes induce a drastic condensation of chromatin and dramatically affect cell proliferation. on the basis of these findings, we propose a simple mechanical model that quantitatively accounts for our experimental data and provides a conceptual framework for the mechanistic coordination between cell and nuclear shape.
1 Mechanobiology & Soft Matter Group, Laboratoire Interfaces et Fluides Complexes, CIRMAP, Faculté des Sciences, Université de Mons, 20, place du Parc, B-7000 Mons, Belgium. Correspondence and requests for materials should be addressed to S.G. (email: [email protected]).
spatial coordination between cell and nuclear shape within micropatterned endothelial cellsmarie Versaevel1, Thomas Grevesse1 & sylvain Gabriele1

ARTICLE
��
nATuRE CommunICATIons | DoI: 10.1038/ncomms1668
nATuRE CommunICATIons | 3:671 | DoI: 10.1038/ncomms1668 | www.nature.com/naturecommunications
© 2012 Macmillan Publishers Limited. All rights reserved.
One of the most fundamental problems in tissue morphogen-esis is the question of how changes in cell shape produce alterations of nuclear form and functions1,2, yet its mecha-
nistic basis is poorly understood3,4. For instance, it is well known that the formation of new blood capillaries requires the polarization and directed migration of endothelial cells (ECs) through large cell elongations5–9. In addition, cell shape changes in ECs are commonly associated with nuclear shape remodelling10–13, which is emerging as a potential regulator of genome function14–16. To explain the link between cellular morphology and information control within living cells, Maniotis et al.17 proposed that cell shape informations are transduced into gene expression through mechanical forces transmitted by the cytoskeleton. This assumption implies that the cytoskeleton applies forces to modulate nuclear shape and size in response to cell shape changes. Interestingly, Khatau et al.18 have reported the presence of a dome-like actin structure, called the actin cap, that covers the top of the nucleus, and their results suggest that this structure is involved in a part of the nuclear shape deformation. More recently, a physical connection between an array of actin fila-ments located above the nucleus and the nuclear membrane, called transmembrane actin-associated nuclear lines, have been observed to be implicated in the intracellular localization of the nucleus19. Furthermore, perturbations of the intermediate filament network could alter the positioning of the nucleus in both migrating and immobile astrocytes, suggesting that cytoplasmic intermediate fila-ments are involved in actin-dependent positioning of the nucleus20. Concomitant with these recent discoveries, significant advances have been made in terms of identifying the molecular links between the nuclear envelope and the cytoplasmic filaments21–25, and new insights have been gained into the mechanistic maintenance of the nucleus3,23,24,26,27. Emerging evidence is now accumulating that cytoplasmic filaments are exploited by cells to govern nuclear mor-phology and finely tune gene expression in response to cell shape changes. However, despite the strong suspicion of the involvement of cytoskeletal actin filaments in the alteration of the intracellular force balance, no mechanical explanation exists for the adaptive remodelling of the nucleus.
This problem can be tackled non-invasively by the use of adhesive islands to create a spatial environment that force single ECs to elon-gate, up to large-scale changes as observed in vivo5–7. We used in this study fibronectin (FN)-coated micropatterns of defined shapes and sizes to understand how changes in cell shape and spreading area (SA), which is known to be a key parameter of the cellular mechanical force balance28,29, induce cytoskeletal reorganizations that regulate the nuclear shape.
In this investigation, we show that the deformation and orien-tation of the nucleus in response to large-scale cell shape changes are mainly controlled by lateral compressive forces and, to a lesser extent, by normal compressive forces, which are both exerted by actin filaments. We demonstrate that lateral compressive forces applied by central thick stress fibres on both sides of the nucleus regulate the nuclear shape as the cell elongates, whereas normal compressive forces are exerted by apical actin filaments to constrain the nuclear height. We show that tension in lateral stress fibres is gradually generated by anisotropic force contraction dipoles as the cell elongates and is strongly dependent on the cell SA. Our findings indicate that large-scale cell shape changes have a dramatic effect on the nuclear shape and structure, resulting in a drastic chromatin condensation and a decrease of cell proliferation. Finally, we have devised a simple physical model that relates the spatial organization and tension of central actin stress fibres to the lateral compressive forces imposed on the nucleus. This mechanical model is able to quantitatively describe the main features of nuclear shape remod-elling and provides a conceptual framework for the mechanical regulation of nuclear shape and functions in response to large-scale changes in cell shape.
ResultsCell shape changes deform and orientate the nucleus. To control both the cell shape index (CSI) and the SA of single ECs, we used a microcontact printing technique to pattern FN30 and define adherent cell shapes and SAs (from 600 to 2,000 µm2). We shape-engineered ECs on circular (CSI = 1), square (CSI = 0.79) and various rectangular (CSI = 0.70, 0.50 and 0.26) adhesive micropatterns, mimicking elongated bipolar shapes observed in vivo5–7. To investigate whether large-scale changes of cell morphology could influence nuclear morphology, we assessed the CSI by differential interference contrast (DIC) microscopy and the nuclear shape index (NSI) by 4′,6-diamidino-2-phenylindole (DAPI) staining for 1,600 µm2 shaped cells (Fig. 1a). As evidenced from Figure 1b, forcing the cells to spread unidirectionally on elongated patterns decrease significantly the NSI, indicating a relation between cell and nuclear shape. How cell shape may influence nuclear orientation was then investigated. Circular-shaped cells showed a random distribution of nuclear orientation spanning 360°, whereas square-shaped cells showed a preferential diagonal orientation of the nucleus, regardless of the SA (Fig. 1c). As the CSI decreased, nuclei became increasingly aligned with respect to the long axis of the cell, to finally reach a well-oriented state for the more pronounced elongated cell shape (CSI ~ 0.26), characterized by a narrow angle sector (89% in a 10°-wide sector, Fig. 1c). Taken together, these results indicate that the nucleus, initially rounded and randomly oriented in circular-shaped cells, becomes progressively deformed and anisotropically oriented as the cell elongates and spreads.
Nuclear remodelling is mediated by the cell SA. Interestingly, Figure 1b and Supplementary Figure S1 show that the nucleus was significantly more deformed when similar-shaped cells (CSI ~ 0.26) elongated on large SAs (NSI = 0.72 ± 0.02 at 2,000 µm2), suggesting that cell spreading is a key parameter of the nuclear deformation process. To further confirm this result, we fixed and stained ECs at different times during their spreading on similar elongated micropatterns (Fig. 2a). As shown in Figure 2b, the nucleus was rounded (NSI ~ 0.97) when ECs started to spread and deformed linearly with increasing the spreading rate to become highly elon-gated (NSI ~ 0.73 at CSI ~ 0.26) when ECs spread completely the FN micropatterns. These results confirm our preliminary observations and underlie the importance of the cell SA in the nuclear shape remodelling process.
Actomyosin is required for nuclear shape remodelling. To gain more insight into the intracellular mechanisms that control the nuclear shape remodelling, we next consider the nuclear shape in the context of the cytoskeletal architecture. We used different pharmacological agents on 1,600 µm2 elongated cells (CSI ~ 0.26) to investigate the role of cytoskeletal components in determining nuclear deformation. As evidenced from Figure 2c, treatment with colchicine, which promotes microtubule depolymerization, did not significantly affect the NSI. Interestingly, alteration of intermediate filament structure with acrylamide and calyculin A allowed the NSI of elongated cells to decrease to 0.63 ± 0.04 and 0.67 ± 0.05, respec-tively (Fig. 2c), suggesting that intermediate filaments contribute to nuclear shape stability by balancing intracellular forces. In con-trast, treatment with blebbistatin, which inhibits actomyosin con-tractility, and latrunculin A, which results in reduced F-actin and focal adhesion (FA) assembly, caused a significant rounding of the nucleus (NSI = 0.91 ± 0.05 and 0.94 ± 0.03, respectively), suggesting that actomyosin activity is a key component of the nuclear deforma-tion process. Finally, we studied the response of thrombin, a vascu-lar permeability agent, which was observed to induce a fast retrac-tion of ECs through increased RhoA-mediated myosin-generated contraction31,32. Remarkably, thrombin treatment resulted in larger deformation of the nucleus (NSI = 0.56 ± 0.04, Fig. 2c), enhancing

ARTICLE
�
nATuRE CommunICATIons | DoI: 10.1038/ncomms1668
nATuRE CommunICATIons | 3:671 | DoI: 10.1038/ncomms1668 | www.nature.com/naturecommunications
© 2012 Macmillan Publishers Limited. All rights reserved.
the importance of actomyosin contractility in cell shape remodel-ling and the critical role of the Rho pathway in determining the extent of actomyosin stress fibre33.
We next investigated whether the disruption of these cytoskel-etal components affects nuclear orientation (Fig. 2d). We found that nuclei of elongated cells remained significantly oriented towards the direction of long cell axis when microtubules and intermediate filaments were disrupted, indicating no involvement of these filaments in the nuclear orientation. By using blebbista-tin, nuclear alignment was lower (60% within a 10°-angle window centred on the long axis of the pattern, which was set to 0°), dem-onstrating that myosin II activity is partially involved in nuclear orientation. After disassembling actin stress fibres with latrun-culin A, we found a random orientation of the nucleus even if the cell remained elongated (Fig. 2d and Supplementary Fig. S2),
establishing that nuclear orientation requires stable actin filament assembly.
Together, these results show that intermediate filaments pro-vide resistance to nuclear deformation and thus help to maintain the mechanical integrity of the nucleus, whereas the mechanism governing nuclear elongation and orientation relies on actomyosin activity and actin filament organization.
Stress fibre distribution in response to cell shape changes. To further investigate how actomyosin activity could be converted into nuclear shape changes, we observed by laser-scanning con-focal microscopy the spatial distribution of actin filaments in the central cell zone, according to the nuclear position in the cell. In circular-shaped cells, F-actin formed circular bundles resulting in the appearance of ‘ring-like’ F-actin structures that localized
SA = 1,600 µm2
CSI ~ 1 0.790.70
0.50
0.26
NSI ~ 0.95 0.930.90
0.88
0.73
n = 29n = 44
n = 38
n = 34
n = 36
89%
180150
120
90
60
300330
300
270
240
240180
150
120
90
60
300330
300
270
240
240180
150
120
90
60
3000 30
60
90
120
150180210
240
270
300
330 330
300
270
240
240
81%71%
60° 30° 10°
Cell elongation
Nuclear elongation
1.00
Nuc
lear
sha
pe in
dex,
NS
I 0.95
0.90
0.85
0.80
0.75
0.70
0.650.2 0.4
Cell shape index, CSI
Nuclear deformation
Nuclear orientation
CSI = 0.79CSI = 1
CSI = 0.7
CSI = 0.5
CSI = 0.26
0.6 0.8
600 µm2
800 µm2
1,200 µm2
1,600 µm2
2,000 µm2
600 µm2
800 µm2
1,200 µm2
1,600 µm2
2,000 µm2
1.0
180150
120
90
60
300330
300
270
240
240
Figure 1 | Cell shape changes induce deformation and orientation of the nucleus. (a) DIC images of single ECs constrained on 1,600 µm2 Fn-coated micropatterns of various shapes (from CsI ~1 to ~0.26). The nucleus, stained in blue with DAPI and superimposed on DIC images, shows nsI ranging from 0.95 in circular-shaped cells to 0.73 in highly elongated cells. The scale bars correspond to 10 µm. (b) Evolution of nsI as a function of CsI for a wide range of sAs (from 600 to 2,000 µm2). To highlight the role of the spreading area, curves for 600 and 2,000 µm2 were fitted with an asymptotic function, in red and purple, respectively. Data are given as mean ± s.d. with n = 15. (c) Angular graphs, superimposed on micropattern drawings in grey, show the different orientations experienced by nuclei in response to cell shape changes for various sAs (from 600 to 2,000 µm2). Data are given as mean ± s.d. .

ARTICLE
��
nATuRE CommunICATIons | DoI: 10.1038/ncomms1668
nATuRE CommunICATIons | 3:671 | DoI: 10.1038/ncomms1668 | www.nature.com/naturecommunications
© 2012 Macmillan Publishers Limited. All rights reserved.
exclusively in the peripheral zone (Fig. 3a and Supplementary Movies 1 and 2). In cells plated on square adhesive patterns, central actin stress fibres were observed to preferentially extent diagonally, in line with previous studies on fibroblast cells34. It is noteworthy that this result is consistent with the diagonal orientations of the nucleus that we observed on square-shaped cells (Fig. 1c). In rectan-gular-shaped cells, outward-curved actin stress fibres were formed along the major cell axis and localized on either side of the nucleus. As the cell became more elongated (from CSI ~0.5 to ~0.26), central actin stress fibres became less curved and tended to adopt a straight morphology (Fig. 3a and Supplementary Movie 3). According to the observations of Khatau et al.18, apical F-actin network in elongated cells was observed to become oriented with respect to the long cell axis (Supplementary Fig. S3).
Cell shape controls FA assembly. To properly understand how actomyosin filaments act on the nucleus, it would then be valuable to evaluate their tension. Previous studies have shown that local forces exerted by stress fibres in stationary cells are related to the area of FAs28. Therefore, we examined in a first approximation whether cell shape changes might affect spatial organization and extent of vincu-lin-containing FAs. After spreading on 1,600 µm2, shaped-cells were immunofluorescently probed for vinculin and imaged using con-focal microscopy (Fig. 3b). Qualitatively, vinculin-containing FAs were found to be homogeneously localized along the circumference
of circular-shaped cells, appeared significantly brighter and concen-trated within the corner regions on square-shaped cells and finally were found to be restricted to the extremities of elongated cells (Fig. 3b). These observations indicate gradual but distinctive changes in the spatial distribution of vinculin-containing FAs in response to cell shape changes. After quantification of vinculin areas, we found that the total FA area formed per cell increased linearly with the extent of cell elongation from CSI ~0.79 to ~0.26 (Supplementary Fig. S4), suggesting that the overall tension per cell increases with cell elongation. Surprisingly, disk-shaped cells were found to form a total FA area significantly larger than those measured for other cell shapes. However, due to the distribution of actin filaments in circular-shaped cells, we can reasonably consider that their nucleus were not affected by this high level of tension, as confirmed by NSI values (Fig. 1b) and immunostaining experiments (Fig. 3a and Supplementary Movie 2).
Changes in cell SA modulate traction forces. To quantitatively determine the amount of tension, we next characterized the trac-tion stress in elongated cells (CSI ~ 0.26) by traction force micros-copy (TFM) for a wide range of SAs (Fig. 3c). We observed that the traction stress was exclusively distributed at the edges of elongated cells (Fig. 3c), confirming that the traction stress is spatially cor-related with adhesion areas. By examining the relationship between the total FA area and SAs for similar shaped cells (CSI ~ 0.26), we found a linear dependence of the total FA area per cell with SAs (Fig. 3d). This relation indicates that FAs in elongated cells formed in proportion to the degree at which cells spread across the sub-strate. Interestingly, the quantification of traction stress was also found to be linearly dependent with SAs (Fig. 3d), indicating indirectly a dependence between tension forces and vinculin- containing FA area in elongated ECs, as suggested by Balaban et al.28 For 1,600 µm2 elongated cells, TFM measurements indi-cated a maximum tension of ~5.7 kPa for a total FA area of ~72 µm2. This result reflects an anisotropic force contraction dipole with two opposing maximum forces of ~205 nN, which is consistent with the amount of forces observed in polarized fibroblasts35.
Central actin fibres generate lateral compressive forces. The next question we addressed was how tension in actin filaments acts on the nucleus in response to cell shape changes. To answer this ques-tion, we first quantified nuclear dimensions by scanning laser con-focal microscopy to determine the three-dimensional relative defor-mations of the nucleus as a function of CSI. As shown in Figure 4a, during elongation the nucleus was subjected to a normal compres-sion, εz, that reached rapidly a threshold of ~16%, suggesting that the nuclear height was maintained constant during large-scale cell elongations. This result is consistent with the presence of well-ori-ented apical actin filaments for elongated ECs (Supplementary Fig. S3), whereas circular (CSI ~ 1.0)- and squared (CSI ~ 0.79)-shaped cells were characterized by a weak density of apical actin filaments. Interestingly, the evolution of the lateral deformation, εy, showed that the nucleus underwent a lateral compression that increased linearly with decreasing CSI, to reach a maximum lateral deforma-tion of ~46%, which was threefold higher than the normal defor-mation. The nucleus underwent also a longitudinal elongation, εx, which increased in response to cell elongation, up to ~26%. This longitudinal elongation is consistent with the situation of a lateral compression applied to a deformable object with a blocked normal extension (Fig. 4b). Taken together, these results suggest a scenario for the nuclear shape remodelling, which is function of the cell elongation. From CSI ~1 to ~0.70, the nucleus experiences a quasi-homothetic deformation by balancing equivalent normal and lat-eral compressive forces (Fig. 4a), whereas from CSI ~0.70 to ~0.26, the nucleus extends longitudinally in response to increased lateral compressive forces and adopts an oblate spheroidal morphology
Cell spreading rate~ 0.15 0.35 0.50 0.80 1.00
ThrombinLatrunculin ABlebbistatinCalyculin AAcrylamideColchicineControl
0.0 0.20.7
0.8
Effect of the spreading area
0.9
Nuc
lear
sha
pe in
dex,
NS
I 1.0
0.7
0.6
0.50.0
Contro
l
Colchic
ine
Calycu
lin A
Blebbis
tatin
Latru
nculi
n A
Throm
bin
Acryla
mide
0.8
0.9
Nuc
lear
sha
pe in
dex,
NS
I 1.0
0.4
Cell spreading rate
0.6 0.8 1.0
3300
300
270
240
Effect of the cytoskeleton
210180
30
60
90
120
150
Figure 2 | The remodelling of the nucleus is mediated by cell spreading area and actomyosin activity. (a) Immunostained images of ECs at different spreading rates (from left to right: 0.15, 0.35, 0.50, 0.80 and 1) on elongated micropatterns with a constant surface area (1,600 µm2). The nucleus is stained in blue with DAPI, actin filaments in green with Alexa 488-phalloidin and focal adhesions in red with vinculin. The scale bar corresponds to 12 µm. (b) Evolution of the nsI of ECs as a function of their spreading rate on elongated micropatterns with a constant surface area (1,600 µm2). The red line corresponds to the best-fit linear regression. (c) Evolution of the nsI of ECs plated on 1,600 µm2 elongated micropatterns (CsI = 0.26) in response to various pharmacological agents. nsI for control cells is presented in black. Data are given as mean ± s.d. (12 ≤ n ≤ 15). (d) Effect of cytoskeletal inhibitors on the angular distribution of nucleus in 1,600 µm2 elongated-shaped ECs (CsI = 0.26). Data are given as mean ± s.d. (12 ≤ n ≤ 15).

ARTICLE
�
nATuRE CommunICATIons | DoI: 10.1038/ncomms1668
nATuRE CommunICATIons | 3:671 | DoI: 10.1038/ncomms1668 | www.nature.com/naturecommunications
© 2012 Macmillan Publishers Limited. All rights reserved.
(Fig. 4b). This indicates that the nuclear deformation of highly elon-gated cells is mainly induced by lateral compressive forces (Supple-mentary Movie 3) and, to a lesser extent, by normal compressive forces.
On the basis of the relative contribution of normal and lateral compressive forces, we choose a simplifying assumption focusing only on central actin fibres. We set out to develop a two-dimensional physical model that could mechanistically describe how tension generated in lateral actomyosin filaments modulates nuclear shape. Two observations—first that curved actin stress fibres formed along the longitudinal cell direction tend to adopt a straight morphology in response to cell elongation (Fig. 3a and Supplementary Movie 3), and second that tension in central actin stress fibres increases with SA (Fig. 3d)—are central to our proposed mechanism of nuclear shape regulation.
We consider the simplest situation in which the nucleus of a highly elongated cell of initial radius R0 is symmetrically surrounded by two thick and parallel actin cables (Fig. 4c). Under the action of lateral compressive forces resulting from the tension in both actin cables, the nucleus is squeezed uniaxially along the x-direction over a distance 2∆R = 2(R0–Rx) (Fig. 4c). Considering the geometry of the system (Fig. 4c), the equilibrium between compressive forces, Fc, and tension in actin stress fibres, Tf, is
F Tc f= 2 sinq
where θ is the angle between an actin stress fibre and the vertical axis passing through its end connected to the extracellular matrix.
(1)(1)
The quantification of θ for similar elongated cells (CSI = 0.26) showed an exponential decay of θ as the SA increases (Fig. 4d), sug-gesting that actin stress fibres around the nucleus tend to adopt a straight morphology for large SAs. The quantification of θ could also be used to describe the evolution of Rx, such as
R lx ∼
2tanq
where l is the long axis of the cell. As shown in Figure 4e, pre-dicted Rx values are consistent with those measured from nuclear deformations.
Then we assumed that the whole amount of tension per cell is related to the tension generated in actomyosin cables acting on the nucleus. By combining the quantification of Tf from TFM experiments (Fig. 3d) and the quantification of θ from confocal imaging (Fig. 4d), we estimated Fc by using equation (1). We found that compressive forces acting on the nucleus of elongated cells (CSI ~0.26) increased with the SA, following a sigmoidal curve (Fig. 4f). Interestingly, this finding explains why we observed a rounded nucleus on small SA (Fig. 2b)—that is, low compressive forces—whereas the nucleus was significantly deformed on large SAs—that is, high compressive forces (Supplementary Fig. S5 and Supplementary Movies 4 and 5).
Considering the compression stress, σ = Fc/A0, and the compres-sion strain, ε = ∆R/R0 (with ∆R = R0–Rx), the Young’s modulus of the nucleus, En, is given by:
Enc=
RA
FR
0
0 ∆
(2)(2)
(3)(3)
xy
z ApicalCentralVentral
CSI ~1 0.79 0.70
0.50
0.26
CSI ~1 0.790.70
0.50
0.26
100Focal adhesion area
Actin organization in the central zone
Constrained FTTC: tractionsDisplacements
3.5 –60
7
6
5
4 kPa
3
2
1
–40
0
20
40
60
–20
–60
–60
–40
–40
0
0
20
20
40
4060
60
–20
–20 –60 –40 0 20 40 60–20
y (µ
m)
y (µ
m)
µm
x (µm) x (µm)
3
2.5
2
1.5
0.5
1
Traction forces in elongated cells
Traction forces
Spreading area (µm2)
CSI = 0.26
Tota
l foc
al a
dhes
ion
area
/cel
l (µm
2 )
80
60
Traction forces (kPa)
40
20
0
8
6
4
2
0400 800 1,200 1,600 2,000
Vinculin-containing focal adhesions
Figure 3 | Spatial reorganization of actin stress fibres and focal adhesions in response to cell shape changes. (a) The spatial distribution of actin filaments in the central zone (see cartoon) of ECs plated on 1,600 µm2 Fn-coated micropatterns was visualized by scanning laser confocal microscopy using phalloidin Alexa 488 staining after 24 h in culture. The nucleus, stained in blue with DAPI, was superimposed for clarity. The scale bars correspond to 10 µm. (b) Immunofluorescence staining for vinculin in 1,600 µm2 shaped cells showing the coordinated reorganization of FAs with cell shape changes. The colour was inverted. The scale bars correspond to 10 µm. (c) Representative images of displacement and traction maps showing typical force distribution in an elongated EC (CsI ~ 0.26 and sA = 1715 µm2). (d) Quantification of the total area of FAs per cell (in black) and tension forces (in blue) in highly elongated cells (CsI ~ 0.26) as a function of the sA. The area of FAs and tension forces per cell increase linearly with the sA. Data are given as mean ± s.d. with 12 ≤ n ≤ 15 for vinculin staining and 3 ≤ n ≤ 7 for traction force experiments.

ARTICLE
��
nATuRE CommunICATIons | DoI: 10.1038/ncomms1668
nATuRE CommunICATIons | 3:671 | DoI: 10.1038/ncomms1668 | www.nature.com/naturecommunications
© 2012 Macmillan Publishers Limited. All rights reserved.
where R0 is the initial radius of the nucleus and A0 is the contact area between the nucleus and actin filaments through which the compres-sive forces are applied. By using experimental values for R0 and A0 (see Methods), equation (3) allows us to predict an increase in the nuclear Young’s modulus as compressive forces increased (Fig. 4g), suggesting a force-dependent stiffening response of the nucleus. By extrapolating the curve shown in Figure 4e, we estimated the nuclear Young’s modulus at zero-force condition about E0 = 5.0 ± 0.6 kPa, which is consistent with the nuclear elastic modulus of 5.1 ± 3.0 kPa found by microplate experiments on spread ECs36.
Nuclear shape remodelling is accompanied by nuclear volume loss. To describe the nuclear morphology with more accuracy, we reported the long, a, the short, b, axis and the height, c, of the nucleus quantified by laser scanning confocal microscopy (Fig. 5a). When analysing the evolution of the long-to-short axis ratio of the nucleus, a/b, and its projected area as a function of CSI (Fig. 5b,c), we found that these two parameters display opposite evolution. Indeed, the nuclear aspect ratio is characterized by a threefold increase as CSI decreases, while the mean projected area of the nucleus was found to decrease by ~22%. To search for the origin of this behaviour, we next
xy
Normal compression�z ~16%
Lateral compression�y ~46%
Longitudinal elongation�x ~26%
z
R0
Rx ∆R
Tf
Fc
Tf
�
0.20
8.0
7.5
7.0
6.5
6.0
5.5
5.0
4.5
80
CSI = 0.26
CSI = 0.26 Rx predictedRx experimental
70
Com
pres
sive
forc
e, F
c (n
N)
60
50
40
20
30
50
40
�x: Longitudinal elongation�y: Lateral compression
�z: Normal compression
20
10
00.2 0.4 0.6
Cell shape index, CSI0.8 1.0
30R
elat
ive
defo
rmat
ions
of t
henu
cleu
s (%
)
20
16
8
4
00 20 40 60 80
12
0.16
0.12
0.08
400 80080
01,2001,
200
Spreading area (µm2)Spreading area (µm2)
CSI = 0.26
600 ≤ SA ≤ 2,000 µm2
Pre
dict
ed n
ucle
ar y
oung
’s m
odul
us,
En
(kP
a)
E0 = 5.0 ± 0.6 kPa
� (r
ad)
Rx
(µm
)
1,600
1,60
02,000
400 800 1,200
Spreading area (µm2)
1,600 2,000
2,00
01,
800
1,40
01,
000
600
l
Lateral compressive force, Fc (nN)
Figure 4 | Nuclear deformations are related to lateral compressive forces generated by central actomyosin fibres. (a) Evolution of the three-dimensional (3D) relative deformations of the nucleus as a function of the CsI (sA ~1,600 µm2). In blue: longitudinal extension (εx), in green: lateral compression (εy) and in black: normal compression (εz). (b) schematic representation of the 3D relative deformations of the nucleus (CsI ~ 0.26 and sA ~1,600 µm2). (c) schematic of the two-dimensional spatial organization of central actomyosin cables localized on either side of the nucleus (CsI ~ 0.26). on low sAs, the nucleus of elongated cells is schematically represented by a circular shape of initial radius R0 (in light blue) surrounded by two curved actomyosin fibres (dashed green lines) connected to the FA areas (dark grey circles) localized at the ends of the cell. on large sAs, the nucleus (in dark blue) is significantly squeezed and oriented by straight actin cables (green lines), which are tightened around the nucleus. Tension forces in central actin stress fibres, Tf, result in lateral compressive forces, Fc acting on both sides of the nucleus over a distance 2∆R = 2(R0 − Rx). (d) Evolution of the angle of actomyosin fibres, θ, in highly elongated cells (CsI ~ 0.26) as a function of the sA. (e) Evolution of predicted (red crosses) and experimental (black circles) values of ∆R in highly elongated cells (CsI ~ 0.26) versus the sA. (f) Compressive forces, Fc, experienced by the nucleus in highly elongated ECs (CsI ~ 0.26) follow a sigmoidal curve as a function of the sA. (g) Predicted evolution of the nuclear Young’s modulus, En, in highly elongated cells (CsI ~ 0.26) as a function of compressive force values reported in f. Extrapolation of the linear relation between En and Fc allows to estimate E0 = 5.0 ± 0.6 kPa at zero-force condition. Data are given as mean ± s.d. with n = 12 for d, e and 12 ≤ n ≤ 15 for f, g.

ARTICLE
�
nATuRE CommunICATIons | DoI: 10.1038/ncomms1668
nATuRE CommunICATIons | 3:671 | DoI: 10.1038/ncomms1668 | www.nature.com/naturecommunications
© 2012 Macmillan Publishers Limited. All rights reserved.
assumed an ellipsoidal shape for the nucleus to estimate the volume and the surface area of the nucleus. Surprisingly, we found that the nuclear shape remodelling results in a surface area and volume decrease of ~22 and ~50%, respectively (Fig. 5d). This observation could be explained by a shrinkage of the nucleus due to the highly folded structure of the nuclear membrane37. Then we investigated the effect of blebbistatin treatment and intermediate filament inhibi-tors on nuclear volume for circular (CSI ~ 1) and elongated (CSI ~0.26) ECs. We found that the nuclear volume of circular-shaped cells was not affected by actomyosin inhibition, whereas the nuclear volume of elongated cells was significantly increased with bleb-bistatin treatment (Supplementary Fig. S6). These results confirm that the nucleus of circular-shaped cells is not altered by tension in actomyosin filaments (Supplementary Movie 2) and are consistent with the evolution of NSI in response to inhibitors, as observed in the Figure 2c. The disruption of intermediate filaments in elongated ECs induced a decrease in the nuclear volume (Supplementary Fig. S7), confirming that intermediate filaments contribute to nuclear shape stability by balancing intracellular forces. Interestingly, the nuclear volume loss that accompanied the overall nuclear remodelling process (Fig. 5d) supports the stiffening hypothesis of the nucleus as predicted by our model (Fig. 4g), therefore suggesting a deep remod-elling of the nuclear architecture in response to cell elongation.
Chromatin condensation and low cell proliferation rate. Start-ing from the above results, an important question that needed to be addressed was therefore whether large-scale changes of cell shape may affect nuclear architecture and functions. To answer this ques-tion, we first examined the chromatin organization by using a quan-titative procedure based on DAPI staining38. Indeed, the uptake of DAPI depends on the total amount of DNA, but also on its level of condensation39. For these reasons, the average spatial density corre-sponding to the ratio between the integrated fluorescence intensity and the volume of the nucleus is a reliable indicator of the in-situ average chromatin condensation. As shown in Figure 6a, marked reorganization of chromatin distribution was associated with nuclear deformation. Highly condensed chromatin domains show higher fluorescence intensity with respect to the less condensed ones. When cells were disk-shaped, chromatin was largely extended within a rounded nucleus, with few small condensed domains local-ized centrally. As the cell elongated, the nucleus became deformed and chromatin tended to condense starting from the nuclear periphery towards the centre to become rapidly packaged (Fig. 6a). By plotting the nuclear average spatial density as a function of CSI (Fig. 6b), we showed that the average spatial density of the nucleus
xy
z
c/2
a/2
b/2
CSI: 1 > 0.78 > 0.7 > 0.5 > 0.26a
b
3.5
2.5
12
10
8
6
4
2
00.2 0.4 0.6 0.8 1.0
3.0
120
140
Mea
n pr
ojec
ted
area
(µm
2 )
160
180
200
220
Long
-to-
shor
t axi
s ra
tio (
a/b)
Nuc
lear
vol
ume
(µm
3 )
Nuc
lear
dim
ensi
ons
a/2,
b/2
, c/2
(µm
)
2.0
1.5
1.0
650
550
500
450
450
350 350
400
Nuc
lear
sur
face
are
a (µ
m2 )
300250
0.2 0.4
Cell shape index (CSI)Cell shape index (CSI)
0.6 0.8 1.0
0.2 0.4
Cell shape index (CSI)
0.6 0.8 1.0
Figure 5 | The nuclear shape remodelling is accompanied by a nuclear volume loss. (a) schematic representation of the long axis (a, in red), the short axis (b, in blue), the height (c, in black) and the projected area (dashed green zone) of a nucleus assuming a spheroidal morphology. Quantitative measurements of a, b and c for 1,600 µm2 shaped cells (1≥CsI≥0.26) were carried out by laser scanning confocal microscopy. The evolution of a/2 (in red), b/2 (in blue) and c/2 (in black) was plotted as a function of the CsI. Data are given as mean ± s.d. with 8 ≤ n ≤ 12. (b) The long-to-short axis ratio (a/b, black curve) and the projected area (green curve), corresponding to the green dashed area in the cartoon presented in a, were plotted as a function of the CsI for sA = 1,600 µm2. Data are given as mean ± s.d. with 8 ≤ n ≤ 12. (c) superimposed nuclear outlines show clearly the increase in the long-to-short axis ratio, whereas the nuclear projected area decreases. (d) The nucleus was fitted with an ellipsoidal morphology to calculate the evolution of the nuclear volume (in black) and the nuclear surface area (in blue) versus CsI. During cell elongation, both volume and surface area of the nucleus decrease. Data are given as mean ± s.d. with 8 ≤ n ≤ 12.
0.72
0.93
0.88 0.5
0.7
0.94 0.79
0.95 1
NSI~ CSI~
0.26
n = 76
77 7769 70
0.22
0.20
Nuc
lear
ave
rage
spa
tial
dens
ity (
a.u.
)N
ucle
ar a
vera
ge s
patia
lde
nsity
(a.
u.)
DN
A s
ynth
esis
(% o
f lab
elle
d nu
clei
)
0.18
0.16
0.140.2
0.30
0.25
0.20
0.15
0.10
0.05
0.00
50
40
30
20
10
01.0 0.79
Cell shape index (CSI)
0.7 0.5 0.26
0.4 0.6Cell shape index (CSI)
CSI=1
CSI=0.
26
CSI=0.
26
+ th
rom
bin
CSI=0.
26
+ ble
bbist
atin
0.8 1.0
255
191
128
64
0
Figure 6 | Cell elongation leads to chromatin condensation and affects cell proliferation. (a) successive changes of the level of chromatin condensation as the nsI decreases. Intensities of DnA staining were digitized in 256 bits and colour coded (from high to low: white, purple, red, orange, yellow, green, light blue and dark blue). Highly condensed domains show higher fluorescence intensity with respect to the less condensed ones. (b) Evolution of the mean average spatial density of the nucleus as a function of the CsI. (c) Elongated cells (CsI ~ 0.26, light grey bar) were treated with thrombin (hatched bar) and blebbistatin (cross-hatched bar). The average spatial density quantified by DAPI staining was compared with circular-shaped cells (dark grey bar). (d) Evolution of the DnA synthesis in response to cell shape changes (1 ≥ CsI ≥ 0.26). Data are given as mean ± s.d. with n ≥ 12 for b, c and 69 ≤ n ≤ 76 for d.

ARTICLE
��
nATuRE CommunICATIons | DoI: 10.1038/ncomms1668
nATuRE CommunICATIons | 3:671 | DoI: 10.1038/ncomms1668 | www.nature.com/naturecommunications
© 2012 Macmillan Publishers Limited. All rights reserved.
increased with decreasing CSI, establishing that condensation of chromatin takes place as the cell elongates. It is noteworthy that nuclear stiffening (Fig. 4e) and chromatin condensation (Fig. 6b) in response to cell elongation are both consistent with micropipette aspiration experiments40, suggesting that the rheological param-eters of the nucleus is largely set by the level of chromatin condensa-
tion. As shown in Figure 6c, we observed that thrombin treatment increased the chromatin condensation by ~31%, whereas blebbista-tin induced a decrease of ~20%. These results indicate that large nuclear deformations previously observed for thrombin-treated cells are associated with a high level of chromatin compaction and confirm the role of actomyosin filaments in the modulation of the
CSI ~1 0.790.70
0.50
0.26
Nucleus
Chromatin
Focal adhesionsNuclear pore complex
Nuclear lamina
Central stress fibres
Nuclear membrane
Adhesive micropattern Water-soluble molecules
Tension forces
Lateral compressive forces
Nuclear volume decrease
Chromatin condensation
Contractile circular bundles
Aligned stress fibres
Isotropiccontraction forces
Anisotropic forcecontraction dipole
Initial state
NSI ~0.95 0.930.90
0.88
0.73
Randomly oriented androunded-shaped nucleus
Oriented and elongated nucleus
Elongated state
0 ≤ θ ≤ 360° θ ≤ 10°
Apical stress fibres
Normal compressive forces
Cell proliferation
Figure 7 | Model for the mechanical orchestration between cell and nuclear shape changes. As the cell elongates, the nucleus initially rounded and randomly oriented becomes significantly deformed and oriented with respect to the long-cell axis direction. Cellular elongation is associated with the formation of parallel actin bundles on either sides of the nucleus and the anisotropy of FAs. During cell elongation, tension in actin filaments increases and results in a high level of compressive forces acting laterally on both sides of the nucleus. The magnitude of compressive forces is denoted by the thickness of the black arrows. Changes in nuclear shape induce a loss of nuclear volume, which causes conformational changes in chromatin structure that significantly affect the cell proliferation.
ARTICLE
�
nATuRE CommunICATIons | DoI: 10.1038/ncomms1668
nATuRE CommunICATIons | 3:671 | DoI: 10.1038/ncomms1668 | www.nature.com/naturecommunications
© 2012 Macmillan Publishers Limited. All rights reserved.
nuclear architecture. We next investigated the effect of large-scale cell shape changes on the cell proliferation rate. The DNA synthesis of ECs, which provides an indication of the cell proliferation rate, was determined by the percentage of 5-bromo-2′-deoxyuridine (BrdU)-positive cells after a cumulative incorporation (8 h label-ling). The proliferation rate was found to be drastically affected by cell elongation (Fig. 6d). Furthermore, we observed a linear relation between the average spatial density and cell proliferation, suggest-ing that DNA synthesis could be altered by chromatin condensation (Supplementary Fig. S8).
DiscussionOur results show that actin filaments are essential factors in the mechanical process of nuclear remodelling and establish for the first time a distinct function for central and apical actin structures. Our findings support a model of a gradual anisotropic contraction dipole as the cell elongates, whereby lateral compressive forces act-ing on the nucleus are driven by a coupling of anisotropic tension and central actin filaments distribution. Furthermore, our results show the unrevealed importance of the cell SA in the nuclear shape remodelling process.
We devised a simple mechanical model that relates the varia-tions of orientation and tension in central actin filaments to nuclear deformations. This model describes how the extent of cell elonga-tion induces a growing increase of tension in central actomyosin cables that regulate the nuclear shape by applying lateral compres-sive forces on both sides of the nucleus. Our study, for the time to our knowledge, therefore provides a unifying perspective on the mechanistic regulation between cell and nuclear shape (Fig. 7).
Interestingly, this model not only provides a conceptual frame-work of the mechanical coupling between cell and nuclear shape but also predicts a stiffening of the nucleus as the cell elongates. We demonstrated that this nuclear stiffening occurs in response to cell elongation due to a significant loss of nuclear volume, which induces chromatin condensation and dramatically affects cell proliferation. Our results give a physical insight in the stiffening of EC nuclei41 and are consistent with previous works indicating that an important part of the nuclear volume (~45%) of isotropic ECs remains virtu-ally free of DNA42, and that nuclear pores expand and transport rates increase when cells physically elongate43. As the typical times-cale of stress fibre assembly (from several minutes to few hours) is larger than the characteristic plastic time of the nucleus (τp~10 s)40, our model is also consistent with the current rheological view of the nucleus, which considers that the nucleus is stiff and resists dis-tortions at short times, but it softens and deforms more readily at longer times40,44.
Additional investigations using computational models45 to include fluid leakage through the pores and the relative contribu-tion of the nuclear envelope could be useful to elucidate the under-lying mechanisms of this cytoskeleton-mediated hardening of the nucleus. In addition, given recent interests on molecular linkages between apical actin filaments and nuclear membrane18,19, it will be interesting to investigate whether such links exist for central actin filaments and influence the force transmission process.
MethodsStamp fabrication and microcontact printing. Micropatterns of various shapes (circles, squares and rectangles with aspect ratios of 1:2, 1:4 and 1:10) and vari-ous areas (600, 800, 1,200, 1,600, 2,000 µm2) were generated to a silicon master by deep reactive-ion etching (FH Vorarlberg University of Applied Sciences, Microtechnology, Dornbirn, Austria) from a chromium photomask (Toppan Photomask, Corbeil Essonnes, France). The silicon surface was passivated with a fluorosilane (tridecafluoro-1,1,2,2-tetrahydrooctyl-1-trichlorosilane, Gelest) for 30 min, and microstamps were obtained by molding the silanized silicon master with polydimethylsiloxane, PDMS, (Sylgard 184 Silicone Elastomer Kit; Dow Corning, Midland, MI) cured for 4 h at 60 °C. PDMS stamps were oxidized in an ultraviolet/O3 oven for 8 min and inked with a 25 µg ml − 1 FN solution from human plasma (Sigma, St Louis, MO) for 1 h at room temperature. Then PDMS
stamps were dried under filtered air and gently pressed onto a flat PDMS-coated glass coverslip. Uncoated regions were blocked by incubating for 5 min in a 1% Pluronic F-127 solution46 (BASF, Mount Olive, NJ) and washed three times in PBS.
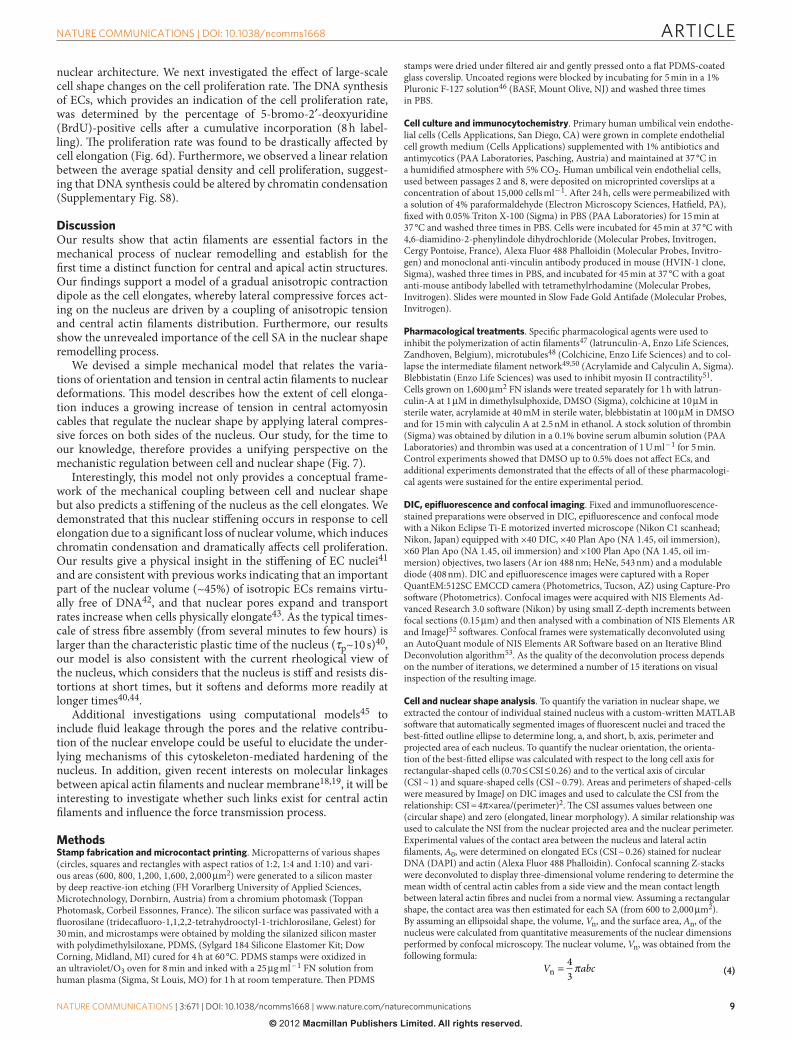
Cell culture and immunocytochemistry. Primary human umbilical vein endothe-lial cells (Cells Applications, San Diego, CA) were grown in complete endothelial cell growth medium (Cells Applications) supplemented with 1% antibiotics and antimycotics (PAA Laboratories, Pasching, Austria) and maintained at 37 °C in a humidified atmosphere with 5% CO2. Human umbilical vein endothelial cells, used between passages 2 and 8, were deposited on microprinted coverslips at a concentration of about 15,000 cells ml − 1. After 24 h, cells were permeabilized with a solution of 4% paraformaldehyde (Electron Microscopy Sciences, Hatfield, PA), fixed with 0.05% Triton X-100 (Sigma) in PBS (PAA Laboratories) for 15 min at 37 °C and washed three times in PBS. Cells were incubated for 45 min at 37 °C with 4,6-diamidino-2-phenylindole dihydrochloride (Molecular Probes, Invitrogen, Cergy Pontoise, France), Alexa Fluor 488 Phalloidin (Molecular Probes, Invitro-gen) and monoclonal anti-vinculin antibody produced in mouse (HVIN-1 clone, Sigma), washed three times in PBS, and incubated for 45 min at 37 °C with a goat anti-mouse antibody labelled with tetramethylrhodamine (Molecular Probes, Invitrogen). Slides were mounted in Slow Fade Gold Antifade (Molecular Probes, Invitrogen).
Pharmacological treatments. Specific pharmacological agents were used to inhibit the polymerization of actin filaments47 (latrunculin-A, Enzo Life Sciences, Zandhoven, Belgium), microtubules48 (Colchicine, Enzo Life Sciences) and to col-lapse the intermediate filament network49,50 (Acrylamide and Calyculin A, Sigma). Blebbistatin (Enzo Life Sciences) was used to inhibit myosin II contractility51. Cells grown on 1,600 µm2 FN islands were treated separately for 1 h with latrun-culin-A at 1 µM in dimethylsulphoxide, DMSO (Sigma), colchicine at 10 µM in sterile water, acrylamide at 40 mM in sterile water, blebbistatin at 100 µM in DMSO and for 15 min with calyculin A at 2.5 nM in ethanol. A stock solution of thrombin (Sigma) was obtained by dilution in a 0.1% bovine serum albumin solution (PAA Laboratories) and thrombin was used at a concentration of 1 U ml − 1 for 5 min. Control experiments showed that DMSO up to 0.5% does not affect ECs, and additional experiments demonstrated that the effects of all of these pharmacologi-cal agents were sustained for the entire experimental period.
DIC, epifluorescence and confocal imaging. Fixed and immunofluorescence-stained preparations were observed in DIC, epifluorescence and confocal mode with a Nikon Eclipse Ti-E motorized inverted microscope (Nikon C1 scanhead; Nikon, Japan) equipped with ×40 DIC, ×40 Plan Apo (NA 1.45, oil immersion), ×60 Plan Apo (NA 1.45, oil immersion) and ×100 Plan Apo (NA 1.45, oil im-mersion) objectives, two lasers (Ar ion 488 nm; HeNe, 543 nm) and a modulable diode (408 nm). DIC and epifluorescence images were captured with a Roper QuantEM:512SC EMCCD camera (Photometrics, Tucson, AZ) using Capture-Pro software (Photometrics). Confocal images were acquired with NIS Elements Ad-vanced Research 3.0 software (Nikon) by using small Z-depth increments between focal sections (0.15 µm) and then analysed with a combination of NIS Elements AR and ImageJ52 softwares. Confocal frames were systematically deconvoluted using an AutoQuant module of NIS Elements AR Software based on an Iterative Blind Deconvolution algorithm53. As the quality of the deconvolution process depends on the number of iterations, we determined a number of 15 iterations on visual inspection of the resulting image.
Cell and nuclear shape analysis. To quantify the variation in nuclear shape, we extracted the contour of individual stained nucleus with a custom-written MATLAB software that automatically segmented images of fluorescent nuclei and traced the best-fitted outline ellipse to determine long, a, and short, b, axis, perimeter and projected area of each nucleus. To quantify the nuclear orientation, the orienta-tion of the best-fitted ellipse was calculated with respect to the long cell axis for rectangular-shaped cells (0.70 ≤ CSI ≤ 0.26) and to the vertical axis of circular (CSI ~ 1) and square-shaped cells (CSI ~ 0.79). Areas and perimeters of shaped-cells were measured by ImageJ on DIC images and used to calculate the CSI from the relationship: CSI = 4π×area/(perimeter)2. The CSI assumes values between one (circular shape) and zero (elongated, linear morphology). A similar relationship was used to calculate the NSI from the nuclear projected area and the nuclear perimeter. Experimental values of the contact area between the nucleus and lateral actin filaments, A0, were determined on elongated ECs (CSI ~ 0.26) stained for nuclear DNA (DAPI) and actin (Alexa Fluor 488 Phalloidin). Confocal scanning Z-stacks were deconvoluted to display three-dimensional volume rendering to determine the mean width of central actin cables from a side view and the mean contact length between lateral actin fibres and nuclei from a normal view. Assuming a rectangular shape, the contact area was then estimated for each SA (from 600 to 2,000 µm2). By assuming an ellipsoidal shape, the volume, Vn, and the surface area, An, of the nucleus were calculated from quantitative measurements of the nuclear dimensions performed by confocal microscopy. The nuclear volume, Vn, was obtained from the following formula:
V abcn = 43
p (4)(4)

ARTICLE
�0�
nATuRE CommunICATIons | DoI: 10.1038/ncomms1668
nATuRE CommunICATIons | 3:671 | DoI: 10.1038/ncomms1668 | www.nature.com/naturecommunications
© 2012 Macmillan Publishers Limited. All rights reserved.
whereas the nuclear surface area, An, was estimated from the following approxi-mate formula:
A a b a c b cp p p p p p p
n ≈ + +
43
1
p/
where 2a, 2b and 2c correspond to the length, the width and the height of the nucleus, respectively, with p = 1.6075.
Traction force microscopy data measurement and analysis. Polyacrylamide gels (0.1% bis and 5% acrylamide; 70 µm thick) containing 1:50 volume of carboxylate-modified fluorescence latex beads (0.2 µm Fluospheres, Molecular Probes, Eugene, OR) were fabricated on 25-mm diameter glass coverslips. The Young’s modulus of the gel was estimated to be 9 kPa using Dynamic Mechanical Analysis (Mettler Toledo, Switzerland). FN-coated PDMS stamps were allowed to react with the activated gel for 1 h at 37 °C to create FN-coated adhesive islands. After removal of the excess of FN by washing with PBS, unprinted areas of the gels were passivated with a bovine serum albumin solution overnight. Fluorescence images of the gel containing fluorescent beads immediately beneath the patterned cells were taken during the cell detachment. The change of the position of the fluorescence beads were measured in Matlab software using an algorithm described previously54. This yielded the discretized displacement field between two consecutive frames. The cal-culated displacements were summed up to determine the overall two-dimensional displacement field. The traction field was then calculated from the displacement field by adapting the algorithm previously developed35. This algorithm solved the inverse of the Boussinesq solution from the displacement field on the surface of an elastic halfspace to obtain the traction field when the mechanical properties of the gel are known. The Poisson ratio of the gel was assumed to be close to 0.5 (ref. 55). The interior of the cell was subdivided into 64 µm2 squares to approximate the discretized localization of contractile forces.
Apparent chromatin condensation and DNA synthesis. Spatial chromatin organization was visualized by staining with DAPI, a fluorescent dye that selec-tively binds to the double-stranded DNA. After permeabilization in 0.05% Triton X-100 solution (Sigma), ECs were stained with 25 µg ml − 1 DAPI and a stack of nuclear images at different focal positions along the z axis (0.15 µm intervals) were acquired in confocal scanning microscopy. To obtain quantitative information, shading correction and dark image substraction were applied in MATLAB to each image38 and a constrained deconvolution in NIS Elements AR software was used to sharpen the image56. After normalizing for time exposure, the integrated fluo-rescence intensity was calculated as the sum of the intensity of each pixel. The total fluorescence intensity was then divided by the nuclear volume to obtain the average spatial density, which correlates with the average chromatin packing ratio56,57, and as such is indicative of chromatin condensation. The proliferative activity in shape-engineered ECs has been investigated by detecting the incorporation of BrdU into cellular DNA. BrdU is a thymidine analogue that incorporates into the DNA-synthetizing nuclei, which can be identified immunohistochemically using an anti-BrdU monoclonal antibody. BrdU cumulative labelling was carried out with injection of 10 µM BrdU in PBS from t = 16 h to 24 h, with intervals of 2 h. After cumulative BrdU injections, cells were fixed in paraformaldehyde and DNA was denatured in DNase I (Sigma) at 62.5 U ml − 1 for 30 min at 37 °C.
References1. Champy, C. & Carleton, H. M. Memoirs: observations on the shape of the
nucleus and its determination. J. Cell Sci. 65, 589–625 (1921).2. Rowat, A. C., Lammerding, J., Herrmann, H. & Aebi, U. Towards an integrated
understanding of the structure and mechanics of the cell nucleus. BioEssays 30, 226–236 (2008).
3. Dahl, K. N., Ribeiro, A. J. S. & Lammerding, J. Nuclear shape, mechanics, and mechanotransduction. Circ. Res. 102, 1307–1318 (2008).
4. Buxboim, A., Ivanovska, I. L. & Discher, D. E. Matrix elasticity, cytoskeletal forces and physics of the nucleus: how deeply do cells ‘feel’ outside and in? J. Cell Sci. 123, 271–308 (2010).
5. Cao, Y. et al. Vascular endothelial growth factor C induces angiogenesis in vivo. Proc. Natl Acad. Sci. USA 95, 14389–14394 (1998).
6. Drake, C. J., LaRue, A., Ferrara, N. & Little, C. D. VEGF regulates cell behavior during vasculogenesis. Dev. Biol. 224, 18–188 (2000).
7. Moore, T. M., Chetham, P. M., Kelly, J. J. & Stevens, T. Signal transduction and regulation of lung endothelial cell permeability. Interaction between calcium and cAMP. Am. J. Physiol. Lung Cell. Mol. Physiol. 275, L203–L222 (1998).
8. Merks, R. M. H., Brodsky, S. V., Goligorsky, M. S., Newman, S. A. & Glazier, J. A. Cell elongation is key to in silico replication of in vitro vasculogenesis and subsequent remodeling. Dev. Biol. 289, 44–54 (2006).
9. Parsa, H., Upadhyay, R. & Sia, A. K. Uncovering the behaviors of individual cells within a multicellular microvascular community. Proc. Natl Acad. Sci. USA 108, 5133–5138 (2011).
10. Sims, J. R., Karp, S. & Ingber, D. E. Altering the cellular mechanical force balance results in integrated changes in cell, cytoskeletal and nuclear shape. J. Cell Sci. 103, 1215–1222 (1992).
(5)(5)
11. Ingber, D. E., Prusty, D., Sun, Z. Q., Betensky, H. & Wang, N. Cell shape, cytoskeletal mechanics, and cell cycle control in angiogenesis. J. Biomech. 28, 1471–1484 (1995).
12. Jean, R. P., Gray, D. S., Spector, A. A. & Chen, C. S. Characterization of the nuclear deformation caused by changes in endothelial cell shapes. J. Biomech. Eng. 126, 552–558 (2004).
13. Roca-Cusachs, P. et al. Micropatterning of single endothelial cell shape reveals a tight coupling between nuclear volume in G1 and proliferation. Biophys. J. 94, 4984–4995 (2008).
14. Thomas, C. H., Collier, J. H., Sfeir, C. S. & Healy, K. E. Engineering gene expression and protein synthesis by modulation of nuclear shape. Proc. Natl Acad. Sci. USA 99, 1972–1977 (2002).
15. Lanctot, C., Cheutin, T., Cremer, M., Cavalli, G. & Cremer, T. Dynamic genome architecture in the nuclear space: regulation of gene expression in three dimensions. Nat. Rev. Genet. 8, 104–115 (2007).
16. Misteli, T. Beyond the sequence: cellular organization of genome function. Cell 128, 787–800 (2007).
17. Maniotis, A. J., Chen, C. S. & Ingber, D. E. Demonstration of mechanical connections between integrins, cytoskeletal filaments, and nucleoplasm that stabilize nuclear structure. Proc. Natl Acad. Sci. USA 94, 849–854 (1997).
18. Khatau, S. B. et al. A perinuclear actin cap regulates nuclear shape. Proc. Natl Acad. Sci. USA 106, 19017–19022 (2009).
19. Luxton, G. W., Gomes, E. R., Folker, E. S., Vintinner, E. & Gundersen, G. G. Linear arrays of nuclear envelope proteins harness retrograde actin flow for nuclear movement. Science 329, 956–959 (2010).
20. Dupin, I., Sakamoto, Y. & Etienne-Manneville, S. Cytoplasmic intermediate filaments mediate actin-driven positioning of the nucleus. J. Cell Sci. 124, 865–872 (2011).
21. Starr, D. A. & Han, M. Role of ANC-1 in tethering nuclei to the actin cytoskeleton. Science 298, 406–409 (2002).
22. Lammerding, J. et al. Abnormal nuclear shape and impaired mechanotransduction in emerin-deficient cells. J. Cell Biol. 170, 781–791 (2005).
23. Hale, C. M. et al. Dysfunctional connections between the nucleus and the actin and microtubule networks in laminopathic models. Biophys. J. 95, 5462–5475 (2008).
24. Roux, K. J., Crisp, M. L. & Burke, B. Nesprin 4 is an outer nuclear membrane protein that can induce kinesin-mediated cell polarization. Proc. Natl Acad. Sci. USA 106, 2194–2199 (2009).
25. Bray, M. A. et al. Nuclear morphology and deformation in engineered cardiac myocytes and tissues. Biomaterials 31, 5143–5150 (2010).
26. Lee, J. S. H. et al. Nuclear lamin A/C deficiency induces defects in cell mechanics, polarization and migration. Biophys. J. 93, 2542–2552 (2007).
27. Stewart, C. L., Roux, K. J. & Burke, B. Blurring the boundary: the nuclear envelope extends its reach. Science 318, 1408–1412 (2007).
28. Balaban, N. Q. et al. Force and focal adhesion assembly: a close relationship studied using elastic micro-patterned substrates. Nat. Cell Biol. 3, 466–472 (2001).
29. Tan, J. L. et al. Cells lying on a bed of microneedles: an approach to isolate mechanical force. Proc. Natl Acad. Sci. USA 100, 1484–1489 (2003).
30. Singhvi, R. et al. Engineering cell shape and function. Science 264, 696–698 (1994).
31. Dudek, S. M. & Garcia, J. G. Cytoskeletal regulation of pulmonary vascular permeability. J. Appl. Physiol. 91, 1487–1500 (2001).
32. Liu, Z. et al. Mechanical tugging force regulates the size of cellĞcell junctions. Proc. Natl Acad. Sci. USA 107, 9944–9949 (2010).
33. Kaunas, R., Nguyen, P., Usami, S. & Chien, S. Cooperative effects of Rho and mechanical stretch on stress fiber organization. Proc. Natl Acad. Sci. USA 102, 15895–15900 (2005).
34. Parker, K. K. et al. Directional control of lamellipodia extension by constraining cell shape and orienting cell tractional forces. FASEB J. 16, 1195–204 (2002).
35. Schwarz, U. S. et al. Calculation of forces at focal adhesions from elastic substrate data: the effect of localized force and the need for regularization. Biophys. J. 83, 1380–1394 (2002).
36. Caille, N., Thoumine, O., Tardy, Y. & Meister, J.- J. Contribution of the nucleus to the mechanical properties of endothelial cells. J. Biomech. 35, 177–187 (2002).
37. Dahl, K. N., Kahn, S. M., Wilson, K. L. & Discher, D. E. The nuclear envelope lamina network has elasticity and a compressibility limit suggestive of a molecular shock absorber. J. Cell Sci. 117, 4779–4786 (2004).
38. Mascetti, G. et al. Effect of fixatives on calf thymocyte chromatin: 3D hight resolution fluorescence microscopy. Cytometry 23, 110–119 (1996).
39. Vergani, L., Grattarola, M. & Nicolini, C. Modifications of chromatin structure and gene expression following induced alterations of cellular shape. Int. J. Biochem. Cell Biol. 36, 1447–1461 (2004).
40. Pajerowski, J. D., Dahl, K. N., Zhong, F. L., Sammak, P. J. & Discher, D. E. Physical plasticity of the nucleus in stem cell differentiation. Proc. Natl Acad. Sci. USA 104, 15619–15624 (2007).

ARTICLE
��
nATuRE CommunICATIons | DoI: 10.1038/ncomms1668
nATuRE CommunICATIons | 3:671 | DoI: 10.1038/ncomms1668 | www.nature.com/naturecommunications
© 2012 Macmillan Publishers Limited. All rights reserved.
41. Deguchi, S., Maeda, K., Ohashi, T. & Sato, M. Flow-induced hardening of endothelial nucleus as an intracellular stress-bearing organelle. J. Biomech. 38, 1751–1759 (2005).
42. Rouquette, J. et al. Revealing the high-resolution three-dimensional network of chromatin and interchromatin space: a novel electron-microscopic approach to reconstructing nuclear architecture. Chromosome Res. 17, 801–810 (2009).
43. Feldherr, C. M. & Akin, D. The permeability of the nuclear envelope in dividing and nondividing cell cultures. J. Cell Biol. 111, 1–8 (1990).
44. Dahl, K. N., Engler, A., Pajerowski, J. D. & Discher, D. E. Power law rheology of isolated nuclei with deformation mapping of nuclear sub-structures. Biophys. J. 89, 2855–2864 (2005).
45. Vaziri, A. & Mofrad, M. R. K. Mechanics and deformation of the nucleus in micropipette aspiration experiment. J. Biomech. 40, 2053–2062 (2007).
46. Gabriele, S., Benoliel, A.- M., Bongrand, P. & Theodoly, O. Microfluidic investigation reveals distinct roles for actin cytoskeleton and myosin II activity in capillary leukocyte trafficking. Biophys. J. 96, 4308–4318 (2009).
47. Wong, P. K., Tan, W. & Ho, C.- M. Cell relaxation after electrodeformation: effect of latrunculin A on cytoskeletal actin. J. Biomech. 38, 529–535 (2005).
48. Howard, W. D. & Timasheff, S. Linkages between the effects of taxol, colchicine and GTP on tubulin polymerization. J. Biol. Chem. 263, 1342–1346 (1988).
49. Hay, M. & De Boni, U. Chromatin motion in neuronal interphase nuclei: changes induced by disruption of intermediate filaments. Cell Motil. Cytoskel. 18, 63–75 (1991).
50. Erikkson, J. E. et al. Specific in vivo phosphorylation sites determine the assembly dynamics of vimentin intermediate filaments. J. Cell Sci. 117, 919–32 (2004).
51. Straight, A. F. et al. Dissecting temporal and spatial control of cytokinesis with a myosin II inhibitor. Science 299, 1743–1747 (2003).
52. Abramoff, M. D., Magelhaes, P. J. & Ram, S. J. Image processing with ImageJ. Biophotonics Int. 11, 36–42 (2004).
53. Sibarita, J. B. Deconvolution microscopy. Adv. Biochem. Engin. Biotechnol. 95, 201–243 (2005).
54. Butler, J. P., Tolic-Norrelykke, I. M., Fabry, B. & Fredberg, J. J. Traction fields, moments, and strain energy that cells exert on their surroundings. Am. J. Physiol. Cell Physiol. 282, C595–C605 (2002).
55. Wang, N., Ostuni, E., Ingber, D. E. & Whitesides, G. M. Micropatterning cell traction in living cells. Cell Motil. Cytoskel. 52, 97–106 (2002).
56. Mascetti, G., Carrara, S. & Vergani, L. Relationship between chromatin condensation compactness and dye uptake for in situ chromatin stained with DAPI. Cytometry 44, 113–119 (2001).
57. Vergani, L., Mascetti, G. & Nicolini, C. Changes of nuclear structure induced by increasing temperatures. J. Biomol. Struct. Dynam. 18, 535–544 (2001).
AcknowledgementsWe thank Philippe Robert, Marc Dreyfus, Fabian Brau, Bernard Vandenbunder for fruitful discussions, and Pascal Damman for critical reading of the manuscript. We also thank Alexandra Belayew for providing cell culture support to carry out preliminary experiments, Kevin Kit Parker and Poling Kuo for their help with TFM experiments. This work was supported by the Belgian National Foundation for Scientific Research (FNRS) through ‘MIS Confocal Microscopy’ and ‘Crédit aux Chercheurs’ grants and the ‘Nanomotility FRFC 2.4622.11’ project. M.V. and T.G. doctoral fellowships are supported by the Foundation for Training in Industrial and Agricultural Research. Interfaces & Complex Fluids Laboratory is a member of the GDR 3070 CellTiss of the Centre National de la Recherche Scientifique (CNRS).
Author contributionsM.V. designed the microstamps, performed and analysed experiments; T.G. performed experiments; S.G. designed the study, supervised the project, analysed the data and wrote the manuscript. All authors commented on the manuscript.
Additional informationSupplementary Information accompanies this paper at http://www.nature.com/naturecommunications
Competing financial interests: The authors declare no competing financial interests.
Reprints and permission information is available online at http://npg.nature.com/reprintsandpermissions/
How to cite this article: Versaevel, M. et al. Spatial coordination between cell and nuclear shape within micropatterned endothelial cells. Nat. Commun. 3:671 doi: 10.1038/ncomms1668 (2012).