Spatial Bistability Generates hunchback Expression Sharpness in the Drosophila Embryo
14
Spatial Bistability Generates hunchback Expression Sharpness in the Drosophila Embryo Francisco J. P. Lopes 1,2,3 *, Fernando M. C. Vieira 3,4 , David M. Holloway 5,6,7 , Paulo M. Bisch 3 , Alexander V. Spirov 1,2 1 Department of Applied Mathematics, Stony Brook University, Stony Brook, New York, United States of America, 2 Center for Developmental Genetics, Stony Brook University, Stony Brook, New York, United States of America, 3 Instituto de Biofisica, Universidade Federal do Rio de Janeiro, Rio de Janeiro, Brazil, 4 Instituto de Quimica, Universidade de Brasilia, Brasilia, Brazil, 5 Mathematics Department, British Columbia Institute of Technology, Burnaby, British Columbia, Canada, 6 Chemistry Department, University of British Columbia, Vancouver, British Columbia, Canada, 7 Biology Department, University of Victoria, Victoria, British Columbia, Canada Abstract During embryonic development, the positional information provided by concentration gradients of maternal factors directs pattern formation by providing spatially dependent cues for gene expression. In the fruit fly, Drosophila melanogaster,a classic example of this is the sharp on–off activation of the hunchback (hb) gene at midembryo, in response to local concentrations of the smooth anterior–posterior Bicoid (Bcd) gradient. The regulatory region for hb contains multiple binding sites for the Bcd protein as well as multiple binding sites for the Hb protein. Some previous studies have suggested that Bcd is sufficient for properly sharpened Hb expression, yet other evidence suggests a need for additional regulation. We experimentally quantified the dynamics of hb gene expression in flies that were wild-type, were mutant for hb self- regulation or Bcd binding, or contained an artificial promoter construct consisting of six Bcd and two Hb sites. In addition to these experiments, we developed a reaction–diffusion model of hb transcription, with Bcd cooperative binding and hb self- regulation, and used Zero Eigenvalue Analysis to look for multiple stationary states in the reaction network. Our model reproduces the hb developmental dynamics and correctly predicts the mutant patterns. Analysis of our model indicates that the Hb sharpness can be produced by spatial bistability, in which hb self-regulation produces two stable levels of expression. In the absence of self-regulation, the bistable behavior vanishes and Hb sharpness is disrupted. Bcd cooperative binding affects the position where bistability occurs but is not itself sufficient for a sharp Hb pattern. Our results show that the control of Hb sharpness and positioning, by hb self-regulation and Bcd cooperativity, respectively, are separate processes that can be altered independently. Our model, which matches the changes in Hb position and sharpness observed in different experiments, provides a theoretical framework for understanding the data and in particular indicates that spatial bistability can play a central role in threshold-dependent reading mechanisms of positional information. Citation: Lopes FJP, Vieira FMC, Holloway DM, Bisch PM, Spirov AV (2008) Spatial Bistability Generates hunchback Expression Sharpness in the Drosophila Embryo. PLoS Comput Biol 4(9): e1000184. doi:10.1371/journal.pcbi.1000184 Editor: Uwe Ohler, Duke University, United States of America Received October 16, 2007; Accepted August 13, 2008; Published September 26, 2008 Copyright: ß 2008 Lopes et al. This is an open-access article distributed under the terms of the Creative Commons Attribution License, which permits unrestricted use, distribution, and reproduction in any medium, provided the original author and source are credited. Funding: FJPL was supported by the Brazilian National Research Council (CNPq)/Ministry of Science and Technology (MCT, Brazil), the joint National Science Foundation (NSF)/National Institute of General Medical Sciences (NIGMS) BioMath program, grant 1-R01-GM072022, and National Institutes of Health grant 2-ROI- RR07801. FMCV and PMB were supported by the CNPq/MCT, Brazil. DMH and AVS were supported by the joint NSF/NIGMS BioMath program, grant 1-R01- GM072022. Competing Interests: The authors have declared that no competing interests exist. * E-mail: [email protected] Introduction How an embryo achieves pattern and form from an initially undifferentiated state has fascinated people at least since the time of Aristotle. Scientific advances on this began over a century ago, with, for example, the experiments of Hans Driesch on sea urchin embryos [1], from which he proposed that the embryo has a coordinate system specifying cellular position; and from the experiments of Ethel Browne [2], who showed that a piece of hydra mount induced a secondary axis when grafted into the body of another hydra. These and other subsequent results were synthesized by Lewis Wolpert in 1969 [3] into a definition of positional information. According to this concept, the spatial asymmetries of concentration gradients of chemical signals (morphogens) provide positional information during cellular differentiation; each cell (or nucleus) reads its position from the local morphogen concentration and differentiates accordingly. Wolpert’s concept of morphogen gradients has become a central tenet of developmental biology [4–6]. Modern molecular tech- niques have demonstrated numerous cases of protein concentra- tion patterns in embryogenesis, and many have been shown to act as morphogens. In the late 1980’s, the Bicoid (Bcd) protein gradient was characterized and its concentration-dependent effect on downstream target genes in Drosophila was demonstrated [7–9]. This has since become one of the most studied examples of morphogen gradient signaling in developmental biology [10,11]. Reaction-network models have been successfully applied to describe a great variety of systems in physics, chemistry, and biology [12–14]. Along with this, many mathematical tools have been developed to support such applications. With these tools, one can show that certain reaction networks may exhibit multiple stationary states, for particular ranges of their rate constants. Bistability is a special case, in which the system can evolve to either of two asymptotically stable steady states (concentration levels). PLoS Computational Biology | www.ploscompbiol.org 1 September 2008 | Volume 4 | Issue 9 | e1000184
Transcript of Spatial Bistability Generates hunchback Expression Sharpness in the Drosophila Embryo

Spatial Bistability Generates hunchback ExpressionSharpness in the Drosophila EmbryoFrancisco J. P. Lopes1,2,3*, Fernando M. C. Vieira3,4, David M. Holloway5,6,7, Paulo M. Bisch3, Alexander V.
Spirov1,2
1 Department of Applied Mathematics, Stony Brook University, Stony Brook, New York, United States of America, 2 Center for Developmental Genetics, Stony Brook
University, Stony Brook, New York, United States of America, 3 Instituto de Biofisica, Universidade Federal do Rio de Janeiro, Rio de Janeiro, Brazil, 4 Instituto de Quimica,
Universidade de Brasilia, Brasilia, Brazil, 5 Mathematics Department, British Columbia Institute of Technology, Burnaby, British Columbia, Canada, 6 Chemistry Department,
University of British Columbia, Vancouver, British Columbia, Canada, 7 Biology Department, University of Victoria, Victoria, British Columbia, Canada
Abstract
During embryonic development, the positional information provided by concentration gradients of maternal factors directspattern formation by providing spatially dependent cues for gene expression. In the fruit fly, Drosophila melanogaster, aclassic example of this is the sharp on–off activation of the hunchback (hb) gene at midembryo, in response to localconcentrations of the smooth anterior–posterior Bicoid (Bcd) gradient. The regulatory region for hb contains multiplebinding sites for the Bcd protein as well as multiple binding sites for the Hb protein. Some previous studies have suggestedthat Bcd is sufficient for properly sharpened Hb expression, yet other evidence suggests a need for additional regulation. Weexperimentally quantified the dynamics of hb gene expression in flies that were wild-type, were mutant for hb self-regulation or Bcd binding, or contained an artificial promoter construct consisting of six Bcd and two Hb sites. In addition tothese experiments, we developed a reaction–diffusion model of hb transcription, with Bcd cooperative binding and hb self-regulation, and used Zero Eigenvalue Analysis to look for multiple stationary states in the reaction network. Our modelreproduces the hb developmental dynamics and correctly predicts the mutant patterns. Analysis of our model indicates thatthe Hb sharpness can be produced by spatial bistability, in which hb self-regulation produces two stable levels ofexpression. In the absence of self-regulation, the bistable behavior vanishes and Hb sharpness is disrupted. Bcd cooperativebinding affects the position where bistability occurs but is not itself sufficient for a sharp Hb pattern. Our results show thatthe control of Hb sharpness and positioning, by hb self-regulation and Bcd cooperativity, respectively, are separateprocesses that can be altered independently. Our model, which matches the changes in Hb position and sharpnessobserved in different experiments, provides a theoretical framework for understanding the data and in particular indicatesthat spatial bistability can play a central role in threshold-dependent reading mechanisms of positional information.
Citation: Lopes FJP, Vieira FMC, Holloway DM, Bisch PM, Spirov AV (2008) Spatial Bistability Generates hunchback Expression Sharpness in the DrosophilaEmbryo. PLoS Comput Biol 4(9): e1000184. doi:10.1371/journal.pcbi.1000184
Editor: Uwe Ohler, Duke University, United States of America
Received October 16, 2007; Accepted August 13, 2008; Published September 26, 2008
Copyright: � 2008 Lopes et al. This is an open-access article distributed under the terms of the Creative Commons Attribution License, which permitsunrestricted use, distribution, and reproduction in any medium, provided the original author and source are credited.
Funding: FJPL was supported by the Brazilian National Research Council (CNPq)/Ministry of Science and Technology (MCT, Brazil), the joint National ScienceFoundation (NSF)/National Institute of General Medical Sciences (NIGMS) BioMath program, grant 1-R01-GM072022, and National Institutes of Health grant 2-ROI-RR07801. FMCV and PMB were supported by the CNPq/MCT, Brazil. DMH and AVS were supported by the joint NSF/NIGMS BioMath program, grant 1-R01-GM072022.
Competing Interests: The authors have declared that no competing interests exist.
* E-mail: [email protected]
Introduction
How an embryo achieves pattern and form from an initially
undifferentiated state has fascinated people at least since the time
of Aristotle. Scientific advances on this began over a century ago,
with, for example, the experiments of Hans Driesch on sea urchin
embryos [1], from which he proposed that the embryo has a
coordinate system specifying cellular position; and from the
experiments of Ethel Browne [2], who showed that a piece of
hydra mount induced a secondary axis when grafted into the body
of another hydra. These and other subsequent results were
synthesized by Lewis Wolpert in 1969 [3] into a definition of
positional information. According to this concept, the spatial
asymmetries of concentration gradients of chemical signals
(morphogens) provide positional information during cellular
differentiation; each cell (or nucleus) reads its position from the
local morphogen concentration and differentiates accordingly.
Wolpert’s concept of morphogen gradients has become a central
tenet of developmental biology [4–6]. Modern molecular tech-
niques have demonstrated numerous cases of protein concentra-
tion patterns in embryogenesis, and many have been shown to act
as morphogens. In the late 1980’s, the Bicoid (Bcd) protein
gradient was characterized and its concentration-dependent effect
on downstream target genes in Drosophila was demonstrated [7–9].
This has since become one of the most studied examples of
morphogen gradient signaling in developmental biology [10,11].
Reaction-network models have been successfully applied to
describe a great variety of systems in physics, chemistry, and
biology [12–14]. Along with this, many mathematical tools have
been developed to support such applications. With these tools, one
can show that certain reaction networks may exhibit multiple
stationary states, for particular ranges of their rate constants.
Bistability is a special case, in which the system can evolve to either
of two asymptotically stable steady states (concentration levels).
PLoS Computational Biology | www.ploscompbiol.org 1 September 2008 | Volume 4 | Issue 9 | e1000184

Under certain conditions, spatial patterning or oscillations can
arise [15–17]. In biology, bistability has long been established in
control of the cell cycle and other oscillations [18,19], and also
recently reported in an artificial gene regulation network [20]. In
Drosophila, spatial bistability has been proposed for dorso-ventral
patterning [21,22].
In early embryogenesis, the diffusion of Bcd protein, translated
from mRNA localized at the anterior end of the egg, forms an
exponential concentration gradient, establishing the anterior–
posterior (AP) axis (Figure 1A and 1C) [8,23,24]. Bcd is a
transcriptional regulator, and through its asymmetric distribution
acts as a morphogen, governing the positions at which the
downstream gap genes will be activated. In combination with
cross-regulation between these genes, the initial Bcd asymmetry is
propagated and refined, establishing the first stage of embryo
segmentation [9,25–32]. It is still not well characterized, however,
what mechanisms interpret the smooth Bcd positional information
into sharp and precisely positioned downstream target gene
expression.
hunchback (hb) is one of the first gap genes activated by Bcd, with
strong anterior expression and a sharp on–off boundary at mid-
embryo (Figure 1B and 1C) [9,33–35]. Anterior hb activation
depends on Bcd, as shown by Struhl et al [9] and Driever et al
[34], and on its own self-regulation, as already reported by
Treisman et al [35] and Margolis et al [36]; many Bcd and Hb
binding sites have been identified in the hb promoter region, as
reported by Treisman et al., among others [35–37]. Hb has
maternal (hbmat) and zygotic contributions, and provides positional
information for other gap genes, such as Kruppel (Kr), knirps (kni),
and giant (gt), and for the homeotic gene Ultrabithorax (Ubx) [38–41].
Removal of both maternal and zygotic hb expression results in
severe deletions and polarity reversals of the most anterior
segments [42]. In normal development, Hb expression drops from
highest to lowest over about 10% egg length (Figure 1B and 1C);
Considerable attention has been focused on what molecular
mechanism generates this Hb sharpness. Early on, it was shown
that a hb enhancer element of 300 base pairs (bp), containing 6 Bcd
binding sites, is sufficient to reproduce the regulatory activity of
Bcd on hb [9,34]. It was shown that Bcd binds to these sites
cooperatively and it was hypothesized that, due to this coopera-
tivity, a small change in Bcd concentration across some threshold
could produce a large change in hb promoter occupancy,
generating the on–off expression pattern [9,34,43–46]. However,
these studies did not establish that cooperativity is sufficient to
generate Hb border sharpness.
To quantify the degree of Bcd’s cooperativity, Ma et al. [44]
used a six-Bcd site fragment of the hb promoter in a DNase I
footprint assay, and found a Hill coefficient of about 3.6; Burz et
al. [47], using a gel-shift assay with a 230 bp hb enhancer, found a
Hill coefficient of 3.0. From quantified in vivo patterns of Bcd and
Hb proteins, Gregor et al. [48], estimated a higher value for this
coefficient, of around 5 (though the effects of hb self-regulation
were neglected, addressed further in the Discussion); and suggested
that it could support the proposal of Crauk and Dostatni [49] that
Hb expression is entirely determined by Bcd cooperative binding.
However, systems with such high Hill coefficients would be
expected to show temperature sensitivity. Houchmandzadeh et al.
[50] showed that the Bcd gradient is strongly affected by
temperature changes of 20uC, but that the Hb pattern is largely
unaffected. Dependence on Bcd with Hill coefficients between 3
and 5 would be expected to show far greater effects on Hb than
are observed, indicating that Bcd cannot be the only factor
regulating the Hb border. The insufficiency of Bcd cooperativity to
produce Hb sharpness is also supported by the findings of
Simpson-Brose et al. [51], who showed that synergy between Hb
and Bcd is necessary to establish the expression patterns of the gap
genes, including hb itself.
To address these issues, we have taken a combined experimen-
tal and theoretical approach to understand how the hb gene
converts the positional information of the smooth Bcd gradient
into a sharp expression pattern. We used wild-type (WT) embryos
to experimentally determine how Hb position and sharpness
change in time; and we measured how these quantities are affected
in embryos mutant for Bcd cooperative binding and for hb self-
regulation, and by use of an artificial promoter with 6 Bcd and 2
Hb binding sites. We also developed a predictive reaction–
diffusion model of hb transcription, incorporating both Bcd
cooperative binding and hb self-regulation. By fitting this model
to wild-type Bcd and Hb patterns, we determined kinetic
parameters of the model, such as binding constants. With these
parameters, our model successfully reproduces the dynamic
development of the Hb pattern. By reducing Bcd binding
constants or the number of Bcd binding sites, our model
reproduces the same mutant phenotypes as our experiments,
and predicts a loss of sharpness for a hb self-regulation mutant,
which we experimentally verified. By applying dynamical systems
theory to the model, we show that Hb sharpness is due to spatial
bistability stemming from hb self-regulation. This means that Hb
does not have a single steady-state concentration continuously
dependent on Bcd, but that at a threshold Bcd concentration, two
stable steady states become available to Hb, and a small change in
Bcd concentration can create a dramatic shift in Hb concentra-
tion. This shift between steady states is responsible for the
sharpness of the Hb boundary. The position of the Bcd threshold
is controlled by Bcd cooperative binding, but this mechanism itself
is not sufficient to generate hb’s expression sharpness.
Results
Mutant Genotypes That Affect Hb Sharpening andPositioning
In order to investigate the relative contributions of self-
regulation and Bcd cooperativity to Hb sharpness and position,
Author Summary
Pattern formation during embryonic development, ormorphogenesis, is one of the most intriguing problemsin biology, entailing the sequence of processes by which arelatively simple system, the fertilized egg, becomes amature organism. In these processes, the genetic informa-tion, stored at the molecular scale in the DNA, is translatedinto the macroscopic spatial expression patterns thatprecede the tissue–organ scale of body organization. It canalso be understood as a flux of information from thegenetic to the organ–system level. In the fruit flyDrosophila melanogaster, one of the early processes duringits embryonic development is the formation of the sharpHunchback protein pattern. To generate this pattern, thehunchback gene interprets the position-dependent infor-mation in the shallow maternal Bicoid gradient andconverts it into the sharp Hunchback protein pattern. Wepropose that bistability in the dynamics of hunchback generegulation can account for this information readingprocess, and we show that this bistable mechanism canbe produced by the ability of this gene to regulate its ownexpression. The solution of this problem offers newapproaches to understand the phenomenon of morpho-genesis.
Spatial Bistability in Drosophila
PLoS Computational Biology | www.ploscompbiol.org 2 September 2008 | Volume 4 | Issue 9 | e1000184

we performed immunohistochemistry assays in wild-type and
mutant embryos in nuclear cleavage cycle 14A (Figure 1 and
Figure S1; see also Materials and Methods). We used systematic
image processing approaches to extract gene expression patterns
from confocal microscopy images, to determine embryo ages and
to quantify pattern position and sharpness.
The effect of loss of hb self-regulation can be directly studied
with the loss of function hb14F allele [52], which codes for a mutant
protein having no DNA-binding capacity (i.e., no self-regulation).
We scanned 39 embryos expressing this allele and found that
embryos homozygous for the hb14F allele (Figure 1D) have a strong
decrease in sharpness (21.8% reduction, from 80.2u in WT to
62.8u), and small shift in position (9.3% decrease, from 47.0% EL
in WT to 42.6% EL; Table 1 summarizes sharpness and position
for all experiments). The hb14F homozygotes were easily identified
by low signal intensities [53] (see Figure S2 for non-normalized
profiles). Heterozygote (hb14F/+) and WT embryos were not easily
distinguished, and are shown together in Figure 1E. The means for
this group show little or no change from WT: sharpness shows a
1.3% change (from 80.2u to 81.3u), and position shows a small
shift, from 47.0% EL to 44.3% EL (5.7% change; Figure 1E). In
order to compare Hb patterns between different assays, in which
absolute intensity varies, all experimental and theoretical profiles
in Figure 1 are normalized. With this, our measure of sharpness is
determined by the AP projection of the profile (see Figure S3); this
is covered in more detail in the Discussion. Note that all hb14F
homozygote embryos display lower sharpness than any WT
embryo older than 8 minutes in cycle 14 (the timing of sharpness
maturation is discussed further in Figure 2 and in the Discussion).
Despite Bcd’s role in AP positioning during early Drosophila
development, bcd heterozygotes (bcdE1/+) are highly viable
embryos, in which, for example, among 593 embryos only 4%
Figure 1. Control of Hb sharpness and position. (A,B) An embryo in mid-nuclear cleavage cycle 14A, with immunostaining to Bicoid (Bcd) (A)and Hunchback (Hb) (B) proteins. Anterior pole on left, dorsal side on top. (C) Fluorescence profiles versus anteroposterior position for A (green) andB (blue). Hb position, 47.1% EL; sharpness, 82.7u. (D) Hb profiles for homozygotes of hb14F, an allele coding a non-DNA binding Hb protein [52],showing dramatically reduced sharpness (63.9u). Heavy blue line: hunchback self-regulatory (HSR) model (Figure 3) prediction for absence of self-regulation. (E) hb14F heterozygotes and wild-type together, showing similar position (44.3% EL) and sharpness (81.3u). See Figure S2 for non-normalized data. (F) Hb profiles from bcdE1/+ embryos (Bcd mRNA half-dosage). Heavy blue line: simulation for this background, by reducing Bcdsynthesis in the HSR model. (G,H) Hb profiles from embryos expressing one copy of bcdK57R, an allele affecting Bcd cooperativity [54], gives twooutcomes: a small anterior shift ((G); 3.0% change from bcdE1/+); and a strong anterior shift ((H); 36.7% change from bcdE1/+). Heavy blue lines: HSRmodel simulations for weakly and strongly reduced Bcd cooperative binding ((G) and (H), respectively). Maximum intensities are normalized to one, toallow comparison of profile sharpness from different experiments. All embryos are between 26 and 39 minutes into nuclear cleavage cycle 14A, asdetermined by membrane invagination and the relative position from surface to cortex (see Materials and Methods). In (D) there are two T7 embryos,showing normal posterior pattern (not used for sharpness or position measurements). Individual embryo images are shown in Figure S1.doi:10.1371/journal.pcbi.1000184.g001
Spatial Bistability in Drosophila
PLoS Computational Biology | www.ploscompbiol.org 3 September 2008 | Volume 4 | Issue 9 | e1000184

were unhatched, and no larval head defects were found [46]. In
these mutants, we found that Hb was shifted anteriorly (16.6%
change, from 47.0% EL in WT to 39.2% EL), as previously
reported [8,50], but sharpness was not affected (0.5% change;
from 80.2u in WT to 80.6u; Figure 1F).
Mutant bcd genes encoding proteins specifically defective in
cooperative DNA binding have been isolated by Hanes and
collaborators [46,54], using a genetic screen in yeast. It was shown
that these mutations do not disrupt the DNA recognition or
transcriptional activity of Bcd. We used one of these mutants,
bcdK57R, to analyze the effect of Bcd cooperative binding on Hb
sharpness and position. In embryos with one dosage of the bcdK57R
allele (in a null Bcd background), incomplete penetrance gives two
outcomes: embryos with a weak response to the Bcd defect
(Figure 1G; showing a small anterior shift compared to bcdE1/+,
from 39.2% EL to 37.6% EL); and embryos with a strong
response, which have a large anterior shift compared to bcdE1/+(Figure 1H; from 39.2% EL to 24.8% EL). In both cases,
sharpness is not reduced (0.5% and 2.5% change from WT, for
weak and strong mutants, respectively).
Driever et al. [43] used a series of lacZ constructs to describe the
effect of high and low affinity binding sites for the establishment of
the localized zygotic expression domains. These constructs have a
lacZ coding sequence attached to different fragments of the hb
promoter sequence. To make flies carrying these constructs, they
are introduced into the fly genome, but the WT background is
maintained. In one of these constructs, pThb5, the promoter is a
portion of the native sequence, having 6 Bcd and 2 Hb binding
sites (see Figure S4). These constructs do not show self-regulation,
since the protein encoded by them (b-galactosidase) has no
transcriptional activity. pThb5 expression has significantly reduced
sharpness (from 80.2u in WT to 72.7u, Table 1; see Figure S5 and
Figure S6 for lacZ expression patterns) and a slight anterior shift in
position (from 47.0% in WT to 45.7% EL). In addition, we found
that pThb5 expression is sharper than hb14F (72.7u vs. 63.9u),
indicating that Hb protein, normally expressed in these flies, can
increase the sharpness of pThb5 expression (This effect of the Hb
WT expression was predicted by our model, as shown below.)
A Reaction–Diffusion Network Model Reproduces theDynamics of Hb Pattern Formation
To investigate what causes the changes in positioning and
sharpness shown in Figure 1 and Table 1, we developed a
predictive reaction–diffusion model. This hunchback self-regulatory
(HSR) model captures both Bcd cooperative binding and hb self-
regulation, with six Bcd sites and two Hb sites driving hb
expression. This model readily reproduced the phenotypes of the
WT and mutant experiments, allowing us to make predictions and
gain new understanding of the molecular mechanisms producing
the measured macroscopic patterns. The model reactions are
summarized in Figure 3. hb expression requires two steps: Bcd and
Hb protein binding to hb promoter (reversible reactions (2n, n = 1,
…, 6) and (14, 16), respectively); and Hb protein synthesis
(irreversible reactions (1+2n, n = 1, …, 8)). Reaction (1) represents
Bcd production; reactions (18) and (19) represent Bcd and Hb
degradation, respectively.
We used Fick’s Law to describe Bcd and Hb diffusion, and the
Law of Mass Action [55] for the reactions in Figure 3, to derive a
system of coupled partial differential equations (PDE’s; see Text
S1) for the species B, H, b0–b6, h0–h2 (only species B and H are
allowed to diffuse). The dynamics of the system are completely
described by initial conditions, diffusion coefficients and the kinetic
constants, found by fitting model output to experimentally
measured expression patterns.
We used a finite difference method to solve the model PDE’s
(see Text S1) and a steepest descent method to determine the k
parameters, by fitting the total Bcd ([B]T) and Hb ([H]T)
concentrations (Text S1, Equations S1 and S2) to the respective
patterns of an embryo in mid-nuclear cleavage cycle 14 (about
Table 1. Mean positions and sharpness (inclination) for all embryos and simulations presented.
Embryos Background/SimulationMean Position (%EL)
Position Std.Dev.
Mean Inclination(degrees)
Inclination Std.Dev.
WT Hb pattern used for fitting 47.1 NA 82.7 NA
HSR Model (6B2H) Fit to WT 48.0 NA 84.3 NA
WT hb 47.0 1.5 80.2 1.7
hb14F heterozygotes and WT 44.3 1.8 81.3 1.3
hb14F homozygotes 41.9 3.3 63.9 3.9
HSR model (6B0H) for hb14F homozygotes 49.0 NA 68.3 NA
bcd heterozygous, bcdE1/+ 39.2 0.2 80.6 1.3
HSR (6B2H) model for bcd heterozygotes. 40.1 NA 83.4 NA
bcdK57R weak 37.6 2.3 80.6 1.3
HSR model (6B2H) for bcdK57R weak 38.0 NA 83.8 NA
bcdK57R strong 24.8 2.9 82.2 1.2
HSR model (6B2H) for bcdK57R strong 24.4 NA 84.3 NA
pThb5 lacZ (FISH) 45.7 1.8 72.7 0.9
pThb5 lacZ (in situ hybridization) 47.3 2.8 74.9 2.4
HSR model for pThb5 (6B2H_lacZ) 48.0 NA 74.9 NA
WT hb RNA (simultaneous FISH Immunofluorescence) 45.0 1.0 84.2 1.4
WT Hb protein (simultaneous FISH Immunofluorescence) 45.4 1.0 82.5 1.1
All embryos are between 26 and 39 minutes into nuclear cleavage cycle 14A. NA means not applicable.doi:10.1371/journal.pcbi.1000184.t001
Spatial Bistability in Drosophila
PLoS Computational Biology | www.ploscompbiol.org 4 September 2008 | Volume 4 | Issue 9 | e1000184

36.4 minutes into the cycle, Figure 2A; see Materials and Methods
for age determination method). The Bcd gradient was fit first, by
using a zero initial concentration and fitting the model to Bcd
experimental data (Figure 2A) without the Hb reactions (Figure 3,
reactions 3, 5, 7, 9, 11, and 13–18), and with Bcd production
(Figure 3, reaction 1) only at 9% EL (the position of maximum Bcd
Figure 3. The hunchback (hb) self-regulatory (HSR) model to simulate hb transcriptional activation by Bicoid (Bcd) and self-regulation. (1): Bcd (B) synthesis from a source term; (2n, n = 1, …, 6): Bcd binding to hb promoter; (14, 16): Hb (H) binding to hb promoter; (1+2n,n = 1, …, 6) and (15, 17): Hb synthesis; (18 and 19): Hb and Bcd decay, respectively. bn and hn represent the fragments of hb promoters containing 6Bcd and 2 Hb sites, respectively; subscripts n indicate how many Bcd or Hb molecules are bound. 0 denotes either inert or constant concentrationspecies (e.g. mRNA). kb0,b1 indicates the transition from b0 to b1 states; kb1,H indicates production of H from b1, and so on. We introducedcooperativity by taking kb(n-1),bn = factorn.kb0,b1 and kbn,b(n-1) = kb1,b0 for n = 2, …, 6. In addition, we set kbn,H = (1+Synt_Factor).kb(n-1),H for n = 2, …, 6 toaccount for the effect of multiple protein binding to the gene promoter. These relations strongly reduced the number of parameters, and the modelfitting was not sensitive to changes in them.doi:10.1371/journal.pcbi.1000184.g003
Figure 2. Dynamics of Hunchback (Hb) pattern formation. (A) Fitting the hunchback self-regulatory (HSR) model (Figure 3) to the sameprofiles as in Figure 1C. Red and black lines: experimental Bicoid (Bcd) and Hb, respectively. Blue and green lines: fitting for total Bcd and Hbconcentrations (Equations S1.1–2, in Text S1), respectively. (B) 47 Hb wild-type profiles at different ages (red lines). Black line is the oldest one (sameas in (A)). Blue lines: Dynamic simulation of HSR model, using kinetic constants determined in (A). Green line is the same as in (A). (C) pattern positionschange slightly over time. Red dots and blue line: Hb boundary positions measured from embryos and from simulation in (B), respectively. (D) Thepattern quickly achieves mature sharpness, with little change after 10 minutes. Red dots: border inclination (from embryos in (B)) versus embryo age.Blue line: Model prediction for the progressive increase of border inclination, for the simulations in (B). Black arrows indicate the embryo used to fitthe model (shown in (A)). See Figure S7 for a direct comparison between data and model time evolution profiles.doi:10.1371/journal.pcbi.1000184.g002
Spatial Bistability in Drosophila
PLoS Computational Biology | www.ploscompbiol.org 5 September 2008 | Volume 4 | Issue 9 | e1000184

level in the data). The Hb reactions were then taken into account,
and the model fit to the Hb experimental data (Figure 2A). With
the k’s determined (Table S1), we simulated the dynamics of the
HSR model (Figure 2B), using zero initial Hb concentration
(embryos lacking maternal Hb develop normally [42]; also, final
concentrations are largely unaffected by low initial [HT]—see
Discussion). The HSR model qualitatively reproduced the time
development of the Hb pattern (Figure 2B, 59 embryos of different
ages), even though it was fit to only one pair of Bcd-Hb patterns
(Figure 2A; see Figure S7 for a direct comparison between data
and model time evolution profiles). The match was best with
respect to sharpness increase (Figure 2D); for position, the model
shifted more than observed (Figure 2C; see also Figure S7A and
S7B), possibly reflecting the simplified aspect of the model, like the
number of Hb or Bcd sites. Figure 2 indicates that developmental
age, after the transient behavior in the first 10 minutes of cycle 14,
is not a significant factor in sharpness or position.
Spatial Bistability, Produced by hb Self-Regulation, isResponsible for the Sharp Hb Border
Once we established that the HSR model accounts for wild-type
expression, we could analyze its dynamics to determine what is
responsible for converting the smooth Bcd spatial distribution into
the sharp Hb pattern. We chose Zero Eigenvalue Analysis [56–59]
as a technique for searching parameter values that produce
bistability in our model. This method establishes a set of
restrictions (the sign compatible relations, see Text S2) which
must be met in order for bistability to occur. Using this technique
on a simplified HSR model [60], with reduced number of Bcd
binding sites (reactions 4 to 13 removed, Figure 3) and normal Hb
binding, we demonstrated that the model does have bistable
solutions (see Text S2). Although this analysis was performed for a
well-mixed system, where concentrations are assumed to be
uniform, the bistable behavior is also found in numerical solutions
of the full model, where spatial distributions of concentrations are
considered. The bifurcation diagram (Figure 4A), plotting [H]T
steady-state solutions for various k0,B and [B]T, shows that for Bcd
concentrations within the bistable region (green line), Hb
concentration has two stable solutions (blue lines), separated by
an unstable solution (red line). This bistability causes a very large
change in Hb concentration (DHb, from one stable branch to the
other) over a small change in Bcd concentration (DBcd) as it passes
through a threshold (at the anterior boundary of the bistable
region). In the Drosophila embryo, the Bcd gradient provides
different concentrations along the anterior–posterior axis, which
work like different initial conditions in the well-mixed system. It
creates a sharp Hb border (Figure 1C) at the position where Bcd
crosses this threshold. Comparison between hb RNA and protein
profiles shows that RNA patterns are sharper than protein ones
(84.2u and 82.5u mean sharpness, respectively; Figure S8 and
Table 1). These findings combine with our results above, to
indicate that Hb sharpness results from spatially bistable dynamics,
which is due to hb self-regulation. In the HSR model, if the hb self-
regulation reactions (Figure 3, reactions 14–17) are removed, the
network loses bistability and has only a single steady state
(Figure 4B), in which Hb varies smoothly with Bcd.
With Hb bistability characterized in the model, we can proceed
to simulating the macroscopic behaviors (i.e., expression pheno-
types) shown in Figure 1, by altering binding strengths and site
numbers, to reproduce the corresponding mutant genotype. For
example, to model hb expression in the bcdE1/+ heterozygotes we
reduced the Bcd source term (k0,B) to 66.6% of original (see Table
S2), finding anteriorly shifted Hb pattern (16.5% change from WT
simulation) without disrupting sharpness (1.0% change from WT),
in agreement with data (Figure 1F, heavy blue curve; Table 1). Hb
sharpness was maintained because reduction of Bcd production by
this amount does not change the model’s bistable phase portrait,
Figure 4A, but does shift the position of the Bcd threshold
anteriorly. To simulate loss of self-regulation, we removed
reactions 14–17 (Figure 3) from the full model (6B2H, for 6 Bcd
and 2 Hb sites), to give 6B0H sites. The model predicts a loss of
sharpness (19.0% change from WT; from 84.3u to 68.3u;Figure 1D, heavy blue curve, Table 1) in qualitative agreement
with hb14F homozygote experimental data (which showed a 20.3%
change from WT). The bifurcation diagram for 6B0H sites
(Figure 4B) shows that this loss of Hb sharpness is due to loss of
bistability, since Hb concentration becomes a smoothly decreasing
function of Bcd concentration.
The pThb5 construct contains an estimated six active Bcd sites
and two Hb sites (Figure S4), but it does not exhibit self-regulation
because the protein coded by it has no transcriptional activity. To
reproduce the lacZ expression of pThb5 we derived an extra set of
reactions by replacing H with L (LacZ) in reactions (1+2n, n = 1,
…, 8; and 18), and added these reactions to the full model; with
this model (6B2H_lacZ) we have no self-activation for lacZ, but we
still take into account both Hb sites in the lacZ promoter. We
found no shift in position, but did find an 11.1% loss of sharpness
from the WT simulation (Table 1, Figure S3), in agreement with
the experimental loss of sharpness from WT to lacZ (9.3%). This
indicates that the loss of sharpness for pThb5 is caused by the lack
of self-regulation. The lacZ experimental patterns are sharper than
hb14F (72.7u and 63.9u, respectively), probably due to the Hb sites
in the construct promoter region. Our model predicts this effect,
with sharpness for 6B2H_lacZ (74.9u) higher than sharpness for
6B0H (68.3u).
Bcd Controls Hb Position, not SharpnessThe loss of sharpness for hb14F homozygotes, Figure 1D and
Table 1, demonstrates that cooperative Bcd binding is not
sufficient to generate the sharp Hb border, since Bcd cooperativity
is not affected in this hb allele. Bcd cooperative binding does play
an important role in Hb pattern positioning, however, as
demonstrated by the bcdK57R results (Figure 1G and 1H; Table 1;
see also [43]), in which pattern position is altered without affecting
sharpness. We simulated the reduced cooperativity in bcdK57R
embryos [54] by reducing the Bcd binding constants in reactions
(2n, n = 1, …, 6) by dropping factor to 67% and 95% of original, to
simulate the strong and weak mutants, respectively (Figure 3
caption, Table S2). Figure 4C shows that this reduction in
cooperativity shifts the bistable region towards regions of high Bcd
concentration (Figure 4C, red and black lines), anteriorly shifting
the pattern without disrupting its sharpness, in agreement with the
data (Figure 1G, heavy blue line; Figure 1H, heavy blue line;
Table 1). These results show that Bcd cooperative binding controls
the position at which the Hb bistable switch occurs.
Though not sufficient for sharpness, Bcd cooperativity is
necessary for Hb bistability to produce sharpness. We can
demonstrate this by simulating a strong decrease in cooperativity
in silico by a decrease in the number of Bcd binding sites (removing
reactions 10–13, giving 4B2H sites) without affecting self-
regulation. These simulations show a strong reduction in hb
activation, giving both a strong anterior shift and a drop in
sharpness (Figure 4D). The small box in Figure 4D shows that
bistability was not disrupted, since self-regulation was not affected,
but the Bcd threshold was shifted to a very high concentration not
reached by the Bcd gradient (indicated by red line). This result
indicates that Bcd cooperative binding is necessary for hb
Spatial Bistability in Drosophila
PLoS Computational Biology | www.ploscompbiol.org 6 September 2008 | Volume 4 | Issue 9 | e1000184

activation to reach its bistable threshold, which in turn is necessary
for sharpness to occur.
The above results show that small disruptions of Bcd
cooperative binding result in positional shifts, without loss of
sharpness, while large enough disruptions of cooperative binding
also disrupt Hb sharpness, since the bistable switch is not reached.
However, the bistable switch itself can only be produced by hb self-
regulation.
Discussion
hb is one of the most studied developmental genes in Drosophila
melanogaster. Since its discovery, many aspects of its transcriptional
regulation and roles in establishing the segmented body plan of the
embryo have been studied. We have shown, using a predictive
reaction–diffusion model as well as a series of experimental data,
that hb reads out the positional information of the morphogenetic
Bcd gradient with bistable kinetics, resulting from hb self-regulation.
The sharp Hb border is generated by the transition from one stable
Hb concentration to the other, and the AP position where this
switch occurs is determined by a threshold in the Bcd concentration,
which establishes the hb activation level through cooperative
binding. Our model reproduces the time development of the sharp
border formation and predicts that if hb self-regulation is removed,
bistability will be lost and sharpness disrupted. The expression
pattern of the hb self-regulation mutant, hb14F, confirms this
prediction. Our analysis confirms earlier observations of the role
of Bcd cooperative binding in positioning, but establishes that this
mechanism is not sufficient for sharpness. Here, we discuss these
conclusions in more detail in the context of the literature.
Figure 4. Bifurcation diagrams and simulations for the hunchback (hb) self-regulatory (HSR) model. (A) Bistability: solid blue curves arethe stable steady states for Hb total concentration [H]T (y-axis) for a given Bicoid (Bcd) total concentration [B]T (bottom axis), or as Bcd production rate(k0,B, top axis). Red curve is unstable steady states ([H]T will evolve away from such concentrations). Hb concentration will evolve to the low steadystates (short dashed lines) at low Bcd concentration, but abruptly steps up to the high steady states (long dashed lines) as Bcd concentration, [B]T,moves out of the bistable region (31.2,[B]T,40.5; green line on bottom axis). (B) Loss of bistability in the absence of self-regulation: bifurcationdiagram for HSR model without self-regulation reactions (14–17) shows no bistability. (C) Reduction in Bcd cooperative binding shifts bistable regiontoward high [B]T regions. Black and Red: bifurcation diagrams for heavy blue lines in Figure 1G and 1H, respectively (simulations for reduced Bcdcooperative binding (Figure 3; Table S2); blue line, wild-type diagram (same as in (A)); (D) Simulation for reduced number of Bcd binding sites(removing reactions 10–13) shows disrupted sharpness since Bcd concentrations (red line in the bifurcation diagram, small box) do not reach thebistable threshold (green dot).doi:10.1371/journal.pcbi.1000184.g004
Spatial Bistability in Drosophila
PLoS Computational Biology | www.ploscompbiol.org 7 September 2008 | Volume 4 | Issue 9 | e1000184
Bcd CooperativityThe role of Bcd cooperative binding on Hb positioning has been
demonstrated since 1989 [9,34,43]. For example, Driever et al. [43]
used a selection of artificial lacZ constructs, each containing some
portion of the native hb regulatory sequence, with varying numbers
of high and low affinity Bcd binding sites. They showed that
reducing the number or strength of Bcd binding sites shifted the
lacZ expression anteriorly, demonstrating the role of cooperativity
for pattern positioning. Increasing the binding strength or number
of sites gave posterior shifts and sharper borders, suggesting that
cooperativity could also be responsible for Hb sharpness. However,
even for the construct with the highest number of sites (12; 6 strong
and 6 weak), which showed the strongest expression level, pattern
was not as sharp as wild-type Hb. While a role for cooperative
binding in sharpening was suggested by these results, the authors
noted this could not be firmly concluded from their data [43]. Struhl
at al. [9] also observed shallower than endogenous Hb borders with
a series of similar lacZ constructs. Based on their results, Driever et
al. [43] proposed a ‘gradient-affinity model’, wherein target genes
with high affinity binding sites, like hb, would be efficiently expressed
even at low Bcd concentrations, and target genes containing low
affinity binding sites would be positioned in more anterior positions.
Our model reproduces these positioning effects of Bcd
cooperative binding, as shown in the simulations in which binding
site strength was varied (e.g., Figure 1F–H). It also explains that
the border of lacZ expression patterns is not as sharp as wild-type
Hb because of the loss of self-regulation in such constructs (Figure
S5 and Figure S6). These results indicate that bistability can play a
role in the gradient-affinity model, since they show that changing
the cooperativity level shifts the Hb pattern (Figure 1G and 1H)
but does not change its sharpness, allowing an on–off expression
boundary to be placed at many positions in the embryo.
Instead of changing cooperativity by changing the binding sites
in artificial constructs, Burz and Hanes [54] generated several Bcd
cooperativity mutants, such as the bcdK57R used in this study. They
showed that this mutant is stable in vivo (in yeast cells) and is not
affected in its DNA recognition, nuclear entry, or transcriptional
activity characteristics [46,54], and in situ hybridization showed
that localization and expression of bcdK57R mRNA is normal [46].
Through analyzing the expression pattern of the gap genes hb, gt
and Kr in this mutant, Lebrecht et al. [46] showed that cooperative
Bcd binding is critical for embryonic patterning. That study also
reported a reduction in Hb sharpness, contrary to what we report
here (see Figure 1G and 1H and Table 1). In [46], sharpness
(slope) was calculated on non-normalized data, which makes their
results susceptible to artificial variations in gene expression levels
that can occur at many steps in a staining assay, such as embryo
fixation and permeabilization. Using non-normalized data and
measuring the slope by the quotient between profile intensity, Dy,
by the distance along AP axis, Dx, introduces variability in slope
due to variability in Dy, see Figure S3. Here, we present new
results for Hb sharpness, computing slope with normalized data
(Dy = 1) to reduce the contribution of these experimental errors
and to compare mutants with different levels of expression. Our
method, similar to that used by Crauk and Dostatni [49], depends
only on how far it takes Hb to drop from ‘on’ to ‘off’ expression
(Dx). Recently, Gregor et al. [61] have shown that immunofluo-
rescent signals are proportional to protein concentration plus a
nonspecific background. This indicates that normalizing immu-
nofluorescent signals provides an equivalent result to normalizing
real concentrations. With this approach, we do not find a
significant difference in sharpness between bcdK57R, bcdWT, or
bcdE1/+.
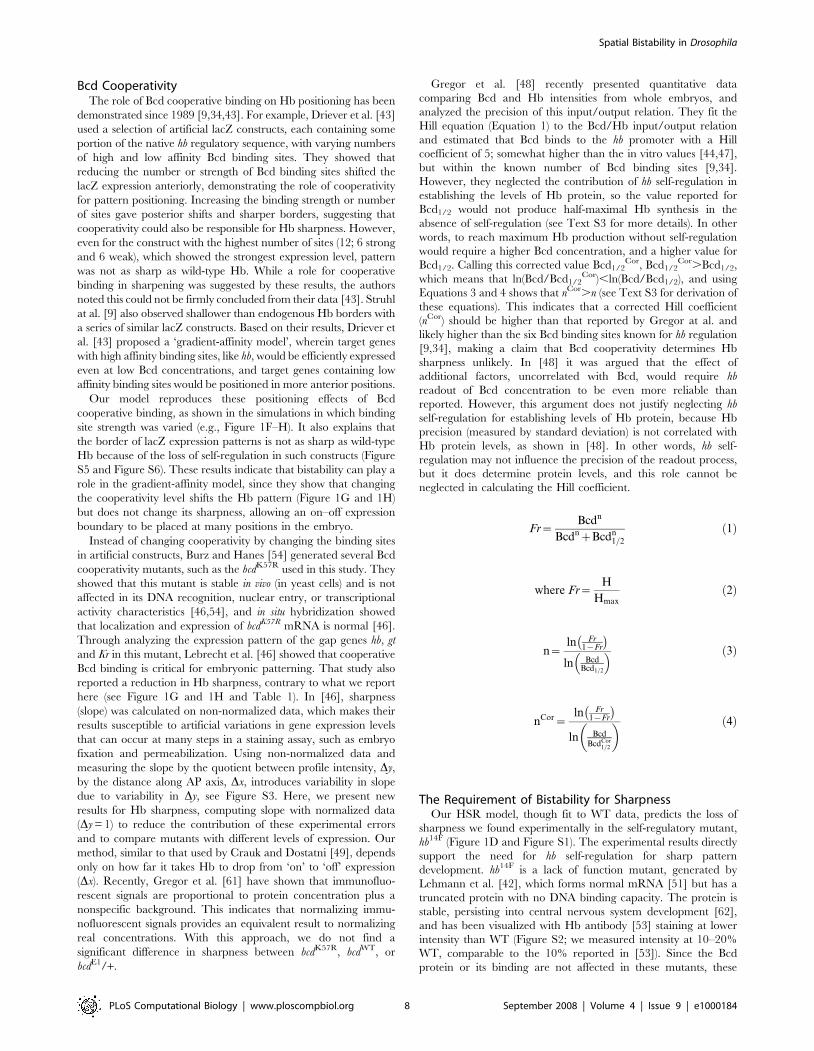
Gregor et al. [48] recently presented quantitative data
comparing Bcd and Hb intensities from whole embryos, and
analyzed the precision of this input/output relation. They fit the
Hill equation (Equation 1) to the Bcd/Hb input/output relation
and estimated that Bcd binds to the hb promoter with a Hill
coefficient of 5; somewhat higher than the in vitro values [44,47],
but within the known number of Bcd binding sites [9,34].
However, they neglected the contribution of hb self-regulation in
establishing the levels of Hb protein, so the value reported for
Bcd1/2 would not produce half-maximal Hb synthesis in the
absence of self-regulation (see Text S3 for more details). In other
words, to reach maximum Hb production without self-regulation
would require a higher Bcd concentration, and a higher value for
Bcd1/2. Calling this corrected value Bcd1/2Cor, Bcd1/2
Cor.Bcd1/2,
which means that ln(Bcd/Bcd1/2Cor),ln(Bcd/Bcd1/2), and using
Equations 3 and 4 shows that nCor.n (see Text S3 for derivation of
these equations). This indicates that a corrected Hill coefficient
(nCor) should be higher than that reported by Gregor at al. and
likely higher than the six Bcd binding sites known for hb regulation
[9,34], making a claim that Bcd cooperativity determines Hb
sharpness unlikely. In [48] it was argued that the effect of
additional factors, uncorrelated with Bcd, would require hb
readout of Bcd concentration to be even more reliable than
reported. However, this argument does not justify neglecting hb
self-regulation for establishing levels of Hb protein, because Hb
precision (measured by standard deviation) is not correlated with
Hb protein levels, as shown in [48]. In other words, hb self-
regulation may not influence the precision of the readout process,
but it does determine protein levels, and this role cannot be
neglected in calculating the Hill coefficient.
Fr~Bcdn
BcdnzBcdn1=2
ð1Þ
where Fr~H
Hmaxð2Þ
n~ln Fr
1{Fr
� �ln Bcd
Bcd1=2
� � ð3Þ
nCor~ln Fr
1{Fr
� �ln Bcd
BcdCor1=2
� � ð4Þ
The Requirement of Bistability for SharpnessOur HSR model, though fit to WT data, predicts the loss of
sharpness we found experimentally in the self-regulatory mutant,
hb14F (Figure 1D and Figure S1). The experimental results directly
support the need for hb self-regulation for sharp pattern
development. hb14F is a lack of function mutant, generated by
Lehmann et al. [42], which forms normal mRNA [51] but has a
truncated protein with no DNA binding capacity. The protein is
stable, persisting into central nervous system development [62],
and has been visualized with Hb antibody [53] staining at lower
intensity than WT (Figure S2; we measured intensity at 10–20%
WT, comparable to the 10% reported in [53]). Since the Bcd
protein or its binding are not affected in these mutants, these
Spatial Bistability in Drosophila
PLoS Computational Biology | www.ploscompbiol.org 8 September 2008 | Volume 4 | Issue 9 | e1000184

embryos clearly show that Bcd cooperative binding is not sufficient
for producing Hb sharpness. Our results with hb14F agree with the
observations of Houchmandzadeh et al. [50] that expression in the
hb6N allele (also with non-functional protein) suggested a role for
self-regulation in sharpening. Our model shows that loss of self-
regulation disrupts the bistable behavior in hb14F expression,
resulting in the loss of sharpness. Similarly, expression of the
pThb5 lacZ construct shows reduced sharpness in comparison to
WT (Figure S5, Figure S6, and Table 1), since the protein coded
by lacZ (b-galactosidase) is not self-regulatory. Construct sharpness
is greater than hb14F sharpness, however. The model predicts this,
by taking into account that native, patterned Hb protein can bind
in the construct promoter (compare Figure 1D to Figure S5 and
Figure S6; see also Table 1 and Figure S4).
Crauk and Dostatni [49] recently reported sharp expression for
a lacZ construct containing only three (strong) Bcd binding sites.
We found lowered sharpness for the pThb5 construct (Figure 1H),
which contains six Bcd binding sites (three strong, three weak; as
well as two Hb and Kr sites). Since this is opposite to what any
cooperative effect should be for increasing sites, the differences are
likely to be methodological. We used both whole mount
fluorescent in situ hybridization (FISH; Figure S5) and traditional
in situ hybridization (Figure S6; as used in [49]) to visualize lacZ
expression. Both methods gave similar measures of sharpness
(Table 1), but the enzymatic staining is more susceptible to signal
saturation and tends not to be proportional to RNA concentration.
Crauk and Dostatni [49] also reported reduced sharpness in
embryos with truncated Bcd proteins, Bcd-DC and Bcd-DQC (with
specific defects in protein activity). In light of the hb transcriptional
dynamics found in our analysis, we believe such alterations to Bcd
could cause transcription to remain sub-threshold for bistable
activation, similar to Figure 4D.
The Method Used for Embryo StagingAll embryos used in Figure 1 and Table 1 were in nuclear
cleavage cycle 14A (precellular blastoderm), within time classes T5
to T6 (26 to 39 min into this cycle), during which Hb levels are at
their highest (Figure 1D shows two T7 embryos, to show the
normal posterior patterning in these mutants). We staged each
embryo by established methods [63], following dorsal membrane
invagination measured from images obtained by Differential
Interference Contrast (DIC) optics. For comparing Hb dynamics
and model simulation (Figure 2), we used embryos in the first
36.4 minutes of cycle 14A. While Hb expression dynamically
amplifies over this period (Figure 2B), the mature sharpness is
reached within 5–10 minutes, after which it is stable (Figure 2D).
Note that Figure 2D shows that Hb pattern in all WT embryos
older than 8 min in cycle 14 are sharper than any embryo in
Figure 1D.
Maternal HbThe earliest Hb protein pattern in the embryo is of maternal
origin. Before nuclear cleavage cycle 8, maternal hb mRNA is
distributed uniformly throughout the egg, but its translation is
repressed by the posterior Nanos (Nos) protein gradient, resulting
in a smooth anterior gradient of maternal Hb (Hbmat) protein.
This is gradually substituted by the zygotically expressed Hb,
starting in cycle 11 [27,33,64–69]. To see the effect of these early
Hb distributions on cycle 14 dynamics, we ran HSR model
simulations with an initial Hb pattern taken from cycle 13 data
(Figure S9; parameters and data from same assay as in Figures 1C
and 2A). Simulation results were the same as in Figure 2,
indicating no effect from the Hb initial condition. This behavior is
related to the bistable behavior of Hb: the diagram in Figure S10
shows that, inside the bistable region, only relatively high initial
conditions (above the unstable branch) can produce high Hb
concentrations. It indicates that the initial concentrations of Hb,
determined by zygotic production, are low and not sufficient to
carry the system through the transition from lower to upper stable
branch. This agrees with previous results showing that embryos
lacking maternal Hb develop normally [42,65,66]. Like the
Drosophila embryos, the HSR model is robust to variability in Hb
initial concentration.
The Method of Constructing Reaction-Network ModelsThe method we have used to construct the HSR network,
describing hb regulation by Bcd cooperative binding and hb self-
regulation, can be readily applied to other genetic regulatory
systems in Drosophila or other organisms, since the regulatory
interactions are general. We avoided using a Hill kinetics
approach to model cooperativity because this would require some
questionable assumptions, such as all six sites being equal, which is
counter to published Bcd binding data [43,47], and bound
simultaneously, which is highly improbable. One advantage of
using the Hill equation could be its few number of parameters;
however, using relations kb(n-1),bn = factorn.kb0,b1 and kbn,b(n-1) =
kb1,b0 for n = 2, …, 6 in reactions (2+2n, n = 1, …, 5) allowed us to
describe cooperativity with just three parameters, kb0,b1, kb1,b0 and
factor. The effects of more or less binding sites and more or less
transcriptional regulators can easily be built into our kind of
model. Our method allows for a direct link between macroscopic
pattern formation and its molecular basis. As well, such a model is
amenable to mathematical analysis with modern nonlinear
techniques, which have developed rapidly in recent years
[17,55,70–73]. In the present example, using such techniques to
search for multiple steady states allowed us to identify the
bistability inherent in the self-regulatory reactions, and determine
the model parameters necessary for triggering this.
The Bistable BehaviorIn reaction networks, bistability is frequently verified by
changing the initial concentration of one species, in the well-
mixed system, and checking the concentrations of all other species
when the system reaches the stationary state. In a monostable
regime, small variations in the initial concentration generally
produce small variations in the stationary state. However, if the
concentration is in the vicinity of a threshold, where the transition
from the monostable to the bistable regimes occurs, small changes
in the initial condition can produce large variation in the
stationary state, because the concentrations of the species can
follow a completely different trajectory (i.e., sequence of
intermediate concentrations), ending up in a very different
stationary state (Figure 4A). In our spatially-patterned case, the
anterior–posterior Bcd gradient provides many different concen-
trations that work like different initial conditions in the well-mixed
system; in such a way that at the position where Bcd crosses the
threshold (Figure 4A), the Hb stationary concentration changes
abruptly, producing the sharp Hb border (Figure 2A).
The origin of bistability in the Bcd-Hb system is a consequence
of the positive feedback of hb self-regulation. If Hb production is
not high enough, self-regulation can only produce a small change
in Hb production, and the consequent increase in degradation
counteracts almost all increase in Hb production; this regime
occurs in the posterior half of the embryo. If Hb production is
more effectively increased, by increasing Bcd concentration, the
positive feedback can produce a certain additional amount of Hb
protein, which can be sufficient to start increasing Hb production
more efficiently. If this occurs, the additional amount of Hb will
Spatial Bistability in Drosophila
PLoS Computational Biology | www.ploscompbiol.org 9 September 2008 | Volume 4 | Issue 9 | e1000184

increase the feedback even more strongly, ending up in a
completely different regime, having higher Hb concentrations;
this regime occurs in the anterior half of the embryo.
Concluding RemarksOur data and model show that positioning and sharpness of the
Hb pattern are separable processes. With the hb14F allele and the
pThb5 construct, we show that sharpness can be disrupted with
self-regulation defects; and our theoretical analysis suggests this is
due to loss of bistability. Earlier work has suggested many of the
shifting and sharpening effects we find here. However, there has
been debate about the relative roles of the transcriptional
regulators: some studies have suggested a role for hb self-regulation
in sharpening [50], while others indicate that it could be
completely controlled by Bcd [48,49]. It has also been known
that the number of Bcd binding sites in the hb promoter affects
pattern position [9,34,43]. Our data and model offer a synthesis:
positioning is largely dependent on the Bcd occupation states of
the hb promoter, but sharpening is a result of bistability in the hb
activation dynamics, caused by hb self-regulation. Bcd cooperativ-
ity, through affecting hb transcription, determines the threshold at
which bistability occurs, but is not itself sufficient for sharpening.
In 1977, Lewis at al. [74] used theoretical arguments to suggest
that bistable control can account for the interpretation of gradients
in positional information. More recently, bistability has been
found in many complex biological processes [14–16,18–21,75]
and spatial bistability has been proposed in dorso-ventral
patterning in Drosophila [21,22]. Here, we have combined
experiments, modeling and analysis to suggest that this dynamic
feature may also be central to AP patterning, and that for hb
transcription bistability arises from the convergence of two
regulatory mechanisms (Bcd cooperative binding and hb self-
regulation). This provides a specific mechanism to the earlier
indication that Bcd and Hb synergy is required for Drosophila gap
patterning [51]. Moreover, in agreement with Lewis et al. [74],
our findings indicate that bistability may be central to threshold-
dependent reading mechanisms of the positional information
established by smooth maternal signals.
Our approach, of developing a kinetic transcriptional model
from molecular data such as binding sites and regulatory
interactions (repression or activation), using dynamical systems
theory to determine the model dynamics, and confirming the
model predictions against quantitative experiments, could be used
for uncovering regulatory mechanisms in many other pattern
formation systems, in fruit flies and in other organisms.
Materials and Methods
DatasetWe stained for Bcd and Hb proteins in WT Oregon-R embryos,
as well as in the hb mutant hb14F [52], and two bcd mutants [46]
(bcdK57R, bcdE1/+). lacZ expression for the pThb5 construct (driven
by a fragment of the hb promoter; [43]) was visualized by two
methods for staining b-galactosidase mRNA (Table 2). The
simultaneous Hb protein and RNA visualization was also done
in WT Oregon-R embryos.
Preparation and StainingAs outlined in Table 2, three different staining procedures were
used for obtaining expression patterns. For all procedures,
embryos were dechorionated; heat fixed in NaCl 0.7%+Triton-
X100 0.05% for 3 seconds and immediately chilled in ice; and
devitellinized with methanol.
For protein staining [76], embryos were incubated with guinea
pig and rat primary antibodies to Hb and Bcd, respectively,
followed by secondary antibodies labeled with Alexa Fluor 647 (to
Hb) and 488 (to Bcd; Molecular Probes). All antibody incubations
and washes were done in PBS+0.1% Tween-20. Blocking was
done in Western Blocking Reagent (Roche), diluted 5 times. All
secondary antibodies were preabsorbed by incubating them with
0- to 12-h-old WT embryos for at least 2 h at 4 C.
For the lacZ embryos, we used simultaneous immunostaining to
Hb and Bcd and in situ hybridization. With FISH, we followed the
method of Janssens et al. [76]: a lacZ riboprobe was prepared with a
2.5-kb PvuII lacZ fragment blunt-cloned into the EcoRV site of
pBluescriptIIKS+ (gift from S. Small), labeled with fluorescein by
transcription using T3 polymerase. After hybridization, lacZ
mRNA was visualized by sequential incubation with rabbit antibody
to fluorescein (Molecular Probes), followed by antibody to rabbit
labeled with Alexa Fluor 488 (Molecular Probes). The embryos
were simultaneously stained for Hb and Bcd proteins, as in the
previous paragraph, using secondary antibody labeled with Alexa
Fluor 555 to detected Bcd. Alternately (Figure S6), some lacZ
embryos were measured via enzymatic staining (whole mount in situ
hybridization): b-galactosidase mRNA was hybridized in situ with a
digoxygenin-labeled DNA probe, following standard protocols [67].
The hybridization products were detected with a phosphatase-
coupled antibody against digoxygenin. For simultaneous determi-
nation of Hb protein and RNA, we used the same FISH procedure
as above, sequentially using guinea pig and rabbit antibodies to Hb
and fluorescein, respectively, and secondary antibodies to guinea pig
and rabbit labeled with Alexa 647 and 488, respectively.
Table 2. Methods for obtaining expression patterns, for the specified numbers of WT and mutant embryos.
Method Genes
hbWT bcdWT hb14F bcdWT hbWT bcdK57R hbWT bcdE1/+ lacZ hbWT RNA hbWT prot.
FISHa – – – – 9 13
Immunofluorescenceb 50 39 23 7 d 13
Enzymatic stainingc – – – – 21 d
aWhole mount fluorescent in situ hybridization.bFluorescence immunostaining.cWhole mount in situ hybridization with digoxygenin-labeled RNA.dAll lacZ embryos were co-stained for Bcd and Hb proteins.doi:10.1371/journal.pcbi.1000184.t002
Spatial Bistability in Drosophila
PLoS Computational Biology | www.ploscompbiol.org 10 September 2008 | Volume 4 | Issue 9 | e1000184

Following fixation and staining, embryos were mounted in
40 ml mounting medium (Prolong Antifade by Invitrogen) and
covered with a 22630 mm cover glass (No. 1K).
Confocal MicroscopyFollowing the methods of Janssens et al. [76], whole-embryo
images were taken using a laser confocal scanning microscope
(Leica TCS SP2). Images were collected using an HC PL APO
206objective and variable digital zoom (1.2–1.56). Fluorophores
were excited by laser at different wavelengths (488, 555, and
647 nm), and detected via a filterless spectral separation system.
Channels were scanned sequentially. To reduce image noise from
the photomultiplier tubes, each embryo was scanned sequentially
16 times and the results averaged.
The settings of the microscope were adjusted for each gene
product such that pixels expressed at maximum intensity were 255
on the 8-bit scale. Initial image size before processing was
102461024 pixels. Raw images were averaged, cropped and
rotated. This standardization allowed us to compare levels of gene
expression at different times, or in different experiments
performed on different days [77].
Processing of ImagesFor embryos triply-stained for segmentation proteins, the
extraction of AP intensity profiles is well established [76,77]. With
such data, a nuclear mask can be created, and intensity data
mapped to nuclei (next section). Co-staining for Bcd and Hb
proteins and b-galactosidase mRNA presents greater challenges:
signal strength and quality are very different for proteins and
RNA; and the anterior localization of Bcd and Hb make
identification of posterior nuclei very difficult. We developed a
non-mask method for profile extraction for these experiments
(section after next).
Image Processing via Nuclear MasksFor embryos stained for three segmentation proteins, the three
images are used to generate a ‘pixel maximum’ image, of the
brightest pixels among the images. On this image, pixels are then
classified as belonging to a nucleus or not, by edge-detection of
bright nuclei against dark background. An error-correction step
repairs any ‘fused’ nuclei. With the resulting nuclear mask, dorso-
ventral, AP coordinates, and average fluorescence level of the
three gene products can be mapped to individual nuclei. Intensity
profiles are extracted from a central 10% strip of nuclei along the
AP axis [76,77].
Direct Image Processing (No Nuclear Mask)For lacZ embryos, co-stained for Hb and Bcd proteins and b-
galactosidase mRNA, nuclei cannot be reliably identified,
especially in the posterior (preliminary nuclear staining in a fourth
channel shows much crosstalk). For these experiments, we directly
extract the pixel intensities in a 10% strip (corresponding area to
above). For high-intensity protein staining the signal is strong, but
for low-intensity RNA staining we must recover expression from a
noisy signal (next section). A one dimensional (1D) AP profile was
created from the strips, by averaging intensities in each DV pixel
column from the central 10% strip along the AP axis. In addition
to some between-pixel noise, the resulting profiles show noise in
nuclear order and in the distribution of stained material between
nuclei and cytoplasm. Minimization of these two sources of noise is
described in the next section. To test the quality of our direct
method, we manually made nuclear masks for several co-stained
lacZ embryos using the multiple ROI feature in ImageJ software
[78]. ROIs are circles with radii comparable to the nuclear radii in
a given image. Each ROI was positioned manually to outline a
given nucleus. Nuclear-resolution AP profiles from this method are
of comparable quality to pixel-resolution profiles from our direct
extraction method.
Signal–Noise DecompositionNoise in intensity profiles can influence model-fitting and
statistical analysis of expression patterns [77,78]. To obtain clear
expression patterns, we used singular spectrum analysis (SSA [79]),
a non-parametric technique with an adaptive filter. This allowed
us to remove experimental (e.g., photomultiplier tube) noise and
noise due to variability in nuclear order and in nuclear-
cytoplasmic distribution of gene products. We used the methods
of Golyandina et al [80], and software developed by Nina
Golyandina and Theodore Alexandrov [81].
Background RemovalNon-specific binding of antibodies to biological material results
in background fluorescence in our images. For triple-stained
protein images it has been shown [82] that this background is a
paraboloid. For every image we calculated the parameters of this
paraboloid from regions of the embryo in which a particular gene
is not expressed, then transformed original fluorescence at or
below this background to zero. For lacZ embryos simultaneously
stained for protein and mRNA it is unclear whether background
has a comparable shape; in these cases, we use a simple flat
background, subtracting the minimum raw intensity off all values.
Quantifying Border Position and SharpnessAn advantage of direct image processing is the large number of
data points (around 1000) and smoothness of each profile. This
makes it possible to apply standard calculus techniques to
characterize the profiles: we define the Hb domain border as the
inflection point, and sharpness as the first derivative at that
position. With normalized intensity data (0–100% scale), this slope
can be expressed as an angle of inclination (as in Figure 2). These
techniques can be applied to data, as well as HSR model results.
Temporal ClassificationIn addition to confocal scanning, all embryos were observed
along the dorsal edge with Differential Interference Contrast (DIC)
optics. Distances were measured from the egg surface to the
invaginating membrane, and from the surface to the cortex. The
ratio of membrane depth to cortex depth was used to estimate
embryo age in minutes, using a published standard curve [63].
The Zero Eigenvalue AnalysisThe Zero Eigenvalue Analysis [56–58] is a very efficient
method, because the search for bistability is reduced to the
solution of a system of equalities and inequalities (see Equation
S2.22 in Text S2) that are easier to find than a direct solution of
the polynomial equation describing the stationary states (see
Equations S1.39–99, S1.159, and S1.169). This technique readily
allows one to find the set of kinetic parameters that produce
bistability, and gives two steady state solutions, which can be used
to easily make the bifurcation diagram, like that shown in Figure 4.
Finding bistability with direct solution of a polynomial requires
solutions that are different, real and positive. This is frequently not
convenient for degree higher than 2 [83], and not analytically
solvable for degree higher than 4. Zero Eigenvalue Analysis can be
applied to such higher degree systems. For example, Li [58] has
used this method to determine multiplicity of stationary states in
Spatial Bistability in Drosophila
PLoS Computational Biology | www.ploscompbiol.org 11 September 2008 | Volume 4 | Issue 9 | e1000184

the famous Goldbeter and Lefever allosteric model [84], consisting
of 14 species, 32 reactions, and 27 kinetic constants.
Supporting Information
Table S1 Kinetic constants for model fitting and simulations.
Found at: doi:10.1371/journal.pcbi.1000184.s001 (0.02 MB PDF)
Table S2 Kinetic constants to simulate a weak and strong
response to half-dosage of bcdK57R.
Found at: doi:10.1371/journal.pcbi.1000184.s002 (0.01 MB PDF)
Text S1 Model equations and fitting procedure.
Found at: doi:10.1371/journal.pcbi.1000184.s003 (0.03 MB PDF)
Text S2 Analysis for multiple stable stationary states.
Found at: doi:10.1371/journal.pcbi.1000184.s004 (0.14 MB PDF)
Text S3 Obtaining the logarithmic Hill equation.
Found at: doi:10.1371/journal.pcbi.1000184.s005 (0.02 MB PDF)
Figure S1 Some individual embryo images for the profiles in
Figure 1. Each of the overlays in Figure 1D–H is composed of
intensity profiles, along the AP axis, from individual embryo
images. Here, we show some examples of these individuals, with
expression patterns for hb; individual embryos on top and profiles
on bottom. (A) An embryo homozygous for hb14F, one of the
profiles used in Figure 1D. (B) An embryo from the overlay in
Figure 1E. (C) An embryo with a half dosage of Bicoid (Bcd)
mRNA (bcdE1/+; see Figure 1F); (D) An embryo with a weak
bcdK57R phenotype (see Figure 1G); (E) An embryo with a strong
bcdK57R phenotype (see Figure 1H).
Found at: doi:10.1371/journal.pcbi.1000184.s006 (1.59 MB TIF)
Figure S2 Non-normalized profiles for 39 embryos expressing
the hb14F allele. The hb14F homozygotes can be easily identified by
low signal intensities, as described in the literature [53]. WT and
heterozygotes could not be easily distinguished in this way.
Found at: doi:10.1371/journal.pcbi.1000184.s007 (0.55 MB TIF)
Figure S3 The influence of experimental error on sharpness
measurement. Dyex is the variability due to staining procedure,
such as embryo fixation and permeabilization, and Dx is the
projection on the AP axis. Even though P1 and P2 have the same
AP projection (Dx) they will have different sharpness measure-
ments (b.a), but this difference is caused by the experimental
error Dyex. With normalized patterns (Dyex = 0 and Dy = 1),
sharpness measurement will be determined only by the AP
projection.
Found at: doi:10.1371/journal.pcbi.1000184.s008 (0.18 MB TIF)
Figure S4 Hb promoter and lacZ artificial construct. A fragment
of 4776 bp from the hb gene. Hb (blue) and Bcd (red) sites were
identified by DNAse footprinting in [35] and [43], respectively.
Black arrows indicate the transcription initiation sites. Green
arrows indicate the position of the fragment used in the pThb5
lacZ construct, which includes the six Bcd and both Hb sites. To
avoid an unnecessarily extensive model, we took into account only
two Hb sites.
Found at: doi:10.1371/journal.pcbi.1000184.s009 (0.26 MB TIF)
Figure S5 Loss of sharpness shown by FISH images for the
mRNA expression pattern of the pThb5 lacZ construct, driven by
a six Bcd and two Hb site promoter. (A) An individual embryo on
top and its corresponding profile on bottom. (B) Overlay of 9
profiles. The pattern shows a slight anterior shift (45.7% EL from
47% EL in WT) and 9.3% decrease in sharpness (72.7u from 80.2uin WT) Heavy line: Model simulation taking into account both Hb
sites on this construct (6B2H_lacZ); pattern positioned at 48.0%
EL with 74.9u inclination.
Found at: doi:10.1371/journal.pcbi.1000184.s010 (0.50 MB TIF)
Figure S6 Demonstrating reduced sharpness in the pThb5 lacZ
construct with the alternate method of enzymatic in-situ
hybridization (compare to FISH, used in Fig. S5). (A) Embryo
image taken by Differential Interference Contrast (DIC) optics on
top and corresponding intensity profile on bottom. (B) 21 profiles
taken by the same procedure. Pattern position gives 47.3% EL and
74.9u sharpness. Heavy blue line is the simulation of HSR model
(6B2H_lacZ) model for this construct (48.0% EL and 74.9uinclination). The observed reduction in sharpness is independent
of the method used for visualizing mRNA.
Found at: doi:10.1371/journal.pcbi.1000184.s011 (0.63 MB TIF)
Figure S7 Temporal evolution of the Hb pattern. Multicolored
and dark blue lines indicate experimental data and HSR model,
respectively. Embryos are the same as in Figure 3B–D. The
embryo ages are indicated in the legend. The oldest embryo,
36.4 min, is the same used to fit the model (Fig. 3A). Each plot
covers a temporal window of 9.1 min: (A) Embryos having
9.1 minutes or less in cycle 14; (B), (C) and (D) show embryos
having ages from 9.2 to 18.2, 18.3 to 27.3 and 27.4 to 36.4 min,
respectively. The earliest computed pattern corresponds to age
2.3 min. There is an interval of roughly 2.3 min between each
computed pattern; four of them are shown in each plot. See
Materials and Methods for embryo temporal classification.
Found at: doi:10.1371/journal.pcbi.1000184.s012 (1.16 MB TIF)
Figure S8 hb RNA and protein profiles. Simultaneous fluores-
cence immunostaining and in situ hybridization showing hb RNA
and protein. (A) RNA (above) and protein (below) signals from two
different embryos (right and left); (B) RNA (solid lines) and protein
(dashed lines) from left (blue) and right (red) embryos in (A),
respectively. (C) Comparison between 13 RNA and protein
patterns, left and middle chart, respectively. The difference in
sharpness is indicated, on right chart, by two straight lines having
inclinations of 84.2u (red) and 82.5u (black), which correspond to
RNA and protein mean inclinations, respectively (see Table 1).
The high sharpness for RNA data supports our result that Hb
sharpness results from spatially bistable dynamics.
Found at: doi:10.1371/journal.pcbi.1000184.s013 (1.11 MB TIF)
Figure S9 The HSR model is robust for different Hb initial
concentrations. Running the HSR model with an initial condition
of zero Hb concentration (yellow line) or a Hb pattern taken from
cycle 13 (gray line) gives the same result (solid blue and dotted red
lines, respectively), indicating no effect from different initial
conditions. This is in agreement with previous results reporting
that embryos lacking maternal Hb develop normally [42,65–66].
Found at: doi:10.1371/journal.pcbi.1000184.s014 (0.14 MB TIF)
Figure S10 Bistability diagram showing the origin of Hb
robustness for different initial conditions. Green line on the Bcd
concentration axis indicates the bistable region, where for each
Bcd concentration there are three stationary states available for
Hb concentration. Blue and red lines are the stable and unstable
branches of stationary states, respectively. Black circles indicate
initial conditions outside the bistable region (green line); they
evolve to the upper stable branch. Red and green circles indicate
initial conditions inside the bistable region: All initial Hb
conditions below the unstable branch (red circles) evolve to the
lower stable branch, having low Hb concentrations; and initial Hb
concentrations above the unstable branch (green circles) evolve to
the upper stable branch, having high Hb concentrations. The
arrows indicate the temporal evolution.
Spatial Bistability in Drosophila
PLoS Computational Biology | www.ploscompbiol.org 12 September 2008 | Volume 4 | Issue 9 | e1000184
Found at: doi:10.1371/journal.pcbi.1000184.s015 (0.22 MB TIF)
Acknowledgments
We thank John Reinitz for fruitful discussions on the model and sharing of
lab facilities; Bloomington Stock Center for hb14F flies; Steve Hanes for the
bcdK57R flies; Steve Small for hb RNA probes; Ah-Ram Kim for lacZ
probes; Gerald Thomsen for revising the manuscript; Carlos Alonso, Ah-
Ram Kim, and Lisa Prazak for instructions on experiments; Svetlana
Surkova for helping embryo temporal classification; and Eliana Abdelhay,
Jose Pontes, Hector Barrabin, and Nathalie Dostatni for discussions on
results.
Author Contributions
Conceived and designed the experiments: FJPL. Performed the experi-
ments: FJPL. Analyzed the data: FJPL FMCV DMH PMB AVS.
Contributed reagents/materials/analysis tools: FJPL FMCV PMB AVS.
Wrote the paper: FJPL DMH AVS. Built the model: FJPL FMCV PMB.
References
1. Driesch H (1893) Entwicklungsmechanische studien VI. Uber einige fragen dertheoretischen morphologie. Z Wiss Zool 55: 34–62.
2. Browne EN (1909) The production of new hydranths in hydra by the insertion ofsmall grafts. J Exp Zool 7: 1–37.
3. Wolpert L (1969) Positional information and spatial pattern of cellular
differentiation. J Theor Biol 25: 1–47.
4. Lander AD (2007) Morpheus unbound: reimagining the morphogen gradient.
Cell 128: 245–256.
5. Lander AD, Nie Q, Wan FYM (2002) Do morphogen gradients arise by
diffusion? Dev Biol 247: 471–471.
6. Gregor T, Bialek W, van Steveninck RRR, Tank DW, Wieschaus EF (2005)
Diffusion and scaling during early embryonic pattern formation. Proc Natl AcadSci U S A 102: 18403–18407.
7. Driever W, Nusslein-Volhard C (1988) The bicoid protein determines position in
the Drosophila embryo in a concentration-dependent manner. Cell 54: 95–104.
8. Driever W, Nusslein-Volhard C (1988) A gradient of bicoid protein in Drosophila
embryos. Cell 54: 83–93.
9. Struhl G, Struhl K, Macdonald PM (1989) The gradient morphogen Bicoid is a
concentration-dependent transcriptional activator. Cell 57: 1259–1273.
10. Wolpert L (2002) Principles of Development. 2nd ed. New York: Oxford
University Press.
11. Ephrussi A, St Johnston D (2004) Seeing is believing: the bicoid morphogen
gradient matures. Cell 116: 143–152.
12. Bonn D, Meunier J, Greffier O, Al-Kahwaji A, Kellay H (1998) Bistability innon-Newtonian flow: rheology of lyotropic liquid crystals. Phys Rev E 58:
2115–2118.
13. Sessoli R, Gatteschi D, Caneschi A, Novak MA (1993) Magnetic bistability in a
metal-ion cluster. Nature 365: 141–143.
14. Bhalla US, Iyengar R (1999) Emergent properties of networks of biological
signaling pathways. Science 283: 381–387.
15. Vieira FMC, Bisch PM (1994) Oscillations and multiple steady-states in activemembrane-transport models. Eur Biophys J 23: 277–287.
16. Guidi GM, Goldbeter A (2000) Oscillations and bistability predicted by a modelfor a cyclical bienzymatic system involving the regulated isocitrate dehydroge-
nase reaction. Biophys Chem 83: 153–170.
17. Feinberg M, Horn FJM (1974) Dynamics of open chemical systems and
algebraic structure of underlying reaction network. Chem Eng Sci 29: 775–787.
18. Leloup JC, Goldbeter A (1998) A model for circadian rhythms in Drosophila
incorporating the formation of a complex between the PER and TIM proteins.
J Biol Rhythms 13: 70–87.
19. Calzone L, Thieffry D, Tyson JJ, Novak B (2007) Dynamical modeling of
syncytial mitotic cycles in Drosophila embryos. Mol Syst Biol 3: 131.
20. Kim J, White KS, Winfree E (2006) Construction of an in vitro bistable circuit
from synthetic transcriptional switches. Mol Syst Biol 2: 68.
21. Umulis DM, Serpe M, O’Connor MB, Othmer HG (2006) Robust, bistable
patterning of the dorsal surface of the Drosophila embryo. Proc Natl Acad
Sci U S A 103: 11613–11618.
22. Wang YC, Ferguson EL (2005) Spatial bistability of Dpp-receptor interactions
during Drosophila dorsal-ventral patterning. Nature 434: 229–234.
23. Nussleinvolhard C, Frohnhofer HG, Lehmann R (1987) Determination of
anteroposterior polarity in Drosophila. Science 238: 1675–1681.
24. Berleth T, Burri M, Thoma G, Bopp D, Richstein S, et al. (1988) The role of
localization of bicoid RNA in organizing the anterior pattern of the Drosophila
embryo. EMBO J 7: 1749–1756.
25. Jackle H, Tautz D, Schuh R, Seifert E, Lehmann R (1986) Cross-regulatory
interactions among the gap genes of Drosophila. Nature 324: 668–670.
26. Frohnhofer HG, Nussleinvolhard C (1986) Organization of anterior pattern in
the Drosophila embryo by the maternal gene bicoid. Nature 324: 120–125.
27. Struhl G (1989) Differing strategies for organizing anterior and posterior body
pattern in Drosophila embryos. Nature 338: 741–744.
28. Nusslein-Volhard C, Wieschaus E (1980) Mutations affecting segment number
and polarity in Drosophila. Nature 287: 795–801.
29. Holloway DM, Harrison LG, Kosman D, Vanario-Alonso CE, Spirov AV(2006) Analysis of pattern precision shows that Drosophila segmentation develops
substantial independence from gradients of maternal gene products. Dev Dyn235: 2949–2960.
30. Spirov AV, Holloway DM (2003) Making the body plan: precision in the genetichierarchy of Drosophila embryo segmentation. In Silico Biol 3: 89–100.
31. Jaeger J, Surkova S, Blagov M, Janssens H, Kosman D, et al. (2004) Dynamic
control of positional information in the early Drosophila embryo. Nature 430:
368–371.
32. von Dassow G, Meir E, Munro EM, Odell GM (2000) The segment polaritynetwork is a robust development module. Nature 406: 188–192.
33. Tautz D, Lehmann R, Schnurch H, Schuh R, Seifert E, et al. (1987) Finger
protein of novel structure encoded by Hunchback, a 2nd member of the gapclass of Drosophila segmentation genes. Nature 327: 383–389.
34. Driever W, Nusslein-Volhard C (1989) The Bicoid protein is a positive regulator
of Hunchback transcription in the early Drosophila embryo. Nature 337: 138–143.
35. Treisman J, Desplan C (1989) The products of the Drosophila gap genes Hunchback
and kruppel bind to the Hunchback promoters. Nature 341: 335–337.
36. Margolis JS, Borowsky ML, Steingrimsson E, Shim GW, Lengyel JA, et al.
(1995) Posterior stripe expression of Hunchback is driven from 2 promoters by acommon enhancer element. Development 121: 3067–3077.
37. Lukowitz W, Schroder C, Glaser G, Hulskamp M, Tautz D (1994) Regulatory
and coding regions of the segmentation gene Hunchback are functionally
conserved between Drosophila-virilis and Drosophila-melanogaster. Mech Dev 45:105–115.
38. Wu XL, Vasisht V, Kosman D, Reinitz J, Small S (2001) Thoracic patterning by
the Drosophila gap gene hunchback. Dev Biol 237: 79–92.
39. Simpsonbrose M, Treisman J, Desplan C (1994) Synergy between theHunchback and Bicoid morphogens is required for anterior patterning in
Drosophila. Cell 78: 855–865.
40. Struhl G, Johnston P, Lawrence PA (1992) Control of Drosophila body pattern bythe Hunchback morphogen gradient. Cell 69: 237–249.
41. Wimmer EA, Carleton A, Harjes P, Turner T, Desplan C (2000) Bicoid-
independent formation of thoracic segments in Drosophila. Science 287:2476–2479.
42. Lehmann R, Nussleinvolhard C (1987) Hunchback, a gene required for
segmentation of an anterior and posterior region of the Drosophila embryo. Dev
Biol 119: 402–417.
43. Driever W, Thoma G, Nusslein-Volhard C (1989) Determination of spatialdomains of zygotic gene-expression in the Drosophila embryo by the affinity of
binding-sites for the Bicoid morphogen. Nature 340: 363–367.
44. Ma XG, Yuan D, Diepold K, Scarborough T, Ma J (1996) The Drosophilamorphogenetic protein Bicoid binds DNA cooperatively. Development 122:
1195–1206.
45. Lopes FJP, Vanario-Alonso CE, Bisch PM, Vieira FMC (2005) A kineticmechanism for Drosophila Bicoid cooperative binding. J Theor Biol 235:
185–198.
46. Lebrecht D, Foehr M, Smith E, Lopes FJP, Vanario-Alonso CE, et al. (2005)
Bicoid cooperative DNA binding is critical for embryonic patterning inDrosophila. Proc Natl Acad Sci U S A 102: 13176–13181.
47. Burz DS, Rivera-Pomar R, Jackle H, Hanes SD (1998) Cooperative DNA-
binding by Bicoid provides a mechanism for threshold-dependent geneactivation in the Drosophila embryo. EMBO J 17: 5998–6009.
48. Gregor T, Tank DW, Wieschaus EF, Bialek W (2007) Probing the limits to
positional information. Cell 130: 153–164.
49. Crauk O, Dostatni N (2005) Bicoid determines sharp and precise target geneexpression on the Drosophila embryo. Curr Biol 15: 1888–1898.
50. Houchmandzadeh B, Wieschaus E, Leibler S (2002) Establishment of
developmental precision and proportions in the early Drosophila embryo.Nature 415: 798–802.
51. Simpson-Brose M, Treisman J, Desplan C (1994) Synergy between the
Hunchback and Bicoid morphogens is required for anterior patterning in
Drosophila. Cell 78: 855–865.
52. Hulskamp M, Lukowitz W, Beermann A, Glaser G, Tautz D (1994) Differentialregulation of target genes by different alleles of the segmentation gene
Hunchback in Drosophila. Genetics 138: 125–134.
53. Schroder C, Tautz D, Seifert E, Jackle H (1988) Differential regulation of the 2transcripts from the Drosophila gap segmentation gene Hunchback. EMBO J 7:
2881–2887.
54. Burz DS, Hanes SD (2001) Isolation of mutations that disrupt cooperative DNAbinding by the Drosophila Bicoid protein. J Mol Biol 305: 219–230.
55. Horn F, Jackson R (1972) General mass action kinetics. Arch Ration Mech Anal
47: 81–116.
56. Li HY (1998) Zero eigenvalue analysis for the determination of multiple steadystates in reaction networks. Z Naturforsch [A] 53: 171–177.
Spatial Bistability in Drosophila
PLoS Computational Biology | www.ploscompbiol.org 13 September 2008 | Volume 4 | Issue 9 | e1000184

57. Li HY (1999) Determination of multiple steady states in an active membrane
transport model. Z Naturforsch [A] 54: 245–250.58. Li HY (1998) Determination of multiple steady states in a family of allosteric
models for glycolysis. J Chem Phys 109: 8485–8493.
59. Chuang GS, Chao AC, Ho PY, Li HY (2004) Computational multiple steadystates in enzymatically catalyzed oxidation of monophenols by tyrosinase in an
isothermal CFSTR. Biochem Eng J 21: 161–170.60. Lopes FJP (2002) Analise da Formacao de Padroes no Desenvolvimento da
Drosophila melanogaster atraves de Modelos de Redes Complexas [PhD thesis]. Rio
de Janeiro: Universidade Federal do Rio de Janeiro.61. Gregor T, Wieschaus EF, McGregor AP, Bialek W, Tank DW (2007) Stability
and nuclear dynamics of the bicoid morphogen gradient. Cell 130: 141–152.62. Isshiki T, Pearson B, Holbrook S, Doe CQ (2001) Drosophila neuroblasts
sequentially express transcription factors which specify the temporal identity oftheir neuronal progeny. Cell 106: 511–521.
63. Merrill PT, Sweeton D, Wieschaus E (1988) Requirements for autosomal gene
activity during precellular stages of Drosophila-melanogaster. Development 104:495–509.
64. Tautz D (1988) Regulation of the Drosophila segmentation gene Hunchback by 2maternal morphogenetic centers. Nature 332: 281–284.
65. Hulskamp M, Schroder C, Pfeifle C, Jackle H, Tautz D (1989) Posterior
segmentation of the drosophila embryo in the absence of a maternal posteriororganizer gene. Nature 338: 629–632.
66. Irish V, Lehmann R, Akam M (1989) The Drosophila posterior-group geneNanos functions by repressing Hunchback activity. Nature 338: 646–648.
67. Tautz D, Pfeifle C (1989) A non-radioactive in situ hybridization method for thelocalization of specific RNAs in Drosophila embryos reveals translational control
of the segmentation gene Hunchback. Chromosoma 98: 81–85.
68. Wang C, Lehmann R (1991) Nanos is the localized posterior determinant inDrosophila. Cell 66: 637–647.
69. Wharton RP, Struhl G (1991) RNA regulatory elements mediate control ofDrosophila body pattern by the posterior morphogen Nanos. Cell 67: 955–967.
70. Horn F (1972) Necessary and sufficient conditions for complex balancing in
chemical-kinetics. Arch Ration Mech Anal 49: 172–186.
71. Feinberg M (1987) Chemical-reaction network structure and the stability of
complex isothermal reactors. 1. The deficiency-zero and deficiency-onetheorems. Chem Eng Sci 42: 2229–2268.
72. Craciun G, Feinberg M (2005) Multiple equilibria in complex chemical reaction
networks: I. The injectivity property. SIAM J Appl Math 65: 1526–1546.73. Li HY, Ho PY (2000) Subnetwork analysis for the determination of multiple
steady states in complex reaction networks. Ind Eng Chem Res 39: 3291–3297.74. Lewis J, Slack JMW, Wolpert L (1977) Thresholds in development. J Theor Biol
65: 579–590.
75. Ingolia NT (2004) Topology and robustness in the Drosophila segment polaritynetwork. Plos Biol 2: e123. doi:10.1371/journal.pbio.0020123.
76. Janssens H (2005) A high-throughput method for quantifying gene expressiondata from early Drosophila embryos. Dev Genes Evol 215: 374–381.
77. Poustelnikova E, Pisarev A, Blagov M, Samsonova M, Reinitz J (2004) Adatabase for management of gene expression data in situ. Bioinformatics 20:
2212–2221.
78. Moodley K, Murrell H (2004) A colour-map plugin for the open source, Javabased, image processing package, ImageJ. Comput Geosci 30: 609–618.
79. Tsonis AA, Kumar P, Elsner JB, Tsonis PA (1996) Wavelet analysis of DNAsequences. Phys Rev E 53: 1828–1834.
80. Golyandina N, Nekrutkin VV, Zhigliavskiiı A (2001) Analysis of Time Series
Structure: SSA and Related Techniques. Boca Raton (Florida): Chapman &Hall/CRC.
81. Alexandrov T, Golyandina N, Spirov A (2008) Singular spectrum analysis ofgene expression profiles of early Drosophila embryo: exponential-in-distance
patterns. Res Lett Signal Process 2008: 5.82. Myasnikova E, Samsonova M, Kosman D, Reinitz J (2005) Removal of
background signal from in situ data on the expression of segmentation genes in
Drosophila. Dev Genes Evol 215: 320–326.83. Fuks DB, Tabachnikov S (2007) Mathematical Omnibus: Thirty Lectures on
Classic Mathematics. Providence (Rhode Island): American MathematicalSociety.
84. Goldbete A, Lefever R (1972) Dissipative structures for an allosteric model–
Application to glycolytic oscillations. Biophys J 12: 1302–1315.
Spatial Bistability in Drosophila
PLoS Computational Biology | www.ploscompbiol.org 14 September 2008 | Volume 4 | Issue 9 | e1000184