Long-term dynamics of a Mediterranean alkaline vernal pool (Rhone delta, southern France
Upload
irsp-ouidahCategory
view
3download
0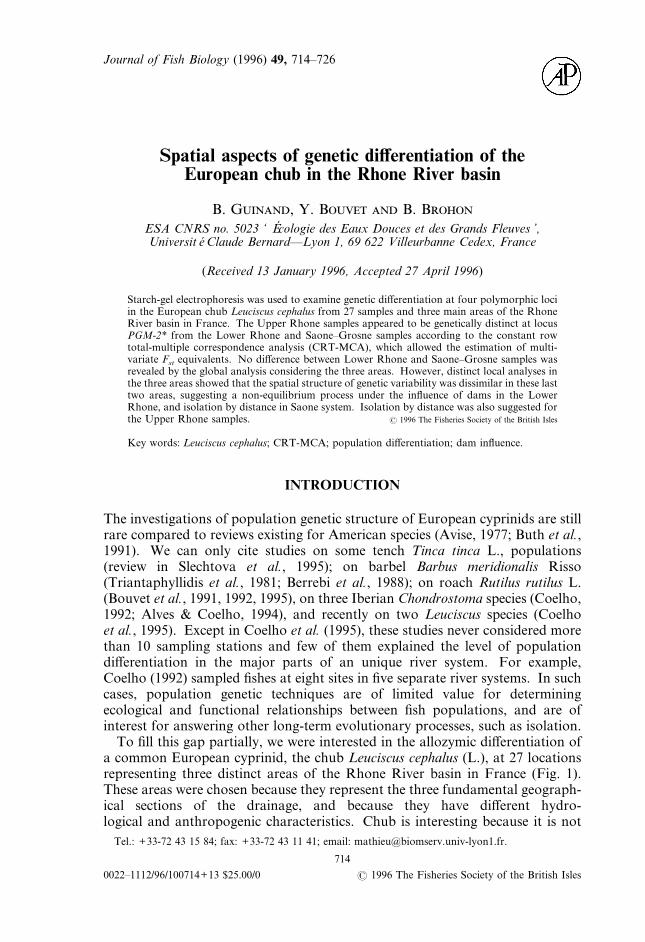
Journal of Fish Biology (1996) 49, 714–726
Spatial aspects of genetic differentiation of theEuropean chub in the Rhone River basin
B. G, Y. B B. B
ESA CNRS no. 5023 ‘ Écologie des Eaux Douces et des Grands Fleuves ’,Université Claude Bernard—Lyon 1, 69 622 Villeurbanne Cedex, France
(Received 13 January 1996, Accepted 27 April 1996)
Starch-gel electrophoresis was used to examine genetic differentiation at four polymorphic lociin the European chub Leuciscus cephalus from 27 samples and three main areas of the RhoneRiver basin in France. The Upper Rhone samples appeared to be genetically distinct at locusPGM-2* from the Lower Rhone and Saone–Grosne samples according to the constant rowtotal-multiple correspondence analysis (CRT-MCA), which allowed the estimation of multi-variate Fst equivalents. No difference between Lower Rhone and Saone–Grosne samples wasrevealed by the global analysis considering the three areas. However, distinct local analyses inthe three areas showed that the spatial structure of genetic variability was dissimilar in these lasttwo areas, suggesting a non-equilibrium process under the influence of dams in the LowerRhone, and isolation by distance in Saone system. Isolation by distance was also suggested forthe Upper Rhone samples. ? 1996 The Fisheries Society of the British Isles
Key words: Leuciscus cephalus; CRT-MCA; population differentiation; dam influence.
INTRODUCTION
The investigations of population genetic structure of European cyprinids are stillrare compared to reviews existing for American species (Avise, 1977; Buth et al.,1991). We can only cite studies on some tench Tinca tinca L., populations(review in Slechtova et al., 1995); on barbel Barbus meridionalis Risso(Triantaphyllidis et al., 1981; Berrebi et al., 1988); on roach Rutilus rutilus L.(Bouvet et al., 1991, 1992, 1995), on three Iberian Chondrostoma species (Coelho,1992; Alves & Coelho, 1994), and recently on two Leuciscus species (Coelhoet al., 1995). Except in Coelho et al. (1995), these studies never considered morethan 10 sampling stations and few of them explained the level of populationdifferentiation in the major parts of an unique river system. For example,Coelho (1992) sampled fishes at eight sites in five separate river systems. In suchcases, population genetic techniques are of limited value for determiningecological and functional relationships between fish populations, and are ofinterest for answering other long-term evolutionary processes, such as isolation.To fill this gap partially, we were interested in the allozymic differentiation of
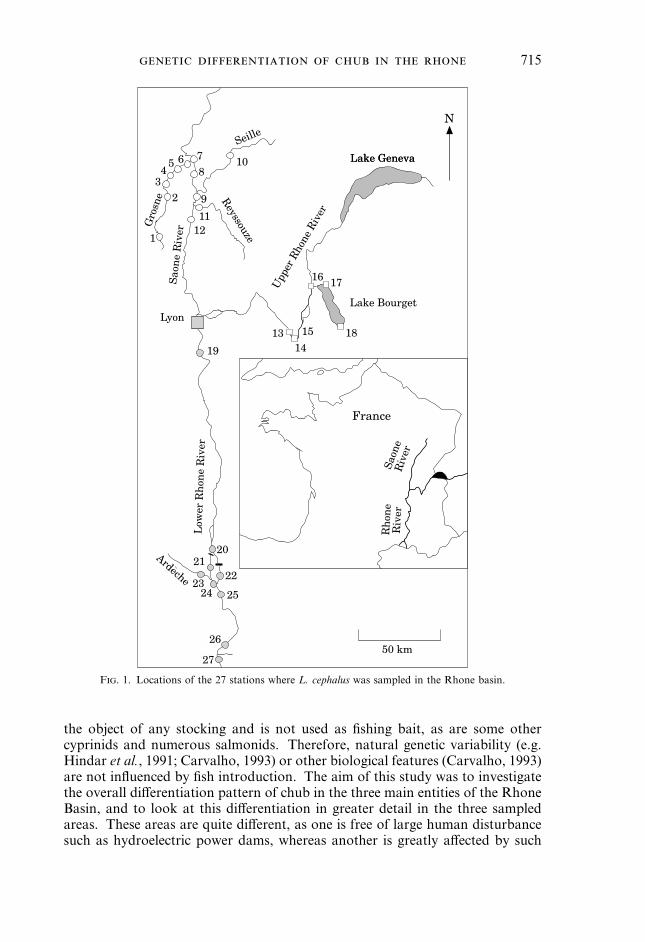
a common European cyprinid, the chub Leuciscus cephalus (L.), at 27 locationsrepresenting three distinct areas of the Rhone River basin in France (Fig. 1).These areas were chosen because they represent the three fundamental geograph-ical sections of the drainage, and because they have different hydro-logical and anthropogenic characteristics. Chub is interesting because it is notTel.: +33-72 43 15 84; fax: +33-72 43 11 41; email: [email protected].
714
0022–1112/96/100714+13 $25.00/0 ? 1996 The Fisheries Society of the British Isles
the object of any stocking and is not used as fishing bait, as are some othercyprinids and numerous salmonids. Therefore, natural genetic variability (e.g.Hindar et al., 1991; Carvalho, 1993) or other biological features (Carvalho, 1993)are not influenced by fish introduction. The aim of this study was to investigatethe overall differentiation pattern of chub in the three main entities of the RhoneBasin, and to look at this differentiation in greater detail in the three sampledareas. These areas are quite different, as one is free of large human disturbancesuch as hydroelectric power dams, whereas another is greatly affected by such
Lake Geneva
Lake Bourget
France
Lyon
Upp
er R
hone
Riv
er
1
234
5 6 78
9
10
1112
1314
15
16 17
18
19
20
2223
24 25
26
27
Low
er R
hon
e R
iver
Rh
one
Riv
erSa
one
Riv
er
Lake Geneva
SeilleG
rosn
eS
aone
Riv
er
Reyssouze
21
50 km
N
Ardeche
F. 1. Locations of the 27 stations where L. cephalus was sampled in the Rhone basin.
715

dams, which may be expected to have an influence on fish movement and geneticdifferentiation. The third area—Upper Rhone—concerned large lake and riverpopulations.
MATERIALS AND METHODS
SAMPLINGSamples were collected by electrofishing or gillnets at 27 sites in the Rhone River basin
(Table I, Fig. 1). These sites belong to three main regions of this basin, which meetapproximately in the city of Lyon. The first region includes four rivers (Saone, Grosne,Seille and Reyssouze; Fig. 1, locations 1–12). These rivers, especially the Grosne, can beconsidered as the chub’s reference habitat because the populations suffer only slightlyfrom human disturbance. In particular, this region is free of dams. The Grosne is a smalltributary; but, with a mean discharge of 400 m3 s"1, the Saone is a large, thoughslow-flowing, river. These main characteristics are listed in Tachet et al. (1988) (Table II).The fish community of the Saone basin is rich and relatively distinct from that of the
T I. Number of fish samples per station (n) and allele frequencies (%) at the fourpolymorphic loci
Stationnumber n
PGM-2* IDHP-1* EST-2* G3PDH*
90 98 100 100 145 98 100 85 100
1 30 1·7 15 83·3 100 0 30 70 21·7 78·32 30 8·3 21·6 70·1 100 0 30 70 16·7 83·33 28 10·7 17·9 71·4 98·2 1·8 25 75 17·9 82·14 30 6·7 20 73·3 100 0 46·7 52·3 21·7 78·35 29 10·3 19 70·7 100 0 36·2 63·8 10·3 89·76 26 17·9 12·5 69·6 98·1 1·9 25 75 15·4 84·67 30 21·6 20 58·4 98·3 1·7 21·7 78·3 10 908 26 25 11·5 63·5 100 0 30·8 69·2 3·8 96·29 20 17·5 5 77·5 97·5 2·5 25 75 5 9510 21 28·2 0 71·8 97·6 2·4 31 69 11·9 88·111 13 15·4 3·8 80·8 96·2 3·8 30·8 69·2 15·4 84·612 24 12·5 10·4 77·1 97·9 2·1 35·4 64·6 10·4 89·613 30 3·3 71·6 25·1 80 20 31·7 68·3 16·7 83·314 30 3·3 60 36·7 75 25 30 70 8·3 91·715 25 4 62 34 74 26 46 54 14 8616 42 0 69 31 69 31 36·9 62·1 11·9 88·117 67 0·3 65·9 33·8 74·7 25·3 49·4 50·6 10·4 89·618 28 0 53·6 46·4 58·9 41·1 32·1 67·9 3·6 96·419 35 12·9 34·3 52·8 87·1 12·9 28·6 71·4 8·6 91·420 30 15 13·3 71·7 95 5 26·7 73·3 5 9521 29 13·8 10·3 75·9 96·6 3·4 24·1 75·9 12·1 87·922 34 17·6 5·9 76·5 94·1 5·9 25 75 16·2 83·823 28 12·5 8·9 78·6 89·3 10·7 33·9 66·1 5·4 94·624 22 11·4 13·6 75 88·6 11·4 38·6 61·4 6·8 93·225 26 13·5 1 85·5 82·3 17·7 30·8 69·2 11·5 88·526 34 8·8 10·3 80·9 91·2 8·8 33·8 66·2 10·3 89·727 34 5·9 11·8 82·3 94·1 5·9 35·3 64·7 7·4 92·6
801 specimens were analysed (mean number of fish&..=29·67&1·79).Station number refers to the locations given in Fig. 1.
716 . .

other areas of the French Rhone basin, primarily owing to its status as a refuge forcyprinids during glaciations (Changeux & Pont, 1995a,b). The second region includes thecourse of the French Upper Rhone, a swiftly flowing river, and Lake Bourget (Fig. 1,locations 13–18; Table II). The third region includes the Lower Rhone and a station onthe lower course of the River Ardèche (Fig. 1, locations 20–27; Table II). Thelongitudinal profile and the hydrology of the Lower Rhone are described in Fruget(1992). The Upper and Lower Rhone Rivers are affected by power dams (Fig. 1) builtbetween 1948 and 1981 (list in Pattee, 1988; see also Fruget, 1992). However, the damsin the part of the Upper Rhone that we investigated were erected only after 1981(influencing at most five or six chub generations), whereas those in the Lower Rhone areolder (the dam located upstream from the Ardèche confluence was completed in 1952).An additional and intermediate station between the three entities was sampled near thecity of Lyon (Fig. 1, location 19).All stations were sampled between November and December 1993. This short winter
period was chosen to eliminate temporal differences among allele frequencies at a singlelocation. Winter sampling excluded possible reproductive movements of the sampledindividuals.
ELECTROPHORECTIC PROCEDUREAt each site fish were killed immediately and humanely, and frozen in liquid nitrogen.
They were brought to the laboratory where they were dissected on ice to obtain aqueousextracts of liver and skeletal muscle. The extracts were homogenized and centrifuged,then placed into individually labelled Eppendorf tubes and stored at "80) C.To assay genetic variation in chub, we used horizontal 12·5% starch–gel
electrophoresis. We examined 28 putative loci coding for 17 supernatant enzymes.Following the nomenclature of Shaklee et al. (1990), loci AAT-1*, AAT-2*, FH*,IDHP-2*, IDHP-3*, LDH-3*, MDH-3*, MPI*, PGDH*, PGM-1*, PGM-2*, SOD*,XDH* gave acceptable electrophorectic resolution in liver, whereas loci AK*, CK*,EST-1*, EST-2*, G3PDH*, GPI-1*, GPI-2*, IDDH*, IDHP-1*, LDH-1*, LDH-2*,MDH-1*,MDH-2*,ME-1* andME-2* gave acceptable resolution in the skeletal muscle.The loci noted in bold characters were analysed with amine-citrate (pH=6·2) bufferaccording to Clayton & Tretiak (1972). Underlined characters indicate that lociwere analysed with tris-citrate (pH=8) buffer; the remaining loci were analysed withtris-phosphate (pH=7·4) buffer [both according to Pasteur et al. (1987)].
DATA ANALYSISPopulation differentiation between the 27 samples was investigated by constant row
total-multiple correspondence analysis (CRT-MCA) developed for population geneticsby Guinand (1996), and for ecology by Chévenet et al. (1994). At the end of the analysissensu stricto, each of the t populations is represented by a vector x=(x1, x2, . . ., xt) wherex are the factorial scores with mean equal to 0 and variance equal to var(x). We do notdetail the analysis here; it provides factorial co-ordinates like other multivariate tech-niques, as summarized in Escoufier (1987), Dolédec & Chessel (1991) and Chévenet et al.
T II. Some characteristics of the river sections
Meandischarge(m3 s"1)
Approximatewidth(m)
Meandecline(‰)
Approximatecurrent velocity
(m s"1)
Grosne ~10 ~15 0·5 0–1Saone 400 300 0·04 0–0·5Upper Rhone 360 60 0·5 0–2Lower Rhone 1600 350 0·3* 0–1
*Natural state, but 10 times less between the dams.
717

(1994). However, two important features must be presented. The first is that CRT-MCAemphasizes the correlation ratios to be maximized for each polymorphic locus on eachfactorial axis, as does MCA [multiple correspondence analysis, an analysis dealing withqualitative variables (loci) having categorical states (alleles); see Dolédec & Chessel,1991]. In population genetics, as was first shown by Cockerham (1969), the correlationratio is equivalent to an Fst per locus. In CRT-MCA, this correlation ratio çj canbe written for a given locus as the ratio between the variance varj of the j alleles at thislocus and total variance:
çj =varj (1)var (x)
For a given locus, classically, population geneticists write:
Fst =ó2ps (2)
ps(1"ps)
where ó2psis the variance of allele frequencies (p) at any given locus calculated for s
subpopulations, and ps (1"ps) is the limiting variance found when all subsamples arefixed for one or the other allele. So, ó2ps is strictly equivalent to varj [equation (1)]. Inequation (1), var (x) is not equal to ps (1"ps) [equation (2)] because CRT-MCA does notprovide an equivalent of the limiting variance. However, var (x) is the best expression ofthis quantity because var (x) is maximized by multivariate methods dealing with MCA(Tenenhaus & Young, 1985). So çj [equation (1)] is equivalent to Fst per locus.In CRT-MCA, and in any approach of multiple correspondence analysis (Tenenhaus
& Young, 1985), the eigenvalue ë(x) of the xth ordination axis is the arithmetic mean ofcorrelation ratios ç
jestablished for the í polymorphic loci analysed:
ë(x) =1
Gí
j=1çj (3)
í
As noted above, çj being maximized, any eigenvalue ë(x) is maximized and is the meanof the Fst per locus. So, in CRT-MCA, the eigenvalues are equivalent to mean Fst, andcorrelation ratios are equivalent to Fst per locus. Thus:(1) For each ordination axis, the structuring locus(i) associated with this axis can be
identified directly: it is the locus with the highest correlation ratio on a given axis.(2) Each ordination axis is associated with a given level of population differentiation.
The first axis, which provides the largest eigenvalue, represents the major differenti-ation pattern, and the other axes express the successive levels of populationdifferentiation in the order of their importance. Thus, the possible levels ofgeographic structure of the populations can be assessed.
(3) The factorial co-ordinates of CRT-MCA are synthetic codes to investigate andillustrate graphically in a factorial plane or in geographic space the possibledifferences between populations. Such representations are useful because theyrepresent, by reduction of the genetical data space, the relative differentiation of eachpopulation with reference to the others. Such multivariate methods also make theinvestigation of genetic data sets possible without reference to any preliminarypooling strategies as is the case in hierarchical F-statistics (see Heywood, 1991).The CRT-MCA is a complement to Long’s (1986) multivariate analysis of variance
(MANOVA). In Long’s approach, Fst is defined as the trace of a data matrix, this beingby definition the sum of its eigenvalues. Hence, with CRT-MCA we have access to thedifferent eigenvalues/mean Fst (see above) and we can separate the information containedin the data set from the ‘ noise ’ of the data, i.e. sampling error.The use of CRT-MCA is a choice. As stated by Hartl & Clark (1989) about Long’s
approach, sensitivity to sampling error and the definition of clear unbiased estimatesremain to be investigated for CRT-MCA, but we believe that the advantages noted above
718 . .

are substantial in expressing the spatial information of any data set. In this paper,CRT-MCA has been applied twice: first to analyse population differentiation within thewhole Rhone Basin; then considering these first results, to investigate populationdifferentiation in each of the three areas.CRT-MCA analysis and graphical display were performed with a procedure of the
ADE-4 software developed by Thioulouse et al. (1995).
RESULTS
CRT-MCA RESULTS
CRT-MCA was performed first over the whole basin on the data matrixcontaining the 27 populations by four polymorphic loci. The first two axes of themultivariate analysis accounted for 88·5% of total variability (Fig. 2). The locusshowing the greatest amount of differentiation, PGM-2*, was associated with thefirst factorial axis. No locus showed a significant Fst value on the secondfactorial axis of the global analysis (Table III).More information on spatial patterns of differentiation was provided by the
representation of the 27 samples on the major factor map (Fig. 2) or ingeographic space (Fig. 3). In these two representations, the Upper Rhone
0.3
–0.3–0.38 0.7
19
0.1
0
F2
F1
13
17
15
14 16
λ1 = 79.8%
λ2 = 8.7%12
1
3
4
5
6
10
11 12
20
2122
23
24
8
2627
7
9
25
Other regions
18
UpperRhone
?
F. 2. Plot of the 27 samples on the factor map formed by the first two factorial axes (F1, F2) of theCRT-MCA. The eigenvalues (ë) associated with these axes and the percentages of variabilityexplained (%) are given in the rectangle. The ellipses indicate the main clusters pointed out bythe analysis. Bold arrows illustrate the transitional position of the 19th sample, and narrowarrows illustrate a possible gradient along the second axis of the CRT-MCA in the Saone–Grosnesamples with the exception of sample no. 4 (?). Samples are labelled by circles or squares accordingto Fig. 1.
719
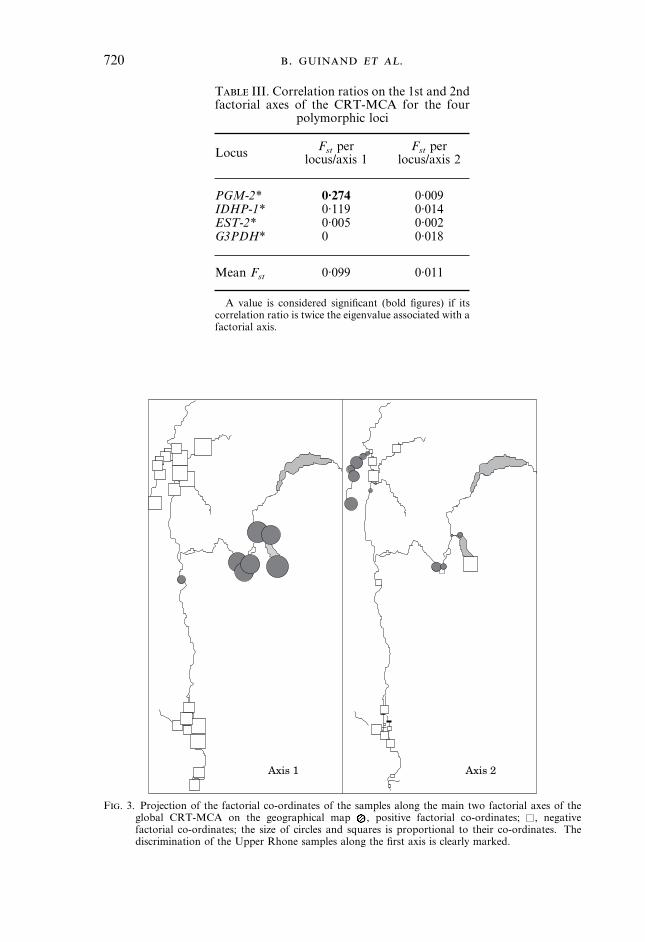
T III. Correlation ratios on the 1st and 2ndfactorial axes of the CRT-MCA for the four
polymorphic loci
Locus Fst perlocus/axis 1
Fst perlocus/axis 2
PGM-2* 0·274 0·009IDHP-1* 0·119 0·014EST-2* 0·005 0·002G3PDH* 0 0·018
Mean Fst 0·099 0·011
A value is considered significant (bold figures) if itscorrelation ratio is twice the eigenvalue associated with afactorial axis.
Axis 2Axis 1
F. 3. Projection of the factorial co-ordinates of the samples along the main two factorial axes of theglobal CRT-MCA on the geographical map , positive factorial co-ordinates; , negativefactorial co-ordinates; the size of circles and squares is proportional to their co-ordinates. Thediscrimination of the Upper Rhone samples along the first axis is clearly marked.
720 . .
samples (Fig. 2,.) are clearly distinct from the others. Saone and Lower Rhoneregions are homogeneous according to their factorial co-ordinates on the firstaxis (see also Fig. 3, axis 1). One Lake Bourget sample (Fig. 2, sample 18)appears distinct from the other Upper Rhone samples on the factorial plane.The remaining samples appear substantially mixed on the factorial plane and nodiscrimination is evident between them (Fig. 2). However, GrosneRiver samples 1–8 rank along a gradient according to the second factorial axis(Fig. 2, arrows) with the exception of sample 4 (question mark), whereas theLower Rhone samples (Fig. 2,,; see also Fig. 3, axis 2) show no trend along anyaxis. The position of population 19 in this factorial plane (Fig. 2, -) isinteresting as it is intermediate between the Grosne–Saone/Lower Rhone popu-lations and the Upper Rhone population. This indicates that, despite thesimilarity of their location on the left of the factor map in Fig. 2, the popu-lations of the Saone–Grosne and Lower Rhone entities do not belong to onepanmictic unit.To investigate population differentiation within the three geographic groups,
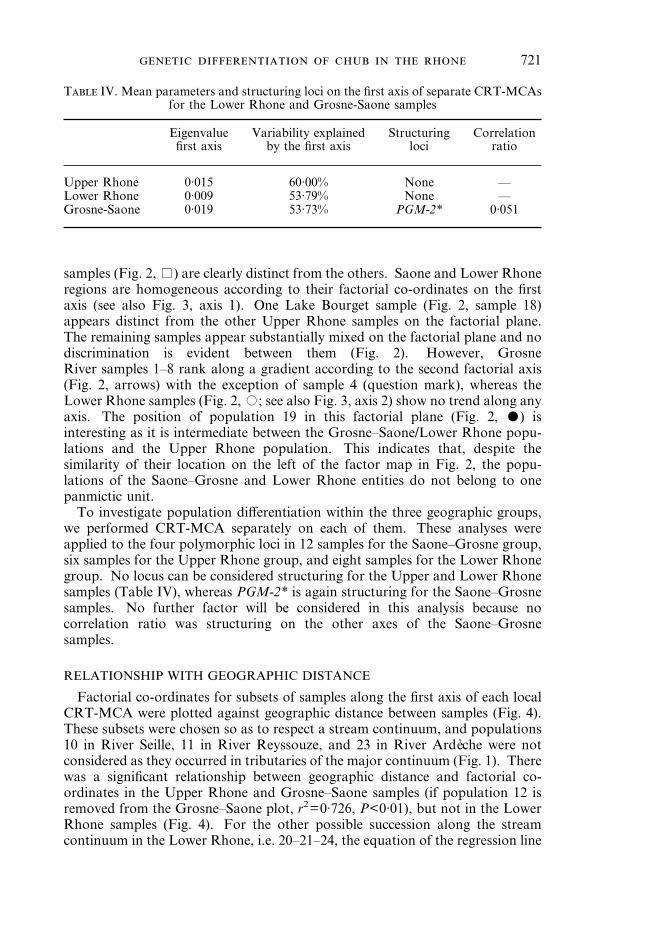
we performed CRT-MCA separately on each of them. These analyses wereapplied to the four polymorphic loci in 12 samples for the Saone–Grosne group,six samples for the Upper Rhone group, and eight samples for the Lower Rhonegroup. No locus can be considered structuring for the Upper and Lower Rhonesamples (Table IV), whereas PGM-2* is again structuring for the Saone–Grosnesamples. No further factor will be considered in this analysis because nocorrelation ratio was structuring on the other axes of the Saone–Grosnesamples.
RELATIONSHIP WITH GEOGRAPHIC DISTANCE
Factorial co-ordinates for subsets of samples along the first axis of each localCRT-MCA were plotted against geographic distance between samples (Fig. 4).These subsets were chosen so as to respect a stream continuum, and populations10 in River Seille, 11 in River Reyssouze, and 23 in River Ardèche were notconsidered as they occurred in tributaries of the major continuum (Fig. 1). Therewas a significant relationship between geographic distance and factorial co-ordinates in the Upper Rhone and Grosne–Saone samples (if population 12 isremoved from the Grosne–Saone plot, r2=0·726, P<0·01), but not in the LowerRhone samples (Fig. 4). For the other possible succession along the streamcontinuum in the Lower Rhone, i.e. 20–21–24, the equation of the regression line
T IV. Mean parameters and structuring loci on the first axis of separate CRT-MCAsfor the Lower Rhone and Grosne-Saone samples
Eigenvaluefirst axis
Variability explainedby the first axis
Structuringloci
Correlationratio
Upper Rhone 0·015 60·00% None —Lower Rhone 0·009 53·79% None —Grosne-Saone 0·019 53·73% PGM-2* 0·051
721

was: y=0·001x"0·019, with r2=0·122, for the slope of which the t-test wasalso non-significant. Therefore, there was no significant relationship betweendistance and first axis factorial co-ordinates in the Lower Rhone.If isolation by distance was suggested in Upper Rhone samples (Fig. 4), the
t-test result was close to the level of significance, and samples were distributed instream and lake habitats (Fig. 1), in stepping-stone-like and island-like modelhabitats, respectively. This result will not be discussed.
Geographical distance (km)60
0.15
–0.2–10
1st
axis
fac
tori
al c
o-or
din
ates
50
–0.1
0.1
0.05
0
–0.05
–0.15
10 20 30 40
y = 0.0016 x – 0.041, r2 = 0.114, N.S.
Lower Rhone
0
20
22
25
26
27
24
60
0.25
–0.2–10
1st
axis
fac
tori
al c
o-or
din
ates
50
–0.1
0.1
0.05
0
–0.05
–0.15
10 20 30 40
y = 0.005 x – 0.112, r2 = 0.662, P < 0.05
Upper Rhone
0
13
14
17
18
16
15
0.15
0.2
100
0.2
–0.25–10
1st
axis
fac
tori
al c
o-or
din
ates
90
–0.1
0.1
0.05
0
–0.05
–0.15
10 20 30 80
y = 0.0034 x – 0.161, r2 = 047, P < 0.05
Grosne-Saone
0
1
3
6 12
5
2
0.15
–0.25
–0.2
40 50 60 70
7
8 9
4
F. 4. Plots of the first factorial co-ordinates v. geographical distance between successive samples in eachregion. The regression line is drawn. Its equation and the t-test of its slope are given in each case.N.S. not significant.
722 . .

DISCUSSION
The Upper Rhone chub were genetically different from other samples at locusPGM-2*, as shown by Fst (Fig. 3 and Table III). For chub, as for roach inBouvet et al. (1995), no straightforward explanation of the genetic individualityof the Upper Rhone samples emerged. Two explanations are possible: restrictedmigrations between the Upper Rhone and the other parts of the basin, andselective factors.Because the eigenvalues are equivalent to Fst, Guinand (1996) proposed that
the equation for the estimate of gene flow (Nm):
Nm~0·25((1/Fst)"1)
be replaced by:
Nm~0·25((1/ë)"1),
where ë is the eigenvalue. The expression linking gene flow to Fst is theoreticallyvalid under certain conditions (island model, population equilibrium, . . .) (e.g.Slatkin & Barton, 1989; Cockerham & Weir, 1993). However, classically, it isused to obtain at least a gene flow estimate.Table I shows that ë=0·099 for the sole structuring axis of the CRT-MCA that
separates the stations of the Upper Rhone from the others (Fig. 3). In this case,the estimation of Nm is about 2·3 individuals exchanged per generation, which ishigher than the classical value of 1 currently estimated for effective gene flow:thus restricted gene flow does not seem sufficient to explain the differentiationbetween the Upper Rhone and the other parts of the basin. Because of samplinguncertainty, Trexler (1988) proposed that an estimated gene flow of 1–4individuals exchanged per generation indicated an intermediate case betweenstrong isolation (Nm<1) and panmixia (Nm>4). Our estimation falls within thisrange. Note that ë=0·099 represents only 80% of the total differentiationoccurring between samples (Fig. 2); if total differentiation (100%) is taken intoaccount in the same way, Nm~1·85 individuals exchanged per generation. Thisdoes not change the conclusion about the role of gene flow.Environmental selective factors (hydrology, temperature, etc.) may be respon-
sible for this slight differentiation. Zhivotovsky & Feldman (1993) proposedanalytical solutions to detect and clarify the role of slight selection pressures inpopulation differentiation, but it is very difficult to apply them on observed dataand to draw conclusions (Zhivotovsky et al., 1994, for an illustration). Carvalho(1993) stressed the need to consider not only gene (allelic) diversity and otherindices, but also the genotypic variance associated with ecologically significanttraits, to assess the role of some selective factors in fish adaptation.In contrast with the Upper Rhone, the other two spatial areas were not well
discriminated by CRT-MCA. This result is important because, as noted above,the Saone, Grosne and other rivers in this area may be considered as a naturalhabitat for chub in the Rhone Basin. It may be postulated that the chub fromthe Lower Rhone have a closer (historical, functional, etc.) relationship with theSaone group and that the individuals examined might be recent colonizers of theLower Rhone. No estimation of gene flow is possible because the stations arethoroughly mixed in the factorial plane (Fig. 3). The Lower Rhone pattern of
723

genetic differentiation in chub suggests a functioning based on a colonization/extinction mechanism such as that of a metapopulation system (Ryman, 1983;Ferguson, 1989). Based on several unpublished reports, Pattee (1988) stressedthe instability of the local stocks and the occasional replacement of unhealthyby healthy populations, mainly after floods. Recently, Carrel et al. (1995),summarizing 10 years of investigations on the Lower Rhone fish community,have shown that the number of L. cephalus in cpue (catch per unit effort) variedby a factor of 1–6 from year to year. Such results also suggest unbalancedfunctioning of the populations.In the approach developed here, it is not Fst per se, the amount of differen-
tiation, that is most interesting, but the spatial expression of Fst through thefactorial co-ordinates of separate CRT-MCAs (Fig. 5). In the Saone–Grosnesamples, locus PGM-2* is spatially structured along the stream continuum: thefirst factorial CRT-MCA co-ordinates are related to the distance between thesepopulations (Fig. 5). Such a representation suggests that the genetic structure ofchub populations in this area agrees well with a mechanism of isolation bydistance (e.g. Kimura & Weiss, 1964). Such a relationship is not shown (Fig. 5)in the samples of the Lower Rhone where dams have been present for 40 years.The fact that the Lower Rhone samples do not show the same differentiationpatterns as those in the undisturbed habitat of the Saone catchment may havetwo, possibly simultaneous, explanations. First, a difference in discharge andwetted section, and hence in volume of the waterbodies, as mentioned inTable II. Indeed, longitudinal gene flow may be expected to be greater in a wideriver than in a narrow one like the Grosne, in which correlation with distancedoes prevail. However, owing to its discharge and slow velocity, the Saone isalso a broad river. The other explanation is that hydroelectric schemes mayaffect the integrity of genetic structure and may have more influence on thespatial genetic structure of chub populations than on the amount of differenti-ation itself, which is lower in the Lower Rhone than in the Saone–Grosne system(Table IV).A colonization/extinction mode of functioning could be assessed by investi-
gating temporal variability of allele frequencies in these locations (e.g. Waples,1989). It is evident that future studies must take into account such consider-ations in order to estimate gene flow and also take into account the demographicparameters of the populations (e.g. Whitlock, 1992). Note, however, thatgenetic differentiation is often considered to be greater in a non-equilibriummetapopulation system than in an equilibrium system such as a stepping-stonemodel (e.g. Wade & McCauley, 1988). This is not really the case for chub.At present, the debate on the integrity of ecological structure in streams
neglects totally the population genetics approach (e.g. Angermeier & Karr,1994). For instance, Johnson et al.’s (1995) concepts in large river ecologyshould also be completed by the consideration of genetic structures andpopulation functioning, as investigated here in assessing the role of dams.
This study was supported by grant EV5VCT920097 from the European Commission.Many thanks to E. Pattee, J. Mathieu, P. Gaudin, L. Hill, M. Bobin and P. Leroy forco-operation at different stages of this research, to P. Berrebi who discussedelectrophoresis, and to P. Leberg and one anonymous referee.
724 . .

References
Alves, M. J. & Coelho, M. M. (1994). Genetic variation and population subdivision ofthe endangered Iberian cyprinid Chondrostoma lusitanicum. Journal of FishBiology 44, 627–636.
Angermeier, P. L. & Karr, J. R. (1994). Biological integrity versus biological diversity aspolicy directives: protecting biotic resources. BioScience 44, 690–697.
Avise, J. C. (1977). Genic heterozygosity and rate of speciation. Paleobiology 3,422–432.
Berrebi, P., Lamy G., Cattaneo-Berrebi G. & Renno, J.-F. (1988). Variabilité génétiquede Barbus meridionalis Risso (Cyprinidae): une espèce quasi monomorphe.Bulletin Français de la Pêche et de la Pisciculture 310, 77–84.
Bouvet, Y., Bobin, M., Maslin, J. L. & Pattee, E. (1995). The genetic structure of roachpopulations in two contrasted large rivers. Hydrobiologia 303, 229–234.
Bouvet, Y., Pattee, E. & Maslin, J. L. (1992). Comparaison de la variabilité génétique dedeux espèces de poissons, l’ombre commun et le gardon dans un fleuve aménagé.Bulletin Français de la Pêche et de la Pisciculture 324, 26–35.
Bouvet, Y., Soewardi, K. & Pattee, E. (1991). The discrimination of roach Rutilus rutilus(Linnaeus, 1758) populations in different parts of a river system. An investigationusing biochemical markers. Hydrobiologia 209, 161–167.
Buth, D. G., Dowling, T. E. & Gold, J. R. (1991). Molecular and cytologicalinvestigations. In Cyprinid Fishes. Systematics, Biology and Exploitation(Winfield, I. J. & Nelson, J. S., eds), pp. 83–126. Fish and Fisheries Series.London: Chapman & Hall.
Carrel, G., Pont, D. & Rivier, B. (1995). Variabilité temporelle des peuplementspiscicoles dans la section médiane du Bas-Rhône. Bulletin Français de la Pêche etde la Pisciculture 337–339, 101–111.
Carvalho, G. R. (1993). Evolutionary aspects of fish distribution: genetic variability andadaptation. Journal of Fish Biology 43 (Suppl. A), 53–73.
Changeux, T. & Pont, D. (1995a). Ichtyogeographic regions and watershed size in theFrench river Rhône network. Hydrobiologia 300/301, 355–363.
Changeux, T. & Pont, D. (1995b). Current status of the riverine fishes of the FrenchMediterranean basin. Biological Conservation 72, 137–158.
Chévenet, F., Dolédec, S. & Chessel, D. (1994). A fuzzy coding approach for the analysisof long-term ecological data. Freshwater Biology 31, 295–309.
Clayton, J. W. & Tretiak, D. N. (1972). Amine-citrate buffers for pH control in starchgel electrophoresis. Journal of Fisheries and Research Board of Canada 29,1169–1172.
Cockerham, C. C. (1969). Variance of gene frequencies. Evolution 23, 72–84.Cockerham, C. C. & Weir, B. S. (1993). Estimation of gene flow from F-statistics.
Evolution 47, 855–863.Coelho, M. M. (1992). Genetic differentiation of the Iberian cyprinids Chondrostoma
polylepis Steind., 1865 and Ch. willkommii Steind., 1866. Archiv für Hydrobiologie125, 487–498.
Coelho, M. M., Brito, R. M., Pacheco, T. R., Figueiredo, D. & Pires, A. M. (1995).Genetic variation and divergence of Leuciscus pyrenaicus and L. carolitertii (Pisces,Cyprinidae). Journal of Fish Biology 47 (Suppl. A), 243–258.
Dolédec, S. & Chessel, D. (1991). Recent developments in linear ordination methods forenvironmental sciences. Advances in Ecology 1, 133–155.
Escoufier, Y. (1987). The duality diagram: a means for better practical applications.In Developments in Numerical Ecology (Legendre, P. & Legendre, L., eds),pp. 139–156. Berlin: Springer-Verlag.
Ferguson, A. (1989). Genetic differences among brown trout, Salmo trutta, stocks andtheir importance for the conservation and management of the species. FreshwaterBiology 21, 35–46.
Fruget, J. F. (1992). Ecology of the Lower Rhône after 200 years of human influence. areview. Regulated Rivers: Research and Management 7, 233–246.
725
Guinand, B. (1996). Use of a multivariate model using allele frequency distributions toanalyse patterns of genetic differentiation. Biological Journal of the LinneanSociety 58, 173–195.
Hartl, D. L. & Clark, A. G. (1989). Principles of population genetics. 2nd edn.Sunderland, MA: Sinauer.
Heywood, J. S. (1991). Spatial analysis of genetic variation in plant populations. AnnualReview of Ecology and Systematics 22, 335–355.
Hindar, K., Ryman, N. & Utter, F. (1991). Genetic effects of cultured fish on naturalpopulations. Canadian Journal of Fisheries and Aquatic Sciences 48, 945–957.
Johnson, B. L., Richardson, W. B. & Naimo, T. J. (1995). Past, present, and futureconcepts in large river ecology. BioScience 45, 134–141.
Kimura, M. & Weiss, G. H. (1964). The stepping stone model of population structureand the decrease of correlation with distance. Genetics 49, 561–576.
Long, J. C. (1986). The allelic correlation structure of Gainj- and Kalam-speakingpeople. I. The estimation and interpretation of F-statistics. Genetics 112, 629–647.
Pasteur, N., Pasteur, G., Bonhomme, F., Catalan, J. & Britton-Davidian, J. (1987).Manuel technique de génétique par électrophorèse de protéines. Tec. & Doc. Paris:Lavoisier.
Pattee, E. (1988). Fish and their environment in large European river ecosystems. TheRhone. Revue des Sciences de l’Eau 7, 35–74.
Ryman, N. (1983). Patterns of distribution of biochemical genetic variation in salmonids:differences between species. Aquaculture 33, 1–21.
Shaklee, J. B., Allendorf, F. W., Morizot, D. C. & Whitt, G. S. (1990). Genenomenclature for protein-coding loci in fish. Transactions of the AmericanFisheries Society 119, 2–15.
Slatkin, M. & Barton, N. (1989). A comparison of three indirect methods for estimatingaverage level of gene flow. Evolution 43, 1349–1368.
Slechtova, V., Slechta, V. & Valenta, M. (1995). Genetic protein variability in tench(Tinca tinca L.) stocks in Czech Republic. Polskie Archiwum Hydrobiologii 42,133–140.
Tachet, H., Gaschignard-Fossati, O., Cellot, B. & Berly, A. (1988). Le macrobenthos dela Saône. Annales de Limnologie 24, 83–100.
Tenenhaus, M. & Young, F. W. (1985). An analysis and synthesis of multiplecorrespondence analysis, optimal scaling, homogeneity analysis and other methodsfor quantifying categorical multivariate data. Psychometrika 50, 91–119.
Thioulouse, J., Dolédec, S., Chessel, D. & Olivier, J. M. (1995). ADE software:multivariate analysis and graphical display of environmental data. In Software perl’Ambiente (Guariso, G. & Rizzola, A., eds), pp. 57–62. Bologna, Italy: PàtronEditore.
Trexler, J. C. (1988). Hierarchical organization of genetic variation in the sailfin molly,Poecilia latipinna (Pisces: Poecilidae). Evolution 42, 1006–1017.
Triantaphyllidis, C. D., Damianakis, H., Economidis, P. S. & Karakousis, J. (1981).Genetic variation in Greek barbel populations. I. Esterases, Ldh, Mdh, Me andPgm in Barbus meridionalis (Pisces, Cyprinidae). Comparative Biochemistry andPhysiology 70, 278–293.
Wade, M. J. & McCauley, D. E. (1988). Extinction and recolonization: their effects onthe genetic differentiation of local populations. Evolution 42, 995–1005.
Waples, R. S. (1989). A generalized approach for estimating effective population sizefrom temporal changes in allele frequency. Genetics 121, 379–391.
Whitlock, M. C. (1992). Temporal fluctuations in demographic parameters and thegenetic variance among populations. Evolution 46, 608–615.
Zhivotovsky, L. A. & Feldman, M. W. (1993). Heterogeneous selection in subdividedpopulations. Journal of Mathematical Biology 31, 747–759.
Zhivotovsky, L. A., Gharrett, A. J., McGregor, A. J., Glubokovsky, M. K. & Feldman,M. W. (1994). Gene differentiation in Pacific salmon (Oncorhynchus sp.): facts andmodels with reference to pink salmon (O. gorbuscha). Canadian Journal ofFisheries and Aquatic Sciences 51 (Suppl. 1), 223–232.
726 . .
Copyright © 2022 FDOKUMEN