Building Consumer-Oriented CSR Differentiation Strategy
14
sustainability Article Building Consumer-Oriented CSR Differentiation Strategy Jinhua Li 1 , Fang Zhang 2 and Shiwei Sun 3,4, * 1 Scientific Laboratory of Economic Behaviors, School of Economics & Management, South China Normal University, Guangzhou 510006, China; [email protected] 2 Dept. of Business Administration, Guangzhou College of Technology and Business, Foshan 528000, China; [email protected] 3 School of Management and Economics, Beijing Institute of Technology, Beijing 100081, China 4 Sustainable Development Research Institute for Economy and Society of Beijing, Beijing 100081, China * Correspondence: [email protected]; Tel.: +86-010-6891-8830 Received: 5 January 2019; Accepted: 23 January 2019; Published: 28 January 2019 Abstract: In a fierce competitive industry, firms conducting a corporate social responsibility (CSR) differentiation strategy can build a relative advantage. However, there is lack of literature to discuss the approach to identifying companies’ CSR differentiation conditions. Based on the theoretical foundations of consumers’ responses to CSR differentiation strategies, this paper proposes a consumer- oriented approach to identify CSR differentiation by using the best–worst scaling approach. In the context of the mobile phone industry, CSR activities were prioritized according to the extent to which they were valued by consumers. Consumers’ perceptions of the CSR activities of Huawei and Apple were also assessed in this study. Finally, the CSR differentiation conditions between the two companies was evaluated. The findings include the following: (1) the consumer priorities for different CSR activities vary greatly, and it is essential for firms to adopt a CSR differentiation strategy; (2) it is feasible to adopt a proper CSR premium in product pricing to build a socially responsible company; and (3) the lack of CSR communication between companies and consumers leads to consumers’ perceived distortion. The results provide implications for firms’ CSR practice. Keywords: corporate social responsibility; best-worst scaling; differentiation strategy; identification 1. Introduction To date, corporate social responsibility (CSR) has been recognized and conducted by more and more firms [1,2]. Driven by practices of business, society and policy makers, the role of CSR will be given more attention in the near future [3]. Corporate stakeholders play an important role in moving this trend forward [4]. As an important member of the stakeholders’ group, consumers usually require companies to undertake certain social responsibilities while pursuing economic interests, and respond according to their CSR performance [5,6], finally reflected in supporting or boycotting companies and their products and services. There is a strong positive relationship between CSR and customer outcomes [7]. Consumers’ responses to CSR stimulate some enterprises to invest more resources into CSR with the intention to obtain better market returns through appropriate CSR activities. However, due to the distance barrier of communication and perception between consumers and companies, consumers have difficulties in perceiving CSR activities of companies. It is even a challenge to distinguish the differences among companies’ CSR activities. In short, CSR activities have different influences on consumers and are restricted by consumers’ perceptions for these activities. Therefore, to develop and make a full use of CSR’s positive impact on consumers, it is necessary for a company to distinguish itself from competitors by virtue of differentiated CSR. Sustainability 2019, 11, 664; doi:10.3390/su11030664 www.mdpi.com/journal/sustainability
-
Upload
khangminh22 -
Category
Documents
-
view
6 -
download
0
Transcript of Building Consumer-Oriented CSR Differentiation Strategy
sustainability
Article
Building Consumer-Oriented CSRDifferentiation Strategy
Jinhua Li 1, Fang Zhang 2 and Shiwei Sun 3,4,*1 Scientific Laboratory of Economic Behaviors, School of Economics & Management, South China Normal
University, Guangzhou 510006, China; [email protected] Dept. of Business Administration, Guangzhou College of Technology and Business, Foshan 528000, China;
[email protected] School of Management and Economics, Beijing Institute of Technology, Beijing 100081, China4 Sustainable Development Research Institute for Economy and Society of Beijing, Beijing 100081, China* Correspondence: [email protected]; Tel.: +86-010-6891-8830
Received: 5 January 2019; Accepted: 23 January 2019; Published: 28 January 2019�����������������
Abstract: In a fierce competitive industry, firms conducting a corporate social responsibility (CSR)differentiation strategy can build a relative advantage. However, there is lack of literature to discussthe approach to identifying companies’ CSR differentiation conditions. Based on the theoreticalfoundations of consumers’ responses to CSR differentiation strategies, this paper proposes a consumer-oriented approach to identify CSR differentiation by using the best–worst scaling approach. In thecontext of the mobile phone industry, CSR activities were prioritized according to the extent towhich they were valued by consumers. Consumers’ perceptions of the CSR activities of Huawei andApple were also assessed in this study. Finally, the CSR differentiation conditions between the twocompanies was evaluated. The findings include the following: (1) the consumer priorities for differentCSR activities vary greatly, and it is essential for firms to adopt a CSR differentiation strategy; (2) it isfeasible to adopt a proper CSR premium in product pricing to build a socially responsible company;and (3) the lack of CSR communication between companies and consumers leads to consumers’perceived distortion. The results provide implications for firms’ CSR practice.
Keywords: corporate social responsibility; best-worst scaling; differentiation strategy; identification
1. Introduction
To date, corporate social responsibility (CSR) has been recognized and conducted by more andmore firms [1,2]. Driven by practices of business, society and policy makers, the role of CSR will begiven more attention in the near future [3]. Corporate stakeholders play an important role in movingthis trend forward [4]. As an important member of the stakeholders’ group, consumers usually requirecompanies to undertake certain social responsibilities while pursuing economic interests, and respondaccording to their CSR performance [5,6], finally reflected in supporting or boycotting companiesand their products and services. There is a strong positive relationship between CSR and customeroutcomes [7]. Consumers’ responses to CSR stimulate some enterprises to invest more resources intoCSR with the intention to obtain better market returns through appropriate CSR activities. However,due to the distance barrier of communication and perception between consumers and companies,consumers have difficulties in perceiving CSR activities of companies. It is even a challenge todistinguish the differences among companies’ CSR activities. In short, CSR activities have differentinfluences on consumers and are restricted by consumers’ perceptions for these activities. Therefore,to develop and make a full use of CSR’s positive impact on consumers, it is necessary for a companyto distinguish itself from competitors by virtue of differentiated CSR.
Sustainability 2019, 11, 664; doi:10.3390/su11030664 www.mdpi.com/journal/sustainability
Sustainability 2019, 11, 664 2 of 14
Companies are currently in a strong competitive environment. CSR can be used as a differentiationstrategy to cope with competitive pressures [8–10]. Kotler (2003) has defined differentiation as“the act of designing a set of meaningful differences to distinguish the company’s offerings fromcompetitors’ offerings” [11]. Differentiation strategy means that a company chooses one or severalcharacteristics that are considered important by customers in an industry and puts itself in a uniqueposition to satisfy these characteristics. Differentiation strategy in practice is viewed as somethingdistinctive that a company’s products are perceived by at least some consumers. The degree ofdifferentiation of a company’s product is ultimately determined by consumers’ perceptions. To realizeCSR differentiation, it is necessary to understand the difference in the degree of influence of differentCSR activities on consumers. However, most related studies adopt a Likert scale method to directlymeasure the impact level of all CSR activities on consumers. This method requires an overly highdiscrimination capability for respondents. They may feel that it is difficult to judge when they arefacing more than a dozen or more similar items. Data obtained from such surveys is of poor quality andthe results are naturally doubtful. In addition, the extant literature has rarely discussed the approachto identify companies’ CSR differentiation conditions.
The objectives of this study are: (1) to propose a consumer-oriented approach to identify CSRdifferentiation between a company and its competitors in CSR implementation; (2) to prioritize a setof CSR activities from the consumer perspective in the context of the mobile phone industry; (3) toevaluate the CSR differentiation conditions between two companies in the mobile phone industryfrom the consumer perspective. The theoretical bases of this paper are consumers’ CSR responses anddifferentiation strategy, and the methodological bases are best–worst scaling and system analysis.
Almost all world-renowned mobile phones firms compete extremely fiercely in the Chinese market,with Huawei, Apple and Samsung having the better performances. These three enjoy high reputationsand have large shares in the Chinese market. Currently, almost every adult in China has routinemobile phone use during daily life. They usually have knowledge of mobile phone manufacturers.Apple and Huawei are especially popular and have production bases in China. Thus, the mobilephone industry and these two cases, in particular, are selected as the research background due to theirrepresentativeness among consumers. In this study, Huawei is the benchmark firm and Apple is thecontrol case. This arrangement provides the advantages of typical selection of industries and firms,a large number of qualified respondents, and a more accurate CSR perception from consumers.
The rest of this paper is structured as follows. In Section 2, a literature review regarding theCSR construct and best–worst Scaling is conducted. The approach to identify CSR differentiation isproposed in Section 3. In Section 4, CSR measurement and survey design are described. In Section 5,data collection and preliminary testing work are provided. The data analysis and results are presentedin Section 6. The theoretical contributions, managerial implications and limitations of this study arediscussed in Section 7.
2. Literature Review
2.1. CSR Construct and Differentiation Strategy
The CSR construct has undergone a lasting evolution and has been combined with issues inpractice, such as human rights, labor rights, environmental protection, consumer protection andfighting corruption, and different definitions place different degrees of emphasis on these points [12–14].More than 35 CSR definitions have been discussed in the literature [15]. Yet, none of these has beencommonly accepted. This study is inclined to the definition by the European Commission (2001),that is, “a concept whereby companies integrate social and environmental concerns in their businessoperations and in their interaction with their stakeholders on a voluntary basis” [16]. This definitionrelates CSR to the triple bottom line theory [17] and the stakeholder theory [18], both of which havebecome important theoretical foundations. In the process of CSR conceptualization, stakeholder theoryis one of most used theories to interpret CSR. According to this theory, firms should not only be
Sustainability 2019, 11, 664 3 of 14
responsible for the interests of shareholders, but also take into account of the interests of employees,customers, suppliers, the local community and other groups.
Due to the inconsistent agreement on the concept of CSR and the wide range of domains, scholarshave proposed different measurements in certain contexts. For example, Turker (2009) proposesa four-dimensional structure of CSR from the corporate perspective, including CSR for social andnon-social stakeholders (i.e., society, natural environment, future generations and non-governmentalorganizations), employees, customers and governments, and designs a scale through the systematicscale development process [19]. Öberseder, Schlegelmilch and Murphy (2013) offer a conceptualizationof CSR from both corporate and consumer points of view: consumers, employees, shareholders,suppliers, the environment, society, local communities, governments, media, and competitors [20].They argue that consumers pay different priorities to CSR in different fields, that is, the most importantdomains are employees, consumers and environment, followed by suppliers, society and localcommunity. Öberseder et al. (2014) develop a comprehensive and validated scale of consumers’perceptions of CSR (CPCSR) useful to both researchers and managers, which covers seven domains,i.e., consumers, employees, environment, suppliers, local community, society and shareholders [21].In addition to the Öberseder et al. (2014) scale, there have been two scales associated with CSR andconsumer behavior. Wagner, Bicen and Hall (2008) measure consumers’ perceptions of corporatesocial irresponsibility (CSIR) in the retail context [22], and Webb, Mohr and Harris (2008) measuresocially responsible purchase and disposal (SRPD) behaviors [23]. However, the two scales are notcomprehensive and only focus on the individual dimensions of CSR.
Overall, our research has extended the consumers’ perception on CSR based on prior research. Forexample, Öberseder, Schlegelmilch and Murphy (2013) discussed corporate practices and consumerperceptions related to CSR using qualitative data from interviews [20]. The conclusions from thisstudy are more subjective due to using a small number of cases. Öberseder et al. (2014), Wagner,Bicen and Hall (2008), and Webb, Mohr and Harris (2008) made contributions to the measurementsof CSR from the consumers’ perspective [21–23]. All these prior studies did not take into accountthe comparative importance of CSR activities from the consumers’ perspective. Unlike past studiesfocusing on measuring CSR perceptions, this study uses a new approach (i.e., best–worst scaling) toprioritize CSR activities according to the extent to which they were valued by consumers.
According to Porter (1985), there are three generic strategies (i.e., cost leadership, differentiation andfocus) [24]. There is a strong interaction between cost minimization strategies, product differentiationstrategies, and market focus strategies. The focus strategy is usually formed by the low-cost strategyand product differentiation strategies. The three generic strategies can be summarized as two basicstrategies, i.e., cost leadership and differentiation. In terms of CSR practice, because of the conflict ofhigh investment and better CSR performance, the low-cost strategy is not the best choice for firms. Thebest strategy is to conduct the differentiation strategy, which can help firms to win relative advantage.The CSR differentiation strategy not only improves reputation, but also attracts consumers to learnmore about firms’ products or services.
2.2. Best–Worst Scaling
Best–worst scaling (BWS), also known as maximum difference scaling, is a contemporary methodfor the prioritization of items proposed by Louviere, and developed and applied in numerousworks [25,26]. It can be seen as an extension of the paired comparison techniques for the simultaneouspresentation of several items together to respondents. The choice is implemented by respondents whoselect which of several presented items is the best and worst. This method can effectively avoid theweakness of identifying items by using the Likert scale method. In BWS, the “best/worst” choicequestion consisting of several objects is called a task. A set of questions consisting of multiple tasksis called the MaxDiff problem. To ensure randomness, multiple versions of the MaxDiff problem aredesigned to correspond to different respondents. The BWS questionnaire design should meet fourconditions: equal number of occurrences of each object, equal number of occurrences of two objects at

Sustainability 2019, 11, 664 4 of 14
the same time, equal frequency of occurrence of objects at each position in the task, and the ability forall objects to be connected. Professional software can be used to easily make the required questionnairethat meets the requirements. Sawtooth Software is the most authoritative and easy-to-use tool togenerate BWS questionnaires. In the MaxDiff module of the software, the questionnaire of multipleversions can be automatically generated by entering an object list and relevant parameters.
BWS has been widely used and developed in many fields, such as social science [26]. It has beenapplied in the evaluation of corporate ethics and supply chain sustainability. For example, Auger,Devinney and Louviere (2007) investigate the differences in the attitudes towards social and ethicalissues among more than 600 consumers across six countries using BWS [27]. Costanigro, Deselnicuand McFadde (2016) assess consumer priorities for the nine CSR activities in milk production usingBWS [28]. Rezaei et al. (2016) propose a supplier selection life cycle approach integrating traditionaland environmental criteria using BWS [29]. Ahmadi, Kusi-Sarpong and Rezaei (2017) assess the socialsustainability of supply chains using BWS [30]. Ahmad et al. (2017) evaluate the external forcesaffecting the sustainability of the oil and gas supply chain using BWS [31].
There are three ways to measure consumers’ perceptions on comparative importance of CSRactivities, including the direct Likert scale method, the indirect Likert scale method, and the comparisonapproaches. The direct Likert scale method directly measure consumers’ perception weight. Based onthe measurement results of overall performance and each item performance, the indirect Likert scalemethod usually uses the regression analysis approach to get the weight for each CSR activity. Relyingon the direct Likert scale method, the indirect method is more complex and needs a lot of data processwork. The comparison approaches usually include Analytic Hierarchy Process (AHP) and BWS. AHPis conducted by comparing each pair of CSR activities, while BWS can be accurately used to makemulti-object comparisons. From the above discussion, we can find that the direct Likert scale methodis easy to use but has a high requirement of discrimination capability for respondents. BWS has betterperformance for accurately measuring consumers’ perceptions of the comparative importance andfinding the weights for each CSR activity.
3. Approach to Identify CSR Differentiation
3.1. General Procedure of the Approach
The purpose of differentiation is to create the maximum difference between the added-buyer-value(and hence the premium) and the cost increased by uniqueness. The cost of operational differentiationvaries with different value activities, and companies should choose the activities that contribute themost to the consumer value compared with its cost. Therefore, to build CSR differentiation, it isnecessary to first know the value of different CSR activities, i.e., the consumer priorities for CSRactivities, and then take them as the weights to comprehensively evaluate CSR differentiation incombination with the consumers’ perceptions for CSR activities of different companies.
The general approach to identify CSR differentiation proposed in this paper follows thefollowing steps:
1. Determine proper CSR activities as CSR measurement indicators from the consumer perspective.2. Design the questionnaire: using BWS to measure the consumer priorities for CSR activities, and
using a Likert scale to measure the consumers’ comparative perceptions for CSR activities of twocomparative companies.
3. Collect data and conduct preliminary testing.4. Analyze the data and evaluate CSR differentiation.
3.2. The Method of Evaluating CSR Differentiation Degree
The hierarchical Bayesian algorithm and the count analysis method are two typical approachesto analyze data from BWS questionnaires. Compared with the former, which is complex andtime-consuming, the latter is more convenient and simpler to calculate. When each object can appear

Sustainability 2019, 11, 664 5 of 14
at least three times, there is no significant difference between the results obtained by the hierarchicalBayesian algorithm and the count analysis method. In this study, each object in this questionnaireappears four times (see Section 4.2). Thus, the count analysis method was appropriate to select fordata analysis. The count analysis method counts the number of times that each object is selected as“best” and “worst”, respectively, and then subtracts the value of the latter from the value of the formerto get the preference score for each object.
Let Aij denote the consumer priority for CSR activity j in sample i, which is the difference betweenCSR activity j being selected as the most important number and the least important number. Let Bijdenote the consumer’s comparative perception degree of CSR activity j in sample i. Let C denotethe CSR differentiation degree of two companies. n is the sample size and m is the number of CSRactivities. The assessment process is as follows:
1. For each sample, count each Aij and get Bij.
2. Use equation C = 1n ∑n
1 ∑m1[(
4 + Aij)·Bij
]to calculate C. Originally, Aij ∈ [−4, 4]. In order to
conform to the normal comparison habit, the value range of Aij is adjusted to [0,8] by adding 4.
3. Calculate the upper bound and lower bound of C, and calculate the ratio of C to the upperbound or the lower bound, so as to observe the difference degree of CSR differentiation of twocompanies easily.
4. CSR Activities and Questionnaire Design
4.1. Consumer-Oriented CSR Activities
Referring to the work from Öberseder, Schlegelmilch and Murphy (2013), Öberseder et al.(2014) and some relevant Chinese literature, and considering the situation in the mobile phoneindustry [20,21], 13 CSR activities of four dimensions (see Table 1) are determined as the measurementindicators of CSR in this study.
Table 1. Corporate social responsibility (CSR) activities measurements.
CSR Domains Codes CSR Activities
Consumers
Co1 Set fair prices for productsCo2 Protect consumer privacyCo3 Deal with customer complaints and return requests promptlyCo4 Provide credible business and product information
EnvironmentEn1 Reduce and avoid pollutionEn2 Invest in research and development regarding environmental protectionEn3 Waste product recycle
EmployeesEm1 Set decent working conditionsEm2 Develop, support and train employeesEm3 Offer adequate remuneration
Local communityand society
Cs1 Sponsoring local community and social public activitiesCs2 Create jobs for people in the regionCs3 Care for vulnerable groups
In general, consumers attach the most importance to CSR related to their own interests, thatis, the consumer domain. Because the rights and interests of consumers have not been respectedproperly in China, CSR to consumers is even more urgent. This study measures CSR to consumersfrom the following aspects: set fair prices for products; protect consumer privacy; deal with customercomplaints and return requests promptly; and provide credible business and product information.
The concept of sustainable development is highly valued by the world’s major countries. ISO26000and environmental protection law have detailed requirements on environmental protection. In China,environmental pollution damages the air, water and soil on which people depend. The good news is thatthe government has begun to tackle the problem. Now, consumers attach increasing importance to the
Sustainability 2019, 11, 664 6 of 14
environmental domain. Consumers will put pressure on companies with more severe environmentalpollution. This study measures CSR to the environment from the following aspects: reduce andavoid pollution; invest in research and development regarding environmental protection; and wasteproduct recycle.
Failure to fulfill CSR to employees may lead to conflicts between employees and companies,which will damage the company’s operation and cause a bad social impact. Consumers themselves arealso employees of certain companies, and naturally they care a lot about CSR to employees. ISO26000and SA8000 have detailed requirements for CSR to employees. This study measures CSR to employeesfrom the following aspects: set decent working conditions; develop, support and train employees; andoffer reasonable remuneration.
Consumers also attach more importance to the local community and society. In China, there isa wide gap between the rich and the poor, and a wide range of vulnerable groups exists. Consumersexpect companies to do what they can to help vulnerable groups, participate in social public activities,serve local communities and promote the harmonious development of society. This study measuresCSR to the local community and society from the following aspects: sponsoring local community andsocial public activities; create jobs for people in the region; and care for vulnerable groups.
This study does not consider CSR to shareholders and suppliers. The reasons include, first, CSRto shareholders and suppliers is difficult to perceive by consumers. Second, CSR to shareholders andsuppliers produces no direct effect on consumers. Third, most of the extant Chinese literature onrelated research has not included supplier domain. In addition, according to Öberseder, Schlegelmilchand Murphy (2013), consumers attach little importance to CSR to media, government, competitors andother stakeholders [20]. Therefore, media domain, government domain and competitor domain arenot considered in this study.
4.2. Questionnaire Design
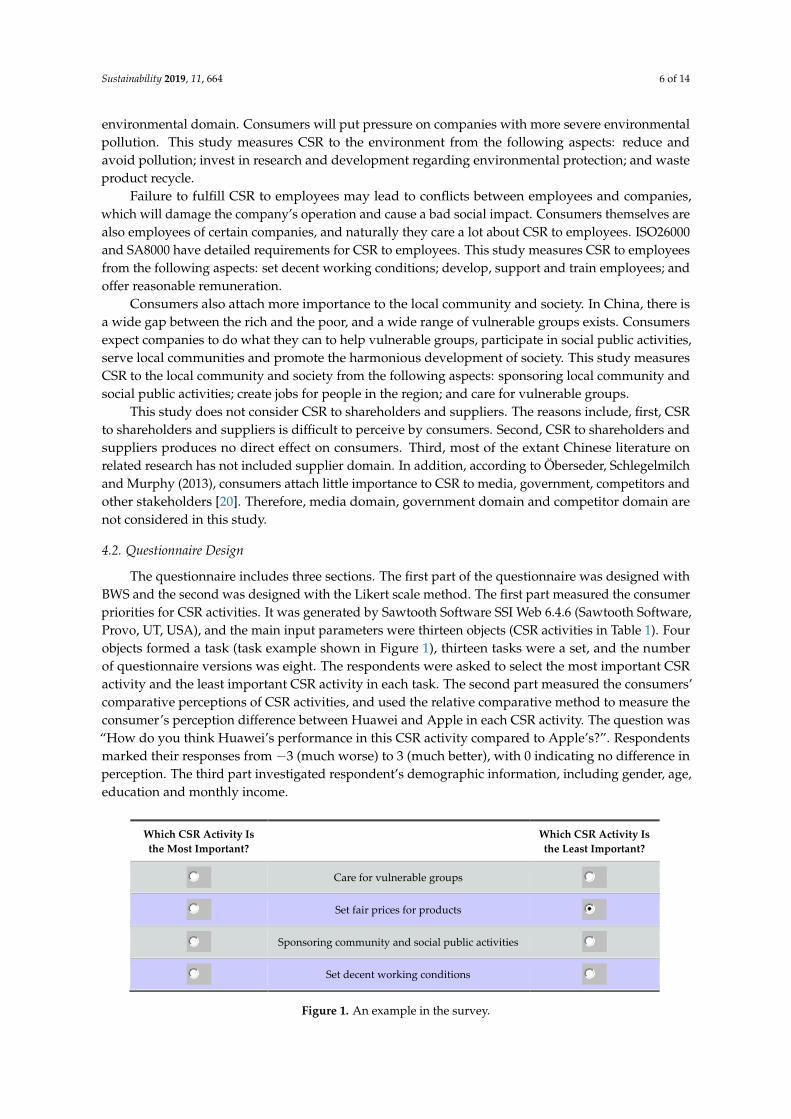
The questionnaire includes three sections. The first part of the questionnaire was designed withBWS and the second was designed with the Likert scale method. The first part measured the consumerpriorities for CSR activities. It was generated by Sawtooth Software SSI Web 6.4.6 (Sawtooth Software,Provo, UT, USA), and the main input parameters were thirteen objects (CSR activities in Table 1). Fourobjects formed a task (task example shown in Figure 1), thirteen tasks were a set, and the numberof questionnaire versions was eight. The respondents were asked to select the most important CSRactivity and the least important CSR activity in each task. The second part measured the consumers’comparative perceptions of CSR activities, and used the relative comparative method to measure theconsumer’s perception difference between Huawei and Apple in each CSR activity. The question was“How do you think Huawei’s performance in this CSR activity compared to Apple’s?”. Respondentsmarked their responses from −3 (much worse) to 3 (much better), with 0 indicating no difference inperception. The third part investigated respondent’s demographic information, including gender, age,education and monthly income.
Sustainability 2018, 10, x; doi: FOR PEER REVIEW www.mdpi.com/journal/sustainability
Which CSR Activity Is
the Most Important?
Which CSR Activity Is
the Least Important?
Care for vulnerable groups
Set fair prices for products
Sponsoring community and social public activities
Set decent working conditions
Figure 1. An example in the survey.
5. Data Collection and Testing
5.1. Sample and Data Collection
We conducted pre-test and formal investigation in Guangzhou, China. The pre-test and related
analysis work were conducted from October 2017 to November 2017. The respondents of the pre-test
were invited from amongst co-authors’ friends and colleagues with knowledge of the firms’ CSR
activities. Fifty questionnaires were collected at this stage. During the pre-test, we also had in-depth
communication with respondents. The reliability and validity of the questionnaire were analyzed
according to the survey results, and the questionnaire design was optimized based on the feedback
of pre-test respondents. Subsequently, eight versions of the online questionnaire were produced
using the website wjx.cn, which specializes in online questionnaires. The formal investigation was
conducted from December 2017 to February 2018. The participants included college students, the co-
authors' circle of friends, and passers-by. College students were randomly selected in class. To
encourage them to actively reply questions on our survey, we gave them small gifts as rewards. We
also sent our survey to co-authors' circle of friends via WeChat, a Chinese multi-purpose messaging
and social media app developed by Tencent (Shenzhen, China). They were free to accept or refuse
our survey. If they chose to respond on time, they were given CNY 6 as a reward (about USD 1).
Passers-by were selected in a super shopping mall in Guangzhou, and also received a small gift if
they filled in the survey. A total of 691 questionnaires were obtained, of which 34 questionnaires were
excluded because of invalid responses, such as too much missing data and too many of the same
answers. A total of 657 responses were valid for final analysis, resulting in a 95% validity rate. The
demographic characteristics of the respondents are shown in Table 2.
Figure 1. An example in the survey.
Sustainability 2019, 11, 664 7 of 14
5. Data Collection and Testing
5.1. Sample and Data Collection
We conducted pre-test and formal investigation in Guangzhou, China. The pre-test and relatedanalysis work were conducted from October 2017 to November 2017. The respondents of the pre-testwere invited from amongst co-authors’ friends and colleagues with knowledge of the firms’ CSRactivities. Fifty questionnaires were collected at this stage. During the pre-test, we also had in-depthcommunication with respondents. The reliability and validity of the questionnaire were analyzedaccording to the survey results, and the questionnaire design was optimized based on the feedback ofpre-test respondents. Subsequently, eight versions of the online questionnaire were produced using thewebsite wjx.cn, which specializes in online questionnaires. The formal investigation was conductedfrom December 2017 to February 2018. The participants included college students, the co-authors’circle of friends, and passers-by. College students were randomly selected in class. To encourage themto actively reply questions on our survey, we gave them small gifts as rewards. We also sent our surveyto co-authors’ circle of friends via WeChat, a Chinese multi-purpose messaging and social media appdeveloped by Tencent (Shenzhen, China). They were free to accept or refuse our survey. If they choseto respond on time, they were given CNY 6 as a reward (about USD 1). Passers-by were selected ina super shopping mall in Guangzhou, and also received a small gift if they filled in the survey. A totalof 691 questionnaires were obtained, of which 34 questionnaires were excluded because of invalidresponses, such as too much missing data and too many of the same answers. A total of 657 responseswere valid for final analysis, resulting in a 95% validity rate. The demographic characteristics of therespondents are shown in Table 2.
Table 2. Demographic characteristics of respondents.
Demographics Number Percentage (%)
SexMale 341 51.90
Female 316 48.10
Age
18–25 years 167 25.4226–35 years 279 42.4736–45 years 92 14.0046–55 years 84 12.78>55 years 35 5.33
Education
Junior high school 27 4.11High school 74 11.26
Undergraduate 342 52.05Graduate 214 32.58
Monthly income
No income 124 18.87<5000 yuan 181 27.54
5000–10,000 yuan 225 33.4910,000–20,000 yuan 89 13.55
>20,000 yuan 38 6.64
5.2. Reliability and Validity Analysis
The first part of the questionnaire “the consumer priorities for CSR activities”, uses anon-Likert-style BWS survey. There is no need to do quantitative reliability and validity analysis.The reliability and validity analysis mainly are done for the second part of the questionnaire, “theconsumers’ comparative perceptions degree of CSR activities”.
Cronbach’s alpha is used to measure the reliability of the scale. The Cronbach’s alpha coefficientof 13 CSR activities is 0.917, consumer dimension 0.769, environmental dimension 0.762, employeedimension 0.823, community and society dimension 0.811. Meanwhile, in the purification item check,except for the corrected item total correlation (CITC) of the first item, which is 0.453 (still greater than

Sustainability 2019, 11, 664 8 of 14
0.35), the CITC of the remaining 12 items are greater than 0.5, indicating that all items can be kept. Theabove data show that the questionnaire has a good reliability.
There are several methods for validity analysis: content validity, criterion validity and structuralvalidity. The results obtained by different methods reflect different aspects of validity. Content validityrefers to whether the designed item can represent the content or subject to be measured, which isgenerally evaluated by logical analysis and statistical analysis. Since this study does not involvehypothesis testing between constructs, it is appropriate to use the content validity analysis method.In terms of logical analysis, the questionnaire in this study refers to relatively mature domestic andforeign studies, and is based on the opinions of relevant experts, so the logic is good. In terms ofstatistical analysis, the correlation analysis results are obtained by single-item and total correlationanalysis. The results show that the correlations of each dimension are significant, and the correlationbetween each dimension and the score is also significant (p < 0.01), indicating the questionnaire usedin this study is very effective.
6. Results
6.1. Ranking of Consumer Priorities for CSR Activities
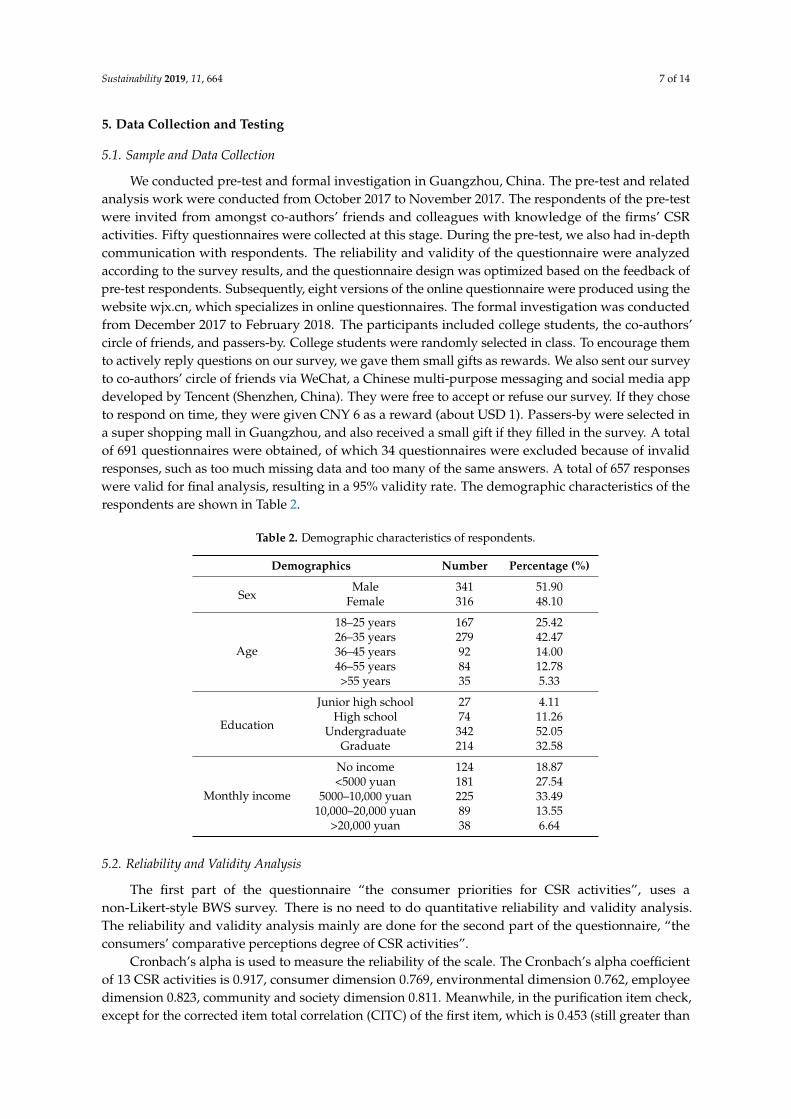
According to the count analysis method of BWS, the scores and rankings of CSR activities areshown in Table 3 and Figure 2.
Table 3. Scores and rankings of CSR activities.
CSR Domains CSR Activities Times to Be theMost Important
Times to Be theLeast Important Scores Ranking
Consumerresponsibility
Co1 885 −515 370 5Co2 1161 −439 722 1Co3 985 −379 606 2Co4 964 −428 536 3
Environmentresponsibility
En1 672 −468 204 6En2 988 −543 445 4En3 310 −922 −612 12
Employeeresponsibility
Em1 542 −574 −32 7Em2 420 −899 −479 10Em3 345 −860 −515 11
Local communityand society
responsibility
Cs1 522 −665 −143 8Cs2 375 −1120 −745 13Cs3 372 −729 −357 9
The first CSR activity ranking (that is, what consumers consider most important) is the activity“Protect customer privacy”, the second is the activity “Deal with customer complaints and returnrequests promptly”, and the third is the activity “Provide credible business and product information”.These three CSR activities belong to the consumer domain, with scores of 722, 606 and 536, respectively,so the fulfillment of CSR to consumer has the most impact on consumers. It can also be found thatthe gap among the top three CSR activities’ scores is not small, indicating that there is still a certaindifference among the three activities from the consumers’ point of view. What consumers value mostis the activity “Protect customer privacy”, which shows that the harm brought about by the leakage orillegal use of customer personal information should not be underestimated.
Ranked fourth is the activity “Invest in research and development regarding environmentalprotection” of the environmental domain with a score of 445. As far as the reality is concerned, thereis considerable domestic and foreign legislation and propaganda on environmental protection, andthe general public has an increasingly stronger awareness of environmental protection. Consumersattach great importance to the development of environmental protection technologies, so as to achieve

Sustainability 2019, 11, 664 9 of 14
the long-term stability of corporate environmental protection problems. Companies that ignoreenvironmental protection will be punished in the consumer market.
Sustainability 2018, 10, x; doi: FOR PEER REVIEW www.mdpi.com/journal/sustainability
Table 3. Scores and rankings of CSR activities.
CSR Domains CSR
Activities
Times to Be the
Most Important
Times to Be the
Least Important Scores Ranking
Consumer
responsibility
Co1 885 −515 370 5
Co2 1161 −439 722 1
Co3 985 −379 606 2
Co4 964 −428 536 3
Environment
responsibility
En1 672 −468 204 6
En2 988 −543 445 4
En3 310 −922 −612 12
Employee
responsibility
Em1 542 −574 −32 7
Em2 420 −899 −479 10
Em3 345 −860 −515 11
Local community and
society responsibility
Cs1 522 −665 −143 8
Cs2 375 −1120 −745 13
Cs3 372 −729 −357 9
Figure 2. Radar map of the scores of the CSR activities.
The first CSR activity ranking (that is, what consumers consider most important) is the activity
“Protect customer privacy”, the second is the activity “Deal with customer complaints and return
requests promptly”, and the third is the activity “Provide credible business and product
information”. These three CSR activities belong to the consumer domain, with scores of 722, 606 and
536, respectively, so the fulfillment of CSR to consumer has the most impact on consumers. It can also
be found that the gap among the top three CSR activities’ scores is not small, indicating that there is
still a certain difference among the three activities from the consumers’ point of view. What
consumers value most is the activity “Protect customer privacy”, which shows that the harm brought
about by the leakage or illegal use of customer personal information should not be underestimated.
Ranked fourth is the activity “Invest in research and development regarding environmental
protection” of the environmental domain with a score of 445. As far as the reality is concerned, there
is considerable domestic and foreign legislation and propaganda on environmental protection, and
the general public has an increasingly stronger awareness of environmental protection. Consumers
attach great importance to the development of environmental protection technologies, so as to
-800.00
-600.00
-400.00
-200.00
0.00
200.00
400.00
600.00
800.00Co2
Co3
Co4
En2
Co1
En1
Em1Cs1
Cs3
Em2
Em3
En3
Cs2
Figure 2. Radar map of the scores of the CSR activities.
The activity “Set fair prices for products” of the consumer domain ranks fifth, with a score of370, which is significantly lower than the scores of the other three activities in the consumer domain.This shows that in the minds of consumers, the fairness of product pricing is not as important aspeople think compared to the other three consumer activities. This gives the company a signal that anappropriate CSR premium is acceptable to consumers in product pricing.
The sixth is the activity “Reduce and avoid pollution” of the environmental domain, with a score of204. Compared with the fourth activity “Invest in research and development regarding environmentalprotection”, there is a big gap. This result indicates that in fulfilling CSR to the environment, consumersare more likely to expect companies to invest in research and development regarding environmentalprotection, and eliminating pollution from the source is more important than generally reducing andavoiding pollution.
Ranked seventh is the activity “Set decent working conditions” of employee domain, with a scoreof −32. This indicates that the times consumers chose the activity to be the least important are slightlygreater than the times it was chosen to be the most important. This ranking is still important, becausethe other identity of the consumer is also the employee of a certain company. The empathy determinesthey cannot ignore the safe and comfortable working environment and conditions.
Ranked eighth is the activity “Sponsoring local community and social public activities” of thecommunity and society domain, with a score of−143. Ranked ninth is the activity “Care for vulnerablegroups”, also belonging to the community and society responsibility, with a score of −357, whichis a large difference compared to the eighth-ranked activity, indicating that this activity is not veryimportant to most consumers. The two activities belong to charitable responsibility, and it is surprisingthat their rankings are so low on the list.
Ranked tenth is the activity “Develop, support and train employees” of employee responsibility,with a score of −479. Ranked eleventh is the activity “Provide reasonable remuneration for employees”of the employee domain, with a score of −515. Consumers do not attach much importance to thesetwo activities.
The activity “Waste product recycle”, belonging to the environmental domain, ranks thesecond-lowest with a score of −612. As far as we know, the waste mobile phone contains toxicand harmful substances such as lead, chromium and mercury, which, if not handled properly, will pose

Sustainability 2019, 11, 664 10 of 14
a huge threat to the environment and human health. The possible reasons why the recycling of wastemobile phones has not received much attention from consumers are as follows: (1) the financial interestobtained by consumers from the recycling of waste mobile phones is not great; (2) many mobile phonemanufacturers have not carried out recycling activities of waste mobile phone; (3) consumers areworried that their privacy will be revealed after their mobile phones are recycled; (4) some consumershave weak environmental awareness; and (5) there is a lack of national policies and regulations onrecycling of waste products.
The last ranking is the activity “Create jobs for people in the region” of the community and societydomain, with a score of −745. This may be because businesses and local communities are inherentlysymbiotic. Setting up a company or factory in a place requires the support of the local community,which also drives the development of the local economy. In this process, it is an economic and naturalchoice for companies to provide jobs to local residents, so consumers generally do not value thisCSR activity.
The above rankings largely support the discussion from Öberseder, Schlegelmilch and Murphy(2013), which notes that consumers attach more importance to CSR related to consumers, environmentand employees [20]. Compared with their study, the comparison accuracy degree of this study reachesthe activity level.
6.2. CSR Differentiation Evaluation
The second part of the questionnaire surveyed the consumers’ comparative perceptions of Huaweiand Apple in fulfilling various CSR activities. The statistical results are shown in Table 4.
Table 4. Consumers’ comparative perceptions of CSR activities of Huawei and Apple.
CSR Activities Much Worse−3
Worse−2
Some-What Worse−1
No Difference0
Some-What Better1
Better2
Much Better3
Co1Times 17 31 69 83 153 180 124
Percentage (%) 2.59 4.72 10.50 12.63 23.29 27.40 18.87
Co2Times 11 40 57 256 94 127 72
Percentage (%) 1.67 6.09 8.68 38.96 14.31 19.33 10.96
Co3Times 10 47 92 260 131 86 31
Percentage (%) 1.52 7.15 14.00 39.57 19.94 13.09 4.72
Co4Times 9 16 130 233 142 84 43
Percentage (%) 1.37 2.44 19.79 35.46 21.61 12.79 6.54
En1Times 8 10 53 352 134 75 25
Percentage (%) 1.22 1.52 8.07 53.58 20.40 11.42 3.81
En2Times 12 36 101 267 102 94 45
Percentage (%) 1.83 5.48 15.37 40.64 15.53 14.31 6.85
En3Times 11 26 95 292 147 57 29
Percentage (%) 1.67 3.96 14.46 44.44 22.37 8.68 4.41
Em1Times 10 15 149 272 93 83 35
Percentage (%) 1.52 2.28 22.68 41.40 14.16 12.63 5.33
Em2Times 7 16 81 307 104 102 40
Percentage (%) 1.07 2.44 12.33 46.73 15.83 15.53 6.09
Em3Times 8 13 47 304 120 115 50
Percentage (%) 1.22 1.98 7.15 46.27 18.26 17.50 7.61
Cs1Times 47 11 33 279 116 129 42
Percentage (%) 7.15 1.67 5.02 42.47 17.66 19.63 6.39
Cs2Times 10 14 74 220 147 122 70
Percentage (%) 1.52 2.13 11.26 33.49 22.37 18.57 10.65
Cs3Times 12 12 37 249 187 122 38
Percentage (%) 1.83 1.83 5.63 37.90 28.46 18.57 5.78
Regarding “Set fair prices for products”, the number of times the option “2” is chosen, meaningHuawei performed better than Apple in this CSR activity, is the most, accounting for 27.4% of thetotal, indicating that respondents clearly perceive that Huawei performs better than Apple in “Set fairprices for products”. However, in the remaining 12 CSR activities, the percentage choosing the option

Sustainability 2019, 11, 664 11 of 14
“0”, meaning no difference between Huawei and Apple is perceived, is about 40%. This indicates thedifferences between Huawei’s CSR activities and Apple’s CSR activities are not fully reflected. It canalso be found that for each CSR activity, the number of times the options “1”, “2” and “3” are chosen issignificantly higher than that of the options “−1”, “−2” and “−3”, which, to some extent, indicatesthat consumers believe that Huawei performs better than Apple in these CSR activities.
According to the evaluation method given above, the CSR differentiation degree of Huawei andApple is calculated quantitatively, C = 25. In order to appreciate the size of this value intuitively, it isnecessary to calculate the value range of CSR differentiation degree. Considering that the value rangeof comparative perception is [−3, 3], the CSR differentiation degree of the two companies is calculated,respectively, when the comparative perceptions are all −3 and 3. When the comparative perceptionsare all −3, Cmin = −156; when the comparative perceptions are all 3, Cmax = 156, so the value rangeof CSR differentiation degree is [−156, 156]. The ratio of CSR differentiation degree between the twocompanies can now be calculated, namely, 25/156 × 100% = 16%. According to this result, it can beconcluded that from the perspective of consumers, Huawei’s various CSR activities are somewhatdifferentiated from Apple, and Huawei’s overall performance in CSR activities is still better thanApple’s, but the degree of differentiation is not high as expected.
Table 3 shows that a considerable number of respondents do not perceive a difference betweenHuawei and Apple in CSR activities, possibly due to two reasons: one is that the two are too similarto evaluate; the other is that the respondents do not know the real situation and feel hard to judge.Further research has been carried out on this. Six members of the project team collected CSR activitiescarried out in recent years by the two companies on official websites of Huawei and Apple, andcompiled them into documents. After carefully reading these materials and a formal discussion, thecomparative perceptions of CSR activities of the two companies in the state of complete informationwere determined, as shown in Table 5.
Table 5. Perceptions of CSR activities of Huawei and Apple under complete information condition.
CSR Activities Comparative Perception CSR Activities Comparative Perception
Co1 3 Em1 2Co2 −2 Em2 2Co3 −1 Em3 1Co4 0 Cs1 2En1 1 Cs2 2En2 −1 Cs3 2En3 −2
Converting the score of each CSR activity in Table 3 to a non-negative number by adding theabsolute value of the maximum negative number, the weighted average is calculated according to theperceptions in Table 5 and the non-negative scores (weights) of the various CSR activities. Then, this isconverted into the ratio of CSR differentiation degree, which is 9.4% under complete information.
Comparing the results in Table 5 with Table 4 and the two ratios, it can be found that: (1) thedegree of “0” in Table 5 decreases significantly, indicating that consumers can basically perceive the gapbetween the two companies and make appropriate choices when they understand the CSR activitiescarried out by the companies; (2) the ratio of CSR differentiation degree under complete information ismuch lower than that under incomplete information and, of course, the former is more accurate. This,on one hand, indicates that the CSR differentiation degree of the two companies is not great and, on theother hand, indicates that the two companies have insufficient CSR communication with consumers.Thus, the consumers do not know much about the CSR performance of the two companies.
Sustainability 2019, 11, 664 12 of 14
7. Discussion and Conclusions
This study highlights the importance of CSR differentiation to companies, and proposes a rigorousapproach to identify CSR differentiation, which lays a firm foundation for companies to implementCSR differentiation strategy.
This study offers three contributions to extant literature. First, unlike most extant literature thatdiscusses the concept and significance of CSR differentiation, this study first proposes an approachto identify CSR differentiation from the consumer’s view. The findings extend the extant literature.Second, this paper measures the consumer priorities for CSR activities using BWS, and obtains moredetailed prioritization of CSR activities than the extant literature. Third, this paper takes into accountthe influence of competitors on CSR and puts forward the concept of the consumers’ comparativeperceptions of CSR activities, which simplifies the measurement of consumer perception.
The following important managerial implications are obtained:
• Although CSR covers a wide range of fields, CSR activities are of a certain order of importance forconsumers. Therefore, companies should formulate appropriate CSR implementation strategieson the basis of taking into account the values they recognize, the CSR practice of competitors, theconsumers’ priorities degree to CSR activities, and the type of consumers, so as to obtain betterresponse from consumers.
• Due to asymmetric information, CSR conducted by companies may not be well understood byconsumers. Therefore, companies should not only do well, but also communicate with consumerson their CSR performance. Companies need to develop appropriate CSR communication strategiesfor consumers, and display their CSR advantages through traditional media, network media,marketing activities, product package labels (this is especially important), etc., so as to establishthe virtuous advantages compared with competitors known by ordinary consumers.
• Relevant literature shows that consumers have certain sensitivity to the motivation of companiesto fulfill CSR, and profit-driven motivation has a negative influence [32,33]. Therefore, CSRcommunication of companies must demonstrate the motivation to serve the society in good faithand should not be exaggerated or falsified. If consumers identify the motivation to pursue profits,the effect may be counterproductive. The controversy over Chen Guangbiao’s philanthropy inChina, which was exposed in the media a few years ago, is a sobering example. Chen Guangbiao’sbenevolence has been repeatedly questioned by the media as fake, which has negatively affectedhis company’s image. The trumpeting of good deeds has played a counterproductive effect.
• The activity “Set fair prices for products” ranks fifth out of 13 CSR activities, and it is at the bottomof the four activities of CSR to consumers. Obviously, this activity is not as important as peoplethink. Therefore, it is feasible for a socially responsible company to adopt an appropriate CSRpremium in product pricing according to CSR performance status.
There are some limitations to this study. For example: the samples in this study were notcompletely randomly selected; the results indicate that the samples of middle and high-incomerespondents, and middle-aged respondents, are relatively small; and the conclusions may be limitedto the mobile phone industry. Future studies will explore the impact mechanism of CSR differentiationon consumer response through empirical or experimental studies. In addition, the selection of casecompanies in this study (such as Huawei and Apple) is not of typical significance. The key is that theapproach in this paper is effective and applicable.
Author Contributions: Conceptualization, J.L. and S.S.; methodology, J.L. and F.Z.; software, J.L. and F.Z.;validation, S.S.; formal analysis, J.L. and F.Z.; investigation J.L. and S.S.; resources, J.L. and S.S.; data curation,F.Z.; writing—original draft preparation, J.L. and S.S.; writing—review and editing, S.S.; supervision, J.L. and S.S.;project administration, J.L.; funding acquisition, J.L.
Funding: This research was funded by the National Social Science Fund of China, grant number18BGL099.
Conflicts of Interest: The authors declare no conflict of interest.
Sustainability 2019, 11, 664 13 of 14
References
1. Li, X.; Zheng, C.; Liu, G.; Sial, M. The Effectiveness of Internal Control and Corporate Social Responsibility:Evidence from Chinese Capital Market. Sustainability 2018, 10, 4006. [CrossRef]
2. Romani, S.; Grappi, S.; Bagozzi, R.P. Corporate socially responsible initiatives and their effects onconsumption of green products. J. Bus. Ethics 2016, 135, 253–264. [CrossRef]
3. Kudłak, R.; Szöcs, I.; Krumay, B.; Martinuzzi, A. The future of CSR-Selected findings from a Europe-wideDelphi study. J. Clean. Prod. 2018, 183, 282–291. [CrossRef]
4. Hu, Y.; Chen, S.; Wang, J. Managerial Humanistic Attention and CSR: Do Firm Characteristics Matter?Sustainability 2018, 10, 4029. [CrossRef]
5. Sen, S.; Bhattacharya, C.B. Does doing good always lead to doing better? Consumer reactions to corporatesocial responsibility. J. Mark. Res. 2001, 38, 225–243. [CrossRef]
6. Bhattacharya, C.B.; Sen, S. Doing Better at Doing Good: When, why, and how consumers respond tocorporate social initiatives. Calif. Manag. Rev. 2004, 47, 9–24. [CrossRef]
7. Abbas, M.; Gao, Y.; Shah, S. CSR and Customer Outcomes: The Mediating Role of Customer Engagement.Sustainability 2018, 10, 4243. [CrossRef]
8. Dupire, M.; M’Zali, B. CSR Strategies in Response to Competitive Pressures. J. Bus. Ethics 2016, 148, 603–623.[CrossRef]
9. McWilliams, A.; Siegel, D. Corporate Social Responsibility: A Theory of the Firm Perspective. Acad. Manag.Rev. 2001, 26, 117–127. [CrossRef]
10. Siegel, D.S.; Vialiano, D.F. An Empirical Analysis of the Strategic Use of Corporate Social Responsibility.J. Econ. Manag. Strateg. 2007, 16, 773–792. [CrossRef]
11. Kotler, P. Marketing Management, 11th ed.; Prentice Hall: Upper Saddle River, NJ, USA, 2003; p. 315.12. Asif, M.; Searcy, C.; Zutshi, A.; Fischer, O.A.M. An integrated management systems approach to corporate
social responsibility. J. Clean. Prod. 2013, 56, 7–17. [CrossRef]13. Liao, P.C.; Liao, J.Q.; Wu, G.; Wu, C.L.; Zhang, X.L.; Ma, M.C. Comparing international contractors’ CSR
communication patterns: A semantic analysis. J. Clean. Prod. 2018, 203, 353–366. [CrossRef]14. Whait, R.B.; Christ, K.L.; Ortas, E.; Burritt, R.L. What do we know about tax aggressiveness and corporate
social responsibility? An integrative review. J. Clean. Prod. 2018, 204, 542–552. [CrossRef]15. Dahlsrud, A. How corporate social responsibility is defined: An analysis of 37 definitions. Corp. Soc.
Responsib. Environ. Manag. 2008, 15, 1–13. [CrossRef]16. European Commission. Green Paper: Promoting an European Framework for Corporate Social Responsibility.
Brussels, Belgium, 2001; p. 6. Available online: http://europa.eu/rapid/press-release_DOC-01-9_en.pdf(accessed on 24 June 2018).
17. Elkington, J. Cannibals with Forks: The Triple Bottom Line of 21st Century Business; Capstone Publishing Ltd.:Oxford, UK, 1999; pp. 25–30.
18. Freeman, R.E. Strategic Management: A Stakeholder Approach; Pitman: Boston, MA, USA, 1984; pp. 1–120.19. Turker, D. Measuring Corporate Social Responsibility: A Scale Development Study. J. Bus. Ethics 2009, 85,
411–427. [CrossRef]20. Öberseder, M.; Schlegelmilch, B.B.; Murphy, P.E. CSR practices and consumer perceptions. J. Bus. Res. 2013,
66, 1839–1851. [CrossRef]21. Öberseder, M.; Schlegelmilch, B.B.; Murphy, P.E.; Gruber, V. Consumers’ Perceptions of Corporate Social
Responsibility: Scale Development and Validation. J. Bus. Ethics 2014, 124, 101–115. [CrossRef]22. Wagner, T.; Bicen, P.; Hall, Z.R. The dark side of retailing: Towards a scale of corporate social irresponsibility.
Int. J. Retail Distrib. Manag. 2008, 36, 124–142. [CrossRef]23. Webb, D.J.; Mohr, L.A.; Harris, K.E. A re-examination of socially responsible consumption and its
measurement. J. Bus. Res. 2008, 61, 91–98. [CrossRef]24. Porter, M.E. Competitive Advantage; Free Press: New York, NY, USA, 1985; pp. 10–80.25. Lipovetsky, S.; Conklin, M. Best-Worst Scaling in analytical closed-form solution. J. Choice Model. 2014, 10,
60–68. [CrossRef]26. Louviere, J.; Lings, I.; Islam, T.; Gudergan, S.; Flynn, T. An introduction to the application of (case 1)
best–worst scaling in marketing research. Int. J. Res. Mark. 2013, 30, 292–303. [CrossRef]
Sustainability 2019, 11, 664 14 of 14
27. Auger, P.; Devinney, T.M.; Louviere, J.J. Using Best–Worst Scaling Methodology to Investigate ConsumerEthical Beliefs Across Countries. J. Bus. Ethics 2007, 70, 299–326. [CrossRef]
28. Costanigro, M.; Deselnicu, O.; Mcfadden, D.T. Product differentiation via corporate social responsibility:Consumer priorities and the mediating role of food labels. Agric. Hum. Values 2016, 33, 597–609. [CrossRef]
29. Rezaei, J.; Nispeling, T.; Sarkis, J.; Tavasszy, L. A supplier selection life cycle approach integrating traditionaland environmental criteria using the best worst method. J. Clean. Prod. 2016, 135, 577–588. [CrossRef]
30. Ahmadi, H.B.; Kasi-Sarpong, S.; Rezaei, J. Assessing the social sustainability of supply chains using BestWorst Method. Resour. Conserv. Recycl. 2017, 126, 99–106. [CrossRef]
31. Ahmad, W.N.; Rezaei, J.; Sadaghiani, S.; Tavasszy, L.A. Evaluation of the external forces affecting thesustainability of oil and gas supply chain using Best Worst Method. J. Clean. Prod. 2017, 153, 242–252.[CrossRef]
32. Becker-Olsen, K.L.; Cudmore, B.A.; Hill, R.P. The impact of perceived corporate social responsibility onconsumer behavior. J. Bus. Res. 2006, 59, 46–53. [CrossRef]
33. Vlachos, P.A.; Tsamakos, A.; Vrechopoulos, A.P.; Avramidis, P.K. Corporate social responsibility: Attributions,loyalty, and the mediating role of trust. J. Acad. Mark. Sci. 2009, 37, 170–180. [CrossRef]
© 2019 by the authors. Licensee MDPI, Basel, Switzerland. This article is an open accessarticle distributed under the terms and conditions of the Creative Commons Attribution(CC BY) license (http://creativecommons.org/licenses/by/4.0/).