Space use patterns of mountain hare ( Lepus timidus ) on the Alps
21
Editorial Manager(tm) for European Journal of Wildlife Research Manuscript Draft Manuscript Number: EJWR-D-09-00206R2 Title: Space use patterns of mountain hare (Lepus timidus) on the Alps Article Type: Original Paper Keywords: Mountain hare; Home range; Site fidelity; Overlap; Distribution edge Corresponding Author: Mr. Francesco Bisi, M.Sc. Corresponding Author's Institution: Università degli Studi dell'Insubria First Author: Francesco Bisi, M.Sc. Order of Authors: Francesco Bisi, M.Sc.; Mosè Nodari, Ph.D.; Nuno Miguel Dos Santos Oliveira; Elisa Masseroni; Damiano G Preatoni, Ph.D.; Lucas A Wauters, Ph.D.; Guido Tosi; Adriano Martinoli, Ph.D. Abstract: Populations on the limits of species' distribution can show different behavioral adaptations to strong ecological pressure than in the central part of the range. We investigated space use patterns of alpine mountain hare (Lepus timidus) at two areas on the southern edge of the species' range. We monitored 34 hares between 2005 and 2008, estimating home range size, overlap and site fidelity, and compared our results with space use in Scottish and North-European populations. Home ranges of mountain hares did not differ between two study areas with different habitat types. Subadult animals used larger ranges than adults and both age groups reduced home range size in autumn, a period that might be critical for hares due to changes in diet and/or high energy expenditure during the previous breeding season. Home ranges in these alpine populations were smaller than in Scandinavian populations, but within the range of populations in different habitat types in Scotland. Seasonal home ranges overlapped considerably, but differed among the sexes: male - female overlap was higher than same sex (male - male, female - female) spatial overlap. Seasonal shifts of home ranges were small and site fidelity remained high over the seasons, suggesting that resource distribution remained constant throughout the year and that the knowledge of an intensively frequented area is an important element of habitat quality. We concluded that habitat structure and availability of mates interact in affecting mountain hare space-use in alpine habitats.
-
Upload
uninsubria -
Category
Documents
-
view
2 -
download
0
Transcript of Space use patterns of mountain hare ( Lepus timidus ) on the Alps

Editorial Manager(tm) for European Journal of Wildlife Research Manuscript Draft Manuscript Number: EJWR-D-09-00206R2 Title: Space use patterns of mountain hare (Lepus timidus) on the Alps Article Type: Original Paper Keywords: Mountain hare; Home range; Site fidelity; Overlap; Distribution edge Corresponding Author: Mr. Francesco Bisi, M.Sc. Corresponding Author's Institution: Università degli Studi dell'Insubria First Author: Francesco Bisi, M.Sc. Order of Authors: Francesco Bisi, M.Sc.; Mosè Nodari, Ph.D.; Nuno Miguel Dos Santos Oliveira; Elisa Masseroni; Damiano G Preatoni, Ph.D.; Lucas A Wauters, Ph.D.; Guido Tosi; Adriano Martinoli, Ph.D. Abstract: Populations on the limits of species' distribution can show different behavioral adaptations to strong ecological pressure than in the central part of the range. We investigated space use patterns of alpine mountain hare (Lepus timidus) at two areas on the southern edge of the species' range. We monitored 34 hares between 2005 and 2008, estimating home range size, overlap and site fidelity, and compared our results with space use in Scottish and North-European populations. Home ranges of mountain hares did not differ between two study areas with different habitat types. Subadult animals used larger ranges than adults and both age groups reduced home range size in autumn, a period that might be critical for hares due to changes in diet and/or high energy expenditure during the previous breeding season. Home ranges in these alpine populations were smaller than in Scandinavian populations, but within the range of populations in different habitat types in Scotland. Seasonal home ranges overlapped considerably, but differed among the sexes: male - female overlap was higher than same sex (male - male, female - female) spatial overlap. Seasonal shifts of home ranges were small and site fidelity remained high over the seasons, suggesting that resource distribution remained constant throughout the year and that the knowledge of an intensively frequented area is an important element of habitat quality. We concluded that habitat structure and availability of mates interact in affecting mountain hare space-use in alpine habitats.

1 2 3 4 5 6 7 8 9 10 11 12 13 14 15 16 17 18 19 20 21 22 23 24 25 26 27 28 29 30 31 32 33 34 35 36 37 38 39 40 41 42 43 44 45 46 47 48 49 50 51 52 53 54 55 56 57 58 59 60 61 62 63 64 65
1
Space use patterns of mountain hare (Lepus 1
timidus) on the Alps 2
3
Francesco Bisi 1 , Mosè Nodari 1, Nuno Miguel Dos Santos Oliveira 3, Elisa 4
Masseroni 2, Damiano G. Preatoni 1, Lucas A. Wauters 1, Guido Tosi1 and 5
Adriano Martinoli1. 6
1 Department Environment-Health-Safety, Universiy of Insubria Varese, Via J.H. 7
Dunant 3, IT-21100 Varese, Italy. 8
2 Institute Oikos NGO Via Crescenzago 1, 20134 Milano. 9
3 Animal Biology Department, Faculty of Science, University of Lisbon. 10
11
Corresponding author: 12
Francesco Bisi 13
Department Environment-Health-Safety, Universiy of Insubria Varese, Via J.H. Dunant 3, IT-14 21100 Varese, Italy 15
Email: [email protected] 16
Phone Work: (+39) 0332 421538 17
Fax Work: (+39) 0332 421554 18
19
*ManuscriptClick here to download Manuscript: Bisi-etal-second-revision.doc Click here to view linked References

1 2 3 4 5 6 7 8 9 10 11 12 13 14 15 16 17 18 19 20 21 22 23 24 25 26 27 28 29 30 31 32 33 34 35 36 37 38 39 40 41 42 43 44 45 46 47 48 49 50 51 52 53 54 55 56 57 58 59 60 61 62 63 64 65
2
Abstract 20
Populations on the limits of species‟ distribution can show different behavioral 21
adaptations to strong ecological pressure than in the central part of the range. We 22
investigated space use patterns of alpine mountain hare (Lepus timidus) at two 23
areas on the southern edge of the species‟ range. We monitored 34 hares between 24
2005 and 2008, estimating home range size, overlap and site fidelity, and 25
compared our results with space use in Scottish and North-European populations. 26
Home ranges of mountain hares did not differ between two study areas with 27
different habitat types. Subadult animals used larger ranges than adults and both 28
age groups reduced home range size in autumn, a period that might be critical for 29
hares due to changes in diet and/or high energy expenditure during the previous 30
breeding season. Home ranges in these alpine populations were smaller than in 31
Scandinavian populations, but within the range of populations in different habitat 32
types in Scotland. Seasonal home ranges overlapped considerably, but differed 33
among the sexes: male - female overlap was higher than same sex (male – male, 34
female – female) spatial overlap. Seasonal shifts of home ranges were small and 35
site fidelity remained high over the seasons, suggesting that resource distribution 36
remained constant throughout the year and that the knowledge of an intensively 37
frequented area is an important element of habitat quality. We concluded that 38
habitat structure and availability of mates interact in affecting mountain hare 39
space-use in alpine habitats. 40
41
Keywords 42
Mountain hare; Home range; Site fidelity; Overlap; Distribution edge; 43

1 2 3 4 5 6 7 8 9 10 11 12 13 14 15 16 17 18 19 20 21 22 23 24 25 26 27 28 29 30 31 32 33 34 35 36 37 38 39 40 41 42 43 44 45 46 47 48 49 50 51 52 53 54 55 56 57 58 59 60 61 62 63 64 65
3
44
Introduction 45
46
Increasing rates of environmental change, exacerbated by climate warming and/or 47
growing human pressure (Sala et al. 2000; IPCC 2001), can lead to range 48
contractions or expansions, variation in population dynamics and cause (local) 49
extinction in species with narrow ecological niches (Thomas et al. 2006). 50
Populations on the limits of a species‟ distribution range are generally considered 51
to be under stronger ecological and genetic pressure than more central populations 52
(Hampe and Petit 2005; Holt and Keitt 2005; Pearson et al. 2009). Moreover, 53
populations at the edge of a species distribution may also have lower genetic 54
diversity, due to habitat fragmentation, lower effective population size and spatial 55
isolation (Eckert et al. 2008). Consequently, at range margins, the population 56
dynamics and spatial behaviour of a species are likely to differ with respect to 57
populations from the centre of the range. This can have strong implications for 58
species management/conservation strategies near range margins. Therefore, 59
exploring home range size, shape and internal structure is of general interest to 60
population and conservation ecologists since knowledge of the size, shape, 61
structure, and location of the home ranges is essential for defining and producing 62
effective management strategies (e.g. Conner et al. 1999; Hanski et al. 2000; Lurz 63
et al. 2000; Rühe and Hohmann 2004; Wauters et al. 2005). Here, we explore 64
space use of mountain hare (Lepus timidus, Linnaeus 1758) living in alpine 65
communities and compare our results with spacing behaviour in populations 66
living in the central part of their range. 67
Mountain hare is a boreo-alpine species with a wide distribution area (Angerbjörn 68
and Flux 1995; Thulin and Flux 2003) In Europe isolated alpine populations occur 69
above 1300 m in the mountains of France, Germany, Switzerland, Austria, 70
Slovenia and Italy (Couturier 1964; Isakovic 1970; Mitchell-Jones et al. 1999; 71
Thulin and Flux 2003; Nodari et al. 2005). Although the ranging and the spacing 72
behaviour of mountain hare have been studied in Scotland (Hewson 1976; 73
Hewson and Hinge 1990; Hulbert et al. 1996) and Scandinavia (Hiltunen et al. 74
2004; Dahl 2005a; Dahl 2005b; Kauhala et al. 2005; Hiltunen 2006), virtually 75

1 2 3 4 5 6 7 8 9 10 11 12 13 14 15 16 17 18 19 20 21 22 23 24 25 26 27 28 29 30 31 32 33 34 35 36 37 38 39 40 41 42 43 44 45 46 47 48 49 50 51 52 53 54 55 56 57 58 59 60 61 62 63 64 65
4
nothing is known about the social structure and home range characteristics of 76
Alpine mountain hare Lepus timidus varronis. 77
Here we report findings of an investigation into the home range and space use 78
patterns of mountain hares from two areas in the Central Alps (Lombardy, Italy) 79
which differ in habitat structure and composition. 80
81
Materials and methods 82
83
Study area 84
Mountain hares were studied in central Italian Alps in two different study areas. 85
San Giacomo di Fraele (named “SG”), is in the Stelvio National Park at 1950 86
m.a.s.l. nearby the artificial Cancano lakes (46°32‟ N, 10°16‟ E). The area is 87
dominated by a homogeneous dwarf mountain pine (Pinus mugo) woodland with 88
trees of both prostrate and arboreal habit. The undergrowth is composed of 89
heather (Erica carnea), juniper (Juniperus communis), blueberry (Vaccinium 90
myrtillus) and lingonberry (Vaccinium vitis-idaea). The second study area is in the 91
nearby Vezzola valley (named “VZ”) at 2050 m.a.s.l., approximately 6 km from 92
SG. (46°29‟ N, 10°16‟ E). The habitat is a mixed forest with similar proportions 93
of Norway spruce (Picea abies), Arolla pine (Pinus cembra) and larch (Larix 94
decidua) with a homogeneous central patch of mountain pine (Pinus mugo about 95
20 % of the entire forest). The undergrowth is composed mainly of heather (Erica 96
carnea) and rhododendron (Rhododendron ferrugineum) with juniper (Juniperus 97
communis) and blueberry (Vaccinium myrtillus). 98
99
Trapping and radio-tracking 100
101
Between March 2005 and March 2008, we trapped 34 mountain hares using 102
Tomahawk single door cat/rabbit collapsible traps (66 x 25 x 25 cm, model 205, 103
Tomahawk Live Trap Co, Tomahawk, WI, USA). In each study area, 25 traps 104
were placed in a grid at 70 m intervals, for a total effort of 1383 trap-nights. 105

1 2 3 4 5 6 7 8 9 10 11 12 13 14 15 16 17 18 19 20 21 22 23 24 25 26 27 28 29 30 31 32 33 34 35 36 37 38 39 40 41 42 43 44 45 46 47 48 49 50 51 52 53 54 55 56 57 58 59 60 61 62 63 64 65
5
Traps were covered with a synthetic outer shell fabric and a smaller wire mesh 1 x 10⁶
1 cm to prevent trapped hares being injured by predators. Traps were pre-baited 107
for at least one week with dry “alfalfa” (trade name of a Medicago sativa based 108
food preparation). The trapping period changed each year depending on snow 109
cover, usually from the beginning of January to the end of March. The traps were 110
activated at dusk and checked at dawn. We trapped and radio-tagged 21 adult hares 111
(10 males and 11 females), and 13 subadults (6 males and 7 females). We radio-collared 112
the hares with ATS adjustable necklace transmitters weighing 35g with a 24 hours 113
set mortality sensor (M1930 transmitters, Advanced Telemetry Systems Inc., 114
Isanti, MN, USA). Hares were sexed and aged (subadult, under 7-8 months old, or 115
adult) by observation of external genitals and by Stroh‟s tubercle palpation (Stroh 116
1931). Radio tagged hares were located using Wildlife receivers TRX-2000S 117
(150-151 MHz, Wildlife Materials Inc., Murphysboro, IL, USA) and three-118
elements ATS and Wildlife directional Yagi antenna. 119
The monitoring of the released animals began immediately after capture and were 120
followed constantly for 24 hours through homing-in (White and Garrott 1990) to 121
check that radio-collars did not disturb normal hare behaviour. In the following 122
stages we used triangulation (White and Garrott 1990) for the localisation of 123
animals: two or more operators simultaneously detected the bearings of the 124
signals coming from each animal using a 1 degree precision compass. On average, 125
the distance between operators and tracked animals was less than 1 km. We 126
monitored hares throughout the year one week per month, 6 hours per day, taking 127
one location (hereinafter called “fix”) every 15 minutes during day-time and 128
night-time (4 periods of 6 hours each, starting at 6:00, 12:00, 18:00 and 24:00). At 129
each fix, a hare‟s location and activity (1 = active, 2 = not active) were recorded. 130
131
Home range analysis 132
Subsequently all data were converted to the Italian coordinate reference system 133
(Gauss-Boaga, West zone, ED50 datum) in a GIS database Arcview 3.2 (ESRI 134
Inc. 1999), and Locate II 3.11 software (Nams 2000) calculated the animals‟ 135
locations from the triangulation bearings. For each year, we estimated home range 136
size at a seasonal basis: winter (December-March, ground continuously covered 137
with snow), spring-summer (April-August, also called “breeding season”, this is 138

1 2 3 4 5 6 7 8 9 10 11 12 13 14 15 16 17 18 19 20 21 22 23 24 25 26 27 28 29 30 31 32 33 34 35 36 37 38 39 40 41 42 43 44 45 46 47 48 49 50 51 52 53 54 55 56 57 58 59 60 61 62 63 64 65
6
the season with vegetation growth, mating and breeding activity), and autumn 139
(September-November, post-breeding season, with no vegetation growth and no 140
continuous snow cover). For hares that were monitored both as subadult and as 141
adult, all data were used and the individual was classified as subadult from its 142
capture until the end of the following spring-summer (maximum age of a 143
„subadult‟ 13-14 months), and as adult afterwards. Within each season, between 144
20 and 848 fixes were collected per individual (n = 119 home ranges estimates, 145
mean ± SD = 91± 110). 146
All home range analyses were performed using R software 2.9.0 (R Development 147
Core Team 2009). In a first step, we explored internal home range structure for 148
core areas of high activity, examining the utilisation distribution (UD, range size 149
included in 5% incremental isopleths containing between 20% and 95% of fixes) 150
of the fixed kernel density estimator (KDE; Kenward 2001). A one-way ANOVA 151
with size of range included in a given isopleth as dependent variable and isopleth 152
from the UD with a given % of fixes (at 5% increments from 20 to 95% of all 153
fixes) as class was calculated to define the core area. We estimated home range 154
size using the fixed kernel density estimator (KDE; Worton 1989) with adjusted 155
smoothing factor (KDE with hadj), following the method to calculate hadj 156
proposed by Wauters et al. (2007). 157
Home range overlap, within each season, was expressed as percentage of overlap 158
of a hare's range with the home range of all other hares (Wauters and Dhondt 159
1992), and the number of overlapping hares of each sex was determined. Since 160
capture-mark-recapture data indicated that > 85% of resident hares were radio-161
collared (Bisi et al., unpubl. data), we felt confident that the overlap analysis 162
revealed the true social system. 163
164
165
Statistical analysis 166
167
We used 95% and 85% KDE as dependent variable in general linear models 168
which explored effects of study area, season, sex and age-classes (subadults and 169
adults), using number of locations as covariate. Because some individuals were 170
monitored in different periods, individual was used as a repeated measure. Only 171

1 2 3 4 5 6 7 8 9 10 11 12 13 14 15 16 17 18 19 20 21 22 23 24 25 26 27 28 29 30 31 32 33 34 35 36 37 38 39 40 41 42 43 44 45 46 47 48 49 50 51 52 53 54 55 56 57 58 59 60 61 62 63 64 65
7
home range estimates based on more than 20 radio locations per season were 172
used. Data on seasonal home-range size did not deviate from a normal distribution 173
(Shapiro-Wilk statistic W > 0.9). A final model was selected using a backward 174
procedure excluding step by step from the complete model the factor that was 175
least significant until only significant factors were left. Interpretations of final 176
models were based on Tukey's HSD test (Honestly Significant Difference, 177
hereinafter indicated as HSDt). Distribution of residual values of each selected 178
final model did not deviate from a normal distribution (Shapiro-Wilk statistic, all 179
W > 0.9). 180
Data of % overlap with animals of the same sex or with animals of the opposite 181
sex did not deviate from a normal distribution (Shapiro-Wilk‟s W = 0.94, p = 182
0.10). Therefore we used % home range overlap with animals of either sex, 183
calculated from the annual 95% KDE home ranges of all hares resident in 2006 184
and 2008 (largest sample size), as the dependent variable in a general linear 185
model. We tested the fixed effects of study area (SG and VZ), season and a sex by 186
overlapping sex interaction (e.g. Wauters et al. 2005). The interaction term 187
allowed us to explore whether overlap differed among the sexes, in other words 188
whether there were differences in overlap for male by males, male by females, 189
female by males and female by other females. 190
We also tested whether overlap was affected by the local density of hares using a 191
linear regression of percentage overlap per individual on number of hares that 192
overlap the individual. 193
We explored site-fidelity of hares by calculating the percentage overlap of each 194
individual‟s home range in one season with its home range the next season. We 195
estimated four „season with season combinations‟ (hereinafter called „between 196
seasons effect‟) of site-fidelity, using the formula: O1,2/(A1+A2-O1,2), where 197
O1,2 = the common area between the two home ranges, A1 = the total area of the 198
first home range and A2 = the total area of the second home range (Dahl 2005a). 199
The four combinations were: (1) overlap winter with breeding season ranges, (2) 200
overlap breeding season with autumn ranges, (3) overlap winter with autumn 201
ranges, and (4) overlap of a seasonal home range between two consecutive years 202
(e.g. winter yrt – winter yrt+1). We used a general linear model to investigate 203
whether degree of site-fidelity (% between season overlap of an individual as 204
dependent variable) was affected by sex, study area and season. 205

1 2 3 4 5 6 7 8 9 10 11 12 13 14 15 16 17 18 19 20 21 22 23 24 25 26 27 28 29 30 31 32 33 34 35 36 37 38 39 40 41 42 43 44 45 46 47 48 49 50 51 52 53 54 55 56 57 58 59 60 61 62 63 64 65
8
206
207
Results 208
209
Core area analysis showed a significant increase in the pairwise comparison 210
between 85% and 90% isopleths (p < 0.001), thus the 85% KDE was used as core-211
area estimator. Both 95% (home range) and 85% KDE (core area) estimates of 212
range size were used as dependent variables in general linear models (see 213
methods). Since the significant explanatory factors in both models were the same, 214
we only present results for KDE95 home range estimates as response variable in 215
this and successive analysis. 216
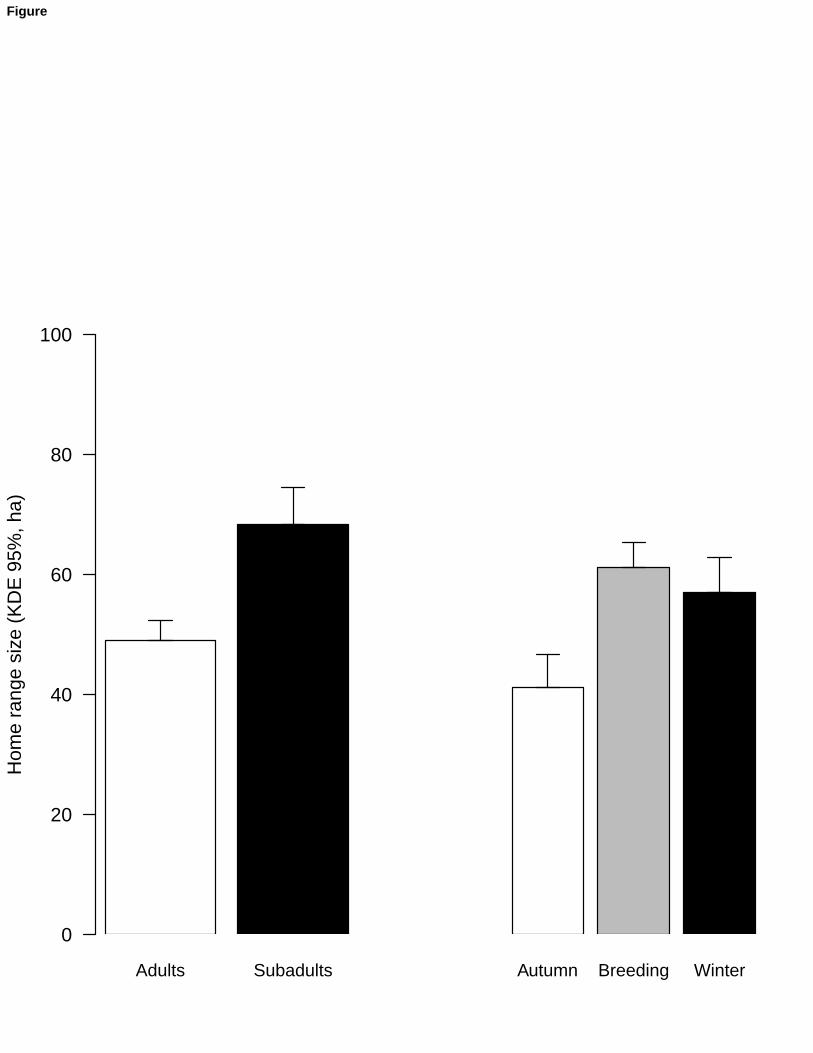
Home range size varied between 1.24 and 156.17 ha (n= 119, mean ± SD = 54.06 217
± 32.78 ha Table 1). Number of locations did not affect estimates of home range 218
size and there was no effect of study area and sex. None of the 2-factor 219
interactions were significant (Table 2). In the selected model only season and age 220
affected variation in home range size. Hares used smaller ranges in autumn than in 221
the breeding season (Season effect F2,115=4.19, p = 0.02, mean difference 20 ha, 222
HSDt p = 0.02) and subadults used larger ranges than adults (age effect 223
F1,115=4.89, p = 0.03, difference 13.9 ha) (Figure 1). 224
Overall home range overlap among hares was 38% ± 24 (n=418, range 0-100%). 225
In the general linear model, factors sex, season, area and their two-way 226
interactions were significant (sex F3,121=8.91; season F2,121=33.0; area F1,121=41.1; 227
all p < 0.001). Males were overlapped more strongly by females than any of the 228
other combination among the sexes (MF > MM HSDt p<0.01, MF > FM HSDt p 229
= 0.01, MF > FF HSDt p = 0.01) (Table 3). There was no difference in the degree 230
of intra-sexual overlap between the sexes (MM not different from FF, HSDt 231
p=0.09). Percentage overlap at study area SG was higher than at VZ, while in 232
autumn hares overlapped less than in the other seasons (WIN > AU and 233
BREEDING > AU, HSDt p < 0.01). A sex by area interaction (F3, 121 = 7.45, p < 234
0.001) was explained by different patterns of inter-sexual overlap being 235
significant only in SG but not in VZ (VZ: HSDt all p > 0.4). The area by season 236
interaction (F2, 121 = 7.93, p < 0.001) indicated that the higher overlap at SG than 237
VZ was significant only in winter (HSDt SG-VZ in winter p < 0.01; other seasons 238

1 2 3 4 5 6 7 8 9 10 11 12 13 14 15 16 17 18 19 20 21 22 23 24 25 26 27 28 29 30 31 32 33 34 35 36 37 38 39 40 41 42 43 44 45 46 47 48 49 50 51 52 53 54 55 56 57 58 59 60 61 62 63 64 65
9
p > 0.05). A sex by season interaction (F6, 121 = 2.40, p = 0.032) was caused by the 239
absence of a season effect on male-male overlap (MM: HSDt all between season 240
combinations, p>0.3) and different seasonal patterns for the other combinations of 241
overlapping sexes. Males were more strongly overlapped by females in winter 242
than in autumn (WIN > AU, HSDt p < 0.001), while females were more strongly 243
overlapped by males in the breeding season than in autumn (BREEDING > AU, 244
HSDt p < 0.001). Finally, intra-sexual overlap amongst females was most reduced 245
in autumn (WIN > AU and BREEDING > AU, HSDt p < 0.05). 246
Variation in number of overlapping animals explained 56% of variation in 247
percentage of overlap (F1,137=175.4; p < 0.0001; R2 = 0.56). 248
Site-fidelity of mountain hares, measured as an individual‟s % seasonal overlap, 249
was 33 11% (n = 125, range 2-59%). There was no effect of between-seasons 250
comparisons on degree of site-fidelity (between-season index F3,120=1.33, 251
p=0.27). In the final model only the factor area was significant (area F1,123=18.8, 252
p<0.01), with higher site-fidelity in SG (site fidelity mean ± SD, SG = 36 ± 9; VZ 253
= 28±12). 254
255
256
Discussion 257
258
Home range size 259
260
The use of different field methods and home range size estimators in studies of 261
spacing patterns reduces the reliability of between-study comparisons (e.g. 262
Marboutin 1997; Wauters et al. 2001). Therefore, we tried to limit our 263
comparisons to studies which used similar time-periods and range-size estimators 264
to our study. However, because few results are available throughout the species‟ 265
range, we also included some home range estimates obtained with minimum 266
convex polygons (100% or 95% MCP). In our areas, MCPs and 95% KDE 267
estimates were strongly correlated (100MCP: r = 0.59, df=117, p<0.01, 95MCP: r 268
= 0.89, df=117, p<0.01). 269

1 2 3 4 5 6 7 8 9 10 11 12 13 14 15 16 17 18 19 20 21 22 23 24 25 26 27 28 29 30 31 32 33 34 35 36 37 38 39 40 41 42 43 44 45 46 47 48 49 50 51 52 53 54 55 56 57 58 59 60 61 62 63 64 65
10
Average home range size (95% KDE) of mountain hares in our two areas (SG, 270
males 63 ha, females 46 ha; VZ, males 52 ha, females 60 ha) was smaller than in 271
Scandinavian populations (Sweden: males 219 ha, females 66 ha, Dahl 2005b; 272
Dahl and Willebrand 2005; Finland: both sexes 206 ha, Kauhala et al. 2005), but 273
within the range of populations in different habitat types in Scotland (95% MCP 274
males 22.0 ha, females 14.9 ha; 100% MCP males 113ha, females 89 ha; Hewson 275
and Hinge 1990; Hulbert et al. 1996; Rao et al. 2003). In Ireland, a median (100% 276
MCP) of 46 ha for males and 21.5 ha for females was recorded (Wolfe and 277
Hayden 1996). In our study areas there were no differences in home range size 278
between the sexes or between areas, despite higher densities at SG than VZ. 279
Compared with other alpine populations, home ranges in this study were on 280
average larger than in a nearby site (about 100 km) in the Swiss Alps (38 ha, 281
Genini-Gamboni et al. 2008), but much smaller than in the Austrian Alps 282
(National Park Hohen Tauern) where an average home range size of 551 ha was 283
reported (Slotta-Bachmayr 1998). These comparisons must be considered with 284
care as: a)only 8 hares were monitored for about one year in the Swiss study, and 285
b) there is no information on possible temporal variation of range size in the 286
Austrian study. In Austria, most of the tagged hares made regular movements of 287
more than 1 km, covering in some cases an elevation range of more than 400m, 288
within 24-hours. We reported this behaviour for only one of our tagged hares in 289
VZ area. Since home range size in Lagomorphs tends to be negatively correlated 290
with food-supply (Boutin 1984), the differences between alpine habitats could be 291
related to habitat related variation in food productivity among the study areas. 292
However, the cited studies did not give details on habitat structure and/or 293
productivity, prohibiting useful comparisons. 294
Weather conditions in the Alps are more similar to Scandinavia than to the British 295
Isles, with long cold winters with permanent snow cover for several months. If 296
weather affects space use, we would expect home ranges to be more similar to 297
Scandinavian than to Scottish populations, but this was not the case. Larger ranges 298
in Finland could be related with poor habitat productivity (unproductive barren 299
heath, Kauhala et al. 2005). Moreover where habitat structure is a mosaic of 300
patches of different quality, in terms of availability of suitable resting and 301
foraging sites, as reported in Scotland (Hewson and Hinge 1990; Hulbert et al. 302

1 2 3 4 5 6 7 8 9 10 11 12 13 14 15 16 17 18 19 20 21 22 23 24 25 26 27 28 29 30 31 32 33 34 35 36 37 38 39 40 41 42 43 44 45 46 47 48 49 50 51 52 53 54 55 56 57 58 59 60 61 62 63 64 65
11
1996; Rao et al. 2003), we suggest that space use is strongly related to habitat 303
structure. 304
In agreement with studies in Northern Europe (Kauhala et al. 2005; Dahl and 305
Willebrand 2005) we found significant differences in autumn home range 306
compared to home range size in the other seasons. In autumn, hares have just 307
finished a period of high energy expenditure due to breeding activity, and, in other 308
populations, the end of the breeding season is the period of the year when hares 309
have the lowest body mass (Merwe and Racey 1991). Hence, they might reduce 310
activity and space use to decrease their energy expenditure. An alternative but not 311
mutually exclusive hypothesis is that reduction of home-range size in autumn is 312
an anti-predatory strategy. Small ranges in autumn could be related to hares being 313
in mid-moult (Flux 1970b), becoming completely white in November – 314
December. Hence, lack of snow cover in November-early December could force 315
hares to reduce space use to decrease predation risk. 316
Studies exploring age effects on spatial behaviour (juveniles, subadults and 317
adults) of mammals have found different age-dependent responses in relation to 318
study species, population density, habitat type and sex (Wauters and Dhondt 319
1992; Wooding and Hardiski 1994; Forys and Humprey 1996). Usually, adults 320
have well defined behavioural tactics: they know where to find preferred 321
resources, and how and where to find mates. In contrast, behaviour of subadults 322
may gradually change with age: their home range could resemble that of adults or 323
completely change in size and location over time. In our study, subadults (less 324
than 13 months old), had larger home ranges than adults. Young hares may make 325
major exploratory movements to gather information about the habitat (patches 326
with good shelter and food), a behaviour not necessary for adults which have 327
already knowledge of the surrounding area. Another possible explanation is that 328
adults behave aggressively against subadults, forcing them to roam over larger 329
areas. 330
Overlap and site-fidelity 331
In Northern Europe, the mountain hare is documented as a non-territorial species 332
(Flux 1970b; Hewson 1976; Hewson 1988; Hewson and Hinge 1990; Dahl 333
2005b), and seasonal home ranges of mountain hares in the present study 334
overlapped considerably, indicating a lack of territorial behaviour in both males 335

1 2 3 4 5 6 7 8 9 10 11 12 13 14 15 16 17 18 19 20 21 22 23 24 25 26 27 28 29 30 31 32 33 34 35 36 37 38 39 40 41 42 43 44 45 46 47 48 49 50 51 52 53 54 55 56 57 58 59 60 61 62 63 64 65
12
and females. The degree of overlap was higher in SG than VZ, where densities 336
were also higher (winter densities in SG and VZ respectively 12 and 4 hares/km2, 337
our unpubl. data). Thus higher densities did not cause a reduction in home range 338
size of hares (no effect of study area on home range size), but resulted in higher 339
degrees of range overlap (see also Swihart 1986). This tendency was confirmed 340
by % overlap increasing with number of overlapping individuals. 341
In mammals, reproductive investment differs between the sexes and the type of 342
mating system affects spatial behaviour (Ostfeld 1990). Consequently, male space 343
use patterns tend to be mainly determined by distribution of potential mates, while 344
female spacing is mainly affected by distribution of food resources or safe shelter 345
for nursing young. In this study we found that intersexual overlap in males (thus 346
with females) was larger than intrasexual overlap in each sex. This could be 347
related to male mating behaviour, males trying to overlap with several oestrous 348
females over the breeding season (Flux 1970a; Angerbjörn and Flux 1995). In 349
fact, females were more strongly overlapped by males in the breeding season than 350
in autumn. 351
Mountain hares in our study areas did not shift their home ranges completely from 352
one season to the next, or from one year to the next. Hence, site-fidelity remained 353
high over the different seasons (Figure 2) and years, suggesting that distribution 354
of food resources and shelter did not vary throughout the year in our alpine 355
habitats. In contrast, hares in boreal forest used different areas in different seasons 356
in relation to distribution of resources (Dahl 2005b). This long-term (year to year) 357
site fidelity agrees with the hypothesis proposed by Dahl and Willebrand (2005) 358
that the knowledge of an intensively frequented area is an important element of 359
habitat quality. 360
Strong site-fidelity and a lack of long-distance movements in subadult hares 361
suggest that the species depends strongly on local habitat structure and/or 362
productivity. This implies that management of mountain hare populations in the 363
Alps should be based on monitoring of local hare densities in different 364
areas/habitats, using standardized indices (e.g. counts of hare signs on line 365
transects, our unpubl. data) that correlate with true numbers. Since space use data 366
suggest a limited capacity to colonize new areas, unmanaged hunting with no 367
consideration to population size estimates might increase risk of local extinction 368
of mountain hares in habitats where they occur at low densities. 369

1 2 3 4 5 6 7 8 9 10 11 12 13 14 15 16 17 18 19 20 21 22 23 24 25 26 27 28 29 30 31 32 33 34 35 36 37 38 39 40 41 42 43 44 45 46 47 48 49 50 51 52 53 54 55 56 57 58 59 60 61 62 63 64 65
13
Our data suggest that habitat structure, density and availability of mates all 370
interact in affecting mountain hare space-use. Home range size was larger than in 371
most Scottish studies (populations with relative high hare densities and productive 372
habitats) and smaller than in boreal forests where food availability is believed to 373
be lower than in our alpine sites. Unfortunately, quantitative measures of food 374
abundance are generally lacking, but detailed data on habitat structure and 375
composition can be obtained for most studies. Hence, comparative studies 376
exploring resource selection of mountain hares, over differently structured 377
landscapes and habitat types, will be necessary to understand how this species 378
adapts its space use to available habitat types and resources. 379
380
Acknowledgements 381
We wish to thank the Sondrio Province personnel: Andrea Vanotti, Maria Ferloni and all the game 382
wardens; the Stelvio National Park personnel: Luca Pedrotti, Alessandro Gugiatti and all the game 383
wardens. Alessandro Bianchi for the veterinary support. A. Guizzardi, P. Bertoglio, L. Perlasca, L. 384
Tarenghi, E. Trizio, F. Ossi, C. Rota for assistance with fieldwork. Peter Lurz and Annabel 385
Harrison reviewed the text and construvtive comments by two reviewers greatly helped to improve 386
the manuscript. The study was part of the MoHaRe (Mountain Hare Research) project, carried out 387
by University of Insubria, Varese and Istituto Oikos NGO, Milan. Financial support was provided 388
by the Wildlife Service of the Province of Sondrio and the Stelvio National Park. 389
References 390
391
Angerbjörn A, Flux JEC (1995) Lepus timidus. Mamm Species 495: 1-11 392 393 Boutin, S (1984) Effect of late winter food addition on numbers and movements of snowshoe hare. 394 Oecologia 62: 393-400 395 396 Conner M, Plowman B, Leopold BD, Lovell C (1999) Influence of time-in-residence on home 397 range and habitat use of bobcats. J Wildl Manage 63:261-269 398 399 Couturier M (1964) Le gibier des montagnes francaises. Arthaud, Grenoble 400 401 Dahl F (2005a) Distinct seasonal habitat selection by annually sedentary mountain hares (Lepus 402 timidus) in the boreal forest of Sweden. Eur J Wildl Res 51(3):163-169. doi:10.1007/s10344-005-403 0095-y 404 405

1 2 3 4 5 6 7 8 9 10 11 12 13 14 15 16 17 18 19 20 21 22 23 24 25 26 27 28 29 30 31 32 33 34 35 36 37 38 39 40 41 42 43 44 45 46 47 48 49 50 51 52 53 54 55 56 57 58 59 60 61 62 63 64 65
14
Dahl F, (2005b) Life and Death of the Mountain Hare in the Boreal Forest of Sweden. 406 Dissertation, Swedish University of Agricultural Sciences, Umea, Sweden 407 408 Dahl F, Willebrand T (2005) Natal dispersal, adult home ranges and site fidelity of mountain hares 409 Lepus timidus in the boreal forest of Sweden. Wildl Biol 11:309-317 410 411 Eckert CG, Samis KE, Lougheed C, (2008) Genetic variation across species' geographical ranges: 412 the central-marginal hypothesis and beyond. Mol Ecol 17:1170-1188. doi: 10.1111/j.1365-413 294X.2007.03659.x 414 415 ESRI Inc. (1999) Using ArcView GIS version 3.2. Environmental Systems Research Insitute, Inc., 416 Redlands, CA, USA 417 418 Flux JEC, (1970a) Life history of the mountain hare (Lepus timidus scoticus) in north-east 419 Scotland. J Zool (Lond) 161: 75-123 420 421 Flux JEC, (1970b) Colour change of mountain hares (Lepus timidus scoticus) in north-east 422 Scotland. J Zool (Lond) 162: 345-358 423 424 Forys EA, Humprey SR (1996) Home range and movements of the lower marsh rabbit in a highly 425 fragmented habitat. J Mammal 77 (4):1042-1048 426 427 Genini-Gamboni AS, Bisi F, Masseroni E, Nodari M, Preatoni DG, Wauters LA, Martinoli A, Tosi 428 G (2008) Home range dynamics of mountain hare (lepus timidus) in the Swiss Alps. Hystrix It J 429 Mammal 19 (2):77-83 430 431 Hampe A, Petit RJ (2005) Conserving biodiversity under climate change: the rear edge matters. 432 Ecol Lett 8:461-467. doi: 10.1111/j.1461-0248.2005.00739.x 433 434 Hanski IK, Stevens PC, Ihalempia P, Selonen V, (2000) Home range size, movements and nest-435 site use in the Siberian flying squirrel, Pteromys volans. J Mammal 81(3):798-809 436 437 Hewson R (1976) A Population Study of Mountain Hares (Lepus timidus) in North-East Scotland 438 from 1956-1969. J Anim Ecol 45(2):395-414 439 440 Hewson R, (1988) Spacing and habitat preference of mountain hares in Shetland. J Appl Ecol 441 25(2):397-407 442 443 Hewson R, Hinge MDC, (1990) Characteristics of the Home Range of Mountain Hares Lepus 444 timidus. J Appl Ecol 27(2):651-666 445 446 Hiltunen M, (2006) The ecology of the mountain hare (Lepus timidus) in managed boreal forests: 447 habitat associations at different forest scales. Dissertation, University of Helsinki, Finland 448 449 Hiltunen M, Kauhala K, Linden H (2004) Habitat use of the mountain hare Lepus timidus in 450 summer: the importance of different vegetation layers. Acta Theriol 49(4):479-490 451 452 453 Holt R, Keitt T (2005) Species' borders: a unifying theme in ecology. Oikos 108:3-6 454 455 Hulbert IAR, Iason GR, Elston DA, Racey PA (1996) Homerange sizes in a stratified upland 456 landscape of two lagomorphs with different feeding strategies. J Appl Ecol 33(6):1479-1488 457 458 IPCC (2001) Climate change 2001: the scientific basis. Contribution of working group I to the 459 third assessment report of the intergovernmental panel on climate change. Cambridge University 460 Press, Cambridge and New York 461 462 Isakovic I (1970) Game management in Yugoslavia. J Wildl Manage 34:800-812 463 464 Kauhala K, Hiltunen M, Salonen T (2005) Home ranges of mountain hares Lepus timidus in boreal 465 forests of Finland. Wildl Biol 11(3):193-200 466 467

1 2 3 4 5 6 7 8 9 10 11 12 13 14 15 16 17 18 19 20 21 22 23 24 25 26 27 28 29 30 31 32 33 34 35 36 37 38 39 40 41 42 43 44 45 46 47 48 49 50 51 52 53 54 55 56 57 58 59 60 61 62 63 64 65
15
Kenward RE, Clarke RT, Hodder KH, Walls SS (2001) Density and linkage estimators of home 468 range: nearest-neighbour clustering defines multinuclear cores. Ecology 82:1905-1920 469 470 Lindstedt S, Miller B, Buskirk S (1986) Home range, time, and body size in mammals. Ecology 471 67: 413-418 472 473 Lurz PWW, Garson PJ, Wauters LA (2000) Effects of temporal and spatial variations in food 474 supply on the space and habitat use of red squirrels, Sciurus vulgaris L. J Zool (Lond) 251:167-475 178 476 477 Marboutin E (1997) A note on home range size in the European hare (Lepus europaeus). Gibier 478 Faune Sauvage 14 (3):349-357 479 480 Merwe Van der M, Racey PA (1991) Body composition and reproduction in mountain hares 481 (Lepus timidus scoticus) in North-East Scotland. J Zool (Lond) 225:676-682 482 483 Mitchell-Jones AJ, Amori G, Bogdanowicz W, Krystufek B, Reijnders PJH, Spitzenberger F, 484 Stubbe M, Thissen JMB, Vohralik V, Zima J (1999) Atlas of European Mammals. Academic 485 Press, London 486 487 Nams VO (2006) Locate III User's Guide. Pacer Computer Software, Tatamagouche, Nova Scotia, 488 Canada. 489 490 Nodari M, Masseroni E, Preatoni DG, Wauters LA, Tosi G, Martinoli A (2005) Live-trapping 491 success of the mountain hare (Lepus timidus) in the southern Italian Alps. Hystrix It J Mammal 492 16:143-148 493 494 Ostfeld RS (1990) The ecology of territoriality in small mammals. Trends Ecol Evol 5:411-415 495 496 Pearson GA, Lago-Leston A, Mota C (2009) Frayed at the edges: selective pressure and adaptive 497 response to abiotic stressors are mismatched in low diversity edge populations. J Ecol 97:450-462. 498 doi:10.1111/j.1365-2745.2009.01481.x 499 500 R Development Core Team (2007) R: A language and environment for statistical computing. R 501 Foundation for Statistical Computing, Vienna, Austria. 502 503 Rao SJ, Iason GR, Hulbert IAR, Racey PA (2003) The effect of establishing native woodland on 504 habitat selection and ranging of moorland hares (Lepus timidus), a flexible forager. J Zool (Lond) 505 260:1-9. doi:10.1017/S0952836903003534 506 507 Rühe F, Hohmann U, (2004) Seasonal locomotion and home-range characteristics of European 508 hares (Lepus europaeus) in an arable region in central Germany. Eur J Wildl Res 50:101-111. doi: 509 10.1007/s10344-004-0049-9 510 511
Sala OE, Chapin FSIII, Armesto JJ, Berlow E, Bloomfield J, Dirzo R, Huber-Sanwald E, 512 Huenneke LF, Jackson RB, Kinzig A, Leemans R, Lodge DM, Mooney HA, Oesterheld M, Poff 513 NL, Sykes MT, Walker BH, Walker M, Wall DH (2000) Global biodiversity scenarios for the year 514 2100. Science 287:1770-1774. doi: 10.1126/science.287.5459.1770 515 516 Slotta-Bachmayr L, (1998) Biologie und Ökologie des Alpenschneehasen (Lepus timidus varronis 517 Miller 1901). Verbreitung, Raumnutzung, Aktivität und Habitatwahl in den Hohen Tauern. 518 Dissertation, Paris Lodron Universit, Salzburg, Austria 519 520 Stroh G, (1931) Zwei sichere Altersmerkmale beim Hasen. Berliner Tierärztliche Wochenschrift 521 12:180-181 522 523 Swihart RK (1986) Home range - Body mass allometry in rabbits and hares (Leporidae). Acta 524 Theriol 31: 139-148 525 526 Thomas CD, Franco AM, Hill JK (2006) Range retractions and extinction in the face of climate 527 warming. Trends Ecol Evol 21:415-416. doi: 10.1016/j.tree.2006.05.012 528

1 2 3 4 5 6 7 8 9 10 11 12 13 14 15 16 17 18 19 20 21 22 23 24 25 26 27 28 29 30 31 32 33 34 35 36 37 38 39 40 41 42 43 44 45 46 47 48 49 50 51 52 53 54 55 56 57 58 59 60 61 62 63 64 65
16
529 Thulin C-G, Flux JEC (2003) Lepus timidus (Linnaeus 1758). Schneehase. In: Niethammer J, F 530 Krapp (ed) Handbuch der Säugetiere Europas, Band 3/II, Lagomorpha. Aula Verlag, Wiebelsheim. 531 pp 155-185. 532 533 Wauters LA, Dhondt AA (1992) Spacing behaviour of the red squirrel, Sciurus vulgaris, variation 534 between habitats and the sexes. Anim Behav 43:297-311 535 536 Wauters L, Preatoni DG, Molinari A, Tosi G (2007) Radio tracking squirrels: performance of 537 home range density and linkage estimators with small range and sample size. Ecol Model 202:333-538 344. doi: 10.1016/j.ecolmodel.2006.11.001 539 540 Wauters LA, Bertolino S, Adamo M, van Dongen S, Tosi G (2005) Food shortage disrupts social 541 organization: the case of red squirrels in conifer forests. Evol Ecol 19:375-404. doi: 542 10.1007/s10682-005-8311-5 543 544 Wauters LA, Gurnell J, Preatoni D, Tosi G (2001) Effects of spatial variation in food availability 545 on spacing behaviour and demography of Eurasian red squirrels. Ecography 24:525-538 546 547 White GC, Garrott RA (1990) Analysis of wildlife radio-tracking data.. Academic, San Diego 548 549 Wolfe A, Hayden, TJ (1996) Home range sizes of Irish mountain hares on coastal grassland. Biol 550 Environ: Proc Royal Ir Acad 96B(3):141-146 551 552 Wooding JB, Hardisky TS (1994) Home range, habitat use and mortality of black bears in north-553 central Florida. Int Conf Bear Res Manage 9 (1): 349-356. 554 555 Worton B (1989) Kernel methods for estimating the utilization distribution in home range studies. 556 Ecology 70:164-168 557 558
559
560
561
Fig. 1 Differences in home ranges size (mean ± SE) considering age classes and seasons 562
563
Fig. 2 Examples of an individual‟s winter, breeding season and autumn home ranges (KDE 95%, 564
ha) 565
566
567

1 2 3 4 5 6 7 8 9 10 11 12 13 14 15 16 17 18 19 20 21 22 23 24 25 26 27 28 29 30 31 32 33 34 35 36 37 38 39 40 41 42 43 44 45 46 47 48 49 50 51 52 53 54 55 56 57 58 59 60 61 62 63 64 65
17
Table 1. Home range size in ha (mean ± SD), sample size and range 568
569
males females both sexes
Seasons
Autumn 48.39 ± 32.67 (15)
15.08 – 127.20
35.48 ± 30.51 (19)
1.21 – 135.80
41.17 ± 31.67 (34)
1.24 – 127.20
Breeding 56.48 ± 24.50 (23)
10.00 – 102.00
65.73 ± 30.45 (22)
16.00 – 119.52
61.19 ± 27.68 (45)
10.00 – 119.52
Winter 66.03 ± 39.82 (19)
10.64 – 157.16
48.82 ± 31.80 (21)
11.04 – 145.40
56.99 ± 36.41 (40)
10.64 – 145.40
All seasons 57.68 ± 32.55 (57)
10.00 – 157.16
50.73 ± 32.90 (62)
1.24 – 145.40
54.06 ± 32.76 (119)
1.24 – 157.16
Age-classes
Adults 52.56 ± 29.37 (45)
10.00 – 127.20
45.37 ± 31.89 (43)
1.24 – 145.40
49.05 ± 30.67 (88)
1.24 – 145.40
Subadults 76.86 ± 37.86 (12)
40.00 – 157.16
62.86 ± 32.72 (19)
19.68 – 121.52
68.28 ± 34.87 (31)
19.68 – 157.16
570
571
572
Table 2. General linear model testing effects of number of locations (Num), study area, season, sex 573
and age, and their two-way interactions on the mean home range size (estimated by 95% KDE) of 574
mountain hare in two areas of the Italian Alps. 575
Model parameters Statistics
Num F1, 100 = 0.01, p = 0.92
Study area F1,100 = 0.12, p = 0.73
Sex F1, 100 = 1.38, p = 0.24
Season F2, 100 = 4.14, p = 0.019
Age F1, 100 = 5.80, p = 0.018
Num*area F1, 100 = 0.54, p = 0.46
Num:*sex F1, 100 = 1.32, p = 0.25
Num*season F2, 100 = 0.14, p = 0.87
Num*age F1, 100 = 0.01, p = 0.91
Study area*sex F1, 100 = 3.16, p = 0.08

1 2 3 4 5 6 7 8 9 10 11 12 13 14 15 16 17 18 19 20 21 22 23 24 25 26 27 28 29 30 31 32 33 34 35 36 37 38 39 40 41 42 43 44 45 46 47 48 49 50 51 52 53 54 55 56 57 58 59 60 61 62 63 64 65
18
Study area*season F2, 100 = 2.02, p = 0.14
Study area*age F1, 100 = 0.02, p = 0.88
Sex*season F2, 100 = 1.70, p = 0.19
Sex*age F1, 100 = 0.89, p = 0.35
576
Table 3. Total percentage home range overlap by season (mean SD) for each combination of sex 577
overlapped by sex overlapper. 578
Season Male by males Male by females Female by males Female by females
Winter 97 68 213 148 114 55 153 99
Breeding
season
91 44 143 60 161 35 126 59
Autumn 19 22 71 66 37 42 49 43
579
580
581
582
Adults Subadults
Hom
e ra
nge
size
(K
DE
95%
, ha)
0
20
40
60
80
100
Autumn Breeding Winter
Figure

Figure