Habitat quality and population density drive occupancy dynamics of snowshoe hare in variegated...
12
610 Habitat quality and population density drive occupancy dynamics of snowshoe hare in variegated landscapes Daniel H. Thornton, Aaron J. Wirsing, James D. Roth and Dennis L. Murray D. H. ornton ([email protected]) and D. L. Murray, Dept of Biology, Trent Univ., Peterborough, ON K9J 7B8, Canada. DHT also at: Panthera, 8 West 40th Street, New York, NY, USA. – A. J. Wirsing, School of Environmental and Forest Sciences, Box 352100, Univ. of Washington, Seattle, WA 98195, USA. – J. D. Roth, Dept of Biological Sciences, Univ. of Manitoba, Winnipeg, MB R3T 2N2, Canada. e influence of habitat quality and population density on occupancy dynamics may surpass that of traditional metrics of area and isolation, but often this is not considered explicitly in studies of spatially structured populations. In landscapes that are not easily characterized as binary habitat/non-habitat (e.g. variegated landscapes), this influence may be even more important and occur at both local and landscape levels. It follows that occupancy dynamics may be driven by dispa- rate processes depending on how extinction or colonization relate to habitat quality and population density. We examined the relative influence of area, structural isolation, habitat quality, local population density, and neighborhood popula- tion density (i.e. population density in the landscape around a site) on the probability of extinction and colonization of snowshoe hare Lepus americanus across an expansive forest mosaic landscape (encompassing the northern third of Idaho). Habitat quality and population density were highly influential in determining extinction and colonization, whereas patch area and isolation were much less important. Sites with heavier vegetative cover at the site or landscape-level were more likely to be colonized and less likely to go extinct, and sites with greater local population density in the previous time step had lower probability of extinction. Sites embedded in high density neighborhoods also were less likely to go extinct, but not more likely to be colonized. We found a significant interaction between local and neighborhood population density on extinction in 1 yr, suggesting that the strength of demographic rescue may vary dependent on local site densities. Our results add to a growing literature showing that factors outside of structural metrics of area and isolation are important drivers of occupancy dynamics. Given the multi-scaled influence of habitat quality and population density on occupancy dynamics, our work also indicates that research on snowshoe hare must extend beyond simply assessing local factors to understand the spatial dynamics of populations. Occupancy dynamics in spatially structured populations largely have been understood by reference to the area- isolation paradigm, which states that extinction and colon- ization processes are controlled primarily by patch area and isolation, respectively (MacArthur and Wilson 1967, Hanski 1999). e area-isolation paradigm has guided research in fragmented or patchy environments, and heavily informs landscape ecology, metapopulation models, and applied conservation efforts (e.g. reserve design). However, for species inhabiting landscapes that are not easily con- ceptualized as binary habitat/non-habitat (e.g. variegated landscapes), or for generalist species that may be able to use, or move through, many habitat types of differing quality, area and isolation may be less important drivers of occu- pancy, or even difficult to measure when discrete patches cannot be easily defined (Manning and Lindenmayer 2004, Prugh et al. 2008, Price et al. 2009). Moreover, recent work reveals that even in heavily fragmented landscapes where patches are more easily defined, area and isolation are not always strong predictors of occupancy patterns and other factors may mediate or surpass their influence (Fleishman et al. 2002, Prugh et al. 2008, Kennedy et al. 2011). In particular, habitat quality and population density strongly influence occupancy dynamics. Habitat quality of focal sites influences survival, reproduction, and growth of species (omas 1994), and higher quality sites are less likely to go extinct and/or more likely to be recolonized (Schooley and Branch 2009, Kennedy et al. 2011, Robles and Ciudad 2012). Population density within focal sites has been found to influence extinction probability indepen- dently of habitat area, perhaps by reducing the likelihood of stochastic fluctuations leading to extinction (Schmidt and Pellet 2005, Franzén and Nilsson 2010). Although most of the work examining the influence of habitat quality and density on occupancy dynamics has focused at the level of individual patches or sites, landscape-level estimates of these parameters may also be important. Habitat quality of neighboring sites, and quality of surrounding matrix habitat have been found to influence occupancy dynamics in a variety of systems (Kennedy et al. 2011, Schooley and Branch 2011, Stouffer et al. 2011). Such landscape-scale effects of habitat quality on extinction Ecography 36: 610–621, 2013 doi: 10.1111/j.1600-0587.2012.07737.x © 2012 e Authors. Ecography © 2012 Nordic Society Oikos Subject Editor: Douglas A. Kelt. Accepted 5 September 2012
Transcript of Habitat quality and population density drive occupancy dynamics of snowshoe hare in variegated...
610
Habitat quality and population density drive occupancy dynamics of snowshoe hare in variegated landscapes
Daniel H. Thornton, Aaron J. Wirsing , James D. Roth and Dennis L. Murray
D. H. Th ornton ([email protected]) and D. L. Murray, Dept of Biology, Trent Univ., Peterborough, ON K9J 7B8, Canada. DHT also at: Panthera, 8 West 40th Street, New York, NY, USA. – A. J. Wirsing, School of Environmental and Forest Sciences, Box 352100, Univ. of Washington, Seattle, WA 98195, USA. – J. D. Roth, Dept of Biological Sciences, Univ. of Manitoba, Winnipeg, MB R3T 2N2, Canada .
Th e infl uence of habitat quality and population density on occupancy dynamics may surpass that of traditional metrics of area and isolation, but often this is not considered explicitly in studies of spatially structured populations. In landscapes that are not easily characterized as binary habitat/non-habitat (e.g. variegated landscapes), this infl uence may be even more important and occur at both local and landscape levels. It follows that occupancy dynamics may be driven by dispa-rate processes depending on how extinction or colonization relate to habitat quality and population density. We examined the relative infl uence of area, structural isolation, habitat quality, local population density, and neighborhood popula-tion density (i.e. population density in the landscape around a site) on the probability of extinction and colonization of snowshoe hare Lepus americanus across an expansive forest mosaic landscape (encompassing the northern third of Idaho). Habitat quality and population density were highly infl uential in determining extinction and colonization, whereas patch area and isolation were much less important. Sites with heavier vegetative cover at the site or landscape-level were more likely to be colonized and less likely to go extinct, and sites with greater local population density in the previous time step had lower probability of extinction. Sites embedded in high density neighborhoods also were less likely to go extinct, but not more likely to be colonized. We found a signifi cant interaction between local and neighborhood population density on extinction in 1 yr, suggesting that the strength of demographic rescue may vary dependent on local site densities. Our results add to a growing literature showing that factors outside of structural metrics of area and isolation are important drivers of occupancy dynamics. Given the multi-scaled infl uence of habitat quality and population density on occupancy dynamics, our work also indicates that research on snowshoe hare must extend beyond simply assessing local factors to understand the spatial dynamics of populations.
Occupancy dynamics in spatially structured populations largely have been understood by reference to the area-isolation paradigm, which states that extinction and colon-ization processes are controlled primarily by patch area and isolation, respectively (MacArthur and Wilson 1967, Hanski 1999). Th e area-isolation paradigm has guided research in fragmented or patchy environments, and heavily informs landscape ecology, metapopulation models, and applied conservation eff orts (e.g. reserve design). However, for species inhabiting landscapes that are not easily con-ceptualized as binary habitat/non-habitat (e.g. variegated landscapes), or for generalist species that may be able to use, or move through, many habitat types of diff ering quality, area and isolation may be less important drivers of occu-pancy, or even diffi cult to measure when discrete patches cannot be easily defi ned (Manning and Lindenmayer 2004, Prugh et al. 2008, Price et al. 2009). Moreover, recent work reveals that even in heavily fragmented landscapes where patches are more easily defi ned, area and isolation are not always strong predictors of occupancy patterns and other factors may mediate or surpass their infl uence
(Fleishman et al. 2002, Prugh et al. 2008, Kennedy et al. 2011). In particular, habitat quality and population density strongly infl uence occupancy dynamics. Habitat quality of focal sites infl uences survival, reproduction, and growth of species (Th omas 1994), and higher quality sites are less likely to go extinct and/or more likely to be recolonized (Schooley and Branch 2009, Kennedy et al. 2011, Robles and Ciudad 2012). Population density within focal sites has been found to infl uence extinction probability indepen-dently of habitat area, perhaps by reducing the likelihood of stochastic fl uctuations leading to extinction (Schmidt and Pellet 2005, Franz é n and Nilsson 2010).
Although most of the work examining the infl uence of habitat quality and density on occupancy dynamics has focused at the level of individual patches or sites, landscape-level estimates of these parameters may also be important. Habitat quality of neighboring sites, and quality of surrounding matrix habitat have been found to infl uence occupancy dynamics in a variety of systems (Kennedy et al. 2011, Schooley and Branch 2011, Stouff er et al. 2011). Such landscape-scale eff ects of habitat quality on extinction
Ecography 36: 610–621, 2013
doi: 10.1111/j.1600-0587.2012.07737.x
© 2012 Th e Authors. Ecography © 2012 Nordic Society Oikos
Subject Editor: Douglas A. Kelt. Accepted 5 September 2012
611
and colonization may be driven by several factors, including relationships between quality and population size or connec-tivity, or increased access to supplemental food resources in higher quality landscapes (Kennedy et al. 2011, Schooley and Branch 2011). Population density in the landscape around focal sites is only rarely assessed in studies of occu-pancy patterns, likely due to the diffi culty of measuring numbers at large-scales, but should relate strongly to the number of available dispersers around a site and thereby infl uence extinction (through rescue eff ects) and/or colon-ization. Cross-scale interactions between local and landscape-level population density may also be important, particularly if local site densities impact the strength of the demo-graphic rescue eff ect, or the ability of dispersers to settle in a site. Th is could lead to variability in the eff ect of demo-graphic rescue on extinction, dependent on local site densities (Fletcher 2007). Such interactions and their eff ect on occupancy dynamics have to our knowledge not been investigated empirically.
Th e snowshoe hare Lepus americanus is well known for its cyclic population dynamics and relationships with food and predators (Murray 2003, Krebs 2011). However, little work to date has focused on understanding occupancy dynamics of this species. Although a focus on occupancy dynamics may be moot in northern populations of snow-shoe hare that persist as a continuous distribution across the relatively homogenous boreal forest, populations of hares living at the southern range edge persist at low densi-ties and in habitats of varying quality, resulting in discon-tinuous occupancy (Wirsing et al. 2002, Griffi n and Mills 2009, Hodges et al. 2009). Moreover, the majority of research concerning snowshoe hare spatial ecology has focused on how local factors such as vegetation density infl uence population dynamics, with limited work examin-ing the infl uence of landscape-level factors on populations (and none that have assessed the infl uence of density at the landscape-level). Th is seems especially problematic given that populations along the southern range edge may be structured as metapopulations, source-sink, or patchy populations (Wirsing et al. 2002, Griffi n and Mills 2009). A better understanding of the relative infl uence of local and landscape factors on snowshoe hare occupancy and abundance patterns therefore is needed.
To examine snowshoe hare occupancy dynamics, we used a large-scale, multi-year dataset on occurrence and abundance of hare fecal pellets across a forest mosaic in northern Idaho. We assessed the relative infl uence of area, structural isolation, habitat quality, local population density, and neighborhood population density (i.e. population density of hares in the landscape around a site) on the probability of extinction and colonization. Specifi cally, we addressed the following questions: 1) do measures of patch area and structural isolation predominantly infl uence occu-pancy dynamics of hare in our system, or are habitat quality and population density the dominant drivers of extinction and colonization? 2) After accounting for local variation, do habitat quality and population density in the landscape around sites infl uence occupancy dynamics, and if so, is this response consistent between extinction and coloniza-tion? 3) Is there an interaction between local and neighbor-hood population density on extinction?
Methods
Study area
We conducted the study in the Idaho Panhandle National Forest (IPNF; 49 ° N, 117 ° to 47 ° N, 115 ° W; Fig. 1) from May 1999 to September 2003. Th e IPNF covers roughly 10 000 km 2 and features a diversity of montane habitats ranging from moist, high elevation forests dominated by subalpine fi r Abies lasiocarpa , mountain hemlock Tsuga mertensiana , and lodgepole pine Pinus contorta var latifolia , mid-elevation sites dominated by Douglas fi r Pseudotsuga menziesii , grand fi r Abies grandis , and cedar Th uja plicata , and low-elevation areas featuring ponderosa pine Pinus ponderosa . Forestry activities and fi re management have created a complex mosaic of diff erent age classes, ranging from seedlings to mature forest, as well as scattered clearcut patches (A. Zack, U.S. Forest Service pers. comm.). Th is landscape thus represents a mosaic of varying habitat quality, with fewer areas of true non-habitat (i.e. completely cleared areas, or non-forest habitat types such as grasslands), and is perhaps best conceptualized as a variegated landscape sensu McIntyre and Barrett (1992). Snowshoe hare are distributed continuously throughout the boreal forests of Canada and Alaska, and exist in more fragmented populations at higher elevation sites further south (e.g. in portions of the Cascade, Sierra Nevada, and Rocky Mountains, as well as mountainous regions in the eastern United States including New York, North Carolina, Virginia, and Tennessee; Murray 2003). Our study area is situated at the southern end of the contiguous portion of the snowshoe hare distribution. Cyclic properties of southern populations of hare remain poorly understood; populations may cycle, but with an amplitude that is much smaller than more northern popula-tions (Murray 2003).
Survey methodology
We established 615 pellet transects between June and October of 1999 across the IPNF (Fig. 1). We located transects roughly perpendicular to existing roadways and spaced them at least 1 km apart. Transect locations were chosen to refl ect the variety of stand types and manage-ment practices occurring in the forest, and therefore did not necessarily represent a random sample of available hare habitat. Each transect was 300-m long, and contained 10 plot locations arranged in a single line with 30-m spacing. At each plot location, 2 plot types were established: 1 rectangular (0.155 m 2 ) quadrat as per Krebs et al. (1987, 2001) and 1 circular plot (1 m 2 ) similar to Murray et al. (2002). On each plot type, pellets were counted and cleared yearly between May – September of 1999 – 2003. Roughly 12% of transects could not be surveyed each year due to road closures and fl ooding, and others were excluded from analysis due to lack of information concerning habitat variables; the total number of transects with occupancy and covariate information remained consistently high across years (x– � 543, range � 533 – 550). See Murray et al. (2002) for additional details on the sampling procedure.
To determine occupancy status on a transect, each year we recorded whether any of the plots (rectangular or

612
Legend
N
CANADA
Recolonization
ExtinctionUnoccupied both years
Occupied both years
0 12.5 25 50 km
Figure 1. Locations of 615 fecal-pellet transects for snowshoe hare Lepus americanus in the Idaho National Panhandle Forest, and changes in their occupancy status for the years 2000 – 2001. Note that ultimately a small subset of the 615 transects were not included in the fi nal analysis for each year because of several factors (e.g. lack of covariate information for some transects). Th e general location of study area within the United States is shown on the inset map.
circular) had fecal pellets present. We treated these data as presence-absence data in all further analysis, because detect-ability of hares given their presence at the site was near 1.0. Ancillary data from 12 nearby 10-ha study sites (each sampled in 2 consecutive years) where extensive live capture of hare and transect pellet counts were conducted at the same time (described in more detail below) indicated a low probability of false absence, with only 0.045 proportion of transects not having any pellets when at least 1 hare was
live captured at a site. Because hare pellets decompose slowly in our study area (Murray et al. 2005), our measure of occupancy of a transect refl ects occupancy at some point in time during the previous year. For the fi rst year of the study (1999) when pellet plots were established, our measure of occupancy may refl ect presence at longer time periods because pellets were counted on uncleared plots, and while these counts may have infl ated our landscape-wide occupancy and/or density estimates, uncleared plots can be

613
useful for relative ranking of snowshoe hare abundance between sites (Murray et al. 2002, Mills et al. 2005). Results of analysis utilizing data from 1999 (i.e. extinction and colonization models for 2000) were generally consistent with other years, and we therefore felt justifi ed including data from uncleared plots in our analysis. We determined extinction and colonization along a transect by comparing occupancy status between consecutive years (1999 – 2000, 2000 – 2001, 2001 – 2002, 2002 – 2003) and creating a binary variable representing extinction and colonization for each pair of years.
Explanatory variables
We separated explanatory variables into 5 distinct groups: 1) spatial and habitat structure variables in the immediate vicinity of transects that we expected a priori were related to habitat quality, 2) habitat structure in the landscape around transects, 3) local population density (density at the transect site), 4) neighborhood population density (i.e. population density in the landscape around transects; Table 1), and 5) area of the forest stand in which each transect was located, and structural isolation of the transect
(% of forest in a 5-km buff er around the transect site). For spatial variables, we determined elevation of the midpoint of the transect based on the National Elevation Data for Idaho, and average February snowfall and annual precipitation from the period 1961 – 1990 (Hijmans et al. 2005). Because of strong correlation (r � 0.65) between elevation and snowfall/rainfall, only elevation was retained as a predictor in the fi nal analysis. We also recorded slopes for each transect based on clinometer measurements at transect midpoints.
We recorded a variety of habitat variables at the transect and landscape-level (Table 1): horizontal and vertical cover were measured using coverboard and densiometer readings, respectively, and refl ected readings in 4 cardinal directions at 0 – 1 and 1 – 2 m heights at each plot location. Vertical and horizontal cover measurements at 0 – 1 and 1 – 2 m were highly correlated (r � 0.7) and therefore averaged (Table 1). Higher values for these 2 variables indicate sites with less vertical or horizontal cover. We also determined overall shrub and tree canopy closure at each plot based on estab-lished ocular estimates (Murray et al. 1994). Th ese were coded as ordinal variables ranging from low to high at each plot (Table 1).
Landscape-level estimates of habitat quality were obtained using 300 m buff ers around each transect that were overlaid
Table 1. Explanatory variables included in the analysis of extinction and colonization.
Variable (abbreviation)Distribution
(mean, range 1 ) Description
UTM Northing coordinates (UTMN) Continuous UTM Northing coordinate of midpoint of transectUTM Easting coordinates (UTME) Continuous UTM Easting coordinate of midpoint of transect
Local-level spatial/habitat variablesElevation (EL, m) Continuous
(1237, 732 – 1920)Elevation of midpoint of transect
Slope (SL, %) Continuous (39, 1 – 85) Slope at midpoint of transectVertical cover (VC) Continuous (25, 0 – 93) Average densiometer reading along the transect (higher values indicate
less vertical cover)Horizontal cover (HC) Continuous (10, 1 – 72) Average coverboard reading along the transect (higher values indicate
less horizontal cover)Shrub canopy closure (SCC) Ordinal Ocular estimate of shrub canopy closure (%) along the transect:
1 � � 6%, 2 � 6 – 25%, 3 � 26 – 50%, 4 � 51 – 75%, 5 � � 76%Tree canopy closure (TCC) Ordinal Ocular estimate of tree canopy closure (%) along the transect:
1 � � 6%, 2 � 6 – 25%, 3 � 26 – 50%, 4 � 51 – 75%, 5 � � 76%
Landscape-level habitat variablesPredominant forest type in 300-m
buffer (PFT)Categorical Forest type with the greatest areal coverage in the buffer, combined into
5 categories: C (cedar), DF-WH-GF-L (Douglas-fi r/western hemlock/grand-fi r/larch), LP (lodgepole pine), WP-PP (white pine/ponderosa pine), SAF (spruce/subalpine fi r/mountain hemlock)
Predominant forest age class in 300-m buffer (PFAC)
Ordinal Forest age class with the greatest areal coverage in the buffer, ordered from young to old: 1 � seedling/saplings (trees � 5 ″ dbh), 2 � pole timber (trees 5.0 – 8.9 ″ dbh), 3 � saw timber (non old-growth trees � 9.0 ″ dbh), 4 � old growth (trees over 150 yr old and � 21 ″ dbh)
Local population variablePopulation density along transect (PD) Continuous 2 Population density estimate for each transect per year (no. ha � 1 )
Neighborhood population variablePopulation density in 5-km buffer
(PD-NEIGH)Continuous 2 Density of snowshoe hare in the landscape around transects (based on
average density value of all transect within a 5-km buffer of each transect, not including the focal transect)
Area and structural isolationPatch area (PA, acres) Continuous (74, 7 – 559) Area of the forest stand containing each surveyed transect% forest in landscape (IS) Continuous (80, 34 – 97) Percent of forest remaining in a 5-km buffer around each transect
1 For continuous variables only (excluding UTM coordinates). 2 Descriptive statistics not given as values changed in each year of the study.

614
including the focal transect) that fell within this buff er. A 5-km radius was chosen a priori because it likely encom-passes maximum dispersal distances of snowshoe hares (Murray 2003) and therefore should refl ect the scale at which the rescue eff ect likely operates. Moreover, the density of our sampling was necessarily low due to the size of our study area, which precluded the use of smaller buff er sizes for assessing neighborhood eff ects. Th e use of a buff er to defi ne neighborhood eff ects, as opposed to alternatives such as distance-weighting schemes (where the neighborhood hare density is defi ned as a function of density in surrounding transects, weighted by distance), was also justifi ed because this was most comparable to our buff er measure of structural isolation. We note that our study was suffi ciently intensive that multiple transects overlapped each buff er (mean � SD � 6.8 � 3.5 transects per buff er), implying that our esti-mates of neighborhood population densities were adequately captured by the buff er. Note that density estimates from larger buff ers (7.5 and 10 km) were highly correlated with those from our 5-km buff er (r � 0.80 and 0.68, respectively).
We also determined the area of the forest stand that contained each transect. Because some transects crossed more than 1 stand, we could only determine stand area for those transects that had at least 6 plot-pairs located in a single stand, as this number supplied reliable information regarding snowshoe hare abundance and distribution (Th ornton et al. 2012). Th erefore, when analyzing the rela-tive infl uence of area and structural isolation on occupancy dynamics, we used a subset of 365 transects from the total number surveyed (see below). Structural isolation was calculated as the percent of forest in the 5 km buff er around the transect site, based on a gap analysis vegetation dataset (US Geological Survey 2011). Correlation coeffi -cients between all continuous variables included in the fi nal analysis were � 0.50, and variance infl ation factors were � 3.0 for all explanatory variables.
Statistical analysis
We used generalized linear models with a binomial probabil-ity distribution and logit link to determine the infl uence of our explanatory variables on annual transect occupancy dynamics (i.e. extinction and colonization). Given that our predictor variables of local and neighborhood population size changed values every year, we decided to model indi-vidual years separately. We standardized all continuous variables to mean 0 and 1 unit standard deviation for ease of comparison of model parameters (Quinn and Keough 2002). We performed 2 separate analyses on the data. To address question 1 (the relative infl uence of area and isolation vs habitat quality and population density), we used the smaller subset of transects that had associated data on patch area. We tested a series of models to determine which sets of factors were most important in driving occupancy dynamics. Th ese models included: 1) spatial location (UTM coordinates of the transect site); 2) local vegetative habitat quality (the best 2 of the 4 vegetative variables in Table 1 based on univariate models); 3) spatial habitat quality (elevation � slope); 4) local and neighborhood population density; and 5) area and structural isolation. We ignored
on the vegetation map for the study area (IPNF Timber Stand Management Record System, � www.fs.usda.gov/detail/ipnf � ), and we determined the predominant forest type and forest age-class for each buff er. Forest types were combined into 4 categories based on tree species associations and likely infl uence on hare prevalence and abundance (Table 1; Th ornton et al. 2012). Th e study area was largely dominated by 1 forest type (Douglas-fi r/western hemlock/grand-fi r/larch), which accounted for 55% of the study area, with the remaining 4 categories each covering between 8 and 15%. We coded the predominant forest age-class in the buff er as an ordinal variable ranging from young to old age classes (Table 1).
We determined population density along each transect based on the average number of pellets collected on each plot type (rectangular and circular). Use of pellet counts for estimating hare density has been validated for our study area (Murray et al. 2002) as well as more broadly across the hare distribution (Krebs et al. 1987, 2001, Mills et al. 2005, Homyack et al. 2006). Given that we included 2 plot shapes in our design, we estimated hare densities from pellet numbers in rectangular plots using the relationship established for the Yukon (Krebs et al. 2001), whereas those from circular plots were derived from the exponential equation for northern Idaho (Murray et al. 2002). Although Murray et al. (2002) found that circular plots performed better as a density estimator for this region of Idaho, hare density estimates based on the 2 plot types were highly correlated (r ≈ 0.75 for any given year), and subsequent analyses based on densities from each plot type considered separately were qualitatively similar. In light of these simi-larities, and to make our results more comparable with other studies across the continent employing rectangular plots, we averaged values from the 2 estimates in our analyses.
Hodges and Mills (2008) suggested that adequate esti-mates of densities based on pellet counts require at least 50 plots although the spatial scale for the application of this guideline is not clear. Regardless, our 20 plots clearly falls below this number so to validate our sample design we analyzed the relationship between densities obtained via pellet counts using 20 and 100 plots, and independently-derived snowshoe hare population density estimates (Murray et al. 2002). Th is dataset comprised 12 10-ha sites where densities of hares were estimated via capture – recapture techniques and radio-telemetry in 2 consecutive years. Each site was also surveyed for hare pellets using 5 transects composed of 10 rectangular and 10 circular plots (identical to our transects in the IPNF; Murray et al. 2002). We randomly selected 1 transect from each of the sites, and correlated pellet counts with live-capture density estimates. We repeated this process 1000 times, and compared Pearson correlation coeffi cients obtained using a single transect per site (20 plots) versus those obtained using all 5 transects per site (100 plots). Th e mean correlation coeffi cients using 20 plots (0.69) was comparable to that using all 100 plots (0.72), indicating our use of a single transect comprising 20 plots was appropriate for estimating relative densities of hares on the IPNF.
To determine neighborhood population density of hares, we created a 5-km buff er around the midpoint of each transect and averaged the density of all transects (not

615
landscape-level habitat and hare density on occupancy dynamics (Fletcher and Koford 2002, Smith et al. 2010). AICc was used to compare model fi t for each year and for calculating model weights (Burnham and Anderson 2002). We evaluated the predictive performance of our extinction and colonization models using receiver operating charac-teristic (ROC) curves, and calculated the area under the curve (AUC) as our measure of accuracy. AUC is a single measure of accuracy that ranges from 0.5 (no discrimina-tion) to 1.0 (perfect discrimination). Interpretation of the AUC value is straightforward. For example, with models of extinction, an AUC of 0.70 indicates that 70% of the time, a transect selected randomly from those that went extinct will have a higher predicted probability of extinction than a transect selected randomly from those that did not go extinct. AUC values � 0.70 indicate mod-els with reasonable discrimination capacity (Pearce and Ferrier 2000).
We examined parameter estimates and standard errors of best-fi t models identifi ed in the previous analysis to deter-mine which of the explanatory variables was most infl uen-tial. Hierarchical partitioning analysis was also performed to assess the relative infl uence of explanatory variables included in best-fi t models. Hierarchical partitioning ana-lysis calculates the increase in model fi t associated with each predictor variable by averaging the goodness-of-fi t increase (change in log-likelihood) across the hierarchy of models in which the variable appears (Chevan and Sutherland 1991). Th is analysis estimates the independent explanatory power of a variable, which is the eff ect on a response variable attributable solely to that particular variable (Chevan and Sutherland 1991, Mac Nally 2000).
We recognize that analyses of species – environment relationships may be subject to problems associated with spatial autocorrelation (Lichstein et al. 2002). We therefore evaluated residuals of best-fi t models for evidence of spatial autocorrelation using Moran ’ s I correlograms (Fortin and Dale 2005). Given our large study area, we used 20 lag distances at 5 km intervals (0 – � 5 km, 5 – � 10 km, … 95 – � 100 km). Signifi cance was tested with Bonferroni corrections, where the i th lag was tested at α � 0.05/ i (Fortin and Dale 2005). All statistical analyses were per-formed in R (R Development Core Team).
Results
Mean study-wide estimates of snowshoe hare occupancy and density increased from 2000 to 2003, with values for 1999 in the middle range of those years (Fig. 2). Excluding estimates from 1999 due to the uncleared status of plots in that year, these data indicate a general expansion and increase in snowshoe hare populations during our study. Th is is refl ected in the rates of extinction and colonization. Twenty-two, 15, 6, and 8% of occupied sites went extinct in 2000, 2001, 2002, and 2003 respectively. Forty-four, 40, 66, and 51% of unoccupied sites were colonized over that same time period. We did not detect evidence for strong spatial autocorrelation in the residuals of best-fi t models (Moran ’ s I values � 0.20 for all lag distances). AUC values of best-fi t models indicate that our models had good discriminative
landscape measures of habitat quality in this analysis due to concerns over the large number of parameters needed for estimating the categorical groupings in this variable set (Table 1). We tested each model singly, and each possible combination of 2 of the models (15 total models). We did not test more complex models given sample size con-straints. We used Akaike ’ s information criterion adjusted for small sample sizes (AICc) to compare the relative fi t of each set of models for each year and for calculating model weights (Burnham and Anderson 2002). To obtain estimates of the relative infl uence of each set of variables (e.g. habitat quality, area � isolation, etc.), we calculated the relative importance measure of Burnham and Anderson (2002) for each year by summing AIC weights for all models where those variables appeared. We then averaged across all 4 yr of the study to obtain a mean relative importance value for each set of variables.
To address questions 2 and 3, we analyzed the entire dataset of transects (approximately 543 yr � 1 ), and ignored structural measures of area and isolation (this was justifi ed based on the results of the above test; see Results). Inclusion of all the transects allowed us to investigate a greater number of parameters and cover a larger overall area of Idaho. As a fi rst step in this analysis, we eliminated explanatory variables that did not have a strong univariate (p � 0.10) infl uence on the response. For the predominant forest age class in the 300 m buff er, we a priori expected to observe a non-linear relationship because both young and old age classes tend to have lower levels of vertical and/or horizontal cover compared to mid-successional age classes (Murray 2003, Th ornton et al. 2012). We therefore included the expression ‘ predominant forest age class � predominant forest age class 2 ’ in the models to capture this eff ect. After pre-screening, we built an increasingly com-plex series of regression models. We started by testing a base model that included only UTM northing and east-ing coordinates of the transect to account for broad-scale spatial patterns, or only included an intercept if the UTM variables did not pass the pre-screening test (model B). Subsequently, we added local spatial and habi-tat variables (model B � H), and then added landscape-level habitat measures (model B � H � L). We then added local population density along the transect (in the previous year) for extinction models (model B � H � L � P). Population density along the transect was not used in colonization models, for by defi nition the density along transects in the previous year was 0 when modeling coloni-zation. Finally, we added our neighborhood estimate of population density (model B � H � L � P � N for extinc-tion, or model B � H � L � N for colonization). We also tested an additional model for extinction, which included an interaction term between local and neighborhood population density, as well as main eff ects for these vari-ables (model B � H � L � P � N � P � N). We expected the infl uence of neighborhood density to be more impor-tant when local site densities were low vs high; this pattern would be supported by a signifi cant positive interaction term. We employed a nested modeling design because this allowed us to assess the infl uence of landscape-level vari-ables after accounting for local variation along transects. Th is approach provided a conservative test of the eff ect
616
of extinction. Inclusion of these metrics substantially reduced AICc values from the base model, and several habi-tat and spatial metrics were present in all best-fi t models for extinction (Table 3); at least 1 of these metrics was highly infl uential for all years (Table 4). Not surprisingly, hares occurring on sites with lesser vertical cover were more likely to go extinct. In 2001 and 2002, hares were more likely to go extinct on higher elevation sites, and sites with a greater average slope (Table 4), which likely refl ects some aspect of habitat quality (e.g. snow depth or mean temperature). Landscape-level estimates of habitat quality were also impor-tant, and this eff ect was due entirely to the predominant age class in the 300-m buff er (predominant forest type in the buff er never passed the pre-screening test). Predominant age class in the 300-m buff er around transects reduced AICc values from the local habitat models in 3 of 4 yr. Hares inhabiting sites surrounded by either young (i.e. seedlings/saplings) or old growth age classes were more likely to go extinct.
Local spatial and habitat variables exerted a strong positive infl uence on probability of colonization. Addition of these variables resulted in a substantial improvement in model fi t from base models (Table 3). Highly infl uential
capacity in almost all years, with values of 0.81, 0.78, 0.84, and 0.78 for extinction models in 2000 – 2003, and 0.67, 0.75, 0.83, and 0.74 for colonization models in 2000 – 2003.
Relative infl uence of area/isolation vs habitat quality/population density
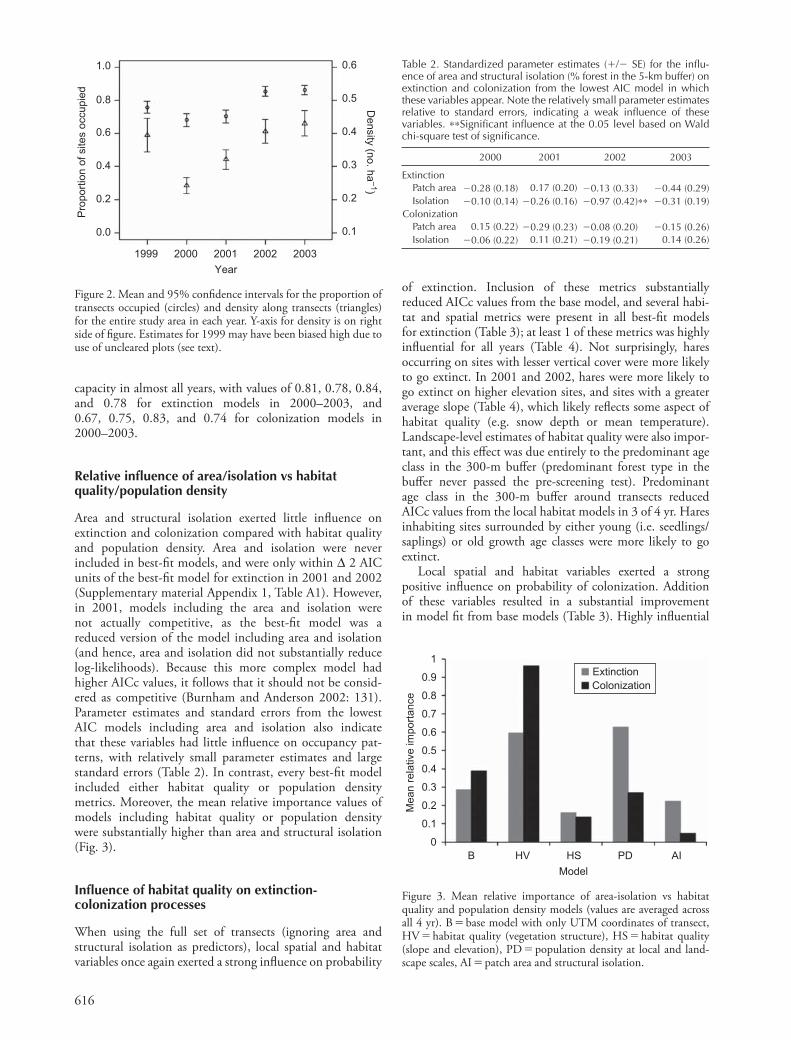
Area and structural isolation exerted little infl uence on extinction and colonization compared with habitat quality and population density. Area and isolation were never included in best-fi t models, and were only within Δ 2 AIC units of the best-fi t model for extinction in 2001 and 2002 (Supplementary material Appendix 1, Table A1). However, in 2001, models including the area and isolation were not actually competitive, as the best-fi t model was a reduced version of the model including area and isolation (and hence, area and isolation did not substantially reduce log-likelihoods). Because this more complex model had higher AICc values, it follows that it should not be consid-ered as competitive (Burnham and Anderson 2002: 131). Parameter estimates and standard errors from the lowest AIC models including area and isolation also indicate that these variables had little infl uence on occupancy pat-terns, with relatively small parameter estimates and large standard errors (Table 2). In contrast, every best-fi t model included either habitat quality or population density metrics. Moreover, the mean relative importance values of models including habitat quality or population density were substantially higher than area and structural isolation (Fig. 3).
Infl uence of habitat quality on extinction-colonization processes
When using the full set of transects (ignoring area and structural isolation as predictors), local spatial and habitat variables once again exerted a strong infl uence on probability
1ExtinctionColonization
0.8
0.9
0.7
0.6
0.5
0.4
Mea
n re
lativ
e im
porta
nce
0.3
0.2
0.1
0B HV HS PD AI
Model
Figure 3. Mean relative importance of area-isolation vs habitat quality and population density models (values are averaged across all 4 yr). B � base model with only UTM coordinates of transect, HV � habitat quality (vegetation structure), HS � habitat quality (slope and elevation), PD � population density at local and land-scape scales, AI � patch area and structural isolation.
Table 2. Standardized parameter estimates ( � / � SE) for the infl u-ence of area and structural isolation (% forest in the 5-km buffer) on extinction and colonization from the lowest AIC model in which these variables appear. Note the relatively small parameter estimates relative to standard errors, indicating a weak infl uence of these variables. ∗ ∗ Signifi cant infl uence at the 0.05 level based on Wald chi-square test of signifi cance.
2000 2001 2002 2003
ExtinctionPatch area � 0.28 (0.18) 0.17 (0.20) � 0.13 (0.33) � 0.44 (0.29)Isolation �0.10 (0.14) � 0.26 (0.16) � 0.97 (0.42) ∗ ∗ � 0.31 (0.19)
ColonizationPatch area 0.15 (0.22) � 0.29 (0.23) � 0.08 (0.20) � 0.15 (0.26)Isolation � 0.06 (0.22) 0.11 (0.21) � 0.19 (0.21) 0.14 (0.26)
1.0
0.8
0.6
0.4
Prop
ortio
n of
site
s oc
cupi
ed
0.2
0.0
0.6
0.5
0.4
0.3
Density (no. ha
–1)
0.2
0.1
Year1999 2000 2001 2002 2003
Figure 2. Mean and 95% confi dence intervals for the proportion of transects occupied (circles) and density along transects (triangles) for the entire study area in each year. Y-axis for density is on right side of fi gure. Estimates for 1999 may have been biased high due to use of uncleared plots (see text).

617
Table 3. Comparison of the fi t of generalized linear models for each response variable (extinction or colonization) in each year based on AICc. Best-fi t models highlighted in bold.
Response variable Model
�2(Log-Likelihood) Δ AICc Weight
Response variable Model
�2(Log-Likelihood) Δ AICc Weight
Ext 2000 1 B 2 404.04 43.61 0.00 Col 2000 B 179.88 4.96 0.05B � H 378.99 24.70 0.00 B � H 168.63 0.00 0.59 B � H � L 374.13 23.99 0.00 B � H � N 167.48 1.01 0.36B � H � L � P 350.05 2.00 0.19 B � H � L � P � N 345.95 0.00 0.52 S � H � P � N � P � N � P � N 345.03 1.19 0.29
Ext 2001 B 304.12 30.14 0.00 Col 2001 B 229.02 19.42 0.00B � H 295.55 25.65 0.00 B � H 201.68 0.42 0.31B � H � P 272.63 4.79 0.06 B � H � L 196.94 0 0.39 B � H � P � N 267.06 1.29 0.32 B � H � N 195.85 0.51 0.30 B � H � P � N � P � N 263.69 0.00 0.62
Ext 2002 B 173.34 16.61 0.00 Col 2002 B 207.59 43.12 0.00B � H 155.54 4.91 0.04 B � H 156.11 0.00 0.77 B � H � L 149.98 3.47 0.73 B � H � L 155.20 3.43 0.14B � H � L � P 145.93 1.49 0.20 B � H � N 153.86 4.30 0.09 B � H � L � P � N 142.35 0.00 0.42 S � H � P � N � P � N � P � N 141.10 0.85 0.28
Ext 2003 B 249.97 24.08 0.00 Col 2003 B 99.84 6.10 0.03B � H 236.07 14.28 0.00 B � H 89.33 0.00 0.66 B � H � L 236.07 6.79 0.03 B � H � N 88.53 1.50 0.31 B � H � L � P 222.20 0.00 0.53 B � H � L � P � N 222.10 2.05 0.19S � H � P � N � P � N � P � N 220.07 1.48 0.25
1 Ext � extinction as response variable in the appropriate year, Col � colonization as response variable in the appropriate year. 2 B � base model that included only Easting and Northing UTM coordinates (or a null model, if UTM coordinates did not have a signifi cant univariate infl uence (p � 0.10) on the response; B � H � base model plus all local habitat quality metrics with signifi cant univariate infl uence included, B � H � L � landscape-level estimates of habitat quality added to model (if these variables had a signifi cant univariate infl uence), B � H � L � P � local population density (population density at the focal transect site) in the previous year added to the model, B � H � L � P � N � population density in the neighborhood around the focal transect added to model, B � H � L � P � N � P � N � same as previous, but with an added interaction term between local and neighborhood population density. Note that for colonizations, density in the previous year was not included as a variable in models, as by defi nition all sites that could have been colonized had zero density in the previous year. Note that some years do not include models with landscape-level estimates of habitat quality (model L) due to none of the variables passing the pre-screening test.
habitat variables in best-fi t models included measures of vertical cover and tree canopy cover for multiple years, as well as horizontal cover in 2002 (Table 4). Snowshoe hares preferentially colonized sites with greater vertical and horizontal cover. Elevation was also an important factor in best-fi t models in 2000 and 2001, with snowshoe hare preferentially colonizing lower elevation sites (Table 4). Addition of landscape-level habitat variables did not substantially reduce AICc values of the local habitat models, and when present in best fi t models, these variables only provided about 10% of explained variation in the response.
Infl uence of local population density on extinction
Population density at a site in the previous year exerted a strong negative infl uence on the probability of extinction. Large parameter estimates relative to standard errors for this variable (and large independent contribution to explained variance from the hierarchical partitioning analysis) indicates that this may have been the single most infl uential variable determining probability of extinction for 3 of the 4 yr (Table 4).
Infl uence of neighborhood on extinction-colonization processes
Sites occurring in landscapes with a high density of hares were less likely to go extinct, but not more likely to be colonized. Th e best-fi t model for probability of extinc-tion included population density in the neighborhood for all years except 2003 (Table 3). AIC weights indicated substantial support for models including a neighborhood eff ect for 2000, 2001, and 2002. Parameter estimates from best-fi t models and hierarchical partitioning results indicate that this variable exerted a signifi cant negative infl uence on the probability of extinction (Table 4). However, in com-parison with habitat quality and local population density, this variable exerted a smaller overall infl uence on extinc-tion patterns. In contrast, none of the best-fi t models for colonization included neighborhood population density (Table 3). Models including the neighborhood variable did fall within 2 AICc units of the best fi t model for colon-ization. However, neighborhood models included exactly the same predictors as the best-fi t model, but added 1 parameter (the neighborhood variable). Similar to the situation mentioned above, these more complex models had higher AICc values and should not be considered as

618
competitive. Additional support for a lack of infl uence of the neighborhood variable on colonization probability is evident from an examination of parameter estimates from the full models including this variable. Values of standard errors were almost the same magnitude as parameter esti-mates (e.g. 2000: 0.20 � 0.19; 2001: 0.23 � 0.18; 2002: 0.23 � 0.20; 2003: � 0.24 � 0.26).
Interaction between local and neighborhood density
For extinction in 2001, the best-fi t model included a sig-nifi cant interaction term between local and neighborhood population density. Probability of extinction was strongly reduced by higher neighborhood hare density when the local population density at the site was low or moderate, but not when local population density was high (Fig. 4). For all other years, the best-fi t model included only main eff ects, without an interaction term. However, it is notable that parameter estimates for the interaction terms for all other years were positive, although standard errors were large (e.g. 2000: 0.59 � 0.50; 2002: 0.39 � 0.33, 2003: 0.41 � 0.25).
Discussion
Landscapes are not always easily categorized as binary habitat – non-habitat, but may contain habitats that have been variously modifi ed (but not extensively destroyed) by human activities (McIntyre and Barrett 1992, Manning and Lindenmayer 2004). Our data suggest that on these types of landscapes, habitat quality and/or population den-sity exert strong infl uences on extinction and colonization patterns, and may be the primary drivers of population turn-over. In contrast, patch geometry (area and isolation) exerts
Tabl
e 4.
Rel
ativ
e in
fl uen
ce o
f par
amet
ers
incl
uded
in b
est-
fi t m
odel
s fo
r ex
tinct
ion
(Ext
) and
col
oniz
atio
n (C
ol).
Show
n ar
e pa
ram
eter
est
imat
es (S
E) fr
om m
ain
effe
cts
gene
raliz
ed li
near
mod
el a
nd th
e in
depe
nden
t con
trib
utio
n of
eac
h va
riab
le fr
om h
iera
rchi
cal p
artit
ioni
ng a
naly
sis
(i.e.
% c
ontr
ibut
ion
of e
ach
pred
icto
r to
the
tota
l var
ianc
e ex
plai
ned
by a
ll pr
edic
tors
in th
e m
odel
).
Mod
elEL
a SL
UTM
NU
TME
VC
b H
C c
TCC
PFA
CPF
AC
2 PD
PD-N
EIG
H
Ext 2
000
0.1(
0.2)
6.0
%0.
2(0.
2) 4
.2%
0.1(
0.2)
2.8
% 0.
5(0.
2) d 13
.9%
0.
5(0.
2) 1
4.4%
–
� 0.
1(0.
2) 4
.7%
� 0.
6(0.
9) 2
.7%
e 0.
2(0.
2) �
1.3(
0.3)
38.
6%
� 0.
4(0.
2) 1
2.6%
Ex
t 200
1 f
0.4(
0.2)
16.
4%
– –
0.0(
0.2)
6.1
2% –
– �
0.2(
0.2)
4.5
% –
– �
1.2(
0.3)
52.
5%
� 0.
4(0.
2) 2
0.5%
Ex
t 200
2 –
0.6(
0.3)
20.
8%
– –
– –
� 0.
6(0.
3) 2
1.0%
�
2.5(
1.5)
20.
0%
0.5(
0.3)
�
0.5(
0.3)
10.
7% �
0.5(
0.3)
18.
1%
Ext 2
003
– –
� 0.
3(0.
3) 5
.9%
0.2(
0.2)
7.5
%0.
0(0.
0) 4
.1%
– �
0.9(
0.3)
34.
8%
� 0.
6(1.
0) 1
5.1%
0.
3(0.
1)
� 2.
8(0.
9) 3
2.2%
0.
1(0.
2) 0
.4%
Col
200
0 �
0.4(
0.2)
54.
7%
– –
– –
– 0.
4(0.
2) 4
5.3%
–
– –
– C
ol 2
001
0.2(
0.2)
2.6
% –
– �
0.4(
0.2)
12.
0%
� 0.
9(0.
3) 5
5.5%
–
0.3(
0.2)
21.
4%
0.8(
1.1)
8.4
% �
0.3(
0.2)
– –
Col
200
2 �
0.7(
0.2)
21%
–
– –
� 0.
0(0.
3) 1
0.2%
� 0.
2(0.
1) 1
6.8%
1.
1(0.
3) 4
1.2%
0.
9(1.
1) 4
.6%
� 0.
2(0.
2) –
– C
ol 2
003
– –
– �
0.5(
0.2)
24.
0%
� 0.
4(0.
3) 3
4.2%
–
0.6(
0.3)
41.
8%
– –
– –
a Abb
revi
atio
ns li
sted
in T
able
1.
b Not
e th
at h
ighe
r va
lues
for
the
vert
ical
cov
er e
xpla
nato
ry v
aria
ble
indi
cate
mor
e op
en s
ites.
c N
ote
that
hig
her
valu
es fo
r th
e ho
rizo
ntal
cov
er e
xpla
nato
ry v
aria
ble
indi
cate
mor
e op
en s
ites.
d B
olde
d ar
e hi
ghly
infl u
entia
l exp
lana
tory
var
iabl
es (p
aram
eter
est
imat
es h
ave
95%
con
fi den
ce in
terv
als
not o
verl
appi
ng z
ero
base
d on
out
put f
rom
gen
eral
ized
line
ar m
odel
s an
d/or
an
inde
pend
ent
cont
ribu
tion
of g
reat
er th
an 1
5% b
ased
on
hier
arch
ical
par
titio
ning
ana
lysi
s).
e Ove
rall
inde
pend
ent c
ontr
ibut
ion
for t
he v
aria
ble
pred
omin
ant f
ores
t age
cla
ss in
the
buffe
r was
bas
ed o
n th
e ex
pone
ntia
l mod
el (e
.g. i
ndep
ende
nt c
ontr
ibut
ion
of P
FAC
� in
depe
nden
t con
trib
utio
n of
PF
AC
2 ). f P
aram
eter
est
imat
es fo
r 20
01 a
re b
ased
on
the
mai
n ef
fect
s m
odel
to a
id c
ompa
riso
n of
par
amet
er e
stim
ates
acr
oss
year
s.
0.4 Low
Medium
High
0.3
0.2
0.1
0.0
0.0 0.2Density in neighborhood (no. ha–1)
0.4 0.6 0.8 1.0
Extin
ctio
n pr
obab
ility
Figure 4. Eff ect of the interaction between neighborhood density (density of hares in the landscape) and local population density (density of hares within a site) on the probability of extinction for the year 2001. Th e infl uence of neighborhood population density on probability of extinction (i.e. the rescue eff ect) is stronger when local population density is low. Shown are extinction curves for low (25% quartile), medium (median), and high (75%) local population densities.

619
Although incorporation of population variables into extinc-tion models is not frequently done, our data add to a grow-ing literature refl ecting the importance of this relationship (Schmidt and Pellet 2005, Franz é n and Nilsson 2010, Hamer and Mahony 2010). Schmidt and Pellet (2005) sug-gested that incorporating population size into occupancy dynamics may be particularly important when species inhabit sites at low densities, because stochastic processes dominate the trajectory of populations through time. Mean population densities of snowshoe hare on our land-scape, and many other areas within the species ’ southern range (Zahratka and Shenk 2008, Lewis et al. 2011), are low relative to those in the core of the species ’ range in the boreal forest (Keith 1990). Th is pattern suggests that local population density within patches or sites may be a key variable infl uencing extinction probability (and there-fore occupancy) across the southern range.
Population density in the landscape around a site was an important determinant of extinction but not coloniza-tion patterns on our landscape. Given that our estimate of neighborhood population was likely refl ective of the num-ber of dispersers available to enter a site, such an asymmetric infl uence on occupancy dynamics is counter-intuitive. Although the relatively connected nature of our landscape may have decreased the infl uence of neighborhood population size on colonization in a similar manner as was potentially seen for structural isolation, this eff ect should have been apparent for extinction as well. One possibility to explain this diff erential impact of neighborhood popu-lation density is that snowshoe hare exhibit conspecifi c attraction during dispersal. Such a mechanism, whereby dispersing hares are attracted to sites that are already occu-pied by conspecifi cs, should enhance rescue eff ects because dispersers preferentially settle in already occupied sites (Ray et al. 1991, Reed and Levine 2005). In contrast, a weaker eff ect of neighborhood density on colonization is expected if dispersers keep searching until they fi nd an occupied site or if dispersers settling in unoccupied sites fail to reproduce/survive because of Allee eff ects. In both cases, the overall eff ect of being situated in areas with a high vs low number of available dispersers should be reduced (because a fewer number of dispersers will try to settle in unoccupied sites in both high and low density landscapes), and therefore more diffi cult to detect during the modeling process. A weaker eff ect of neighborhood density on colon-ization vs extinction may have other possible explanations, such as diff erent processes controlling extinction vs colon-ization. Regardless, attraction is one of the most parsimoni-ous a posteriori explanations of the observed pattern.
Th eory suggests that the use of conspecifi c cues may be valuable when such cues reduce the time that dispersers must search for habitat, especially when search costs are high (Fletcher 2006, Ahlering et al. 2010). Hares experience substantial predation pressure throughout their life cycle, and perhaps particularly so during dispersal (Wolff 1980, Murray 2003), thus indicating a strong benefi t to using conspecifi c cues to locate settling habitat during dispersal. Given high predation pressure on hares and the universally positive relationship between habitat structure and snow-shoe hare abundance and distribution (Murray 2003), pres-ence of conspecifi cs may be a useful short-cut for dispersing
relatively little infl uence on occupancy dynamics in such systems. Given the common nature of variegated landscapes such as our study site, these fi ndings have implications for a general understanding of the dynamics of many types of spatially structured populations. Taken together with other recent work in more heavily fragmented systems (Fleishman et al. 2002, Schmidt and Pellet 2005, Schooley and Branch 2009, Robles and Cuidad 2012), our results also highlight the importance of considering variables beyond the typical structural measures of area and isolation for modeling occupancy or extinction and colonization patterns.
Th e lack of association between patch area and extinc-tion suggests that patch area may not be a good surrogate for population size. Although this may be due to the lack of highly discrete patches on our variegated landscape, other studies in more obviously fragmented systems have also noted a lack of infl uence of patch size on extinction, or a greater infl uence of other factors (Pellet et al. 2007, Robles and Ciudad 2012). Th e lack of infl uence of area on colon-ization is less surprising, although a positive association between these variables has been suggested if dispersers are more likely to encounter large patches by chance, or if large patches are more attractive to dispersers. Structural isolation (% forest cover in the landscape) may not have infl uenced colonization or extinction in our system because the landscape was relatively connected, which should reduce the infl uence of connectivity metrics on occupancy dynamics (Robles and Ciudad 2012). Our measure of neighborhood population density equates to a non-structural measure of isolation, and this variable did infl uence extinction in 3 of the 4 yr (discussed more below). However, the strength of infl uence was still less than that of habitat quality or local population density, and therefore does not alter our conclusions regarding the generally weak infl uence of area and isolation on occupancy dynamics.
In our study, high quality sites were less likely to go extinct and more likely to be colonized. Habitat quality of sites or patches increasingly is recognized as a key factor to consider in fragmented or patchy environments (Fleishman et al. 2002, Mortelliti et al. 2010, Robles and Ciudad 2012). High-quality sites on our landscape were those with sub-stantial amounts of vertical or canopy cover in the immedi-ate vicinity of pellet transects. Th e importance of cover for snowshoe hare has been confi rmed extensively in other areas and likely relates to the importance of cover as escape habi-tat from mammalian or avian predators (Murray 2003). Our study adds to this conclusion by showing that large-scale patterns of extinction and colonization were infl uenced by these same habitat measures. Although habitat quality primarily exerted an infl uence at the local-level, quality of habitat was also important at a broader-scale, with sites embedded in landscapes composed of predominately mid-successional age classes being less likely to go extinct. Given that mid-successional age classes tended to have the most vertical and horizontal cover (Th ornton et al. 2012), transects embedded in neighborhoods of mid-successional habitat may have benefi tted from reduced predation pres-sure at a larger-scale, with more stable or productive hare populations in the immediate vicinity of focal sites.
Probability of extinction at a site dropped dramatically when local population density was high in the previous year.

620
Burnham, K. and Anderson, D. 2002. Model selection and multi-model inference. – Springer.
Chevan, A. and Sutherland, M. 1991. Hierarchical partitioning. – Am. Stat. 45: 90 – 96.
Fleishman, E. et al. 2002. Assessing the roles of patch quality, area, and isolation in predicting metapopulation dynamics. – Conserv. Biol. 16: 706 – 716.
Fletcher, R. J. Jr 2006. Emergent properties of conspecifi c attrac-tion in fragmented landscapes. – Am. Nat. 168: 207 – 219.
Fletcher, R. J. Jr 2007. Species interactions and population density mediate the use of social cues for habitat selection. – J. Anim. Ecol. 76: 598 – 606.
Fletcher, R. J. and Koford, R. R. 2002. Habitat and landscape associations of breeding birds in native and restored grasslands. – J. Wildl. Manage. 66: 1011 – 1022.
Fortin, M.-J. and Dale, M. 2005. Spatial analysis: a guide for ecologists. – Cambridge Univ. Press.
Franz é n, M. and Nilsson, S. G. 2010. Both population size and patch quality aff ect local extinctions and colonizations. – Proc. R. Soc. B 277: 79 – 85.
Griffi n, P. C. and Mills, L. S. 2009. Sinks without borders: snow-shoe hare dynamics in a complex landscape. – Oikos 118: 1487 – 1498.
Hamer, A. J. and Mahony, M. J. 2010. Rapid turnover in site occupancy of a pond-breeding frog demonstrates the need for landscape-level management. – Wetlands 30: 287 – 299.
Hanski, I. 1999. Metapopulation ecology. – Oxford Univ. Press. Hijmans, R. J. et al. 2005. Very high resolution interpolated
climate surfaces for global land areas. – Int. J. Climatol. 25: 1965 – 1978.
Hodges, K. E. and Mills, L. S. 2008. Designing fecal pellet surveys for snowshoe hares. – For. Ecol. Manage. 256: 1918 – 1926.
Hodges, K. E. et al. 2009. Distribution and abundance of snow-shoe hares in Yellowstone National Park. – J. Mammal. 90: 870 – 878.
Homyack, J. A. et al. 2006. Quantifying densities of snowshoe hares in Maine using pellet plots. – Wildl. Soc. Bull. 34: 74 – 80.
Keith, L. B. 1990. Dynamics of snowshoe hare populations. – In: Genoways, H. H. (eds), Current mammalogy. Plenum Press, pp. 119 – 195.
Kennedy, C. M. et al. 2011. Landscape matrix mediates occupancy dynamics of Neotropical avian insectivores. – Ecol. Appl. 21: 1837 – 1850.
Krebs, C. J. 2011. Of lemmings and snowshoe hares: the ecology of northern Canada. – Proc. R. Soc. B 278: 481 – 489.
Krebs, C. J. et al. 1987. Estimation of snowshoe hare population density from turd transects. – Can. J. Zool. 65: 565 – 567.
Krebs, C. J. et al. 2001. Estimating snowshoe hare population density from pellet plots: a further evaluation. – Can. J. Zool. 79: 1 – 4.
Lewis, C. W. et al. 2011. Infl uence of stand and landscape features on snowshoe hare abundnace in fragmented forests. – J. Mammal. 92: 561 – 567.
Lichstein, J. W. et al. 2002. Spatial autocorrelation and auto-regressive models in ecology. – Ecol. Monogr. 72: 445 – 463.
Mac Nally, R. 2000. Regression and model-building in conserva-tion biology, biogeography and ecology: the distinction between – and reconciliation of – “predictive” and explanatory models. – Biodivers. Conserv. 9: 655 – 671.
MacArthur, R. H. and Wilson, E. O. 1967. Th e theory of island biogeography. – Princeton Univ. Press.
Manning, A. D. and Lindenmayer, D. B. 2004. Continua and Umwelt: novel perspectives on viewing landscapes. – Oikos 104: 621 – 628.
McIntyre, S. and Barrett, G. W. 1992. Habitat variegation, an alternative to fragmentation. – Conserv. Biol. 6: 146 – 147.
Mills, L. S. et al. 2005. Pellet count indices compared to mark – recapture estimates for evaluating snowshoe hare density. – J. Wildl. Manage. 69: 1053 – 1062.
animals to fi nd patches with low predation, or those that contain the appropriate habitat structure (Stamps 2001). Our conclusions logically call for additional work directly examining rates of immigration of dispersing hares to unoc-cupied vs occupied sites in fragmented habitats.
We documented an interaction between local and neigh-borhood population density on extinction that suggests the infl uence of demographic rescue on extinction may vary depending on local site densities. Although the interaction was only signifi cant in 1 of the 4 yr we tested, interaction terms for other years had parameter estimates in the expected direction. Our fi ndings therefore suggest that, at least for some years, the rescue eff ect for a site will be stron-ger when the site has low or medium densities compared to high densities. Th is result could be driven by a number of diff erent processes. Demographic rescue could simply be more important for sites with low vs high densities, particu-larly if high densities are substantial enough to be buff ered from extinction. Th e interaction could also be explained by a decline in the number of dispersers successfully entering high density sites and thus weakening the attractiveness of prime sites. Th e existence of a an interaction between local and neighborhood population density may also explain why 2003 was the only year in which the neighborhood population density did not infl uence extinction probability: by 2003, landscape-wide hare densities were almost 2 times higher than those in 2000, and thus demographic rescue eff ects would be less pronounced.
Our study highlights the importance of habitat quality and population density at multiple scales for understanding occupancy dynamics of species, and reinforces the notion that factors outside of structural measures of area and isola-tion may be important drivers of occupancy dynamics in fragmented or variegated landscapes. Given that few studies of extinction and colonization patterns analyze factors such as habitat quality or population density, our understanding of the drivers of occupancy dynamics could be greatly enhanced by more studies that explicitly consider multiple competing factors (Robles and Ciudad 2012). Our data also suggest that the infl uence of quality and density on hare dynamics occurs at both local and landscape-levels. Th ere-fore, in the fragmented and mosaic forest landscapes that characterize the southern range edge of snowshoe hare, researchers will need to extend their focus beyond local or stand-level factors to consider the broader landscape to obtain a better understanding of population dynamics.
Acknowledgements – Th is study was achieved through cooperative and collaborative eff orts involving the U.S. Forest Service, Idaho Dept of Fish and Game, and Univ. of Idaho. We are grateful to A. Zack and R. Ralphs for their extensive support, as well as to E. Ellsworth, C. Gardner, J. Haydon, P. Hiebert, W. Melquist, H. Nipps, W. Terrill for assistance with aspects of this work. We thank the many individuals who assisted in the collection of hare turds under sometimes less than glamorous circumstances.
References
Ahlering, M. A. et al. 2010. Research needs and recommendations for the use of conspecifi c-attraction methods in the conser-vation of migratory songbirds. – Condor 112: 252 – 264.

621
Schmidt, B. R. and Pellet, J. 2005. Relative importance of population processes and habitat characteristics in determin-ing site occupancy of two anurans. – J. Wildl. Manage. 69: 884 – 893.
Schooley, R. L. and Branch, L. C. 2009. Enhancing the area-isolation paradigm: habitat heterogenetiy and metapopulation dynamics of a rare wetland mammal. – Ecol. Appl. 19: 1708 – 1722.
Schooley, R. L. and Branch, L. C. 2011. Habitat quality of source patches and connectivity in fragmented landscapes. – Biodivers. Conserv. 20: 1611 – 1623.
Smith, D. C. et al. 2010. Survival of colonizing wolves in the northern Rocky Mountains of the United States, 1982 – 2004. – J. Wildl. Manage. 74: 620 – 634.
Stamps, J. A. 2001. Habitat selection by dispersers: integrating proximate and ultimate approaches. – In: Clobert, J. et al. (eds), Dispersal. Oxford Univ. Press, pp. 230 – 242.
Stouff er, P. C. et al. 2011. Understory bird communities in Amazonian rainforest fragments: species turnover through 25 years post-isolation in recovering landscapes. – PLoS One 6: e20543.
Th omas, C. D. 1994. Extinction, colonization, and metapopula-tions: environmental tracking by rare species. – Conserv. Biol. 8: 373 – 378.
Th ornton, D. H. et al. 2012 . Complex eff ects of site preparation and harvest on snowshoe hare abundance across a patchy forest landscape. – For. Ecol. Manage. 2 80: 132 – 139.
US Geological Survey 2011. Gap analysis program (GAP). – National Land Cover, ver. 2.
Wirsing, A. J. et al. 2002. A demographic analysis of a southern snowshoe hare population in a fragmented habitat: evaluating the refugium model. – Can. J. Zool. 80: 169 – 177.
Wolff , J. O. 1980. Th e role of habitat patchiness in the popu-lation dynamics of snowshoe hares. – Ecol. Monogr. 50: 111 – 130.
Zahratka, J. L. and Shenk, T. M. 2008. Population estimates of snowshoe hares in the southern Rocky Mountains. – J. Wildl. Manage. 72: 906 – 912.
Mortelliti, A. et al. 2010. Th e role of habitat quality in fragmented landscapes: a conceptual overview and prospectus for future research. – Oecologia 163: 535 – 547.
Murray, D. L. 2003. Snowshoe hare and other hares. – In: Feldhamer, G. A. et al. (eds), Wild mammals of North America. Volume II. John Hopkins Univ. Press, pp. 147 – 175.
Murray, D. L. et al. 1994. Winter habitat selection by lynx and coyotes in relation to snowshoe hare abundance. – Can. J. Zool. 68: 1221 – 1226.
Murray, D. L. et al. 2002. Estimating low-density snowshoe hare populations using fecal pellet counts. – Can. J. Zool. 80: 771 – 781.
Murray, D. L. et al. 2005. Assessment of potential bias with snowshoe hare fecal pellet-plot counts. – J. Wildl. Manage. 69: 385 – 395.
Pearce, J. and Ferrier, S. 2000. Evaluating the predictive perform-ance of habitat models developed using logistic regression. – Ecol. Model. 133: 225 – 245.
Pellet, J. et al. 2007. An empirical evaluation of the area and isolation paradigm of metapopulation dynamics. – Biol. Conserv. 136: 483 – 495.
Price, B. et al. 2009. Continuum or discrete patch landscape models for savanna birds? Towards a pluralistic approach. – Ecography 32: 745 – 756.
Prugh, L. R. et al. 2008. Eff ect of habitat area and isolation on fragmented animal populations. – Proc. Natl Acad. Sci. USA 105: 20770 – 20775.
Quinn, G. P. and Keough, M. J. 2002. Experimental design and data analysis for biologists. – Cambridge Univ. Press.
Ray, C. et al. 1991. Th e eff ect of conspecifi c attraction on metapopulation dynamics. – Biol. J. Linn. Soc. 42: 123 – 134.
Reed, J. M. and Levine, S. H. 2005. A model for behavioral regulation of metapopulation dynamics. – Ecol. Model. 183: 411 – 423.
Robles, H. and Ciudad, C. 2012. Infl uence of habitat quality, population size, patch size, and connectivity on patch-occupancy dynamics of the middle spotted woodpecker. – Conserv. Biol. 26: 284 – 293.
Supplementary material (Appendix E7737 at � www.oikosoffi ce.lu.se/appendix � ). Appendix 1.