Shoot, shovel and shut up: cryptic poaching slows restoration of a large carnivore in Europe
Predicting spatio-temporal recolonization of large
carnivore populations and livestock depredation risk:
wolves in the Italian Alps
F. Marucco1,2* and E. J. B. McIntire3
1Centro Gestione Conservazione Grandi Carnivori, Parco Naturale Alpi Marittime, 12010 Valdieri, Italy; 2Wildlife
Biology Program, Department of Ecosystem and Conservation Sciences, University of Montana, Missoula, MT 59812,
USA; and 3Centre d’etude des forets, Pav. ABP, Universite Laval, Quebec City, QC G1K 7P4, Canada
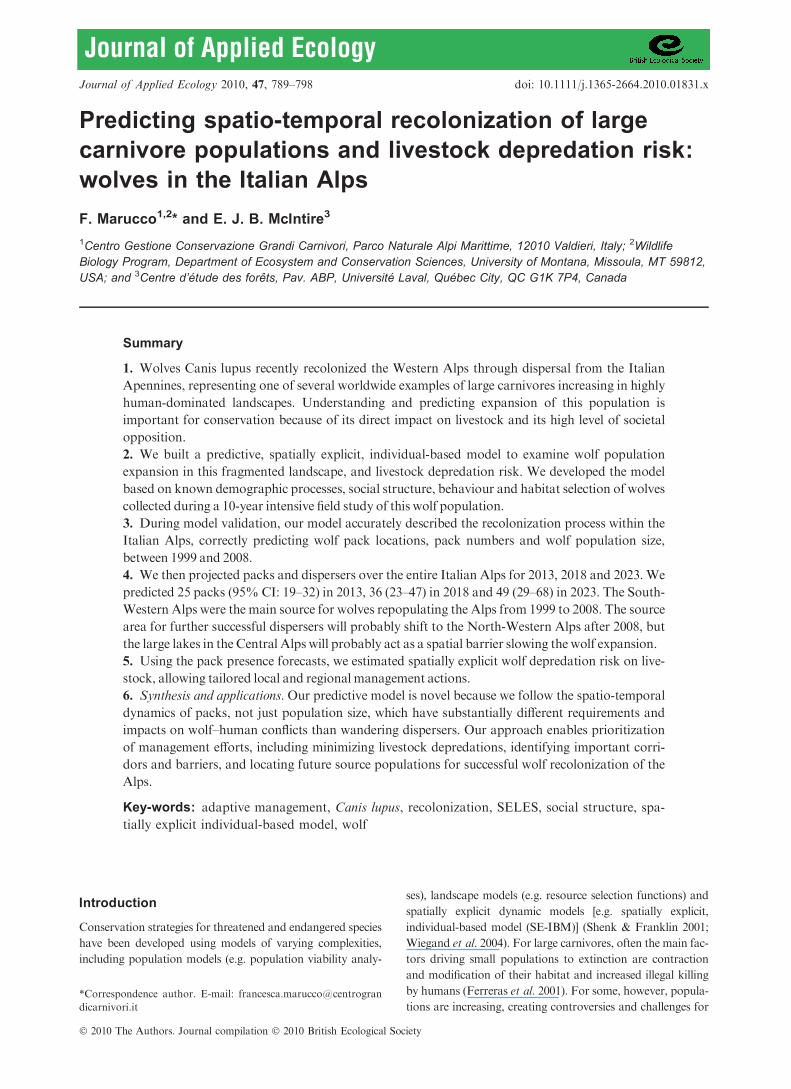
Summary
1. Wolves Canis lupus recently recolonized the Western Alps through dispersal from the Italian
Apennines, representing one of several worldwide examples of large carnivores increasing in highly
human-dominated landscapes. Understanding and predicting expansion of this population is
important for conservation because of its direct impact on livestock and its high level of societal
opposition.
2. We built a predictive, spatially explicit, individual-based model to examine wolf population
expansion in this fragmented landscape, and livestock depredation risk. We developed the model
based on known demographic processes, social structure, behaviour and habitat selection of wolves
collected during a 10-year intensive field study of this wolf population.
3. During model validation, our model accurately described the recolonization process within the
Italian Alps, correctly predicting wolf pack locations, pack numbers and wolf population size,
between 1999 and 2008.
4. We then projected packs and dispersers over the entire Italian Alps for 2013, 2018 and 2023. We
predicted 25 packs (95% CI: 19–32) in 2013, 36 (23–47) in 2018 and 49 (29–68) in 2023. The South-
Western Alps were the main source for wolves repopulating the Alps from 1999 to 2008. The source
area for further successful dispersers will probably shift to the North-Western Alps after 2008, but
the large lakes in the Central Alps will probably act as a spatial barrier slowing the wolf expansion.
5. Using the pack presence forecasts, we estimated spatially explicit wolf depredation risk on live-
stock, allowing tailored local and regional management actions.
6. Synthesis and applications. Our predictive model is novel because we follow the spatio-temporal
dynamics of packs, not just population size, which have substantially different requirements and
impacts on wolf–human conflicts than wandering dispersers. Our approach enables prioritization
of management efforts, including minimizing livestock depredations, identifying important corri-
dors and barriers, and locating future source populations for successful wolf recolonization of the
Alps.
Key-words: adaptive management, Canis lupus, recolonization, SELES, social structure, spa-
tially explicit individual-based model, wolf
Introduction
Conservation strategies for threatened and endangered species
have been developed using models of varying complexities,
including population models (e.g. population viability analy-
ses), landscape models (e.g. resource selection functions) and
spatially explicit dynamic models [e.g. spatially explicit,
individual-based model (SE-IBM)] (Shenk & Franklin 2001;
Wiegand et al. 2004). For large carnivores, often the main fac-
tors driving small populations to extinction are contraction
and modification of their habitat and increased illegal killing
by humans (Ferreras et al. 2001). For some, however, popula-
tions are increasing, creating controversies and challenges for*Correspondence author. E-mail: francesca.marucco@centrogran
dicarnivori.it
Journal of Applied Ecology 2010, 47, 789–798 doi: 10.1111/j.1365-2664.2010.01831.x
� 2010 The Authors. Journal compilation � 2010 British Ecological Society
their conservation. Wolves, for example, conflict with humans
mainly through competition over livestock, a natural side-
effect of wolf population expansion in Europe where the terri-
tories of carnivores and livestock husbandry often overlap
(Linnell, Swenson & Anderson 2001). Hence, pressures on
authorities to define control strategies are often high evenwhen
abundance is lower than a minimum viable population (Nils-
son 2003). Italian wolves Canis lupus Linnaeus, 1758 [endan-
gered: the Habitat Directive 92 ⁄43 ⁄CEE, the Bern Conventionon the Conservation of European Wildlife and Natural Habi-
tats (19.IX.1979) and Red list (IUCN 2001)] are of concern as
they recently naturally recolonized the Western Alps after
being extirpated throughout most of Western Europe during
the 20th century, and their future status is uncertain. Predictive
models could therefore be very important to guide conserva-
tion andmanagement decisions, minimizing the ecological and
economic costs of trial and error for endangered species. How-
ever, the conservation questions are complex and require a
combination of analysis of spatial landscapes, and a knowl-
edge of animal behaviour and population dynamics.
Population models (e.g. population viability analysis) have
often been used to define conservation strategies for large
carnivores (Samson 2002), including wolves, to assess extinc-
tion risk under different management strategies (Chapron
et al. 2003), and to investigate the effects of inbreeding
depression, hunting policy and catastrophic events on
isolated populations in Scandinavia (Nilsson 2003). However,
these models have been criticized because they inadequately
represent animal behaviour (DeAngelis et al. 2001), and
because they are often not spatially related to real landscapes
(Macdonald & Rushton 2003; McIntire, Schultz & Crone
2007). For wolves, a highly social and territorial species
structured in packs with a single-breeding pair, their behav-
iour disproportionately affects density, home-range configu-
ration, reproduction and mortality (Mech & Boitani 2003).
Social structure may inflate the importance of or amplify
demographic stochasticity by restricting the number of breed-
ing units to the number of social groups (Caro & Durant
1995; Vucetich, Peterson & Waite 1997). Yet, behavioural
data have been rarely incorporated into population models
(Gonzalez-Suarez & Gerber 2008).
Another type of model—the spatially explicit, geographical
information system-based, landscape model—can also be very
useful for species management (Adriaensen et al. 2003), and
has been widely used in Western Europe to predict wolf distri-
bution in areas not yet recolonized (e.g. Corsi, Dupre & Boi-
tani 1999; Jedrzejewski et al. 2008). In the Italian Alps, where
the landscape is human dominated and suitable habitat for car-
nivores is heavily fragmented by both topography and
humans, the habitat can play an important role in reducing the
system carrying capacity for wolves. However, social and pop-
ulation dynamics have never been addressed in these models,
and therefore no potential feedbacks within the system have
been considered (McIntire, Schultz & Crone 2007). Addition-
ally, no pack requirements for territorial establishment have
been accounted for, implying no differences between potential
presence of wandering solitary wolves and established packs.
To analyse this complex natural recolonization process and
population dynamics in a fragmented landscape, and to cir-
cumvent these shortcomings, we built an SE-IBM for wolves
that incorporated reproduction, age-based mortality, social
structure, territoriality, juvenile dispersal, and habitat selection
acting on dispersal and territory location directly within the
Alps. Because our model is set in the real landscape, it is open
to empirical testing and validation, and to investigate the roles
of various population and landscape parameters. Moreover,
the SE-IBM that we developed is a way to link individual traits
and social system complexity, such as wolf pack structure,
because they directly account for how population dynamics
emerge from individual behaviour (Grimm&Railsback 2005).
IBMs allow the effects of demographic stochasticity and the
internal complexity within a population to be taken into
account in a straightforward manner (Matsinos, Wolff &
DeAngelis 2002), and are therefore particularly well suited for
small populations (DeAngelis et al. 2001). Thus, we first cali-
brate and validate our model; then we predict the potential
future wolf recolonization to guide wolf conservation and
management decisions. We predict spatial absolute probabili-
ties of future wolf packs in the Alps in the next 5, 10 and
15 years (i.e. 2013, 2018 and 2023), together with pack num-
bers and other population parameters. We also identify critical
areas for wolf pack establishment, which will be fundamental
for future sources in the wolf recolonization process of the
entire Italian Alps system. Finally, we spatially predicted wolf
depredation risk of livestock throughout the wolf recoloniza-
tion process.
Material and methods
STUDY AREA AND THE HABITAT SUITABIL ITY MODEL
The study area covers the Western, Central and Eastern Alps in Italy
(Fig. 1). This area is weakly connected in the south to the Apennines
Mountains, the only source for the wolf population in the Alps (Fab-
bri et al. 2007). Gene flow between the Apennines and the Alps is
moderate (1Æ25–2Æ50 wolves per generation; Fabbri et al. 2007) so we
considered immigration negligible for initial purposes of our demo-
graphic submodel. The wolf population in the Alps is currently
expanding in the French Alps (Marboutin & Duchamp 2005); how-
ever, we limited our analysis to the Italian side of the Alps because of
data availability. In the future, as data become available, it will be
important to expand the model to the entire Alps. This implies that
our predictive model does not take into account the potential for
immigrants (gains) or emigrants (losses) or for additional connectivity
through routes not included in the area that we have modelled.
Despite the trend towards more coordinated international
approaches, the present Italian focus reflects present management
structures. Sheep farming is widespread in the Italian Alps and live-
stock depredation by wolves has caused increasing conflicts over the
years (Marucco et al. 2009a). Today, however, the wolf population is
fully protected in Italy and hunting is illegal.
We used the wolf habitat suitability model for the Italian Alps
(Fig. 1), developed by Marucco (2009), to explicitly represent the
Alps in the SE-IBM.Marucco (2009) applied an unconditional multi-
season occupancy model to estimate wolf occupancy parameters and
detection probabilities (MacKenzie 2006), based on data collected
790 F. Marucco & E. J. B. McIntire
� 2010 The Authors. Journal compilation � 2010 British Ecological Society, Journal of Applied Ecology, 47, 789–798
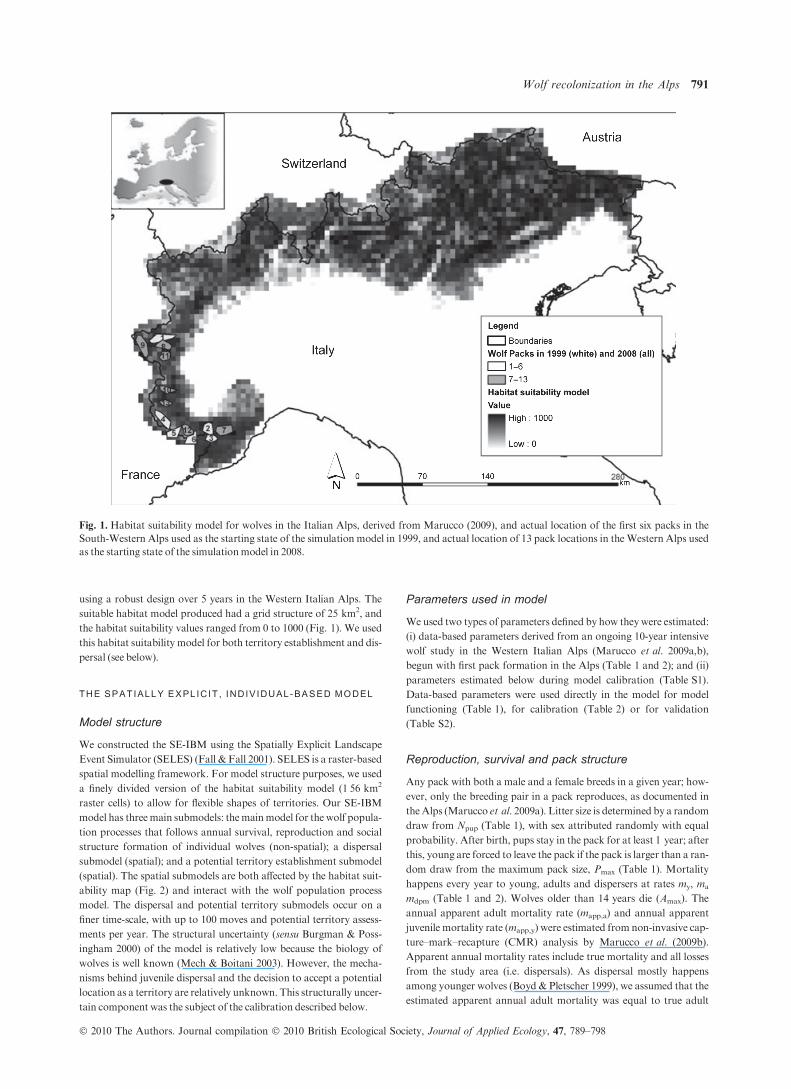
using a robust design over 5 years in the Western Italian Alps. The
suitable habitat model produced had a grid structure of 25 km2, and
the habitat suitability values ranged from 0 to 1000 (Fig. 1). We used
this habitat suitability model for both territory establishment and dis-
persal (see below).
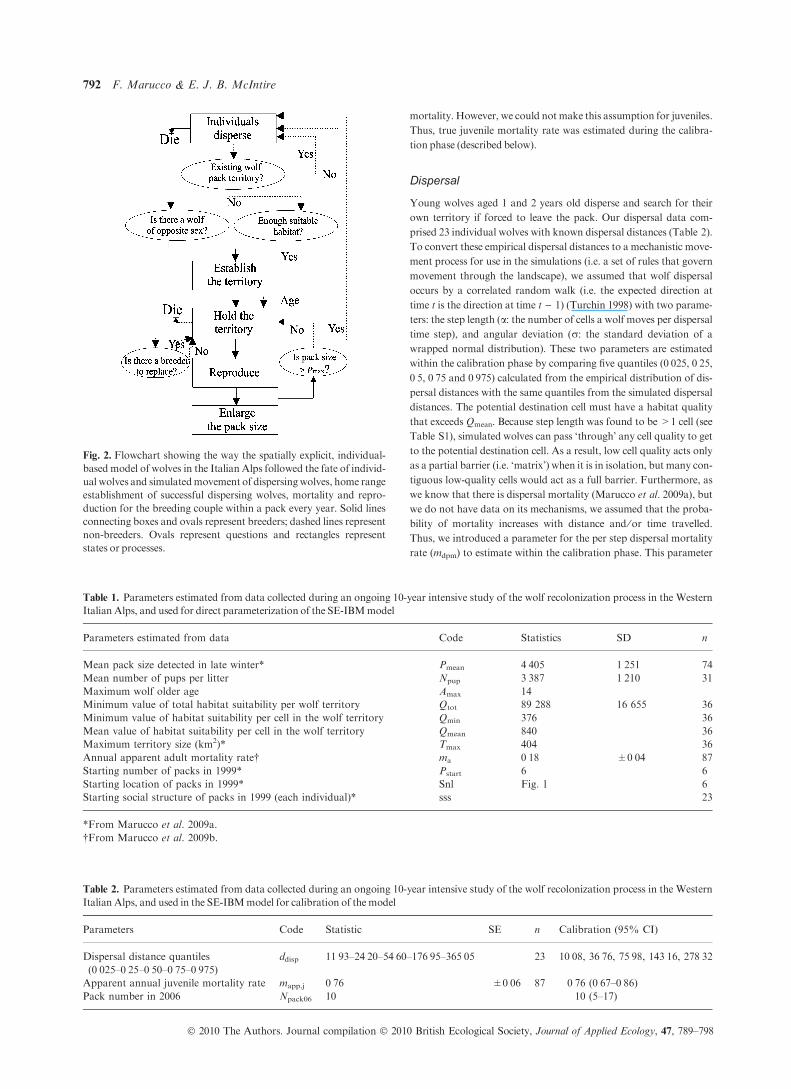
THE SPATIALLY EXPLIC IT , INDIV IDUAL-BASED MODEL
Model structure
We constructed the SE-IBM using the Spatially Explicit Landscape
Event Simulator (SELES) (Fall & Fall 2001). SELES is a raster-based
spatial modelling framework. For model structure purposes, we used
a finely divided version of the habitat suitability model (1Æ56 km2
raster cells) to allow for flexible shapes of territories. Our SE-IBM
model has threemain submodels: themainmodel for the wolf popula-
tion processes that follows annual survival, reproduction and social
structure formation of individual wolves (non-spatial); a dispersal
submodel (spatial); and a potential territory establishment submodel
(spatial). The spatial submodels are both affected by the habitat suit-
ability map (Fig. 2) and interact with the wolf population process
model. The dispersal and potential territory submodels occur on a
finer time-scale, with up to 100 moves and potential territory assess-
ments per year. The structural uncertainty (sensu Burgman & Poss-
ingham 2000) of the model is relatively low because the biology of
wolves is well known (Mech & Boitani 2003). However, the mecha-
nisms behind juvenile dispersal and the decision to accept a potential
location as a territory are relatively unknown. This structurally uncer-
tain component was the subject of the calibration described below.
Parameters used in model
We used two types of parameters defined by how theywere estimated:
(i) data-based parameters derived from an ongoing 10-year intensive
wolf study in the Western Italian Alps (Marucco et al. 2009a,b),
begun with first pack formation in the Alps (Table 1 and 2); and (ii)
parameters estimated below during model calibration (Table S1).
Data-based parameters were used directly in the model for model
functioning (Table 1), for calibration (Table 2) or for validation
(Table S2).
Reproduction, survival and pack structure
Any pack with both a male and a female breeds in a given year; how-
ever, only the breeding pair in a pack reproduces, as documented in
theAlps (Marucco et al. 2009a). Litter size is determined by a random
draw from Npup (Table 1), with sex attributed randomly with equal
probability. After birth, pups stay in the pack for at least 1 year; after
this, young are forced to leave the pack if the pack is larger than a ran-
dom draw from the maximum pack size, Pmax (Table 1). Mortality
happens every year to young, adults and dispersers at rates my, ma
mdpm (Table 1 and 2). Wolves older than 14 years die (Amax). The
annual apparent adult mortality rate (mapp,a) and annual apparent
juvenile mortality rate (mapp,y) were estimated from non-invasive cap-
ture–mark–recapture (CMR) analysis by Marucco et al. (2009b).
Apparent annual mortality rates include true mortality and all losses
from the study area (i.e. dispersals). As dispersal mostly happens
among younger wolves (Boyd & Pletscher 1999), we assumed that the
estimated apparent annual adult mortality was equal to true adult
Fig. 1. Habitat suitability model for wolves in the Italian Alps, derived from Marucco (2009), and actual location of the first six packs in the
South-Western Alps used as the starting state of the simulation model in 1999, and actual location of 13 pack locations in the Western Alps used
as the starting state of the simulationmodel in 2008.
Wolf recolonization in the Alps 791
� 2010 The Authors. Journal compilation � 2010 British Ecological Society, Journal of Applied Ecology, 47, 789–798
mortality. However, we could not make this assumption for juveniles.
Thus, true juvenile mortality rate was estimated during the calibra-
tion phase (described below).
Dispersal
Young wolves aged 1 and 2 years old disperse and search for their
own territory if forced to leave the pack. Our dispersal data com-
prised 23 individual wolves with known dispersal distances (Table 2).
To convert these empirical dispersal distances to a mechanistic move-
ment process for use in the simulations (i.e. a set of rules that govern
movement through the landscape), we assumed that wolf dispersal
occurs by a correlated random walk (i.e. the expected direction at
time t is the direction at time t ) 1) (Turchin 1998) with two parame-
ters: the step length (a: the number of cells a wolf moves per dispersal
time step), and angular deviation (r: the standard deviation of a
wrapped normal distribution). These two parameters are estimated
within the calibration phase by comparing five quantiles (0Æ025, 0Æ25,0Æ5, 0Æ75 and 0Æ975) calculated from the empirical distribution of dis-
persal distances with the same quantiles from the simulated dispersal
distances. The potential destination cell must have a habitat quality
that exceeds Qmean. Because step length was found to be >1 cell (see
Table S1), simulated wolves can pass ‘through’ any cell quality to get
to the potential destination cell. As a result, low cell quality acts only
as a partial barrier (i.e. ‘matrix’) when it is in isolation, but many con-
tiguous low-quality cells would act as a full barrier. Furthermore, as
we know that there is dispersal mortality (Marucco et al. 2009a), but
we do not have data on its mechanisms, we assumed that the proba-
bility of mortality increases with distance and ⁄ or time travelled.
Thus, we introduced a parameter for the per step dispersal mortality
rate (mdpm) to estimate within the calibration phase. This parameter
Fig. 2. Flowchart showing the way the spatially explicit, individual-
based model of wolves in the Italian Alps followed the fate of individ-
ual wolves and simulatedmovement of dispersingwolves, home range
establishment of successful dispersing wolves, mortality and repro-
duction for the breeding couple within a pack every year. Solid lines
connecting boxes and ovals represent breeders; dashed lines represent
non-breeders. Ovals represent questions and rectangles represent
states or processes.
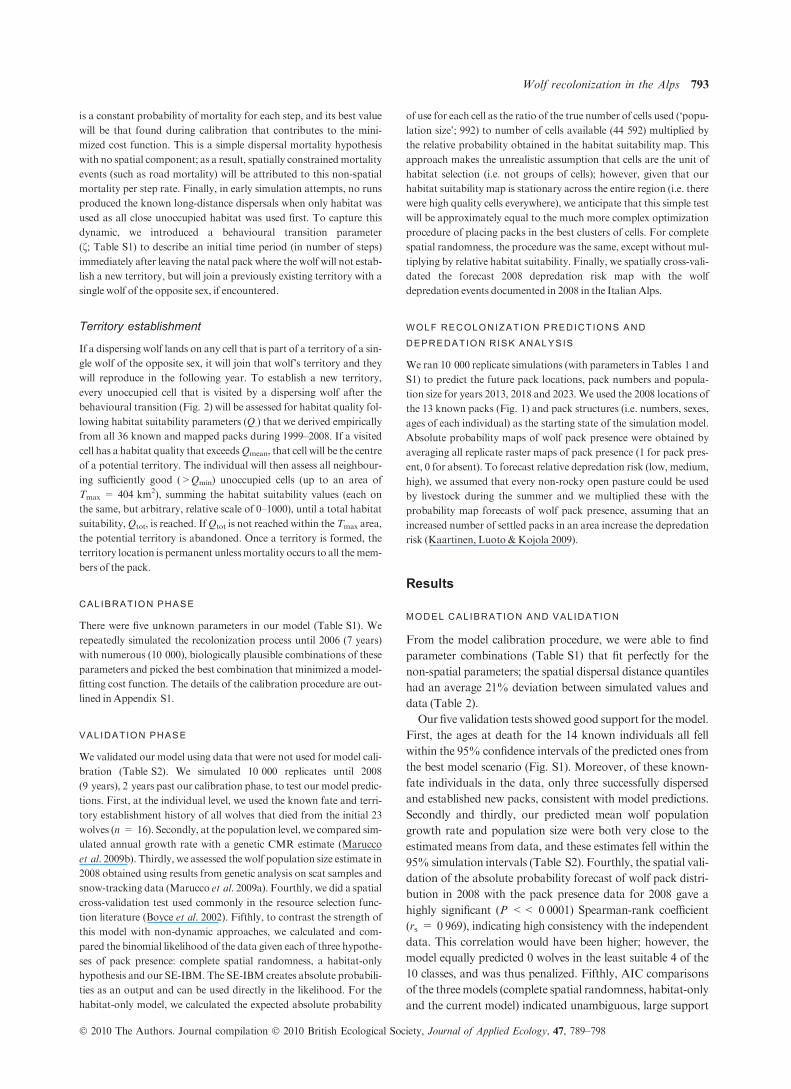
Table 1. Parameters estimated from data collected during an ongoing 10-year intensive study of the wolf recolonization process in the Western
Italian Alps, and used for direct parameterization of the SE-IBMmodel
Parameters estimated from data Code Statistics SD n
Mean pack size detected in late winter* Pmean 4Æ405 1Æ251 74
Mean number of pups per litter Npup 3Æ387 1Æ210 31
Maximum wolf older age Amax 14
Minimum value of total habitat suitability per wolf territory Qtot 89 288 16 655 36
Minimum value of habitat suitability per cell in the wolf territory Qmin 376 36
Mean value of habitat suitability per cell in the wolf territory Qmean 840 36
Maximum territory size (km2)* Tmax 404 36
Annual apparent adult mortality rate† ma 0Æ18 ±0Æ04 87
Starting number of packs in 1999* Pstart 6 6
Starting location of packs in 1999* Snl Fig. 1 6
Starting social structure of packs in 1999 (each individual)* sss 23
*From Marucco et al. 2009a.
†From Marucco et al. 2009b.
Table 2. Parameters estimated from data collected during an ongoing 10-year intensive study of the wolf recolonization process in the Western
Italian Alps, and used in the SE-IBMmodel for calibration of the model
Parameters Code Statistic SE n Calibration (95% CI)
Dispersal distance quantiles
(0Æ025–0Æ25–0Æ50–0Æ75–0Æ975)ddisp 11Æ93–24Æ20–54Æ60–176Æ95–365Æ05 23 10Æ08, 36Æ76, 75Æ98, 143Æ16, 278Æ32
Apparent annual juvenile mortality rate mapp,j 0Æ76 ±0Æ06 87 0Æ76 (0Æ67–0Æ86)Pack number in 2006 Npack06 10 10 (5–17)
792 F. Marucco & E. J. B. McIntire
� 2010 The Authors. Journal compilation � 2010 British Ecological Society, Journal of Applied Ecology, 47, 789–798
is a constant probability of mortality for each step, and its best value
will be that found during calibration that contributes to the mini-
mized cost function. This is a simple dispersal mortality hypothesis
with no spatial component; as a result, spatially constrainedmortality
events (such as road mortality) will be attributed to this non-spatial
mortality per step rate. Finally, in early simulation attempts, no runs
produced the known long-distance dispersals when only habitat was
used as all close unoccupied habitat was used first. To capture this
dynamic, we introduced a behavioural transition parameter
(f; Table S1) to describe an initial time period (in number of steps)
immediately after leaving the natal packwhere the wolf will not estab-
lish a new territory, but will join a previously existing territory with a
single wolf of the opposite sex, if encountered.
Territory establishment
If a dispersing wolf lands on any cell that is part of a territory of a sin-
gle wolf of the opposite sex, it will join that wolf’s territory and they
will reproduce in the following year. To establish a new territory,
every unoccupied cell that is visited by a dispersing wolf after the
behavioural transition (Fig. 2) will be assessed for habitat quality fol-
lowing habitat suitability parameters (Q.) that we derived empirically
from all 36 known and mapped packs during 1999–2008. If a visited
cell has a habitat quality that exceedsQmean, that cell will be the centre
of a potential territory. The individual will then assess all neighbour-
ing sufficiently good (>Qmin) unoccupied cells (up to an area of
Tmax = 404 km2), summing the habitat suitability values (each on
the same, but arbitrary, relative scale of 0–1000), until a total habitat
suitability,Qtot, is reached. IfQtot is not reached within theTmax area,
the potential territory is abandoned. Once a territory is formed, the
territory location is permanent unlessmortality occurs to all themem-
bers of the pack.
CALIBRATION PHASE
There were five unknown parameters in our model (Table S1). We
repeatedly simulated the recolonization process until 2006 (7 years)
with numerous (10 000), biologically plausible combinations of these
parameters and picked the best combination that minimized a model-
fitting cost function. The details of the calibration procedure are out-
lined inAppendix S1.
VALIDATION PHASE
We validated our model using data that were not used for model cali-
bration (Table S2). We simulated 10 000 replicates until 2008
(9 years), 2 years past our calibration phase, to test our model predic-
tions. First, at the individual level, we used the known fate and terri-
tory establishment history of all wolves that died from the initial 23
wolves (n = 16). Secondly, at the population level, we compared sim-
ulated annual growth rate with a genetic CMR estimate (Marucco
et al. 2009b). Thirdly, we assessed the wolf population size estimate in
2008 obtained using results from genetic analysis on scat samples and
snow-tracking data (Marucco et al. 2009a). Fourthly, we did a spatial
cross-validation test used commonly in the resource selection func-
tion literature (Boyce et al. 2002). Fifthly, to contrast the strength of
this model with non-dynamic approaches, we calculated and com-
pared the binomial likelihood of the data given each of three hypothe-
ses of pack presence: complete spatial randomness, a habitat-only
hypothesis and our SE-IBM. The SE-IBM creates absolute probabili-
ties as an output and can be used directly in the likelihood. For the
habitat-only model, we calculated the expected absolute probability
of use for each cell as the ratio of the true number of cells used (‘popu-
lation size’; 992) to number of cells available (44 592) multiplied by
the relative probability obtained in the habitat suitability map. This
approach makes the unrealistic assumption that cells are the unit of
habitat selection (i.e. not groups of cells); however, given that our
habitat suitability map is stationary across the entire region (i.e. there
were high quality cells everywhere), we anticipate that this simple test
will be approximately equal to the much more complex optimization
procedure of placing packs in the best clusters of cells. For complete
spatial randomness, the procedure was the same, except without mul-
tiplying by relative habitat suitability. Finally, we spatially cross-vali-
dated the forecast 2008 depredation risk map with the wolf
depredation events documented in 2008 in the Italian Alps.
WOLF RECOLONIZATION PREDICT IONS AND
DEPREDATION RISK ANALYSIS
We ran 10 000 replicate simulations (with parameters in Tables 1 and
S1) to predict the future pack locations, pack numbers and popula-
tion size for years 2013, 2018 and 2023. We used the 2008 locations of
the 13 known packs (Fig. 1) and pack structures (i.e. numbers, sexes,
ages of each individual) as the starting state of the simulation model.
Absolute probability maps of wolf pack presence were obtained by
averaging all replicate raster maps of pack presence (1 for pack pres-
ent, 0 for absent). To forecast relative depredation risk (low, medium,
high), we assumed that every non-rocky open pasture could be used
by livestock during the summer and we multiplied these with the
probability map forecasts of wolf pack presence, assuming that an
increased number of settled packs in an area increase the depredation
risk (Kaartinen, Luoto &Kojola 2009).
Results
MODEL CALIBRATION AND VALIDATION
From the model calibration procedure, we were able to find
parameter combinations (Table S1) that fit perfectly for the
non-spatial parameters; the spatial dispersal distance quantiles
had an average 21% deviation between simulated values and
data (Table 2).
Our five validation tests showed good support for themodel.
First, the ages at death for the 14 known individuals all fell
within the 95% confidence intervals of the predicted ones from
the best model scenario (Fig. S1). Moreover, of these known-
fate individuals in the data, only three successfully dispersed
and established new packs, consistent with model predictions.
Secondly and thirdly, our predicted mean wolf population
growth rate and population size were both very close to the
estimated means from data, and these estimates fell within the
95% simulation intervals (Table S2). Fourthly, the spatial vali-
dation of the absolute probability forecast of wolf pack distri-
bution in 2008 with the pack presence data for 2008 gave a
highly significant (P << 0Æ0001) Spearman-rank coefficient
(rs = 0Æ969), indicating high consistency with the independent
data. This correlation would have been higher; however, the
model equally predicted 0 wolves in the least suitable 4 of the
10 classes, and was thus penalized. Fifthly, AIC comparisons
of the threemodels (complete spatial randomness, habitat-only
and the current model) indicated unambiguous, large support
Wolf recolonization in the Alps 793
� 2010 The Authors. Journal compilation � 2010 British Ecological Society, Journal of Applied Ecology, 47, 789–798
for the SE-IBM (best: SE-IBM, DAIC = 0; second: habitat-
only, DAIC = 3256; third: CSR, DAIC = 15 536). Finally,
the validation of the 2008 depredation risk map for the Italian
Alps gave a highly significant test (P << 0Æ0001), showinghigh consistency between independent data on 2008 wolf dep-
redation events (n = 109) and simulations.
WOLF PREDICTIONS AND DEPREDATION RISK
Assuming unchanging habitat, mortality rate and protected
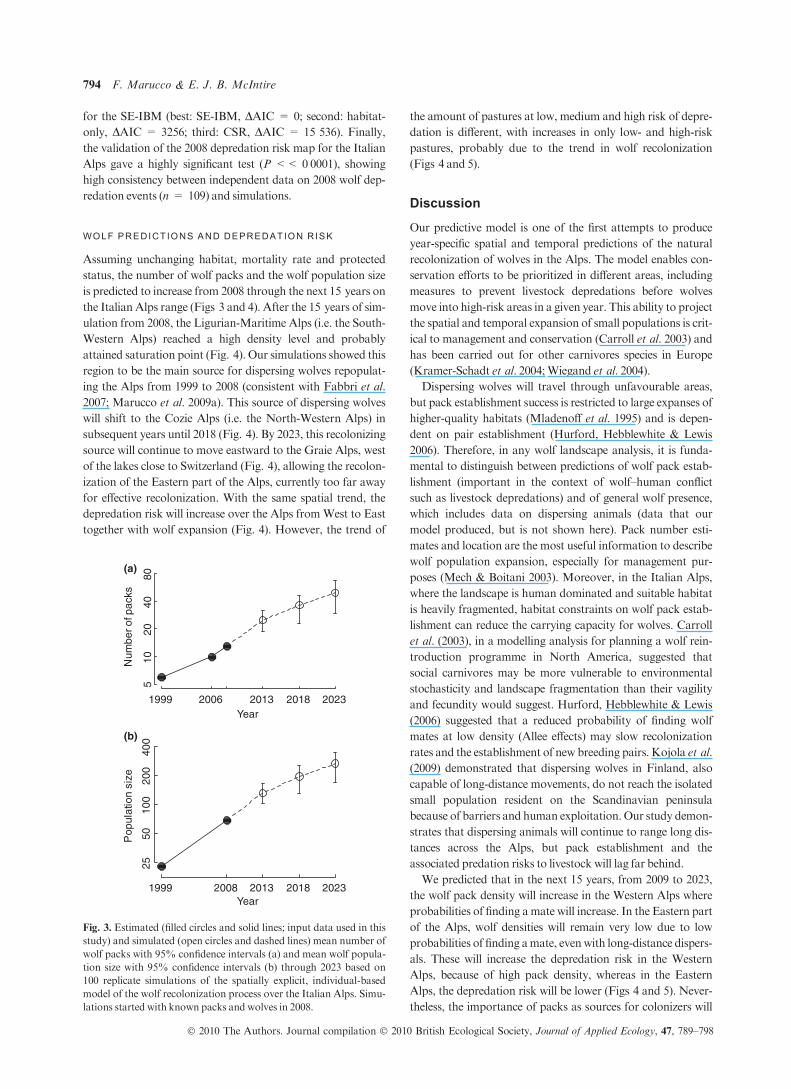
status, the number of wolf packs and the wolf population size
is predicted to increase from 2008 through the next 15 years on
the Italian Alps range (Figs 3 and 4). After the 15 years of sim-
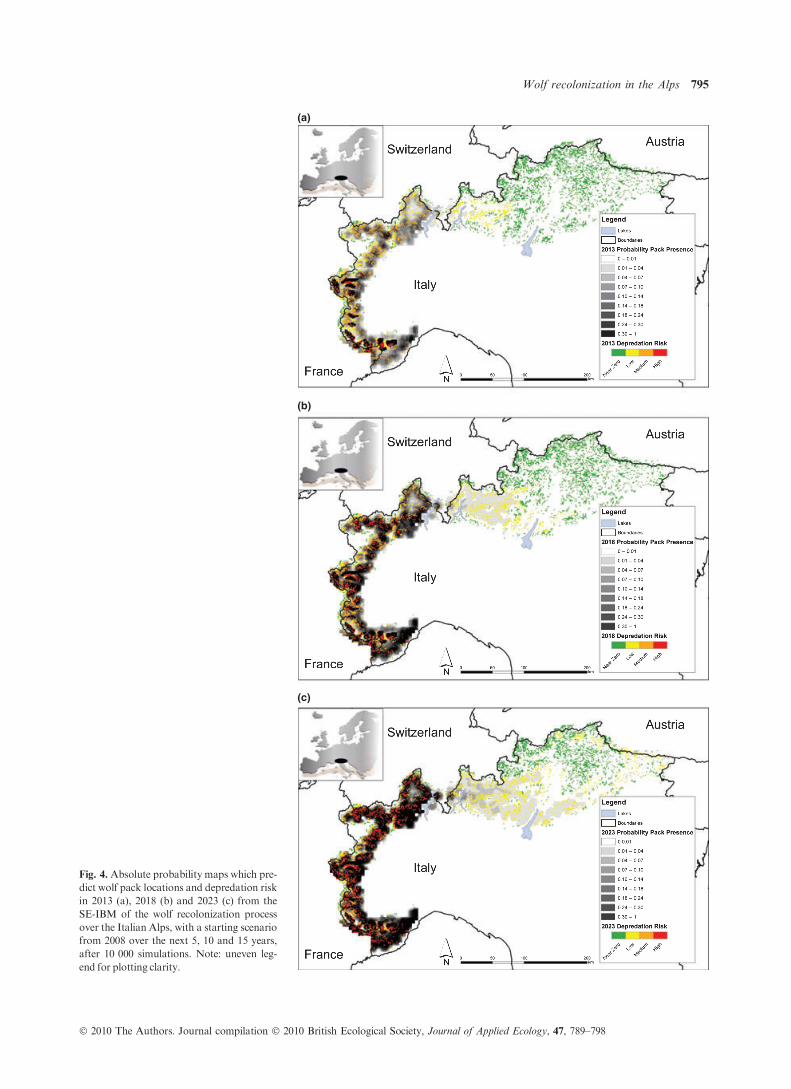
ulation from 2008, the Ligurian-Maritime Alps (i.e. the South-
Western Alps) reached a high density level and probably
attained saturation point (Fig. 4). Our simulations showed this
region to be the main source for dispersing wolves repopulat-
ing the Alps from 1999 to 2008 (consistent with Fabbri et al.
2007; Marucco et al. 2009a). This source of dispersing wolves
will shift to the Cozie Alps (i.e. the North-Western Alps) in
subsequent years until 2018 (Fig. 4). By 2023, this recolonizing
source will continue to move eastward to the Graie Alps, west
of the lakes close to Switzerland (Fig. 4), allowing the recolon-
ization of the Eastern part of the Alps, currently too far away
for effective recolonization. With the same spatial trend, the
depredation risk will increase over the Alps fromWest to East
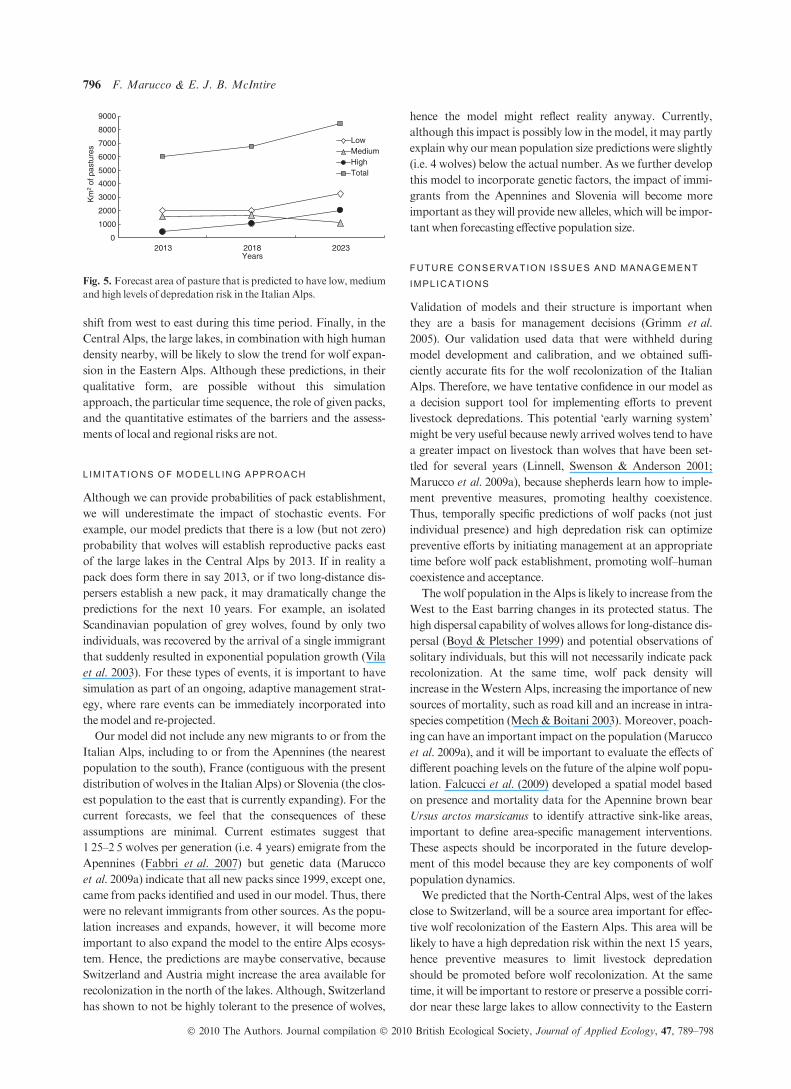
together with wolf expansion (Fig. 4). However, the trend of
the amount of pastures at low, medium and high risk of depre-
dation is different, with increases in only low- and high-risk
pastures, probably due to the trend in wolf recolonization
(Figs 4 and 5).
Discussion
Our predictive model is one of the first attempts to produce
year-specific spatial and temporal predictions of the natural
recolonization of wolves in the Alps. The model enables con-
servation efforts to be prioritized in different areas, including
measures to prevent livestock depredations before wolves
move into high-risk areas in a given year. This ability to project
the spatial and temporal expansion of small populations is crit-
ical to management and conservation (Carroll et al. 2003) and
has been carried out for other carnivores species in Europe
(Kramer-Schadt et al. 2004;Wiegand et al. 2004).
Dispersing wolves will travel through unfavourable areas,
but pack establishment success is restricted to large expanses of
higher-quality habitats (Mladenoff et al. 1995) and is depen-
dent on pair establishment (Hurford, Hebblewhite & Lewis
2006). Therefore, in any wolf landscape analysis, it is funda-
mental to distinguish between predictions of wolf pack estab-
lishment (important in the context of wolf–human conflict
such as livestock depredations) and of general wolf presence,
which includes data on dispersing animals (data that our
model produced, but is not shown here). Pack number esti-
mates and location are the most useful information to describe
wolf population expansion, especially for management pur-
poses (Mech & Boitani 2003). Moreover, in the Italian Alps,
where the landscape is human dominated and suitable habitat
is heavily fragmented, habitat constraints on wolf pack estab-
lishment can reduce the carrying capacity for wolves. Carroll
et al. (2003), in a modelling analysis for planning a wolf rein-
troduction programme in North America, suggested that
social carnivores may be more vulnerable to environmental
stochasticity and landscape fragmentation than their vagility
and fecundity would suggest. Hurford, Hebblewhite & Lewis
(2006) suggested that a reduced probability of finding wolf
mates at low density (Allee effects) may slow recolonization
rates and the establishment of new breeding pairs. Kojola et al.
(2009) demonstrated that dispersing wolves in Finland, also
capable of long-distance movements, do not reach the isolated
small population resident on the Scandinavian peninsula
because of barriers and human exploitation.Our study demon-
strates that dispersing animals will continue to range long dis-
tances across the Alps, but pack establishment and the
associated predation risks to livestock will lag far behind.
We predicted that in the next 15 years, from 2009 to 2023,
the wolf pack density will increase in the Western Alps where
probabilities of finding amate will increase. In the Eastern part
of the Alps, wolf densities will remain very low due to low
probabilities of finding amate, evenwith long-distance dispers-
als. These will increase the depredation risk in the Western
Alps, because of high pack density, whereas in the Eastern
Alps, the depredation risk will be lower (Figs 4 and 5). Never-
theless, the importance of packs as sources for colonizers will
Year
Num
ber o
f pac
ks
Year
Pop
ulat
ion
size
1999 2006 2013 2018 2023
1999 2008 2013 2018 2023
510
2040
80
(a)
(b)
2550
100
200
400
Fig. 3. Estimated (filled circles and solid lines; input data used in this
study) and simulated (open circles and dashed lines) mean number of
wolf packs with 95% confidence intervals (a) and mean wolf popula-
tion size with 95% confidence intervals (b) through 2023 based on
100 replicate simulations of the spatially explicit, individual-based
model of the wolf recolonization process over the Italian Alps. Simu-
lations started with known packs and wolves in 2008.
794 F. Marucco & E. J. B. McIntire
� 2010 The Authors. Journal compilation � 2010 British Ecological Society, Journal of Applied Ecology, 47, 789–798
(a)
(b)
(c)
Fig. 4. Absolute probability maps which pre-
dict wolf pack locations and depredation risk
in 2013 (a), 2018 (b) and 2023 (c) from the
SE-IBM of the wolf recolonization process
over the Italian Alps, with a starting scenario
from 2008 over the next 5, 10 and 15 years,
after 10 000 simulations. Note: uneven leg-
end for plotting clarity.
Wolf recolonization in the Alps 795
� 2010 The Authors. Journal compilation � 2010 British Ecological Society, Journal of Applied Ecology, 47, 789–798
shift from west to east during this time period. Finally, in the
Central Alps, the large lakes, in combination with high human
density nearby, will be likely to slow the trend for wolf expan-
sion in the Eastern Alps. Although these predictions, in their
qualitative form, are possible without this simulation
approach, the particular time sequence, the role of given packs,
and the quantitative estimates of the barriers and the assess-
ments of local and regional risks are not.
L IMITATIONS OF MODELL ING APPROACH
Although we can provide probabilities of pack establishment,
we will underestimate the impact of stochastic events. For
example, our model predicts that there is a low (but not zero)
probability that wolves will establish reproductive packs east
of the large lakes in the Central Alps by 2013. If in reality a
pack does form there in say 2013, or if two long-distance dis-
persers establish a new pack, it may dramatically change the
predictions for the next 10 years. For example, an isolated
Scandinavian population of grey wolves, found by only two
individuals, was recovered by the arrival of a single immigrant
that suddenly resulted in exponential population growth (Vila
et al. 2003). For these types of events, it is important to have
simulation as part of an ongoing, adaptive management strat-
egy, where rare events can be immediately incorporated into
themodel and re-projected.
Our model did not include any new migrants to or from the
Italian Alps, including to or from the Apennines (the nearest
population to the south), France (contiguous with the present
distribution of wolves in the Italian Alps) or Slovenia (the clos-
est population to the east that is currently expanding). For the
current forecasts, we feel that the consequences of these
assumptions are minimal. Current estimates suggest that
1Æ25–2Æ5 wolves per generation (i.e. 4 years) emigrate from the
Apennines (Fabbri et al. 2007) but genetic data (Marucco
et al. 2009a) indicate that all new packs since 1999, except one,
came from packs identified and used in our model. Thus, there
were no relevant immigrants from other sources. As the popu-
lation increases and expands, however, it will become more
important to also expand the model to the entire Alps ecosys-
tem. Hence, the predictions are maybe conservative, because
Switzerland and Austria might increase the area available for
recolonization in the north of the lakes. Although, Switzerland
has shown to not be highly tolerant to the presence of wolves,
hence the model might reflect reality anyway. Currently,
although this impact is possibly low in the model, it may partly
explain why ourmean population size predictions were slightly
(i.e. 4 wolves) below the actual number. As we further develop
this model to incorporate genetic factors, the impact of immi-
grants from the Apennines and Slovenia will become more
important as they will provide new alleles, which will be impor-
tant when forecasting effective population size.
FUTURE CONSERVATION ISSUES AND MANAGEMENT
IMPLICATIONS
Validation of models and their structure is important when
they are a basis for management decisions (Grimm et al.
2005). Our validation used data that were withheld during
model development and calibration, and we obtained suffi-
ciently accurate fits for the wolf recolonization of the Italian
Alps. Therefore, we have tentative confidence in our model as
a decision support tool for implementing efforts to prevent
livestock depredations. This potential ‘early warning system’
might be very useful because newly arrived wolves tend to have
a greater impact on livestock than wolves that have been set-
tled for several years (Linnell, Swenson & Anderson 2001;
Marucco et al. 2009a), because shepherds learn how to imple-
ment preventive measures, promoting healthy coexistence.
Thus, temporally specific predictions of wolf packs (not just
individual presence) and high depredation risk can optimize
preventive efforts by initiating management at an appropriate
time before wolf pack establishment, promoting wolf–human
coexistence and acceptance.
The wolf population in the Alps is likely to increase from the
West to the East barring changes in its protected status. The
high dispersal capability of wolves allows for long-distance dis-
persal (Boyd & Pletscher 1999) and potential observations of
solitary individuals, but this will not necessarily indicate pack
recolonization. At the same time, wolf pack density will
increase in theWestern Alps, increasing the importance of new
sources of mortality, such as road kill and an increase in intra-
species competition (Mech & Boitani 2003). Moreover, poach-
ing can have an important impact on the population (Marucco
et al. 2009a), and it will be important to evaluate the effects of
different poaching levels on the future of the alpine wolf popu-
lation. Falcucci et al. (2009) developed a spatial model based
on presence and mortality data for the Apennine brown bear
Ursus arctos marsicanus to identify attractive sink-like areas,
important to define area-specific management interventions.
These aspects should be incorporated in the future develop-
ment of this model because they are key components of wolf
population dynamics.
We predicted that the North-Central Alps, west of the lakes
close to Switzerland, will be a source area important for effec-
tive wolf recolonization of the Eastern Alps. This area will be
likely to have a high depredation risk within the next 15 years,
hence preventive measures to limit livestock depredation
should be promoted before wolf recolonization. At the same
time, it will be important to restore or preserve a possible corri-
dor near these large lakes to allow connectivity to the Eastern
0
1000
2000
3000
4000
5000
6000
7000
8000
9000
202320182013Years
Km
2 of
pas
ture
s
LowMediumHighTotal
Fig. 5. Forecast area of pasture that is predicted to have low, medium
and high levels of depredation risk in the Italian Alps.
796 F. Marucco & E. J. B. McIntire
� 2010 The Authors. Journal compilation � 2010 British Ecological Society, Journal of Applied Ecology, 47, 789–798
Alps, a successful strategy for large carnivores in North Amer-
ica (e.g. Duke et al. 2001). These and other results and recom-
mendations derived from this model can assist in wolf
conservation and, in the future, can also help to determine the
influence that land use and further human development may
have on the spatial expansion and connectivity of the wolf pop-
ulation in theAlps.
Acknowledgements
This study was developed within a multi-year wolf project ‘Progetto Lupo
Piemonte’, funded by the PiemonteRegion, Italy.We thank theAlpiMarittime
Natural Park for the management of the project, and the Progetto Lupo
Piemonte crew, Natural Parks, Corpo Forestale dello Stato and Provinces of
the Piemonte Region for field work. We thank L. Boitani, J. Graham, M.
Hebblewhite and D. Pletscher for comments on an early draft. This work was
supported by anNSERC post-doctoral fellowship and Canada Research Chair
to E.McIntire.
References
Adriaensen, F., Chardon, J.P., De Blust, G., Swinnen, E., Villalba, S., Gulinck,
H. & Matthysen, E. (2003) The application of ‘‘least-cost’’ modelling as a
functional landscapemodel.Landscape and urban planning, 64, 233–247.
Boyce,M.S., Vernier, P.R., Nielsen, S.E. & Schmiegelow, F.K.A. (2002) Evalu-
ating resource selection functions.EcologicalModelling, 157, 281–300.
Boyd, D. & Pletscher, D.H. (1999) Characteristics of dispersal in a colonizing
wolf population in the Central Rocky Mountains. Journal of Wildlife Man-
agement, 63, 1094–1108.
Burgman, M.A. & Possingham, H.P. (2000) Population viability analysis for
conservation: the good, the bad, and the underscribed. Genetics, Demogra-
phy, and Viability of Fragmented Populations (eds A.G. Young & G.M.
Clarke), pp. 68–72. CambridgeUniversity Press, London.
Caro, T.M. & Durant, S.M. (1995) The importance of behavioral ecology for
conservation biology: examples from Serengeti carnivores. Serengeti II:
Dynamics, Management, and Conservation of an Ecosystem (eds A.R.E. Sin-
clair & P.Arcese), pp. 451–472. University of Chicago Press, Chicago.
Carroll, C., Phillips, M.K., Schumaker, N.H. & Smith, D.W. (2003) Impacts
of landscape change on wolf restoration success: planning a reintroduction
program based on static and dynamic spatial models. Conservation Biology,
17, 536–548.
Chapron,G., Legendre, P., Ferriere, R., Clobert, J.&Haight, R.G. (2003) Con-
servation and control strategies for the wolf (Canis lupus) inWestern Europe
based on demographicmodels.ComptesRendus Biologies, 326, 575–587.
Corsi, F., Dupre, E. & Boitani, L. (1999) A large-scale model of wolf distribu-
tion in Italy for conservation planning.Conservation Biology, 13, 150–159.
DeAngelis, D.L., Mooij, W.M., Nott, M.P. & Bennetts, R.E. (2001) Individ-
ual-based models: tracking variability among individuals.Modeling in Natu-
ral Resource Management (eds T. Shenk & A.B. Franklin), pp. 171–196.
Island Press,WashingtonDC.
Duke, D.L., Hebblewhite, M., Callaghan, C., Percy, M. & Paquet, P.C. (2001)
Restoration of a large carnivore corridor in Banff National Park. Large
Mammal Restoration: Ecological and Sociological Challenges in the 21st Cen-
tury (eds D.S. Maehr, R.F. Noss & J.L. Larkin), pp. 261–275. Island Press,
Washington.
Fabbri, E., Miquel, C., Lucchini, V., Santini, A., Caniglia, R., Duchamp, C.,
Weber, J.-M., Lequette, B., Marucco, F., Boitani, L., Fumagalli, L., Taber-
let, P. & Randi, E. (2007) From the Apennines to the Alps: colonization
genetics of the naturally expanding Italian wolf (Canis lupus) population.
Molecular Ecology, 16, 1661–1671.
Falcucci, A., Ciucci, P., Maiorano, L., Gentile, L. & Boitani, L. (2009) Assess-
ing habitat quality for conservation using an integrated occurrence-mortality
model. Journal of Applied Ecology, 46, 600–609.
Fall, A. & Fall, J. (2001) A domain-specific language for models of landscape
dynamics.EcologicalModelling, 141, 1–18.
Ferreras, P., Gaona, P., Palomares, F. & Delibes, M. (2001) Restore habitat or
reduce mortality? Implications from a population viability analysis of the
Iberian lynx.Animal Conservation, 4, 265–274.
Gonzalez-Suarez, M. & Gerber, L.R. (2008) A behaviorally explicit demo-
graphicmodel integrating habitat selection and population dynamics inCali-
fornia sea lions.Conservation Biology, 22, 1608–1618.
Grimm, V. & Railsback, S. (2005) Individual-Base Modeling and Ecology.
PrincetonUniversity Press, Princeton.
Grimm, V., Revilla, E., Berger, U., Jeltsch, F., Mooij, W.M., Railsback, S.F.,
Thulke, H.H., Weiner, J., Wiegand, T. & DeAngelis, D.L. (2005) Pattern-
oriented modeling of agent-based complex systems: lessons from ecology.
Science, 310, 987–991.
Hurford, A., Hebblewhite, M. & Lewis, M.A. (2006) A spatially explicit model
for an Allee effect: why wolves recolonize so slowly in greater Yellowstone.
Theoretical Population Biology, 70, 244–254.
IUCN (2001) IUCN Red List Categories and Criteria: Version 3.1. IUCN Spe-
cies Survival Commission, Gland, Switzerland andCambridge, UK.
Jedrzejewski, W., Jedrzejewska, B., Zawadzka, B., Borowik, T., Nowak, S. &
Myslajek., R.W. (2008) Habitat suitability model for Polish wolves based on
long-term national census.Animal Conservation, 11, 377–390.
Kaartinen, S., Luoto, M. & Kojola, I. (2009) Carnivore-livestock conflicts:
determinants of wolf (Canis lupus) depredation on sheep farms in Finland.
Biodiversity and Conservation, 18, 3503–3517.
Kojola, I., Kaartinen, S., Hakala, A., Heikkinen, S. & Voipio, H.-M. (2009)
Dispersal behavior and the connectivity between wolf populations in North-
ern Europe. Journal ofWildlifeManagement, 73, 309–313.
Kramer-Schadt, S., Revilla, E., Wiegand, T. & Breitenmoser, U. (2004)
Fragmented landscapes, road mortality and patch connectivity: modelling
influences on the dispersal of Eurasian lynx. Journal of Applied Ecology, 41,
711–723.
Linnell, J.D.C., Swenson, S.E. & Anderson, R. (2001) Predators and people:
conservation of large carnivores is possible at high human densities if
management policy is favourable.Animal Conservation, 4, 345–349.
Macdonald, D.W. & Rushton, S. (2003) Modelling space use and dispersal of
mammals in real landscapes: a tool for conservation. Journal of Biogeogra-
phy, 30, 607–620.
MacKenzie, D.I. (2006) Modeling the probability of resource use: the effect of,
and dealingwith, detecting a species imperfectly. Journal ofWildlifeManage-
ment, 70, 367–374.
Marboutin, E. & Duchamp, C. (2005) Gestion adaptative de la population de
loup en France: du monitoring a l’evaluation des possibilites de prelevements.
ONCFSRapport scientifique, pp. 14–19.
Marucco, F. (2009) Spatial population dynamics of a recolonizing wolves in the
Western Alps. PhD dissertation,University ofMontana.
Marucco, F., Avanzinelli, E., Dalmasso, S. & Orlando, L. (2009a) . Report
2009: Progetto Lupo Piemonte. Regione Piemonte, Torino.
Marucco, F., Pletscher, D.H., Boitani, L., Schwartz, M.K., Pilgrim, K.L. &
Lebreton, J.D. (2009b) Wolf survival and population trend using non-inva-
sive CMR techniques in the Western Alps. Journal of Applied Ecology, 46,
1003–1010.
Matsinos, Y.G., Wolff, W.F. & DeAngelis, D.L. (2002) Can individual-based
models yield better assessment of population viability?QuantitativeMethods
for Conservation Biology (eds S. Ferson & M.A. Burgman), pp. 188–198.
Springer, NewYork.
McIntire, E.J.B., Schultz, C.B. & Crone, E.E. (2007) Designing a network for
butterfly habitat restoration: where individuals, populations and landscape
interact. Journal of Applied Ecology, 44, 725–736.
Mech, L.D. & Boitani, L. (2003)Wolves: Behavior, Ecology, and Conservation.
TheUniversity of Chicago Press, Chicago.
Mladenoff, D.J., Sickley, T.A., Haight, R.G. &Wydeven, A.P. (1995) A regio-
nal landscape analysis and prediction of favorable gray wolf habitat in the
NorthernGreat LakesRegion.Conservation Biology, 9, 279–294.
Nilsson, T. (2003) Integrating effects of hunting policy, catastrophic events,
and inbreeding depression, in PVA simulation: the Scandinavian wolf popu-
lation as an example.Biological Conservation, 115, 227–239.
Samson, F.B. (2002) Population viability analysis, management, and conserva-
tion planning at large scales. Population Viability Analysis (eds. S.R.
Beissinger & D.R. McCullough), pp. 425–446. The University of Chicago
Press, Chicago.
Shenk, T.M. & Franklin, A.B. (2001) Modeling in Natural Resource Manage-
ment: Development, Interpretation, and Application. IslandPress,Washington.
Turchin, P. (1998) Quantitative Analysis of Movement: Measuring and
Modeling Population Redistribution in Animals and Plants. Sinauer Associ-
ates,MA.
Vila, C., Sundqvist, A.K., Flagstad, O., Seddon, J., Bjornerfeldt, S., Kojola, I.,
Casulli, A., Sand, H., Wabakken, P. & Ellegren, H. (2003) Rescue of a
several bottlenecked wolf (Canis lupus) population by a single immigrant.
Proceedings of the Royal Society of London Series B, 279, 91–97.
Vucetich, J.A., Peterson, R.O. & Waite, T.A. (1997) Effects of social structure
and prey dynamics on extinction risk in gray wolves. Conservation Biology,
11, 957–965.
Wolf recolonization in the Alps 797
� 2010 The Authors. Journal compilation � 2010 British Ecological Society, Journal of Applied Ecology, 47, 789–798
Wiegand, T., Knauer, F., Kaczensky, P. & Naves, J. (2004) Expansion of
brown bears (Ursus arctos) into the Eastern Alps: a spatially explicit popula-
tionmodel.Biodiversity and Conservation, 13, 79–114.
Received 9 February 2010; accepted 6May 2010
Handling Editor: Ullas Karanth
Supporting Information
Additional Supporting Information may be found in the online ver-
sion of this article.
Fig. S1. Age of death of known wolves from real data and simula-
tions.
Table S1. Parameters estimated during calibration phase
Table S2.Documented parameters used for validation of the model
Appendix S1.Calibration of themodel.
As a service to our authors and readers, this journal provides support-
ing information supplied by the authors. Such materials may be
re-organized for online delivery, but are not copy-edited or typeset.
Technical support issues arising from supporting information (other
thanmissing files) should be addressed to the authors.
798 F. Marucco & E. J. B. McIntire
� 2010 The Authors. Journal compilation � 2010 British Ecological Society, Journal of Applied Ecology, 47, 789–798
Copyright © 2022 FDOKUMEN