A Study of Digging Productivity of an Electric Rope Shovel for ...
Upload
independentCategory
view
1download
0
Proc R Soc B (2012) 279 910ndash915
Authodagger The fir
Electron1098rsp
doi101098rspb20111275
Published online 17 August 2011
ReceivedAccepted
Shoot shovel and shut up crypticpoaching slows restoration of a large
carnivore in EuropeOlof Liberg1dagger Guillaume Chapron1dagger Petter Wabakken2
Hans Christian Pedersen3 N Thompson Hobbs4 and Hakan Sand1
1Grimso Wildlife Research Station Department of Ecology Swedish University of Agricultural Sciences
73091 Riddarhyttan Sweden2Department of Applied Ecology and Agricultural Sciences Hedmark University College
Evenstad 2480 Koppang Norway3Norwegian Institute for Nature Research Tungasletta 2 7485 Trondheim Norway
4Natural Resource Ecology Laboratory and Graduate Degree Program in Ecology Colorado State University
Fort Collins CO 80523 USA
Poaching is a widespread and well-appreciated problem for the conservation of many threatened species
Because poaching is illegal there is strong incentive for poachers to conceal their activities and con-
sequently little data on the effects of poaching on population dynamics are available Quantifying
poaching mortality should be a required knowledge when developing conservation plans for endangered
species but is hampered by methodological challenges We show that rigorous estimates of the effects of
poaching relative to other sources of mortality can be obtained with a hierarchical statendashspace model
combined with multiple sources of data Using the Scandinavian wolf (Canis lupus) population as an
illustrative example we show that poaching accounted for approximately half of total mortality and
more than two-thirds of total poaching remained undetected by conventional methods a source of mor-
tality we term as lsquocryptic poachingrsquo Our simulations suggest that without poaching during the past
decade the population would have been almost four times as large in 2009 Such a severe impact of
poaching on population recovery may be widespread among large carnivores We believe that conser-
vation strategies for large carnivores considering only observed data may not be adequate and should
be revised by including and quantifying cryptic poaching
Keywords statendashspace models poaching wolf Canis lupus conservation
1 INTRODUCTIONThe illegal killing of animals hereafter poaching threa-
tens the viability of many species worldwide [1ndash5]
Because of their characteristic low densities combined
with their slow rates of population growth top predators
are particularly vulnerable to effects of poaching Almost
all large carnivore species have endured a long history of
human persecution and have been eradicated from sub-
stantial parts of their historical ranges [6] Although
most species of large carnivores are now legally protected
poaching remains a widespread problem for their conser-
vation [6] Some species are commercially poached for
pelts or body parts used in traditional medicine [7] but
many are killed because of conflicts with human interests
such as competition for game depredation of livestock
and threats to human safety [8] It follows that dealing
with poaching mortality often emerges as a required con-
dition for the restoration conservation and sustainable
management of large carnivore populations
r for correspondence (oloflibergsluse)st two authors contributed equally to this work
ic supplementary material is available at httpdxdoiorg10b20111275 or via httprspbroyalsocietypublishingorg
18 June 201126 July 2011 910
A near universal problem with understanding poaching
is the absence of rigorous estimates of its effects relative to
other sources of mortality [1] There are several recent
attempts to assess the extent mechanisms and effects of
poaching [29ndash12] but remarkably little quantitative
data exist although new methods to measure its extent
have recently been developed [13] One obvious reason
for the absence of data is methodological The most
reliable method of quantifying causes of mortality in
populations of large wild mammals is to observe their
fates over time using radio-tracking [14] However
when a radio-collared animal is poached there is a high
probability that the poacher promptly destroys the trans-
mitter and hides (or consumes) the carcass leaving the
researcher with a lost radio contact without known
cause [15] Treating cases of lost radio contact in a sur-
vival analysis based on radio-tracking is not a trivial
problem especially not for such lsquopoaching-pronersquo animals
as large carnivores One can never exclude the possibility
that a certain proportion of animals with lost radio con-
tact in fact died from poaching that cannot be verified
We define this unobserved source of mortality as lsquocryptic
poachingrsquo Estimating a quantity in ecological processes
that is not amenable to direct observation is feasible
with hierarchical models because these models allow
multiple sources of data to inform estimates of model
This journal is q 2011 The Royal Society
Quantifying cryptic poaching O Liberg et al 911
parameters including unobservable ones [16] These
sources of data can include observations on state variables
from monitoring studies as well as direct estimates of
observable parameters from detailed studies of processes
In this paper we used a decade (1999ndash2009) of popu-
lation census radio-tracking and recruitment data of the
Scandinavian wolf population combined with a Bayesian
statendashspace hierarchical population model to show that
poaching has drastically slowed down the recovery of
this population
2 MATERIAL AND METHODS(a) General approach
Between December 1998 and April 2009 we radio-marked
104 wolves in Scandinavia constituting between 10 and 15
per cent of the population among which we had 26 verified
mortalities We used radio-tracking data to compute three
cause-specific mortality rates based on 21 cases of non-
poaching (seven natural deaths such as age and disease
five traffic mortalities and nine cases of legal control) five
cases of verified poaching and finally 18 cases of cryptic
poaching (not included in the 26 verified mortalities) We
considered a wolf as having been cryptically poached or ver-
ifiably poached according to criteria explained below
However we could not obtain a robust estimate of cryptic
poaching because we never found the supposedly dead
wolves We circumvented this obstacle by fitting a hierar-
chical statendashspace model to another dataset a decade-long
time series of population size and number of reproductions
In particular we investigated whether the non-poaching
mortality and the verified poaching rates would be large
enough altogether to explain the observed population
trends or on the contrary if an additional source of
mortality was needed to fit the longitudinal data the best
(b) Criteria for cryptic and verified poaching
Cryptic poaching was defined based on four criteria (with
either all of criteria 1ndash3 or criterion 4 alone satisfied)
1 Sudden loss of radio contact with no indication of trans-
mitter failure (more than half of the expected battery
life-time remaining)
2 At least two aerial searches over a much larger area than
the wolf territory were performed without further contact
with the collared individual
3 The individual was resident and repeated snow-tracking
within the territory in combination with the collection
of scats and subsequent DNA analyses of multiple
faeces confirmed that this individual was no longer
present within the pack territory
4 Radio contact was lost and special circumstances strongly
indicated that poaching was the most plausible expla-
nation This applied only for two cases where police
reports confirmed that people had attempted to poach
wolves
Wolves not satisfying these criteria were censored at the date
of lost contact
Verified poaching was defined based on two criteria
(enough if one criterion is satisfied)
1 The body was recovered and the necropsy showed that a
human deliberately killed it outside a legal hunt
Proc R Soc B (2012)
2 Wolf tissue (skin or muscle) determined by DNA analysis
to originate from one of the radio-collared wolves was
found in possession of a person that could not explain
how he had acquired it and was later convicted at a
court for this illegal possession
(c) Hierarchical model
To estimate the posterior distribution of the true size of the
population we composed process and observation equations
The process equation was
mt frac14 logfrac12Nt1eth1m v cTHORN thorn lRt1and
Nt lognormalethmt sprocTHORN
where mt is the deterministic prediction of the median wolf
population size at time t Nt is the true population size at
time t sproc is the standard deviation of the true population
size on the log scale m is the mortality rate from all causes
except poaching v is the verified poaching rate c is the cryp-
tic poaching rate l is the per pack recruitment rate and Rt is
the number of reproductions at time t The process equation
was linked to data using the observation equation
at frac14N2
t
s2Nobs
bt frac14Nt
s2Nobs
lt gamma ethat btTHORNand Nobst PoissonethltTHORN
where Nobst is the observed population size at time t s2Nobs is
the estimate of the error of observation of the population size
This formulation views the count data hierarchicallymdashthe
mean observed count of wolves at time t is Poisson distribu-
ted with mean lt and this mean is drawn from a gamma
distribution with mean equal to the prediction of the process
model and a standard deviation for observation error We
chose this approach because it allows the uncertainty in the
data model to be larger than the variance of the Poisson par-
ameter lt The approach is the same as assuming that the
count data follow a negative binomial distribution but offer
computational advantages [17] We did not include density-
dependence in our hierarchical model because there is plenty
of space and wild ungulate prey for larger wolf populations
on the Scandinavian Peninsula and both Sweden and
Norway have some of the highest moosendashwolf ratios in the
world [18]
(d) Data and model priors
Estimates of total population size (Nobs) and number of
reproductions (R) were obtained annually from 1999 to
2009 using a combination of snow-tracking radio-tracking
and DNA analysis of scats (see electronic supplementary
material time-series data)
Monitoring of pack reproductions provided informative
prior on l Number of pups at the age of six months was esti-
mated from recurrent sessions of snow-tracking within
territories (3788+1466) Shape parameters of informative
gamma-distributed prior for litter size l were then calculated
using moment matching (table 1) [19]
Using radio-tracking data we calculated cause-specific
mortality rates non-poaching m frac14 0148 + 0028 verified
poaching v frac14 0049 + 0017 and suspected poaching
c frac14 0085 + 0023 and accounting for competing risks [14]
Shape parameters of informative beta-distributed priors
Table 1 Parameter values from radio-tracking dataset and
prior distributions Priors shape parameters were derived bymoment matching of mean and sd values from the radio-tracking dataset Note that sproc is on a log scale
parameter
mean valuefrom radio-tracking sd prior
m 0148 0028 beta (2344 13521)a
v 0050 0017 beta (784 15056)a
c 0085 0023 unif (0 1)l 3788 1466 gamma (667 176)a
sNobs mdash mdash unif (0 50)sproc mdash mdash unif (0 25)
aDenotes informative priors
912 O Liberg et al Quantifying cryptic poaching
for rates m and v were calculated using moment matching
(table 1) [19] Although radio-tracking data could provide
information also on cryptic poaching rate c we specified an
uninformative prior on c to investigate whether the observed
population trends could be well explained with no cryptic
poaching at all While literature refers to cause-specific mor-
tality rates c m and v are in fact probabilities to die from a
specific cause and therefore the most uninformative prior
we could give to c was a uniform distribution in (01)
Shape parameters for uninformative priors for sNobs and
sproc were chosen subjectively to assure that all possible
values in the posterior distribution had equal densities in
the prior distribution (table 1) Sensitivity of posterior dis-
tributions to the priors was tested to assure the choices of
shape parameters were uninformative
(e) Monte Carlo Markov Chain inference
We estimated the posterior distribution of each parameter by
running Monte Carlo Markov Chains implemented in JAGS
[20] with R [21] Six chains were initialized with different
sets of parameter values chosen within biologically plausible
bounds After an initial burn-in period of 100 000 iterations
we obtained 1 000 000 iterations of each of the chains thinning
each by 10 We successfully checked for convergence using the
Heidelberger amp Welch [22] stationarity and half-width tests
with the CODA package [23] We evaluated the overlap
between prior p(u) and posterior p(ujy) distributions by com-
puting the quantity t frac14 eth1=pethuTHORNTHORNETH
mineth pethuTHORNpethuj yTHORNTHORNdu [24]
To estimate the impact of poaching on our study popu-
lation we simulated population trajectories from 1999 to
2009 using posterior distributions of parameters without
cryptic poaching and without any poaching at all We also
wanted to investigate if we could differentiate an absence of
cryptic poaching from small rates of cryptic poaching For
this we considered that the simulated population without
cryptic poaching would become our longitudinal data and
we used the same approach to estimate the posterior distri-
bution of cryptic poaching This amounts to fitting a model
to a dataset that we know has been generated with no cryptic
poaching at all
3 RESULTSPoaching accounted for half of total mortality (51) and
more than two-third (69) of total poaching was cryptic
The median estimates of posterior non-poaching
Proc R Soc B (2012)
(0142+0027) and verified poaching (0046+0016)
mortality rates from the model were very similar to the
rates based on radio-tracking data (respectively 0148+0028 and 0049+0017 figure 1) The median estimate
of the posterior cryptic poaching rate from the model
(0103+0106) was also remarkably close to the indepen-
dent estimate based on radio-tracking data (0085+0023) but was accompanied by higher variance (figure 1)
However despite this variance the data improved the
estimate of cryptic poaching over prior knowledge
Overlap was large for non-poaching (t frac14 94) and verified
poaching (t frac14 96) mortality rates On the contrary for
cryptic poaching overlap was smaller (t frac14 37) indicating
that modelling did add information on the estimate of
cryptic poaching
Our study population increased from 74 individuals in
winter 19981999 to 263 in 20082009 (figure 2) The
mean annual growth rate during this period was 135
per cent Assuming no (verified and cryptic) poaching
and no density-dependence this trajectory would have
resulted in a median population size of 990 wolves in
2009 ie almost four times larger than the one observed
For a population without cryptic poaching and with veri-
fied poaching only the trajectory would have resulted in a
median population size of 676 wolves in 2009 When we
considered the simulated population without cryptic
poaching as data and used the same modelling approach
to quantify cryptic poaching we obtained a rate of cryptic
poaching very close to zero (c frac14 0023+003)
4 DISCUSSIONHere we have demonstrated a high incidence of poaching
in a threatened wolf population but because a major part
of this poaching was unobserved (cryptic) and inferred
from indirect data its estimate is open to criticism
Although we cannot unequivocally prove that the
posterior of rate c strictly includes only poaching we
can conclude that an additional source of mortality is
required to explain our combined data Because we
could not identify any other cause of death than poaching
that also would have resulted in a sudden loss of radio
contact combined with no later verification through the
continuous DNA-monitoring of the population we
believe that most if not all mortality included in this
rate is indeed cryptic poaching The close correspondence
between the estimates we obtained for cryptic poaching
rate from the model (0103) and the independent one
based on radio-tracking data (0085) furthermore support
that cryptic poaching indeed was an important mortality
cause in our study population The larger model estimate
might be explained by the fact that the estimate based on
radio-tracking data could be an underestimate Because of
our strict criteria for poaching we did not classify any of
the missing radio-collared non-resident dispersers as
cryptic poaching although this may have occurred in
some cases Our estimate of cryptic poaching received
further support by the large gap between the simulated
population trend without cryptic poaching and the
observed dataset This should convincingly reveal that
observable mortality rates m and v cannot alone explain
the observed population trends
Our results may have been severely biased if we had
underestimated population size because in that case
0 02 04 06 08 10cryptic poaching rate
dens
ity(a) (b)
(c)
0 02 04 06 08 10non-poaching mortality rate
0 02 04 06 08 10
verified poaching rate
Figure 1 Posterior (solid black line) and prior (dotted black line) densities for (a) cryptic poaching rate c (posterior median frac140103+0106 shown by vertical thin line) (b) non-poaching mortality rate m (posterior median frac14 0142+0027) and
(c) verified poaching rate v (posterior median frac14 0046+0016) Overlap between prior and posterior densities is shownby the grey area Parameters m and v were given informative priors based on radio-tracking data Their posterior median esti-mates were very similar to rates from radio-tracking data (non-poaching mortality rate frac14 0148+0028 verified poachingrate frac14 0049+0017) The prior for cryptic poaching rate was on the contrary left uninformative Still its posterior medianestimate was remarkably similar to the independent estimate of cryptic poaching rate from radio-tracking data (0085+0023) The posterior density of cryptic poaching poorly overlapped with its prior and reveals that an unobserved source ofmortality was present in the population
Quantifying cryptic poaching O Liberg et al 913
the parameter we attributed to cryptic poaching would
actually have been a correction factor for our underesti-
mate However the intense and continuous fine scale
monitoring of wolves allowed us to rule out a systematic
underestimate of population size (see electronic sup-
plementary material robustness of census data) Our
results may have been equally biased if our criteria for
cryptic poaching were inadequate However none of the
18 animals classified as cryptic poaching were ever
detected after the loss of radio contact by any of the
survey methods used in this study (see electronic sup-
plementary material robustness of poaching criteria)
Quantifying a cause-specific mortality rate based on
unknown fates requires also excluding the possibilities
that an animal would have remained undetected by dis-
persing from the population The breeding wolf
population on the Scandinavian peninsula (Norway and
Sweden) appears to be functionally isolated from the
FinnishndashRussian population with very little immigration
and only one confirmed emigration recorded during the
past decade (see electronic supplementary material
population isolation)
Poaching has had a significant impact on the popu-
lation recovery An average annual growth rate of
135 per cent is well below the typical rate of colonizing
or recovering wolf populations [25] Without any
Proc R Soc B (2012)
poaching the median annual growth rate of our study
population would have been 295 per cent during the
period ie more than double the observed rate and
compatible with the fastest recovering wolf populations
on record [2526] Considering that neither suitable
habitat nor prey base are limiting factors the population
size in 2009 would probably have been three to four
times the one observed (figure 2) Although the popu-
lation has continued to grow the decelerated growth
rate caused by poaching is having other negative conse-
quences It has postponed the time when managing
authorities can be more flexible with permits to kill pro-
blem individuals causing unnecessary conflict with local
people Still more serious it has aggravated an already
bad genetic situation The Scandinavian wolf population
is small isolated and facing serious genetic problems
[2728] and any delay in growth will accelerate inbreed-
ing and loss of genetic variation [29]
Few studies of large carnivore survival based on radio-
tracking have clearly described how they have treated cases
of lost radio contact and made efforts to differentiate
between possible fates of these animals In a newly protected
wolf population in north central Minnesota a substantial
proportion of lost radio contacts was assumed to be caused
by illegal killing and estimated to make up 70 per cent of
total mortality rate [30] In three different Scandinavian
200
400
600
800
1000
year
wol
f po
pula
tion
size
1999 2001 2003 2005 2007 2009
Figure 2 Model and census estimates of the wolf populationin Scandinavia during 1999ndash2009 Filled black triangles are
census data Squares are median of posterior distribution ofthe fitted model with its 95 credible interval shown bydashed lines Circles are the median posterior distributionof the simulated population without poaching assuming nodensity-dependence This reveals a decade of poaching
scaled down population size from 990 to 263 wolves in2009 Lozenges are the median posterior distribution of thesimulated population without cryptic poaching assumingno density-dependence The grey area indicates thenumber of wolves theoretically lost due to cryptic poaching
914 O Liberg et al Quantifying cryptic poaching
lynx (Lynx lynx) populations formal criteria resembling the
ones we have used in this study were set up for validation of
each case of lost radio contact resulting in poaching rates
between 32 and 74 per cent of total mortality [31] A
study on wolverines (Gulo gulo) also differentiated among
lost radio contacts and estimated that poaching made up
60 per cent of total mortality [32] while in a study of
Amur tigers (Panthera tigris) ratio of poaching to total mor-
tality was 75 per cent [15] A shared result in these studies
was that a substantial part of the estimated poaching rates
was made up of cryptic poaching (44ndash71) Cryptic poach-
ing was estimated to be 69 per cent of the total poaching rate
in our study which falls within the range of these earlier
studies Had all cases of lost radio contact just been
censored from further calculations both poaching and
total mortality rates would have been seriously underesti-
mated However as the estimates of the cryptic part of
poaching in all these case studies were based on assump-
tions the degree of uncertainty in the estimates was
unknown By using a hierarchical model we could combine
multiple sources of data in a statistically coherent way and
unobserved quantities could be estimated because of their
interdependence with the quantities that are observed
We believe that the results presented above motivate
careful reconsideration of the extent of cryptic poaching
in all studies of large carnivores A recent example is the
Proc R Soc B (2012)
extensive study of survival in the newly recovered
Northern Rocky Mountain wolf population in northwes-
tern United States [33] where a minimum of 87 (24) of
the 363 dead animals was confirmed illegally killed A
further number of 150 animals were censored at the
date of lost radio contact Although the authors gave sev-
eral arguments why it was less likely that these animals
might have been poached we caution that this indeed
might be the case for a substantial part of them especially
considering that the study was performed in an extremely
wolf hostile human environment
We have shown that the failure to include the effects of
cryptic poaching can cause serious errors in the estimation
of the potential rate of population growth Because a sub-
stantial part of poaching is often unobserved poaching
may be an even larger problem in wildlife conservation
than has hitherto been assumed owing to the difficulty of
measuring it properly Quantifying cryptic poaching and
its impact illustrates a challenging problem that is not
unusual in ecology and conservation biologymdashthe esti-
mation of unobservable parameters with small values but
high variance [34] As we have illustrated here such
problem can be successfully addressed by combining
multiple data in a hierarchical framework to obtain robust
inferences The increasing possibilities to mark many
more individual animals at a much larger range of taxa
body sizes and length of tracking time [3536] should
make collecting individual data more feasible and there-
fore our approach more widely applicable in the future
Our study should further reinforce the need to bring uncer-
tainty to the centre stage of conservation studies [37] and
illustrate how considering uncertainty affects the ability
to manage populations [338]
All research presented complies with the current laws of thecountry in which the experiments were performed
We are indebted to J M Arnemo P Ahlqvist and P Segerstromwho captured and handled the wolves C WikenrosA Blixgard S E Bredvold A Bye M Dotterer J EnerudF Holen P Kirkeby P Larsson E Maartmann B OlssonH Roslashnning R Skyrud T H Stroslashmseth and O-K Steinsetcarried out fieldwork The Swedish National VeterinaryInstitute and the Veterinary Laboratory at the NorwegianInstitute for Nature Research performed the post-morteminvestigations of retrieved dead wolves The study wassupported by the Swedish Environmental Protection Agencythe Swedish Association for Hunting and WildlifeManagement World Wildlife Fund for Nature (Sweden)Swedish University of Agricultural Sciences NorwegianDirectorate for Nature Management Norwegian ResearchCouncil Norwegian Institute for Nature Research HedmarkUniversity College County Governors of Hedmark andVarmland Borregaard Skoger Glommen SkogeierforeningNorskog Norges Skogeierforbund Olle and SignhildEngkvists Stiftelser Carl Tryggers Stiftelse Marie ClaireCronstedts Stiftelse Swedish Carnivore Association andStor-Elvdal Amot Asnes and Trysil municipalities
REFERENCES1 Gavin M C Solomon J N amp Blank S G 2010
Measuring and monitoring illegal use of naturalresources Conserv Biol 24 89ndash100 (doi101111j1523-1739200901387x)
2 Agnew D J Pearce J Pramod G Peatman TWatson R Beddington J R Pitcher T J amp Sandin
Quantifying cryptic poaching O Liberg et al 915
S A 2009 Estimating the worldwide extent of illegal fish-ing PLoS ONE 4 e4570 (doi101371journalpone0004570)
3 Fulton E A Smith A D M Smith D C ampVan Putten I E 2011 Human behaviour the keysource of uncertainty in fisheries management FishFish 12 2ndash17 (doi101111j1467-2979201000371x)
4 Hilborn R Arcese P Borner M Hando J Hopcraft
G Loibooki M Mduma S amp Sinclair A R E 2006Effective enforcement in a conservation area Science314 1266 (doi101126science1132780)
5 Redpath S amp Thirgood S 2009 Hen harriers and red
grouse moving towards consensus J Appl Ecol 46961ndash963 (doi101111j1365-2664200901702x)
6 Woodroffe R amp Ginsberg J R 1998 Edge effects and theextinction of populations inside protected areas Science280 2126ndash2128 (doi101126science28053722126)
7 Gratwicke B et al 2008 Attitudes toward consumptionand conservation of tigers in China PLoS ONE 3e2544 (doi101371journalpone0002544)
8 Treves A amp Karanth K U 2003 Humanndashcarnivoreconflict and perspectives on carnivore management
worldwide Conserv Biol 17 1491ndash1499 (doi101111j1523-1739200300059x)
9 Chapron G Miquelle D G Lambert A Goodrich JM Legendre S amp Clobert J 2008 The impact on tigersof poaching versus prey depletion J Appl Ecol 45
1667ndash1674 (doi101111j1365-2664200801538x)10 Kenney J S Smith J L Starfield A M amp McDougla
C W 1995 The long-term effects of tiger poaching onpopulation viability Conserv Biol 9 1127ndash1133
(doi101046j1523-173919959051116x-i1)11 Yiming L Zhongwei G Qisen Y Yushan W amp
Niemela J 2003 The implications of poaching for giantpanda conservation Biol Conserv 111 125ndash136(doi101016S0006-3207(02)00255-0)
12 Keane A Jones J P G Edwards-Jones G amp Milner-Gulland E J 2008 The sleeping policeman understand-ing issues of enforcement and compliance inconservation Anim Conserv 11 75ndash82 (doi101111j1469-1795200800170x)
13 Saint John F A V Edwards-Jones G Gibbons J M ampJones J P G 2010 Testing novel methods for assessingrule breaking in conservation Biol Conserv 1431025ndash1030 (doi101016jbiocon201001018)
14 Heisey D M amp Patterson B R 2006 A review ofmethods to estimate cause-specific mortality in presenceof competing risks J Wildl Manag 70 1544ndash1555(doi1021930022-541X(2006)70[1544AROMTE]20CO2)
15 Goodrich J M Kerley L L Smirnov E N Miquelle DG McDonald L Quigley H B Hornocker M G ampMcDonald T 2008 Survival rates and causes of mortalityofAmur tigers on and near the Sikhote-Alin Biosphere Zapo-vednik J Zool 276 323ndash329 (doi101111j1469-7998
200800458x)16 tavecchia G Besbeas P Coulson T Morgan B J T amp
Clutton-Brock T H 2009 Estimating population size andhidden demographic parameters with statendashspacemodeling Am Nat 173 722ndash733 (doi101086598499)
17 McCarthy M 2007 Bayesian methods for ecologyCambridge UK Cambridge University Press
18 Sand H Wikenros C Wabakken P amp Liberg O 2006Effects of hunting group size snow depth and age on thesuccess of wolves hunting moose Anim Behav 72
781ndash789 (doi101016janbehav200511030)19 Clark J 2007 Models for ecological data an introduction
Princeton NJ Princeton University Press20 Plummer M 2003 JAGS a program for analysis of
Bayesian graphical models using Gibbs sampling In
Proc R Soc B (2012)
Proc 3rd Int Workshop on Distributed Statistical Computing(eds K Hornik F Leisch amp A Zeileis) Vienna AustriaSee wwwcituwienacatConferencesDSC-2003Procee
dingsPlummerpdf21 R Development Core Team 2009 R a language and
environment for statistical computing Vienna AustriaR Foundation for Statistical Computing
22 Heidelberger P amp Welch P D 1983 Simulation run
length control in the presence of an initial transientOper Res 31 1109ndash1144 (doi101287opre3161109)
23 Plummer N Best N Cowles K amp Vines K 2006CODA convergence diagnosis and output analysis for
MCMC R News 6 7ndash1124 Garrett E S amp Zeger S L 2000 Latent class model
diagnosis Biometrics 56 1055ndash1067 (doi101111j0006-341X200001055x)
25 Fuller T K Mech D L amp Cochrane J F 2003 Wolf
population dynamics In Wolves behavior ecology andconservation (eds D L Mech amp L Boitaini) pp161ndash191 Chicago IL University of Chicago Press
26 van Deelen T R 2009 Growth characteristics of a reco-vering wolf population in the great lakes Region In
Recovery of gray wolves in the great lakes region of theUnited States (eds A P Wydeven T R Deelen amp EHeske) pp 139ndash154 Berlin Germany Springer
27 Bensch S et al 2006 Selection for heterozygosity giveshope to a wild population of inbred wolves PLoS ONE1 e72 (doi101371journalpone0000072)
28 Liberg O Andren H Pedersen H C Sand HSejberg D Wabakken R Akesson M amp Bensch S2005 Severe inbreeding depression in a wild wolf (Canislupus) population Biol Lett 1 17ndash20 (doi101098rsbl20040266)
29 Frankham R 1995 Inbreeding and extinction athreshold effect Conserv Biol 9 792ndash799 (doi101046j1523-1739199509040792x)
30 Fuller T K 1989 Population dynamics of wolves innorth-central Minnesota Wildl Monogr 105
31 Andren H et al 2006 Survival rates and causes of mor-tality in Eurasian lynx (Lynx lynx) in multi-uselandscapes Biol Conserv 131 23ndash32 (doi101016j
biocon200601025)32 Persson J Ericsson G amp Segerstrom P 2009 Human
caused mortality in the endangered Scandinavian wolver-ine population Biol Conserv 142 325ndash331 (doi101016jbiocon200810028)
33 Smith D W et al 2010 Survival of colonizing wolves inthe northern rocky mountains of the United States1982ndash2004 J Wildl Manag 74 620ndash634 (doi1021932008-584)
34 Newman K B Buckland S T Lindley S T ThomasL amp Fernandez C 2006 Hidden process models foranimal population dynamics Ecol Appl 16 74ndash86(doi10189004-0592)
35 Rutz C amp Hays G C 2009 New frontiers in biologging
science Biol Lett 5 289ndash292 (doi101098rsbl20090089)
36 Sims D W Queiroz N Humphries N E Lima F P ampHays G C 2009 Long-term GPS tracking of oceansunfish Mola mola offers a new direction in fish monitoring
PLoS ONE 4 e7351 (doi101371journalpone0007351)
37 Regan H M Colyvan M amp Burgman M A 2002 Ataxonomy and treatment of uncertainty for ecology andconservation biology Ecol Appl 12 618ndash628 (doi10
18901051-0761(2002)012[0618ATATOU]20CO2)38 Bunnefeld N Hoshino E amp Milner-Gulland E J
In press Management strategy evaluation a powerfultool for conservation Trends Ecol Evol (doi101016jtree201105003)
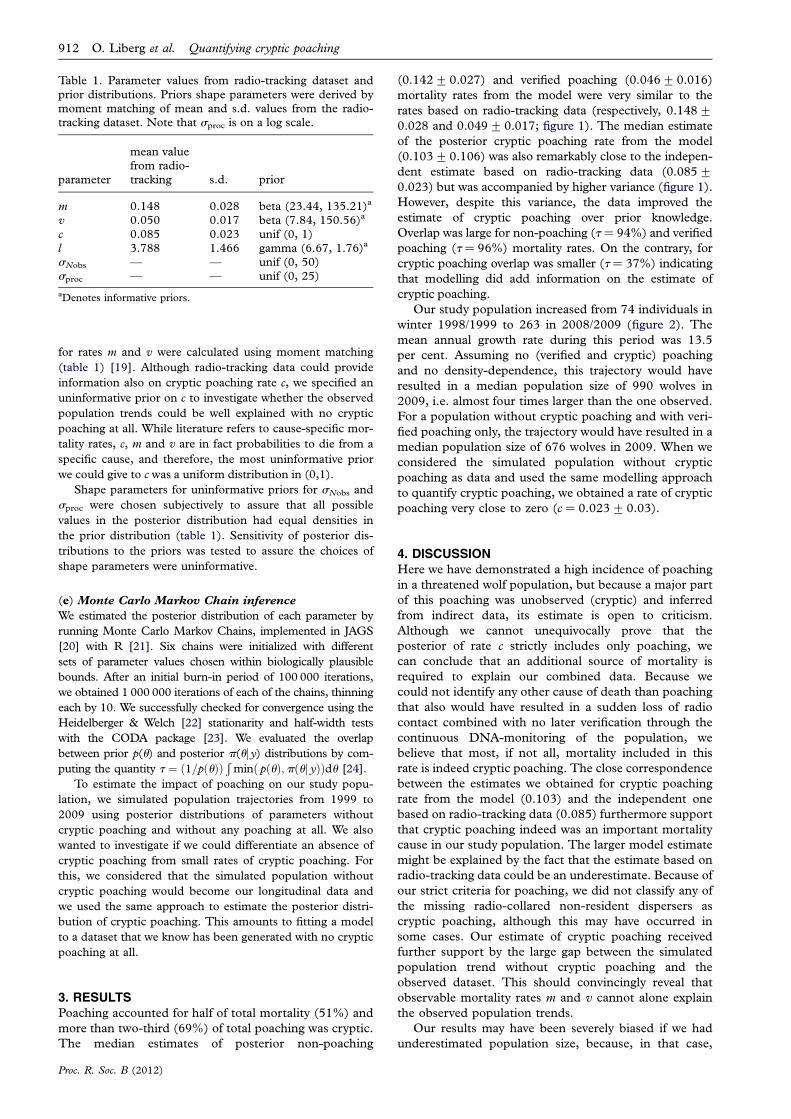
Copyright © 2022 FDOKUMEN