A Study of Digging Productivity of an Electric Rope Shovel for ...
17
minerals Article A Study of Digging Productivity of an Electric Rope Shovel for Different Operators Mohammad Babaei Khorzoughi 1, * and Robert Hall 2 1 Norman B. Keevil Institute of Mining Engineering, University of British Columbia, Vancouver, BC V6T 1Z4, Canada 2 School of Mining and Petroleum Engineering, University of Alberta, Edmonton, AB T6G 2W2, Canada; [email protected] * Correspondance: [email protected]; Tel.: +1-604-368-0667 Academic Editor: Tuncel M. Yegulalp Received: 21 January 2016; Accepted: 13 May 2016; Published: 25 May 2016 Abstract: A performance monitoring study of an electric rope shovel operating in an open pit coal mine was conducted. As the mining industry moves toward higher productivity, profitability and predictability, the need for more reliable, productive and efficient mining shovels increases. Consequently, it is critical to study the productivity of these machines and to understand the effect of different operational parameters on that. In this paper a clustering analysis is performed to classify shovel digging effort and behaviour based on digging energy, dig time and payload per pass. Then the influence of the operator on the digging efficiency and productivity of the machine is analyzed with a focus on operator technique during digging. A statistical analysis is conducted on different cycle time components (dig time, swing time, return time) for different operators. In addition to time components, swing and return angles as well as loading rate and mucking rate are observed and analyzed. The results of this study help to understand the effect of different operators on the digging productivity of the shovel and then to set the best operator practice. Keywords: electric rope shovels; productivity; digging energy; operator; digging time 1. Introduction Loading efficiency has a critical role in the success of the mining process as the loading equipment is the source of ore supply [1] or waste removal. An efficient loading practice can help to increase production and reduce cost. For instance, according to Scott and Mackee [2], one million dollars can be saved in a surface coal mine with a 1% improvement in loading efficiency. Therefore, it is essential to study and monitor the performance of loading equipment. The electric rope shovel is one type of mining equipment primarily used in most large, high volume operations as a loading unit. The performance of electrical rope shovels may vary with the muck-pile characteristics, operator practice and skills, and machine type and conditions. Previous research attempts show that shovel performance is directly influenced by muck-pile characteristics [3,4]. However, in addition to muck-pile characteristics, operator proficiency and skill play a significant role in the productivity of loading equipment [5–12]. This paper investigates the digging efficiency and productivity of a shovel and the effect of different operators on its performance. The shovel is currently operating in an open pit coal mine in Canada and the data has been collected during a week of field trials in the summer of 2015. The machine used in the present study is a P&H4100XPB shovel with a nominal dipper capacity of approximately 90 metric tonnes or approximately 48.4 cubic meters of material volume. The shovel’s main functions during loading haul trucks include digging, swinging and dumping. The digging component is a combination of hoist and crowd actions. These functions are mainly accomplished by two hoist, one Minerals 2016, 6, 48; doi:10.3390/min6020048 www.mdpi.com/journal/minerals
-
Upload
khangminh22 -
Category
Documents
-
view
2 -
download
0
Transcript of A Study of Digging Productivity of an Electric Rope Shovel for ...

minerals
Article
A Study of Digging Productivity of an Electric RopeShovel for Different Operators
Mohammad Babaei Khorzoughi 1,* and Robert Hall 2
1 Norman B. Keevil Institute of Mining Engineering, University of British Columbia, Vancouver,BC V6T 1Z4, Canada
2 School of Mining and Petroleum Engineering, University of Alberta, Edmonton, AB T6G 2W2, Canada;[email protected]
* Correspondance: [email protected]; Tel.: +1-604-368-0667
Academic Editor: Tuncel M. YegulalpReceived: 21 January 2016; Accepted: 13 May 2016; Published: 25 May 2016
Abstract: A performance monitoring study of an electric rope shovel operating in an open pitcoal mine was conducted. As the mining industry moves toward higher productivity, profitabilityand predictability, the need for more reliable, productive and efficient mining shovels increases.Consequently, it is critical to study the productivity of these machines and to understand the effect ofdifferent operational parameters on that. In this paper a clustering analysis is performed to classifyshovel digging effort and behaviour based on digging energy, dig time and payload per pass. Thenthe influence of the operator on the digging efficiency and productivity of the machine is analyzedwith a focus on operator technique during digging. A statistical analysis is conducted on differentcycle time components (dig time, swing time, return time) for different operators. In addition to timecomponents, swing and return angles as well as loading rate and mucking rate are observed andanalyzed. The results of this study help to understand the effect of different operators on the diggingproductivity of the shovel and then to set the best operator practice.
Keywords: electric rope shovels; productivity; digging energy; operator; digging time
1. Introduction
Loading efficiency has a critical role in the success of the mining process as the loading equipmentis the source of ore supply [1] or waste removal. An efficient loading practice can help to increaseproduction and reduce cost. For instance, according to Scott and Mackee [2], one million dollars can besaved in a surface coal mine with a 1% improvement in loading efficiency. Therefore, it is essential tostudy and monitor the performance of loading equipment.
The electric rope shovel is one type of mining equipment primarily used in most large, highvolume operations as a loading unit. The performance of electrical rope shovels may vary with themuck-pile characteristics, operator practice and skills, and machine type and conditions. Previousresearch attempts show that shovel performance is directly influenced by muck-pile characteristics [3,4].However, in addition to muck-pile characteristics, operator proficiency and skill play a significant rolein the productivity of loading equipment [5–12].
This paper investigates the digging efficiency and productivity of a shovel and the effect ofdifferent operators on its performance. The shovel is currently operating in an open pit coal mine inCanada and the data has been collected during a week of field trials in the summer of 2015. The machineused in the present study is a P&H4100XPB shovel with a nominal dipper capacity of approximately90 metric tonnes or approximately 48.4 cubic meters of material volume. The shovel’s main functionsduring loading haul trucks include digging, swinging and dumping. The digging component is acombination of hoist and crowd actions. These functions are mainly accomplished by two hoist, one
Minerals 2016, 6, 48; doi:10.3390/min6020048 www.mdpi.com/journal/minerals
Minerals 2016, 6, 48 2 of 17
crowd and two swing motors on-board the shovel. Additionally, for an electric rope shovel a normaland productive cycle includes: digging, swinging, waiting (usually for the first pass), dumping andreturning back to the face.
It should be noted that the onboard monitoring system on the shovel provides real-time feedbackto the operator. The system was implemented to improve operator productivity and ensure consistentshovel performance. With this system, the operators adjust their digging tactics to current diggingcondition to achieve the highest productivity.
2. Background
Shovel productivity and performance are strongly influenced by operator proficiency. Awell-trained operator is essential to achieve maximum productivity [10]. Especially, with the currentcost pressure on the mining industry, it is important to have high productivity. The influence ofoperator practice and skill should be a significant factor in any productivity assessment. Some researchstudies have reported the effect of operators on shovel performance.
Hendricks [5] monitored the performance of four electric rope shovel operators. He concludedthat operators adjust their digging tactic to compensate for variations in muck-pile digging conditions;however, each operator operates within a particular range of dipper trajectories.
Jesset [6], as part of his research, established a framework that might help to set the best operatorpractice to improve shovel productivity and reduce loading duty. By statistically comparing measureddata for different operators, Jessett [6] concluded that operator’s style affects shovel productivity andduty loading.
In contrast to blasted muckpile digging, Patnayak et al. [8] reported the influence of operatingpractice on the shovel performance in oil sand digging. For the purpose of this study, performanceparameters, recorded from the shovel, were compared for four teams of operators. They believedthat “the operating characteristics of each team of operators will overshadow the influence of materialdiggability at a given shovel location” [8] (p. 133). Comparing average shift hoist and crowd motorpower during different shifts and for different teams, Patnayak et al. [8] concluded that the consumedhoist power depends on the way that a team operates the shovel while the crowd power is independentof an operators’ team digging tactic. They also showed that the hoist energy per unit volume of payloadcan be a measure of the operators’ team performance.
As reported by Hendricks [5] and Patnayak et al. [8], energy consumption and digging effort ofshovels are significantly influenced by operating characteristics. Similarly, other attempts have beenmade in the past to address the effect of operator practice and skill on equipment energy consumptionand its performance. Widzyk-Capehart and Lever [13] similar to Jessett [6] stated that operator stylehas a significant effect on shovel productivity. Similarly, Onederra et al. [7] , based on the result of theircase study, showed that operator proficiency is critical in shovel performance which was indicatedthrough production rate variability. Vukotic [10] established a methodology to evaluate rope shoveloperators and then to minimize energy consumption and maximize production rate. He developed amodel to analyze operator’s performance in different parts of the shovel loading cycle based on theenergy consumption and production rate. Bernold [14] compared operator’s digging performance byanalyzing digging forces through a backhoe simulator. He estimated operator’s performance on thebasis of total energy per digging cycle, total path distance per digging cycle and bucket average velocity.Komljenovic et al. [15] developed a performance indicator for dragline operators. This indicator wasdefined as the ratio of dragline hourly production rate and hourly energy consumption. Awuah-Offeiand Frimpong [16] introduced hoist rope and crowd arm speeds as critical parameters in evaluatingoperator’s performance. In this study, a simulation of a rope shovel was conducted.
Minerals 2016, 6, 48 3 of 17
3. Approach
3.1. Field Studies
In this study data was collected during a one-week period using a commercially available fleetmanagement and health monitoring system on-board the shovel. This monitoring system records datafrom sensors mounted on the shovel and processes them to estimate a comprehensive set of key shovelperformance indicators (KPIs) per cycle. These KPIs include dig time, swing time, return time, swingangle, return angle, payload, and equivalent digging energy. This data is stored in a MySQL databaseand can be queried. In addition to the mentioned system, an embedded computer system, Octagon(Octagon Systems, Westminster, CO, USA) (Figure 1), has been installed in the shovel house to captureon-board shovel signals such as electrical motor responses and joystick reference signals. The Octagoncomputer records the data using an OPC (Open Platform Communications) interface. There is OPCbridge software installed on the two computers on the shovel. The software makes a connection tothese bridges to collect the signals from digital side of the programmable logic controller (PLC). Thesignals pertaining to this paper include the hoist and crowd joysticks references as well as the hoistrope retraction and crowd arm extension. The sampling rate for these signals has been set at 20 Hz.Finally, in parallel to all of these data sets, the entire operation shift has been recorded using a USBcamera mounted in the operator cab. These digital video records help to interpret collected data.
Minerals 2016, 6, 48 3 of 17
3. Approach
3.1. Field Studies
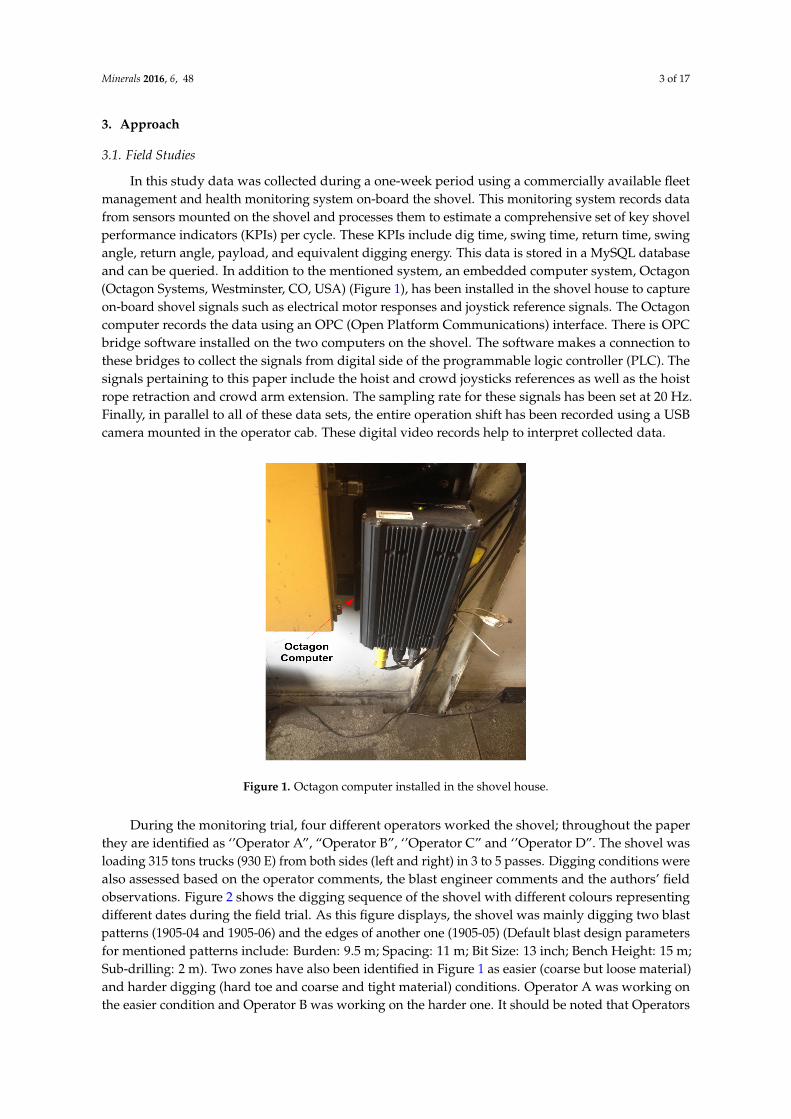
In this study data was collected during a one-week period using a commercially available fleet management and health monitoring system on-board the shovel. This monitoring system records data from sensors mounted on the shovel and processes them to estimate a comprehensive set of key shovel performance indicators (KPIs) per cycle. These KPIs include dig time, swing time, return time, swing angle, return angle, payload, and equivalent digging energy. This data is stored in a MySQL database and can be queried. In addition to the mentioned system, an embedded computer system, Octagon (Octagon Systems, Westminster, CO, US) (Figure 1), has been installed in the shovel house to capture on-board shovel signals such as electrical motor responses and joystick reference signals. The Octagon computer records the data using an OPC (Open Platform Communications) interface. There is OPC bridge software installed on the two computers on the shovel. The software makes a connection to these bridges to collect the signals from digital side of the programmable logic controller (PLC). The signals pertaining to this paper include the hoist and crowd joysticks references as well as the hoist rope retraction and crowd arm extension. The sampling rate for these signals has been set at 20 Hz. Finally, in parallel to all of these data sets, the entire operation shift has been recorded using a USB camera mounted in the operator cab. These digital video records help to interpret collected data.
Figure 1. Octagon computer installed in the shovel house.
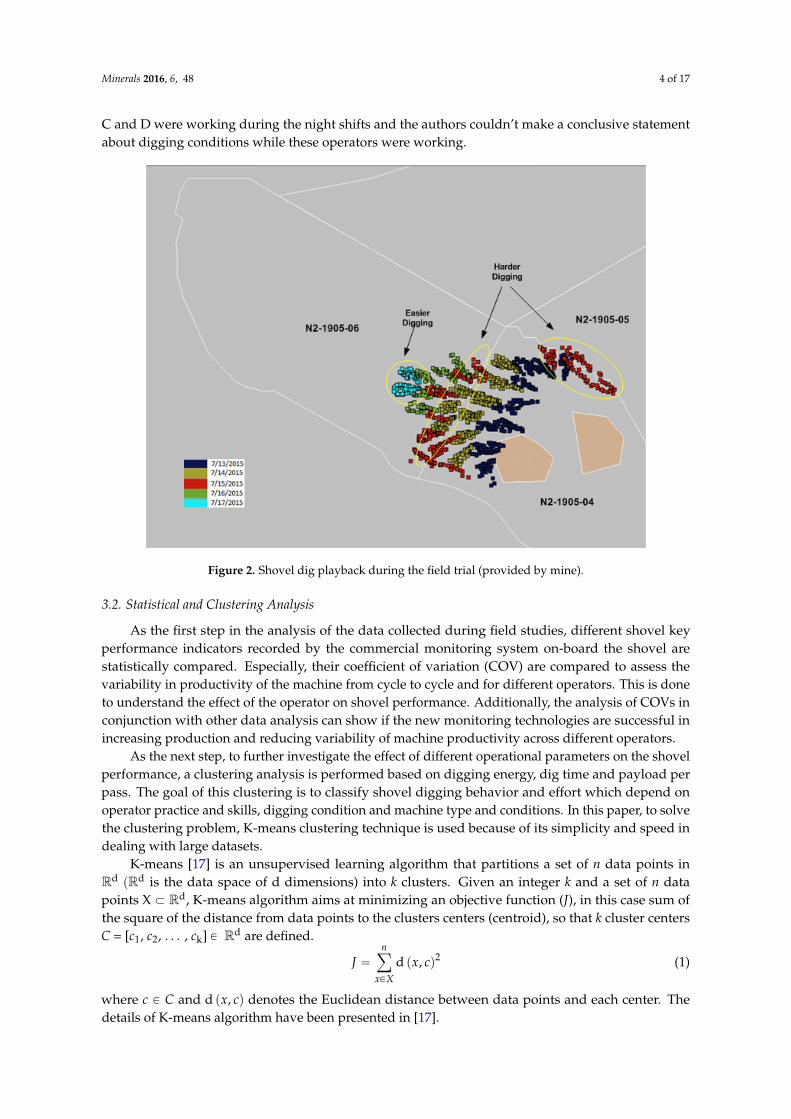
During the monitoring trial, four different operators worked the shovel; throughout the paper they are identified as ‘’Operator A’’, “Operator B’’, ‘’Operator C’’ and ‘’Operator D’’. The shovel was loading 315 tons trucks (930 E) from both sides (left and right) in 3 to 5 passes. Digging conditions were also assessed based on the operator comments, the blast engineer comments and the authors’ field observations. Figure 2 shows the digging sequence of the shovel with different colours representing different dates during the field trial. As this figure displays, the shovel was mainly digging two blast patterns (1905-04 and 1905-06) and the edges of another one (1905-05) (Default blast design parameters for mentioned patterns include: Burden: 9.5 m; Spacing: 11 m; Bit Size: 13 inch; Bench Height: 15 m; Sub-drilling: 2 m). Two zones have also been identified in Figure 1 as easier (coarse but loose material) and harder digging (hard toe and coarse and tight material) conditions. Operator A was working on the easier condition and Operator B was working on the harder one. It should be noted that Operators C and D were working during the night shifts and the
Figure 1. Octagon computer installed in the shovel house.
During the monitoring trial, four different operators worked the shovel; throughout the paperthey are identified as ‘’Operator A”, “Operator B”, ‘’Operator C” and ‘’Operator D”. The shovel wasloading 315 tons trucks (930 E) from both sides (left and right) in 3 to 5 passes. Digging conditions werealso assessed based on the operator comments, the blast engineer comments and the authors’ fieldobservations. Figure 2 shows the digging sequence of the shovel with different colours representingdifferent dates during the field trial. As this figure displays, the shovel was mainly digging two blastpatterns (1905-04 and 1905-06) and the edges of another one (1905-05) (Default blast design parametersfor mentioned patterns include: Burden: 9.5 m; Spacing: 11 m; Bit Size: 13 inch; Bench Height: 15 m;Sub-drilling: 2 m). Two zones have also been identified in Figure 1 as easier (coarse but loose material)and harder digging (hard toe and coarse and tight material) conditions. Operator A was working onthe easier condition and Operator B was working on the harder one. It should be noted that Operators
Minerals 2016, 6, 48 4 of 17
C and D were working during the night shifts and the authors couldn’t make a conclusive statementabout digging conditions while these operators were working.
Minerals 2016, 6, 48 4 of 17
authors couldn’t make a conclusive statement about digging conditions while these operators were working.
Figure 2. Shovel dig playback during the field trial (provided by mine).
3.2. Statistical and Clustering Analysis
As the first step in the analysis of the data collected during field studies, different shovel key performance indicators recorded by the commercial monitoring system on-board the shovel are statistically compared. Especially, their coefficient of variation (COV) are compared to assess the variability in productivity of the machine from cycle to cycle and for different operators. This is done to understand the effect of the operator on shovel performance. Additionally, the analysis of COVs in conjunction with other data analysis can show if the new monitoring technologies are successful in increasing production and reducing variability of machine productivity across different operators.
As the next step, to further investigate the effect of different operational parameters on the shovel performance, a clustering analysis is performed based on digging energy, dig time and payload per pass. The goal of this clustering is to classify shovel digging behavior and effort which depend on operator practice and skills, digging condition and machine type and conditions. In this paper, to solve the clustering problem, K-means clustering technique is used because of its simplicity and speed in dealing with large datasets.
K-means [17] is an unsupervised learning algorithm that partitions a set of n data points in ℝ (ℝ is the data space of d dimensions) into k clusters. Given an integer k and a set of n data points X ⊂ ℝ , K-means algorithm aims at minimizing an objective function (J), in this case sum of the square of the distance from data points to the clusters centers (centroid), so that k cluster centers C = [c1, c2, …, ck] ∈ ℝ are defined.
= d( , )∈ (1)
where ∈ and d( , ) denotes the Euclidean distance between data points and each center. The details of K-means algorithm have been presented in [17].
Figure 2. Shovel dig playback during the field trial (provided by mine).
3.2. Statistical and Clustering Analysis
As the first step in the analysis of the data collected during field studies, different shovel keyperformance indicators recorded by the commercial monitoring system on-board the shovel arestatistically compared. Especially, their coefficient of variation (COV) are compared to assess thevariability in productivity of the machine from cycle to cycle and for different operators. This is doneto understand the effect of the operator on shovel performance. Additionally, the analysis of COVs inconjunction with other data analysis can show if the new monitoring technologies are successful inincreasing production and reducing variability of machine productivity across different operators.
As the next step, to further investigate the effect of different operational parameters on the shovelperformance, a clustering analysis is performed based on digging energy, dig time and payload perpass. The goal of this clustering is to classify shovel digging behavior and effort which depend onoperator practice and skills, digging condition and machine type and conditions. In this paper, to solvethe clustering problem, K-means clustering technique is used because of its simplicity and speed indealing with large datasets.
K-means [17] is an unsupervised learning algorithm that partitions a set of n data points inRd pRd is the data space of d dimensions) into k clusters. Given an integer k and a set of n datapoints X Ă Rd, K-means algorithm aims at minimizing an objective function (J), in this case sum ofthe square of the distance from data points to the clusters centers (centroid), so that k cluster centersC = [c1, c2, . . . , ck] P Rd are defined.
J “n
ÿ
xPX
d px, cq2 (1)
where c P C and d px, cq denotes the Euclidean distance between data points and each center. Thedetails of K-means algorithm have been presented in [17].
Minerals 2016, 6, 48 5 of 17
In this paper, the number of clusters has been set as k “ 4 to allow for the results from thiswork to be integrated into a diggability algorithm that is a subject of ongoing research. Additionally,Euclidian distance, the most common metric used for clustering, has been chosen to assign data pointsto each cluster.
Finally, K-means++ algorithm [18] has been used to initialize cluster centers. According to Arthurand Vassilvitskii [18], this algorithm improves the speed and quality of clustering of K-means.
In this paper to ascertain that the K-means algorithm will result in a solution that is a globalminimum, 10 replicates with different starting points (according to K-means++ algorithm) have beenused. The results of productivity analysis, as well as clustering analysis are presented next.
4. Analysis of Results
4.1. Productivity
A total of 4791 shovel cycles were monitored during the course of the field trial. As discussedin Section 3.1 a commercial monitoring system was used to record different shovel activities such asdigging, swinging and returning. Additionally, the monitoring system detects and records activitiesthat are not associated with loading the truck such as cleaning up the face. In this paper, such activitiesare not included in the analysis. As the current study mainly focuses on the digging part of eachloading cycle, Figure 3 illustrates a histogram and a box plot of dig time values. The histogramindicates that dig times are positively skewed and they range from 2 to 48 s. The box plot also describesthe spread of data and highlights outliers. In this paper an outlier is defined as a value that is morethan 1.5 times the interquartile range away from the top or bottom of the box in the boxplot.
Minerals 2016, 6, 48 5 of 17
In this paper, the number of clusters has been set as = 4 to allow for the results from this work to be integrated into a diggability algorithm that is a subject of ongoing research. Additionally, Euclidian distance, the most common metric used for clustering, has been chosen to assign data points to each cluster.
Finally, K-means++ algorithm [18] has been used to initialize cluster centers. According to Arthur and Vassilvitskii [18], this algorithm improves the speed and quality of clustering of K-means.
In this paper to ascertain that the K-means algorithm will result in a solution that is a global minimum, 10 replicates with different starting points (according to K-means++ algorithm) have been used. The results of productivity analysis, as well as clustering analysis are presented next.
4. Analysis of Results
4.1. Productivity
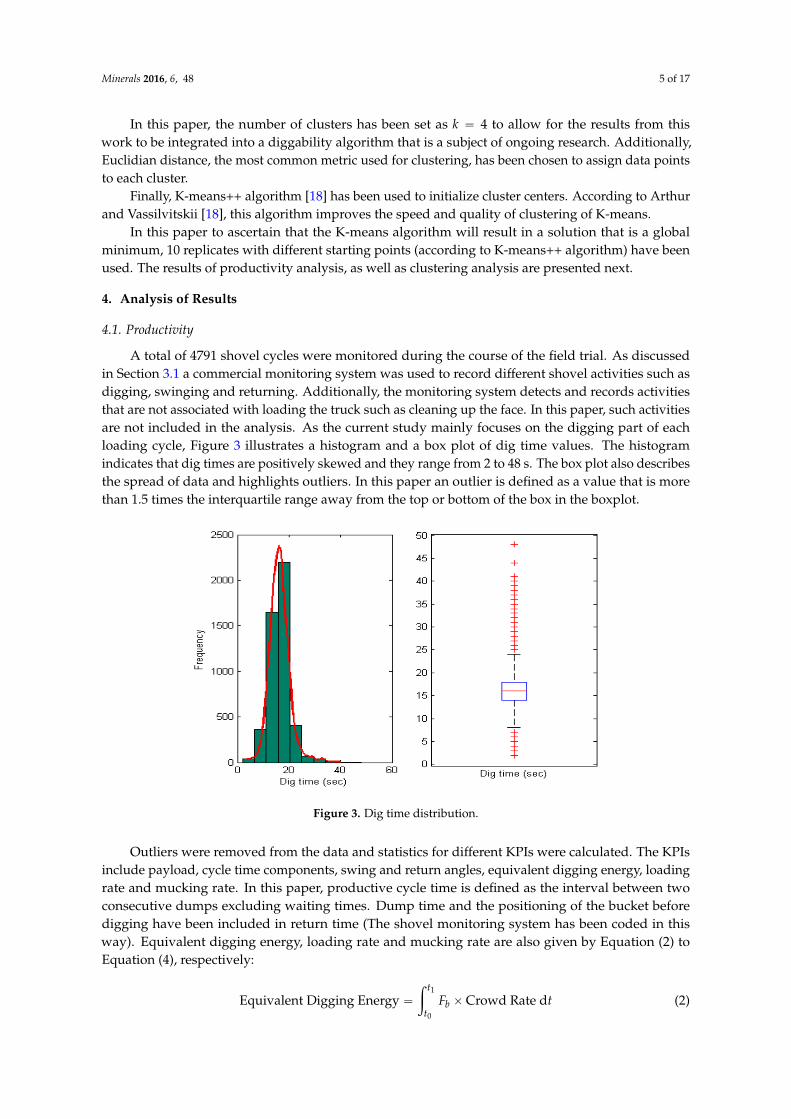
A total of 4791 shovel cycles were monitored during the course of the field trial. As discussed in Section 3.1 a commercial monitoring system was used to record different shovel activities such as digging, swinging and returning. Additionally, the monitoring system detects and records activities that are not associated with loading the truck such as cleaning up the face. In this paper, such activities are not included in the analysis. As the current study mainly focuses on the digging part of each loading cycle, Figure 3 illustrates a histogram and a box plot of dig time values. The histogram indicates that dig times are positively skewed and they range from 2 to 48 s. The box plot also describes the spread of data and highlights outliers. In this paper an outlier is defined as a value that is more than 1.5 times the interquartile range away from the top or bottom of the box in the boxplot.
Figure 3. Dig time distribution.
Outliers were removed from the data and statistics for different KPIs were calculated. The KPIs include payload, cycle time components, swing and return angles, equivalent digging energy, loading rate and mucking rate. In this paper, productive cycle time is defined as the interval between two consecutive dumps excluding waiting times. Dump time and the positioning of the bucket before digging have been included in return time (The shovel monitoring system has been coded in this way). Equivalent digging energy, loading rate and mucking rate are also given by Equation (2) to Equation (4), respectively: EquivalentDigging Energy = × Crowd Rate d (2)
Loading Rate = PayloadDig time (3)
Figure 3. Dig time distribution.
Outliers were removed from the data and statistics for different KPIs were calculated. The KPIsinclude payload, cycle time components, swing and return angles, equivalent digging energy, loadingrate and mucking rate. In this paper, productive cycle time is defined as the interval between twoconsecutive dumps excluding waiting times. Dump time and the positioning of the bucket beforedigging have been included in return time (The shovel monitoring system has been coded in thisway). Equivalent digging energy, loading rate and mucking rate are also given by Equation (2) toEquation (4), respectively:
Equivalent Digging Energy “ż t1
t0
Fb ˆCrowd Rate dt (2)

Minerals 2016, 6, 48 6 of 17
Loading Rate “PayloadDig time
(3)
Mucking Rate “Payload
Productive Cycle Time(4)
where t0 and t1 are the start and the end of digging respectively, Fb is the bail force (bail pull) andcrowd rate is the rate of change of crowd arm angle with respect to horizon. It should be noted that allthese KPIs are being estimated by the commercial monitoring system on-board the shovel using a suitof sensors such as load cells and gyro sensors. As Equation (2) shows the digging energy estimated bythe monitoring system on-board the shovel is an equivalent mechanical energy ptonsˆ radq duringthe digging part of the cycle. The equivalent digging energy is measured at the bail and is a measureof mechanical energy transferred to the bucket teeth. This energy is provided by electrical DC motorson-board the shovel. A summary of the aforementioned KPIs for all of the operators is presentedin Table 1.
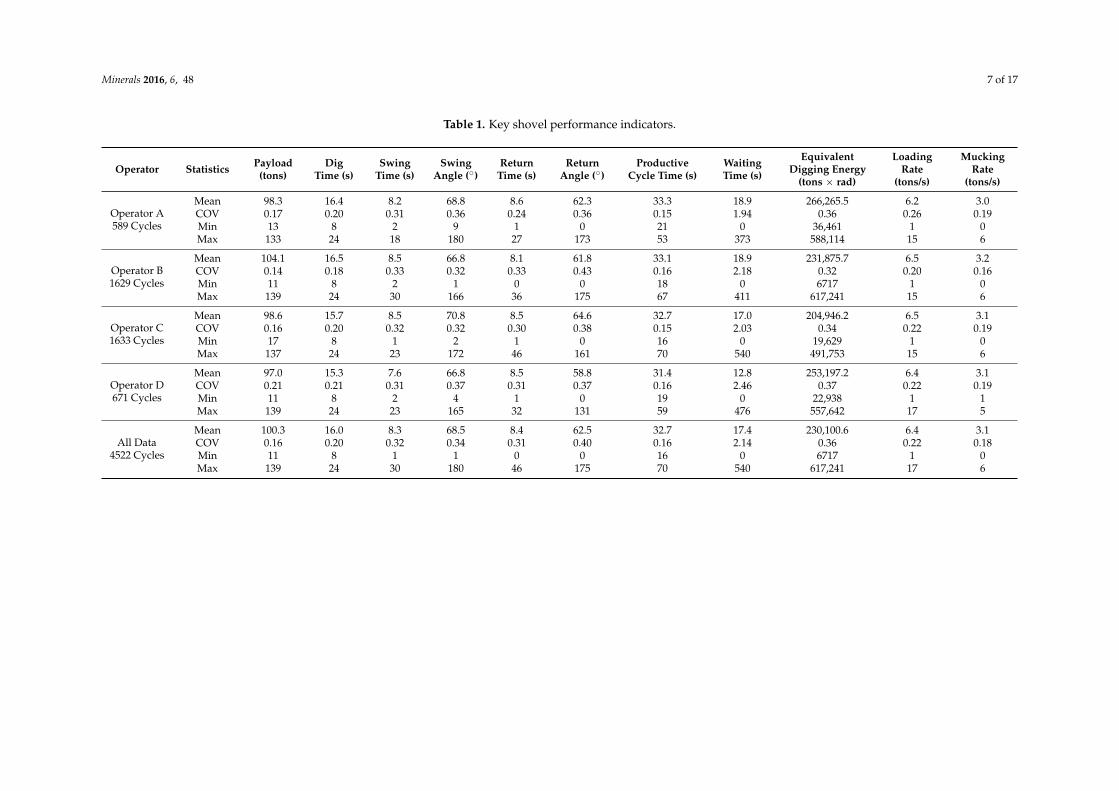
Table 1 shows that the largest component of the cycle is the dig phase which on average accountsfor about 50% of the productive cycle time. Swing time and return time each accounts for 25% of theproductive cycle time which is lower than dig time portion. This could be due to low swing and returnangles (<90˝).
Among the parameters presented in Table 1, waiting time has the highest variation (highest COV)which is independent of machine performance. Furthermore, the largest variations within each cycleoccur in the swing and return phases which are mainly controlled by the operator. Payload also hasthe lowest variation which demonstrates that operators try to adapt their digging technique to currentdigging conditions to achieve the desired payload which is the highest target load per pass withoutexceeding the truck capacity; therefore, it is mainly consistent from cycle to cycle. It should be notedthat current loading practice is not an automated process and machine monitoring systems only helpthe operators to more consistently fill the bucket. The variations in payload can also be a representationof variations in productivity of the machine. Generally, operations are interested in lower variations intheir shovel productivity which should be reflected in a narrow distribution of truck loads.
Table 1 also shows that although different operators have different average equivalent diggingenergy per cycle, they have similar average loading rates as well as mucking rates. Among the fouroperators, Operator A has the lowest digging rate and mucking rate while he has the highest averageequivalent digging energy per cycle. It should be noted that Operator A encountered one of the easierdigging conditions during the field trial. Operator B has the highest loading and mucking rates whilehe was digging one of the harder digging conditions during the field trial. The digging practice of thesetwo operators will be compared in Section 4.3 using recorded signals from PLC to better understandthe effect of different operational parameters on the shovel performance. Operators C and D have notbeen chosen for comparison due to technical issues that caused the PLC signals not to be recordedwhile they operated the shovel.
In order to further investigate the effect of operator on the machine productivity, especiallydigging component, a clustering analysis is performed and operators’ techniques during digging arecompared. The results are presented next.
Minerals 2016, 6, 48 7 of 17
Table 1. Key shovel performance indicators.
Operator Statistics Payload(tons)
DigTime (s)
SwingTime (s)
SwingAngle (˝)
ReturnTime (s)
ReturnAngle (˝)
ProductiveCycle Time (s)
WaitingTime (s)
EquivalentDigging Energy
(tons ˆ rad)
LoadingRate
(tons/s)
MuckingRate
(tons/s)
Operator A589 Cycles
Mean 98.3 16.4 8.2 68.8 8.6 62.3 33.3 18.9 266,265.5 6.2 3.0COV 0.17 0.20 0.31 0.36 0.24 0.36 0.15 1.94 0.36 0.26 0.19Min 13 8 2 9 1 0 21 0 36,461 1 0Max 133 24 18 180 27 173 53 373 588,114 15 6
Operator B1629 Cycles
Mean 104.1 16.5 8.5 66.8 8.1 61.8 33.1 18.9 231,875.7 6.5 3.2COV 0.14 0.18 0.33 0.32 0.33 0.43 0.16 2.18 0.32 0.20 0.16Min 11 8 2 1 0 0 18 0 6717 1 0Max 139 24 30 166 36 175 67 411 617,241 15 6
Operator C1633 Cycles
Mean 98.6 15.7 8.5 70.8 8.5 64.6 32.7 17.0 204,946.2 6.5 3.1COV 0.16 0.20 0.32 0.32 0.30 0.38 0.15 2.03 0.34 0.22 0.19Min 17 8 1 2 1 0 16 0 19,629 1 0Max 137 24 23 172 46 161 70 540 491,753 15 6
Operator D671 Cycles
Mean 97.0 15.3 7.6 66.8 8.5 58.8 31.4 12.8 253,197.2 6.4 3.1COV 0.21 0.21 0.31 0.37 0.31 0.37 0.16 2.46 0.37 0.22 0.19Min 11 8 2 4 1 0 19 0 22,938 1 1Max 139 24 23 165 32 131 59 476 557,642 17 5
All Data4522 Cycles
Mean 100.3 16.0 8.3 68.5 8.4 62.5 32.7 17.4 230,100.6 6.4 3.1COV 0.16 0.20 0.32 0.34 0.31 0.40 0.16 2.14 0.36 0.22 0.18Min 11 8 1 1 0 0 16 0 6717 1 0Max 139 24 30 180 46 175 70 540 617,241 17 6

Minerals 2016, 6, 48 8 of 17
4.2. Clustering of Shovel Cycles
To classify shovel digging behavior and effort, first a 3D space of digging energy, dig time andpayload for total of 4522 cycles is built. These three parameters or a combination of them have beenwidely used as a measure of digging efficiency or shovel performance [4,5,7,8,16]. Then, using theK-means method [17], this space is divided into four clusters. Figure 4 shows different clusters in the3D space.
Minerals 2016, 6, 48 8 of 17
4.2. Clustering of Shovel Cycles
To classify shovel digging behavior and effort, first a 3D space of digging energy, dig time and payload for total of 4522 cycles is built. These three parameters or a combination of them have been widely used as a measure of digging efficiency or shovel performance [4,5,7,8,16]. Then, using the K-means method [17], this space is divided into four clusters. Figure 4 shows different clusters in the 3D space.
Figure 4. Generated clusters using K-means clustering method.
As the results of clustering show (Figure 4), clusters have been generated based on the digging energy which means that digging energy explains the majority of variability in the data. Therefore, a classification for digging energy based on the results of clustering analysis is presented in Table 2. This table illustrates that most cycles are within the range of average to high digging energy. Among all operators, Operator C has the highest percentage of cycles in the low energy class and the lowest percentage of cycles in the extremely high energy class while Operator A has the lowest percentage of cycles in the low energy class and the highest percentage of cycles in the extremely high energy class.
Table 2. Digging energy classification.
Digging Energy Class
Energy Range (× ) ( × ) Percentage of
Cycles (All Data)
Percentage of Cycles
(Operator A)
Percentage of Cycles
(Operartor B)
Percentage of Cycles
(Operator C)
Percentage of Cycles
(Operator D) Low Energy <1.57 18 14.2 14.4 24 15.2
Average Energy
1.57–2.36 37 22.6 39.1 44 25.4
High Energy 2.36–3.23 33 34.2 36.2 27 37.5 Extremely
High Energy >3.23 12 29 10.3 5 21.9
In order to further investigate the relationship between digging energy, payload and dig time, Figures 5 and 6 compare dig time and payload for the different classes of digging energy from Table 2.
Figure 4. Generated clusters using K-means clustering method.
As the results of clustering show (Figure 4), clusters have been generated based on the diggingenergy which means that digging energy explains the majority of variability in the data. Therefore,a classification for digging energy based on the results of clustering analysis is presented in Table 2.This table illustrates that most cycles are within the range of average to high digging energy. Amongall operators, Operator C has the highest percentage of cycles in the low energy class and the lowestpercentage of cycles in the extremely high energy class while Operator A has the lowest percentage ofcycles in the low energy class and the highest percentage of cycles in the extremely high energy class.
Table 2. Digging energy classification.
DiggingEnergy Class
Energy Range(ˆ105)
ptonsˆ radq
Percentage ofCycles (All Data)
Percentage ofCycles
(Operator A)
Percentage ofCycles
(Operartor B)
Percentage ofCycles
(Operator C)
Percentage ofCycles
(Operator D)
Low Energy <1.57 18 14.2 14.4 24 15.2AverageEnergy 1.57–2.36 37 22.6 39.1 44 25.4
High Energy 2.36–3.23 33 34.2 36.2 27 37.5Extremely
High Energy >3.23 12 29 10.3 5 21.9
In order to further investigate the relationship between digging energy, payload and dig time,Figures 5 and 6 compare dig time and payload for the different classes of digging energy from Table 2.
Minerals 2016, 6, 48 9 of 17Minerals 2016, 6, 48 9 of 17
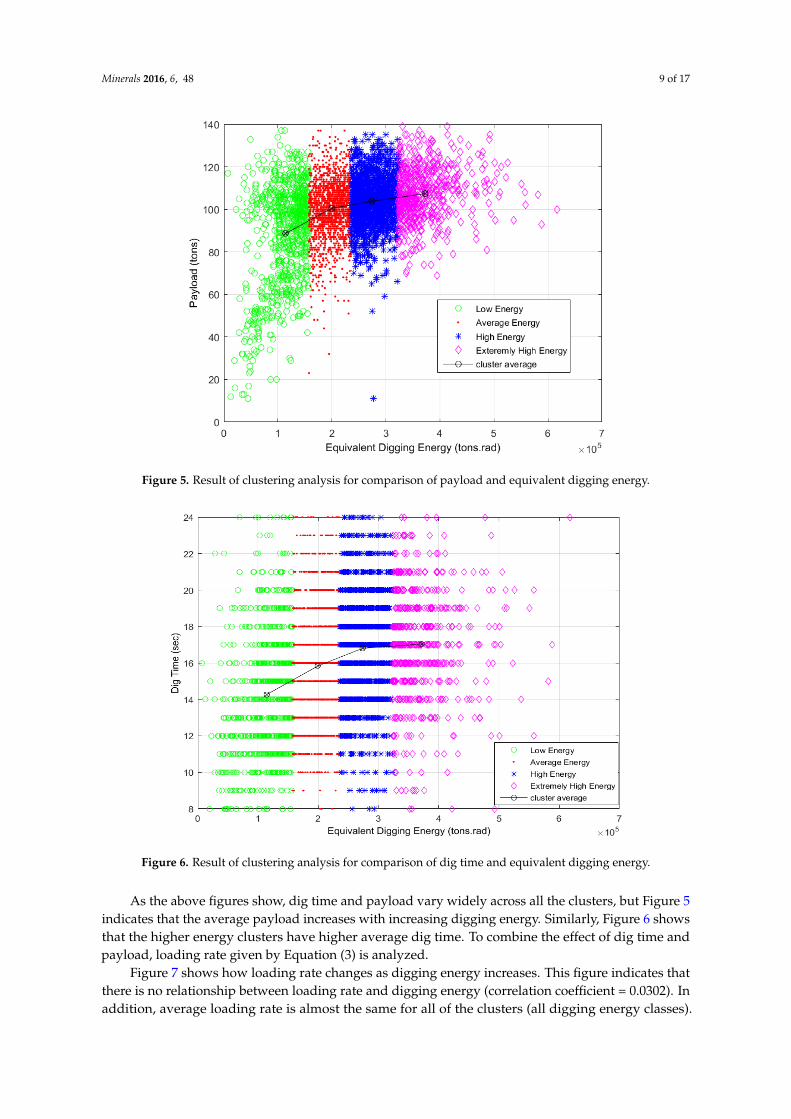
Figure 5. Result of clustering analysis for comparison of payload and equivalent digging energy.
Figure 6. Result of clustering analysis for comparison of dig time and equivalent digging energy.
As the above figures show, dig time and payload vary widely across all the clusters, but Figure 5 indicates that the average payload increases with increasing digging energy. Similarly, Figure 6 shows that the higher energy clusters have higher average dig time. To combine the effect of dig time and payload, loading rate given by Equation (3) is analyzed.
Figure 7 shows how loading rate changes as digging energy increases. This figure indicates that there is no relationship between loading rate and digging energy (correlation coefficient = 0.0302). In addition, average loading rate is almost the same for all of the clusters (all digging energy classes). Therefore, one would conclude that variations in digging energy are caused by variations in muck-pile digging conditions or operators. However, even for one operator working in the same location (nearly same digging condition), digging energy will vary from cycle to cycle while average loading rate is almost constant. This can be explained by the effect of operator digging practice and
Figure 5. Result of clustering analysis for comparison of payload and equivalent digging energy.
Minerals 2016, 6, 48 9 of 17
Figure 5. Result of clustering analysis for comparison of payload and equivalent digging energy.
Figure 6. Result of clustering analysis for comparison of dig time and equivalent digging energy.
As the above figures show, dig time and payload vary widely across all the clusters, but Figure 5 indicates that the average payload increases with increasing digging energy. Similarly, Figure 6 shows that the higher energy clusters have higher average dig time. To combine the effect of dig time and payload, loading rate given by Equation (3) is analyzed.
Figure 7 shows how loading rate changes as digging energy increases. This figure indicates that there is no relationship between loading rate and digging energy (correlation coefficient = 0.0302). In addition, average loading rate is almost the same for all of the clusters (all digging energy classes). Therefore, one would conclude that variations in digging energy are caused by variations in muck-pile digging conditions or operators. However, even for one operator working in the same location (nearly same digging condition), digging energy will vary from cycle to cycle while average loading rate is almost constant. This can be explained by the effect of operator digging practice and
Figure 6. Result of clustering analysis for comparison of dig time and equivalent digging energy.
As the above figures show, dig time and payload vary widely across all the clusters, but Figure 5indicates that the average payload increases with increasing digging energy. Similarly, Figure 6 showsthat the higher energy clusters have higher average dig time. To combine the effect of dig time andpayload, loading rate given by Equation (3) is analyzed.
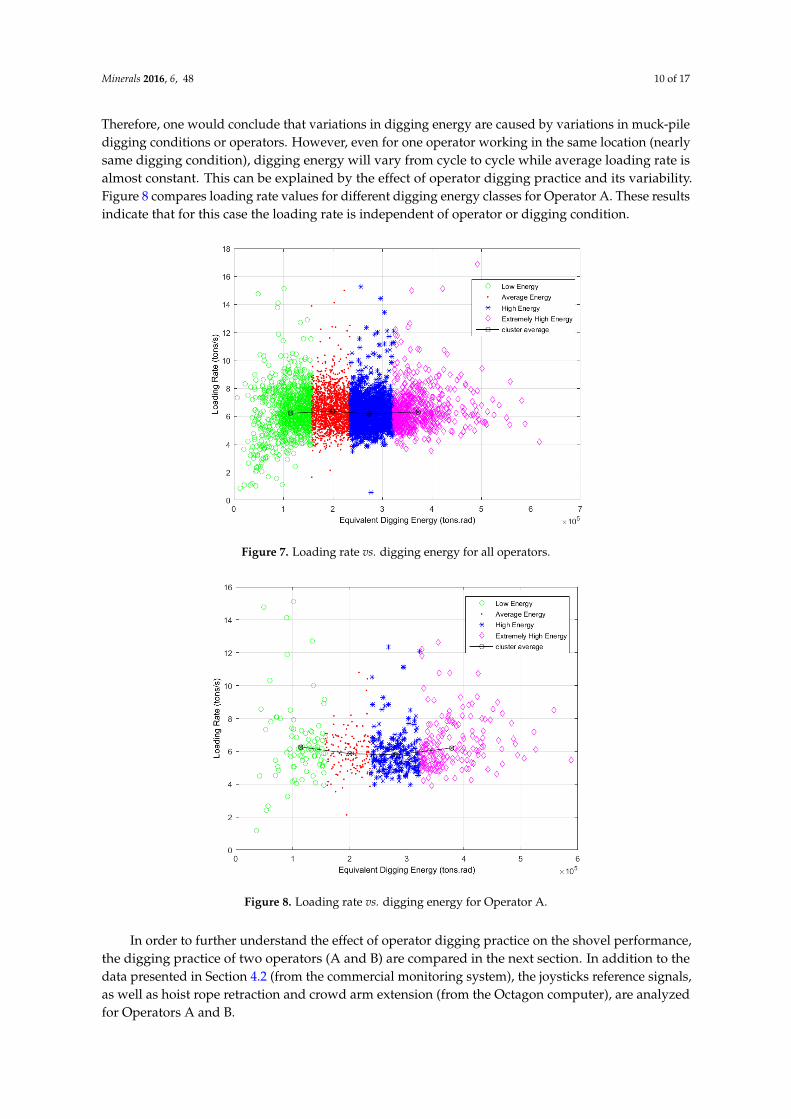
Figure 7 shows how loading rate changes as digging energy increases. This figure indicates thatthere is no relationship between loading rate and digging energy (correlation coefficient = 0.0302). Inaddition, average loading rate is almost the same for all of the clusters (all digging energy classes).
Minerals 2016, 6, 48 10 of 17
Therefore, one would conclude that variations in digging energy are caused by variations in muck-piledigging conditions or operators. However, even for one operator working in the same location (nearlysame digging condition), digging energy will vary from cycle to cycle while average loading rate isalmost constant. This can be explained by the effect of operator digging practice and its variability.Figure 8 compares loading rate values for different digging energy classes for Operator A. These resultsindicate that for this case the loading rate is independent of operator or digging condition.
Minerals 2016, 6, 48 10 of 17
its variability. Figure 8 compares loading rate values for different digging energy classes for Operator A. These results indicate that for this case the loading rate is independent of operator or digging condition.
Figure 7. Loading rate vs. digging energy for all operators.
Figure 8. Loading rate vs. digging energy for Operator A.
In order to further understand the effect of operator digging practice on the shovel performance, the digging practice of two operators (A and B) are compared in the next section. In addition to the data presented in Section 4.2 (from the commercial monitoring system), the joysticks reference signals, as well as hoist rope retraction and crowd arm extension (from the Octagon computer), are analyzed for Operators A and B.
4.3. Operator Digging Practice
As mentioned in Section 1, digging is mainly a combination of hoist and crowd actions. There are two joysticks in the operator’s cab that allow operators to control the machine. To study the effect of operator practice on digging efficiency, an evaluation of their hoist and crowd practices based on joystick signals is done. Figure 9 shows the hoist joystick reference signal for Operators A and B
Figure 7. Loading rate vs. digging energy for all operators.
Minerals 2016, 6, 48 10 of 17
its variability. Figure 8 compares loading rate values for different digging energy classes for Operator A. These results indicate that for this case the loading rate is independent of operator or digging condition.
Figure 7. Loading rate vs. digging energy for all operators.
Figure 8. Loading rate vs. digging energy for Operator A.
In order to further understand the effect of operator digging practice on the shovel performance, the digging practice of two operators (A and B) are compared in the next section. In addition to the data presented in Section 4.2 (from the commercial monitoring system), the joysticks reference signals, as well as hoist rope retraction and crowd arm extension (from the Octagon computer), are analyzed for Operators A and B.
4.3. Operator Digging Practice
As mentioned in Section 1, digging is mainly a combination of hoist and crowd actions. There are two joysticks in the operator’s cab that allow operators to control the machine. To study the effect of operator practice on digging efficiency, an evaluation of their hoist and crowd practices based on joystick signals is done. Figure 9 shows the hoist joystick reference signal for Operators A and B
Figure 8. Loading rate vs. digging energy for Operator A.
In order to further understand the effect of operator digging practice on the shovel performance,the digging practice of two operators (A and B) are compared in the next section. In addition to thedata presented in Section 4.2 (from the commercial monitoring system), the joysticks reference signals,as well as hoist rope retraction and crowd arm extension (from the Octagon computer), are analyzedfor Operators A and B.

Minerals 2016, 6, 48 11 of 17
4.3. Operator Digging Practice
As mentioned in Section 1, digging is mainly a combination of hoist and crowd actions. Thereare two joysticks in the operator’s cab that allow operators to control the machine. To study the effectof operator practice on digging efficiency, an evaluation of their hoist and crowd practices based onjoystick signals is done. Figure 9 shows the hoist joystick reference signal for Operators A and B duringa period of 250 s (5 cycles). The signals for Operators A and B have been annotated to show the start ofdigging (red circles), the end of digging (blue circles) and the end of the cycle (green circles). Similarly,Figure 10 shows the crowd joystick reference signals for Operators A and B for the same period of time.
Minerals 2016, 6, 48 11 of 17
during a period of 250 s (5 cycles). The signals for Operators A and B have been annotated to show the start of digging (red circles), the end of digging (blue circles) and the end of the cycle (green circles). Similarly, Figure 10 shows the crowd joystick reference signals for Operators A and B for the same period of time.
Figure 9. Hoist joystick reference.
Figure 10. Crowd joystick reference.
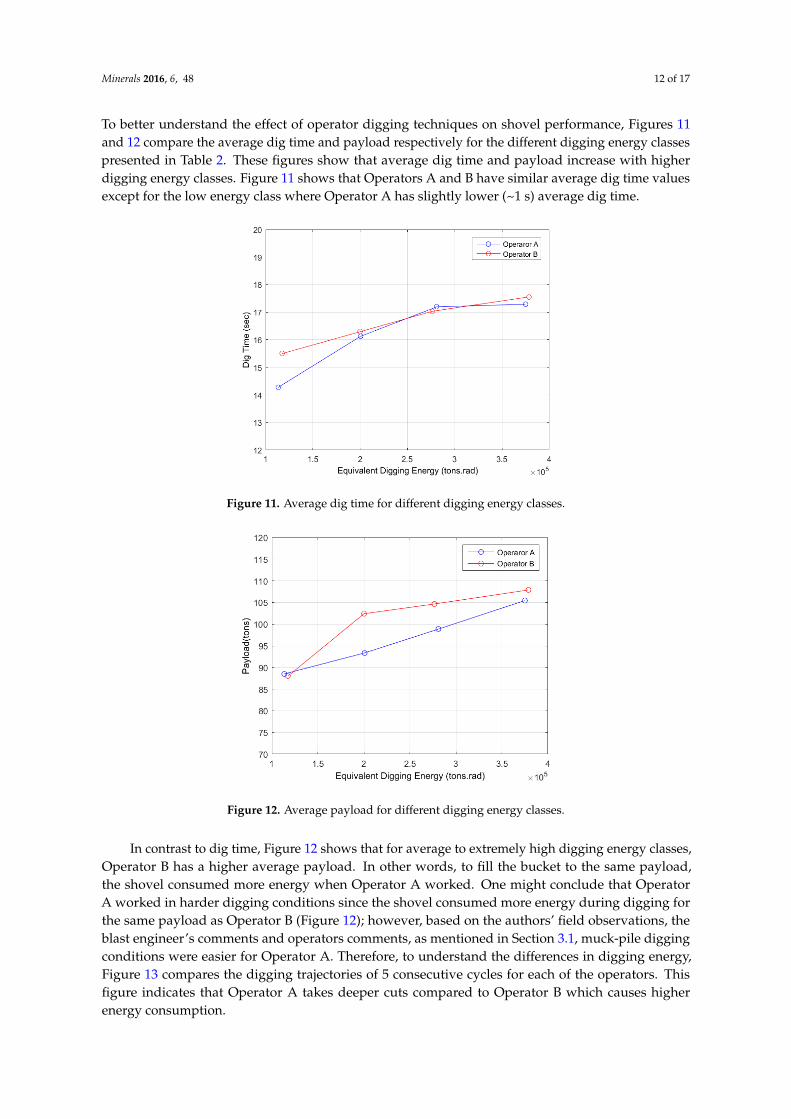
The above figures show that each operator has a unique style in filling the dipper. Operator B has a smoother hoist action during digging while he frequently pulls the crowd joystick towards himself (retraction) which is shown as valleys in the crowd joystick reference signal. Although, the above signals exhibit some similar trends, it is clear that each operator has different digging habits/techniques. To better understand the effect of operator digging techniques on shovel performance, Figures 11 and 12 compare the average dig time and payload respectively for the different digging energy classes presented in Table 2. These figures show that average dig time and payload increase with higher digging energy classes. Figure 11 shows that Operators A and B have similar average dig time values except for the low energy class where Operator A has slightly lower (~1 s) average dig time.
Figure 9. Hoist joystick reference.
Minerals 2016, 6, 48 11 of 17
during a period of 250 s (5 cycles). The signals for Operators A and B have been annotated to show the start of digging (red circles), the end of digging (blue circles) and the end of the cycle (green circles). Similarly, Figure 10 shows the crowd joystick reference signals for Operators A and B for the same period of time.
Figure 9. Hoist joystick reference.
Figure 10. Crowd joystick reference.
The above figures show that each operator has a unique style in filling the dipper. Operator B has a smoother hoist action during digging while he frequently pulls the crowd joystick towards himself (retraction) which is shown as valleys in the crowd joystick reference signal. Although, the above signals exhibit some similar trends, it is clear that each operator has different digging habits/techniques. To better understand the effect of operator digging techniques on shovel performance, Figures 11 and 12 compare the average dig time and payload respectively for the different digging energy classes presented in Table 2. These figures show that average dig time and payload increase with higher digging energy classes. Figure 11 shows that Operators A and B have similar average dig time values except for the low energy class where Operator A has slightly lower (~1 s) average dig time.
Figure 10. Crowd joystick reference.
The above figures show that each operator has a unique style in filling the dipper. Operator B hasa smoother hoist action during digging while he frequently pulls the crowd joystick towards himself(retraction) which is shown as valleys in the crowd joystick reference signal. Although, the abovesignals exhibit some similar trends, it is clear that each operator has different digging habits/techniques.
Minerals 2016, 6, 48 12 of 17
To better understand the effect of operator digging techniques on shovel performance, Figures 11and 12 compare the average dig time and payload respectively for the different digging energy classespresented in Table 2. These figures show that average dig time and payload increase with higherdigging energy classes. Figure 11 shows that Operators A and B have similar average dig time valuesexcept for the low energy class where Operator A has slightly lower (~1 s) average dig time.Minerals 2016, 6, 48 12 of 17
Figure 11. Average dig time for different digging energy classes.
Figure 12. Average payload for different digging energy classes.
In contrast to dig time, Figure 12 shows that for average to extremely high digging energy classes, Operator B has a higher average payload. In other words, to fill the bucket to the same payload, the shovel consumed more energy when Operator A worked. One might conclude that Operator A worked in harder digging conditions since the shovel consumed more energy during digging for the same payload as Operator B (Figures 12); however, based on the authors’ field observations, the blast engineer’s comments and operators comments, as mentioned in Section 3.1, muck-pile digging conditions were easier for Operator A. Therefore, to understand the differences in digging energy, Figure 13 compares the digging trajectories of 5 consecutive cycles for each of the operators. This figure indicates that Operator A takes deeper cuts compared to Operator B which causes higher energy consumption.
According to past studies [16,19] the best operator digging practice is achieved by lower crowd extension speed and higher hoist rope retraction speed, which result in a decrease in the depth of cut. Such a practice should result in lower digging energy consumption per unit of loading rate known as specific digging energy. However, a limit of using specific digging energy as a measure of shovel performance is the inability to determine causes for its variations. In Section 4.1 it was shown that there is no relationship between digging energy and loading rate; therefore, based on the definition of specific digging energy, digging energy is not normalized for the effect of loading rate. Additionally, digging energy can be affected by other factors, such as muck-pile digging conditions and machine type and conditions.
Figure 11. Average dig time for different digging energy classes.
Minerals 2016, 6, 48 12 of 17
Figure 11. Average dig time for different digging energy classes.
Figure 12. Average payload for different digging energy classes.
In contrast to dig time, Figure 12 shows that for average to extremely high digging energy classes, Operator B has a higher average payload. In other words, to fill the bucket to the same payload, the shovel consumed more energy when Operator A worked. One might conclude that Operator A worked in harder digging conditions since the shovel consumed more energy during digging for the same payload as Operator B (Figures 12); however, based on the authors’ field observations, the blast engineer’s comments and operators comments, as mentioned in Section 3.1, muck-pile digging conditions were easier for Operator A. Therefore, to understand the differences in digging energy, Figure 13 compares the digging trajectories of 5 consecutive cycles for each of the operators. This figure indicates that Operator A takes deeper cuts compared to Operator B which causes higher energy consumption.
According to past studies [16,19] the best operator digging practice is achieved by lower crowd extension speed and higher hoist rope retraction speed, which result in a decrease in the depth of cut. Such a practice should result in lower digging energy consumption per unit of loading rate known as specific digging energy. However, a limit of using specific digging energy as a measure of shovel performance is the inability to determine causes for its variations. In Section 4.1 it was shown that there is no relationship between digging energy and loading rate; therefore, based on the definition of specific digging energy, digging energy is not normalized for the effect of loading rate. Additionally, digging energy can be affected by other factors, such as muck-pile digging conditions and machine type and conditions.
Figure 12. Average payload for different digging energy classes.
In contrast to dig time, Figure 12 shows that for average to extremely high digging energy classes,Operator B has a higher average payload. In other words, to fill the bucket to the same payload,the shovel consumed more energy when Operator A worked. One might conclude that OperatorA worked in harder digging conditions since the shovel consumed more energy during digging forthe same payload as Operator B (Figure 12); however, based on the authors’ field observations, theblast engineer’s comments and operators comments, as mentioned in Section 3.1, muck-pile diggingconditions were easier for Operator A. Therefore, to understand the differences in digging energy,Figure 13 compares the digging trajectories of 5 consecutive cycles for each of the operators. Thisfigure indicates that Operator A takes deeper cuts compared to Operator B which causes higherenergy consumption.

Minerals 2016, 6, 48 13 of 17
Minerals 2016, 6, 48 13 of 17
Figure 13. Digging trajectory for Operators A and B
To demonstrate how operators control the machine during digging, Figure 14 shows the crowd arm extension and hoist rope retraction during digging for 5 consecutive cycles for Operators A and B. In this figure, the slope of hoist rope retraction represents hoist speed and the slope of crowd arm extension represents crowd speed.
Figure 14. Hoist rope retraction and crowd arm extension for Operators A and B.
Figure 14 shows that the slope of the hoist rope retraction is almost constant for each cycle and a straight line can be fitted on the data for each cycle to estimate the hoist speed. Comparing the two operators, Operator A has a lower hoist speed. The hoist speeds and associated R-squared values for cycles in Figure 14 are presented in Table 3. In contrast to the hoist rope retraction, Figure 14 shows that the crowd arm extension exhibits two different trends:
1. Constant crowd speed until the desired dipper depth of penetration is achieved (the first part of the digging);
2. Once the dipper penetrates into the bank, digging is mainly accomplished by hoist action, and the crowd speed is approximately zero.
Figure 13. Digging trajectory for Operators A and B
According to past studies [16,19] the best operator digging practice is achieved by lower crowdextension speed and higher hoist rope retraction speed, which result in a decrease in the depth of cut.Such a practice should result in lower digging energy consumption per unit of loading rate knownas specific digging energy. However, a limit of using specific digging energy as a measure of shovelperformance is the inability to determine causes for its variations. In Section 4.1 it was shown thatthere is no relationship between digging energy and loading rate; therefore, based on the definition ofspecific digging energy, digging energy is not normalized for the effect of loading rate. Additionally,digging energy can be affected by other factors, such as muck-pile digging conditions and machinetype and conditions.
To demonstrate how operators control the machine during digging, Figure 14 shows the crowdarm extension and hoist rope retraction during digging for 5 consecutive cycles for Operators A andB. In this figure, the slope of hoist rope retraction represents hoist speed and the slope of crowd armextension represents crowd speed.
Minerals 2016, 6, 48 13 of 17
Figure 13. Digging trajectory for Operators A and B
To demonstrate how operators control the machine during digging, Figure 14 shows the crowd arm extension and hoist rope retraction during digging for 5 consecutive cycles for Operators A and B. In this figure, the slope of hoist rope retraction represents hoist speed and the slope of crowd arm extension represents crowd speed.
Figure 14. Hoist rope retraction and crowd arm extension for Operators A and B.
Figure 14 shows that the slope of the hoist rope retraction is almost constant for each cycle and a straight line can be fitted on the data for each cycle to estimate the hoist speed. Comparing the two operators, Operator A has a lower hoist speed. The hoist speeds and associated R-squared values for cycles in Figure 14 are presented in Table 3. In contrast to the hoist rope retraction, Figure 14 shows that the crowd arm extension exhibits two different trends:
1. Constant crowd speed until the desired dipper depth of penetration is achieved (the first part of the digging);
2. Once the dipper penetrates into the bank, digging is mainly accomplished by hoist action, and the crowd speed is approximately zero.
Figure 14. Hoist rope retraction and crowd arm extension for Operators A and B.
Minerals 2016, 6, 48 14 of 17
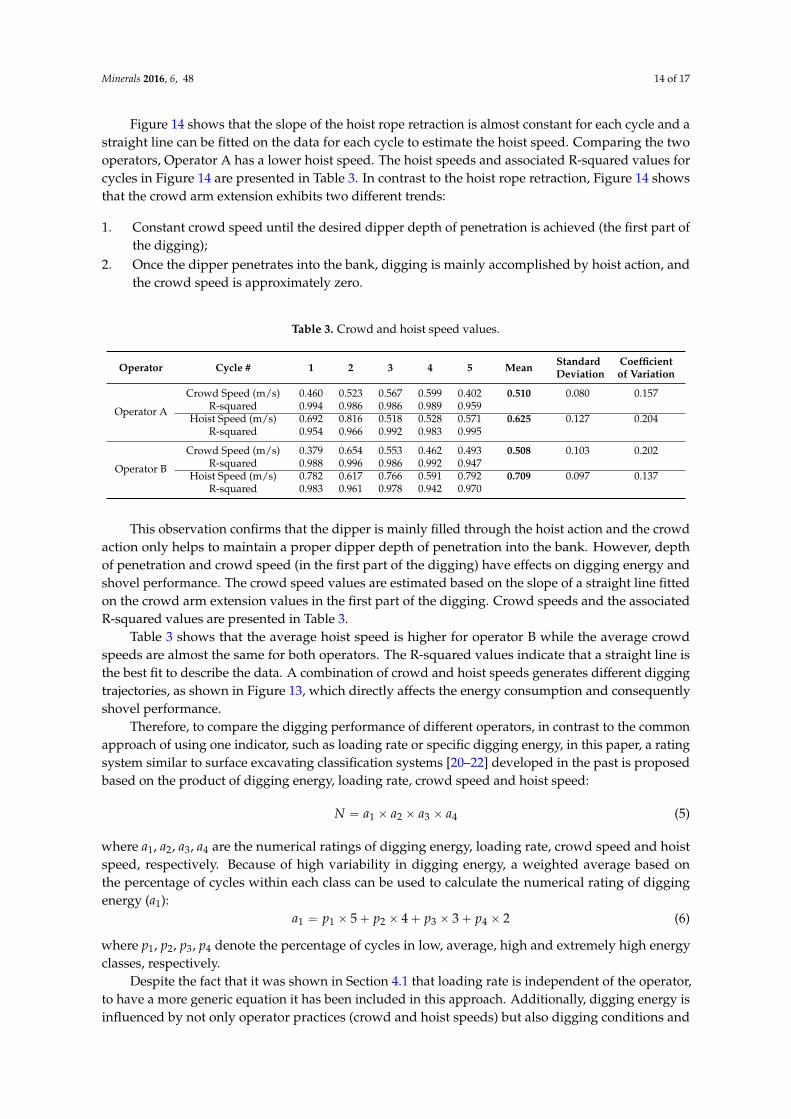
Figure 14 shows that the slope of the hoist rope retraction is almost constant for each cycle and astraight line can be fitted on the data for each cycle to estimate the hoist speed. Comparing the twooperators, Operator A has a lower hoist speed. The hoist speeds and associated R-squared values forcycles in Figure 14 are presented in Table 3. In contrast to the hoist rope retraction, Figure 14 showsthat the crowd arm extension exhibits two different trends:
1. Constant crowd speed until the desired dipper depth of penetration is achieved (the first part ofthe digging);
2. Once the dipper penetrates into the bank, digging is mainly accomplished by hoist action, andthe crowd speed is approximately zero.
Table 3. Crowd and hoist speed values.
Operator Cycle # 1 2 3 4 5 Mean StandardDeviation
Coefficientof Variation
Operator A
Crowd Speed (m/s) 0.460 0.523 0.567 0.599 0.402 0.510 0.080 0.157R-squared 0.994 0.986 0.986 0.989 0.959
Hoist Speed (m/s) 0.692 0.816 0.518 0.528 0.571 0.625 0.127 0.204R-squared 0.954 0.966 0.992 0.983 0.995
Operator B
Crowd Speed (m/s) 0.379 0.654 0.553 0.462 0.493 0.508 0.103 0.202R-squared 0.988 0.996 0.986 0.992 0.947
Hoist Speed (m/s) 0.782 0.617 0.766 0.591 0.792 0.709 0.097 0.137R-squared 0.983 0.961 0.978 0.942 0.970
This observation confirms that the dipper is mainly filled through the hoist action and the crowdaction only helps to maintain a proper dipper depth of penetration into the bank. However, depthof penetration and crowd speed (in the first part of the digging) have effects on digging energy andshovel performance. The crowd speed values are estimated based on the slope of a straight line fittedon the crowd arm extension values in the first part of the digging. Crowd speeds and the associatedR-squared values are presented in Table 3.
Table 3 shows that the average hoist speed is higher for operator B while the average crowdspeeds are almost the same for both operators. The R-squared values indicate that a straight line isthe best fit to describe the data. A combination of crowd and hoist speeds generates different diggingtrajectories, as shown in Figure 13, which directly affects the energy consumption and consequentlyshovel performance.
Therefore, to compare the digging performance of different operators, in contrast to the commonapproach of using one indicator, such as loading rate or specific digging energy, in this paper, a ratingsystem similar to surface excavating classification systems [20–22] developed in the past is proposedbased on the product of digging energy, loading rate, crowd speed and hoist speed:
N “ a1 ˆ a2 ˆ a3 ˆ a4 (5)
where a1, a2, a3, a4 are the numerical ratings of digging energy, loading rate, crowd speed and hoistspeed, respectively. Because of high variability in digging energy, a weighted average based onthe percentage of cycles within each class can be used to calculate the numerical rating of diggingenergy (a1):
a1 “ p1 ˆ 5` p2 ˆ 4` p3 ˆ 3` p4 ˆ 2 (6)
where p1, p2, p3, p4 denote the percentage of cycles in low, average, high and extremely high energyclasses, respectively.
Despite the fact that it was shown in Section 4.1 that loading rate is independent of the operator,to have a more generic equation it has been included in this approach. Additionally, digging energy isinfluenced by not only operator practices (crowd and hoist speeds) but also digging conditions and
Minerals 2016, 6, 48 15 of 17
machine type and conditions. Therefore, to ensure that other factors such as digging conditions don’tmislead the assessment, it is essential to include crowd and hoist speeds in addition to digging energy.It should be noted that the proposed formulation has operational purposes and is an experimentallyderived approach that can be employed by different operations to assess digging performance ofelectric rope shovels operators.
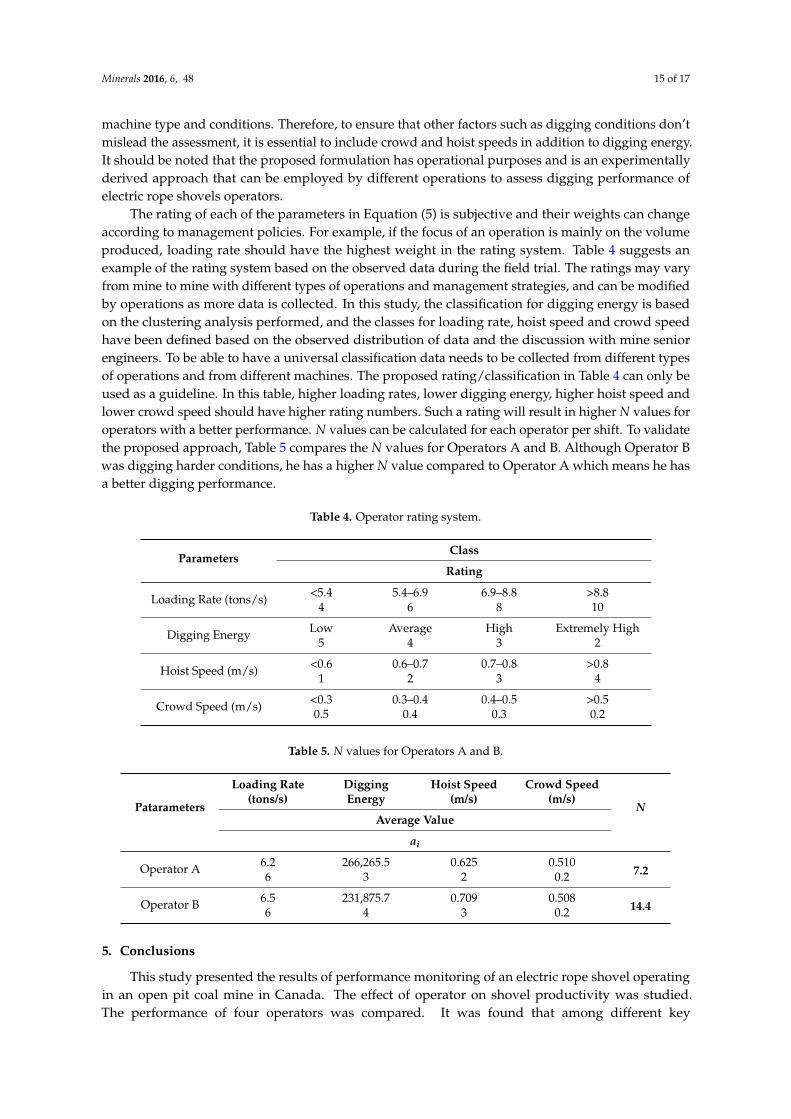
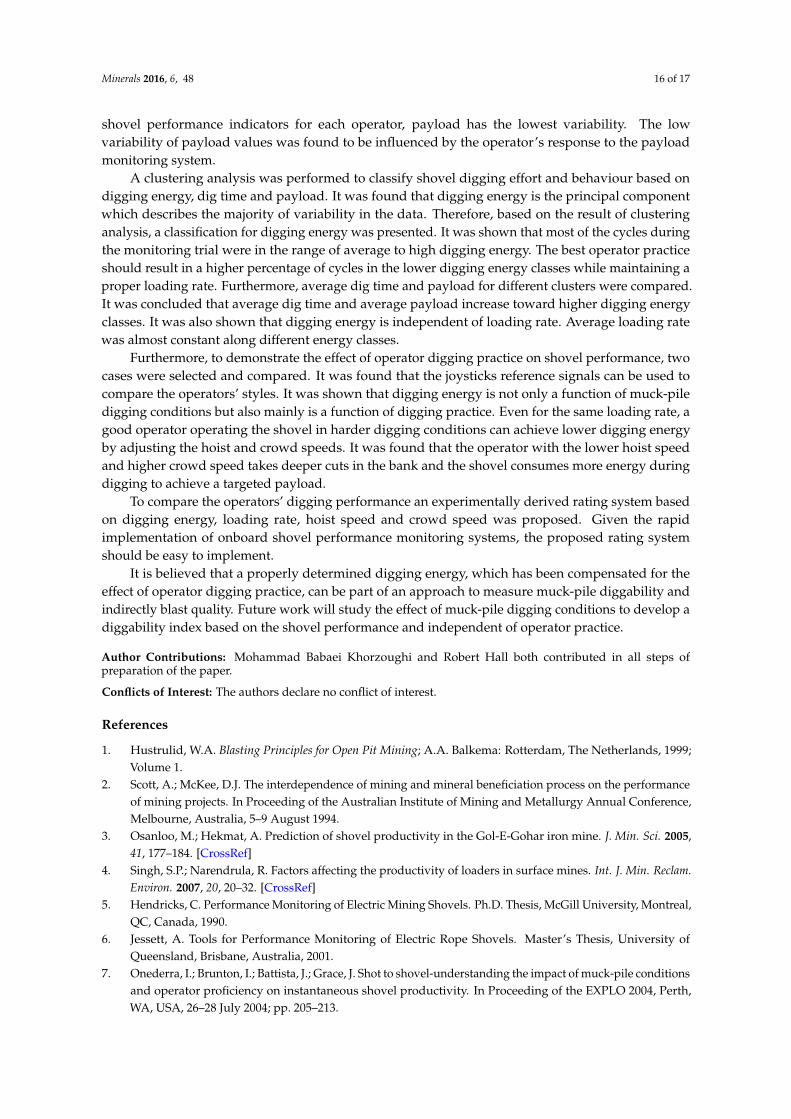
The rating of each of the parameters in Equation (5) is subjective and their weights can changeaccording to management policies. For example, if the focus of an operation is mainly on the volumeproduced, loading rate should have the highest weight in the rating system. Table 4 suggests anexample of the rating system based on the observed data during the field trial. The ratings may varyfrom mine to mine with different types of operations and management strategies, and can be modifiedby operations as more data is collected. In this study, the classification for digging energy is basedon the clustering analysis performed, and the classes for loading rate, hoist speed and crowd speedhave been defined based on the observed distribution of data and the discussion with mine seniorengineers. To be able to have a universal classification data needs to be collected from different typesof operations and from different machines. The proposed rating/classification in Table 4 can only beused as a guideline. In this table, higher loading rates, lower digging energy, higher hoist speed andlower crowd speed should have higher rating numbers. Such a rating will result in higher N values foroperators with a better performance. N values can be calculated for each operator per shift. To validatethe proposed approach, Table 5 compares the N values for Operators A and B. Although Operator Bwas digging harder conditions, he has a higher N value compared to Operator A which means he hasa better digging performance.
Table 4. Operator rating system.
ParametersClass
Rating
Loading Rate (tons/s) <5.4 5.4–6.9 6.9–8.8 >8.84 6 8 10
Digging Energy Low Average High Extremely High5 4 3 2
Hoist Speed (m/s) <0.6 0.6–0.7 0.7–0.8 >0.81 2 3 4
Crowd Speed (m/s) <0.3 0.3–0.4 0.4–0.5 >0.50.5 0.4 0.3 0.2
Table 5. N values for Operators A and B.
Patarameters
Loading Rate(tons/s)
DiggingEnergy
Hoist Speed(m/s)
Crowd Speed(m/s)
NAverage Value
ai
Operator A 6.2 266,265.5 0.625 0.5107.26 3 2 0.2
Operator B 6.5 231,875.7 0.709 0.50814.46 4 3 0.2
5. Conclusions
This study presented the results of performance monitoring of an electric rope shovel operatingin an open pit coal mine in Canada. The effect of operator on shovel productivity was studied.The performance of four operators was compared. It was found that among different key
Minerals 2016, 6, 48 16 of 17
shovel performance indicators for each operator, payload has the lowest variability. The lowvariability of payload values was found to be influenced by the operator’s response to the payloadmonitoring system.
A clustering analysis was performed to classify shovel digging effort and behaviour based ondigging energy, dig time and payload. It was found that digging energy is the principal componentwhich describes the majority of variability in the data. Therefore, based on the result of clusteringanalysis, a classification for digging energy was presented. It was shown that most of the cycles duringthe monitoring trial were in the range of average to high digging energy. The best operator practiceshould result in a higher percentage of cycles in the lower digging energy classes while maintaining aproper loading rate. Furthermore, average dig time and payload for different clusters were compared.It was concluded that average dig time and average payload increase toward higher digging energyclasses. It was also shown that digging energy is independent of loading rate. Average loading ratewas almost constant along different energy classes.
Furthermore, to demonstrate the effect of operator digging practice on shovel performance, twocases were selected and compared. It was found that the joysticks reference signals can be used tocompare the operators’ styles. It was shown that digging energy is not only a function of muck-piledigging conditions but also mainly is a function of digging practice. Even for the same loading rate, agood operator operating the shovel in harder digging conditions can achieve lower digging energyby adjusting the hoist and crowd speeds. It was found that the operator with the lower hoist speedand higher crowd speed takes deeper cuts in the bank and the shovel consumes more energy duringdigging to achieve a targeted payload.
To compare the operators’ digging performance an experimentally derived rating system basedon digging energy, loading rate, hoist speed and crowd speed was proposed. Given the rapidimplementation of onboard shovel performance monitoring systems, the proposed rating systemshould be easy to implement.
It is believed that a properly determined digging energy, which has been compensated for theeffect of operator digging practice, can be part of an approach to measure muck-pile diggability andindirectly blast quality. Future work will study the effect of muck-pile digging conditions to develop adiggability index based on the shovel performance and independent of operator practice.
Author Contributions: Mohammad Babaei Khorzoughi and Robert Hall both contributed in all steps ofpreparation of the paper.
Conflicts of Interest: The authors declare no conflict of interest.
References
1. Hustrulid, W.A. Blasting Principles for Open Pit Mining; A.A. Balkema: Rotterdam, The Netherlands, 1999;Volume 1.
2. Scott, A.; McKee, D.J. The interdependence of mining and mineral beneficiation process on the performanceof mining projects. In Proceeding of the Australian Institute of Mining and Metallurgy Annual Conference,Melbourne, Australia, 5–9 August 1994.
3. Osanloo, M.; Hekmat, A. Prediction of shovel productivity in the Gol-E-Gohar iron mine. J. Min. Sci. 2005,41, 177–184. [CrossRef]
4. Singh, S.P.; Narendrula, R. Factors affecting the productivity of loaders in surface mines. Int. J. Min. Reclam.Environ. 2007, 20, 20–32. [CrossRef]
5. Hendricks, C. Performance Monitoring of Electric Mining Shovels. Ph.D. Thesis, McGill University, Montreal,QC, Canada, 1990.
6. Jessett, A. Tools for Performance Monitoring of Electric Rope Shovels. Master’s Thesis, University ofQueensland, Brisbane, Australia, 2001.
7. Onederra, I.; Brunton, I.; Battista, J.; Grace, J. Shot to shovel-understanding the impact of muck-pile conditionsand operator proficiency on instantaneous shovel productivity. In Proceeding of the EXPLO 2004, Perth,WA, USA, 26–28 July 2004; pp. 205–213.

Minerals 2016, 6, 48 17 of 17
8. Patnayak, S.; Tannant, D.D.; Parsons, I.; Del Valle, V.; Wong, J. Operator and dipper tooth influence on electricshovel performance during oil sands mining. Int. J. Min. Reclam. Environ. 2008, 22, 120–145. [CrossRef]
9. Awuah-Offei, K.; Summers, D. Reducing Energy Consumption and Carbon Footprint through Improved ProductionPractices; Technical Report; Missouri University of Science and Technology: Rolla, MO, USA, 2010.
10. Vukotic, I.M. Evaluation of Rope Shovel Operators in Surface Coal Mining Using a Multi-AttributeDecision-Making Model. Master’s Thesis, West Virginia University, Morgantown, WV, USA, 2013.
11. Oskouei, M.A.; Awuah-Offei, K. Statistical methods for evaluating the effect of operators on energy efficiencyof mining machines. Min. Technol. 2014, 123, 175–182. [CrossRef]
12. Oskouei, M.A.; Awuah-Offei, K. A method for data-driven evaluation of operator impact on energy efficiencyof digging machines. Energy Effic. 2015, 123, 175–182. [CrossRef]
13. Widzyk-Capehard, E.; Lever, P. Towards rope shovel automation operation information system. InProceeding of the CRC Mining Conference, Queensland, Australia, 15–16 June 2004.
14. Bernold, L. Quantitative assessment of backhoe operator skill. J. Constr. Eng. Manag. 2007, 133, 889–899.[CrossRef]
15. Komljenovic, D.; Bogunovic, D.; Kecojevic, V. Dragline operator performance indicator. Int. J. Min. Reclam.Environ. 2010, 24, 34–43. [CrossRef]
16. Awuah-Offei, K.; Frimpong, S. Cable shovel digging optimization for energy efficiency. Mech. Mach. Theory2007, 42, 995–1006. [CrossRef]
17. Lloyd, S. Least squares quantization in PCM. IEEE Trans. Inform. Theory 1982, 28, 129–137. [CrossRef]18. Arthur, D.; Vassilvitskii, S. K-means: The advantages of careful seeding. In Proceedings of the
Eighteenth Annual ACM-SIAM Symposium on Discrete Algorithms, Philadelphia, PA, USA, 7 January 2007;pp. 1027–1035.
19. Awuah-Offeik, K.; Frimpong, S. Geometric simulation of material weight resistance in cable shovel loading.In Proceedings of the 15th IASTED Conference, Marina Del Rey, CA, USA, 1–3 March 2004; pp. 141–146.
20. Kirsten, H.A.D. A classification system for excavation in natural materials. Civ. Eng. S. Afr. 1982, 24, 293–308.21. Scoble, M.J.; Muftuoglu, Y.V. Derivation of a diggability index for surface mine equipment selection.
Min. Sci. Technol. 1984, 1, 305–322. [CrossRef]22. Hadjigeorgiou, J.; Poulin, R. Assessment of ease of excavation of surface mines. J. Terramechanics 1998, 35,
137–153. [CrossRef]
© 2016 by the authors; licensee MDPI, Basel, Switzerland. This article is an open accessarticle distributed under the terms and conditions of the Creative Commons Attribution(CC-BY) license (http://creativecommons.org/licenses/by/4.0/).