Satellite tracking of wild dogs in south-eastern mainland Australian forests: Implications for...
10
This article appeared in a journal published by Elsevier. The attached copy is furnished to the author for internal non-commercial research and education use, including for instruction at the authors institution and sharing with colleagues. Other uses, including reproduction and distribution, or selling or licensing copies, or posting to personal, institutional or third party websites are prohibited. In most cases authors are permitted to post their version of the article (e.g. in Word or Tex form) to their personal website or institutional repository. Authors requiring further information regarding Elsevier’s archiving and manuscript policies are encouraged to visit: http://www.elsevier.com/copyright
Transcript of Satellite tracking of wild dogs in south-eastern mainland Australian forests: Implications for...

This article appeared in a journal published by Elsevier. The attachedcopy is furnished to the author for internal non-commercial researchand education use, including for instruction at the authors institution
and sharing with colleagues.
Other uses, including reproduction and distribution, or selling orlicensing copies, or posting to personal, institutional or third party
websites are prohibited.
In most cases authors are permitted to post their version of thearticle (e.g. in Word or Tex form) to their personal website orinstitutional repository. Authors requiring further information
regarding Elsevier’s archiving and manuscript policies areencouraged to visit:
http://www.elsevier.com/copyright
Author's personal copy
Satellite tracking of wild dogs in south-eastern mainland Australian forests:Implications for management of a problematic top-order carnivore
Andrew W. Claridge a,b,*, Douglas J. Mills a, Rob Hunt c, David J. Jenkins d, Josh Bean e
a Department of Environment and Climate Change, Parks and Wildlife Group, Planning and Performance Unit, Southern Branch,
P.O. Box 733, Queanbeyan, New South Wales 2620, Australiab School of Physical, Environmental and Mathematical Sciences, University of New South Wales, Australian Defence Force Academy,
Northcott Drive, Canberra, Australian Capital Territory 2600, Australiac Department of Environment and Climate Change, Parks and Wildlife Group, Pest Management Unit, P.O. Box 733, Queanbeyan, New South Wales 2620, Australiad School of Animal and Veterinary Sciences, Charles Sturt University, Locked Bag 588, Wagga Wagga, New South Wales 2678, Australiae Department of Environment and Climate Change, Parks and Wildlife Group, South West Slopes Region, P.O. Box 472, Tumut, New South Wales 2720, Australia
1. Introduction
1.1. The dingo in Australia
The dingo (Canis lupus dingo) is viewed by some as a keystonetop-order predator in mainland Australian landscapes (Glen et al.,2007). There is compelling evidence that dingoes help regulate thedistribution and abundance of herbivores, leading to differentgrazing regimes and associated vegetation changes (Newsome
et al., 1983; Robertshaw and Harden, 1986; Newsome, 1990; Popleet al., 2000). In addition, reviews by Glen and Dickman (2005) andJohnson et al., 2007 speculate that the dingo may also assertpredatory and competitive dominance over the introduced red foxand feral cat, tempering their negative environmental effects (seealso Newsome et al., 1997, 2001; Mitchell and Banks, 2005).Despite the dingo being potentially functionally important,conservation management of the species is controversial on atleast three counts. Firstly, dingoes prey on domestic stock inagricultural areas, necessitating control efforts (Fleming and Korn,1989). Secondly, having arrived in Australia around 5000 years ago(Savolainen et al., 2004), it may well have competed with andcontributed toward the mainland extinction of native marsupialpredators including the Thylacine (Thylacinus cynocephalus) andTasmanian Devil (Sarcophilus harrisii) (Johnson and Wroe, 2003;Johnson, 2006). Thirdly, since European human settlement of
Forest Ecology and Management 258 (2009) 814–822
A R T I C L E I N F O
Article history:
Received 2 March 2009
Received in revised form 22 May 2009
Accepted 26 May 2009
Keywords:
Australia
Carnivore
Dingo
Home range
Management
Mesopredator
Satellite tracking
A B S T R A C T
Satellite tracking was used to follow the movements of a problematic top-order carnivore, the wild dog
(Canis lupus dingo, C. lupus familiaris and their hybrids), in contiguous forested landscapes in south-
eastern mainland Australia. Home range sizes of wild dogs were much larger than previously determined
using conventional telemetry methods, averaging 10,000 ha with a maximum size of 59,000 ha over
approximate 3-month periods. Wild dogs at sites with high abundance of kangaroos, wallabies and
rabbits had smaller areas of occupancy than did dogs at sites with low availability of these preys. Despite
mostly large home ranges, tracked animals were loyal to publicly-owned tenure and there were few
instances where individuals moved large distances on to adjacent private tenure. Instead, movement
behaviours of most tracked animals were characterised by repeated short distance forays, often at acute
angles from previous locations. Consequently, home ranges were stable and otherwise well defined.
Analysis of DNA from our study animals indicated that most individuals were of ‘dingo’ ancestry, but
otherwise considered hybrids because of the presence of domestic dog genes. Only two of 24 animals
could be considered as ‘pure’ dingo. Contemporary wild dog management demarcates lands where
control is or is not undertaken, with the latter notionally acting to ‘conserve’ dingoes. Due to the large
scale of movement of animals, existing control efforts likely impact over a greater area than previously
suspected. Furthermore, our genetic findings suggest that conservation of dingoes in south-eastern
mainland Australia is difficult to achieve. A modified approach to wild dog management is needed,
taking account of the extent of range of individual animals and the existing genetic characteristics of
populations.
� 2009 Elsevier B.V. All rights reserved.
* Corresponding author at: Department of Environment and Climate Change,
Parks and Wildlife Group, Planning and Performance Unit, Southern Branch, P.O.
Box 733, Queanbeyan, New South Wales 2620, Australia. Tel.: +61 2 6229 7041;
fax: +61 2 6229 7001.
E-mail address: [email protected] (A.W. Claridge).
Contents lists available at ScienceDirect
Forest Ecology and Management
journa l homepage: www.e lsevier .com/ locate / foreco
0378-1127/$ – see front matter � 2009 Elsevier B.V. All rights reserved.
doi:10.1016/j.foreco.2009.05.030

Author's personal copy
Australia the genetics of dingoes have been compromised throughhybridisation with domestic dogs (Canis l. familaris) gone wild,leaving a gene pool of mixed purity (Savolainen et al., 2004). Thedegree to which hybrids behave like dingoes, including socialbiology, predatory and reproductive behaviour, remains unclear(Corbett, 1995; Glen et al., 2007). However, some authors advocatethat dingoes and their hybrids may be functionally similar (Danielsand Corbett, 2003; Claridge and Hunt, 2008).
1.2. Management of wild dogs in Australia
Regardless of whether they are purebred dingoes or hybrids,‘wild dogs’ as they are collectively termed (Fleming and Korn,1989), are estimated to cost the Australian livestock (sheep, goatand cattle) industries around $66 million AUD per annum inproduction losses and associated control, and additional unquan-tified social costs to affected agricultural communities (McLeod,2004; Fleming et al., 2006). Wild dogs also are the definitive hostfor cystic hydatids (Echinococcus granulosus) in humans, domesticlivestock and native herbivores (Jenkins, 2005, 2006). In mostAustralian State and Territory land management agencies, a policybalance is struck between legislative requirements to control wilddogs to the extent necessary to minimise agricultural impacts andthe desire to maintain the dingo as a top-order predator in thelandscape (i.e. Department of Environment and Climate Change,2005). On the latter count, this has seen the dingo listed mostrecently as a threatened species in the State of Victoria(Department of Sustainability and Environment, 2008).
Making decisions about how best to manage wild dogs in bothtime and space, balancing control with conservation, relies in parton understanding movement patterns of these animals: includingextent of home range. In eastern mainland Australia there havebeen few studies of the spatial biology of wild dogs, all usingconventional VHF telemetry methods (Catling, 1978; Harden,1985; McIlroy et al., 1986). The consensus of these studies was thatwild dogs range over 1000–3000 ha, around a third to half the sizeof home ranges of wild dogs in arid landscapes in the interior of thecontinent (Thomson, 1992; Thomson et al., 1992). From a controlstandpoint it has been suggested that perimeter buffers inpublicly-owned land adjacent to agricultural areas should beone or two home range sizes wide, in the order of 5–10 km, to allowfor effective management (Harden, 1985; McIlroy et al., 1986).
The use of satellite transmitting and GPS systems have recentlyallowed further insight into the movement behaviour of top-ordercarnivores, shedding tremendous light (Wong et al., 2004;McCarthy et al., 2005; Bandeira de Melo et al., 2007). The primaryobjective of our study was to use satellite-tracking technology tobetter describe the home range requirements of wild dogs in avariety of publicly-owned forested landscapes in south-easternmainland Australia. We asked four questions: (i) how large an areado wild dogs range over? (ii) Is this consistent with data obtainedfrom previous studies? (iii) What kind of movement behaviours dowild dogs display in time and space? (iv) Do wild dogs in largertracts (>30,000 ha) of publicly-owned land interact with adjacentprivately-owned agricultural landscapes? The practical intent wasto use the information from our tracking to link back into wild dogmanagement efforts, particularly in relation to scale of buffer zonesfor control versus home range size. Here, we report on the findingsof our research in relation to the above questions.
2. Materials and methods
2.1. Study areas
Wild dogs were live-captured and tracked in: Alpine NationalPark in Victoria; Coopracambra National Park in Victoria; northern
and southern Kosciuszko National Park in New South Wales;Morton National Park in New South Wales, and; Namadgi NationalPark in the Australian Capital Territory (see Fig. 1). Areas chosenwere those not directly subject to wild dog control. This wasconsidered important for establishing home range estimates ofanimals free of perturbation. Such areas represent an increasinglysmaller part of the overall part of the landscape where wild dogsoccur and might be considered important for dingo conservation.
Alpine National Park and northern and southern KosciuszkoPark share similar climate, geology, vegetation and fire history.Mostly over 1000 m in elevation, they are characterised by ruggedlandforms, including rock cliffs and escarpments, high plains andthe corridor of the Murray River. The major geology is granitic andsedimentary rock sometimes metamorphosed by volcanic intru-sions. Average annual rainfall varies with elevation, as does snowdepth and cover: at the highest elevations (>1500 m) winters havepersistent snow cover. Vegetation across this diverse landscape isvariable. Extensive snow gum woodlands (E. pauciflora) occur athigher elevations. Alpine wet heathlands occur along streams andwhere drainage is impeded. Alpine ash (E. delegatensis) forestsoccur below snow gum woodlands, mostly at elevations between1000 m and 1400 m. In northern Kosciuszko, the Long Plain areadiffers in having large areas of limestone geomorphology,including Yarrangobilly Caves, with the plain itself characterisedby open grassland of mostly native pasture. Much of the higherelevation parts of the study area were burned by wildfire insummer 2002–2003.
Coopracambra National Park is in Far East Gippsland, Victoria,abutting the New South Wales border. North of the border it
Fig. 1. Map of south-eastern mainland Australia indicating general location of major
study areas where satellite tracking of wild dogs was undertaken.
A.W. Claridge et al. / Forest Ecology and Management 258 (2009) 814–822 815

Author's personal copy
adjoins South East Forests National Park and Yambulla State Forest.Geology mostly comprises Ordovician and Devonian sediments inthe east and extensive tracts of Devonian granite in the west, withQuaternary alluvial flats along larger creeklines and waterways.Elevation ranges from 300 to 1103 m above sea level. Landform isstrongly dissected with several large peaks characterised bygranite tors and the sinuous sandstone gorge of the Genoa River.Average annual rainfall is about 900 mm. Damp forest, lowlandforest and shrubby dry forest occur variously, mountain grey gum(E. dalrympleana), messmate (E. obliqua), yellow stringybark (E.
muelleriana), silvertop ash (E. sieberi) and red box (E. polyanthemos)being common. Wildfires were last recorded in 1983.
Morton National Park lies approximately 150 km south-east ofSydney. Its boundaries are contiguous with mostly vegetatedcrown land, State Forest and private tenure. Elevation ranges from100 to 1000 m. The landscape is characterised by narrow plateausdissected by deep gorges featuring cliffs, crevices, caves, water-falls and rocky river beds. The vegetation is complex, with diverseand often low heaths dominating on plateaus and floristically richeucalypt-dominated forests as well as rainforests in riparianareas. Much of the study area was burned during summer 2002–2003.
Namadgi National Park occupies the southern third of theAustralian Capital Territory, approximately 30 km south ofCanberra. Within the park, the Gudgenby Valley area formedour work base. Once native grasslands, the valley is now convertedto mostly agricultural pasture, until relatively recently grazed bydomestic stock. The vegetation surrounding the valley floor ispredominantly dry sclerophyll forest dominated by red string-ybark (E. macrorhyncha) and brittle gum (E. mannifera), with someribbon gum (E. viminalis). The surrounding landscape is dominatedby granitic peaks and tors > 1000 m in elevation. The study sitewas mostly burned by wildfire in summer 2002–2003.
2.2. Trapping methodology
Wild dogs were captured in Victor Soft Catch1 #3 leg-holdtraps with no modifications (Woodstream Corporation, PA, USA).These traps are designed to reduce impact on the captured animal’slimb (see Meek et al., 1995; Fleming et al., 1998). In each study areatraps were set on or adjacent to vehicular trails at sites with wilddog scratchings, urine stains or faeces. These sites were identifiedby working domestic dogs in association with local professionalwild dog trappers who set traps. Traps were buried beneath thesoil–litter interface, with an attached chain firmly secured to aheavy piece of wood that acted as a ‘drag’. The drag enabledcaptured animals to move to the nearest vegetative cover whileremaining tethered. At each trap site an attractant decoy or lurewas used more often than not. These were based on eithercombinations of rotting meat or urine-based formulae, or whereworking dogs had urinated or defecated in response to detectingwild dog sign. Traps were set for differing periods of time since ittook varying periods to capture animals. Traps were checked earlyeach morning shortly after dawn (0600–0900 h) and sometimesagain each afternoon (1600–1800 h).
2.3. Handling and processing of animals
Captured wild dogs were first restrained using a retractablenoose pole (Ketch All Company, San Luis Obispo, CA, USA), thenmoved to a board fitted with velcro straps, enabling the animal tobe firmly strapped side-on across the neck, behind the front legsand in front of the rear legs. The board was further fitted with acanvas blind that covered the head of the restrained animal toreduce stress. Once secured, the noose pole was released from thedog and the leg-hold trap removed.
Captured wild dogs were sexed, weighed (50 kg Pesola MacroScale, Ontario, Canada), photographed and individually markedwith a passive transponder tag (Trovan PIT, Microchips Australia,Keysborough, Australia) into the subcutaneous tissue in the neck.Tooth wear, coat colour pattern and general body appearance werenoted. Age was subjectively estimated on the basis of body weight,sex and tooth condition. An ear biopsy sample was also taken,using a leather hole punch, for later DNA analysis to confirm levelof genetic purity against known dingo samples. Wild dogs wereclassified on the basis of the proportion of dingo versus domesticdog genes as: (i) pure dingo, no domestic dog genes present, (ii)<75% dingo genes, (iii) <65% dingo genes and (iv) <50% dingogenes (Elledge et al., 2008).
2.4. GPS and satellite tracking collars
Movement of wild dogs was characterised using two sorts ofsatellite tracking systems deployed on collars fitted to animals. Thefirst system was a platform transmitting terminal or PTT (Sirtrack,Hastings, New Zealand, hereafter ‘satellite-transmitting collar’).Each location of an individual collared dog was obtained viatransmission to a low-level orbit satellite (ARGOS) system thenrelayed to a ground-based processing centre. Unlike GPS-basedlocations that rely on the simultaneous reception of multiplesatellites to improve the accuracy of positional fixes, the accuracyof ARGOS is dependant upon the number of times a signal isreceived from a transmitter while a single satellite is ‘visible’ to thetransmitter. The more times a signal is received from a transmitter,the more accurate the positional fix is.
ARGOS classifies positional fixes into three ‘usable’ classesaccording to accuracy:
(1) 350–1000 m;(2) 150–350 m;(3) <150 m.
Standard data received from ARGOS comprises a date and time thelocation was received, an accuracy class, location in the form oflatitude and longitude, and elevation. To extend operating life of eachdevice we scheduled ‘on’ and ‘off’ periods. These were either 6 h ‘on’(transmitting to satellites) and 8 h ‘off’ or 6 h ‘on’ and 19 h ‘off’. Thescheduling systems allowed fixes to be gathered from different partsof the 24 h cycle.
The second tracking system used conventional Global Position-ing Satellite (GPS) technology (hereafter GPS collar – LotekWireless Fish and Wildlife Monitoring, Ontario, Canada). Thissystem relies on reception of GPS signals from high level(20,000 km) satellites that are then stored on the collar unitattached to the animal. Acquisition rates can be set to virtually anyuser-defined configuration. We set most GPS collars to acquirefixes every 2 h and some every 30 min for 1–3 months. Based on atrial exercise where five collars were placed at known locations inthe field, 90% (87–95%) of resultant fixes were within 50 maccuracy of the ‘truth’. Data from GPS collars could only beretrieved if the collar could be retrieved. Both types of trackingcollar contained a release mechanism, fitted with an electronicfiring pin, allowing remote detachment without needing to re-trapanimals. Collars were then relocated by means of VHF telemetrysince they incorporated a 150–152 MHz transmitter. Both types oftracking device weighed around 300 g or 2% of the average mass ofan adult wild dog.
2.5. Prey availability
Availability of major prey items for wild dogs was indirectlyevaluated for each study area at the time animals were tracked. At
A.W. Claridge et al. / Forest Ecology and Management 258 (2009) 814–822816

Author's personal copy
500 m fixed intervals throughout each area, two circular plots,each 10 m in diameter, were identified 30 m either side ofvehicular trails. The relative abundance of herbivore (macro-pod = kangaroo and wallaby, and rabbit) pellets was estimated on asubjective scale: 0 = absent, 1 = 1–3 pellets, 2 = >3 pellets butcovering less than 30% of the surface area of the plot, and 3 = >30%of plot covered in pellets. Detectability of pellets on different plotsdid not vary since the entire plot was uniformly searched. At least25 sets of paired plots in each study area were searched once forpellets. The relative abundance of prey pellets in each study areawas standardised by totalling scores for macropods and rabbitpellets across all plots, then dividing by the maximum possiblescore achievable (the number of plots from which pellets werescored multiplied by three). For example, from 20 sets of plots (i.e.40 plots in total), the cumulative score for rabbit pellets was 20 andfor macropods 20. Thus, the relative abundance of prey was 40(20 + 20) divided by 120, or 0.33.
2.6. Tracking data analysis
For each dog, minimum convex polygons (MCPs) and 95% fixedkernel (FK 95) home ranges were analysed and quantified using the‘Abode’ extension for ArcGIS9 (Laver, 2005). FK95 estimates werecalculated using least squares cross validation (LSCV) and unitvariance standarisation as recommended by Seaman and Powell(1996). For each of 24 wild dogs, home range estimates werederived wherever possible on discrete and equitable time periods.Since data acquisition rates varied between satellite transmittingand GPS collars, a period of 84 days was chosen as the samplingperiod within which to derive home range estimates as only four ofthe 24 dogs tracked were tracked for less than that time. Forindividuals tracked longer, multiple estimates were derived wherethe time tracked was divisible in whole amounts. Locations used toestimate home ranges from GPS-collared animals were taken onceper day to be consistent with the sampling of the satellite-collaredanimals. This minimised variation in home range estimates thatmay have arisen from temporal dependence between fixes.Differences in average home range sizes of wild dogs within and
across study sites were examined by paired t-tests since data werenormally distributed.
Preliminary analyses of data obtained from GPS collars showedthat the number of fixes required to reliably quantify home rangeestimates of wild dogs asymptoted at 40–55 fixes over thenominated 84-day period. To derive this asymptote we took datafrom six GPS-collared animals and retrospectively sampledbetween 3 and 75 fixes, at random and without replacement,and examined effect of number of fixes on home range size. Thisprocedure was repeated for each dataset at least 80 times, toestablish the point at which variability in home range estimateswas minimised. The number of fixes at which we found anasymptote point is remarkably similar to the 30–50 fixes suggestedby Seaman et al. (1999). Since locations for all of our wild dogswere recorded at least once per day, the number of fixes obtainedwas adequate to estimate home range size for all but three animalsthat were tracked for <84 days.
For GPS-collared wild dogs only, we examined averagedistances moved over six-hourly periods where contiguous fixeswere obtained, over deployment duration. This 6 h ‘window’ waschosen for two reasons: (i) it was considered sufficient tocharacterise wild dog behaviour and (ii) lengthening the windowwould have incorporated more missing fixes and resulted in lessreliable summaries. In addition to mean distances moved, for eachrun of fixes we calculated the mean change in direction over the 6 hperiod. The maximum value obtained could not be >1808 (i.e. theanimal is constantly turning back on itself). These data wereexpressed empirically, charting the number of fixes as a series ofdifferent distance and angle classes.
To examine land tenure issues, locality fixes for each wild dogtracked were overlayed on to a base map within ArcGIS9 and thenumber of locations on public versus private land calculated. ForGPS-collared dogs, all locality fixes were used because of highaccuracy. For wild dogs with satellite-transmitting collars,accuracy of some locations was sufficiently poor (i.e. <1 km) torecord what tenure the animal was on confidently. For most suchdatasets, less than 10% of locality fixes were affected in such a wayand for five dogs with satellite-transmitting collars the underlying
Table 1Profiles of wild dogs live-captured and tracked using satellite technology during present study in south-eastern mainland Australia. Animals shown in bold type were killed
during routine control operations.
Study area Dog no. Collar type Sex Age (years) Days tracked Usable fixes DNA profile
Alpine NP 1 Lotek M 7+ 306 2066 <65% dingo
2 Lotek F <1 39 1183 <75% dingo
Coopracambra NP 3 Sirtrack F 2+ 310 110 <65% dingo
4 Sirtrack F 2+ 435 159 <65% dingo
5 Sirtrack M 1+ 306 118 <65% dingo
Kosciuszko NP 6 Sirtrack F 7+ 269 333 <75% dingo
7 Sirtrack F 3+ 87 159 <75% dingo
8 Sirtrack M <1 153 223 <65% dingo
9 Sirtrack M 6+ 526 575 <50% dingo
10 Sirtrack F 4+ 221 94 <65% dingo11 Sirtrack M 4+ 250 251 <50% dingo
12 Sirtrack F 5+ 842 295 <65% dingo
13 Lotek M 6+ 84 804 >75% dingo
14 Lotek F 2+ 84 841 Pure dingo
15 Lotek M 3+ 84 793 <75% dingo
16 Lotek F <1 84 760 <75% dingo
17 Lotek M 4+ 84 600 Pure dingo
Morton NP 18 Sirtrack F 4+ 206 229 <65% dingo
19 Sirtrack M 2+ 48 61 <50% dingo
20 Sirtrack M 5+ 327 180 <65% dingo
Namadgi NP 21 Lotek F 3+ 22 191 <75% dingo22 Lotek M 5+ 84 846 <75% dingo
23 Lotek M 4+ 84 600 <75% dingo
24 Lotek M 4+ 84 887 <75% dingo
A.W. Claridge et al. / Forest Ecology and Management 258 (2009) 814–822 817

Author's personal copy
land tenure of all fixes was undisputed. Across all wild dogs, theproportion of fixes on publicly-owned versus private land wasnoted.
3. Results
3.1. Animals caught and tracked
Overall, 24 wild dogs were successfully tracked across the fivestudy areas. These were from a range of sex and age classes,comprising 13 males and 11 females. Genetic testing of theserevealed that only two animals were ‘pure’ dingoes, with theremainder being hybrids of varying purity (Table 1). Of the 24animals tracked, four were killed during control operations, threewithin-park and one off-park. The duration of tracking ranged from22 to 842 days, resulting in between 61 and 2066 usable fixes peranimal. In general, GPS collar deployments resulted in far moreusable fixes being obtained than by satellite-transmitting collars.
3.2. Home range estimates
Home range estimates (FK95 and MCP) for the 24 wild dogstracked are summarised in Table 2. For satellite-transmittingcollared animals, FK95 home range estimates varied over time,from 2502 ha to 59,291 ha, over successive 84-day periods. Theaverage FK95 home range estimates of these animals varied from3887 ha to 27,619 ha. For GPS-collared wild dogs, FK95 homerange estimates varied from 925 ha to 19,366 ha over a similarduration of time.
There was marked variation in average home range estimatesbetween wild dogs across study areas. For example, the averageFK95 home range estimate of wild dogs tracked in NamadgiNational Park was significantly less (1433 � 550 ha, n = 4) than thatof animals in all other study areas (e.g. Kosciuszko National Park10,971 � 5551 ha, n = 12; Morton National Park 14,988 � 11,576 ha,n = 3; all animals 9923 � 7776 ha; p < 0.01). Thus, with all wild dogsconsidered, the average FK95 estimate was 9923 � 7776 ha (n = 24),while that of wild dogs apart from those at Namadgi was
11,621 � 7224 ha (n = 20). Across all 24 wild dogs, there was nosignificant difference (p = 0.61) between average FK95 estimates ofmale animals (10,646 � 9182 ha, n = 13) versus female animals(9068 � 6024 ha, n = 11). Similarly, when apportioned between ageclasses, there were no statistical differences between the averagehome range estimates of wild dogs aged from 0 to 2(12,876 � 8012 ha, n = 8), 3–4 (5835 � 3914 ha, n = 3), 4–5(9569 � 7341 ha, n = 6) and >5 years of age (10,082 � 9835 ha,n = 7) (p values in paired t-tests varied from 0.14 to 0.59).
3.3. Home range versus prey availability
Fig. 2 illustrates the relationship between the estimated size ofwild dog home ranges and the availability of macropods andrabbits, as adjudged through pellet counts. Across all study areasthere was a strong relationship (r2 = 0.5729) between home rangesize and prey availability, with home range size smallest wherepellet counts of prey were highest.
Table 2Home range estimates for wild dogs tracked by satellite technology in south-eastern mainland Australia. Animals shown in bold type were killed during routine control
operations.
Study area Dog no. Sex Age FK 95 (ha) Average FK 95 (ha) MCP (ha) Average MCP (ha)
Alpine NP 1 M 7+ 1,249 1,505
2 F <1 9,726 10,062
Coopracambra NP 3 F 2+ 12,045–16,528 14,090 8,421–11,067 9,679
4 F 2+ 2,502–5,229 3,887 1,723–4,231 2,844
5 M 1+ 5,188–55,089 26,988 4,619–27,498 19,248
Kosciuszko NP 6 F 7+ 3,713–6,650 4,747 3,088–7,679 6,055
7 F 3+ 13,155 10,894
8 M <1 11,300–18,262 14,781 8,851–11,513 10,182
9 M 6+ 7,460–11,667 9,493 7,220–11,995 9,834
10 F 4+ 20,661–25,968 22,622 12,265–20,916 16,47411 M 4+ 7,561–10,065 8,962 7,625–19,229 11,522
12 F 5+ 4,486–9,424 5,926 2,532–8,852 4,412
13 M 6+ 19,366 17,227
14 F 2+ 5,803 5,096
15 M 3+ 10,501 16,782
16 F <1 7,781 8,109
17 M 4+ 8,524 8,472
Morton NP 18 F 4+ 9,042–13,139 11,091 7,250–17,163 12,20719 M 2+ 6,111 4,008
20 M 5+ 7,390–59,291 27,619 5,547–61,566 26,209
Namadgi NP 21 F 3+ 925 1,02222 M 5+ 2,175 2,996
23 M 4+ 1,126 1,161
24 M 4+ 1,506 1,175
Fig. 2. Relationship between average home range size and prey availability score for
satellite-collared wild dogs, across each of the study areas in south-eastern
mainland Australia.
A.W. Claridge et al. / Forest Ecology and Management 258 (2009) 814–822818

Author's personal copy
3.4. Movement patterns
The relative percentages of six-hourly locality runs for GPS-collared wild dogs in each of several distance-directioncategories are highlighted in Fig. 3. The majority of runs fromthese animals (76.2%) were less than 4 km apart and>608 changein direction. Very few runs (2.7%) were of relatively long distance(>4 km) and straight lines (<608 mean change in direction).Instead, wild dog movements could be best characterised asshort and convoluted within defined home ranges. The weeklymovements of wild dog #14 indicated in Fig. 4 illustrate thepattern common across all GPS-collared wild dogs. Among theremaining wild dogs with satellite-transmitting collars affixed,there were very few long distance forays (>10 km), save for asingle movement for wild dog #5 in Coopracambra National Parkand wild dog #20 in Morton National Park. In the case of wild dog#5 the movement was unidirectional away from a defined homerange, on to private farmland, resulting in the animal beingkilled. At Morton, wild dog #20 made a foray approximately60 km south of an established home range, before returning to itscore area. These movements were atypical compared against thebroader dataset of movements from across the 24 trackedanimals.
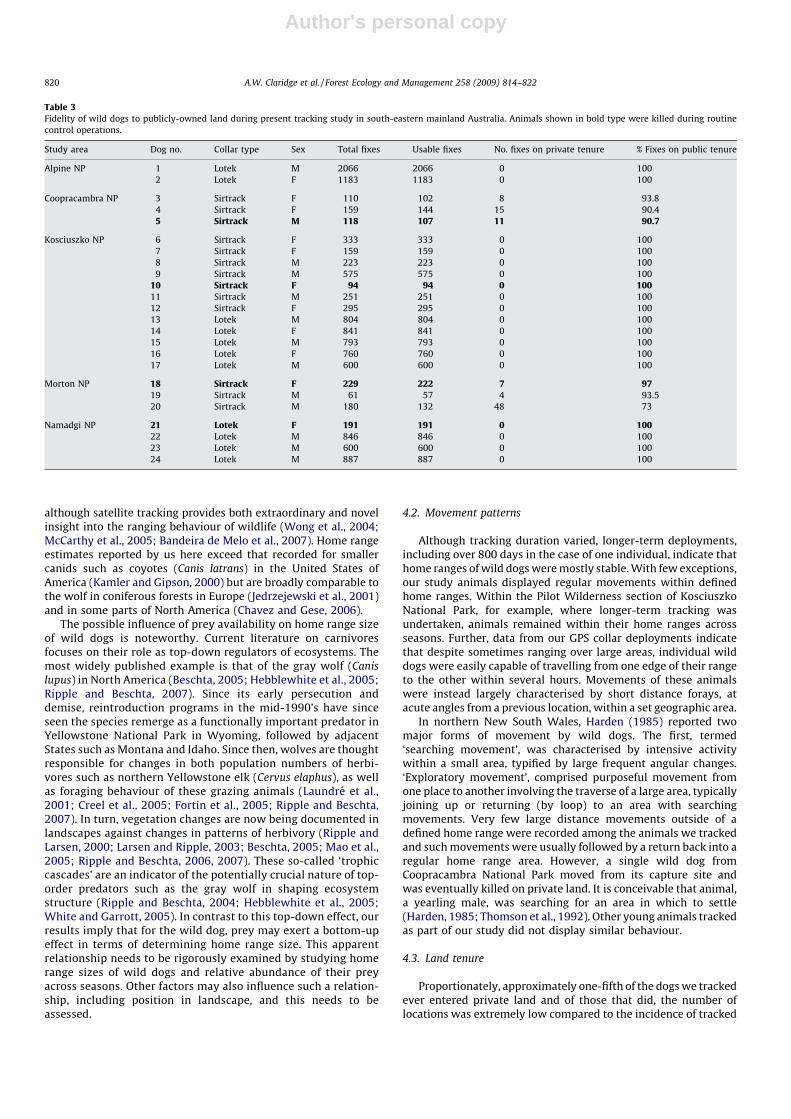
3.5. Land tenure
Table 3 indicates, for each wild dog tracked, the number andproportion of locality fixes recorded on public versus private land.The vast majority of fixes for nearly all dogs tracked were recordedon publicly-owned land, with few exceptions to this rule. Further,of the five wild dogs recorded on private tenure, only one of thesewas recorded on land with domestic stock (goats) and it wastrapped and shot.
4. Discussion
4.1. Home ranges of wild dogs in south-eastern mainland Australia
The first component of our study investigated the extent ofhome range size of wild dogs in large contiguous forested areas insouth-eastern mainland Australia using satellite tracking technol-ogy, to compare against previous VHF telemetry studies. Earlierstudies were typically characterised by small sample sizes of wilddogs, but deployment periods similar to ours. For example, Catling(1978) investigated seasonal movements of wild dogs withincoastal Nadgee Nature Reserve, and in the Pilot Wilderness Area ofKosciuszko National Park in the same location where we worked.At Nadgee, average (MCP) home range estimates of three wild dogswere around 1000 ha, while at Kosciuszko average estimates fromfour animals was closer to 2000 ha. In northern New South Wales,Harden (1985) tracked wild dogs in rugged escarpment country.Home range estimates (MCP) for adult male dogs approached3000 ha, and for four juvenile animals around 1000 ha. Finally,McIlroy et al. (1986) tracked nine wild dogs in northern KosciuszkoNational Park, again near where we worked. Over periods of a fewmonths, estimates (MCP) were around 2000 ha.
The home range estimates reported above are similar to thosewe recorded at Namadgi National Park, in the Australian CapitalTerritory, at a site where estimated prey abundance was relativelyhigh. However, this site was atypical among the areas where weworked and overall home range estimates of the wild dogs wetracked, including Namadgi animals, were approximately10,000 ha. This represents a significant difference in home rangeestimates of wild dogs between our work, which used satellite-tracking technology, and the earlier studies that used VHFtelemetry systems. The extent to which this difference is areflection of different tracking methodologies is unknown,
Fig. 3. Distribution of fixes from GPS-collared wild dogs in relation to point to point
distances and angles from one fix to next. The size of the dot is proportional to the
number of fixes in that category. See text for fuller description.Fig. 4. Example movement pattern of wild dog number 14, within the northern
section of Kosciuszko National Park, New South Wales, Australia. Pattern shown
highlights repeated convoluted movements within a defined home range.
A.W. Claridge et al. / Forest Ecology and Management 258 (2009) 814–822 819
Author's personal copy
although satellite tracking provides both extraordinary and novelinsight into the ranging behaviour of wildlife (Wong et al., 2004;McCarthy et al., 2005; Bandeira de Melo et al., 2007). Home rangeestimates reported by us here exceed that recorded for smallercanids such as coyotes (Canis latrans) in the United States ofAmerica (Kamler and Gipson, 2000) but are broadly comparable tothe wolf in coniferous forests in Europe (Jedrzejewski et al., 2001)and in some parts of North America (Chavez and Gese, 2006).
The possible influence of prey availability on home range sizeof wild dogs is noteworthy. Current literature on carnivoresfocuses on their role as top-down regulators of ecosystems. Themost widely published example is that of the gray wolf (Canis
lupus) in North America (Beschta, 2005; Hebblewhite et al., 2005;Ripple and Beschta, 2007). Since its early persecution anddemise, reintroduction programs in the mid-1990’s have sinceseen the species remerge as a functionally important predator inYellowstone National Park in Wyoming, followed by adjacentStates such as Montana and Idaho. Since then, wolves are thoughtresponsible for changes in both population numbers of herbi-vores such as northern Yellowstone elk (Cervus elaphus), as wellas foraging behaviour of these grazing animals (Laundre et al.,2001; Creel et al., 2005; Fortin et al., 2005; Ripple and Beschta,2007). In turn, vegetation changes are now being documented inlandscapes against changes in patterns of herbivory (Ripple andLarsen, 2000; Larsen and Ripple, 2003; Beschta, 2005; Mao et al.,2005; Ripple and Beschta, 2006, 2007). These so-called ‘trophiccascades’ are an indicator of the potentially crucial nature of top-order predators such as the gray wolf in shaping ecosystemstructure (Ripple and Beschta, 2004; Hebblewhite et al., 2005;White and Garrott, 2005). In contrast to this top-down effect, ourresults imply that for the wild dog, prey may exert a bottom-upeffect in terms of determining home range size. This apparentrelationship needs to be rigorously examined by studying homerange sizes of wild dogs and relative abundance of their preyacross seasons. Other factors may also influence such a relation-ship, including position in landscape, and this needs to beassessed.
4.2. Movement patterns
Although tracking duration varied, longer-term deployments,including over 800 days in the case of one individual, indicate thathome ranges of wild dogs were mostly stable. With few exceptions,our study animals displayed regular movements within definedhome ranges. Within the Pilot Wilderness section of KosciuszkoNational Park, for example, where longer-term tracking wasundertaken, animals remained within their home ranges acrossseasons. Further, data from our GPS collar deployments indicatethat despite sometimes ranging over large areas, individual wilddogs were easily capable of travelling from one edge of their rangeto the other within several hours. Movements of these animalswere instead largely characterised by short distance forays, atacute angles from a previous location, within a set geographic area.
In northern New South Wales, Harden (1985) reported twomajor forms of movement by wild dogs. The first, termed‘searching movement’, was characterised by intensive activitywithin a small area, typified by large frequent angular changes.‘Exploratory movement’, comprised purposeful movement fromone place to another involving the traverse of a large area, typicallyjoining up or returning (by loop) to an area with searchingmovements. Very few large distance movements outside of adefined home range were recorded among the animals we trackedand such movements were usually followed by a return back into aregular home range area. However, a single wild dog fromCoopracambra National Park moved from its capture site andwas eventually killed on private land. It is conceivable that animal,a yearling male, was searching for an area in which to settle(Harden, 1985; Thomson et al., 1992). Other young animals trackedas part of our study did not display similar behaviour.
4.3. Land tenure
Proportionately, approximately one-fifth of the dogs we trackedever entered private land and of those that did, the number oflocations was extremely low compared to the incidence of tracked
Table 3Fidelity of wild dogs to publicly-owned land during present tracking study in south-eastern mainland Australia. Animals shown in bold type were killed during routine
control operations.
Study area Dog no. Collar type Sex Total fixes Usable fixes No. fixes on private tenure % Fixes on public tenure
Alpine NP 1 Lotek M 2066 2066 0 100
2 Lotek F 1183 1183 0 100
Coopracambra NP 3 Sirtrack F 110 102 8 93.8
4 Sirtrack F 159 144 15 90.4
5 Sirtrack M 118 107 11 90.7
Kosciuszko NP 6 Sirtrack F 333 333 0 100
7 Sirtrack F 159 159 0 100
8 Sirtrack M 223 223 0 100
9 Sirtrack M 575 575 0 100
10 Sirtrack F 94 94 0 10011 Sirtrack M 251 251 0 100
12 Sirtrack F 295 295 0 100
13 Lotek M 804 804 0 100
14 Lotek F 841 841 0 100
15 Lotek M 793 793 0 100
16 Lotek F 760 760 0 100
17 Lotek M 600 600 0 100
Morton NP 18 Sirtrack F 229 222 7 9719 Sirtrack M 61 57 4 93.5
20 Sirtrack M 180 132 48 73
Namadgi NP 21 Lotek F 191 191 0 10022 Lotek M 846 846 0 100
23 Lotek M 600 600 0 100
24 Lotek M 887 887 0 100
A.W. Claridge et al. / Forest Ecology and Management 258 (2009) 814–822820

Author's personal copy
locations on publicly-owned lands. This finding is based ontracking wild dogs within larger parcels (>30,000 ha) of publicly-owned land. Intuitively, when publicly-owned lands are smaller indimension, or fragmented by adjacent private lands, the oppor-tunity for wild dogs to move outside of publicly-owned land isincreased. Critically, we did not focus on areas on the public–private land interface but rather, those areas not subject to controlso that we observed ‘natural’ movements. When subject to control,individuals may display erratic movements shaped by individualanimals being killed around them. Such change in behaviour hasbeen reported among coyotes subject to increased humanperturbation (Kitchen et al., 2000). Wild dogs tracked at landtenure interfaces may interact more frequently with private landthan did our sample population but this requires testing.
Wild dogs on large parcels of publicly-owned land may alsoindirectly affect adjacent private land interests in cases where theirprogeny disperse away from a natal home range and cross landtenure boundaries (Thomson et al., 1992). Data on dispersal ratesand distances of movement of young and sub-adult wild dogs insouth-eastern mainland Australia are lacking. We tracked too fewanimals in these age classes and the few we did track remainedmostly faithful to publicly-owned land. Similarly, in arid north-western Australia, Thomson et al. (1992) found that most radio-collared young and sub-adult dingoes remained in the same areasover time.
4.4. Management implications
Contemporary management effort for wild dogs is based on adistinction between areas where control of all wild dogs is soughtand those identified for notional conservation of ‘dingoes’.Practically, this has also seen some plans of management forconservation reserves include the prospect of maintaining dingoesas top-order predators (Department of Environment and Con-servation, 2006). Genetic assay of animals we studied indicatesthat very few wild dogs could be considered as ‘pure dingoes’ butrather were ‘mostly dingo’ with various infusion of domestic doggenes (Elledge et al., 2008). If our sub-sample of wild dogs isrepresentative of the genetics of the broader population, what isactually being genetically conserved in non-control areas? A largersample size of animals needs to be genetically tested as a priority todetermine where pure dingoes are being conserved.
Our work indicates that home range sizes of the majority of wilddogs in landscapes in south-eastern mainland Australia appearmuch larger than previously determined by conventional tele-metry studies. Control efforts in our study region are loosely basedon maintaining a perimeter or ‘wild dog free’ buffer area of 5–10 km width adjacent to agricultural assets (Harden, 1985; McIlroyet al., 1986). Within these zones, previously thought to be two wilddog home ranges wide, control efforts are concentrated. Main-taining buffer zones of the order of this magnitude couldpotentially impact upon a broader proportion of wild dogs givenour findings. Put another way, because of the relatively largerhome range sizes of animals, even individuals in the core of largertracts of publicly-owned lands may interact with control sincereserves are no more than 20–30 km wide in total. This was thecase for two animals in our study killed by poison baits. How thismight disrupt movements of individual wild dogs when animals inneighbouring home ranges are killed is unknown. However, whenterritorial boundaries cease to be maintained by social interaction,movements of surviving animals may become erratic (Thomsonet al., 1992; Corbett, 1995).
Wild dog management efforts need to be tenure blind withcontrol focussed on protecting agricultural assets deemedthreatened. Elsewhere, wild dogs might be maintained asimportant functional components of natural landscapes. Such a
balance can only be achieved in areas that are large enough toenable wild dogs to range solely within publicly-owned tenure orotherwise on private tenures not maintaining assets such asdomestic stock. Practical change will be more easily achieved byignoring tenure boundaries and treating the landscape as a whole,accepting wild dogs range large distances, and that in largepublicly-owned lands animals are ‘mostly dingo’ by geneticmakeup.
Acknowledgements
This is the second paper stemming from the Dogs in Space
project � New South Wales Department of Environment andClimate Change (DECC). The Parks and Wildlife Group SouthernBranch Senior Management Team and the Australian Alps LiaisonCommittee funded us. L. Allen, M. Clarke, J. Cuervo, M. Davis, M.Dower, I. Eggleton, F. Ford, J. King, B. Morris, A. Murray, J. Pardew, C.Pascoe, R. Pleschutsnig, R. Roach and W. Schofield assisted withfieldwork. A. Wilton from the University of New South Walesundertook genetic assays. Research was conducted in accordancewith an Environment ACT Licence to Take (#LT2006237), a NSWSection 132C Scientific Licence (#S11384), a Victorian DSEScientific Permit (#10003397), Victorian Department of PrimaryIndustries Pest Animal Research/Education Collections Permit(#RE54) and a DECC Animal Ethics Authority (#040906/01).
References
Bandeira de Melo, L.F., Lima Sabato, M.A., Vaz Magni, E.M., Young, R.J., Coelho, C.M.,2007. Secret lives of maned wolves (Chrysocyon brachyurus Illiger 1815): asrevealed by GPS tracking collars. J. Zool. (Lond.) 271, 27–36.
Beschta, R.L., 2005. Reduced cottonwood recruitment following extirpation ofwolves in Yellowstone’s Northern Range. Ecology 86, 391–403.
Chavez, A.S., Gese, E.G., 2006. Landscape use and movements of wolves in relation tolivestock in a wildland–agricultural matrix. J. Wildl. Manage. 70, 1079–1087.
Catling, P.C., 1978. Dingo movements in south-eastern New South Wales. In:Australian Vertebrate Pest Control Conference Working Papers, Canberra,ACT, July, pp. 40–42.
Claridge, A.W., Hunt, R., 2008. Evaluating the role of the dingo as a trophic regulator:additional practical suggestions. Ecol. Manage. Rest. 9, 116–119.
Corbett, L.K., 1995. The Dingo in Australia and Asia. University of New South WalesPress, Sydney.
Creel, S., Winnie Jr., J., Maxwell, B., Hamlin, K., Creel, M., 2005. Elk alter habitatselection as an antipredator response to wolves. Ecology 86, 3387–3397.
Daniels, M.J., Corbett, L., 2003. Redefining introgressed protected mammals: whenis a wildcat a wild cat and a dingo a wild dog? Wildl. Res. 30, 213–218.
Department of Environment and Conservation, 2005. http://www.environ-ment.nsw.gov.au/resources/pestsweeds/WildDogPolicy.pdf.
Department of Environment and Conservation, 2006. Kosciuszko National Park2006 Plan of Management. Department of Environment and Conservation,Sydney South.
Department of Sustainability and Environment, Victoria, 2008. http://www.dse.-vic.gov.au/CA256F310024B628/0/CE0F24F31465F64FCA25753F00190BFF/$File/FFG+threatened+list+November+2008.pdf.
Elledge, A., Allen, L.R., Carlsson, B.L., Wilton, A.L., Leung, L.K., 2008. An evaluation ofgenetic analyses, skull morphology and visual appearance for assessing dingopurity: implications for dingo conservation. Wildl. Res. 35, 812–820.
Fleming, P.J.S., Korn, T.J., 1989. Predation of livestock by wild dogs in eastern NewSouth Wales. Aust. Rangeland J. 11, 61–66.
Fleming, P.J.S., Allen, L.R., Bergout, M.J., Meek, P.D., Pavlov, P.M., Stevens, P., Strong,K., Thompson, J.A., Thomson, P.C., 1998. The performance of wild-canid traps inAustralia: efficiency, selectivity and trap-related injuries. Wildl. Res. 25, 327–338.
Fleming, P.J.S., Allen, L.R., Lapidge, S.J., Robley, A., Saunders, G.R., Thomson, P.C.,2006. A strategic approach to mitigating the impacts of wild canids: proposedactivities of the Invasive Animals Cooperative Research Centre. Aust. J. Exp.Agric. 46, 753–762.
Fortin, D., Beyer, H.L., Boyce, M.S., Smith, D.W., Duchesne, T., Mao, J.S., 2005. Wolvesinfluence elk movements: behaviour shapes a trophic cascade in YellowstoneNational Park. Ecology 86, 1320–1330.
Glen, A.S., Dickman, C.R., 2005. Complex interactions among mammalian carnivoresin Australia, and their implications for wildlife management. Biol. Rev. 80, 387–401.
Glen, A.S., Dickman, C.R., Soule, M.E., Mackey, B.G., 2007. Evaluating the role of thedingo as a trophic regulator in Australian ecosystems. Aust. Ecol. 32, 492–501.
Harden, R.H., 1985. The ecology of the dingo in north-eastern New South Wales. I.Movements and home range. Aust. Wildl. Res. 12, 25–37.
A.W. Claridge et al. / Forest Ecology and Management 258 (2009) 814–822 821

Author's personal copy
Hebblewhite, M., White, C.A., Nietvelt, C.G., McKenzie, J.A., Hurd, T.E., Fryxell, J.M.,Bayley, S.E., Paquet, P.C., 2005. Human activity mediates a trophic cascadecaused by wolves. Ecology 86, 2135–2144.
Jedrzejewski, W., Schmidt, K., Theuerkauf, K.J., Jedrzejewska, B., Okarma, H., 2001.Daily movements and territory use by radio-collared wolves (Canis lupus) inBialowieza Primeval Forest in Poland. Can. J. Zool. 79, 1993–2004.
Jenkins, D.J., 2005. Hydatid control in Australia: where it began, what we haveachieved and where to from here. Int. J. Parasitol. 35, 733–740.
Jenkins, D.J., 2006. Echinococcus granulosus in Australia, widespread and doing well!Parasitol. Int. 55, S203–S206.
Johnson, C.N., 2006. Australia’s Mammal Extinctions: A 50000 Year History. Cam-bridge University Press, Cambridge.
Johnson, C.N., Wroe, S., 2003. Causes of extinction of vertebrates during theHolocene of mainland Australia: arrival of the dingo, or human impact?Holocene 13, 1009–1016.
Johnson, C.N., Isaac, J.L., Fisher, D.O., 2007. Rarity of a top order predator triggerscontinent-wide collapse of mammal prey: dingoes and marsupials in Australia.Proc. Roy. Soc. B 274, 341–346.
Kamler, J.F., Gipson, J.S., 2000. Space and habitat use by resident and transientcoyotes. Can. J. Zool. 78, 2106–2111.
Kitchen, A.M., Gese, E.M., Schauster, E.R., 2000. Changes in coyote activity patternsdue to reduced exposure to human persecution. Can. J. Zool. 78, 853–857.
Laundre, J.W., Hernandez, L., Altendorf, K.B., 2001. Wolves, elk, and bison: re-establishing the ‘‘landscape of fear’’ in Yellowstone National Park U.S.A. Can.J. Zool. 79, 1401–1409.
Larsen, E.J., Ripple, W.J., 2003. Aspen age structure in the northern Yellowstoneecosystem: USA. Forest Ecol. Manage. 179, 469–482.
Laver, P., 2005. Abode Home Range Tool for ArcGIS. http://filebox.vt.edu/users/player/abode/home.html.
Mao, J.S., Boyce, M.S., Smith, D.W., Singer, F.J., Vales, D.J., Vore, J.M., Merrill, E.H.,2005. Habitat selection by elk before and after wolf reintroduction in Yellow-stone National Park. J. Wildl. Manage. 69, 1691–1707.
McCarthy, T.M., Fuller, T.K., Munkhtsog, B., 2005. Movements and activities of snowleopards in Southwestern Mongolia. Biol. Conserv. 124, 527–537.
McIlroy, J.C., Cooper, R.J., Gifford, E.J., Green, B.F., Newgrain, K.W., 1986. The effect onwild dogs, Canis f. familiaris, of 1080-poisoning campaigns in KosciuszkoNational Park N.S.W. Aust. Wildl. Res. 13, 535–544.
McLeod, R., 2004. Counting the Cost: Impact of Invasive Animals in Australia 2004.Cooperative Research Centre for Pest Animal Control, Canberra.
Meek, P.D., Jenkins, D.J., Morris, B., Ardler, A.J., Hawksby, R.J., 1995. Use of twohumane leg-hold traps for catching pest species. Wildl. Res. 22, 733–739.
Mitchell, B.D., Banks, P.B., 2005. Do wild dogs exclude foxes? Evidence for competi-tion from dietary and spatial overlaps. Aust. Ecol. 30, 581–591.
Newsome, A.E., 1990. The control of vertebrate pests by vertebrate predators.Trends Ecol. Evol. 5, 187–191.
Newsome, A.E., Catling, P.C., Corbett, L.K., 1983. The feeding ecology of the dingo. II.Dietary and numerical relationships with fluctuating prey populations in south-eastern Australia. Aust. J. Ecol. 8, 345–366.
Newsome, A.E., Catling, P.C., Cooke, B.D., Smyth, R., 2001. Two ecological universesseparated by the dingo fence in semi-arid Australia: interactions betweenlandscapes, herbivory and carnivory, with and without dingoes. Rangeland J.23, 71–98.
Newsome, A.E., Pech, R.P., Smyth, R., Banks, P.B., Dickman, C.R., 1997. PotentialImpacts on Australian Native Fauna of Rabbit Calicivirus Disease. EnvironmentAustralia, Canberra.
Pople, A.R., Grigg, G.C., Cairns, S.C., Beard, L.A., Alexander, P., 2000. Trends in thenumbers of red kangaroos and emus either side of the South Australian dingofence: evidence for predator regulation? Wildl. Res. 27, 269–276.
Ripple, W.J., Larsen, E.J., 2000. Historic aspen recruitment, elk, and wolves innorthern Yellowstone National Park. Biol. Conserv. 95, 361–370.
Ripple, W.J., Beschta, R.L., 2004. Wolves and the ecology of fear: can predation riskstructure ecosystems? Bioscience 54, 755–766.
Ripple, W.J., Beschta, R.L., 2006. Linking wolves to willows via risk-sensitive fora-ging by ungulates in the northern Yellowstone Ecosystem. Forest Ecol. Manage.230, 96–106.
Ripple, W.J., Beschta, R.L., 2007. Restoring Yellowstone’s aspen with wolves. Biol.Conserv. 138, 514–519.
Robertshaw, J.D., Harden, R.H., 1986. The ecology of the dingo in north-eastern NewSouth Wales. IV. Prey selection by dingoes, and its effect on the major preyspecies, the swamp wallaby, Wallabia bicolor (Desmarest). Aust. Wildl. Res. 13,141–163.
Savolainen, P., Leitner, T., Wilton, A.N., Matisoo-Smith, E., Lundeberg, J., 2004. Adetailed picture of the origin of the Australian dingo, obtained from the study ofmitochondrial DNA. Proc. Natl. Acad. Sci. U.S.A. 101, 12387–12390.
Seaman, D.E., Powell, R.A., 1996. An evaluation of the accuracy of kernel densityestimators for home range analysis. Ecology 77, 2075–2085.
Seaman, D.E., Millspaugh, J.J., Kernohan, B.J., Brundige, G.C., Radeke, K.J., Gitzen, R.A.,1999. Effects of sample size on kernel home range estimates. J. Wildl. Manage.63, 739–747.
Thomson, P.C., 1992. The behavioural ecology of dingoes in north-western Aus-tralia. IV. Social and spatial organization, and movements. Wildl. Res. 19, 543–563.
Thomson, P.C., Rose, K., Kok, N.E., 1992. The behavioural ecology of dingoes in north-western Australia. VI. Temporary extraterritorial movements and dispersal.Wildl. Res. 19, 585–595.
White, P.J., Garrott, R.A., 2005. Yellowstone’s ungulates after wolves—expectations,realizations, and predictions. Biol. Conserv. 125, 141–152.
Wong, S.T., Servheen, C.W., Ambu, L., 2004. Home range, movement and activitypatterns, and bedding sites of Malayan sun bears Helarctos malayanus in therainforest of Borneo. Biol. Conserv. 119, 169–181.
A.W. Claridge et al. / Forest Ecology and Management 258 (2009) 814–822822