Denitrification in sediments of the Laurentian Trough, St. Lawrence Estuary, Québec, Canada
Upload
independentCategory
view
3download
0
Journal of Aquatic Ecosystem Stress and Recovery 8: 125–141, 2000.© 2000 Kluwer Academic Publishers. Printed in the Netherlands.
125
Recolonization and possible recovery of Burrowing Mayflies(Ephemeroptera: Ephemeridae: Hexagenia spp.) in Lake Erieof the Laurentian Great Lakes ∗
Don W. Schloesser1, Kenneth A. Krieger2, Jan J. H. Ciborowski3 & Lynda D. Corkum4
1U.S. Geological Survey, Great Lakes Science Center, Ann Arbor, MI 48105, U.S.A.2Water Quality Laboratory, Heidelberg College, Tiffin, OH 44883, U.S.A.3Department of Biological Sciences and Great Lakes Institute for Environmental Research, University of Windsor,Windsor, Ontario N9B 3P4, Canada4Department of Biological Sciences, University of Windsor, Windsor, Ontario N9B 3P4, Canada
Received 23 May 2000; accepted in revised form 16 January 2001
Key words: Hexagenia, Lake Erie, mayflies, recovery
Abstract
Burrowing mayflies of the genus Hexagenia spp. were widely distributed (ca. 80% of sites) and abundant (ca.160 nymphs/m2) in the western basin of Lake Erie of the Laurentian Great Lakes in 1929–1930, prior to a periodof anoxia in the mid 1950s. Nymphs were absent or rare in the basin between 1961 and 1973–1975. In 1979–1991,nymphs were infrequently found (13–46% of sites) in low abundance (3–40 nymphs/m2) near shore (<7.5 km fromshore), but were absent or rare offshore (0–7% of sites at 0–1 nymphs/m2). Increased abundance occurred offshorebetween 1991 (0% of sites) and 1993 (52% of sites at 7/m2). Annual sampling, beginning in 1995, indicates thatnymphs increased in both nearshore and offshore waters. By 1997, nymphs were found throughout the lake (88%of sites) at a mean density 40-fold greater (392/m2) than that observed in 1993 (11/m2). In 1998, the distribution ofnymphs remained the same as 1997 (88% of sites) but density declined 3-fold (392 to 134/m2). These data indicatethat mayflies have recolonized sediments of western Lake Erie and that their abundance may be similar to levelsobserved before their disappearance in the mid 1950s. However, prior to the mid 1950s, densities were greater inoffshore than nearshore waters, but between 1979 and 1998 greater densities occurred near shore than offshore.In addition, there were two areas in the 1990s where low densities consistently occurred. Therefore, recovery ofnymphs in western Lake Erie may not have been complete in 1998. At present we do not know the cause forthe sudden recolonization of nymphs in large portions of western Lake Erie. Undoubtedly, pollution-abatementprograms contributed to improved conditions that would have ultimately led to mayfly recovery in the future.However, the explosive growth of the exotic zebra mussel, Dreissena polymorpha, undoubtedly diverted planktonfoods to bottom substrates which could have increased the speed at which Hexagenia spp. nymphs recolonizedsediments in western Lake Erie in the 1990s.
Introduction
Examination of macrobenthos in the western basinof Lake Erie indicates that one primary event deter-mined the character of benthic communities betweenthe mid 1950s and early 1990s (Beeton, 1961, 1969;
∗ The U.S. Government right to retain a non-exclusive, royalty-free license in and to any copyright is acknowledged.
Carr & Hiltunen, 1965; Burns, 1985). This was thesudden decline of burrowing mayfly nymphs (Hexa-genia spp.) as a result of anoxia in bottom watersof the eastern portion of the basin in autumn 1953(Britt, 1955a, b). Before the anoxic event, the benthicmacroinvertebrate community was described as beingdominated by relatively large-bodied organisms, suchas burrowing mayflies and caddisflies larvae (e.g.,
126
Oecetis spp., Shelford & Boesel, 1942). After the1950s, the benthos community became dominated byrelatively small organisms, such as oligochaetes (70%of total, Schloesser et al., 1995; Manny & Schloesser,1999), and mayflies and caddisflies were absent or rare(Beeton, 1961; Carr & Hiltunen, 1965; Reynoldsonet al., 1989; Manny & Schloesser, 1999). Betweenthe 1950s and 1988 there was no substantial changein macrobenthos in open waters of western Lake Erieuntil high densities of zebra mussels (Dreissena poly-morpha) occurred in 1989 (Carr & Hiltunen, 1965;Nalepa & Schloesser, 1993; Manny & Schloesser,1999). In the early 1990s, adults of burrowing mayfliesbegan to be seen along the shores of western LakeErie, which led to subsequent discovery of nymphsand their expansion into offshore waters in 1995(Krieger et al., 1996).
The return of burrowing mayflies to westernLake Erie is important because they are indicatorsof mesotrophic conditions and their densities havebeen proposed as criteria for measuring the reversalof eutrophication through international pollution-abatement programs initiated in the late 1960s (Hunt,1953; Burns, 1985; Reynoldson et al., 1989; Fremling& Johnson, 1990; Sweeney, 1993; Ohio Lake ErieCommission, 1998). Mayflies are relatively immobile,long lived, and have been shown to be sensitive toenvironmental stress, especially low dissolved oxygen(Fremling, 1964; Hiltunen & Schloesser, 1983;Schloesser & Hiltunen, 1984; Fremling & Johnson,1990; Schloesser et al., 1991). Return of mayfliesto formerly eutrophic waters has been interpreted asa sign of progress toward reversing eutrophication ininland waters of North America and Europe (Harris etal., 1987; Krieger et al., 1996; Fremling & Johnson,1990; Schloesser et al., 1991; bij de Vaate et al.,1992). In the rivers Meuse and Rhine of Europe,massive numbers of the mayfly Ephoron virgo werefound in the first few decades of the 20th centurybut severe water pollution resulted in low dissolvedoxygen and extirpation of nymphs from large portionsof these rivers in the 1930s (bij de Vaate et al., 1992).Pollution-abatement programs allowed recovery of E.virgo in the Netherlands’ portions of the rivers Meuseand Rhine in 1991.
Recent examination of historical information ofmayfly nymphs in western Lake Erie has revealedthat there is little information in general and verylittle quantitative, site-specific information and thissite-specific information is difficult to obtain and isopen to interpretation (Manny, 1991; Kolar et al.,
1997; Madenjian et al., 1998; Krieger et al., 1996;Schloesser & Nalepa, 2001). In addition, past studieshave only sampled portions of the entire basin, which,because of its size and proximity to different anthropo-genic influences, has exhibited strong regional differ-ences of benthic communities (Carr & Hiltunen, 1965;Schloesser et al., 1995; Manny & Schloesser, 1999;Edsall et al., 1999). Consequently, determinations ofmean densities based on individual studies vary widelyamong comparative studies and therefore probably donot reflect basin-wide comparisons.
Here, we present our interpretation of densityinformation from specific sites for studies conductedbetween 1929 and 1991 and densities for recentstudies conducted between 1991 and 1998(Appendix 1). We compare all available data toassess the status of nymphs in western Lake Eriein the 1990s. A preliminary study by Krieger et al.(1996) showed the distribution of nymphs primarilyin the western portion of the basin between 1930 and1991 and early signs of increased distribution – butnot densities – of nymphs into open waters in 1995.The present study includes several regional studiesconducted between 1991 and 1994, expands the 1995study by Krieger et al. (1996) to 1996–1998, and addsa second, independent study conducted in 1996–1998.The present study is the first to report the distributionand density of Hexagenia spp. nymphs throughoutwestern Lake Erie.
Methods
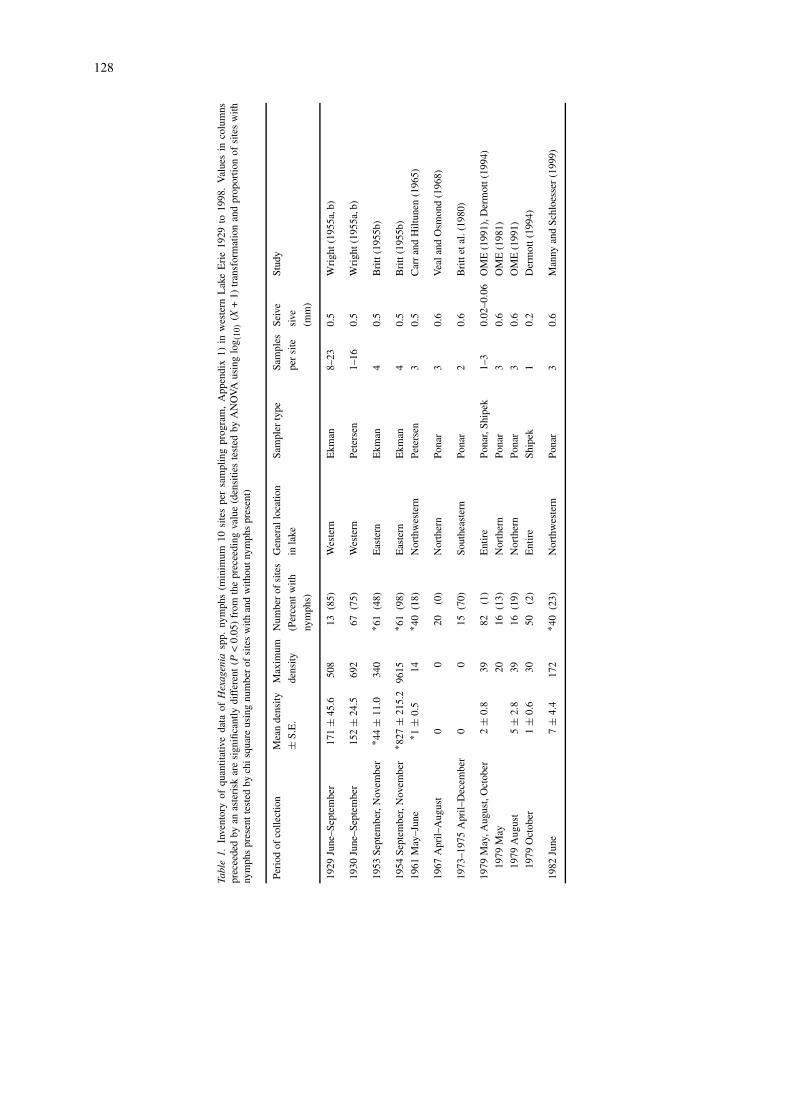
We determined densities of mayflies found in 10periods between 1929 and 1991 (past studies) andin 7 periods between 1991 and 1998 (present study)(Table 1, Appendix 1). Densities in past studieswere compiled by examining published documents,reports, original field records, and personal commu-nications with individuals who were knowledgeableof methods used during the period of study (e.g.,personal communication, Jarl K. Hiltunen, Sault Ste.Marie, Michigan). Criteria used in selecting datawere availability of quantitative density estimates atspecific sites using a recommended benthic sampler, aminimum of 10 sites per sampling period over a rela-tively broad geographic area, and comparable seivesizes (Clesceri et al., 1998). Sample processing variedover years but followed general guidelines for benthicsampling as follows: samples were washed through a(minimum 0.6 mm-mesh) screen, preserved in form-
127
alin, and nymphs were removed and enumerated inthe laboratory by visual inspection. These methods areadequate to obtain nymphs as small as 3 mm in length(Schloesser & Hiltunen, 1984; Schloesser & Nalepa,2001; DWS, unpublished data).
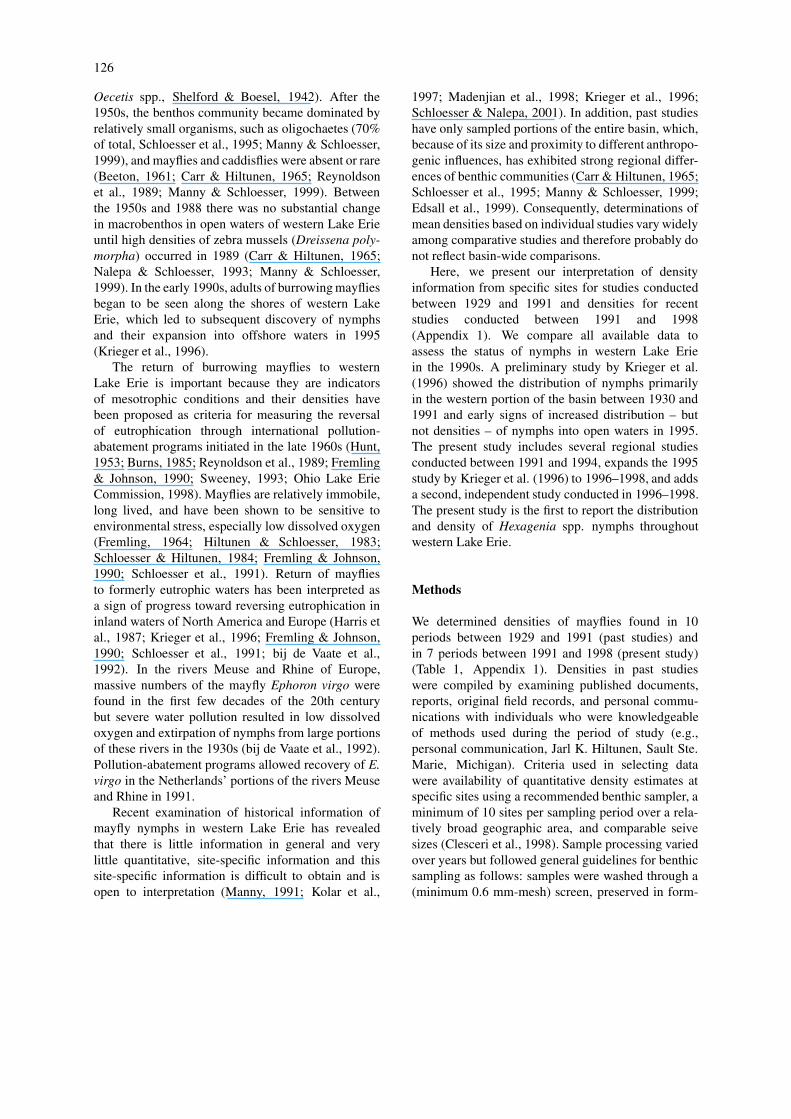
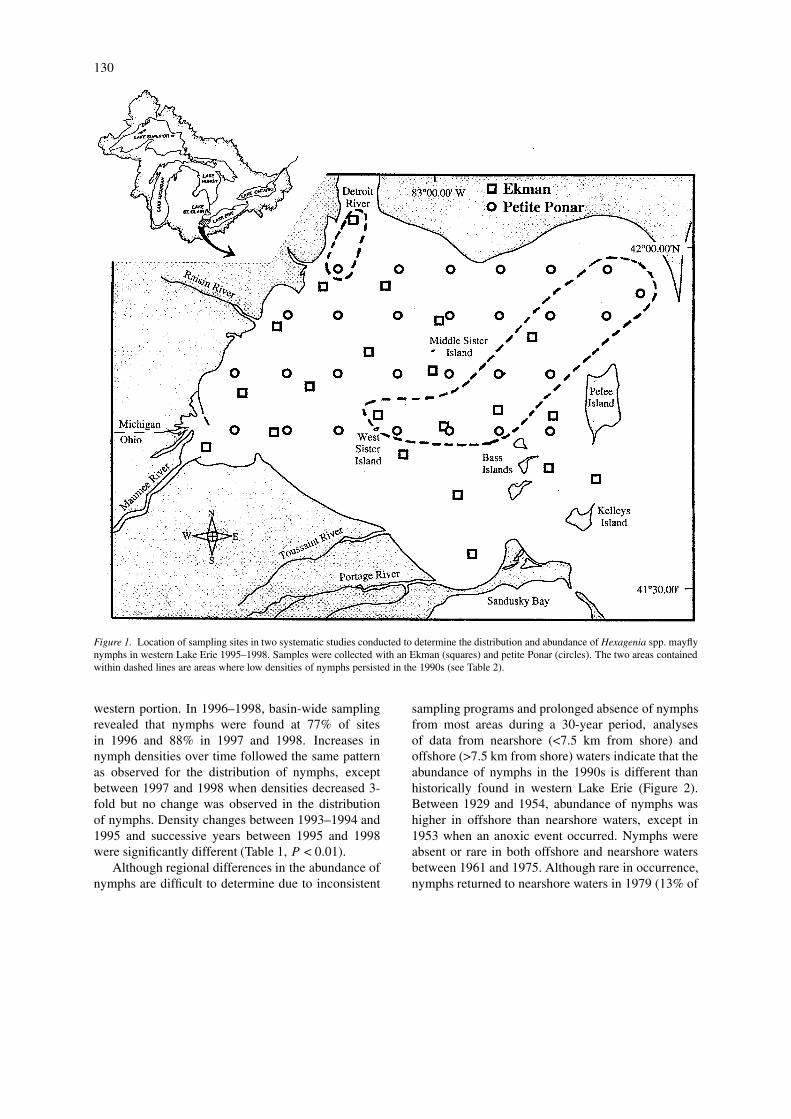
In the present study, three recommended benthicsamplers (Ponar, Ekman, petite Ponar) were usedto determine densities of nymphs at between 9 and47 sites in four sample collections in 1991, 1993,and 1994 (Table 1). Then beginning in 1995 and1996, two systematic sampling programs were initi-ated (Figure 1). These two sampling programs wereconducted independently. In one sampling program,an Ekman grab (506 cm2) was used to collect foursamples per site (primarily in the southwestern andmiddle portions of the basin) at between 20 and 21sites annually 1995–1998. These are the same sitessampled by Krieger et al. (1996) in 1995. In a secondsampling program, a petite Ponar grab (225 cm2) wasused to collect five samples per site (primarily in thenorthern and middle portions of the basin) at between18 and 28 sites annually 1996–1998. Several siteslocated in the most western portion of the basin corres-pond to historical sites sampled in 1929–1930, 1961,1982, and 1993 (Appendix 1). Many sites locatedin the northeastern, middle, and southern portionsof the basin were sampled for the first time in thepresent study. Combined, the two sampling programsincluded the entire western basin with overlap of sitelocations in the western and middle portions of thebasin. No significant differences between densitiesobtained during the two sampling programs withinyears were found. Therefore, we used total meandensities of individual sites of the two samplingprograms to obtain basin-wide densities for 1996,1997, and 1998. The present study is one of onlytwo (Dermott, 1994) designed to sample benthos inthe entire basin even though past studies have showndramatic differences in benthic community composi-tion based on proximity to islands, river mouths,and open water (Britt, 1955a, b; Carr & Hiltunen,1965; Schloesser et al., 1995; Manny & Schloesser,1999). Substrates throughout (>90%) western LakeErie are soft muds, which are preferred substrates ofburrowing mayfly nymphs (Hunt, 1953; Thomas et al.,1976). All samples were collected in May and Junebecause this is the period of year when nymphs arerelatively abundant and large and when several paststudies of benthos were conducted (1961 and 1982,Carr & Hiltunen, 1965; Schloesser et al., 1995; Manny& Schloesser, 1999; Schloesser & Nalepa, 2001).
Sample preservation and analysis followed recom-mended methods for benthic sampling and was verysimilar to that of past studies (Clesceri et al., 1998).Details of methods can be found in Schloesser (1988),Schloesser et al. (1991), and Schloesser et al. (1995).
Recent examination of the life history of Hexa-genia spp. nymphs in Lake Erie revealed no discern-able groups that could be attributed to the two speciesof nymphs (i.e., H. limbata and H. rigida) found inLake Erie (Schloesser & Nalepa, 2001). There is noreliable method to separate these species of nymphsand past studies combined these taxa, which histor-ically were the only species present (Krieger et al.,1996).
Statistical comparisons of densities of nymphsbetween studies within years and between years weretested by two-way ANOVA (Sokal & Rohlf, 1981;Zar, 1996) after log(10)(x + 1) transformation of arith-metic site means. Differences in densities of nymphsfound near shore (<7.5 km from shore) and offshore(>7.5 km) were tested using one-tailed student’s t-tests (after log(10)(x + 1) transformation) based on apriori knowledge of the trend of differences observedbefore and during the anoxic event in 1953–1954.Differences between densities in two areas of lowdensity and all other sites in 1995–1998 were testedby one-way ANOVA after transformation of site densi-ties. Areas were designated based on visual inspectionof site densities. Differences in proportions of siteswith nymphs present were tested using chi square ofindependence in 2 × 2 contingency tables containingnumber of sites with and without nymphs in successiveyears.
Results
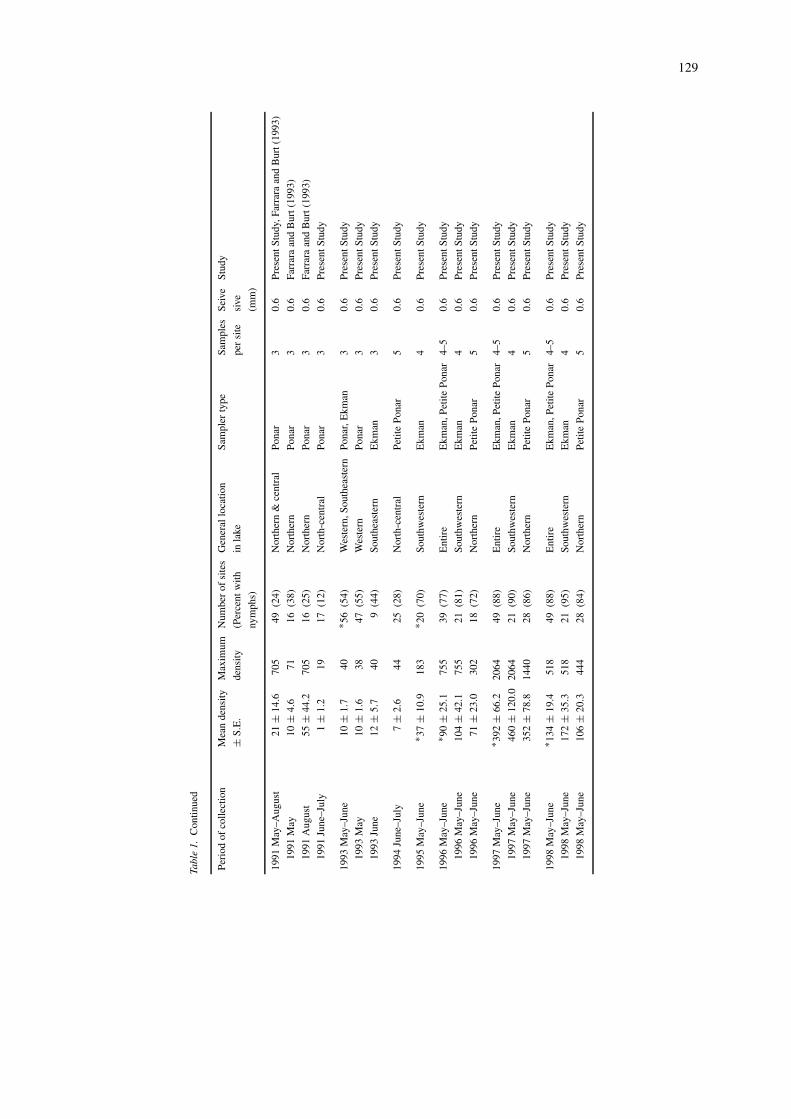
In the 1990s, the distribution and density of mayflynymphs increased dramatically over those observed inthe previous 30 years (1961–1993) and by 1997–1998were greater or similar to those found in 1929–1930(Table 1). Nymphs were distributed at 75–98% ofthe sites between 1929 and 1954, except after ananoxic event in 1953 (48%). After the 1950s, nymphswere absent or rare between 1961 and 1991 whenthey occurred at 0 to 24% of sites. Recolonization ofnymphs began between 1991 when nymphs occurredat 24% of sites and 1993 when they occurred at 54%of sites. Nymphs occurred at only 28% of sites ina north-central portion of the basin in 1994. After1995, nymphs were found at 70% of sites in a south-
128
Tabl
e1.
Inve
ntor
yof
quan
titat
ive
data
ofH
exag
enia
spp.
nym
phs
(min
imum
10si
tes
per
sam
plin
gpr
ogra
m,
App
endi
x1)
inw
este
rnL
ake
Eri
e19
29to
1998
.V
alue
sin
colu
mns
prec
eede
dby
anas
teri
skar
esi
gnifi
cant
lydi
ffer
ent
(P<
0.05
)fr
omth
epr
ecee
ding
valu
e(d
ensi
ties
test
edby
AN
OV
Aus
ing
log (
10)
(X+
1)tr
ansf
orm
atio
nan
dpr
opor
tion
ofsi
tes
with
nym
phs
pres
entt
este
dby
chis
quar
eus
ing
num
ber
ofsi
tes
with
and
with
outn
ymph
spr
esen
t)
Peri
odof
colle
ctio
nM
ean
dens
ityM
axim
umN
umbe
rof
site
sG
ener
allo
catio
nSa
mpl
erty
peSa
mpl
esSe
ive
Stud
y
±S.
E.
dens
ity(P
erce
ntw
ithin
lake
per
site
sive
nym
phs)
(mm
)
1929
June
–Sep
tem
ber
171
±45
.650
813
(85)
Wes
tern
Ekm
an8–
230.
5W
righ
t(19
55a,
b)
1930
June
–Sep
tem
ber
152
±24
.569
267
(75)
Wes
tern
Pete
rsen
1–16
0.5
Wri
ght(
1955
a,b)
1953
Sept
embe
r,N
ovem
ber
∗ 44
±11
.034
0∗ 6
1(4
8)E
aste
rnE
kman
40.
5B
ritt
(195
5b)
1954
Sept
embe
r,N
ovem
ber
∗ 827
±21
5.2
9615
∗ 61
(98)
Eas
tern
Ekm
an4
0.5
Bri
tt(1
955b
)
1961
May
–Jun
e∗ 1
±0.
514
∗ 40
(18)
Nor
thw
este
rnPe
ters
en3
0.5
Car
ran
dH
iltun
en(1
965)
1967
Apr
il–A
ugus
t0
020
(0)
Nor
ther
nPo
nar
30.
6V
eala
ndO
smon
d(1
968)
1973
–197
5A
pril–
Dec
embe
r0
015
(70)
Sout
heas
tern
Pona
r2
0.6
Bri
ttet
al.(
1980
)
1979
May
,Aug
ust,
Oct
ober
2±
0.8
3982
(1)
Ent
ire
Pona
r,Sh
ipek
1–3
0.02
–0.0
6O
ME
(199
1),D
erm
ott(
1994
)
1979
May
2016
(13)
Nor
ther
nPo
nar
30.
6O
ME
(198
1)
1979
Aug
ust
5±
2.8
3916
(19)
Nor
ther
nPo
nar
30.
6O
ME
(199
1)
1979
Oct
ober
1±
0.6
3050
(2)
Ent
ire
Ship
ek1
0.2
Der
mot
t(19
94)
1982
June
7±
4.4
172
∗ 40
(23)
Nor
thw
este
rnPo
nar
30.
6M
anny
and
Schl
oess
er(1
999)
129
Tabl
e1.
Con
tinue
d
Peri
odof
colle
ctio
nM
ean
dens
ityM
axim
umN
umbe
rof
site
sG
ener
allo
catio
nSa
mpl
erty
peSa
mpl
esSe
ive
Stud
y
±S.
E.
dens
ity(P
erce
ntw
ithin
lake
per
site
sive
nym
phs)
(mm
)
1991
May
–Aug
ust
21±
14.6
705
49(2
4)N
orth
ern
&ce
ntra
lPo
nar
30.
6Pr
esen
tStu
dy,F
arra
raan
dB
urt(
1993
)
1991
May
10±
4.6
7116
(38)
Nor
ther
nPo
nar
30.
6Fa
rrar
aan
dB
urt(
1993
)
1991
Aug
ust
55±
44.2
705
16(2
5)N
orth
ern
Pona
r3
0.6
Farr
ara
and
Bur
t(19
93)
1991
June
–Jul
y1
±1.
219
17(1
2)N
orth
-cen
tral
Pona
r3
0.6
Pres
entS
tudy
1993
May
–Jun
e10
±1.
740
∗ 56
(54)
Wes
tern
,Sou
thea
ster
nPo
nar,
Ekm
an3
0.6
Pres
entS
tudy
1993
May
10±
1.6
3847
(55)
Wes
tern
Pona
r3
0.6
Pres
entS
tudy
1993
June
12±
5.7
409
(44)
Sout
heas
tern
Ekm
an3
0.6
Pres
entS
tudy
1994
June
–Jul
y7
±2.
644
25(2
8)N
orth
-cen
tral
Petit
ePo
nar
50.
6Pr
esen
tStu
dy
1995
May
–Jun
e∗ 3
7±
10.9
183
∗ 20
(70)
Sout
hwes
tern
Ekm
an4
0.6
Pres
entS
tudy
1996
May
–Jun
e∗ 9
0±
25.1
755
39(7
7)E
ntir
eE
kman
,Pet
itePo
nar
4–5
0.6
Pres
entS
tudy
1996
May
–Jun
e10
4±
42.1
755
21(8
1)So
uthw
este
rnE
kman
40.
6Pr
esen
tStu
dy
1996
May
–Jun
e71
±23
.030
218
(72)
Nor
ther
nPe
tite
Pona
r5
0.6
Pres
entS
tudy
1997
May
–Jun
e∗ 3
92±
66.2
2064
49(8
8)E
ntir
eE
kman
,Pet
itePo
nar
4–5
0.6
Pres
entS
tudy
1997
May
–Jun
e46
0±
120.
020
6421
(90)
Sout
hwes
tern
Ekm
an4
0.6
Pres
entS
tudy
1997
May
–Jun
e35
2±
78.8
1440
28(8
6)N
orth
ern
Petit
ePo
nar
50.
6Pr
esen
tStu
dy
1998
May
–Jun
e∗ 1
34±
19.4
518
49(8
8)E
ntir
eE
kman
,Pet
itePo
nar
4–5
0.6
Pres
entS
tudy
1998
May
–Jun
e17
2±
35.3
518
21(9
5)So
uthw
este
rnE
kman
40.
6Pr
esen
tStu
dy
1998
May
–Jun
e10
6±
20.3
444
28(8
4)N
orth
ern
Petit
ePo
nar
50.
6Pr
esen
tStu
dy
130
Figure 1. Location of sampling sites in two systematic studies conducted to determine the distribution and abundance of Hexagenia spp. mayflynymphs in western Lake Erie 1995–1998. Samples were collected with an Ekman (squares) and petite Ponar (circles). The two areas containedwithin dashed lines are areas where low densities of nymphs persisted in the 1990s (see Table 2).
western portion. In 1996–1998, basin-wide samplingrevealed that nymphs were found at 77% of sitesin 1996 and 88% in 1997 and 1998. Increases innymph densities over time followed the same patternas observed for the distribution of nymphs, exceptbetween 1997 and 1998 when densities decreased 3-fold but no change was observed in the distributionof nymphs. Density changes between 1993–1994 and1995 and successive years between 1995 and 1998were significantly different (Table 1, P < 0.01).
Although regional differences in the abundance ofnymphs are difficult to determine due to inconsistent
sampling programs and prolonged absence of nymphsfrom most areas during a 30-year period, analysesof data from nearshore (<7.5 km from shore) andoffshore (>7.5 km from shore) waters indicate that theabundance of nymphs in the 1990s is different thanhistorically found in western Lake Erie (Figure 2).Between 1929 and 1954, abundance of nymphs washigher in offshore than nearshore waters, except in1953 when an anoxic event occurred. Nymphs wereabsent or rare in both offshore and nearshore watersbetween 1961 and 1975. Although rare in occurrence,nymphs returned to nearshore waters in 1979 (13% of
131
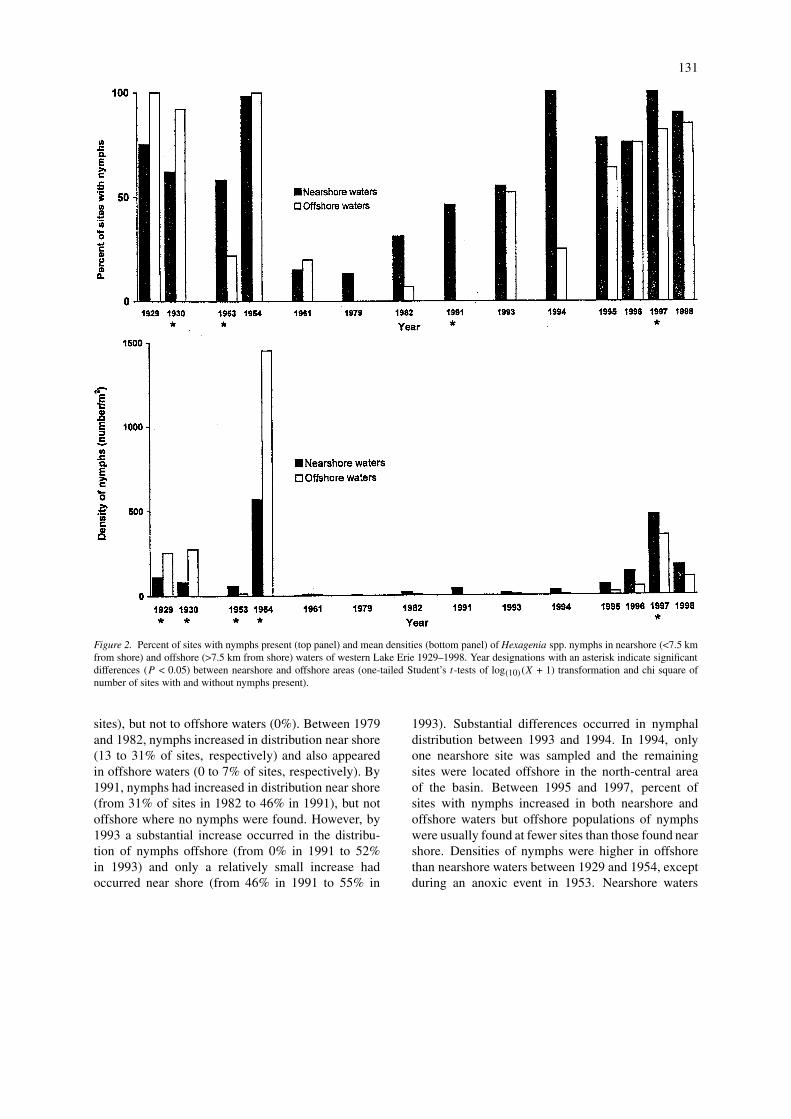
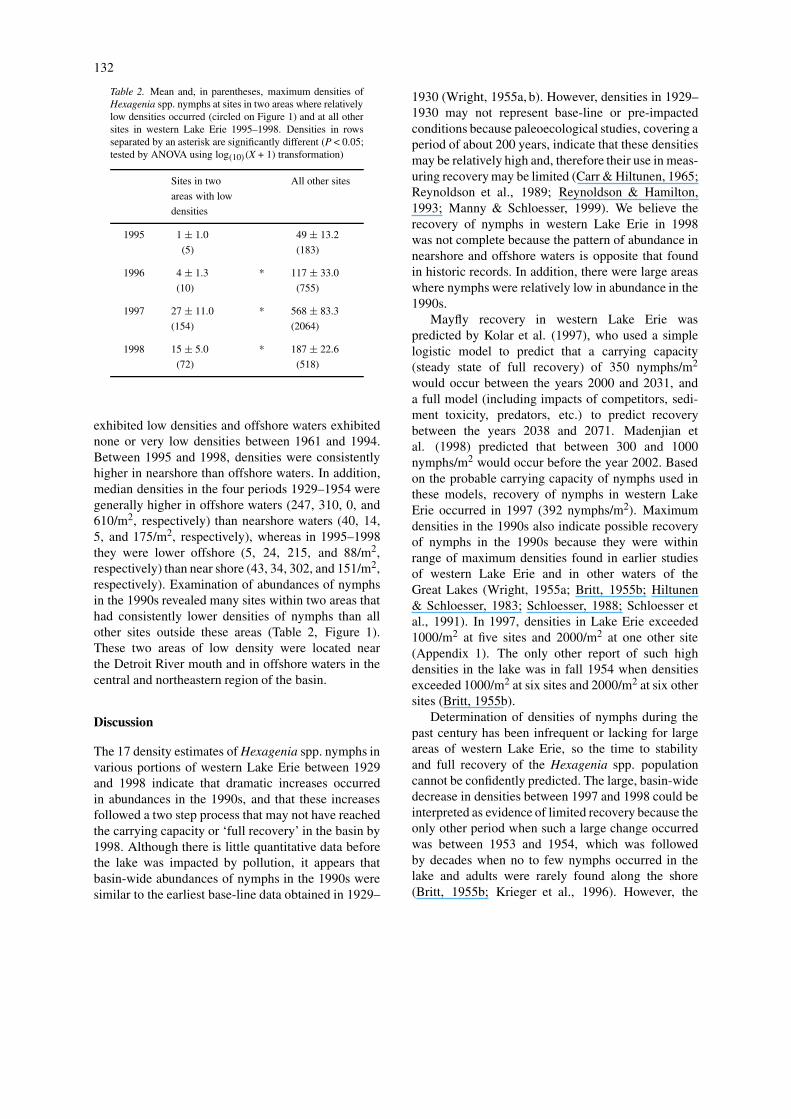
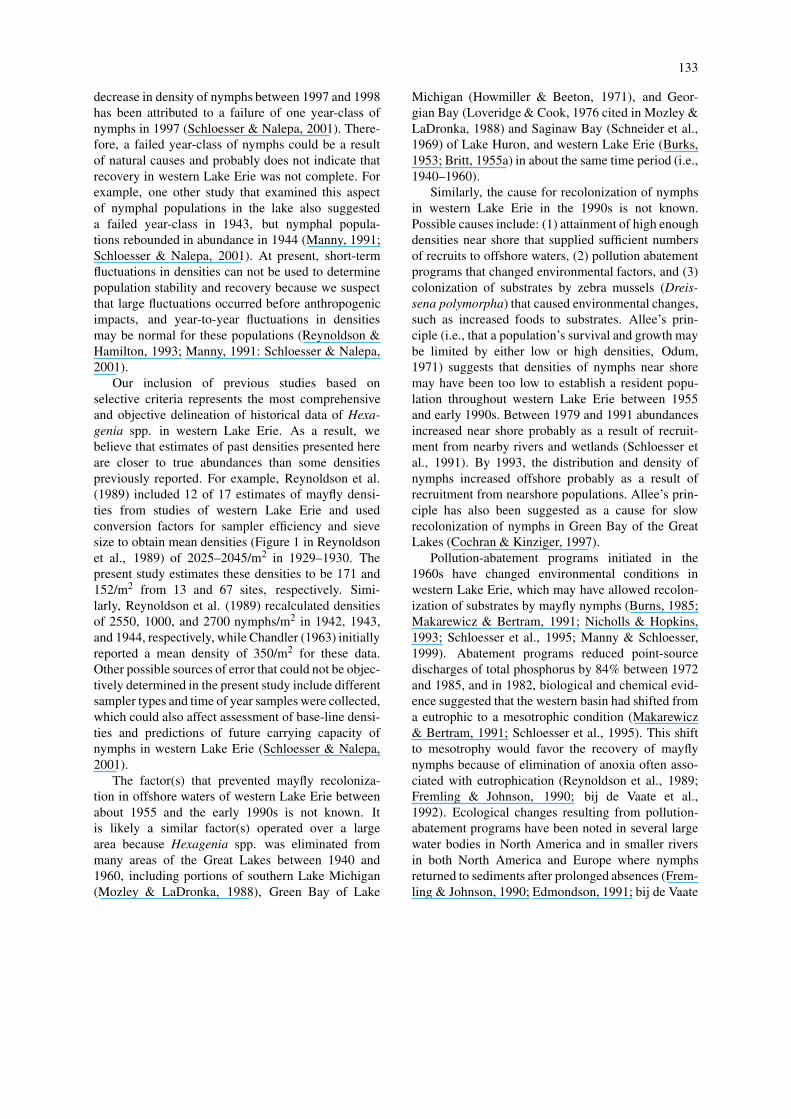
Figure 2. Percent of sites with nymphs present (top panel) and mean densities (bottom panel) of Hexagenia spp. nymphs in nearshore (<7.5 kmfrom shore) and offshore (>7.5 km from shore) waters of western Lake Erie 1929–1998. Year designations with an asterisk indicate significantdifferences (P < 0.05) between nearshore and offshore areas (one-tailed Student’s t-tests of log(10)(X + 1) transformation and chi square ofnumber of sites with and without nymphs present).
sites), but not to offshore waters (0%). Between 1979and 1982, nymphs increased in distribution near shore(13 to 31% of sites, respectively) and also appearedin offshore waters (0 to 7% of sites, respectively). By1991, nymphs had increased in distribution near shore(from 31% of sites in 1982 to 46% in 1991), but notoffshore where no nymphs were found. However, by1993 a substantial increase occurred in the distribu-tion of nymphs offshore (from 0% in 1991 to 52%in 1993) and only a relatively small increase hadoccurred near shore (from 46% in 1991 to 55% in
1993). Substantial differences occurred in nymphaldistribution between 1993 and 1994. In 1994, onlyone nearshore site was sampled and the remainingsites were located offshore in the north-central areaof the basin. Between 1995 and 1997, percent ofsites with nymphs increased in both nearshore andoffshore waters but offshore populations of nymphswere usually found at fewer sites than those found nearshore. Densities of nymphs were higher in offshorethan nearshore waters between 1929 and 1954, exceptduring an anoxic event in 1953. Nearshore waters
132
Table 2. Mean and, in parentheses, maximum densities ofHexagenia spp. nymphs at sites in two areas where relativelylow densities occurred (circled on Figure 1) and at all othersites in western Lake Erie 1995–1998. Densities in rowsseparated by an asterisk are significantly different (P < 0.05;tested by ANOVA using log(10)(X + 1) transformation)
Sites in two All other sites
areas with low
densities
1995 1 ± 1.0 49 ± 13.2
(5) (183)
1996 4 ± 1.3 * 117 ± 33.0
(10) (755)
1997 27 ± 11.0 * 568 ± 83.3
(154) (2064)
1998 15 ± 5.0 * 187 ± 22.6
(72) (518)
exhibited low densities and offshore waters exhibitednone or very low densities between 1961 and 1994.Between 1995 and 1998, densities were consistentlyhigher in nearshore than offshore waters. In addition,median densities in the four periods 1929–1954 weregenerally higher in offshore waters (247, 310, 0, and610/m2, respectively) than nearshore waters (40, 14,5, and 175/m2, respectively), whereas in 1995–1998they were lower offshore (5, 24, 215, and 88/m2,respectively) than near shore (43, 34, 302, and 151/m2,respectively). Examination of abundances of nymphsin the 1990s revealed many sites within two areas thathad consistently lower densities of nymphs than allother sites outside these areas (Table 2, Figure 1).These two areas of low density were located nearthe Detroit River mouth and in offshore waters in thecentral and northeastern region of the basin.
Discussion
The 17 density estimates of Hexagenia spp. nymphs invarious portions of western Lake Erie between 1929and 1998 indicate that dramatic increases occurredin abundances in the 1990s, and that these increasesfollowed a two step process that may not have reachedthe carrying capacity or ‘full recovery’ in the basin by1998. Although there is little quantitative data beforethe lake was impacted by pollution, it appears thatbasin-wide abundances of nymphs in the 1990s weresimilar to the earliest base-line data obtained in 1929–
1930 (Wright, 1955a, b). However, densities in 1929–1930 may not represent base-line or pre-impactedconditions because paleoecological studies, covering aperiod of about 200 years, indicate that these densitiesmay be relatively high and, therefore their use in meas-uring recovery may be limited (Carr & Hiltunen, 1965;Reynoldson et al., 1989; Reynoldson & Hamilton,1993; Manny & Schloesser, 1999). We believe therecovery of nymphs in western Lake Erie in 1998was not complete because the pattern of abundance innearshore and offshore waters is opposite that foundin historic records. In addition, there were large areaswhere nymphs were relatively low in abundance in the1990s.
Mayfly recovery in western Lake Erie waspredicted by Kolar et al. (1997), who used a simplelogistic model to predict that a carrying capacity(steady state of full recovery) of 350 nymphs/m2
would occur between the years 2000 and 2031, anda full model (including impacts of competitors, sedi-ment toxicity, predators, etc.) to predict recoverybetween the years 2038 and 2071. Madenjian etal. (1998) predicted that between 300 and 1000nymphs/m2 would occur before the year 2002. Basedon the probable carrying capacity of nymphs used inthese models, recovery of nymphs in western LakeErie occurred in 1997 (392 nymphs/m2). Maximumdensities in the 1990s also indicate possible recoveryof nymphs in the 1990s because they were withinrange of maximum densities found in earlier studiesof western Lake Erie and in other waters of theGreat Lakes (Wright, 1955a; Britt, 1955b; Hiltunen& Schloesser, 1983; Schloesser, 1988; Schloesser etal., 1991). In 1997, densities in Lake Erie exceeded1000/m2 at five sites and 2000/m2 at one other site(Appendix 1). The only other report of such highdensities in the lake was in fall 1954 when densitiesexceeded 1000/m2 at six sites and 2000/m2 at six othersites (Britt, 1955b).
Determination of densities of nymphs during thepast century has been infrequent or lacking for largeareas of western Lake Erie, so the time to stabilityand full recovery of the Hexagenia spp. populationcannot be confidently predicted. The large, basin-widedecrease in densities between 1997 and 1998 could beinterpreted as evidence of limited recovery because theonly other period when such a large change occurredwas between 1953 and 1954, which was followedby decades when no to few nymphs occurred in thelake and adults were rarely found along the shore(Britt, 1955b; Krieger et al., 1996). However, the
133
decrease in density of nymphs between 1997 and 1998has been attributed to a failure of one year-class ofnymphs in 1997 (Schloesser & Nalepa, 2001). There-fore, a failed year-class of nymphs could be a resultof natural causes and probably does not indicate thatrecovery in western Lake Erie was not complete. Forexample, one other study that examined this aspectof nymphal populations in the lake also suggesteda failed year-class in 1943, but nymphal popula-tions rebounded in abundance in 1944 (Manny, 1991;Schloesser & Nalepa, 2001). At present, short-termfluctuations in densities can not be used to determinepopulation stability and recovery because we suspectthat large fluctuations occurred before anthropogenicimpacts, and year-to-year fluctuations in densitiesmay be normal for these populations (Reynoldson &Hamilton, 1993; Manny, 1991: Schloesser & Nalepa,2001).
Our inclusion of previous studies based onselective criteria represents the most comprehensiveand objective delineation of historical data of Hexa-genia spp. in western Lake Erie. As a result, webelieve that estimates of past densities presented hereare closer to true abundances than some densitiespreviously reported. For example, Reynoldson et al.(1989) included 12 of 17 estimates of mayfly densi-ties from studies of western Lake Erie and usedconversion factors for sampler efficiency and sievesize to obtain mean densities (Figure 1 in Reynoldsonet al., 1989) of 2025–2045/m2 in 1929–1930. Thepresent study estimates these densities to be 171 and152/m2 from 13 and 67 sites, respectively. Simi-larly, Reynoldson et al. (1989) recalculated densitiesof 2550, 1000, and 2700 nymphs/m2 in 1942, 1943,and 1944, respectively, while Chandler (1963) initiallyreported a mean density of 350/m2 for these data.Other possible sources of error that could not be objec-tively determined in the present study include differentsampler types and time of year samples were collected,which could also affect assessment of base-line densi-ties and predictions of future carrying capacity ofnymphs in western Lake Erie (Schloesser & Nalepa,2001).
The factor(s) that prevented mayfly recoloniza-tion in offshore waters of western Lake Erie betweenabout 1955 and the early 1990s is not known. Itis likely a similar factor(s) operated over a largearea because Hexagenia spp. was eliminated frommany areas of the Great Lakes between 1940 and1960, including portions of southern Lake Michigan(Mozley & LaDronka, 1988), Green Bay of Lake
Michigan (Howmiller & Beeton, 1971), and Geor-gian Bay (Loveridge & Cook, 1976 cited in Mozley &LaDronka, 1988) and Saginaw Bay (Schneider et al.,1969) of Lake Huron, and western Lake Erie (Burks,1953; Britt, 1955a) in about the same time period (i.e.,1940–1960).
Similarly, the cause for recolonization of nymphsin western Lake Erie in the 1990s is not known.Possible causes include: (1) attainment of high enoughdensities near shore that supplied sufficient numbersof recruits to offshore waters, (2) pollution abatementprograms that changed environmental factors, and (3)colonization of substrates by zebra mussels (Dreis-sena polymorpha) that caused environmental changes,such as increased foods to substrates. Allee’s prin-ciple (i.e., that a population’s survival and growth maybe limited by either low or high densities, Odum,1971) suggests that densities of nymphs near shoremay have been too low to establish a resident popu-lation throughout western Lake Erie between 1955and early 1990s. Between 1979 and 1991 abundancesincreased near shore probably as a result of recruit-ment from nearby rivers and wetlands (Schloesser etal., 1991). By 1993, the distribution and density ofnymphs increased offshore probably as a result ofrecruitment from nearshore populations. Allee’s prin-ciple has also been suggested as a cause for slowrecolonization of nymphs in Green Bay of the GreatLakes (Cochran & Kinziger, 1997).
Pollution-abatement programs initiated in the1960s have changed environmental conditions inwestern Lake Erie, which may have allowed recolon-ization of substrates by mayfly nymphs (Burns, 1985;Makarewicz & Bertram, 1991; Nicholls & Hopkins,1993; Schloesser et al., 1995; Manny & Schloesser,1999). Abatement programs reduced point-sourcedischarges of total phosphorus by 84% between 1972and 1985, and in 1982, biological and chemical evid-ence suggested that the western basin had shifted froma eutrophic to a mesotrophic condition (Makarewicz& Bertram, 1991; Schloesser et al., 1995). This shiftto mesotrophy would favor the recovery of mayflynymphs because of elimination of anoxia often asso-ciated with eutrophication (Reynoldson et al., 1989;Fremling & Johnson, 1990; bij de Vaate et al.,1992). Ecological changes resulting from pollution-abatement programs have been noted in several largewater bodies in North America and in smaller riversin both North America and Europe where nymphsreturned to sediments after prolonged absences (Frem-ling & Johnson, 1990; Edmondson, 1991; bij de Vaate
134
et al., 1992; Lathrop, 1992). However, if conditionswere favorable for mayflies in western Lake Erie, thereappearance of nymphs would have been expectedto occur soon after mesotrophic conditions occurredin western Lake Erie (i.e., early 1980s). Expectationof a rapid recovery of nymphs is supported by thespeed at which increased densities of nymphs occurredin Lake Erie between 1953 and 1954, at two sitesin fall 1991, and at many sites between 1991 and1997 and in the Mississippi River between 1982 and1986 (Fremling & Johnson, 1990). Mean densities ofnymphs increased 15-fold between 1953 and 1954 inoffshore waters of the lake. In 1991, Farrara and Burt(1993) showed that mayfly densities increased 5-foldbetween May and September near shore and 10-foldat two sites (sites 321 and 323, Appendix 1) near theDetroit River. In the 1990s, a 10-fold increase in densi-ties occurred between 1995 and 1997 throughout thebasin. In a portion of the Mississippi River, Hexa-genia spp. were eliminated in 1930 due to depletionof oxygen (Fremling & Johnson, 1990). Few mayflieswere found between 1930 and the late 1960s whenpollution-control programs were initiated. Pollutiondischarges into the river leveled off in 1982. By 1986,emerging mayflies were abundant enough to causenuisance problems along the shores. In western LakeErie, phosphorus loadings leveled off about 1982, butmayflies did not begin to return to sediments until1993. At minimum, pollution-abatement programsimproved environmental conditions in western LakeErie so that once nymphs did colonize sedimentsthey were not extirpated by harsh conditions, such asanoxia.
Colonization and explosive increase in abundanceof zebra mussels in western Lake Erie in 1989 mayhave contributed to the speed at which nymphs recol-onized sediments in the 1990s (Hebert et al., 1989;Griffiths et al., 1991; Schloesser & Kovalak, 1991;Nalepa & Schloesser, 1993; Krieger et al., 1996).Rapid changes in water characteristics and benthicfauna of western Lake Erie have been associated withand attributed to impacts of zebra mussels (Nalepa& Schloesser, 1993; Schloesser & Nalepa, 1994;Madenjian, 1995; MacIsaac, 1996; Schloesser etal., 1997). In 1989, densities of zebra mussels inwestern Lake Erie were the highest ever recorded(up to 350 000/m2) and by 1995, mussels coveredabout 10% of all available substrates (Schloesser& Kovalak, 1991; Nalepa & Schloesser, 1993;Berkman et al., 1998). High densities, combinedwith the mussels’ ability to remove particulates (e.g.,
sediments, phytoplankton, and small zooplankton)from the water column and deposit the material onsubstrates, delivered substantial amounts of nutri-ents and food energy to benthic populations withina shorter period of time (up to 35% of availableplankton per day, Bunt et al., 1993; Madenjian,1995) than would be expected if zebra mussels werenot present (Wisniewski, 1990; Nicholls & Hopkins,1993; Madenjian, 1995; MacIsaac, 1996). The abilityof zebra mussels to remove suspended particulateshas been used as a management tool to de-eutrophypolluted water in Europe (Reeders & bij de Vaate,1990; Reeders et al., 1993). In North America, theinvasion of zebra mussels has been accompanied byan increase in diversity of macrobenthos, especiallythose taxa that are relatively intolerant of organicpollution (e.g., snails, amphipods, caddisflies, andmayflies) (Dermott et al., 1993; Griffiths, 1993;Stewart & Haynes, 1994; Botts et al., 1996). In addi-tion, Karatayev et al. (1997), who summarized 60years of research on the impacts of zebra musselsin eastern Europe, reported that in general, benthiccommunities in the presence of zebra mussels arecomposed of larger-sized species than communities inthe absence of zebra mussels. The return of one ofthe largest benthic forms (Hexagenia spp.) in westernLake Erie occurred shortly after increased abundanceof zebra mussels.
There is also evidence that Hexagenia spp. isreturning to other areas of the Great Lakes in the 1990s(e.g., Cochran, 1992). Adult mayflies have been foundannually since 1991 near the lower Fox River of GreenBay, Lake Michigan (Cochran, 1992; Cochran &Kinziger, 1997). Small swarms of adult mayflies werealso found along the shores of the central and easternbasins of Lake Erie in the mid 1990s (personal obser-vations, DWS, KAK, and LDC). Exuviae (nymphalskins) were observed in the Bay of Quinte in easternLake Ontario in 1996 (personal communication., R.Dermott, Fisheries and Oceans, Burlington, Ontario).Swarms of adults occurred near shore in northernSaginaw Bay, Lake Huron between 1994 and 1996(personal communication, D. Stewart, State Univer-sity of New York, Syracuse, New York). Similar towestern Lake Erie, we do not know what is allowingrecolonization of mayflies in other areas of the GreatLakes, but it is likely that the impacts of pollutionabatement and zebra mussels, which colonized watersone or more years before nymphs recolonized theseareas of the Great Lakes, are contributing factors(Cochran, 1992; Cochran & Kinziger, 1997).
135
Conclusions
The return of nymphs to much of western Lake Erieis a historical event in the Great Lakes. The causefor recolonization in the lake is unknown but isprimarily attributed to pollution-abatement programsand rapid ecological changes brought about by theexotic zebra mussel, Dreissena polymorpha. It is prob-able that the recovery of nymphs in western LakeErie was not complete in 1995–1998 because abund-ances of nymphs in nearshore and offshore waterswere different than that historically found in the lake,and there still existed large portions of offshore waterswhere nymphs were absent or low in abundance in the1990s. Although little evidence exists, we suspect thatthe cause for low abundances of nymphs in some areasin the 1990s was low dissolved oxygen caused by highsediment oxygen demand of settling plankton and/orresidual organic carbon in sediments as a result ofanthropogenic inputs into the lake prior to the 1980s.The density of burrowing mayfly nymphs could beused to monitor large areas in the Great Lakes wherenymphs potentially may recolonize sediments (Cairns,1974; Mozley & LaDronka, 1988; Schloesser, 1988;Schloesser et al., 1991). Such an indicator organismhas been used in other water bodies of the world,such as in the rivers Meuse and Rhine in The Neth-erlands (bij de Vaate et al., 1992), where recoloniza-tion of substrates by similar Ephemeroptera nymphs(Ephoron virgo) parallels that observed for Hexageniaspp. nymphs in western Lake Erie of the LaurentianGreat Lakes.
Acknowledgments
This article is Contribution Number 1136 of theU.S. Geological Survey, Great Lakes Science Center,Ann Arbor, Michigan. Work was supported by theOhio Lake Erie Protection Fund (Grants LEPF-08-94and LEPF-97-30), Ohio Sea Grant Program (GrantNA90AA-D-SG496, Project R/ER-26-PD), Univer-sity of Windsor, the Great Lakes Science Center, theNatural Sciences and Engineering Research Councilof Canada (JJHC and LDC), the Great Lakes Univer-sity Research Fund (JJHC and LDC), and the OntarioEnvironmental Youth Corps Program (JJHC andLDC).
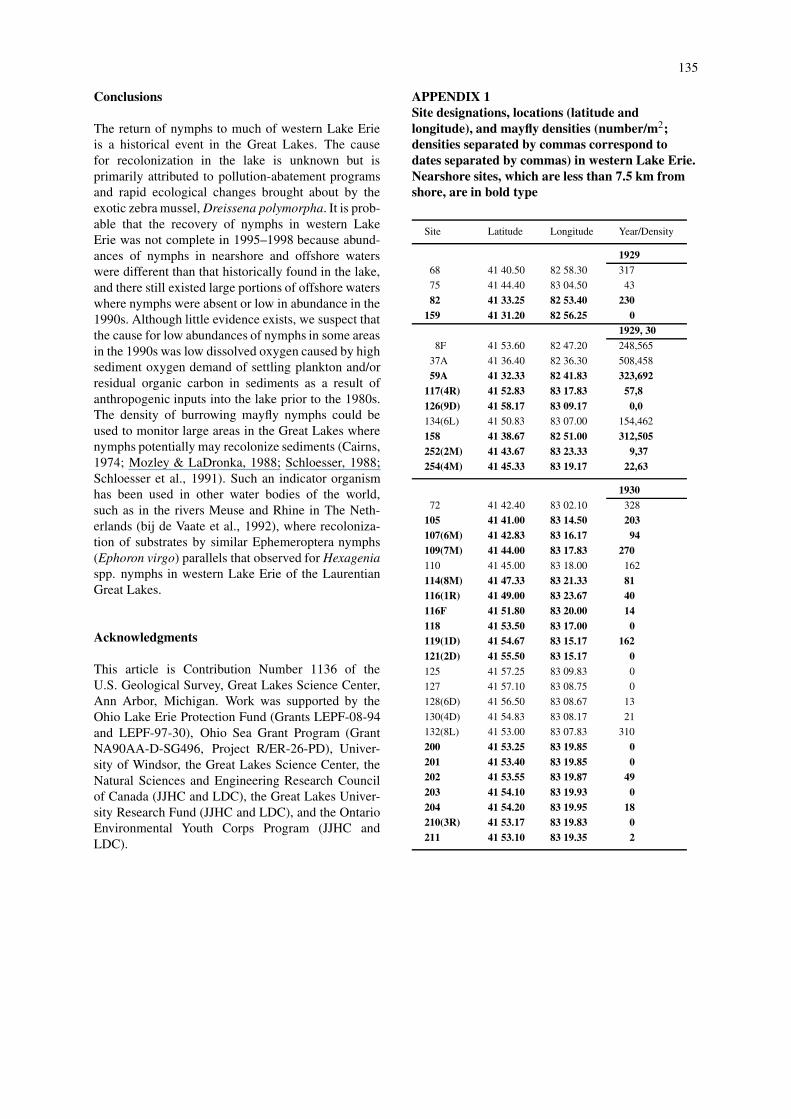
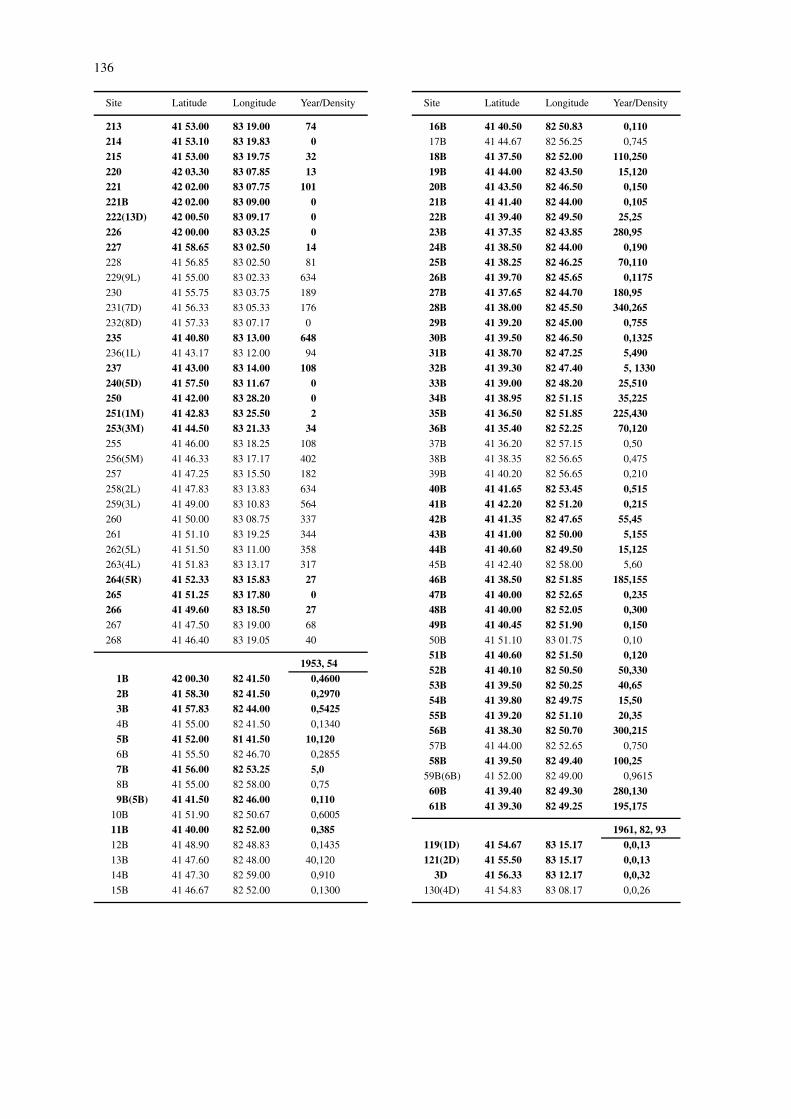
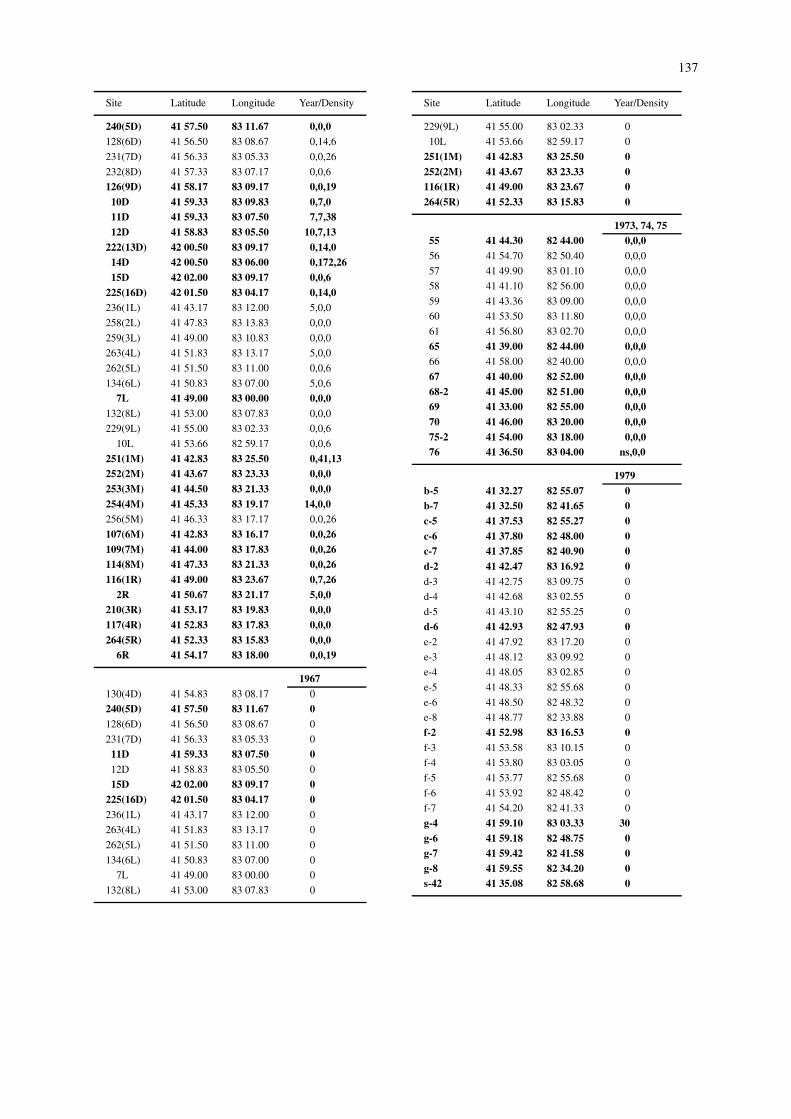
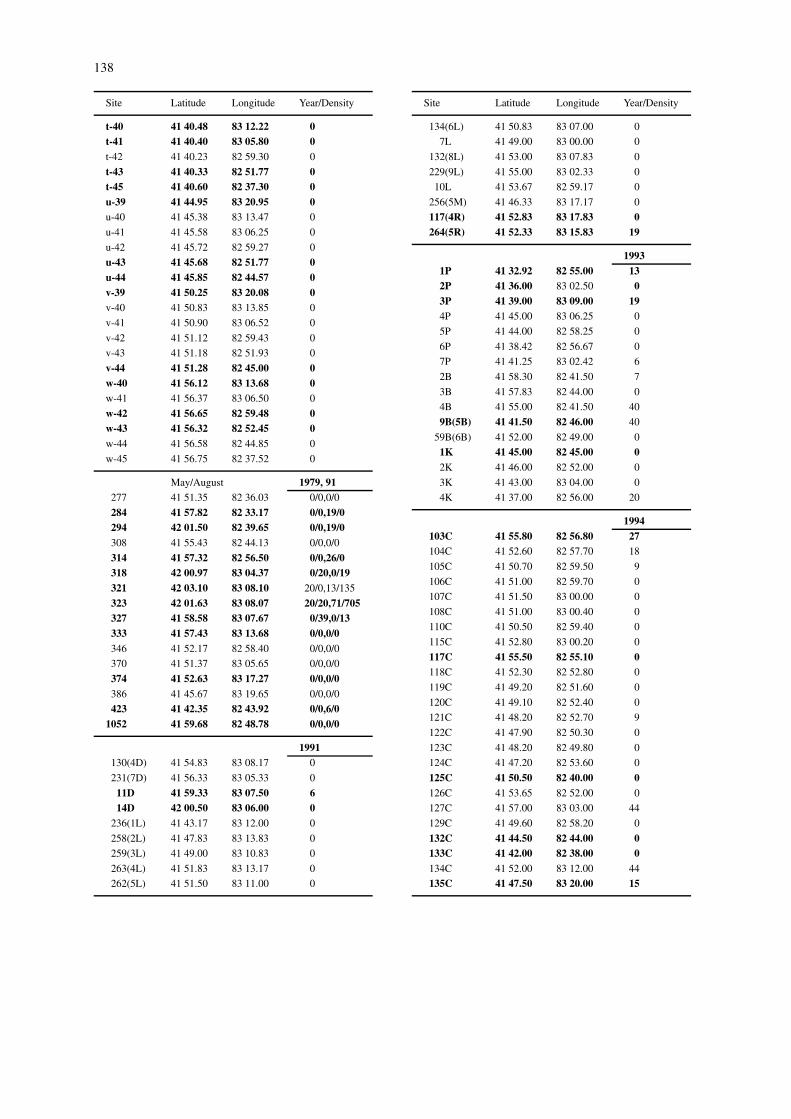
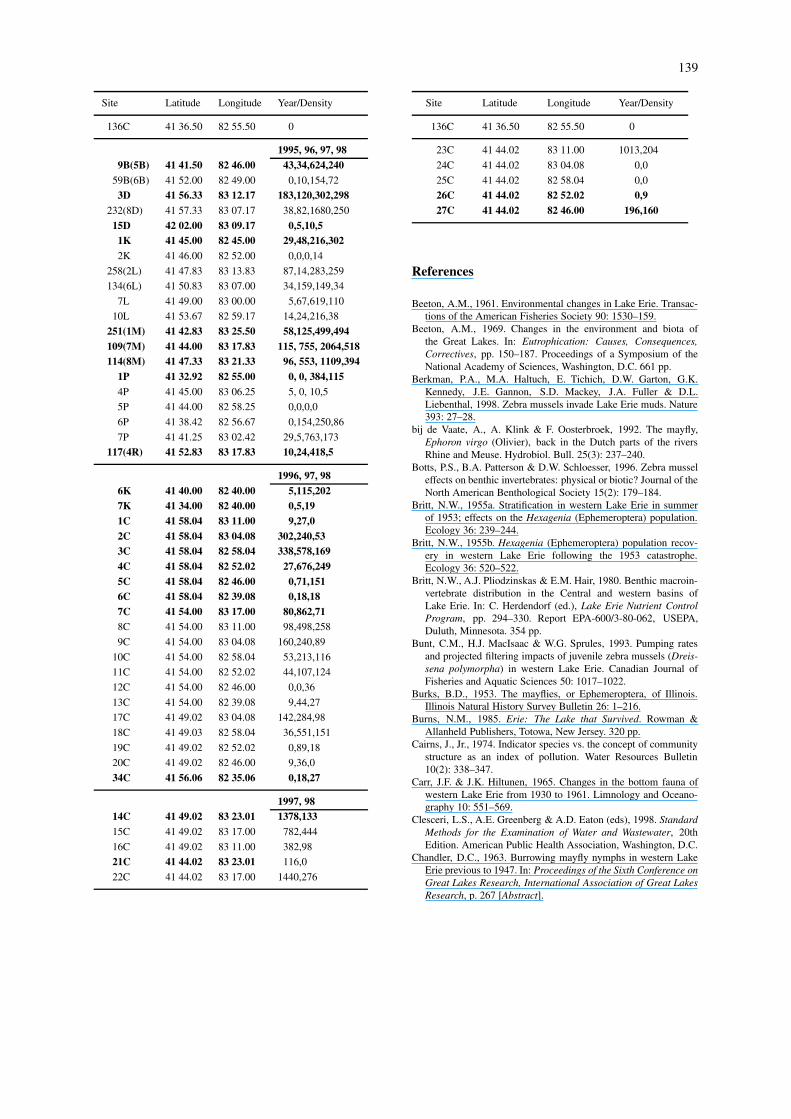
APPENDIX 1Site designations, locations (latitude andlongitude), and mayfly densities (number/m2;densities separated by commas correspond todates separated by commas) in western Lake Erie.Nearshore sites, which are less than 7.5 km fromshore, are in bold type
Site Latitude Longitude Year/Density
192968 41 40.50 82 58.30 317
75 41 44.40 83 04.50 43
82 41 33.25 82 53.40 230159 41 31.20 82 56.25 0
1929, 308F 41 53.60 82 47.20 248,565
37A 41 36.40 82 36.30 508,458
59A 41 32.33 82 41.83 323,692117(4R) 41 52.83 83 17.83 57,8126(9D) 41 58.17 83 09.17 0,0134(6L) 41 50.83 83 07.00 154,462
158 41 38.67 82 51.00 312,505252(2M) 41 43.67 83 23.33 9,37254(4M) 41 45.33 83 19.17 22,63
193072 41 42.40 83 02.10 328
105 41 41.00 83 14.50 203107(6M) 41 42.83 83 16.17 94109(7M) 41 44.00 83 17.83 270110 41 45.00 83 18.00 162
114(8M) 41 47.33 83 21.33 81116(1R) 41 49.00 83 23.67 40116F 41 51.80 83 20.00 14118 41 53.50 83 17.00 0119(1D) 41 54.67 83 15.17 162121(2D) 41 55.50 83 15.17 0125 41 57.25 83 09.83 0
127 41 57.10 83 08.75 0
128(6D) 41 56.50 83 08.67 13
130(4D) 41 54.83 83 08.17 21
132(8L) 41 53.00 83 07.83 310
200 41 53.25 83 19.85 0201 41 53.40 83 19.85 0202 41 53.55 83 19.87 49203 41 54.10 83 19.93 0204 41 54.20 83 19.95 18210(3R) 41 53.17 83 19.83 0211 41 53.10 83 19.35 2
136
Site Latitude Longitude Year/Density
213 41 53.00 83 19.00 74214 41 53.10 83 19.83 0215 41 53.00 83 19.75 32220 42 03.30 83 07.85 13221 42 02.00 83 07.75 101221B 42 02.00 83 09.00 0222(13D) 42 00.50 83 09.17 0226 42 00.00 83 03.25 0227 41 58.65 83 02.50 14228 41 56.85 83 02.50 81
229(9L) 41 55.00 83 02.33 634
230 41 55.75 83 03.75 189
231(7D) 41 56.33 83 05.33 176
232(8D) 41 57.33 83 07.17 0
235 41 40.80 83 13.00 648236(1L) 41 43.17 83 12.00 94
237 41 43.00 83 14.00 108240(5D) 41 57.50 83 11.67 0250 41 42.00 83 28.20 0251(1M) 41 42.83 83 25.50 2253(3M) 41 44.50 83 21.33 34255 41 46.00 83 18.25 108
256(5M) 41 46.33 83 17.17 402
257 41 47.25 83 15.50 182
258(2L) 41 47.83 83 13.83 634
259(3L) 41 49.00 83 10.83 564
260 41 50.00 83 08.75 337
261 41 51.10 83 19.25 344
262(5L) 41 51.50 83 11.00 358
263(4L) 41 51.83 83 13.17 317
264(5R) 41 52.33 83 15.83 27265 41 51.25 83 17.80 0266 41 49.60 83 18.50 27267 41 47.50 83 19.00 68
268 41 46.40 83 19.05 40
1953, 541B 42 00.30 82 41.50 0,46002B 41 58.30 82 41.50 0,29703B 41 57.83 82 44.00 0,54254B 41 55.00 82 41.50 0,1340
5B 41 52.00 81 41.50 10,1206B 41 55.50 82 46.70 0,2855
7B 41 56.00 82 53.25 5,08B 41 55.00 82 58.00 0,75
9B(5B) 41 41.50 82 46.00 0,11010B 41 51.90 82 50.67 0,6005
11B 41 40.00 82 52.00 0,38512B 41 48.90 82 48.83 0,1435
13B 41 47.60 82 48.00 40,120
14B 41 47.30 82 59.00 0,910
15B 41 46.67 82 52.00 0,1300
Site Latitude Longitude Year/Density
16B 41 40.50 82 50.83 0,11017B 41 44.67 82 56.25 0,745
18B 41 37.50 82 52.00 110,25019B 41 44.00 82 43.50 15,12020B 41 43.50 82 46.50 0,15021B 41 41.40 82 44.00 0,10522B 41 39.40 82 49.50 25,2523B 41 37.35 82 43.85 280,9524B 41 38.50 82 44.00 0,19025B 41 38.25 82 46.25 70,11026B 41 39.70 82 45.65 0,117527B 41 37.65 82 44.70 180,9528B 41 38.00 82 45.50 340,26529B 41 39.20 82 45.00 0,75530B 41 39.50 82 46.50 0,132531B 41 38.70 82 47.25 5,49032B 41 39.30 82 47.40 5, 133033B 41 39.00 82 48.20 25,51034B 41 38.95 82 51.15 35,22535B 41 36.50 82 51.85 225,43036B 41 35.40 82 52.25 70,12037B 41 36.20 82 57.15 0,50
38B 41 38.35 82 56.65 0,475
39B 41 40.20 82 56.65 0,210
40B 41 41.65 82 53.45 0,51541B 41 42.20 82 51.20 0,21542B 41 41.35 82 47.65 55,4543B 41 41.00 82 50.00 5,15544B 41 40.60 82 49.50 15,12545B 41 42.40 82 58.00 5,60
46B 41 38.50 82 51.85 185,15547B 41 40.00 82 52.65 0,23548B 41 40.00 82 52.05 0,30049B 41 40.45 82 51.90 0,15050B 41 51.10 83 01.75 0,10
51B 41 40.60 82 51.50 0,12052B 41 40.10 82 50.50 50,33053B 41 39.50 82 50.25 40,6554B 41 39.80 82 49.75 15,5055B 41 39.20 82 51.10 20,3556B 41 38.30 82 50.70 300,21557B 41 44.00 82 52.65 0,750
58B 41 39.50 82 49.40 100,2559B(6B) 41 52.00 82 49.00 0,9615
60B 41 39.40 82 49.30 280,13061B 41 39.30 82 49.25 195,175
1961, 82, 93119(1D) 41 54.67 83 15.17 0,0,13121(2D) 41 55.50 83 15.17 0,0,13
3D 41 56.33 83 12.17 0,0,32130(4D) 41 54.83 83 08.17 0,0,26
137
Site Latitude Longitude Year/Density
240(5D) 41 57.50 83 11.67 0,0,0128(6D) 41 56.50 83 08.67 0,14,6
231(7D) 41 56.33 83 05.33 0,0,26
232(8D) 41 57.33 83 07.17 0,0,6
126(9D) 41 58.17 83 09.17 0,0,1910D 41 59.33 83 09.83 0,7,011D 41 59.33 83 07.50 7,7,3812D 41 58.83 83 05.50 10,7,13
222(13D) 42 00.50 83 09.17 0,14,014D 42 00.50 83 06.00 0,172,2615D 42 02.00 83 09.17 0,0,6
225(16D) 42 01.50 83 04.17 0,14,0236(1L) 41 43.17 83 12.00 5,0,0
258(2L) 41 47.83 83 13.83 0,0,0
259(3L) 41 49.00 83 10.83 0,0,0
263(4L) 41 51.83 83 13.17 5,0,0
262(5L) 41 51.50 83 11.00 0,0,6
134(6L) 41 50.83 83 07.00 5,0,6
7L 41 49.00 83 00.00 0,0,0132(8L) 41 53.00 83 07.83 0,0,0
229(9L) 41 55.00 83 02.33 0,0,6
10L 41 53.66 82 59.17 0,0,6
251(1M) 41 42.83 83 25.50 0,41,13252(2M) 41 43.67 83 23.33 0,0,0253(3M) 41 44.50 83 21.33 0,0,0254(4M) 41 45.33 83 19.17 14,0,0256(5M) 41 46.33 83 17.17 0,0,26
107(6M) 41 42.83 83 16.17 0,0,26109(7M) 41 44.00 83 17.83 0,0,26114(8M) 41 47.33 83 21.33 0,0,26116(1R) 41 49.00 83 23.67 0,7,26
2R 41 50.67 83 21.17 5,0,0210(3R) 41 53.17 83 19.83 0,0,0117(4R) 41 52.83 83 17.83 0,0,0264(5R) 41 52.33 83 15.83 0,0,0
6R 41 54.17 83 18.00 0,0,19
1967130(4D) 41 54.83 83 08.17 0
240(5D) 41 57.50 83 11.67 0128(6D) 41 56.50 83 08.67 0
231(7D) 41 56.33 83 05.33 0
11D 41 59.33 83 07.50 012D 41 58.83 83 05.50 0
15D 42 02.00 83 09.17 0225(16D) 42 01.50 83 04.17 0236(1L) 41 43.17 83 12.00 0
263(4L) 41 51.83 83 13.17 0
262(5L) 41 51.50 83 11.00 0
134(6L) 41 50.83 83 07.00 0
7L 41 49.00 83 00.00 0
132(8L) 41 53.00 83 07.83 0
Site Latitude Longitude Year/Density
229(9L) 41 55.00 83 02.33 0
10L 41 53.66 82 59.17 0
251(1M) 41 42.83 83 25.50 0252(2M) 41 43.67 83 23.33 0116(1R) 41 49.00 83 23.67 0264(5R) 41 52.33 83 15.83 0
1973, 74, 7555 41 44.30 82 44.00 0,0,056 41 54.70 82 50.40 0,0,0
57 41 49.90 83 01.10 0,0,0
58 41 41.10 82 56.00 0,0,0
59 41 43.36 83 09.00 0,0,0
60 41 53.50 83 11.80 0,0,0
61 41 56.80 83 02.70 0,0,0
65 41 39.00 82 44.00 0,0,066 41 58.00 82 40.00 0,0,0
67 41 40.00 82 52.00 0,0,068-2 41 45.00 82 51.00 0,0,069 41 33.00 82 55.00 0,0,070 41 46.00 83 20.00 0,0,075-2 41 54.00 83 18.00 0,0,076 41 36.50 83 04.00 ns,0,0
1979b-5 41 32.27 82 55.07 0b-7 41 32.50 82 41.65 0c-5 41 37.53 82 55.27 0c-6 41 37.80 82 48.00 0c-7 41 37.85 82 40.90 0d-2 41 42.47 83 16.92 0d-3 41 42.75 83 09.75 0
d-4 41 42.68 83 02.55 0
d-5 41 43.10 82 55.25 0
d-6 41 42.93 82 47.93 0e-2 41 47.92 83 17.20 0
e-3 41 48.12 83 09.92 0
e-4 41 48.05 83 02.85 0
e-5 41 48.33 82 55.68 0
e-6 41 48.50 82 48.32 0
e-8 41 48.77 82 33.88 0
f-2 41 52.98 83 16.53 0f-3 41 53.58 83 10.15 0
f-4 41 53.80 83 03.05 0
f-5 41 53.77 82 55.68 0
f-6 41 53.92 82 48.42 0
f-7 41 54.20 82 41.33 0
g-4 41 59.10 83 03.33 30g-6 41 59.18 82 48.75 0g-7 41 59.42 82 41.58 0g-8 41 59.55 82 34.20 0s-42 41 35.08 82 58.68 0
138
Site Latitude Longitude Year/Density
t-40 41 40.48 83 12.22 0t-41 41 40.40 83 05.80 0t-42 41 40.23 82 59.30 0
t-43 41 40.33 82 51.77 0t-45 41 40.60 82 37.30 0u-39 41 44.95 83 20.95 0u-40 41 45.38 83 13.47 0
u-41 41 45.58 83 06.25 0
u-42 41 45.72 82 59.27 0
u-43 41 45.68 82 51.77 0u-44 41 45.85 82 44.57 0v-39 41 50.25 83 20.08 0v-40 41 50.83 83 13.85 0
v-41 41 50.90 83 06.52 0
v-42 41 51.12 82 59.43 0
v-43 41 51.18 82 51.93 0
v-44 41 51.28 82 45.00 0w-40 41 56.12 83 13.68 0w-41 41 56.37 83 06.50 0
w-42 41 56.65 82 59.48 0w-43 41 56.32 82 52.45 0w-44 41 56.58 82 44.85 0
w-45 41 56.75 82 37.52 0
May/August 1979, 91277 41 51.35 82 36.03 0/0,0/0
284 41 57.82 82 33.17 0/0,19/0294 42 01.50 82 39.65 0/0,19/0308 41 55.43 82 44.13 0/0,0/0
314 41 57.32 82 56.50 0/0,26/0318 42 00.97 83 04.37 0/20,0/19321 42 03.10 83 08.10 20/0,13/135
323 42 01.63 83 08.07 20/20,71/705327 41 58.58 83 07.67 0/39,0/13333 41 57.43 83 13.68 0/0,0/0346 41 52.17 82 58.40 0/0,0/0
370 41 51.37 83 05.65 0/0,0/0
374 41 52.63 83 17.27 0/0,0/0386 41 45.67 83 19.65 0/0,0/0
423 41 42.35 82 43.92 0/0,6/01052 41 59.68 82 48.78 0/0,0/0
1991130(4D) 41 54.83 83 08.17 0
231(7D) 41 56.33 83 05.33 0
11D 41 59.33 83 07.50 614D 42 00.50 83 06.00 0
236(1L) 41 43.17 83 12.00 0
258(2L) 41 47.83 83 13.83 0
259(3L) 41 49.00 83 10.83 0
263(4L) 41 51.83 83 13.17 0
262(5L) 41 51.50 83 11.00 0
Site Latitude Longitude Year/Density
134(6L) 41 50.83 83 07.00 0
7L 41 49.00 83 00.00 0
132(8L) 41 53.00 83 07.83 0
229(9L) 41 55.00 83 02.33 0
10L 41 53.67 82 59.17 0
256(5M) 41 46.33 83 17.17 0
117(4R) 41 52.83 83 17.83 0264(5R) 41 52.33 83 15.83 19
19931P 41 32.92 82 55.00 132P 41 36.00 83 02.50 03P 41 39.00 83 09.00 194P 41 45.00 83 06.25 0
5P 41 44.00 82 58.25 0
6P 41 38.42 82 56.67 0
7P 41 41.25 83 02.42 6
2B 41 58.30 82 41.50 7
3B 41 57.83 82 44.00 0
4B 41 55.00 82 41.50 40
9B(5B) 41 41.50 82 46.00 40
59B(6B) 41 52.00 82 49.00 0
1K 41 45.00 82 45.00 02K 41 46.00 82 52.00 0
3K 41 43.00 83 04.00 0
4K 41 37.00 82 56.00 20
1994103C 41 55.80 82 56.80 27104C 41 52.60 82 57.70 18
105C 41 50.70 82 59.50 9
106C 41 51.00 82 59.70 0
107C 41 51.50 83 00.00 0
108C 41 51.00 83 00.40 0
110C 41 50.50 82 59.40 0
115C 41 52.80 83 00.20 0
117C 41 55.50 82 55.10 0118C 41 52.30 82 52.80 0
119C 41 49.20 82 51.60 0
120C 41 49.10 82 52.40 0
121C 41 48.20 82 52.70 9
122C 41 47.90 82 50.30 0
123C 41 48.20 82 49.80 0
124C 41 47.20 82 53.60 0
125C 41 50.50 82 40.00 0126C 41 53.65 82 52.00 0
127C 41 57.00 83 03.00 44
129C 41 49.60 82 58.20 0
132C 41 44.50 82 44.00 0133C 41 42.00 82 38.00 0134C 41 52.00 83 12.00 44
135C 41 47.50 83 20.00 15
139
Site Latitude Longitude Year/Density
136C 41 36.50 82 55.50 0
1995, 96, 97, 989B(5B) 41 41.50 82 46.00 43,34,624,240
59B(6B) 41 52.00 82 49.00 0,10,154,72
3D 41 56.33 83 12.17 183,120,302,298232(8D) 41 57.33 83 07.17 38,82,1680,250
15D 42 02.00 83 09.17 0,5,10,51K 41 45.00 82 45.00 29,48,216,3022K 41 46.00 82 52.00 0,0,0,14
258(2L) 41 47.83 83 13.83 87,14,283,259
134(6L) 41 50.83 83 07.00 34,159,149,34
7L 41 49.00 83 00.00 5,67,619,110
10L 41 53.67 82 59.17 14,24,216,38
251(1M) 41 42.83 83 25.50 58,125,499,494109(7M) 41 44.00 83 17.83 115, 755, 2064,518114(8M) 41 47.33 83 21.33 96, 553, 1109,394
1P 41 32.92 82 55.00 0, 0, 384,1154P 41 45.00 83 06.25 5, 0, 10,5
5P 41 44.00 82 58.25 0,0,0,0
6P 41 38.42 82 56.67 0,154,250,86
7P 41 41.25 83 02.42 29,5,763,173
117(4R) 41 52.83 83 17.83 10,24,418,5
1996, 97, 986K 41 40.00 82 40.00 5,115,2027K 41 34.00 82 40.00 0,5,191C 41 58.04 83 11.00 9,27,02C 41 58.04 83 04.08 302,240,533C 41 58.04 82 58.04 338,578,1694C 41 58.04 82 52.02 27,676,2495C 41 58.04 82 46.00 0,71,1516C 41 58.04 82 39.08 0,18,187C 41 54.00 83 17.00 80,862,718C 41 54.00 83 11.00 98,498,258
9C 41 54.00 83 04.08 160,240,89
10C 41 54.00 82 58.04 53,213,116
11C 41 54.00 82 52.02 44,107,124
12C 41 54.00 82 46.00 0,0,36
13C 41 54.00 82 39.08 9,44,27
17C 41 49.02 83 04.08 142,284,98
18C 41 49.03 82 58.04 36,551,151
19C 41 49.02 82 52.02 0,89,18
20C 41 49.02 82 46.00 9,36,0
34C 41 56.06 82 35.06 0,18,27
1997, 9814C 41 49.02 83 23.01 1378,13315C 41 49.02 83 17.00 782,444
16C 41 49.02 83 11.00 382,98
21C 41 44.02 83 23.01 116,0
22C 41 44.02 83 17.00 1440,276
Site Latitude Longitude Year/Density
136C 41 36.50 82 55.50 0
23C 41 44.02 83 11.00 1013,204
24C 41 44.02 83 04.08 0,0
25C 41 44.02 82 58.04 0,0
26C 41 44.02 82 52.02 0,927C 41 44.02 82 46.00 196,160
References
Beeton, A.M., 1961. Environmental changes in Lake Erie. Transac-tions of the American Fisheries Society 90: 1530–159.
Beeton, A.M., 1969. Changes in the environment and biota ofthe Great Lakes. In: Eutrophication: Causes, Consequences,Correctives, pp. 150–187. Proceedings of a Symposium of theNational Academy of Sciences, Washington, D.C. 661 pp.
Berkman, P.A., M.A. Haltuch, E. Tichich, D.W. Garton, G.K.Kennedy, J.E. Gannon, S.D. Mackey, J.A. Fuller & D.L.Liebenthal, 1998. Zebra mussels invade Lake Erie muds. Nature393: 27–28.
bij de Vaate, A., A. Klink & F. Oosterbroek, 1992. The mayfly,Ephoron virgo (Olivier), back in the Dutch parts of the riversRhine and Meuse. Hydrobiol. Bull. 25(3): 237–240.
Botts, P.S., B.A. Patterson & D.W. Schloesser, 1996. Zebra musseleffects on benthic invertebrates: physical or biotic? Journal of theNorth American Benthological Society 15(2): 179–184.
Britt, N.W., 1955a. Stratification in western Lake Erie in summerof 1953; effects on the Hexagenia (Ephemeroptera) population.Ecology 36: 239–244.
Britt, N.W., 1955b. Hexagenia (Ephemeroptera) population recov-ery in western Lake Erie following the 1953 catastrophe.Ecology 36: 520–522.
Britt, N.W., A.J. Pliodzinskas & E.M. Hair, 1980. Benthic macroin-vertebrate distribution in the Central and western basins ofLake Erie. In: C. Herdendorf (ed.), Lake Erie Nutrient ControlProgram, pp. 294–330. Report EPA-600/3-80-062, USEPA,Duluth, Minnesota. 354 pp.
Bunt, C.M., H.J. MacIsaac & W.G. Sprules, 1993. Pumping ratesand projected filtering impacts of juvenile zebra mussels (Dreis-sena polymorpha) in western Lake Erie. Canadian Journal ofFisheries and Aquatic Sciences 50: 1017–1022.
Burks, B.D., 1953. The mayflies, or Ephemeroptera, of Illinois.Illinois Natural History Survey Bulletin 26: 1–216.
Burns, N.M., 1985. Erie: The Lake that Survived. Rowman &Allanheld Publishers, Totowa, New Jersey. 320 pp.
Cairns, J., Jr., 1974. Indicator species vs. the concept of communitystructure as an index of pollution. Water Resources Bulletin10(2): 338–347.
Carr, J.F. & J.K. Hiltunen, 1965. Changes in the bottom fauna ofwestern Lake Erie from 1930 to 1961. Limnology and Oceano-graphy 10: 551–569.
Clesceri, L.S., A.E. Greenberg & A.D. Eaton (eds), 1998. StandardMethods for the Examination of Water and Wastewater, 20thEdition. American Public Health Association, Washington, D.C.
Chandler, D.C., 1963. Burrowing mayfly nymphs in western LakeErie previous to 1947. In: Proceedings of the Sixth Conference onGreat Lakes Research, International Association of Great LakesResearch, p. 267 [Abstract].
140
Cochran, P.A., 1992. The return of Hexagenia (Ephemeroptera:Ephemeridae) to the lower Fox River, Wisconsin. The GreatLakes Entomologist 25(2): 79–81.
Cochran, P.A. & A.P. Kinziger, 1997. Hexagenia bilineata (Ephem-eroptera: Ephemeridae) persists at low-levels of abundance inthe lower Fow River, Wisconsin. The Great Lakes Entomologist30(3): 89–92.
Dermott, R., 1994. Benthic Invertebrate Fauna of Lake Erie 1979:Distribution, Abundance and Biomass. Canada Center for InlandWaters, Burlington, Ontario, 82 pp. (corrected appendices,personal communication, R. Dermott).
Dermott, R., J. Mitchell, I. Murray & E. Fear, 1993. Biomass andproduction of zebra mussels (Dreissena polymorpha) in shallowwaters of northeastern Lake Erie. In: T. Nalepa & D. Schloesser(eds), Zebra Mussels: Biology, Impacts, and Control, pp. 399–413. CRC Press, Inc. (Lewis Publishers), Boca Raton, Florida,810 pp.
Edmondson, W.T., 1991. The Uses of Ecology: Lake Washingtonand Beyond. University of Washington Press, Seattle, Wash-ington, 329 pp.
Edsall, T.A, C.P. Madenjian & B.A. Manny, 1999. Burrowingmayflies in Lake Erie-a review. In: M. Munawar, T. Edsall &I. Munawar (eds), State of Lake Erie – Past, Present, and Future,pp. 219–231. Ecovision World Monograph Series. BackhuysPublishers, Leiden, The Netherlands, 550 pp.
Edsall, T.A., B.A. Manny, D.W. Schloesser, S.J. Nichols &A.M. Frank, 1991. Production of Hexagenia limbata nymphsin contaminated sediments in the upper Great Lakes connectingchannels. Hydrobiologia 219: 353–361.
Farrara, D.G. & A.J. Burt, 1993. Environmental assessmentof western Lake Erie sediments and benthic communities –1991. Report for the Ontario Ministry of the Environmentand Energy, Water Resources Vranch, Great Lakes Section byBeak Consultants Limited, Brampton (Mississauga), Ontario,193 pp.
Fremling, C.R., 1964. Mayfly distribution indicates water quality onthe Upper Mississippi River. Science 146: 1164–1166.
Fremling, C.R. & D.K. Johnson, 1990. Recurrence of Hexageniamayflies demonstrates improved water quality in Pool 2 and LakePepin, Upper Mississippi River. In: I. Campbell (ed.), Mayfliesand Stoneflies, pp. 243–248. Kluwer Academic Publishers,Dordrecht.
Griffiths, R.W., 1993. Effects of zebra mussels (Dreissena poly-morpha) on benthic fauna of Lake St. Clair. In: T. Nalepa & D.Schloesser (eds), Zebra Mussels: Biology, Impacts, and Control,pp. 415–438. CRC Press, Inc. (Lewis Publishers), Boca Raton,Florida, 810 pp.
Griffiths, R.W., D.W. Schloesser, J.H. Leach & W.P. Kovalak, 1991.Distribution and dispersal of the zebra mussel (Dreissena poly-morpha) in the Great Lakes region. Canadian Journal of Fisheriesand Aquatic Sciences 48(8): 1381–1388.
Harris, H.J., P.E. Sager, S. Richman, V.A. Harris & C.J. Yarbrough,1987. Coupling ecosystem science with management: a GreatLakes perspective from Green Bay, Lake Michigan, USA. Envir-onmental Management 11: 625–629.
Hebert, P.D.N., W.B. Muncaster & G.L. Mackie, 1989. Ecologicaland genetic studies on Dreissena polymorpha (Pallas): a newmollusc in the Great Lakes. Canadian Journal of Fisheries andAquatic Sciences 46: 1587–1591.
Hiltunen, J.K. & D.W. Schloesser, 1983. The occurrence of oil andthe distribution of Hexagenia (Ephemeroptera: Ephemeridae)nymphs in the St. Marys River, Michigan and Ontario. Fresh-water Invertebrate Biology 2(4): 199–203.
Howmiller, R.P. & A.M. Beeton, 1971. Biological evaluations ofenvironmental quality, Green Bay, Lake Michigan. Journal ofWater Pollution Control Federation 43: 123–133.
Hunt, B.P., 1953. The life history and economic importance ofa burrowing mayfly Hexagenia limbata in southern Michiganlakes. Michigan Department of Conservation, Bulletin of Insti-tute of Fisheries Research 4: 1–151.
Karatayev. A.Y., L.E. Burlakova & D.K. Padilla, 1997. Theeffects of Dreissena polymorpha (Pallas) invasion on aquaticcommunities in eastern Europe. Journal of Shellfish Research16(1): 187–203.
Kolar, C.S., P.L. Hudson & J.F. Savino, 1997. Conditions for thereturn and simulation of the recovery of burrowing mayfliesin western Lake Erie. Ecological Applications 7(2): 665–676.
Krieger, K.A., D.W. Schloesser, B.A. Manny, C.E. Trisler, S.E.Heady, J.J.H. Ciborowski & K.M. Muth, 1996. Recovery ofburrowing mayflies (Ephemeroptera: Ephemeridae: Hexagenia)in western Lake Erie. Journal of Great Lakes Research 22(2):254–263.
Lathrop, R.C., 1992. Benthic macroinvertebrates. In: J.F. Kitchell(ed.), Food Web Management: A Case Study of Lake Mendota,pp. 173–192. Springer-Verlag New York, New York, New York,553 pp.
Loveridge, C.C. & D.G. Cook, 1976. A preliminary report on thebenthic macroinvertebrates of Georgian Bay and North Channel.Canadian Fisheries Maritime Service. Technical Report 610.Canadian Center for Inland Waters, Burlington, Ontario. InMozley and Ladronka 1988.
MacIsaac, H.J., 1996. Potential abiotic and biotic impacts of zebramussels on the inland waters of North America. AmericanZoologist 36(3): 287–299.
Madenjian, C.P., 1995. Removal of algae by the zebra mussel(Dreissena polymorpha) population in western Lake Erie: abioenergetics approach. Canadian Journal of Fisheries andAquatic Sciences 52: 381–390.
Madenjian, C.P., D.W. Schloesser & K.A. Krieger, 1998. Populationmodels of burrowing mayfly recolonization in western Lake Erie.Ecological Applications 8(4): 1206–1212.
Makarewicz, J.C. & P. Bertram, 1991. Evidence for the restorationof the Lake Erie ecosystem. Bioscience 41: 216–223.
Manny, B.A., 1991. Burrowing mayfly nymphs in western LakeErie, 1942–1944. Journal of Great Lakes Research 17(4): 517–521.
Manny, B.A. & D.W. Schloesser, 1999. Changes in the bottom faunaof western Lake Erie. In: M. Munawar, T. Edsall & I. Munawar(eds), State of Lake Erie – Past, Present, and Future, pp. 197–217. Ecovision World Monograph Series. Backhuys Publishers,Leiden, The Netherlands, 550 pp.
Mozley, S.C. & R.M. LaDronka, 1988. Ephemera and Hexagenia(Ephemeridae, Ephemeroptera) in the straits of Mackinac, 1955–56. Journal of Great Lakes Research 14(2): 171–177.
Nalepa, T.F. & D.W. Schloesser (eds), 1993. Zebra Mussels:Biology, Impacts, and Control. Lewis/CRC Press, Inc., BocaRaton, Florida, 810 pp.
Nicholls, K.H. & G.J. Hopkins, 1993. Recent changes in Lake Erie(North Shore) phytoplankton: cumulative impacts of phosphorusloading reductions and the zebra mussel introduction. Journal ofGreat Lakes Research 19(4): 637–647.
Odum, E.P., 1971. Fundamentals of Ecology. W.B. SaundersCompany, Philadelphia, Pennsylvania, 574 pp.
Ohio Lake Erie Commission, 1998. State of Ohio 1998: State of theLake Report. Toledo, Ohio, 88 pp.
141
OME (Ontario Ministry of Environment), 1981. An assessment ofthe bottom fauna and sediments of western Lake Erie, 1979.Water Resources Assessment, Water Resources Branch, Toronto,Ontario.
Reeders, H.H. & A. bij de Vaate, 1990. Zebra mussels (Dreissenapolymorpha): a new perspective for water quality management.Hydrobiologia 201: 437–450.
Reeders, H.H., A. bij de Vaate & R. Noordhuis, 1993. Poten-tial of the zebra mussel (Dreissena polymorpha) for waterquality management. In: T. Nalepa & D. Schloesser (eds), ZebraMussels: Biology, Impacts, and Control, pp. 439–451. CRCPress, Inc. (Lewis Publishers), Boca Raton, Florida, 810 pp.
Reynoldson, T.B. & A.L. Hamilton, 1993. Historical changes inpopulations of burrowing mayflies (Hexagenia limbata) fromLake Erie on sediment tusk profiles. Journal of Great LakesResearch 19(2): 250–257.
Reynoldson, T.B., D.W. Schloesser & B.A. Manny, 1989. Devel-opment of a benthic invertebrate objective for mesotrophicGreat Lakes waters. Journal of Great Lakes Research 15:669–686.
Schloesser, D.W., 1988. Zonation of mayfly nymphs and caddisflylarvae in the St. Marys River. Journal of Great Lakes Research14(2): 227–233.
Schloesser, D.W., T.A. Edsall, B.A. Manny & S.J. Nichols, 1991.Distribution of Hexagenia nymphs and visible oil in sediments ofthe upper Great Lakes connecting channels. Hydrobiologia 219:345–352.
Schloesser, D.W. & J.K. Hiltunen, 1984. Life cycle of the mayflyHexagenia limbata in the St. Marys River between LakesSuperior and Huron. Journal of Great Lakes Research 10(4):435–439.
Schloesser, D.W. & W.P. Kovalak, 1991. Infestation of unionidsby Dreissena polymorpha in a power plant canal in Lake Erie.Journal of Shellfish Research 10: 355–359.
Schloesser, D.W. & T.F. Nalepa, 1994. Dramatic decline of unionidbivalves in offshore waters of western Lake Erie after the inva-sion by the zebra mussel, Dreissena polymorpha. CanadianJournal of Fisheries and Aquatic Science 51: 2234–2242.
Schloesser, D.W. & T.F. Nalepa, 2001. Changing abundance ofHexagenia mayfly nymphs in western Lake Erie of the Lauren-tian Great Lakes: impediments to assessment of lake recovery?International Review of Hydrobiology 86: 87–103.
Schloesser, D.W., T.B. Reynoldson & B.A. Manny, 1995. Oligo-chaete fauna of western Lake Erie 1961 and 1982: signs ofsediment quality recovery. Journal of Great Lakes Research 21:294–306.
Schloesser, D.W., R.D. Smithee, G.D. Longton & W.P. Kovalak,1997. Zebra mussel induced mortality of unionids in firmsubstrata of western Lake Erie and a habitat for survival. Amer-ican Malacological Bulletin 14(1): 67–74.
Schneider, J.C., F.F. Hooper & A.M. Beeton, 1969. The distributionand abundance of benthic fauna in Saginau Bay, Lake Huron.Proceedings of the 12th Conference on Great Lakes Research,International Association of Great Lakes Research 12: 80–90.
Shelford, V.E. & M.W. Boesel, 1942. Bottom animal communitiesof the island area of western Lake Erie in the summer of 1937.Ohio Journal of Science 42: 179–190.
Sokal, R.P. & F.J. Rohlf, 1981. Biometry: the Principles and Prac-tice of Statistics in Biological Research, 2nd edn. W. FreemanPublishers, San Francisco, California, 859 pp.
Stewart, T.W. & J.M. Haynes, 1994. Benthic macroinvertebratecommunities of southwestern Lake Ontario following invasionof Dreissena. Journal Great Lakes Research 20(2): 479–493.
Sweeney, R.A., 1993. “Dead” sea of North America? – Lake Eriein the 1960s and 1970s. Journal of Great Lakes Research 19(2):198–199.
Thomas, R.L., J.M. Jaquet, A.L.W. Kemp & C.F.M. Lewis, 1976.Surficial sediments of Lake Erie. Journal of Fisheries ResearchBoard of Canada 33: 385–403.
Veal, D.M. & D.S. Osmond, 1968. Bottom fauna of the westernbasin and near-shore Canadian waters of Lake Erie. In: Proceed-ings 11th Conference of Great Lakes Research, pp. 151–160.International Association of Great Lakes Research.
Wisniewski, R., 1990. Shoals of Dreissena polymorpha as bio-processors of seston. Hydrobiologia 200/201: 451–458.
Wright, S., 1955a. Limnological survey of western Lake Erie.United States Department of the Interior, U.S. GovernmentPrinting Office, Washington, D.C., 341 pp.
Wright S. (ed.), 1955b. Supplemental data: Limnological survey ofwestern Lake Erie with special reference to pollution. Extractedfrom Wickliff, E.L. (ed.), with same title. Ohio Division ofWildlife. Columbus, Ohio.
Zar, J.H., 1996. Biostatistical Analysis, 3rd edn. Prentice HallPublisher, Upper Saddle River, New Jersey, 718 pp.

Copyright © 2022 FDOKUMEN