Sources of attention-sensitive visual event-related potentials
11
Brain Topography, Volume 7, Number 1,1994 41 Sources of Attention-Sensitive Visual Event-Related Potentials Carlos M. Gomez Gonzalez*, Vincent P. Clark +, Silu Fan S, Steven J. Luck #, and Steven A. Hillyard # Summary: In a study of the neural processes that mediate visual attention in humans, 32-channel recordings of event-related potentials were obtained from 14 normal subjects while they performed a spatial attention task. The generator locations of the early C1, P1, and N1 components of the visual evoked response were estimated by means of topographic maps of voltage and current source density in conjunction with dipole modelling. The topography of the C1 component (ca. 85 ms post-stimulus) was consistent with a generator in striate cortex, and this component was unaffected by attention. In contrast, the P1 and N1 components (ca. 95 and 170ms) exhibited current density loci at scalp sites overlying lateral extrastriate cortex and were larger for attended stimuli than for unattended stimuli. The voltage topographies in the 75-175 ms latency range were modeled with a 5-dipole configuration consisting of a single striate dipole and left-right pairs of dipoles located in lateral extrastriate and inferior occipito-temporal areas. This model was found to account for the voltage topographies produced byboth attended and unattended stimuli with low residual variance. These results support the proposal that visual-spatial attention modulates neural activity in extrastriate visual cortex but does not affect the initial evoked response in striate cortex. Key words: Event-related potential; Visual-spatial attention; Source localization; Dipole; Current source density. A large number of psychophysical studies have shown that humans are capable of voluntarily focusing attention upon particular locations in the visual field without making overt eye movements, leading to faster and more accurate discrimination of stimuli presented at the at- tended location (e.g., Hawkins et al. 1990; Henderson 1991; Jonides 1981; Posner 1980). A longstanding con- troversy has developed concerning the question of whether this improved discrimination performance results from changes in early, sensory-level processing (e.g., Posner 1980) or from changes in postperceptual stages such as short-term memory and response selection (e.g., Duncan 1980; Sperling 1984). Because behavioral * Laboratory of Psychobiology, University of Sevilla, Spain. + Laboratory of Psychology and Psychopathology, NIMH, National Institutes of Health, Bethesda, USA. Institute of Psychology, Academia Sinica, Beijing, China. # Department of Neurosciences, University of California, San Diego, USA. Accepted for publication: May 30, 1994. This study was supported by ONR Contract N00014-89-J-1806, by grants from NIMH (MH-25594), NINCDS (NS 17778), the Human Frontier Science Program, DGICYT (PM92-0128), and by a Fulbright scholarship to the first author. Correspondence and reprint requests should be addressed to Carlos Gomez, Laboratorio de Psicobiologia, Facultad de Filosofia y C.E., Avda. Francisco Javier s/n, Sevilla 41005, Spain, or Steven A. Hillyard, Department of Neurosciences 0608, University of California, San Diego, 9500 Gilman Drive, La Jolla, CA, 92093-0608, USA. Copyright 1994 Human Sciences Press, Inc. measures such as reaction time and accuracy reflect the net outcome of both perceptual and postperceptual processes, it has been difficult to resolve this "locus of selection" issue on the basis of psychophysical studies alone. Event-related brain potentials (ERPs) provide an ad- ditional source of information regarding the time course of information processing and have therefore been useful in determining the stage at which attention begins to affect processing. Several studies using this approach have reported that stimuli presented within the focus of attention elicit larger sensory-evoked responses than stimuli presented at unattended locations (e.g., Eason et al. 1969; Harter and Anllo-Vento 1991; Luck et al. 1993; Mangun and Hillyard 1988, 1990, 1991; Rugg et al. 1987). Since these ERP modulations typically begin within 100 ms of stimulus onset, they have been taken as strong evidence for the proposal that attention operates at an early stage to improve sensory processing (reviewed in Mangun et al. 1993). A number of recent studies have attempted to deter- mine more precisely the neuroanatomical level at which visual-spatial attention begins to affect sensory process- ing. Eason et al. (1983) reported that attention affected processing at the level of the retina, but subsequent studies have failed to replicate this finding and have concluded that attention does not influence processing until information reaches the cerebral cortex (Hackley et
-
Upload
independent -
Category
Documents
-
view
3 -
download
0
Transcript of Sources of attention-sensitive visual event-related potentials

Brain Topography, Volume 7, Number 1,1994 41
Sources of Attention-Sensitive Visual Event-Related Potentials
Carlos M. Gomez Gonzalez*, Vincent P. Clark +, Silu Fan S, Steven J. Luck #, and Steven A. Hillyard #
Summary: In a study of the neural processes that mediate visual attention in humans, 32-channel recordings of event-related potentials were obtained from 14 normal subjects while they performed a spatial attention task. The generator locations of the early C1, P1, and N1 components of the visual evoked response were estimated by means of topographic maps of voltage and current source density in conjunction with dipole modelling. The topography of the C1 component (ca. 85 ms post-stimulus) was consistent with a generator in striate cortex, and this component was unaffected by attention. In contrast, the P1 and N1 components (ca. 95 and 170ms) exhibited current density loci at scalp sites overlying lateral extrastriate cortex and were larger for attended stimuli than for unattended stimuli. The voltage topographies in the 75-175 ms latency range were modeled with a 5-dipole configuration consisting of a single striate dipole and left-right pairs of dipoles located in lateral extrastriate and inferior occipito-temporal areas. This model was found to account for the voltage topographies produced byboth attended and unattended stimuli with low residual variance. These results support the proposal that visual-spatial attention modulates neural activity in extrastriate visual cortex but does not affect the initial evoked response in striate cortex.
Key words: Event-related potential; Visual-spatial attention; Source localization; Dipole; Current source density.
A large number of psychophysical studies have shown that humans are capable of voluntarily focusing attention upon particular locations in the visual field without making overt eye movements, leading to faster and more accurate discrimination of stimuli presented at the at- tended location (e.g., Hawkins et al. 1990; Henderson 1991; Jonides 1981; Posner 1980). A longstanding con- troversy has developed concerning the question of whether this improved discrimination performance results from changes in early, sensory-level processing (e.g., Posner 1980) or from changes in postperceptual stages such as short-term memory and response selection (e.g., Duncan 1980; Sperling 1984). Because behavioral
* Laboratory of Psychobiology, University of Sevilla, Spain. + Laboratory of Psychology and Psychopathology, NIMH, National
Institutes of Health, Bethesda, USA. Institute of Psychology, Academia Sinica, Beijing, China.
# Department of Neurosciences, University of California, San Diego, USA.
Accepted for publication: May 30, 1994. This study was supported by ONR Contract N00014-89-J-1806, by
grants from NIMH (MH-25594), NINCDS (NS 17778), the Human Frontier Science Program, DGICYT (PM92-0128), and by a Fulbright scholarship to the first author.
Correspondence and reprint requests should be addressed to Carlos Gomez, Laboratorio de Psicobiologia, Facultad de Filosofia y C.E., Avda. Francisco Javier s /n , Sevilla 41005, Spain, or Steven A. Hillyard, Department of Neurosciences 0608, University of California, San Diego, 9500 Gilman Drive, La Jolla, CA, 92093-0608, USA.
Copyright �9 1994 Human Sciences Press, Inc.
measures such as reaction time and accuracy reflect the net outcome of both perceptual and postperceptual processes, it has been difficult to resolve this "locus of selection" issue on the basis of psychophysical studies alone.
Event-related brain potentials (ERPs) provide an ad- ditional source of information regarding the time course of information processing and have therefore been useful in determining the stage at which attention begins to affect processing. Several studies using this approach have reported that stimuli presented within the focus of attention elicit larger sensory-evoked responses than stimuli presented at unattended locations (e.g., Eason et al. 1969; Harter and Anllo-Vento 1991; Luck et al. 1993; Mangun and Hillyard 1988, 1990, 1991; Rugg et al. 1987). Since these ERP modulations typically begin within 100 ms of stimulus onset, they have been taken as strong evidence for the proposal that attention operates at an early stage to improve sensory processing (reviewed in Mangun et al. 1993).
A number of recent studies have attempted to deter- mine more precisely the neuroanatomical level at which visual-spatial attention begins to affect sensory process- ing. Eason et al. (1983) reported that attention affected processing at the level of the retina, but subsequent studies have failed to replicate this finding and have concluded that attention does not influence processing until information reaches the cerebral cortex (Hackley et

42 Gonzalez et al,
al. 1990; Mangun et al. 1986). Similar conclusions have also been reached in studies of auditory attention, whi, ch have shown that attention does not affect the brainstem evoked responses, but may influence the mid-latency evoked responses (ca. 20-50 ms), which appear to be cortical in origin (Woldorff et al. 1987, 1993).
Single-unit recordings from macaque visual cortex (Moran and Desimone 1985) have provided additional evidence concerning the locus of attentional selection by showing that spatial at tention modulates sensory processing in extrastriate areas V4 and IT, but not in primary visual (striate) cortex. A similar conclusion was reached in a recent human ERP study reported by Man- gun et al. (1993), in which attention was found to in- fluence the P1 and N1 components (ca. 110 and 170 ms), but not the earlier C1 component (ca. 80 ms). A number of studies have suggested that the C1 component arises in striate cortex, whereas the P1 component arises in extrastriate cortex (Clark 1993; Jeffreys and Axford 1972; Ossenblock 1992). Accordingly, the presence of atten- tional modulation of the P1 and N1 waves but not the C1 wave is consistent with the proposal that attention begins to affect sensory processing at the level of extrastriate visual cortex.
The present study aimed to provide additional infor- mation about the attentional sensitivity and neural gen- erator locations of the C1, P1, and N1 components. In the study of Mangun et al. (1993), topographic maps of volt- age and current source density indicated that the focus of P1 activity was over lateral occipital cortex, while the focus of N1 activity was more dorsal, overlying parietal cortex. Other studies, however, have indicated that there are at least two attention-sensitive N1 subcomponents, one anteriorly distributed and another posteriorly dis- tributed (e.g., Clark 1993; Luck et al. 1993), and have suggested that the P1 wave may also arise from multiple generators (Clark 1993; McCarthy and Scabini 1991).
The present experiment extended the study of Man- gun et al. (1993) in three major ways. First, there is evidence that the nature of the perceptual task may be crucial in determining whether ERP attention effects begin at an early, intermediate, or late stage of processing (Naatanen 1992); the present study therefore employed more complex perceptual tasks than the simple size dis- crimination employed by Mangun et al. (1993) in order to produce a highly focused state of selective attention. Second, the Brain Electrical Source Analysis (BESA) tech- nique (Scherg 1990) was used in the present study to provide an additional means of testing hypotheses about ERP generator locations. Although inverse dipole modelling techniques such as BESA are limited in their ability to localize complex sets of generator sources on the basis of scalp topography alone (see Dale and Sereno 1993), this technique can be useful for assessing the ade-
quacy of specific, highly constrained, and relatively simple models, such as those considered here. Third, Woldorff (1993) has demonstrated that the ERPs elicited by stimuli preceding and following a stimulus of interest may cause substantial distort ion of the waveform recorded to this stimulus; this waveform overlap may alter the distribution of voltage over the surface of the scalp and interfere with the localization of generator sources. To mitigate this problem, the present paradigm used relatively long interstimulus intervals, and the ERP waveforms were processed with the ADJAR filter (Wol- dorff 1993) to remove overlapping ERP activity elicited by previous and subsequent stimuli.
Methods
Subjects
Fourteen right-handed college students (6 male) who gave informed consent were paid to participate in this experiment. The subjects were between 18 and 24 years old, had normal or corrected vision, and reported no history of neurological impairment.
Stimuti
Stimuli were presented on a color video monitor that was placed 75 cm in front the subject, who reclined in a comfortable chair. A fixation point was continuously visible in the center of the display as stimuli were flashed in the left and right visual fields in random order. Each stimulus pattern consisted of a green line at the horizon- tal meridian and two geometric forms, one above and one below the green line (see figure 1). The green line sub- tended 4.3 degrees of visual angle and was centered 4.3 degrees to the left or right of fixation. The geometric forms were either squares or right angle junctions that subtended 1.0 degrees. The horizontal and vertical posi- tions of the two forms were varied at random within rectangular regions of 4.4 x 4.4 degrees, located directly above and below the green line. In each stimulus pattern, the two forms were either identical or different in shape and were placed at either identical or different vertical distances from the green line. Stimulus duration was 250 11"18.
Procedu re
Each trialblock consisted of a sequence of 120 stimulus patterns, 60 flashed in the left visual field and 60 in the right, presented in random order. The interval between successive stimulus onsets varied randomly between 650 and 900ms. At the beginning of each block, subjects were instructed to attend to stimuli on either the left or right side and to press a button upon detecting a target on the

Attent!on-Sensitive Visual ERPs 43
9 + I Left Standard
I
. i
I * " I Right Standard
Figure i. Example stimulus sequence segment. Most of the stimuli were standards, for which the shapes of the two objects and their vertical distances from the marker line were both different. Form targets and spatial targets, in which the two objects possessed the same form or dis- tance, each occurred on 12% of trials. These stimulus types were randomly intermixed. Subjects attended to either the left or right side of the display, and responded to form targets on the attended side in some blocks and to spatial targets on the attended side in others.
attended side. For half of the blocks, targets were defined as stimuli having identical forms above and below the green line, and for the remaining blocks targets were defined as stimuli having identical distances between the upper and lower forms and the green line. Stimuli with identical forms or distances each comprised 12% of the stimuli, but since half of the stimuli were presented on the unattended side, only 6% of the stimuli within a block required a response in a given condition. Each subject received 32 trial blocks, 8 for each combination of target type and direction of attention. The ERP data were vir- tually identical for the two target type conditions and the two conditions were therefore combined for all analyses described below.
Subjects were instructed to fixate the central fixation point while per forming the task and fixation was monitored with electro-oculogram (EOG) recordings. The EOG was cont inuously moni tored by the ex- perimenter; when deviations in eye position were ob- served, the subject was given feedback and that trial
block was discarded and repeated later in the session.
Recording and Analysis
ERPs were recorded from 29 scalp locations using tin electrodes mounted in an electrode cap. Two of the sites were located over left and right frontal areas (near F3 and F4) and the remaining sites were positioned in a regular grid that covered the posterior portion of the head. All scalp electrodes, as well as an electrode at the right mas- toid, were referenced to an electrode at the left mastoid. The data were algebraically re-referenced to the average of the mastoids off-line for waveform plotting and statis- tical analysis, but the original single-mastoid reference was used for topographic mapping and dipole source localization, as required by our software. The horizontal and vertical EOG signals were recorded bipolarly with electrodes at the left and right outer canthi and above and below the left eye, respectively. All signals were amplified by Grass Model 12 polygraphs with a gain of 20,000 and a bandpass of 0.01-100 Hz (1/2 amplitude cutoffs). The EEG was digitized with a sampling rate of 250 Hz and stored for off-line averaging. Trials con- taminated by blinks, eye movements, or amplifier block- ing were automatically rejected during averaging.
In order to estimate and remove the overlapping ERP waveforms arising from previous and subsequent stimuli, the ADJAR correction procedure (Woldorff 1993) was performed before any further data analysis proce- dures were carried out. This technique estimates over- lapping activity by convolving the ERP waveform for an adjacent stimulus with the probability distribution of the interstimulus interval between the adjacent stimulus and the current (time-locking) stimulus. This estimate of the overlap can then be subtracted from the observed w a v e f o r m for the cu r ren t s t imulus . Because the waveform used for estimating the overlap is itself con- taminated by overlap, the overlap estimate contains some error. However, this error can be minimized by iterating the procedure, using the ERP waveforms from the previous iteration to estimate the overlap for the current iteration. In general, the waveforms from each iteration will be a closer approximation of the true waveform than the waveforms from the previous itera- tion, so the estimated waveforms should converge towards the true waveform with a sufficient number of iterations. In the current case, 10 iterations were suffi- cient to remove all signs of overlap from the prestimulus baseline period. Because this technique is less effective for low frequencies than for high frequencies, the waveforms were filtered with a digital implementation of a single-pole causal high-pass filter before the ADJAR procedure was performed. This filter had a 1/2 amplitude cutoff at 1.2 Hz with a phase shift that was less
44 Gonzalez et al.
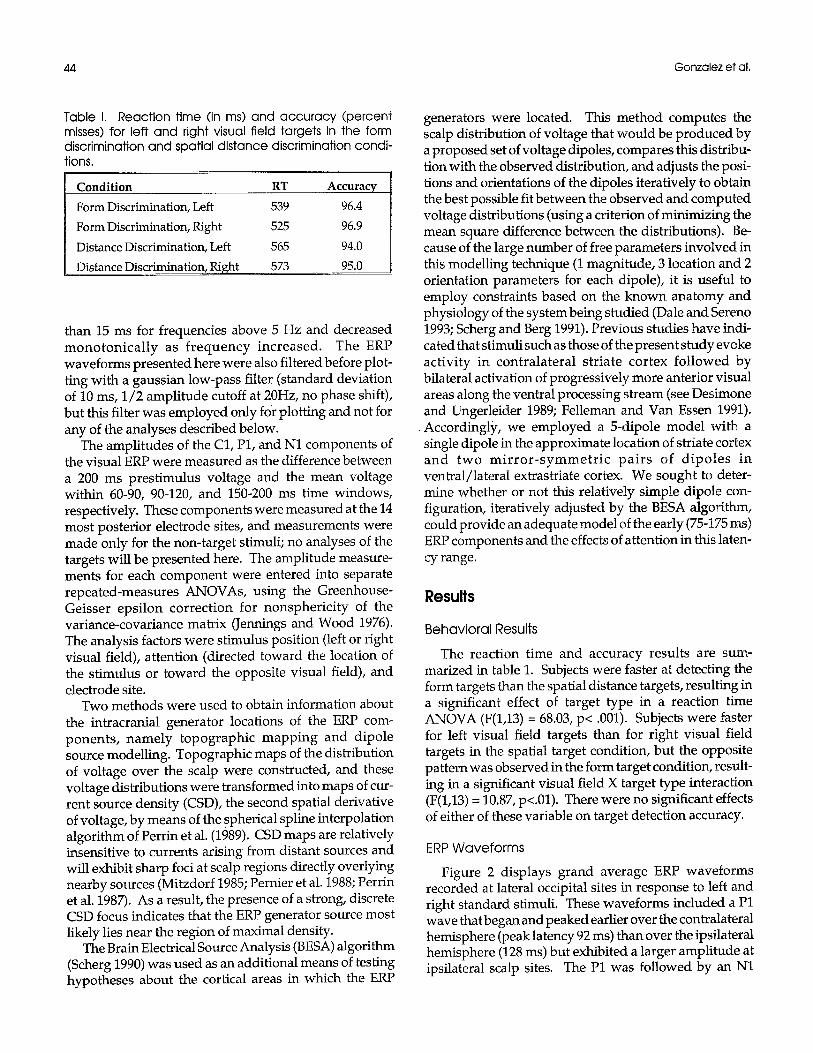
Table I. Reaction time (in ms) and accuracy (percent misses) for left and right visual field targets in the form discrimination and spatial distance discrimination condi- tions.
Condition RT Accuracy
Form Discrimination, Left 539 96.4
Form Discrimination, Right 525 96.9
Distance Discrimination, Left 565 94.0
Distance Discrimination, Right 573 95.0
than 15 ms for frequencies above 5 Hz and decreased monoton ica l ly as f r equency increased. The ERP waveforms presented here were also filtered before plot- ting with a gaussian low-pass filter (standard deviation of 10 ms, 1/2 amplitude cutoff at 20Hz, no phase shift), but this filter was employed only for plotting and not for any of the analyses described below.
The amplitudes of the C1, P1, and N1 components of the visual ERP were measured as the difference between a 200 ms prestimulus voltage and the mean voltage within 60-90, 90-120, and 150-200 ms time windows, respectively. These components were measured at the 14 most posterior electrode sites, and measurements were made only for the non-target stimuli; no analyses of the targets will be presented here. The amplitude measure- ments for each component were entered into separate repeated-measures ANOVAs, using the Greenhouse- Geisser epsilon correction for nonsphericity of the variance-covariance matrix (Jennings and Wood 1976). The analysis factors were stimulus position (left or right visual field), attention (directed toward the location of the stimulus or toward the opposite visual field), and electrode site.
Two methods were used to obtain information about the intracranial generator locations of the ERP com- ponents, namely topographic mapping and dipole source modelling. Topographic maps of the distribution of voltage over the scalp were constructed, and these voltage distributions were transformed into maps of cur- rent source density (CSD), the second spatial derivative of voltage, by means of the spherical spline interpolation algorithm of Perrin et al. (1989). CSD maps are relatively insensitive to currents arising from distant sources and will exhibit sharp foci at scalp regions directly overlying nearby sources (Mitzdorf 1985; Pernier et al. 1988; Perrin et al. 1987). As a result, the presence of a strong, discrete CSD focus indicates that the ERP generator source most likely lies near the region of maximal density.
The Brain Electrical Source Analysis (BESA) algorithm (Scherg 1990) was used as an additional means of testing hypotheses about the cortical areas in which the ERP
generators were located. This method computes the scalp distribution of voltage that would be produced by a proposed set of voltage dipoles, compares this distribu- tion with the observed distribution, and adjusts the posi- tions and orientations of the dipoles iteratively to obtain the best possible fit between the observed and computed voltage distributions (using a criterion of minimizing the mean square difference between the distributions). Be- cause of the large number of free parameters involved in this modelling technique (1 magnitude, 3 location and 2 orientation parameters for each dipole), it is useful to employ constraints based on the known anatomy and physiology of the system being studied (Dale and Sereno 1993; Scherg and Berg 1991). Previous studies have indi- cated that stimuli such as those of the present study evoke activity in contralateral striate cortex followed by bilateral activation of progressively more anterior visual areas along the ventral processing stream (see Desimone and Ungerleider 1989; Felleman and Van Essen 1991). Accordingly, we employed a 5-dipole model with a single dipole in the approximate location of striate cortex and two m i r r o r - s y m m e t r i c pai rs of d ipoles in ventral/lateral extrastriate cortex. We sought to deter- mine whether or not this relatively simple dipole con- figuration, iteratively adjusted by the BESA algorithm, could provide an adequate model of the early (75-175 ms) ERP components and the effects of attention in this laten- cy range.
Results
Behavioral Results
The reaction time and accuracy results are sum- marized in table 1. Subjects were faster at detecting the form targets than the spatial distance targets, resulting in a significant effect of target type in a reaction time ANOVA (F(1,13) = 68.03, p< .001). Subjects were faster for left visual field targets than for right visual field targets in the spatial target condition, but the opposite pattern was observed in the form target condition, result- ing in a significant visual field X target type interaction (F(1,13) = 10.87, p<.01). There were no significant effects of either of these variable on target detection accuracy.
ERP Waveforms
Figure 2 displays grand average ERP waveforms recorded at lateral occipital sites in response to left and right standard stimuli. These waveforms included a P1 wave that began and peaked earlier over the contralateral hemisphere (peak latency 92 ms) than over the ipsilateral hemisphere (128 ms) but exhibited a larger amplitude at ipsilateral scalp sites. The P1 was followed by an N1

Attention-Sensitive Visual ERPs 45
Lateral Occipi ta l Sites N,
A Ipsi ~ Contra t : \ /
Lo:t = _ T - ^ A , , f ' { ,, :
,., A ,
r 1.0 l~v i i i i - - A t t e n d e d 0 100 200 300 400 ............. Unattended
T / I S e C
Figure 2. Grand average ERP responses elicited by stand- ards in the left and right visual fields, recorded at electrode sites located 5 cm ipsilateral or contralateral to the stand- ard Oz electrode site. The waveforms are presented separately as a funct ion of whether attention was directed to the location of the evoking stimulus (at- tended) o r to the opposite visual field (unattended). Note that negative is plotted upwards.
wave that peaked at approximately the same latency over both hemispheres but was substantially larger over the contralateral hemisphere. The P1 wave was observed only at the more posterior electrode sites, whereas the N1 wave was broadly distributed. The N1 wave peaked earlier at anterior sites (152 ms) than at posterior sites (170 ms). At the posterior midline and ipsilateral electrode sites, the P1 was preceded by a small negative wave peaking at 80 ms, presumably corresponding to the C1 component described by Jeffreys and Afford (1972). This component can be seen in figure 3, which plots the w a v e f g r m s r e c o r d e d at pe r im id l i ne sites. The predominantly ipsilateral distribution observed here is typical for this component, and may reflect either cancel- lation of the C1 by the larger P1 at contralateral sites or
Table II. Component amplitudes (in uV) for attended and unattended stimuli, measured at lateral occipital (P1 and N1) or perimidline (C1) electrode sites (standard errors in 3arentheses).
C1 P1 N1
Attended -0.13 0.82 -1.85
(0.12) (0.22) (0.31)
Unattended -0.16 0.40 -0.73
(0.09) (0.17) (0.21)
Per imid l ine Sites
N1
Ipsi ~1 Contra
Left ~ f ~ . , I... - I . . . . . . Standard i ; ~ ' b ~ " ~ --Z+~'~ ' NI: '""
P1 ~,." ~ f ~ ,
Ipsi N1 Contra /\I," Right _ ~..-_ ~t A .'".";, ..~L~,~ I.-'''"1
Standard .... 1+ ~'. " - . ~ : ' " ' y " " ? ~ -- " I+ ! ~ "%..."
P !
[l"0i~V I 1 I I - - - A t t e n d e d o lOO 2oo 3oo 4o0 ............. Unattended
'ITI, Se C
Figure 3. Same as figure 2 for perimidline sites located 2 cm lateral and 2 cm superior to Oz.
an ipsilaterally oriented generator source located in the contralateral hemisphere.
Both the P1 and N1 components were larger when a t ten t ion was directed to the location of the evoking
stimulus than when attention was dired:ed to the op- posite visual field (see table 2). This resulted in sig- nificant main effects of attention for both the P1 wave (F(1,13) = 6.28, p<.05) and the N1 wave (F(1,13) = 12.99, p<.005). No significant main effects or interactions in- volving the attention factor were observed for the C1 component. Because the N1 wave was larger at con- tralateral electrodes and the C1 wave was larger at ip- silateral electrodes, both of these components produced significant stimulus position X electrode site interactions (C1: F(13,169) = 10.66, p<.001; N1:F(13,169) = 30.48, p< .001). In addition, the effects of attention were greater at contralateral sites than ipsilateral sites for the N1 com- ponent, resulting in a significant attention X stimulus position X electrode site interaction (F(13,169) =37.69, p< .001). No significant effects of stimulus position were observed for the P1 component.
Topograph ic Analysis
Topographic maps of voltage and current source den- sity are presented for the left visual field standards in figure 4. Each row of maps displays the voltage or CSD distributions over four consecutive time intervals. Separate maps are shown for the response elicited by a left visual field stimulus when it was attended and when it was not attended, and for the difference between the attended and unattended waveforms. The maps from the unattended waveforms show that the P1 component began over the contralateral hemisphere, but its focus

46 Gonzalez et ai.
Figure 4. Isocontour maps of voltage (top) and current source density (bottom) derived from the grand average waveforms elicited by left standard stimuli using a spherical spline interpolation algorithm (Perrin et al. 1989), Each column reflects the topography of the mean amplitude over the indicated latency range. These maps show a rear view of the head and employ an orthogonal projection. The dots on the schematic heads represent the electrode positions. Each isocontour line indicates a change of 0.4 uV for the voltage maps or 4.0 uV/m ~ for the CSD maps.
then shifted to the ipsilateral hemisphere over the inter- val from 75-150 ms. In contrast, the N1 component was primarily focused over the contralateral hemisphere (a weak ipsilateral N1 focus was present after the time
period shown here). The contralateral N1 focus emerged at posterior parietal sites at 100-125 ms and then moved ventrally toward occipital-temporal sites by 150-175 ms. Similar effects were observed for the right visual field
Attention-Sensitive Visual ERPs 47
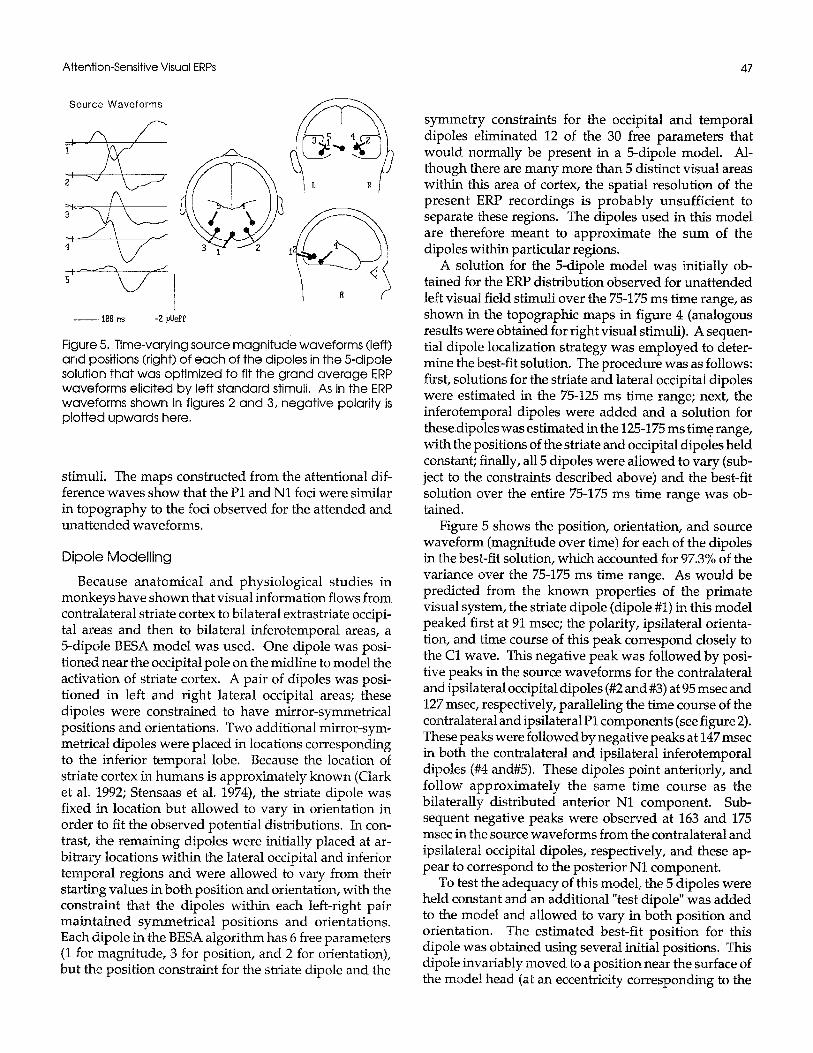
S o u r c e W a v e f o r m s
Z
- - 1 8 8 ns -Z pUeff
Figure 5. Time-varying source magnitude waveforms (left) and positions (right) of each of the dipoles in the 5-dipole solution that was optimized to fit the grand average ERP waveforms elicited by left standard stimuli. As in the ERP waveforms shown in figures 2 and 3, negat ive polarity is plotted upwards here.
stimuli. The maps constructed from the attentional dif- ference waves show that the P1 and N1 foci were similar in topography to the foci observed for the attended and unattended waveforms.
Dipo le Mode l l i ng
Because anatomical and physiological studies in monkeys have shown that visual information flows from contralateral striate cortex to bilateral extrastriate occipi- tal areas and then to bilateral inferotemporal areas, a 5-dipole BESA model was used. One dipole was posi- tioned near the occipital pole on the midline to model the activation of striate cortex. A pair of dipoles was posi- tioned in left and right lateral occipital areas; these dipoles were constrained to have mirror-symmetrical positions and orientations. Two additional mirror-sym- metrical dipoles were placed in locations corresponding to the inferior temporal lobe. Because the location of striate cortex in humans is approximately known (Clark et al. 1992; Stensaas et al. 1974), the striate dipole was fixed in location but allowed to vary in orientation in order to fit the observed potential distributions. In con- trast, the remaining dipoles were initially placed at ar- bitrary locations within the lateral occipital and inferior temporal regions and were allowed to vary from their starting values in both position and orientation, with the constraint that the dipoles within each left-right pair maintained symmetrical positions and orientations. Each dipole in the BESA algorithm has 6 free parameters (1 for magnitude, 3 for position, and 2 for orientation), but the position constraint for the striate dipole and the
symmetry constraints for the occipital and temporal dipoles eliminated 12 of the 30 free parameters that would normally be present in a 5-dipole model. Al- though there are many more than 5 distinct visual areas within this area of cortex, the spatial resolution of the present ERP recordings is probably unsufficient to separate these regions. The dipoles used in this model are therefore meant to approximate the sum of the dipoles within particular regions.
A solution for the 5-dipole model was initially ob- tained for the ERP distribution observed for unattended left visual field stimuli over the 75-175 ms time range, as shown in the topographic maps in figure 4 (analogous results were obtained for right visual stimuli). A sequen- tial dipole localization strategy was employed to deter- mine the best-fit solution. The procedure was as follows: first, solutions for the striate and lateral occipital dipoles were estimated in the 75-125 ms time range; next, the inferotemporal dipoles were added and a solution for thesedipoles was estimated in the 125-175 ms time range, with the positions of the striate and occipital dipoles held constant; finally, all 5 dipoles were allowed to vary (sub- ject to the constraints described above) and the best-fit solution over the entire 75-175 ms time range was ob- tained.
Figure 5 shows the position, orientation, and source waveform (magnitude over time) for each of the dipoles in the best-fit solution, which accounted for 97.3% of the variance over the 75-175 ms time range. As would be predicted from the known properties of the primate visual system, the striate dipole (dipole #1) in this model peaked first at 91 msec; the polarity, ipsilateral orienta- tion, and time course of this peak correspond closely to the C1 wave. This negative peak was followed by posi- tive peaks in the source waveforms for the contralateral and ipsilateral occipital dipoles (#2 and #3) at 95 msec and 127 msec, respectively, paralleling the time course of the contralateral and ipsilateral P1 components (see figure 2). These peaks were followed by negative peaks at 147 msec in both the contralateral and ipsilateral inferotemporal dipoles (#4 and#5). These dipoles point anteriorly, and follow approximately the same time course as the bilaterally distributed anterior N1 component. Sub- sequent negative peaks were observed at 163 and 175 msec in the source waveforms from the contralateral and ipsilateral occipital dipoles, respectively, and these ap- pear to correspond to the posterior N1 component.
To test the adequacy of this model, the 5 dipoles were held constant and an additional "test dipole" was added to the model and allowed to vary in both position and orientation. The estimated best-fit position for this dipole was obtained using several initial positions. This dipole invariably moved to a position near the surface of the model head (at an eccentricity corresponding to the

48 Gonzalez et at.
skull), and widely different final positions were obtained depending upon the initial position. These results indi- cate that the 5-dipole solution can provide an adequate account for the major sources of voltage topography variance in the 75-175 ms latency window.
To test the adequacy of this 5-dipole model in account- ing for the ERPs elicited by attended stimuli, the dipole parameters were held constant and the model was ap- plied to the waveforms elicited by the attended left stand- ards. Although this solution had been optimized for the unattended waveforms, including both signal and noise information, it was able to account for 96.4% of the variance for the attended waveforms. A mirror-sym- metrical 5-dipole model was also able to account for 95.8% and 94.3% of the variance for the unattended and attended right visual field stimuli, respectively. The close fit of this model for both attended and unattended waveforms is consistent with the proposal that the effects of attention in this latency range reflect an amplitude modulation of the exogenous components rather than the addition of endogenous activity from different generator sources. To further assess this proposal, test dipoles were added to the model using the data from the attended stimuli. As was observed for the unattended waveforms, no consistent test dipole solution was obtained for the attended waveforms. Once again, the test dipole was found to move to a location outside of the brain, with a final position that depended strongly on the dipole's initial position. This finding is consistent with the proposal that attention modulates exogenous sensory responses and does not lead to the activation of addition- al brain regions during the period from 75 to 175 ms post-stimulus. However, there may also be slower, later, endogenous attention effects that could not observed here due to the use of high-pass filtering and a short analysis interval.
As an additional test of the relationship between the dipoles in this model and the ERP attention effects, statis- tical analyses were appl ied to the dipole source waveforms to determine whether the magnitude of ac- tivity for a given dipole was modulated by attention. In these analyses, the dipole solution from the grand average was applied to the single-subject ERP data and the resulting source waveforms were then measured for each subject in the same manner as the original ERP waveforms. In accord with the ERP waveform analysis, there was no significant effect of attention in the C1 latency range for the dipole positioned in striate cortex (F<I). The lateral extrastriate dipoles, in contrast, ex- hibited greater magnitudes for attended stimuli than for unattended stimuli in both the P1 and N1 latency ranges (P1:F(1,13) = 5.57, p<.05; NI: F(1,13) = 8.63, p<.02). At- tended stimuli also elicited significantly larger in- ferotemporal responses than unattended stimuli in the
N1 latency range (F(1,13) = 5.81, p<.05). No statistically significant attention effects were observed in the P1 or N1 latency ranges for the striate dipole. These results sup- port the conclusion that the P1 and N1 attention effects arise primarily from lateral extrastriate and inferotem- poral cortices, with no effect of attention in the initial striate response.
Discussion
As in previous studies of visual-spatial attention (reviewed above), the present study found that the sen- sory-evoked P1 and N1 components were larger for at- tended stimuli than for unattended stimuli, consistent with the proposal that spatial attention influences processing at an early, sensory level. No significant ef- fects of attention were observed for the C1 component, however, suggesting that spatial attention operates after visual information has passed through striate cortex, where the C 1 component is hypothesized to be generated (Jeffreys and Axford 1972; Clark 1993). The stimuli of the present experiment elicited only a small C1 component, however, and clearer evidence for the insensitivity of C1 to attentional manipulation can be found in previous studies (Clark 1993; Mangun et al. 1993).
Maps of voltage and CSD topography in the present experiment were consistent with previous observations that the P1 wave was composed of an initial component arising in contralateral occipital cortex and a second, later source arising in the ipsilateral hemisphere (Mangun and Hillyard 1990; Rugg, Lines, and Milner 1984; Saron and Davidson 1989). Consistent with the proposal that the delayed ipsilateral P1 focus is generated within the un- derlying ipsilateral hemisphere and depends upon cal- losal transfer of visual information, Mangun et al. (1991) found that the ipsilateral CSD focus was absent in "split- brain" patients who had previously undergone surgical section of the corpus callosum. Although the ipsilateral P1 component had a longer latency than the contralateral P1 in the present and previous studies, the ipsilateral amplitude was as large or larger than the contralateral focus, possibly due to partial cancellation from the N1 component at contralateral sites.
The focus of the N1 component initially appeared over posterior parietal cortex and then moved ventrolaterally toward the lateral occipital scalp. This parietal-to-occipi- tal shift in the voltage and CSD foci has at least two plausible explanations. First, it may simply reflect the sequential activation of parietal and lateral occipital gen- erator sources. Alternatively, this shift may have been caused by partial temporal overlap between the P1 and N1 components: the P1 may have partially cancelled out the N1 over lateral occipital sites initially, allowing the parietal portion of the N1 surface field to dominate until

Attention-Sensitive Visual ERPs 49
the P1 subsided. This second possibility is consistent with the results of the dipole modelling procedure, in which parietal dipoles were not necessary to provide a good fit and "test" dipoles were not attracted to parietal cortex when dipoles were placed in occipital and tem- poral areas. However, while the dipole modelling results indicate that parietal cortex was not the primary source of the N1 wave, we cannot completely rule out the pos- sibility of a parietal contribution to the N1 wave, which might be more evident under different stimulus and /or task conditions.
The dipole modelling procedure indicated that the voltage topography from 75-175 ms post-stimulus could be explained, with relatively low residual variance, by a simple model consisting of a striate dipole and symmetri- cal pairs of dipoles in lateral occipital and inferior oc- cipito-temporal areas. This configuration is similar to models of electrical and magnetic visual responses described previously (e.g. Simpson, Scherg, Ritter and Vaughan 1990; Aine, Supek and George, in press), in which striate, lateral occipital, and inferotemporal dipoles were postulated. As shown by Aine, Bodis- Wollner and George (1990), however, the distribution of activity may depend strongly on stimulus parameters such as spatial frequency, which may limit the com- parability of the present model with previous studies.
In the present model, a single pair of dipoles in lateral occipital cortex accounted for both the P1 and N1 waves at posterior electrode sites. Although this would appear to indicate that the P1 and N1 waves arise from a single, polarity-inverting source, this result is also consistent with the existence of separate, but nearby, generator sources for these components. In order to distinguish between these possible interpretations, it would be neces- sary to increase the signal-to-noise ratio, obtain record- ings from more electrodes, and /o r utilize additional sources of information about the anatomy and physiol- ogy of the proposed generator sources. Since the P1 and N1 wave are affected differently by a number of ex- perimental manipulations, however, it seems likely that they arise from different sources (see Luck et al. 1990, in press; Mangun and Hillyard 1991). The present results also suggest that the N1 waves observed at anterior and posterior electrode sites were generated by different sources: whereas the posterior N1 wave was primarily explained by the lateral occipital dipoles, the anterior N1 wave was primarily explained by the contralateral in- ferotemporal dipole. This conclusion accords with pre- vious dissociations observed between the anterior and posterior N1 waves (Luck et al. in press) and with the fact that the anterior N1 typically onsets earlier than the posterior N1.
The ERP waveforms, voltage and CSD maps, and dipole modelling results from the present study together
provide converging evidence for the hypothesis that visual-spatial attention modulates sensory processing in lateral extrastriate cortex but does not affect earlier evoked activity arising from striate cortex (Clark 1993; Mangtm et al. 1993). This conclusion also parallels the results of single-unit studies in non-human primates showing that attention modulates responses in ex- trastriate, but not striate, cortex (see Desimone, Wes- singer, Thomas and Schneider 1990). Studies in humans using positron emission tomography have also identified specific zones of ventral and lateral extrastriate cortex that show enhanced metabolic activity during visual at- tention (Corbetta et al. 1991; Haxby et al. 1991). Previous psychophysical studies have shown that attention in- fluences the speed and accuracy of target detection and discrimination processes (Hawkins et al. 1990; Luck et al. in press; Posner 1980), and the present neurophysiologi- cal findings suggest that these perceptual effects are produced at least in part by a selective modulation of visual information flow at an early, sensory level of processing in extrastriate cortex.
References Aine, C.J., Bodis-Woliner, I. and George, J.S. Generators of
visually evoked neuromagnetic responses: Spatial-frequen- cy segregation and evidence for multiple sources. In: S. Sato (Ed.), Advances in Neurology: Magnetoencephalography, 54. Raven Press, New York, 1990: 141-155.
Aine, C.J., Supek, S. and George, J.S. Temporal dynamics of visual-evoked magnetic sources: Effect of stimulus parameters and selective attention. International Journal of Neuroscience, in press.
Clark, V.P., Courchesne, E. and Grafe, M. In vivo myeloarchitec- tonic analysis of human striate and extrastriate cortex using magnetic resonance imaging. Cerebral Cortex, 1992, 2: 417- 424.
Clark, V.P. Localization and identification of functional regions within the human visual system. Doctoral dissertation, University of California, San Diego, 1993.
Corbetta, M., Miezin, F.M., Dobmeyer, S., Shulman, G.L. and Petersen, S.E. Selective and divided attention during visual discriminations of shape, color, and speed: functional anatomy by positron emission tomography. Journal of Neuroscience, 1991,11: 2383-2402.
Dale, A.M. and Sereno, M.I. Improved localization of cortical activity by combining EEG and MEG with MRI cortical surface reconstruction: A linear approach. Journal of Cogni- tive Neuroscience, 1993, 5:162-176.
Desimone, R. and Ungerleider, L.G. Neural mechanisms of visual processing in monkeys. In: F. Boiler and J. Grafman (Eds.), Handbook of Neuropsychology, 2. Elsevier, Amster- dam, 1989: 267-299.
Desimone, R., Wessinger, M., Thomas, L. and Schneider, W. Attentional control of visual perception: Cortical and subcor- tical mechanisms. Cold Spring Harbor Symposium on Quantitative Biology, 1990, 55: 963-971.

50 Gonzalez et al,
Duncan, J. The locus of interference in the perception of simul- taneous stimuli. Psychological Review, 1980, 87: 272-300.
Eason, R., Harter, M. and White, C. Effects of attention and arousal on visually evoked cortical potentials and reaction time in man. Physiology and Behavior, 1969, 4: 283-289.
Eason, R.G., Oakley, M. and Flowers, L. Central neural influen- ces on the human retina during selective attention. Physiological Psychology, 1983,11:18-28.
Felleman, D.J. and Van Essen, D.C. Distributed hierarchical processing in the primate cerebral cortex. Cerebral Cortex, 1991,1: 1-47.
Hackley, S.A., Woldorff, M. and Hillyard, S.A. Cross-modal selective attention effects on retinal, myogenic, brainstem and cerebral evoked potentials. Psychophysiology, 1990, 27: 195-208.
Harter, M.R. and Anllo-Vento, L. Visual-spatial attention: Preparation and selection in children and adults. In: C.H.M. Brunia, G. Mulder and M.N. Verbaten (Eds.), Event-Related Potentials of the Brain. Elsevier, Amsterdam, 1991: 183-194.
Hawkins, H.L., Hillyard, S.A., Luck, S.J., Mouloua, M., Down- ing, C.J. and Woodward, D.P. Visual attention modulates signal detectability. Journal of Experimental Psychology: Human Perception and Performance, 1990,16: 802-811.
Haxby, J.V., Grady, C.L., Horwitz, B., Ungerleider, L.G., Mishikin, M., Carson, R.E., Herscovitch, P., Schapiro, M.B. and Rapoport, S.I. Dissociation of object and spatial visual processing pathways in human extrastriate cortex. Proceed- ings of the National Academy of Sciences, 1991, 88: 1621- 1625.
Henderson, J.M. Stimulus discrimination following covert at- tentional orienting to an exogenous cue. Journal of Ex- per imenta l Psychology: Human Perception and Performance, 1991,17: 91-106.
Jeffreys, D.A. and Axford, J.G. Source locations of pattern- specific components of human visual evoked potentials. I: Components of striate cortical origin. Experimental Brain Research, 1972, 16: 1-21.
Jennings, J.R. and Wood, C.C. The e-adjustment procedure for repeated-measures analyses of variance. Psychophysiology, 1976,13: 277-278.
Jonides, J. Voluntary versus automatic control over the mind's eye's movement. In: J.B. Long and A.D. Baddeley (Eds.), Attention and Performance, IX. Erlbaum, Hillsdale, New Jersey, 1981.
Luck, S.J., Heinze, H.J., Mangun, G.R. and Hillyard, S.A. Visual event-related potentials index focused attention within bilateral stimulus arrays. IL Functional dissociation of P1 and N1 components. Electroencephalography and Clinical Neurophysiology, 1990, 75: 528-542.
Luck S.J., Fan, S. and Hillyard, S.A. Attention-related modula- r-ion of sensory-evoked brain activity in a visual search task. Journal of Cognitive Neuroscience, 1993, 5: 188-195.
Luck, S.J., Hillyard, S.A., Mouloua, M., Woldorff, M.G., Clark, V.P. and Hawkins, H.L. Effects of spatial cuing on luminance detectability: Psychophysical and electrophysiological evidence for early selection. Journal of Experimental Psychology: Human Perception and Performance, in press.
Mangun, G.R., Hansen, J.C. and Hillyard, S.A. Electroretinograms reveal no evidence for centrifugal modulation of retinal input during selective attention in
man. Psychophysiology, 1986, 23: 156-165. Mangun, G.R. and Hillyard, S.A. Spatial gradients of visual
attention: Behavioral and electrophysiological evidence. Electroencephalography and Clinical Neurophysiology, 1988, 70: 417-428.
Mangun, G.R. and Hillyard, S.A. Electrophysiological studies of visual selective attention in humans. In: A.B. Scheibel and A.F. Wechsler (Eds.), Neurobiology of Higher Cognitive Function. Guilford, New York, 1990: 271-295.
Mangun, G.R. and Hillyard, S.A. Modulations of sensory- evoked brain potentials indicate changes in perceptual processing during visual-spatial priming. Journal of Ex- perimental Psychology: Human Perception and Perfor- mance, 1991, 17: 1057-1074.
Mangun, G.R., Luck S.J., Gazzaniga, M.S. and Hiltyard, S.A. Electrophysiological measures of interhemispheric transfer of visual information in split brain patients. Society for Neuroscience Abstracts, 1991,17: 866.
Mangun, G.R., Hillyard, S.A. and Luck S.J. Electrocortical sub- strates of visual selective attention. In: D. Meyer and S. Kornblum (Eds.), Attention and Performance XIV. MIT Press, Cambridge, Massachusetts, 1993: 219-243.
McCarthy, G. and Scabini, D. Attention modifies event-related potentials recorded from human visual cortex. IBRO World Congress of Neuroscience, 1991, 3: 176.
Mitzdorf, U. Current source-density method and application in cat cerebral cortex: Investigation of evoked potentials and EEG phenomena. Physiological Review, 1985, 65: 37-100.
Naatanen, R. Attention and brain function. Lawrence Erlbaum Associates, Hillsdale, New Jersey, 1992.
Ossenblok, P. The sources of the pattern VEP in man. University of Amsterdam, Amsterdam, 1992.
Pernier, J., Perrin, F. and Bertrand, O. Scalp current density fields: Concept and properties. Electroencephalography and C1Lnical Neurophysiology, 1988, 69: 385-389.
Perrin, F., Bertrand, O. and Pernier, J. Scalp current density mapping: Value and estimation from potential data. IEEE Transactions on Biomedical Engineering, 1987: 283-288.
Perrin, F., Pernier, J., Bertrand, O. and Echallier, J.F. Spherical splines for scalp potential and current density mapping. Electroencephalography and Clinical Neurophysiology, 1989, 72: 184-187.
Posner, M.I. Orienting of attention. Quarterly Journal of Ex- perimental Psychology, 1980, 32: 3-25.
Rugg, M.D., Lines, C.R. and Milner, A.D. Visual evoked poten- tials to lateralized visual stimuli and the measurement of interhemispheric transmission time. Neuropsychologia, 1984, 22: 215-225.
Rugg, M.D., Milner, A.D., Lines, C.R. and Phalp, R. Modulation of visual event-related potentials by spatial and non-spatial visual selective attention. Neuropsychologia, 1987, 25: 85-96.
Scherg, M. Fundamentals of dipole source potential analysis. In: F. Grandori, M. Hoke and G.L. Romani (Eds.), Auditory Evoked Magnetic Fields and Potentials. Advances in Audiol- ogy, 6. Karger, Basel 1990: 40-69.
Scherg, M. and Berg, P. Use of prior knowledge in brain electromagnetic source analysis. Brain Topography, 1991, 4: 143-150.
Simpson, G.V., Scherg, M., Ritter, W. and Vaughan, H.G., Jr. Localization and temporal activity functions of brain sources

Attention-Sensitive Visual ERPs 5 ]
generating the human visual ERP. In: C.H.Mo Brunia, A.W.K. Gaillard and A. Kok (Eds.), Psychophysiological Brain Re- search, 1. Tilburg University Press, 1990: 99-105.
Sperling, G. A unified theory of attention and signal detection. In: R. Parasuraman and D.R. Davies (Eds.), Varieties of Attention. Academic Press, London, 1984: 103-181.
Stensaas, S.S., Eddington, D.K. and Dobelle, W.H. The topog- raphy and variability of the primary visual cortex in man. Journal of Neurosurgery, 1974, 40: 747-755:
Woldorff, M., Hansen, J.C. and Hillyard, S.A. Evidence for effects of selective attention to the mid latency range of the
human auditory event related potential. In: R. Johnson (Ed.), Current Research in Event-Related Brain Potentials. El- sevier, Amsterdam, 1987: 146-154.
Woldorff, M. Distortion of ERP averages due to overlap from temporally adjacent ERPS: Analysis and correction. Psychophysiology, 1993, 30: 38.
Woldorff, M.G., Gallen, C.C., Hampson, S.A., Hillyard, S.A., Pantev, C., Sobel, D. and Bloom, F.E. Modulation of early sensory processing in human auditory cortex during auditory selective attention. Proceedings of the National Academy of Sciences, 1993, 90: 8722-8726.