Source mechanism and surface wave excitation for two earthquakes in northern Baja California, Mexico
25
Geophys. J. R. astr. SOC. (1983) 73, 739-163 Source mechanism and surface wave excitation for two earthquakes in northern Baja California, Mexico F. Alejandro Nava Instituto de Investigaciones en Matemdticas Aplicadas y en James N. Brune Institute of Geophysics and Planetary Physics, scripps Institution of Oceanography, University of California, Sari Diego, La Jolla, California, (JSA Sisternas, Universidad Nacional Autdnoma de Mdxico 20, DF Mdxico Received 1982 December 9 ; in original form 1980 July 24 Summary. Two earthquakes of comparable local magnitude from different regions of northern Baja California (the 1975 July 17 Pino Solo earthquake, ML = 5.1, from the Peninsular Ranges region, and the 1976 December 7 Mesa de Andrade earthquake, ML = 5.3, from the Colorado River Delta region) are studied in detail to determine possible causes for the observed stronger exci- tation of surface waves by earthquakes from the Delta region relative to earthquakes of comparable local magnitude in the Peninsular Ranges region. Data from distant stations are complemented with data from aftershock studies using local arrays and, for the Mesa de Andrade earthquake, with data from two strong motion stations. The strong motion records for ihe Mesa de Andrade earthquake show that it consisted of two events, 45 s apart, which produced maximum recorded horizontal accelerations of 0.21 and 0.24g, respectively, at a distance of 18 km from the epicentre. Synthetic seismograms are used to help determine the depth of these events and their source time functions. Both events are relatively simple. The second event is sharp and impulsive and could be thought of as an aftershock, since it has a considerably smaller moment than the first event, even though its recorded acceleration was higher. Comparison of measured parameters shows that while the local magnitude of the Mesa de Andrade earthquake is only 0.2 units larger than the Pino Solo earthquake and its source dimension is - 2.2 times larger (source areas - 4.8 times larger), its moment is larger by a factor of 6.2-8.5. This is approximately explained by the cY2 scaling law. However, the near source spectra and accelerations recorded on the strong motion accelerograph at Riito, at a distance of about 18 km, are considerably larger than predicted by the scaling law. This is probably a results of high stress drop asperities on the fault surface, although near field focusing (directivity) may also have contributed. 25 by guest on August 4, 2016 http://gji.oxfordjournals.org/ Downloaded from
-
Upload
independent -
Category
Documents
-
view
2 -
download
0
Transcript of Source mechanism and surface wave excitation for two earthquakes in northern Baja California, Mexico

Geophys. J. R . astr. SOC. (1983) 73, 739-163
Source mechanism and surface wave excitation for two earthquakes in northern Baja California, Mexico
F. Alejandro Nava Instituto d e Investigaciones en Matemdticas Aplicadas y en
James N. Brune Institute of Geophysics and Planetary Physics, scripps Institution of Oceanography, University of California, Sari Diego, La Jolla, California, (JSA
Sisternas, Universidad Nacional Autdnoma de Mdxico 20, DF Mdxico
Received 1982 December 9 ; in original form 1980 July 24
Summary. Two earthquakes of comparable local magnitude from different regions of northern Baja California (the 1975 July 17 Pino Solo earthquake, ML = 5.1, from the Peninsular Ranges region, and the 1976 December 7 Mesa de Andrade earthquake, ML = 5.3, from the Colorado River Delta region) are studied in detail to determine possible causes for the observed stronger exci- tation of surface waves by earthquakes from the Delta region relative to earthquakes of comparable local magnitude in the Peninsular Ranges region. Data from distant stations are complemented with data from aftershock studies using local arrays and, for the Mesa de Andrade earthquake, with data from two strong motion stations.
The strong motion records for ihe Mesa de Andrade earthquake show that it consisted of two events, 45 s apart, which produced maximum recorded horizontal accelerations of 0.21 and 0.24g, respectively, a t a distance of 18 km from the epicentre. Synthetic seismograms are used to help determine the depth of these events and their source time functions. Both events are relatively simple. The second event is sharp and impulsive and could be thought of as an aftershock, since it has a considerably smaller moment than the first event, even though its recorded acceleration was higher.
Comparison of measured parameters shows that while the local magnitude of the Mesa de Andrade earthquake is only 0.2 units larger than the Pino Solo earthquake and its source dimension is - 2.2 times larger (source areas - 4.8 times larger), its moment is larger by a factor of 6.2-8.5. This is approximately explained by the cY2 scaling law. However, the near source spectra and accelerations recorded on the strong motion accelerograph at Riito, at a distance of about 18 km, are considerably larger than predicted by the scaling law. This is probably a results of high stress drop asperities on the fault surface, although near field focusing (directivity) may also have contributed.
25
by guest on August 4, 2016
http://gji.oxfordjournals.org/D
ownloaded from
740
Introduction
The study reported in this paper has an important bearing on the general problem of under- standing earthquake mechanism and, more specifically, the problems of seismic discrimi- nation between earthquakes and explosions and understanding earthquake strong motion. One of the main discrimination criteria used at present is the M, versus m b criterion (Liebermann & Pomeroy 1969; Marshall & Basham 1972), which compares the relative exci- tation of long-period surface waves used to determine M, and the short-period body waves used to deteimine mb. Points representing earthquakes and explosions lie on different regions of a plot of M, versus mb because of the greater relative excitation of surface waves by earthquakes. The earthquake population on Ms/mb diagrams shows a large scatter, and several authors have noticed a regional dependence in the scatter. They have suggested that the M,/mb discriminant be applied regionally. With respect to strong ground motion, it is critically important to know how ground acceleration and velocity scale with both local magnitudes M L , and surface wave magnitude M,, so that better predictions can be made for earthquake resistant design. This study addresses that problem.
Brune, Espinosa & Oliver (1963) noticed a region of anomalously low surface wave exci- tation in northern Baja California while studying events from the California-Nevada area. In contrast, the Gulf of California area was identified as a region of large surface wave exci- tation by Wyss & Brune (1971). Thatcher & Brune (1971) found that earthquakes from a swarm in Wagner Basin in the northern end of the Gulf of California also excited surface waves more than earthquakes in northern Baja California with similar body wave excitation.
Thatcher (1 972) studied the regional variations of spectral parameters in northern Baja California from observations at the California Institute of Technology (Cal Tech) stations in southern California, especially BAR, PLM and PAS. The spectra were interpreted in terms of source parameters such as moment, source dimension and stress drop. Thatcher inferred that northern Baja sources have dimensions that are typically a factor of 4 smaller than the dimension of Gulf events of comparable local magnitude. Conversely, moments for the Gulf events were about an order of magnitude larger (for the same M L ) than those for northern Baja. The average stress drop for the Gulf earthquakes was found to be lower than the average for northern Baja California.
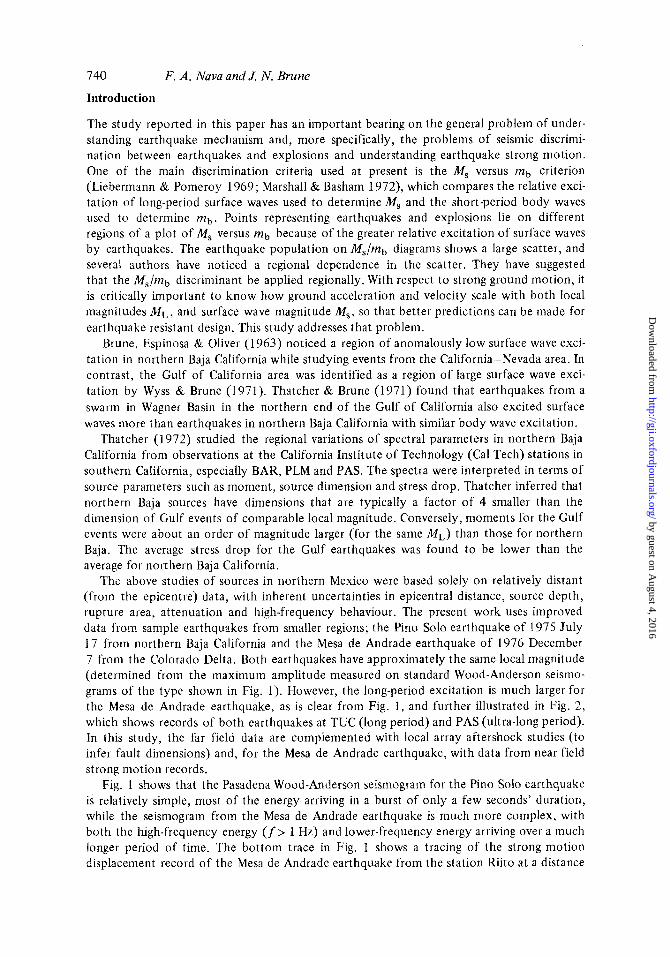
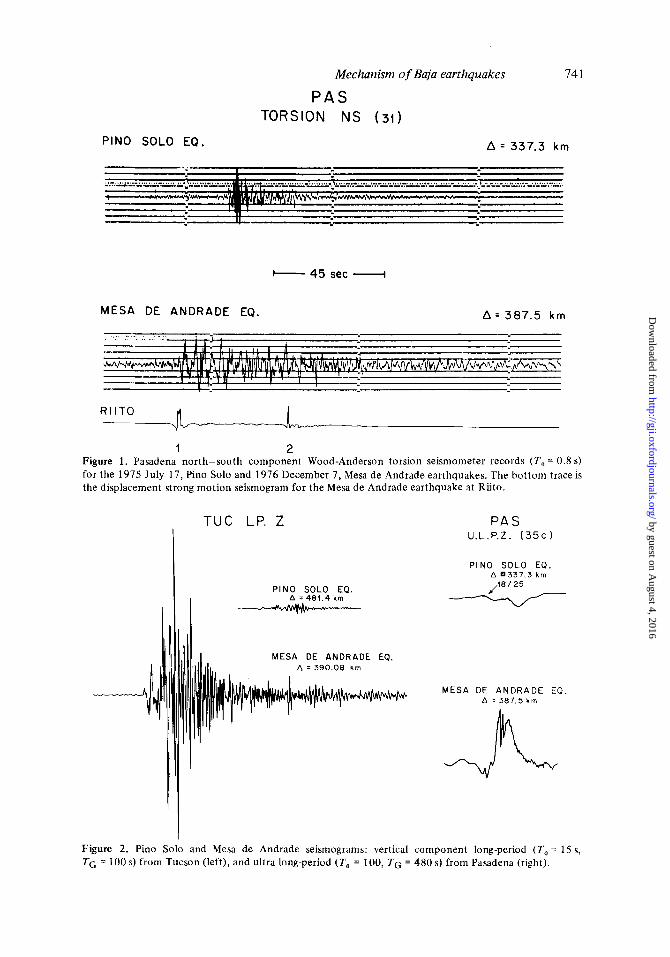
The above studies of sources in northern Mexico were based solely on relatively distant (from the epicentre) data, with inherent uncertainties in epicentral distance, source depth, rupture area, attenuation and high-frequency behaviour. The present work uses improved data from sample earthquakes from smaller regions; the Pino Solo earthquake of 1975 July 17 from northern Baja California and the Mesa de Andrade earthquake of 1976 December 7 from the Colorado Delta. Both earthquakes have approximately the same local magnitude (determined from the maximum amplitude measured on standard Wood-Anderson seismo- grams of the type shown in Fig. 1). However, the long-period excitation is much larger for the Mesa de Andrade earthquake, as is clear from Fig. 1, and further illustrated in Fig. 2, which shows records of both earthquakes at TUC (long period) and PAS (ultra-long period). In this study, the far field data are complemented with local array aftershock studies (to infer fault dimensions) and, for the Mesa de Andrade earthquake, with data from near field strong motion records.
Fig. 1 shows that the Pasadena Wood-Anderson seismogram for the Pino Solo earthquake is relatively simple, most of the energy arriving in a burst of only a few seconds’ duration, while the seismogram from the Mesa de Andrade earthquake is much more complex, with both the high-frequency energy (f> 1 Hz) and lower-frequency energy arriving over a much longer period of time. The bottom trace in Fig. 1 shows a tracing of the strong motion displacement record of the Mesa de Andrade earthquake from the station Riito at a distance
F. A . Nava and J. N. Brune
by guest on August 4, 2016
http://gji.oxfordjournals.org/D
ownloaded from
Mechanism of Baja earthquakes
P A S TORSION NS (31)
74 1
PINO SOLO EQ. A = 337.3 km - -
Y
MESA DE ANDRADE EQ. A = 387.5 k m
R I I T 0
1 2 Figure 1. Pasadena north-south component Wood-Anderson torsion seismometer records (To = 0.8 S)
for the 1975 July 17, Pino Solo and 1976 December 7, Mesa de Andrade earthquakes. The bottom trace is the displacement strong motion seismogram for the Mesa d e Andrade earthquake at Riito.
P A S U.L.P.Z. ( 3 5 c l
P I N O SOLO €0. A 337.3 k m
PINO SOLO €0. A = 484.4 km -
MESA DE ANDRADE EQ. A = 390.08 km
M E S A DE ANDRADE EQ. A = 387.5 km
Figure 2. Pino Solo and Mesa de Andrade seismograms: vertical component long-period (To = 15 s, TG = 100 s) from Tucson (left), and ultra long-period (To = 100, TG = 480 S ) from Pasadena (right).
by guest on August 4, 2016
http://gji.oxfordjournals.org/D
ownloaded from
742
of about 18 km (discussed later), and indicates that the actual energy release occurred in two relatively simple events, the first containing considerably more low-frequency energy than the second. Fig. 1 indicates that propagation path effects have been important in causing the complexity observed in the Mesa de Andrade seismogram at Pasadena, and less important in the case of the Pino Solo seismogram.
F. A . Nava and J. N. Brune
The Pino Solo earthquake
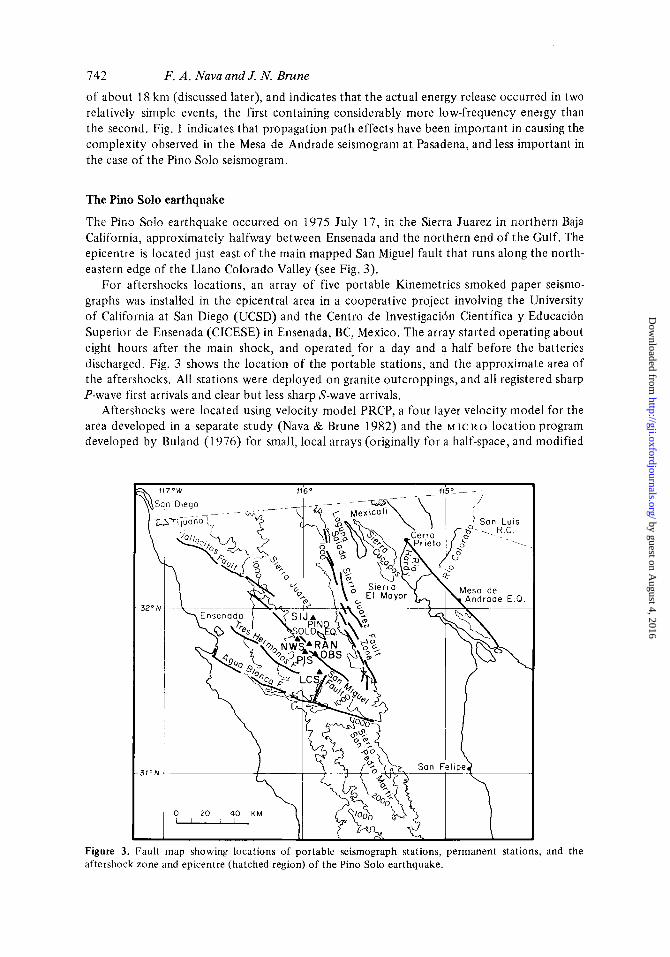
The Pino Solo earthquake occurred on 1975 July 17, in the Sierra Juarez in northern Baja California, approximately halfway between Ensenada and the northern end of the Gulf. The epicentre is located just east of the main mapped San Miguel fault that runs along the north- eastern edge of the Llano Colorado Valley (see Fig. 3 ) .
For aftershocks locations, an array of five portable Kinemetrics smoked paper seismo- graphs was installed in the epicentral area in a cooperative project involving the University of California at San Diego (UCSD) and the Centro de Investigacidn Cientifica y Educacidn Superior de Ensenada (CICESE) in Ensenada, BC, Mexico. The array started operating about eight hours after the main shock, and operated for a day and a half before the batteries discharged. Fig. 3 shows the location of the porfable stations, and the approximate area of the aftershocks. All stations were deployed on granite outcroppings, and all registered sharp P-wave first arrivals and clear but less sharp S-wave arrivals.
Aftershocks were located using velocity model PRCP, a four layer velocity model for the area developed in a separate study (Nava & Brune 1982) and the M I C R O location program developed by Buland (1976) for small, local arrays (originally for a half-space, and modified
Figure 3. Fault map showing locations of portable seismograph stations, permanent stations, and the aftershock zone and epicentre (hatched region) of the Pino Solo earthquake.
by guest on August 4, 2016
http://gji.oxfordjournals.org/D
ownloaded from
Mechanism of Baja earthquakes 743
+ 3 1 ' 5 0 ' N
+ I l 5 O 5 2 . 5 ' W
5 KM. E
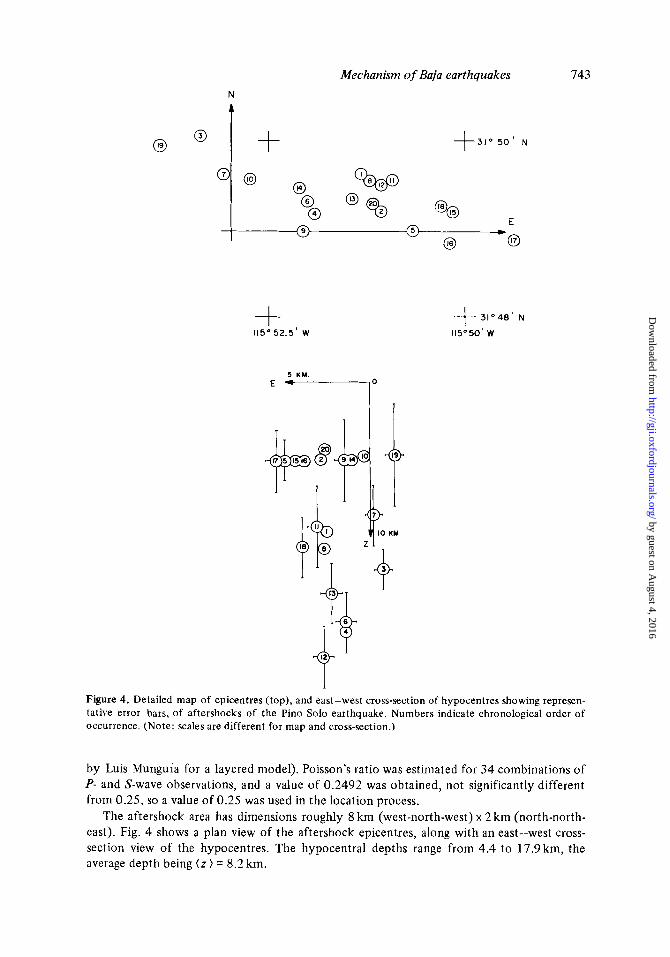
Figure 4. Detailed map of epicentres (top), and east-west cross-section of hypocentres showing represen- tative error bars, of aftershocks of the Pino Solo earthquake. Numbers indicate chronological order of occurrence. (Note: scales are different for map and cross-section.)
by Luis Munguia for a layered model). Poisson's ratio was estimated for 34 combinations of P- and S-wave observations, and a value of 0.2492 was obtained, not significantly different from 0.2.5, so a value of 0.2.5 was used in the location process.
The aftershock area has dimensions roughly 8 km (west-north-west) x 2 km (north-north- east). Fig. 4 shows a plan view of the aftershock epicentres, along with an east-west cross- section view of the hypocentres. The hypocentral depths range from 4.4 to 17.9km, the average depth being ( 2 ) = 8.2 km.
by guest on August 4, 2016
http://gji.oxfordjournals.org/D
ownloaded from
744 F. A. Naua and J. N. Brune
A linear regression for the epicentres defines a strike N 70"W. Consideration of the prob- able errors allows strikes from N55"W to N96"W. As described later, the polarities of the first arrivals from the aftershocks, as recorded on the portable stations, are consistent with a fault plane corresponding to a vertical, strike-slip fault with a strike of N 57"W. This is not inconsistent with the aftershock location data.
The aftershock region, and hence the earthquake itself, is not associated with any known fault. However, the region is between the intensely fractured Sierra Juarez and San Miguel fault zones (see Fig. 3) and hence it is quite reasonable to assume that an active fault exists there. Because of the relatively uniform granitic terrain, the identification of smaller faults is difficult in this region.
Careful relocation of the main event, reinterpreting data from US stations and including data from the Mexican stations at Ensenada and Rio Hardy give a location that within the experimental error lies within the zone of aftershocks (the USGS Earthquake Data Report of 1976 July 8 gives a location some 8.25 km north-east of the aftershock zone).
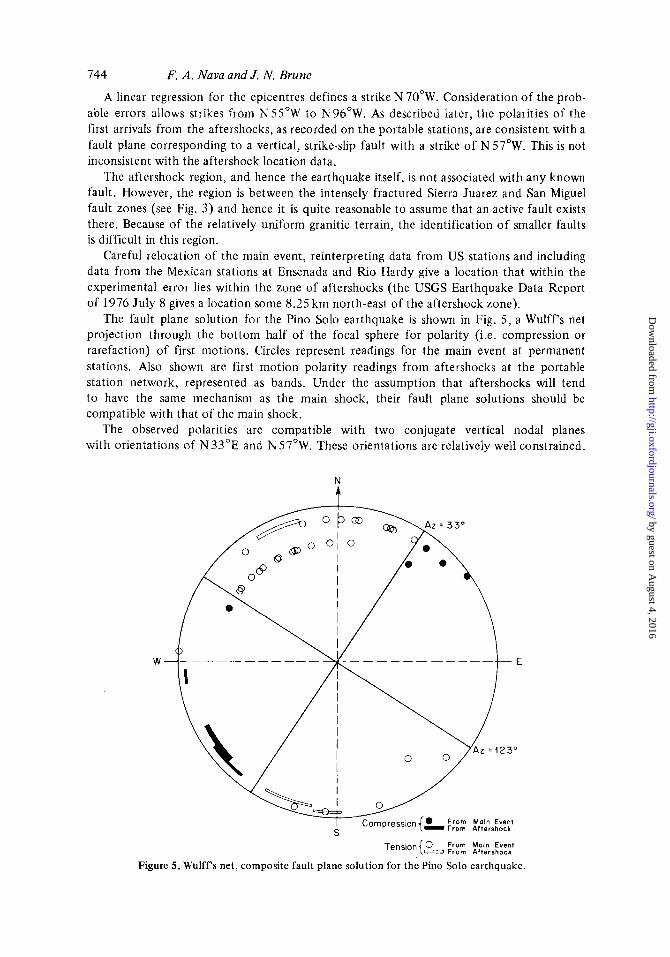
The fault plane solution for the Pino Solo earthquake is shown in Fig. 5, a Wulff's net projection through the bottom half of the focal sphere for polarity (i.e. compression or rarefaction) of first motions. Circles represent readings for the main event at permanent stations. Also shown are first motion polarity readings from aftershocks at the portable station network, represented as bands. Under the assumption that aftershocks will tend to have the same mechanism as the main shock, their fault plane solutions should be compatible with that of the main shock.
The observed polarities are compatible with two conjugate vertical nodal planes with orientations of N33"E and N 57"W. These orientations are relatively well constrained.
N 4
Tension{ 0 From Main Event 0 From Aftershock
Figure 5. Wulff's net, composite fault plane solution for the Pino Solo earthquake.
by guest on August 4, 2016
http://gji.oxfordjournals.org/D
ownloaded from
Mechanism of Baja earthquakes 745
Based on the aftershock distribution, regional tectonics and observed faulting or surface manifestations of other earthquakes in the region, the plane with the strike of N 57OW was assumed to be the fault plane.
P I N O S O L O L O N G - P E R I O D S E I S M O G R A M S F R O M P A S
For the Pino Solo earthquake, the closest station with calibrated long-period instruments was PAS at Cal Tech (distance 337.3 km). The path from epicentre to station is almost completely along the Peninsular Ranges, except at the very end where it crosses some sedi- ments before reaching Pasadena at the foot of the San Gabriel Mountains.
The fundamental Rayleigh and Love modes were extracted from the digitized and notated PAS seismograms by group velocity dispersion curves obtained by moving-window analysis. An estimate of 15 rt 3 km for the source depth, consistent with the arrival time data, was obtained by fitting synthetic seismograms computed with Harkrider's (1 964, 1970) program and the PKCP Peninsular Ranges model, and by comparing the Rayleigh and Love spectra (Tsai & Aki 1970). The details of the above procedures may be found in Nava (1 980).
T H E PINO S O L O E A R T H Q U A K E S O U R C E P A R A M E T E R S
Directly measurable parameters (e.g. magnitudes and moments) and inferred parameters (e.g. source dimension, stress drop, fault displacement, energy, etc.) were computed for the Pino Solo earthquake (for comparison with the corresponding parameters for the Mesa de Andrade earthquake). Local magnitude ML was determined from readings of Wood- Anderson standard seismographs at seven stations in southern California. The average gives ML = 5.1 with a standard deviation u = 0.2 unit. This result agrees quite well with the M L = 5.0 given by the USGS Earthquake Data Report.
The body wave magnitude, m b , was measured for eleven short-period stations ranging in distance from 8.7" to 45", giving an average mb ~ 4 . 9 with a standard deviation of 0 = 0.3. This value agrees perfectly with the value in the USGS Earthquake Data Report, obtained from ten observations at distances ranging from 7.6" to 84.4".
Surface wave magnitude M,, was determined using Marshall & Basham's (1972) formula for eleven stations at distances ranging from 8" to 44.5". This gave an average& = 4.0 with standard deviation u = 0.1.
Moment, M,, was measured by comparing the long-period amplitudes on the observed surface wave records at six stations with those on the synthetic seismograms computed for these stations using Harkrider's (1 964, 1970) program with a known moment of 1 OZSdyne cm. The average moment from all measured values is M o = 3.37 x 10Z3dyne cm, with a standard deviation of 1.4 x lOZ3dyne cm.
The moment was also estimated at high frequencies (- 0.9 Hz) by comparison of the observed BAR Wood-Anderson record with a synthetic seismogram computed using the Aspel-Luco wavenumber integration program (Apse1 & Luco 1978). Comparison with the P-phase amplitude yields Mo = 1.55 x 10²³dyne cm. The S-phase amplitude is harder to read due to the distortion in the baseline, but the moment is consistent with that determined from the P-wave. This estimation of moment from high frequencies is not very reliable, but will be useful in a later discussion of the spectra.
The main evidence for the dimensions of the source area of the Pino Solo earthquake is the distribution of early aftershocks. As mentioned above, the horizontal length of the after- shock area is -7.5 km. Since depth is not very well constrained, a vertical dimension equal
by guest on August 4, 2016
http://gji.oxfordjournals.org/D
ownloaded from
746
to the horizontal is assumed, and a circular rupture area will be used as a first approxi- mation. It is possible that some of the aftershocks may be outside the region of main energy release. Thus the length of the aftershock area might be considered an upper bound to the fault length. If this is the case, exclusion of the events located at the extremes would give a fault length of 5.3 km (see Fig. 4).
The stress drop for the Pino Solo earthquake was estimated using the Keilis-Borok (1960) circular dislocation model which relates the average moment (3.37 x 1OZ3dyne cm) and the source dimensions to the stress drop as Au=(7/16)MO/r3, giving Au 2.7-7.9 bar corresponding to fault dimensions of 7.5 and 5.3 km, respectively. These values fall within the range found by Thatcher (1972) for northern Baja earthquakes. The stress drop and fault dimensions correspond to an average displacement of a few centimetres.
F. A. Nava and J. N. Brune
The Mesa de Andrade earthquake
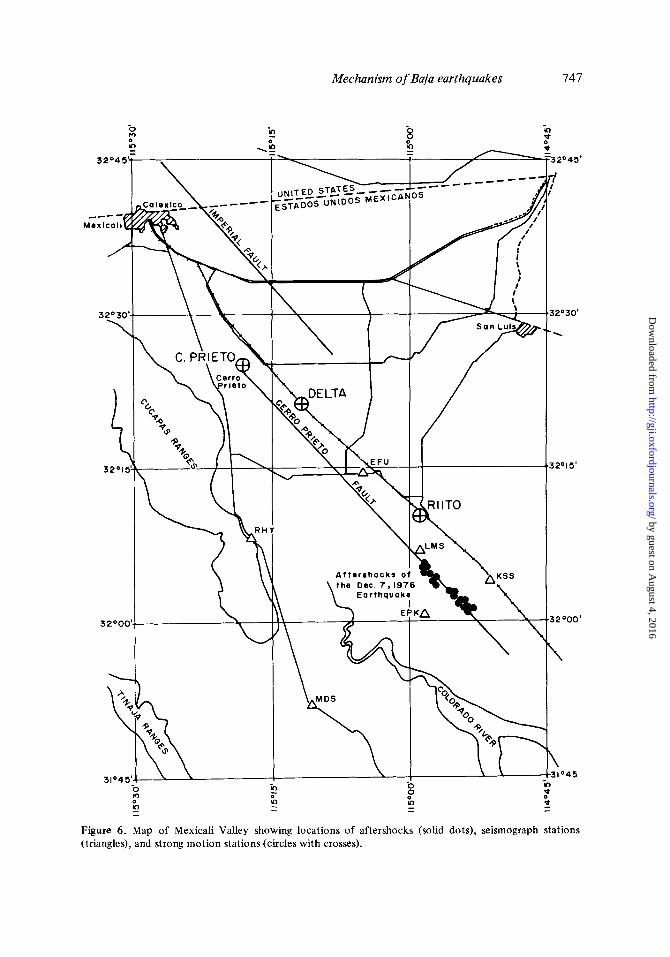
The Mesa de Andrade earthquake occurred just before 1300 hr GMT on 1976 December 7, about 50km south-east of Cerro Prieto in the Colorado River Delta area. Although no surface rupture was documented, sand boils were observed in the Mesa de Andrade area (presumably in the region of rupture at depth).
Less than 24 hr after the mainshock, a net of eight portable smoked paper seismographs was operating in the aftershock area, installed by UCSD in cooperation with CICESE in Ensenada. All the locations were done by Javier Gonzalez at CICESE (see Fig. 6). Positive identification of the S-phase was uncertain, and no S readings were used for these locations, hence depth determinations are not very reliable.
As part of a joint project between Scripps Institution of Oceanography (SIO, UCSD), and Instituto de Ingenieria (UNAM), several strong motion instruments (triaxial, analogue, film recording, SMA-1 s) had been previously installed in northern Baja California (Prince, Brune & Nava 1976). The Mesa de Andrade earthquake triggered three of these instruments, at Riito, Delta and Cerro Prieto. Fig. 6 shows the location of these instruments and the locations of the aftershocks.
The strong motion records show that the Mesa de Andrade earthquake consists of two large events with origin times about 45 s apart, close enough so that the instruments were still recording (triggered by the first event) when the second event occurred, and separated enough so that the energy from the first event was negligible at the time of the arrival of waves from the second event. The maximum horizontal accelerations recorded for the first event were 0.21, 0.17 and 0.04g at Riito, Delta and Cerro Prieto respectively. For the second event, the corresponding accelerations were 0.24,0.13 and 0.04g.
Consideration of the relative arrival times of the various phases on the strong motion records indicates that within the uncertainties the two events had the same epicentre, among the aftershocks (whose epicentres are well determined), approximately 18 km from Riito.
A C C E L E R O G R A M A N A L Y S I S
Henceforth, records will be identified by the name of the station, followed by a digit that identifies the event (i.e. 1 or 2).
The original accelerograph 70mm films were enlarged three times and digitized on a ‘Calma’ digitizer. The equispaced series were corrected for instrument response and integrated to give ground displacement, using the process described by Trifunac & Lee (1973). The processing required judicious choice of a high-pass filter to remove the long-period part of the spectrum introduced by the process of double integration. We found that a high-pass
by guest on August 4, 2016
http://gji.oxfordjournals.org/D
ownloaded from
Mechanism of Baja earthquakes
RllTO B,
747
!
'32O45'
rl I
32O30'
* \
32-15'
32-00'
\
\ -31'45 b
Figure 6. Map of Mexicali Valley showing locations of aftershocks (solid dots), seismograph stations (triangles), and strong motion stations (circles with crosses).
by guest on August 4, 2016
http://gji.oxfordjournals.org/D
ownloaded from
748
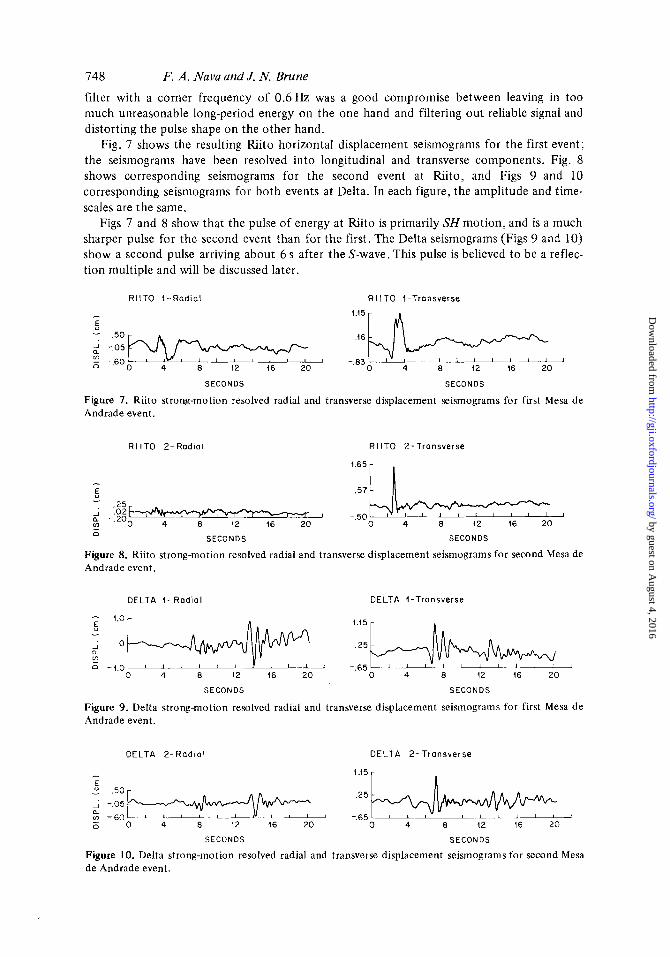
filter with a corner frequency of 0.6Hz was a good compromise between leaving in too much unreasonable long-period energy on the one hand and filtering out reliable signal and distorting the pulse shape on the other hand.
Fig. 7 shows the resulting Riito horizontal displacement seismograms for the first event; the seismograms have been resolved into longitudinal and transverse components. Fig. 8 shows corresponding seismograms for the second event at Riito, and Figs 9 and 10 corresponding seismograms for both events at Delta. In each figure, the amplitude and time- scales are the same.
Figs 7 and 8 show that the pulse of energy at Riito is primarily SH motion, and is a much sharper pulse for the second event than for the first. The Delta seismograms (Figs 9 and 10) show a second pulse arriving about 6 s after the S-wave. This pulse is believed to be a reflec- tion multiple and will be discussed later.
F. A. Nava and J. N. Brune
R l l T O 1-Rad ia l R I I T 0 ?-Transverse
SECONDS SECONDS
Figure 7. Riito strong-motion resolved radial and transverse displacement seismograms for first Mesa de Andrade event.
R l l T O 2-Rad ia l R l l T O 2-Tronsverse
- 5
.25 i .02 - (I] a - -.Zoo- 4 8 12 16 20 1 0 4 8 1'2 16 20
SECONDS SECONDS a
Figure 8. Riito strong-motion resolved radial and transverse displacement seismograms for second Mesa d e Andrade event.
DELTA 1- Rodial DELTA I-Transverse
- 1.0- Y - J O U
[" 0 - 1 . 0 " ' ' '
0 4 8 12 16 20 0 4 8 12 16 20
SECONDS SECONDS
Figure 9. Delta strong-motion resolved radial and transverse displacement seismograms for first Mesa d e Andrade event.
DELTA 2 - R a d i a l DELTA 2-Transverse
i.i5 r 1
-.65 4 8 12 16 20 0 4 8 12 16 20
' L ' " ' ' ' ' ' '
SECONDS SECONDS
Figure 10. Delta strong-motion resolved radial and transverse displacement seismograms for second Mesa de Andrade event.
by guest on August 4, 2016
http://gji.oxfordjournals.org/D
ownloaded from
Mechanism of Baja earthquakes 749 G R E E N ’ S F U N C T I O N S Y N T H E T I C S A N D S O U R C E D E P T H
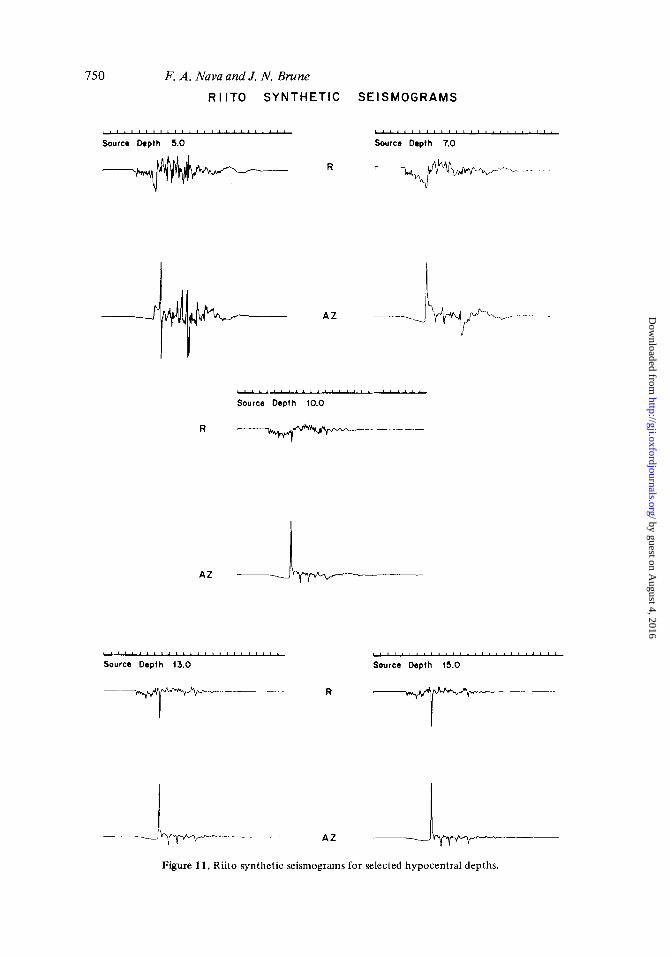
Depth is difficult to establish for this earthquake, since depths are uncertain even for the aftershocks. Thus, we estimated the depth by matching the observed strong motion records with synthetic seismograms obtained using the P R O S E program developed by Apse1 & Luco (1978). This program calculates Green’s functions for a flat layered model. The model used was the KHC2-IV model for the Imperial Valley (Hartzell & Brune 1977) with a crustal thickness of 32.4 km. Synthetics for source depths between 5 and 15 km were obtained for Riito and Delta. The alignment of the aftershock epicentres suggests that the Mesa de Andrade earthquake was associated with transcurrent motion along the Cerro Prieto fault. Hence, right lateral strike-slip motion along the Cerro Prieto fault was assumed for calculat- ing initial synthetic seismograms for comparison with the observed displacement time series. A step source time function was assumed.
Fig. 11 shows the synthetic seismograms for radial and transverse components, for different depths, at Riito. Fig. 12 shows the corresponding synthetics computed for Delta. The synthetics computed for a depth of 5 km are dominated by short-period energy trapped in the sediments. This energy is not seen in the observed records (Figs 7 and 8). The synthetics for 7 km source depth also show too much surface wave energy, especially for the Delta records (compare Fig. 12 with Figs 9 and 10). The synthetics for 10 km source depth (centre) agree well with the Riito 2 records, and the first large pulse of the Delta 2 records. Synthetics for Riito for a source deeper than lOkm, exhibit a larger radial pulse than observed.
The main differences between synthetic and observed seismograms for Delta relate to the pulse (B) arriving some 5 s after S on the transverse synthetic (Fig. 12) and the intermediate period pulse arriving some 7 s after S on the observed radial record (Figs 9 and 10). For 13 and l 5 k m source depth, the second pulse on the Delta synthetic diminishes, but a prominent S arrival, not seen as obviously on the observed records, appears on the Riito synthetics for the radial component. The second pulse (B) on the lOkm source depth synthetic for the Delta record was identified as a multiple reflection travelling from the source to the surface, thence to the bottom of the sediments and up to the surface again. The conspicuous feature marked (C) on the synthetic seismogram is another multiple, this time from the surface and twice reflected at the interface between layers four and five.
Attempts to obtain a synthetic pulse resembling the observed multiple by assuming different fault orientations and slip direction proved fruitless. It is possible that this problem results from the limitations of a flat layered model. The basement structure in the epicentral region is probably highly distorted. It is known that the basement of the Colorado Delta is heavily fractured, with blocks ascending toward the edges of the valley (Kovach, Allen & Press 1962; Alonso 1966). The Cerro Prieto fault, a major transform fault, strikes from the epicentre toward Delta. Thus, it is possible that the predominantly tangential energy was coupled into radial energy by reflection at some inclined feature. This suggests that we attempt to match only the direct wave at Delta. In this case, a source depth of lOkm produces the synthetic seismogram that best fits the observations.
The depth determination for the first event is less certain, mainly because its shape does not resemble the synthetic shapes as closely as was the case for the second events. However, the time between the S pulse and the multiple reflection phases appear to be the same for both events (see Figs 9 and 10). Hence, it is not unreasonable to assign a source depth for the first event similar to that for the second event.
A search for different fault orientations and/or slip directions indicated that any large deviation from the initial choice decreased the overall fit. Hence, the simple case of pure strike-slip on a vertical plane along the Cerro Prieto fault is our favoured model for the mechanism of the Mesa de Andrade earthquake.
by guest on August 4, 2016
http://gji.oxfordjournals.org/D
ownloaded from
750 F. A . Nava and J. N. Brune R I IT0 SYNTHETIC SEISMOGRAMS
Source Depth 10.0
A Z L Source Depih 13.0
R 7-
A Z
Figure 11. Riito synthetic seismograms for selected hypocentral depths.
by guest on August 4, 2016
http://gji.oxfordjournals.org/D
ownloaded from
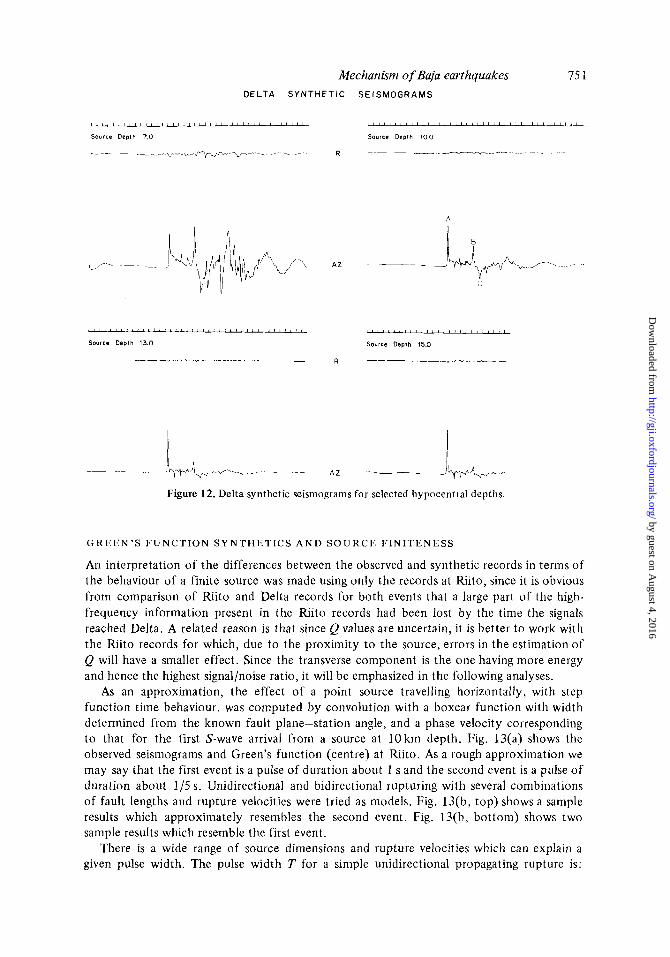
Mechanism of Baja earthquakes 75 1 DELTA SYNTHETIC S E I S M O G R A M S
A
Source Deplh 13.0 Spurce Depth 15.0
R -~ ___x.--_ ~-______---*I ~
Figure 12. Delta synthetic seismograms for selected hypocentral depths.
G R E E N ’ S F U N C T I O N S Y N T H E T I C S A N D S O U R C E F I N I T E N E S S
An interpretation of the differences between the observed and synthetic records in terms of the behaviour of a finite source was made using only the records at Riito, since it is obvious from comparison of Riito and Delta records for both events that a large part of the high- frequency information present in the Riito records had been lost by the time the signals reached Delta. A related reason is that since Q values are uncertain, it is better to work with the Riito records for which, due to the proximity to the source, errors in the estimation of Q will have a smaller effect. Since the transverse component is the one having more energy and hence the highest signal/noise ratio, it will be emphasized in the following analyses.
As an approximation, the effect o f a point source travelling horizontally, with step function time behaviour, was computed by convolution with a boxcar function with width determined from the known fault plane-station angle, and a phase velocity corresponding to that for the first S-wave arrival from a source at lOkm depth. Fig. 13(a) shows the observed seismograms and Green’s function (centre) at Riito. As a rough approximation we may say that the first event is a pulse of duration about 1 s and the second event is a pulse of duration about 1 / S s. Unidirectional and bidirectional rupturing wjth several combinations of fault lengths and rupture velocities were tried as models. Fig. 13(b, top) shows a sample results which approximately resembles the second event. Fig. 13(b, bottom) shows two sample results which resemble the first event.
There is a wide range o f source dimensions and rupture velocities which can explain a given pulse width. The pulse width T for a simple unidirectional propagating rupture is:
by guest on August 4, 2016
http://gji.oxfordjournals.org/D
ownloaded from

7 5 2 F. A. Nava and J. N. Brune M E S A EQ.
RLlTO 2 - Transverse - U n i l a t e r a l (+ )
10 - 0 0
I
SECOND EVENT : 09 "b ; I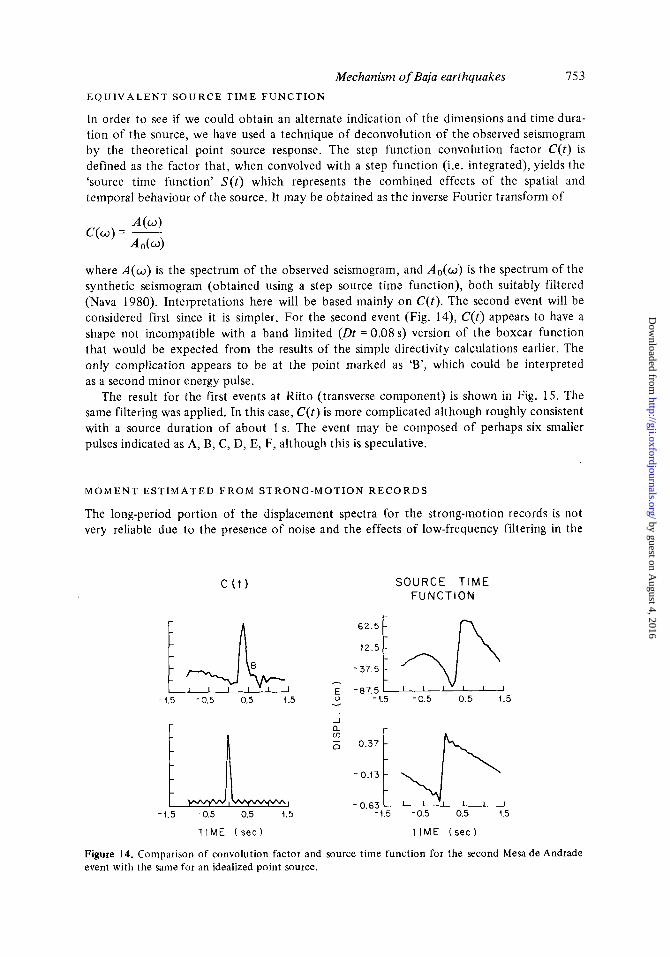
Mechanism of Baja earthquakes 753 E Q U I V A L E N T S O U R C E T I M E F U N C T I O N
In order to see if we could obtain an alternate indication of the dimensions and time dura- tion of the source, we have used a technique of deconvolution of the observed seismogram by the theoretical point source response. The step function convolution factor C(t) is defined as the factor that, when convolved with a step function (i.e. integrated), yields the ‘source time function’ S ( t ) which represents the combined effects of the spatial and temporal behaviour of the source. It may be obtained as the inverse Fourier transform of
where A(w) is the spectrum of the observed seismogram, and A o ( o ) is the spectrum of the synthetic seismogram (obtained using a step source time function), both suitably filtered (Nava 1980). Interpretations here will be based mainly on C( t ) . The second event will be considered first since it is simpler. For the second event (Fig. 14), C(t) appears to have a shape not incompatible with a band limited (Dt = 0.08 s) version of the boxcar function that would be expected from the results of the simple directivity calculations earlier. The only complication appears to be at the point marked as ‘B’, which could be interpreted as a second minor energy pulse.
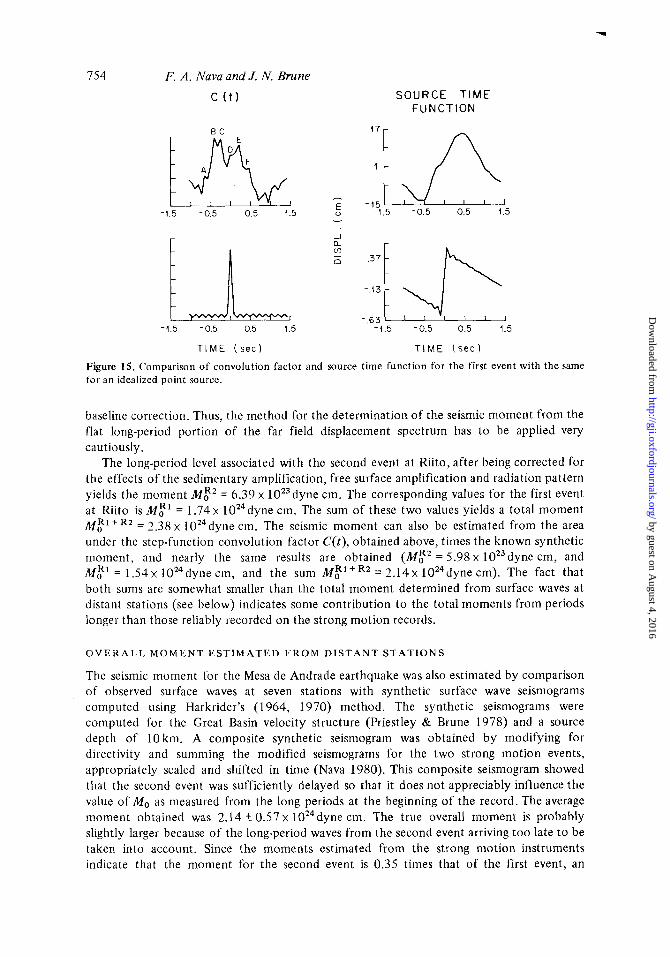
The result for the first events at Riito (transverse component) is shown in Fig. 15. The same filtering was applied. In this case, C ( t ) is more complicated although roughly consistent with a source duration of about 1 s. The event may be composed of perhaps six smaller pulses indicated as A, B, C, D, E, F, although this is speculative.
M O M E N T E S T I M A T E D F R O M S T R O N G - M O T I O N R E C O R D S
The long-period portion of the displacement spectra for the strong-motion records is not very reliable due to the presence of noise and the effects of low-frequency filtering in the
-1.5 -0.5 0.5 1.5
r
SOURCE TIME F U N C T I O N
-f.5 -0.5 0.5 1.5
T I M E ( s e c ) T I M E ( s e c )
Figure 14. Comparison of convolution factor and source time function for the second Mesa de Andrade event with the same for an idealized point source.
by guest on August 4, 2016
http://gji.oxfordjournals.org/D
ownloaded from
754 F. A. Nava and J. N. Brune
c ( t ) SOURCE TIME FUNCTION
r
-1.5 -0.5 0.5 1.5
T I M E ( s e c l
- i . 5 -0.5 0.5 1.5
T I M E ( s e c )
Figure 15. Comparison of convolution factor and source time function for the first event with the same for an idealized point source.
baseline correction. Thus, the method for the determination of the seismic moment from the flat long-period portion of the far field displacement spectrum has to be applied very cautiously.
The long-period level associated with the second event at Riito, after being corrected for the effects of the sedimentary amplification, free surface amplification and radiation pattern yields the moment ME2 = 6.39 x 10²³dyne cm. The corresponding values for the first event at Riito is MF' = 1 . 7 4 ~ 1024dyne cm. The sum of these two values yields a total moment M F 1 + R 2 = 2.38 x 1OZ4dyne cm. The seismic moment can also be estimated from the area under the step-function convolution factor C(t), obtained above, times the known synthetic moment, and nearly the same results are obtained ( M c 2 = 5.98 x 10²³dyne cm, and MF' = 1 . 5 4 ~ 1024dyne cm, and the sum = 2 . 1 4 ~ 1024dyne cm). The fact that both sums are somewhat smaller than the total moment determined from surface waves at distant stations (see below) indicates some contribution to the total moments from periods longer than those reliably iecorded on the strong motion records.
OVERALL MOMENT ESTIMATED FROM DISTANT STATIONS
The seismic moment for the Mesa de Andrade earthquake was also estimated by comparison of observed surface waves at seven stations with synthetic surface wave seismograms computed using Harkrider's (1 964, 1970) method. The synthetic seismograms were computed for the Great Basin velocity structure (Priestley & Brune 1978) and a source depth of IOkm. A composite synthetic seismogram was obtained by modifying for directivity and summing the modified seismograms for the two strong motion events, appropriately scaled and shifted in time (Nava 1980). This composite seismogram showed that the second event was sufficiently delayed so that it does not appreciably influence ,the value of Mo as measured from the long periods at the beginning of the record. The average moment obtained was 2.14 k 0.57 x 1024dyne cm. The true overall moment is probably slightly larger because of the long-period waves from the second event arriving too late to be taken into account. Since the moments estimated from the strong motion instruments indicate that the moment for the second event is 0.35 times that of the first event, an
by guest on August 4, 2016
http://gji.oxfordjournals.org/D
ownloaded from
Mechanism of Baja earthquakes 755
estimate for the Mesa de Andrade moment as would have been determined using waves with periods long compared with the 45 s between the two events is about Mo 2.89 x loz4 dyne cm.
O V E R A L L S O U R C E D I M E N S I O N S A N D S T R E S S D R O P
For distant stations, the two events appear as one complex event, and the contribution of the second event to the magnitude (especially M,) is relatively small. Also, as seen above, its contribution to the value of the moment which would have been obtained by fitting the early long-period part of the distant records (without realizing that there were two events involved) will be very small. The aftershock area probably gives the most reliable estimation of the overall source dimension; it would be the only estimate possible for an observer not having the strong motion information. Hence, the results obtained from this assumption will be representative of the usual determination when only aftershock data are available. The aftershock distribution with a length of - 11.5 km and a depth range of - 4.5 km, suggests the use of a rectangular fault model, although as mentioned before, the aftershock depth determination is somewhat uncertain so the estimation of the depth range may not be accurate. Thus, the possibility of a circular source with radius r = L / 2 = 5.75 km may be considered as an upper bound for the source area. Use of these two fault geometries, plus the overall moment Mo = 2.89 x 1024dyne cm, yields Ao = 15.53 bar (using Madariaga's 1977 formula for stress drop) for the rectangular fault, and A o = 5.81 bar for the circular one. The average displacement across the fault, U , was approximately 5-1 0 cm.
Comparison and interpretation of the parameters for both earthquakes
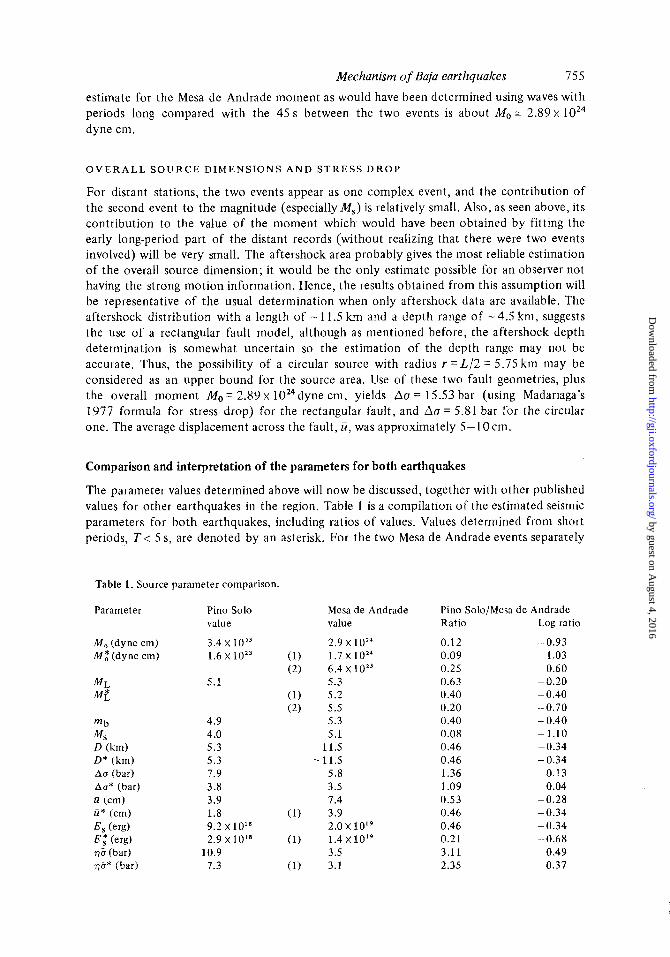
The parameter values determined above will now be discussed, together with other published values for other earthquakes in the region. Table 1 is a compilation of the estimated seismic parameters for both earthquakes, including ratios of values. Values determined from short periods, T < 5 s, are denoted by an asterisk. For the two Mesa de Andrade events separately
Table 1. Source parameter comparison.
Parameter
M , (dyne cm) MZ (dyne cm)
m b MS D (km) D* (km) Au (bar) ALT* (bar) a (crn) ti* (cm) E, (erg) E,* (erg) q5 (bar) +10* (bar)
Pino Solo value
3.4 x 1 0 2 ~ 1.6 x l oz3 (1)
(2)
(1) (2)
5.1
4.9 4.0 5.3 5.3 - 7.9 3.8 3.9 1.8 (1) 9.2 X 10" 2.9 X lo1* (1)
7.3 (1) 10.9
Mesa de Andrade value
2.9 x loz4
6.4 x loz3 1.7 X
5.3 5.2 5.5 5.3 5.1
11.5 11.5 5.8 3.5 7.4 3.9 2.0 x l o i 9 1.4 x 10¹⁹ 3.5 3.1
Pino Solo/Mesa d e Andrade Ratio Log ratio
0.1 2 -0.93 0.09 - 1.03 0.25 - 0.60 0.63 - 0.20 0.40 - 0.40 0.20 --0.70 0.40 - 0.40 0.08 - 1.10 0.46 -0.34 0.46 -0.34 1.36 0.13 1.09 0.04 0.53 -0.28
0.46 -0.34 0.21 -0.68 3.11 0.49 2.35 0.37
0.46 -0.34
by guest on August 4, 2016
http://gji.oxfordjournals.org/D
ownloaded from
756
the equivalent local magnitude, ML, was determined from the deconvolution-convolution technique suggested by Kanamori & Jennings (1 978) to produce equivalent Wood-Anderson records from strong motion records. For logarithmic quantities like the magnitudes, the logarithm of the ratio (log ratio) shown is the difference between the values being compared. The energies (E,) were computed from the local magnitudes using the revised Gutenberg & Richter (1 956) relation (log E = 9.9 + 1.9 M L - 0.024 ML), and the apparent stresses 775 (Aki 1966) were calculated using these energy values.
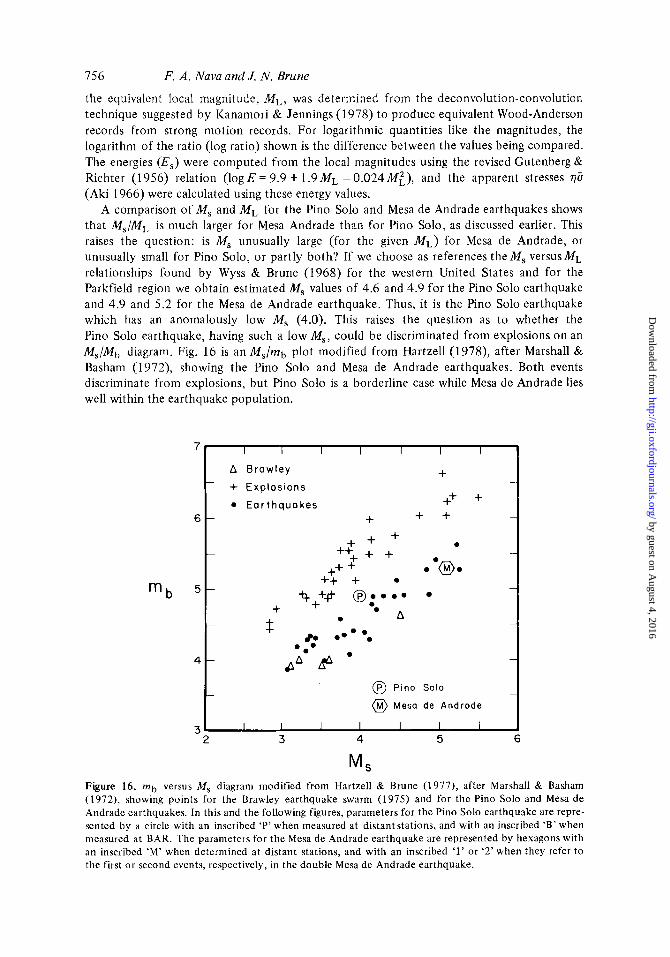
A comparison of M, and ML for the Pino Solo and Mesa de Andrade earthquakes shows that M,/ML is much larger for Mesa Andrade than for Pino Solo, as discussed earlier. This raises the question: is M, unusually large (for the given M L ) for Mesa de Andrade, or unusually small for Pino Solo, or partly both? If we choose as references theM, versusML relationships found by Wyss & Brune (1968) for the western United States and for the Parkfield region we obtain estimated Ms values of 4.6 and 4.9 for the Pino Solo earthquake and 4.9 and 5.2 for the Mesa de Andrade earthquake. Thus, it is the Pino Solo earthquake which has an anomalously low M, (4.0). This raises the question as to whether the Pino Solo earthquake, having such a low M,, could be discriminated from explosions on an Ms/Mb diagram. Fig. 16 is an MJmb plot modified from Hartzell (1978), after Marshall & Basham (1972), showing the Pino Solo and Mesa de Andrade earthquakes. Both events discriminate from explosions, but Pino Solo is a borderline case while Mesa de Andrade lies well within the earthquake population.
F. A . Nava and J. N. Brune
7 . I I I I I I I
+ A B r a w l e y
- + Explosions _.
0 E a r t h q u a k e s ++ +
- +++ + + -
+ + 6 - + -
+ + + 0
++ + 0 ‘ ( 9 0
++ + 0 - 5 - %++# @ y o *
4 - y@ ’ -
0 ‘ A +
- - 80 0.’ ‘0
T
@ Pino S O I O
@) Mesa de Androde
I I 1 I I I I
- -
3 2 3 4 5
m b
6
Ms Figure 16. m b versus M, diagram modified from Hartzell & Brune (1977), after Marshall & Basham (1972), showing points for the Brawley earthquake swarm (1975) and for the Pino Solo and Mesa de Andrade earthquakes. In this and the following figures, parameters for the Pino Solo earthquake are repre- sented by a circle with an inscribed ‘P’ when measured at distant stations, and with an inscribed ‘B’ when measured at BAR. The parameters for the Mesa de Andrade earthquake are represented by hexagons with an inscribed ‘M’ when determined at distant stations, and with an inscribed ‘1’ or ‘2’ when they refer to the first o r second events, respectively, in the double Mesa de Andrade earthquake.
by guest on August 4, 2016
http://gji.oxfordjournals.org/D
ownloaded from
E loZ5
5 0 10 5 I r
‘\I I
\ \
\ \ 100 bars
L f . 3 0 5 . 7
- \\ A 5.1 5 . 5 . \
- \ 0 6.0 \ - \A 5 . 7 \
\ @
4’9A \ & 0 5 . 4 \ \ 4 . 3 9 \ n,4.4
\ 5.7 .\
-
\ 5.4 =\
4.7
\ =5.0 5 . 2 m m 5 , 0 \
\;:7 ;6
- \ \- \ 5.C = 5 . 0 \
- \ m 4 . 4 m 4 . ~ - 4 . 2 1 = 3 . 0 4.0 .\,3.7
4.0 \ - \ -
St ress drop = I bar\ \ \
I - I 0
al C
7J
c
S loZ4 E E 0
U .- 5 loZ3 .- a, v)
W
0 E ._ X 0 L Q Q
10 2‘ a
10 2o
Mechanism of Baja earthquakes 757
Approx imate source dimension, km
10
I I
a c 0
16‘ - 0 a Ln
I O - ~
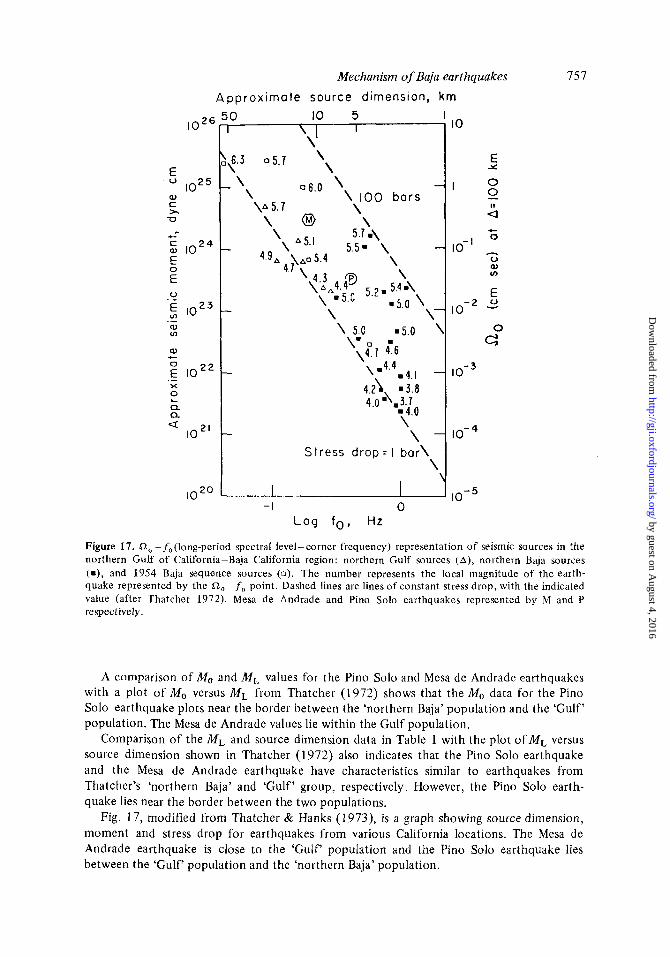
Figure 17. no -f,(long-period spectral level- corner frequency) representation of seismic sources in the northern Gulf of California-Baja California region: northern Gulf sources (A) , northern Baja sources (m), and 1954 Baja sequence sources (0). The number represents the local magnitude of the earth- quake represented by the a, -f, point. Dashed lines are lines of constant stress drop, with the indicated value (after Thatcher 1972). Mesa de Andrade and Pino Solo earthquakes represented by M and P respectively.
A comparison of Mo and M L values for the Pino Solo and Mesa de Andrade earthquakes with a plot of Mo versus M L from Thatcher (1972) shows that the Mo data for the Pino Solo earthquake plots near the border between the ‘northern Baja’ population and the ‘Gulf’ population. The Mesa de Andrade values lie within the Gulf population.
Comparison of the ML and source dimension data in Table 1 with the plot ofML versus source dimension shown in Thatcher (1972) also indicates that the Pino Solo earthquake and the Mesa de Andrade earthquake have characteristics similar to earthquakes from Thatcher’s ‘northern Baja’ and ‘Gulf’ group, respectively. However, the Pino Solo earth- quake lies near the border between the two populations.
Fig. 17, modified from Thatcher & Hanks ( 1 973), is a graph showing source dimension, moment and stress drop for earthquakes from various California locations. The Mesa de Andrade earthquake is close to the ‘Gulf population and the Pino Solo earthquake lies between the ‘Gulf‘ population and the ‘northern Baja’ population.
by guest on August 4, 2016
http://gji.oxfordjournals.org/D
ownloaded from
758 F. A. Nava and J. N. Brune
The following is a summary of the comparisons just made:
(a) The Pino Solo and Mesa de Andrade earthquakes, as measured at distant stations, appear to be approximately representative of their respective regions.
(b) Using the parameter values for Pino Solo as a reference, some characteristics common to the corresponding values for the Mesa de Andrade earthquake measured at distant stations are: (1) relative to M,, mb is smaller; (2) relative to M,, M L is smaller; (3) relative to the source dimension, M L is smaller.
(c) The second Mesa de Andrade event probably had a smaller source dimension (and higher stress drop) than either the Pino Solo earthquake or the first Mesa de Andrade event.
(d) The overall average stress drop is approximately the same for the Pino Solo and Mesa de Andrade events.
I N T E R P R E T A T I O N
In order to interpret the similarities and differences between the parameters of the Pino Solo and Mesa de Andrade earthquakes presented above, it is important to consider the frequency associated with each measurement. A good example of this is indicated in the Wood- Anderson records shown in Fig. 1, where it can be seen that the maximum amplitude (and hence the ML value) is associated with a frequency 2 1.81 Hz (period - 0.55 s) for the Pino Solo record, and with a frequency of - 0.33 Hz (period - 3 s) for the Mesa de Andrade record. Values of parameters and the frequencies at which they were measured have been converted into spectral values and plorted in Fig. 18, together with values from actual measured spectra, to illustrate the relation of the measured parameters to the spectra.
All observed values were converted into spectral values corresponding to a distance R =lOkm and an ‘average’ azimuth (such that the radiation pattern ReG ~ 0 . 6 ) in a homogeneous full-space characterized by a density p = 2.7g ~ m - ~ , and a shear wave velocity p = 3 . 7 k m s-l (values appropriate for the crust under the Imperial Valley). Thus, the spectral density associated with a particular value of the moment is obtained from the relation (Keilis-Borok 1960)
which for our case gives
Ro = 3.4912 x 10⁻²⁵M0
(R, in cm s, Mo in dyne cm). The observed spectral values were transformed into equivalent full-space values by correct-
ing for distance by a factor of 10 km divided by epicentral distance; for amplification at the free surface by a factor of 0.5, for radiation by a factor of 0.6 divided by the observed R ~ Q value and for the amplification of the Imperial Valley sediments, by multiplying by a factor of 0.4 (Hartzell & Brune 1977). Since the BAR record for the Pino Solo earthquake was not suitable for digitization, the short-period spectral value was estimated from the synthetic spectrum scaled so that the synthetic seismogram would have the same maximum amplitude as the observed one.
Relative magnitude values were used to estimate relative spectral values in the following way: the value of the magnitude measured for Pino Solo was associated with the Pino Solo spectrum at the frequency at which the magnitude measurement was made, and used as the reference from which the relative position of the corresponding spectral value for the Mesa de Andrade earthquake was placed (after correcting for the effects of different frequencies
by guest on August 4, 2016
http://gji.oxfordjournals.org/D
ownloaded from
Mechanism of Baja earthquakes 759 2
I
.e
.6
.4
.2
.I
08
06
04
02
01
I I I 1 I , / ( I I I I I 1 1 1 1 I I I I I I I
T
J a M ( y = 2 '
d) a: .- - Q % - - - - -
p = 2.7 Q/CC 6 = 3.7 km/sec
R = ! O h m
0.6
I I , I I I I I I I I I l l l l , \ 1 I I , I
.04 .06 .08 .I . 2 .4 .6 .8 I 2 4 6 8
FREQUENCY ( H z ) I
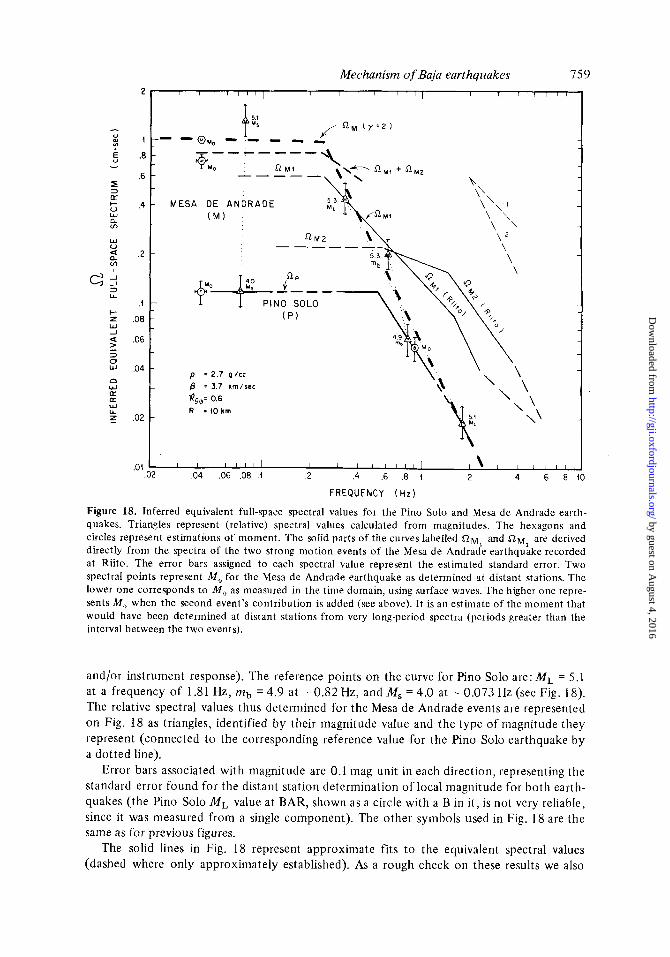
Figure 18. Inferred equivalent full-space spectral values for the Pino Solo and Mesa de Andrade earth- quakes. Triangles represent (relative) spectral values calculated from magnitudes. The hexagons and circles represent estimations of moment. The solid parts of the curves iabelled S ~ M , and KZM, are derived directly from the spectra of the two strong motion events of the Mesa d e Andrade earthquake recorded at Riito. The error bars assigned to each spectral value represent the estimated standard error. Two spectral points represent M,, for the Mesa de Andrade earthquake as determined at distant stations. The lower one corresponds to M , as measured in the time domain, using surface waves. The higher one repre- sents M , when the second event's contribution is added (see above). I t is an estimate of the moment that would have been determined at distant stations from very long-period spectra (periods greater than the interval between the two events).
and/or instrument response). The reference points on the curve for Pino Solo are: M L = 5.1 at a frequency of 1.81 Hz, mb = 4.9 at - 0.82 Hz, and M, = 4.0 at - 0,073 Hz (see Fig. 18). The relative spectral values thus determined for the Mesa de Andrade events are represented on Fig. 18 as triangles, identified by their magnitude value and the type of magnitude they represent (connected to the corresponding reference value for the Pino Solo earthquake by a dotted line).
Error bars associated with magnitude are 0.1 mag unit in each direction, representing the standard error found for the distant station determination of local magnitude for both earth- quakes (the Pino Solo ML value at BAR, shown as a circle with a B in it, is not very reliable, since it was measured from a single component). The other symbols used in Fig. I8 are the same as for previous figures.
The solid lines in Fig. 18 represent approximate fits to the equivalent spectral values (dashed where only approximately established). As a rough check on these results we also
by guest on August 4, 2016
http://gji.oxfordjournals.org/D
ownloaded from
760
calculated the spectra from the Pasadena Wood-Anderson records of each earthquake. The results approximately confirmed the relative positions of the overall spectra shown in Fig. 18 at frequencies below 0.5 Hz. They also approximately confirmed the absolute positions of the curves, under the assumption that the waves recorded on the Wood-Anderson records were body waves, with corrections made approximately as done by Thatcher & Hanks (1973). The curve with large dash marks labelled n ~ ( y = 2) is the estimated overall spectrum for the Mesa de Andrade earthquake with a high-frequency fall-off beyond the corner frequency assumed to be proportional to f-’.
We are now In a position to attempt to answer some of the questions that prompted the present work.
As noted earlier, the Pasadena Wood-Anderson seismogram for the Pino Solo earthquake (Fig. 1) is relatively simple, most of the energy arriving in a burst of only a few seconds’ duration, while the seismograms for the Mesa de Andrade earthquake is more complex, with both the high-frequency energy (F> 1 Hz) and lower frequency energy arriving over a much longer period of time (- 1 min). However, the Riito integrated strong-motion displacement seismogram for the Mesa de Andrade earthquake at a distance of - 18 km (Fig. 1, bottom), indicates that the actual energy release occurred in two relatively simple events, the second containing considerably more low-frequency energy than the first (see spectra in Fig. 18), while the second was a sharper event with somewhat higher accelerations (see also Fig. 8). Fig. 1 indicates that most of the complexity observed on the Mesa de Andrade seismogram must have come from scattering and multipathing as a result of the complex geological path between the Mesa de Andrade earthquake and Pasadena. For the Pino Solo record, the geological path to Pasadena is much simpler, and this results in a relatively simple pulse of energy. Thus the comparison in Fig. 1 shows that the high-frequency energy from the Mesa de Andrade earthquake has been spread out in time and this may have reduced theML magnitude for Mesa de Andrade relative to the Pino Solo. The spreading out of energy by scattering will have a much less pronounced effect on spectra than on ML. It is also possible that differential attenuation due to lower Q values for the part of the propagation path in the Salton Trough has selectively reduced the high frequencies for the Mesa de Andrade earthquake at stations outside the Salton Trough.
The moments and corner frequencies shown in Fig. 18 are in approximate agreement with the y = 2 model for the spectra of earthquakes (Aki 1967; Brune 1970, 1971). The corner frequency of the Mesa de Andrade earthquake (ignoring ~ L M ~ ) is about a factor of 2 lower than for the Pino Solo earthquake, whereas the corresponding low-frequency amplitudes are approximately 8 times higher. Thus the corner frequencies and moments for the Mesa de Andrade and Pino Solo earthquakes are in agreement with the y = 2 model for two earth- quakes of approximately the same stress drop, but with source dimensions different by a factor of 2 (Hanks 1979).
However, the Riito strong motion spectra are not consistent with the y = 2 model (Fig. 18). For the first event the spectra are about 3 times higher between 0.8 and 2 Hz, and for the second event the spectra are about 4 times higher at 1 Hz and 7 times higher at 2-5 Hz, estimated relative to the heavy dashed line labelled n ~ ( y = 2) in Fig. 18. This causes M t (Table 1) determined from the nearby Riito strong motion record (using the technique of Kanamori & Jennings 1978), to be higher for the second event (5.5) than for the first event (5.2). At other azimuths and larger distances (where the high frequencies have been attenuated and scattered) and focusing is not effective, M , calculated for the second event, if it could be seen, would probably be smaller than for the first event (because the moment and low-frequency spectrum are lower). Actually, the energy from the second event cannot be clearly identified at distant stations because of the presence of energy from the first event (see Fig. 1).
F. A . Nava and J. N . Brune
by guest on August 4, 2016
http://gji.oxfordjournals.org/D
ownloaded from
Mechanism of Baja earthquakes 76 1
The M Z values computed for station Delta are even higher, about 6.1 for both the first and second events. This could be due in part to directivity focusing since Delta is directly i n the direction of the fault, However, there may be other factors contributing, e.g. local amplification, or perhaps the Richter attenuation curve assumed in the calculation of M E is not appropriate for the region. The station Delta also recorded anomalously high ground motion from the 1979 Imperial Valley earthquake (Brune et al. 1982).
The relatively high ground motions at Riito and Delta clearly demonstrate the difficulty in predicting peak motion in the near field from parameters measured at distant stations. The acceleration values of 0.21 and 0.24g at Riito exceed the 84 percentile correlation curves of Joyner & Boore (1981). The Delta peak acceleration values exceed these curves by more than a factor of 2.
Conclusion
The overall stress drops for the Mesa de Andrade and Pino Solo earthquakes were found to be nearly the same, but the source dimension of the Mesa de Andrade earthquake is approxi- mately 2 times that of the Pino Solo earthquake. In terms of the y = 2 seismic source model, this explains most of the greater moment and greater excitation of surface waves for the Mesa de Andrade earthquake. The difference in local magnitude (0.2) is also, within the uncertainty in measurement, consistent with the y = 2 model. However, greater complexity in the Wood-Anderson records from the Mesa de Andrade earthquakes, when compared with the simple displacement strong motion records, indicates that scattering due to complexities in geological path affects the magnitude determinations from earthquakes in the Salton Trough and could be in part responsible for the apparent higher excitation of surface waves from earthquakes in that area. Final determination of the reason for the differences in surface wave excitation must await more studies of the type presented here, especially for larger earthquakes. A recent study by Munguia & Brune (1983) indicates that scattering and attenuation play a major role in distorting the spectra at larger distances.
The high accelerations and spectra recorded at the strong-motion stations Riito and Delta are not expected from the y = 2 model, and may have resulted from two relatively high stress drop events (possible asperities breaking) on an otherwise relatively low stress-drop rupture surface. Another possible contributing factor is the effect of near field focusing (directivity).
In a more recent study, Munguja & Brune (1983) found high stress drop events (stress drops around 1 kbar) for several earthquakes along the Cerro Prieto fault, in 1977, 1978 and 1980. In that study there was no likelihood of focusing as an explanation since the stations were much closer to the epicentres (within a few kilometres). For this reason we now favour the high stress drop asperity explanation for the high accelerations recorded at Riito for the Mesa de Andrade earthquake. This interpretation in turn implies that most of the high-frequency energy (above 0.5-1 Hz) from the two Mesa de Andrade events has effectively been removed from the records at more distant stations by scattering and attenuation. Otherwise much higher M L and somewhat higher mb values would have been observed at more distant stations (see Fig. 18). Severe scattering and attenuation of high- frequency energy might be expected in this region because of the complex geological structure and the high mantle temperatures. In fact Munguia & Brune (1983) showed that much of the high-frequency energy from some of their events has effectively been removed from the Wood-Anderson records at Pasadena, thus throwing into question some of the stress drop results of Thatcher (1972), Thatcher & Hanks (1973), and the apparent stress estimations of Wyss & Brune (1971) which used Wood-Anderson records from earthquakes in this region to infer relatively low stress drops and apparent stresses.
by guest on August 4, 2016
http://gji.oxfordjournals.org/D
ownloaded from
762
Acknowledgments
We are indebted to Rich Simons, John Orcutt, Luis Munguia, Allen Olson and Rick Adair for their help in using some synthetic seismograms programs. We are grateful to Alfonso Reyes, Javier Gonzalez and Wayne Thatcher for the use of some unpublished data.
We wish to thank the Institute of Engineering at the Universidad Nacional Aut6noma de MCxico (UNAM) for the use of their strong motion data, and California Institute of Technology (CIT) and Centro de Investigacibn Cientifica y Educacibn Superior de Ensenada (CICESE) for the use of some of their seismograms. It has been a pleasure to work in cooperation with CICESE and we would like to thank Alfonso Reyes, Javier Gonzalez, Miguel Farfdn and Francisco Farfdn, who shared in the field work. Rich Simons and Mark Hernandez from the Institute of Geophysics and Planetary Physics (IGPP) also shared the field work.
We are grateful to Jean Polhamus for her cheerful patience and expert typing of the manuscript, to Elaine Blackmore and Shelley Marquez for their help in the same respect, and to Ruth Zdvorak for drafting.
We are also grateful to Professor James W. Dewey for his careful criticism and suggestions. UNAM and the Consejo Nacional de Ciencia y Tecnologia (CONACYT) provided
financial support from Mexico. The research was also supported in part by U.S. funding from the National Science Foundation (NSF GA 41751, NSF DES 74-03188, NSF EAR 78-84060, NSF PFR 75-02939 and NSF PFR 77-23829) and the National Aeronautic and Space Administration (NASA NGR 05-009-246), and is a contribution of the Scripps Institution of Oceanography.
F. A . Nava and J. N. Brune
References
Aki, K . , 1966. Generation and propagation of G waves from the Niigata earthquake of June 16, 1964, 2, Estimation of earthquake moment, released energy, and stress-strain drop from G-wave spectrum, Bull. Earthq. Res. Inst., Tokyo Univ., 44, 73-88.
Aki, K . , 1967. Scaling law of seismic spectrums,J. geophys. Res., 72, 1217-1231. Alonso, H., 1966. La zona geotirmica de Cerro Prieto, Baja California, Bol. Soc. geol. Mex., 29-1, 17-47. Apsel, R. & Luco, E., 1978. Dynamic Green functions for a layered half-space, Rep. Dept appl. Mech.
Brune, J . , 1970. Tectonic stress and the spectra of seismic shear waves from earthquakes,J. geophys. Res.,
Brune, J . , 1971. Correction, J. geophys. Res., 76, 5002. Brune, J . , Espinosa, A. & Oliver, J., 1963. Relative excitation of surface waves by earthquakes and under-
ground explosions in the California-Nevada region, J. geophys. Res., 68, 3501 -35 13. Brune, J . N., Vernon, t;. L. 111, Simons, R. S., Prince, J. & Mena, E., 1982. Strong-motion data recorded
in Mexico during the main shock, The Imperial Valley, California earthquake of October 15, 1979, Prof Pap. US. geol. Surv. 1254, 319-349.
Engng Sci., UCSD, La Jolla.
75,4997-5009.
Buland, R., 1976. The mechanics of locating earthquakes, BuZl. seism. SOC. Am., 66,173-187. Gutenberg, B. & Richter, C., 1956. Magnitude and energy of earthquakes,Annali Geofis., 9, 1-15. Hanks, T. C., 1979. 6-values and w'Y seismic source models: implications for tectonic stress variations
along active crustal fault zones and the estimation of high-frequency strong ground motion, J. geophys. Rex , 84, 2235-2242.
Harkrider, D., 1964. Surface waves in multilayered elastic media. Part I. Rayleigh and Love waves from buried sources in a multilayered elastic halfspace, Bull. seism. SOC. Am., 54,627-679.
Harkrider, D., 1970. Surface waves in multilayered elastic media. Part 11. Higher mode spectra and spectral ratios from point sources in plane layered earth models, Bull. seism. SOC. Am., 60, 1937- 1987.
Hartzell, S., 1978. Interpretation of earthquake strong-motion and implications for earthquake mecha- nism, PhD thesis, University of California, San Diego.
Hartzell, S. & Brune, J . , 1977. Source parameters for the January 1975 Brawley-Imperial Valley earth- quake swarm, Pageoph, 115, 333-355 (in Stress in the Earth, ed. Wyss, Max, Birkhauser).
by guest on August 4, 2016
http://gji.oxfordjournals.org/D
ownloaded from
Mechanism of Baja earthquakes 763
Joyner, W. B. & Boore, D. M., 1981. Peak horizontal acceleration and velocity froin strong-motion records including records from the 1979 Imperial Valley, California, earthquake, Bull. seism. SOC. Am., 71,2011-2038.
Kanamori, H. & Jennings, P., 1978. Determination of local magnitude, M L , from strong motion records, Bull. seism. SOC. Am., 65,471-485.
Keilis-Borok, V., 1960. Investion of the mechanism of earthquakes, Sou. Res. Geophys., 4 (trans. TF. Geofiz. inst., 40, 1957) American Geophysics Union, Consultants Bureau, New York.
Kovach, R., Allen, C. & Press, F., 1962. Geophysical investigations in the Colorado Delta region, J . geophys. Res., 61, 2845-2872.
Liebermann, R. & Pomeroy, P., 1969. Relative excitation of surface waves by earthquakes and under- ground explosions,J. geophys. Res., 14, 15 775-15 790.
Madariaga, R., 1977. Implications of stressdrop models of earthquakes for the inversion of stressdrop from seismic observations, Pugeoph, 115, 301-316 (in Stress in the Eurth, ed. Wyss, Max, Birkhauser).
Marshall, P. & Basham, P., 1972. Discrimination between earthquakes and underground explosions employing an improved M , scale, Geophys. J . R. ustr. Soc., 28, 431-458.
Munguia, L. & Brune, J . N., 1983. High stress drop events in the Victoria, Baja California earthquake of March, 1978, Geophys. J. R. ustr. SOC., submitted.
Munguia, L., Brune, J . N., Adair, R., Gonzalez, J., Simons, R . & Vernon, I:., 1978. Digital seismograph and strong motion recordings of earthquakes in the Victoria, B.C., Mexico swarm of March, 1978 (Abstract), Eos, 59, 11 3 1.
Nava, A., 1980. Study of seismic wave excitation for two earthquakes in Northern Baja CaIifornia,PhD thesis, University of California, San Diego.
Nava, F. A. & Brune, J . N., 1982. An earthquake-explosion reversed refraction line in the Peninsular Ranges of Southern California and Baja California Norte, Bull. seism. SOC. Am., 72, 1195- 1206.
Prian, R., 1978. Correlaciones litol6gicas de 10s pozos del campo de Cerro Prieto con based en la inter- pretacidn de 10s registros elkctricos, in Proc. First Symp. Cerro Prieto Geothermal Field, pp. 49-56, Baja California, Mexico.
Priestley, K. & Brune, J . , 1978. Surface waves and the structure of the Great Basin of Nevada and Western Utah, J. geophys. Res., 83, 2265-2272.
Prince, J . , Brune, J . & Nava, A., 1977. Strong motion instrumentation of Northern Baja California,Ahstr. Pvog. geol. SOC. Am., 9, 484. Meeting of the Seisn~ological Society of America, 1977 April 5-7,
Thatcher, W., 1972. Regional variation of seismic source parameters in the Northern Baja California area,
Thatcher, W., 1979. Horizontal crustal deformation from historic geodetic measurements in Southern
Thatcher, W. & Brune, J . , 1971. Seismic study of an oceanic ridge earthquake swarm in the Gulf of
Thatcher, W. & Hanks, T., 1973. Source parameters of Southern California earthquakes, J . geophys. Res.,
Tsai, Y . & Aki, K . , 1970. Precise focal determination from amplitude spectra of surface waves, J . geophys.
Wyss, M. & Brune, J., 1968. Seismic moment, stress, and source dimensions for earthquakes in the
Wyss, M. & Brune, J . , 1971. Regional variations of source properties in Southern California estimated
Sacramento, California.
J. geophys. Res., 77,1549--1565.
California, J. geophys. Res., 84, 2351 -2370.
California, Geophys. J. R. astr. Sac., 22, 473--489.
78,8547-8576.
Res., 75, 5729-5743.
California-Nevada region, J. geophys. Res., 73,4681-4694.
from the ratio of short- to long-period amplitudes, Bufl. seism. SOC. Am., 61, 1153-1 167.
by guest on August 4, 2016
http://gji.oxfordjournals.org/D
ownloaded from