Source evaluation of aerosols measured during the Indian Ocean Experiment using combined chemical...
14
Source evaluation of aerosols measured during the Indian Ocean Experiment using combined chemical transport and back trajectory modeling S. Verma, 1 C. Venkataraman, 1 O. Boucher, 2,3 and S. Ramachandran 4 Received 25 June 2006; revised 19 February 2007; accepted 22 March 2007; published 9 June 2007. [1] This work presents an analysis of aerosol measurements made during the Oceanographic Research Vessel Sagar Kanya cruise of January–March 1999, in the Indian Ocean Experiment intensive field phase (INDOEX-IFP), with regard to the aerosol chemical constituents and identification of source regions of their origin. This is done through a hybrid approach which uses an Eulerian forward transport calculation in a general circulation model (GCM) with region-tagged emissions along with an analysis of Lagrangian back trajectories and emission inventory information, for overlapping time periods. Back trajectory analysis showed that the ship was mainly influenced by air masses from the Indo-Gangetic plain, central India, or south India during the early part of its cruise with the GCM-predicted aerosol species composed of mainly sulfate and organic matter, whereas dust species dominated during its cruise in late February and early March over the Arabian Sea when the ship was influenced by air masses from Africa- west Asia or northwest India. However, a typical clean marine aerosol dominated by sea salt was encountered during February when the ship cruised in the tropical Indian Ocean and was mostly influenced by marine air masses. The high aerosol optical depth was due to roughly equal parts of organic matter and sulfate. Region-tagged GCM estimates showed the presence of distinct transport at surface and higher layers for, e.g., DOY 56–61 and 65–70, indicating strong signals of emissions of black carbon, organic matter, and sulfate originating in central and northwest India, whereas elevated transport channels of black carbon and organic matter from Africa-west Asia. This is consistent with the back trajectory analysis and in corroboration with INDOEX measurement studies which observed different aerosol properties from aircraft and ship attributed to different transport pathways in surface and elevated flows. However, back trajectory analysis is not sufficient to evaluate the major source regions contributing to the transported aerosol. The fractional contribution of a source region also depended upon the emission flux from the region and its proximity to the receptor domain. Citation: Verma, S., C. Venkataraman, O. Boucher, and S. Ramachandran (2007), Source evaluation of aerosols measured during the Indian Ocean Experiment using combined chemical transport and back trajectory modeling, J. Geophys. Res., 112, D11210, doi:10.1029/2006JD007698. 1. Introduction [2] Observational studies during the Indian Ocean Exper- iment or INDOEX [Ramanathan et al., 2001; Ramachandran and Jayaraman, 2002] and more recent field campaigns in the Bay of Bengal [Ramachandran, 2005; Lal et al., 2006] Arabian Sea [Rao, 2005] have established the widespread occurrence of aerosols and trace gases of anthropogenic origin over ocean regions adjoining India. Several INDOEX investigators analyzed transport pathways into the domain and variations in pollution loading in air masses of different origins. Four broad channels of flow were identified into the INDOEX domain during the winter monsoon [Verver et al., 2001], which arose from west Asia passing over northwest- ern India, the Indo-Gangetic plain passing over the Bay of Bengal and south India, central India passing over the west coast and from southeast Asia, indicating contributions of multiple regions to the measured pollutants. Back trajectory analysis was used to qualitatively link variations in the chemical and optical properties of aerosols [Reiner et al., 2001; Mayol-Bracero et al., 2002; Quinn et al., 2002; Franke et al., 2003] to sources, broadly biomass burning and fossil fuel combustion, located in geographical regions traversed by JOURNAL OF GEOPHYSICAL RESEARCH, VOL. 112, D11210, doi:10.1029/2006JD007698, 2007 Click Here for Full Articl e 1 Department of Chemical Engineering, Indian Institute of Technology, Bombay, Mumbai, India. 2 Laboratoire d’Optique Atmosphe ´rique, CNRS/Universite ´ des Sciences et Technologies de Lille, Villeneuve d’Ascq, France. 3 Now at Hadley Centre, Met Office, Exeter, UK. 4 Space and Atmospheric Sciences Division, Physical Research Laboratory, Ahmedabad, India. Copyright 2007 by the American Geophysical Union. 0148-0227/07/2006JD007698$09.00 D11210 1 of 14
Transcript of Source evaluation of aerosols measured during the Indian Ocean Experiment using combined chemical...
Source evaluation of aerosols measured during the
Indian Ocean Experiment using combined chemical
transport and back trajectory modeling
S. Verma,1 C. Venkataraman,1 O. Boucher,2,3 and S. Ramachandran4
Received 25 June 2006; revised 19 February 2007; accepted 22 March 2007; published 9 June 2007.
[1] This work presents an analysis of aerosol measurements made during theOceanographic Research Vessel Sagar Kanya cruise of January–March 1999, in theIndian Ocean Experiment intensive field phase (INDOEX-IFP), with regard to the aerosolchemical constituents and identification of source regions of their origin. This is donethrough a hybrid approach which uses an Eulerian forward transport calculation in ageneral circulation model (GCM) with region-tagged emissions along with an analysis ofLagrangian back trajectories and emission inventory information, for overlapping timeperiods. Back trajectory analysis showed that the ship was mainly influenced by airmasses from the Indo-Gangetic plain, central India, or south India during the early part ofits cruise with the GCM-predicted aerosol species composed of mainly sulfate andorganic matter, whereas dust species dominated during its cruise in late February and earlyMarch over the Arabian Sea when the ship was influenced by air masses from Africa-west Asia or northwest India. However, a typical clean marine aerosol dominated by seasalt was encountered during February when the ship cruised in the tropical IndianOcean and was mostly influenced by marine air masses. The high aerosol optical depthwas due to roughly equal parts of organic matter and sulfate. Region-tagged GCMestimates showed the presence of distinct transport at surface and higher layers for,e.g., DOY 56–61 and 65–70, indicating strong signals of emissions of black carbon,organic matter, and sulfate originating in central and northwest India, whereas elevatedtransport channels of black carbon and organic matter from Africa-west Asia. This isconsistent with the back trajectory analysis and in corroboration with INDOEXmeasurement studies which observed different aerosol properties from aircraft and shipattributed to different transport pathways in surface and elevated flows. However,back trajectory analysis is not sufficient to evaluate the major source regions contributingto the transported aerosol. The fractional contribution of a source region also dependedupon the emission flux from the region and its proximity to the receptor domain.
Citation: Verma, S., C. Venkataraman, O. Boucher, and S. Ramachandran (2007), Source evaluation of aerosols measured during the
Indian Ocean Experiment using combined chemical transport and back trajectory modeling, J. Geophys. Res., 112, D11210,
doi:10.1029/2006JD007698.
1. Introduction
[2] Observational studies during the Indian Ocean Exper-iment or INDOEX [Ramanathan et al., 2001;Ramachandranand Jayaraman, 2002] and more recent field campaigns inthe Bay of Bengal [Ramachandran, 2005; Lal et al., 2006]Arabian Sea [Rao, 2005] have established the widespread
occurrence of aerosols and trace gases of anthropogenicorigin over ocean regions adjoining India. Several INDOEXinvestigators analyzed transport pathways into the domainand variations in pollution loading in air masses of differentorigins. Four broad channels of flow were identified into theINDOEX domain during the winter monsoon [Verver et al.,2001], which arose from west Asia passing over northwest-ern India, the Indo-Gangetic plain passing over the Bay ofBengal and south India, central India passing over the westcoast and from southeast Asia, indicating contributions ofmultiple regions to the measured pollutants. Back trajectoryanalysis was used to qualitatively link variations in thechemical and optical properties of aerosols [Reiner et al.,2001;Mayol-Bracero et al., 2002;Quinn et al., 2002; Frankeet al., 2003] to sources, broadly biomass burning and fossilfuel combustion, located in geographical regions traversed by
JOURNAL OF GEOPHYSICAL RESEARCH, VOL. 112, D11210, doi:10.1029/2006JD007698, 2007ClickHere
for
FullArticle
1Department of Chemical Engineering, Indian Institute of Technology,Bombay, Mumbai, India.
2Laboratoire d’Optique Atmospherique, CNRS/Universite des Scienceset Technologies de Lille, Villeneuve d’Ascq, France.
3Now at Hadley Centre, Met Office, Exeter, UK.4Space and Atmospheric Sciences Division, Physical Research
Laboratory, Ahmedabad, India.
Copyright 2007 by the American Geophysical Union.0148-0227/07/2006JD007698$09.00
D11210 1 of 14
air masses arriving in the Arabian Sea and tropical IndianOcean. Quinn et al. [2002] suggested eight source regions,based on back trajectory pathways influencing the Ronald H.Brown ship during its INDOEX cruise. They identifiedperiods when the boundary layer and elevated layer aerosolswere well mixed, and contrasting periods when they were notwell mixed, in both cases arising from the same or differentsource regions. In situ chemical measurements showed thepresence of high sulfate, particulate organic matter, blackcarbon, and inorganic matter in the air masses from Arabiaand the Indian subcontinent than in marine air masses.Aircraft based measurements of trace gas concentrations,aerosol chemical composition and optical effects over theIndian Ocean during INDOEX showed the evidence of thesignatures of heavy pollution over the north Indian oceanwhich was identified because of the outflow from the Indiansubcontinent as well as fromArabia and Southeast Asia basedon back trajectory calculations [Reiner et al., 2001; de Gouwet al., 2001;Gabriel et al., 2002;Mayol-Bracero et al., 2002].Leon et al. [2001] suggested the episodic transport of dustfrom Arabia over the Indian Ocean region during INDOEX.[3] Modeling methods for source-receptor resolution, or
quantitative estimation of the contribution of various sources,source classes or source regions to measured atmosphericpollution, e.g., mass concentrations of aerosol particles,aerosol chemical constituents or gaseous pollutants, arebroadly classified as dispersion models and receptor models.Dispersion models use mathematical descriptions of sources,in the form of emission inventories, and of atmosphericprocesses including dilution, chemical transformation andtransport to predict pollutant concentrations over space andtime, and form the basis of chemical transport models[Seinfeld and Pandis, 1998]. Retrotransport and adjointmodeling [Hourdin and Issartel, 2000] are used to estimatesource region contributions by running chemical transport
models backward in time. Receptor models use pollutantcharacteristics, such as chemical composition and their timeseries variation, at the receptor site, along with sourceinformation, to identify sources and their quantitative con-tributions to the measured pollution at the receptor site[Friedlander, 1973; Hopke, 2003]. Receptor modelingmethods using back trajectories that arise from a receptorsite to identify contributing source regions, include resi-dence time and area of influence analysis and the potentialsource contribution function [Hopke, 2003]. Hybrid models,e.g., trajectory cluster analysis with chemical mass balancereceptor modeling [Woo et al., 2003] and factor analysis orpositive matrix factorization with back trajectory analysis[Kulkarni et al., 2005] are recently being tried for regional-scale source-receptor resolution. Additionally, inversemodeling [Kasibhatla and Arellano, 2002] uses optimiza-tion methods to vary regional source strengths and minimizeerrors between global measurement databases and predic-tions from chemical transport models run in forward time, todeduce potential errors in emission inventories.[4] Dispersion models, i.e., chemical transport models,
have been used with newly available regional emissionsinformation for atmospheric simulations over south Asiaduring the INDOEX period [Reddy et al., 2004; Verma etal., 2006], and have shown a predominance of organiccarbon aerosols in addition to sulfate in the south Asianregion. Modeling studies have indicated the potential con-tribution of regions outside India to INDOEX aerosols[Rasch et al., 2001; Reddy et al., 2004], and of biomassburning to carbon monoxide [de Laat et al., 2001; Lelieveldet al., 2001]. A mesoscale chemical transport model hasbeen used to analyze sulfate, carbonaceous and dust trans-port indicated the predominance of dust species over theNorth while that of sulfate and carbonaceous species in thesouth of the INDOEX area [Minvielle et al., 2004a, 2004b].In this work, we analyze the aerosol species composition tothe aerosol distributions measured on board the Oceano-graphicResearchVessel SagarKanya during its INDOEX-IFPcruise.We carry out the source identification of the transportedaerosol using a hybrid method which involves region-taggedemissions in an Eulerian forward transport calculation in ageneral circulation model (GCM) along with analysis ofLagrangian back trajectories and emission inventory informa-tion, for overlapping time periods.
2. Method of Study
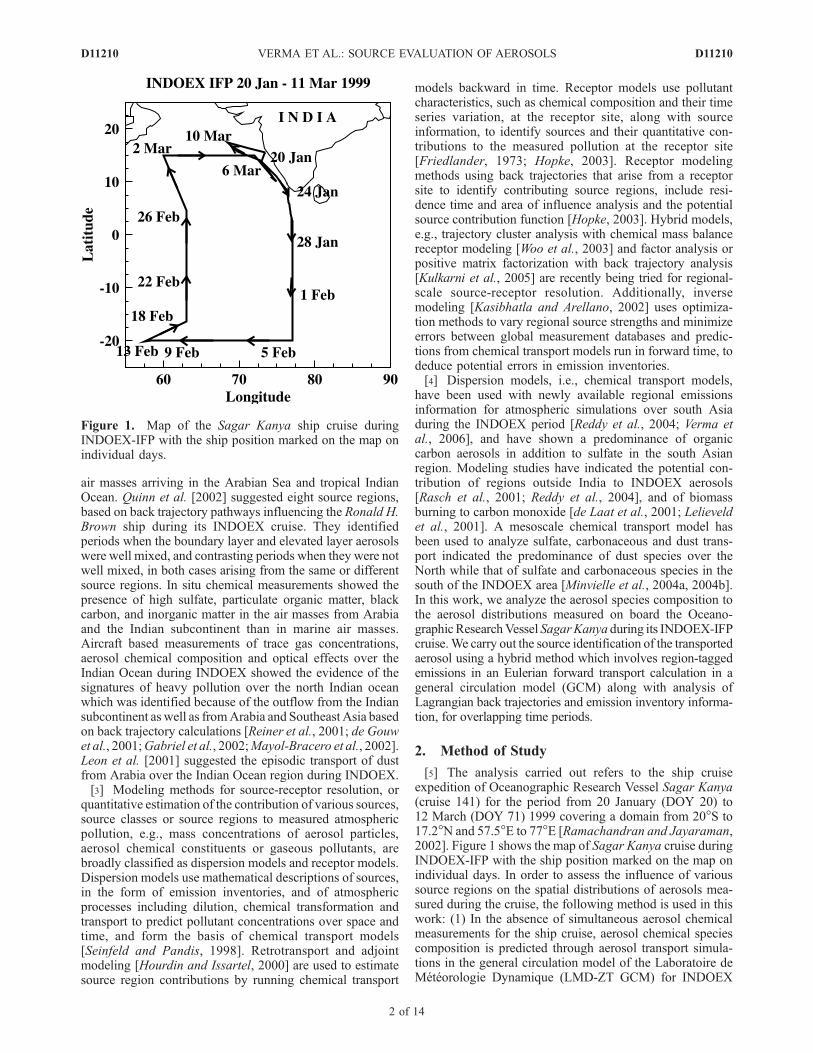
[5] The analysis carried out refers to the ship cruiseexpedition of Oceanographic Research Vessel Sagar Kanya(cruise 141) for the period from 20 January (DOY 20) to12 March (DOY 71) 1999 covering a domain from 20�S to17.2�N and 57.5�E to 77�E [Ramachandran and Jayaraman,2002]. Figure 1 shows the map of Sagar Kanya cruise duringINDOEX-IFP with the ship position marked on the map onindividual days. In order to assess the influence of varioussource regions on the spatial distributions of aerosols mea-sured during the cruise, the following method is used in thiswork: (1) In the absence of simultaneous aerosol chemicalmeasurements for the ship cruise, aerosol chemical speciescomposition is predicted through aerosol transport simula-tions in the general circulation model of the Laboratoire deMeteorologie Dynamique (LMD-ZT GCM) for INDOEX
Figure 1. Map of the Sagar Kanya ship cruise duringINDOEX-IFP with the ship position marked on the map onindividual days.
D11210 VERMA ET AL.: SOURCE EVALUATION OF AEROSOLS
2 of 14
D11210
and sampling the estimates for the times and locations ofSagar Kanya during its INDOEX-IFP cruise. (2) We usesource region aerosol flux composition, from the emissioninventory to deduce their potential influence on receptorlocation. (3) We make quantitative predictions of sourceregion contributions to total aerosols and aerosol chemicalspecies, through aerosol transport experiments in the LMD-ZTGCM with region-tagged emissions in conjunction with theback trajectory analysis.
2.1. Aerosol Emission Fluxes From Source Regions
[6] Source regions were classified on the basis of differ-ences in composition of their aerosol emission fluxes andtheir proximity to the Indian Ocean [Rasch et al., 2001;Ramachandran and Jayaraman, 2002; Reddy et al., 2004].These source regions are the following: (1) Indo-Gangeticplain (IGP), (2) central India (CNI), (3) south India (SI),(4) northwest India (NWI), (5) southeast Asia (SEA),(6) east Asia (EA), (7) Africa-west Asia (AFWA), and(8) rest of the world (ROW). Emissions over India are fromthe high-resolution (0.25� � 0.25�) emission inventories of
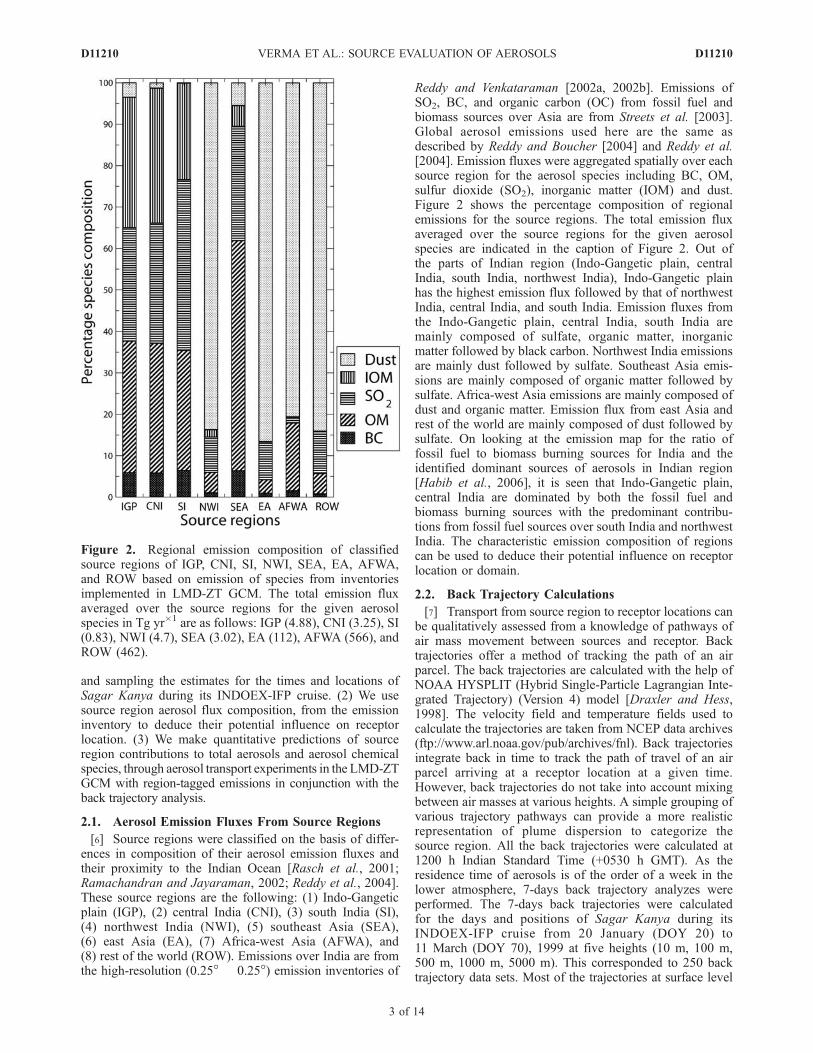
Reddy and Venkataraman [2002a, 2002b]. Emissions ofSO2, BC, and organic carbon (OC) from fossil fuel andbiomass sources over Asia are from Streets et al. [2003].Global aerosol emissions used here are the same asdescribed by Reddy and Boucher [2004] and Reddy et al.[2004]. Emission fluxes were aggregated spatially over eachsource region for the aerosol species including BC, OM,sulfur dioxide (SO2), inorganic matter (IOM) and dust.Figure 2 shows the percentage composition of regionalemissions for the source regions. The total emission fluxaveraged over the source regions for the given aerosolspecies are indicated in the caption of Figure 2. Out ofthe parts of Indian region (Indo-Gangetic plain, centralIndia, south India, northwest India), Indo-Gangetic plainhas the highest emission flux followed by that of northwestIndia, central India, and south India. Emission fluxes fromthe Indo-Gangetic plain, central India, south India aremainly composed of sulfate, organic matter, inorganicmatter followed by black carbon. Northwest India emissionsare mainly dust followed by sulfate. Southeast Asia emis-sions are mainly composed of organic matter followed bysulfate. Africa-west Asia emissions are mainly composed ofdust and organic matter. Emission flux from east Asia andrest of the world are mainly composed of dust followed bysulfate. On looking at the emission map for the ratio offossil fuel to biomass burning sources for India and theidentified dominant sources of aerosols in Indian region[Habib et al., 2006], it is seen that Indo-Gangetic plain,central India are dominated by both the fossil fuel andbiomass burning sources with the predominant contribu-tions from fossil fuel sources over south India and northwestIndia. The characteristic emission composition of regionscan be used to deduce their potential influence on receptorlocation or domain.
2.2. Back Trajectory Calculations
[7] Transport from source region to receptor locations canbe qualitatively assessed from a knowledge of pathways ofair mass movement between sources and receptor. Backtrajectories offer a method of tracking the path of an airparcel. The back trajectories are calculated with the help ofNOAA HYSPLIT (Hybrid Single-Particle Lagrangian Inte-grated Trajectory) (Version 4) model [Draxler and Hess,1998]. The velocity field and temperature fields used tocalculate the trajectories are taken from NCEP data archives(ftp://www.arl.noaa.gov/pub/archives/fnl). Back trajectoriesintegrate back in time to track the path of travel of an airparcel arriving at a receptor location at a given time.However, back trajectories do not take into account mixingbetween air masses at various heights. A simple grouping ofvarious trajectory pathways can provide a more realisticrepresentation of plume dispersion to categorize thesource region. All the back trajectories were calculated at1200 h Indian Standard Time (+0530 h GMT). As theresidence time of aerosols is of the order of a week in thelower atmosphere, 7-days back trajectory analyzes wereperformed. The 7-days back trajectories were calculatedfor the days and positions of Sagar Kanya during itsINDOEX-IFP cruise from 20 January (DOY 20) to11 March (DOY 70), 1999 at five heights (10 m, 100 m,500 m, 1000 m, 5000 m). This corresponded to 250 backtrajectory data sets. Most of the trajectories at surface level
Figure 2. Regional emission composition of classifiedsource regions of IGP, CNI, SI, NWI, SEA, EA, AFWA,and ROW based on emission of species from inventoriesimplemented in LMD-ZT GCM. The total emission fluxaveraged over the source regions for the given aerosolspecies in Tg yr�1 are as follows: IGP (4.88), CNI (3.25), SI(0.83), NWI (4.7), SEA (3.02), EA (112), AFWA (566), andROW (462).
D11210 VERMA ET AL.: SOURCE EVALUATION OF AEROSOLS
3 of 14
D11210

(10 m to 500 m) originate from the Indian region and that athigher heights (1000 m and above) from Africa-west Asiaand the Indo-Gangetic plain indicating the presence of long-range transport from Africa-west Asia over to the Indo-Gangetic plain.
2.3. Short Description of the LMD-ZT GCM
[8] The study of region-tagged aerosol transport is carriedout with the help of the LMD-ZT general circulation model(GCM), version 3.3. A description of the atmosphericmodel is given by Li [1999] and a specific description ofaerosol treatment and atmospheric transport is given byBoucher et al. [2002] and Reddy et al. [2004]. A shortdescription of the model is presented here. The sulfur cyclehas been incorporated and processes of convective trans-port, wet scavenging, and aqueous phase chemistry havebeen parameterized as consistently as possible with themodel physical parameterizations [Boucher et al., 2002].Sulfate formation, transport, and radiative forcing wereestimated byBoucher et al. [2002]. Aerosol optical properties(mass extinction coefficient, ae; single scattering albedo, w;and asymmetry factor, g) for all aerosol species are computedusing Mie theory as described by Reddy et al. [2004]. Theaerosol extinction coefficient is computed from all aerosolspecies and associated water.[9] The model has a resolution of 96 points in longitude
and 72 points in latitude. There are 19 vertical layers of ahybrid sigma-pressure coordinate with eleven layers below
850 hPa and eight layers between 850 and 500 hPa. A zoomis applied over the Indian region; it is centered at 75�E and15�N and extends from 50�E to 100�E in longitude andfrom 5�S to 35�N in latitude. Zoom factors of 4 and 3 areapplied in longitude and latitude, respectively, resulting in aresolution of about 1� in longitude and 0.8� in latitude overthe zoomed region. A short description of the techniqueapplied to use the GCM with tagged region as an Eulerianforward transport approach is given here. The sourceregions as classified in section 2.1 are implemented inGCM. Figure 3 shows the masked regions on GCM zoomgrid. Aerosol emissions including sulfate (Sul), organicmatter (OM), black carbon (BC), dust, inorganic matter(IOM), and sea salt (SS) are tagged for each of the sourceregion. INDOEX-IFP is simulated in the LMD-ZT GCM foreach of the source region with the emissions out of thatregion being switched off. The GCM is nudged withECMWF wind fields. We sample the model outputs forthe different position and time of the Sagar Kanya during itsINDOEX-IFP cruise.
3. Source Region Influence and Contribution toAerosols Measured Aboard Sagar Kanya
3.1. Back Trajectory Analysis and EmissionInventory Information
[10] Back trajectories were calculated as described insection 2.2 and grouped on the basis of their origin and
Figure 3. Masked regions on GCM zoom grid representing tagged source regions taken under study;the classification of source regions are as follows with different color scales indicated in bracket: (1) IGP(light green), (2) CNI (orange), (3) SI (yellow), (4) NWI (red), (5) SEA (green), (6) EA (blue), (7) AFWA(purple), and (8) ROW (dark green).
D11210 VERMA ET AL.: SOURCE EVALUATION OF AEROSOLS
4 of 14
D11210
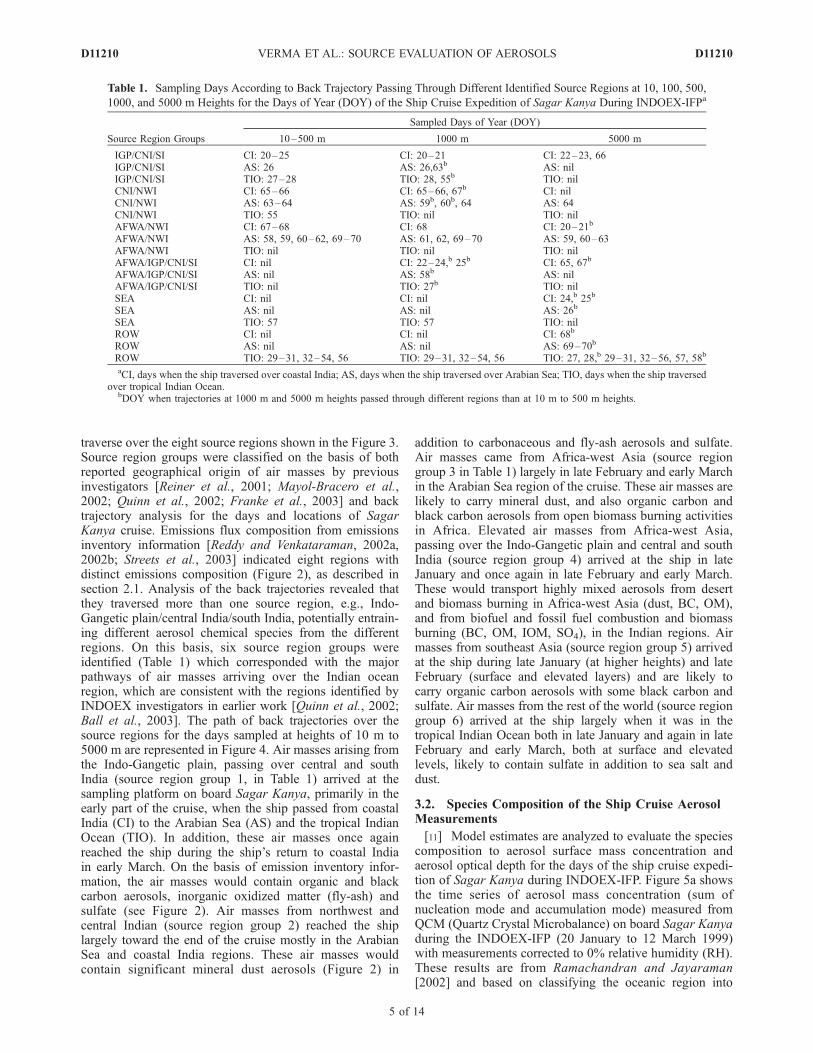
traverse over the eight source regions shown in the Figure 3.Source region groups were classified on the basis of bothreported geographical origin of air masses by previousinvestigators [Reiner et al., 2001; Mayol-Bracero et al.,2002; Quinn et al., 2002; Franke et al., 2003] and backtrajectory analysis for the days and locations of SagarKanya cruise. Emissions flux composition from emissionsinventory information [Reddy and Venkataraman, 2002a,2002b; Streets et al., 2003] indicated eight regions withdistinct emissions composition (Figure 2), as described insection 2.1. Analysis of the back trajectories revealed thatthey traversed more than one source region, e.g., Indo-Gangetic plain/central India/south India, potentially entrain-ing different aerosol chemical species from the differentregions. On this basis, six source region groups wereidentified (Table 1) which corresponded with the majorpathways of air masses arriving over the Indian oceanregion, which are consistent with the regions identified byINDOEX investigators in earlier work [Quinn et al., 2002;Ball et al., 2003]. The path of back trajectories over thesource regions for the days sampled at heights of 10 m to5000 m are represented in Figure 4. Air masses arising fromthe Indo-Gangetic plain, passing over central and southIndia (source region group 1, in Table 1) arrived at thesampling platform on board Sagar Kanya, primarily in theearly part of the cruise, when the ship passed from coastalIndia (CI) to the Arabian Sea (AS) and the tropical IndianOcean (TIO). In addition, these air masses once againreached the ship during the ship’s return to coastal Indiain early March. On the basis of emission inventory infor-mation, the air masses would contain organic and blackcarbon aerosols, inorganic oxidized matter (fly-ash) andsulfate (see Figure 2). Air masses from northwest andcentral Indian (source region group 2) reached the shiplargely toward the end of the cruise mostly in the ArabianSea and coastal India regions. These air masses wouldcontain significant mineral dust aerosols (Figure 2) in
addition to carbonaceous and fly-ash aerosols and sulfate.Air masses came from Africa-west Asia (source regiongroup 3 in Table 1) largely in late February and early Marchin the Arabian Sea region of the cruise. These air masses arelikely to carry mineral dust, and also organic carbon andblack carbon aerosols from open biomass burning activitiesin Africa. Elevated air masses from Africa-west Asia,passing over the Indo-Gangetic plain and central and southIndia (source region group 4) arrived at the ship in lateJanuary and once again in late February and early March.These would transport highly mixed aerosols from desertand biomass burning in Africa-west Asia (dust, BC, OM),and from biofuel and fossil fuel combustion and biomassburning (BC, OM, IOM, SO4), in the Indian regions. Airmasses from southeast Asia (source region group 5) arrivedat the ship during late January (at higher heights) and lateFebruary (surface and elevated layers) and are likely tocarry organic carbon aerosols with some black carbon andsulfate. Air masses from the rest of the world (source regiongroup 6) arrived at the ship largely when it was in thetropical Indian Ocean both in late January and again in lateFebruary and early March, both at surface and elevatedlevels, likely to contain sulfate in addition to sea salt anddust.
3.2. Species Composition of the Ship Cruise AerosolMeasurements
[11] Model estimates are analyzed to evaluate the speciescomposition to aerosol surface mass concentration andaerosol optical depth for the days of the ship cruise expedi-tion of Sagar Kanya during INDOEX-IFP. Figure 5a showsthe time series of aerosol mass concentration (sum ofnucleation mode and accumulation mode) measured fromQCM (Quartz Crystal Microbalance) on board Sagar Kanyaduring the INDOEX-IFP (20 January to 12 March 1999)with measurements corrected to 0% relative humidity (RH).These results are from Ramachandran and Jayaraman[2002] and based on classifying the oceanic region into
Table 1. Sampling Days According to Back Trajectory Passing Through Different Identified Source Regions at 10, 100, 500,
1000, and 5000 m Heights for the Days of Year (DOY) of the Ship Cruise Expedition of Sagar Kanya During INDOEX-IFPa
Source Region Groups
Sampled Days of Year (DOY)
10–500 m 1000 m 5000 m
IGP/CNI/SI CI: 20–25 CI: 20–21 CI: 22–23, 66IGP/CNI/SI AS: 26 AS: 26,63b AS: nilIGP/CNI/SI TIO: 27–28 TIO: 28, 55b TIO: nilCNI/NWI CI: 65–66 CI: 65–66, 67b CI: nilCNI/NWI AS: 63–64 AS: 59b, 60b, 64 AS: 64CNI/NWI TIO: 55 TIO: nil TIO: nilAFWA/NWI CI: 67–68 CI: 68 CI: 20–21b
AFWA/NWI AS: 58, 59, 60–62, 69–70 AS: 61, 62, 69–70 AS: 59, 60–63AFWA/NWI TIO: nil TIO: nil TIO: nilAFWA/IGP/CNI/SI CI: nil CI: 22–24,b 25b CI: 65, 67b
AFWA/IGP/CNI/SI AS: nil AS: 58b AS: nilAFWA/IGP/CNI/SI TIO: nil TIO: 27b TIO: nilSEA CI: nil CI: nil CI: 24,b 25b
SEA AS: nil AS: nil AS: 26b
SEA TIO: 57 TIO: 57 TIO: nilROW CI: nil CI: nil CI: 68b
ROW AS: nil AS: nil AS: 69–70b
ROW TIO: 29–31, 32–54, 56 TIO: 29–31, 32–54, 56 TIO: 27, 28,b 29–31, 32–56, 57, 58b
aCI, days when the ship traversed over coastal India; AS, days when the ship traversed over Arabian Sea; TIO, days when the ship traversedover tropical Indian Ocean.
bDOY when trajectories at 1000 m and 5000 m heights passed through different regions than at 10 m to 500 m heights.
D11210 VERMA ET AL.: SOURCE EVALUATION OF AEROSOLS
5 of 14
D11210

Figure 4. Path of back trajectories (10 m, 100 m, and 500 m (black lines with circles); 1000 m (red lineswith squares); and 5000 m (green lines with triangles)) over the different identified source regions (detailsof back trajectories for all days of the ship cruise are given in Table 1). Numbers shown against thelegends represent days of the year (DOY).
D11210 VERMA ET AL.: SOURCE EVALUATION OF AEROSOLS
6 of 14
D11210
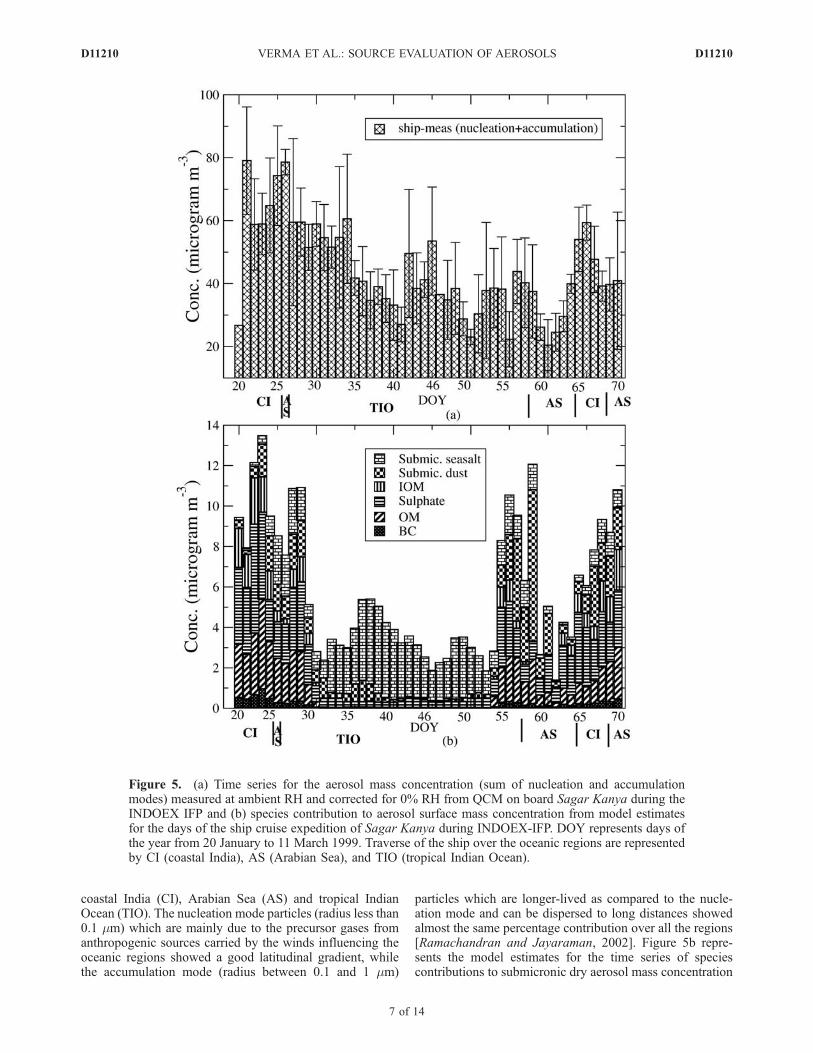
coastal India (CI), Arabian Sea (AS) and tropical IndianOcean (TIO). The nucleation mode particles (radius less than0.1 mm) which are mainly due to the precursor gases fromanthropogenic sources carried by the winds influencing theoceanic regions showed a good latitudinal gradient, whilethe accumulation mode (radius between 0.1 and 1 mm)
particles which are longer-lived as compared to the nucle-ation mode and can be dispersed to long distances showedalmost the same percentage contribution over all the regions[Ramachandran and Jayaraman, 2002]. Figure 5b repre-sents the model estimates for the time series of speciescontributions to submicronic dry aerosol mass concentration
Figure 5. (a) Time series for the aerosol mass concentration (sum of nucleation and accumulationmodes) measured at ambient RH and corrected for 0% RH from QCM on board Sagar Kanya during theINDOEX IFP and (b) species contribution to aerosol surface mass concentration from model estimatesfor the days of the ship cruise expedition of Sagar Kanya during INDOEX-IFP. DOY represents days ofthe year from 20 January to 11 March 1999. Traverse of the ship over the oceanic regions are representedby CI (coastal India), AS (Arabian Sea), and TIO (tropical Indian Ocean).
D11210 VERMA ET AL.: SOURCE EVALUATION OF AEROSOLS
7 of 14
D11210
for the days of the ship cruise expedition of Sagar Kanya.The model estimates dust (two size bins: submicronic andsupermicronic), and sea salt (in 10 size bins between 0.045 and20 mm at 80% relative humidity), but do not have sizesegregated estimations for the species of sulfate, OM andBC. The submicron mass concentrations are compared frommodel in relation with that of sum of accumulation andnucleation mode from measurements. In general, the modelestimates of total dry surface mass concentration in compar-ison to measurements corrected to 0% RH are underestimatedby a factor of 5 to 10. The model has been extensivelyevaluated with the INDOEX measurements of Reddy et al.[2004]. In the present work, we have used the same version ofmodel with the region tagged emissions to carry out sourceevaluation of aerosols. Comparison of modeled surface massconcentrations for various species of sulphate, black carbon(BC), organic matter (OM), inorganic matter, and sea salt(please refer to Reddy et al. [2004, Figures 2 and 3]) showedthat themodel captured the north to south gradient inmeasuredconcentrations, but over the region of largest concentrations(5 to 10�N), modeled sulphate, BC, and dust concentrationswere estimated a factor of 2 to 3 lower than the measuredvalues. The OM and sea salt showed a better agreement withthe measurements. It is to be noted that measurements ofaerosol surface mass concentration on board Sagar Kanyawere taken at ambient relative humidity. The correction for theRH factor to the measurements were applied taking intoaccount scaling factors variation with relative humidity asgiven byRamachandran and Jayaraman [2002, Table 3]. Thiswas done to scale the measurements taken at ambient RH to0%RH. The scaling factor estimates did not take explicitly theRH growth effects due to individual aerosol component suchas sulfate, organic matter. The scaling factors were derived foraerosol size distributions made of water soluble aerosols (Hesset al., 1998) and sea salt (accumulation) and sea salt (coarse)modes. Another factor leading to large discrepancy could bedue to the differences in the mode radius of individual aerosolcomponent used in determining the scaling factors [Hess et al.,1998] and the values used in LMD-GCM. We also comparethe modeled aerosol optical depth and Sagar Kanya measure-ments which is discussed later in the text.[12] On evaluating the species composition from model
estimates for the days of the ship cruise expedition of SagarKanya, it is found that sulfate and organic matter contributemainly to the species composition on days from 20 January(DOY 20) to 30 January (DOY 30) when the ship traversesover coastal India and Arabian Sea and starts to traversetoward the tropical Indian Ocean indicating the transportmainly from the Indian region, based on emission compo-sition analysis presented in Figure 2. Sea salt and sulfatecontribute mainly to the species composition from 1 February(DOY 32) to 23 February (DOY 54) when the ship traversesover tropical Indian Ocean, indicating transport mainly fromoceanic regions. Contribution from organic matter, sulfateand dust to the total aerosol species composition starts to peakup from 24 February (DOY 55) as the ship traverses near tothe Arabian Sea region so that on 25 February (DOY 56), dustalong with sulfate and organic matter contribute mainly tospecies composition, indicating transport from both Indianregions and Africa-west Asia, while that from 26 February(DOY 57) to 28 February (DOY 59), sulfate channeldeclines, and it is dust followed by organic matter which
mainly contributes to the species composition, indicatingtransport mainly from Africa-west Asia. This is alsosupported by back trajectory analysis shown in Table 1 andis consistent with Ramachandran and Jayaraman [2002,Figure 11a]. From 1 March (DOY 60), organic matterchannel declines and sulfate starts to peak up from 2 March(DOY 61) so that aerosol species composition is mainlycontributed from both dust and sulfate species, indicatingtransport mainly from northwest part of India. This is alsosupported by back trajectory analysis shown in Table 1 and isconsistent with Ramachandran and Jayaraman [2002,Figure 11b]. From 3 March (DOY 62) to 7 March (DOY 66)dust channel declines and now the aerosol species compo-sition is composed mainly of sulfate species, indicatingtransport from Indian region. From 8 March (DOY 67) to11 March (DOY 70), both dust and organic matter againstarts to peak up with species composition composed ofcontributions from both sulfate and dust species mainly on8 March (DOY 67), while sulfate, dust, and organic matteron 10 March (DOY 69) and 11 March (DOY 70), indicatingtransport from both Africa-west Asia and Indian region.[13] Figure 6a shows the aerosol optical depth (AOD)
measured on board Sagar Kanya at 500 nm and from modelestimates (Figure 6b) at 550 nm sampled for the days of theship cruise expedition of Sagar Kanya. The model estimatesfor AOD agrees relatively well with the Sagar Kanyameasurements on almost all days except on few days(DOY 24, 60, 65, 66, 67) when the model estimates areunderestimated by a factor of 1.5 to 2. This factor of modelunderestimation falls within the range of 2 to 3 as reportedby Reddy et al. [2004] on evaluation of model estimatesfrom measurements made from other platforms duringINDOEX. The reasons for underestimation of model wasattributed to a spurious overestimation of precipitation ratein the model over the Arabian Sea and tropical Indian oceanand inaccuracies in the wind fields of ECMWF which areused to nudge the model, but there is likely to be as well anunderestimation of some of the aerosol sources in the model[Reddy et al., 2004]. Though model estimates are under-estimated, it is a valuable tool to understand the chemicalspecies composition and the source region evaluation to theaerosol measurements of the Sagar Kanya. This is becausethe pattern of emissions consisting of the regional emissioncomposition of aerosol species as shown in Figure 2 areexpected to be correct.[14] In general, AOD species composition as estimated from
model is mainly contributed by sulfate and organic matteron all days except on 10 and 11 March (DOY 69 and 70)when dust also contributes almost equally to that of sulfateand organic matter indicating elevated transport of dustspecies on these days. A high AOD is estimated when theship traverses over coastal India followed by that overArabian Sea and a low value over tropical Indian Ocean.Over CI and AS, species contribution to AOD comprisesmainly sulfate species followed by organic matter and blackcarbon while over TIO, composition mainly comprisescontributions from sea salt and sulfate species. This isconsistent with measurements from Sagar Kanya whichshowed the presence of more absorbing aerosols over CIand AS as compared to that at TIOwith mean values of singlescattering albedo of 0.88 (CI), 0.93 (AS), and 0.99 (TIO)[Ramachandran and Jayaraman, 2002]. Low values of
D11210 VERMA ET AL.: SOURCE EVALUATION OF AEROSOLS
8 of 14
D11210

single scattering albedo over CI and AS are due to thepresence of soot particles emanating from fossil fuel andbiomass burning and transported from the continent.[15] Different features of AOD and that of surface mass
concentration are also estimated on some of the days (DOY20, 59, 69, 70). A high AOD is estimated on 20 January
(DOY 20) as compared to that of 22 and 23 January (DOY 22and 23) though the surface mass concentration showed lowvalue on 20 January (DOY 20) as compared to that on 22 and23 January (DOY 22 and 23) inferring elevated transport ofaerosol species on 20 January (DOY 20). Peaked surfacemass concentration on 28 February (DOY 59) is due to an
Figure 6. (a) Time series for the aerosol optical depth measured at 500 nm on board Sagar Kanyaduring the INDOEX IFP and (b) species contributions to aerosol optical depth at 550 nm from modelestimates for the days of the ship cruise expedition of Sagar Kanya during INDOEX-IFP. DOYrepresents days of the year from 20 January to 11 March 1999. Traverse of the ship over the oceanicregions are represented by CI (coastal India), AS (Arabian Sea), and TIO (tropical Indian Ocean).
D11210 VERMA ET AL.: SOURCE EVALUATION OF AEROSOLS
9 of 14
D11210
episodic transport of dust species while AOD shows maxi-mum contributions from organic matter and sulfate species.On 10 March (DOY 69) and 11 March (DOY 70), AOD(largely contributed from dust species) shows a declinethough the surface mass concentration (largely contributedfrom sulfate and organic matter) have high values ascompared to previous days indicating the elevated transportof species with low extinction efficiency such as dust species.[16] Overall, the estimates sampled for the times and
locations of Sagar Kanya cruise (Figures 5 and 6) capturesthe latitudinal gradient as reported in INDOEX studies[Rhoads et al., 1997; Gupta et al., 1999; Moorthy et al.,2001] showing the presence of high aerosol surface massconcentration and optical depth when the ship cruises overcoastal India and the Arabian Sea as compared to that overthe tropical Indian Ocean. Aerosol species is mainlycomposed of sulfate and organic matter during the earlypart of its cruise when the ship was mainly influenced by airmasses from the Indo-Gangetic plain, central India or southIndia whereas dust species dominated during its cruise inlate February and early March over the Arabian Sea whenthe ship was influenced by air masses from Africa-westAsia or northwest India. However, a typical clean marineaerosol dominated by sea salt was encountered duringFebruary when the ship cruised in the tropical Indian Oceanand was mostly influenced by marine air masses. Thiscorroborates the measurements analysis which showed thepresence of heavy pollution including high sulfate, organicmatter, black carbon, and inorganic matter in the air massesfrom Arabia and the Indian subcontinent in addition to theepisodic transport of dust from Arabia than that from marineair masses [Reiner et al., 2001; de Gouw et al., 2001;
Gabriel et al., 2002; Mayol-Bracero et al., 2002; Leon etal., 2001; Quinn et al., 2002; Ball et al., 2003].
3.3. Identification of Source Regions
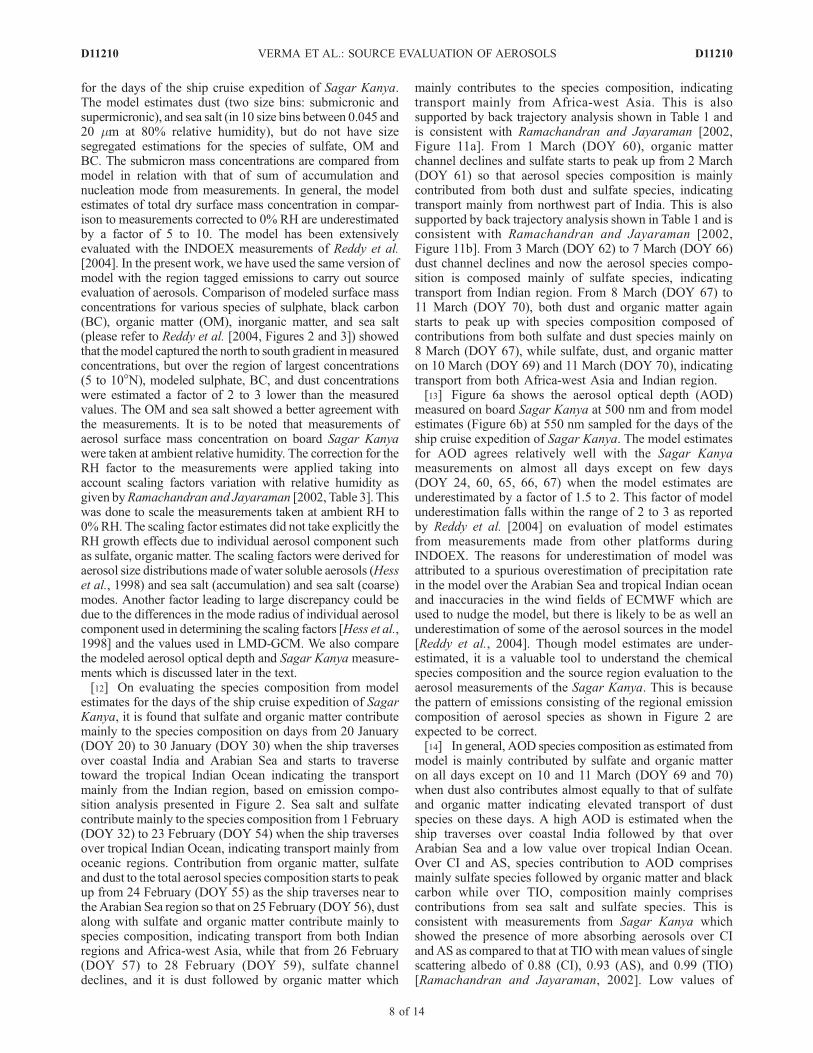
[17] Identification of source regions, contributing to boththe aerosol surface mass concentration and optical depth, isdone through the aerosol transport experiments in theLMD-ZT GCM with region-tagged emissions from theeight source regions defined earlier. The definition ofthe spatial extent of ROW, results in local sea salt andlong-range transported aerosols from regions outside thedefined source regions, i.e., northern Asia, north and southAmerica, and Australia, being included in this category.These predictions are evaluated with back trajectory analysisat corresponding ship positions for overlapping time periods,specifically to understand differences in transport pathwaysat different heights in the atmosphere.[18] Figure 7 shows the relative contributions of the eight
source regions to the submicron aerosol mass concentrationaveraged between 0 to 500 m heights, corresponding to thesurface concentrations measured aboard Sagar Kanya, aswell as to the AOD, from the aerosol column. The simula-tion results were sampled at times and various locationsduring the cruise. Figures 8a–8c and Figures 8d–8fdisaggregate the information of Figure 7 for the speciesof BC, OM and, sulfate. This analysis is presented for theperiod from 20 January (DOY 20) to 31 January (DOY 31),and from 23 February (DOY 54) to 11 March (DOY 70).From DOY 31 to 54, typical clean marine aerosol dominatedby sea salt was encountered. During this period a nearuniform aerosol composition, when the ship was in thetropical Indian Ocean, which consisted mostly of sea saltfrom the local ocean regions and some sulfate (as seen from
Figure 7. Estimates of aerosol transport from classified source regions from region-tagged simulationsfor (a) aerosol surface mass concentration and (b) aerosol optical depth averaged for the days of the shipcruise expedition of Sagar Kanya during INDOEX-IFP. DOY represents days of the year from 20 Januaryto 11 March 1999.
D11210 VERMA ET AL.: SOURCE EVALUATION OF AEROSOLS
10 of 14
D11210
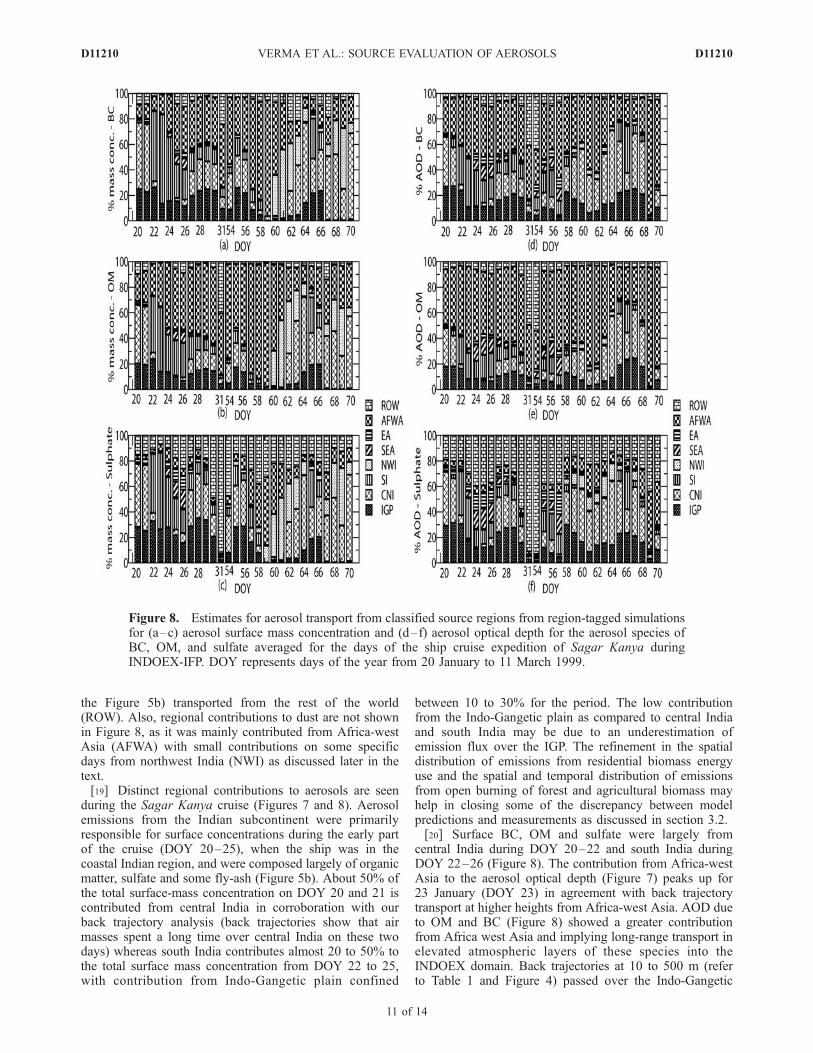
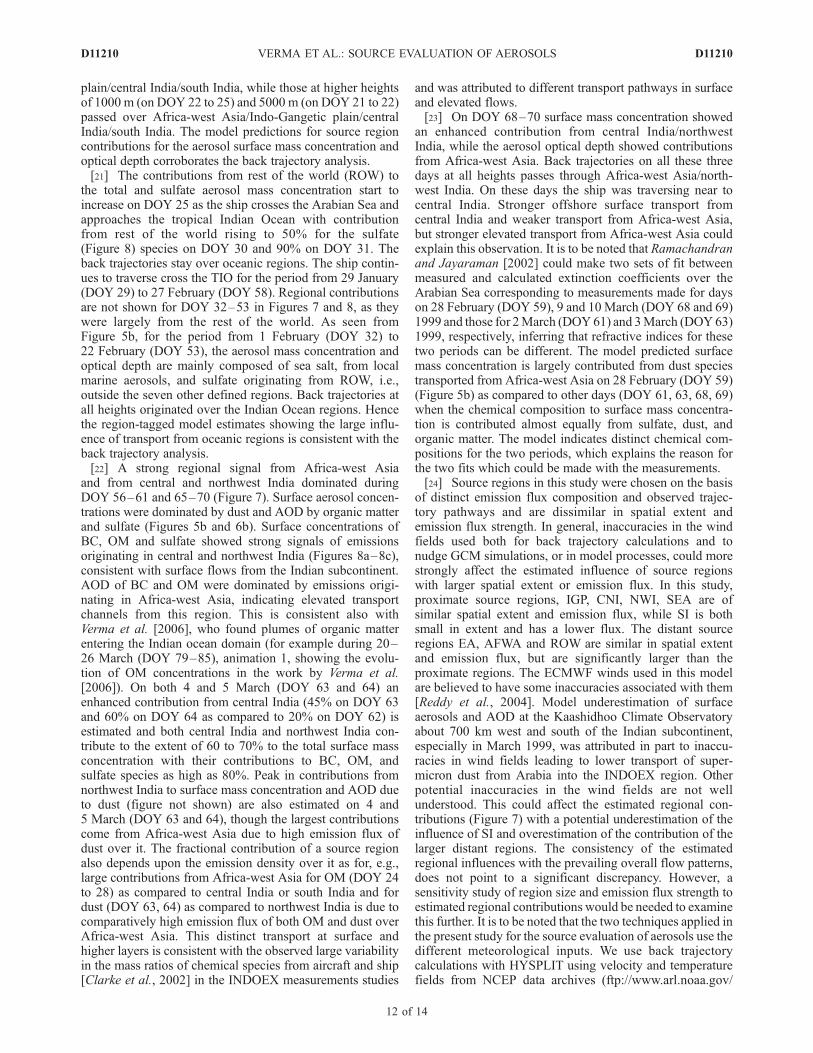
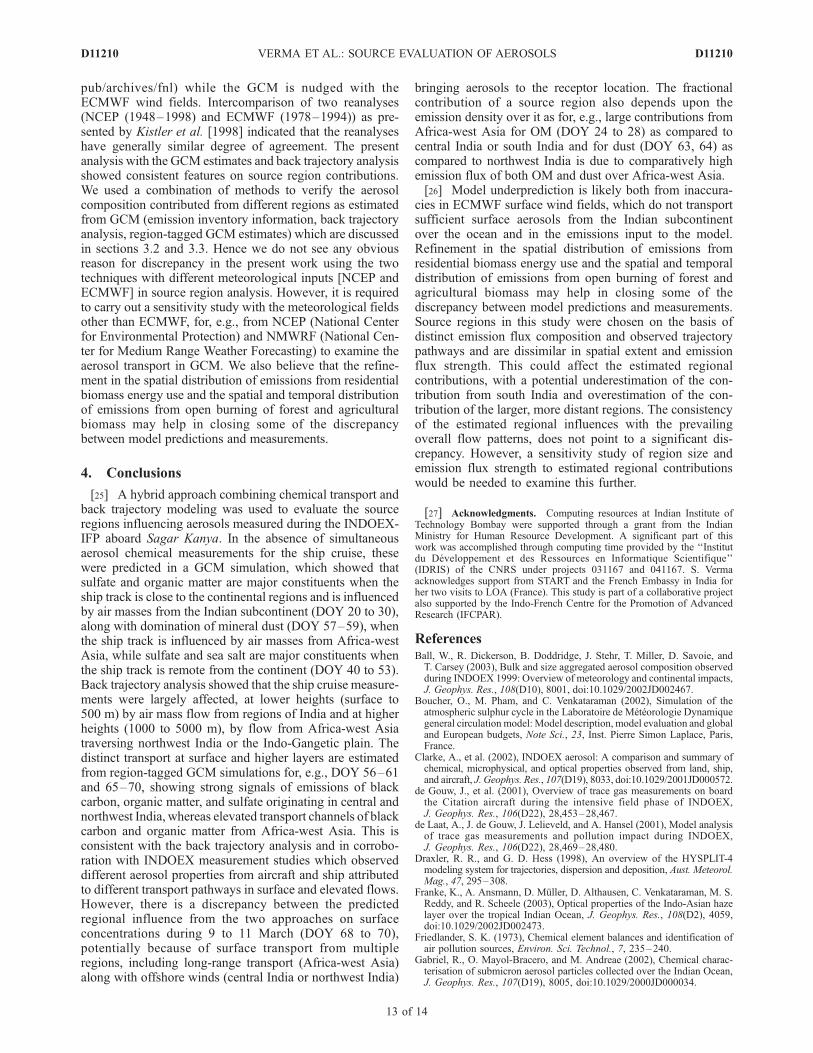
the Figure 5b) transported from the rest of the world(ROW). Also, regional contributions to dust are not shownin Figure 8, as it was mainly contributed from Africa-westAsia (AFWA) with small contributions on some specificdays from northwest India (NWI) as discussed later in thetext.[19] Distinct regional contributions to aerosols are seen
during the Sagar Kanya cruise (Figures 7 and 8). Aerosolemissions from the Indian subcontinent were primarilyresponsible for surface concentrations during the early partof the cruise (DOY 20–25), when the ship was in thecoastal Indian region, and were composed largely of organicmatter, sulfate and some fly-ash (Figure 5b). About 50% ofthe total surface-mass concentration on DOY 20 and 21 iscontributed from central India in corroboration with ourback trajectory analysis (back trajectories show that airmasses spent a long time over central India on these twodays) whereas south India contributes almost 20 to 50% tothe total surface mass concentration from DOY 22 to 25,with contribution from Indo-Gangetic plain confined
between 10 to 30% for the period. The low contributionfrom the Indo-Gangetic plain as compared to central Indiaand south India may be due to an underestimation ofemission flux over the IGP. The refinement in the spatialdistribution of emissions from residential biomass energyuse and the spatial and temporal distribution of emissionsfrom open burning of forest and agricultural biomass mayhelp in closing some of the discrepancy between modelpredictions and measurements as discussed in section 3.2.[20] Surface BC, OM and sulfate were largely from
central India during DOY 20–22 and south India duringDOY 22–26 (Figure 8). The contribution from Africa-westAsia to the aerosol optical depth (Figure 7) peaks up for23 January (DOY 23) in agreement with back trajectorytransport at higher heights from Africa-west Asia. AOD dueto OM and BC (Figure 8) showed a greater contributionfrom Africa west Asia and implying long-range transport inelevated atmospheric layers of these species into theINDOEX domain. Back trajectories at 10 to 500 m (referto Table 1 and Figure 4) passed over the Indo-Gangetic
Figure 8. Estimates for aerosol transport from classified source regions from region-tagged simulationsfor (a–c) aerosol surface mass concentration and (d–f) aerosol optical depth for the aerosol species ofBC, OM, and sulfate averaged for the days of the ship cruise expedition of Sagar Kanya duringINDOEX-IFP. DOY represents days of the year from 20 January to 11 March 1999.
D11210 VERMA ET AL.: SOURCE EVALUATION OF AEROSOLS
11 of 14
D11210
plain/central India/south India, while those at higher heightsof 1000 m (on DOY 22 to 25) and 5000 m (on DOY 21 to 22)passed over Africa-west Asia/Indo-Gangetic plain/centralIndia/south India. The model predictions for source regioncontributions for the aerosol surface mass concentration andoptical depth corroborates the back trajectory analysis.[21] The contributions from rest of the world (ROW) to
the total and sulfate aerosol mass concentration start toincrease on DOY 25 as the ship crosses the Arabian Sea andapproaches the tropical Indian Ocean with contributionfrom rest of the world rising to 50% for the sulfate(Figure 8) species on DOY 30 and 90% on DOY 31. Theback trajectories stay over oceanic regions. The ship contin-ues to traverse cross the TIO for the period from 29 January(DOY 29) to 27 February (DOY 58). Regional contributionsare not shown for DOY 32–53 in Figures 7 and 8, as theywere largely from the rest of the world. As seen fromFigure 5b, for the period from 1 February (DOY 32) to22 February (DOY 53), the aerosol mass concentration andoptical depth are mainly composed of sea salt, from localmarine aerosols, and sulfate originating from ROW, i.e.,outside the seven other defined regions. Back trajectories atall heights originated over the Indian Ocean regions. Hencethe region-tagged model estimates showing the large influ-ence of transport from oceanic regions is consistent with theback trajectory analysis.[22] A strong regional signal from Africa-west Asia
and from central and northwest India dominated duringDOY 56–61 and 65–70 (Figure 7). Surface aerosol concen-trations were dominated by dust and AOD by organic matterand sulfate (Figures 5b and 6b). Surface concentrations ofBC, OM and sulfate showed strong signals of emissionsoriginating in central and northwest India (Figures 8a–8c),consistent with surface flows from the Indian subcontinent.AOD of BC and OM were dominated by emissions origi-nating in Africa-west Asia, indicating elevated transportchannels from this region. This is consistent also withVerma et al. [2006], who found plumes of organic matterentering the Indian ocean domain (for example during 20–26 March (DOY 79–85), animation 1, showing the evolu-tion of OM concentrations in the work by Verma et al.[2006]). On both 4 and 5 March (DOY 63 and 64) anenhanced contribution from central India (45% on DOY 63and 60% on DOY 64 as compared to 20% on DOY 62) isestimated and both central India and northwest India con-tribute to the extent of 60 to 70% to the total surface massconcentration with their contributions to BC, OM, andsulfate species as high as 80%. Peak in contributions fromnorthwest India to surface mass concentration and AOD dueto dust (figure not shown) are also estimated on 4 and5 March (DOY 63 and 64), though the largest contributionscome from Africa-west Asia due to high emission flux ofdust over it. The fractional contribution of a source regionalso depends upon the emission density over it as for, e.g.,large contributions from Africa-west Asia for OM (DOY 24to 28) as compared to central India or south India and fordust (DOY 63, 64) as compared to northwest India is due tocomparatively high emission flux of both OM and dust overAfrica-west Asia. This distinct transport at surface andhigher layers is consistent with the observed large variabilityin the mass ratios of chemical species from aircraft and ship[Clarke et al., 2002] in the INDOEX measurements studies
and was attributed to different transport pathways in surfaceand elevated flows.[23] On DOY 68–70 surface mass concentration showed
an enhanced contribution from central India/northwestIndia, while the aerosol optical depth showed contributionsfrom Africa-west Asia. Back trajectories on all these threedays at all heights passes through Africa-west Asia/north-west India. On these days the ship was traversing near tocentral India. Stronger offshore surface transport fromcentral India and weaker transport from Africa-west Asia,but stronger elevated transport from Africa-west Asia couldexplain this observation. It is to be noted that Ramachandranand Jayaraman [2002] could make two sets of fit betweenmeasured and calculated extinction coefficients over theArabian Sea corresponding to measurements made for dayson 28 February (DOY 59), 9 and 10 March (DOY 68 and 69)1999 and those for 2March (DOY61) and 3March (DOY63)1999, respectively, inferring that refractive indices for thesetwo periods can be different. The model predicted surfacemass concentration is largely contributed from dust speciestransported from Africa-west Asia on 28 February (DOY 59)(Figure 5b) as compared to other days (DOY 61, 63, 68, 69)when the chemical composition to surface mass concentra-tion is contributed almost equally from sulfate, dust, andorganic matter. The model indicates distinct chemical com-positions for the two periods, which explains the reason forthe two fits which could be made with the measurements.[24] Source regions in this study were chosen on the basis
of distinct emission flux composition and observed trajec-tory pathways and are dissimilar in spatial extent andemission flux strength. In general, inaccuracies in the windfields used both for back trajectory calculations and tonudge GCM simulations, or in model processes, could morestrongly affect the estimated influence of source regionswith larger spatial extent or emission flux. In this study,proximate source regions, IGP, CNI, NWI, SEA are ofsimilar spatial extent and emission flux, while SI is bothsmall in extent and has a lower flux. The distant sourceregions EA, AFWA and ROW are similar in spatial extentand emission flux, but are significantly larger than theproximate regions. The ECMWF winds used in this modelare believed to have some inaccuracies associated with them[Reddy et al., 2004]. Model underestimation of surfaceaerosols and AOD at the Kaashidhoo Climate Observatoryabout 700 km west and south of the Indian subcontinent,especially in March 1999, was attributed in part to inaccu-racies in wind fields leading to lower transport of super-micron dust from Arabia into the INDOEX region. Otherpotential inaccuracies in the wind fields are not wellunderstood. This could affect the estimated regional con-tributions (Figure 7) with a potential underestimation of theinfluence of SI and overestimation of the contribution of thelarger distant regions. The consistency of the estimatedregional influences with the prevailing overall flow patterns,does not point to a significant discrepancy. However, asensitivity study of region size and emission flux strength toestimated regional contributions would be needed to examinethis further. It is to be noted that the two techniques applied inthe present study for the source evaluation of aerosols use thedifferent meteorological inputs. We use back trajectorycalculations with HYSPLIT using velocity and temperaturefields from NCEP data archives (ftp://www.arl.noaa.gov/
D11210 VERMA ET AL.: SOURCE EVALUATION OF AEROSOLS
12 of 14
D11210
pub/archives/fnl) while the GCM is nudged with theECMWF wind fields. Intercomparison of two reanalyses(NCEP (1948–1998) and ECMWF (1978–1994)) as pre-sented by Kistler et al. [1998] indicated that the reanalyseshave generally similar degree of agreement. The presentanalysis with the GCM estimates and back trajectory analysisshowed consistent features on source region contributions.We used a combination of methods to verify the aerosolcomposition contributed from different regions as estimatedfrom GCM (emission inventory information, back trajectoryanalysis, region-tagged GCM estimates) which are discussedin sections 3.2 and 3.3. Hence we do not see any obviousreason for discrepancy in the present work using the twotechniques with different meteorological inputs [NCEP andECMWF] in source region analysis. However, it is requiredto carry out a sensitivity study with the meteorological fieldsother than ECMWF, for, e.g., from NCEP (National Centerfor Environmental Protection) and NMWRF (National Cen-ter for Medium Range Weather Forecasting) to examine theaerosol transport in GCM. We also believe that the refine-ment in the spatial distribution of emissions from residentialbiomass energy use and the spatial and temporal distributionof emissions from open burning of forest and agriculturalbiomass may help in closing some of the discrepancybetween model predictions and measurements.
4. Conclusions
[25] A hybrid approach combining chemical transport andback trajectory modeling was used to evaluate the sourceregions influencing aerosols measured during the INDOEX-IFP aboard Sagar Kanya. In the absence of simultaneousaerosol chemical measurements for the ship cruise, thesewere predicted in a GCM simulation, which showed thatsulfate and organic matter are major constituents when theship track is close to the continental regions and is influencedby air masses from the Indian subcontinent (DOY 20 to 30),along with domination of mineral dust (DOY 57–59), whenthe ship track is influenced by air masses from Africa-westAsia, while sulfate and sea salt are major constituents whenthe ship track is remote from the continent (DOY 40 to 53).Back trajectory analysis showed that the ship cruise measure-ments were largely affected, at lower heights (surface to500 m) by air mass flow from regions of India and at higherheights (1000 to 5000 m), by flow from Africa-west Asiatraversing northwest India or the Indo-Gangetic plain. Thedistinct transport at surface and higher layers are estimatedfrom region-tagged GCM simulations for, e.g., DOY 56–61and 65–70, showing strong signals of emissions of blackcarbon, organic matter, and sulfate originating in central andnorthwest India, whereas elevated transport channels of blackcarbon and organic matter from Africa-west Asia. This isconsistent with the back trajectory analysis and in corrobo-ration with INDOEX measurement studies which observeddifferent aerosol properties from aircraft and ship attributedto different transport pathways in surface and elevated flows.However, there is a discrepancy between the predictedregional influence from the two approaches on surfaceconcentrations during 9 to 11 March (DOY 68 to 70),potentially because of surface transport from multipleregions, including long-range transport (Africa-west Asia)along with offshore winds (central India or northwest India)
bringing aerosols to the receptor location. The fractionalcontribution of a source region also depends upon theemission density over it as for, e.g., large contributions fromAfrica-west Asia for OM (DOY 24 to 28) as compared tocentral India or south India and for dust (DOY 63, 64) ascompared to northwest India is due to comparatively highemission flux of both OM and dust over Africa-west Asia.[26] Model underprediction is likely both from inaccura-
cies in ECMWF surface wind fields, which do not transportsufficient surface aerosols from the Indian subcontinentover the ocean and in the emissions input to the model.Refinement in the spatial distribution of emissions fromresidential biomass energy use and the spatial and temporaldistribution of emissions from open burning of forest andagricultural biomass may help in closing some of thediscrepancy between model predictions and measurements.Source regions in this study were chosen on the basis ofdistinct emission flux composition and observed trajectorypathways and are dissimilar in spatial extent and emissionflux strength. This could affect the estimated regionalcontributions, with a potential underestimation of the con-tribution from south India and overestimation of the con-tribution of the larger, more distant regions. The consistencyof the estimated regional influences with the prevailingoverall flow patterns, does not point to a significant dis-crepancy. However, a sensitivity study of region size andemission flux strength to estimated regional contributionswould be needed to examine this further.
[27] Acknowledgments. Computing resources at Indian Institute ofTechnology Bombay were supported through a grant from the IndianMinistry for Human Resource Development. A significant part of thiswork was accomplished through computing time provided by the ‘‘Institutdu Developpement et des Ressources en Informatique Scientifique’’(IDRIS) of the CNRS under projects 031167 and 041167. S. Vermaacknowledges support from START and the French Embassy in India forher two visits to LOA (France). This study is part of a collaborative projectalso supported by the Indo-French Centre for the Promotion of AdvancedResearch (IFCPAR).
ReferencesBall, W., R. Dickerson, B. Doddridge, J. Stehr, T. Miller, D. Savoie, andT. Carsey (2003), Bulk and size aggregated aerosol composition observedduring INDOEX 1999: Overview of meteorology and continental impacts,J. Geophys. Res., 108(D10), 8001, doi:10.1029/2002JD002467.
Boucher, O., M. Pham, and C. Venkataraman (2002), Simulation of theatmospheric sulphur cycle in the Laboratoire de Meteorologie Dynamiquegeneral circulation model: Model description, model evaluation and globaland European budgets, Note Sci., 23, Inst. Pierre Simon Laplace, Paris,France.
Clarke, A., et al. (2002), INDOEX aerosol: A comparison and summary ofchemical, microphysical, and optical properties observed from land, ship,and aircraft, J. Geophys. Res., 107(D19), 8033, doi:10.1029/2001JD000572.
de Gouw, J., et al. (2001), Overview of trace gas measurements on boardthe Citation aircraft during the intensive field phase of INDOEX,J. Geophys. Res., 106(D22), 28,453–28,467.
de Laat, A., J. de Gouw, J. Lelieveld, and A. Hansel (2001), Model analysisof trace gas measurements and pollution impact during INDOEX,J. Geophys. Res., 106(D22), 28,469–28,480.
Draxler, R. R., and G. D. Hess (1998), An overview of the HYSPLIT-4modeling system for trajectories, dispersion and deposition, Aust. Meteorol.Mag., 47, 295–308.
Franke, K., A. Ansmann, D. Muller, D. Althausen, C. Venkataraman, M. S.Reddy, and R. Scheele (2003), Optical properties of the Indo-Asian hazelayer over the tropical Indian Ocean, J. Geophys. Res., 108(D2), 4059,doi:10.1029/2002JD002473.
Friedlander, S. K. (1973), Chemical element balances and identification ofair pollution sources, Environ. Sci. Technol., 7, 235–240.
Gabriel, R., O. Mayol-Bracero, and M. Andreae (2002), Chemical charac-terisation of submicron aerosol particles collected over the Indian Ocean,J. Geophys. Res., 107(D19), 8005, doi:10.1029/2000JD000034.
D11210 VERMA ET AL.: SOURCE EVALUATION OF AEROSOLS
13 of 14
D11210

Gupta, P. K., R. C. Sharma, S. Koul, D. C. Parashar, T. K. Mandal, and A. P.Mitra (1999), Study of trace gas species including greenhouse gases overthe Indian Ocean during INDOEX precampaign cruises of 1996, 1997 and1998 on Sagar Kanya, Curr. Sci., 76(7), 944–946.
Habib, G., C. Venkataraman, I. Chiapello, S. Ramachandran, O. Boucher,and M. S. Reddy (2006), Seasonal and interannual variability in absorbingaerosols over India derived from TOMS: Relationship to regional meteor-ology and emissions, Atmos. Environ., 40, 1909–1921.
Hess, M., P. Koepke, and I. Schult (1998), Optical properties of aerosolsand clouds: The software package OPAC, Bull. Am. Meteorol. Soc., 79,831–844.
Hopke, P. K. (2003), Recent developments in receptor modeling, J. Chemo-metrics, 17, 255–265.
Hourdin, F., and J.-P. Issartel (2000), Sub-surface nuclear tests monitoringthrough the CTBT xenon network, Geophys. Res. Lett., 27(15), 2245–2248.
Kasibhatla, P., and A. Arellano (2002), Top-down estimate of a large sourceof atmospheric carbon monoxide associated with fuel combustion inAsia, Geophys. Res. Lett., 29(19), 1900, doi:10.1029/2002GL015581.
Kistler, R., et al. (1998), The NCEP-NCAR 50-year reanalysis: Monthlymeans CD-ROM and documentation, Bull. Am. Meteorol. Soc., 82, 247–268.
Kulkarni, S., Y. Tang, G. R. Carmichael, and L. Pan (2005), Surface ele-mental composition of aerosols at Beijing (China), Gosan (Korea) andTango (Japan) during ACE-Asia,Bull. Indian Aerosol Sci. Technol. Assoc.,17(1–2), 92–93.
Lal, S., D. Chand, L. K. Sahu, S. Venkataramani, G. Brasseur, and M. G.Schultz (2006), High levels of ozone and related gases over the Bay ofBengal during winter and early spring of 2001, Atmos. Environ., 40,1633–1644.
Lelieveld, J., et al. (2001), The Indian Ocean Experiment: Widespread airpollution from south and southeast Asia, Science, 291, 1031–1036.
Leon, J.-F., et al. (2001), Large scale advection of continental aerosolsduring INDOEX, J. Geophys. Res., 106(D22), 28,427–28,440.
Li, Z.-X. (1999), Ensemble atmospheric GCM simulation of climate inter-annual variability from 1979 to 1994, J. Clim., 12, 986–1001.
Mayol-Bracero, O., R. Gabriel, M. Andreae, T. Kirchstetter, T. Novakov,J. Ogren, P. Sheridan, and D. Streets (2002), Carbonaceous aerosolsover the Indian Ocean during INDOEX: Chemical characterization,optical properties and probable sources, J. Geophys. Res., 107(D19),8030, doi:10.1029/2000JD000039.
Minvielle, F., et al. (2004a), Modeling of the transport of aerosols duringINDOEX 19 99 and comparison with experimental data, part 1: Carbo-naceous aerosol distribution, Atmos. Environ., 38(12), 1811–1822.
Minvielle, F., et al. (2004b), Modeling of the transport of aerosols duringINDOEX 19 99 and comparison with experimental data, part 2: Conti-nental aerosol and their optical depth, Atmos. Environ., 38(12), 1823–1837.
Moorthy, K. K., A. Saha, B. Prasad, K. Niranjan, D. Jhurry, and P. S. Pillai(2001), Aerosol optical depths over peninsular India and adjoiningoceans during the INDOEX campaign: Spatial, temporal, and spectralcharacteristics, J. Geophys. Res., 106(D22), 28,539–28,554.
Quinn, P. K., D. J. Coffman, T. S. Bates, T. L. Miller, J. E. Johnson, E. J.Welton, C. Neususs, M. Miller, and P. J. Sheridan (2002), Aerosol opticalproperties during INDOEX 1999: Means, variability, and controllingfactors, J. Geophys. Res., 107(D19), 8020, doi:10.1029/2000JD000037.
Ramachandran, S. (2005), Aerosol radiative forcing over Bay of Bengaland Chennai: Comparison with maritime, continental, and urban aerosolmodels, J. Geophys. Res., 110, D21206, doi:10.1029/2005JD005861.
Ramachandran, S., and A. Jayaraman (2002), Premonsoon aerosol massloadings and size distributions over the Arabian Sea and the tropical IndianOcean, J. Geophys. Res., 107(D24), 4738, doi:10.1029/2002JD002386.
Ramanathan, V., et al. (2001), An integrated analysis of the climate forcingand effects of the great Indo-Asian haze, J. Geophys. Res., 106(D22),28,371–28,398.
Rao, P. S. (2005), Arabian Sea monsoon experiment: An overview,Mausam,56(1), 1–6.
Rasch, P. J., W. D. Collins, and B. E. Eaton (2001), Understanding theIndian Ocean Experiment (INDOEX) aerosol distributions with an aerosolassimilation, J. Geophys. Res., 106(D7), 7337–7355.
Reddy, M. S., and O. Boucher (2004), Global carbonaceous aerosol trans-port and assessment of radiative effects in the LMDZ GCM, J. Geophys.Res., 109, D14202, doi:10.1029/2003JD004048.
Reddy, M. S., and C. Venkataraman (2002a), Inventory of aerosol andsulphur dioxide emissions from India: I—Fossil fuels combustion, Atmos.Environ., 36, 677–697.
Reddy, M. S., and C. Venkataraman (2002b), Inventory of aerosol andsulphur dioxide emissions from India: II—Biomass combustion, Atmos.Environ., 36, 699–712.
Reddy, M. S., O. Boucher, C. Venkataraman, S. Verma, J.-F. Leon, andM. Pham (2004), GCM estimates of aerosol transport and radiative forcingduring INDOEX, J. Geophys. Res., 109, D16205, doi:10.1029/2004JD004557.
Reiner, T., D. Sprung, C. Jost, R. Gabriel, O. Mayol-Bracero, M. Andreae,T. Campos, and R. Shetter (2001), Chemical characterisation of pollutionlayers over the tropical Indian Ocean: Signatures of biomass burningemissions, J. Geophys. Res., 106(D22), 28,497–28,510.
Rhoads, K. P., P. Kelley, R. R. Dickerson, T. P. Carsey, M. Farmer, D. L.Savoie, and J. M. Prospero (1997), Composition of troposhere over theIndian Ocean during the monsoonal transition, J. Geophys. Res.,102(D15), 18,981–18,995.
Seinfeld, J. H., and S. N. Pandis (Eds.) (1998), Atmospheric Chemistry andPhysics: From Air Pollution to Climate Change, 1193 pp., John Wiley,New York.
Streets, D. G., et al. (2003), An inventory of gaseous and primary aerosolemissions in Asia, J. Geophys. Res., 108(D21), 8809, doi:10.1029/2002JD003093.
Verma, S., O. Boucher, C. Venkataraman,M. S. Reddy, D. Muller, P. Chazette,and B. Crouzille (2006), Aerosol lofting from sea breeze during the IndianOcean Experiment, J. Geophys. Res., 111, D07208, doi:10.1029/2005JD005953.
Verver, G., D. R. Sikka, J. M. Lobert, G. Stossmeister, and M. Zachariasse(2001), Overview of the meteorological conditions and atmospherictransport processes during INDOEX 1999, J. Geophys. Res., 106(D22),28,399–28,414.
Woo, J.-H., et al. (2003), Contribution of biomass and biofuel emissions totrace gas distributions in Asia during the TRACE-P experiment, J. Geophys.Res., 108(D21), 8812, doi:10.1029/2002JD003200.
�����������������������O. Boucher, Hadley Centre, Met Office, Fitzroy Road, Exeter EX1 3PB,
UK. ([email protected])S. Ramachandran, Space and Atmospheric Sciences Division, Physical
Research Laboratory, Ahmedabad 380009, India. ([email protected])C. Venkataraman and S. Verma, Department of Chemical Engineering,
Indian Institute of Technology, Bombay, Mumbai 400076, India.([email protected]; [email protected])
D11210 VERMA ET AL.: SOURCE EVALUATION OF AEROSOLS
14 of 14
D11210