Sound source localization of a dipole by the plainfin midshipman fish (Porichthys notatus
10
Sound source localization by the plainfin midshipman fish, Porichthys notatus David G. Zeddies Marine Acoustics, Inc., 4100 Fairfax Drive, Suite 730, Arlington, Virginia 22203 Richard R. Fay Department of Psychology, Loyola University Chicago, Chicago, Illinois 60626 Peter W. Alderks and Kiel S. Shaub Department of Psychology, University of Washington, Seattle, Washington 98195 Joseph A. Sisneros Departments of Psychology and Biology, University of Washington, Seattle, Washington 98195 Received 4 September 2009; revised 18 February 2010; accepted 19 February 2010 The aim of this study was to use plainfin midshipman fish Porichthys notatus as a general model to explore how fishes localize an underwater sound source in the relatively simple geometry of a monopole sound field. The robust phonotaxic responses displayed by gravid females toward a monopole sound projector J-9 broadcasting a low-frequency 90 Hz tone similar to the fundamental frequency of the male’s advertisement call were examined. The projector’s sound field was mapped at 5 cm resolution azimuth using an eight-hydrophone array. Acoustic pressure was measured with the array and acoustic particle motion was calculated from pressure gradients between hydrophones. The response pathways of the fish were analyzed from video recordings and compared to the sound field. Gravid females at initial release were directed toward the sound source, and the majority 73% swam to the playback projector with straight to slightly curved tracks in the direction of the source and in line with local particle motion vectors. In contrast, the initial direction of the control sound-off group did not differ from random. This paper reports on a comparison of fish localization behavior with directional cues available in the form of local particle motion vectors. © 2010 Acoustical Society of America. DOI: 10.1121/1.3365261 PACS numbers: 43.66.Qp, 43.64.Bt, 43.80.Lb MCH Pages: 3104–3113 I. INTRODUCTION Fish, like most animals, live in highly complex acoustic environments that require them to make sense of the objects and events that take place there. In order to behave appropri- ately toward the objects and events, animals must be able to “segregate” streams of acoustic information so that indepen- dent sources are not confused and that the “scene” is under- stood. An important component of stream segregation is sound source localization. It is the ability to localize sound sources that gives the acoustic scene a spatial dimension. Evidence suggests that the capacity for sound source local- ization is common to mammals, anurans, birds, and reptiles, but surprisingly it is not known whether fishes locate sound sources in the same manner. The focus of the present study was to investigate sound source localization by fishes, and as a first step explore how fish localize an underwater sound source in the relatively simple geometry of a monopole sound field. The question of sound source localization by fishes was first raised in 1935 by Reinhardt 1935 and by von Frisch and Dijkgraaf 1935. Both groups worked with the Euro- pean minnow Phoxinus laevis, and both concluded that Phoxinus could not localize sound sources. The European minnow is a pressure-sensitive otophysan, having Weberian ossicles that connect the swim bladder to the inner ears We- ber, 1820. Otophysans were thought to respond exclusively to sound pressure as transduced by the swim bladder and transmitted as motions to the ears via the Weberian ossicles, and von Frisch 1938 explained the negative result of the behavioral experiments by pointing out that sound pressure at any single point such as the swim bladder contains no information about the direction of sound propagation. Other modes of acoustic stimulation of fish inner ears were not known or understood at the time; thus, sound pressure sen- sitivity was considered an essential part of the definition of hearing; a definition that continued to dominate for some time under the influence of van Bergeijk 1964. Presently, hearing in fishes is somewhat better under- stood, and it is generally accepted that fishes have at least two modes of hearing. One mode is pressure-mediated and found either in species with specialized skeletal adaptations e.g., the Weberian ossicles that connect the swim bladder to the inner ear or in species where the swim bladder, or other gas-filled structures, is in close or direct contact with the ear. The other mode of hearing is ancestral shared by all fishes and based on the inertia of otolith organs De Vries, 1950. The inertial mode of hearing is independent of the swim bladder. It results from direct stimulation of the inner ear by acoustic particle motion in the near and far fields e.g., Popper and Fay, 1993. During inertial-mode stimulation the entire fish is set into motion by the acoustic disturbance but impedance differences between the otoliths and surrounding 3104 J. Acoust. Soc. Am. 127 5, May 2010 © 2010 Acoustical Society of America 0001-4966/2010/1275/3104/10/$25.00 Author's complimentary copy
-
Upload
independent -
Category
Documents
-
view
0 -
download
0
Transcript of Sound source localization of a dipole by the plainfin midshipman fish (Porichthys notatus

Sound source localization by the plainfin midshipman fish,Porichthys notatus
David G. ZeddiesMarine Acoustics, Inc., 4100 Fairfax Drive, Suite 730, Arlington, Virginia 22203
Richard R. FayDepartment of Psychology, Loyola University Chicago, Chicago, Illinois 60626
Peter W. Alderks and Kiel S. ShaubDepartment of Psychology, University of Washington, Seattle, Washington 98195
Joseph A. SisnerosDepartments of Psychology and Biology, University of Washington, Seattle, Washington 98195
�Received 4 September 2009; revised 18 February 2010; accepted 19 February 2010�
The aim of this study was to use plainfin midshipman fish �Porichthys notatus� as a general modelto explore how fishes localize an underwater sound source in the relatively simple geometry of amonopole sound field. The robust phonotaxic responses displayed by gravid females toward amonopole sound projector �J-9� broadcasting a low-frequency �90 Hz� tone similar to thefundamental frequency of the male’s advertisement call were examined. The projector’s sound fieldwas mapped at 5 cm resolution azimuth using an eight-hydrophone array. Acoustic pressure wasmeasured with the array and acoustic particle motion was calculated from pressure gradientsbetween hydrophones. The response pathways of the fish were analyzed from video recordings andcompared to the sound field. Gravid females at initial release were directed toward the sound source,and the majority �73%� swam to the playback projector with straight to slightly curved tracks in thedirection of the source and in line with local particle motion vectors. In contrast, the initial directionof the control �sound-off� group did not differ from random. This paper reports on a comparison offish localization behavior with directional cues available in the form of local particle motion vectors.© 2010 Acoustical Society of America. �DOI: 10.1121/1.3365261�
PACS number�s�: 43.66.Qp, 43.64.Bt, 43.80.Lb �MCH� Pages: 3104–3113
r's
com
plim
enta
ry c
op
y
I. INTRODUCTION
Fish, like most animals, live in highly complex acousticenvironments that require them to make sense of the objectsand events that take place there. In order to behave appropri-ately toward the objects and events, animals must be able to“segregate” streams of acoustic information so that indepen-dent sources are not confused and that the “scene” is under-stood. An important component of stream segregation issound source localization. It is the ability to localize soundsources that gives the acoustic scene a spatial dimension.Evidence suggests that the capacity for sound source local-ization is common to mammals, anurans, birds, and reptiles,but surprisingly it is not known whether fishes locate soundsources in the same manner. The focus of the present studywas to investigate sound source localization by fishes, and asa first step explore how fish localize an underwater soundsource in the relatively simple geometry of a monopolesound field.
The question of sound source localization by fishes wasfirst raised in 1935 by Reinhardt �1935� and by von Frischand Dijkgraaf �1935�. Both groups worked with the Euro-pean minnow �Phoxinus laevis�, and both concluded thatPhoxinus could not localize sound sources. The Europeanminnow is a pressure-sensitive otophysan, having Weberianossicles that connect the swim bladder to the inner ears �We-
ber, 1820�. Otophysans were thought to respond exclusively3104 J. Acoust. Soc. Am. 127 �5�, May 2010 0001-4966/2010/12
to sound pressure as transduced by the swim bladder andtransmitted as motions to the ears via the Weberian ossicles,and von Frisch �1938� explained the negative result of thebehavioral experiments by pointing out that sound pressureat any single point �such as the swim bladder� contains noinformation about the direction of sound propagation. Othermodes of acoustic stimulation of fish inner ears were notknown or understood at the time; thus, sound pressure sen-sitivity was considered an essential part of the definition ofhearing; a definition that continued to dominate for sometime under the influence of van Bergeijk �1964�.
Presently, hearing in fishes is somewhat better under-stood, and it is generally accepted that fishes have at leasttwo modes of hearing. One mode is pressure-mediated andfound either in species with specialized skeletal adaptations�e.g., the Weberian ossicles� that connect the swim bladder tothe inner ear or in species where the swim bladder, or othergas-filled structure�s�, is in close or direct contact with theear. The other mode of hearing is ancestral �shared by allfishes� and based on the inertia of otolith organs �De Vries,1950�. The inertial mode of hearing is independent of theswim bladder. It results from direct stimulation of the innerear by acoustic particle motion in the near and far fields �e.g.,Popper and Fay, 1993�. During inertial-mode stimulation theentire fish is set into motion by the acoustic disturbance but
impedance differences between the otoliths and surrounding© 2010 Acoustical Society of America7�5�/3104/10/$25.00 Au
tho
r's
com
plim
enta
ry c
op
y
tissue cause relative movement between the otolith and thebed of hair cells in the sensory epithelium �macula�. Theauditory hair cells are inherently directionally sensitive andare organized in patterns where the axis of best directionalsensitivity varies along the maculae of the end organ. Thus, itis this inertial mode of hearing that could presumably pro-vide directional information to fish �Edds-Walton et al.,1999�.
The behavioral capacity for directional hearing by fisheshas been demonstrated in several species using psychoacous-tic discrimination techniques. Direction-dependent maskingwas shown �Chapman, 1973; Chapman and Johnstone,1974�, minimum audible angles of 15°–20° in both azimuthand elevation were measured �Schuijf, 1975; Hawkins andSand, 1977�, and source distance discrimination was demon-strated �Schuijf and Hawkins, 1983�. If it is assumed thatsound source localization by fish is essentially similar to thatin humans, in the sense that observers “know” where thesources to be discriminated are located and can act on thisinformation, then the conditioned discrimination experimentsprovide evidence for good localization ability that is prob-ably widely shared among fishes. However, Kalmijn �1997�argues for source localization strategies by fishes that do notassume familiar, human-like capacities and behaviors, butinstead are based on ethological tenets and what is presentlyaccepted about source localization using the ampullary elec-trosensory system. Kalmijn points out that fish could findtheir way to a sound source by swimming in a direction thatmaintains a constant angle between the fish and the axis ofparticle motion. The fish does not have to “know” the sourcelocation or the orientation of the local particle motion vector,it just has to behave in a way that maintains a constant anglewith the particle motion vector and it will eventually arriveat the source. The question of whether fish “know” where asource is located or use a more mechanistic approach re-mains open, in part, because few experiments have demon-strated that fish can use sound to move to a source and noexperiment has compared the pathways fish take to a soundsource with the directional cues available in the particle mo-tion vector field.
McKibben and Bass �1998, 2001� found that gravid fe-males of the species Porichthys notatus exhibit robust pho-notaxis toward an underwater loudspeaker broadcasting amale advertisement call �a continuous “hum” consisting of amultiharmonic signal with a fundamental frequency of about90 Hz�, or a low-frequency tone near the fundamental fre-quency of the male’s advertisement call. Gravid females of-ten respond to the tone by approaching the sound source andeither directly touching the speaker face or by circling infront of or underneath the playback speaker. This unambigu-ous phonotaxic response by gravid females makes the mid-shipman fish an exceptional model animal for investigatingsound source localization. Also, because these fish will per-form in a controlled �laboratory� setting, the sound fields canbe mapped, including the particle motion vectors, to producea comprehensive map of the acoustic environment.
The primary objective of this study was to investigatehow female plainfin midshipman fish �P. notatus� localize a
sound source in the relatively simple sound-field geometryJ. Acoust. Soc. Am., Vol. 127, No. 5, May 2010 Zed
produced by a monopole source. The phonotaxic responsesof reproductive females are described in relation to the par-ticle motion and pressure components of the measured soundfield. The pathways that the fish take to the source couldindicate their near-field decision parameters and soundsource localization strategies.
II. MATERIALS AND METHODS
A. Experimental animals
Female plainfin midshipman fish were collected duringthe reproductive season �June and July in 2007 and 2008�from the same geographical locations used in previous stud-ies along Tomales Bay near Marshall, CA �Brantley andBass, 1994; McKibben and Bass, 1998; Sisneros and Bass,2005�. Females were collected by hand from the nests oftype I males in the intertidal zone at low tide and werereadily distinguished from nesting type I and sneaker type IImales based on the size of the animal and shape of the uro-genital papilla. Females collected from nests were in variousstages of spawning, but the majority of the collected femaleswere gravid �full of eggs� with ovaries that contained rela-tively large ��5 mm in diameter� yellow, yolked eggs.Gravid females were also visually distinguished from type Imales based on the size and appearance of the abdomen,which were typically distended in gravid females and notice-ably flaccid in spent females �Brantley and Bass, 1994; Bass,1996�. The reproductive state of females was quantified bymeasuring the gonadosomatic index �GSI, defined here as100� gonad mass/body mass—gonad mass, according toTomkins and Simmons, 2002�. Animals collected in the fieldwere temporarily housed �for a few hours� in coolers withaerated seawater until they could be brought to the BodegaMarine Laboratory in Bodega Bay, CA, where they weremaintained in large communal aquaria at natural ambienttemperatures that ranged from 12 °C to 14 °C. Fish wereheld for less than 20 h prior to testing later that night.
B. Experimental tank and setup
All tests were conducted outdoors in a cylindrical con-crete tank �4 m in diameter, 0.75 m in depth� at the BodegaMarine Laboratory, Bodega Bay, CA. A monopole soundprojector �U.S. Navy J-9 transducer� was suspended from abeam in the center of the tank with the center of the projectorface positioned 7 cm above the tank floor and facing outward�Fig. 1�. A 2.44 m opaque plastic tarp was used as a screenand placed immediately in front of, but not touching, thesound projector. This was done to remove any visual cuesthat might affect sound source localization behavior.
The playback signal consisted of a continuous tone at 90Hz that was similar to the fundamental frequency of the maleadvertisement call �80–100 Hz; Bass et al., 1999�. The play-back signal of 90 Hz was chosen for this study based on thefinding that there is a temperature-dependent frequency pref-erence for the phonotaxic response �McKibben and Bass1998�. The acoustic stimuli for the playback experimentswere generated by a Wavetek function generator and passed
through a power amplifier �Crown Audio, Inc., Elkhart, IN�dies et al.: Sound localization by the plainfin midshipman fish 3105 Au
tho

r's
com
plim
enta
ry c
op
y
that drove the U.S. Navy J-9 sound projector. The soundlevel of the J-9 projector was monitored and nightly cali-brated using a custom-written LABVIEW program with a Na-tional Instruments 6052E DAQ-Pad �Austin, TX� and a mini-hydrophone �8103, Bruel & Kjaer, Norcross, GA� placed 4.5cm above the tank floor on the center line between the twoanimal release sites �Fig. 1�. The tone level at the calibrationsite was set at 130 dB �re 1 �Pa peak� and is consistent withsound pressure levels of the advertisement calls of type Imales recorded near their nests �Bass and Clark, 2003�.
The behavioral responses of the fish were recorded onvideotape using a video recorder and a CV110 Precisionblack-and-white camera �0.2 lux � minimum light level�mounted approximately 6 m above the tank’s test arena. Aremote positioning system was used to direct and positionthe camera above the test arena. The video records weredigitized with a Vixia HV30 camcorder �Canon Inc., LakeSuccess, NY� and IMOVIE 7.0 software �Apple Inc., Cuper-tino, CA�. Windows MOVIE MAKER 5.0 �Microsoft, Red-mond, WA� and SIGMASCAN PRO 5.0 �Systat Inc., Chicago,IL� were used for frame-by-frame analysis of the digitizedvideo records. Every fifth frame was analyzed by markingthe position of the animal’s head �on the midline between thetwo eyes� relative to the fixed position of the sound projector.The x- and y-coordinates of the animal’s head were then usedto track the movement of the animal �behavioral response� inrelation to the measured sound field.
C. Experimental protocol
The sound playback experiments were conducted atnight between 21:00 and 2:00 h during the midshipman sum-mer breeding season from June through July. Three redfloodlights positioned around the tank perimeter allowed forthe observation and videotaping of the behavioral responsesfrom female midshipman fish. The water temperature in thetest tank was controlled by adjusting the incoming flow rateof seawater to the tank prior to the behavioral tests. Thewater flow to the test tank was shut off during all tests. Water
FIG. 1. Schematic of the playback tank �diameter=4 m; tank depth=0.75 m� showing the sound projector �J-9� position, opaque screen, andanimal release sites �A and B�.
depth was adjusted to 50 cm for all tests.
3106 J. Acoust. Soc. Am., Vol. 127, No. 5, May 2010
Prior to testing, female fish were held individually in 5gallon buckets with water from the test tank at the test tanktemperature and were allowed to acclimate for at least 10–15min. Tests began with an individual fish being placed in a 30cm in diameter plastic mesh cylinder positioned approxi-mately 109 cm from the sound source �Fig. 1� while thesound playback stimulus was already playing. Fish were thenreleased by manually raising the cylinder. This protocol ofreleasing the fish without an acclimation period while theacoustic stimulus was continuously playing was adoptedfrom McKibben and Bass �1998�. Tests were terminatedwhen the fish swam to the perimeter of the testing arena orwhen the sound was turned off after a positive phonotaxicresponse. A positive response was recorded when a fish ap-proached the sound source and then directly touched thespeaker face or circled in front of or under the sound projec-tor. There were no observations of fish returning to the centerof the tank after reaching the periphery, and rarely, if ever,did a fish remain in the center of the tank when the speakerwas off.
D. Acoustic and vibration measurements
Pressure measurements were made with miniature �50mm in length, 9.5 mm in diameter� hydrophones; eitherBruel & Kjaer type 8103 or Reson type TC4013. These hy-drophone types are essentially identical, both have a usefulfrequency range of 1–170 kHz and sensitivity of approxi-mately �212 dB re 1 V /�Pa. The output signal from thehydrophones was amplified by two 4 channel charge ampli-fiers �Bruel & Kjaer model 2692� and fed into a DAQ pad6052e �National Instruments�. Custom LABVIEW �NationalInstruments� programs were written to control and recordfrom the DAQ pad �program author D. G. Zeddies�. Thepressure calibration of each hydrophone was tested with aBruel & Kjaer 4229 pistonphone calibrator. All hydrophonesmeasured within 0.25 dB of the expected pressure and 0.25dB of each other.
In order to determine substrate vibration introduced intothe behavioral arena through mechanical coupling of thesound projector, vibrational amplitudes were measured usingGeospace CT32 geophones �Houston, TX� that had a sensi-tivity of 0.197 V/cm/s. A VP2000 voltage preamplifierEC6081 �Reson, Goleta, CA� was used and the output sig-nals recorded by a LABVIEW program via the DAQ pad.
1. Acoustic particle displacement measurements
The acceleration of the “particles” constituting the me-dium in which an acoustic disturbance takes place is propor-tional to the pressure gradient. This is formalized in theequation of motion, or Euler’s equation �Pierce, 1994�
− �p = �0�u
�t, �1�
where � is the gradient operator on the pressure p, �0 is thefluid density, u is the velocity vector, and t is time. A dis-
cretized form of Euler’s equation in one dimension is:Zeddies et al.: Sound localization by the plainfin midshipman fish Au
tho
r's
com
plim
enta
ry c
op
y
−P1 − P2
�0d=
�u
�t, �2�
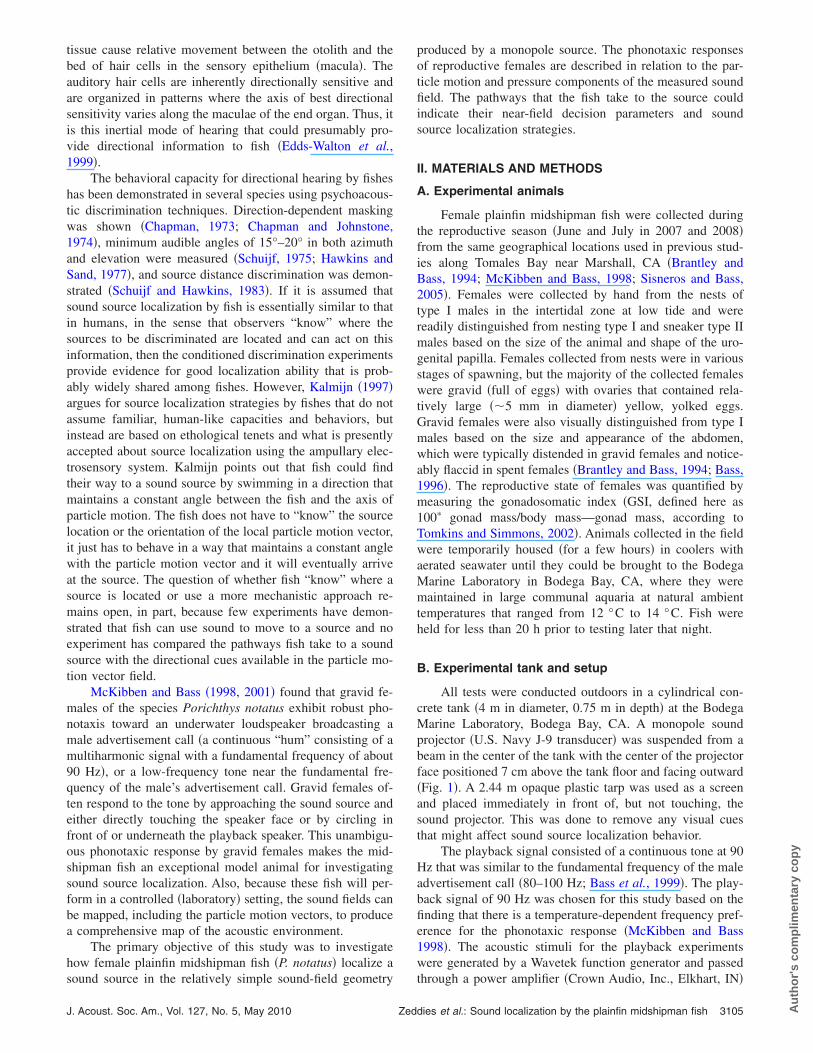
where, P1 and P2 are the sound pressures measured at twopoints separated by a distance d, and u is the velocity in linewith the two points. Equation �2� lends itself to practicalmeasurement because P1 and P2 can be measured with hy-drophones. However, it should be pointed out that the com-plex pressure should be measured �magnitude and phase� andused in Eq. �2�.
A probe was constructed using eight hydrophones �fiveBruel & Kjaer type 8103 and three Reson type TC4013� tomeasure the pressure at known separation distances and di-rections. The hydrophones were arranged to form a 5 cmcube with a hydrophone at each corner �Fig. 2�. This arrange-ment allows particle motion to be calculated in the x-, y-, andz-directions by finding the pressure gradient between adja-cent hydrophones. A custom LABVIEW program was createdto record the pressure and phase �relative to one hydrophonechosen as the reference� at each hydrophone, and then calcu-late the fluid particle displacement by integrating Eq. �2�with respect to time.
The phase angle measured for the pressure and used inEq. �2� will depend, in part, on the response properties of thehydrophone. Differences in filtering among the hydrophonescould bias the calculated particle motion. To determine therelative phase response of the eight hydrophones, a probewas made to hold two hydrophones along a radial line from
FIG. 2. Drawing of the probe used to measure sound pressure and determinepressure gradients within the behavioral arena. The probe holds eight hydro-phones at separation distances of 5 cm in the x-, y-, and z-directions. Thesides holding the hydrophones were constructed from plexiglass and wereglued to PVC piping. The piping was attached to a cart that was used tomove the probe around the tank. Plexiglass and PVC were chosen in aneffort to keep the probe acoustically transparent at 90 Hz. Holes were drilledin the PVC piping �not show in drawing� to ensure that air was not trappedin the PVC piping that held the probe.
the projector. The probe could then be rotated 180° so that
J. Acoust. Soc. Am., Vol. 127, No. 5, May 2010 Zed
the hydrophones exchanged places. Twenty 1 s samples witha 90 Hz tone �175 kHz sampling rate for each channel� wereobtained. The standard deviation of the phase of each groupin 20 trials was less than 0.25°. If the response time of thetwo hydrophones is the same, then rotating the probe 180°and adding the measured phases should equal zero. A devia-tion from zero would reveal the difference in response timebetween the two hydrophones and could be used as a correc-tion factor. After rotating the probe 180° and taking anothertwenty samples, deviations from zero for the seven hydro-phones measured relative to the reference were �0.5°. How-ever, repeating the measurements revealed approximately upto 0.5° differences from prior measurements. The 0.5° devia-tions were more likely due to small placement errors whenrotating the probe rather than actual differences in hydro-phone response. For this reason no phase corrections wereapplied.
E. Analysis of movement
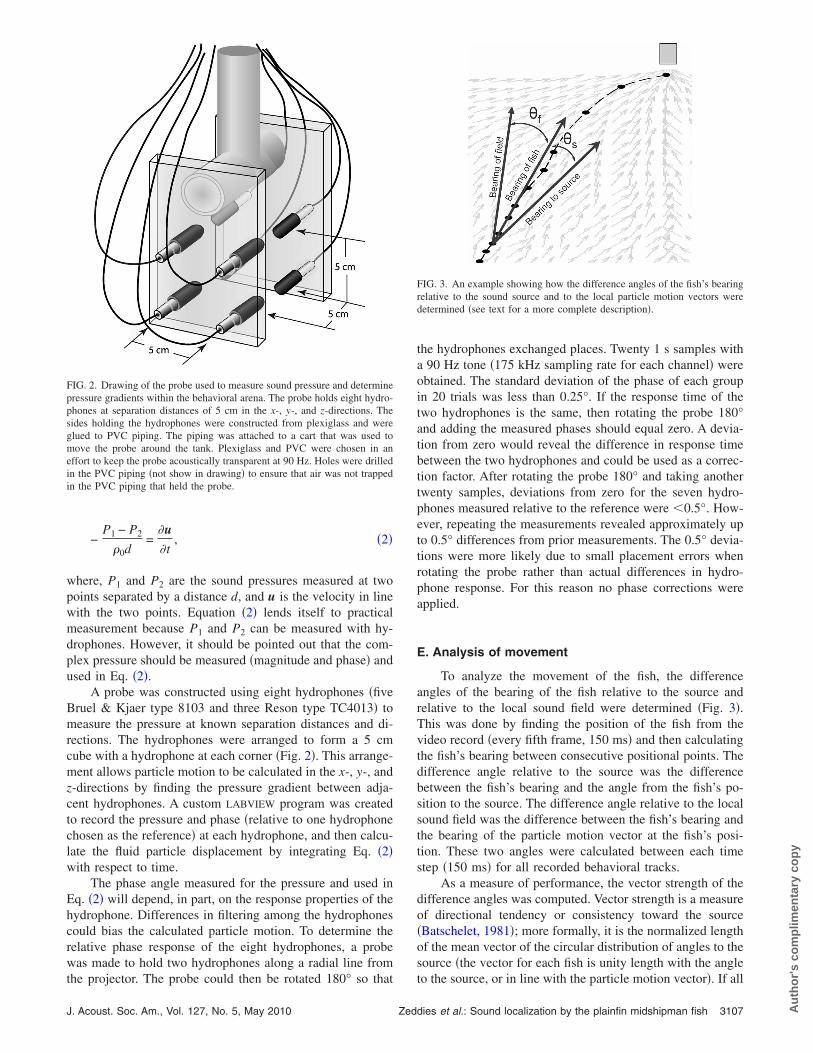
To analyze the movement of the fish, the differenceangles of the bearing of the fish relative to the source andrelative to the local sound field were determined �Fig. 3�.This was done by finding the position of the fish from thevideo record �every fifth frame, 150 ms� and then calculatingthe fish’s bearing between consecutive positional points. Thedifference angle relative to the source was the differencebetween the fish’s bearing and the angle from the fish’s po-sition to the source. The difference angle relative to the localsound field was the difference between the fish’s bearing andthe bearing of the particle motion vector at the fish’s posi-tion. These two angles were calculated between each timestep �150 ms� for all recorded behavioral tracks.
As a measure of performance, the vector strength of thedifference angles was computed. Vector strength is a measureof directional tendency or consistency toward the source�Batschelet, 1981�; more formally, it is the normalized lengthof the mean vector of the circular distribution of angles to thesource �the vector for each fish is unity length with the angle
FIG. 3. An example showing how the difference angles of the fish’s bearingrelative to the sound source and to the local particle motion vectors weredetermined �see text for a more complete description�.
to the source, or in line with the particle motion vector�. If all
dies et al.: Sound localization by the plainfin midshipman fish 3107 Au
tho
r's
com
plim
enta
ry c
op
y
directions are equally likely, the vector strength is zero,whereas if all fish move in the same direction, the vectorstrength is 1 �1.0�.
III. RESULTS
A. Sound field measurements
To evaluate the phonotaxic behavior of the fish, quanti-tative descriptions �maps� of the acoustic pressure and par-ticle motion in the behavioral arena were obtained. Pressureis a scalar measure consisting of only a magnitude. It is themore familiar component because pressure is measured witha hydrophone. Particle motion �i.e., the displacement, veloc-ity, and acceleration of the media due to an acoustic distur-bance� is a vector, having both magnitude and direction. Par-ticle motion must be determined with a vector sensor, such asan accelerometer, or can be calculated from the pressure gra-dient. In this study particle motion was calculated from thepressure gradient measurement using an array of hydro-phones with known separation distances.
1. Acoustic pressure measurements
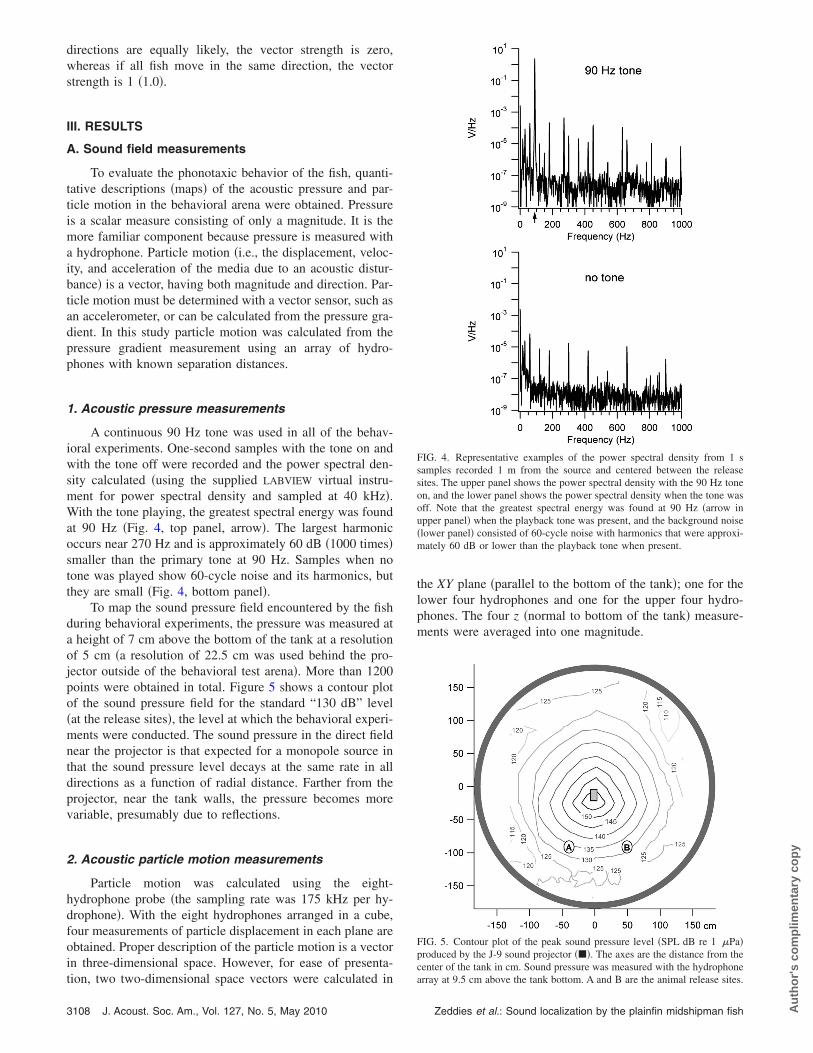
A continuous 90 Hz tone was used in all of the behav-ioral experiments. One-second samples with the tone on andwith the tone off were recorded and the power spectral den-sity calculated �using the supplied LABVIEW virtual instru-ment for power spectral density and sampled at 40 kHz�.With the tone playing, the greatest spectral energy was foundat 90 Hz �Fig. 4, top panel, arrow�. The largest harmonicoccurs near 270 Hz and is approximately 60 dB �1000 times�smaller than the primary tone at 90 Hz. Samples when notone was played show 60-cycle noise and its harmonics, butthey are small �Fig. 4, bottom panel�.
To map the sound pressure field encountered by the fishduring behavioral experiments, the pressure was measured ata height of 7 cm above the bottom of the tank at a resolutionof 5 cm �a resolution of 22.5 cm was used behind the pro-jector outside of the behavioral test arena�. More than 1200points were obtained in total. Figure 5 shows a contour plotof the sound pressure field for the standard “130 dB” level�at the release sites�, the level at which the behavioral experi-ments were conducted. The sound pressure in the direct fieldnear the projector is that expected for a monopole source inthat the sound pressure level decays at the same rate in alldirections as a function of radial distance. Farther from theprojector, near the tank walls, the pressure becomes morevariable, presumably due to reflections.
2. Acoustic particle motion measurements
Particle motion was calculated using the eight-hydrophone probe �the sampling rate was 175 kHz per hy-drophone�. With the eight hydrophones arranged in a cube,four measurements of particle displacement in each plane areobtained. Proper description of the particle motion is a vectorin three-dimensional space. However, for ease of presenta-
tion, two two-dimensional space vectors were calculated in3108 J. Acoust. Soc. Am., Vol. 127, No. 5, May 2010
the XY plane �parallel to the bottom of the tank�; one for thelower four hydrophones and one for the upper four hydro-phones. The four z �normal to bottom of the tank� measure-ments were averaged into one magnitude.
FIG. 4. Representative examples of the power spectral density from 1 ssamples recorded 1 m from the source and centered between the releasesites. The upper panel shows the power spectral density with the 90 Hz toneon, and the lower panel shows the power spectral density when the tone wasoff. Note that the greatest spectral energy was found at 90 Hz �arrow inupper panel� when the playback tone was present, and the background noise�lower panel� consisted of 60-cycle noise with harmonics that were approxi-mately 60 dB or lower than the playback tone when present.
FIG. 5. Contour plot of the peak sound pressure level �SPL dB re 1 �Pa�produced by the J-9 sound projector ���. The axes are the distance from thecenter of the tank in cm. Sound pressure was measured with the hydrophone
array at 9.5 cm above the tank bottom. A and B are the animal release sites.Zeddies et al.: Sound localization by the plainfin midshipman fish Au
tho
r's
com
plim
enta
ry c
op
y
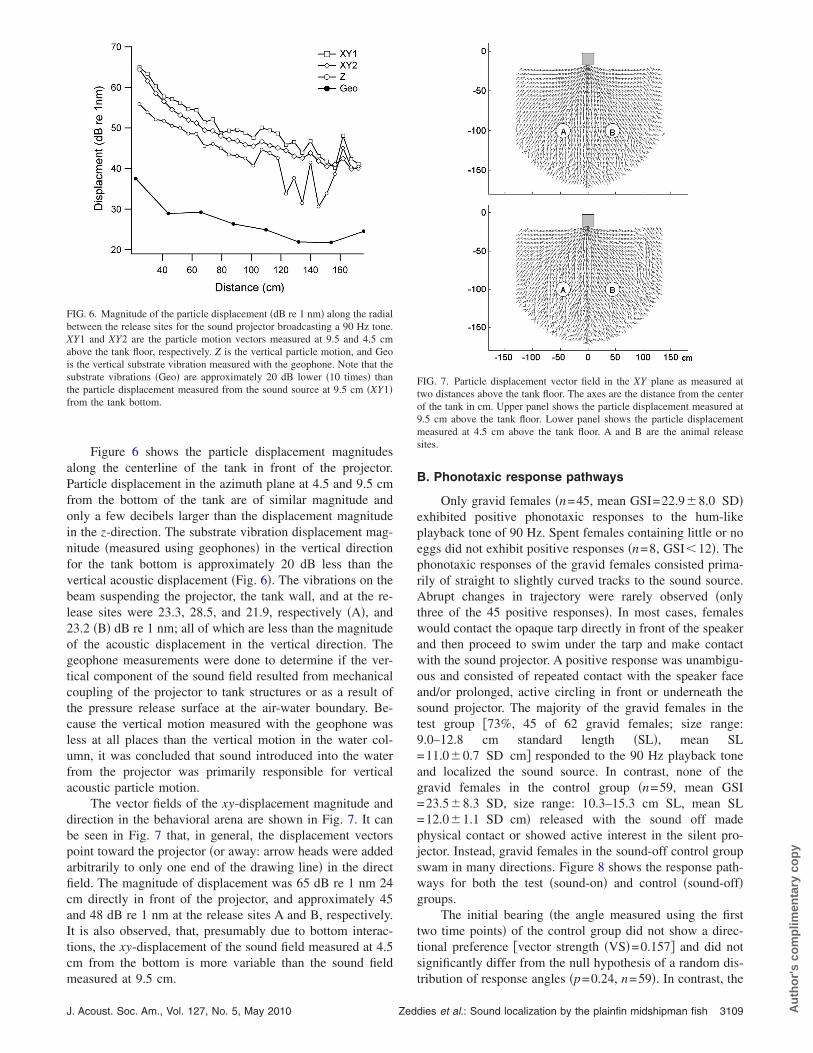
Figure 6 shows the particle displacement magnitudesalong the centerline of the tank in front of the projector.Particle displacement in the azimuth plane at 4.5 and 9.5 cmfrom the bottom of the tank are of similar magnitude andonly a few decibels larger than the displacement magnitudein the z-direction. The substrate vibration displacement mag-nitude �measured using geophones� in the vertical directionfor the tank bottom is approximately 20 dB less than thevertical acoustic displacement �Fig. 6�. The vibrations on thebeam suspending the projector, the tank wall, and at the re-lease sites were 23.3, 28.5, and 21.9, respectively �A�, and23.2 �B� dB re 1 nm; all of which are less than the magnitudeof the acoustic displacement in the vertical direction. Thegeophone measurements were done to determine if the ver-tical component of the sound field resulted from mechanicalcoupling of the projector to tank structures or as a result ofthe pressure release surface at the air-water boundary. Be-cause the vertical motion measured with the geophone wasless at all places than the vertical motion in the water col-umn, it was concluded that sound introduced into the waterfrom the projector was primarily responsible for verticalacoustic particle motion.
The vector fields of the xy-displacement magnitude anddirection in the behavioral arena are shown in Fig. 7. It canbe seen in Fig. 7 that, in general, the displacement vectorspoint toward the projector �or away: arrow heads were addedarbitrarily to only one end of the drawing line� in the directfield. The magnitude of displacement was 65 dB re 1 nm 24cm directly in front of the projector, and approximately 45and 48 dB re 1 nm at the release sites A and B, respectively.It is also observed, that, presumably due to bottom interac-tions, the xy-displacement of the sound field measured at 4.5cm from the bottom is more variable than the sound field
FIG. 6. Magnitude of the particle displacement �dB re 1 nm� along the radialbetween the release sites for the sound projector broadcasting a 90 Hz tone.XY1 and XY2 are the particle motion vectors measured at 9.5 and 4.5 cmabove the tank floor, respectively. Z is the vertical particle motion, and Geois the vertical substrate vibration measured with the geophone. Note that thesubstrate vibrations �Geo� are approximately 20 dB lower �10 times� thanthe particle displacement measured from the sound source at 9.5 cm �XY1�from the tank bottom.
measured at 9.5 cm.
J. Acoust. Soc. Am., Vol. 127, No. 5, May 2010 Zed
B. Phonotaxic response pathways
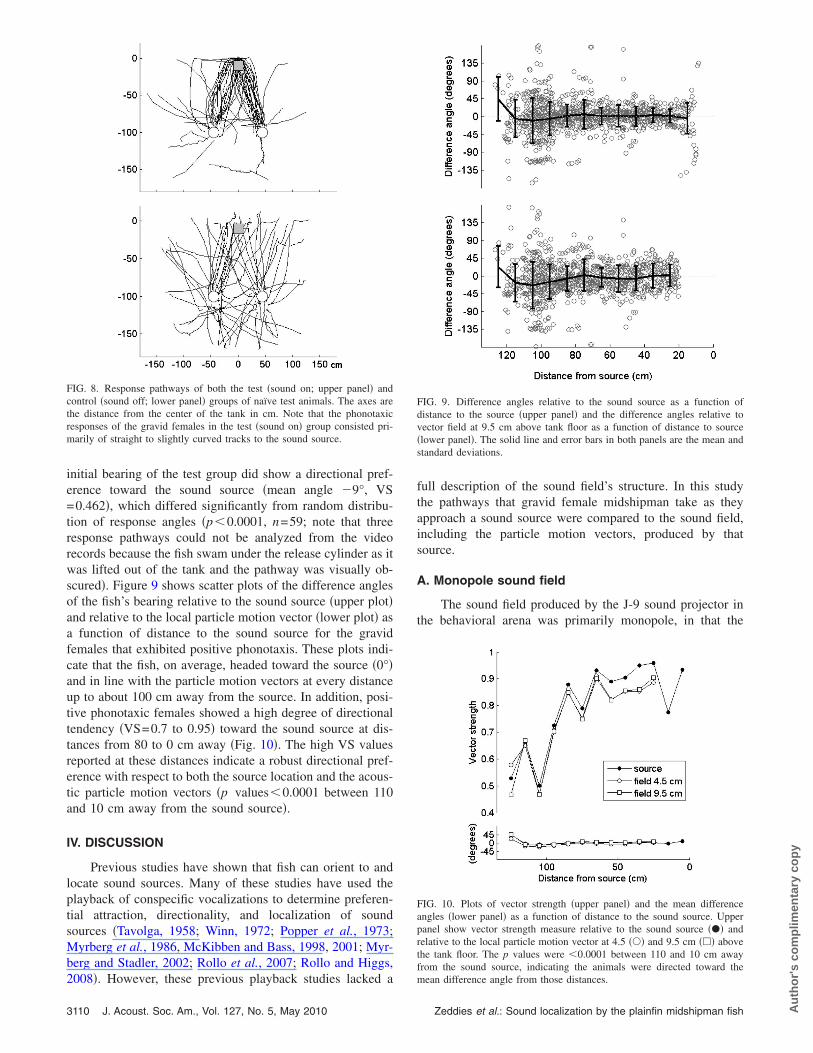
Only gravid females �n=45, mean GSI=22.9�8.0 SD�exhibited positive phonotaxic responses to the hum-likeplayback tone of 90 Hz. Spent females containing little or noeggs did not exhibit positive responses �n=8, GSI�12�. Thephonotaxic responses of the gravid females consisted prima-rily of straight to slightly curved tracks to the sound source.Abrupt changes in trajectory were rarely observed �onlythree of the 45 positive responses�. In most cases, femaleswould contact the opaque tarp directly in front of the speakerand then proceed to swim under the tarp and make contactwith the sound projector. A positive response was unambigu-ous and consisted of repeated contact with the speaker faceand/or prolonged, active circling in front or underneath thesound projector. The majority of the gravid females in thetest group �73%, 45 of 62 gravid females; size range:9.0–12.8 cm standard length �SL�, mean SL=11.0�0.7 SD cm� responded to the 90 Hz playback toneand localized the sound source. In contrast, none of thegravid females in the control group �n=59, mean GSI=23.5�8.3 SD, size range: 10.3–15.3 cm SL, mean SL=12.0�1.1 SD cm� released with the sound off madephysical contact or showed active interest in the silent pro-jector. Instead, gravid females in the sound-off control groupswam in many directions. Figure 8 shows the response path-ways for both the test �sound-on� and control �sound-off�groups.
The initial bearing �the angle measured using the firsttwo time points� of the control group did not show a direc-tional preference �vector strength �VS�=0.157� and did notsignificantly differ from the null hypothesis of a random dis-
FIG. 7. Particle displacement vector field in the XY plane as measured attwo distances above the tank floor. The axes are the distance from the centerof the tank in cm. Upper panel shows the particle displacement measured at9.5 cm above the tank floor. Lower panel shows the particle displacementmeasured at 4.5 cm above the tank floor. A and B are the animal releasesites.
tribution of response angles �p=0.24, n=59�. In contrast, the
dies et al.: Sound localization by the plainfin midshipman fish 3109 Au
tho
r's
com
plim
enta
ry c
op
y
initial bearing of the test group did show a directional pref-erence toward the sound source �mean angle �9°, VS=0.462�, which differed significantly from random distribu-tion of response angles �p�0.0001, n=59; note that threeresponse pathways could not be analyzed from the videorecords because the fish swam under the release cylinder as itwas lifted out of the tank and the pathway was visually ob-scured�. Figure 9 shows scatter plots of the difference anglesof the fish’s bearing relative to the sound source �upper plot�and relative to the local particle motion vector �lower plot� asa function of distance to the sound source for the gravidfemales that exhibited positive phonotaxis. These plots indi-cate that the fish, on average, headed toward the source �0°�and in line with the particle motion vectors at every distanceup to about 100 cm away from the source. In addition, posi-tive phonotaxic females showed a high degree of directionaltendency �VS=0.7 to 0.95� toward the sound source at dis-tances from 80 to 0 cm away �Fig. 10�. The high VS valuesreported at these distances indicate a robust directional pref-erence with respect to both the source location and the acous-tic particle motion vectors �p values�0.0001 between 110and 10 cm away from the sound source�.
IV. DISCUSSION
Previous studies have shown that fish can orient to andlocate sound sources. Many of these studies have used theplayback of conspecific vocalizations to determine preferen-tial attraction, directionality, and localization of soundsources �Tavolga, 1958; Winn, 1972; Popper et al., 1973;Myrberg et al., 1986, McKibben and Bass, 1998, 2001; Myr-berg and Stadler, 2002; Rollo et al., 2007; Rollo and Higgs,
FIG. 8. Response pathways of both the test �sound on; upper panel� andcontrol �sound off; lower panel� groups of naïve test animals. The axes arethe distance from the center of the tank in cm. Note that the phonotaxicresponses of the gravid females in the test �sound on� group consisted pri-marily of straight to slightly curved tracks to the sound source.
2008�. However, these previous playback studies lacked a
3110 J. Acoust. Soc. Am., Vol. 127, No. 5, May 2010
full description of the sound field’s structure. In this studythe pathways that gravid female midshipman take as theyapproach a sound source were compared to the sound field,including the particle motion vectors, produced by thatsource.
A. Monopole sound field
The sound field produced by the J-9 sound projector inthe behavioral arena was primarily monopole, in that the
FIG. 9. Difference angles relative to the sound source as a function ofdistance to the source �upper panel� and the difference angles relative tovector field at 9.5 cm above tank floor as a function of distance to source�lower panel�. The solid line and error bars in both panels are the mean andstandard deviations.
FIG. 10. Plots of vector strength �upper panel� and the mean differenceangles �lower panel� as a function of distance to the sound source. Upperpanel show vector strength measure relative to the sound source ��� andrelative to the local particle motion vector at 4.5 ��� and 9.5 cm ��� abovethe tank floor. The p values were �0.0001 between 110 and 10 cm awayfrom the sound source, indicating the animals were directed toward the
mean difference angle from those distances.Zeddies et al.: Sound localization by the plainfin midshipman fish Au
tho

r's
com
plim
enta
ry c
op
y
pressure decreased away from the source at about the samerate in all directions �Fig. 5� and the particle motion vectorspointed to �and away from� the source �Fig. 7�. A monopolesound field was expected to be generated by this source butwas not guaranteed considering the playback environment ofthe shallow test tank. Though minor, there was some localinteraction with the bottom as the particle motion vectors at9.5 cm above the bottom are more uniformly directed towardthe source than the particle motion vectors at 4.5 cm abovethe bottom �Fig. 7�. Also, closer to the tank wall the soundpressure begins to increase due to reflections from the wall,and the particle motion vectors do not necessarily point to-ward the source.
B. Phonotaxis and localization
As in previous midshipman playback studies �Winn,1972; McKibben and Bass, 1998, 2001�, only gravid femalesdisplayed a positive phonotaxic response to a tone near thefundamental frequency of the male’s advertisement call. Itcan be concluded from these experiments that gravid femalescan in fact localize sound sources and rely solely on acousticcues to do so. The control �sound-off� group showed no di-rectional tendency on initial release and none of the gravidfemales from the control group remained in the center of thetank �where the silent sound projector was located� if theyhappened to pass near it. However, upon release, the test�sound on� group showed significant directional tendency to-ward the source, and 45 of the 62 �73%� gravid femaleslocated the speaker and contacted the speaker face, and thenremained under or circled the transducer as long as the soundremained on. McKibben and Bass �1998, 2001� demon-strated that gravid females swam to the source, but they wereuncertain whether fish used only acoustic cues to locate thesource. Here, only naïve fish were tested using one speakerthat was visually occluded by an opaque screen. The onlysensory cues available to the fish for localizing the soundsource were acoustic.
C. Mechanisms and strategies of sound sourcelocalization
Investigators generally agree that particle motion pro-vides information useful for determining the direction of asound source, but it is presently a matter of debate �1�whether fish decide on the source location from a distanceusing local cues or use a strategy for approaching the source,�2� whether both particle motion detection and sound pres-sure detection are required for localization and resolution ofthe “180° ambiguity” �see below�, and �3� whether theotolithic ears or the lateral line organs are the receptors re-sponsible for localization behavior, particularly in the nearfield.
The majority of the gravid females �73%� exhibited apositive phonotaxic response. Their pathways tended to besmooth, continuous, and consistently directed toward thesource with comparable accuracy between the release siteand final response at the source �VS�0.7, Figs. 8 and 9�.This is in contrast to sculpin that display a zig-zag pattern
where they stop and seem to sample the environment andJ. Acoust. Soc. Am., Vol. 127, No. 5, May 2010 Zed
then refine their behavior when approaching a nearby sourceusing the lateral line system �Coombs and Conley, 1997�. Inthe present study, midshipman did not adopt an arbitrary ori-entation and then swam in a direction that maintained a con-stant �but arbitrary� angle with respect to the axis of particlemotion �sensu Kalmijn�. Rather, they adopted �on average� a0° orientation with respect to the particle motion axis, andswam toward the source. The finding that midshipman weresignificantly directed toward the sound source from the re-lease sites indicates that a displacement of 45 dB re 1 nm�178 nm� is sufficient for these fish to determine direction.
It is possible that phonotaxis in the midshipman can beexplained as the animal’s orientation to the spatial change inintensity that exists in the tank �Fraenkel and Gunn, 1961;Richard, 1968�, with the fish “climbing up” the intensity gra-dient. There is indeed an intensity gradient amounting toabout 0.3 dB per cm �Fig. 5�. Although such orientation strat-egies have not been demonstrated for fish experimentally, theperformance in this task would presumably depend on theabilities of the fish to make comparisons of the sound levelsat successive locations, and then to move in the direction ofhigher intensity. The discrimination limen for intensity hasnot been measured in the midshipman, but based on com-parative data from other species, it is on the order of 2–9 dB�Fay, 1988�. If the midshipman used their ears and not thelateral line for phonotaxis, they would presumably have tomove in a zig-zag manner to sample the sound field, asanurans do �Rheinlaender et al., 1979�. The tracks taken bythe animals in this study do not suggest this sort of behavior,and therefore, do not support a sampling and gradient climb-ing mechanism for source localization. If the lateral line sys-tem were used in this task, the pressure gradients appearingalong the length of the animal could possibly be used fororientation if the intensity gradient acuity were adequate.However, this acuity has not been measured in any animal.
An important issue with respect to sound source local-ization by fishes concerns the “180° ambiguity” problem.Particle motion in a monopole sound field is ambiguous inthat the axis of motion points both toward and 180° awayfrom the source. Which direction should the fish swim?Theoretically, the phase relation between sound pressure andparticle motion could be used to resolve the ambiguity�Schuijf, 1975�, but it requires independent measurements ofsound pressure and particle motion. Sensing sound pressure,presumably via the swim bladder, is a mode of hearing that isunlikely in midshipman and other toadfish, as there is noevidence so far for sound pressure reception in these animals.Nevertheless, further studies on midshipman phonotaxis us-ing animals with deflated swim bladders are planned to in-vestigate this possibility.
It is interesting to note that no evidence was found thatthe midshipman fish were confused by the 180° ambiguity ofthe particle motion. If sound source localization can takeplace independent of swim bladder involvement, then otherstrategies for resolving the 180° ambiguity must be available.It is possible that fish sample at two or more sites beforedeciding which direction to swim, or use estimates of theprobabilities of source locations to influence their decisions
as human listeners do when making sound source elevationdies et al.: Sound localization by the plainfin midshipman fish 3111 Au
tho
r's
com
plim
enta
ry c
op
y
and front-back judgments in anechoic environments �Wight-man and Kistler, 1993�. In other words, it might be askingtoo much of the auditory system to be able to solve thisproblem in isolation.
Another important issue concerns the involvement of thelateral line system in near-field sound source localization. Upthrough the 1960s while the work of van Bergeijk �1964�was influential, it was thought that all near-field “hearing” byfishes was subserved by the lateral line system. It is nowknown that the otolithic organs of the ears are exquisitelysensitive to acoustic particle motion �with thresholds at 100Hz on the order of 0.1 nm �Fay, 1984, 1988��, and that thelateral line system is a very close range detector �on the orderof a few body lengths; Coombs and Conley, 1997�. It re-mains a possibility that sound source localization behaviordepends on lateral line stimulation, so phonotaxis experi-ments on midshipman for which the lateral line system of themidshipman has been inactivated are planned for future ex-periments.
V. SUMMARY AND CONCLUSIONS
In this study, the plainfin midshipman fish was used as ageneral model to explore how fishes localize an underwatersound source in the relatively simple geometry of a mono-pole sound field. It was found that gravid females were di-rected toward the sound source upon initial release and themajority �73%� subsequently followed straight to slightlycurved pathways directed toward the source and in line withthe local particle motion vectors. This study is the first tocompare the path that fish take to a sound source with thelocal vector components of the sound field. It was not pos-sible to conclude from these experiments if the fish “knew”where the sound source was located in the sense that humans�and other vertebrates� do, but it does appear that midship-man fish are able to use acoustic cues to determine directionto a sound source from distances of 80–100 cm away. Thereare a number of questions still to be answered, but the pro-cedure presented here can be applied to more complex fieldsand represents an approach that may shed light on the cuesand strategies that fish use to localize sound sources in theirnatural environment.
ACKNOWLEDGMENTS
This collaborative research was supported by the Na-tional Science Foundation �Grant No. IOS-0642214�. Wewould like to thank Andrew Bass and Margaret Marchaterrefor field assistance and logistical support, Mardi Hastings fortechnical advice, and the UC Bodega Marine Laboratorywhere these experiments were conducted.
Bass, A. H. �1996�. “Shaping brain sexuality,” Am. Sci. 84, 352–363.Bass, A. H., Bodnar, D. A., and Marchaterre, M. A. �1999�. “Complemen-
tary explanations for existing phenotypes in an acoustic communicationsystem,” in Neural Mechanisms of Communication, edited by M. Hauserand M. Konishi �MIT Press, Cambridge, MA�, pp. 493–514.
Bass, A. H., and Clark, C. W. �2003�. “The physical acoustics of underwatersound communication,” in Acoustic Communication, edited by A. M. Sim-mons, R. R. Fay, and A. N. Popper, �Springer, New York�, pp. 15–64.
Batschelet, E. �1981�. “The Rayleigh test,” in Circular Statistics in Biology,
edited by E. Batschelet �Academic Press, New York�, pp. 54–58.3112 J. Acoust. Soc. Am., Vol. 127, No. 5, May 2010
Brantley, R. K., and Bass, A. H. �1994�. “Alternative male spawning tacticsand acoustic signals in the plainfin midshipman fish Porichthys notatusGirard �Teleostei, Batrachoididae�,” Ethology 96, 212–232.
Chapman, C. J. �1973�. “Field studies of hearing in teleost fish,” Helgolan-der wiss Meeresunters 24, 371–390.
Chapman, C. J., and Johnstone, A. D. F. �1974�. “Some auditory discrimi-nation experiments on marine fish,” J. Exp. Biol. 61, 521–528.
Coombs, S., and Conley, R. �1997�. “Dipole source localization by mottledSculpin. I. Approach strategies,” J. Comp. Physiol. �A� 180, 387–399.
De Vries, H. L. �1950�. “The mechanics of the labyrinth otoliths,” ActaOto-Laryngol. 38, 262–273.
Edds-Walton, P. L., Fay, R. R., and Highstein, S. M. �1999�. “Dendriticarbors and central projections of auditory fibers from the saccule of thetoadfish �Opsanus tau),” J. Comp. Neurol. 411, 212–238.
Fay, R. R. �1984�. “The goldfish ear codes the axis of acoustic particlemotion in three dimensions,” Science 225, 951–954.
Fay, R. R. �1988�. Hearing in Vertebrates: A Psychophysics Databook �Hill-Fay Associates, Winnetka, IL�.
Fraenkel, G. S., and Gunn, D. L. �1961�. The Orientation of Animals �Dover,New York�.
Hawkins, A. D., and Sand, O. �1977�. “Directional hearing in the medianvertical plane by the cod,” J. Comp. Physiol. �A� 122, 1–8.
Kalmijn, A. J. �1997�. “Electric and near-field acoustic detection, a com-parative study,” Acta Physiol. Scand. 161, 25–38.
McKibben, J. R., and Bass, A. H. �1998�. “Behavioral assessment of acous-tic parameters relevant to signal recognition and preference in a vocalfish,” J. Acoust. Soc. Am. 104, 3520–3533.
McKibben, J. R., and Bass, A. H. �2001�. “Effects of temporal envelopemodulation on acoustic signals in a vocal fish: Harmonic and beatstimuli,” J. Acoust. Soc. Am. 109, 2934–2943.
Myrberg, A. A., Mohler, M., and Catala, J. D. �1986�. “Sound production bymales of a coral reef fish �Pomacentrus partitus�: Its significance to fe-males,” Anim. Behav. 34, 913–923.
Myrberg, A. A., and Stadler, J. H. �2002�. “The significance of the soundsby male gobies �Gobiidae� to conspecific females: Similar findings to astudy made long ago,” Bioacoustics 12, 255–257.
Pierce, A. D. �1994�. Acoustics: An Introduction to Its Physical Principlesand Applications �Acoustical Society of America, New York�.
Popper, A. N., and Fay, R. R. �1993�. “Sound detection and processing byfish: Critical review and major research questions,” Brain Behav. Evol. 41,14–38.
Popper, A. N., Salmon, A., and Parvulescu, A. �1973�. “Sound localizationby the Hawaiian squirrelfishes, Myripristis berndti and M. argyromus,”Anim. Behav. 21, 86–97.
Reinhardt, F. �1935�. “Uber Richtungs wahrnehmung bei Fischen �Aboutdirectional orientation in fishes, especially the European minnow �Phoxi-nus laevis� and the catfish �Amiurus nebulosis Raf.��,” Z. Vgl. Physiol. 22,570–603.
Rheinlaender, J., Gerhardt, H. C., Yager, D. D., and Capranica, R. R. �1979�.“Accuracy of phonotaxis by the green treefrog �Hyla cinerea�,” J. Comp.Physiol. �A� 133, 247–255.
Richard, J. D. �1968�. “Fish attraction with pulsed low frequency sound,” J.Fish. Res. Board Can. 25, 1441–1452.
Rollo, A, Andraso, G., Janssen, J., and Higgs, D. �2007�. “Attraction andlocalization of round goby �Neogobius melanostomus� to conspecificcalls,” Behaviour 144, 1–21.
Rollo, A., and Higgs, D. �2008�. “Differential acoustic response specificityand directionality in the round goby Neogobius melanostomus,” Anim.Behav. 75, 1903–1912.
Schuijf, A. �1975�. “Directional hearing of cod �Gadus morhua� under ap-proximate free field conditions,” J. Comp. Physiol. �A� 98, 307–332.
Schuijf, A., and Hawkins, A. D. �1983�. “Acoustic distance discriminationby the cod,” Nature �London� 302, 143–144.
Sisneros, J. A., and Bass, A. H. �2005�. “Ontogenetic changes in the re-sponse properties of individual, primary auditory afferents in the vocalplainfin midshipman fish Porichthys notatus Girard,” J. Exp. Biol. 208,3121–3131.
Tavolga, W. N. �1958�. “The significance of underwater sounds produced bymales of the gobiid fish, Bathygobius soporator,” Physiol. Zool. 31, 259–271.
Tomkins, J. L., and Simmons, L. W. �2002�. “Measuring relative investment:A case study of testes investment in species with alternative male repro-ductive tactics,” Anim. Behav. 63, 1009–1016.
van Bergeijk, W. A. �1964�. “Directional and nondirectional hearing in fish,”
Zeddies et al.: Sound localization by the plainfin midshipman fish Au
tho

in Marine Bioacoustics, edited by W. A. Tavolga �Peramon Press, Lon-don�, pp. 269–301.
von Frisch, K. �1938�. “Über die Bedeutung des Sacculus und der Lagenafur den Gehorsinn der Fische,” Z. Vgl. Physiol. 25, 703–747.
von Frisch, K., and Dijkgraaf, S. �1935�. “Can fish perceive sound direc-tion?,” Z. Vgl. Physiol. 22, 641–655.
Weber, E. H. �1820�. “De Aure et Auditu Hominis et Animalium Pars I
�About the ear and hearing in humans and animals Part I�,” in De AureJ. Acoust. Soc. Am., Vol. 127, No. 5, May 2010 Zed
Animalium Aquatilium (About the Ear of Aquatic Animals), edited by G.Fleischer �Gerhard Fleischer, Leipzig�.
Wightman, F. L., and Kistler, D. J. �1993�. “Sound localization,” in HumanPsychophysics, edited by W. A. Yost, A. N. Popper, and R. R. Fay�Springer-Verlag, New York�, pp. 155–192.
Winn, H. E. �1972�. “Acoustic discrimination by the toadfish with commentson signal systems” in Behavior of Marine Animals Volume 2: Vertebrates,
edited by H. E. Winn and B. L. Olla �Plenum, New York�, pp. 361–385.dies et al.: Sound localization by the plainfin midshipman fish 3113 Au
tho
r's
com
plim
enta
ry c
op
y