Johnson Creek landslide researCh ProJeCt, linColn County ...

Some considerations about the simulation of breach
channel erosion on landslide dams
Corrado Cencetti, Andrea Fredduzzi, Ivan Marchesini,
Mara Naccini and Paolo Tacconi
Department of Civil and Environmental Engineering, University of Perugia, Perugia, Italy
E-mail: [email protected]
Received 31 August 2004; accepted 4 August 2005
The analysis of the flood hazard related to the areas downstream of landslide dams is one
of the most interesting aspects of studying the formation and the failure of natural dams. The
BREACH code [14], simulating the collapse of earthen dams, both man-made and naturally
formed by a landslide, was chosen in order to analyse the case of the Valderchia landslide
(central Italy). The bed-load transport formula used in BREACH (Meyer-Peter and Muller,
modified by Smart [27]) is based on flume experiments with well-sorted sediments. Such a
methodology probably makes this equation not very suitable for describing the sediment
transport peculiar to a landslide body presenting a very poor material sorting. The Schoklitsch
[26] formula was implemented into the programme as an alternative to the Smart equation.
However, because the landslide deposits may often have a strongly bimodal grainYsize
frequency curve, the percentile D50 (the typical granulometric parameter requested by bed-
load sediment transport formulas) can sometimes correspond to one of the grain-size classes
which are really present to a lesser degree. To consider this phenomenon, the BREACH
programme (version 7/88-1) was implemented with a new procedure that calculates two
granulometric curves, one for each mode of the original distribution, and evaluates transport
of the landslide material separately. Results of the analysis show that the model is very
sensitive to the bed-load equation and that the procedure implemented to consider the
eventual bimodal distribution of the dam material simulates the armouring phenomenon
(which can stop the erosion of the dam during the overtopping phase).
Keywords: landslide dams, dam breach, breach shape, sediment sorting, bed-load transport,
sensitivity analysis
1. Introduction
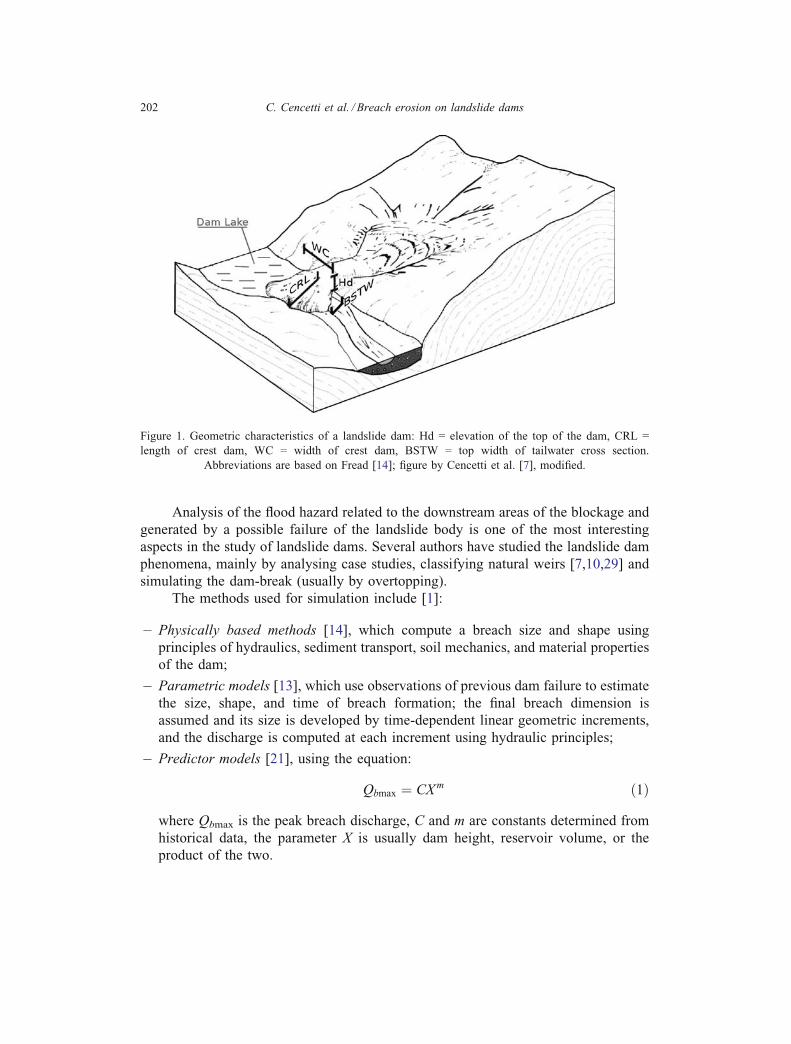
The interference of landslides with river channels can generate many scenarios
[7], from the partial blockage of the river, to the entire occlusion of the floodplain and
the consequent flooding of the upstream lands (figure 1).
Computational Geosciences (2006) 10:201–219
DOI: 10.1007/s10596-005-9019-x # Springer 2006
Analysis of the flood hazard related to the downstream areas of the blockage and
generated by a possible failure of the landslide body is one of the most interesting
aspects in the study of landslide dams. Several authors have studied the landslide dam
phenomena, mainly by analysing case studies, classifying natural weirs [7,10,29] and
simulating the dam-break (usually by overtopping).
The methods used for simulation include [1]:
Y Physically based methods [14], which compute a breach size and shape using
principles of hydraulics, sediment transport, soil mechanics, and material properties
of the dam;
Y Parametric models [13], which use observations of previous dam failure to estimate
the size, shape, and time of breach formation; the final breach dimension is
assumed and its size is developed by time-dependent linear geometric increments,
and the discharge is computed at each increment using hydraulic principles;
Y Predictor models [21], using the equation:
Qbmax ¼ CX m ð1Þ
where Qbmax is the peak breach discharge, C and m are constants determined from
historical data, the parameter X is usually dam height, reservoir volume, or the
product of the two.
Figure 1. Geometric characteristics of a landslide dam: Hd = elevation of the top of the dam, CRL =
length of crest dam, WC = width of crest dam, BSTW = top width of tailwater cross section.
Abbreviations are based on Fread [14]; figure by Cencetti et al. [7], modified.
202 C. Cencetti et al. / Breach erosion on landslide dams

Y Comparison methods [28] are used to estimate the breach characteristics and peak
outflow of dam when the latter is very similar in size, construction and materials to
a failed dam with known data.
The landslide dam failure is still frequently studied as an earthen dam failure,
because the mechanism of breach formation is considered very similar, despite of
different geometry, dimensions and material properties. To study the effects of the
heterogeneity of the landslide material on the erosion of the breach, the BREACH
code, one of the most widely used computer models, was applied to a real landslide
dam: the landslide of Valderchia in central Italy [6]. The landslide dam is located just
upstream of the town of Gubbio and the ensuing overtopping flood could have been
dangerous. It must be noted that the landslide blockage (which occurred in 1997) did
not lead to overtopping and flooding due to rapid technical mitigation (the pumping of
the dam lake and the construction of a by-pass) carried out by local authorities.
Moreover, we want to stress that we chose the Valderchia landslide because it was a
landslide dam about which we had enough data and because it enabled us to apply the
BREACH code to simulate a real case and not an artificial one. In particular, we
decided to test some bed-load formulas, which can be used in the model. The objective
was to determine which one best describes the sediment transport of poorly sorted
materials (as landslide materials can be; for instance, when movement has started from
lithologically heterogeneous slopes). Finally, a methodology was implemented in the
BREACH code to consider the bimodal grain-size distribution of materials in the
analysis of the erosion of a landslide dam by overtopping.
2. The BREACH code
The BREACH code is a mathematical model, used to simulate the collapse of
earthen dams, either man-made or naturally formed by a landslide, developed by Fread
[14] at the US National Weather Service. The model predicts some characteristics of
the breach (such as size, shape, time of formation and outflow hydrograph emanating
from the reservoir) by using the principles of hydraulics, sediment transport formulas,
the theory of soil mechanics, as well as the geometry and the material properties of the
dam and of the reservoir. The code assumes that the size of the breach developing
along the crest of the landslide dam is governed by the capacity of the flowing water
(which erodes and scours the bed of the breach channel) to transport the eroded
materials.
The dam-break may occur by overtopping, by piping, or by sudden structural
collapse due to hydrostatic pressure. The BREACH code uses:
Y the equation of the broad-crested weir [12]:
Qb ¼ 0:385 *ffiffiffiffiffi
2gp
B0ðH � HcÞ1:5 ð2Þ
C. Cencetti et al. / Breach erosion on landslide dams 203

where Qb (m3/s) is the flow into the breach channel, g (m/s2) is the gravitational
constant, B0 (m) is the instantaneous width of the initially rectangular-shaped
channel, Hc (m) is the elevation of the breach bottom and H (m) is the water level
in the reservoir, to simulate the outflow in the breach channel;
Y the Smart [27] equation to calculate the sediment transport capacity for flow;
Y the Manning equation of the uniform flow, to define the water depth;
Y the mass conservation equation between inflow and outflow (from the breach, the
crest, the spillway).
The flow is considered uniform because it varies little along the breach channel Y both
in artificial dams with a reduced channel length and a high bed slope, and in landslide
dams with a bigger channel length but a lesser slope. Moreover, a stability analysis of
the channel banks is made at each time step, and when the stability is not verified the
slump of the banks is simulated. Each slump increases the size and changes the shape
of the breach (from an initial rectangular shape to a trapezoidal one; figure 2). The
programme simulates the erosion of the breach bottom, until the depth of the breach
reaches a critical height (Hk)
Hk ¼4c * cos� * sin�k�1
� 1� cosð�k�1 � �Þ½ � ð3Þ
Figure 2. Cross_section view of a dam with breach formation sequence. �k = �/2 j �; � = side slopes
angle; B0 = width of the breach; B0m = final width of the breach bottom; Hd = elevation of the dam; Hc =
elevation of the breach bottom; by Fread [14], modified.
204 C. Cencetti et al. / Breach erosion on landslide dams
(where c is cohesion, � is the unit weight, � is internal friction, � is the side slopes
angle) over which the banks of the channel slump, leading to a stable configuration of
the slopes with angle (�k), defined by:
�k ¼ 0:5�� �k ¼�k�1 þ �
2ð4Þ
(where � = �/2 j �).
The width of the breach (B0) is assumed to be initially defined by the next
equation:
B0 ¼ 2y ð5Þ
where y represents the uniform depth of the flow inside the channel and is derived
from the Manning open channel flow equation and B0 is the width of the breach. The
erosion takes place equally along the bottom and the sides of the breach channel,
except when the sides collapse as described before. The erosion depth is evaluated
iteratively, assuming an estimated erosion depth (DH) and solving for bed-load [27],
flow (Manning) and breach dimension equations as above.
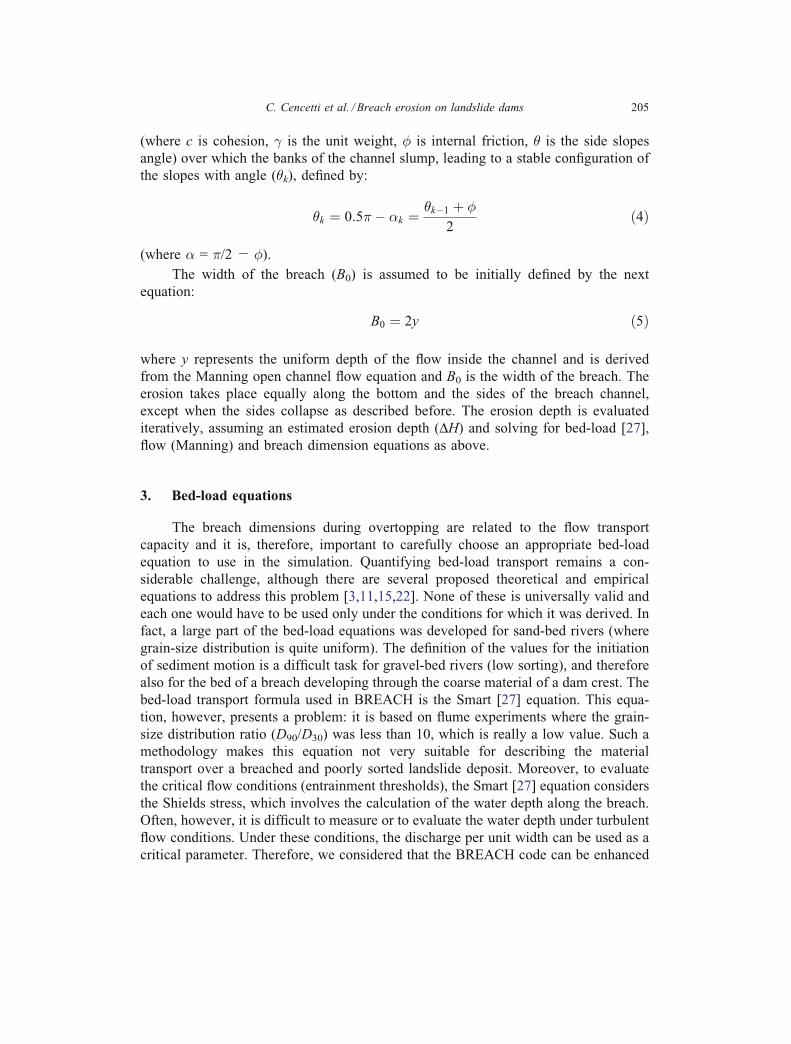
3. Bed-load equations
The breach dimensions during overtopping are related to the flow transport
capacity and it is, therefore, important to carefully choose an appropriate bed-load
equation to use in the simulation. Quantifying bed-load transport remains a con-
siderable challenge, although there are several proposed theoretical and empirical
equations to address this problem [3,11,15,22]. None of these is universally valid and
each one would have to be used only under the conditions for which it was derived. In
fact, a large part of the bed-load equations was developed for sand-bed rivers (where
grain-size distribution is quite uniform). The definition of the values for the initiation
of sediment motion is a difficult task for gravel-bed rivers (low sorting), and therefore
also for the bed of a breach developing through the coarse material of a dam crest. The
bed-load transport formula used in BREACH is the Smart [27] equation. This equa-
tion, however, presents a problem: it is based on flume experiments where the grain-
size distribution ratio (D90/D30) was less than 10, which is really a low value. Such a
methodology makes this equation not very suitable for describing the material
transport over a breached and poorly sorted landslide deposit. Moreover, to evaluate
the critical flow conditions (entrainment thresholds), the Smart [27] equation considers
the Shields stress, which involves the calculation of the water depth along the breach.
Often, however, it is difficult to measure or to evaluate the water depth under turbulent
flow conditions. Under these conditions, the discharge per unit width can be used as a
critical parameter. Therefore, we considered that the BREACH code can be enhanced
C. Cencetti et al. / Breach erosion on landslide dams 205

by implementing the Schoklitsch [26] equation, which does indeed consider the dis-
charge per unit width as a critical parameter:
ms ¼ 2; 500S3=2 q� qcð Þ ð6Þ
qc ¼ 0:26�s
�� 1
� �5=3
d3=240 S�7=6 ð7Þ
where ms is the transport rate per unit width (kg/s), S is the channel slope, q is the
volumetric water discharge per unit width (m3/s), qc is the critical volumetric water
discharge per unit width (m3/s), �s is specific mass of sediments (kg/m3), � is the
specific mass of water (kg/m3), d40 is the diameter for which 40% of sediments are
finer (m).
Moreover, this equation, as shown by Bathurst et al. [3], furnishes the best results
under conditions of unlimited supply and for mountain rivers (coarse grain-size and
steep slopes). We could assume that the breach channel developing on a landslide dam
is very steep and is supplied with a large amount of material. Therefore we believe that
bed-load transport rate can be adequately simulated using the Schoklitsch formula.
4. The landslide of Valderchia
The Valderchia landslide affected a portion of the mountain slope on the left
bank of the St. Donato Creek (Tiber basin), close to the town of Gubbio (central Italy).
It blocked the water course and formed a natural dam 9 m high, impounding a little
lake upstream (42 m wide, 90 m long and 2 m deep). The type of the landslide is
complex (rotational slide in the upper part and flow in the lower part, IGS [18]). The
geological formations affected by the mass movement are:
Y the BMarnosoYArenacea^ formation, composed of turbidites (alternation of grey
marls over 1 m thick and grey-brown sandstones with decimetre-thick strata);
Y the BSchlier^ formation, composed of clayey marls and grey clays;
Y colluvial sediments (main bodies of old landslides in figure 3), covering a wide part
of the slopes
The landslide moved during the night between the 5th and 6th of January 1997 from
an elevation of approximately 700 m a.s.l., and quickly arrived at the bottom of the
valley (approximately 600 m a.s.l.); here, the landslide front damaged two houses and
stopped against the bridge of the old abandoned national road (figure 3).
206 C. Cencetti et al. / Breach erosion on landslide dams

5. Characterisation of the landslide materials
The landslide body granulometry is poorly sorted, and may also contain cobbles
and boulders (longest diameter >1 m). A sampling survey (boreholes) of the
Valderchia landslide body was carried out by the local authorities immediately after
the event [24]. The resulting samples were studied via laboratory analysis. Table 1
shows the values of the investigated parameters (required as input for the model). The
Table 1
Average values of the friction angle, cohesion, unit weight, porosity, plasticity index and the grain-size
percentiles obtained from the analysis of the Valderchia landslide material samples.
6r [-] c [MPa] � [kN/m3] n PI [%] D90 [mm] D50 [mm] D30 [mm]
24.2 0.016 20.57 0.35 22.2 43.71 0.036 0.006
Figure 3. Geomorphological and lithological sketch of the landslide area. (1) Main scarp of present
landslide, (2) main body of present landslide, (3) main body of old landslides, (4) dam lake, (5) stream,
(6) main road; (a) BMarnosoYArenacea^ formation, (b) BSchlier^ formation, (c) BBisciaro^ formation, (d)
BScaglia Cinerea^ formation; after Cencetti et al. (1998), modified.
C. Cencetti et al. / Breach erosion on landslide dams 207

data represent the mean values of nine samples, collected from the landslide body by
means of seven boreholes. The sampling depth varied between 0.4 and 16.5 m. The
sampling position was chosen by the local authorities to enable boreholes to be used to
install seven inclinometers.
However, the mean diameter, D50, and the ratio D90/D30 obtained from the
sample analysis (table 1) cannot be considered representative of the real grain-size
distribution of the landslide materials. This is because it is often impossible to
determinate the proper grain-size composition of the landslide materials using standard
methods of investigation (sampling via geognostic drillers) when the present clasts are
larger than the geognostic instruments. This is particularly true for the Valderchia
landslide since the slope consists of fractured sandstones, with two families of joints
(NWYSE and NNEYSSW oriented) spaced at a distance of 50 cm (see figure 4).
Therefore it is possible to assume the presence within the landslide body of clasts
with an intermediate diameter of approximately 40 cm (boulders). Casagli et al. [5]
proposed to assess the real grain-size distribution of landslide material by using the
typical methods of gravel-bed rivers. There are fundamentally three kinds of methods
[9,19]:
Y volumetric sampling (sieve by weight);
Y grid or transect line sampling [20,32];
Y the photographic method [5,8].
To rapidly characterise large outcrops of landslide material, it is probably necessary to
use all the aforementioned methods. Grid, transect and photographic methods (that
Figure 4. Example of fractured sandstones constituting the slopes of the Valderchia landslide.
208 C. Cencetti et al. / Breach erosion on landslide dams

enable the coarse fraction to be sampled) can be integrated via traditional volumetric
sampling, which enables the fine sediments constituting the matrix to be analysed [2].
Unfortunately, due to the technical mitigation of the landslide, it was not possible to
sample the landslide materials using the aforementioned methods because the outcrops
of deposits were completely obliterated. Thus we assumed different weight
percentages of boulders hypothetically present in the landslide body (10% up to
80%) and estimated all the related geotechnical parameters (table 2). First, the average
granulometric curve was reconstructed for each percentage of boulders, and the value
of D30, D50, D90 and the ratio D30/D90 was calculated. The specific mass for each
percentage of boulders was calculated by the weighted average of the specific mass
obtained from the classical sampling survey (made by the authorities) and the specific
mass typical of rocks (i.e., 26 kN/m3). Porosity was evaluated by applying an
empirical diagram, based on the ratio D60/D10 [17]. Porosity for large values of D60/
D10 is asymptotic to a value of 0.2. We have assumed this constant value for all
percentages of boulders. To estimate the friction angle and the cohesion, we
distinguished two hypothetical situations: the boulders are dispersed into a matrix of
fine materials or, instead, constitute a rockfill. We adopted a simple approach in order
to determine the percentage of boulders that leads to the formation of a rockfill:
assuming that the maximum Bvoid ratio^ (e) for a packing arrangement of spherical
particles is 0.92 [4], we calculated the void ratio of landslide materials corresponding
to each percentage of boulders, as though the deposits consisted only of boulders. For
boulder frequency below 60% (e > 0.92), we assumed that the behaviour of the
landslide deposit is controlled by the matrix and we used the matrix geotechnical
parameters (6r, c), as obtained from the samples. For boulder frequency equal to, or
greater than 60% (e < 0.92), we considered the deposits as a rockfill and we estimated
the parameters as follows: 6r = 35-, as the friction angle between two blocks of quartz
[23]; the cohesion c = 0.
This enabled a sensitivity analysis of the model to be carried out according to
both the weight frequencies of boulders and to all the geotechnical parameters.
Table 2
Geotechnical parameters of the Valderchia landslide material estimated considering the hypothetical
presence of different weight percentages of boulders (10Y80%).
% Boulders 10 20 30 40 45 50 60 70 80
D30 [mm] 0.012 0.019 0.025 0.037 0.040 0.05 1.22 75 274
D50 [mm] 0.045 0.056 1.03 24.46 46.9 256 280 297 310
D90 [mm] 256 328 352 364 368 371.2 376 379.4 382
D90/D30 21,333 17,263 14,080 9,838 9,200 7,424 308 5 1.35
� [kN/m3] 21.00 21.44 21.91 22.41 22.66 22.92 23.47 24.05 24.66
6r [)] 24.2 24.2 24.2 24.2 24.2 24.2 35 35 35
c [MPa] 0.016 0.016 0.016 0.016 0.016 0.016 0 0 0
C. Cencetti et al. / Breach erosion on landslide dams 209

6. Incoming discharge
Discharge entering the dam lake is another important input parameter for the
BREACH model. No hydraulic parameter was measured during the event along the St.
Donato Creek (because it is a small river and there is no gauging station). Since the
aim of this study is to evaluate the sensitivity of the model (Schoklitsch equation [26]
and the percentage of boulders in the landslide body), we decided to perform the
simulation using a discharge value obtained from the statistic analysis of the plu-
viometric data of the meteorological station of Gubbio. The data were taken since
1929 up to 1991 and, using the Bkinematic method^ [12] we were able to obtain
discharge values with different return periods. We decided to use the 100-year dis-
charge (14 m3/s) to start the simulations.
7. Application of BREACH to the Valderchia landslide dam using different
bed-load equations
With the aim of stressing the importance of choosing the correct bed-load
equation, we applied both the base BREACH code model and the same model
modified by the implementation of the Schoklitsch equation [26] to the Valderchia
landslide dam. Implementing the Schoklitsch formula into the BREACH source code
(FORTRAN) was a straightforward process. Only a few rows have to be inserted to
enable the critical discharge to be evaluated (equation (7)) and the value obtained to be
compared with the discharge passing through the breach, as calculated by the model.
The difference between them is used to calculate ms as in equation (6). As previously
explained, the Valderchia landslide blocked the St. Donato River and finally came to a
halt against the bridge of the old abandoned, national road (see figure 3). We
considered that, in case of overtopping, the bridge would have worked as an artificial
spillway, because the water would be passed in part over the landslide and in part over
the bridge. We have defined the dimensions of the Bbridge-spillway^, its roughness
coefficient, and so we were able to perform a discharge rating curve (spillway flow vs.
head) for the bridge. Using this data, the BREACH code is able to simulate the
presence of a spillway on a dam [14]. A sensitivity analysis was performed on the two
models with respect to the variation in the grain-size composition of the landslide
body (percentage of boulders). We applied the base BREACH model to the Valderchia
landslide dam using both original geotechnical parameters and the modified
parameters according to the assumed different percentages of boulders in the landslide
body (see table 2). We assumed that the boulders were uniformly distributed inside the
landslide material. The performed simulations show that the model predicts the breach
formation for overtopping for 0Y45% of boulder content (figure 5). In contrast, the
presence of approximately 50% in weight of the boulders within the landslide body
does not allow breach formation. This occurs because the calculated transport capacity
210 C. Cencetti et al. / Breach erosion on landslide dams
is not able to erode the landslide body, due to the fact that, with 50% of the boulders
inside the dam, the value of the percentile D50 grows considerably. In effect, D50 is the
only granulometric parameter used by the base model to calculate the breach erosion.
Moreover, the model is not able to describe the preferential entrainment of the fine
materials for a given boulder content. We verified that in order to obtain the breach
formation with an assumed 50% of boulders content in the landslide, an unrealistic
discharge, higher than 3,000 m3/s, would be necessary.
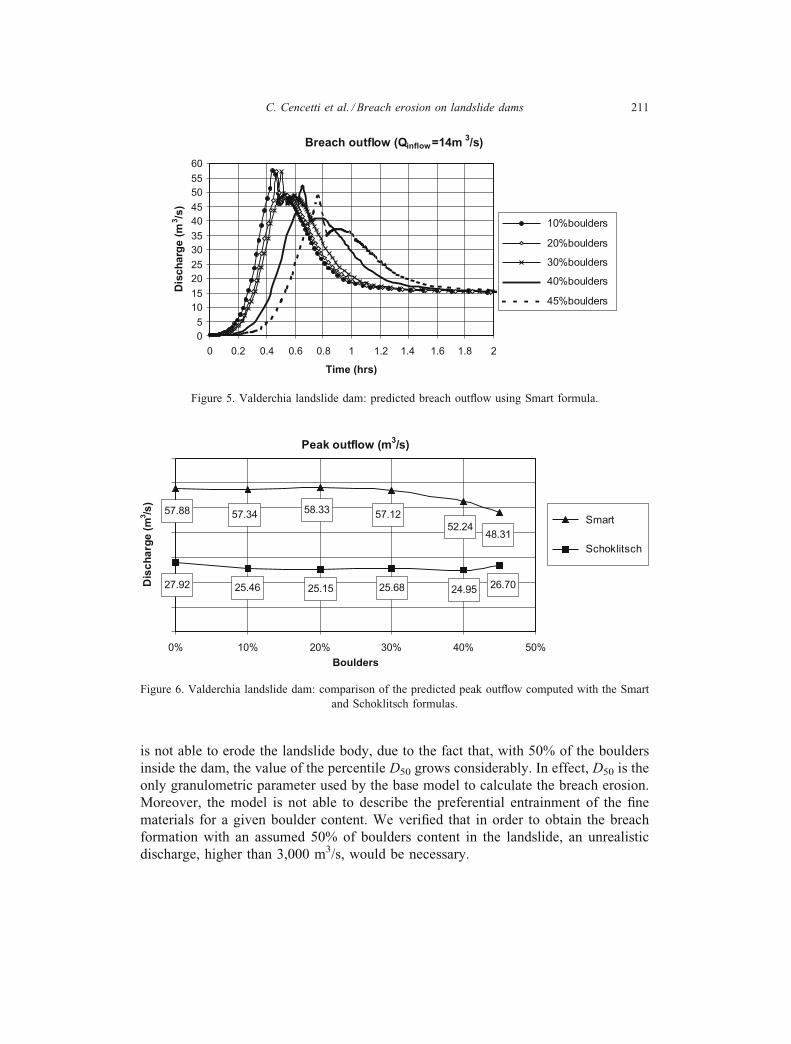
Figure 5. Valderchia landslide dam: predicted breach outflow using Smart formula.
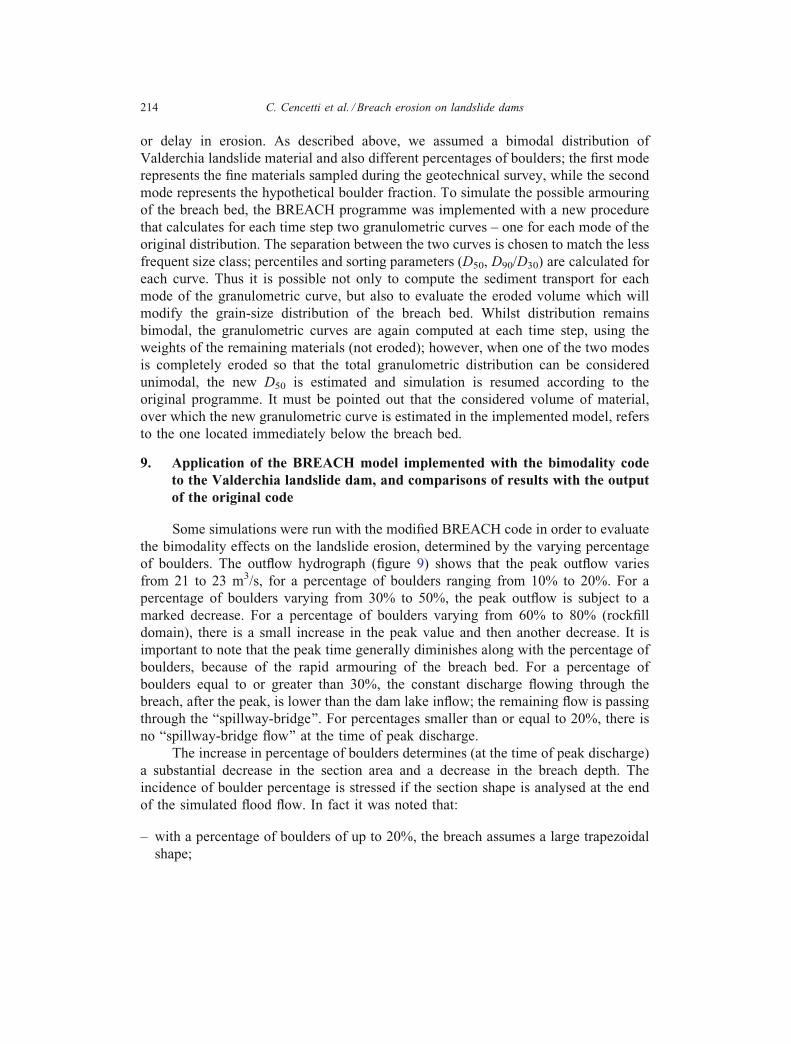
Figure 6. Valderchia landslide dam: comparison of the predicted peak outflow computed with the Smart
and Schoklitsch formulas.
C. Cencetti et al. / Breach erosion on landslide dams 211

We observed (figure 5) a low sensitivity in the different percentages of boulders
present inside the landslide body: values of peak discharge exiting from the breach
(which varies from 50 to 60 m3/s) and values of peak time (ranging within 20 min)
have small variations. Moreover, results in the application of the base model show that
the discharge passing through the breach is able to entrain the clasts when the median
diameter is approximately 47 mm, but is unable to do so above 256 mm. This last
observation was also verified for the implemented Schoklitsch model. The difference
is that the peak discharges exiting from the breach are halved compared to the base
model (figure 6).
Figure 7. Schematic cross-section view of the breach in the Valderchia landslide dam, at the peak outflow
computed with Smart formula (base model). Hc(X%) = elevation of the breach bottom with X% of
boulders in the landslide body; B(X%) = width of the breach with X% of boulders in the landslide body.
Figure 8. Schematic cross_section view of the breach in the Valderchia landslide dam, at the peak outflow
computed with Schoklitsch formula. Hc(X%) = elevation of the breach bottom with X% of boulders in the
landslide body; B(X%) = width of the breach with X% of boulders in the landslide body.
212 C. Cencetti et al. / Breach erosion on landslide dams

This is because the peak occurs before the banks of the breach catch up with the
critical height (Hk in equation (3)) and slump. Therefore, at the peak moment, the
cross-sectional area (figures 7 and 8) of the breach is much smaller than the one
obtained using the base model (where the banks slump earlier).
Another important difference is that, with median diameters equal to or greater
than 256 mm, the discharges (entering the dam lake) needed to prime the breach
formation are considerably lower than those obtained with the base model (table 3).
Indeed, considering D50 = 256 mm, for example, we observed that the dam lake inflow
needed to start the erosion using the Schoklitsch formula, i.e., 15.4 m3/s which,
compared to 3,000 m3/s, differs by 2 orders of magnitude.
8. Effects of material bimodality on the bed-load transport and description
of its implementation on the BREACH code
The entrainment of particles under flow conditions depends on certain sediment
characteristics, such as dimension, form and boundary roughness [16,25,30]. Since
only the dimension is taken into consideration by the bed-load formulas, we will focus
our attention on this parameter. The choice of the representative grain-size percentile
to use in the bed-load sediment transport simulation is important, because D50 can
sometimes correspond to one of the grain-size classes, which are less present in reality.
This is the case with some multimodal distributions, such the materials consisting of
the landslide body of Valderchia (see section 5). It is obvious that the sediment per-
formance in reaction to the erosive force of the flow is different, according to whether
the grain-size distribution curve is bimodal or unimodal. In the case of unimodal
distribution, the critical shear stress for each size fraction is well represented by the
shear stress required to entrain D50 particles. In accordance with the observations of
Wilcock [31], in the case of strongly bimodal grain-size distributions, the finer
fractions are set in motion by less shear stress as opposed to the coarse fractions.
Moreover, values of critical shear stress for each fraction depend on how the material
is distributed between the two modes. For instance, the same fine sediments (con-
stituting a mode) can start motion at different values of shear stress, depending on the
proportion of coarse sediments present in the second mode [31]. The preferential
erosion of the fine sediments can have some important consequences in dam breach
studies. Indeed, in the case of a breach formation along the top of a landslide dam,
this behaviour can determine the armouring of the breach bed, with a resulting halt
Table 3
Lake inflow discharge, needed start the erosion, related to D50 of the landslide body
(using Schoklitsch formula).
D50 [mm] 256 280 297 310
Reservoir inflow [m3/s] 15.4 84.9 84.9 93.4
C. Cencetti et al. / Breach erosion on landslide dams 213
or delay in erosion. As described above, we assumed a bimodal distribution of
Valderchia landslide material and also different percentages of boulders; the first mode
represents the fine materials sampled during the geotechnical survey, while the second
mode represents the hypothetical boulder fraction. To simulate the possible armouring
of the breach bed, the BREACH programme was implemented with a new procedure
that calculates for each time step two granulometric curves Y one for each mode of the
original distribution. The separation between the two curves is chosen to match the less
frequent size class; percentiles and sorting parameters (D50, D90/D30) are calculated for
each curve. Thus it is possible not only to compute the sediment transport for each
mode of the granulometric curve, but also to evaluate the eroded volume which will
modify the grain-size distribution of the breach bed. Whilst distribution remains
bimodal, the granulometric curves are again computed at each time step, using the
weights of the remaining materials (not eroded); however, when one of the two modes
is completely eroded so that the total granulometric distribution can be considered
unimodal, the new D50 is estimated and simulation is resumed according to the
original programme. It must be pointed out that the considered volume of material,
over which the new granulometric curve is estimated in the implemented model, refers
to the one located immediately below the breach bed.
9. Application of the BREACH model implemented with the bimodality code
to the Valderchia landslide dam, and comparisons of results with the output
of the original code
Some simulations were run with the modified BREACH code in order to evaluate
the bimodality effects on the landslide erosion, determined by the varying percentage
of boulders. The outflow hydrograph (figure 9) shows that the peak outflow varies
from 21 to 23 m3/s, for a percentage of boulders ranging from 10% to 20%. For a
percentage of boulders varying from 30% to 50%, the peak outflow is subject to a
marked decrease. For a percentage of boulders varying from 60% to 80% (rockfill
domain), there is a small increase in the peak value and then another decrease. It is
important to note that the peak time generally diminishes along with the percentage of
boulders, because of the rapid armouring of the breach bed. For a percentage of
boulders equal to or greater than 30%, the constant discharge flowing through the
breach, after the peak, is lower than the dam lake inflow; the remaining flow is passing
through the Bspillway-bridge^. For percentages smaller than or equal to 20%, there is
no Bspillway-bridge flow^ at the time of peak discharge.
The increase in percentage of boulders determines (at the time of peak discharge)
a substantial decrease in the section area and a decrease in the breach depth. The
incidence of boulder percentage is stressed if the section shape is analysed at the end
of the simulated flood flow. In fact it was noted that:
Y with a percentage of boulders of up to 20%, the breach assumes a large trapezoidal
shape;
214 C. Cencetti et al. / Breach erosion on landslide dams

Y with a percentage of boulders greater than or equal to 30%, the breach erosion stops
after the time of peak discharge.
The original model predicts very high peak flows when compared with the
modified model (figure 10).
This means that in a real case in which bimodal distributions of landslide
materials are concerned, using a single D50 for the entire material mixture (not
Figure 10. Valderchia landslide dam: comparison of the predicted peak outflow computed with the
original and the modified code.
Figure 9. Valderchia landslide dam: predicted breach outflow using the bimodal model.
C. Cencetti et al. / Breach erosion on landslide dams 215

representative of a real granulometric class) can result in an overestimation of erosion
and of outflow hydrograph. The modified model, which takes into account the bimodal
distribution, shows a higher elevation of the bottom of the breach channel both at the
peak flow (figure 11) and at the end of the simulation (figure 12).
Furthermore, as a result of the formation of a threshold which cannot be eroded
(armouring), erosion at the breach bottom ceases, due to the increase in relative
frequency of the boulders in the breach bed.
Figure 11. Valderchia landslide dam: comparison of the predicted bottom elevation of the breach at the
peak outflow computed with both the original and modified code.
Figure 12. Valderchia landslide dam: comparison of the predicted bottom elevation of the breach at the
end of the simulations computed with both the original and modified code.
216 C. Cencetti et al. / Breach erosion on landslide dams

10. Conclusion
Data on the Valderchia landslide dam (Gubbio, Italy) was used to test the
BREACH model [14], a code for the simulation of the dam breach phenomena, and to
implement some integrations. Due to the uncertainty in the weight percentage of
boulders in the landslide grain-size distribution, we tested the model based on several
different hypotheses (from 0% to 80% in weight of the boulders, in increments of
10%). Thus, the Valderchia landslide dam was considered a useful theoretical field test
with which to perform a sensitivity analysis of the BREACH model. The aim was to
analyse the relevance of the bed-load equation used by the model and to demonstrate
the role played by the granulometric distribution of the landslide material. Results of
the analysis show that the model is very sensitive to the bed-load equation. When the
Schoklitsch equation is used, in place of the original Smart formula, the model
supplies a different peak outflow. The peak discharge values are constant for D50
ranging from 0.045 to 15 mm using either the Schoklitsch or the Smart equation.
However, the peak outflows calculated via the Schoklitsch approach are halved
compared to those obtained using the Smart relation. The model showed that erosion
was not possible above D50 U 25.6 cm. It must be noted that, although both formulas
showed a scarce sensitivity to the increase in percentage of boulders inside the
landslide body, differences in peak values obtained using the two formulas are
considerable. Indeed, if we assume a trapezoidal (entrenched) channel cross-section,
we can roughly evaluate the maximum flow that can pass through the channel without
flooding, i.e., 25 m3/s (hydraulic radius = 1.08 m; Chezy coefficient = 19.3 m0.5/s;
channel slope = 0.016; cross-section area = 9.7 m2). It is obvious, when looking at
figure 6, that the implemented Schoklitsch model would have forecasted a low risk
flow (approximately 25 m3/s, thereby eliminating the need for a by-pass construction
for the landslide), whereas the Smart formula would have forecasted a flood
(approximately 57 m3/s). Although there are few elements from which to evaluate
which is the most useful equation to describe overtopping, we think that the
Schoklitsch equation can perform better. The theoretical reasons of our assertion are:
Y the Schoklitsch equation was developed and tested using field data, whereas the
Smart equation was derived by flume experiments on well-sorted sediments;
Y the Smart equation is based on critical shear stress which cannot be a good criterion
for entrainment in a self-formed channel because the critical conditions are often
exceeded in only part of the channel; on the other hand, the Schoklitsch equation
uses a critical unit water discharge which can be considered a good criterion in
natural channels [3].
Figure 10 shows that the percentage of boulder has a big influence on the value
of the peak discharge if the simulation is performed using the bimodality modified
model (see section 9). This is due to the selective erosion of fine particles and to the
C. Cencetti et al. / Breach erosion on landslide dams 217
creation of an armour on the breach bed, which does not enable the incision of the
breach. This leads to the formation of a smaller breach section area and to a
consequent smaller peak outflow. As explained at the end of section 8, the model
performs the bimodal simulation assuming that the volume of material, over which the
armouring process is developing, is located immediately below the breach bed until
the bottom of the landslide dam. Therefore the procedure implemented to consider the
eventual bimodal distribution of the dam material simulates both the armouring
phenomenon (which can stop the erosion of the dam during the overtopping phase)
and the reduction of erodibility of the landslide body related to the increase in the
percentage of boulders. From this point of view, the correct characterisation of the
granulometry of the landslide dam materials (also obtained using methods like those
used for the gravel-bed rivers) increases its significance. This approach of selective
transport can surely be improved and modified to permit simulation of breach erosion
into multimodal grain-size distributions. We think that the obtained results can be
considered promising, and that the modified model is more suitable for simulating the
erosion of poorly sorted landslide dam materials.
References
[1] ASCE, Downstream Hazard Classification Guidelines, Technical report (American Society of Civil
Engineering, Denver, CO, 1988).
[2] J. Bartoldy and P. Billi, Morphodynamics of a pseudomeandering gravel bar reach, Geomorphology
42(3) (2002) 293Y310.
[3] J.C. Bathurst, W.H. Graf and H.H. Cao, Bed load discharge equations for steep mountain rivers, in:
Sediment Transport In Gravel Bed Rivers, eds. C.R. Thorne and J.C. Bathrusts (Wiley, New York,
1996) pp. 453Y477.
[4] A. Burghignoli, Lezioni di meccanica delle terre, 2nd edition (ESA, 1993).
[5] N. Casagli, L. Ermini and G. Rosati, Determining grain size distribution of the material composing
landslide dams in the Northern Apennines: sampling and processing methods, Eng. Geol. 69(1Y2)
(2003) 83Y97.
[6] C. Cencetti, P. Conversini, C. Ribaldi and P. Tacconi, The landslide in Valderchia near Gubbio,
Umbria, Central Italy, in: Proc. of 8th IAEG Congress, Vancouver, British Columbia, Canada,
Balkema (1998) 3, 1469Y1476 ISBN: 90-5410-990-4.
[7] C. Cencetti, P. Conversini, C. Ribaldi and P. Tacconi, Studio dei sistemi alveo Y pianura fluviale in
relazione alle interazioni con fenomeni franosi di versante, Mem. Soc. Geol. Ital. 56 (2001)
249Y263. ISSN: 0375-9857.
[8] C. Cencetti, A. Fredduzzi, I. Marchesini and P. Tacconi, Esperienze di rilevamento e
determinazione dei caratteri granulometrici di alvei ghiaiosi, in: I convegno AIGA, Atti, Rendina
Editori, Chieti (2003) 181Y198 ISBN: 88-86698-40-2.
[9] M.A. Church, D.G. McLean and J.F. Wolcott, River bed gravels: sampling and analysis, in:
Sediment Transport in Gravel Bed Rivers, eds. C.R. Thorne and J.C. Bathrusts (Wiley, New York,
1987) pp. 269Y325.
[10] J.E. Costa and R.L. Schuster, The formation and failure of natural dams, Geol. Soc. Am. Bull.
100(6) (1988) 1054Y1068.
218 C. Cencetti et al. / Breach erosion on landslide dams

[11] V. D’Agostino and M.A. Lenzi, Bedload transport in the instrumented catchment of the Rio Cordon.
Part 2: Analysis of bedload rate, Catena 36(3) (1999) 191Y204.
[12] V. Ferro, La sistemazione dei bacini idrografici (McGraw-Hill, 2002).
[13] D.L. Fread, DAMBRK: The NWS Dam-Break Flood Forecasting Model, Hydrologic Research
Laboratory, National Weather Service, Silver Spring, MD, HLR-149 (1984) 56 pp.
[14] D.L. Fread, BREACH: An Erosion Model for Earthen Dam Failures, Hydrologic Research
Laboratory, National Weather Service, Silver Spring, MD, HLR-256 (1987) 315 pp.
[15] B. Gomez and M. Church, An assessment of bed load transport formulae for gravel bed rivers,
Water Resour. Res. 25(6) (1989) 1161Y1186.
[16] J. Hattingh and W.K. Illenberger, Shape sorting of flood-transported synthetic clasts in a gravel bed-
river, Sediment. Geol. 96 (1995) 181Y190.
[17] I. Herle and G. Gudehus, Determination of parameters of a hypoplastic constitutive model from
properties of grain assemblies, Mech. Cohes.-Frict. Mater. 4(5) (1999) 461Y486.
[18] IGS, Multilingual Landslide Glossary, in: International Geotechnical Society’s UNESCO Working
Party on World Landslide Inventory, Biotech, Richmond, British Columbia (1993) p. 59.
[19] R. Kellerhals and D.I. Bray, Sampling procedures for coarse fluvial sediments, J. Hydraul. Div.
97(8) (1971) 1165Y1179.
[20] L.B. Leopold, An improved method for size distribution of stream bed gravel, Water Resour. Res.
6(5) (1970) 1336Y1357.
[21] T.C. MacDonald and J. Langridge-Monopolis, Breaching characteristics of dam failures, J. Hydraul.
Eng. 110(5) (1984) 567Y586.
[22] Y. Martin, Evaluation of bed load transport formulae using field evidence from the Vedder River,
British Columbia, Geomorphology 53 (2003) 75Y95.
[23] J.K. Mitchell, Fundamental Soil Behavior, 2nd edition (Wiley, 1993).
[24] Regione Umbria, Progetto di sistemazione dell’area in frana di Valderchia (Comune di Gubbio,
Provincia di Perugia, 1999).
[25] K. Schmidt and P. Ergernzinger, Bedload entrainment, travel lengths, step lengths, rest periods,
studied with passive (iron, magnetic) and active (radio) tracers techniques, Earth Surf. Processes
Landf. 17 (1992) 147Y165.
[26] A. Schoklitsch, Handbuch des Wasserbaues (Springer, Wien, 1962).
[27] G.M. Smart, Sediment transport formula for steep channels, J. Hydraul. Div., ASCE 110(HY3)
(1984) 267Y276.
[28] T. Strelkoff, D. Schamber and N. Katopodes, Comparative analysis of routing techniques for the
floodwater from a ruptured dam, in: Proceedings of Dam-Breach Flood-Routing-Model Workshop
held in Bethesda (1977) 227Y291.
[29] F.J. Swanson, N. Oyagi and M. Tominaga, Landslide dams in Japan, in: Landslide Dams:
Processes, Risk and Mitigation, ed. R.L. Schuster (Geotechnical Special Publication, Seattle, WA,
1986) pp. 131Y145.
[30] J. Warburton and T. Demir, Influence of bed material shape on sediment transport in gravel
bed rivers: A field experiment, in: Tracers in Geomorphology (Wiley, Chichester, UK, 2000)
pp. 401Y410.
[31] P.R. Wilcock, Experimental investigation of effect of mixture properties on transport dynamics,
in: Dynamics of Gravel-Bed River, ed. Billi, P. et al. (Wiley, Chichester, 1992) 109Y139.
[32] M.G. Wolman, A method of sampling coarse river-bed material, Am. Geophys. Union Trans. 35(6)
(1954) 951Y956.
C. Cencetti et al. / Breach erosion on landslide dams 219
Copyright © 2022 FDOKUMEN