Solubility and solution mechanisms of C–O–H volatiles in silicate melt with variable redox...
17
Solubility and solution mechanisms of C–O–H volatiles in silicate melt with variable redox conditions and melt composition at upper mantle temperatures and pressures Bjorn O. Mysen a,⇑ , Kathryn Kumamoto b , George D. Cody a , Marilyn L. Fogel a a Geophysical Laboratory, Carnegie Inst. Washington, Washington DC, USA b Williams College, Williamstown, MA, USA Received 18 March 2011; accepted in revised form 25 July 2011; available online 6 August 2011 Abstract Solubility and solution mechanisms in silicate melts of oxidized and reduced C-bearing species in the C–O–H system have been determined experimentally at 1.5 GPa and 1400 °C with mass spectrometric, NMR, and Raman spectroscopic methods. The hydrogen fugacity, f H2 , was controlled in the range between that of the iron-wu ¨ stite-H 2 O (IW) and the magnetite– hematite–H 2 O (MH) buffers. The melt polymerization varied between those typical of tholeiitic and andesitic melts. The solubility of oxidized (on the order of 1–2 wt% as C) and reduced carbon (on the order of 0.15–0.35 wt% as C) is pos- itively correlated with the NBO/Si (nonbridging oxygen per silicon) of the melt. At given NBO/Si-value, the solubility of oxi- dized carbon is 2–4 times greater than under reducing conditions. Oxidized carbon dioxide is dissolved as CO 2 3 complexes, whereas the dominant reduced species in melts are CH 3 -groups forming bonds with Si 4+ together with molecular CH 4 . For- mation of CO 2 3 complexes results in silicate melt polymerization (decreasing NBO/Si), whereas solution of reduced carbon results in depolymerization of melts (increasing NBO/Si). Redox melting in the Earth’s interior has been explained with the aid of the different solution mechanisms of oxidized and reduced carbon in silicate melts. Further, effects of oxidized and reduced carbon on melt viscosity and on element partitioning between melts and minerals have been evaluated from relationships between melt polymerization and dissolved carbon com- bined with existing experimental data that link melt properties and melt polymerization. With total carbon contents in the melts on the order of several mol%, mineral/melt element partition coefficients and melt viscosity can change by several tens to several hundred percent with variable redox conditions in the range of the Earth’s deep crust and upper mantle. Ó 2011 Elsevier Ltd. All rights reserved. 1. INTRODUCTION Carbon-bearing volatiles in the C–O–H system are the second-most abundant, after H 2 O, in the silicate earth (see review by Jambon, 1994). Among these volatiles CO 2 and CH 4 are dominant in the Earth’s deep crust and upper mantle, depending on redox conditions (e.g., Eggler and Baker, 1982; Kasting et al., 1993; Kadik et al., 2004). In the present-day relatively oxidized upper mantle (within 1–2 orders of magnitude of that defined by the quartz-mag- netite-fayalite (QFM) buffer – see, for example, Mattioli and Wood, 1986; O’Neill, 1991; McCammon, 2005), it com- monly is assumed that CO 2 dominates (e.g., Eggler, 1975; Mysen, 1976; Wyllie, 1984; Boettcher et al., 1987; Jambon, 1994; Molina and Poli, 2000; Dasgupta and Hirschmann, 2007). However, during the core-forming event of the very young Earth, the oxygen fugacity, f O2 , likely was near or below that of the iron-wu ¨ stite (IW) buffer (e.g., O’Neill, 1991; Righter et al., 1997; Gessmann and Rubie, 2000; Cha- bot and Agee, 2003) and the dominant C-bearing volatile species may have been methane, CH 4 (Green et al., 1987; 0016-7037/$ - see front matter Ó 2011 Elsevier Ltd. All rights reserved. doi:10.1016/j.gca.2011.07.035 ⇑ Corresponding author. Tel.: +1 202 478 8975; fax: +1 202 478 8901. E-mail address: [email protected] (B.O. Mysen). www.elsevier.com/locate/gca Available online at www.sciencedirect.com Geochimica et Cosmochimica Acta 75 (2011) 6183–6199
-
Upload
independent -
Category
Documents
-
view
3 -
download
0
Transcript of Solubility and solution mechanisms of C–O–H volatiles in silicate melt with variable redox...
Available online at www.sciencedirect.com
www.elsevier.com/locate/gca
Geochimica et Cosmochimica Acta 75 (2011) 6183–6199
Solubility and solution mechanisms of C–O–H volatiles insilicate melt with variable redox conditions and melt
composition at upper mantle temperatures and pressures
Bjorn O. Mysen a,⇑, Kathryn Kumamoto b, George D. Cody a, Marilyn L. Fogel a
a Geophysical Laboratory, Carnegie Inst. Washington, Washington DC, USAb Williams College, Williamstown, MA, USA
Received 18 March 2011; accepted in revised form 25 July 2011; available online 6 August 2011
Abstract
Solubility and solution mechanisms in silicate melts of oxidized and reduced C-bearing species in the C–O–H system havebeen determined experimentally at 1.5 GPa and 1400 �C with mass spectrometric, NMR, and Raman spectroscopic methods.The hydrogen fugacity, fH2, was controlled in the range between that of the iron-wustite-H2O (IW) and the magnetite–hematite–H2O (MH) buffers. The melt polymerization varied between those typical of tholeiitic and andesitic melts.
The solubility of oxidized (on the order of 1–2 wt% as C) and reduced carbon (on the order of 0.15–0.35 wt% as C) is pos-itively correlated with the NBO/Si (nonbridging oxygen per silicon) of the melt. At given NBO/Si-value, the solubility of oxi-dized carbon is 2–4 times greater than under reducing conditions. Oxidized carbon dioxide is dissolved as CO2�
3 complexes,whereas the dominant reduced species in melts are CH3-groups forming bonds with Si4+ together with molecular CH4. For-mation of CO2�
3 complexes results in silicate melt polymerization (decreasing NBO/Si), whereas solution of reduced carbonresults in depolymerization of melts (increasing NBO/Si).
Redox melting in the Earth’s interior has been explained with the aid of the different solution mechanisms of oxidized andreduced carbon in silicate melts. Further, effects of oxidized and reduced carbon on melt viscosity and on element partitioningbetween melts and minerals have been evaluated from relationships between melt polymerization and dissolved carbon com-bined with existing experimental data that link melt properties and melt polymerization. With total carbon contents in themelts on the order of several mol%, mineral/melt element partition coefficients and melt viscosity can change by several tensto several hundred percent with variable redox conditions in the range of the Earth’s deep crust and upper mantle.� 2011 Elsevier Ltd. All rights reserved.
1. INTRODUCTION
Carbon-bearing volatiles in the C–O–H system are thesecond-most abundant, after H2O, in the silicate earth(see review by Jambon, 1994). Among these volatiles CO2
and CH4 are dominant in the Earth’s deep crust and uppermantle, depending on redox conditions (e.g., Eggler andBaker, 1982; Kasting et al., 1993; Kadik et al., 2004). In
0016-7037/$ - see front matter � 2011 Elsevier Ltd. All rights reserved.
doi:10.1016/j.gca.2011.07.035
⇑ Corresponding author. Tel.: +1 202 478 8975; fax: +1 202 4788901.
E-mail address: [email protected] (B.O. Mysen).
the present-day relatively oxidized upper mantle (within1–2 orders of magnitude of that defined by the quartz-mag-netite-fayalite (QFM) buffer – see, for example, Mattioliand Wood, 1986; O’Neill, 1991; McCammon, 2005), it com-monly is assumed that CO2 dominates (e.g., Eggler, 1975;Mysen, 1976; Wyllie, 1984; Boettcher et al., 1987; Jambon,1994; Molina and Poli, 2000; Dasgupta and Hirschmann,2007). However, during the core-forming event of the veryyoung Earth, the oxygen fugacity, fO2, likely was near orbelow that of the iron-wustite (IW) buffer (e.g., O’Neill,1991; Righter et al., 1997; Gessmann and Rubie, 2000; Cha-bot and Agee, 2003) and the dominant C-bearing volatilespecies may have been methane, CH4 (Green et al., 1987;
0.0 0.2 0.4 0.6 0.8 1.0 1.2 1.4
20
10
0
NBO/T
Perc
ent
Andesitemelt Tholeiite
melt
NS2
NS2
.5
NS1
.3N
S4
0.0 0.2 0.4 0.6 0.8 1.0 1.2 1.4
SiO2 Na2ONa/Si
NS5
N3S
8
NS1
.7
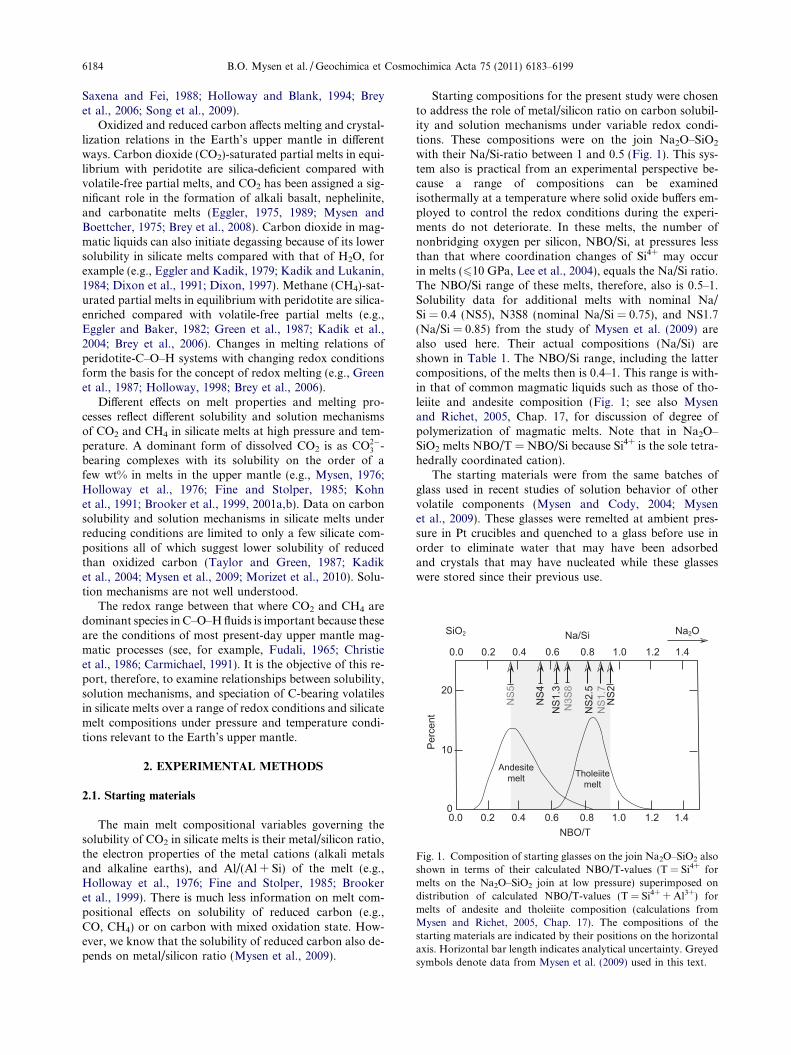
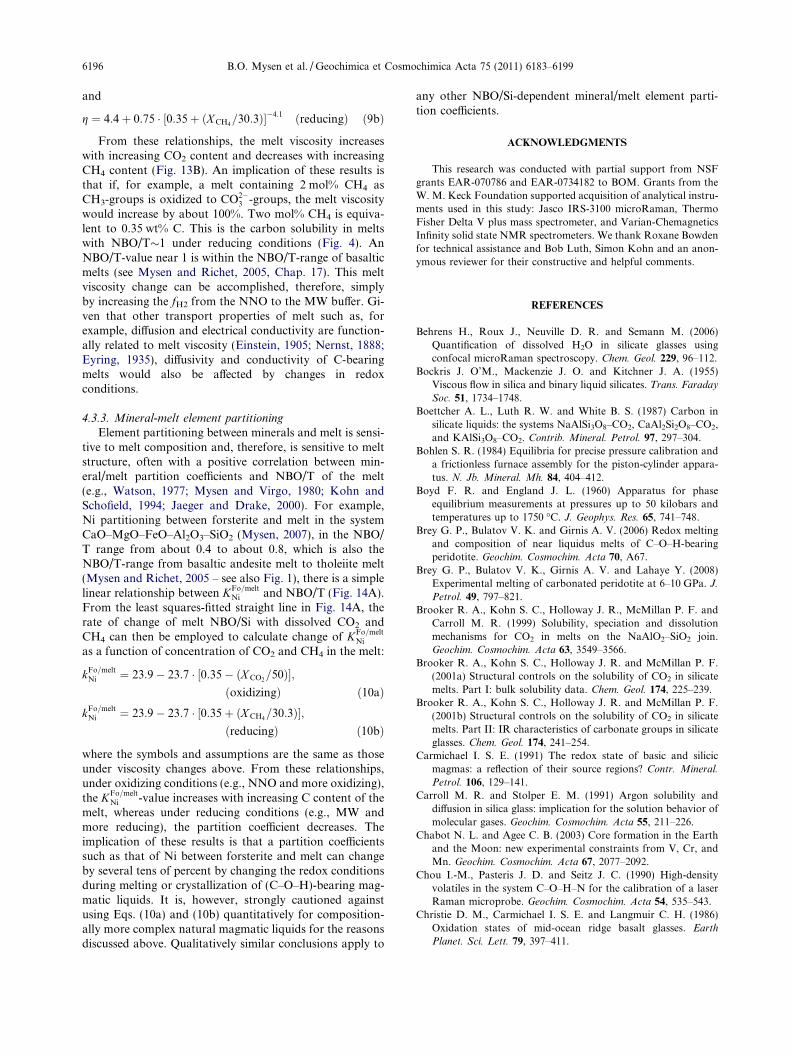
Fig. 1. Composition of starting glasses on the join Na2O–SiO2 alsoshown in terms of their calculated NBO/T-values (T = Si4+ formelts on the Na2O–SiO2 join at low pressure) superimposed ondistribution of calculated NBO/T-values (T = Si4+ + Al3+) formelts of andesite and tholeiite composition (calculations fromMysen and Richet, 2005, Chap. 17). The compositions of thestarting materials are indicated by their positions on the horizontalaxis. Horizontal bar length indicates analytical uncertainty. Greyedsymbols denote data from Mysen et al. (2009) used in this text.
6184 B.O. Mysen et al. / Geochimica et Cosmochimica Acta 75 (2011) 6183–6199
Saxena and Fei, 1988; Holloway and Blank, 1994; Breyet al., 2006; Song et al., 2009).
Oxidized and reduced carbon affects melting and crystal-lization relations in the Earth’s upper mantle in differentways. Carbon dioxide (CO2)-saturated partial melts in equi-librium with peridotite are silica-deficient compared withvolatile-free partial melts, and CO2 has been assigned a sig-nificant role in the formation of alkali basalt, nephelinite,and carbonatite melts (Eggler, 1975, 1989; Mysen andBoettcher, 1975; Brey et al., 2008). Carbon dioxide in mag-matic liquids can also initiate degassing because of its lowersolubility in silicate melts compared with that of H2O, forexample (e.g., Eggler and Kadik, 1979; Kadik and Lukanin,1984; Dixon et al., 1991; Dixon, 1997). Methane (CH4)-sat-urated partial melts in equilibrium with peridotite are silica-enriched compared with volatile-free partial melts (e.g.,Eggler and Baker, 1982; Green et al., 1987; Kadik et al.,2004; Brey et al., 2006). Changes in melting relations ofperidotite-C–O–H systems with changing redox conditionsform the basis for the concept of redox melting (e.g., Greenet al., 1987; Holloway, 1998; Brey et al., 2006).
Different effects on melt properties and melting pro-cesses reflect different solubility and solution mechanismsof CO2 and CH4 in silicate melts at high pressure and tem-perature. A dominant form of dissolved CO2 is as CO2�
3 -bearing complexes with its solubility on the order of afew wt% in melts in the upper mantle (e.g., Mysen, 1976;Holloway et al., 1976; Fine and Stolper, 1985; Kohnet al., 1991; Brooker et al., 1999, 2001a,b). Data on carbonsolubility and solution mechanisms in silicate melts underreducing conditions are limited to only a few silicate com-positions all of which suggest lower solubility of reducedthan oxidized carbon (Taylor and Green, 1987; Kadiket al., 2004; Mysen et al., 2009; Morizet et al., 2010). Solu-tion mechanisms are not well understood.
The redox range between that where CO2 and CH4 aredominant species in C–O–H fluids is important because theseare the conditions of most present-day upper mantle mag-matic processes (see, for example, Fudali, 1965; Christieet al., 1986; Carmichael, 1991). It is the objective of this re-port, therefore, to examine relationships between solubility,solution mechanisms, and speciation of C-bearing volatilesin silicate melts over a range of redox conditions and silicatemelt compositions under pressure and temperature condi-tions relevant to the Earth’s upper mantle.
2. EXPERIMENTAL METHODS
2.1. Starting materials
The main melt compositional variables governing thesolubility of CO2 in silicate melts is their metal/silicon ratio,the electron properties of the metal cations (alkali metalsand alkaline earths), and Al/(Al + Si) of the melt (e.g.,Holloway et al., 1976; Fine and Stolper, 1985; Brookeret al., 1999). There is much less information on melt com-positional effects on solubility of reduced carbon (e.g.,CO, CH4) or on carbon with mixed oxidation state. How-ever, we know that the solubility of reduced carbon also de-pends on metal/silicon ratio (Mysen et al., 2009).
Starting compositions for the present study were chosento address the role of metal/silicon ratio on carbon solubil-ity and solution mechanisms under variable redox condi-tions. These compositions were on the join Na2O–SiO2
with their Na/Si-ratio between 1 and 0.5 (Fig. 1). This sys-tem also is practical from an experimental perspective be-cause a range of compositions can be examinedisothermally at a temperature where solid oxide buffers em-ployed to control the redox conditions during the experi-ments do not deteriorate. In these melts, the number ofnonbridging oxygen per silicon, NBO/Si, at pressures lessthan that where coordination changes of Si4+ may occurin melts (610 GPa, Lee et al., 2004), equals the Na/Si ratio.The NBO/Si range of these melts, therefore, also is 0.5–1.Solubility data for additional melts with nominal Na/Si = 0.4 (NS5), N3S8 (nominal Na/Si = 0.75), and NS1.7(Na/Si = 0.85) from the study of Mysen et al. (2009) arealso used here. Their actual compositions (Na/Si) areshown in Table 1. The NBO/Si range, including the lattercompositions, of the melts then is 0.4–1. This range is with-in that of common magmatic liquids such as those of tho-leiite and andesite composition (Fig. 1; see also Mysenand Richet, 2005, Chap. 17, for discussion of degree ofpolymerization of magmatic melts. Note that in Na2O–SiO2 melts NBO/T = NBO/Si because Si4+ is the sole tetra-hedrally coordinated cation).
The starting materials were from the same batches ofglass used in recent studies of solution behavior of othervolatile components (Mysen and Cody, 2004; Mysenet al., 2009). These glasses were remelted at ambient pres-sure in Pt crucibles and quenched to a glass before use inorder to eliminate water that may have been adsorbedand crystals that may have nucleated while these glasseswere stored since their previous use.

Table 1Run data.
Comp. Na/Si Dur. min Buffera C solub wt.% Raman 1H MAS 13C MAS 1H13C CPMAS
NS2 0.92 ± 0.04 90 MH 2.03 ± 0.01 Y N Y YNS1.7 0.87c 90 MH 1.50 ± 0.21 N N N NNS2.5 0.8d 90 MH 1.11 ± 0.06 Y N N NNS1.3 0.63 ± 0.02 90 MH 0.84 ± 0.03 Y N Y YNS4 0.55 ± 0.02 5 MH 0.56 ± 0.03 Y N N NNS4 0.55 ± 0.02 15 MH 0.49 ± 0.03 Y N N NNS4 0.55 ± 0.02 30 MH 0.71 ± 0.06 Y N N NNS4 0.55 ± 0.02 60 MH 0.52 ± 0.03 Y N N NNS4 0.55 ± 0.02 90 MH 0.45 ± 0.02 Y Y Y NNS4 0.55 ± 0.02 90 NNO N Y Y Y NNS4 0.55 ± 0.02 90 MW N Y Y Y YNS4 0.55 ± 0.02 90 IW 0.20 ± 0.07b Y Y Y YNS5b 0.36 ± 0.02 90 IW 0.15 ± 0.03 Y N N NNS3S8b 0.69 ± 0.02 90 IW 0.22 ± 0.07 y N N NNS2b 0.92 ± 0.04 90 IW 0.32 ± 0.16 y N N N
a MH: magnetite–hematite, NNO: nickel–nickel oxide, MW: magnetite–wustite, IW: iron–wustite.b Mysen et al. (2009).c Mysen and Cody (2004).d Nominal.
C–O–H volatiles in silicate melts 6185
2.2. High-pressure experiments
Experiments at high temperature and pressure were con-ducted in the solid-media, high-pressure apparatus (Boydand England, 1960) with a 3/400-diameter furnace assembly(Kushiro, 1976). Pressure was calibrated with the calcite-aragonite and quartz-coesite transitions (Bohlen, 1984).The precision is <0.05 GPa and accuracy 60.1 GPa. Tem-perature was measured with Pt–Pt90Rh10 thermocoupleswith no pressure correction of their emf. Temperature pre-cision is ±1 �C. However, the accuracy is 610 �C becauseeffects of pressure on the emf of the thermocouples werenot taken into account (Getting and Kennedy, 1970; Maoet al., 1971). The experiments were terminated by turningoff the power to the furnace, which results in an averagecooling rate near 100 �C/s between experimental tempera-ture and about 500 �C.
Starting materials of crushed glass were loaded into3 mm-OD by 4–5 mm long Pt capsules. Carbon dioxidewas added to these samples as silver oxalate, Ag2C2O4
and welded shut. The sample/Ag2C2O4 wt ratio was main-tained at 4.75 (wt% C P 1.6 wt% in all experiments). Dur-ing heating to the temperature of a high-pressure/-temperature experiment (1.5 GPa/1400 �C), the Ag2C2O4
decomposes to metallic Ag and CO2 near 140 �C (see, My-sen and Boettcher, 1975). This Ag2C2O4 was enriched to99% 13C for use in carbon-13 NMR experiments. A parallelset of experiments was conducted without the 13C enrich-ment to prepare glasses for carbon concentrationmeasurements.
The sealed, sample-containing capsule was placed insidea 5 mm-diameter by 10 mm long Pt capsule together withoxide buffer materials and H2O to buffer the hydrogenfugacity, fH2. The capsules were then welded shut. ThefH2 of the inner, sample-containing capsule is the same asthat controlled by the buffer assemblage in the outer cap-sule because the Pt wall of the inner, sample-containing
capsule is permeable to H2 (e.g., Wones and Eugster,1962). An indicator that the buffer was not exhausted dur-ing an experiment is the presence of reactants, products,and H2O in the buffer assemblage after an experiment asdetermined with reflected-light examination of the buffermaterials in a petrographic microscope.
The hydrogen buffers were magnetite–hematite½2Fe3O4 þH2O� 3Fe2O3 þH2�, nickel–nickel oxide ½NiþH2O�NiOþH2� magnetite-wustite ½3FeOþH2O�Fe3
O4 þH2�, and iron-wustite ½FeþH2O�FeOþH2�. Thesebuffers will be referred to as MH, NNO, MW, and IW,respectively. The hydrogen fugacity controlled by thesereactions was calculated with the thermodynamic proper-ties of H2O using SUPCRIT92 and the oxygen fugacityof the buffers at high pressure and temperature from Hueb-ner (1971).
2.3. Chemical and structural analysis
Melts from the high temperature/-pressure experimentsquenched to glass. These glass samples were crushed to�10–30 lm grain size before carbon analysis to releasegas in bubbles that may have contained fluid from high-pressure experiment. The total carbon contents were ana-lyzed with an Elemental Analyzer (EA) of CE Instruments,NC 2500 series, using the same methods as described byMysen et al. (2009).
Structural examination was carried out with NMR andRaman spectroscopic methods. The Raman spectrometerwas a Jasco model IRS-3100 confocal microRaman spec-trometer with sample excitation by means of the 532 nmline of a solid state laser operating at about 7 mW at thesample together with a 100� objective lens (N.A. = 0.90)for visual microscopic examination and spectroscopicanalysis. An Andor Model DV401-F1 1024 � 128 pixel(25 lm pixel size) Peltier-cooled CCD was employed forsignal detection. With the 600 gratings/mm used, a
Inte
nsity
240020001600Frequency, cm-1
Car
bon
(gra
phite
)
Car
bon
(gra
phite
)
A B
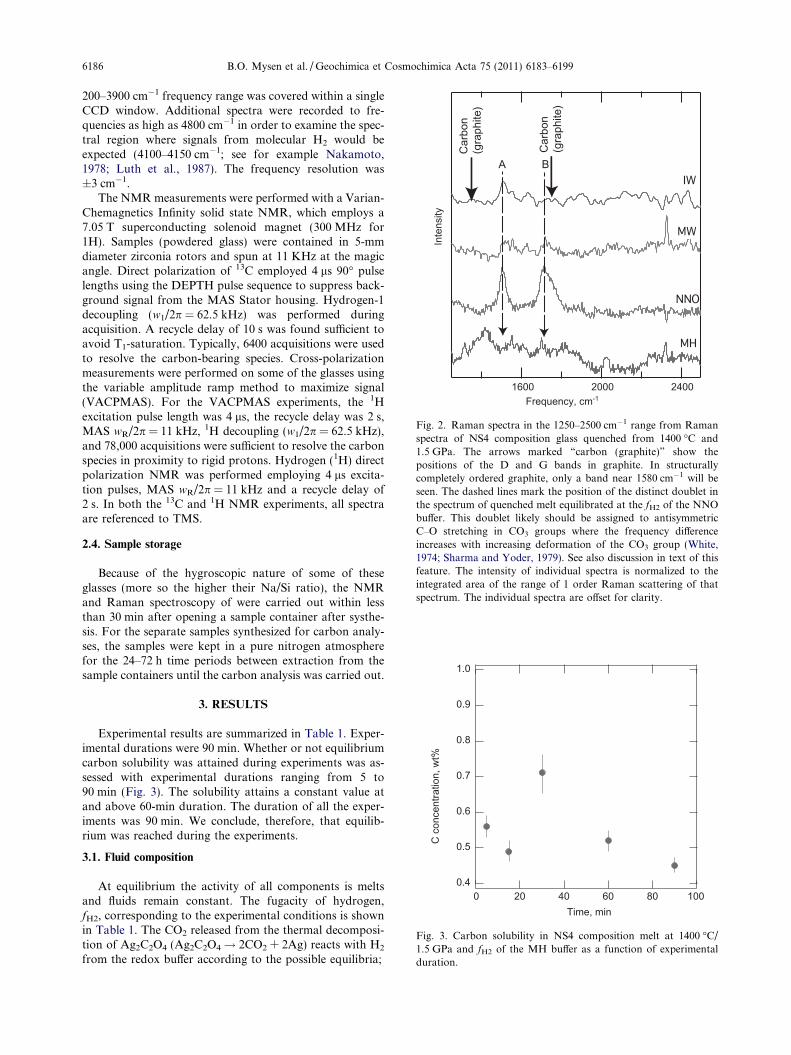
Fig. 2. Raman spectra in the 1250–2500 cm�1 range from Ramanspectra of NS4 composition glass quenched from 1400 �C and1.5 GPa. The arrows marked “carbon (graphite)” show thepositions of the D and G bands in graphite. In structurallycompletely ordered graphite, only a band near 1580 cm�1 will beseen. The dashed lines mark the position of the distinct doublet inthe spectrum of quenched melt equilibrated at the fH2 of the NNObuffer. This doublet likely should be assigned to antisymmetricC–O stretching in CO3 groups where the frequency differenceincreases with increasing deformation of the CO3 group (White,1974; Sharma and Yoder, 1979). See also discussion in text of thisfeature. The intensity of individual spectra is normalized to theintegrated area of the range of 1 order Raman scattering of thatspectrum. The individual spectra are offset for clarity.
1.0
0.9
0.8
0.7
0.6
0.5
0.4100806040200
C c
once
ntra
tion,
wt%
Time, min
Fig. 3. Carbon solubility in NS4 composition melt at 1400 �C/1.5 GPa and fH2 of the MH buffer as a function of experimentalduration.
6186 B.O. Mysen et al. / Geochimica et Cosmochimica Acta 75 (2011) 6183–6199
200–3900 cm�1 frequency range was covered within a singleCCD window. Additional spectra were recorded to fre-quencies as high as 4800 cm�1 in order to examine the spec-tral region where signals from molecular H2 would beexpected (4100–4150 cm�1; see for example Nakamoto,1978; Luth et al., 1987). The frequency resolution was±3 cm�1.
The NMR measurements were performed with a Varian-Chemagnetics Infinity solid state NMR, which employs a7.05 T superconducting solenoid magnet (300 MHz for1H). Samples (powdered glass) were contained in 5-mmdiameter zirconia rotors and spun at 11 KHz at the magicangle. Direct polarization of 13C employed 4 ls 90� pulselengths using the DEPTH pulse sequence to suppress back-ground signal from the MAS Stator housing. Hydrogen-1decoupling (w1/2p = 62.5 kHz) was performed duringacquisition. A recycle delay of 10 s was found sufficient toavoid T1-saturation. Typically, 6400 acquisitions were usedto resolve the carbon-bearing species. Cross-polarizationmeasurements were performed on some of the glasses usingthe variable amplitude ramp method to maximize signal(VACPMAS). For the VACPMAS experiments, the 1Hexcitation pulse length was 4 ls, the recycle delay was 2 s,MAS wR/2p = 11 kHz, 1H decoupling (w1/2p = 62.5 kHz),and 78,000 acquisitions were sufficient to resolve the carbonspecies in proximity to rigid protons. Hydrogen (1H) directpolarization NMR was performed employing 4 ls excita-tion pulses, MAS wR/2p = 11 kHz and a recycle delay of2 s. In both the 13C and 1H NMR experiments, all spectraare referenced to TMS.
2.4. Sample storage
Because of the hygroscopic nature of some of theseglasses (more so the higher their Na/Si ratio), the NMRand Raman spectroscopy of were carried out within lessthan 30 min after opening a sample container after systhe-sis. For the separate samples synthesized for carbon analy-ses, the samples were kept in a pure nitrogen atmospherefor the 24–72 h time periods between extraction from thesample containers until the carbon analysis was carried out.
3. RESULTS
Experimental results are summarized in Table 1. Exper-imental durations were 90 min. Whether or not equilibriumcarbon solubility was attained during experiments was as-sessed with experimental durations ranging from 5 to90 min (Fig. 3). The solubility attains a constant value atand above 60-min duration. The duration of all the exper-iments was 90 min. We conclude, therefore, that equilib-rium was reached during the experiments.
3.1. Fluid composition
At equilibrium the activity of all components is meltsand fluids remain constant. The fugacity of hydrogen,fH2, corresponding to the experimental conditions is shownin Table 1. The CO2 released from the thermal decomposi-tion of Ag2C2O4 (Ag2C2O4! 2CO2 + 2Ag) reacts with H2
from the redox buffer according to the possible equilibria;
2.0
1.6
1.2
0.8
0.4
C c
once
ntra
tion,
wt%
1.00.80.60.4
NBO/Si
A (MH)
1.00.80.6Na/Si
0.5
0.4
0.3
0.2
0.1
C c
once
ntra
tion,
wt%
1.00.80.60.4NBO/Si
B (IW)
0.4
1.00.80.6
Na/Si
Thibault andHolloway (1994)
Kadik et al. (2004)
Leas
t squ
ares
fit
(Bro
oker
et a
l., 20
01a)
Taylor and Green (1987)
Mysen et al. (2009)
0.5
0.4
0.3
0.2
0.1
( )
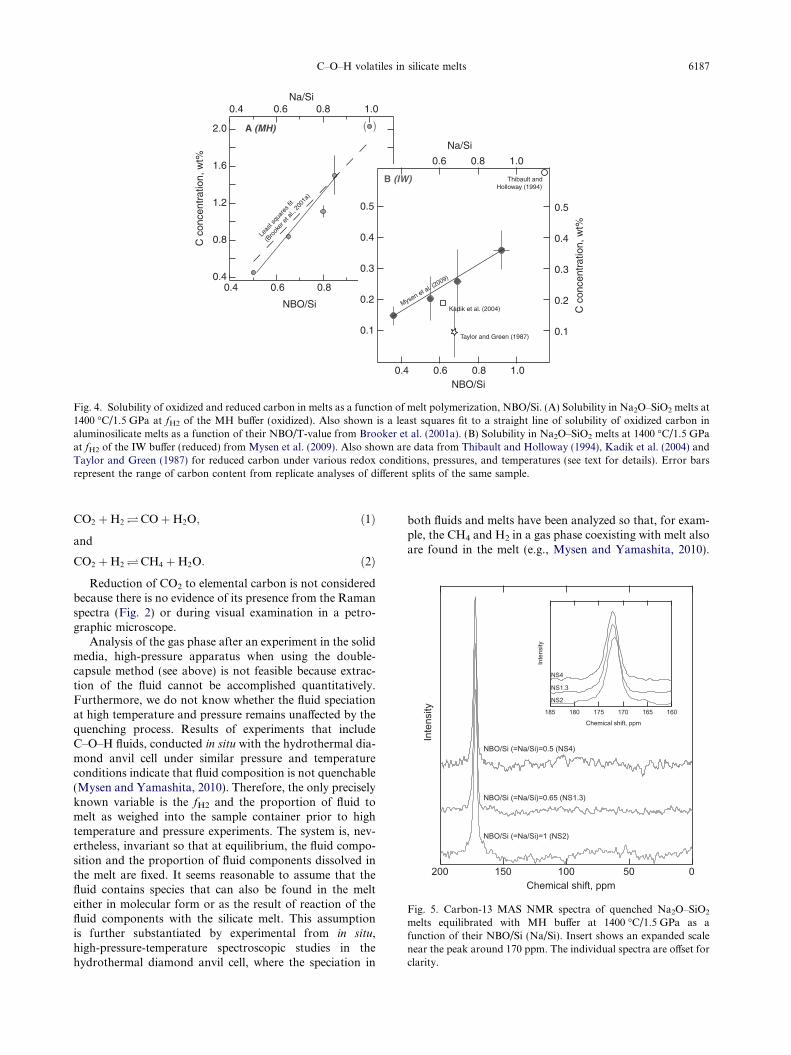
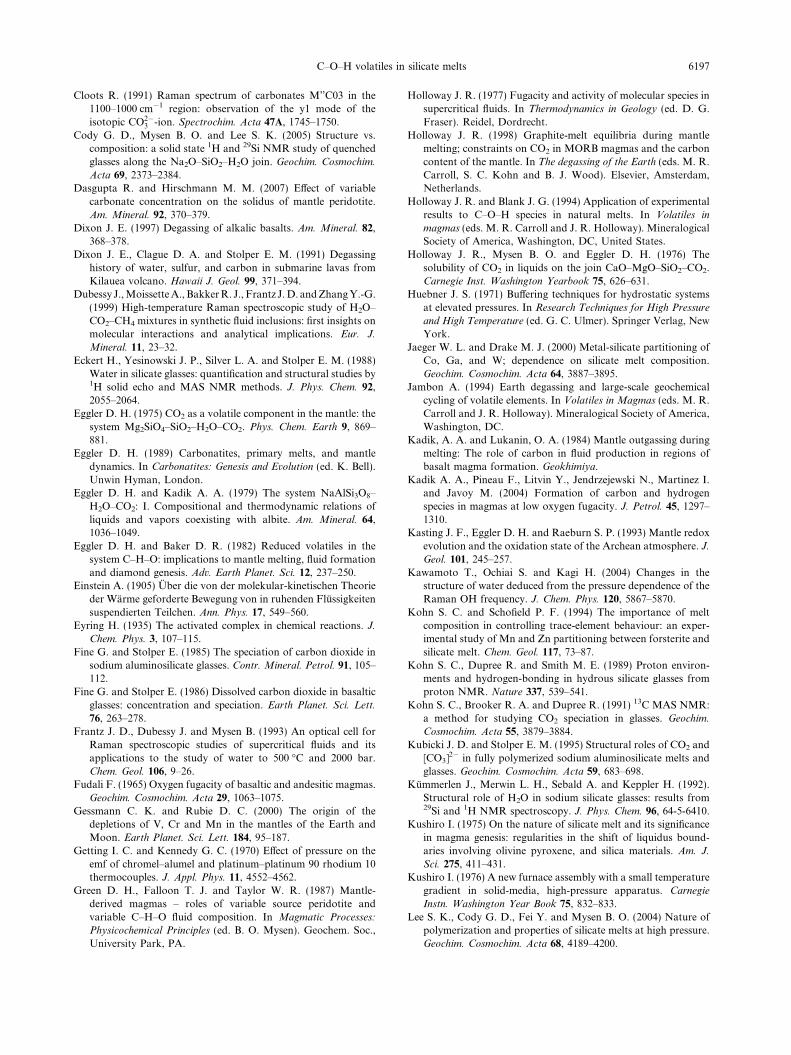
Fig. 4. Solubility of oxidized and reduced carbon in melts as a function of melt polymerization, NBO/Si. (A) Solubility in Na2O–SiO2 melts at1400 �C/1.5 GPa at fH2 of the MH buffer (oxidized). Also shown is a least squares fit to a straight line of solubility of oxidized carbon inaluminosilicate melts as a function of their NBO/T-value from Brooker et al. (2001a). (B) Solubility in Na2O–SiO2 melts at 1400 �C/1.5 GPaat fH2 of the IW buffer (reduced) from Mysen et al. (2009). Also shown are data from Thibault and Holloway (1994), Kadik et al. (2004) andTaylor and Green (1987) for reduced carbon under various redox conditions, pressures, and temperatures (see text for details). Error barsrepresent the range of carbon content from replicate analyses of different splits of the same sample.
Inte
nsity
200 150 100 50 0Chemical shift, ppm
Inte
nsity
185 180 175 170 165 160
Chemical shift, ppm
NBO/Si (=Na/Si)=0.5 (NS4)
NBO/Si (=Na/Si)=0.65 (NS1.3)
NBO/Si (=Na/Si)=1 (NS2)
NS2
NS1.3
NS4
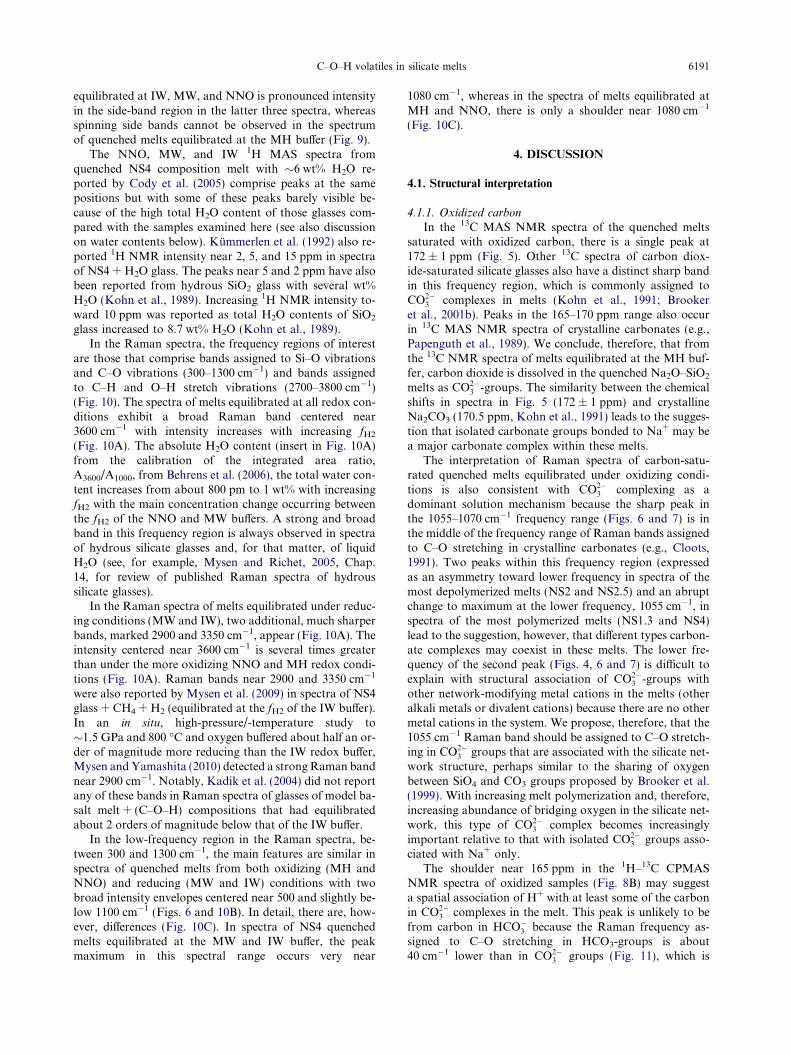
Fig. 5. Carbon-13 MAS NMR spectra of quenched Na2O–SiO2
melts equilibrated with MH buffer at 1400 �C/1.5 GPa as afunction of their NBO/Si (Na/Si). Insert shows an expanded scalenear the peak around 170 ppm. The individual spectra are offset forclarity.
C–O–H volatiles in silicate melts 6187
CO2 þH2�COþH2O; ð1Þ
and
CO2 þH2�CH4 þH2O: ð2Þ
Reduction of CO2 to elemental carbon is not consideredbecause there is no evidence of its presence from the Ramanspectra (Fig. 2) or during visual examination in a petro-graphic microscope.
Analysis of the gas phase after an experiment in the solidmedia, high-pressure apparatus when using the double-capsule method (see above) is not feasible because extrac-tion of the fluid cannot be accomplished quantitatively.Furthermore, we do not know whether the fluid speciationat high temperature and pressure remains unaffected by thequenching process. Results of experiments that includeC–O–H fluids, conducted in situ with the hydrothermal dia-mond anvil cell under similar pressure and temperatureconditions indicate that fluid composition is not quenchable(Mysen and Yamashita, 2010). Therefore, the only preciselyknown variable is the fH2 and the proportion of fluid tomelt as weighed into the sample container prior to hightemperature and pressure experiments. The system is, nev-ertheless, invariant so that at equilibrium, the fluid compo-sition and the proportion of fluid components dissolved inthe melt are fixed. It seems reasonable to assume that thefluid contains species that can also be found in the melteither in molecular form or as the result of reaction of thefluid components with the silicate melt. This assumptionis further substantiated by experimental from in situ,high-pressure-temperature spectroscopic studies in thehydrothermal diamond anvil cell, where the speciation in
both fluids and melts have been analyzed so that, for exam-ple, the CH4 and H2 in a gas phase coexisting with melt alsoare found in the melt (e.g., Mysen and Yamashita, 2010).

NBO/Si (=Na/Si)=0.55 (NS4)
NBO/Si (=Na/Si)=0.63(NS1.3)
NBO/Si (=Na/Si)=0.8 (NS2.5)
NBO/Si (=Na/Si)=0.92 (NS2)
Inte
nsity
1200800400Frequency, cm-1
NB=
NB=
N
N
Inte
nsity
120011001000900Frequency, cm-1
NBO/Si (=Na/Si)=0.555 (NS4)
NBO/Si (=Na/Si)=0.63 (NS1.3)
NBO/Si (=Na/Si)=0.8 (NS2.5)
NBO/Si (=Na/Si)=0.92 (NS2)
A B
Fig. 6. Raman spectra of quenched Na2O–SiO2 melts equilibrated with MH buffer at 1400 �C/1.5 GPa as a function of their NBO/Si (Na/Si)in the 300–1300 cm�1 frequency range. Also shown (dashed lines) are the spectra of the same composition quenched melts equilibrated at thesame temperature and pressure, but without dissolved carbon. The intensity of individual spectra is normalized to the integrated area of therange of 1, order Raman scattering of that spectrum. The individual spectra are offset for clarity.
Inte
nsity
diff
eren
ce
12001150110010501000950900Frequency, cm-1
NBO/Si (=Na/Si)=0.55 (NS4)
NBO/Si (=Na/Si)=0.63 (NS1.3)
NBO/Si (=Na/Si)=0.8 (NS2.5)
NBO/Si (=Na/Si)=0.92 (NS2)
Fig. 7. A. Difference spectra of quenched Na2O–SiO2 meltsequilibrated with MH buffer at 1400 �C/1.5 GPa as a function oftheir NBO/Si (Na/Si) in the 900–1200 cm�1 frequency range(original spectra are shown in Fig. 6). The difference spectra wereobtained by subtracting the spectra of C-free melts (dashed lines inFig. 6) from the spectra of the same melts, but saturated withoxidized C (solid lines in Fig. 6).
6188 B.O. Mysen et al. / Geochimica et Cosmochimica Acta 75 (2011) 6183–6199
Similarly, dissolved H2O (or OH) and CO2 (or CO3, orboth) in melts reflects the presence of the same gas compo-nents in coexisting fluid (e.g., Mysen, 2009).
3.2. Carbon solubility
The solubility of oxidized (at the MH buffer) and re-duced (at the IW buffer) carbon, calculated as elementalcarbon, is positively correlated with NBO/Si of the melt(Fig. 4). Note, however, that the measured carbon contentof oxidized (MH buffer) carbon in the NS2 glass exceeds byabout 0.4 wt% the amount of carbon added to the startingmaterial. The excess carbon probably is because some ofthe gas bubbles exsolved during quenching to a glass (seeabove) were not released during glass crushing. Becausethe quench bubble distribution in quenched glasses is nothomogeneous and such bubbles are particularly commonin the most Na-rich quenched melts, it is indeed possiblethe analyzed samples could have excess carbon content ofthat added because the analytical method is a bulk method.For this reason, the solubility of oxidized carbon in NS2composition glass is shown in parentheses in Fig. 4A.
Positive correlation of carbon solubility (i.e., CO2) withNBO/Si of the melt under oxidizing conditions resemblesthat observed in other systems (CaO–SiO2; Hollowayet al., 1976; Na2O–CaO–MgO–Al2O3–SiO2; Brookeret al., 2001a). The solubility of oxidized carbon (Fig. 4A)is significantly more sensitive to melt polymerization(NBO/Si) than that of reduced carbon (Fig. 4B). Thedashed line in Fig. 4A, which is a least-squares linear fitto the experimental data of Brooker et al. (2001a), is essen-tially the same as for melts along the compositionally sim-pler join Na2O–SiO2 even though the melts in the Brookeret al. (2001a) study contained both Al3+ and Ca2+, whichcan affect CO2 solubility.
The solubility of reduced (IW) carbon is 20–80% lowerthan carbon solubility determined under oxidizing condi-tions (MH) at the same temperature and pressure
(Fig. 4A and B). To the knowledge of the author, there existno other experimental data on solubility of reduced carbonin silicate melts at similar temperature, pressure, redox andcompositional conditions with which to compare the pres-ent data. Among the data that do exist, those of Kadiket al. (2004) and Taylor and Green (1987) (Fig. 4B) wereobtained under more reducing condition (�2 log units morereducing than that of the IW buffer), whereas those of Thi-bault and Holloway (1994) were obtained with the oxygenfugacity about 3 orders of magnitude more oxidizing thanthat of the IW buffer as were those of Morizet et al.
Inte
nsity
200 150 100 50 0Chemical shift, ppm
Inte
nsity
20 10 0 -10 -20
Chemical shift, ppmIn
tens
ity190 180 170 160 150
Chemical shift, ppm
IW
MW
NNO
MH
IW
MW
NNO
MH
insert A insert B
A B
Inte
nsity
200 150 100 50 0Chemical shift, ppm
IW
MW
MH
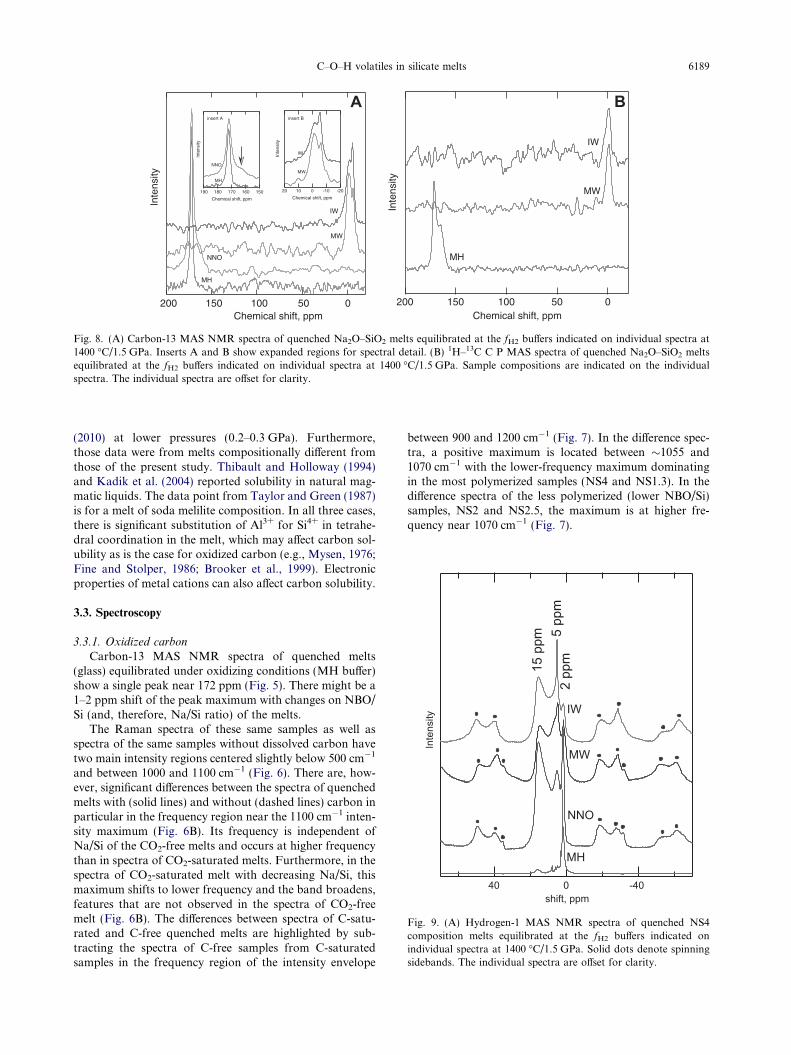
Fig. 8. (A) Carbon-13 MAS NMR spectra of quenched Na2O–SiO2 melts equilibrated at the fH2 buffers indicated on individual spectra at1400 �C/1.5 GPa. Inserts A and B show expanded regions for spectral detail. (B) 1H–13C C P MAS spectra of quenched Na2O–SiO2 meltsequilibrated at the fH2 buffers indicated on individual spectra at 1400 �C/1.5 GPa. Sample compositions are indicated on the individualspectra. The individual spectra are offset for clarity.
IW
MW
NNO
2 pp
m5
ppm
15 p
pm
Inte
nsity
40 0 -40shift, ppm
MH
Fig. 9. (A) Hydrogen-1 MAS NMR spectra of quenched NS4composition melts equilibrated at the fH2 buffers indicated onindividual spectra at 1400 �C/1.5 GPa. Solid dots denote spinningsidebands. The individual spectra are offset for clarity.
C–O–H volatiles in silicate melts 6189
(2010) at lower pressures (0.2–0.3 GPa). Furthermore,those data were from melts compositionally different fromthose of the present study. Thibault and Holloway (1994)and Kadik et al. (2004) reported solubility in natural mag-matic liquids. The data point from Taylor and Green (1987)is for a melt of soda melilite composition. In all three cases,there is significant substitution of Al3+ for Si4+ in tetrahe-dral coordination in the melt, which may affect carbon sol-ubility as is the case for oxidized carbon (e.g., Mysen, 1976;Fine and Stolper, 1986; Brooker et al., 1999). Electronicproperties of metal cations can also affect carbon solubility.
3.3. Spectroscopy
3.3.1. Oxidized carbon
Carbon-13 MAS NMR spectra of quenched melts(glass) equilibrated under oxidizing conditions (MH buffer)show a single peak near 172 ppm (Fig. 5). There might be a1–2 ppm shift of the peak maximum with changes on NBO/Si (and, therefore, Na/Si ratio) of the melts.
The Raman spectra of these same samples as well asspectra of the same samples without dissolved carbon havetwo main intensity regions centered slightly below 500 cm�1
and between 1000 and 1100 cm�1 (Fig. 6). There are, how-ever, significant differences between the spectra of quenchedmelts with (solid lines) and without (dashed lines) carbon inparticular in the frequency region near the 1100 cm�1 inten-sity maximum (Fig. 6B). Its frequency is independent ofNa/Si of the CO2-free melts and occurs at higher frequencythan in spectra of CO2-saturated melts. Furthermore, in thespectra of CO2-saturated melt with decreasing Na/Si, thismaximum shifts to lower frequency and the band broadens,features that are not observed in the spectra of CO2-freemelt (Fig. 6B). The differences between spectra of C-satu-rated and C-free quenched melts are highlighted by sub-tracting the spectra of C-free samples from C-saturatedsamples in the frequency region of the intensity envelope
between 900 and 1200 cm�1 (Fig. 7). In the difference spec-tra, a positive maximum is located between �1055 and1070 cm�1 with the lower-frequency maximum dominatingin the most polymerized samples (NS4 and NS1.3). In thedifference spectra of the less polymerized (lower NBO/Si)samples, NS2 and NS2.5, the maximum is at higher fre-quency near 1070 cm�1 (Fig. 7).
6190 B.O. Mysen et al. / Geochimica et Cosmochimica Acta 75 (2011) 6183–6199
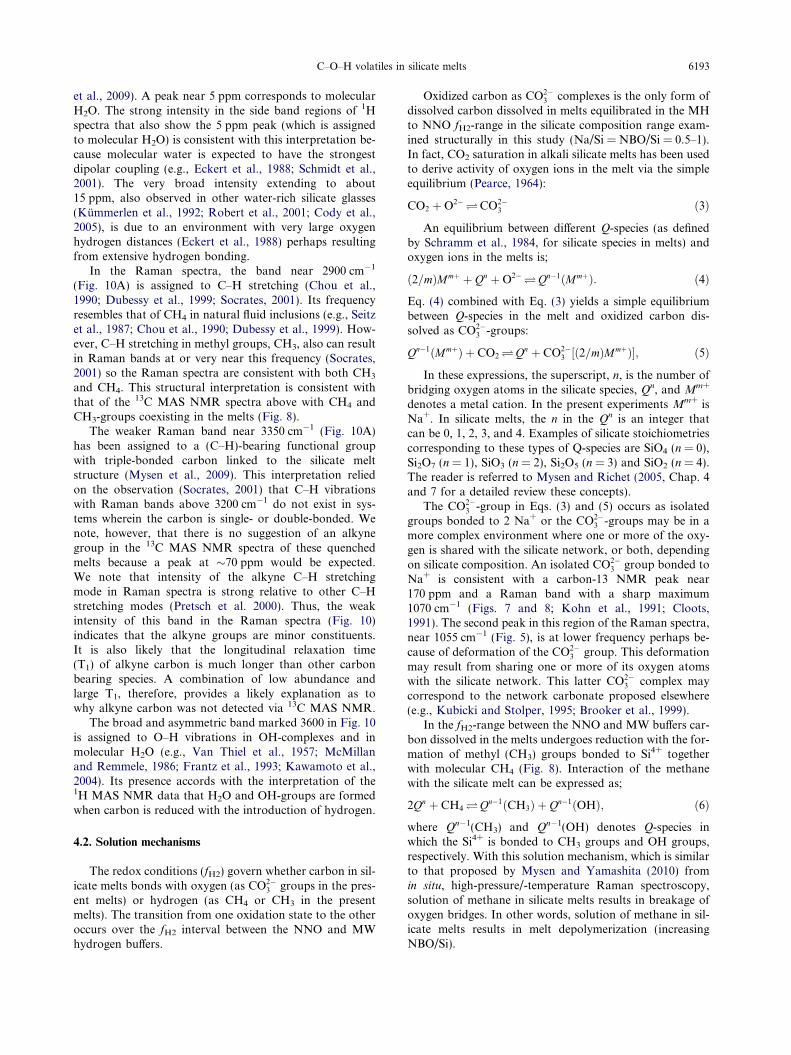
3.3.2. Variable redox conditions
In the 13C MAS NMR spectra of quenched NS4 melt atthe fH2 of the MH and NNO buffers, the peak near 170 ppmdominates (Fig. 8). By increasing the fH2 from the MH tothe NNO buffer, however, a shoulder appears near165 ppm (arrow in Fig. 8A). The 1H–13C CPMAS spectraof the same glasses are also dominated by the peak near170 ppm. There is also a weaker shoulder near 165 ppm(Fig. 8B). A further increase of fH2 to that of the MW re-sults in a completely changed 13C MAS NMR spectrumwith two peaks near �6 and �2 ppm, respectively, and noother peaks (see also inserts A and B of Fig. 8A for expan-sion of the relevant regions of the 13C MAS NMR spectra).A further fH2 increase to the IW buffer may change therelative intensities of these two peaks, but not theirchemical shifts (see insert B; Fig. 8A). Spectra from
Inte
nsity
32002800Frequen
2900
MH
NNO
MW
IW
Inte
nsity
12001000800600400Frequency, cm-1
MH
NNO
MW
IW
N
M
M
IW
B
0.30
0.25
0.20
0.15
0.10
0.05
0.00
A 360
0/A10
00
3210-1log fH2
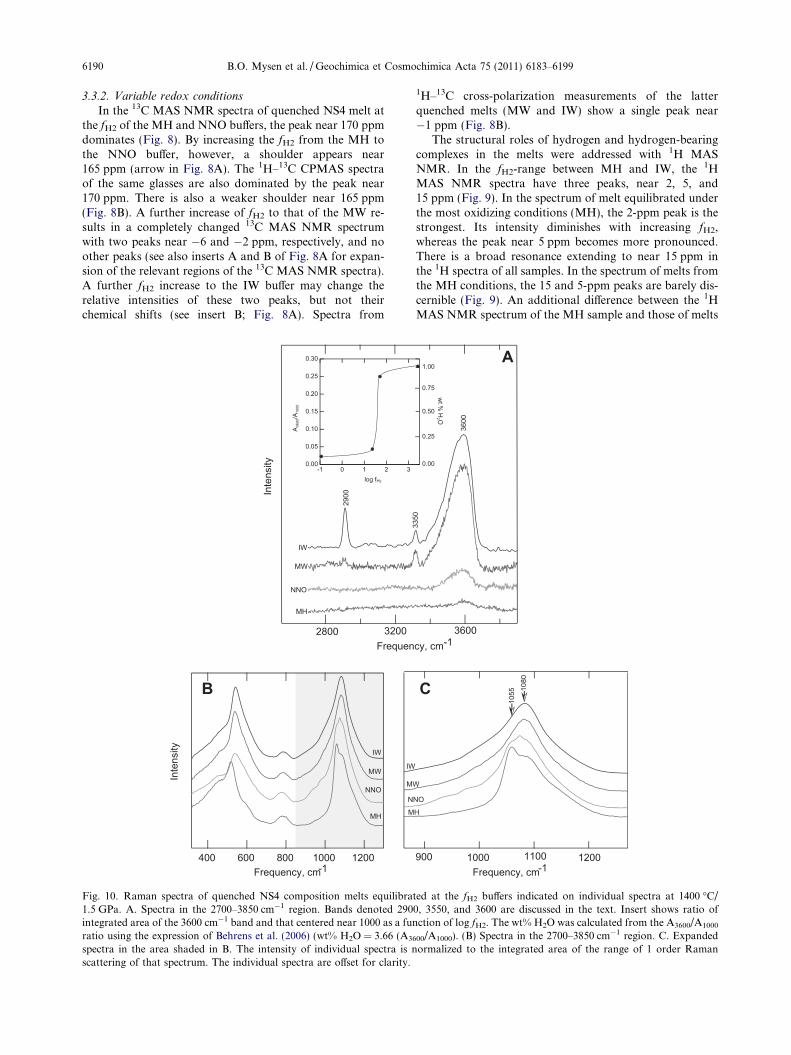
Fig. 10. Raman spectra of quenched NS4 composition melts equilibra1.5 GPa. A. Spectra in the 2700–3850 cm�1 region. Bands denoted 290integrated area of the 3600 cm�1 band and that centered near 1000 as a funratio using the expression of Behrens et al. (2006) (wt% H2O = 3.66 (A36
spectra in the area shaded in B. The intensity of individual spectra is nscattering of that spectrum. The individual spectra are offset for clarity.
1H–13C cross-polarization measurements of the latterquenched melts (MW and IW) show a single peak near�1 ppm (Fig. 8B).
The structural roles of hydrogen and hydrogen-bearingcomplexes in the melts were addressed with 1H MASNMR. In the fH2-range between MH and IW, the 1HMAS NMR spectra have three peaks, near 2, 5, and15 ppm (Fig. 9). In the spectrum of melt equilibrated underthe most oxidizing conditions (MH), the 2-ppm peak is thestrongest. Its intensity diminishes with increasing fH2,whereas the peak near 5 ppm becomes more pronounced.There is a broad resonance extending to near 15 ppm inthe 1H spectra of all samples. In the spectrum of melts fromthe MH conditions, the 15 and 5-ppm peaks are barely dis-cernible (Fig. 9). An additional difference between the 1HMAS NMR spectrum of the MH sample and those of melts
3600cy, cm-1
3350
3600
120011001000900
NO
H
W
1055 10
80
Frequency, cm-1
A
C
wt %
H2 O
0.25
0.50
0.75
1.00
0.00
ted at the fH2 buffers indicated on individual spectra at 1400 �C/0, 3550, and 3600 are discussed in the text. Insert shows ratio ofction of log fH2. The wt% H2O was calculated from the A3600/A1000
00/A1000). (B) Spectra in the 2700–3850 cm�1 region. C. Expandedormalized to the integrated area of the range of 1 order Raman
C–O–H volatiles in silicate melts 6191
equilibrated at IW, MW, and NNO is pronounced intensityin the side-band region in the latter three spectra, whereasspinning side bands cannot be observed in the spectrumof quenched melts equilibrated at the MH buffer (Fig. 9).
The NNO, MW, and IW 1H MAS spectra fromquenched NS4 composition melt with �6 wt% H2O re-ported by Cody et al. (2005) comprise peaks at the samepositions but with some of these peaks barely visible be-cause of the high total H2O content of those glasses com-pared with the samples examined here (see also discussionon water contents below). Kummerlen et al. (1992) also re-ported 1H NMR intensity near 2, 5, and 15 ppm in spectraof NS4 + H2O glass. The peaks near 5 and 2 ppm have alsobeen reported from hydrous SiO2 glass with several wt%H2O (Kohn et al., 1989). Increasing 1H NMR intensity to-ward 10 ppm was reported as total H2O contents of SiO2
glass increased to 8.7 wt% H2O (Kohn et al., 1989).In the Raman spectra, the frequency regions of interest
are those that comprise bands assigned to Si–O vibrationsand C–O vibrations (300–1300 cm�1) and bands assignedto C–H and O–H stretch vibrations (2700–3800 cm�1)(Fig. 10). The spectra of melts equilibrated at all redox con-ditions exhibit a broad Raman band centered near3600 cm�1 with intensity increases with increasing fH2
(Fig. 10A). The absolute H2O content (insert in Fig. 10A)from the calibration of the integrated area ratio,A3600/A1000, from Behrens et al. (2006), the total water con-tent increases from about 800 pm to 1 wt% with increasingfH2 with the main concentration change occurring betweenthe fH2 of the NNO and MW buffers. A strong and broadband in this frequency region is always observed in spectraof hydrous silicate glasses and, for that matter, of liquidH2O (see, for example, Mysen and Richet, 2005, Chap.14, for review of published Raman spectra of hydroussilicate glasses).
In the Raman spectra of melts equilibrated under reduc-ing conditions (MW and IW), two additional, much sharperbands, marked 2900 and 3350 cm�1, appear (Fig. 10A). Theintensity centered near 3600 cm�1 is several times greaterthan under the more oxidizing NNO and MH redox condi-tions (Fig. 10A). Raman bands near 2900 and 3350 cm�1
were also reported by Mysen et al. (2009) in spectra of NS4glass + CH4 + H2 (equilibrated at the fH2 of the IW buffer).In an in situ, high-pressure/-temperature study to�1.5 GPa and 800 �C and oxygen buffered about half an or-der of magnitude more reducing than the IW redox buffer,Mysen and Yamashita (2010) detected a strong Raman bandnear 2900 cm�1. Notably, Kadik et al. (2004) did not reportany of these bands in Raman spectra of glasses of model ba-salt melt + (C–O–H) compositions that had equilibratedabout 2 orders of magnitude below that of the IW buffer.
In the low-frequency region in the Raman spectra, be-tween 300 and 1300 cm�1, the main features are similar inspectra of quenched melts from both oxidizing (MH andNNO) and reducing (MW and IW) conditions with twobroad intensity envelopes centered near 500 and slightly be-low 1100 cm�1 (Figs. 6 and 10B). In detail, there are, how-ever, differences (Fig. 10C). In spectra of NS4 quenchedmelts equilibrated at the MW and IW buffer, the peakmaximum in this spectral range occurs very near
1080 cm�1, whereas in the spectra of melts equilibrated atMH and NNO, there is only a shoulder near 1080 cm�1
(Fig. 10C).
4. DISCUSSION
4.1. Structural interpretation
4.1.1. Oxidized carbon
In the 13C MAS NMR spectra of the quenched meltssaturated with oxidized carbon, there is a single peak at172 ± 1 ppm (Fig. 5). Other 13C spectra of carbon diox-ide-saturated silicate glasses also have a distinct sharp bandin this frequency region, which is commonly assigned toCO2�
3 complexes in melts (Kohn et al., 1991; Brookeret al., 2001b). Peaks in the 165–170 ppm range also occurin 13C MAS NMR spectra of crystalline carbonates (e.g.,Papenguth et al., 1989). We conclude, therefore, that fromthe 13C NMR spectra of melts equilibrated at the MH buf-fer, carbon dioxide is dissolved in the quenched Na2O–SiO2
melts as CO2�3 -groups. The similarity between the chemical
shifts in spectra in Fig. 5 (172 ± 1 ppm) and crystallineNa2CO3 (170.5 ppm, Kohn et al., 1991) leads to the sugges-tion that isolated carbonate groups bonded to Na+ may bea major carbonate complex within these melts.
The interpretation of Raman spectra of carbon-satu-rated quenched melts equilibrated under oxidizing condi-tions is also consistent with CO2�
3 complexing as adominant solution mechanism because the sharp peak inthe 1055–1070 cm�1 frequency range (Figs. 6 and 7) is inthe middle of the frequency range of Raman bands assignedto C–O stretching in crystalline carbonates (e.g., Cloots,1991). Two peaks within this frequency region (expressedas an asymmetry toward lower frequency in spectra of themost depolymerized melts (NS2 and NS2.5) and an abruptchange to maximum at the lower frequency, 1055 cm�1, inspectra of the most polymerized melts (NS1.3 and NS4)lead to the suggestion, however, that different types carbon-ate complexes may coexist in these melts. The lower fre-quency of the second peak (Figs. 4, 6 and 7) is difficult toexplain with structural association of CO2�
3 -groups withother network-modifying metal cations in the melts (otheralkali metals or divalent cations) because there are no othermetal cations in the system. We propose, therefore, that the1055 cm�1 Raman band should be assigned to C–O stretch-ing in CO2�
3 groups that are associated with the silicate net-work structure, perhaps similar to the sharing of oxygenbetween SiO4 and CO3 groups proposed by Brooker et al.(1999). With increasing melt polymerization and, therefore,increasing abundance of bridging oxygen in the silicate net-work, this type of CO2�
3 complex becomes increasinglyimportant relative to that with isolated CO2�
3 groups asso-ciated with Na+ only.
The shoulder near 165 ppm in the 1H–13C CPMASNMR spectra of oxidized samples (Fig. 8B) may suggesta spatial association of H+ with at least some of the carbonin CO2�
3 complexes in the melt. This peak is unlikely to befrom carbon in HCO�3 because the Raman frequency as-signed to C–O stretching in HCO3-groups is about40 cm�1 lower than in CO2�
3 groups (Fig. 11), which is

6192 B.O. Mysen et al. / Geochimica et Cosmochimica Acta 75 (2011) 6183–6199
not observed in the Raman spectra of MH and NNOquenched melts (Fig. 10). The spatial association of 1Hand 13C inferred from the 1H–13C CPMAS NMR spectrareflects only transfer of magnetization from the 1H to the13C nucleus and not necessarily chemical bonding of pro-tons with carbon (as in HCO�3 complexes). The Ramanspectrum of NS4 composition melt both at MH andNNO show a doublet (near 1400 cm�1 and 1700 cm�1,respectively) (Fig. 2) that can be assigned to antisymmetricC–O stretching in CO3 complexes (White, 1974; Sharmaand Yoder, 1979) where the frequency separation of thetwo bands in this doublet is a measure of deformation ofthe CO3 group (White, 1974; Sharma and Yoder, 1979).The intensity from the NNO sample is the most intense,which is consistent with greater relative abundance of thisCO3 group in the quenched melts from the redox conditionsof NNO.
In highly polymerized melts such as those along the joinNaAlO2–SiO2, molecular CO2 is also dissolved (e.g., Fineand Stolper, 1985; Kohn et al., 1991; Brooker et al.,1999). In the 13C MAS NMR spectra, molecular CO2
would be manifested in a sharp peak near 125 ppm (Kohnet al., 1991), which is not observed. The Fermi doublet inthe Raman spectra at 1280 and 1360 cm�1, also diagnosticof molecular CO2, is not seen either. The absence of molec-ular CO2 in these melts probably is because these are con-siderably more depolymerized than those in which CO2
molecules have been detected.
4.1.2. Variable redox conditions
In the redox range between the MH and NNO buffer,formation of CO2�
3 complexes is a principle means of CO2
Inte
nsity
110010501000950900Frequency, cm-1
NaH
CO
3
Na 2
CO
3
40 cm-1
Fig. 11. Raman spectra of crystalline NaHCO3 and Na2CO3 in the900–1150 cm�1 frequency region where the strongest Raman bandin those spectra (C–O stretching on CO2�
3 groups) occurs. Theintensity of individual spectra is normalized to the integrated areaof the range of 1 order Raman scattering of that spectrum. Theindividual spectra are offset for clarity.
solution in the Na-silicate melts as evidenced by the domi-nant peak near 170 in the 13C MAS NMR spectra ppm(Fig. 8) and the peaks between 1055 and 1070 cm�1 in theRaman spectra (Fig. 10).
As the fH2 is increased from that of NNO to that of MW(and IW) buffer the disappearance of the 170–165 ppm peakin the 13C NMR and 1H–13C CPMAS spectra and appear-ance of the doublet near �2 and �6 ppm in the 13C NMRspectra (Fig. 8A) and a peak near �1 ppm in the 1H–13CCPMAS spectra (Fig. 8B) reflect reduction of carbon toform (C + H)-bearing groups that may exist in molecularform and as functional groups that form bonds with the sil-icate melt network (Pretsch et al., 2000).
The exact 13C chemical shift depends on the immediateelectronic (and, therefore, chemical) environment. Molecu-lar CH4 in silicate melts likely occupies cavities in the meltstructure in a manner that structurally resembles other mol-ecules, including H2O, CO2, N2, and noble gases, in meltsand chlathrates (e.g., Shelby, 1976; Carroll and Stolper,1991; Murphy and Roberts, 1995). Columbic interactionbetween CH4 molecules and its silicate environment leadsto deshielding of its 13C nuclei and, therefore, changes inthe relevant chemical shifts.
The fact that two peaks are observed near 0 ppm withdirect polarization (single pulse), but only one is observedusing cross polarization (Fig. 8) indicates that one of thetwo species cannot gain signal from polarization fromhydrogen to carbon. The CH4 molecules likely are con-tained in 3-dimensional cavities in the silicate structure sim-ilar to the solution mechanism of noble gases and othermolecules silicate melt structure (e.g., N2, H2O etc.). Withlittle or no interaction with the cavity walls, this CH4 mol-ecule spins rapidly. Ruling out the unlikely possibility ofone species not having hydrogen (e.g. SiC, with 13C chem-ical shift near �20 ppm; Wagner et al., 1989) it is possiblethat the rapid three dimensional random rotation of meth-ane will suppress the H–C dipolar coupling, disallowingcross polarization to occur (as occurs with liquids). Methylgroups (CH3) also rotate around the C–Si bond, but this re-stricted rotation is not sufficient to average out the dipolarcoupling. We conclude, therefore, that the peak at �1 ppmin the CP MAS NMR spectra are due to 1H polarizationtransfer to 13C in methyl groups, CH3, in the melt becauseisolated CH4 molecules located in silicate cavities in themelts are spatially isolated in structural from H2O andOH-groups would not, therefore result in signals in theCPMAS spectra. This methyl group likely forms bonds di-rectly with Si4+ (to form Si–CH3 bonds) because the 13Cchemical shift of a methoxy group, OCH3, is about50 ppm. There is no evidence of a peak in this latter regionof the 13C MAS NMR or the 1H–13C CPMAS spectra(Fig. 8). The second 13C MAS NMR peak, near �6 ppm,is assigned to molecular CH4 dissolved in the silicate melt.
Following the interpretation of Cody et al. (2005), thesharp peak marked 2 ppm in the 1H MAS NMR spectra(Fig. 9) corresponds to H in Si–OH groups in the melts.However, the reduced glasses (MW and IW) contain CH3
and CH4 groups in addition to OH-groups, and hydrogenfrom such an environment can also give rise to 1H chemicalshift in the 0–2 ppm range (Pretsch et al., 2000; Mysen
C–O–H volatiles in silicate melts 6193
et al., 2009). A peak near 5 ppm corresponds to molecularH2O. The strong intensity in the side band regions of 1Hspectra that also show the 5 ppm peak (which is assignedto molecular H2O) is consistent with this interpretation be-cause molecular water is expected to have the strongestdipolar coupling (e.g., Eckert et al., 1988; Schmidt et al.,2001). The very broad intensity extending to about15 ppm, also observed in other water-rich silicate glasses(Kummerlen et al., 1992; Robert et al., 2001; Cody et al.,2005), is due to an environment with very large oxygenhydrogen distances (Eckert et al., 1988) perhaps resultingfrom extensive hydrogen bonding.
In the Raman spectra, the band near 2900 cm�1
(Fig. 10A) is assigned to C–H stretching (Chou et al.,1990; Dubessy et al., 1999; Socrates, 2001). Its frequencyresembles that of CH4 in natural fluid inclusions (e.g., Seitzet al., 1987; Chou et al., 1990; Dubessy et al., 1999). How-ever, C–H stretching in methyl groups, CH3, also can resultin Raman bands at or very near this frequency (Socrates,2001) so the Raman spectra are consistent with both CH3
and CH4. This structural interpretation is consistent withthat of the 13C MAS NMR spectra above with CH4 andCH3-groups coexisting in the melts (Fig. 8).
The weaker Raman band near 3350 cm�1 (Fig. 10A)has been assigned to a (C–H)-bearing functional groupwith triple-bonded carbon linked to the silicate meltstructure (Mysen et al., 2009). This interpretation reliedon the observation (Socrates, 2001) that C–H vibrationswith Raman bands above 3200 cm�1 do not exist in sys-tems wherein the carbon is single- or double-bonded. Wenote, however, that there is no suggestion of an alkynegroup in the 13C MAS NMR spectra of these quenchedmelts because a peak at �70 ppm would be expected.We note that intensity of the alkyne C–H stretchingmode in Raman spectra is strong relative to other C–Hstretching modes (Pretsch et al. 2000). Thus, the weakintensity of this band in the Raman spectra (Fig. 10)indicates that the alkyne groups are minor constituents.It is also likely that the longitudinal relaxation time(T1) of alkyne carbon is much longer than other carbonbearing species. A combination of low abundance andlarge T1, therefore, provides a likely explanation as towhy alkyne carbon was not detected via 13C MAS NMR.
The broad and asymmetric band marked 3600 in Fig. 10is assigned to O–H vibrations in OH-complexes and inmolecular H2O (e.g., Van Thiel et al., 1957; McMillanand Remmele, 1986; Frantz et al., 1993; Kawamoto et al.,2004). Its presence accords with the interpretation of the1H MAS NMR data that H2O and OH-groups are formedwhen carbon is reduced with the introduction of hydrogen.
4.2. Solution mechanisms
The redox conditions (fH2) govern whether carbon in sil-icate melts bonds with oxygen (as CO2�
3 groups in the pres-ent melts) or hydrogen (as CH4 or CH3 in the presentmelts). The transition from one oxidation state to the otheroccurs over the fH2 interval between the NNO and MWhydrogen buffers.
Oxidized carbon as CO2�3 complexes is the only form of
dissolved carbon dissolved in melts equilibrated in the MHto NNO fH2-range in the silicate composition range exam-ined structurally in this study (Na/Si = NBO/Si = 0.5–1).In fact, CO2 saturation in alkali silicate melts has been usedto derive activity of oxygen ions in the melt via the simpleequilibrium (Pearce, 1964):
CO2 þO2��CO2�
3 ð3Þ
An equilibrium between different Q-species (as definedby Schramm et al., 1984, for silicate species in melts) andoxygen ions in the melts is;
ð2=mÞMmþ þ Qn þO2��Qn�1ðMmþÞ: ð4Þ
Eq. (4) combined with Eq. (3) yields a simple equilibriumbetween Q-species in the melt and oxidized carbon dis-solved as CO2�
3 -groups:
Qn�1ðMmþÞ þ CO2�Qn þ CO2�3 ½ð2=mÞMmþÞ�; ð5Þ
In these expressions, the superscript, n, is the number ofbridging oxygen atoms in the silicate species, Qn, and Mm+
denotes a metal cation. In the present experiments Mm+ isNa+. In silicate melts, the n in the Qn is an integer thatcan be 0, 1, 2, 3, and 4. Examples of silicate stoichiometriescorresponding to these types of Q-species are SiO4 (n = 0),Si2O7 (n = 1), SiO3 (n = 2), Si2O5 (n = 3) and SiO2 (n = 4).The reader is referred to Mysen and Richet (2005, Chap. 4and 7 for a detailed review these concepts).
The CO2�3 -group in Eqs. (3) and (5) occurs as isolated
groups bonded to 2 Na+ or the CO2�3 -groups may be in a
more complex environment where one or more of the oxy-gen is shared with the silicate network, or both, dependingon silicate composition. An isolated CO2�
3 group bonded toNa+ is consistent with a carbon-13 NMR peak near170 ppm and a Raman band with a sharp maximum1070 cm�1 (Figs. 7 and 8; Kohn et al., 1991; Cloots,1991). The second peak in this region of the Raman spectra,near 1055 cm�1 (Fig. 5), is at lower frequency perhaps be-cause of deformation of the CO2�
3 group. This deformationmay result from sharing one or more of its oxygen atomswith the silicate network. This latter CO2�
3 complex maycorrespond to the network carbonate proposed elsewhere(e.g., Kubicki and Stolper, 1995; Brooker et al., 1999).
In the fH2-range between the NNO and MW buffers car-bon dissolved in the melts undergoes reduction with the for-mation of methyl (CH3) groups bonded to Si4+ togetherwith molecular CH4 (Fig. 8). Interaction of the methanewith the silicate melt can be expressed as;
2Qn þ CH4�Qn�1ðCH3Þ þ Qn�1ðOHÞ; ð6Þ
where Qn�1(CH3) and Qn�1(OH) denotes Q-species inwhich the Si4+ is bonded to CH3 groups and OH groups,respectively. With this solution mechanism, which is similarto that proposed by Mysen and Yamashita (2010) fromin situ, high-pressure/-temperature Raman spectroscopy,solution of methane in silicate melts results in breakage ofoxygen bridges. In other words, solution of methane in sil-icate melts results in melt depolymerization (increasingNBO/Si).
10 20 30 40 50
10
20
30
40
50
Mg2SiO4MgSiO
3
NaAl
SiO 4
SiO2
Enst
atite
+Liq
uid
Fors
terit
e+Li
quid
CH4CO2Vo
latile
-free
mol %2.8 GPa
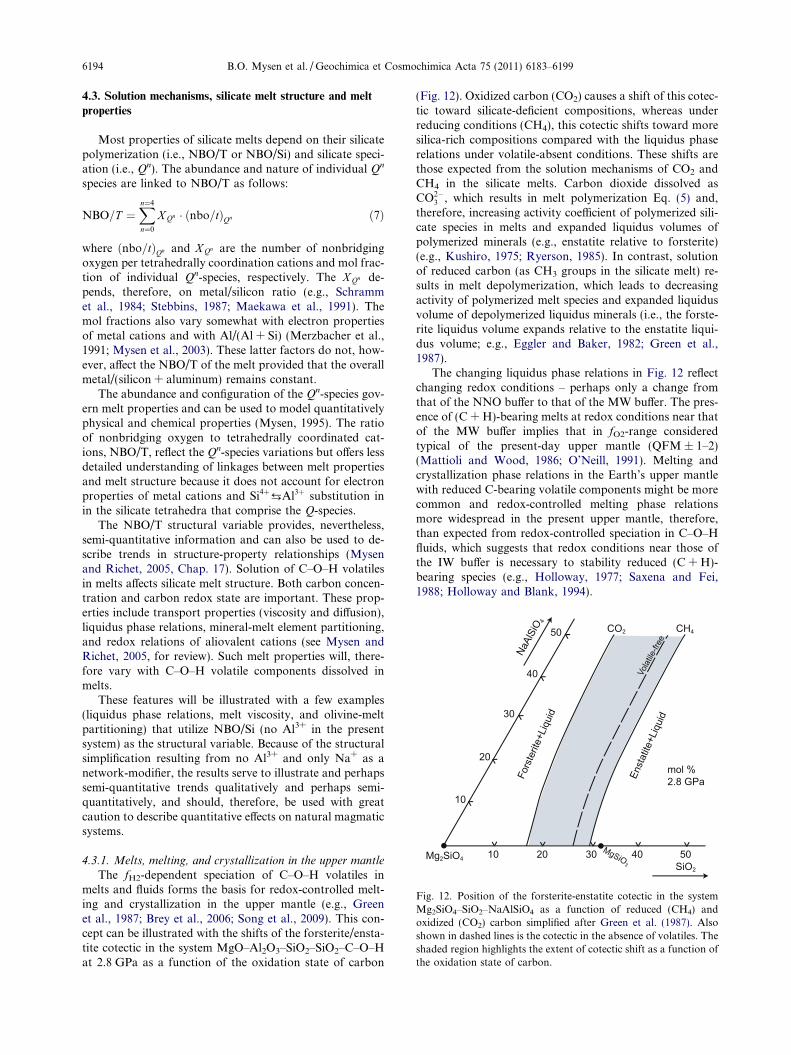
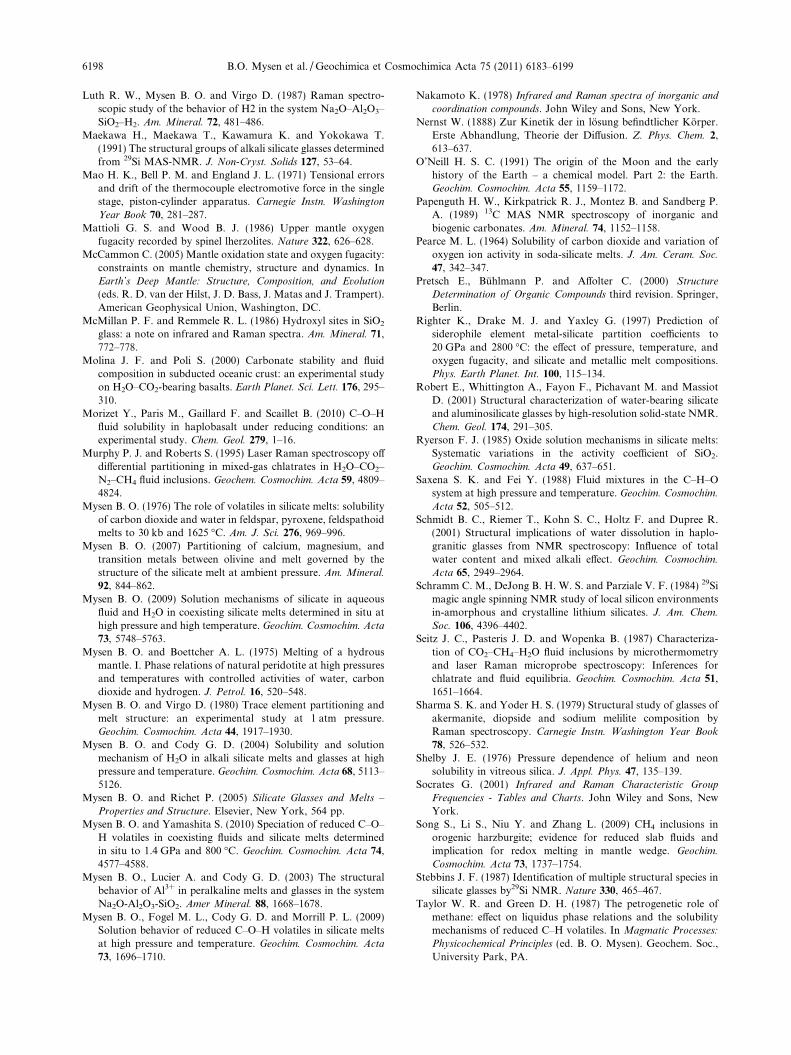
Fig. 12. Position of the forsterite-enstatite cotectic in the systemMg2SiO4–SiO2–NaAlSiO4 as a function of reduced (CH4) andoxidized (CO2) carbon simplified after Green et al. (1987). Alsoshown in dashed lines is the cotectic in the absence of volatiles. Theshaded region highlights the extent of cotectic shift as a function ofthe oxidation state of carbon.
6194 B.O. Mysen et al. / Geochimica et Cosmochimica Acta 75 (2011) 6183–6199
4.3. Solution mechanisms, silicate melt structure and melt
properties
Most properties of silicate melts depend on their silicatepolymerization (i.e., NBO/T or NBO/Si) and silicate speci-ation (i.e., Qn). The abundance and nature of individual Qn
species are linked to NBO/T as follows:
NBO=T ¼Xn¼4
n¼0
X Qn � ðnbo=tÞQn ð7Þ
where ðnbo=tÞQn and X Qn are the number of nonbridgingoxygen per tetrahedrally coordination cations and mol frac-tion of individual Qn-species, respectively. The X Qn de-pends, therefore, on metal/silicon ratio (e.g., Schrammet al., 1984; Stebbins, 1987; Maekawa et al., 1991). Themol fractions also vary somewhat with electron propertiesof metal cations and with Al/(Al + Si) (Merzbacher et al.,1991; Mysen et al., 2003). These latter factors do not, how-ever, affect the NBO/T of the melt provided that the overallmetal/(silicon + aluminum) remains constant.
The abundance and configuration of the Qn-species gov-ern melt properties and can be used to model quantitativelyphysical and chemical properties (Mysen, 1995). The ratioof nonbridging oxygen to tetrahedrally coordinated cat-ions, NBO/T, reflect the Qn-species variations but offers lessdetailed understanding of linkages between melt propertiesand melt structure because it does not account for electronproperties of metal cations and Si4þ
¡Al3þ substitution inin the silicate tetrahedra that comprise the Q-species.
The NBO/T structural variable provides, nevertheless,semi-quantitative information and can also be used to de-scribe trends in structure-property relationships (Mysenand Richet, 2005, Chap. 17). Solution of C–O–H volatilesin melts affects silicate melt structure. Both carbon concen-tration and carbon redox state are important. These prop-erties include transport properties (viscosity and diffusion),liquidus phase relations, mineral-melt element partitioning,and redox relations of aliovalent cations (see Mysen andRichet, 2005, for review). Such melt properties will, there-fore vary with C–O–H volatile components dissolved inmelts.
These features will be illustrated with a few examples(liquidus phase relations, melt viscosity, and olivine-meltpartitioning) that utilize NBO/Si (no Al3+ in the presentsystem) as the structural variable. Because of the structuralsimplification resulting from no Al3+ and only Na+ as anetwork-modifier, the results serve to illustrate and perhapssemi-quantitative trends qualitatively and perhaps semi-quantitatively, and should, therefore, be used with greatcaution to describe quantitative effects on natural magmaticsystems.
4.3.1. Melts, melting, and crystallization in the upper mantle
The fH2-dependent speciation of C–O–H volatiles inmelts and fluids forms the basis for redox-controlled melt-ing and crystallization in the upper mantle (e.g., Greenet al., 1987; Brey et al., 2006; Song et al., 2009). This con-cept can be illustrated with the shifts of the forsterite/ensta-tite cotectic in the system MgO–Al2O3–SiO2–SiO2–C–O–Hat 2.8 GPa as a function of the oxidation state of carbon
(Fig. 12). Oxidized carbon (CO2) causes a shift of this cotec-tic toward silicate-deficient compositions, whereas underreducing conditions (CH4), this cotectic shifts toward moresilica-rich compositions compared with the liquidus phaserelations under volatile-absent conditions. These shifts arethose expected from the solution mechanisms of CO2 andCH4 in the silicate melts. Carbon dioxide dissolved asCO2�
3 , which results in melt polymerization Eq. (5) and,therefore, increasing activity coefficient of polymerized sili-cate species in melts and expanded liquidus volumes ofpolymerized minerals (e.g., enstatite relative to forsterite)(e.g., Kushiro, 1975; Ryerson, 1985). In contrast, solutionof reduced carbon (as CH3 groups in the silicate melt) re-sults in melt depolymerization, which leads to decreasingactivity of polymerized melt species and expanded liquidusvolume of depolymerized liquidus minerals (i.e., the forste-rite liquidus volume expands relative to the enstatite liqui-dus volume; e.g., Eggler and Baker, 1982; Green et al.,1987).
The changing liquidus phase relations in Fig. 12 reflectchanging redox conditions – perhaps only a change fromthat of the NNO buffer to that of the MW buffer. The pres-ence of (C + H)-bearing melts at redox conditions near thatof the MW buffer implies that in fO2-range consideredtypical of the present-day upper mantle (QFM ± 1–2)(Mattioli and Wood, 1986; O’Neill, 1991). Melting andcrystallization phase relations in the Earth’s upper mantlewith reduced C-bearing volatile components might be morecommon and redox-controlled melting phase relationsmore widespread in the present upper mantle, therefore,than expected from redox-controlled speciation in C–O–Hfluids, which suggests that redox conditions near those ofthe IW buffer is necessary to stability reduced (C + H)-bearing species (e.g., Holloway, 1977; Saxena and Fei,1988; Holloway and Blank, 1994).
C–O–H volatiles in silicate melts 6195
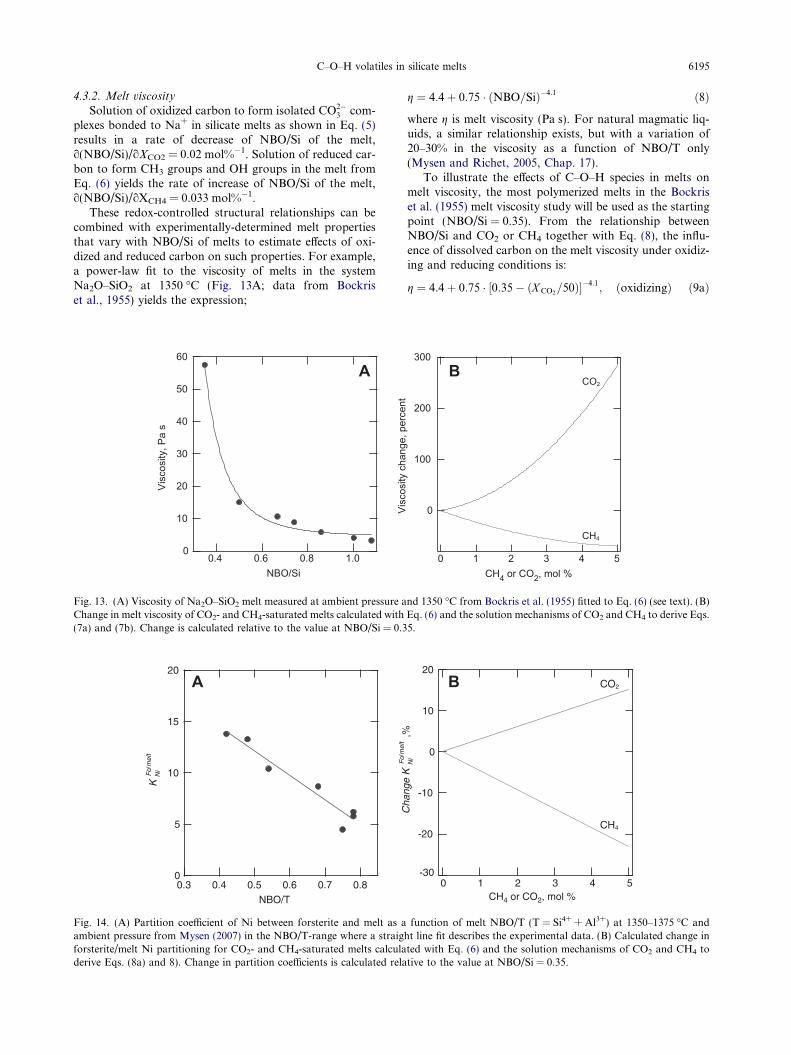
4.3.2. Melt viscosity
Solution of oxidized carbon to form isolated CO2�3 com-
plexes bonded to Na+ in silicate melts as shown in Eq. (5)results in a rate of decrease of NBO/Si of the melt,o(NBO/Si)/oXCO2 = 0.02 mol%�1. Solution of reduced car-bon to form CH3 groups and OH groups in the melt fromEq. (6) yields the rate of increase of NBO/Si of the melt,o(NBO/Si)/oXCH4 = 0.033 mol%�1.
These redox-controlled structural relationships can becombined with experimentally-determined melt propertiesthat vary with NBO/Si of melts to estimate effects of oxi-dized and reduced carbon on such properties. For example,a power-law fit to the viscosity of melts in the systemNa2O–SiO2 at 1350 �C (Fig. 13A; data from Bockriset al., 1955) yields the expression;
60
50
40
30
20
10
0
Visc
osity
, Pa
s
1.00.80.60.4NBO/Si
A
Fig. 13. (A) Viscosity of Na2O–SiO2 melt measured at ambient pressure aChange in melt viscosity of CO2- and CH4-saturated melts calculated with(7a) and (7b). Change is calculated relative to the value at NBO/Si = 0.3
20
15
10
5
00.80.70.60.50.40.3
NBO/T
KN
iF
o/m
elt
A
Fig. 14. (A) Partition coefficient of Ni between forsterite and melt as aambient pressure from Mysen (2007) in the NBO/T-range where a straigforsterite/melt Ni partitioning for CO2- and CH4-saturated melts calculaderive Eqs. (8a) and 8). Change in partition coefficients is calculated rela
g ¼ 4:4þ 0:75 � ðNBO=SiÞ�4:1 ð8Þ
where g is melt viscosity (Pa s). For natural magmatic liq-uids, a similar relationship exists, but with a variation of20–30% in the viscosity as a function of NBO/T only(Mysen and Richet, 2005, Chap. 17).
To illustrate the effects of C–O–H species in melts onmelt viscosity, the most polymerized melts in the Bockriset al. (1955) melt viscosity study will be used as the startingpoint (NBO/Si = 0.35). From the relationship betweenNBO/Si and CO2 or CH4 together with Eq. (8), the influ-ence of dissolved carbon on the melt viscosity under oxidiz-ing and reducing conditions is:
g ¼ 4:4þ 0:75 � ½0:35� ðX CO2=50Þ��4:1
; ðoxidizingÞ ð9aÞ
300
200
100
0Visc
osity
cha
nge,
per
cent
543210CH4 or CO2, mol %
CH4
CO2B
nd 1350 �C from Bockris et al. (1955) fitted to Eq. (6) (see text). (B)Eq. (6) and the solution mechanisms of CO2 and CH4 to derive Eqs.5.
-30
-20
-10
0
10
20
543210CH4 or CO2, mol %
Cha
nge
KN
iF
o/m
elt
,%
B
CH4
CO2
function of melt NBO/T (T = Si4+ + Al3+) at 1350–1375 �C andht line fit describes the experimental data. (B) Calculated change inted with Eq. (6) and the solution mechanisms of CO2 and CH4 totive to the value at NBO/Si = 0.35.
6196 B.O. Mysen et al. / Geochimica et Cosmochimica Acta 75 (2011) 6183–6199
and
g ¼ 4:4þ 0:75 � ½0:35þ ðX CH4=30:3Þ��4:1 ðreducingÞ ð9bÞ
From these relationships, the melt viscosity increaseswith increasing CO2 content and decreases with increasingCH4 content (Fig. 13B). An implication of these results isthat if, for example, a melt containing 2 mol% CH4 asCH3-groups is oxidized to CO2�
3 -groups, the melt viscositywould increase by about 100%. Two mol% CH4 is equiva-lent to 0.35 wt% C. This is the carbon solubility in meltswith NBO/T�1 under reducing conditions (Fig. 4). AnNBO/T-value near 1 is within the NBO/T-range of basalticmelts (see Mysen and Richet, 2005, Chap. 17). This meltviscosity change can be accomplished, therefore, simplyby increasing the fH2 from the NNO to the MW buffer. Gi-ven that other transport properties of melt such as, forexample, diffusion and electrical conductivity are function-ally related to melt viscosity (Einstein, 1905; Nernst, 1888;Eyring, 1935), diffusivity and conductivity of C-bearingmelts would also be affected by changes in redoxconditions.
4.3.3. Mineral-melt element partitioning
Element partitioning between minerals and melt is sensi-tive to melt composition and, therefore, is sensitive to meltstructure, often with a positive correlation between min-eral/melt partition coefficients and NBO/T of the melt(e.g., Watson, 1977; Mysen and Virgo, 1980; Kohn andSchofield, 1994; Jaeger and Drake, 2000). For example,Ni partitioning between forsterite and melt in the systemCaO–MgO–FeO–Al2O3–SiO2 (Mysen, 2007), in the NBO/T range from about 0.4 to about 0.8, which is also theNBO/T-range from basaltic andesite melt to tholeiite melt(Mysen and Richet, 2005 – see also Fig. 1), there is a simplelinear relationship between KFo=melt
Ni and NBO/T (Fig. 14A).From the least squares-fitted straight line in Fig. 14A, therate of change of melt NBO/Si with dissolved CO2 andCH4 can then be employed to calculate change of KFo=melt
Ni
as a function of concentration of CO2 and CH4 in the melt:
kFo=meltNi ¼ 23:9� 23:7 � ½0:35� ðX CO2
=50Þ�;ðoxidizingÞ ð10aÞ
kFo=meltNi ¼ 23:9� 23:7 � ½0:35þ ðX CH4
=30:3Þ�;ðreducingÞ ð10bÞ
where the symbols and assumptions are the same as thoseunder viscosity changes above. From these relationships,under oxidizing conditions (e.g., NNO and more oxidizing),the KFo=melt
Ni -value increases with increasing C content of themelt, whereas under reducing conditions (e.g., MW andmore reducing), the partition coefficient decreases. Theimplication of these results is that a partition coefficientssuch as that of Ni between forsterite and melt can changeby several tens of percent by changing the redox conditionsduring melting or crystallization of (C–O–H)-bearing mag-matic liquids. It is, however, strongly cautioned againstusing Eqs. (10a) and (10b) quantitatively for composition-ally more complex natural magmatic liquids for the reasonsdiscussed above. Qualitatively similar conclusions apply to
any other NBO/Si-dependent mineral/melt element parti-tion coefficients.
ACKNOWLEDGMENTS
This research was conducted with partial support from NSFgrants EAR-070786 and EAR-0734182 to BOM. Grants from theW. M. Keck Foundation supported acquisition of analytical instru-ments used in this study: Jasco IRS-3100 microRaman, ThermoFisher Delta V plus mass spectrometer, and Varian-ChemagneticsInfinity solid state NMR spectrometers. We thank Roxane Bowdenfor technical assistance and Bob Luth, Simon Kohn and an anon-ymous reviewer for their constructive and helpful comments.
REFERENCES
Behrens H., Roux J., Neuville D. R. and Semann M. (2006)Quantification of dissolved H2O in silicate glasses usingconfocal microRaman spectroscopy. Chem. Geol. 229, 96–112.
Bockris J. O’M., Mackenzie J. O. and Kitchner J. A. (1955)Viscous flow in silica and binary liquid silicates. Trans. Faraday
Soc. 51, 1734–1748.
Boettcher A. L., Luth R. W. and White B. S. (1987) Carbon insilicate liquids: the systems NaAlSi3O8–CO2, CaAl2Si2O8–CO2,and KAlSi3O8–CO2. Contrib. Mineral. Petrol. 97, 297–304.
Bohlen S. R. (1984) Equilibria for precise pressure calibration anda frictionless furnace assembly for the piston-cylinder appara-tus. N. Jb. Mineral. Mh. 84, 404–412.
Boyd F. R. and England J. L. (1960) Apparatus for phaseequilibrium measurements at pressures up to 50 kilobars andtemperatures up to 1750 �C. J. Geophys. Res. 65, 741–748.
Brey G. P., Bulatov V. K. and Girnis A. V. (2006) Redox meltingand composition of near liquidus melts of C–O–H-bearingperidotite. Geochim. Cosmochim. Acta 70, A67.
Brey G. P., Bulatov V. K., Girnis A. V. and Lahaye Y. (2008)Experimental melting of carbonated peridotite at 6–10 GPa. J.
Petrol. 49, 797–821.
Brooker R. A., Kohn S. C., Holloway J. R., McMillan P. F. andCarroll M. R. (1999) Solubility, speciation and dissolutionmechanisms for CO2 in melts on the NaAlO2–SiO2 join.Geochim. Cosmochim. Acta 63, 3549–3566.
Brooker R. A., Kohn S. C., Holloway J. R. and McMillan P. F.(2001a) Structural controls on the solubility of CO2 in silicatemelts. Part I: bulk solubility data. Chem. Geol. 174, 225–239.
Brooker R. A., Kohn S. C., Holloway J. R. and McMillan P. F.(2001b) Structural controls on the solubility of CO2 in silicatemelts. Part II: IR characteristics of carbonate groups in silicateglasses. Chem. Geol. 174, 241–254.
Carmichael I. S. E. (1991) The redox state of basic and silicicmagmas: a reflection of their source regions? Contr. Mineral.
Petrol. 106, 129–141.
Carroll M. R. and Stolper E. M. (1991) Argon solubility anddiffusion in silica glass: implication for the solution behavior ofmolecular gases. Geochim. Cosmochim. Acta 55, 211–226.
Chabot N. L. and Agee C. B. (2003) Core formation in the Earthand the Moon: new experimental constraints from V, Cr, andMn. Geochim. Cosmochim. Acta 67, 2077–2092.
Chou I.-M., Pasteris J. D. and Seitz J. C. (1990) High-densityvolatiles in the system C–O–H–N for the calibration of a laserRaman microprobe. Geochim. Cosmochim. Acta 54, 535–543.
Christie D. M., Carmichael I. S. E. and Langmuir C. H. (1986)Oxidation states of mid-ocean ridge basalt glasses. Earth
Planet. Sci. Lett. 79, 397–411.
C–O–H volatiles in silicate melts 6197
Cloots R. (1991) Raman spectrum of carbonates M”C03 in the1100–1000 cm�1 region: observation of the y1 mode of theisotopic CO2�
3 -ion. Spectrochim. Acta 47A, 1745–1750.
Cody G. D., Mysen B. O. and Lee S. K. (2005) Structure vs.composition: a solid state 1H and 29Si NMR study of quenchedglasses along the Na2O–SiO2–H2O join. Geochim. Cosmochim.
Acta 69, 2373–2384.
Dasgupta R. and Hirschmann M. M. (2007) Effect of variablecarbonate concentration on the solidus of mantle peridotite.Am. Mineral. 92, 370–379.
Dixon J. E. (1997) Degassing of alkalic basalts. Am. Mineral. 82,
368–378.
Dixon J. E., Clague D. A. and Stolper E. M. (1991) Degassinghistory of water, sulfur, and carbon in submarine lavas fromKilauea volcano. Hawaii J. Geol. 99, 371–394.
Dubessy J., Moissette A., Bakker R. J., Frantz J. D. and Zhang Y.-G.(1999) High-temperature Raman spectroscopic study of H2O–CO2–CH4 mixtures in synthetic fluid inclusions: first insights onmolecular interactions and analytical implications. Eur. J.
Mineral. 11, 23–32.
Eckert H., Yesinowski J. P., Silver L. A. and Stolper E. M. (1988)Water in silicate glasses: quantification and structural studies by1H solid echo and MAS NMR methods. J. Phys. Chem. 92,
2055–2064.
Eggler D. H. (1975) CO2 as a volatile component in the mantle: thesystem Mg2SiO4–SiO2–H2O–CO2. Phys. Chem. Earth 9, 869–
881.
Eggler D. H. (1989) Carbonatites, primary melts, and mantledynamics. In Carbonatites: Genesis and Evolution (ed. K. Bell).Unwin Hyman, London.
Eggler D. H. and Kadik A. A. (1979) The system NaAlSi3O8–H2O–CO2: I. Compositional and thermodynamic relations ofliquids and vapors coexisting with albite. Am. Mineral. 64,
1036–1049.
Eggler D. H. and Baker D. R. (1982) Reduced volatiles in thesystem C–H–O: implications to mantle melting, fluid formationand diamond genesis. Adv. Earth Planet. Sci. 12, 237–250.
Einstein A. (1905) Uber die von der molekular-kinetischen Theorieder Warme geforderte Bewegung von in ruhenden Flussigkeitensuspendierten Teilchen. Ann. Phys. 17, 549–560.
Eyring H. (1935) The activated complex in chemical reactions. J.
Chem. Phys. 3, 107–115.
Fine G. and Stolper E. (1985) The speciation of carbon dioxide insodium aluminosilicate glasses. Contr. Mineral. Petrol. 91, 105–
112.
Fine G. and Stolper E. (1986) Dissolved carbon dioxide in basalticglasses: concentration and speciation. Earth Planet. Sci. Lett.
76, 263–278.
Frantz J. D., Dubessy J. and Mysen B. (1993) An optical cell forRaman spectroscopic studies of supercritical fluids and itsapplications to the study of water to 500 �C and 2000 bar.Chem. Geol. 106, 9–26.
Fudali F. (1965) Oxygen fugacity of basaltic and andesitic magmas.Geochim. Cosmochim. Acta 29, 1063–1075.
Gessmann C. K. and Rubie D. C. (2000) The origin of thedepletions of V, Cr and Mn in the mantles of the Earth andMoon. Earth Planet. Sci. Lett. 184, 95–187.
Getting I. C. and Kennedy G. C. (1970) Effect of pressure on theemf of chromel–alumel and platinum–platinum 90 rhodium 10thermocouples. J. Appl. Phys. 11, 4552–4562.
Green D. H., Falloon T. J. and Taylor W. R. (1987) Mantle-derived magmas – roles of variable source peridotite andvariable C–H–O fluid composition. In Magmatic Processes:
Physicochemical Principles (ed. B. O. Mysen). Geochem. Soc.,
University Park, PA.
Holloway J. R. (1977) Fugacity and activity of molecular species insupercritical fluids. In Thermodynamics in Geology (ed. D. G.Fraser). Reidel, Dordrecht.
Holloway J. R. (1998) Graphite-melt equilibria during mantlemelting; constraints on CO2 in MORB magmas and the carboncontent of the mantle. In The degassing of the Earth (eds. M. R.Carroll, S. C. Kohn and B. J. Wood). Elsevier, Amsterdam,
Netherlands.
Holloway J. R. and Blank J. G. (1994) Application of experimentalresults to C–O–H species in natural melts. In Volatiles in
magmas (eds. M. R. Carroll and J. R. Holloway). Mineralogical
Society of America, Washington, DC, United States.
Holloway J. R., Mysen B. O. and Eggler D. H. (1976) Thesolubility of CO2 in liquids on the join CaO–MgO–SiO2–CO2.Carnegie Inst. Washington Yearbook 75, 626–631.
Huebner J. S. (1971) Buffering techniques for hydrostatic systemsat elevated pressures. In Research Techniques for High Pressure
and High Temperature (ed. G. C. Ulmer). Springer Verlag, New
York.
Jaeger W. L. and Drake M. J. (2000) Metal-silicate partitioning ofCo, Ga, and W; dependence on silicate melt composition.Geochim. Cosmochim. Acta 64, 3887–3895.
Jambon A. (1994) Earth degassing and large-scale geochemicalcycling of volatile elements. In Volatiles in Magmas (eds. M. R.Carroll and J. R. Holloway). Mineralogical Society of America,
Washington, DC.
Kadik, A. A. and Lukanin, O. A. (1984) Mantle outgassing duringmelting: The role of carbon in fluid production in regions ofbasalt magma formation. Geokhimiya.
Kadik A. A., Pineau F., Litvin Y., Jendrzejewski N., Martinez I.and Javoy M. (2004) Formation of carbon and hydrogenspecies in magmas at low oxygen fugacity. J. Petrol. 45, 1297–
1310.
Kasting J. F., Eggler D. H. and Raeburn S. P. (1993) Mantle redoxevolution and the oxidation state of the Archean atmosphere. J.
Geol. 101, 245–257.
Kawamoto T., Ochiai S. and Kagi H. (2004) Changes in thestructure of water deduced from the pressure dependence of theRaman OH frequency. J. Chem. Phys. 120, 5867–5870.
Kohn S. C. and Schofield P. F. (1994) The importance of meltcomposition in controlling trace-element behaviour: an exper-imental study of Mn and Zn partitioning between forsterite andsilicate melt. Chem. Geol. 117, 73–87.
Kohn S. C., Dupree R. and Smith M. E. (1989) Proton environ-ments and hydrogen-bonding in hydrous silicate glasses fromproton NMR. Nature 337, 539–541.
Kohn S. C., Brooker R. A. and Dupree R. (1991) 13C MAS NMR:a method for studying CO2 speciation in glasses. Geochim.
Cosmochim. Acta 55, 3879–3884.
Kubicki J. D. and Stolper E. M. (1995) Structural roles of CO2 and[CO3]2� in fully polymerized sodium aluminosilicate melts andglasses. Geochim. Cosmochim. Acta 59, 683–698.
Kummerlen J., Merwin L. H., Sebald A. and Keppler H. (1992).Structural role of H2O in sodium silicate glasses: results from29Si and 1H NMR spectroscopy. J. Phys. Chem. 96, 64-5-6410.
Kushiro I. (1975) On the nature of silicate melt and its significancein magma genesis: regularities in the shift of liquidus bound-aries involving olivine pyroxene, and silica materials. Am. J.
Sci. 275, 411–431.
Kushiro I. (1976) A new furnace assembly with a small temperaturegradient in solid-media, high-pressure apparatus. Carnegie
Instn. Washington Year Book 75, 832–833.
Lee S. K., Cody G. D., Fei Y. and Mysen B. O. (2004) Nature ofpolymerization and properties of silicate melts at high pressure.Geochim. Cosmochim. Acta 68, 4189–4200.
6198 B.O. Mysen et al. / Geochimica et Cosmochimica Acta 75 (2011) 6183–6199
Luth R. W., Mysen B. O. and Virgo D. (1987) Raman spectro-scopic study of the behavior of H2 in the system Na2O–Al2O3–SiO2–H2. Am. Mineral. 72, 481–486.
Maekawa H., Maekawa T., Kawamura K. and Yokokawa T.(1991) The structural groups of alkali silicate glasses determinedfrom 29Si MAS-NMR. J. Non-Cryst. Solids 127, 53–64.
Mao H. K., Bell P. M. and England J. L. (1971) Tensional errorsand drift of the thermocouple electromotive force in the singlestage, piston-cylinder apparatus. Carnegie Instn. Washington
Year Book 70, 281–287.
Mattioli G. S. and Wood B. J. (1986) Upper mantle oxygenfugacity recorded by spinel lherzolites. Nature 322, 626–628.
McCammon C. (2005) Mantle oxidation state and oxygen fugacity:constraints on mantle chemistry, structure and dynamics. InEarth’s Deep Mantle: Structure, Composition, and Evolution
(eds. R. D. van der Hilst, J. D. Bass, J. Matas and J. Trampert).American Geophysical Union, Washington, DC.
McMillan P. F. and Remmele R. L. (1986) Hydroxyl sites in SiO2
glass: a note on infrared and Raman spectra. Am. Mineral. 71,
772–778.
Molina J. F. and Poli S. (2000) Carbonate stability and fluidcomposition in subducted oceanic crust: an experimental studyon H2O–CO2-bearing basalts. Earth Planet. Sci. Lett. 176, 295–
310.
Morizet Y., Paris M., Gaillard F. and Scaillet B. (2010) C–O–Hfluid solubility in haplobasalt under reducing conditions: anexperimental study. Chem. Geol. 279, 1–16.
Murphy P. J. and Roberts S. (1995) Laser Raman spectroscopy offdifferential partitioning in mixed-gas chlatrates in H2O–CO2–N2–CH4 fluid inclusions. Geochem. Cosmochim. Acta 59, 4809–
4824.
Mysen B. O. (1976) The role of volatiles in silicate melts: solubilityof carbon dioxide and water in feldspar, pyroxene, feldspathoidmelts to 30 kb and 1625 �C. Am. J. Sci. 276, 969–996.
Mysen B. O. (2007) Partitioning of calcium, magnesium, andtransition metals between olivine and melt governed by thestructure of the silicate melt at ambient pressure. Am. Mineral.
92, 844–862.
Mysen B. O. (2009) Solution mechanisms of silicate in aqueousfluid and H2O in coexisting silicate melts determined in situ athigh pressure and high temperature. Geochim. Cosmochim. Acta
73, 5748–5763.
Mysen B. O. and Boettcher A. L. (1975) Melting of a hydrousmantle. I. Phase relations of natural peridotite at high pressuresand temperatures with controlled activities of water, carbondioxide and hydrogen. J. Petrol. 16, 520–548.
Mysen B. O. and Virgo D. (1980) Trace element partitioning andmelt structure: an experimental study at 1 atm pressure.Geochim. Cosmochim. Acta 44, 1917–1930.
Mysen B. O. and Cody G. D. (2004) Solubility and solutionmechanism of H2O in alkali silicate melts and glasses at highpressure and temperature. Geochim. Cosmochim. Acta 68, 5113–
5126.
Mysen B. O. and Richet P. (2005) Silicate Glasses and Melts –
Properties and Structure. Elsevier, New York, 564 pp.Mysen B. O. and Yamashita S. (2010) Speciation of reduced C–O–
H volatiles in coexisting fluids and silicate melts determinedin situ to 1.4 GPa and 800 �C. Geochim. Cosmochim. Acta 74,
4577–4588.
Mysen B. O., Lucier A. and Cody G. D. (2003) The structuralbehavior of Al3+ in peralkaline melts and glasses in the systemNa2O-Al2O3-SiO2. Amer Mineral. 88, 1668–1678.
Mysen B. O., Fogel M. L., Cody G. D. and Morrill P. L. (2009)Solution behavior of reduced C–O–H volatiles in silicate meltsat high pressure and temperature. Geochim. Cosmochim. Acta
73, 1696–1710.
Nakamoto K. (1978) Infrared and Raman spectra of inorganic and
coordination compounds. John Wiley and Sons, New York.Nernst W. (1888) Zur Kinetik der in losung befindtlicher Korper.
Erste Abhandlung, Theorie der Diffusion. Z. Phys. Chem. 2,
613–637.
O’Neill H. S. C. (1991) The origin of the Moon and the earlyhistory of the Earth – a chemical model. Part 2: the Earth.Geochim. Cosmochim. Acta 55, 1159–1172.
Papenguth H. W., Kirkpatrick R. J., Montez B. and Sandberg P.A. (1989) 13C MAS NMR spectroscopy of inorganic andbiogenic carbonates. Am. Mineral. 74, 1152–1158.
Pearce M. L. (1964) Solubility of carbon dioxide and variation ofoxygen ion activity in soda-silicate melts. J. Am. Ceram. Soc.
47, 342–347.
Pretsch E., Buhlmann P. and Affolter C. (2000) Structure
Determination of Organic Compounds third revision. Springer,Berlin.
Righter K., Drake M. J. and Yaxley G. (1997) Prediction ofsiderophile element metal-silicate partition coefficients to20 GPa and 2800 �C: the effect of pressure, temperature, andoxygen fugacity, and silicate and metallic melt compositions.Phys. Earth Planet. Int. 100, 115–134.
Robert E., Whittington A., Fayon F., Pichavant M. and MassiotD. (2001) Structural characterization of water-bearing silicateand aluminosilicate glasses by high-resolution solid-state NMR.Chem. Geol. 174, 291–305.
Ryerson F. J. (1985) Oxide solution mechanisms in silicate melts:Systematic variations in the activity coefficient of SiO2.Geochim. Cosmochim. Acta 49, 637–651.
Saxena S. K. and Fei Y. (1988) Fluid mixtures in the C–H–Osystem at high pressure and temperature. Geochim. Cosmochim.
Acta 52, 505–512.
Schmidt B. C., Riemer T., Kohn S. C., Holtz F. and Dupree R.(2001) Structural implications of water dissolution in haplo-granitic glasses from NMR spectroscopy: Influence of totalwater content and mixed alkali effect. Geochim. Cosmochim.
Acta 65, 2949–2964.
Schramm C. M., DeJong B. H. W. S. and Parziale V. F. (1984) 29Simagic angle spinning NMR study of local silicon environmentsin-amorphous and crystalline lithium silicates. J. Am. Chem.
Soc. 106, 4396–4402.
Seitz J. C., Pasteris J. D. and Wopenka B. (1987) Characteriza-tion of CO2–CH4–H2O fluid inclusions by microthermometryand laser Raman microprobe spectroscopy: Inferences forchlatrate and fluid equilibria. Geochim. Cosmochim. Acta 51,
1651–1664.
Sharma S. K. and Yoder H. S. (1979) Structural study of glasses ofakermanite, diopside and sodium melilite composition byRaman spectroscopy. Carnegie Instn. Washington Year Book
78, 526–532.
Shelby J. E. (1976) Pressure dependence of helium and neonsolubility in vitreous silica. J. Appl. Phys. 47, 135–139.
Socrates G. (2001) Infrared and Raman Characteristic Group
Frequencies - Tables and Charts. John Wiley and Sons, NewYork.
Song S., Li S., Niu Y. and Zhang L. (2009) CH4 inclusions inorogenic harzburgite; evidence for reduced slab fluids andimplication for redox melting in mantle wedge. Geochim.
Cosmochim. Acta 73, 1737–1754.
Stebbins J. F. (1987) Identification of multiple structural species insilicate glasses by29Si NMR. Nature 330, 465–467.
Taylor W. R. and Green D. H. (1987) The petrogenetic role ofmethane: effect on liquidus phase relations and the solubilitymechanisms of reduced C–H volatiles. In Magmatic Processes:
Physicochemical Principles (ed. B. O. Mysen). Geochem. Soc.,
University Park, PA.
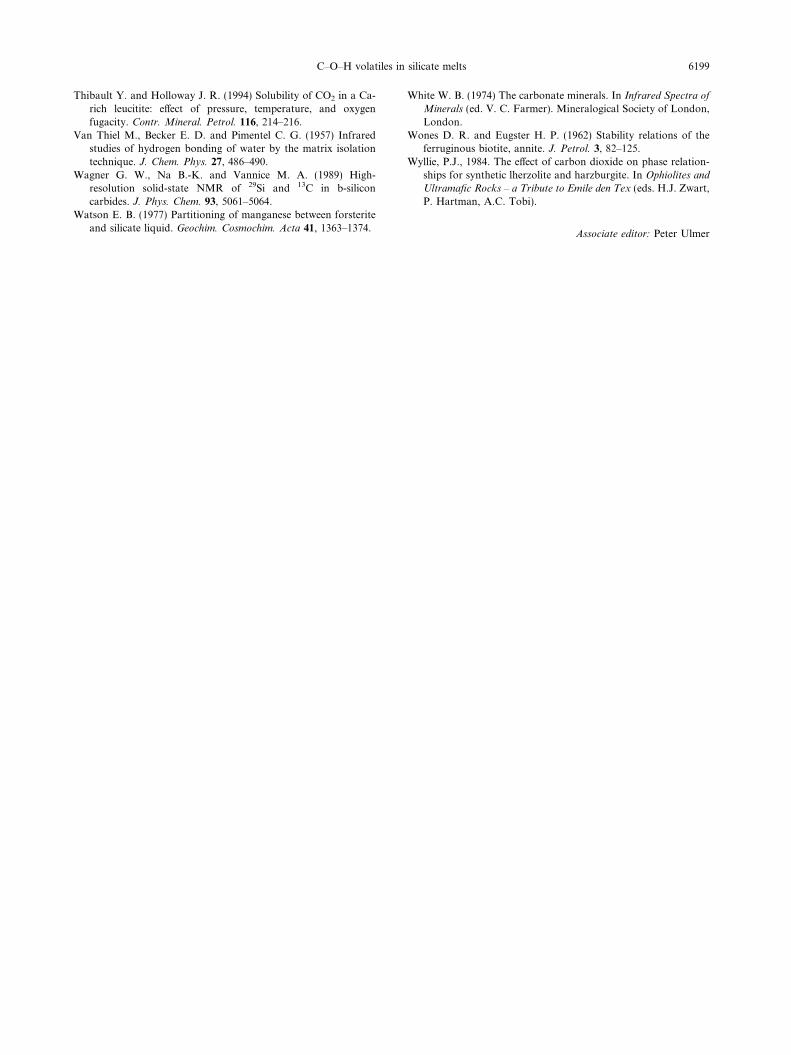
C–O–H volatiles in silicate melts 6199
Thibault Y. and Holloway J. R. (1994) Solubility of CO2 in a Ca-rich leucitite: effect of pressure, temperature, and oxygenfugacity. Contr. Mineral. Petrol. 116, 214–216.
Van Thiel M., Becker E. D. and Pimentel C. G. (1957) Infraredstudies of hydrogen bonding of water by the matrix isolationtechnique. J. Chem. Phys. 27, 486–490.
Wagner G. W., Na B.-K. and Vannice M. A. (1989) High-resolution solid-state NMR of 29Si and 13C in b-siliconcarbides. J. Phys. Chem. 93, 5061–5064.
Watson E. B. (1977) Partitioning of manganese between forsteriteand silicate liquid. Geochim. Cosmochim. Acta 41, 1363–1374.
White W. B. (1974) The carbonate minerals. In Infrared Spectra of
Minerals (ed. V. C. Farmer). Mineralogical Society of London,
London.
Wones D. R. and Eugster H. P. (1962) Stability relations of theferruginous biotite, annite. J. Petrol. 3, 82–125.
Wyllie, P.J., 1984. The effect of carbon dioxide on phase relation-ships for synthetic lherzolite and harzburgite. In Ophiolites and
Ultramafic Rocks – a Tribute to Emile den Tex (eds. H.J. Zwart,P. Hartman, A.C. Tobi).
Associate editor: Peter Ulmer