Thought Experiments, Hypotheses, and Cognitive Dimension of Literary Fiction

This article appeared in a journal published by Elsevier. The attachedcopy is furnished to the author for internal non-commercial researchand education use, including for instruction at the authors institution
and sharing with colleagues.
Other uses, including reproduction and distribution, or selling orlicensing copies, or posting to personal, institutional or third party
websites are prohibited.
In most cases authors are permitted to post their version of thearticle (e.g. in Word or Tex form) to their personal website orinstitutional repository. Authors requiring further information
regarding Elsevier’s archiving and manuscript policies areencouraged to visit:
http://www.elsevier.com/copyright

Author's personal copy
Hydrology, environment (Pedology)
Soil processes and functions across an international network ofCritical Zone Observatories: Introduction to experimental methodsand initial results
Processus pedologiques et fonctions des sols au travers d’un reseau international
d’Observatoires de la Zone Critique : introduction aux methodes experimentales et
resultats preliminaires
Steven Banwart a,*, Manoj Menon a, Stefano M. Bernasconi b, Jaap Bloem c, Winfried E.H. Blum d,Danielle Maia de Souza e, Brynhildur Davidsdotir f, Christopher Duffy g, Georg J. Lair d,Pavel Kram h, Anna Lamacova h, Lars Lundin i, Nikolaos P. Nikolaidis j, Martin Novak h,Panos Panagos e, Kristin Vala Ragnarsdottir f, Brian Reynolds k, David Robinson k,Svetla Rousseva l, Peter de Ruiter c, Pauline van Gaans m, Liping Weng c, Tim White n, Bin Zhang o
a Kroto Research Institute, University of Sheffield, North Campus, Broad Lane, Sheffield S3 7HQ, United Kingdomb Geological Institute, ETH Zurich, Sonneggstrasse 5, 8092 Zurich, Switzerlandc Wageningen University, Droevendaalsesteeg 4, Postbox 47, 6700 AA Wageningen, The Netherlandsd University of Natural Resources and Life Sciences (BOKU), Vienna, Peter-Jordan-Street 82, 1190 Vienna, Austriae European Commission, Joint Research Centre, Institute for Environment and Sustainability, Via E. Fermi 2749, 21027 Ispra, VA, Italyf School of Engineering and Natural Sciences, University of Iceland, VRII, Hjardarhagi 2-6, 107, Reykjavık, Icelandg Department of Civil and Environmental Engineering, The Pennsylvania State University, 231G Sackett Building, University Park, PA 16802, United States of Americah Czech Geological Survey, Klarov 3, 118 21 Prague 1, Czech Republici Department of Aquatic Sciences and Assessment, Swedish University of Agricultural Sciences, PO Box 7050, 750 07 Uppsala, Swedenj Department of Environmental Engineering, Technical University of Crete, Polytechnioupolis, 73100 Chania, Crete, Greecek NERC Centre for Ecology & Hydrology Environment Centre, Wales Deiniol Road, Bangor Gwynedd LL57 2UW, United Kingdoml Soil Erosion Department, Institute of Soil Science, Sofia 1080, Bulgariam Deltares, PO Box 85467, 3508 AL Utrecht, The Netherlandsn Earth and Environmental Systems Institute, The Pennsylvania State University, 2217 Earth & Engineering Sciences Building, 225B University Park, PA 16802,
United States of Americao Department of Soil Science, Institute of Agricultural Resources and Regional Planning, Chinese Academy of Agricultural Sciences, Zhongguancun Nan Da Jie 12,
Beijing 100081, China
C. R. Geoscience 344 (2012) 758–772
A R T I C L E I N F O
Article history:
Received 31 July 2012
Accepted after revision 22 October 2012
Available online 24 November 2012
Written on invitation of the
Editorial Board
A B S T R A C T
Growth in human population and demand for wealth creates ever-increasing pressure on
global soils, leading to soil losses and degradation worldwide. Critical Zone science studies
the impact linkages between these pressures, the resulting environmental state of soils,
and potential interventions to protect soil and reverse degradation. New research on soil
processes is being driven by the scientific hypothesis that soil processes can be described
along a life cycle of soil development. This begins with formation of new soil from parent
material, development of the soil profile, and potential loss of the developed soil functions
and the soil itself under overly intensive anthropogenic land use, thus closing the cycle.
Four Critical Zone Observatories in Europe have been selected focusing research at sites
* Corresponding author.
E-mail address: [email protected] (S. Banwart).
Contents lists available at SciVerse ScienceDirect
Comptes Rendus Geoscience
w ww.s c ien ced i rec t . c o m
1631-0713/$ – see front matter � 2012 Academie des sciences. Published by Elsevier Masson SAS. All rights reserved.
http://dx.doi.org/10.1016/j.crte.2012.10.007

Author's personal copy
1. Introduction
Increasing global population, estimated to reach9 billion by 2050, is placing ever-increasing pressure onnatural resources, soils being no exception (Banwart,2011), with the need to feed, clothe and shelter so many.
Traditionally, soils have been largely managed with asingle use in mind, primarily for food, feed or fibreproduction. However, soils provide other importantfunctions (Blum, 2006) including supporting and sustain-ing our terrestrial ecosystems, regulating the atmospherethrough carbon storage, filtering water, recycling waste,
that represent key stages along the hypothetical soil life cycle; incipient soil formation,
productive use of soil for farming and forestry, and decline of soil due to longstanding
intensive agriculture. Initial results from the research show that soil develops important
biogeochemical properties on the time scale of decades and that soil carbon and the
development of favourable soil structure takes place over similar time scales. A new
mathematical model of soil aggregate formation and degradation predicts that set-aside
land at the most degraded site studied can develop substantially improved soil structure
with the accumulation of soil carbon over a period of several years. Further results
demonstrate the rapid dynamics of soil carbon; how quickly it can be lost, and also
demonstrate how data from the CZOs can be used to determine parameter values for
models at catchment scale. A structure for a new integrated Critical Zone model is
proposed that combines process descriptions of carbon and nutrient flows, a simplified
description of the soil food web, and reactive transport; all coupled with a dynamic model
for soil structure and soil aggregation. This approach is proposed as a methodology to
analyse data along the soil life cycle and test how soil processes and rates vary within, and
between, the CZOs representing different life cycle stages. In addition, frameworks are
discussed that will help to communicate the results of this science into a more policy
relevant format using ecosystem service approaches.
� 2012 Academie des sciences. Published by Elsevier Masson SAS. All rights reserved.
R E S U M E
L’augmentation de la population humaine et sa quete de richesses creent une pression
toujours croissante sur les sols du globe, creant pertes et degradation de sols a l’echelle
mondiale. La science de la Zone Critique etudie les relations d’impact entre ces pressions
et, l’etat environnemental des sols qui en resulte et les interventions potentielles pour la
protection des sols et le renversement de la tendance a la degradation. Une nouvelle
recherche sur les processus pedologiques est pilotee par l’hypothese scientifique selon
laquelle les processus pedologiques peuvent etre decrits au long d’un cycle de vie de
developpement du sol. Ceci commence avec la formation d’un sol neuf a partir du
materiau parental, puis il y a developpement d’un profil de sol et perte potentielle des
fonctions d’un sol developpe et du sol lui-meme, en raison de son utilisation beaucoup
trop intensive par l’homme, ceci cloturant le cycle. Quatre observatoires europeens de la
zone critique ont ete selectionnes, focalisant la recherche sur des sites representant des
etapes cle au long du cycle hypothetique de vie du sol : formation naissante d’un sol;
utilisation productive du sol pour l’agriculture et les forets ; et declin du sol du a une
agriculture intensive de longue duree. Les resultats preliminaires de la recherche
montrent que le sol developpe des proprietes bio-geochimiques importantes a l’echelle de
la decennie et que le carbone du sol et la structure favorable du sol se mettent en place sur
une echelle similaire de temps. Un nouveau modele mathematique sur la formation et la
degradation des agregats du sol predit qu’une terre laissee a l’abandon pres du site etudie
le plus degrade, peut developper une structure substantiellement amelioree, avec
accumulation de carbone dans le sol sur une periode de quelques annees. Des resultats
ulterieurs demontrent la dynamique rapide du carbone du sol- comment il peut etre
perdu rapidement - et demontrent aussi comment les donnees de CZOs peuvent etre
prises en compte pour determiner les parametres a utiliser pour les modeles a l’echelle du
bassin. Une structure pour un nouveau modele integre de Zone Critique est proposee,
combinant les descriptions de traitement des flux de carbone et de nutriments, une
description simplifiee ce qui constitue la nourriture du sol et le transport reactif, tout ceci
couple a un modele dynamique pour la structure du sol et l’agregation du sol. Cette
approche est proposee comme methodologie pour analyser les donnees acquises au long
du cycle de vie du sol et pour tester comment les processus pedologiques et leurs vitesses
varient au sein d’un site et d’un site a l’autre, CZOs representant differents stades du cycle
de vie. En outre, des reseaux sont en discussion, qui aideraient a communiquer les
resultats scientifiques acquis dans un format relevant plus de la politique, utilisant les
approches de services ecosystemiques.
� 2012 Academie des sciences. Publie par Elsevier Masson SAS. Tous droits reserves.
Keywords:
Soil management
Sustainability
Critical zone
Observatory
Mathematical modeling
Mots cles :
Gestion des sols
Durabilite
Zone critique
Observatoire
Modelisation mathematique
S. Banwart et al. / C. R. Geoscience 344 (2012) 758–772 759

Author's personal copy
preserving heritage, acting as an aesthetic and culturalresource, whilst maintaining a vital gene pool andbiological resource from which many of our antibioticshave been derived (D’Costa et al., 2006). The increasingintensity of land use means greater demands on theservices that soils deliver, compounded by soil degradationworldwide. Increasing pressures mean that solutions toland management that can be sustained beyond the nextgeneration will require far more optimal use of soils todeliver multiple functions simultaneously, while avoidingand reversing land degradation.
The European Union has recognized the vulnerability ofthe soil resource that needs to be protected (Blum et al.,2004) through the ‘Soil Thematic Strategy’ regarding soilprotection (COM(2006) 231). The communication(COM(2006) 231) sets the framework explaining whyfurther action is needed at EU level, and provides theoverall objective of the Strategy. It is considered thatwithin this common framework (COM(2006) 232), the EUMember States will be able to decide how best to protecttheir soil in a sustainable way. The Soil Thematic Strategyidentifies eight major threats to soils based on the impactassessment. The threats are estimated, on an annual basis,to cost the EU billions of Euros: erosion (s0.7–14.0 billion),organic matter decline (s3.4–5.6 billion), compaction (noestimate possible), salinization (s158–321 million), land-slides (up to s1.2 billion per event), contamination (s2.4–17.3 billion), sealing (no estimate possible), and biodiver-sity decline (no estimate possible).
Common to all of these soil threats is that theircause, impact, remediation and management go beyondthe confines of the classically defined 1–2 meter soilprofile used for inventories. The Thematic Strategyincludes within the definition of soil the full depth of
unconsolidated material below the ground surface to thebedrock. This draws strong parallels with the concept ofEarth’s Critical Zone (NRC, 2001), defined as the terrestrialenvironment extending from the top of the vegetationcanopy to the bottom of drinking water aquifers (Fig. 1).Critical Zone science addresses the environmental pro-cesses that are linked ‘‘from tree-top to bedrock’’. Itprovides an integrating framework to both understand,and better manage, the Critical Zone, including its vitalsoil layer.
A central issue addressed by the Soil Thematic Strategyrevolves around the need for closer links between science,management and policy for decision making. The proposedDPSIR framework (Fig. 2, Blum et al., 2004) outlines theimpact chain that occurs due to environmental change. Itconsiders how socio-economic driving forces (D), developpressures (P) on the environment, resulting in a change inthe state (S) of the environment, which creates impacts (I)that give rise to unintended or managed responses (R) fromthe population who are affected. Analysis of this impactchain requires substantial scientific evidence from studiesof Earth surface and ecosystem processes, and helpsidentify where in the chain to adapt human activity tomitigate or manage the effects of environmental change.
The actions of the Thematic Strategy for Soil Protectioninclude conducting scientific research that develops theevidence base for effective policy to protect and enhancesoil functions. One strand of current research includes thedevelopment of Critical Zone Observatories, i.e. researchfield sites for the multidisciplinary study of soil processesand their impact chain linkages within Earth’s Critical Zone(the SoilTrEC project, Banwart et al., 2011). The overarch-ing hypothesis for this research is that the development ofsoil functions, which include a range of economic services,
Fig. 1. A Critical Zone hillslope profile. This diagram represents the material and energy flows that arise from environmental processes of the Critical Zone
and that supply goods and services for human benefit. The large arrows represent material and energy flows and the resulting goods and services are listed
in large, bold type. Light type lists the main environmental components of the Critical Zone (adapted from Banwart et al., 2012).
Fig. 1. Zone critique de profil de haut de pente. Le diagramme represente les flux de materiaux et d’energie qui resultent des processus environnementaux
de la zone critique et qui produisent des biens et services au benefice de l’homme. Les grandes fleches correspondent aux flux de materiaux et d’energie et
les effets et services qu’ils generent sont listes en caracteres gras. Les caracteres maigres representent les principaux composants environnementaux de la
zone critique (adapte de Banwart et al., 2012).
S. Banwart et al. / C. R. Geoscience 344 (2012) 758–772760

Author's personal copy
occurs within a conceptual life cycle of soil functions(Fig. 3).
This cycle starts with the exposure of rock or depositionof sediment as parent material at the land surface whereweathering and pedogenesis occur. Soil developmentprogresses but is modified by human activity (Richteret al., 2011) or environmental change that drives Earthsurface conditions to a point where changes of soilfunctionality occur. This change is often detrimental tohuman sustainable development; potentially includingcomplete loss of the bulk material through physicalerosion. The experimental design to test this hypothesisis to quantify soil processes and functions throughout thesoil life cycle; from the earliest stages of soil formation tosoils that have been heavily impacted by millennia ofintensive human activity.
A more detailed extension of this hypothesis is that thedevelopment of soil structure is a key determinant of soilprocesses and soil functions, at the different stages of thesoil life cycle (Banwart et al., 2011). Soil structure ischaracterised by the particle size mass distribution of soilaggregates. As rock breaks down physically and dissolvesduring soil formation, fragments of primary rock particlesand secondary mineral precipitates bind together withdecaying biomass and living microbes to form soilaggregates. Empirical evidence suggests that agronomi-cally productive soils coincide with conditions wheregreater than 60% of the dry soil mass occurs as aggregateswith a relatively greater size, i.e. above 250 mm (Shein,
2005). This favourable soil state can similarly be char-acterised by the inflection point on the water retentioncurve (Dexter, 2004a, 2004b, 2004c).
A conceptual model for this soil state includes capillarypore space within aggregates to hold sufficient moisture tosupport microbial activity for nutrient transformations, alsosufficient capillary pore space between aggregates to supplyplant roots with water, but with sufficient macropore spacebetween aggregates to otherwise allow the soil to drain andallow ingress of O2 to support root and microbial respiration(Victoria et al., 2012). Larger aggregates also coincide withyoung organic matter that provides a reservoir of N and Pnutrients, and a carbon and energy source for microbialactivity that degrades the organic matter and transforms theN and P for plant availability (see e.g. Tisdall and Oades(2012) and included references). Secondary clay and oxideminerals within aggregates can adsorb and maintain areservoir of inorganic phosphorous, preventing its loss togroundwater recharge and runoff. The mineral surfaces canalso sequester and reduce the bioavailability of heavymetals and organic pollutants as potentially toxic con-taminants that may adversely impact microbial activity andplant productivity.
The main objectives of the research are to:
� provide a fundamental description of how soil structureimpacts processes and functions at soil profile scale;� establish Critical Zone Observatories to focus the study of
soil and related processes at field scale;
Fig. 2. Drivers-Pressures-State-Impact-Response (DPSIR) impact chain for policy intervention to sustain Critical Zone goods and services using examples
arising from soil. Scenario analysis of CZ State and impacts arising from environmental change can be used to assess trade-offs between various policy and
management options for intervention within the DPSIR impact chain.
Fig. 2. Chaıne d’impact Causes–Pressions–Etat–Impact- Reponse (DPSIR) afin que les interventions de type politique soutiennent les biens et services
utilisant des exemples tires de sols. L’analyse du scenario relatif a l’Etat de la zone critique (CZ) et aux impacts dus aux changements environnementaux
peut etre utilisee pour l’evaluation de la balance des charges entre les options variees de politique et de gestion, en vue d’une intervention dans la chaıne
d’impact DPSIR.
S. Banwart et al. / C. R. Geoscience 344 (2012) 758–772 761

Author's personal copy
� develop a CZ integrated mathematical model of soilprocesses and functions;� create a GIS-based modelling framework to delineate soil
threats and assess mitigation at EU scale;� demonstrate how environmental change can impact soil
function and ecosystem services;� form with international partners a global network of
CZOs for soils and related research;� design a future experiment to quantify soil processes and
rates along global environmental gradients of climate,lithology and land use.
The overarching method for this experimental design isdescribed below, together with a range of initial resultsand discussion of how this type of multidisciplinaryresearch can be integrated to create interdisciplinarysolutions to global soil threats.
2. Summary of experimental method and data analysisthrough mathematical modelling
The observatory method applied here has several keyfeatures in common with other Earth/ecological observa-tory approaches in natural sciences research. Theseinclude being strongly hypothesis driven with couplingin experimental design between mathematical modelling,
particularly numerical simulation, and experimentalobservation. Measurements including observations froma range of spatial scales from molecular, through those ofmicrobial populations, soil grains, soil profiles, catch-ments and river basins, to whole continents (Andersonet al., 2004; Brantley et al., 2006). Observations also span alarge range of temporal scales. These include rapid(seconds–minutes), real-time sensing of fluctuations inenvironmental variables such as meteorological condi-tions, water flow, solute composition and transport.Measurements that are not made in real time includedaily - decadal field sampling campaigns to retrieve andstudy samples. The measurement of proxy variablescaptures long-term geological changes in regolith com-position and movement, and the biological evolution ofEarth’s surface, often employing the study of geologicalchronosequences (Brantley et al., 2007).
In order to test the overarching hypothesis, this studyselected four principal CZOs at different stages along theSoil Life Cycle (listed in Fig. 3):
� Damma Glacier Forefield CZO, Switzerland. The initialstages of soil formation are studied along a chronose-quence established by retreat of the glacier during thepast 150 years. Bedrock and deposited parent materialare exposed at the ice face, with soil profiles established
Fig. 3. The life cycle of soil functions and four main CZOs selected to represent key stages around the cycle. The Damma Glacier site provides a
chronosequence of newly forming young soil as it develops from bedrock and glacial outwash deposits that are exposed during the retreat of the glacier; this
has occurred over the past two centuries. The Fuchsenbigl-Marchfeld and Lysina CZOs represent currently productive arable farmland and plantation forest,
respectively. The Koiliaris River Basin CZO represents mature, intensive agricultural land management over periods of centuries to millennia and is under
threat from modern climate change predicted for the Mediterranean Basin.
Fig. 3. Deroulement du cycle de vie du sol et quatre CZOs principales, selectionnees pour representer les etapes cle au long du cycle. Le site de Damma
Glacier fournit une chronosequence de sol jeune nouvellement forme, tel qu’il se developpe a partir de la roche mere et de depots glaciaires exposes lors du
retrait du glacier ; ceci s’est produit lors des deux derniers siecles passes. Les CZOs de Fuchsenbigl-Marchfeld et Lysina representent generalement des terres
productives pour la culture et la plantation forestiere, respectivement. La CZO du bassin de la riviere Koiliaris represente une terre mature, cultivee de
maniere intensive sur des periodes s’etalant de plusieurs siecles a plusieurs millenaires; elle est sous la menace du changement climatique moderne, predit
sur le Bassin mediterraneen.
S. Banwart et al. / C. R. Geoscience 344 (2012) 758–772762

Author's personal copy
over increasingly longer time periods along a transectaway from the glacier (Bernasconi and BigLink ProjectMembers, 2008; Bernasconi et al., 2011);� The Lysina Catchment CZO, Czech Republic. The mono-
culture spruce forest plantation is actively managed fortimber production and has been heavily impacted byacid deposition during the latter half of the 20th centurywith ongoing recovery due to decreasing acid loadingduring the past 2 decades (Kram et al., 2012);� The Fuchsenbigl-Marchfeld CZO, Austria. Long-term soil
development under various land use including forest,grassland and cropland is studied through a chronose-quence of fluvially deposited sediments, from currentlyongoing deposition and erosion near the river channel tofluvial terraces formed during the Holocene some kmaway from the river (Fiebig et al., 2009; Lair et al., 2009);� The Koiliaris River Basin CZO, Crete, Greece. The impact
of century- to millennia- long intensive land use forgrazing and arable farming is studied at elevation stagesfrom arable land in the coastal zone to grazing in theuplands reaching peaks of > 2000 m (Moraetis et al.,2010). These soils are under threat from both long-termintensive agriculture and also desertification pressuredue to the anticipated effects of modern climate changein the Mediterranean basin (IPCC, 2007).
Additional sites are included in the experimentaldesign, as an international network of CZOs. This secondtier of sites expands the range of environmental conditionsfor the field data, and provides additional data sets to testnew integrated mathematical models of soil functions thatare developed from observations at the four main sites. Theadditional sites have been previously described (Banwartet al., 2011) and include The Red Soil Experimental StationCZO (Jiangxi, China), The Plynlimon Experimental Catch-ments CZO (Wales, UK), The Strengbach Catchment CZO(France), The Kindla Forest CZO (Sweden), The Shale HillsCatchment CZO (Pennsylvania, USA), and The Clear CreekWatershed CZO (Iowa, USA). The 1st-tier, four main CZOsare summarized in Table 1.
The methodology to test the role of soil structure in thedevelopment of soil processes and soil functions is basedon measurements on new soil cores obtained at the fourCZOs. The selected measurement methods have beensummarized previously (Banwart et al., 2011), andinclude analysis of a range of physical, geochemical andbiological soil properties. This data is used to parameter-ise a series of mathematical models of soil processes,which include:
� water flow and solute transport;� geochemical speciation and physical-chemical aggregate
stability;� weathering kinetics and acid-base dynamics of mineral
dissolution;� carbon dynamics, nutrient transformations and bioavail-
ability of C, N and P;� soil food web dynamics.
The results from these model calculations are com-pared to additional observations in small plot studies at
the four CZOs. These studies are based on installation oflysimeter nests and analysis of pore fluid chemistry andselected stable isotopes. The calculated state variables forthe various models include fluxes of water, solutes andparticulates and element transformations as solutesources and sinks. Of particular importance is theinference of process rates from the model results, inorder to quantify the relative contribution of soilprocesses to element mass and flux balances for soilprofiles at the different field sites. The sampling strategyfor soil cores at each site includes replicate cores withinand between different locations at each site, in order toquantify uncertainty in process rates when comparing thedifferent stages of the life cycle.
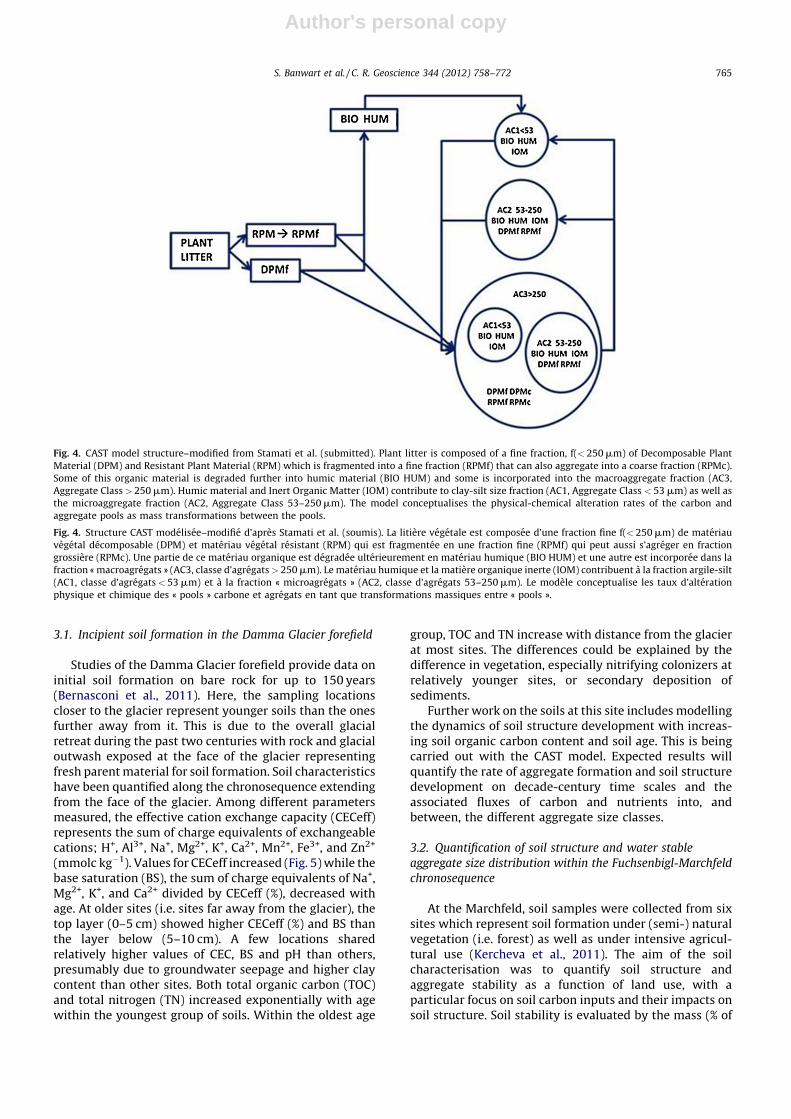
A new mathematical model has been developed dealingwith Carbon dynamics and Aggregate STability (CAST). Themodel conceptualises carbon inputs and degradation in theformation and destruction of soil aggregates and resultingchanges in the aggregate size distribution, which is beingtested on the soil profile data obtained from the CZO’s. TheCAST model describes the aggregate size distribution withthree size classes. We define the smallest size aggregates as< 50 mm and refer to them as the clay-silt fraction;microaggregates, 50–250 mm; and macroaggregates,> 250 mm), and conceptualize carbon dynamics as masstransfers between the inputs of litter and root/mycorrhizaand, for each aggregate size fraction: (1) below groundliving biomass; (2) degradable dead carbon; and (3)occluded and sorbed organic carbon that is resistant todegradation. Inputs to the model are the flux of carbon intothe soil, primary particles describing soil texture, and rateconstants for carbon transformation between the poolsderived from previous studies of soil carbon dynamics(Nikolaidis and Bidoglio, 2013; Stamati et al., in revision;Stamati et al., submitted), and rate constants for aggrega-tion within and between particle size fractions to describedynamic changes in soil structure (Fig. 4).
These state variables are then used to calculate changesto bulk soil properties including porosity, density, carboncontent, water and gas permeability, and gas diffusivity.Soil organic carbon is an important starting point formodelling soil aggregation. Future work could incorporateother factors such as site-specific mineralogy, inorganiccarbon and sesquioxides and their role in aggregateformation and stability.
3. Initial results
In this section, we present a synthesis of fieldobservations and modelling results from different CZOs,building primarily on previously published work. The aimof this synthesis is to showcase examples of data sets andmodelling approaches across a range of scales from soilprofile to catchments. There are not yet comprehensiveresults for any single site, and combined field experi-mentation and mathematical modelling is ongoing.The measurement and modelling results presentedhere illustrate how integration through mathematicalmodelling is being used to advance new knowledge thatlinks soil structure to soil processes and Critical Zoneservices.
S. Banwart et al. / C. R. Geoscience 344 (2012) 758–772 763

Author's personal copy
Table 1
SoilTrEC CZO site descriptions.
Tableau 1
Sol TrEC CZO : descriptions des sites.
Bedrock and soil Geochemistry Meteorology and hydrology
Damma Glacier Forefield CZO, SwitzerlandCoarse-grained greeenschist facies metamorphic
granite of the Aare massif
Various metagranites with variations in the relative
mineral proportions and grain size are also present
The composition of the bedrock and soils along the
chronosequence is relatively constant
Soils classified as hyperskeletic leptosols
Soils forming over bare rocks and till are 50–80%
sand, 10–50% silt, < 4% clay, poorly structured
with vertical zoning only in the older soils
Dominant minerals: quartz, plagioclase,
potassium feldspar, biotite and muscovite;
epidote is present in significant amounts,
also as inclusions in plagioclase
Accessory minerals include magnetite
chlorite and apatite
Soil pH in 0.01 M CaCl2 decreases with
soil age from pH 5.5 in young soils to
pH 3.6 in the older soils
Base saturation varies greatly, broadly
decreases from 70–80% to 40–50% from
younger to older soils
Soil mineralogy closely reflects parent
bedrock
Reference soils outside the glaciated
forefield: typically up to 10 wt.% TOC,
500–750 ppm Total P, 0.6–0.8% Total N
Average precipitation 2300 mm yr�1
water equivalent, about half of which
falls as snow; surface runoff
2700 mm yr�1, augmented by glacial
meltwater; estimated
evapotranspiration 70 mm yr�1
Snow cover c180 days of per year
Mean air temperature 2.2 8C, annual
maximum temperature 21.5 8C, annual
minimum temperature �21 8C
Lysina Experimental Catchment CZO, Czech RepublicBase-poor, coarse-grained leucogranite
Dominant soil type is folic albic skeletic podzol
Mean soil depth 1 m
Leucogranite dominated by feldspars and quartz,
low biotite content
Soil minerals: quartz, albite, orthoclase,
amorphous Al, and muscovite
Minor minerals: topaz, anatase, chlorite,
hematite, tourmaline, and apatite
Concentrations of organic C in the albic
eluvial (E) horizon are low, higher
concentrations are in the spodic B horizon,
and lower concentrations in the C horizon
Soil concentrations of N within horizons have
a similar trend with depth as organic C
Soil pH in water decreases with depth from
3.4 to 4.2
Average precipitation 980 mm yr�1,
surface runoff 460 mm yr�1, estimated
evapotranspiration 520 mm yr�1
Snow cover c120 days per year
Mean air temperature 5.3 8C, mean
maximum temperature 10.1 8C,
mean minimum temperature 1.4 8C
Fuchsenbigl-Marchfeld Agricultural Field Station CZO, AustriaIncised basin fill and alpine meltwater terraces
Up to 20 m of gravel covered in places by several
meters of fine sediments, mainly silt and fine sands
Soils classify mainly as fluvisols close to the river and
chernozems with increasing distance from the river
Soil ages include fresh sediments to sediments
deposited more than 6000 years ago
(Lair et al., 2009)
Soil mineralogy of calcite, dolomite, quartz,
plagioclase, K-feldspar and mica
Clay mineralogy dominated by illite and
chlorite (Lair et al., 2007)
Soil carbonate contents and particle size
distributions are similar along the soil
chronosequence (Lair et al., 2007)
Soil pH varies in a narrow range above
neutral
Organic carbon contents in the topsoil
are strongly influenced by soil age and
land use (Zehetner et al., 2009)
Average precipitation 531 mm yr�1;
no surface runoff with infiltration
25–75 mm yr�1; evapotranspiration
potential 566 mm yr�1
Annual average days of snow cover:
33 days per year
Mean air temperature 9.4 8C, annual
maximum temperature 35 8C, annual
minimum temperature �12 8C
Koiliaris Experimental Watershed CZO, Greece (Crete)71.8% of watershed on limestones, dolomites,
marbles, and re-crystallized limestones with
cherts (Plattenkalk, Tripolis, Trypali series),
9.5% calcaric marls in Neogene formations, 6.1%
marls in Neogene formations; 6.1% schists and
6.4% Quaternary alluvial deposits
Thin poorly developed soils follow regional lithology
Soils in limestones correspond to alpine humic Ranker
type and Podzols mixed with forest acid red soil
with calcaric Lithosols at higher altitudes
Soils in Neogene and Alluvial formations are thicker
than on other formations with profiles of
calcareous rendzines soil
Calcaric regosols are developed in Neocene and
Alluvial formations at low altitude
Thin horizons of Eutric lithosols with mainly coarse
texture are developed in schists
Dominant mineral phases are illite,
muscovite, kaolinite, paragonite, quartz,
feldspars, calcite, chlorite and hematite/
goethite, with about 30% clay mineral
abundance
Soil pH 7.6–7.9
pH range of 7.6–7.9 typifies Karstic
groundwater
Karstic groundwater with D.O.
6.3–7.8 mg/L and +300 mV Eh
2–4 m well in neogene deposits pH 7.2,
D.O. 4.9 mg/L, 15 mg/L NO3�N
Watershed altitude increases from sea
level to 2500 m
Average precipitation 1363 mm yr�1,
surface runoff 621 mm yr�1, estimated
evapotranspiration 455 mm yr�1
Snow cover 100–140 days/year, varying
with altitude
Mean air temperature at sea level 18.8 8C,
mean minimum air temperature 15.2 8C,
mean maximum air temperature 22.5 8C,
with a temperature gradient with
altitude of �5.6 8C/1000 m
Adapted from Banwart et al. (2011).
S. Banwart et al. / C. R. Geoscience 344 (2012) 758–772764
Author's personal copy
3.1. Incipient soil formation in the Damma Glacier forefield
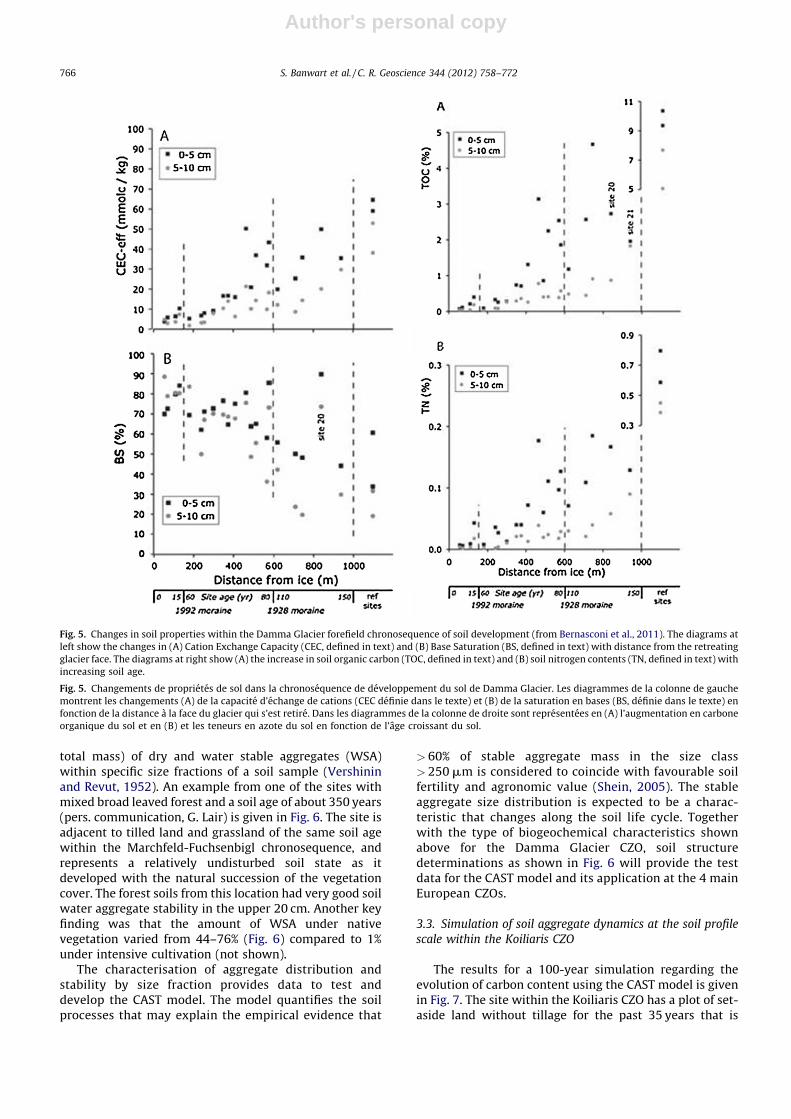
Studies of the Damma Glacier forefield provide data oninitial soil formation on bare rock for up to 150 years(Bernasconi et al., 2011). Here, the sampling locationscloser to the glacier represent younger soils than the onesfurther away from it. This is due to the overall glacialretreat during the past two centuries with rock and glacialoutwash exposed at the face of the glacier representingfresh parent material for soil formation. Soil characteristicshave been quantified along the chronosequence extendingfrom the face of the glacier. Among different parametersmeasured, the effective cation exchange capacity (CECeff)represents the sum of charge equivalents of exchangeablecations; H+, Al3+, Na+, Mg2+, K+, Ca2+, Mn2+, Fe3+, and Zn2+
(mmolc kg�1). Values for CECeff increased (Fig. 5) while thebase saturation (BS), the sum of charge equivalents of Na+,Mg2+, K+, and Ca2+ divided by CECeff (%), decreased withage. At older sites (i.e. sites far away from the glacier), thetop layer (0–5 cm) showed higher CECeff (%) and BS thanthe layer below (5–10 cm). A few locations sharedrelatively higher values of CEC, BS and pH than others,presumably due to groundwater seepage and higher claycontent than other sites. Both total organic carbon (TOC)and total nitrogen (TN) increased exponentially with agewithin the youngest group of soils. Within the oldest age
group, TOC and TN increase with distance from the glacierat most sites. The differences could be explained by thedifference in vegetation, especially nitrifying colonizers atrelatively younger sites, or secondary deposition ofsediments.
Further work on the soils at this site includes modellingthe dynamics of soil structure development with increas-ing soil organic carbon content and soil age. This is beingcarried out with the CAST model. Expected results willquantify the rate of aggregate formation and soil structuredevelopment on decade-century time scales and theassociated fluxes of carbon and nutrients into, andbetween, the different aggregate size classes.
3.2. Quantification of soil structure and water stable
aggregate size distribution within the Fuchsenbigl-Marchfeld
chronosequence
At the Marchfeld, soil samples were collected from sixsites which represent soil formation under (semi-) naturalvegetation (i.e. forest) as well as under intensive agricul-tural use (Kercheva et al., 2011). The aim of the soilcharacterisation was to quantify soil structure andaggregate stability as a function of land use, with aparticular focus on soil carbon inputs and their impacts onsoil structure. Soil stability is evaluated by the mass (% of
Fig. 4. CAST model structure–modified from Stamati et al. (submitted). Plant litter is composed of a fine fraction, f(< 250 mm) of Decomposable Plant
Material (DPM) and Resistant Plant Material (RPM) which is fragmented into a fine fraction (RPMf) that can also aggregate into a coarse fraction (RPMc).
Some of this organic material is degraded further into humic material (BIO HUM) and some is incorporated into the macroaggregate fraction (AC3,
Aggregate Class > 250 mm). Humic material and Inert Organic Matter (IOM) contribute to clay-silt size fraction (AC1, Aggregate Class < 53 mm) as well as
the microaggregate fraction (AC2, Aggregate Class 53–250 mm). The model conceptualises the physical-chemical alteration rates of the carbon and
aggregate pools as mass transformations between the pools.
Fig. 4. Structure CAST modelisee–modifie d’apres Stamati et al. (soumis). La litiere vegetale est composee d’une fraction fine f(< 250 mm) de materiau
vegetal decomposable (DPM) et materiau vegetal resistant (RPM) qui est fragmentee en une fraction fine (RPMf) qui peut aussi s’agreger en fraction
grossiere (RPMc). Une partie de ce materiau organique est degradee ulterieurement en materiau humique (BIO HUM) et une autre est incorporee dans la
fraction « macroagregats » (AC3, classe d’agregats > 250 mm). Le materiau humique et la matiere organique inerte (IOM) contribuent a la fraction argile-silt
(AC1, classe d’agregats < 53 mm) et a la fraction « microagregats » (AC2, classe d’agregats 53–250 mm). Le modele conceptualise les taux d’alteration
physique et chimique des « pools » carbone et agregats en tant que transformations massiques entre « pools ».
S. Banwart et al. / C. R. Geoscience 344 (2012) 758–772 765
Author's personal copy
total mass) of dry and water stable aggregates (WSA)within specific size fractions of a soil sample (Vershininand Revut, 1952). An example from one of the sites withmixed broad leaved forest and a soil age of about 350 years(pers. communication, G. Lair) is given in Fig. 6. The site isadjacent to tilled land and grassland of the same soil agewithin the Marchfeld-Fuchsenbigl chronosequence, andrepresents a relatively undisturbed soil state as itdeveloped with the natural succession of the vegetationcover. The forest soils from this location had very good soilwater aggregate stability in the upper 20 cm. Another keyfinding was that the amount of WSA under nativevegetation varied from 44–76% (Fig. 6) compared to 1%under intensive cultivation (not shown).
The characterisation of aggregate distribution andstability by size fraction provides data to test anddevelop the CAST model. The model quantifies the soilprocesses that may explain the empirical evidence that
> 60% of stable aggregate mass in the size class> 250 mm is considered to coincide with favourable soilfertility and agronomic value (Shein, 2005). The stableaggregate size distribution is expected to be a charac-teristic that changes along the soil life cycle. Togetherwith the type of biogeochemical characteristics shownabove for the Damma Glacier CZO, soil structuredeterminations as shown in Fig. 6 will provide the testdata for the CAST model and its application at the 4 mainEuropean CZOs.
3.3. Simulation of soil aggregate dynamics at the soil profile
scale within the Koiliaris CZO
The results for a 100-year simulation regarding theevolution of carbon content using the CAST model is givenin Fig. 7. The site within the Koiliaris CZO has a plot of set-aside land without tillage for the past 35 years that is
Fig. 5. Changes in soil properties within the Damma Glacier forefield chronosequence of soil development (from Bernasconi et al., 2011). The diagrams at
left show the changes in (A) Cation Exchange Capacity (CEC, defined in text) and (B) Base Saturation (BS, defined in text) with distance from the retreating
glacier face. The diagrams at right show (A) the increase in soil organic carbon (TOC, defined in text) and (B) soil nitrogen contents (TN, defined in text) with
increasing soil age.
Fig. 5. Changements de proprietes de sol dans la chronosequence de developpement du sol de Damma Glacier. Les diagrammes de la colonne de gauche
montrent les changements (A) de la capacite d’echange de cations (CEC definie dans le texte) et (B) de la saturation en bases (BS, definie dans le texte) en
fonction de la distance a la face du glacier qui s’est retire. Dans les diagrammes de la colonne de droite sont representees en (A) l’augmentation en carbone
organique du sol et en (B) et les teneurs en azote du sol en fonction de l’age croissant du sol.
S. Banwart et al. / C. R. Geoscience 344 (2012) 758–772766

Author's personal copy
adjacent to a similar plot that has been tilled each yearduring the same period.
The CAST model was able to capture the carbon content,the C-to-N content ratio (not shown) and the fractionationof the pools comprising the three aggregate types:macroaggregates: > 250 mm (AC3), microaggregates: 53–250 mm (AC2), and silt-clay sized aggregates: < 53 mm(AC1) in the Greek sites. The model simulated land useconversion from cultivated (initial conditions) to set-aside(calibrated parameters). The calibrated parameters wererelated to the rate constants and turnover times of thecarbon, as well as aggregate and structure turnover. TheCAST model can be used to assess the factors controllingorganic matter sequestration, aggregate stability, andaggregate size class turnover in soils. In this way, themodel improves the prediction of the soil response tomanagement practices, land use changes, and climatechange.
The results of the CAST model for the Koiliaris CZOdemonstrate the potential for the model to simulate thedynamics of soil aggregate formation through time at theother CZOs. The Damma Glacier and Fuchsenbigl-March-feld chronosequences represent the development of soilstructure over time scales of decades to centuries andcenturies to millennia, respectively. Data from these siteswill be used to further test the CAST model’s capability tosimulate changes in soil structure over the history of soildevelopment at the sites.
3.4. Soil carbon changes in forested catchments along a
climate gradient at the continental scale
Based on the CAST model results for the Koiliaris CZO(Fig. 7), a further hypothesis is that soil aggregatedynamics are particularly sensitive to soil carbon seques-tration and loss. Both historical and new data on soilcarbon is being integrated with other data sets and processstudies to gain insight into the process linkages betweencarbon dynamics, aggregate formation and stability, and
other soil process rates. Initial data sets are provided byhistorical investigations that were carried out over theyears 1983 to 2009 at 26 sites including the four SwedishIntegrated monitoring (IM) sites; one of them being theKindla CZO site. Litter decomposition shows differentpatterns in the South and the North of Sweden. From thelarge range of sites investigated, one representativeexample from North Sweden and one from the Southare selected to show the differences. In the northern site,Reivo (N 658 470, E 198 080), the decomposition during thefirst year was lower in than the southern site Aneboda (N578 050, E 148 320). However, in the Reivo site decomposi-tion proceeded at a similar rate during years two and threewhile decomposition slowed during these years in thesouthern site (Fig. 8). Total decomposition over three yearswas higher at the southern site.
It appears that decomposition may be extended overlonger time periods in the north but total decompositionincluding all years is somewhat higher in the south.However, after only one or two years, the partly decom-posed litter in the south became more recalcitrantcompared to the northern sites litter (Bringmark et al.,2011). This could be caused by higher nitrogen contentsafter high initial decomposition and this would hamperfurther decomposition. The data show that the relativestorage of fresh carbon input is greater initially in thenorth, with relatively faster carbon turnover in the south.Studies on ages and decomposition properties for theorganic matter humus layers show similar trends in carbonturnover and storage (Froberg et al., 2011).
3.5. Upscaling data and model results from soil profile- to
catchment-scale and beyond
Mathematical modelling of soil processes facilitatesintegration of new data and knowledge. The resultspresented in the preceding sections illustrate the rangeof variables and processes that need to be quantifiedwithin models. An endpoint of such modelling is economic
Fig. 6. Plots of soil aggregate distribution and water stable aggregates (WSA) from soils in a predominantly mixed broad leaf forest (from Kercheva et al.,
2011).
Fig. 6. Diagramme representant la distribution des agregats du sol et des agregats stables a l’eau (WSA) dans des sols d’une foret de feuillus melanges a
feuilles larges predominantes.
S. Banwart et al. / C. R. Geoscience 344 (2012) 758–772 767

Author's personal copy
valuation of ecosystem services. Goods and services arisefrom flows of material and energy over time. For Earth’sCritical Zone, goods and services can be quantified throughthe material (e.g. water, nutrients) and energy (e.g.primary productivity, biomass yield) flows at the catch-ment and landscape scales. The process descriptions thatquantify these flows must be upscaled from the studies atsoil profile scale, to the catchment scale. An initial phase ofthe research draws on existing catchment scale processmodels, starting with existing codes that have been used todevelop mathematical models of the Czech Republic CZO.Projections of the future water balance and streamwaterchemistry, according to different climate change scenarios,were evaluated for the forested Lysina and Pluhuv Borcatchments in the Slavkov Forest.
The aim of the modelling exercise was to forecasthydrological patterns for the period 2071–2100, usingoutputs from two general circulation models (HadAM3Hand ECHAM4/OPYC3), which were downscaled using threeregional climate models (RCM) namely RCAO, CHRM andHIRHAM under the IPCC A2 and B2 emission scenariosdefined by the Intergovernmental Panel on Climate Change(IPCC, 2007). Comparing the results of the modelledscenarios (Fig. 9) indicated that annual runoff is projectedto decline by 10 to 30%, and impacts on the distribution ofmonthly flow are projected to be significant, withsummer–autumn decreases of 30 to 95%, and winterincreases of up to �40% compared to mean discharge forthe period 1967–1990 (Bencokova et al., 2011a).
In addition to the hydrologic modelling, geochemicalsimulations of stream water composition were also runusing the MAGIC (Cosby et al., 2001) simulation code. Thesimulations revealed that the projected climate changewill not have a significant impact on the chemistry ofsurface water at Lysina even though the projected declinein stream runoff for the pessimistic scenario would besignificant (Fig. 10). The model indicated that surfacewater chemistry is primarily controlled by changes in aciddeposition. However, the Lysina catchment is currentlyaffected by high acidity due to historic anthropogenicacidification. Therefore, the environmental condition ofthe stream will probably remain unsatisfactory, with thedominant influences being the continued effects of aciddeposition and forest management practices in the area(Bencokova et al., 2011b).
4. Discussion
The ambition of the combined experimental observa-tions and mathematical modelling is to develop anintegrated process model that simulates soil processesin 1-D at the profile scale, and that is also implementedinto a dynamic, 3-D geospatially variable model of soilprocesses at the catchment scale. The CAST model is thefirst step towards the integrated process model at the soilprofile scale. Fig. 11 is a conceptual model of the flows ofcarbon and nutrients within Earth’s Critical Zone thatincludes the aggregate formation and disaggregationdynamics of the CAST model processes (adapted fromNikolaidis and Bidoglio, 2013). These are noted in thefigure as arrows that show transport of carbon and particlemass between the three aggregate classes of the CASTmodel.
In this conceptual model, carbon inputs are via aboveground litter deposition and below ground root andmycorrhizal fungi carbon flows. A simplified food webdynamics model considers consumption of organic carbonpools by decomposers and grazing pressure from con-sumers and their predators. The outputs of such a modelare the mass distribution and flows of soil carbon andassociated nutrient (N, P, K) pools and soil aggregates.From these descriptions, the resulting changes in thephysical soil parameters of bulk density, porosity, perme-ability and gas diffusivity are calculated through time asthe bulk properties of the soil change with aggregate sizedistribution. The calculated soil parameters will be used in
Fig. 7. Simulated evolution of carbon content of modelled pools in the
cropland converted (at time = 0) to set-aside land use, with return to
tillage at year 40. The curves represent (A) the change in the water stable
aggregate mass in the three size fractions aggregate type 1 (AC1,
< 50 mm), aggregate type 2 (AC2, 50 mm < size < 250 mm), and aggregate
type 3 (AC3, > 250 mm), and (B) the change in content of total Soil Organic
Carbon (SOC), and the organic carbon content in the AC1, AC2 and AC3
aggregate size classes. Points indicate field measurements.
Fig. 7. Evolution simulee de la teneur en carbone de « pools » modelises
dans une terre cultivee convertie (au temps 0) en terre laissee a l’abandon,
avec retour au labourage a l’annee 40. Les courbes representent (A) le
changement dans la masse des agregats stables a l’eau dans les trois
fractions de taille des agregats : type 1 (AC1, < 50 mm), type 2 (AC2
50 mm < taille < 250 mm) et type 3 (AC3, > 250 mm) ; (B) le changement
de teneur en carbone organique total du sol (SOC) et la teneur en carbone
organique dans les trois classes de taille des agregats AC1, AC2, AC3. Les
points indiquent des mesures de terrain.
S. Banwart et al. / C. R. Geoscience 344 (2012) 758–772768

Author's personal copy
coupled simulations of water flow and reactive transportwithin the soil profile. In future work the CAST model willbe incorporated directly into a simulation code thatcouples the processes of soil aggregate dynamics withthose of flow and transport.
The CAST model is being adapted to include transfor-mation of soil carbon including biomass degradation, andturnover of the associated N and P nutrient pools. The aimis to embed this process model into the SWAT (Soil andWater Assessment Tool, see Gassman et al., 2007) code forsimulation of the processes represented in Fig. 11 at thelandscape and catchment scales. The data sets from thefour main European CZOs will be used to test thecomputational model that is developed. The tested modelwill be used to assess process rates and their variationwithin and between sites at the catchment scale using themodified SWAT code as a common, integrating dataanalysis framework. The results will be used to test theoverarching hypothesis that soil processes evolve along aconceptual life cycle of soil development, and thehypothesis that soil structure development, i.e. aggregateformation, is a key indicator of soil state within the lifecycle. Additionally, the results of the modelling willprovide quantification of key flows of material and energyat catchment scale that contribute to the economic goodsand services produced by Earth’s Critical Zone at each fieldsite. It is expected that an indicator of the relative positionalong the life cycle of soil function will be reflected in therelative value of the goods and services arising from soilprocesses at the CZO sites.
4.1. Translation of research results into science evidence for
policy
Concurrent with the development of the DPSIRframework and the EU Thematic Strategy for Soil Protec-tion, the Millennium Ecosystem Assessment (MA, 2005)was published, raising global awareness of the threats toEarth’s ecosystems. The MA refined the ecosystem servicesframework, defining ecosystem services as, ‘the benefitswe obtain from nature’. Many policy and decision makingorganizations ranging from the UNEP, FAO, and UNDP tonational governments, e.g. the UK, are adopting a similar,so-called ‘ecosystems approach’ to link policy and science
Fig. 8. A. Cumulative litter decomposition for individual years in the northern PMK-site Reivo-Laxtjarnen. Materials of one (green), two (blue), and three
(orange) years of age. Lines indicate 3 years moving averages. B. Cumulative litter decomposition for individual years in the southern PMK/IM-site Aneboda.
Materials of one (green), two (blue), and three (orange) years of age. Lines indicate 3 years moving averages (from Bringmark et al., 2011).
Fig. 8. A. Decomposition cumulative de la litiere pour chaque annee dans le site PMK septentrional de Reivo-Laxtjamen. Materiaux ages d’une (en vert),
deux (en bleu) ou trois (en orange) annees. Les lignes indiquent les moyennes glissantes sur trois ans. B. Decomposition cumulative de la litiere pour chaque
annee dans le site PMK/IM meridional de Aneboda. Materiaux ages d’une (en vert), deux (en bleu) ou trois (en orange) annees. Les lignes indiquent les
moyennes glissantes sur trois ans (selon Bringmark et al., 2011).
Fig. 9. Annual series of mean runoff (R, mm month�1) for (A) Lysina (LYS)
and (B) Pluhuv Bor (PLB); FUT: future scenario period (2071–2100); CTL:
control period (1967–1990); 25–75%: inter-quartile range of all
scenarios; 10–90%: inter-quintile range (adapted from Bencokova
et al., 2011a).
Fig. 9. Serie annuelle de ruissellement moyen (R, mm/mois) pour (A)
Lysina (LYS) et (B) Pluhuv Bor (PLB) ; FUT : future periode de scenario
(2071–2100) ; CTL : periode de controle (1967–1990) ; 25–75 %
fourchette inter-quartile de tous les scenarios ; 10–90 % fourchette
inter-quartile (adapte d’apres Bencokova et al., 2011a).
S. Banwart et al. / C. R. Geoscience 344 (2012) 758–772 769

Author's personal copy
Fig. 10. Observed mean annual (dots) and model predictions (lines) for streamwater constituents for the period 1860–2070; (A) sulphate ion, (B) sum of
base cations, (C) pH, and (D) trivalent aluminium ions. The solid line represents mean annual ambient hydrology conditions, the dotted line the RCAO-H/A2
scenario and the dashed line the RCAO-E/A2 scenario. The sum of base cations (SBC) was calculated as charge equivalents of Ca2+, Mg2+, Na+, and K+ ion.
Soluble Al concentration was calculated as the trivalent ion (adapted from Bencokova et al., 2011b).
Fig. 10. Moyenne annuelle observee (points) et predictions du modele (lignes) pour les constituants de l’eau de riviere pour la periode 1860–2070 ; (A) ion
sulfate ; (B) somme des cations de base ; (C) pH et (D) ions aluminium trivalents. La ligne pleine represente les conditions hydrologiques naturelles
moyennes annuelles, la ligne pointillee le scenario RCAO et la ligne tiretee le scenario RCAO-E/A2. La somme des cations de base a ete calculee en
equivalents charge de Ca2+, Mg2+, Na+ et K+.
Fig. 11. A proposed model structure for the CZ Integrated Model. The boxes represent mass pools of carbon and nutrients. The arrows represent mass flows
and transformation between the pools (modified from Nikolaidis and Bidoglio, 2013).
Fig. 11. Modele de structure propose pour le modele integre CZ. Les cartouches representent les « pools » massiques de carbone et de nutriments. Les fleches
representent les flux massiques et les transformations entre les « pools » (modifie d’apres Nikolaidis et Bidoglio, 2013).
S. Banwart et al. / C. R. Geoscience 344 (2012) 758–772770

Author's personal copy
(Costanza et al., 1997; Daily, 1997; Westman, 1977).Critical Zone science addresses a broader range ofenvironmental compartments and processes that give riseto goods and services. In particular, this extension toconsider a broad range of ‘‘Critical Zone services’’ stronglyembraces the benefits that arise from both geosphere andecosystem dynamics. The added value of this extension ofan ecosystems approach is that it seeks to use a commonvaluation system, often monetary, as a means to incorpo-rate the often unseen value of benefits we obtain from theCritical Zone into decision making. A brief survey of theliterature indicates three distinct, but connected objectivesfor an economic services framework:
� to provide an economic indicator like GDP for nationalaccounts that incorporates natural capital and CriticalZone goods and services (Fisher et al., 2009);� the development of decision making tools that consider
Critical Zone services in the decision making and trade-off process (Nelson et al., 2009);� to create a mechanism by which payments for building
natural capital and delivering Critical Zone goods andservices can be developed (Kinzig et al., 2011).
SoilTrEC is addressing these objectives through a soil-centric, Critical Zone/ecosystems approach, endeavouringto place soils within suitable frameworks and addressingthe ecosystem service challenges for soil science proposedby Robinson et al. (2012). With regard to nationalindicators, GDP already accounts for some naturalresources so the challenge is how we better map, defineand incorporate soil natural capital into this. One potentialroute is to adopt the natural capital framework for soilsproposed by Robinson et al. (2009).
The next challenge is to identify and map soil ecosystemservices. An important component of this is to developdecision making tools, so that policy makers can usebiophysical models and decision support tools to evaluatethe trade-offs of different management options. InVEST isan example of such a tool that is under development(Nelson et al., 2009), which aligns closely with the work ofSoilTrEC. SoilTrEC is developing soil specific models andtheir linkages to the full vertical extent of processes withinthe Critical Zone, so that tools like InVEST can incorporate abetter representation of soils. The overarching conceptualframework for the work of SoilTrEC has the projectproviding the biophysical models, which, when mappedwith beneficiaries, can give the final goods or servicesdistribution that would be valued. Concurrently, SoilTrECis developing the conceptual frameworks and modellingapproaches for decision support that includes life cycleanalysis together with environmental economics valuationmethods. The third challenge is currently beyond the scopeof SoilTrEC, but as the new EU common agricultural policyfocuses on payments for land stewardship and ecosystemservices, this will become increasingly important for theresearch community to address and could be developedfrom the advances proposed here.
Clearly, the above examples indicate the need forintegrated biophysical models to provide output that canbe linked to information on beneficiaries in order to
identify and map ecosystem services through strategiesproposed for example by Fisher et al. (2011). Although thisfield of research is rapidly developing, little considerationhas been given to the role of soils within the ecosystemsframework, other than considering soil formation as aservice of infinite value. SoilTrEC seeks to address this byfurther developing the conceptual frameworks and bio-physical modelling approaches for soils that will helpintegrate with decision making for management optionsthat consider impacts and intervention through the fullextent of the Critical Zone.
5. Note
Fig. 6 reprinted from Applied Geochemistry, Volume 25Supplement, Kercheva.M., Rousseva.S., Dimitrov.E.,Nenov.M., Shishkov.T., Soil aggregation estimates inCZO-Fuchsenbigl, S57–S59, Copyright (2011), with per-mission from Elsevier.
Fig. 8 reprinted from Springer and the AMBIO/A Journal
of the Human Environment, Vol. 40, Issue 8, 2011, pp. 878–890, Long-term monitoring of Scots pine litter decomposi-tion rates throughout Sweden indicates formation of amore recalcitrant litter in the South, Bringmark. E.,Bringmark. L., Sonesten. L., Mjofors. K., Johansson. M.,Fig. 2, original copyright notice is given to the publicationin which the material was originally published with kindpermission from Springer Science and Business Media.
Acknowledgements
This work is supported by the European Commission7th Framework Programme as a Large Integrating Project(SoilTrEC, www.soiltrec.eu, Grant Agreement No. 244118).The authors thank Heather Buss for a constructive reviewwhich substantially improved the manuscript.
References
Anderson, S.P., Blum, J., Brantley, S.L., Chadwick, O., Chorover, J., Derry,L.A., Drever, J.I., Hering, J.G., Kirchner, J.W., Kump, L.R., Richter, D.,White, A.F., 2004. Proposed initiative would study Earth’s weath-ering engine. EOS Transactions, American Geophysical Union 85(28), 265–269.
Banwart, S.A., 2011. Save our soils. Nature 474, 151–152.Banwart, S.A., et al., 2011. Assessing soil processes and function across an
International Network of Critical Zone Observatories: research hy-potheses and experimental design. Invited contribution to specialissue on Critical Zone Observatories. Vadose Zone J. 10, 974–987 (with15 co-authors).
Banwart, S.A., et al. (with 15 co-authors), 2012. Sustaining Earth’s CriticalZone. Report of an International Workshop on Critical Zone Observa-tory Science, 9th–11th November, 2011, University of Delaware.Available via www.soiltrec.eu.
Bencokova, A., Kram, P., Hruska1, J., 2011a. Future climate and changes inflow patterns in Czech headwater catchments. Clim. Res. 49, 1–15.
Bencokova, A., Hruska, J., Kram, P., 2011b. Modeling of anticipated climatechange impact on biogeochemical cycles of acidified headwatercatchment. Appl. Geochem. 26, S6–S8.
Bernasconi, S.M., BigLink Project Members, 2008. Weathering, soil for-mation and initial ecosystem evolution on a glacier forefield: a casestudy from the Damma Glacier, Switzerland. Mineral. Mag. 72, 19–22.
Bernasconi, S.M., Bernasconi, S.M., Bauder, A., Bourdon, B., Brunner, I.,Bunemann, E., Christl, I., Derungs, N., Edwards, P., Farinotti, D., Frey, B.,Frossard, E., Furrer, F., Gierga, M., Goransson, H., Guelland, K., Hage-dorn, F., Hajdas, I., Hindshaw, R.S., Ivy-Ochs, S., Jansa, J., Jonas, T.,Kiczka, M., Kretzschmar, R., Lemarchand, E., Luster, J., Magnusson, J.,
S. Banwart et al. / C. R. Geoscience 344 (2012) 758–772 771

Author's personal copy
Mitchell, E.A.D., Olde Venterink, H., Plotze, M., Reynolds, B.C., Smit-tenberg, R.H., Stahli, M., Tamburini, F., Tipper, E.T., Wacker, L., Welc,M., Wiederhold, J.G., Zeyer, J., Zimmermann, S., Zumsteg, A., 2011.Chemical and biological gradients along the Damma Glacier soilchronosequence (Switzerland). Vadose Zone J. 10, 867–883.
Blum, W.E.H., 2006. Functions of soil for society and the environment.Rev. Environ. Sci. Biotechnol. 4, 75–79.
Blum, W.E.H., Busing, J., Montanarella, L., 2004. Research needs in supportof the European thematic strategy for soil protection. Trends Anal.Chem. 23, 680–685.
Brantley, S.L., White, T.S., White, A.F., Sparks, D., Richter, D., Pregitzer, K.,Derry, L., Chorover, J., Chadwick, O., April, R., Anderson, S, Amundson,R., 2006. Frontiers in Exploration of the Critical Zone, a NSF-sponsoredworkshop, National Science Foundation, Washington, D.C. 30 p.
Brantley, S.L., Goldhaber, M.B., Ragnarsdottir, K.V., 2007. Crossing disci-plines and scales to understand the Critical Zone. Elements 3, 315–320.
Bringmark, E., Bringmark, L., Sonesten, L., Mjofors, K., Johansson, M.-B.,2011. Long-term monitoring of Scots pine litter decomposition ratesthroughout Sweden indicates formation of a more recalcitrant litter inthe south. Ambio 40, 878–890 [Doi:10.1007/s13280-011-0207-8,ISSN 0044-7447]
COM(2006)231, 2006. Thematic Strategy for Soil Protection. Communi-cation from the commission to the Council, the European Parliament,the European economic and social committee and the committee ofthe regions.
COM(2006)232, 2006. Establishing a framework for the protection of soiland amending Directive 2004/35/EC. Proposal for a directive of theEuropean Parliament and of the Council.
Cosby, B.J., Ferrier, R.C., Jenkins, A., Wright, R.F., 2001. Modelling theeffects of acid deposition: refinements, adjustments and inclusion ofnitrogen dynamics in the MAGIC model. Hydrol. Earth System Sci. 5,499–517.
Costanza, R., Cumberland, J.C., Daly, H.E., Goodland, R., Norgaard, R., 1997.An introduction to ecological economics. St. Lucie Press, Boca Raton.
Daily, G.C., 1997. Nature’s services: societal dependence on naturalecosystems. Island Press, Washington.
D’Costa, V.M., McGrann, K.M., Hughes, D.W., Wright, G.D., 2006. Samplingthe antibiotic resistome. Science 311, 374–377.
Dexter, A.R., 2004a. Soil physical quality: I. Theory, effects of soil texture,density and organic matter, and effects on root growth. Geoderma120, 201–214.
Dexter, A.R., 2004b. Soil physical quality: II. Friability, tillage, tilth andhardsetting. Geoderma 120, 215–225.
Dexter, A.R., 2004c. Soil physical quality: III. Unsaturated hydraulicconductivity and general conclusions about S-theory. Geoderma120, 227–239.
Fiebig, M., Preusser, F., Steffen, D., Thamo-Bozso, E., Grabner, M., Lair, G.J.,Gerzabek, M.H., 2009. Luminescence dating of historical fluvialdeposits from the Danube and Ebro. Geoarchaeol. Int. J. 24 (2),224–241.
Fisher, B., Turner, R.K., Morling, P., 2009. Defining and classifying ecosys-tem services for decision making. Ecol. Econ. 68, 643–653.
Fisher, B., Turner, R.K., Burgess, N.D., Swetnam, R.D., Green, J., Green, R.E.,Kajembe, G., Kulindwa, K., Lewis, S.L., Marchant, R., Marshall, A.R.,Madoffe, S., Munishi, P.K.T., Morse-Jones, S., Mwakalila, S., Paavola, J.,Naidoo, R., Ricketts, T., Rouget, M., Willcock, S., White, S., Balmford, A.,2011. Measuring, modeling and mapping ecosystem services in theEastern Arc Mountains of Tanzania. Prog. Phys. Geog. 35, 595–611.
Froberg, M., Tipping, E., Stendahl, J., Clarke, N., Bryant, C., 2011. Meanresidence time of O horizon along a climate gradient in Scandinaviaestimated by 14C measurements of archived soils. Biogeochemistry104, 227–236.
Gassman, P.W., Reyes, M.R., Green, C.H., Arnold, J.G., 2007. The soil andwater assessment tool: historical development, applications andfuture research directions. Trans. ASABE 50, 1211–1250.
IPCC (Intergovernmental Panel on Climate Change), 2007. Climate change2007: synthesis report. IPCC, Geneva, Switzerland.
Kercheva, M., Rousseva, S., Dimitrov, E., Nenov, M., Shishkov, T., 2011.Soil aggregation estimates in CZO-Fuchsenbigl. Appl. Geochem. 26,S57–S59.
Kinzig, A.P., Perrings, C., Chapin III, F.S., Polasky, S., Smith, V.K., Tilman, D.,Turner II, B.L., 2011. Paying for ecosystem services - promise and peril.Science 334, 603–604.
Kram, P., Hruska, J., Shanley, J.B., 2012. Streamwater chemistry in threecontrasting monolithologic Czech catchments. Appl. Geochem. 27,1854–1863.
Lair, G.J., Gerzabek, M.H., Fiebig, M., Zehetner, F., 2007. Verwitterung vonAuboden in verschiedenen klimatischen Regionen Europas. Mittei-lungen der Osterreichischen Bodenkundlichen Gesellschaft 74,35–52.
Lair, G.J., Zehetner, F., Hrachowitz, M., Franz, N., Maringer, F.-J., Gerzabek,M.H., 2009. Dating of soil layers in a young floodplain using iron oxidecrystallinity. Quat. Geochronol. 4, 260–266.
Millennium Ecosystem Assessment (MA), 2005. Ecosystems and humanwell-being: synthesis. Island Press, Washington, DC.
Moraetis, D., Efstathiou, D., Stamati, F., Tzoraki, O., Nikolaidis, N.P.,Schnoor, J.L., Vozinakis, K., 2010. High frequency monitoring forthe identification of hydrological and biochemical processes in aMediterranean river basin. J. Hydrol. 389, 127–136.
Nelson, E., Mendoza, G., Regetz, J., Polasky, S., Tallis, H., Cameron, D.R.,Chan, K.M.A., Daily, G.C., Goldstein, J., Kareiva, P.M., Lonsdorf, E.,Naidoo, R., Ricketts, T.H., Shaw, M.R., 2009. Modeling multiple eco-system services, biodiversity conservation, commodity production,and tradeoffs at landscape scales. Front. Ecol. Environ. 7, 4–11.
National Research Council, 2001. Basic research opportunities in the earthsciences. Natl. Acad. Press, Washington, DC.
Nikolaidis, N.P., Bidoglio, G., 2013. Soil organic matter dynamics andstructure. Sustainable Agriculture Reviews 12, in press.
Richter, D.deB., Andrews, S.S., Bacon, A.R., Billings, S., Cambardella, C.A.,Cavallaro, N., DeMeester, J.E., Franzluebbers, A.J., Grandy, A.S.,Grunwald, S., Gruver, J., Hartshorn, A.S., Janzen, H., Kramer, M.G.,Ladha, J.K., Lajtha, K., Liles, G.C., Markewitz, D., Megonigal, P.J.,Mermut, A.R., Mobley, M.A., Rasmussen, C., Richardson, C.J., Robin-son, D.A., Smith, P., Stiles, C., Tate, R.L., Thompson, A., Tugel, A.J., anEs, H., West, L., Wills, S., Yaalon, D., Zobeck, T.M., 2011. Human-soilrelations are changing rapidly: proposals from SSSA’s New Cross-Divisional Working Group on Soil Change. Soil Sci. Soc. Am. J. 75 (6),2079–2084.
Robinson, D.A., Lebron, I., Vereecken, H., 2009. On the definition of thenatural capital of soils: a framework for description, evaluation andmonitoring. Soil Sci. Soc. Am. J. 73, 1904–1911.
Robinson, D.A., Hockley, N., Dominati, E., Lebron, I., Scow, K.M., Reynolds,B., Emmett, B.A., Keith, A.M., de Jonge, L.W., Schjønning, P., Moldrup,P., Jones, S.B., Tuller, M., 2012. Natural capital, ecosystem services andsoil change: why soil science must embrace an ecosystems approach.Vadose Zone J. 11.
Shein, E.V., 2005. Kurs fiziki pochv(A Course of Soil Physics) [in Russian].Moscow State Univ. Publishing, Moscow.
Stamati, F., Nikolaidis, N.P., Banwart, S.A., Blum, W.E., 2012. A coupledCarbon, Aggregation, and Structure Turnover (CAST) Model for top-soils. Geoderma, in review.
Stamati, F., Nikolaidis, N.P., Schnoor, J.L., 2012. The role of soil texture oncarbon and nitrogen sequestration in agricultural soils of differentclimates. Agric. Ecosyst. Environ. J., in revision.
Tisdall, J.M., Oades, J.M., 2012. Landmark papers: No. 1. Tisdall, J.M.,Oades, J.M., 1982. Organic matter and water-stable aggregates insoils. J. Soil Sci. 33, 141–163. Euro. J. Soil Sci. 63, 1–21.
Vershinin, P.V., Revut, I.B., 1952. On the Methods for Estimating SoilWater Stability. Sbornik trudov agronomicheskoi fizike, vol. 5 (inRussian).
Victoria, R., Banwart, S.A., Black, H., Ingram, J., Joosten, H., Milne, E.,Noellemeyer, E., 2012. Benefits of soil carbon. Foresight Chapter inUNEP Yearbook 2012. United Nations Environment Programme, ISBN9789280732146, pp. 19–33.
Westman, W.E., 1977. How much are nature’s services worth. Science197, 960–964.
Zehetner, F., Lair, G.J., Gerzabek, M.H., 2009. Rapid carbon accretionand organic matter pool stabilizati on in riverine floodplain soils.Global Biogeochem. Cycles 23, GB4004, http://dx.doi.org/10.1029/2009GB003481.
S. Banwart et al. / C. R. Geoscience 344 (2012) 758–772772
Copyright © 2022 FDOKUMEN