Soil lead concentrations in residential Minnesota as measured by ICP-AES
12
SOIL LEAD CONCENTRATIONS IN RESIDENTIAL MINNESOTA AS MEASURED BY ICP-AES MARK D. C. SCHMITT, DALE J. TRIPPLER, JOHN N. WACHTLER, and GAIL V. LUND Minnesota Pollution Control Agency, 520 Lafayette Road North, St. Paul MN 55155, U.S.A. (Received October 2, 1987; revised March 4, 1988) Abstract. A total of 2454 samples were collected to evaluate the degree, extent, and distribution of Pb contaminated soil in Minnesota. Samples were collected primarily at locations where susceptible popu- lations were concentrated. Soil Pb concentrations in chilldren's play areas, urban gardens, and at open sites were generally below 100 ~tgg- ~ when Pb painted structures were absent. Street side and yard soils typically had Pb concentrations between 10 to 300 gg g- 1,with samples collected near major highways or Pb painted structures exhibiting greater values. The most severely contaminated soils were found in localized areas around the foundations of private residences, where concentrations up to 20136 gg g- 1 were detected. Exterior Pb based house paint is the major Pb source in these soils, and its presence greatly influences the distribution of contaminated soil in individual yards. Contamination attributable to autoemissions is less concentrated but more widespread than contamination from paint. A higher proportion of soils exceeding 1000 gg g ~Pb was found in large cities than elsewhere. However, a sufficient number were detected in small cities and rural areas to confirm that high soil Pb levels are not exclusively an urban phenomenon. By examining the degree, extent, and distribution of Pb contaminated soils in Minnesota, this study provides information useful in guiding response actions to reduce children's exposure to Pb by this pathway. 1. Introduction During the First Special Session of 1985, the Minnesota State Legislature directed the Minnesota Pollution Control Agency to conduct a survey describing the degree and extent of Pb pollution in Minnesota soils. This directive came in response to numerous studies indicating that soil may be a significant contributor to the Pb burden of children under age 6. These have been summarized by the Environmental Protection Agency (1986). Information on soil Pb in Minnesota was available at the time this legislation was passed. Trace metal concentrations for 16 soil series formed from 7 major parent materials in the state had been published (Pierce et al., 1982). Soil Pb concentrations along transects perpendicular to 12 highways in the Twin Cities Metropolitan Area had also been described (Singer and Hanson, 1969). Mielke et al. (1983) had also examined the influence of painted structures on soil Pb concentrations, differences in soil Pb concentrations between Twin Cities neigh- borhoods, and the relationship between soil Pb concentrations and population blood Pb levels. The suspected nonrandom distribution of soil Pb concentrations along transects through Minneapolis, St. Paul, Duluth, and Rochester had also been verified (Mielke et al., 1984/85). Despite these contributions, significant gaps remained in the understanding of soil Pb in Minnesota. This was due, in part, to the appropriately restrictive site selection criteria Water, Air, and Soil Pollution 39 (1988) 157-168. © 1988 by Kluwer Academic Publishers.
-
Upload
independent -
Category
Documents
-
view
2 -
download
0
Transcript of Soil lead concentrations in residential Minnesota as measured by ICP-AES
S O I L L E A D C O N C E N T R A T I O N S I N R E S I D E N T I A L
M I N N E S O T A AS M E A S U R E D BY I C P - A E S
MARK D. C. SCHMITT, DALE J. T R I P P L E R , JOHN N. W A C H T L E R , and GAIL V. LUND
Minnesota Pollution Control Agency, 520 Lafayette Road North, St. Paul MN 55155, U.S.A.
(Received October 2, 1987; revised March 4, 1988)
Abstract. A total of 2454 samples were collected to evaluate the degree, extent, and distribution of Pb contaminated soil in Minnesota. Samples were collected primarily at locations where susceptible popu- lations were concentrated. Soil Pb concentrations in chilldren's play areas, urban gardens, and at open sites were generally below 100 ~tg g- ~ when Pb painted structures were absent. Street side and yard soils typically had Pb concentrations between 10 to 300 gg g- 1, with samples collected near major highways or Pb painted structures exhibiting greater values. The most severely contaminated soils were found in localized areas around the foundations of private residences, where concentrations up to 20136 gg g- 1 were detected. Exterior Pb based house paint is the major Pb source in these soils, and its presence greatly influences the distribution of contaminated soil in individual yards. Contamination attributable to autoemissions is less concentrated but more widespread than contamination from paint. A higher proportion of soils exceeding 1000 gg g ~ Pb was found in large cities than elsewhere. However, a sufficient number were detected in small cities and rural areas to confirm that high soil Pb levels are not exclusively an urban phenomenon. By examining the degree, extent, and distribution of Pb contaminated soils in Minnesota, this study provides information useful in guiding response actions to reduce children's exposure to Pb by this pathway.
1. Introduction
During the Firs t Special Session of 1985, the Minneso ta State Legislature directed the
Minneso ta Pollut ion Control Agency to conduc t a survey describing the degree and
extent of Pb pollut ion in Minneso ta soils. This directive came in response to numerous
studies indicating that soil may be a significant contr ibutor to the Pb burden of children
under age 6. These have been summarized by the Environmenta l Protect ion Agency
(1986).
Informat ion on soil Pb in Minneso ta was available at the t ime this legislation was
passed. Trace metal concentra t ions for 16 soil series formed from 7 major parent
materials in the state had been publ ished (Pierce et al., 1982). Soil Pb concentra t ions
along t ransects perpendicular to 12 highways in the Twin Cities Met ropol i tan Area had
also been descr ibed (Singer and Hanson , 1969).
Mielke et al. (1983) had also examined the influence of pa in ted structures on soil Pb
concentrat ions, differences in soil Pb concentra t ions between Twin Cities neigh-
borhoods , and the relat ionship between soil Pb concentra t ions and popula t ion b lood
Pb levels. The suspected n o n r a n d o m distr ibution of soil Pb concentra t ions along
t ransects through Minneapol is , St. Paul, Duluth, and Roches ter had also been verified
(Mielke et al., 1984/85).
Despi te these contr ibutions, significant gaps remained in the unders tanding of soil Pb
in Minnesota . This was due, in part , to the appropr ia te ly restrictive site selection criteria
Water, Air, and Soil Pollution 39 (1988) 157-168. © 1988 by Kluwer Academic Publishers.

158 M. D. C. SCHMITT ET AL.
employed in the studies cited above to fulfill specified research objectives. Additionally, the different sampling and analytical techniques employed in these studies make com- parison of their results difficult.
This paper summarizes the results of the soil Pb survey mandated by the Minnesota State Legislature in 1985. The survey is broader in scope than those previously conducted in Minnesota, encompassing 5 large cities and other urban, suburban, and rural sites in 27 counties. Emphasis has been placed on soils from residential areas where children routinely play rather than soils from street sides, rights of way, or undisturbed sites.
Because of the relatively small number of samples collected and the emphasis on sampling near susceptible populations, this paper does not pretend to provide complete information on Pb in Minnesota soils. However, the information presented should prove useful as a measure of the degree, extent, and distribution of contaminated soil in the State, as an indicator of its potential threat to children, and as a guide for response actions to reduce exposure.
2. Methods
2.1. SITE SELECTION
The presence of high Pb concentrations in soil is not, in itself, a threat to public health. In order for adverse health consequences to occur, susceptible populations must be exposed to and absorb Pb from contaminated soils. For this reason, sites sampled in this study were selected primarily because susceptible populations were present, not necessarily because contaminated soils were expected to be found.
In order to select sites where susceptible populations were likely to be present, data collected during the 1980 U.S. Census were reviewed. Census tracts were identified in the major cities of Minneapolis, St. Paul, Duluth, Rochester, and St. Cloud and ranked on the basis of each of the following criteria.
(1) % of population under age 5 (4 points). (2) ~o of the black population under age 5 (2 points). (3) ~o of residences with income below $15,000 yr-1 (1 point). (4) % of residences with income below $7,500 yr- 1 (1 point). (5) To of residences built before 1960 (1 point). A tract ranked in the top 25~o in each category received the indicated number of
points. For example, a census tract ranked in the top 25~o for each of the above categories would receive the maximum rating of 9 points.
The scoring criteria reflect research findings indicating that the population most susceptible to Pb poisoning is children between 9 mo and 6 yr of age (United States Department of Health and Human Services, 1985). Furthermore, individuals in this group that are black, poor, malnourished, have blood disorders such as sickle cell anemia, or live in Pb painted housing are particularly at risk (Erenberg et al., 1974; Mahaffey, 1981; United States Department of Health and Human Services, 1984; 1985).

SOIL LEAD CONCENTRATIONS IN RESIDENTIAL MINNESOTA 159
The highly rated census tracts generally consist of low-income neighborhoods having
tightly spaced and poorly maintained multi-family dwellings. Childhood Pb poisonings frequently occur in this type of environment. The scores assigned to each of the census tracts in the 5 large cities are too lengthy to include here but are available elsewhere (Minnesota Pollution Control Agency and Minnesota Department of Health, 1987).
2.2. S A M P L I N G P R O T O C O L
The sampling program was geared toward the highly rated census tracts where sus- ceptible populations were concentrated. However, a number of census tracts with lower
ratings and other small urban, suburban, and rural areas were also sampled to insure that the range of socioeconomic conditions occurring in Minnesota and their associated soil Pb concentrations were represented in the data base.
Certain sites within the targeted tracts and counties were preferentially sampled. These included day care centers, school lots, and playgrounds. Sampling at private residences was also a priority, particularly if inhabited by children with a history of elevated blood Pb levels. In general, samples were collected from any site frequented by children.
A total of 2454 samples were collected between April 7 and October 16, 1986. Typically, 3 to 5 samples were collected at each site. Each sample was a composite of five subsamples collected with a standard tube auger from the corners and center of a 61 cm x 61 cm square. The samples were collected from the surface 2 cm of soil in all
cases. Samples were categorized into one or more of the following sample types: (1) Street Side - Collected within 1.5 m of a street. (2) Foundation - Collected within 1.5 m of a building. (3) Front Yard - Collected in front of a residence. (4) Side Yard - Collected at the side of a residence. (5) Back Yard - Collected in back of a residence. (6) Open - Collected from sites without buildings, such as vacant lots or undeveloped
rural areas. (7) Garden - Collected in a garden or farm field.
(8) Play Area - Collected from sites designated for the play of small children. These include parks, day care center playgrounds, and those portions of private residences with sandboxes, swing sets, etc.
2.3. A N A L Y T I C A L P R O T O C O L
Analytical work for the study was performed by the University of Minnesota Research Analytical Laboratory. Standard procedure for the analysis of samples in this study was as follows: Samples were dried in a 35 to 38 °C oven and passed through a 2 mm sieve. Three g of soil from each sample was placed in a 50 mL plastic specimen tube, dosed with 30 mL of 1 M HNO 3, and allowed to stand for 5 minutes. Each tube was capped, shaken for 1 hr at 180 reciprocations per minute, then centrifuged for 15 min at 2500 rpm. An

160 M.D. C, SCHMITT ET AL.
aliquot of the extraction solution was analyzed for Pb and 14 additional elements via inductively coupled plasma-atomic emission spectroscopy (ICP-AES).
2.4. Q U A L I T Y A S S U R A N C E A N D C O N T R O L
Sample extracts were analyzed using an autosampler under computer control. All
extractions were conducted using redistilled HNO 3, triple deionized water, and HNO 3- rinsed plastic ware. Calibration standards were made from spectral quality materials in multi-element concentrations that best approximated the chemical matrix of most soil
sample extracts.
A standard quality control check of 100 gg g - ~ Pb was positioned every 10th sample and monitored by the ICP-AES computer. If Pb or any of the 14 other elements measured were found to be greater than 5 ~o from their true value, the system was recalibrated before proceeding. Analysis of an extraction blank was repeated every 25th to 50th sample. All blanks read below the detection limit of 0.09 lag g - 1 Pb in solution.
An in-house check sample was also analyzed every 25th to 50th sample. This sample
has an extractable mean Pb concentration of 206 lag g 1, well within the range of critical interest to the study. The relative standard deviation for the in-house check sample was 3 ~o for the duration of the study. Three standard deviations of the running average was
used as the data rejection limit for the in-house check. The first sample in each batch was also reanalyzed at the end of the batch. The
average deviation from the mean for 57 sets of duplicated samples run throughout the study was 6 ~ .
The only spectral interference of concern was from aluminum (A1), which, at a concentration of 1000 lag g - 1, would result in an automatic computer correction on Pb of 1.8 lag g- 1. Ratios of measured A1 to Pb were monitored for excessive corrections, which did not occur. Most samples contained less than 1000 lag g - 1 A1.
Prior to this survey, soil sample extracts from another study on similar soils were measured by both flame atomic absorption (AA) with background correction and the ICP-AES instrument used in this study. The difference between means for a set of 72 soil extracts was 1.7%, and the correlation between paired analyses rounded to 1.00. The AA mean was 1030 lag g - a Pb and the ICP-AES mean was 1047 jag g - ~ Pb. The AA range was 1 . 0 - 4 5 8 9 1 a g g - 1 p b and ICP-AES had a range of
1.6 - 4662 lag g - ~ Pb.
3. Results and Discussion
The study results are summarized in Table I as soil Pb concentration percentiles and geometric means by sample type and location. Percentiles were calculated using the SAS UNIVARIATE procedure (SAS Institute Inc., 1985a). Samples collected outside the five major cities have been classified as 'outstate'. This category includes samples collected in small urban, suburban, and rural areas in 27 counties.
Of the 2454 samples collected, 1196 (49~) exceeded 100 lag g - l, 277 (11 ~o) exceeded 500 lag g - 1, 160 (5 ~/o) exceeded 1000 lag g - 1, and 45 (2~o) exceeded 2000 lag g 1 Pb.

SOIL LEAD CONCENTRATIONS IN RESIDENTIAL MINNESOTA
TABLE I
Soil Pb concentration percentiles and geometric means (lig g - i ) by location and sample type
161
Sample type N Percentiles Geometric mean ± S.D. 0% 25yo 50% 75% 90% 100%
St. Paul
Foundation 127 3 268 576 1246 2556 7994 472 ± 4 .5A Garden 8 14 40 147 1177 2846 2846 174 ± 6.2AB Back yard 114 1 65 161 300 531 1386 119 ± 3.8 B Street side 170 6 64 127 204 270 575 113 ± 2.2 B Side yard 46 1 42 133 364 692 2385 96 ± 6.1B Front yard 108 1 44 104 192 336 1377 90 ± 3.0 B Open 95 2 26 76 177 349 1466 66 ± 3.7 B Play area 164 1 4 36 104 251 607 24 ± 7.0 C
Minneapolis
Foundation 199 35 305 689 1496 3776 20136 665 ± 3.5A Garden 28 34 109 264 445 1981 3858 253 ± 3.2 B Side yard 61 4 110 247 520 840 1210 212 ± 3.3 B Back yard 119 3 108 223 338 541 1876 186 ± 2.6 B Street side 170 27 106 165 297 496 1326 177 ± 2.2 B Front yard 131 18 107 185 289 499 1345 173 ± 2.1B Open 51 1 24 34 73 249 878 39 ± 3.7 C Play area 139 1 4 33 110 224 788 22 ± 6.9C
Duluth
Foundation 32 12 170 559 1702 3307 11110 455 + 5.2 A Garden 3 55 55 78 630 630 630 139 + 3.7 ABCDE Front yard 24 11 58 99 415 578 768 125 + 3.3 BD Street side 41 10 65 138 227 335 798 124 + 2.3 BC Back yard 32 2 56 117 276 594 1815 106 + 4.1 BCD Side yard 14 4 6 99 221 373 425 58 _+ 5.3 BCDE Open 19 7 16 38 66 174 298 38 + 2.7 DE Play area 64 1 5 24 65 117 320 17 + 5.1 E
Rochester
Foundation 19 2 13 48 315 1867 1930 65 + 8.4 A Street side 27 3 29 55 90 207 289 48 _+ 3.4 A Front yard 14 2 13 23 101 173 216 27 + 3.7 AB Open 15 4 7 23 43 379 752 23 + 4.1 AB Back yard 20 1 5 10 38 111 660 13 + 4.7 B Side yard 10 4 5 15 32 41 42 13 _+ 2.4 AB Play area 55 1 4 14 32 88 216 11 _+ 4.7 B Garden 5 5 6 8 12 14 14 8 + 1.5 AB

162
Table I (continued)
M. D. C. SCHMITT ET AL.
Sample type N Percentiles Geometric mean _+ S.D. 0~o 25~o 50~o 75~o 90~o 100~o
St. Cloud
Garden 2 9 9 981 1952 1952 1952 135 + 43.8 AB Foundation 13 5 16 120 475 1952 1952 85 _+ 7.5 A Street side 27 6 32 52 144 277 515 62 + 2.7A Front yard 16 6 18 32 82 139 151 35 _+ 2.5 AB Back yard 10 7 9 31 55 141 146 28 _ 2.8 AB Open 18 1 10 20 89 204 324 25 + 4.9 AB Side yard 5 1 7 20 71 115 115 16 + 5.1 AB Play area 35 1 3 12 35 74 134 10 + 4.6 B
Outstate
Foundation 67 1 18 78 665 2842 7111 105 + 9.2 A Side yard 16 9 22 40 73 151 170 39 + 2.4 AB Street side 179 1 19 48 105 176 617 39 _+ 3.8 B Front yard 50 2 14 37 65 132 656 31 + 3.4 B Back yard 34 3 8 16 31 93 198 18 + 2.7 BC Open 179 1 6 11 25 47 291 12 + 3.0 C Play area 227 1 3 13 36 85 617 11 +_ 4.6 C Garden 29 2 4 8 19 32 78 9 + 2.6 C
Analysis of variance indicated significant differences in geometric mean soil Pb levels between sample types at each location. Means followed by the same letter are not significantly different (p = 0.05).
A higher proportion of samples exceeding 1000 lag g - 1 was found in the Twin Cities
(9~o) than in smaller cities (4}'0) or outstate areas (2~o). These results indicate that
elevated soil Pb is primarily, but not exclusively, an urban phenomenon.
Samples collected from play areas exhibited the lowest overall soil Pb concentrat ions
in the survey. This is encouraging since the motivating concern and major objective
behind the study was measurement of soil Pb concentrat ions at sites where children
were likely to be exposed. Play areas are excellent examples of such sites.
Soil Pb concentrat ions in public play areas rarely exceeded 50 lag g 1, and often
approached background levels. The few play area samples with soil Pb concentrat ions
above 50 lag g - 1 came from private residences. The higher Pb levels in private play areas
are due to differences in Pb exposure and Pb retention capacity.
Public play areas are designed for safety and low maintenance. Accordingly, they are
located away from traffic and covered with coarse sand. Private play areas may be
located near painted structures or roadways on soils of varying texture. They may also
support lawns which increase soil organic matter content and, therefore, its cation
exchange capacity. Hence, soils at public play areas are not exposed to as much Pb as
their private counterparts, nor do they have sufficient cation exchange capacity to
adsorb the Pb to which they are exposed.

SOIL LEAD CONCENTRATIONS IN RESIDENTIAL MINNESOTA 163
Most open samples exhibited soil Pb concentrations below 100 lag g- 1. However, some interesting exceptions were found. Four samples collected from empty lots in St. Paul had Pb concentrations exceeding 500 lag g- i . These contained Pb paint residues from homes formerly occupying these lots that burned or were condemned and demolished.
Open samples with soil Pb concentrations axceeding 250 lag g- 1 were also collected at sites near an automotive junk yard and Pb painted railroad bridge. Other open samples with concentrations greater than 200 lag g- 1 Pb were collected close enough to roadways to be contaminated by automotive emissions but too far away to be classified as street side samples.
The distribution of soil Pb concentrations in garden samples was bimodal. Samples collected from rural farm fields always contained less than 50 lag g- 1 Pb. Soils from
urban gardens were more contaminated, occasionally exceeding the 500 lag g- ~ level generally considered safe for the production of crops for human consumption (Spittler and Feder, 1979; Rosen and Munter, 1985). Urban gardens are often located adjacent to houses or detached garages to conserve yard space. When these structures bear Pb paint, the garden soils are invariably contaminated.
Street side soil Pb concentrations typically varied between 10-300 lag g- 1. The few samples exceeding 500 lag g- 1 were generally collected near interstate or major trunk highways a substantial distance from sites where children routinely play. Only one street side sample collected in the survey exceeded 1000 lag g- 1.
Soil Pb concentrations in front, side, or back yard samples were similar to those found in street side samples collected within the same yard. Exceptions occurred with samples collected 1.5 to 5 m from Pb painted structures. In these cases, Pb concentrations in yard samples were higher than in street side samples.
The highest soil Pb concentrations were found in foundation samples. Virtually every sample exceeding 2000 lag g- i Pb and 140 of 160 samples exceeding 1000 ~tg g- 1 were collected near house foundations.
Significant differences (p = 0.05) between means were detected at each location. Analysis of variance and mean separation tests were conducted by using the SAS GLM procedure with the TUKEY option (SAS Institute Inc., 1985b).
Foundation samples generally had the highest soil Pb concentrations. Beyond the concept of statistical significance, it appears that the magnitude of the differences between foundation samples and other sample types is also of practical importance in the context of potential exposure to children.
Play area and open samples had uniformly low soil Pb concentrations. Concentra- tions in front yard, back yard, side yard, and street side samples were similar, and intermediate in magnitude between foundation and play area sample types. Garden samples had greatly varying concentrations depending on location. Urban gardens had high soil Pb concentrations, while farm soils had low concentrations.
Table II contains soil Pb concentration percentiles and geometric means for foundation samples collected by houses with differing exterior composition. Statistical analyses were conducted using the methods previously cited.

164 M . D . C . SCHMITT ET AL.
TABLE II
Soil Pb concentration percentiles and geometric means (~tg g- 1) for foundation samples by general house composition
Composition Percentiles Geometric mean ± S.D. N 0~o 25~ 50~o 75~o 90~o 100~o
Wood 213 1 247 811 1866 3825 20136 522 ± 6.4A Sided 44 3 161 559 1318 3531 11162 381 ± 6.5A Stucco 80 7 140 497 972 1533 3021 380 ± 3.7A Brick 88 1 58 181 505 767 2846 158 ± 4.3 B
Analysis of variance indicated a significant difference in geometric mean foundation soil Pb levels between composition types. Means followed by the same letter are not significantly different (p = 0.05).
Foundation samples from houses with wooden exteriors had the highest soil Pb
concentrations, although their geometric mean was not statistically greater than those
from houses with sided or stucco exteriors. Foundation samples from houses with brick
exteriors were significantly lower than those from wooden, sided or stucco houses.
These differences suggest that contamination of foundation soils is primarily a function
of exterior Pb based paint application. Wooden houses are usually entirely painted and, if constructed prior to 1950, carry
at least one coat of Pb based paint. Older houses with deteriorating wooden exteriors
typify the residences found in the highly rated census tracts that were the focus of the
survey in Duluth and the Twin Cities Metropolitan Area. Some sided (aluminum, steel, vinyl) houses had painted wooden exteriors when
originally constructed. Such residences had foundation soil Pb concentrations similar to those at residences with wooden houses. Other were newly built and had never been
painted. Soil Pb concentrations near the foundations of these residences were compar- able to those found at houses with brick exteriors.
A similar situation exists for stucco houses. Approximately 50 ~o of the stucco houses surveyed were painted. Samples collected near the foundations of these houses had
similar Pb concentrations to those found near the foundations of houses with wooden exteriors. Those collected at unpainted stucco houses exhibited substantially lower
concentrations. Brick houses generally bear very little paint. Consequently, soil Pb concentrations are
consistently lower along the foundations of brick homes than those with more heavily
painted exteriors. These data strongly implicate Pb based exterior paint as the primary source of Pb in
highly contaminated soils. Although this determination is deductive, and was made without the support of isotopic data or detailed particle analysis (Yaffe et al., 1983; Linton et al., 1980), the approach is logical and has proven useful in the past (Ter Haar
and Aronow, 1974; Mielke et al., 1983). Figure 1 illustrates the relationship between soil Pb concentrations and the distance

S O I L L E A D C O N C E N T R A T I O N S I N R E S I D E N T I A L M I N N E S O T A 165
I
V
r l .< LI.J ._1 ._J 0 V)
20136
4000- 1
3500-~
3OOO-~
2500~
2000-
1500-
1000-
500-
O
Fig. 1.
5553 4185 7
,> ~ 9 ~ MAXIMUM VALUE
f, f, I ~ MEDIAN VALUE
f, 2
2 ~, 2 ",' '~ z
I I I I I I I I I I I I I I
0.3 0.6 0.9 1.2 1.5 1.8 2.1 2.4 2.7 3.0 3.4 3.7 4.0 4.3 4.6 6.1 7.6 9,1
DISTANCE FROM STRUCTURE ( m )
Median and maximum soil Pb concentration (gg g - ~ ) by distance from structure.
samples were collected from the nearest structure. Both maximum and median concen- trations are at their peak near house foundations, decrease sharply from 0-3 m, and stabilize thereafter. Although soil Pb concentrations exceeding 1000 g g g - 1 were
v "
I
IDn
C23 < I,I __1
O (/3
Z < £3 kH
Fig. 2.
900"
800"
700-
600-
500" V/I..M v A'.'.a , , ' / l%~1
400 . . . . .
V/Ix',4 ¢-/IxM
300-
v/1,.'-J 200" ~" -"- "
leo- T 0 FOUNDATION
ILR~RLR$1 WOOD
SIDING
STUCCO
BRICK
i i I I
BACK YARD SIDE YARD FRONT YARD STREET SIDE
SAMPLE TYPE
Median soil PB concentration (gg g - 1 ) by sample type and house exterior type.

166 M. D. C. SCHMITT ET AL.
occasionally found more than 3 m from the foundation, this was the exception rather than the rule. The low values observed at 0.6 m are the result of small sample size.
Figure 2 illustrates how the overall pattern of contamination exhibited in Figure 1 changes as a function of Pb source. Soil Pb concentrations in yards with brick resi- dences are relatively low, with contamination decreasing with increasing distance from the street. This pattern has been observed repeatedly when automotive emissions are the primary Pb source (Nriagu, 1978). Foundation soils along brick houses are modestly elevated, however, reflecting the impact of painted trim and the accumulation of Pb aerosols.
Yards with houses having wood, sided, or stucco exteriors exhibit a different contami- nation pattern, with the highest soil Pb concentrations located near the foundation. Since eroding paint affects only the area immediately around the house, soil Pb concen- trations elsewhere in the yard are not severely affected.
TABLE III Frequency with which samples of the indicated type were the most contaminated in a yard
with a house of the specified composition
Sample type Composition Brick Stucco Sided Wood
Foundation 40 % 72 ~ 68 % 74 % Street side 43% 15% 15% 13% Front, back, or side yard 17% 13% 17% 13%
Table III further reflects the influence of Pb source on the soil contamination pattern. Foundation soils are more likely to be the most severely contaminated soils in yards with houses having wood frame, sided, or stucco exteriors than brick ones.
Generally, soil Pb concentrations within each sample type were higher in the large cities of Minneapolis, St. Paul, and Duluth than in Rochester, St. Cloud, or other less developed areas. Soil Pb concentrations also tended to decrease with distance from the city center. This agrees with previous work indicating that soil Pb concentrations increase with degree of urbanization in Minnesota and decrease as the distance from the city center increases (Mielke, 1984/85).
It must be recognized, however, that there are numerous exceptions to this general trend. Significantly elevated soil Pb concentrations will be found near Pb painted structures irrespective of their location. If soil Pb concentrations are to be considered hazardous independent of contributions from other Pb sources, it will be necessary to recognize that these exceptions exist and address them appropriately.
The overall results obtained in this survey are comparable to those observed in studies conducted worldwide (Nriagu, 1978). Particularly striking is the similarity to the results of Ter Haar and Aronow (1974) in terms of the Pb concentrations found, the distribu- tion of contaminated soils in individual yards, and the role of Pb paint in governing this distribution.
SOIL LEAD CONCENTRATIONS IN RESIDENTIAL MINNESOTA 167
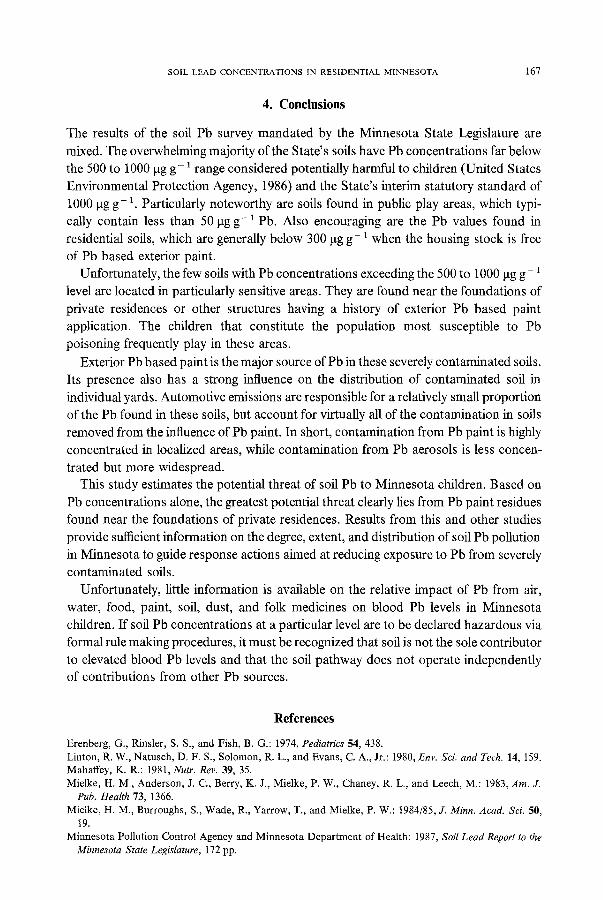
4. Conclusions
The results of the soil Pb survey mandated by the Minnesota State Legislature are mixed. The overwhelming majority &the State's soils have Pb concentrations far below the 500 to 1000 pg g- 1 range considered potentially harmful to children (United States Environmental Protection Agency, 1986) and the State's interim statutory standard of 1000 gg g- 1. Particularly noteworthy are soils found in public play areas, which typi- cally contain less than 50 pg g-1 Pb. Also encouraging are the Pb values found in residential soils, which are generally below 300 gg g- 1 when the housing stock is free of Pb based exterior paint.
Unfortunately, the few soils with Pb concentrations exceeding the 500 to 1000 pg g- 1 level are located in particularly sensitive areas. They are found near the foundations of private residences or other structures having a history of exterior Pb based paint application. The children that constitute the population most susceptible to Pb poisoning frequently play in these areas.
Exterior Pb based paint is the major source of Pb in these severely contaminated soils. Its presence also has a strong influence on the distribution of contaminated soil in individual yards. Automotive emissions are responsible for a relatively small proportion of the Pb found in these soils, but account for virtually all of the contamination in soils removed from the influence of Pb paint. In short, contamination from Pb paint is highly concentrated in localized areas, while contamination from Pb aerosols is less concen- trated but more widespread.
This study estimates the potential threat of soil Pb to Minnesota children. Based on Pb concentrations alone, the greatest potential threat clearly lies from Pb paint residues found near the foundations of private residences. Results from this and other studies provide sufficient information on the degree, extent, and distribution of soil Pb pollution in Minnesota to guide response actions aimed at reducing exposure to Pb from severely contaminated soils.
Unfortunately, little information is available on the relative impact of Pb from air, water, food, paint, soil, dust, and folk medicines on blood Pb levels in Minnesota children. If soil Pb concentrations at a particular level are to be declared hazardous via formal rule making procedures, it must be recognized that soil is not the sole contributor to elevated blood Pb levels and that the soil pathway does not operate independently of contributions from other Pb sources.
References
Erenberg, G., Rinsler, S. S., and Fish, B. G.: 1974, Pediatrics 54, 438. Linton, R. W., Natusch, D. F. S., Solomon, R. L , and Evans, C. A., Jr.: 1980, Env. Sci. and Tech. 14, 159. Mahaffey, K. R.: 1981, Nutr. Rev. 39, 35. Mielke, H. M., Anderson, J. C., Berry, K. J., Mielke, P. W., Chaney, R. L, and Leech, M.: 1983, Am. J.
Pub. Health 73, 1366. Mielke, H. M., Burroughs, S., Wade, R., Yarrow, T., and Mielke, P. W.: 1984/85, o r. Minn. Acad. Sci. 50,
19. Minnesota Pollution Control Agency and Minnesota Department of Health: 1987, Soil Lead Report to the
Minnesota State Legislature, 172 pp.

168 M. D. C. SCHMITT ET AL.
Nriagu, J. O.: 1978, 'Lead in Soils, Sediments, and Major Rock Types', pp. 15-72. in J. O. Nriagu (ed.), The Biogeochemistry of Lead in the Environment, Part A, Elsevier/North-Holland Biomedical Press, Amsterdam, 422 pp.
Pierce, F. J., Dowdy, R. H., and GTigal, D. F.: 1982, J. Env. Qual. 11, 416. Rosen, C. and Munter, R.: 1985, Lead in the Home Garden and Urban Environments, Univ. Minn. Ag. Ext.
Serv. Paper AG-FS-2543, 2 pp. SAS Institute Inc.: 1985a, SAS User's Guide: Basics, Version 5 Edition, SAS Institute Inc., Cary, N.C.,
1290 pp. SAS Institute Inc.: 1985b, SAS User's Guide: Statistics, Version 5 Edition, SAS Institute Inc., Cary, N.C.,
956 pp. Singer, M. J. and Hanson, L.: 1969, Soil ScL Soc. Am. Proc. 33, 152. Spittler, T. M. and Feder, W. A.: 1979, Comm. Soil Sci. and Plant AnaL 10, 1195. Ter Haar, G. and Aronow, R.: 1974, Env. Health Perspectives 7, 83. United States Department of Health and Human Services: 1984, Blood Lead Levels for Persons Ages
6 Months-74 Years: United States, 1976-1980, National Center for Health Statistics, DHHS Publication No. (PHS) 84-1683, 63 pp.
United States Department of Health and Human Services: 1985, Preventing Lead Poisoning in Young Children, Centers for Disease Control, DHHS Publication No. 99-2230, 35 pp.
United States Environmental Protection Agency: 1986,Air Quality Criteria for Lead (Draft Final), Volume III. EPA-600/8-83/028cF, U.S. Government Printing Office, Washington D.C.
Yaffe, Y., Fessel, C. P., Wesolowski, J. J., del Rosario, A., Guirguis, G. N., and Matias, V.: 1983, Arch. Env. Health 38, 237.