Soil fungal distribution and functionality as affected by grazing and vegetation components of...
10
Applied Soil Ecology 66 (2013) 61–70 Contents lists available at SciVerse ScienceDirect Applied Soil Ecology journa l h o me page: www.elsevier.com/locate/apsoil Soil fungal distribution and functionality as affected by grazing and vegetation components of integrated crop–livestock agroecosystems M. Davinic a , J. Moore-Kucera a,∗ , V. Acosta-Martínez b , J. Zak c , V. Allen a a Department of Plant & Soil Science, Texas Tech University, Lubbock, TX 79409, USA b USDA-ARS Cropping Systems Research Laboratory, Wind Erosion and Water Conservation Unit, Lubbock, TX, USA c Department of Biological Sciences, Texas Tech University, Lubbock, TX 79409,USA a r t i c l e i n f o Article history: Received 7 October 2012 Received in revised form 18 January 2013 Accepted 23 January 2013 Keywords: Agroecoystem Arbuscular mycorrhizae Saprophytic fungi Grazing C Utilization profiles Ester-linked fatty acid methyl esters a b s t r a c t Integrated crop and livestock (ICL) agroecosystems are characterized by a mixture of perennial or annual vegetation grazed by livestock and annual harvested crops. Compared to annual crops, ICLs hold the potential to enhance soil organic matter (OM) inputs, carbon sequestration, nutrient cycling, and water conservation. Soil fungi play an essential role in the transformation of OM and nutrients and soil struc- ture stabilization; however their specific role in OM transformations in ICL agroecosystems has not been studied. This study evaluated mycorrhizal and saprophytic fungal populations (via fatty acid methyl ester profiles; FAME) and saprophytic fungal functionality (via FungiLog analysis) under two ICL agroecosys- tems and a continuous cotton (Gossypium hirsutum L.) system in the Southern High Plains of the U.S. The first ICL system included non-irrigated perennial native grasses, an annual cotton and foxtail mil- let (Setaria italica) rotation and deficit-irrigated ‘WW-B. Dahl’ old world bluestem (Bothriochloa bladhii; OWB). The second ICL agroecosystem consisted of deficit-irrigated OWB and bermudagrass (Cynodon dactylon). The effect of grazing by cattle was evaluated via grazing exclusion areas. Abundance of sapro- phytic fungal FAMEs (10–26% of total FAMEs) and mycorrhizal FAMEs (2–24% of total FAMEs) were higher under ICLs compared to the continuous-cotton system at 0–5 cm. Overall, vegetation impacted the dis- tribution of the fungal FAME markers, whereas the fungal saprophytic functionality was more sensitive to grazing. Perennial vegetation of ICLs was associated with an increase in fungal markers (saprophytic and mycorrhizal) as well as increased soil OM content. Greater utilization of multiple C sources and increased saprophytic fungal functional indices were found under cotton, non-grazed perennial veg- etation (with exception of bermudagrass) and the rotation under millet. Among the grazed perennial vegetation, bermudagrass showed the highest fungal FAMEs abundance and functional diversity values. These fungal improvements were also reflected in the highest OM content under this grass, potentially indicating improved sustainability under the OWB and bermudagrass agroecosystem. © 2013 Elsevier B.V. All rights reserved. 1. Introduction Integrating grazing livestock production into cropping systems is an alternative agronomic practice to monoculture cropping and has been successfully utilized in diverse ecoregions including the cold, subhumid region of northcentral USA and Canada and the semiarid Southern High Plains (SHP) USA (Allen et al., 2005, 2012; Franzluebbers, 2007; Russelle and Franzluebbers, 2007). In the SHP, these integrated crop–livestock agroecosystems (ICL) have been shown to reduce irrigation and energy needs in compar- ison to monoculture cropping while increasing nutrient supply ∗ Corresponding author at: Department of Plant & Soil Science, Box 42122, Texas Tech University, Lubbock, TX 79409-2122, USA. Tel.: +1 806 742 2838x236; fax: +1 806 742 0775. E-mail address: [email protected] (J. Moore-Kucera). and carbon (C) storage (Allen et al., 2005, 2012; Acosta-Martínez et al., 2010a). This has been especially beneficial in the SHP region that faces declining water supplies from the nonsustainable extraction of the Ogallala Aquifer. The dominant crop is irrigated monoculture cotton that returns less biomass than other major crops (Lal, 2004) and leaves more soil exposed to the strong winds of this region. In contrast, ICLs typically include peren- nial grass paddocks which protect the soil surface from erosion (Kort et al., 1998) and increases nutrient availability from the decomposition of diverse plant residues via aboveground litter inputs (Patra et al., 2005; Seastedt et al., 1988) and root exudates (Bardgett et al., 1996). Although ICLs have been shown to sus- tain multiple ecological, economic, and agronomic benefits, the vast combinations of crop, livestock, and soil management options warrant long-term evaluation of the systems components to best understand the mechanisms and drivers responsible for enhanced sustainability. 0929-1393/$ – see front matter © 2013 Elsevier B.V. All rights reserved. http://dx.doi.org/10.1016/j.apsoil.2013.01.013
-
Upload
independent -
Category
Documents
-
view
0 -
download
0
Transcript of Soil fungal distribution and functionality as affected by grazing and vegetation components of...
Sv
Ma
b
c
a
ARRA
KAASGCE
1
ihcsFSbi
Tf
0h
Applied Soil Ecology 66 (2013) 61– 70
Contents lists available at SciVerse ScienceDirect
Applied Soil Ecology
journa l h o me page: www.elsev ier .com/ locate /apsoi l
oil fungal distribution and functionality as affected by grazing andegetation components of integrated crop–livestock agroecosystems
. Davinica, J. Moore-Kuceraa,∗, V. Acosta-Martínezb, J. Zakc, V. Allena
Department of Plant & Soil Science, Texas Tech University, Lubbock, TX 79409, USAUSDA-ARS Cropping Systems Research Laboratory, Wind Erosion and Water Conservation Unit, Lubbock, TX, USADepartment of Biological Sciences, Texas Tech University, Lubbock, TX 79409,USA
r t i c l e i n f o
rticle history:eceived 7 October 2012eceived in revised form 18 January 2013ccepted 23 January 2013
eywords:groecoystemrbuscular mycorrhizaeaprophytic fungirazing
Utilization profilesster-linked fatty acid methyl esters
a b s t r a c t
Integrated crop and livestock (ICL) agroecosystems are characterized by a mixture of perennial or annualvegetation grazed by livestock and annual harvested crops. Compared to annual crops, ICLs hold thepotential to enhance soil organic matter (OM) inputs, carbon sequestration, nutrient cycling, and waterconservation. Soil fungi play an essential role in the transformation of OM and nutrients and soil struc-ture stabilization; however their specific role in OM transformations in ICL agroecosystems has not beenstudied. This study evaluated mycorrhizal and saprophytic fungal populations (via fatty acid methyl esterprofiles; FAME) and saprophytic fungal functionality (via FungiLog analysis) under two ICL agroecosys-tems and a continuous cotton (Gossypium hirsutum L.) system in the Southern High Plains of the U.S.The first ICL system included non-irrigated perennial native grasses, an annual cotton and foxtail mil-let (Setaria italica) rotation and deficit-irrigated ‘WW-B. Dahl’ old world bluestem (Bothriochloa bladhii;OWB). The second ICL agroecosystem consisted of deficit-irrigated OWB and bermudagrass (Cynodondactylon). The effect of grazing by cattle was evaluated via grazing exclusion areas. Abundance of sapro-phytic fungal FAMEs (10–26% of total FAMEs) and mycorrhizal FAMEs (2–24% of total FAMEs) were higherunder ICLs compared to the continuous-cotton system at 0–5 cm. Overall, vegetation impacted the dis-tribution of the fungal FAME markers, whereas the fungal saprophytic functionality was more sensitiveto grazing. Perennial vegetation of ICLs was associated with an increase in fungal markers (saprophytic
and mycorrhizal) as well as increased soil OM content. Greater utilization of multiple C sources andincreased saprophytic fungal functional indices were found under cotton, non-grazed perennial veg-etation (with exception of bermudagrass) and the rotation under millet. Among the grazed perennialvegetation, bermudagrass showed the highest fungal FAMEs abundance and functional diversity values.These fungal improvements were also reflected in the highest OM content under this grass, potentiallyindicating improved sustainability under the OWB and bermudagrass agroecosystem.. Introduction
Integrating grazing livestock production into cropping systemss an alternative agronomic practice to monoculture cropping andas been successfully utilized in diverse ecoregions including theold, subhumid region of northcentral USA and Canada and theemiarid Southern High Plains (SHP) USA (Allen et al., 2005, 2012;ranzluebbers, 2007; Russelle and Franzluebbers, 2007). In the
HP, these integrated crop–livestock agroecosystems (ICL) haveeen shown to reduce irrigation and energy needs in compar-son to monoculture cropping while increasing nutrient supply
∗ Corresponding author at: Department of Plant & Soil Science, Box 42122, Texasech University, Lubbock, TX 79409-2122, USA. Tel.: +1 806 742 2838x236;ax: +1 806 742 0775.
E-mail address: [email protected] (J. Moore-Kucera).
929-1393/$ – see front matter © 2013 Elsevier B.V. All rights reserved.ttp://dx.doi.org/10.1016/j.apsoil.2013.01.013
© 2013 Elsevier B.V. All rights reserved.
and carbon (C) storage (Allen et al., 2005, 2012; Acosta-Martínezet al., 2010a). This has been especially beneficial in the SHPregion that faces declining water supplies from the nonsustainableextraction of the Ogallala Aquifer. The dominant crop is irrigatedmonoculture cotton that returns less biomass than other majorcrops (Lal, 2004) and leaves more soil exposed to the strongwinds of this region. In contrast, ICLs typically include peren-nial grass paddocks which protect the soil surface from erosion(Kort et al., 1998) and increases nutrient availability from thedecomposition of diverse plant residues via aboveground litterinputs (Patra et al., 2005; Seastedt et al., 1988) and root exudates(Bardgett et al., 1996). Although ICLs have been shown to sus-tain multiple ecological, economic, and agronomic benefits, the
vast combinations of crop, livestock, and soil management optionswarrant long-term evaluation of the systems components to bestunderstand the mechanisms and drivers responsible for enhancedsustainability.
6 d Soil
sibd122SaasF21fansm(f(aZo(
toahavecstbp(tb2bgpc2toomamim2(pgomf
a
2 M. Davinic et al. / Applie
At the core of many ecological services supporting long-termustainability are the processes performed by soil microorgan-sms. Soil fungi constitute a major proportion of the soil microbialiomass and support ecological sustainability in all ecosystemsue to their key roles in nutrient cycling (Suberkropp and Weyers,996), formation of stable soil aggregates (Schutter and Dick,000), crop disease introduction and suppression (Fravel et al.,003; Janvier et al., 2007) and C storage (Adu and Oades, 1978;uberkropp and Weyers, 1996). In semiarid environments, fungire particularly important to help aggregate soil particles to protectgainst erosion and increase water and nutrient uptake via exten-ion of rooting surfaces from mycorrhizal associations (Rillig, 2004).urthermore, fungi are sensitive to environmental (Sobek and Zak,003) and agronomic disturbances (Drijber et al., 2000; Frey et al.,999; Wang and Qiu, 2006), which ultimately impact ecosystemunctionality and thus, monitoring soil fungal dynamics may serves an excellent indicator group to assess the impacts from agro-omic practices on ecosystem functioning. Our knowledge of thetructure of soil fungal communities as affected by land manage-ent has been expanded by using specific fatty acid methyl ester
FAME) biomarkers to distinguish between arbuscular mycorrhizalungi (Graham et al., 1995; Olsson, 1999) and saprophytic fungiFrostegård and Bååth, 1996; Zelles et al., 1991). Saprophytic fungalctivity can be assessed using the FungiLog method (Dobranic andak, 1999), which provides information about the catabolic profilef soil fungi and ecosystem stability, productivity and resilienceBell et al., 2008, 2009; Sobek and Zak, 2003).
The ICL agroecosystems can influence soil microbial communi-ies and overall ecosystem functioning but the extent and directionf the impact depends on a variety of management choices suchs tillage, vegetation type(s) and grazing management. Althoughigher concentrations of fungal markers have been reported ingricultural systems associated with no-till systems with increasedegetative and litter cover (Acosta-Martínez et al., 2010a; Schuttert al., 2001), the relative abundance of fungi over bacteria is notonsistently higher under no-till practices compared to more inten-ive tillage (Helgason et al., 2009). The composition and function ofhe heterotrophic microbial communities can also be influencedy changes in resource availability when plant community com-osition is changed due to shifts in plant biochemical compositionZak et al., 2003). Compared to monoculture production, crop rota-ion systems result in increased organic C and N content, microbialiomass and microbial activity (Miller and Dick, 1995; Moore et al.,000; Acosta-Martínez et al., 2004). Furthermore, higher soil micro-ial diversity, enzyme activities involved in nutrient cycling andreater fungal:bacterial ratios were found in a 5-year old ICL com-osed of perennial grass and a wheat-fallow–rye–cotton rotationompared to cotton monoculture in the SHP (Acosta-Martínez et al.,004). These shifts in microbial composition and enhanced func-ionality in the ICL however, were dependent on the crop at timef sampling. In addition to the direct effects of vegetation typen soil microbial dynamics, grazing animals potentially impacticrobial communities and functions through their interactive
lteration to the chemistry, growth and composition of plant com-unities (Bardgett et al., 1998). Although grazing can negatively
mpact soil microorganisms (Bethlenfalvay and Dakessian, 1984),any other studies have reported beneficial impacts (Patra et al.,
005) including enhanced N cycling via inputs from animal excretaMcNaughton et al., 1997) and altered microbial community com-osition (Bardgett et al., 2001). Type of animal, grazing intensity,razing history, and inherent soil properties likely account for muchf the variation between reported results and highlight the need for
ore studies evaluating long-term impacts of grazing on ecosystemunctioning (Bardgett et al., 1998).The complexity of ICL agroecosystems requires a systems-level
pproach that evaluates vegetative and grazing components over
Ecology 66 (2013) 61– 70
the long-term. Therefore, the present study assessed the relativeabundance of saprophytic and mycorrhizal FAME fungal markersand the C utilization patterns of fungi as impacted by vegetativecomponents of two ICL agroecosystems compared to continuouscotton (Gossypium hirsutum L.), as well as the effect of grazingwithin the ICL systems in the SHP region.
2. Materials and methods
2.1. Site description
The three agroecosystems were located in the Southern HighPlains at the Texas Tech Experimental Farm (TTEF) in New Deal,TX (33◦44′6.7′′N latitude; 101◦44′20′′W longitude; 93 m eleva-tion). The area is characterized by a semi-arid climate with amean annual precipitation of 46.5 cm occurring mostly from Aprilthrough October (NOAA, 2010). The average daily temperatureranges between 7.9 and 22.9 ◦C. The coolest month is Januarywith an average low temperature of −4.4 ◦C, and the warmestmonth is July with an average high temperature of 33.3 ◦C. BetweenJanuary and just prior to sampling in July 2010, the study sitereceived 40.6 cm of precipitation. Two of the three agroecosys-tems were ICLs initiated in 2004 with three field replicates totaling42 ha and the third agroecosystem was managed for at leastfour years as a continuous cotton (CTNc) system. All agroecosys-tems were established on Pullman clay loam soil (fine, mixed,superactive, thermic Torrertic Paleustolls) with an average of38% clay, 28% silt, and 34% sand and a pH of 7.7 in the top20 cm.
The first ICL is a forage-cotton (FRG CTN) system comprisedof three non-irrigated paddocks and one irrigated paddock. Thenon-irrigated paddocks included one paddock of perennial nativegrasses (PNG) (4.5 ha) and two paddocks of annual crops (1.7 haeach) that rotated between cotton [Ct; G. hirsutum L.] and fox-tail millet [Mi; Setaria italica (L.) P. Beauv.]. Dominant grasseswithin the PNG included blue grama [Bouteloua gracilis (Willd.ex Kunth) Lag. ex Griffiths], sideoats grama [Bouteloua curtipen-dula (Michx.) Torr.], buffalograss [Buchloe dactyloides (Nutt.) J.T.Columbus], and green sprangletop [Leptochloa dubia (Kunth) Nees].The irrigated paddock contained ‘WW-B. Dahl’ old world bluestem(OWB1) [Bothriochloa bladhii (Retz.) S.T. Blake] (2.1 ha), which orig-inally was managed from 2004 to 2008 as part of the irrigatedsecond ICL system described below but in 2009, was incorporatedas part of the FRG CTN system to assist in cattle retention duringdrought years (Zilverberg, 2012). Steers grazed PNG, foxtail millet,and OWB1, before moving to the feedyard for finishing. Averagestocking density for 2009–2010 in PNG, OWB1 and in the millet ofthe Mi–Ct rotation were 6.6, 14.5, and 5.7 steers ha−1, respectively.The PNG paddocks received a total of 60 kg ha−1 N, 11 kg ha−1 P and18 kg ha−1 S in 2009, while no fertilizer was applied in 2010. In2009 and 2010, OWB1 received an average of 200 mm of irrigationand 477 mm of precipitation per year, which is equivalent to anaverage of 39% replacement of evapotranspiration (i.e., deficit irri-gated). This paddock also received 67 kg N ha−1 and 12 kg S ha−1
each year in the last two years prior to sampling. Each crop of themillet–cotton rotation (Mi–Ct) received 56 kg N ha−1, 11 kg P ha−1
and 17 kg S ha−1 annually. The cotton variety was ‘FiberMax 9058F’.The second ICL is a deficit-irrigated (average of 49% replacement
of evapotranspiration) three-paddock agroecosystem consisting oftwo types of perennial warm-season grasses: ‘WW-B. Dahl’ oldworld bluestem and bermudagrass [Cynodon dactylon (L.) Pers.](OWB BER). One paddock (2.1 ha) contains OWB (OWB2) and the
remaining two paddocks contain ‘Tifton-85’ bermudagrass (BER) on0.89 ha each. Because the two BER paddocks were similarly man-aged, only one bermudagrass paddock was sampled to conservecosts of analyses. Excess growth of bermudagrass was harvested
d Soil
fOfb6Oii6d
sItcaSa
2
2cairdCsfias
aebtfcrtrMwssmaa
2
v1fipeoItuU
M. Davinic et al. / Applie
or hay. All vegetative components of this agroecosystem andWB1 from the FRG-CTN system were irrigated with a subsur-
ace drip irrigation (SDI) system with tapes located on 1-m centers,uried 0.36 m deep. The OWB2 received 203 mm yr−1 of irrigation,7 kg N ha−1 and 12 kg S ha−1, annually. During spring growth,WB2 is grazed before BER. The BER received 254 mm yr−1 of
rrigation, 200 kg N ha−1 and 36 kg S ha−1 per year. Average stock-ng density for 2009–2010 in OWB2 and BER were 21.8 and7.4 steers ha−1, respectively. Grazing management and ICL systemetails are found in Zilverberg (2012).
The CTNc system was adjacent to the FRG CTN and OWB BERystems, though it is not part of the same experimental design of theCLs. This field is non-grazed, 0.25-ha in size and has been under cot-on production with similar management for at least four years. Theotton variety was ‘Delta Pine DP0912 B2RF’, planted with Temikpplied in furrows at 5.6 kg ha−1. The CTNc was irrigated with aDI system with tapes located on 1-m centers and received a meannnual N application rate of 48.2 kg ha−1 through the drip tape.
.2. Soil sampling
The soil samples (0–5 and 5–20 cm depths) were collected in July010, which represents the summer growth season when annualrops were established (especially critical for cotton production)nd livestock were actively grazing. Each sample was a compos-te mixture of five randomly selected locations within each fieldeplicate. Due to the thick rooting system under the BER pad-ocks, the top 2.5 cm of organic material were removed. For theTNc, where traditional field replicates did not exist, three tran-ects were established prior to sampling, marked by GPS, andve soil samples were collected randomly along each transectnd combined to create three spatially distinct and random fieldamples.
In order to assess grazing effects on soil properties, sampleslso were taken from caged areas (4.8 m × 4.8 m) designed toxclude cattle. Cages were placed in the center of each paddockeginning in 2004 and remained throughout the study, except inhe cotton–millet rotation when they temporarily were removed toacilitate planting and harvest of cotton. Following cotton harvest,ages were replaced in the same original location using previouslyecorded GPS coordinates. Throughout Section 3 (figures andables) and Section 4, the crop being produced as part of the Mi–Ctotation at the time of sampling is indicated in bold letters (i.e.,i–Ct) when sampled under cotton. All composite soil samplesere immediately stored in coolers in the field, transported the
ame day back to the laboratory and passed through a 4.75 mmieve within 48 h and stored field-moist at 4 ◦C. Gravimetric soiloisture was determined by oven drying field-moist samples
t 105 ◦C for 24 h. Subsamples were air-dried for soil chemicalnalyses.
.3. Selected soil properties
Soil microbial biomass C (MBC) and N (MBN) were assessedia the chloroform-fumigation extraction method (Brookes et al.,985; Vance et al., 1987) using 15 g of oven-dry equivalenteld-moist samples. Soil pH was measured in air-dried sam-les with a soil:water ratio of 1:1 and a combination glasslectrode. Soil OM content was determined in a private lab-ratory by the loss-on-ignition method (Ward Laboratories,
nc., Kearney, NE, USA). Air-dried subsamples were groundo a fine powder and total N (TN) content was measuredsing automated dry combustion (LECO TruSpec CN, Joseph, MI,SA).Ecology 66 (2013) 61– 70 63
2.4. Soil fungal composition assessment using EL-FAME analysis
Field-moist soil samples were analyzed according to the ester-linked fatty acid methyl esters (EL-FAMEs) method by Schutter andDick (2000). The FAME fractions were dried under N2 and analyzedusing a 6890 GC series II (Hewlett Packard, Wilmington, DE, USA)equipped with a flame ionization detector and a fused silica capil-lary column (25 m × 0.2 mm) and H2 (ultrahigh purity) as the carriergas (Acosta-Martínez et al., 2010a). Peak identification and areacalculation was performed using the TSBA6 aerobe program fromMIDI (Microbial ID, Inc., Newark, DE). Absolute amounts of FAMEs(nmol g−1 soil) were calculated according to Zelles (1997) using the19:0 internal standard and these values were subsequently used tocalculate mol percent. The FAMEs are described by the number of Catoms, followed by a colon, the number of double bonds and thenby the position of the first double bond from the methyl (�) endof the molecule. Arbuscular mycorrhizal fungi (AMF) were catego-rized by the FAME markers 16:1�5c and 20:1�9c (Graham et al.,1995; Madan et al., 2002; Olsson, 1999) and saprophytic fungi usingthe FAME makers 18:1�9c, 18:2�6c and 18:3�6c (Frostegård andBååth, 1996; Zelles, 1997; Zelles et al., 1991). Because the 18:2�6,9and 18:1�9 markers for saprophytic fungi are also major plant fattyacids (Frostegård et al., 2011), care was taken when processing sam-ples for FAME analysis to remove all visible plant parts to minimizethis interference.
2.5. Soil saprophytic fungal functional diversity using Cutilization profiles
Fungal C utilization profiles were assessed via the FungiLog pro-cedure, as described by Dobranic and Zak (1999), which uses BiologSFN2 96-well microtiter plates containing 95 different C substrates(Biolog, Hayward, CA, USA). Each well was inoculated with a 100-�lmixture of water, agar, streptomycin sulfate and chlortetracyclinehydrochloride (used as antibiotics), dimethylthiazolyl-diphenyl-tetrazolium bromide (color reaction dye) and 50 mg of soil OMparticles between 250 and 500 �m in size (Sobek and Zak, 2003).The microtiter plates were incubated at room temperature for 120-h (time which allows for the most complete C utilization) and thenabsorbance was measured at 590 nm (Sobek and Zak, 2003) onan Epoch spectrophotometer (BioTek, VT, USA). Absorbance valueswere converted to fungal functional responses for total substrateactivity (SA), substrate richness (SR) and substrate diversity (H) asdescribed by Zak et al. (1994). Briefly, SA is calculated as the sum ofthe absorbance across the entire plate and represents the combinedcapacity to utilize different C substrates; SR is the total numberof wells displaying any activity; and H is equivalent to the Shan-non index (Magurran, 1988) and is calculated as the ratio of theactivity (absorbance at 590 nm) of a particular C substrate to thesum of all absorbance values > 0 (Dobranic and Zak, 1999). Each Csubstrate on the plate was analyzed individually and collectivelyas one of six groups (guilds) of chemically similar substrates. Thesix guilds were: (1) amines/amides, (2) complex carbohydrates,(3) carboxylic acids, (4) polymers, (5) amino acids and (6) simplecarbohydrates (Sobek and Zak, 2003).
2.6. Statistical analyses
Analysis of variance (ANOVA) and non-metric multidimensionalscaling (NMS) ordinations were used to determine differences ofthe FAMEs, FungiLog data and selected soil properties due to sys-tem, vegetation (i.e., individual components of each ICL or CTNc
system) and grazing effects (for the ICL agroecosystems only). Eachdepth was independently analyzed. For the ANOVAs, data wereanalyzed with two statistical models using SAS (version 9.2, SASInstitute, 2008). In the first model, we tested for differences among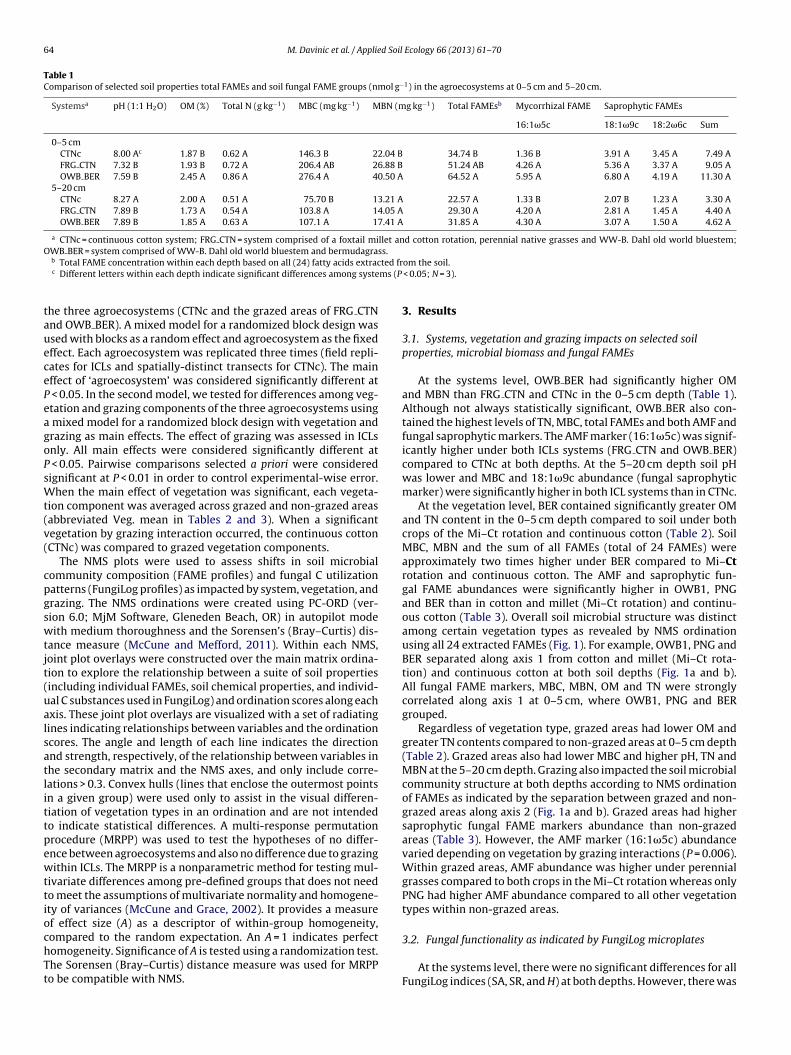
64 M. Davinic et al. / Applied Soil Ecology 66 (2013) 61– 70
Table 1Comparison of selected soil properties total FAMEs and soil fungal FAME groups (nmol g−1) in the agroecosystems at 0–5 cm and 5–20 cm.
Systemsa pH (1:1 H2O) OM (%) Total N (g kg−1) MBC (mg kg−1) MBN (mg kg−1) Total FAMEsb Mycorrhizal FAME Saprophytic FAMEs
16:1�5c 18:1�9c 18:2�6c Sum
0–5 cmCTNc 8.00 Ac 1.87 B 0.62 A 146.3 B 22.04 B 34.74 B 1.36 B 3.91 A 3.45 A 7.49 AFRG CTN 7.32 B 1.93 B 0.72 A 206.4 AB 26.88 B 51.24 AB 4.26 A 5.36 A 3.37 A 9.05 AOWB BER 7.59 B 2.45 A 0.86 A 276.4 A 40.50 A 64.52 A 5.95 A 6.80 A 4.19 A 11.30 A
5–20 cmCTNc 8.27 A 2.00 A 0.51 A 75.70 B 13.21 A 22.57 A 1.33 B 2.07 B 1.23 A 3.30 AFRG CTN 7.89 B 1.73 A 0.54 A 103.8 A 14.05 A 29.30 A 4.20 A 2.81 A 1.45 A 4.40 AOWB BER 7.89 B 1.85 A 0.63 A 107.1 A 17.41 A 31.85 A 4.30 A 3.07 A 1.50 A 4.62 A
a CTNc = continuous cotton system; FRG CTN = system comprised of a foxtail millet and cotton rotation, perennial native grasses and WW-B. Dahl old world bluestem;OWB BER = system comprised of WW-B. Dahl old world bluestem and bermudagrass.
ted frms (P
tauecePeagoPsWt(v(
cpgswtjt(ualsatlittpewttiochTt
b Total FAME concentration within each depth based on all (24) fatty acids extracc Different letters within each depth indicate significant differences among syste
he three agroecosystems (CTNc and the grazed areas of FRG CTNnd OWB BER). A mixed model for a randomized block design wassed with blocks as a random effect and agroecosystem as the fixedffect. Each agroecosystem was replicated three times (field repli-ates for ICLs and spatially-distinct transects for CTNc). The mainffect of ‘agroecosystem’ was considered significantly different at
< 0.05. In the second model, we tested for differences among veg-tation and grazing components of the three agroecosystems using
mixed model for a randomized block design with vegetation andrazing as main effects. The effect of grazing was assessed in ICLsnly. All main effects were considered significantly different at
< 0.05. Pairwise comparisons selected a priori were consideredignificant at P < 0.01 in order to control experimental-wise error.
hen the main effect of vegetation was significant, each vegeta-ion component was averaged across grazed and non-grazed areasabbreviated Veg. mean in Tables 2 and 3). When a significantegetation by grazing interaction occurred, the continuous cottonCTNc) was compared to grazed vegetation components.
The NMS plots were used to assess shifts in soil microbialommunity composition (FAME profiles) and fungal C utilizationatterns (FungiLog profiles) as impacted by system, vegetation, andrazing. The NMS ordinations were created using PC-ORD (ver-ion 6.0; MjM Software, Gleneden Beach, OR) in autopilot modeith medium thoroughness and the Sorensen’s (Bray–Curtis) dis-
ance measure (McCune and Mefford, 2011). Within each NMS,oint plot overlays were constructed over the main matrix ordina-ion to explore the relationship between a suite of soil propertiesincluding individual FAMEs, soil chemical properties, and individ-al C substances used in FungiLog) and ordination scores along eachxis. These joint plot overlays are visualized with a set of radiatingines indicating relationships between variables and the ordinationcores. The angle and length of each line indicates the directionnd strength, respectively, of the relationship between variables inhe secondary matrix and the NMS axes, and only include corre-ations > 0.3. Convex hulls (lines that enclose the outermost pointsn a given group) were used only to assist in the visual differen-iation of vegetation types in an ordination and are not intendedo indicate statistical differences. A multi-response permutationrocedure (MRPP) was used to test the hypotheses of no differ-nce between agroecosystems and also no difference due to grazingithin ICLs. The MRPP is a nonparametric method for testing mul-
ivariate differences among pre-defined groups that does not needo meet the assumptions of multivariate normality and homogene-ty of variances (McCune and Grace, 2002). It provides a measuref effect size (A) as a descriptor of within-group homogeneity,
ompared to the random expectation. An A = 1 indicates perfectomogeneity. Significance of A is tested using a randomization test.he Sorensen (Bray–Curtis) distance measure was used for MRPPo be compatible with NMS.om the soil. < 0.05; N = 3).
3. Results
3.1. Systems, vegetation and grazing impacts on selected soilproperties, microbial biomass and fungal FAMEs
At the systems level, OWB BER had significantly higher OMand MBN than FRG CTN and CTNc in the 0–5 cm depth (Table 1).Although not always statistically significant, OWB BER also con-tained the highest levels of TN, MBC, total FAMEs and both AMF andfungal saprophytic markers. The AMF marker (16:1�5c) was signif-icantly higher under both ICLs systems (FRG CTN and OWB BER)compared to CTNc at both depths. At the 5–20 cm depth soil pHwas lower and MBC and 18:1�9c abundance (fungal saprophyticmarker) were significantly higher in both ICL systems than in CTNc.
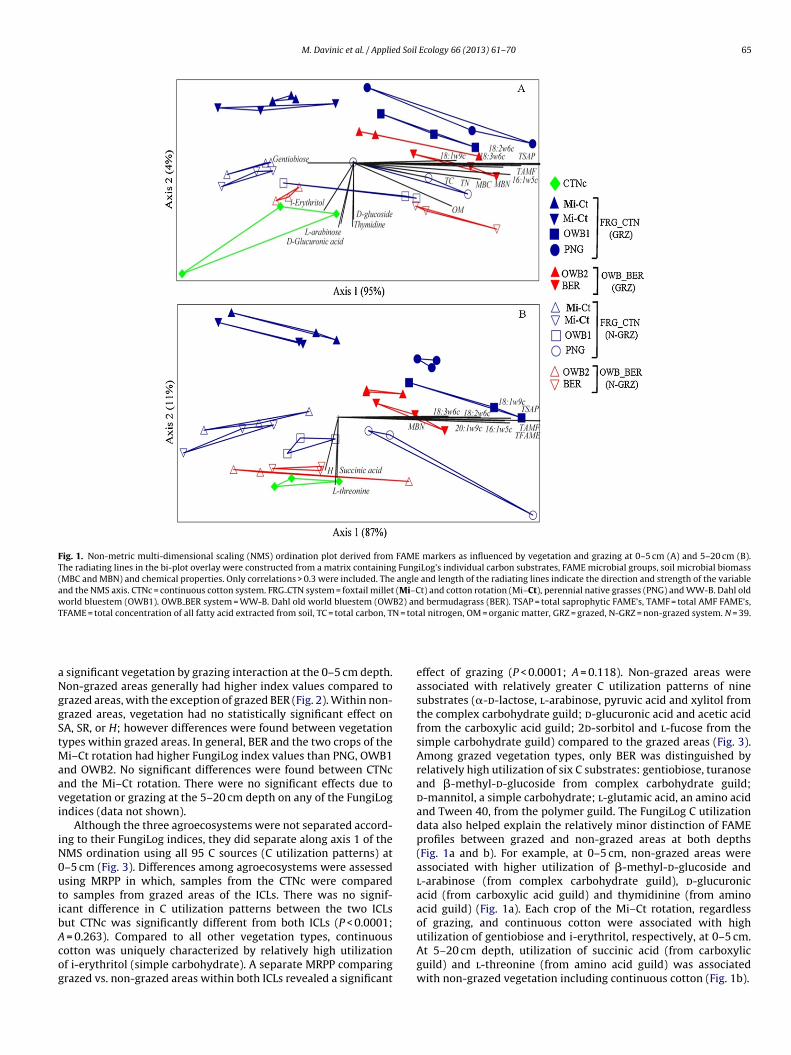
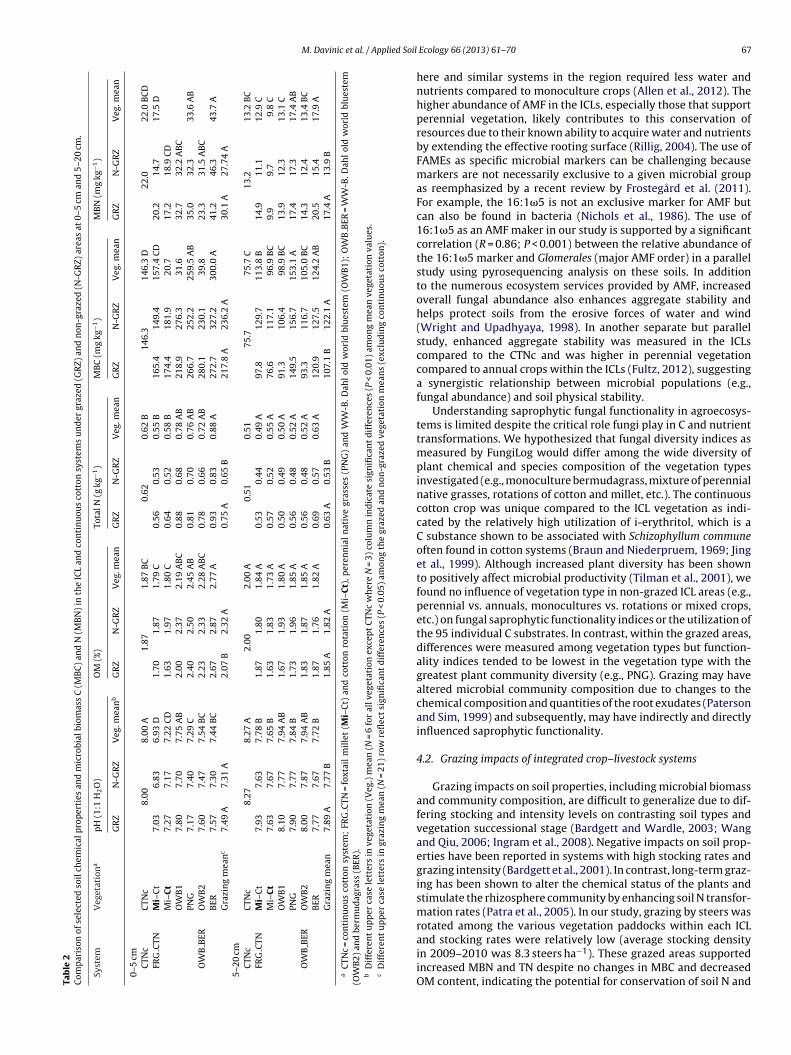
At the vegetation level, BER contained significantly greater OMand TN content in the 0–5 cm depth compared to soil under bothcrops of the Mi–Ct rotation and continuous cotton (Table 2). SoilMBC, MBN and the sum of all FAMEs (total of 24 FAMEs) wereapproximately two times higher under BER compared to Mi–Ctrotation and continuous cotton. The AMF and saprophytic fun-gal FAME abundances were significantly higher in OWB1, PNGand BER than in cotton and millet (Mi–Ct rotation) and continu-ous cotton (Table 3). Overall soil microbial structure was distinctamong certain vegetation types as revealed by NMS ordinationusing all 24 extracted FAMEs (Fig. 1). For example, OWB1, PNG andBER separated along axis 1 from cotton and millet (Mi–Ct rota-tion) and continuous cotton at both soil depths (Fig. 1a and b).All fungal FAME markers, MBC, MBN, OM and TN were stronglycorrelated along axis 1 at 0–5 cm, where OWB1, PNG and BERgrouped.
Regardless of vegetation type, grazed areas had lower OM andgreater TN contents compared to non-grazed areas at 0–5 cm depth(Table 2). Grazed areas also had lower MBC and higher pH, TN andMBN at the 5–20 cm depth. Grazing also impacted the soil microbialcommunity structure at both depths according to NMS ordinationof FAMEs as indicated by the separation between grazed and non-grazed areas along axis 2 (Fig. 1a and b). Grazed areas had highersaprophytic fungal FAME markers abundance than non-grazedareas (Table 3). However, the AMF marker (16:1�5c) abundancevaried depending on vegetation by grazing interactions (P = 0.006).Within grazed areas, AMF abundance was higher under perennialgrasses compared to both crops in the Mi–Ct rotation whereas onlyPNG had higher AMF abundance compared to all other vegetationtypes within non-grazed areas.
3.2. Fungal functionality as indicated by FungiLog microplates
At the systems level, there were no significant differences for allFungiLog indices (SA, SR, and H) at both depths. However, there was
M. Davinic et al. / Applied Soil Ecology 66 (2013) 61– 70 65
Fig. 1. Non-metric multi-dimensional scaling (NMS) ordination plot derived from FAME markers as influenced by vegetation and grazing at 0–5 cm (A) and 5–20 cm (B).The radiating lines in the bi-plot overlay were constructed from a matrix containing FungiLog’s individual carbon substrates, FAME microbial groups, soil microbial biomass(MBC and MBN) and chemical properties. Only correlations > 0.3 were included. The angle and length of the radiating lines indicate the direction and strength of the variableand the NMS axis. CTNc = continuous cotton system. FRG CTN system = foxtail millet (Mi–Ct) and cotton rotation (Mi–Ct), perennial native grasses (PNG) and WW-B. Dahl oldworld bluestem (OWB1). OWB BER system = WW-B. Dahl old world bluestem (OWB2) and bermudagrass (BER). TSAP = total saprophytic FAME’s, TAMF = total AMF FAME’s,TFAME = total concentration of all fatty acid extracted from soil, TC = total carbon, TN = total nitrogen, OM = organic matter, GRZ = grazed, N-GRZ = non-grazed system. N = 39.
aNggStMaavi
iN0utibAcog
significant vegetation by grazing interaction at the 0–5 cm depth.on-grazed areas generally had higher index values compared torazed areas, with the exception of grazed BER (Fig. 2). Within non-razed areas, vegetation had no statistically significant effect onA, SR, or H; however differences were found between vegetationypes within grazed areas. In general, BER and the two crops of the
i–Ct rotation had higher FungiLog index values than PNG, OWB1nd OWB2. No significant differences were found between CTNcnd the Mi–Ct rotation. There were no significant effects due toegetation or grazing at the 5–20 cm depth on any of the FungiLogndices (data not shown).
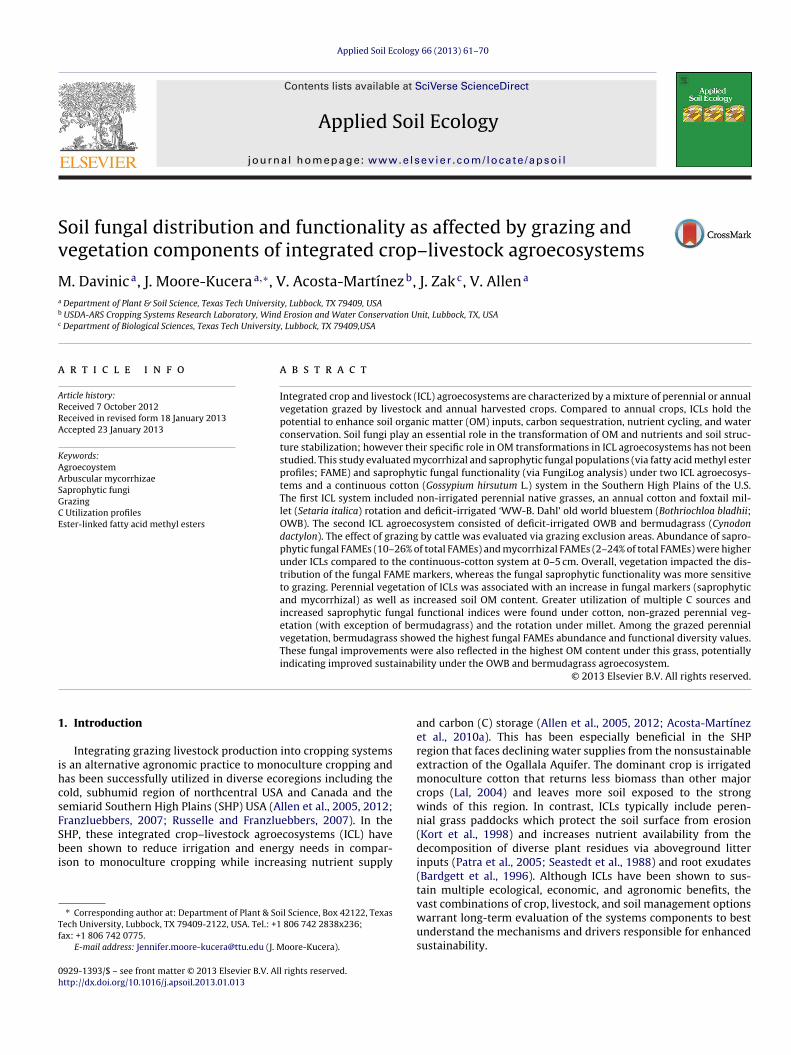
Although the three agroecosystems were not separated accord-ng to their FungiLog indices, they did separate along axis 1 of theMS ordination using all 95 C sources (C utilization patterns) at–5 cm (Fig. 3). Differences among agroecosystems were assessedsing MRPP in which, samples from the CTNc were comparedo samples from grazed areas of the ICLs. There was no signif-cant difference in C utilization patterns between the two ICLsut CTNc was significantly different from both ICLs (P < 0.0001;
= 0.263). Compared to all other vegetation types, continuousotton was uniquely characterized by relatively high utilizationf i-erythritol (simple carbohydrate). A separate MRPP comparingrazed vs. non-grazed areas within both ICLs revealed a significant
effect of grazing (P < 0.0001; A = 0.118). Non-grazed areas wereassociated with relatively greater C utilization patterns of ninesubstrates (�-d-lactose, l-arabinose, pyruvic acid and xylitol fromthe complex carbohydrate guild; d-glucuronic acid and acetic acidfrom the carboxylic acid guild; 2d-sorbitol and l-fucose from thesimple carbohydrate guild) compared to the grazed areas (Fig. 3).Among grazed vegetation types, only BER was distinguished byrelatively high utilization of six C substrates: gentiobiose, turanoseand �-methyl-d-glucoside from complex carbohydrate guild;d-mannitol, a simple carbohydrate; l-glutamic acid, an amino acidand Tween 40, from the polymer guild. The FungiLog C utilizationdata also helped explain the relatively minor distinction of FAMEprofiles between grazed and non-grazed areas at both depths(Fig. 1a and b). For example, at 0–5 cm, non-grazed areas wereassociated with higher utilization of �-methyl-d-glucoside andl-arabinose (from complex carbohydrate guild), d-glucuronicacid (from carboxylic acid guild) and thymidinine (from aminoacid guild) (Fig. 1a). Each crop of the Mi–Ct rotation, regardlessof grazing, and continuous cotton were associated with high
utilization of gentiobiose and i-erythritol, respectively, at 0–5 cm.At 5–20 cm depth, utilization of succinic acid (from carboxylicguild) and l-threonine (from amino acid guild) was associatedwith non-grazed vegetation including continuous cotton (Fig. 1b).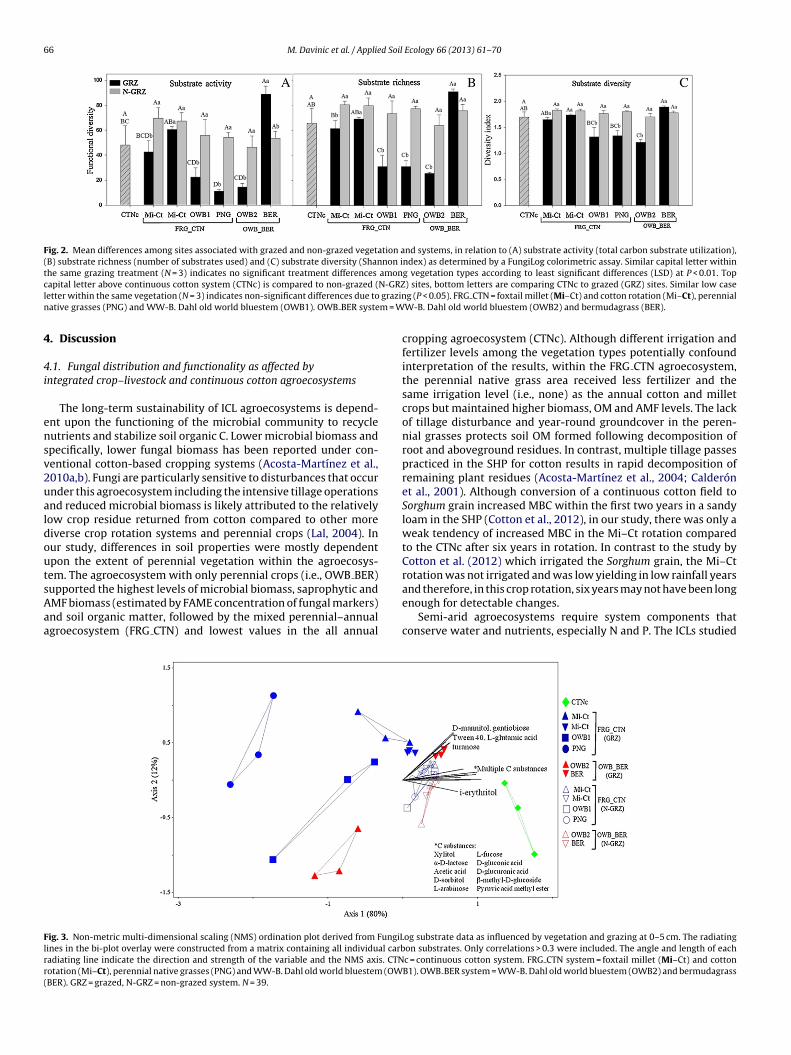
66 M. Davinic et al. / Applied Soil Ecology 66 (2013) 61– 70
Fig. 2. Mean differences among sites associated with grazed and non-grazed vegetation and systems, in relation to (A) substrate activity (total carbon substrate utilization),(B) substrate richness (number of substrates used) and (C) substrate diversity (Shannon index) as determined by a FungiLog colorimetric assay. Similar capital letter withinthe same grazing treatment (N = 3) indicates no significant treatment differences among vegetation types according to least significant differences (LSD) at P < 0.01. Topc N-GRZl grazinn m = W
4
4i
ensv2ualdoutsAaa
Flrr(
apital letter above continuous cotton system (CTNc) is compared to non-grazed (etter within the same vegetation (N = 3) indicates non-significant differences due toative grasses (PNG) and WW-B. Dahl old world bluestem (OWB1). OWB BER syste
. Discussion
.1. Fungal distribution and functionality as affected byntegrated crop–livestock and continuous cotton agroecosystems
The long-term sustainability of ICL agroecosystems is depend-nt upon the functioning of the microbial community to recycleutrients and stabilize soil organic C. Lower microbial biomass andpecifically, lower fungal biomass has been reported under con-entional cotton-based cropping systems (Acosta-Martínez et al.,010a,b). Fungi are particularly sensitive to disturbances that occurnder this agroecosystem including the intensive tillage operationsnd reduced microbial biomass is likely attributed to the relativelyow crop residue returned from cotton compared to other moreiverse crop rotation systems and perennial crops (Lal, 2004). Inur study, differences in soil properties were mostly dependentpon the extent of perennial vegetation within the agroecosys-em. The agroecosystem with only perennial crops (i.e., OWB BER)
upported the highest levels of microbial biomass, saprophytic andMF biomass (estimated by FAME concentration of fungal markers)nd soil organic matter, followed by the mixed perennial–annualgroecosystem (FRG CTN) and lowest values in the all annualig. 3. Non-metric multi-dimensional scaling (NMS) ordination plot derived from FungiLines in the bi-plot overlay were constructed from a matrix containing all individual carbadiating line indicate the direction and strength of the variable and the NMS axis. CTNotation (Mi–Ct), perennial native grasses (PNG) and WW-B. Dahl old world bluestem (OWBER). GRZ = grazed, N-GRZ = non-grazed system. N = 39.
) sites, bottom letters are comparing CTNc to grazed (GRZ) sites. Similar low caseg (P < 0.05). FRG CTN = foxtail millet (Mi–Ct) and cotton rotation (Mi–Ct), perennialW-B. Dahl old world bluestem (OWB2) and bermudagrass (BER).
cropping agroecosystem (CTNc). Although different irrigation andfertilizer levels among the vegetation types potentially confoundinterpretation of the results, within the FRG CTN agroecosystem,the perennial native grass area received less fertilizer and thesame irrigation level (i.e., none) as the annual cotton and milletcrops but maintained higher biomass, OM and AMF levels. The lackof tillage disturbance and year-round groundcover in the peren-nial grasses protects soil OM formed following decomposition ofroot and aboveground residues. In contrast, multiple tillage passespracticed in the SHP for cotton results in rapid decomposition ofremaining plant residues (Acosta-Martínez et al., 2004; Calderónet al., 2001). Although conversion of a continuous cotton field toSorghum grain increased MBC within the first two years in a sandyloam in the SHP (Cotton et al., 2012), in our study, there was only aweak tendency of increased MBC in the Mi–Ct rotation comparedto the CTNc after six years in rotation. In contrast to the study byCotton et al. (2012) which irrigated the Sorghum grain, the Mi–Ctrotation was not irrigated and was low yielding in low rainfall years
and therefore, in this crop rotation, six years may not have been longenough for detectable changes.Semi-arid agroecosystems require system components thatconserve water and nutrients, especially N and P. The ICLs studied
og substrate data as influenced by vegetation and grazing at 0–5 cm. The radiatingon substrates. Only correlations > 0.3 were included. The angle and length of eachc = continuous cotton system. FRG CTN system = foxtail millet (Mi–Ct) and cottonB1). OWB BER system = WW-B. Dahl old world bluestem (OWB2) and bermudagrass
M. Davinic et al. / Applied Soil
Tab
le
2C
omp
aris
on
of
sele
cted
soil
chem
ical
pro
per
ties
and
mic
robi
al
biom
ass
C
(MB
C)
and
N
(MB
N)
in
the
ICL
and
con
tin
uou
s
cott
on
syst
ems
un
der
graz
ed
(GR
Z)
and
non
-gra
zed
(N-G
RZ)
area
s
at
0–5
cm
and
5–20
cm.
Syst
em
Veg
etat
ion
ap
H
(1:1
H2O
)
OM
(%)
Tota
l N
(g
kg−1
)
MB
C
(mg
kg−1
)
MB
N
(mg
kg−1
)
GR
ZN
-GR
ZV
eg. m
ean
bG
RZ
N-G
RZ
Veg
. mea
n
GR
Z
N-G
RZ
Veg
. mea
n
GR
Z
N-G
RZ
Veg
. mea
n
GR
Z
N-G
RZ
Veg
. mea
n
0–5
cmC
TNc
CTN
c8.
008.
00
A
1.87
1.87
BC
0.62
0.62
B
146.
3
146.
3
D
22.0
22.0
BC
DFR
G
CTN
Mi–
Ct
7.03
6.83
6.93
D
1.70
1.87
1.79
C
0.56
0.53
0.55
B
165.
4
149.
4
157.
4
CD
20.2
14.7
17.5
DM
i–C
t
7.27
7.17
7.22
CD
1.63
1.97
1.80
C
0.64
0.52
0.58
B
174.
418
1.9
20.7
17.2
18.9
CD
OW
B1
7.80
7.70
7.75
AB
2.00
2.37
2.19
AB
C
0.88
0.68
0.78
AB
218.
9
276.
3
31.6
32.7
32.2
AB
CPN
G7.
177.
407.
29
C
2.40
2.50
2.45
AB
0.81
0.70
0.76
AB
266.
725
2.2
259.
5
AB
35.0
32.3
33.6
AB
OW
BB
ER
OW
B2
7.60
7.47
7.54
BC
2.23
2.33
2.28
AB
C
0.78
0.66
0.72
AB
280.
1
230.
1
39.8
23.3
31.5
AB
CB
ER
7.57
7.30
7.44
BC
2.67
2.87
2.77
A
0.93
0.83
0.88
A
272.
7
327.
2
300.
0
A
41.2
46.3
43.7
AG
razi
ng
mea
nc
7.49
A7.
31
A2.
07
B2.
32
A
0.75
A
0.65
B
217.
8
A
236.
2
A
30.1
A
27.7
4
A5–
20
cmC
TNc
CTN
c8.
278.
27
A2.
002.
00
A
0.51
0.51
75.7
75.7
C
13.2
13.2
BC
FRG
CTN
Mi–
Ct
7.93
7.63
7.78
B
1.87
1.80
1.84
A
0.53
0.44
0.49
A
97.8
129.
7
113.
8 B
14.9
11.1
12.9
CM
i–C
t
7.63
7.67
7.65
B
1.63
1.83
1.73
A
0.57
0.52
0.55
A
76.6
117.
1
96.9
BC
9.9
9.7
9.8
CO
WB
1
8.10
7.77
7.94
AB
1.67
1.93
1.80
A
0.50
0.49
0.50
A
91.3
106.
4
98.9
BC
13.9
12.3
13.1
CPN
G7.
907.
777.
84
B
1.73
1.96
1.85
A
0.56
0.48
0.52
A
149.
515
6.7
153.
1
A
17.4
17.3
17.4
AB
OW
BB
ER
OW
B2
8.00
7.87
7.94
AB
1.83
1.87
1.85
A
0.56
0.48
0.52
A
93.3
116.
7 10
5.0
BC
14.3
12.4
13.4
BC
BER
7.77
7.67
7.72
B
1.87
1.76
1.82
A
0.69
0.57
0.63
A
120.
912
7.5
124.
2
AB
20.5
15.4
17.9
AG
razi
ng
mea
n7.
89
A7.
77
B
1.85
A
1.82
A
0.63
A
0.53
B
107.
1
B
122.
1
A
17.4
A
13.9
B
aC
TNc
=
con
tin
uou
s
cott
on
syst
em;
FRG
CTN
=
foxt
ail
mil
let
(Mi–
Ct)
and
cott
on
rota
tion
(Mi–
Ct)
, per
enn
ial
nat
ive
gras
ses
(PN
G)
and
WW
-B. D
ahl
old
wor
ld
blu
este
m
(OW
B1)
;
OW
B
BER
=
WW
-B. D
ahl
old
wor
ld
blu
este
m(O
WB
2)
and
berm
ud
agra
ss
(BER
).b
Dif
fere
nt
up
per
case
lett
ers
in
vege
tati
on
(Veg
.)
mea
n
(N
=
6
for
all v
eget
atio
n
exce
pt
CTN
c
wh
ere
N
=
3)
colu
mn
ind
icat
e
sign
ifica
nt
dif
fere
nce
s
(P
< 0.
01)
amon
g
mea
n
vege
tati
on
valu
es.
cD
iffe
ren
t
up
per
case
lett
ers
in
graz
ing
mea
n
(N
=
21)
row
refl
ect
sign
ifica
nt
dif
fere
nce
s
(P
<
0.05
)
amon
g
the
graz
ed
and
non
-gra
zed
vege
tati
on
mea
ns
(exc
lud
ing
con
tin
uou
s
cott
on).
Ecology 66 (2013) 61– 70 67
here and similar systems in the region required less water andnutrients compared to monoculture crops (Allen et al., 2012). Thehigher abundance of AMF in the ICLs, especially those that supportperennial vegetation, likely contributes to this conservation ofresources due to their known ability to acquire water and nutrientsby extending the effective rooting surface (Rillig, 2004). The use ofFAMEs as specific microbial markers can be challenging becausemarkers are not necessarily exclusive to a given microbial groupas reemphasized by a recent review by Frostegård et al. (2011).For example, the 16:1�5 is not an exclusive marker for AMF butcan also be found in bacteria (Nichols et al., 1986). The use of16:1�5 as an AMF maker in our study is supported by a significantcorrelation (R = 0.86; P < 0.001) between the relative abundance ofthe 16:1�5 marker and Glomerales (major AMF order) in a parallelstudy using pyrosequencing analysis on these soils. In additionto the numerous ecosystem services provided by AMF, increasedoverall fungal abundance also enhances aggregate stability andhelps protect soils from the erosive forces of water and wind(Wright and Upadhyaya, 1998). In another separate but parallelstudy, enhanced aggregate stability was measured in the ICLscompared to the CTNc and was higher in perennial vegetationcompared to annual crops within the ICLs (Fultz, 2012), suggestinga synergistic relationship between microbial populations (e.g.,fungal abundance) and soil physical stability.
Understanding saprophytic fungal functionality in agroecosys-tems is limited despite the critical role fungi play in C and nutrienttransformations. We hypothesized that fungal diversity indices asmeasured by FungiLog would differ among the wide diversity ofplant chemical and species composition of the vegetation typesinvestigated (e.g., monoculture bermudagrass, mixture of perennialnative grasses, rotations of cotton and millet, etc.). The continuouscotton crop was unique compared to the ICL vegetation as indi-cated by the relatively high utilization of i-erythritol, which is aC substance shown to be associated with Schizophyllum communeoften found in cotton systems (Braun and Niederpruem, 1969; Jinget al., 1999). Although increased plant diversity has been shownto positively affect microbial productivity (Tilman et al., 2001), wefound no influence of vegetation type in non-grazed ICL areas (e.g.,perennial vs. annuals, monocultures vs. rotations or mixed crops,etc.) on fungal saprophytic functionality indices or the utilization ofthe 95 individual C substrates. In contrast, within the grazed areas,differences were measured among vegetation types but function-ality indices tended to be lowest in the vegetation type with thegreatest plant community diversity (e.g., PNG). Grazing may havealtered microbial community composition due to changes to thechemical composition and quantities of the root exudates (Patersonand Sim, 1999) and subsequently, may have indirectly and directlyinfluenced saprophytic functionality.
4.2. Grazing impacts of integrated crop–livestock systems
Grazing impacts on soil properties, including microbial biomassand community composition, are difficult to generalize due to dif-fering stocking and intensity levels on contrasting soil types andvegetation successional stage (Bardgett and Wardle, 2003; Wangand Qiu, 2006; Ingram et al., 2008). Negative impacts on soil prop-erties have been reported in systems with high stocking rates andgrazing intensity (Bardgett et al., 2001). In contrast, long-term graz-ing has been shown to alter the chemical status of the plants andstimulate the rhizosphere community by enhancing soil N transfor-mation rates (Patra et al., 2005). In our study, grazing by steers wasrotated among the various vegetation paddocks within each ICL
and stocking rates were relatively low (average stocking densityin 2009–2010 was 8.3 steers ha−1). These grazed areas supportedincreased MBN and TN despite no changes in MBC and decreasedOM content, indicating the potential for conservation of soil N and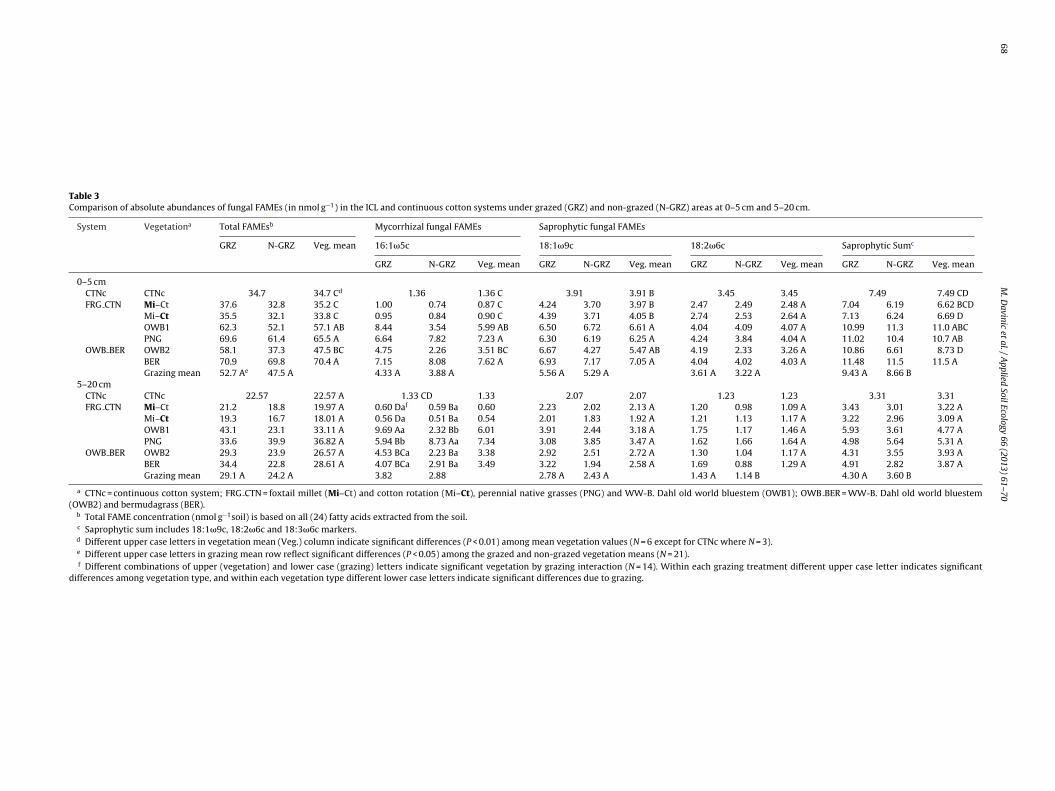
68M
. D
avinic et
al. /
Applied
Soil Ecology
66 (2013) 61– 70
Table 3Comparison of absolute abundances of fungal FAMEs (in nmol g−1) in the ICL and continuous cotton systems under grazed (GRZ) and non-grazed (N-GRZ) areas at 0–5 cm and 5–20 cm.
System Vegetationa Total FAMEsb Mycorrhizal fungal FAMEs Saprophytic fungal FAMEs
GRZ N-GRZ Veg. mean 16:1�5c 18:1�9c 18:2�6c Saprophytic Sumc
GRZ N-GRZ Veg. mean GRZ N-GRZ Veg. mean GRZ N-GRZ Veg. mean GRZ N-GRZ Veg. mean
0–5 cmCTNc CTNc 34.7 34.7 Cd 1.36 1.36 C 3.91 3.91 B 3.45 3.45 7.49 7.49 CDFRG CTN Mi–Ct 37.6 32.8 35.2 C 1.00 0.74 0.87 C 4.24 3.70 3.97 B 2.47 2.49 2.48 A 7.04 6.19 6.62 BCD
Mi–Ct 35.5 32.1 33.8 C 0.95 0.84 0.90 C 4.39 3.71 4.05 B 2.74 2.53 2.64 A 7.13 6.24 6.69 DOWB1 62.3 52.1 57.1 AB 8.44 3.54 5.99 AB 6.50 6.72 6.61 A 4.04 4.09 4.07 A 10.99 11.3 11.0 ABCPNG 69.6 61.4 65.5 A 6.64 7.82 7.23 A 6.30 6.19 6.25 A 4.24 3.84 4.04 A 11.02 10.4 10.7 AB
OWB BER OWB2 58.1 37.3 47.5 BC 4.75 2.26 3.51 BC 6.67 4.27 5.47 AB 4.19 2.33 3.26 A 10.86 6.61 8.73 DBER 70.9 69.8 70.4 A 7.15 8.08 7.62 A 6.93 7.17 7.05 A 4.04 4.02 4.03 A 11.48 11.5 11.5 AGrazing mean 52.7 Ae 47.5 A 4.33 A 3.88 A 5.56 A 5.29 A 3.61 A 3.22 A 9.43 A 8.66 B
5–20 cmCTNc CTNc 22.57 22.57 A 1.33 CD 1.33 2.07 2.07 1.23 1.23 3.31 3.31FRG CTN Mi–Ct 21.2 18.8 19.97 A 0.60 Daf 0.59 Ba 0.60 2.23 2.02 2.13 A 1.20 0.98 1.09 A 3.43 3.01 3.22 A
Mi–Ct 19.3 16.7 18.01 A 0.56 Da 0.51 Ba 0.54 2.01 1.83 1.92 A 1.21 1.13 1.17 A 3.22 2.96 3.09 AOWB1 43.1 23.1 33.11 A 9.69 Aa 2.32 Bb 6.01 3.91 2.44 3.18 A 1.75 1.17 1.46 A 5.93 3.61 4.77 APNG 33.6 39.9 36.82 A 5.94 Bb 8.73 Aa 7.34 3.08 3.85 3.47 A 1.62 1.66 1.64 A 4.98 5.64 5.31 A
OWB BER OWB2 29.3 23.9 26.57 A 4.53 BCa 2.23 Ba 3.38 2.92 2.51 2.72 A 1.30 1.04 1.17 A 4.31 3.55 3.93 ABER 34.4 22.8 28.61 A 4.07 BCa 2.91 Ba 3.49 3.22 1.94 2.58 A 1.69 0.88 1.29 A 4.91 2.82 3.87 AGrazing mean 29.1 A 24.2 A 3.82 2.88 2.78 A 2.43 A 1.43 A 1.14 B 4.30 A 3.60 B
a CTNc = continuous cotton system; FRG CTN = foxtail millet (Mi–Ct) and cotton rotation (Mi–Ct), perennial native grasses (PNG) and WW-B. Dahl old world bluestem (OWB1); OWB BER = WW-B. Dahl old world bluestem(OWB2) and bermudagrass (BER).
b Total FAME concentration (nmol g−1soil) is based on all (24) fatty acids extracted from the soil.c Saprophytic sum includes 18:1�9c, 18:2�6c and 18:3�6c markers.d Different upper case letters in vegetation mean (Veg.) column indicate significant differences (P < 0.01) among mean vegetation values (N = 6 except for CTNc where N = 3).e Different upper case letters in grazing mean row reflect significant differences (P < 0.05) among the grazed and non-grazed vegetation means (N = 21).f Different combinations of upper (vegetation) and lower case (grazing) letters indicate significant vegetation by grazing interaction (N = 14). Within each grazing treatment different upper case letter indicates significant
differences among vegetation type, and within each vegetation type different lower case letters indicate significant differences due to grazing.

d Soil
iHIhasCathsN
egFpcc2gofCblmdfdtI
5
fwwipethpg(rtafsOtr
A
wpsTmU
M. Davinic et al. / Applie
ncreased N availability under grazed areas (Bardgett et al., 1998;amilton and Frank, 2001; Holland et al., 1992; Yeates et al., 1997).
ncreased soil N loads from cattle urine and dung in grazed areasave been shown to suppress fungal activity (Deng et al., 2006)nd may partially explain the reduced fungal functional diver-ity indices (SA, SR, and H) and lower utilization of individual
substrates measured in grazed areas compared to non-grazedreas. However, BER, which received the highest N fertilizer levelshroughout each growing season (200 kg N ha−1) also supported theighest functionality diversity indices, thus indicating controls ofaprophytic fungal functionality are not exclusively related to soil
status.The chemical composition of C substrates (from plant root
xudates or aboveground residues) also influences saprophytic fun-al functionality (Wardle, 2002; Zimmer, 2002). Many of the CungiLog substrates utilized to a lesser extent in the grazed sam-les compared to those utilized in the non-grazed samples wereharacteristic of common plant root exudates, such as simple andomplex carbohydrates and carboxylic and amino acids (Bell et al.,009; Jones, 1998). The reduced utilization of these substrates inrazed areas suggests that grazing in these ICLs may have decreasedr altered belowground plant C inputs and subsequently affectedungal functional capability. Compared to grazed ICL vegetation,TNc was associated with functionally more diverse fungal assem-lages. The higher lignin and crude fibers found in cotton leaves,
int, and burr residues compared to grasses (Stewart et al., 1998)ay select for fungi that are more functionally capable to quickly
egrade a wide array of C sources. Although the fungal saprophyticunctionality was increased in the CTNc, the lower relative abun-ance of fungal markers and overall microbial biomass may explainhe relatively low OM content compared to OM measured in theCLs.
. Conclusion
The proportional abundances of saprophytic and mycorrhizalungal biomass and saprophytic fungal carbon use did differehen the two integrated crop and livestock (ICL) agroecosystemsere compared to a continuous monoculture cotton. Moreover,
n comparison to the continuous cotton system, both ICLs sup-orted enhanced arbuscular mycorrhizal abundances, which couldxplain the conservation of water, nutrients, and soil aggrega-ion previously reported for these agroecosystems. The two ICLs,owever, did not behave equally with enhanced soil biologicalroperties higher in the ICL with only perennial crops (bermuda-rass and OWB) followed by the ICL containing both perennialmixed native grasses and OWB) and annual (a cotton–milletotation) crops. Of all vegetation types evaluated, bermudagrassended to have the highest levels of AMF, microbial biomass,nd soil organic matter. Grazed areas lowered the saprophyticungal functionality indices but had a positive effect on the con-ervation of soil N and on the saprophytic fungal abundance.ur study highlights the importance of soil fungal dynamics for
he long-term agricultural sustainability of ICLs in this semi-aridegion.
cknowledgements
The authors would like to thank Dr. Lisa Fultz for assistanceith sample collection and valuable comments during manuscriptreparation, Jon Cotton for assistance with GC-analysis of FAME
amples, Phil Brown and Paul Green for plot maintenance at theTEF, and Rick Kellison for valuable input on the history andanagement of the TAWC sites. Funding was provided by theSDA-SSARE grant (Project number LS10-229).Ecology 66 (2013) 61– 70 69
References
Acosta-Martínez, V., Upchurch, D.R., Schubert, A.M., Porter, D., Wheeler, T., 2004.Early impacts of cotton and peanut cropping systems on selected soil chemi-cal, physical, microbiological and biochemical properties. Biol. Fertil. Soils 40,44–54.
Acosta-Martínez, V., Bell, C., Morris, B.E., Zak, J.C., Allen, V.G., 2010a. Long-termsoil microbial community and enzyme activity responses to an integratedcropping-livestock system in a semiarid region. Agric. Ecosyst. Environ. 137,231–240.
Acosta-Martínez, V., Burow, G., Zobeck, T.M., Allen, V.G., 2010b. Soil microbial com-munities and function in alternative systems to continuous cotton. Soil Sci. Soc.Am. J. 74, 1181–1192.
Adu, J.K., Oades, J.M., 1978. Physical factors influencing decomposition of organicmaterials in soil aggregates. Soil Biol. Biochem. 10, 109–115.
Allen, V.G., Brown, C.P., Kellison, R., Segarra, E., Wheeler, T., Dotray, P.A., Conkwright,J.C., Green, C.J., Acosta-Martínez, V., 2005. Integrating cotton and beef productionto reduce water withdrawal from the Ogallala Aquifer in the Southern HighPlains. Agronomy 97, 556–567.
Allen, V.G., Brown, C.P., Kellison, R., Green, P., Zilverberg, C.J., Johnson, P., Wein-heimer, J., Wheeler, T., Segarra, E., Acosta-Martínez, V., Zobeck, T., Conkwright,J.C., 2012. Integrating cotton and beef production in the Texas SouthernHigh Plains: I. Water use and measures of productivity. Agronomy 104,1625–1642.
Bardgett, R.D., Wardle, D.A., 2003. Herbivore-mediated linkages between above-ground and belowground communities. Ecology 84, 2258–2268.
Bardgett, R.D., Hobbs, P.J., Frostegård, Å., 1996. Changes in fungal:bacterial biomassratios following reductions in the intensity of management on an upland grass-land. Biol. Fertil. Soils 22, 261–264.
Bardgett, R.D., Wardle, D.A., Yeates, G.W., 1998. Linking above-ground and below-ground food webs: how plant responses to foliar herbivory influence soilorganisms. Soil Biol. Biochem. 30, 1867.
Bardgett, R.D., Jones, A.C., Jones, D.L., et al., 2001. Soil microbial community patternsrelated to the history and intensity of grazing in sub-montane ecosystems. SoilBiol. Biochem. 33, 1653–1664.
Bell, C.W., McIntyre, N.E., Cox, S., Tissue, D.T., Zak, J.C., 2008. Soil microbial responsesto temporal variations of moisture and temperature in Chihuahuan desert grass-land. Microb. Ecol. 56, 153–167.
Bell, C.W., Acosta-Martinez, V., McIntyre, N.E., Cox, S., Tissue, D.T., Zak, J.C., 2009.Linking microbial community structure and function to seasonal differences insoil moisture and temperature in a Chihuahuan desert grassland. Microb. Ecol.58, 827–842.
Bethlenfalvay, G.J., Dakessian, S., 1984. Grazing effects on mycorrhizal colonizationand floristic composition of the vegetation on a semiarid range in NorthernNevada. J. Range Manage. 37, 312–316.
Braun, M.L., Niederpruem, D.J., 1969. Erythritol metabolism in wild-type and mutantstrains of Schizophyllum commune. J. Bacteriol. 100, 625–634.
Brookes, P.C., Landman, A., Pruden, G., Jenkinson, D.S., 1985. Chloroform fumigationand the release of soil nitrogen: a rapid direct extraction method to measuremicrobial biomass nitrogen in soil. Soil Biol. Biochem. 17, 837–842.
Calderón, F.J., Jackson, L.E., Scow, K.M., Rolston, D.E., 2001. Short-term dynamics ofnitrogen microbial activity, and phospholipid fatty acid after tillage. Soil Sci. Soc.Am. J. 65, 118–126.
Cotton, J., Acosta-Martínez, V., Moore-Kucera, J., Burow, G., 2012. Earlychanges due to Sorghum biofuel cropping systems in soil microbial com-munities and metabolic functioning. Biol. Fertil. Soils, http://dx.doi.org/10.1007/s00374-012-0732-z, published online first: 4 October 2012.
Deng, S.P., Parham, J.A., Hattey, J.A., Babu, D., 2006. Animal manure and anhydrousammonia amendment alter microbial carbon use efficiency, microbial biomass,and activities of dehydrogenase and amidohydrolases in semiarid agroecosys-tems. Appl. Soil Ecol. 33, 258–268.
Dobranic, J.K., Zak, J.C., 1999. A microtiter plate procedure for evaluating fungalfunctional diversity. Mycologia 91, 756–765.
Drijber, R.A., Doran, J.W., Parkhurst, A.M., Lyon, D.J., 2000. Changes in soil microbialcommunity structure with tillage under long-term wheat-fallow management.Soil Biol. Biochem. 32, 1419–1430.
Franzluebbers, A.J., 2007. Integrated crop–livestock systems in the SoutheasternUSA. Agron. J. 99, 361–372.
Fravel, D., Olivain, C., Alabouvette, C., 2003. Fusarium oxysporum and its biocontrol.New Phytol. 157, 493–502.
Frey, S.D., Elliott, E.T., Paustian, K., 1999. Bacterial and fungal abundance and biomassin conventional and no-tillage agroecosystems along two climatic gradients. SoilBiol. Biochem. 31, 573–585.
Frostegård, Å., Bååth, E., 1996. The use of phospholipid fatty acid analysis to estimatebacterial and fungal biomass. Biol. Fertil. Soils 22, 59–65.
Frostegård, Å., Tunlid, A., Bååth, E., 2011. Use and misuse of PLFA measurements insoils. Soil Biol. Biochem. 43, 1621–1625.
Fultz, L.M., 2012. Dynamics of soil aggregation, organic carbon pools, and greenhousegases in integrated crop–livestock agroecosystems in the Texas High Plains,Doctoral dissertation, Texas Tech University, Lubbock.
Graham, J.H., Hodge, N.C., Morton, J.B., 1995. Fatty acid methyl ester profiles for
characterization of Glomalean fungi and their endomycorrhizae. Appl. Environ.Microbiol. 61, 58–64.Hamilton, E.W., Frank, D.A., 2001. Can plants stimulate soil microbes and theirown nutrient supply? Evidence from a grazing tolerant grass. Ecol. Soc. Am.82, 2397–2402.
7 d Soil
H
H
I
J
J
J
K
L
M
M
M
M
M
M
M
N
N
O
P
P
0 M. Davinic et al. / Applie
elgason, B.L., Walley, F.L., Germida, J.J., 2009. Fungal and bacterial abundance inlong-term no-till and intensive-till soils of the Northern Great Plains. Soil Sci.Soc. Am. J. 73, 120–127.
olland, E.A., Parton, W.J., Detling, J.K., Coppock, D.L., 1992. Physiological responsesof plant populations to herbivory and their consequences for ecosystem nutrientflow. Am. Nat. 140, 685–706.
ngram, L.J., Stahl, P.D., Schuman, G.E., Buyer, J.S., Vance, G.F., Ganjegunte, G.K.,Welker, J.M., Derner, J.D., 2008. Grazing impacts on soil carbon and microbialcommunities in a mixed-grass ecosystem. Soil Biol. Biochem. 72, 939–948.
anvier, C., Villeneuve, F., Alabouvette, C., Edel-Hermann, V., Mateille, T., Steinberg, C.,2007. Soil health through soil disease suppression: which strategy from descrip-tors to indicators? Soil Biol. Biochem. 39, 1–23.
ing, F., Feng, H., Peiji, G., 1999. Optimization of cellobiose dehydrogenase productionby Schizophyllum commune and effect of the enzyme on kraft pulp bleaching byligninases. Process Biochem. 9, 957–961.
ones, D.L., 1998. Organic acids in the rhizosphere – a critical review. Plant Soil 205,25–44.
ort, J., Collins, M., Ditsch, D., 1998. A review of soil erosion potential associatedwith biomass crops. Biomass Bioenergy 14, 351–359.
al, R., 2004. Soil carbon sequestration impacts on global climate change and foodsecurity. Science 304, 1623–1627.
adan, R., Parkhurst, C., Hawke, B., Smith, S., 2002. Use of fatty acids for identificationof AM fungi and estimation of the biomass of AM spores in soil. Soil Biol. Biochem.34, 125–128.
agurran, A.E., 1988. Ecological Diversity and its Measurement. Princeton Univer-sity Press, New Jersey, p. 179.
cCune, B., Grace, J.B., 2002. Analysis of Ecological Communities. MjM Software,Oregon.
cCune, B., Mefford, M.J., 2011. PC-ORD. In: Multivariate analysis of ecological data.Version 6.0. MjM Software, Oregon.
cNaughton, S.J., Banyikwa, F.F., McNaughton, M.M., 1997. Promotion of the cyclingof diet-enhancing nutrients by African grazers. Science 278, 1798–1800.
iller, M., Dick, R.P., 1995. Dynamics of soil C and microbial biomass in whole soiland aggregates in two cropping systems. Appl. Soil Ecol. 2, 253–261.
oore, J.M., Klose, S., Tabatabai, M.A., 2000. Soil microbial biomass carbon andnitrogen as affected by cropping systems. Biol. Fertil. Soils 31, 200–210.
ichols, P., Stulp, B.K., Jones, J.G., White, D.C., 1986. Comparison of fatty acid contentand DNA homology of the filamentous gliding bacteria Vitreoscilla flexibacter,Filibacter. Arch. Microbiol. 146, 1–6.
OAA Online Weather Data, 2010. National Oceanic and Atmospheric Admin-istration http://www.nws.noaa.gov/climate/xmacis.php?wfo=lub (accessed10.04.12).
lsson, P.A., 1999. Signature fatty acids provide tools for determination of the dis-tribution and interactions of mycorrhizal fungi in soil. FEMS Microbiol. Ecol. 29,303–310.
aterson, E., Sim, A., 1999. Rhizodeposition and C-partitioning of Lolium perennein axenic culture affected by nitrogen supply and defoliation. Plant Soil 216,
155–164.atra, A.K., Abbadie, L., Clays-Josserand, A., Degrange, V., Grayston, S.J., Loiseau, P.,Louault, F., Mahmood, S., Nazaret, S., Philippot, L., Poly, F., Prosser, J.I., Richaume,A., Le Roux, X., 2005. Effects of grazing on microbial functional groups involvedin soil N dynamics. Ecol. Monogr. 75, 65–80.
Ecology 66 (2013) 61– 70
Rillig, M.C., 2004. Arbuscular mycorrhizae and terrestrial ecosystem processes. Ecol.Lett. 7, 740–754.
Russelle, M.P., Franzluebbers, A.J., 2007. Introduction to “Symposium: Integratedcrop–livestock systems for profit and sustainability”. Agron. J. 99, 323–324.
Schutter, M.E., Dick, R.P., 2000. Comparison of fatty acid methyl ester (FAME)methods for characterizing microbial communities. Soil Sci. Soc. Am. J. 64,1659–1668.
Schutter, M.E., Sandero, J.M., Sandero, Dick, R.P., 2001. Seasonal, soil type, and alter-native management influences on microbial communities of vegetable croppingsystems. Biol. Fertil. Soils 34, 397–410.
Seastedt, T.R., Ramundo, R.A., Hayes, D.C., 1988. Maximization of densities of soil ani-mals by foliage herbivory: empirical evidence, graphical and conceptual models.Oikos 51, 243–248.
Sobek, E., Zak, J.C., 2003. The soil FungiLog procedure: method and analyticalapproaches toward understanding fungal functional diversity. Mycologia 95,590–602.
Stewart, R.R., Bader, M.J., Harris, G.H., 1998. Evaluation of cotton gin trash as cattlefeed, University of Georgia Animal and Dairy Sci. Ann. Rpt., Univ. of Georgia,Athens, pp. 28–30.
Suberkropp, K., Weyers, H., 1996. Application of fungal and bacterial productionmethodologies to decomposing leaves in streams. Appl. Environ. Microbiol. 62,1610–1615.
Tilman, D., Reich, P., Knops, J., Wedin, D., Mielke, T., Lehman, C., 2001. Diver-sity and productivity in a long-term grassland experiment. Science 227,1300–1302.
Vance, E.D., Brookes, P.C., Jenkinson, D.S., 1987. An extraction method for measuringsoil microbial biomass C. Soil Biol. Biochem. 19, 703–707.
Wang, B., Qiu, Y.L., 2006. Phylogenetic distribution and evolution of mycorrhizas inland plants. Mycorrhiza 16, 299–363.
Wardle, D.A., 2002. Communities and Ecosystems: Linking the Aboveground and theBelowground Components. Princeton University Press, New Jersey, p. 392.
Wright, S.F., Upadhyaya, A., 1998. A survey of soils for aggregate stability and gloma-lin, a glycoprotein produced by hyphae of arbuscular mycorrhizal fungi. PlantSoil 198, 97–107.
Yeates, G.W., Saggar, S., Daly, B.K., 1997. Soil microbial C, N, and P, and micro-faunal populations under Pinus radiata and grazed pasture land use systems.Pedobiologia 41, 549–565.
Zak, J.C., Willig, M.R., Moorhead, D.L., Wildman, H.G., 1994. Functional diversityof microbial communities: a quantitative approach. Soil Biol. Biochem. 26,1101–1108.
Zak, D.R., Holmes, W.E., White, D.C., Peacock, A.D., Tilman, D., 2003. Plant diver-sity, soil microbial communities, and ecosystem function: are there any links?Ecology 84, 2042–2050.
Zelles, L., 1997. Phospholipid fatty acid profiles in selected members of soil microbialcommunities. Chemosphere 35, 275–294.
Zelles, L., Adrian, P., Bai, Q.Y., Stepper, K., Adrian, M.V., Fischer, K., Maier, A., Ziegler,A., 1991. Microbial activity measured in soils stored under different temperature
and humidity conditions. Soil Biol. Biochem. 23, 955–962.Zilverberg, C., 2012. Agroecology of three integrated crop-livestock systems in theTexas High Plains. Doctoral dissertation, Texas Tech University, Lubbock.
Zimmer, M., 2002. Is decomposition of woodland leaf litter influenced by its speciesrichness? Soil Biol. Biochem. 34, 277–284.