
Soil erosion history and past human land use in the North ...
284
Soil erosion history and past human land use in the North Pare Mountains. A geoarchaeological study of slope deposits in NE Tanzania. Matthias Christian Heckmann Doctor of Philosophy University of York Archaeology October 2011
-
Upload
khangminh22 -
Category
Documents
-
view
1 -
download
0
Transcript of Soil erosion history and past human land use in the North ...
Soil erosion history and past human land use in
the North Pare Mountains.
A geoarchaeological study of slope deposits
in NE Tanzania.
Matthias Christian Heckmann
Doctor of Philosophy
University of York
Archaeology
October 2011

ABSTRACT
Landscapes are the legacy of past environmental processes. The understanding of current environmental problems such as land degradation is strongly enhanced when trajectories of past landscape development are taken into account. In the Pare Mountains of north-eastern Tanzania widespread exposure of subsoil and saprolite indicates large-scale land degradation, which was advanced in the mid-19th century when the first European travellers reported widespread deforestation. The present study explores the timing, causes and consequences of past soil erosion to assess whether the spread of agriculture, large-scale iron working, or agricultural intensification during the 19th-century caravan trade were the main drivers of present day land degradation.
Geoarchaeological investigations drawing on a multi-proxy approach including pedological investigations of slope deposits and palaeoecological analysis of swamp sediments, suggest that enhanced soil erosion and corresponding accumulation of slope deposits started about 2000 years ago, roughly contemporaneous with the arrival of new subsistence strategies like agriculture and the spread of iron working. Three distinct periods of soil erosion characterised by an increasing intensity of land use have been distinguished by macroscopic soil features and analytical measurements: Slow topsoil erosion from about 300 BC on, accelerated runoff-based erosion of subsoils since the 15th century and ongoing land degradation under intensive agricultural land use since the 19th century. Progressive land clearance and continuous soil erosion depleted topsoil and later subsoil resources progressively, but resulted in rapid changes of environmental processes when internal thresholds were crossed. Topsoil exhaustion in the 15th century caused a shift from slow aggregate-based to accelerated runoff-based erosion, whereas localised colluviation is identified as having dammed the Lomwe swamp in the 6th century.
This research highlights the importance of cumulative impacts of prolonged human land use, whether forest clearing or cultivation, for landscape development. Rather than abrupt climate change, the impact of slow but continuous anthropogenic degradation processes is critical when assessing long-term stability of environment systems or the sustainability of land use practices. The investigation of past soil erosion based on its corresponding terrestrial archives produces detailed, site-specific reconstructions of past environments and their dominant processes and allows conclusions about human land use practices and settlement history. This is particularly important where the archaeological record is restricted due to anthropogenic erosion of past land surfaces.

ii
iii
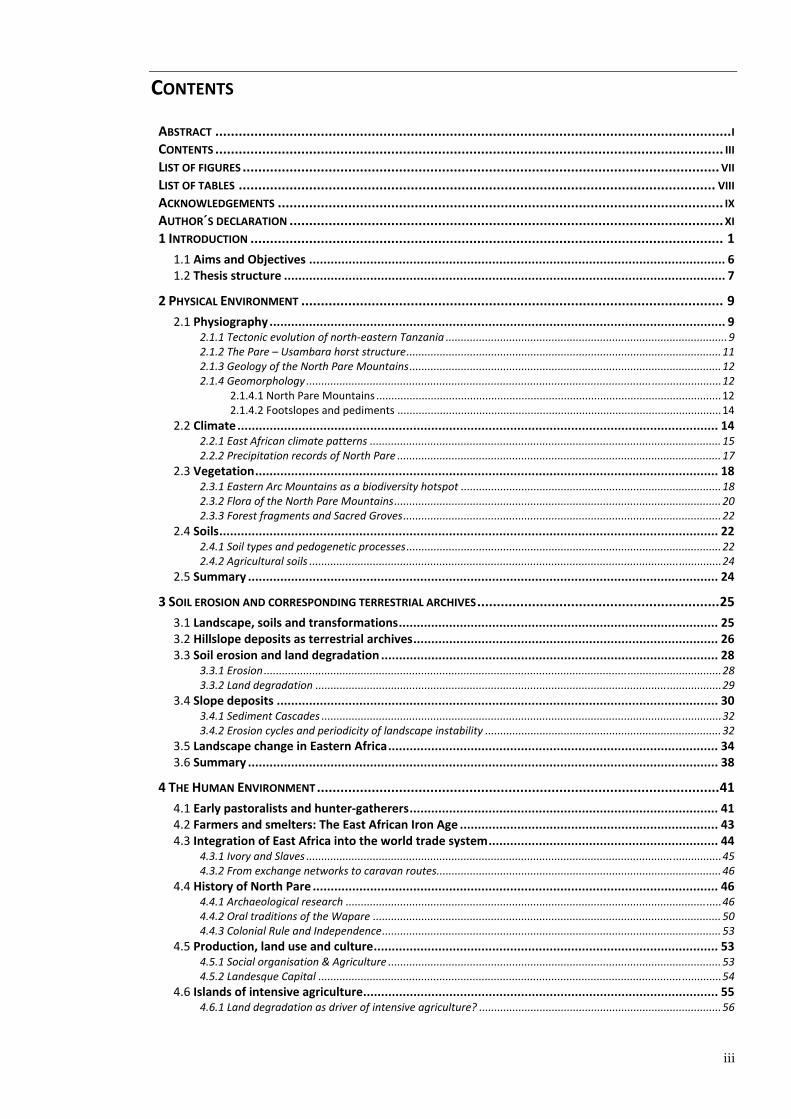
CONTENTS
ABSTRACT ....................................................................................................................................I CONTENTS .................................................................................................................................. III LIST OF FIGURES .......................................................................................................................... VII LIST OF TABLES .......................................................................................................................... VIII ACKNOWLEDGEMENTS .................................................................................................................. IX AUTHOR´S DECLARATION ...............................................................................................................XI 1 INTRODUCTION ......................................................................................................................... 1
1.1 Aims and Objectives .................................................................................................................... 6 1.2 Thesis structure ........................................................................................................................... 7
2 PHYSICAL ENVIRONMENT ............................................................................................................ 9 2.1 Physiography............................................................................................................................... 9
2.1.1 Tectonic evolution of north‐eastern Tanzania .............................................................................................9 2.1.2 The Pare � Usambara horst structure........................................................................................................11 2.1.3 Geology of the North Pare Mountains.......................................................................................................12 2.1.4 Geomorphology .........................................................................................................................................12
2.1.4.1 North Pare Mountains ..................................................................................................................12 2.1.4.2 Footslopes and pediments ...........................................................................................................14
2.2 Climate...................................................................................................................................... 14 2.2.1 East African climate patterns .................................................................................................................... 15 2.2.2 Precipitation records of North Pare ........................................................................................................... 17
2.3 Vegetation................................................................................................................................. 18 2.3.1 Eastern Arc Mountains as a biodiversity hotspot ......................................................................................18 2.3.2 Flora of the North Pare Mountains............................................................................................................ 20 2.3.3 Forest fragments and Sacred Groves.........................................................................................................22
2.4 Soils........................................................................................................................................... 22 2.4.1 Soil types and pedogenetic processes........................................................................................................22 2.4.2 Agricultural soils ........................................................................................................................................24
2.5 Summary ................................................................................................................................... 24 3 SOIL EROSION AND CORRESPONDING TERRESTRIAL ARCHIVES..............................................................25
3.1 Landscape, soils and transformations......................................................................................... 25 3.2 Hillslope deposits as terrestrial archives..................................................................................... 26 3.3 Soil erosion and land degradation .............................................................................................. 28
3.3.1 Erosion.......................................................................................................................................................28 3.3.2 Land degradation ......................................................................................................................................29
3.4 Slope deposits ........................................................................................................................... 30 3.4.1 Sediment Cascades ....................................................................................................................................32 3.4.2 Erosion cycles and periodicity of landscape instability ..............................................................................32
3.5 Landscape change in Eastern Africa............................................................................................ 34 3.6 Summary ................................................................................................................................... 38
4 THE HUMAN ENVIRONMENT.......................................................................................................41 4.1 Early pastoralists and hunter‐gatherers...................................................................................... 41 4.2 Farmers and smelters: The East African Iron Age ........................................................................ 43 4.3 Integration of East Africa into the world trade system................................................................ 44
4.3.1 Ivory and Slaves .........................................................................................................................................45 4.3.2 From exchange networks to caravan routes..............................................................................................46
4.4 History of North Pare ................................................................................................................. 46 4.4.1 Archaeological research ............................................................................................................................46 4.4.2 Oral traditions of the Wapare ................................................................................................................... 50 4.4.3 Colonial Rule and Independence................................................................................................................ 53
4.5 Production, land use and culture................................................................................................ 53 4.5.1 Social organisation & Agriculture ..............................................................................................................53 4.5.2 Landesque Capital .....................................................................................................................................54
4.6 Islands of intensive agriculture................................................................................................... 55 4.6.1 Land degradation as driver of intensive agriculture? ................................................................................56
iv
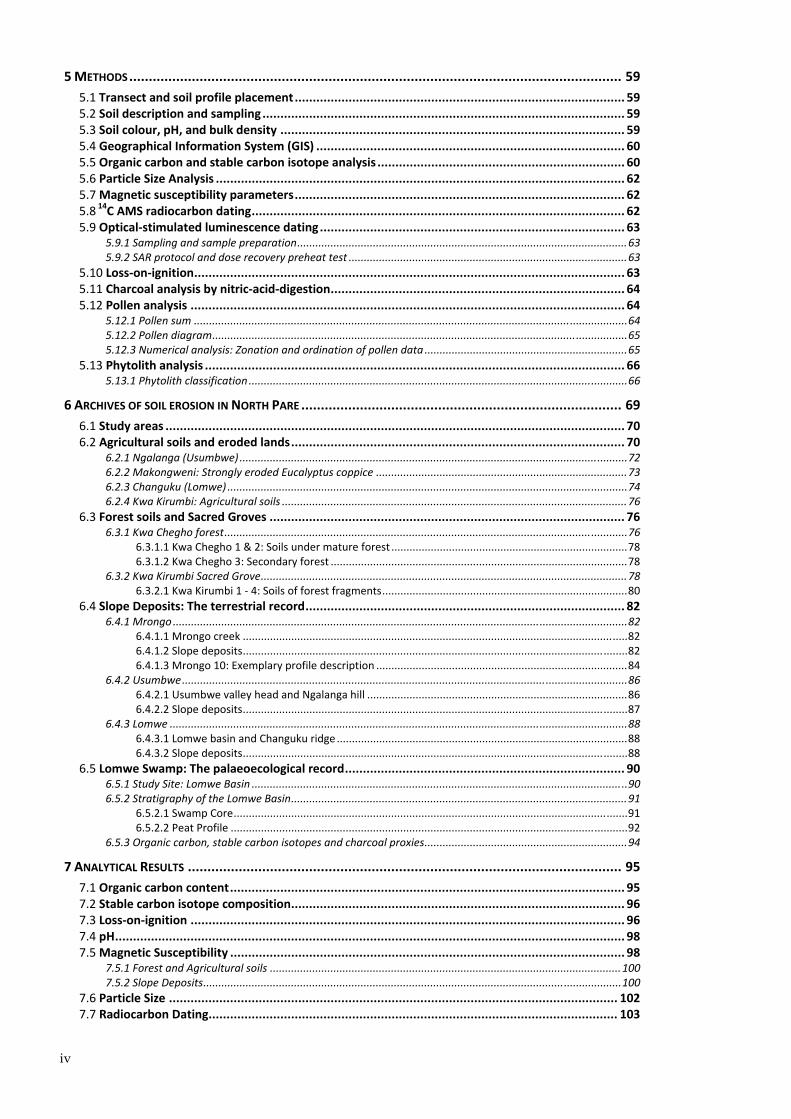
5 METHODS.............................................................................................................................. 59 5.1 Transect and soil profile placement............................................................................................ 59 5.2 Soil description and sampling..................................................................................................... 59 5.3 Soil colour, pH, and bulk density ................................................................................................ 59 5.4 Geographical Information System (GIS) ...................................................................................... 60 5.5 Organic carbon and stable carbon isotope analysis ..................................................................... 60 5.6 Particle Size Analysis .................................................................................................................. 62 5.7 Magnetic susceptibility parameters............................................................................................ 62 5.8 14C AMS radiocarbon dating........................................................................................................ 62 5.9 Optical‐stimulated luminescence dating..................................................................................... 63
5.9.1 Sampling and sample preparation.............................................................................................................63 5.9.2 SAR protocol and dose recovery preheat test ............................................................................................63
5.10 Loss‐on‐ignition........................................................................................................................ 63 5.11 Charcoal analysis by nitric‐acid‐digestion.................................................................................. 64 5.12 Pollen analysis ......................................................................................................................... 64
5.12.1 Pollen sum ...............................................................................................................................................64 5.12.2 Pollen diagram.........................................................................................................................................65 5.12.3 Numerical analysis: Zonation and ordination of pollen data ...................................................................65
5.13 Phytolith analysis ..................................................................................................................... 66 5.13.1 Phytolith classification .............................................................................................................................66
6 ARCHIVES OF SOIL EROSION IN NORTH PARE .................................................................................. 69 6.1 Study areas ................................................................................................................................ 70 6.2 Agricultural soils and eroded lands............................................................................................. 70
6.2.1 Ngalanga (Usumbwe) ................................................................................................................................72 6.2.2 Makongweni: Strongly eroded Eucalyptus coppice ...................................................................................73 6.2.3 Changuku (Lomwe) ....................................................................................................................................74 6.2.4 Kwa Kirumbi: Agricultural soils ..................................................................................................................76
6.3 Forest soils and Sacred Groves ................................................................................................... 76 6.3.1 Kwa Chegho forest.....................................................................................................................................76
6.3.1.1 Kwa Chegho 1 & 2: Soils under mature forest ..............................................................................78 6.3.1.2 Kwa Chegho 3: Secondary forest ..................................................................................................78
6.3.2 Kwa Kirumbi Sacred Grove.........................................................................................................................78 6.3.2.1 Kwa Kirumbi 1 ‐ 4: Soils of forest fragments.................................................................................80
6.4 Slope Deposits: The terrestrial record......................................................................................... 82 6.4.1 Mrongo ......................................................................................................................................................82
6.4.1.1 Mrongo creek ...............................................................................................................................82 6.4.1.2 Slope deposits...............................................................................................................................82 6.4.1.3 Mrongo 10: Exemplary profile description ...................................................................................84
6.4.2 Usumbwe...................................................................................................................................................86 6.4.2.1 Usumbwe valley head and Ngalanga hill ......................................................................................86 6.4.2.2 Slope deposits...............................................................................................................................87
6.4.3 Lomwe .......................................................................................................................................................88 6.4.3.1 Lomwe basin and Changuku ridge ................................................................................................88 6.4.3.2 Slope deposits...............................................................................................................................88
6.5 Lomwe Swamp: The palaeoecological record.............................................................................. 90 6.5.1 Study Site: Lomwe Basin ............................................................................................................................90 6.5.2 Stratigraphy of the Lomwe Basin...............................................................................................................91
6.5.2.1 Swamp Core..................................................................................................................................91 6.5.2.2 Peat Profile ...................................................................................................................................92
6.5.3 Organic carbon, stable carbon isotopes and charcoal proxies...................................................................94 7 ANALYTICAL RESULTS ............................................................................................................... 95
7.1 Organic carbon content.............................................................................................................. 95 7.2 Stable carbon isotope composition............................................................................................. 96 7.3 Loss‐on‐ignition ......................................................................................................................... 96 7.4 pH.............................................................................................................................................. 98 7.5 Magnetic Susceptibility .............................................................................................................. 98
7.5.1 Forest and Agricultural soils ....................................................................................................................100 7.5.2 Slope Deposits..........................................................................................................................................100
7.6 Particle Size ............................................................................................................................. 102 7.7 Radiocarbon Dating.................................................................................................................. 103

v
7.8 Optically‐stimulated luminescence dating ................................................................................ 104 7.9 Pollen record ........................................................................................................................... 106
7.9.1 Zonation and Ordination .........................................................................................................................106 7.9.2 Pollen zones .............................................................................................................................................110
7.9.2.1 Pollen zone I: Buried Peat...........................................................................................................110 7.9.2.2 Pollen Zone II: Colluvial and alluvial hillwash .............................................................................110 7.9.2.3 Pollen Zone III: contemporaneous wetland................................................................................111
7.10 Phytolith record..................................................................................................................... 112 7.10.1 Interpretation ........................................................................................................................................114
8 STRATIGRAPHY AND CHARACTERISTIC FEATURES OF HILLSLOPE DEPOSITS .............................................117 8.1 Buried soils and erosion surfaces ............................................................................................. 117 8.2 Colluvial features as benchmark criteria for slope deposits....................................................... 118 8.3 Sand lenses: indicators of slope wash processes....................................................................... 122 8.4 Magnetic stratigraphy.............................................................................................................. 124
8.4.1 Soil magnetism ........................................................................................................................................124 8.4.2 Type and source of magnetic minerals ....................................................................................................125 8.4.3 Pedogenetic enhancement and source variation.....................................................................................126 8.4.4 Magnetic stratigraphy of slope deposits .................................................................................................126 8.4.5 Sand lenses ..............................................................................................................................................127 8.4.6 Waterlogging...........................................................................................................................................128 8.4.7 Summary .................................................................................................................................................128
8.5 Vegetation change: Evidence from stable carbon isotopes........................................................ 130 8.5.1 Stable carbon isotopes and vegetation change .......................................................................................130 8.5.2 Forest soils ...............................................................................................................................................130 8.5.3 Slope deposits ..........................................................................................................................................132 8.5.4 Summary .................................................................................................................................................134
8.6 From hillwash processes to a history of land use and erosion ................................................... 134 8.6.1 Drivers of enhanced slope wash and sand lens formation.......................................................................135 8.6.2 Land use practices and the preservation of sand lenses ..........................................................................135
8.7 Post depositional translocation processes within slope deposits .............................................. 138 8.7.1 Base cation enrichment ...........................................................................................................................138 8.7.2 Clay illuviation .........................................................................................................................................139
8.8 Nitric‐acid‐resistant‐carbon: Charcoal or resistant organic matter?........................................... 139 8.9 Chronology of the Lomwe swamp core..................................................................................... 140
8.9.1 Exotic taxa as stratigraphic markers .......................................................................................................140 8.9.1.1 Maize ..........................................................................................................................................141 8.9.1.2 Introduced tree species ..............................................................................................................141 8.9.1.3 Classification of Cupressus/Juniperus and Eucalyptus/Syzygium pollen.....................................142
8.9.2 Radiocarbon date reversals and allochthonous material influx...............................................................142 9 LANDSCAPE DEVELOPMENT IN NORTH PARE .................................................................................145
9.1 Forest soils .............................................................................................................................. 145 9.1.1 Kwa Chegho.............................................................................................................................................145 9.1.2 Kwa Kirumbi.............................................................................................................................................145 9.1.3 Complex history of forest soils ................................................................................................................. 145
9.2 Qualitative assessment of soil erosion...................................................................................... 146 9.3 Ugweno: A history of anthropogenic soil erosion ..................................................................... 148
9.3.1 Unit I: Mid‐Holocene stable land surface and forest environment ..........................................................148 9.3.2 Unit II: Initial, anthropogenic soil erosion (since ~200 BC).......................................................................148 9.3.3 Unit III: Accelerated runoff‐based soil erosion & sand lens formation (14th/15th to 19th century) ...........149 9.3.4 Unit IV: Land use intensification and prolonged soil degradation (since 19th century)............................150
9.4 Lomwe: Holocene landscape development............................................................................... 151 9.4.1 Unit IP: Late Glacial land surface and forest environment ......................................................................151 9.4.2 Unit II: Early and late Holocene landscape instability � ...........................................................................152 9.4.3 Unit III/IV: Accelerated soil erosion and land degradation ......................................................................153
9.5 Lomwe Swamp: Vegetation and environmental history............................................................ 154 9.5.1 � before the 6th century...........................................................................................................................154 9.5.2 The early swamp environment (6th � 12th century, PZ I) ..........................................................................155 9.5.3 Beyond the threshold: Widespread soil erosion since the 12th century (PZ II)..........................................156
9.5.3.1 Open landscape of the past centuries ........................................................................................157 9.5.4 The recent wetland (PZ III, ~19th to 20th century).....................................................................................158
9.5.4.1 Contemporaneous vegetation....................................................................................................159 9.5.4.2 Recent stream incision ...............................................................................................................159

vi
10 ENVIRONMENTAL HISTORY OF NORTH PARE ...............................................................................161 10.1 Late Pleistocene transition ..................................................................................................... 161 10.2 Early Holocene surface stability .............................................................................................. 163 10.3 Mid‐Holocene aridity?............................................................................................................ 163 10.4 Late Holocene, anthropogenic landscape development .......................................................... 166
10.4.1 Early Iron Age settlers and onset of soil erosion (3thc. BC � 6thc. AD).....................................................166 10.4.2 Vegetation cover before and during the transition to agriculture .........................................................169 10.4.3 Wetland establishment and peat growth (6 � 12th century)..................................................................172 10.4.4 Catchment wide soil erosion (since the 12th century) ............................................................................173 10.4.5 Accelerated and runoff‐based soil erosion � the legacy of past land degradation? (15th to 19th century)
.......................................................................................................................................................174 10.4.6 Possible impact of 19th‐century agricultural intensification...................................................................177 10.4.7 20th‐century land cover changes............................................................................................................177
10.5 Behind the paradigms: Does the land lie? ............................................................................... 180 11 CONCLUSION .......................................................................................................................183
11.1 Caveats and methodological critique ...................................................................................... 185 11.2 Directions for future research................................................................................................. 187
APPENDIX................................................................................................................................189 A Soil Data (On CD‐ROM)............................................................................................................... 189
A.1 Analytical Data ‐ Slope Deposits.................................................................................................................189 A.2 Analytical Data � Forest and Cultivated Soil Profiles ..................................................................................189
B Soil and slope deposit descriptions ............................................................................................. 190 B.1 Changuku: Eroded soils under agricultural land use...................................................................................190 B.2 Lomwe: Slope deposit descriptions.............................................................................................................196 B.3 Mrongo: Slope deposit descriptions............................................................................................................207 B.4 Ngalanga: Eroded soil under agricultural land use.....................................................................................220 B.5 Usumbwe: Slope deposit decriptions ..........................................................................................................226 B.6 Kwa Kirumbi: Forest soils............................................................................................................................232 B.7 Kwa Kirumbi: Eroded soils under agricultural land use...............................................................................236 B.8 Kwa Chegho: Forest soils ............................................................................................................................238
C Palaeoecological Data................................................................................................................. 242 D Analytical Techniques................................................................................................................. 245
D.1 Optically‐stimulated lumincescence dating................................................................................................245 D.2 Loss‐on‐ignition ..........................................................................................................................................248 D.3 Nitric‐acid‐resistant carbon: profile Lomwe 10 ..........................................................................................249
REFERENCES.............................................................................................................................251
vii
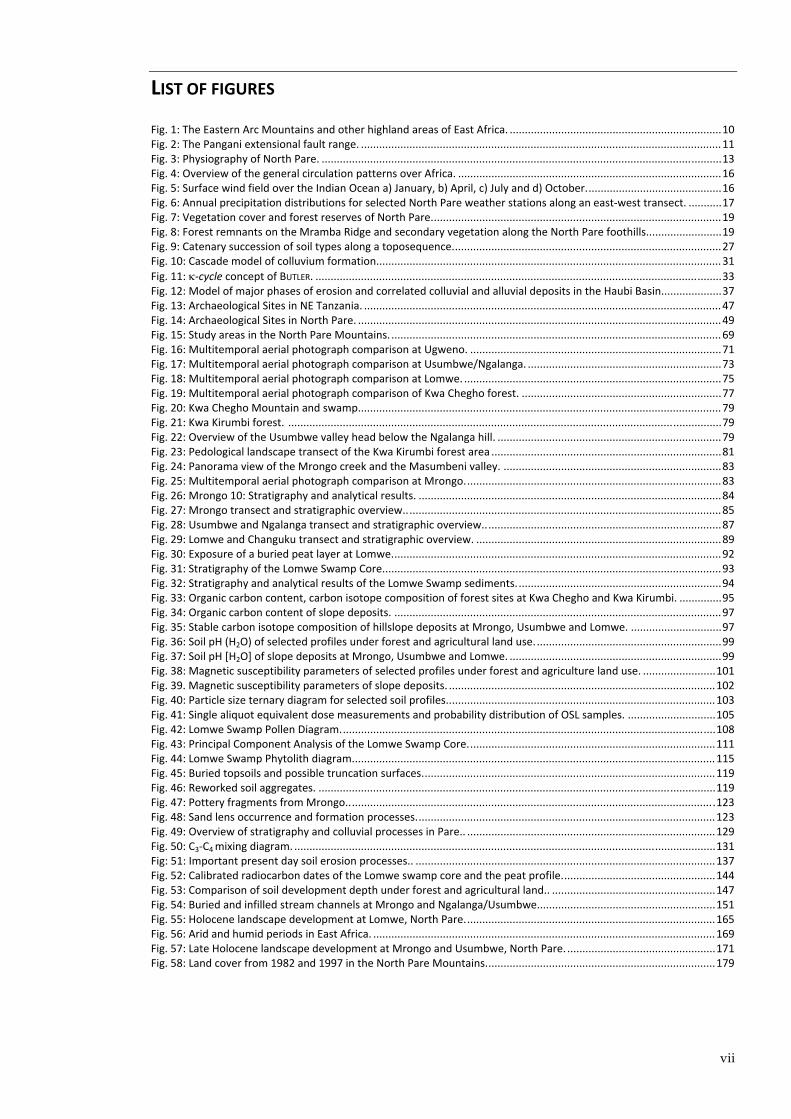
LIST OF FIGURES
Fig. 1: The Eastern Arc Mountains and other highland areas of East Africa. ......................................................................10 Fig. 2: The Pangani extensional fault range. .......................................................................................................................11 Fig. 3: Physiography of North Pare. ....................................................................................................................................13 Fig. 4: Overview of the general circulation patterns over Africa. .......................................................................................16 Fig. 5: Surface wind field over the Indian Ocean a) January, b) April, c) July and d) October.............................................16 Fig. 6: Annual precipitation distributions for selected North Pare weather stations along an east‐west transect. ...........17 Fig. 7: Vegetation cover and forest reserves of North Pare................................................................................................19 Fig. 8: Forest remnants on the Mramba Ridge and secondary vegetation along the North Pare foothills.........................19 Fig. 9: Catenary succession of soil types along a toposequence.........................................................................................27 Fig. 10: Cascade model of colluvium formation..................................................................................................................31 Fig. 11: κ‐cycle concept of BUTLER. ......................................................................................................................................33 Fig. 12: Model of major phases of erosion and correlated colluvial and alluvial deposits in the Haubi Basin....................37 Fig. 13: Archaeological Sites in NE Tanzania. ......................................................................................................................47 Fig. 14: Archaeological Sites in North Pare. ........................................................................................................................49 Fig. 15: Study areas in the North Pare Mountains. .............................................................................................................69 Fig. 16: Multitemporal aerial photograph comparison at Ugweno. ...................................................................................71 Fig. 17: Multitemporal aerial photograph comparison at Usumbwe/Ngalanga. ................................................................73 Fig. 18: Multitemporal aerial photograph comparison at Lomwe. .....................................................................................75 Fig. 19: Multitemporal aerial photograph comparison of Kwa Chegho forest. ..................................................................77 Fig. 20: Kwa Chegho Mountain and swamp........................................................................................................................79 Fig. 21: Kwa Kirumbi forest. ...............................................................................................................................................79 Fig. 22: Overview of the Usumbwe valley head below the Ngalanga hill. ..........................................................................79 Fig. 23: Pedological landscape transect of the Kwa Kirumbi forest area ............................................................................81 Fig. 24: Panorama view of the Mrongo creek and the Masumbeni valley. ........................................................................83 Fig. 25: Multitemporal aerial photograph comparison at Mrongo.....................................................................................83 Fig. 26: Mrongo 10: Stratigraphy and analytical results. ....................................................................................................84 Fig. 27: Mrongo transect and stratigraphic overview.........................................................................................................85 Fig. 28: Usumbwe and Ngalanga transect and stratigraphic overview...............................................................................87 Fig. 29: Lomwe and Changuku transect and stratigraphic overview. .................................................................................89 Fig. 30: Exposure of a buried peat layer at Lomwe.............................................................................................................92 Fig. 31: Stratigraphy of the Lomwe Swamp Core................................................................................................................93 Fig. 32: Stratigraphy and analytical results of the Lomwe Swamp sediments....................................................................94 Fig. 33: Organic carbon content, carbon isotope composition of forest sites at Kwa Chegho and Kwa Kirumbi. ..............95 Fig. 34: Organic carbon content of slope deposits. ............................................................................................................97 Fig. 35: Stable carbon isotope composition of hillslope deposits at Mrongo, Usumbwe and Lomwe. ..............................97 Fig. 36: Soil pH (H2O) of selected profiles under forest and agricultural land use..............................................................99 Fig. 37: Soil pH [H2O] of slope deposits at Mrongo, Usumbwe and Lomwe. ......................................................................99 Fig. 38: Magnetic susceptibility parameters of selected profiles under forest and agriculture land use. ........................101 Fig. 39. Magnetic susceptibility parameters of slope deposits. ........................................................................................102 Fig. 40: Particle size ternary diagram for selected soil profiles.........................................................................................103 Fig. 41: Single aliquot equivalent dose measurements and probability distribution of OSL samples. .............................105 Fig. 42: Lomwe Swamp Pollen Diagram............................................................................................................................108 Fig. 43: Principal Component Analysis of the Lomwe Swamp Core..................................................................................111 Fig. 44: Lomwe Swamp Phytolith diagram........................................................................................................................115 Fig. 45: Buried topsoils and possible truncation surfaces.................................................................................................119 Fig. 46: Reworked soil aggregates. ...................................................................................................................................119 Fig. 47: Pottery fragments from Mrongo..........................................................................................................................123 Fig. 48: Sand lens occurrence and formation processes...................................................................................................123 Fig. 49: Overview of stratigraphy and colluvial processes in Pare.. ..................................................................................129 Fig. 50: C3‐C4 mixing diagram. ...........................................................................................................................................131 Fig: 51: Important present day soil erosion processes.. ...................................................................................................137 Fig. 52: Calibrated radiocarbon dates of the Lomwe swamp core and the peat profile...................................................144 Fig. 53: Comparison of soil development depth under forest and agricultural land.. ......................................................147 Fig. 54: Buried and infilled stream channels at Mrongo and Ngalanga/Usumbwe...........................................................151 Fig. 55: Holocene landscape development at Lomwe, North Pare...................................................................................165 Fig. 56: Arid and humid periods in East Africa. .................................................................................................................169 Fig. 57: Late Holocene landscape development at Mrongo and Usumbwe, North Pare. .................................................171 Fig. 58: Land cover from 1982 and 1997 in the North Pare Mountains............................................................................179

viii
LIST OF TABLES
Tab. 1: Size distribution of forest fragments in North Pare. ...............................................................................................21 Tab. 2: Radiocarbon age of archaeological sites in NE Tanzania. .......................................................................................51 Tab. 3: Parameters of soil description recorded in the field...............................................................................................61 Tab. 4: Sources of remote sensing data, aerial photographs, satellite images, thematic maps, DEM, and GIS data. ........61 Tab. 5: Phytolith categories.. ..............................................................................................................................................67 Tab. 6: 14C AMS radiocarbon dates from North Pare........................................................................................................104 Tab. 7: OSL dates from North Pare. ..................................................................................................................................105 Tab. 8: Pollen and non‐pollen palynomorph types identified at the Lomwe swamp. ......................................................107 Tab. 9: Phytolith morphotypes identified in the Lomwe Swamp......................................................................................113 Tab. 10: Average Corg and δ
13C of stratigraphic units and dark soil aggregates. ...............................................................119 Tab. 11: Bulk density changes of slope deposits at Lomwe.. ............................................................................................121 Tab. 12: Deposition rates and stratigraphic divisions based on benchmark features. .....................................................123 Tab. 13: Organic carbon, δ13C and C/N‐ratios for selected topsoil and plant samples. ....................................................133

ix
ACKNOWLEDGEMENTS
Many people have contributed in one way or the other to the composition of this dissertation. In first place, I thank my supervisor Paul Lane for introducing me to archaeology and his patience during the completion of the thesis. Kevin Walsh I thank for the introduction to geoarchaeology, a journey that turned into an odyssey between interdisciplinary disciplines. I am grateful to Robert Marchant (University of York) who always was interest in the topic for fruitful discussions and comments. Sincerely I thank Robert Payton (University of Newcastle) for his time and interest, the motivating discussions and his advice during fieldwork. The three years would not be complete without the other HEEAL members. Daryl Stump I thank for stimulating debates, a practical guide to excavation, and a lovely companionship in the field. Pauline von Hellerman I thank for her advice outside political correctness. There is not sufficient space to express my thanks to Ashley Coutu and Thomas Biginagwa always ready to sort things out and for reassurance and support when things turn upside down. Looking forward to see you all in Graceland.
The doctoral research was carried out under the umbrella of the Historical Ecologies of East African Landscapes (HEEAL) project and was founded by an European Union Marie Curie grant (MEXT-CT-2006-042704). Fieldwork in Tanzania was possible thanks to research clearance granted by the Tanzania Commission for Science and Technology (COSTECH), Research Permit N° 2008-76-NA-2008-20 and N° 2009-344-ER-2008-20: The Development of Intensive Agriculture in East Africa: Archaeological, History and Geographical Perspectives.
The laboratory work at York would not have been possible if not for the constant support of the technicians Rebecca Sutton, Environment department and Richard Allen, King´s Manor. The work has benefited from a wide range of analyses and I thank Arnoud Boom (University of Leicester) for isotope analysis and Mark Bateman and Rob Ashurst (University of Sheffield), who introduced me to the magical work of luminescence dating. I am further indebted to Katharina Neumann, who gave her time to introduce me into the challenging world of phytoliths.
In Kenya, I am grateful for the support of the British Institute in Eastern Africa (BIEA), in Nairobi, especially Benson Kimeu for sorting equipment out and Joseph Mutua for introducing me to Kishuaeli culture and teaching me to drive up and down the Pare Mountains. I thank Stephen Rucina and Veronica Muiruri from the National Museum in Kenya for their hospitality at NMK, the coring equipment and particularly I would like to thank Veronica for her collaboration and the determination of pollen and phytoliths.
I am indebted to a number of people from Usangi and Ugweno in Pare. In the first place, I would like to thank all the farmers at Lomwe, Mrongo, Usumbwe, and Ngalanga for the permission to excavate in their shambas offering only confused explications of historia na mazingira and momonioko.
Particularly I would like to thank Ahadi Msuya for his companionship, the successful negotiations and the unsuccessful struggle with vehicles. I am very grateful to the entire family Msuya for their hospitality in Kifula and to have received us in the family. I am very sorry for your terrible loss, but will always remember you all and the times of joy with Paco.
In the place of many others, I would like to thank Peter Saul (NGO coordinator) for offering information and contacts throughout Pare, the director of the Lomwe Secondary School, Nelson Kangera for the permission to establish soil profiles on the school area and Saidi Bangalale from

x
Ndambwe for hospitality during cold and windy nights. Of all the assistants I would particularly like to thank Bile and Sefu, but also many others who helped to dig, record and sample the profiles.
Finally, my warmest gratitude goes to the students of the School of the Deaf for teaching us that language more often is an obstacle than a means of communication and lovely Asha for the most honest hospitality.
At all times, I thank my parents for their unconditional support in all impossible situations.
Gracias Yanina for all your patience, your love, and for your company around the world to a rainy island and hot mountains.
York, October 2011
xi
AUTHOR´S DECLARATION
This dissertation is the result of the author's original work and includes nothing, which is the outcome of work done in collaboration, except where specifically indicated. It has not been previously submitted for any other qualification at this or any other institution.
Specifically, collaborative work is restricted to:
• Stable isotope measurement was undertaken in collaboration with Dr. Arnoud Boom, University of Leicester. Samples were prepared at York; measurement took place in Leicester.
• Optical stimulated luminescence dating was carried out by myself under the supervision of Dr. Mark Bateman, University of Sheffield. All samples were prepared and measured on my own.
• For the identification of pollen and phytoliths I am indebted to Veronica Muiruri, National Museum of Kenya, Nairobi, Kenya. Presentation, statistical analysis, and interpretation are my own responsibility.
Matthias Heckmann, York, 10/2011

xii
1 INTRODUCTION
The current, accelerated environmental changes have stimulated interest in palaeoclimatic and palaeoenvironmental research. Following the well known dictum �The past is the key to the future� investigation of past environment dynamics has become an important tool for guiding policy making in uncertain decision situations such as climate change, droughts and land degradation. Particularly, past human-environment interactions have attracted the attention not only of the scientific community but also the fascination of the public and have gained interest from financial donor organisations as they convey the possibility that potential insights might turn out to be a key to dealing with present and future developments (SWETNAM et al. 1999; COSTANZA et al. 2007; CASELDINE & TURNEY 2010; VEGAS-VILARRÚBIA et al. 2011). In the last decades, with mankind shaping the earth in faster and more irreversible ways that were unimaginable a century ago, attention has been drawn to closer examination of the way former societies interacted, shaped and coped with their environment and its limitations. Along the same lines it is now recognised that many environments once assumed to be �natural� have a long-standing history of human interference (GILLSON & WILLIS 2004; WILLIS et al. 2004; ELLIS 2011; WIDGREN in press) This has changed the way scholars perceive, manage and protect ecosystems today that are under the threat of severe human re-shaping.
The investigation of human-environment interactions is often described within the conflicting concepts of environmental determinism and independent cultural development. But, as cultural development can not be explained as if detached from the physical environment, most ecosystems have been shaped in one way or the other by anthropogenic influences. The reciprocal and iterative evolution of environments and its inhabitants demands that single environmental processes, most importantly contemporaneous changes such as land degradation, have to be investigated against the background of past human-environment interactions. Through the last decades a number of synthetic approaches like Environmental History and Historical Ecology have emerged, which emphasise historicity in environmental and ecologic research covering a wide range of disciplines from history, archaeology, and geography to palaeoecology and systems ecology (CRUMLEY 1994; BUTZER 2005; BALÉE 2006; CRUMLEY 2006; LANE 2010). Any environmental history though is specific to a restricted space and therefore is a co-product of the respective physical landscape. Thus, reconstruction of the history and development of particular landscapes is an essential step toward understanding broader environmental histories. On different spatial scales, geoarchaeological work, located at the intersection of archaeology, pedology and geomorphology, has proven a suitable tool for the reconstruction of environmental histories on a wider, landscape-scale basis even, and particularly when, historical knowledge is lacking (ZOLITSCHKA et al. 2003; BUTZER 2005, 2008; DOTTERWEICH 2008; FRENCH et al. 2009; FRENCH 2010).
For example, the well-studied environmental history of Europe and the Mediterranean has shown that landscape change has been closely related to the transformation stages of past societies. Formation of colluvial slope deposits took place during the Neolithic, Bronze and Iron Ages, Roman times, the Middle Ages and the deposition of floodplain sediments marks the onset of intensive mining activities in Middle Europe (e.g. LANG & HÖNSCHEIDT 1999; BORK 2003; BORK & LANG 2003; LANG 2003; SCHMITT et al. 2003; DREIBRODT et al. 2010a; FUCHS et al. 2010), the British Isles (EVANS 1990; FRENCH et al. 2005) and the Mediterranean (FRENCH & WHITELAW 1999; AYALA & FRENCH 2005; FUCHS 2007). Although climate dynamics such as the Roman climatic optimum, the Migration Period Pessimum, the Medieval Warm Period and the Little Ice Age have strongly influenced the
2
development of European societies, lasting landscape transformation of the late Holocene have generally been the direct result of human land use (c.f. ZOLITSCHKA et al. 2003; DREIBRODT et al. 2010b).
Unlike Europe, the Mediterranean, and the Middle East, written historic information is lacking for most of pre-colonial Africa up to the 19th century, especially in eastern Africa. The reconstruction of cultural and environmental changes before the 19th century is thus primarily based on the interpretation of archaeological, pedological, and palaeoecological findings and only in rare cases on the interpretation of oral traditions (for example see WEBSTER (1979) for the oral histories of the Interlacustrine kingdoms). The reconstruction of late Holocene environmental development in Africa thus is confronted by the lack of detailed historic information dating the rise and fall of pre-colonial African societies, which hampers the correlation of environmental changes with societal transformations and complicates or even impedes to discern between causes and effects. Over the course of the last few decades a number of studies based on palaeoenvironmental research have attempted to establish environmental histories and to link distinct socioeconomic and cultural phases with environmental and climatic change. Investigating a wide range of sediment archives research in Ethiopia (ESHETU & HÖGBERG 2000; ESHETU 2002; DARBYSHIRE et al. 2003; NYSSEN et al. 2004; GEBRU et al. 2009; SULAS 2010), West Africa (NGOMANDA et al. 2009b; LE DRÉZEN et al. ; LESPEZ et al. 2011), Central Africa (BRNCIC et al. 2007; RUNGE 2008; NGOMANDA et al. 2009a), and the Great Lakes area (ROBERTSHAW & TAYLOR 2000; TAYLOR et al. 2000; KERSTING 2010) has shown that both climate dynamics and human land use have shaped the late Holocene environments of Africa.
The 20th-century environmental history of Africa has been widely perceived as a time of land degradation and desertification as a consequence of resource over-exploitation and unsustainable human land use against the background of a rapidly increasing population (CLEAVER & SCHREIBER 1994; PIMENTEL et al. 1995; BURESH et al. 1997; DRECHSEL et al. 2001; SANCHEZ 2002). Confronted with the apparently fragile ecological equilibrium and the dynamics of semi-arid environments, colonial policies early on have promoted soil conservation plans and the creation of national parks to protect the �natural environment� from the grasp of land degradation. Like received wisdom, narratives of desertification and land degradation have become �common knowledge� to both donors and receivers of financial aid to such an extent that the local circumstances of land degradation often are overshadowed by easy to accept explanations - the apparent �lie of the land� (LEACH & MEARNS 1996). The received wisdom of land degradation mechanisms has since been challenged by thorough interdisciplinary research on environmental histories in long-term perspective (see particularly studies compiled by FAIRHEAD & LEACH (1999), LEACH & MEARNS (1996) and GILLSON et al. (2003) but also LANE (2010) and BROCKINGTON (2002)). Particularly the inclusion of historicity and long-term developments in the evaluation of human-environment interactions � like the use of time-series of aerial photographs as well as interdisciplinary research including ecological and socioeconomic and historic research � has shifted the focus of interpretation from linear histories of resource overexploitation and land degradation to the dynamics of human-environment interactions on time scales from decades, centuries and millennia (GILLSON & DUFFIN 2007; GILLSON & HOFFMAN 2007). In essence, this means that to understand the current state of the environment and to develop adequate conservation or land use policies, it is necessary to consider past trajectories of landscape dynamics and take into account the historicity of the local environments, which have developed out of site-specific, long-term human-environmental interactions.

3
This approach of �landscape historical ecology� has been recently specified and put forward by LANE (2010) and applied in the Historical Ecology of East African Landscapes (HEEAL) project investigating human-environment interactions in north-eastern Tanzania, of which the present study forms a part. The overall project focuses on the impact of the 19th-century caravan trade on local subsistence practices and settlement patterns (BIGINAGWA 2009) and its consequences for agricultural intensification in Pare (STUMP 2010). VON HELLERMANN (2010) investigates the 20th-century environmental history in South Pare, whereas COUTU (2011) studies changing patterns of elephant distribution during the last centuries.
The present thesis investigates the landscape development set against the background of the early arrival of sedentary agriculturalists, intensive iron smelting activities and agricultural intensification during the last millennia, and current land degradation and conservation policies. The study applies a pedological-geoarchaeological approach and examines terrestrial sediment archives focusing particularly on slope deposits and valley fills in the North Pare Mountains.
As with many of the other densely settled mountain areas of Tanzania, the North Pare Mountains have experienced over the last century the implementation of various soil and water conservation schemes to protect and enhance agricultural production and stop land degradation, especially enhanced soil erosion. Soil conservation measures started with afforestation programs in colonial times (SHERIDAN 2001) and have culminated in the rehabilitation of irrigation systems and terraces by national and international organizations (TIP, TFIP GTZ,) during the last decades (WARDELL 1991).
Deforestation and land degradation in North Pare, however, seem not restricted to the 20th century but preceded the establishment of colonial rule. For the Eastern Arc Mountains and particularly the Pare Mountains the assumption of pre-colonial anthropogenic deforestation and consequent land degradation is based on the historical accounts of the early European travellers VON DER DECKEN (1869), MEYER (1890), and BAUMANN (1891), who reported widespread open landscapes, bare hills and few trees in the late 19th century. In their accounts, many of the early travellers remark on the fertile, lush green valley sides of the Pare Mountains in direct contrast to the hot and dusty lowlands and comment on terraces and irrigation channels. Yet they also describe a deforested mountain region, which in the middle of the 19th century was widely covered by ferns and low bushland - a description suspiciously reminiscent of secondary vegetation. Whereas the earliest account of VON DER DECKEN
(1869) lacks useful descriptions of the vegetation in Pare, HANS MEYER (1890) reports bare summits and widespread areas of �man-high thickets of bracken ferns� while bushes and shrubs are rare and trees are completely absent1 and combines his observations with the interpretation:
�The different population densities bring about that only the outer mountain ranges and the uninhabited north-western [part] is covered by forest or bushland, whereas middle, south and east Ugweno - except where it hasn�t been deforested for agricultural purposes and now is covered with fields and except of the mountain tops � is only covered by small bushes or it is totally treeless, that means it is covered with ferns and grasses�2
1 e.g. Guamalla hill: �The path winds through man-high thickets of bracken ferns; bushes and shrubs are rare,
trees are lacking. � and climbed .... over rocks and ferns to the round, bare summits of the Guamalla hill�. [original: �Der Pfad windet sich durch mannshohes Dickicht von Adlerfarnen; Busch und Strauch sind selten, Baumwuchs fehlt ganz. ... und kletterte .... über Fels und Farn zu dem runden, kahlen Gipfel des Gamuallaberges (2000m) hinauf� (MEYER 1890:185)]
2 �Die verschiedene Bevölkerungsdichte bringt es mit sich, daß nur die äußeren Randberge und der ganze menschenleere Nordwesten mit Wald oder Buschwald bewachsen sind, dagegen Mittel-, Süd- und Ostugueno da,
4
In a similar way, BAUMANN (1891:200) discusses the altitudinal zonation of the Pare mountains and suggests that the mid-altitudinal cultivation zone �originally must have been entirely forested, as can be deduced from scattered groups of trees, but now forms an extended area of cultivated land�3. In the 20th century, low bushes and ferns were a characteristic vegetation of strongly eroded slopes and hill tops exposing subsoil and saprolite. Many of these degraded areas have been afforested since the early 20th century and have turned into eucalyptus plantations as inferred from old aerial photographs. Although no direct description of land degradation or soil erosion processes was made by the early travellers, bare hills and the ubiquitous occurrence of bracken fern together with early 20th-century observations suggest that the Pare environment had been entirely deforested and probably strongly degraded at the mid-19th century.
The widespread deforestation in Pare can be causally explained by several circumstances: the climatically-favoured mountain location as a spatially confined focus point for agricultural settlement, the iron-rich basement rocks as an easily available resource for iron smelting, and finally agricultural intensification as response to an external economic stimulus during the 19th-century caravan trade. Agriculture as a new subsistence strategy and the knowledge of iron smelting have been introduced contemporaneously around the begin of the Common Era (PHILLIPSON 2005). Following the assumptions of traditional degradation narratives, the demand of cleared land for agriculture and the impact of fuelwood extraction for iron smelting is supposed to have had a strong, albeit probably slow impact on the extent and the quality of the Pare forests resulting in a steady decline of the original forest cover (HAMILTON 1989a; SCHMIDT 1989; NEWMARK 1998). Iron working was widely practiced in Pare and the Wagweno were widely known for their high quality iron (VON DER DECKEN 1869; MEYER 1890; BAUMANN 1891) and also had a well established trading network with the Massai from the lowlands and the Chagga from Mount Kilimanjaro (KIMAMBO 1969). Archaeological evidence of intensive iron smelting has been recorded on numerous locations on the Pare footslopes as well as within the uplands (SOPER 1967b), although the fuel demands and intensity of their technology have yet to be assessed in detail. From the magnitude of the ivory and slave trade and from historic analogues, many scholars believe that the Pare economy experienced a boom during the 19th-century caravan trade (KIMAMBO 1969; SHERIDAN 2002; HÅKANSSON 2008; HÅKANSSON et al. 2008; STUMP 2010). Stimulated by the food demand of passing caravans, agricultural land use might have intensified and extended. Investment of labour in landesque capital such as terraces and irrigation systems became worthwhile as the area and possibly the fertility of the available cultivated land declined. However, given the general lack of well-dated archaeological evidences for the advent of agriculture, the extent and age of iron smelting, and the establishment of irrigation systems and terraces, it remains unclear if the open landscape encountered by the early travellers was the result of an agricultural intensification stimulated by the 19th-century caravan trade or if the lack of forests has been part of the Pare
wo es nicht durch �Kulturenbrand� entholzt und mit Feldern überzogen ist, bis auf die Bergkuppen entweder nur niedrigen Busch trägt oder ganz buschlos, das heißt, gras- und farnbewachsen ist.� (MEYER 1890:194).
3 �Above of these extends the cultivation zone, which originally must have been entirely forested, as can be deduced from scattered groups of trees, but now forms an extended area of cultivated land. Above this, one encounters a zone covered by short, luscious grasses, ferns and heather, which extends over the highest ridges of Mid- and North Pare.� [Original: �Ueber diesen dehnt sich die eigentliche Culturregion aus, welche, ursprünglich wohl ganz bewaldet, wie aus den vereinzelten dichten Baumgruppen noch zu schließen ist, nun ein ausgedehntes bebautes Gebiet bildet. Ober dieser erreicht man eine mit niedrigem, saftigem Grase, mit Farnkräutern und Ericas bewachsene Zone, die in Mittel- und Nord-Pare die höchsten Kämme bedeckt.� (BAUMANN 1891:200).
5
landscape for a much longer time - perhaps caused by initial human occupation or the spread of farming and afterwards maintained by intensive iron smelting. There is however a third possibility as GILLSON et al. (2003), critical of the conventional narratives of environmental degradation due to human land use, point out. What if the mid-altitudes of the Pare Mountains never supported the nowadays assumed potential natural vegetation cover of mature (sub-) montane forest? Confronted with this question GILLSON and co-workers (2003) propose that:
�Only archaeological investigation of the soil profiles of several sacred forests, radiocarbon dating of charcoal from precolonial iron-smelting sites and analysis of fossil pollen can conclusively document how and when the vegetation of North Pare, Mkomazi and Tsavo changed.�
It is the principal aim of this piece of research to establish an environmental history of North Pare, aimed at answering the question of anthropogenic vegetation change, the influence of climatic drivers and to reconstruct past landscape development and shed light on the trajectory of environment change which has ultimately led to the present state of partial land degradation.
Palaeoclimate and palaeoecological analysis are commonplace in East Africa. The investigation of past climates based on lake levels (for overviews see NICHOLSON & FLOHN 1980; GASSE 2000; GASSE 2006; GASSE et al. 2008) and the reconstruction of past vegetation patterns by pollen analysis (for overviews see HAMILTON 1982; JOLLY et al. 1997; KIAGE & LIU 2006) have a long tradition in the lake and swamp rich areas of East Africa. On the other hand, the reconstruction of landscape development and the investigation of terrestrial archives of environmental change such as soils, slope deposits, alluvial fans and fluvial sediments have so far been disregarded by most research in East Africa. Thorough pedological work on slope deposits is restricted to Kondoa (PAYTON & SHISHIRA 1994; SHISHIRA & PAYTON 1996; ERIKSSON et al. 2000) and Mindu Mountains (SØRENSEN 2001) in Tanzania, Butare in Rwanda (KERSTING 2010) and work by (RUNGE 2001a, 2008) in the Eastern Congo. Farther north, around the ancient town of Aksum in Ethiopia, geoarchaeological work involving soil micromophology has focused directly on human-environmental interactions showing stability during prolonged phases of intensive land use as well as rapid degradation during the last few centuries (BUTZER 1981; FRENCH et al. 2009; SULAS et al. 2009). In contrast to established climate and vegetation models, the aspect of landscape development in East Africa has not yet been comprehensively addressed.
Hypotheses about landscape change in North Pare so far have been based on conclusions drawn from archaeological, ethnological and (palaeo-) ecological research. Whereas the limited archaeological evidence suggest sedentary occupation on the lower slopes of the Eastern Arc Mountains since at least 2000 BP (SOPER 1967b), the land use history of the mountain areas, particularly of the undulating uplands but also of the high altitude grasslands, remains unknown. Oral histories summarised and collected by KIMAMBO (1969) and ethnographic work by CONTE (1999) suggest that the use of highland grasslands as pastures was common even before the advent of agriculture. Recent palaeoecological work has focused on the long-term history of the Eastern Arc Mountains studying swamp cores from the South Pare (FINCH & MARCHANT 2010), Usambara (MUMBI 2009) as well as the Udzungwa (MUMBI et al. 2008) and the Uluguru Mountains (FINCH et al. 2009) in order to establish a Holocene vegetation history of the montane forest zone. Palaeoecological investigations commonly involve a high-resolution study of one or better several lake and swamp cores. Well dated, with a reasonable number of radiocarbon dates, these allow the assessment of past hydrological and vegetation changes with a high temporal resolution. However, due to the restricted occurrence of lake and swamp deposits and a research bias towards high-altitude locations only limited information about
6
vegetation dynamics in mid-altitudes and lowlands can be extracted. Whereas the palaeoecological work gives valuable insights in the long-term stability of high-altitude vegetation of the Eastern Arc Mountains, knowledge of late Holocene land use history remains inconclusive. Although the pollen records show that fire has shaped these ecosystems and that open grasslands have persisted through the Holocene (FINCH & MARCHANT 2010, in prep.) few evidence for human occupation or land use (animal husbandry, forest clearing or agriculture) has been obtained.
All approaches so far � whether archaeological, palaeoecological or ethnohistorical � attempt to answer questions about land use, land use change and landscape development on the basis of inferred evidence. The pedological-geoarchaeological approach of the present study in contrast, investigates the terrestrial sediment record, in particular, colluvial sediments on hill slopes, valley fills, and soil development along slope transects, to obtain direct information about past human land use on a landscape scale. As the correlated sediments of upslope soil erosion, slope deposits are directly related to landscape dynamics and provide information on surface processes and vegetation cover, thus allowing the assessment of past human land use activities on the grounds of their immediate environmental impact. The thesis integrates the evidence from three study areas into a landscape-scale model of environmental change in North Pare and closes the gap between the regional long-term vegetation history and site-specific historical accounts of land use and finally discusses the timing and causes of morphological change in the context of regional climate dynamics and agricultural practices.
1.1 Aims and Objectives
The principal aim of the present study is to establish a history of past soil erosion and reconstruct the shaping of the present North Pare landscape. The soil erosion history is then compared with the occupation history of the area inferred from oral accounts and archaeological research and with published reconstructions of palaeoclimate in order to disentangle human-environment interactions and the impact of climate dynamics on landscape development. The research has been conducted in an explorative approach and is based on several research questions rather than overt, formulated hypotheses, the aims of which can be summarised as
1. to establish the general framework of landscape development,
2. reconstruct vegetation dynamics,
3. to explore the origins of soil erosion and land degradation,
4. to evaluate the impact of early sedentary land use and iron smelting,
5. and the consequences of the 19th-century caravan trade on landscape and vegetation patterns.
Ultimately, the reconstruction of past landscape development will allow the evaluation of land degradation processes suggested by the reports of the 19th-century travellers and the present state of the North Pare landscape, and ties in to the broader questions about the environmental history of north-eastern Tanzania.
Terrestrial archives in North Pare suitable to answer the questions raised are most importantly hillslope deposits, ubiquitous in the small valleys. Three different study sites were investigated in detail � Lomwe, Mrongo and Usumbwe � and allow a comprehensive overview of Holocene slope processes in the agriculturally important, mid-altitudinal upland of North Pare (chapter 6.4). Three distinct phases of colluviation are distinguished across the study areas and are explained as cumulative soil erosion phases, initially transporting topsoil material and after its exhaustion land degradation and subsoil erosion. The explanatory power of the sedimentary record is enhanced by a soil transect study
7
across the eroded source areas of the respective sediment traps. Eroded soils under agricultural land use and on differing topographic position are contrasted with soils under mature forest from remaining forest fragments at Kwa Kirumbi and and Kwa Chegho (chapters 6.2 & 6.3). The comparison of eroded and non-eroded soils allows a qualitative estimate of the amount of material lost since the onset of soil erosion (chapter 9.2). The terrestrial record is complemented by palaeoecological analysis of a buried swamp deposit at Lomwe (chapter 9.5). From its location in the mid-altitudinal agricultural zone the pollen record is expected to differ from previous studies in montane forest locations and to reflect strongly the onset of human land use and anthropogenic vegetation change.
The research is based on a multi-proxy approach. Fundamental is the field description of the slope deposits, which enables the identification of benchmark features for soil erosion processes and concludes in a generalised stratigraphy (chapter 8). The model of slope deposit formation is confirmed by magnetic susceptibility properties and basic geochemical parameters (chapter 7). To assess past vegetation cover, three different lines of evidence - pollen, phytolith and stable carbon isotope analysis - are integrated. Direct palaeoecological evidence from the swamp core is contrasted with indirect evidence from stable carbon isotope analysis of soil organic matter of the slope deposits (chapter 8.5). The chronology of soil erosion and slope deposit formation is based on radiocarbon dating of ubiquitous macroscopic charcoal fragments but is compared to independent deposition ages obtained from optical-stimulated luminescence dating (chapter 7.8).
1.2 Thesis structure The thesis is structured into an introductory part summarising the physical environment of the
Eastern Arc Mountains and particularly the North Pare mountains (chapter 2). The following chapter 3 highlights important research questions on soil erosion, hillslope deposit formation and landscape development in East Africa, discusses methodological caveats and presents important case studies from Tanzania. This is followed by an outline of the archaeological and historical information available for northeastern Tanzania in general and the Pare Mountains in particular (chapter 4). Methods are presented in chapter 5. Chapter 6 presents an overview of the three study areas and summarises the stratigraphy of the respective slope deposits, whereas detailed descriptions of each profile are given in Appendix B. A comparison of eroded agricultural and non-eroded forest soils follows leading to a quantitative estimate of soil erosion and land degradation. The analytical results are presented following a thematic structure (chapter 7), and are subsequently discussed in terms of stratigraphic correlation and their interpretational value for palaeo-environmental processes (chapter 8) before each of the slope transects is interpreted independently (chapter 9). Finally, the evidence is discussed in the light of the regional palaeoclimatic and archaeological paradigms (chapter 10). The thesis concludes with an evaluation of the research approach and the applied methods and closes with perspectives on future research questions.

8
9
2 PHYSICAL ENVIRONMENT
2.1 Physiography The Pare Mountains are part of the Eastern Arc Mountains - a crescent shaped chain of thirteen
crystalline mountain blocks in eastern Tanzania (LOVETT 1989). These tectonically uplifted blocks of Precambrian basement contrast with the much younger and higher volcanic mountains such as Kilimanjaro, Mt. Kenya and the Ruwenzoris. From north to south the thirteen Eastern Arc Mountain blocks are Taita, North Pare, South Pare, Usambara, Nguu, Nguru, Ulugruru, Ukaguru, Malundwe, Rubeho, Udzungwa, and Mahenge (Fig. 1).
2.1.1 Tectonic evolution of north-eastern Tanzania
North-eastern Tanzania is characterised by three distinct geological units. Old Precambrian basement is exposed on the peneplains of the Massai Steppe, the Mkomazi and Tsavo plains and in the uplifted blocks of the Pare - Usambara Mountain range (SAGGERSON 1972). Karoo sediments are preserved to the east and are overlain by progressively younger Mesozoic to Quaternary sediments near the coast. Rifting and associated volcanic activity have shaped the north-western part. The basement of the Eastern Arc Mountains forms part of the Precambrian Mozambique Belt, which extends along the coast from Mozambique to Ethiopia. During the Mozambiquian orogeny, crystalline rocks and sediments were subjected to metamorphic alteration and the present suite of metamorphic rocks - granulitic gneisses, hornblende-pyroxene granulites (from sandstone, shale), as well as marbles and graphitic schists (metamorphosed shale) � developed. In the Pare Mountains, radiometric dating suggests that the high-grade metamorphosis took place about 655 - 617 Ma ago (BAUERNHOFER et al. 2008b). Uplifting during the Karoo (290 - 180 Ma BP) and again since the Miocene, exposed the once deeply buried strata and formed the Eastern Arc Mountains. During the early Mesozoic, terrestrial Karoo sediments covered wide areas of East Africa. Whereas in the interior, Karoo deposits were eroded during uplift and faulting, they were preserved along the coast due to trough positions and subsequently covered by Jurassic and Cretaceous marine sediments (GRIFFITHS 1993). The break up of the Gondwana continent (180 - 120 Ma) and the drifting away of South America, Antarctica and Madagascar led to a restructuring of the remaining African continent. Rift faulting created range and basin structures and initial block faulting and probably saw the development of predecessors of the Eastern Arc Mountains (GRIFFITHS 1993).
Since then, repeated cycles of uplift and erosion have shaped different erosion surfaces, which characterise East African landscapes today. Inselbergs of harder and more resistant parent material rise over etchplains, bearing traces of older planation surfaces and repeated cycles of peneplanation. The Late Cretaceous - Early Tertiary African surface is represented in the Massai Steppe west of the Pare Mountains and its counterpart the Serengeti Plains west of the Rift Valley. The Central Tanzanian plateau on the other hand is presumed to be an etchplain of younger age (GRIFFITHS 1993).
The East African Rift system is the most important geomorphological feature of the present East African topography and shaped not only the regional climate pattern but also controls vegetation and more settlement patterns. The East African Rift extends from the Afar triple-junction to the Zambesi river in Mozambique and forms part of the large Afro-Arabian Rift system extending further north through the Levant to Turkey. The rifting originated as a consequence of uplifting due to two lithospheric bulges; the Afar and the East African Dome caused by stationary mantle plumes
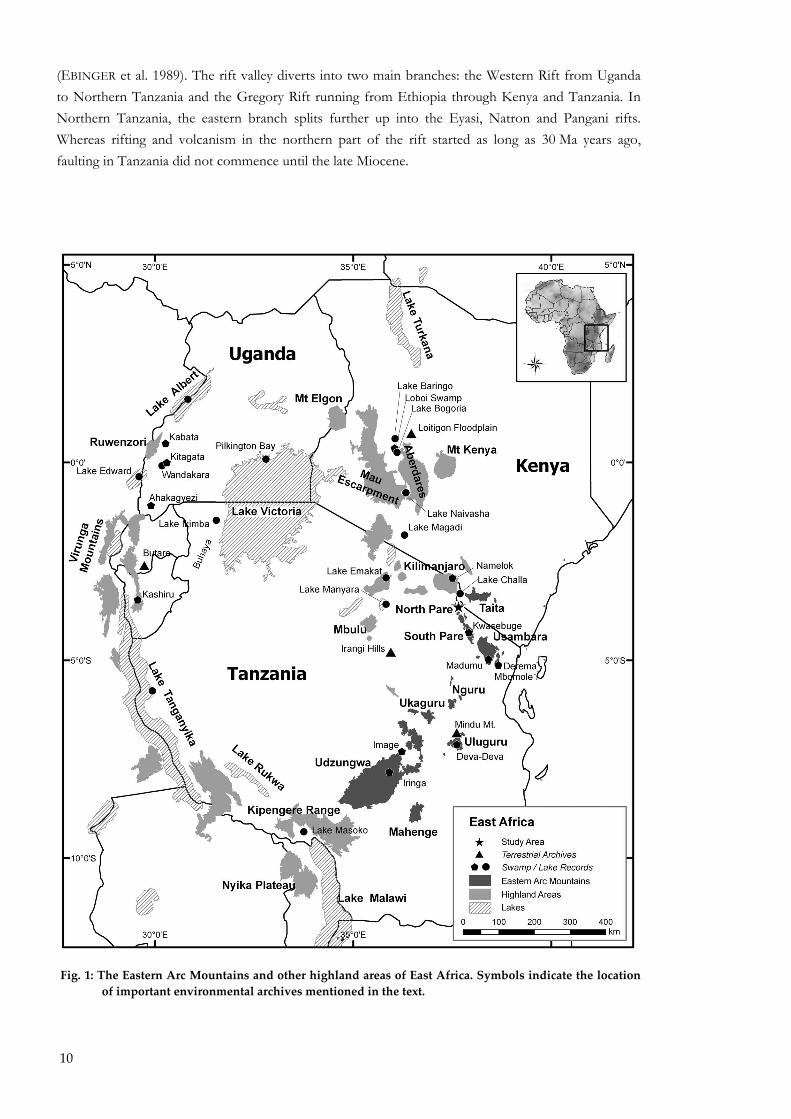
10
(EBINGER et al. 1989). The rift valley diverts into two main branches: the Western Rift from Uganda to Northern Tanzania and the Gregory Rift running from Ethiopia through Kenya and Tanzania. In Northern Tanzania, the eastern branch splits further up into the Eyasi, Natron and Pangani rifts. Whereas rifting and volcanism in the northern part of the rift started as long as 30 Ma years ago, faulting in Tanzania did not commence until the late Miocene.
Fig. 1: The Eastern Arc Mountains and other highland areas of East Africa. Symbols indicate the location of important environmental archives mentioned in the text.

11
2.1.2 The Pare � Usambara horst structure
The uplift of the Eastern Arc Mountain blocks started during the early Mesozoic, but their present shape was only obtained during the final stages of the East African Rift development from about 7 Ma until about 1.2 Ma ago (GRIFFITHS 1993) when extensional faulting of the Pangani graben caused the final uplift of the Pare and Usambara mountain range (LE GALL et al. 2008). The late faulting of the Pangani rift is linked to the onset of volcanic activity of Mount Kilimanjaro around 1 Ma ago (DOWNIE & WILKINSON 1972; LE GALL et al. 2008) and interrupted a former drainage system resulting in the formation of the shallow and poorly drained Lake Jipe (Fig. 3).
The Pangani graben is bordered by the North Pare horst to the east and the Lelatema Mountains to the west. Farther south, the western escarpment develops gradually into a basement flexural warp of the Massai craton and the Pangani basin becomes an asymmetrical half-graben structure (Fig. 2). The vertical displacement of the tilted blocks along the main fault increases southwards from >1000m in the older North Pare Mountains, 1500m in South Pare and >1500 in the younger Usambara Mountains (LE GALL et al. 2008). The five fault blocks of North, Middle, and South Pare and North and East
Fig. 2: The Pangani extensional fault range. Structural overview of the asymmetrical Pare‐Usambara horst and Pangani half‐graben structure. Cross sections of the North Pare (B1), South Pare (B2) and Usambara (B3) mountain ranges (vertical exaggeration x6, Map from LE GALL et al. 2008).
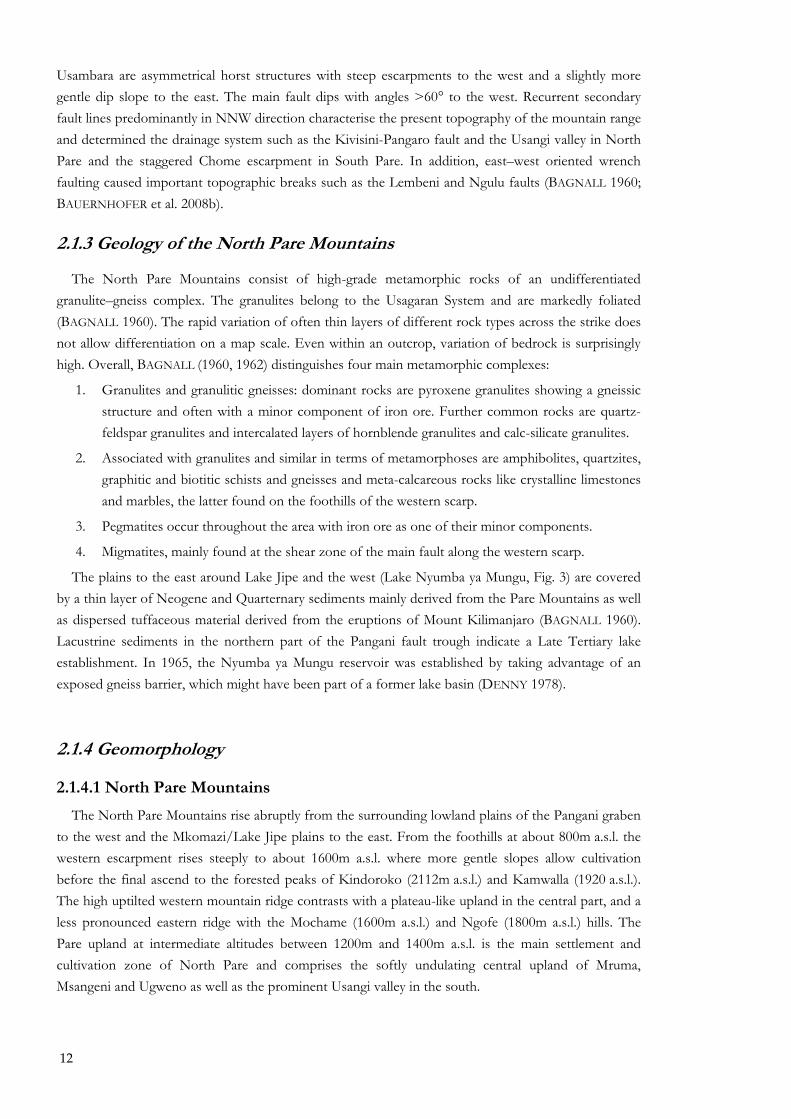
12
Usambara are asymmetrical horst structures with steep escarpments to the west and a slightly more gentle dip slope to the east. The main fault dips with angles >60° to the west. Recurrent secondary fault lines predominantly in NNW direction characterise the present topography of the mountain range and determined the drainage system such as the Kivisini-Pangaro fault and the Usangi valley in North Pare and the staggered Chome escarpment in South Pare. In addition, east�west oriented wrench faulting caused important topographic breaks such as the Lembeni and Ngulu faults (BAGNALL 1960; BAUERNHOFER et al. 2008b).
2.1.3 Geology of the North Pare Mountains
The North Pare Mountains consist of high-grade metamorphic rocks of an undifferentiated granulite�gneiss complex. The granulites belong to the Usagaran System and are markedly foliated (BAGNALL 1960). The rapid variation of often thin layers of different rock types across the strike does not allow differentiation on a map scale. Even within an outcrop, variation of bedrock is surprisingly high. Overall, BAGNALL (1960, 1962) distinguishes four main metamorphic complexes:
1. Granulites and granulitic gneisses: dominant rocks are pyroxene granulites showing a gneissic structure and often with a minor component of iron ore. Further common rocks are quartz-feldspar granulites and intercalated layers of hornblende granulites and calc-silicate granulites.
2. Associated with granulites and similar in terms of metamorphoses are amphibolites, quartzites, graphitic and biotitic schists and gneisses and meta-calcareous rocks like crystalline limestones and marbles, the latter found on the foothills of the western scarp.
3. Pegmatites occur throughout the area with iron ore as one of their minor components.
4. Migmatites, mainly found at the shear zone of the main fault along the western scarp.
The plains to the east around Lake Jipe and the west (Lake Nyumba ya Mungu, Fig. 3) are covered by a thin layer of Neogene and Quarternary sediments mainly derived from the Pare Mountains as well as dispersed tuffaceous material derived from the eruptions of Mount Kilimanjaro (BAGNALL 1960). Lacustrine sediments in the northern part of the Pangani fault trough indicate a Late Tertiary lake establishment. In 1965, the Nyumba ya Mungu reservoir was established by taking advantage of an exposed gneiss barrier, which might have been part of a former lake basin (DENNY 1978).
2.1.4 Geomorphology
2.1.4.1 North Pare Mountains
The North Pare Mountains rise abruptly from the surrounding lowland plains of the Pangani graben to the west and the Mkomazi/Lake Jipe plains to the east. From the foothills at about 800m a.s.l. the western escarpment rises steeply to about 1600m a.s.l. where more gentle slopes allow cultivation before the final ascend to the forested peaks of Kindoroko (2112m a.s.l.) and Kamwalla (1920 a.s.l.). The high uptilted western mountain ridge contrasts with a plateau-like upland in the central part, and a less pronounced eastern ridge with the Mochame (1600m a.s.l.) and Ngofe (1800m a.s.l.) hills. The Pare upland at intermediate altitudes between 1200m and 1400m a.s.l. is the main settlement and cultivation zone of North Pare and comprises the softly undulating central upland of Mruma, Msangeni and Ugweno as well as the prominent Usangi valley in the south.
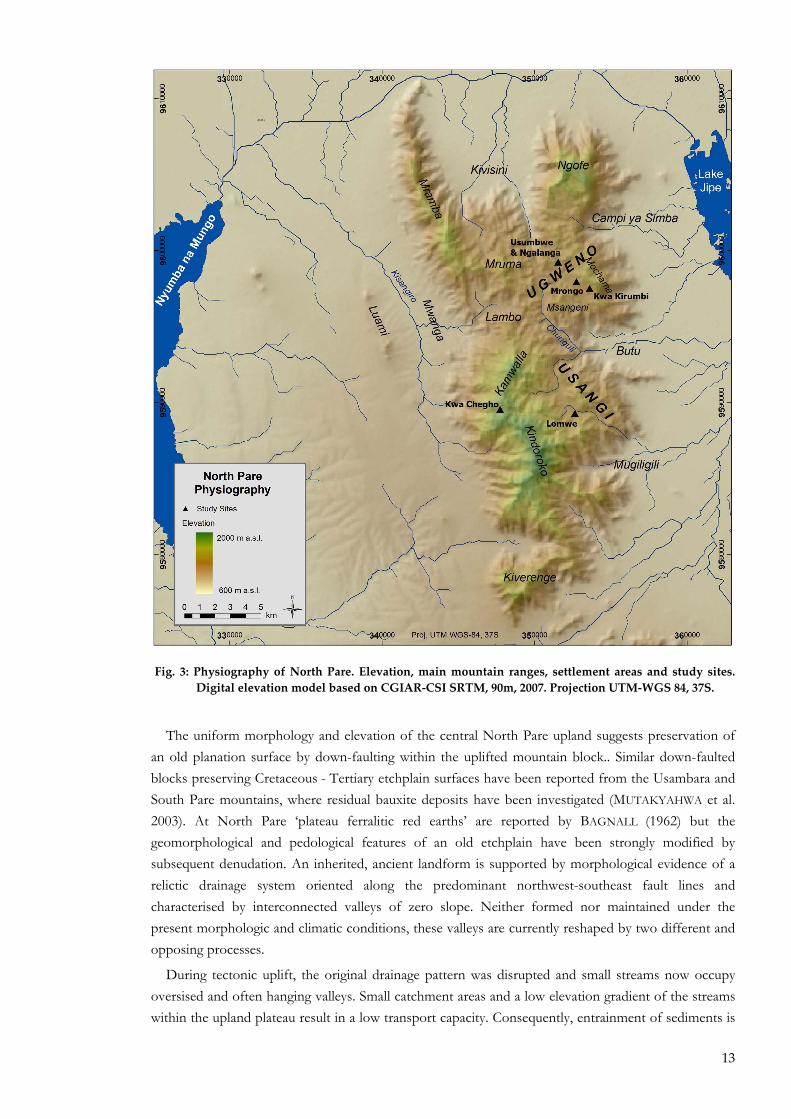
13
Fig. 3: Physiography of North Pare. Elevation, main mountain ranges, settlement areas and study sites. Digital elevation model based on CGIAR‐CSI SRTM, 90m, 2007. Projection UTM‐WGS 84, 37S.
The uniform morphology and elevation of the central North Pare upland suggests preservation of an old planation surface by down-faulting within the uplifted mountain block.. Similar down-faulted blocks preserving Cretaceous - Tertiary etchplain surfaces have been reported from the Usambara and South Pare mountains, where residual bauxite deposits have been investigated (MUTAKYAHWA et al. 2003). At North Pare �plateau ferralitic red earths� are reported by BAGNALL (1962) but the geomorphological and pedological features of an old etchplain have been strongly modified by subsequent denudation. An inherited, ancient landform is supported by morphological evidence of a relictic drainage system oriented along the predominant northwest-southeast fault lines and characterised by interconnected valleys of zero slope. Neither formed nor maintained under the present morphologic and climatic conditions, these valleys are currently reshaped by two different and opposing processes.
During tectonic uplift, the original drainage pattern was disrupted and small streams now occupy oversised and often hanging valleys. Small catchment areas and a low elevation gradient of the streams within the upland plateau result in a low transport capacity. Consequently, entrainment of sediments is
14
reduced and aggradation has resulted in the accumulation of valley deposits. Local seepage has led to the development of valley bottom swamps (e.g. Lomwe and Ngagheni swamp in the Usangi valley and Masumbeni swamp in Ugweno) and shallow interflues within former valley bottoms are frequently observed.
On the other hand, uplift stimulated down-cutting of the few well-watered streams running along zones of structural weakness in predominantly northwest-southeast direction. The deeply incised perennial Chunguli River and the northwards draining streams Molo/Kivisini and Shimbomu have captured most of Ugweno�s streams and drain large parts of the upland All other independent watercourses run along almost flat, hanging valleys and pour down the steep slopes of the escarpment.
The pattern of undulating hills and swampy, infilled valley bottoms broadly resembles the geomorphology of the �bas-fonds de regions humides� (RAUNET 1985) or more specifically the marais of the rolling hill country of Rwanda (GRUNERT et al. 2004; KERSTING 2010). Despite their small size, particular location and a much more intensive erosion regime, the undulating plateau-like upland preserved in central North Pare can be considered as bas-fond or �tropical valley bottoms� sensu RAUNET (1985) reflecting the �elementary drainage system� of �ferralitised� planation surfaces.
2.1.4.2 Footslopes and pediments
The lower slopes of the Pare Mountains are broken up by step faults resulting in a discontinuous chain of lower foothills. Their footslopes gradually merge into pediments. Along the northern and eastern flanks, the footslope pediments are interconnected and extend into the four structural conditioned tectonic creeks of Kivisini, Kambi ya Simba, Butu and Mugiligil/Muvraini. The pediments are homogeneous and dip gently down to the Lake Jipe depression, a former river valley blocked by the development of Mount Kilimanjaro. Although streams flow year-round in the Pare highlands, they run dry along the slope and water only reaches the plains during the rainy season. Where the seasonal rivers seep away the accumulation of alluvial clay leads to the formation of dark clay soils. The shallow depressions are called mbugas (Kiswahili) and are more commonly known as dambos. These seasonally waterlogged, small channelless valleys are generally associated with granitic or metamorphic bedrock of the gently undulating plains of the post-African planation surfaces (MÄCKEL 1974; ACRES et al. 1985; RAUNET 1985).
The western foothills present a different situation. Here low, parallel ridges separate shallow, sediment-filled depressions. Soil erosion on the interfluves has exposed the weathered bedrock and recent gully erosion in the shallow valleys has created a network of gullies and up to 3m deep ravines. The seasonal streams are captured by the Kisangiro channel running north along the dominant step fault separating the small Luami hill from the North Pare mountain block. Between 2 and 10m of alluvial and colluvial deposits show that the Kisangiro depression has acted as an efficient trap for sediments transported by streams from the mountain block and the eroded footslopes of North Pare.
2.2 Climate
East African climate is one of the most complex meteorological systems on the African continent due to the interaction of three air masses leading to two distinct convergence zones. This large-scale pattern is modified by regional conditions including topography and large lakes resulting in a mosaic of local climates. The most conspicuous aspect of the present day East African climate is its azonal aridity, which has prompted many climatological investigations (FLOHN 1964; NICHOLSON & FLOHN 1980; NICHOLSON 2000; HASTENRATH 2001; HASTENRATH & LAMB 2004; HASTENRATH 2007).
15
2.2.1 East African climate patterns
Three main air masses control the East African climate: the south-western monsoon (boreal summer), the north-western monsoon (boreal winter) and the Congo Air with westerly flow (Fig. 4). The Congo Air originates from the high-pressure cell over the southern Atlantic and is the moisture source for the tropical forests of the central African lowlands. Thermally unstable it brings convective and orographic rains to the north-western part of East Africa. The elevated highlands of the Western Rift in Rwanda, Burundi, Uganda receive the bulk of this precipitation and act as a barrier for the Central Rift and the eastern lowland areas (NICHOLSON 1996).
The air masses of the north-western monsoon are predominantly dry as they originate from the high-pressure cells over the dry deserts of northeast Africa and Arabia. The south-western monsoon brings moist air masses from the high over the southwest Indian Ocean, but does not result in a pronounced rainy season during boreal summer. Both of the monsoon systems are thermally and dynamically stable (FLOHN 1964; HAMILTON 1982; NICHOLSON 1996). The stability of these air masses results from flow divergence and related subsidence as a consequence of a) increasing meridian area at the Equator; b) near parallel air flow along the East African coast and consequent friction stress and flow divergence along the land sea boundary; c) flow diversion to the Ethiopian trough in boreal summer; and d) subsidence due to cooling over cold upwelling bottom waters along the Kenyan and Somali coasts induced by the equatorial westerlies. The resulting thermal stability and general subsidence of air masses prevent rainfall during the summer and winter monsoon periods. Consequently, rainfall in most of East Africa is restricted to the transition period between the two monsoon phases when maximum solar insolation during the overhead passage of the sun promotes convectional rainfall. The interplay between the north-south migration of the Intertropical Convergence Zone (ITCZ) and the monsoons leads to a bimodal precipitation pattern with �Long Rains� (Masika in Kiswahili) occurring in boreal spring (April/May) and �Short Rains� (Vule) in November/December.
The �Long Rains� are more reliable and abundant, whereas the �Short Rains� are highly variable and sensitive to circulation anomalies, which have been responsible for heavy rainfalls resulting in disastrous 20th-century floods in e.g. 1961, 1994, and 1997 (NICHOLSON 2000; HASTENRATH 2007). Anomalous high precipitation events like the extreme event of 1961 are believed to influence lake levels for several subsequent years (HASTENRATH 2007). The intensity of the East African �Short Rains� are tightly correlated with the velocity of the equatorial westerlies, which establish ephemerally during the monsoonal transition phases as part of the equatorial zonal circulation cell (Walker circulation) over the Indian Ocean (Fig. 5) (HASTENRATH 2007). A stronger circulation cell leads to upwelling, lower sea surface temperatures, and subsiding airflow over the western Indian Ocean and hence dry conditions over most of East Africa, whereas the Indonesian region experiences rainfall. The establishment of equatorial westerlies is subdued in years of a strong southwest monsoon. A weaker circulation cell results in higher sea surface temperatures, enhancement of the tropical low pressure trough and hence strong convective rainfall.
This vertical circulation cell over the Indian Ocean is part of the global Walker circulation and therefore shows strong teleconnections to the El Niño - Southern Oscillation phenomenon (ENSO) as the pressure differences over the Pacific Ocean are transmitted through strengthening and weakening of the equatorial zonal circulation cells. During the 20th century, high precipitation and therefore higher lake levels in East Africa are correlated with strong tradewinds and weak equatorial westerlies. Thus, precipitation in East Africa tends to increase in ENSO years (weak Walker circulation) and is
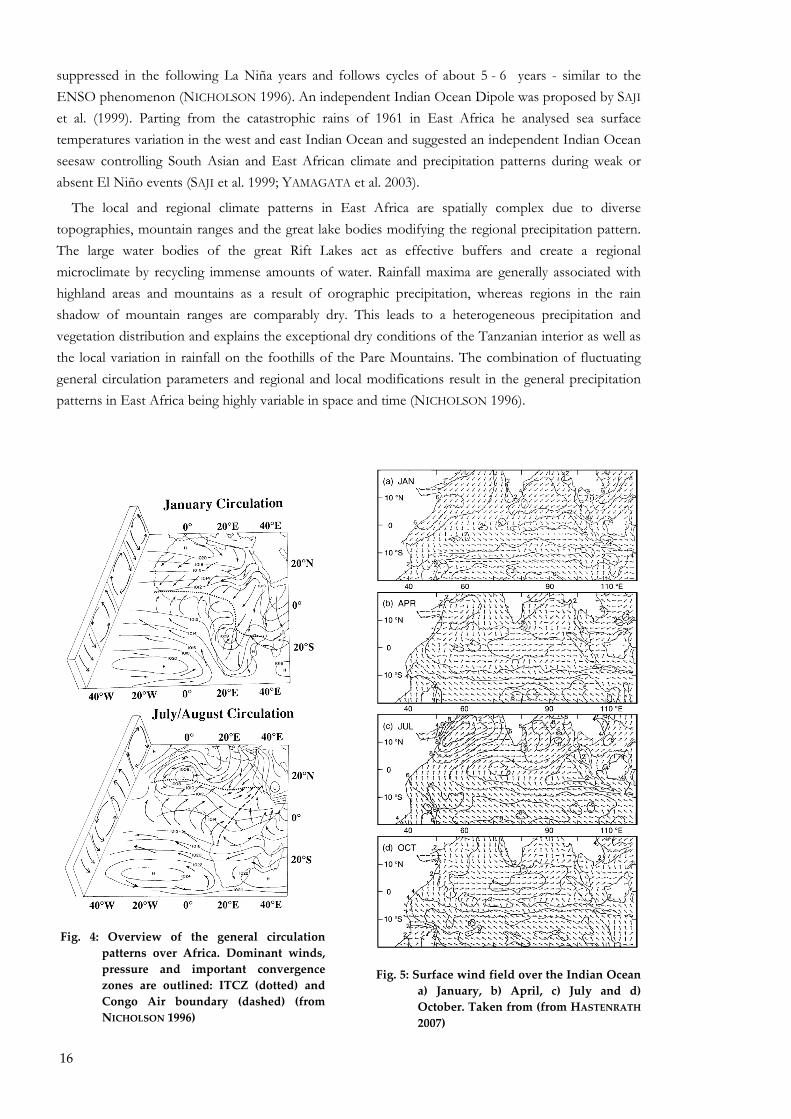
16
suppressed in the following La Niña years and follows cycles of about 5 - 6 years - similar to the ENSO phenomenon (NICHOLSON 1996). An independent Indian Ocean Dipole was proposed by SAJI
et al. (1999). Parting from the catastrophic rains of 1961 in East Africa he analysed sea surface temperatures variation in the west and east Indian Ocean and suggested an independent Indian Ocean seesaw controlling South Asian and East African climate and precipitation patterns during weak or absent El Niño events (SAJI et al. 1999; YAMAGATA et al. 2003).
The local and regional climate patterns in East Africa are spatially complex due to diverse topographies, mountain ranges and the great lake bodies modifying the regional precipitation pattern. The large water bodies of the great Rift Lakes act as effective buffers and create a regional microclimate by recycling immense amounts of water. Rainfall maxima are generally associated with highland areas and mountains as a result of orographic precipitation, whereas regions in the rain shadow of mountain ranges are comparably dry. This leads to a heterogeneous precipitation and vegetation distribution and explains the exceptional dry conditions of the Tanzanian interior as well as the local variation in rainfall on the foothills of the Pare Mountains. The combination of fluctuating general circulation parameters and regional and local modifications result in the general precipitation patterns in East Africa being highly variable in space and time (NICHOLSON 1996).
Fig. 4: Overview of the general circulation patterns over Africa. Dominant winds, pressure and important convergence zones are outlined: ITCZ (dotted) and Congo Air boundary (dashed) (from NICHOLSON 1996)
Fig. 5: Surface wind field over the Indian Ocean a) January, b) April, c) July and d) October. Taken from (from HASTENRATH 2007)
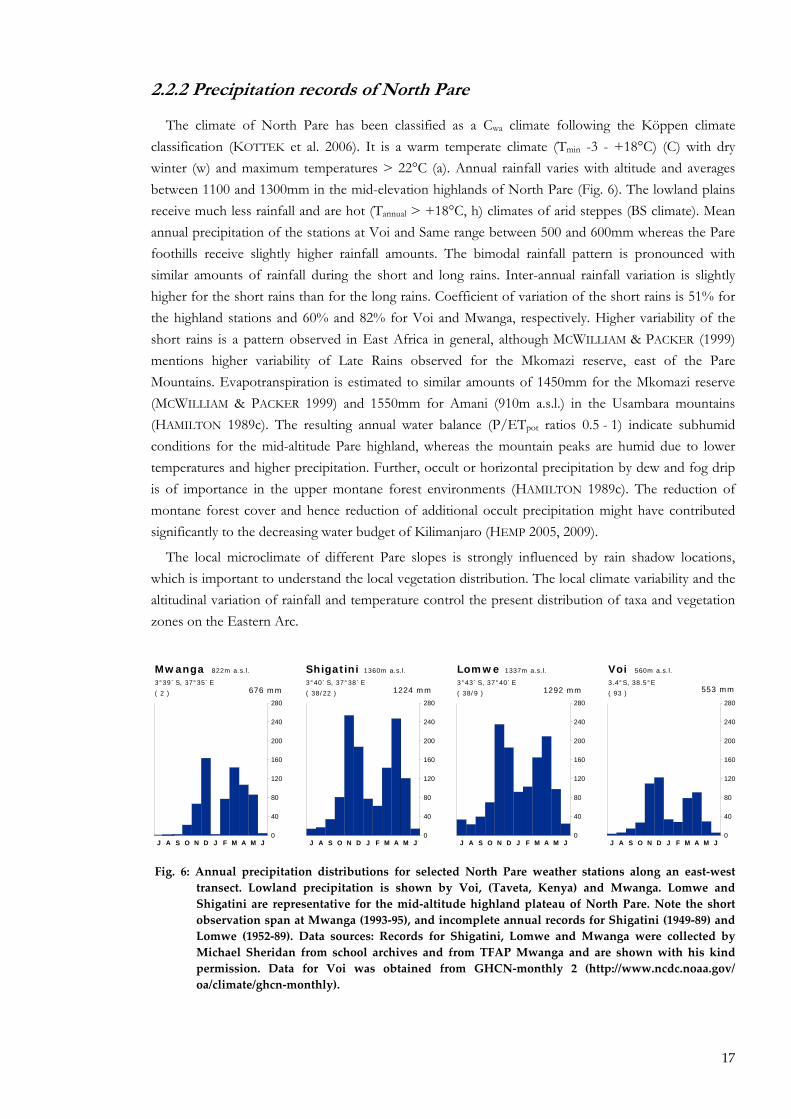
17
2.2.2 Precipitation records of North Pare
The climate of North Pare has been classified as a Cwa climate following the Köppen climate classification (KOTTEK et al. 2006). It is a warm temperate climate (Tmin -3 - +18°C) (C) with dry winter (w) and maximum temperatures > 22°C (a). Annual rainfall varies with altitude and averages between 1100 and 1300mm in the mid-elevation highlands of North Pare (Fig. 6). The lowland plains receive much less rainfall and are hot (Tannual > +18°C, h) climates of arid steppes (BS climate). Mean annual precipitation of the stations at Voi and Same range between 500 and 600mm whereas the Pare foothills receive slightly higher rainfall amounts. The bimodal rainfall pattern is pronounced with similar amounts of rainfall during the short and long rains. Inter-annual rainfall variation is slightly higher for the short rains than for the long rains. Coefficient of variation of the short rains is 51% for the highland stations and 60% and 82% for Voi and Mwanga, respectively. Higher variability of the short rains is a pattern observed in East Africa in general, although MCWILLIAM & PACKER (1999) mentions higher variability of Late Rains observed for the Mkomazi reserve, east of the Pare Mountains. Evapotranspiration is estimated to similar amounts of 1450mm for the Mkomazi reserve (MCWILLIAM & PACKER 1999) and 1550mm for Amani (910m a.s.l.) in the Usambara mountains (HAMILTON 1989c). The resulting annual water balance (P/ETpot ratios 0.5 - 1) indicate subhumid conditions for the mid-altitude Pare highland, whereas the mountain peaks are humid due to lower temperatures and higher precipitation. Further, occult or horizontal precipitation by dew and fog drip is of importance in the upper montane forest environments (HAMILTON 1989c). The reduction of montane forest cover and hence reduction of additional occult precipitation might have contributed significantly to the decreasing water budget of Kilimanjaro (HEMP 2005, 2009).
The local microclimate of different Pare slopes is strongly influenced by rain shadow locations, which is important to understand the local vegetation distribution. The local climate variability and the altitudinal variation of rainfall and temperature control the present distribution of taxa and vegetation zones on the Eastern Arc.
J A S O N D J F M A M J0
40
80
120
160
200
240
280
Voi 560m a.s.l.
3.4°S, 38.5°E
( 93 ) 553 mm
J A S O N D J F M A M J0
40
80
120
160
200
240
280
Mwanga 822m a.s.l.
3°39´S, 37°35´E
( 2 ) 676 mm
J A S O N D J F M A M J0
40
80
120
160
200
240
280
Shigatini 1360m a.s.l.
3°40´S, 37°38´E
( 38/22 ) 1224 mm
J A S O N D J F M A M J0
40
80
120
160
200
240
280
Lomwe 1337m a.s.l.
3°43´S, 37°40´E
( 38/9 ) 1292 mm
Fig. 6: Annual precipitation distributions for selected North Pare weather stations along an east‐west transect. Lowland precipitation is shown by Voi, (Taveta, Kenya) and Mwanga. Lomwe and Shigatini are representative for the mid‐altitude highland plateau of North Pare. Note the short observation span at Mwanga (1993‐95), and incomplete annual records for Shigatini (1949‐89) and Lomwe (1952‐89). Data sources: Records for Shigatini, Lomwe and Mwanga were collected by Michael Sheridan from school archives and from TFAP Mwanga and are shown with his kind permission. Data for Voi was obtained from GHCN‐monthly 2 (http://www.ncdc.noaa.gov/ oa/climate/ghcn‐monthly).
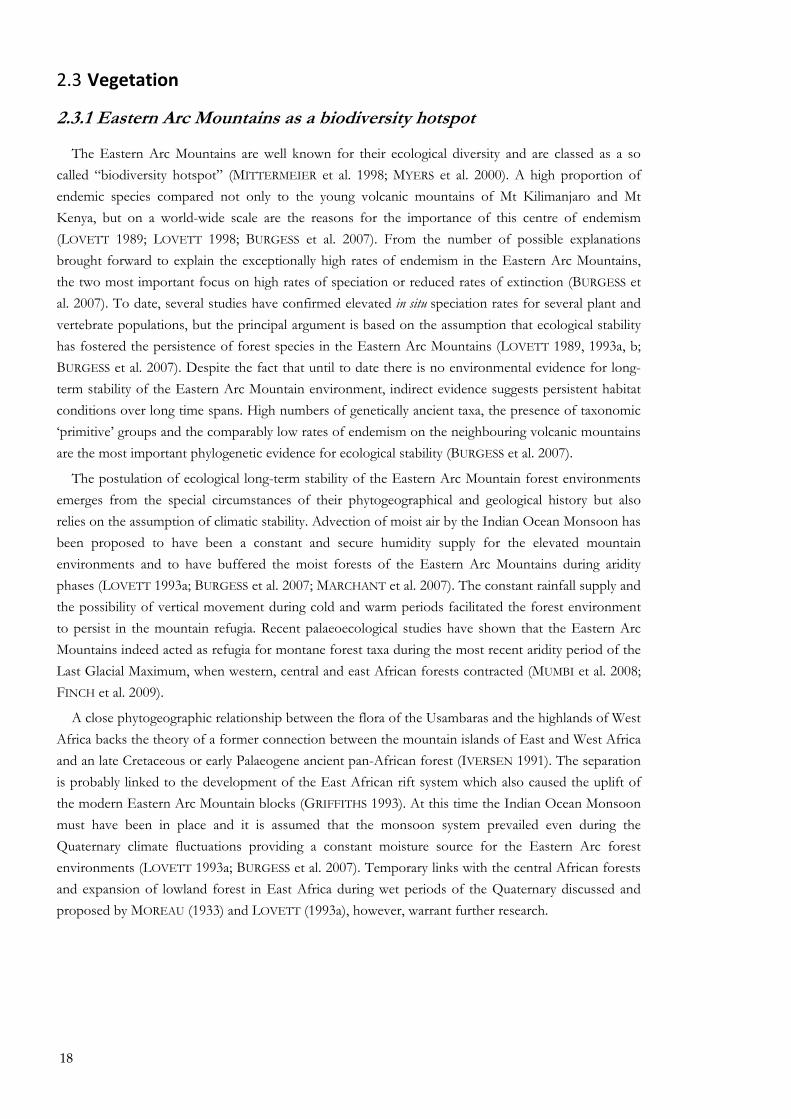
18
2.3 Vegetation
2.3.1 Eastern Arc Mountains as a biodiversity hotspot
The Eastern Arc Mountains are well known for their ecological diversity and are classed as a so called �biodiversity hotspot� (MITTERMEIER et al. 1998; MYERS et al. 2000). A high proportion of endemic species compared not only to the young volcanic mountains of Mt Kilimanjaro and Mt Kenya, but on a world-wide scale are the reasons for the importance of this centre of endemism (LOVETT 1989; LOVETT 1998; BURGESS et al. 2007). From the number of possible explanations brought forward to explain the exceptionally high rates of endemism in the Eastern Arc Mountains, the two most important focus on high rates of speciation or reduced rates of extinction (BURGESS et al. 2007). To date, several studies have confirmed elevated in situ speciation rates for several plant and vertebrate populations, but the principal argument is based on the assumption that ecological stability has fostered the persistence of forest species in the Eastern Arc Mountains (LOVETT 1989, 1993a, b; BURGESS et al. 2007). Despite the fact that until to date there is no environmental evidence for long-term stability of the Eastern Arc Mountain environment, indirect evidence suggests persistent habitat conditions over long time spans. High numbers of genetically ancient taxa, the presence of taxonomic �primitive� groups and the comparably low rates of endemism on the neighbouring volcanic mountains are the most important phylogenetic evidence for ecological stability (BURGESS et al. 2007).
The postulation of ecological long-term stability of the Eastern Arc Mountain forest environments emerges from the special circumstances of their phytogeographical and geological history but also relies on the assumption of climatic stability. Advection of moist air by the Indian Ocean Monsoon has been proposed to have been a constant and secure humidity supply for the elevated mountain environments and to have buffered the moist forests of the Eastern Arc Mountains during aridity phases (LOVETT 1993a; BURGESS et al. 2007; MARCHANT et al. 2007). The constant rainfall supply and the possibility of vertical movement during cold and warm periods facilitated the forest environment to persist in the mountain refugia. Recent palaeoecological studies have shown that the Eastern Arc Mountains indeed acted as refugia for montane forest taxa during the most recent aridity period of the Last Glacial Maximum, when western, central and east African forests contracted (MUMBI et al. 2008; FINCH et al. 2009).
A close phytogeographic relationship between the flora of the Usambaras and the highlands of West Africa backs the theory of a former connection between the mountain islands of East and West Africa and an late Cretaceous or early Palaeogene ancient pan-African forest (IVERSEN 1991). The separation is probably linked to the development of the East African rift system which also caused the uplift of the modern Eastern Arc Mountain blocks (GRIFFITHS 1993). At this time the Indian Ocean Monsoon must have been in place and it is assumed that the monsoon system prevailed even during the Quaternary climate fluctuations providing a constant moisture source for the Eastern Arc forest environments (LOVETT 1993a; BURGESS et al. 2007). Temporary links with the central African forests and expansion of lowland forest in East Africa during wet periods of the Quaternary discussed and proposed by MOREAU (1933) and LOVETT (1993a), however, warrant further research.
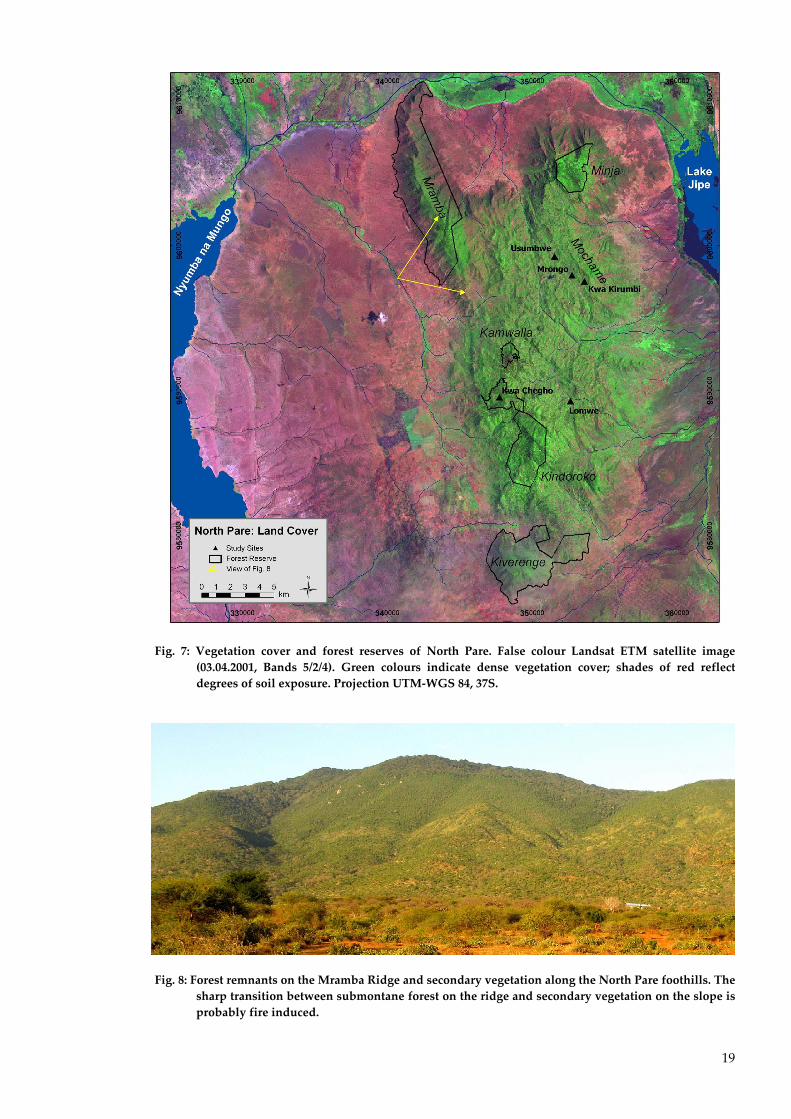
19
Fig. 7: Vegetation cover and forest reserves of North Pare. False colour Landsat ETM satellite image (03.04.2001, Bands 5/2/4). Green colours indicate dense vegetation cover; shades of red reflect degrees of soil exposure. Projection UTM‐WGS 84, 37S.
Fig. 8: Forest remnants on the Mramba Ridge and secondary vegetation along the North Pare foothills. The sharp transition between submontane forest on the ridge and secondary vegetation on the slope is probably fire induced.
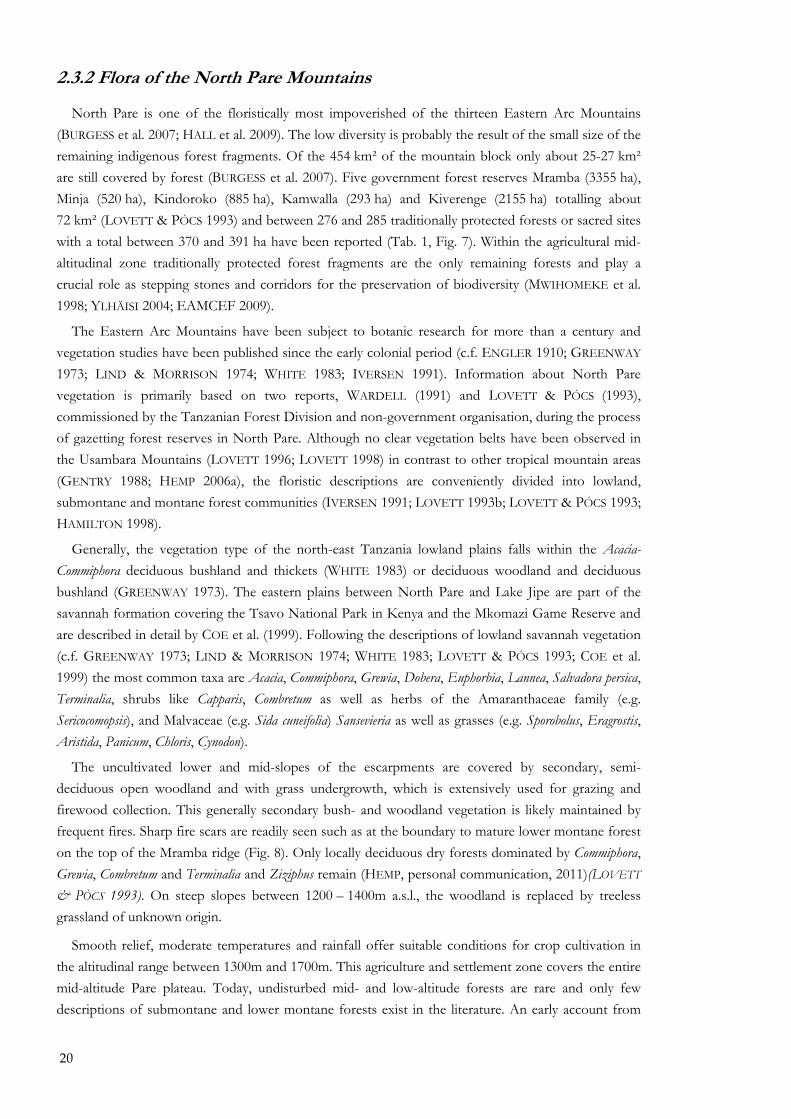
20
2.3.2 Flora of the North Pare Mountains
North Pare is one of the floristically most impoverished of the thirteen Eastern Arc Mountains (BURGESS et al. 2007; HALL et al. 2009). The low diversity is probably the result of the small size of the remaining indigenous forest fragments. Of the 454 km² of the mountain block only about 25-27 km² are still covered by forest (BURGESS et al. 2007). Five government forest reserves Mramba (3355 ha), Minja (520 ha), Kindoroko (885 ha), Kamwalla (293 ha) and Kiverenge (2155 ha) totalling about 72 km² (LOVETT & PÓCS 1993) and between 276 and 285 traditionally protected forests or sacred sites with a total between 370 and 391 ha have been reported (Tab. 1, Fig. 7). Within the agricultural mid-altitudinal zone traditionally protected forest fragments are the only remaining forests and play a crucial role as stepping stones and corridors for the preservation of biodiversity (MWIHOMEKE et al. 1998; YLHÄISI 2004; EAMCEF 2009).
The Eastern Arc Mountains have been subject to botanic research for more than a century and vegetation studies have been published since the early colonial period (c.f. ENGLER 1910; GREENWAY 1973; LIND & MORRISON 1974; WHITE 1983; IVERSEN 1991). Information about North Pare vegetation is primarily based on two reports, WARDELL (1991) and LOVETT & PÓCS (1993), commissioned by the Tanzanian Forest Division and non-government organisation, during the process of gazetting forest reserves in North Pare. Although no clear vegetation belts have been observed in the Usambara Mountains (LOVETT 1996; LOVETT 1998) in contrast to other tropical mountain areas (GENTRY 1988; HEMP 2006a), the floristic descriptions are conveniently divided into lowland, submontane and montane forest communities (IVERSEN 1991; LOVETT 1993b; LOVETT & PÓCS 1993; HAMILTON 1998).
Generally, the vegetation type of the north-east Tanzania lowland plains falls within the Acacia-Commiphora deciduous bushland and thickets (WHITE 1983) or deciduous woodland and deciduous bushland (GREENWAY 1973). The eastern plains between North Pare and Lake Jipe are part of the savannah formation covering the Tsavo National Park in Kenya and the Mkomazi Game Reserve and are described in detail by COE et al. (1999). Following the descriptions of lowland savannah vegetation (c.f. GREENWAY 1973; LIND & MORRISON 1974; WHITE 1983; LOVETT & PÓCS 1993; COE et al. 1999) the most common taxa are Acacia, Commiphora, Grewia, Dobera, Euphorbia, Lannea, Salvadora persica, Terminalia, shrubs like Capparis, Combretum as well as herbs of the Amaranthaceae family (e.g. Sericocomopsis), and Malvaceae (e.g. Sida cuneifolia) Sansevieria as well as grasses (e.g. Sporobolus, Eragrostis, Aristida, Panicum, Chloris, Cynodon).
The uncultivated lower and mid-slopes of the escarpments are covered by secondary, semi-deciduous open woodland and with grass undergrowth, which is extensively used for grazing and firewood collection. This generally secondary bush- and woodland vegetation is likely maintained by frequent fires. Sharp fire scars are readily seen such as at the boundary to mature lower montane forest on the top of the Mramba ridge (Fig. 8). Only locally deciduous dry forests dominated by Commiphora, Grewia, Combretum and Terminalia and Ziziphus remain (HEMP, personal communication, 2011)(LOVETT & PÓCS 1993). On steep slopes between 1200 � 1400m a.s.l., the woodland is replaced by treeless grassland of unknown origin.
Smooth relief, moderate temperatures and rainfall offer suitable conditions for crop cultivation in the altitudinal range between 1300m and 1700m. This agriculture and settlement zone covers the entire mid-altitude Pare plateau. Today, undisturbed mid- and low-altitude forests are rare and only few descriptions of submontane and lower montane forests exist in the literature. An early account from
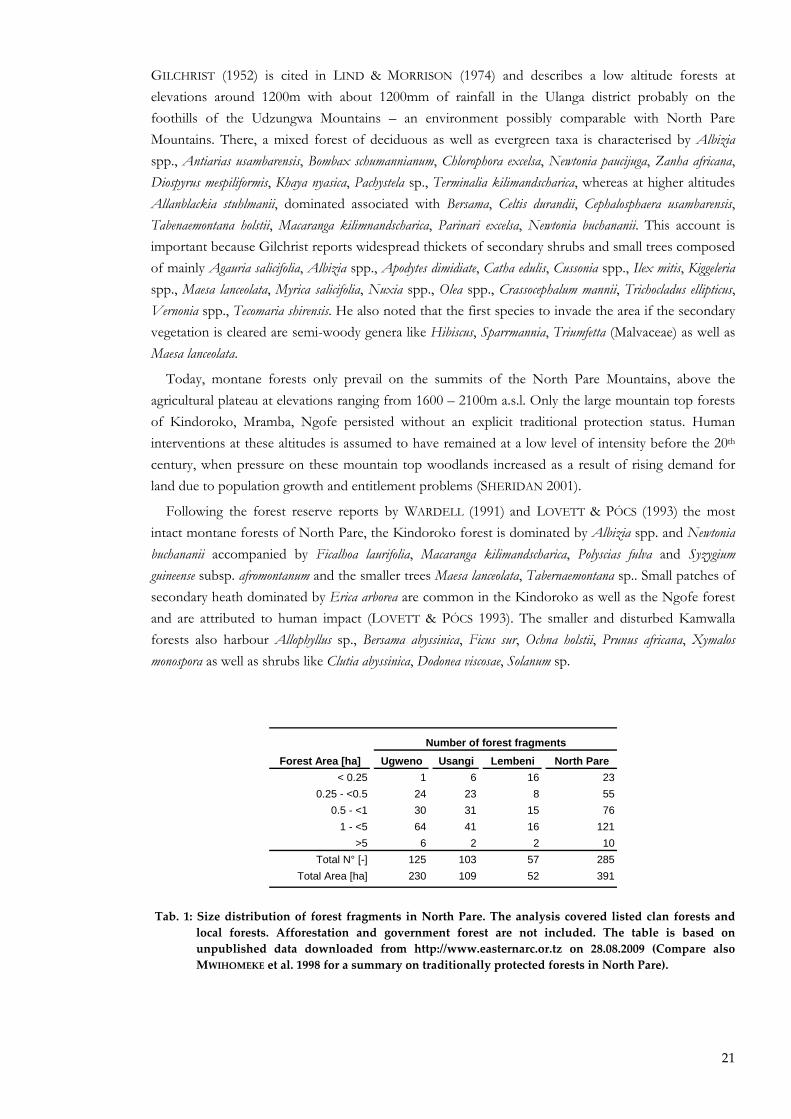
21
GILCHRIST (1952) is cited in LIND & MORRISON (1974) and describes a low altitude forests at elevations around 1200m with about 1200mm of rainfall in the Ulanga district probably on the foothills of the Udzungwa Mountains � an environment possibly comparable with North Pare Mountains. There, a mixed forest of deciduous as well as evergreen taxa is characterised by Albizia spp., Antiarias usambarensis, Bombax schumannianum, Chlorophora excelsa, Newtonia paucijuga, Zanha africana, Diospyrus mespiliformis, Khaya nyasica, Pachystela sp., Terminalia kilimandscharica, whereas at higher altitudes Allanblackia stuhlmanii, dominated associated with Bersama, Celtis durandii, Cephalosphaera usambarensis, Tabenaemontana holstii, Macaranga kilimnandscharica, Parinari excelsa, Newtonia buchananii. This account is important because Gilchrist reports widespread thickets of secondary shrubs and small trees composed of mainly Agauria salicifolia, Albizia spp., Apodytes dimidiate, Catha edulis, Cussonia spp., Ilex mitis, Kiggeleria spp., Maesa lanceolata, Myrica salicifolia, Nuxia spp., Olea spp., Crassocephalum mannii, Trichocladus ellipticus, Vernonia spp., Tecomaria shirensis. He also noted that the first species to invade the area if the secondary vegetation is cleared are semi-woody genera like Hibiscus, Sparrmannia, Triumfetta (Malvaceae) as well as Maesa lanceolata.
Today, montane forests only prevail on the summits of the North Pare Mountains, above the agricultural plateau at elevations ranging from 1600 � 2100m a.s.l. Only the large mountain top forests of Kindoroko, Mramba, Ngofe persisted without an explicit traditional protection status. Human interventions at these altitudes is assumed to have remained at a low level of intensity before the 20th century, when pressure on these mountain top woodlands increased as a result of rising demand for land due to population growth and entitlement problems (SHERIDAN 2001).
Following the forest reserve reports by WARDELL (1991) and LOVETT & PÓCS (1993) the most intact montane forests of North Pare, the Kindoroko forest is dominated by Albizia spp. and Newtonia buchananii accompanied by Ficalhoa laurifolia, Macaranga kilimandscharica, Polyscias fulva and Syzygium guineense subsp. afromontanum and the smaller trees Maesa lanceolata, Tabernaemontana sp.. Small patches of secondary heath dominated by Erica arborea are common in the Kindoroko as well as the Ngofe forest and are attributed to human impact (LOVETT & PÓCS 1993). The smaller and disturbed Kamwalla forests also harbour Allophyllus sp., Bersama abyssinica, Ficus sur, Ochna holstii, Prunus africana, Xymalos monospora as well as shrubs like Clutia abyssinica, Dodonea viscosae, Solanum sp.
Forest Area [ha] Ugweno Usangi Lembeni North Pare< 0.25 1 6 16 23
0.25 - <0.5 24 23 8 550.5 - <1 30 31 15 76
1 - <5 64 41 16 121>5 6 2 2 10
Total N° [-] 125 103 57 285Total Area [ha] 230 109 52 391
Number of forest fragments
Tab. 1: Size distribution of forest fragments in North Pare. The analysis covered listed clan forests and local forests. Afforestation and government forest are not included. The table is based on unpublished data downloaded from http://www.easternarc.or.tz on 28.08.2009 (Compare also MWIHOMEKE et al. 1998 for a summary on traditionally protected forests in North Pare).
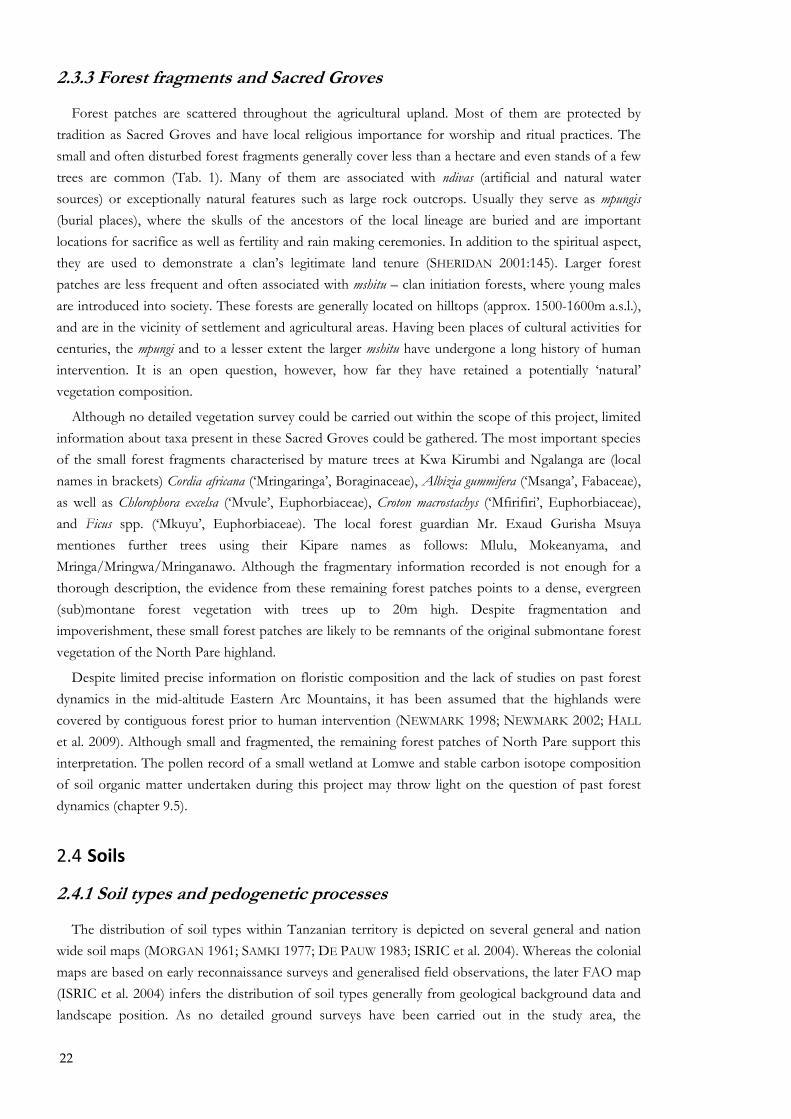
22
2.3.3 Forest fragments and Sacred Groves
Forest patches are scattered throughout the agricultural upland. Most of them are protected by tradition as Sacred Groves and have local religious importance for worship and ritual practices. The small and often disturbed forest fragments generally cover less than a hectare and even stands of a few trees are common (Tab. 1). Many of them are associated with ndivas (artificial and natural water sources) or exceptionally natural features such as large rock outcrops. Usually they serve as mpungis (burial places), where the skulls of the ancestors of the local lineage are buried and are important locations for sacrifice as well as fertility and rain making ceremonies. In addition to the spiritual aspect, they are used to demonstrate a clan�s legitimate land tenure (SHERIDAN 2001:145). Larger forest patches are less frequent and often associated with mshitu � clan initiation forests, where young males are introduced into society. These forests are generally located on hilltops (approx. 1500-1600m a.s.l.), and are in the vicinity of settlement and agricultural areas. Having been places of cultural activities for centuries, the mpungi and to a lesser extent the larger mshitu have undergone a long history of human intervention. It is an open question, however, how far they have retained a potentially �natural� vegetation composition.
Although no detailed vegetation survey could be carried out within the scope of this project, limited information about taxa present in these Sacred Groves could be gathered. The most important species of the small forest fragments characterised by mature trees at Kwa Kirumbi and Ngalanga are (local names in brackets) Cordia africana (�Mringaringa�, Boraginaceae), Albizia gummifera (�Msanga�, Fabaceae), as well as Chlorophora excelsa (�Mvule�, Euphorbiaceae), Croton macrostachys (�Mfirifiri�, Euphorbiaceae), and Ficus spp. (�Mkuyu�, Euphorbiaceae). The local forest guardian Mr. Exaud Gurisha Msuya mentiones further trees using their Kipare names as follows: Mlulu, Mokeanyama, and Mringa/Mringwa/Mringanawo. Although the fragmentary information recorded is not enough for a thorough description, the evidence from these remaining forest patches points to a dense, evergreen (sub)montane forest vegetation with trees up to 20m high. Despite fragmentation and impoverishment, these small forest patches are likely to be remnants of the original submontane forest vegetation of the North Pare highland.
Despite limited precise information on floristic composition and the lack of studies on past forest dynamics in the mid-altitude Eastern Arc Mountains, it has been assumed that the highlands were covered by contiguous forest prior to human intervention (NEWMARK 1998; NEWMARK 2002; HALL et al. 2009). Although small and fragmented, the remaining forest patches of North Pare support this interpretation. The pollen record of a small wetland at Lomwe and stable carbon isotope composition of soil organic matter undertaken during this project may throw light on the question of past forest dynamics (chapter 9.5).
2.4 Soils
2.4.1 Soil types and pedogenetic processes
The distribution of soil types within Tanzanian territory is depicted on several general and nation wide soil maps (MORGAN 1961; SAMKI 1977; DE PAUW 1983; ISRIC et al. 2004). Whereas the colonial maps are based on early reconnaissance surveys and generalised field observations, the later FAO map (ISRIC et al. 2004) infers the distribution of soil types generally from geological background data and landscape position. As no detailed ground surveys have been carried out in the study area, the
23
suggested soil types remain tentative. In the following, reference will be made to earlier soil studies mainly from Usambara before discussing the major soil forming processes and the respective reference soil groups for the Pare environments following the World Reference Base for Soil Resources (IUSS
WORKING GROUP WRB 2007).
MILNE�s (1935, 1937) descriptions of �red earths� from West Usambara can be taken as representative for upland soils of the Eastern Arc Mountains and North Pare. His �Usambara fasc of laterised red loams� or �red earths� are found under original forest vegetation over crystalline basement rocks of mountain areas with high rainfall and moderately high temperatures. These soils are generally over 2m deep, freely drained, have a porous structure, show red-brown to yellow-brown colours, and are readily friable when both dry and wet (MILNE 1937). Iron oxides, most importantly the formation of red haematite (α-Fe2O3) under warm and dry climatic conditions in organic matter poor soils is responsible for the strong red colour (rubefication), and the common denomination of �red earths�.
The organic carbon content of forest topsoils in the Usambaras varies between 2 - 6%, decreasing rapidly to <1% in the subsoils (HAMILTON 1989b). Above elevations about >1200m a.s.l. forest soils are characterised by a folic horizon, an organic layer of accumulated leaves partially decomposed, as mineralization is reduced due to lower temperatures (LUNDGREN 1980). At higher altitudes and on more humid slopes, organic matter rich Umbrisols do occur.
Under a tropical climate regime with high rainfall and moderate to high temperatures chemical weathering processes are advanced. Dissolution of primary minerals by hydrolysis, leaching of cations and incipient desilification have resulted in considerable acidification and topsoil pH values range between 4 � 5 (HAMILTON 1989b; MASUKI & BAKUTI 1994 in Sheridan 2001) but increase about 1 unit in the subsoil (LUNDGREN 1980). Continued percolation of rainwater results in desilification as silica is leached from the solum. The resulting shortage of silica and dominance of aluminium favours the formation of low activity clays like kaolinite, characterised by a low cation-exchange-capacity and a poor nutrient storage capacity as shown by a pilot study of North Pare soils (MASUKI & BAKUTI 1994 in SHERIDAN 2001).
Following LUNDGREN (1980), high altitude soils (~1450m a.s.l.) in West Usambara range from �humic ferralitic soils� in wetter areas to �humic ferrisols� and �humic nitosols� in drier and cooler parts, the latter often under agricultural cultivation. Similarly, HAMILTON (1989b) classifies soils under lowland (250m a.s.l.) and submontane forest (~950m a.s.l.) on the Eastern Usambaras as Rhodic respective Orthic/Xanthic Ferralsols. Finally, the FAO soil map and SOTER database for Tanzania (ISRIC et al. 2004) reports for the upland areas of North and South Pare as well as Usambara a mosaic of mainly Humic Acrisols (25%), Ferric Lixisols (20%), Haplic Nitisols (15%), Rhodic Ferralsols (15%) and Eutric Leptosols (15%).
Although frequently described as �ferralitic� no ferralsols have been reported from North Pare. Ferrallitisation is characterised by advanced leaching of base cations, prolonged desilification and in consequence the residual accumulation and relative enrichment of aluminium and iron oxides, and the neoformation of silica depleted low activity clays (IUSS WORKING GROUP WRB 2007). Under the present semi-humid conditions, soil formation in upland Pare does not lead to the advanced weathering stage of Ferralsols, which thus must be viewed as relict soils having developed under different environmental conditions. �High level ferralitic red earths� (BAGNALL et al. 1963) are widespread in the Usambara Mountains and occur localised in South Pare (Shenghena), where uplifted palaeosurfaces of Cretaceous-Tertiary age are conserved (BAGNALL et al. 1963; MUTAKYAHWA et al. 2003). On these old weathered surfaces advanced ferrallitisation (relative and possibly also absolute
24
enrichment of Al- and Fe� Oxides) has resulted in the development of local bauxite deposits, preserved in a morphological shelter location of down-faulted blocks (MUTAKYAHWA et al. 2003). In North Pare, the distribution of �plateau ferralitic red earths� is locally restricted to small areas >1300m a.s.l. on the Kamwalla, Toni, Ngofe and Kindoroko mountains (BAGNALL 1962) but is not reported from the undulating plateau assumed to be the remnant of a former etchplain. Preservation of old surfaces in North Pare is incomplete and the conservation of relict ferralitic soils is hampered by steep terrain and the rejuvenation of soils by erosion. Hence, neither bauxite occurrence nor pronounced Ferralsols occur in North Pare.
Instead, Acrisols, Nitisols and Cambisols are reported for the slopes of the Pare upland and may have once formed natural toposequences with Ferralsols on the hills and Acrisols on the slopes. The predominant pedological process observed in Pare soils is the translocation of clay minerals from an elluvial topsoil horizon into the subsoil (lessivation/argilluviation) characteristic for Acrisols. The mobilisation of clays is favoured under a seasonally humid climate. Strong rains with electrolyte-poor water facilitate the dispersion of clay particles, whereas desiccation cracks caused by long dry periods facilitate the physical translocation of clay particles into the subsoil.
The literature review suggests a mosaic of Acrisols, Nitisols and locally Cambisols for forests of the Pare upland, whereas Eutric Leptosols or shallow Cambisols cover the steep slopes of the escarpment.
2.4.2 Agricultural soils
Except the steep slopes of the escarpment, most of the upland area of North Pare is under cultivation. The thick organic matter typically found under closed canopy forest cover decomposes rapidly after forest clearance and the humus content of agricultural topsoils is low (<1%). Most agricultural soils are truncated; the original topsoils have been eroded by soil and tillage erosion. Large areas are characterised by exhumed subsoil and widespread exposure of the underlying saprolite are a clear sign of advanced land degradation. A thorough comparison between eroded, agricultural soils and intact forest soils is given in chapter 6.2 & 6.3.
2.5 Summary
This chapter has provided an overview of the physical environment of the study area. Tectonic evolution of the Eastern Arc Mountains created ancient mountain environments, which benefit from the reliable advection of moisture from the Indian Ocean. The assumed long-term climatic stability of these semi-humid to humid highlands has been identified as promoting the exceptional biodiversity of the Eastern Arc montane forests. In North Pare, the gentle mid-altitudinal uplands of the uplifted mountain block offer favourable climatic conditions for agriculture and cultivation in a sheltered environment. The semi-humid climate and the iron rich bedrock geology of the Pare Mountains made this location highly suited to human occupation and enabled the spread of specialised subsistence strategies and technologies. Whereas the geology, climate, flora of the Eastern Arc Mountains have received considerable attention, the geomorphological development and its implications for the present condition of the soil resources are inadequately known. Also poorly understood is how the history of human settlement has shaped these resources. The following chapter discusses the importance of general surface processes like soil erosion and slope deposit formation for landscape development in East Africa, with particular reference to North Pare, while Chapter 4 offers an overview of the available evidence concerning the history and pattern of human settlement in the area.
25
3 SOIL EROSION AND CORRESPONDING TERRESTRIAL ARCHIVES
Like the two faces of a coin, erosion and deposition are intrinsically linked. In the following, a short overview of soil erosion and land degradation research in East Africa is presented to place this research in a broader context. A general discussion of models and concepts of slope deposit development follows. The chapter concludes with a short state of the art overview on terrestrial archives in East Africa in general and Tanzania in particular.
3.1 Landscape, soils and transformations
The term landscape combines geographic as well as cultural notions and is best described visually as the entity of impressions captured by �a view out of the window�. A landscape is characterised by the occurrence of a typical set of characteristic patterns and structures so called landscape elements, which include topographic landforms, land cover, climatic characteristics, as well as cultural elements. Landscape thus is a patchwork of characteristic mosaics at different spatial scales and integrates physical elements, such as geomorphologic features (mountains, valleys, rock outcrops, pediments, superficial deposits), biotic features (forests, savannah, animals) as well as anthropogenic and cultural elements (terraces, paths, agricultural fields, houses, settlement structure).
From an ecological point of view, landscapes as mosaics of different ecosystems are characterised by fluxes, stores, and transformation of energy and matter between the different landscape compartments. There is a dynamic equilibrium between the different landscape elements maintained by internal reorganisation and transformation processes. Despite their dynamic and resilient character, changes in any of the landscape components or processes might trigger instability. The crossing of a threshold may trigger rapid, irreversible changes and the establishment of a different landscape complex (THOMAS 2001a). It is the sensitivity of a specific landscape to perturbations and its resilience, which controls landscape change and the transition from one stable state to the other.
Soil formation and development is controlled by a number of different parameters such as climate, organisms, relief, parent material and time (JENNY 1941). Early models of soil formation were static and implied that soil development under constant environmental factors will over long time periods lead towards a state of soil maturity (cf. GERRARD 1992). Later models go further and take processes as well as soil forming factors into account. SIMONSON (1978) distinguishes four major actors: additions, removals, translocations and transformations (e.g. addition of water, radiation, organic matter; losses of elements by leaching, water by evapotranspiration or drainage; translocations via clay elluviation, podsolization or nutrient cycling; transformations by weathering, humification or the formation of secondary minerals). These processes do no only act on the soil pedon scale, but are active on a landscape scale. Simonson´s model puts the single pedon into a dynamic spatial relationship with the surrounding soil complex to which it is intrinsically linked by translocations.
The abstract framework of soil formation and the linkage of soil development across different landscape positions by element removal and addition has been accurately described by MILNE (1935, 1936b). His classic catena approach illustrates the spatial differentiation of soil types along a slope gradient as a function of topography and drainage acting through differential translocation of soil material to create a characteristic sequence of soil types (Fig. 9).
Starting on an eroded hillock, the skeletal soil gradual turns into deeply weathered soil on the pediment. Soil erosion maintains shallow Leptosols on ridges and hill slopes (1, Fig. 9), whereas on the
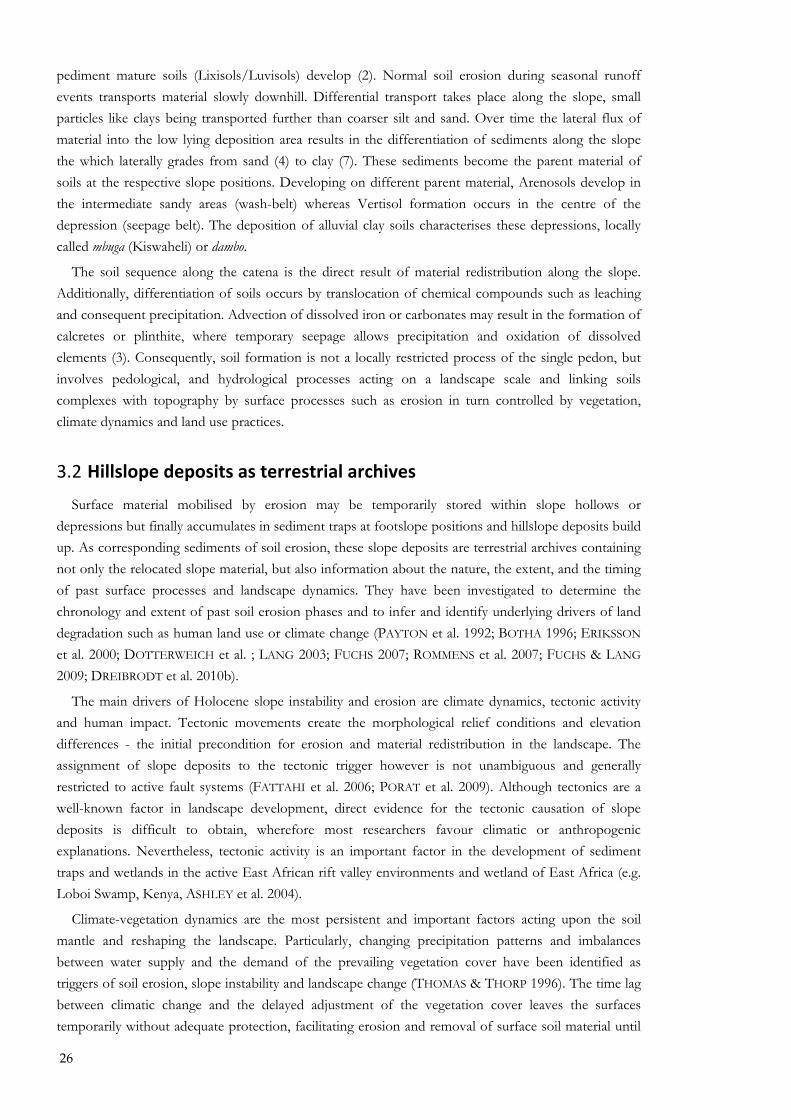
26
pediment mature soils (Lixisols/Luvisols) develop (2). Normal soil erosion during seasonal runoff events transports material slowly downhill. Differential transport takes place along the slope, small particles like clays being transported further than coarser silt and sand. Over time the lateral flux of material into the low lying deposition area results in the differentiation of sediments along the slope the which laterally grades from sand (4) to clay (7). These sediments become the parent material of soils at the respective slope positions. Developing on different parent material, Arenosols develop in the intermediate sandy areas (wash-belt) whereas Vertisol formation occurs in the centre of the depression (seepage belt). The deposition of alluvial clay soils characterises these depressions, locally called mbuga (Kiswaheli) or dambo.
The soil sequence along the catena is the direct result of material redistribution along the slope. Additionally, differentiation of soils occurs by translocation of chemical compounds such as leaching and consequent precipitation. Advection of dissolved iron or carbonates may result in the formation of calcretes or plinthite, where temporary seepage allows precipitation and oxidation of dissolved elements (3). Consequently, soil formation is not a locally restricted process of the single pedon, but involves pedological, and hydrological processes acting on a landscape scale and linking soils complexes with topography by surface processes such as erosion in turn controlled by vegetation, climate dynamics and land use practices.
3.2 Hillslope deposits as terrestrial archives Surface material mobilised by erosion may be temporarily stored within slope hollows or
depressions but finally accumulates in sediment traps at footslope positions and hillslope deposits build up. As corresponding sediments of soil erosion, these slope deposits are terrestrial archives containing not only the relocated slope material, but also information about the nature, the extent, and the timing of past surface processes and landscape dynamics. They have been investigated to determine the chronology and extent of past soil erosion phases and to infer and identify underlying drivers of land degradation such as human land use or climate change (PAYTON et al. 1992; BOTHA 1996; ERIKSSON et al. 2000; DOTTERWEICH et al. ; LANG 2003; FUCHS 2007; ROMMENS et al. 2007; FUCHS & LANG 2009; DREIBRODT et al. 2010b).
The main drivers of Holocene slope instability and erosion are climate dynamics, tectonic activity and human impact. Tectonic movements create the morphological relief conditions and elevation differences - the initial precondition for erosion and material redistribution in the landscape. The assignment of slope deposits to the tectonic trigger however is not unambiguous and generally restricted to active fault systems (FATTAHI et al. 2006; PORAT et al. 2009). Although tectonics are a well-known factor in landscape development, direct evidence for the tectonic causation of slope deposits is difficult to obtain, wherefore most researchers favour climatic or anthropogenic explanations. Nevertheless, tectonic activity is an important factor in the development of sediment traps and wetlands in the active East African rift valley environments and wetland of East Africa (e.g. Loboi Swamp, Kenya, ASHLEY et al. 2004).
Climate-vegetation dynamics are the most persistent and important factors acting upon the soil mantle and reshaping the landscape. Particularly, changing precipitation patterns and imbalances between water supply and the demand of the prevailing vegetation cover have been identified as triggers of soil erosion, slope instability and landscape change (THOMAS & THORP 1996). The time lag between climatic change and the delayed adjustment of the vegetation cover leaves the surfaces temporarily without adequate protection, facilitating erosion and removal of surface soil material until
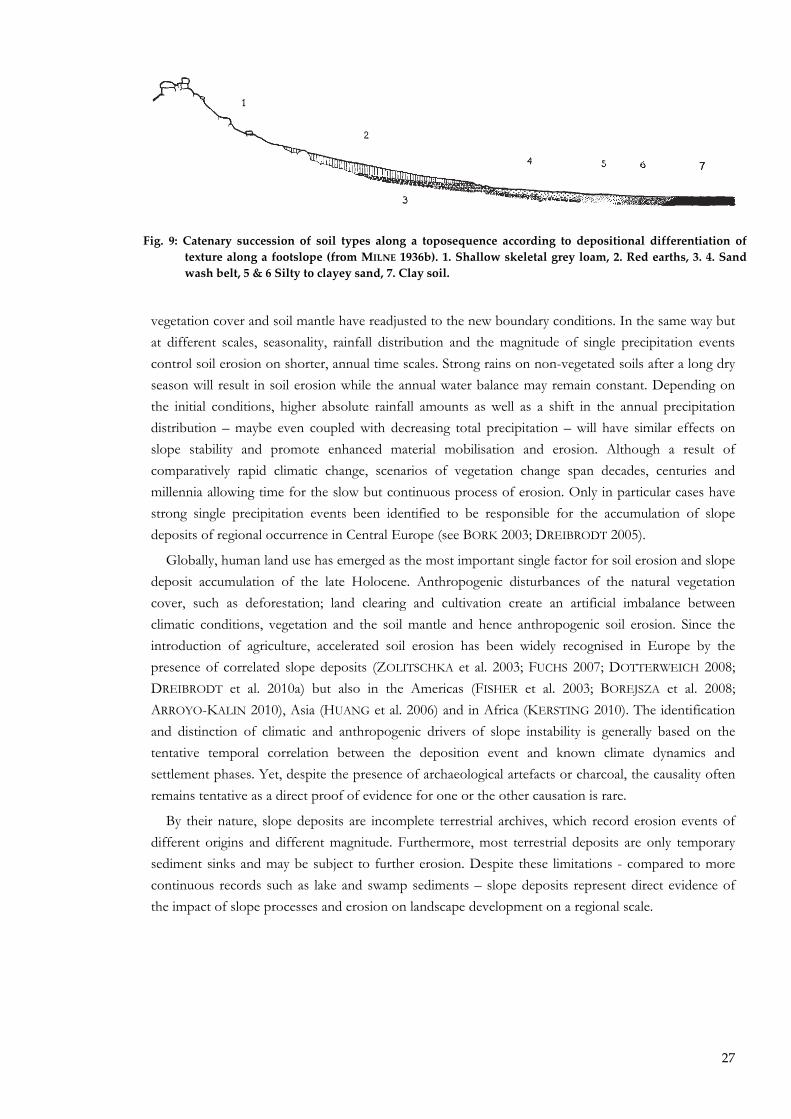
27
vegetation cover and soil mantle have readjusted to the new boundary conditions. In the same way but at different scales, seasonality, rainfall distribution and the magnitude of single precipitation events control soil erosion on shorter, annual time scales. Strong rains on non-vegetated soils after a long dry season will result in soil erosion while the annual water balance may remain constant. Depending on the initial conditions, higher absolute rainfall amounts as well as a shift in the annual precipitation distribution � maybe even coupled with decreasing total precipitation � will have similar effects on slope stability and promote enhanced material mobilisation and erosion. Although a result of comparatively rapid climatic change, scenarios of vegetation change span decades, centuries and millennia allowing time for the slow but continuous process of erosion. Only in particular cases have strong single precipitation events been identified to be responsible for the accumulation of slope deposits of regional occurrence in Central Europe (see BORK 2003; DREIBRODT 2005).
Globally, human land use has emerged as the most important single factor for soil erosion and slope deposit accumulation of the late Holocene. Anthropogenic disturbances of the natural vegetation cover, such as deforestation; land clearing and cultivation create an artificial imbalance between climatic conditions, vegetation and the soil mantle and hence anthropogenic soil erosion. Since the introduction of agriculture, accelerated soil erosion has been widely recognised in Europe by the presence of correlated slope deposits (ZOLITSCHKA et al. 2003; FUCHS 2007; DOTTERWEICH 2008; DREIBRODT et al. 2010a) but also in the Americas (FISHER et al. 2003; BOREJSZA et al. 2008; ARROYO-KALIN 2010), Asia (HUANG et al. 2006) and in Africa (KERSTING 2010). The identification and distinction of climatic and anthropogenic drivers of slope instability is generally based on the tentative temporal correlation between the deposition event and known climate dynamics and settlement phases. Yet, despite the presence of archaeological artefacts or charcoal, the causality often remains tentative as a direct proof of evidence for one or the other causation is rare.
By their nature, slope deposits are incomplete terrestrial archives, which record erosion events of different origins and different magnitude. Furthermore, most terrestrial deposits are only temporary sediment sinks and may be subject to further erosion. Despite these limitations - compared to more continuous records such as lake and swamp sediments � slope deposits represent direct evidence of the impact of slope processes and erosion on landscape development on a regional scale.
Fig. 9: Catenary succession of soil types along a toposequence according to depositional differentiation of texture along a footslope (from MILNE 1936b). 1. Shallow skeletal grey loam, 2. Red earths, 3. 4. Sand wash belt, 5 & 6 Silty to clayey sand, 7. Clay soil.
28
3.3 Soil erosion and land degradation
3.3.1 Erosion
Erosion (from Latin �erodere� which means literally �eating away�) is the physical removal of soil material by different agents like water, wind, and gravity. The first stage of erosion is the detachment of soil particles from the surface, followed by entrainment and transport of material and finally deposition or sedimentation, when transport conditions cease. The term erosion applies in the first instance to local processes of surface wasting, whereas large-scale lowering of the relief is referred to as denudation.4
The most important erosive agent in mountain regions such as North Pare is water and the related processes of sheet, rill and gully erosion. Wind erosion has not been reported to be an important agent in contemporary East African environments. Deflation might be of considerable local importance in sparsely vegetated lowland plains, especially during dry periods without a permanent vegetation cover. Rapid mass movements like landslides, slumps, rockfall or mud flows are the most conspicuous signs of mass wasting and common in mountainous tropical areas (THOMAS 1994). The occurrence of rapid and large mass wasting events is restricted to predestined slopes with favouring geological bedding, subsurface water convergence and is generally triggered by high-magnitude storms (WESTERBERG & CHRISTIANSSON 1999). Although the amount of material relocated by rapid mass movements shows they are major geomorphic agents in landscape development they generally refer to single mass wasting event with a locally restricted distribution.
Small-scale erosional processes on the other hand show a uniform distribution and are more likely to provide information about regional environmental conditions. Slow gravitational processes like soil creep, for example, have strongly shaped the relief of the subhumid regions of Uganda during the early Holocene (MOEYERSONS 1988). These slow erosion processes comprise gravitational soil creep, precipitation induced splash creep and splash erosion, and by the action of flowing water laminar sheet wash. The laminar overland flow soon concentrates in concavities and results in linear erosion processes such as rill erosion eventually leading to the formation of ravines and gullies. Whereas mass wasting by laminar processes might proceed unnoticed, the rapid incision and spread of rills and gullies is the most visible hint of enhanced soil erosion. For agricultural fields in the Uluguru highlands KIMARO (2008) showed that rill erosion contributes about 70% to the total soil loss, whereas interrill erosion accounts for the remaining 30%.
The term �soil erosion� was originally coined to describe erosion on cultivated land and is used to differentiate anthropogenically induced, accelerated forms of erosion (accelerated mobilisation, transport and deposition) from �normal� background erosion. With the disappearance of �virgin�, anthropogenically uninfluenced environments, a distinction between normal or natural erosion and anthropogenic accelerated soil erosion has become unfeasible.
Soil erosion in the broader sense also includes tillage erosion. Tillage erosion is the mechanical transport of soil downslope by agricultural tools and gravity (LINDSTROM et al. 1992; VAN OOST et al. 2006). Similar to soil erosion by natural processes, translocation and loss of soil material is highest on convex slopes with high slope angles, whereas accumulation of tilled material occurs in concave
4 The word pair is used with somehow different connotations in other languages, in the German usage for example erosion refers to linear mass wasting in rills or gullies and contrasts with denudation corresponding to laminar forms of erosion like sheet wash (AHNERT 1999)
29
hollows. The effects of tillage erosion become visible in a landscape dissected by pronounced field boundaries, which act as barriers and interrupt soil flux along the slope. Loss of material and truncation of soils occurs on the upper end of a field, whereas - given a physical barrier - tilled soil accumulates in colluvial deposits at the lower slope of the cultivated field. A soil bank grows and lynchets develop. Where field boundaries are physical barriers - like contour bands, or hedgerows - tillage results in the formation of progressive terraces (NYSSEN et al. 2000; VAN OOST et al. 2006; BÖRJESON 2007).
Soil and water conservation programs to fight soil erosion and land degradation have been widely promoted; their success however is often ambivalent and critically contested (cf. chapter 10.5). Whereas stories of success state that �rural society is now well on the way to control and reverse the degradation processes� such as the conclusion from an integrated soil conservation program at May Zegzeg in Ethiopia (NYSSEN ET AL. 2009), other scholars take a critical look on development programs concerning soil conservation and land degradation, particularly when the adopted measures are not fully accepted by the local communities (e.g. ÖSTBERG 1986; MBEGU 1996; OGLE 2001; LANE 2009).
3.3.2 Land degradation
Land degradation describes a variety of human-induced processes resulting in the decline of the capability of the land to produce goods and services. (BIOT et al. 1992; BIOT 1995; KINLUND 1996), soil erosion being the most visible and one of the most important processes (PIMENTEL et al. 1995; MONTGOMERY 2007). In general, the term is restricted to human-induced land degradation, the consequence of unsustainable land use such as ressource overexploitation, overgrazing or deforestation. Degradation goes along with a loss of biodiversity and vegetation change and finally results in the loss of soil fertility by processes such as the removal of fertile topsoil by water and wind erosion, the decline of water storage capacity, soil compactation, and siltation as well as chemical degradation such as salinization and the gradual loss of nutrients (DAHLBERG 1994).
Land degradation is a serious threat to agricultural productivity and the wellbeing of societies and has prompted the implementation of soil conservation schemes all over the world. Despite its serious implications, controversial debates exist on the local scale, questioning land degradation itself, the anthropogenic impact, and the causality chain of degradation for specific environments. The evaluation and analysis of land degradation, its severity, extent, and particularly the identification of the responsible causes and mechanisms are complicated by the complex interactions of environmental and climatic factors and the economic, socioeconomic and cultural framework (for examples see JONES 1996; BROCKINGTON & HOMEWOOD 2001; GILLSON et al. 2003; SHOWERS 2005).
Whereas traditional interpretation patterns have stressed the Malthusian theory of population growth triggering overexploitation, this simple explanatory model has been contested by the Boserupean theorem, that population growth stimulates agricultural intensification and the implementation of sophisticated and sustainable cultivation systems (cf. chapter 4.6.1). Similarly, poverty per se has been suspected to be a main driver of environmental degradation. However, a number of other important factors control the individual decisions of people such as the socioeconomic framework, land tenure, cultural standards, as well as the fluctuation of prices on the global market (KINLUND 1996).
Discerning human-induced land degradation from environmental dynamics is particularly difficult in semiarid environments, where agriculturally sustainable crop production and the carrying capacity of livestock fluctuate according to the spatial and temporal variability of the climatic conditions. It is in
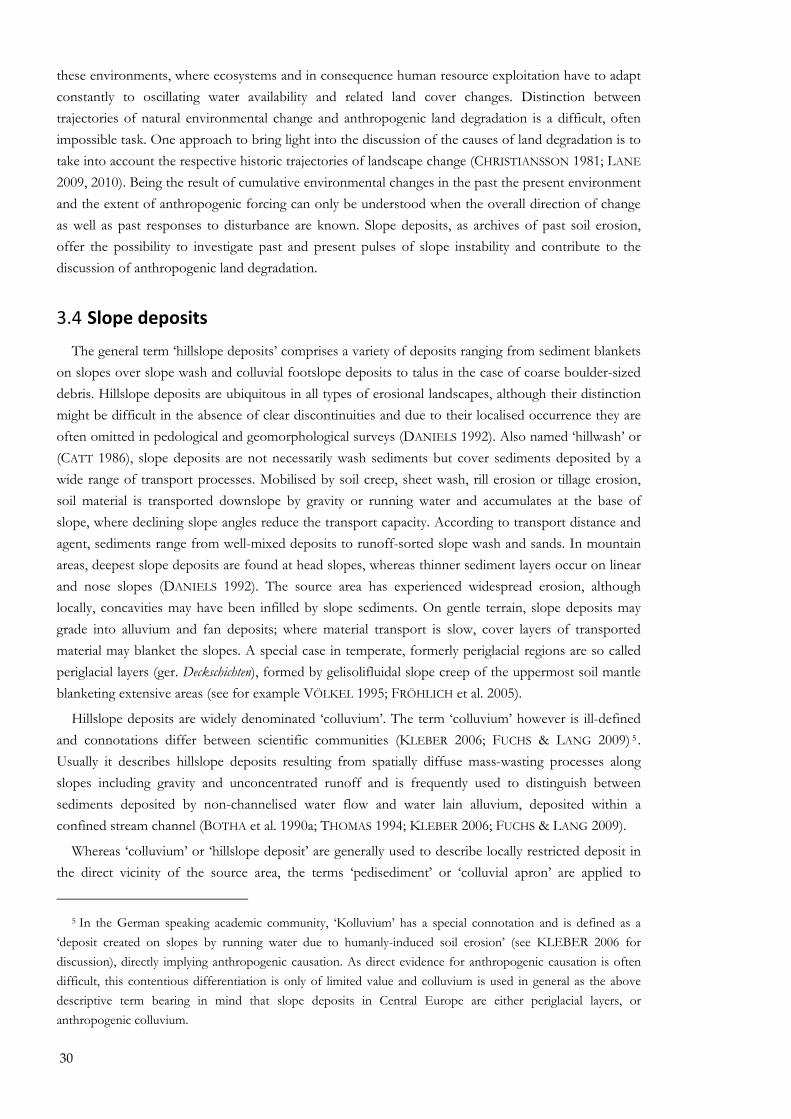
30
these environments, where ecosystems and in consequence human resource exploitation have to adapt constantly to oscillating water availability and related land cover changes. Distinction between trajectories of natural environmental change and anthropogenic land degradation is a difficult, often impossible task. One approach to bring light into the discussion of the causes of land degradation is to take into account the respective historic trajectories of landscape change (CHRISTIANSSON 1981; LANE 2009, 2010). Being the result of cumulative environmental changes in the past the present environment and the extent of anthropogenic forcing can only be understood when the overall direction of change as well as past responses to disturbance are known. Slope deposits, as archives of past soil erosion, offer the possibility to investigate past and present pulses of slope instability and contribute to the discussion of anthropogenic land degradation.
3.4 Slope deposits The general term �hillslope deposits� comprises a variety of deposits ranging from sediment blankets
on slopes over slope wash and colluvial footslope deposits to talus in the case of coarse boulder-sized debris. Hillslope deposits are ubiquitous in all types of erosional landscapes, although their distinction might be difficult in the absence of clear discontinuities and due to their localised occurrence they are often omitted in pedological and geomorphological surveys (DANIELS 1992). Also named �hillwash� or (CATT 1986), slope deposits are not necessarily wash sediments but cover sediments deposited by a wide range of transport processes. Mobilised by soil creep, sheet wash, rill erosion or tillage erosion, soil material is transported downslope by gravity or running water and accumulates at the base of slope, where declining slope angles reduce the transport capacity. According to transport distance and agent, sediments range from well-mixed deposits to runoff-sorted slope wash and sands. In mountain areas, deepest slope deposits are found at head slopes, whereas thinner sediment layers occur on linear and nose slopes (DANIELS 1992). The source area has experienced widespread erosion, although locally, concavities may have been infilled by slope sediments. On gentle terrain, slope deposits may grade into alluvium and fan deposits; where material transport is slow, cover layers of transported material may blanket the slopes. A special case in temperate, formerly periglacial regions are so called periglacial layers (ger. Deckschichten), formed by gelisolifluidal slope creep of the uppermost soil mantle blanketing extensive areas (see for example VÖLKEL 1995; FRÖHLICH et al. 2005).
Hillslope deposits are widely denominated �colluvium�. The term �colluvium� however is ill-defined and connotations differ between scientific communities (KLEBER 2006; FUCHS & LANG 2009) 5 . Usually it describes hillslope deposits resulting from spatially diffuse mass-wasting processes along slopes including gravity and unconcentrated runoff and is frequently used to distinguish between sediments deposited by non-channelised water flow and water lain alluvium, deposited within a confined stream channel (BOTHA et al. 1990a; THOMAS 1994; KLEBER 2006; FUCHS & LANG 2009).
Whereas �colluvium� or �hillslope deposit� are generally used to describe locally restricted deposit in the direct vicinity of the source area, the terms �pedisediment� or �colluvial apron� are applied to
5 In the German speaking academic community, �Kolluvium� has a special connotation and is defined as a
�deposit created on slopes by running water due to humanly-induced soil erosion� (see KLEBER 2006 for discussion), directly implying anthropogenic causation. As direct evidence for anthropogenic causation is often difficult, this contentious differentiation is only of limited value and colluvium is used in general as the above descriptive term bearing in mind that slope deposits in Central Europe are either periglacial layers, or anthropogenic colluvium.
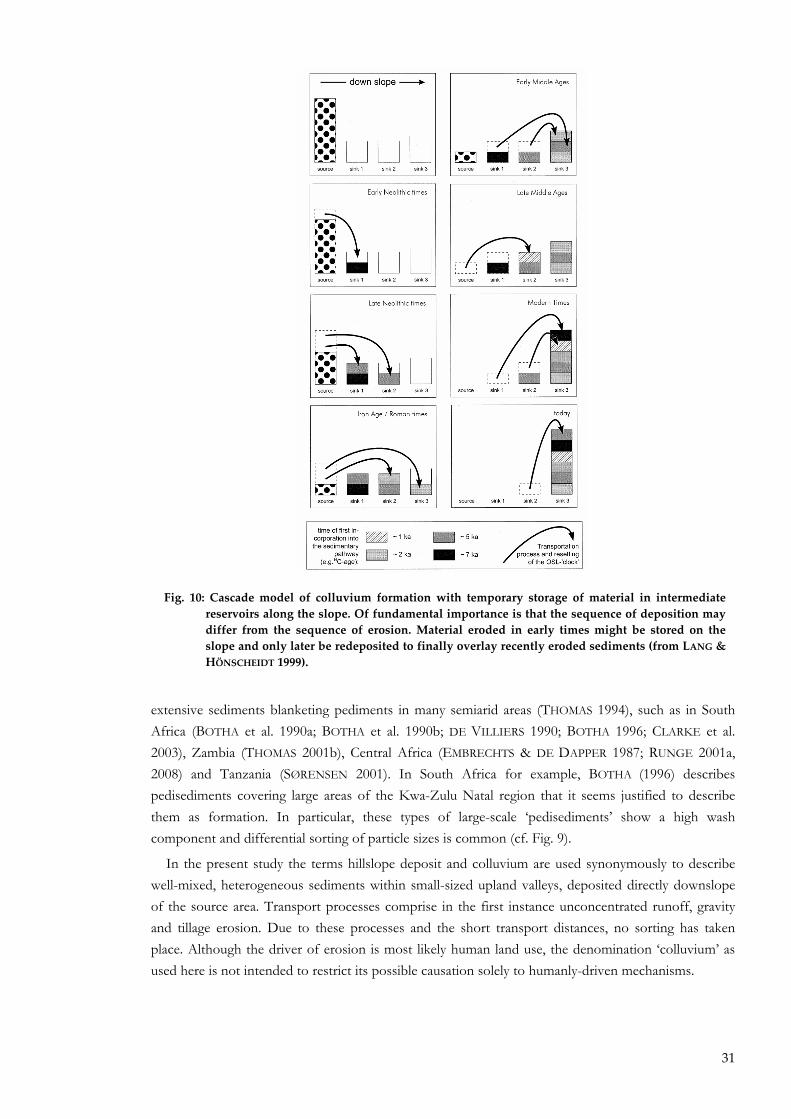
31
extensive sediments blanketing pediments in many semiarid areas (THOMAS 1994), such as in South Africa (BOTHA et al. 1990a; BOTHA et al. 1990b; DE VILLIERS 1990; BOTHA 1996; CLARKE et al. 2003), Zambia (THOMAS 2001b), Central Africa (EMBRECHTS & DE DAPPER 1987; RUNGE 2001a, 2008) and Tanzania (SØRENSEN 2001). In South Africa for example, BOTHA (1996) describes pedisediments covering large areas of the Kwa-Zulu Natal region that it seems justified to describe them as formation. In particular, these types of large-scale �pedisediments� show a high wash component and differential sorting of particle sizes is common (cf. Fig. 9).
In the present study the terms hillslope deposit and colluvium are used synonymously to describe well-mixed, heterogeneous sediments within small-sized upland valleys, deposited directly downslope of the source area. Transport processes comprise in the first instance unconcentrated runoff, gravity and tillage erosion. Due to these processes and the short transport distances, no sorting has taken place. Although the driver of erosion is most likely human land use, the denomination �colluvium� as used here is not intended to restrict its possible causation solely to humanly-driven mechanisms.
Fig. 10: Cascade model of colluvium formation with temporary storage of material in intermediate reservoirs along the slope. Of fundamental importance is that the sequence of deposition may differ from the sequence of erosion. Material eroded in early times might be stored on the slope and only later be redeposited to finally overlay recently eroded sediments (from LANG & HÖNSCHEIDT 1999).
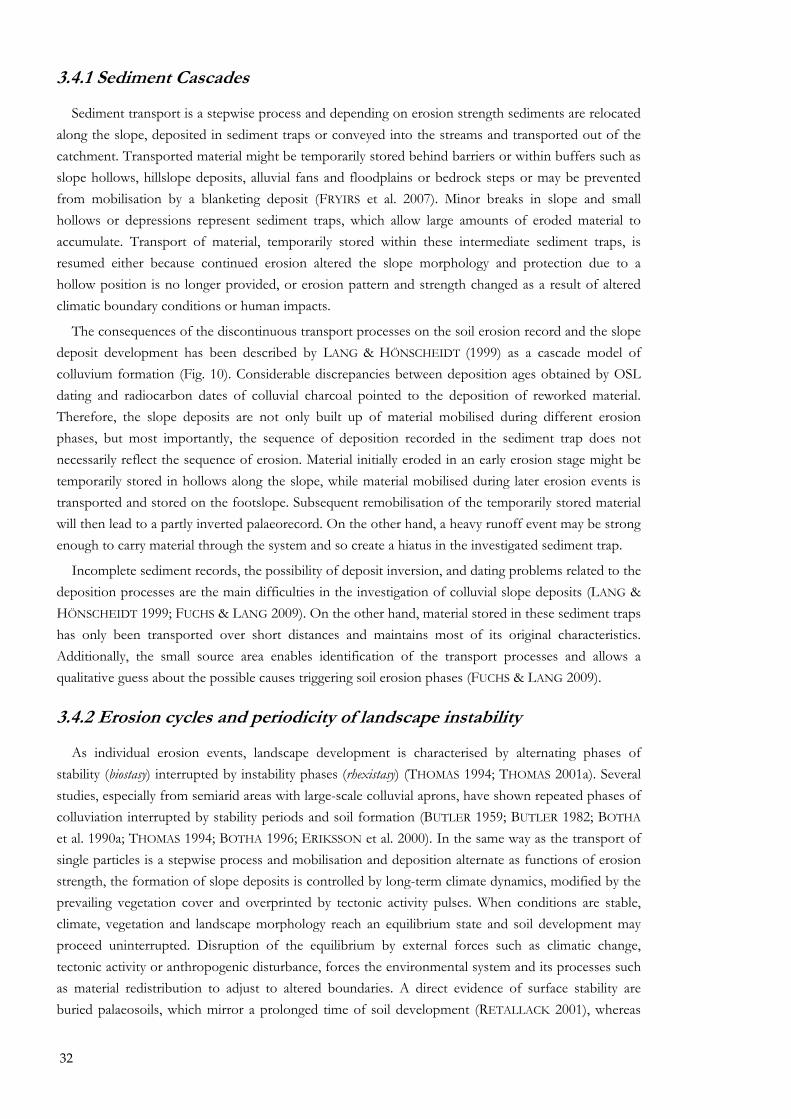
32
3.4.1 Sediment Cascades
Sediment transport is a stepwise process and depending on erosion strength sediments are relocated along the slope, deposited in sediment traps or conveyed into the streams and transported out of the catchment. Transported material might be temporarily stored behind barriers or within buffers such as slope hollows, hillslope deposits, alluvial fans and floodplains or bedrock steps or may be prevented from mobilisation by a blanketing deposit (FRYIRS et al. 2007). Minor breaks in slope and small hollows or depressions represent sediment traps, which allow large amounts of eroded material to accumulate. Transport of material, temporarily stored within these intermediate sediment traps, is resumed either because continued erosion altered the slope morphology and protection due to a hollow position is no longer provided, or erosion pattern and strength changed as a result of altered climatic boundary conditions or human impacts.
The consequences of the discontinuous transport processes on the soil erosion record and the slope deposit development has been described by LANG & HÖNSCHEIDT (1999) as a cascade model of colluvium formation (Fig. 10). Considerable discrepancies between deposition ages obtained by OSL dating and radiocarbon dates of colluvial charcoal pointed to the deposition of reworked material. Therefore, the slope deposits are not only built up of material mobilised during different erosion phases, but most importantly, the sequence of deposition recorded in the sediment trap does not necessarily reflect the sequence of erosion. Material initially eroded in an early erosion stage might be temporarily stored in hollows along the slope, while material mobilised during later erosion events is transported and stored on the footslope. Subsequent remobilisation of the temporarily stored material will then lead to a partly inverted palaeorecord. On the other hand, a heavy runoff event may be strong enough to carry material through the system and so create a hiatus in the investigated sediment trap.
Incomplete sediment records, the possibility of deposit inversion, and dating problems related to the deposition processes are the main difficulties in the investigation of colluvial slope deposits (LANG & HÖNSCHEIDT 1999; FUCHS & LANG 2009). On the other hand, material stored in these sediment traps has only been transported over short distances and maintains most of its original characteristics. Additionally, the small source area enables identification of the transport processes and allows a qualitative guess about the possible causes triggering soil erosion phases (FUCHS & LANG 2009).
3.4.2 Erosion cycles and periodicity of landscape instability
As individual erosion events, landscape development is characterised by alternating phases of stability (biostasy) interrupted by instability phases (rhexistasy) (THOMAS 1994; THOMAS 2001a). Several studies, especially from semiarid areas with large-scale colluvial aprons, have shown repeated phases of colluviation interrupted by stability periods and soil formation (BUTLER 1959; BUTLER 1982; BOTHA et al. 1990a; THOMAS 1994; BOTHA 1996; ERIKSSON et al. 2000). In the same way as the transport of single particles is a stepwise process and mobilisation and deposition alternate as functions of erosion strength, the formation of slope deposits is controlled by long-term climate dynamics, modified by the prevailing vegetation cover and overprinted by tectonic activity pulses. When conditions are stable, climate, vegetation and landscape morphology reach an equilibrium state and soil development may proceed uninterrupted. Disruption of the equilibrium by external forces such as climatic change, tectonic activity or anthropogenic disturbance, forces the environmental system and its processes such as material redistribution to adjust to altered boundaries. A direct evidence of surface stability are buried palaeosoils, which mirror a prolonged time of soil development (RETALLACK 2001), whereas
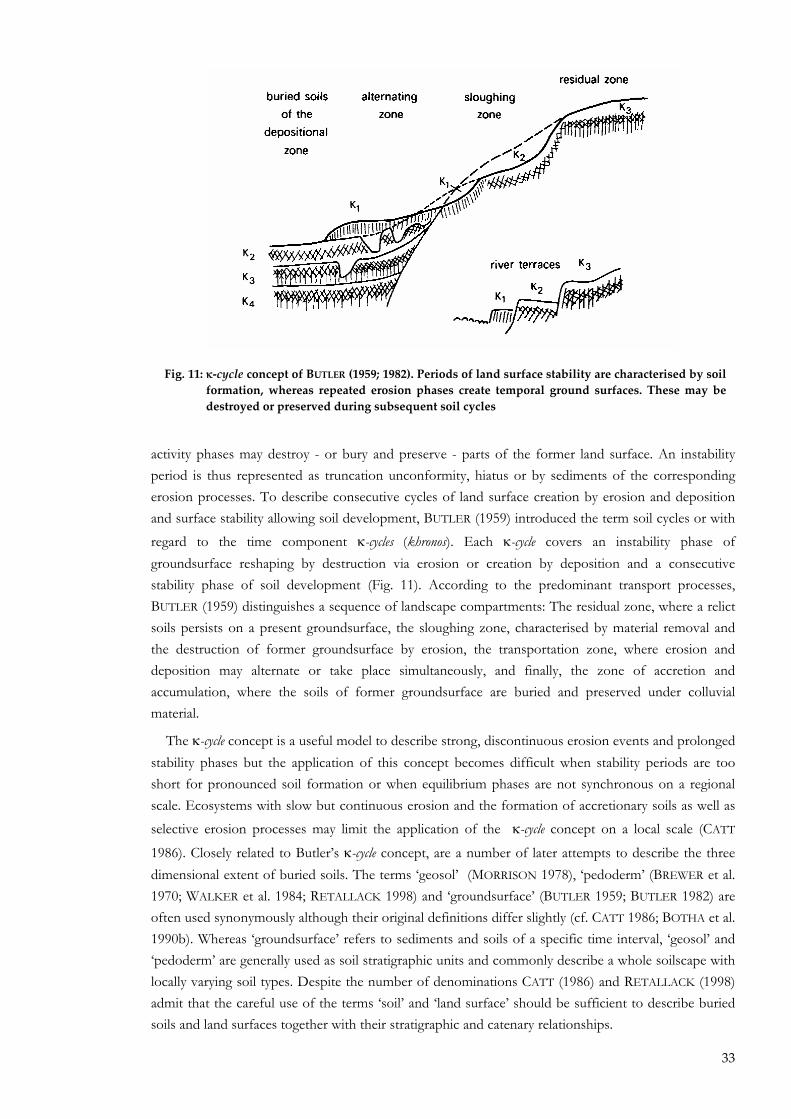
33
activity phases may destroy - or bury and preserve - parts of the former land surface. An instability period is thus represented as truncation unconformity, hiatus or by sediments of the corresponding erosion processes. To describe consecutive cycles of land surface creation by erosion and deposition and surface stability allowing soil development, BUTLER (1959) introduced the term soil cycles or with regard to the time component κ-cycles (khronos). Each κ-cycle covers an instability phase of groundsurface reshaping by destruction via erosion or creation by deposition and a consecutive stability phase of soil development (Fig. 11). According to the predominant transport processes, BUTLER (1959) distinguishes a sequence of landscape compartments: The residual zone, where a relict soils persists on a present groundsurface, the sloughing zone, characterised by material removal and the destruction of former groundsurface by erosion, the transportation zone, where erosion and deposition may alternate or take place simultaneously, and finally, the zone of accretion and accumulation, where the soils of former groundsurface are buried and preserved under colluvial material.
The κ-cycle concept is a useful model to describe strong, discontinuous erosion events and prolonged stability phases but the application of this concept becomes difficult when stability periods are too short for pronounced soil formation or when equilibrium phases are not synchronous on a regional scale. Ecosystems with slow but continuous erosion and the formation of accretionary soils as well as selective erosion processes may limit the application of the κ-cycle concept on a local scale (CATT
1986). Closely related to Butler�s κ-cycle concept, are a number of later attempts to describe the three dimensional extent of buried soils. The terms �geosol� (MORRISON 1978), �pedoderm� (BREWER et al. 1970; WALKER et al. 1984; RETALLACK 1998) and �groundsurface� (BUTLER 1959; BUTLER 1982) are often used synonymously although their original definitions differ slightly (cf. CATT 1986; BOTHA et al. 1990b). Whereas �groundsurface� refers to sediments and soils of a specific time interval, �geosol� and �pedoderm� are generally used as soil stratigraphic units and commonly describe a whole soilscape with locally varying soil types. Despite the number of denominations CATT (1986) and RETALLACK (1998) admit that the careful use of the terms �soil� and �land surface� should be sufficient to describe buried soils and land surfaces together with their stratigraphic and catenary relationships.
Fig. 11: κ‐cycle concept of BUTLER (1959; 1982). Periods of land surface stability are characterised by soil formation, whereas repeated erosion phases create temporal ground surfaces. These may be destroyed or preserved during subsequent soil cycles
34
The formation of extensive pedisediments is likely linked to the cyclicity of long-term climatic dynamics or sporadic tectonic activity. Although ice-, ocean- and lake-cores have allowed the reconstruction of African climate dynamics over much of the Quaternary (GASSE 2000; GASSE 2006; GASSE et al. 2008), the fragmentary terrestrial record and problematic dating control has so far hampered the establishment of a chronology of morphological change in the tropics (THOMAS & THORP 1995; THOMAS 2000).
Some insights can be gained from regional studies, however. For instance, a series of studies have investigated hillslope deposits on the South African Highveld in KwaZulu-Natal (BOTHA et al. 1990a; BOTHA et al. 1990b; BOTHA et al. 1994; BOTHA 1996; CLARKE et al. 2003; TOOTH et al. 2004; TEMME et al. 2008). Widespread slope deposits (the so called Matsocheni formation) cover waste areas of KwaZulu-Natal and is dissected by numerous gullies. A focus of the work undertaken by BOTHA (BOTHA et al. 1990a; BOTHA et al. 1994; BOTHA & FEDOROFF 1995) has been the stratigraphic subdivision of the Masotcheni formation with the add of intercalated palaeosols indicating stability phases and the deposition of distinct colluvial deposits. The slope deposits are homogeneous from a lithostratigraphic point of view and breaks in sedimentation are only seen by buried soils or stone lines representing marked stability phases. BOTHA (1990a; 1996) showed that the Highveld landscape has been formed by repeated cycles of erosion and stability. The age of these Late Pleistocene colluvial deposits range from 100 ka BP to the Holocene (CLARKE et al. 2003; TEMME et al. 2008). CLARKE et al. (2003) linked the colluviation and correspondent erosion to arid periods as reflected by the rainfall record of the Pretoria Salt Pan (PARTRIDGE et al. 1997), whereas formation of palaeosols took place during periods of higher precipitation and a denser vegetation cover. The most important erosion phases are dated to before 100 ka BP, around 55 ka BP, during the LGM around 22 ka BP and in the Holocene since 13 ka BP (CLARKE et al. 2003; TEMME et al. 2008).
3.5 Landscape change in Eastern Africa Hillslope deposits have been investigated widely in Central Europe (DOTTERWEICH et al. 2002;
BORK 2003; LANG 2003; ROMMENS et al. 2007; DOTTERWEICH 2008; FUCHS & LANG 2009; DREIBRODT et al. 2010b; DREIBRODT et al. 2010a) and the Mediterranean (BUTZER 2005; FUCHS 2007), where they generally are interpreted as evidence for human-induced erosion and landscape change. Elsewhere natural processes like climate dynamics have been identified as drivers of colluviation and human impact plays a secondary role (THOMAS 2001b; CLARKE et al. 2003; DE
OLIVEIRA et al. 2008a; DE OLIVEIRA et al. 2008b; TEMME et al. 2008). In Africa, slope deposits have been subject to investigation since early geographical reconnaissance studies e.g. by MILNE (1936b, 1947), however due to the difficulty of accurate dating and the local variance of terrestrial archives, environmental and palaeoclimatic reconstruction so far have focused mainly on lake, swamp and ice core records.
Hillsope deposits investigated in the semi-humid to semi-arid highland areas of tropical East Africa date � with a few exceptions (RUNGE 2001a; SØRENSEN 2001; THOMAS 2001b) � to the Holocene and in the majority of studies anthropogenic causes are suggested (MÄCKEL 1992; ERIKSSON et al. 2000; KERSTING 2010). Valley infills and slope deposits of the Rwandan and Ugandan highlands are the best studied. Here, a rolling hill landscape has developed on an uplifted etchplain of the African surface, characterised by bas-fonds, tropical valley bottoms assumed to have resulted from dambo destruction by channel incision and valley widening (RAUNET 1985; KERSTING 2010). Hills of convex morphology (demi-orange) alter with bas-fonds, flat tropical valley bottoms, which act as sediment traps and only
35
recently experience dissection by active gullying. Detailed research on slope forming processes, soil erosion, deep-seated slope creep and landslides has been carried out by MOEYERSONS (1991, 2001, 2003) on the Butare plateau in Rwanda. Creep lobes frequently overlie gravel layer of possibly LGM age suggestive of valley widening by incision and erosion (MOEYERSONS 2001). The creep lobes, led MOEYERSONS (2001) to propose that deep-seated long-term slope creep and slow earth flow processes during the wet early Holocene have maintained and accentuated the convex morphology of the Rwandan hill and valley country. The slow creep and flow was favoured by high soil moisture and low surface erosion and resulted in the narrowing and probably the local damming of valleys. Deep-seated slope creep ceased, when climate conditions became drier or more seasonal during the mid-Holocene (since ca. 5000 BP), and a more accentuated rainfall regime triggered soil erosion and the deposition of colluvial sediments in the valleys. Slow aggradation and hillwash deposition is recorded at Rwaza Hill throughout the late Holocene only interrupted by two stability phases characterised by peat growth around 3000 and 1800 BP (GRUNDERBEEK et al. 1984; MOEYERSONS 2001). At the Gaseke valley KERSTING (2010) describes ca 1500 year old colluvial valley fill over basal sands. Whereas the latter is assumed to relate to the strong seasonal climate during the mid-Holocene transition 3600 � 1800 BP, it is widely assumed, that the last phase of colluviation starting about 1800 - 1500 BP corresponds to the introduction of agro-pastoralist subsistence strategies and related forest clearing (GRUNDERBEEK et al. 1984; MOEYERSONS 2001; GRUNERT et al. 2004; KERSTING 2010).
Work on colluvial deposits in semi-arid northern Kenya was pioneered by MÄCKEL & WALTHER (1984) and MÄCKEL (1989, 1992). Several colluvial and fluvial sediment layers, buried soils and stone lines were dated. Within the region, radiocarbon ages from these sediments vary widely but are restricted (with few exceptions) to the Holocene. The dates fall into three broad clusters, the Early Holocene ~6,000 - 9,000 BP, between 3,000 - 4,000 BP and the last two millennia. In most areas a recent activity phase within the last millennium and probably linked to human land use is recorded (MÄCKEL 1989, 1992). Whereas during the early Holocene wet phase deep-seated slope creep and reduced soil erosion due to dense vegetation cover is assumed for the present day semi-humid Rwandan uplands, slope instability and the accumulation of slope wash deposits seem to have occurred at the same time in what is today semi-arid Northern Kenya. Thus, comparison of morphological and climatic change has to take into account the variability of regional climatic conditions and the respective vegetation cover.
On the volcanic mountains of Mt. Kenya and Mt. Kilimanjaro numerous buried soils are preserved and record past slope dynamics. On Mt. Kenya, palaeosols developed during interglacials and were buried during phases of slope activity and glacier advances. Besides buried soils dating to the mid-Quaternary glaciations, neoglacial advances are reported (MAHANEY & SLOWPOKE 1991; MAHANEY 1992). On Mt. Kilimanjaro, buried soils in the montane forest zone are interpreted to reflect shifts of vegetation belts and tree line fluctuations during the Late Pleistocene and the Holocene. Using n-alkanes and stable isotope analysis of soil organic matter ZECH (2006) has argued that during colder and wetter periods, the ericaceous vegetation belt extended and migrated down slope to altitudes as low as 2100m a.s.l. Topsoil formation and downslope expansion of ericaceous vegetation on the back of montane forest may have occurred around 7.2/7.6 ka cal BP as well as during the early Holocene wet period until about 10 ka cal BP. Furthermore, LGM and pre-LGM phases of tree line depression are reported from lower altitude soil profiles (ZECH 2006). Higher soil moisture due to lower temperatures or more precipitation is thought to be responsible for the development of these black, organic matter rich, ericaceous topsoils. However, burial of these topsoils by mineral material is not attributed to slope instability, instead inverted weathering profiles on the northern slopes of
36
Kilimanjaro are interpreted as having developed through a constant influx of Aeolian dust from exposed periglacial areas (ZECH et al. in press).
Research on lowland slope deposits in Tanzania developed out of the debates on soil erosion and land degradation and has been much more applied in character than most of the pedological and geomorphological work focusing mainly on the palaeoclimatic and palaeoecologic implications of colluvial deposits. Many regions of Tanzania such as Ugogo country (Dodoma District) and the Irangi hills (Kondoa District) in Central Tanzania, as well as the Pare Mountains - the research area of the present study - have been reported as severely degraded since their first visits by European travellers in the late 19th century (BURTON 1860; VON DER DECKEN 1869; STUHLMANN 1894). In Central Tanzania, soil erosion such as intensive sheet wash and rill erosion are widespread and the formation of deep gullies has converted former agricultural areas into badlands while eroding earlier slope deposits on the extensive hill pediments (CHRISTIANSSON 1981, 1986).
Soil erosion was recognised during the colonial era as a severe threat to the ecological and economic future of the affected areas, and the first soil conservations projects were implemented during the 1930s and 1940s (CHRISTIANSSON 1986). Whereas the severe consequences of soil erosion were realised early on and conservation measures were promoted soon afterwards, emphasise lay on reconnaissance and the theoretical understanding of slope processes. MILNE (1936a, b) discussed soil erosion and corresponding deposits as essential parts of geomorphological processes leading to substrate differentiation and the distribution of soil types along a toposequence, the so called catena. After independence in the 1970s, the early colonial soil conservation projects were followed up by the Tanzanian wide soil erosion research project DUSER (Dar-es-Salam/Uppsala Universities Soil Erosion Research Project) (RAPP 1972; RAPP et al. 1972a), which produced quantitative data on soil erosion processes at plot and landscape scales and �supported earlier qualitative judgements regarding land degradation� (CHRISTIANSSON 1992).
Research in the 1970s conducted by RAPP, TEMPLE and co-workers (RAPP et al. 1972b; TEMPLE 1972; TEMPLE & MURRAY-RUST 1972; TEMPLE & SUNDBORG 1972) focused on the process of soil erosion itself, the impact of differing agricultural techniques and soil conservation measures. Soil erosion was quantified on erosion plots or on catchment scale by reservoir sedimentation. Building on these earlier soil erosion studies CHRISTIANSEN (1981) investigated soil erosion and land degradation in Ugogo country around Dodoma. High soil erosion rates and strong land degradation to the extent of near desert like areas were observed and thus his study concludes with practical advice on soil conservation policies. Importantly, CHRISTIANSEN (1981) was one of the first researchers to draw from historical information on land use and Wagogo economy to explain past soil erosion and pre-20th-century gully formation. In particular, the local population concentration due to pressure from hostile neighbours and a high food and firewood demand during the heyday of the 19th-century caravan trade were identified as drivers of soil erosion and land degradation. The consideration of historicity in soil erosion research puts the observations of accelerated soil erosion and anthropogenic land degradation in context with concepts of long-term landscape and vegetation dynamics.
The results of the research project had influences on environmental protection politics in Central Tanzania. Between 1971 and 1979 a comprehensive soil and water conservation program - the HADO project (Hifadhi Ardhi Dodoma � Dodoma Region Soil Conservation Project) was established with special focus on the Irangi Hills of Kondoa. Again, scientific research on the exact and individual causes and circumstances of soil erosion only followed 20 years later. Building on former experiences and within the framework of conservation measures, the �Man-Land Interrelations in Semi-arid
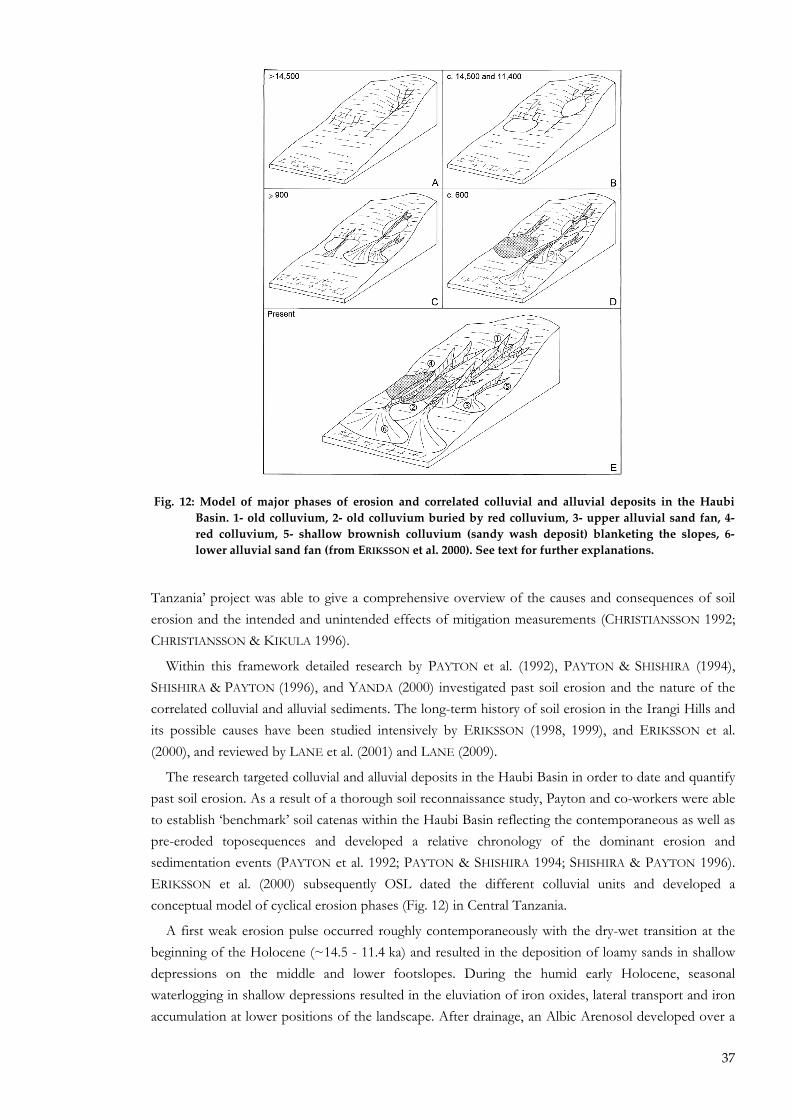
37
Tanzania� project was able to give a comprehensive overview of the causes and consequences of soil erosion and the intended and unintended effects of mitigation measurements (CHRISTIANSSON 1992; CHRISTIANSSON & KIKULA 1996).
Within this framework detailed research by PAYTON et al. (1992), PAYTON & SHISHIRA (1994), SHISHIRA & PAYTON (1996), and YANDA (2000) investigated past soil erosion and the nature of the correlated colluvial and alluvial sediments. The long-term history of soil erosion in the Irangi Hills and its possible causes have been studied intensively by ERIKSSON (1998, 1999), and ERIKSSON et al. (2000), and reviewed by LANE et al. (2001) and LANE (2009).
The research targeted colluvial and alluvial deposits in the Haubi Basin in order to date and quantify past soil erosion. As a result of a thorough soil reconnaissance study, Payton and co-workers were able to establish �benchmark� soil catenas within the Haubi Basin reflecting the contemporaneous as well as pre-eroded toposequences and developed a relative chronology of the dominant erosion and sedimentation events (PAYTON et al. 1992; PAYTON & SHISHIRA 1994; SHISHIRA & PAYTON 1996). ERIKSSON et al. (2000) subsequently OSL dated the different colluvial units and developed a conceptual model of cyclical erosion phases (Fig. 12) in Central Tanzania.
A first weak erosion pulse occurred roughly contemporaneously with the dry-wet transition at the beginning of the Holocene (~14.5 - 11.4 ka) and resulted in the deposition of loamy sands in shallow depressions on the middle and lower footslopes. During the humid early Holocene, seasonal waterlogging in shallow depressions resulted in the eluviation of iron oxides, lateral transport and iron accumulation at lower positions of the landscape. After drainage, an Albic Arenosol developed over a
Fig. 12: Model of major phases of erosion and correlated colluvial and alluvial deposits in the Haubi Basin. 1‐ old colluvium, 2‐ old colluvium buried by red colluvium, 3‐ upper alluvial sand fan, 4‐ red colluvium, 5‐ shallow brownish colluvium (sandy wash deposit) blanketing the slopes, 6‐ lower alluvial sand fan (from ERIKSSON et al. 2000). See text for further explanations.
38
hardened petroplinthic ironstone layer. The major period of erosion commenced before about 900 years BP, when incipient gully erosion resulted in the deposition of upper alluvial fan sediments. Accumulation of red colluvium with stratified quartz sands initiated about 600 years ago and suggests considerable transport by running water and reduced soil development as no B-horizon has developed. This late Holocene phase of soil erosion, which ultimately led to the extensive gullying observed today, has been linked to anthropogenic land use and the introduction of agriculture, domestic livestock and iron smelting (ERIKSSON et al. 2000). At present, all pediments are blanketed by a thin layer of recent brownish sandy wash deposit indicating the ongoing colluviation processes. Gully erosion on the other hand has resulted in deeply dissected badlands and the development of extensive alluvial fan deposits in the foreland.
The archaeological evidence has been investigated by LANE (2009), who discusses the possible causes of soil erosion beyond the general attribution to human impact. The archaeological survey revealed that most of the radiocarbon dated sites (16 out of 20) fall within the last millennium AD and only a few sites associated with iron smelting are recorded from the first half of the last millennium BC and around the begin of the Common Era (LANE 2009). The temporal correlation of the most recent erosion phases and settlement intensity strongly point to human land use as the main driver of soil erosion around 900 years ago. Lane stresses the need to take into account the interplay of different possible drivers of soil erosion such as climatic processes and anthropogenic development. During the most recent phase of soil erosion, severe gullying dissected the Irangi Hills and extensive lower sand fans developed. How far increasing population pressure and subsequent intensive human land use during phases of agricultural intensification stimulated by the 19th-century caravan trade, as discussed for Ugogo country and the Pare Mountains (CHRISTIANSSON 1981; BÖRJESON 2004; HÅKANSSON & WIDGREN 2007; HÅKANSSON 2008), contributed to intensify soil erosion in the Haubi area, remains unknown.
Finally, sediments of the Lake Haubi itself record soil erosion during the 20th century. Its conversion from a seasonal swamp to a lake around AD 1900 is attributed to the damming by alluvial sand fans � the direct result of gully erosion (ERIKSSON & CHRISTIANSSON 1997). Sedimentation rates of the accumulated lake sediments show a trend of increasing deposition reflecting advancing land degradation, whereas magnetic analysis seem to pick up alleviating periods of colonial soil conservation measures (ERIKSSON & SANDGREN 1999).
3.6 Summary
Hillslope deposits have been shown to be critical archives recording stability as well as periods of rapid landscape change. Directly linked to surface processes, most importantly soil erosion, hill slope deposits record long-term developments such as climatic transition but have emerged as particularly important when analysing the growing impact of human land use on the environment.
So far, several East African landscape studies agree that widespread enhancement of slope processes occurred during the Pleistocene - Holocene transition, when rapid climate shifts outpaced vegetation change. During the Holocene a number of locally distinct pulses of slope instability are recorded � most importantly disturbances related the mid-Holocene climatic transition. Evidence for slope instability increases during the last two millennia when anthropogenic land degradation becomes ubiquitous particularly during the last 1000 years. However, the patterns of slope dynamics vary regionally and point to a variable set of regional and local controls of slope processes. Despite the fast growing body of evidence for past climate dynamics and the establishment of palaeoclimate models,

39
the reconstruction of past landscape dynamics in East Africa is still in its infancy. The fragmentary nature of the terrestrial records and the locally distinct trajectories of landscape development warrant further investigations on a local basis as developed in this thesis, before a large-scale model of regional landscape can be constructed. Before turning to the results of this work, however, a brief summary of what is known of the later Holocene settlement history of the study area and wider region is called for.

40
41
4 THE HUMAN ENVIRONMENT
In the late Holocene, human land use has become the main driver of vegetation and landscape transformation. This chapter presents an archaeological and historical overview on changing subsistence strategies and land use in East Africa and particularly in the Pare Mountains.
East Africa has a long history of hominin occupation and played and important role in the development of early modern humans (BARHAM & MITCHELL 2008). The morphological and ecological diversity of the East African Rift, its highlands, lakes and volcanoes is maintained and reshaped by recurrent tectonic activity and offered a diverse mosaic of environments and resources, which is thought to have facilitated and stimulated the human behaviour and development (BAILEY & KING 2011; BAILEY et al. 2011). On the other hand, there is much speculation about the impact of hominins, early modern humans and Stone Age hunter-gatherers on their environment and in particular the deliberate use of fire is discussed as having shaped vegetation patterns and landscape development not only on the African continent but also in view of the persistence and expansion of savannah landscapes (GOLDAMMER 1992; BIRD 1995; BOWMAN 2005; PAUSAS & KEELEY 2009). But only in the late Holocene can direct links between human land use, vegetation dynamics and landscape development be observed.
4.1 Early pastoralists and hunter‐gatherers An African particularity in the development of subsistence strategies is the adoption of domestic
animals before the domestication of indigenous African crops (MARSHALL & HILDEBRAND 2002). Around 7000 � 6700 BP caprines (sheep/goat) had been introduced from the Near East, whereas the exact timing of the introduction or the autochthonos domestication of cattle is still disputed (BLENCH & MACDONALD 2000; MARSHALL & HILDEBRAND 2002; GIFFORD-GONZALEZ 2005). The origin for the domestication of indigenous cereals like pearl millet (Pennisetum glaucum) but also Sorghum (Sorghum bicolor), African rice (Oryza glaberrima), yam (Dioscorea cayensis), and cow pea (Vigna unguiculata) probably occurred around 4000 BP in the West African grasslands (MARSHALL & HILDEBRAND 2002; MANNING et al. 2011). Domestication of the most important East African crops finger millet (Eleusine coracana), ensete (Ensete ventricosum), and tef (Eragrostis tef) took place not before the beginning of first millennium AD (MARSHALL & HILDEBRAND 2002 and references herein).
Southward expansion of pastoralists into East Africa is generally assumed to have coincided with the end of the African Humid Period around 4.5 - 4 ka BP (DEMENOCAL et al. 2000a). Manifested by the final desiccation of the Sahara, the southward retreat of the ITCZ during the mid-Holocene also resulted in drier conditions in East Africa, where aridity has been deduced from falling lake levels and the increase in drought tolerant taxa (GASSE 2000; MARCHANT & HOOGHIEMSTRA 2004; KIAGE & LIU 2006). A spin-off from the southward shift of the forest/savannah ecotone and the establishment of extensive savannah rangelands was the retreat of the tsetse fly distribution limit, which facilitated the spread of pastoralism into the highlands of East Africa (BOWER 1991; SMITH 1992; GIFFORD-GONZALEZ 1998). Following RICHARDSON & RICHARDSON (1972) and NICHOLSON & FLOHN (1980) the modern circulation system of East Africa with a bimodal rainfall pattern established about 3,000 years ago. Two rainy seasons would have increased the productivity of the rangelands and in consequence milk production and reproduction of domestic herds, hence stimulating the development of specialised pastoralism in East Africa (MARSHALL 1990).
42
Faunal remains of domestic animals occur in the archaeological record since 3400 � 4500 BP in Northern Kenya but are rare in central Kenya and northern Tanzania until around 3,000 BP, when pastoralism became more widespread in parts of East Africa (KAREGA-MUNENE 2003). Several hypotheses have been put forward to explain the early presence of small numbers of domesticates from hunter-gatherer communities in southern Kenya and northern Tanzania and the time lag of about a millennium until an abrupt expansion of the pastoral way of life began (BOWER 1991; GIFFORD-GONZALEZ 1998; LANE 2004; DALE & ASHLEY 2010). The explanatory models can be seen as part of a �moving frontier� with sequential phases of contact and interaction between groups with different subsistence strategies (LANE 2004). The so called �trickle-and-splash� model (BOWER 1991) suggests the presence of small groups of herders since the mid-forth millennium BP. But only around 3,000 BP a splash of southern Cushitic speaking pastoralists made its way into the Rift valley and northern Tanzania. A possible further explanation is offered on epizootiological grounds by GIFFORD-GONZALEZ (1998). Ecological factors like extended tsetse fly infested bush and woodland and highly contagious WD-MCF (Wildebeest derived - Malignant Catarrhal fever) might have been responsible for the delayed introduction of animal husbandry in East Africa. In particular, the distribution of the tsetse fly, the vector of Trypanosoma spp. causing sleeping sickness in animals and human beings, is often cited as responsible for the absence of animal husbandry in various regions of Africa. (ROGERS & RANDOLPH 1988; GIFFORD-GONZALEZ 1998). The Northeast African pastoralists entering East Africa were initially unaware of these threats to their livestock so successful immigration of pastoralists only became possible when the early herders had gained the veterinary knowledge to avoid wildebeest contacts and to circumvent tsetse infected shady bush and woodland. The threat, which trypanosomiasis poses to animal husbandry, has led to the widely repeated assumption among historians and archaeologists that early pastoralists were responsible for widespread burning and woodland clearing in order to create open spaces. (KJEKSHUS 1977; STEVERDING 2008).
The term Pastoral Neolithic was coined to refer to these new food-producing communities, which relied primarily on animal husbandry (cattle, sheep/goat), had knowledge of pottery but still used lithic industries and practiced complementing hunting and gathering (AMBROSE 1984; KAREGA-MUNENE 2003). From linguistic work EHRET (1998) suggests that the early pastoralists were speakers of a Southern Cushitic language and originated from southern Sudan and Ethiopia. They occupied open-air sites throughout the savannah rangelands of central Kenya and Northern Tanzania but did not yet penetrate into the bush and woodlands of central and southern Tanzania (PHILLIPSON 2005; BARHAM & MITCHELL 2008). These early pastoralists were heterogeneous groups and many different pottery traditions e.g. Nderit, Maringishu, Narosura, and Elmentaita (Remnant) developed contemporaneously (AMBROSE 1984).
The pastoralist newcomers spread into a region occupied since the early Holocene by hunter-gatherer communities characterised by their common use of the Eburran 5 lithic industries and who are assumed to belong to the Khoisan language family (AMBROSE 1984). Despite repeated postulations that foragers and pastoralists communities of the Later Stone Age may have practiced some sort of plant cultivation (PHILLIPSON 2005) no direct evidence has been found so far (KAREGA-MUNENE 2003). Pottery (Kansyore ware) however was known as early as the sixth millennium BC by hunter-fisher-gatherer communities around Lake Victoria (DALE & ASHLEY 2010). From site distribution and the resource use of the Okiek, a recent hunter-gatherer group in the Mau Escarpment, AMBROSE (1984) deduces that the Eburran communities favoured the lower fringes of the montane forests, which allowed access to forest resources (honey, animal traps) as well as to savannah environments (hunting). He concludes that distinct subsistence strategies exploiting different ecosystems allowed

43
hunter-gatherers and pastoralists to coexist and even complement their resource use. Coexistence and interaction of hunter-gatherers, pastoralists and later farmer groups within the same region but specializing in the exploitation of resources of different ecological environments represents an important theme, and is of ongoing importance for the understanding of cultural cohabitation and conflict between farmers and pastoralists in many parts of Africa.
4.2 Farmers and smelters: The East African Iron Age
At the end of the first millennium BC, sedentary food-producing farmers entered the East African stage so far dominated by pastoralists and hunter-gatherers. In addition to the cultivation of plants, this new life-style is characterised by knowledge of iron working and by a new distinct pottery style known as Urewe ware (ASHLEY 2010). The origins and spread of African iron working is still poorly understood, but it becomes apparent that during the mid first millennium BC autochthonous iron production emerged at different regions across Africa � most importantly within the Nok culture in Nigeria, the Meroe in Southern Sudan, coastal Gabon and in the Interlacustrine Region of East Africa (CHILDS & HERBERT 2005). Linguistic research links the occurrence of �dimple-based� Urewe ware with the establishment of Bantu speaking farming communities in the Great Lakes region. The antecedents of these early Bantu population, which probably practiced the cultivation of root crops like yams, must have migrated to the highlands of western East Africa from their assumed origin in Southern Cameroon and Gabon (EHRET 1998, 2001). Based on linguistic reconstructions SCHOENBRUN (1993a) proposes a patchwork like population pattern of root crop-based Bantu people amidst grain growing and stock raising Central Sudanic, alongside mixed farming practicing Eastern Sudanic and primarily pastoral Southern Cushitic groups. The diversity of subsistence strategies requiring different ecological environments allowed coexistence, exchange and amalgamation of technologies and languages. The combination of mixed agricultural techniques - including grain cultivation (sorghum, pearl and finger millet), planting of root crops (yams) and nitrogen fixing legumes (cowpea, Bambara groundnut) - and the raising and milking of cattle, combined with the new technological knowledge of iron working, resulted in a powerful toolkit, which facilitated the occupation of a variety of ecosystems and finally resulted in the rapid spread of Bantu-speaking groups over East and into South Africa (SCHOENBRUN 1993b). It is however worth noting, that the widely accepted assumption of farming is based on the occurrence of grinding stones and linguistic grounds. Archaebotanical research conducted so far has been hampered by the scarcity of botanical remains and has not yet confirmed the cultivation of crops in Early Iron Age contexts.
The first occurrence of the �dimple-based� Urewe pottery style and iron smelting is dated to around 500 BC in the Buhaya region at Lake Victoria. Numerous iron smelting sites dating between AD 200 and AD 700 are reported throughout the Great Lakes Region (GRUNDERBEEK et al. 1984; SCHMIDT & CHILDS 1985; CLIST 1987; SCHMIDT 1997b, a). From here the knowledge of iron smelting and presumably farming spread together with the pottery style to the east and south and in the following centuries ceramic types ressembling Urewe ware are found all over East and Southeast Africa. The most important regional variety is Kwale ware (SOPER 1967a), which appears around AD 200 in the coastal regions of Kenya and Tanzania but is also found along the mountain ranges of Usambara and Pare (SOPER 1967b; ODNER 1971a; SOPER 1971a), on Kilimanjaro (ODNER 1971b), at Dakawa near the Nguru Hills (HÅLAND & MSUYA 2000), the Tsavo area (KIRIAMA 1987) and as far north as Mount Kenya.
44
Several scenarios of Bantu migration out of the Lake region into southeast Kenya and Northeast Tanzania have been proposed (cf. KIRIAMA 1993; PHILLIPSON 2005): A northern dispersal route via Mt Kenya and southwards along the coast, a southern route giving rise to the intermediate pottery style Lelesu ware in Sandaweland, Kondoa (SMOLLA 1957) and finally the direct migration from the interlacustrine highlands to Mt. Kilimanjaro and North Pare from where they further spread to Mt. Kenya and along the Eastern Arc Mountains (EHRET 1998). A general drawback of migration models based on purely linguistic grounds is that dispersal mechanisms of technologies like subsistence strategies, pottery styles, and iron smelting are not necessarily bound to the migration of linguistically constrained populations. EGGERT (2005) summarises the development and the ongoing discussion about the origin and dispersal of Bantu languages and critically accesses the often circular reasoning of linguists and archaeologists trying to confirm the prevailing paradigm. He concludes that the reconstruction of dispersal pathways based on linguistic theories should be regarded with caution as material evidence for the spread of common cultural traits is lacking in most areas. Instead of one great homogeneous Bantu expansion, it is more likely that diffusion and cross-cultural interaction between immigrants and local populations on different spatial and temporal scales has resulted in cultural change as well as language adoption and technology transfer. As WRIGLEY (1997) points out, voluntary as well as forced displacement of single people or small groups with the respective knowledge might also have been sufficient to initiate the emergence of similar cultural traits far away from the original centre of dispersal.
4.3 Integration of East Africa into the world trade system
Whereas farming communities spread in the interior, the Tanzanian coast established links with the Near Eastern and Indian world through the emergence of Indian Ocean trade networks. The earliest written references to the East African coast are found in the Periplus maris Erythraei written in the first century AD by an unknown author and translated by CASSON (1989; for alternative translations see among others WRIGLEY 1997) and the Geography of Ptolemy (second century AD). Later in the 10th century the Persian writer Al-Masudi confirms the integration of the East African coast into a wider regional network of exchange and trade with the Roman, Indian and even the Chinese worlds (FREEMAN-GRENVILLE 1962; CHAMI 1994). The most important trade goods mentioned in the Periplus maris Erythraei were �a great amount of ivory but inferior to that from Adulis; rhinoceros horn; best-quality tortoise shell after the Indian; a little nautilus shell� (or palm oil in other translations), whereas the Arabian traders supplied �axes; knives; small awls; numerous types of glass stone�, the former presumably made of iron (CASSON 1989). Further export goods from the Azanian coast were ambergris (copal) from the Tanzanian coast (SUNSERI 2007), gold traded from Sofala (derived from the Zimbabwe plateau and Mozambique coast) and finally slaves (FREEMAN-GRENVILLE 1962; SHERIFF 1987). Archaeological evidence for this early trade is limited. Reports of Roman coins found on Zanzibar remain unconfirmed (FREEMAN-GRENVILLE 1962). The only archaeological evidence so far is from Mkukutu in the Rufiji delta, where CHAMI (1999) recovered Roman beads and pottery from an early iron-working context with pre-Kwale pottery dated to between 230 and 570 AD.
Along the coast, Kwale ware, the local pottery type of the Early Iron Age, is superseded around the 4th to 5th century AD by TIW (Triangular Incised Ware - also called Kitchen ware or Tana ware) (CHAMI 1994, 1995b). On the basis of a continuous pottery style development CHAMI (1994) proposes a local development of the TIW industry and related culture. On the other hand, the flowering of the Triangular Incised Wares on the Tanzanian coast coincides with the rise of the pre-Islamic Persian
45
Sassanid Empire. Blue-green glazed pottery and glass beads of Sassanid origin, the introduction of further metals, like copper and lead, and even a few sherds of Chinese porcelain are evidence of the growing importance of Indian Ocean trade and suggest Sassanid influence or control of the Indian Ocean trade (FREEMAN-GRENVILLE 1962; CHAMI 1994). The Indian Ocean trade stimulated the formation of hierarchical societies and the emergence of coastal states (SHERIFF 1987). By the 15th century the Swahili towns were flowering and the ruling merchant class lived in wealth and luxury. The upsurge of mercantile wealth since the 15th century at the coastal Swahili city-states of Kilwa, Pangani, Saadani/Bagamoyo, Malindi, and Lamu was strongly dependant on the external trade controlled by Arabian and Indian traders.
4.3.1 Ivory and Slaves
Ivory, slaves and spices were the three most important export commodities up to the 19th century (SHERIFF 1987). Ivory is highly valuable and represents one of the first and most constant export goods to the Indian, Arabian and Mediterranean world. Although the ivory boom in East Africa had a comparably late take off in the second half of the 19th century, the opening up of the East African hinterland occurred in less than half a century. Oral accounts of ivory trade in the interior date back to AD 1800 in Buganda, but it is only around AD 1811 when coastal merchants protruded into the hinterland and traded with �tribes 15 days up the Pangani� (THORBAHN 1983). It took years until in 1824 the first known caravans departed into the interior. By the mid-19th century Arab merchants had established trade routes as far as Ujiji, and Unyamwezi and Kamba traders from the interior brought ivory directly to the coast (THORBAHN 1983 and references herein). Although the amount of ivory extracted from East Africa was small compared to West Africa and India (ALPERS 1975), Burton estimated that in the mid-19th century up to 100,000 elephants were killed annually (in THORBAHN 1983), which had a devastating effect on elephant population and societies (HÅKANSSON 2004).
Several reasons are put forward to explain the late and sudden East African ivory boom, including an increase in the ivory demand, declining supply from other source areas, the reorganization of the trade itself, and finally the organization of the ivory supply (THORBAHN 1983; SHERIFF 1987). THORBAHN (1983) analysed ivory prices and volumes in pre-colonial East Africa and concluded that ivory extraction involved not only the immediate hinterland of the coast but must have extended over large areas of the interior. From decreasing tusk size and fluctuating pattern of ivory supply at the Swahili coast he deduces that elephant populations were hunted to the rim of overexploitation at the dawn of the 19th century � event before the onset of the colonial ivory boom.
Trade of East African slaves to the Middle East has a long tradition. The famous Zanji rebellion (AD 869-883 AD) in former Persia is said to have been a revolt of Azanian slaves from East African and illustrates the widespread distribution of African slaves (FREEMAN-GRENVILLE 1962; SHERIFF 1987). European engagement in the East African slave trade commenced with the Portuguese in the early 16th century but intensified especially during the French dominated period between 1770 and 1822, when an estimate of about 1000 - 4000 slaves per year were exported from the East African coast (ALPERS 1975). British attempts to abolish the slave trade since AD 1807 resulted in a steady decline of the European slave trade and the diversion of slaves into agricultural production within Africa. The establishment of slave-based clove plantations on Zanzibar and Pemba and other areas of the coast such as around Pangani and Mombasa in the early 19th century was seen as a direct consequence of the decreasing European demand.
46
4.3.2 From exchange networks to caravan routes
Whereas trade with the outside world via the Indian Ocean has been studied in detail, information on exchange networks and long-distance trade in the hinterland is fragmented and based solely on the interpretation of archaeological evidence. In the last decades several archaeologists have set out to investigate the remains of market places, caravan stops and settlements along the caravan routes in order to investigate the changes early trade networks and later caravan trade had on the subsistence strategies and settlement patterns of local communities (THORBAHN 1983; WRIGHT 2005; ROCKEL 2006; BIGINAGWA 2009; WALZ 2010; WYNNE-JONES 2010). Interpretations of single findings of shell beads in archaeological contexts of the interior are ambiguous, as they do not reveal the means of transport. They may be the material remains of long-distance trade, but may also have arrived through interconnected local exchange networks, the latter without invoking organization and the far-distance movement of groups of people. In the case of ivory, THORBAHN (1983) disagrees with hypothesis of local exchange networks, through which the valuable commodity was passed on until reaching the coast. Instead he proposes trade networks between hunter-gatherers responsible for the ivory supply and pastoralist or agricultural groups, which occasionally organised trading parties directly to the coast or to middlemen as early as the 16th century.
In later periods, regional trade systems were established as a response to the high demand for ivory and slaves. Following earlier routes of exchange, groups of elephant and slave hunters (or traders) penetrated the interior to buy or capture ivory and human beings. Long-distance trade obviously relied on the knowledge of local guides, was constrained by water sources and the provision of food, and may have followed established tracks connecting inhabited areas and commercially interesting trading locations (WALZ 2010).
In the 19th-century caravans with up to 1,000 porters carried ivory to the coast although smaller caravans between 30 and 150 men were more common (KRAPF 1858; THORBAHN 1983; KOPONEN 1988a). Even these small caravans required provision, and it has therefore been assumed that the gathering and translocation of these quantities of people and products stimulated economic growth along the caravan routes (SHERIFF 1987; HÅKANSSON 1994, 2004). Places along the major caravan routes, where water and food were available became first resting places, then local market sites, and later developed into important market towns which attracted new settlers and became economic as well as political powers (ROCKEL 2006; WYNNE-JONES 2010). The food demand of the passing caravans offered farming communities the opportunity to sell surplus production and in return gain luxury products and status symbols. HÅKANSSON (2004; 2008) suggests that the opportunity to sell surplus was the economic incentive for farmers to intensify cultivation and the driving force behind agricultural intensification and the establishment of landesque capital in Pare but also in Usambara, Taita, Ugogo, and Kilimanjaro.
4.4 History of North Pare
4.4.1 Archaeological research
A first archaeological reconnaissance survey of north-east Tanzania was conducted during the 1970s within the Bantu-project of the British Institute in East Africa (SOPER 1967b, 1971a). Numerous archaeological sites - mostly associated with iron smelting - were recorded throughout North and South Pare as well as in the Usambara Mountains (Fig. 13). Although the concentration of site
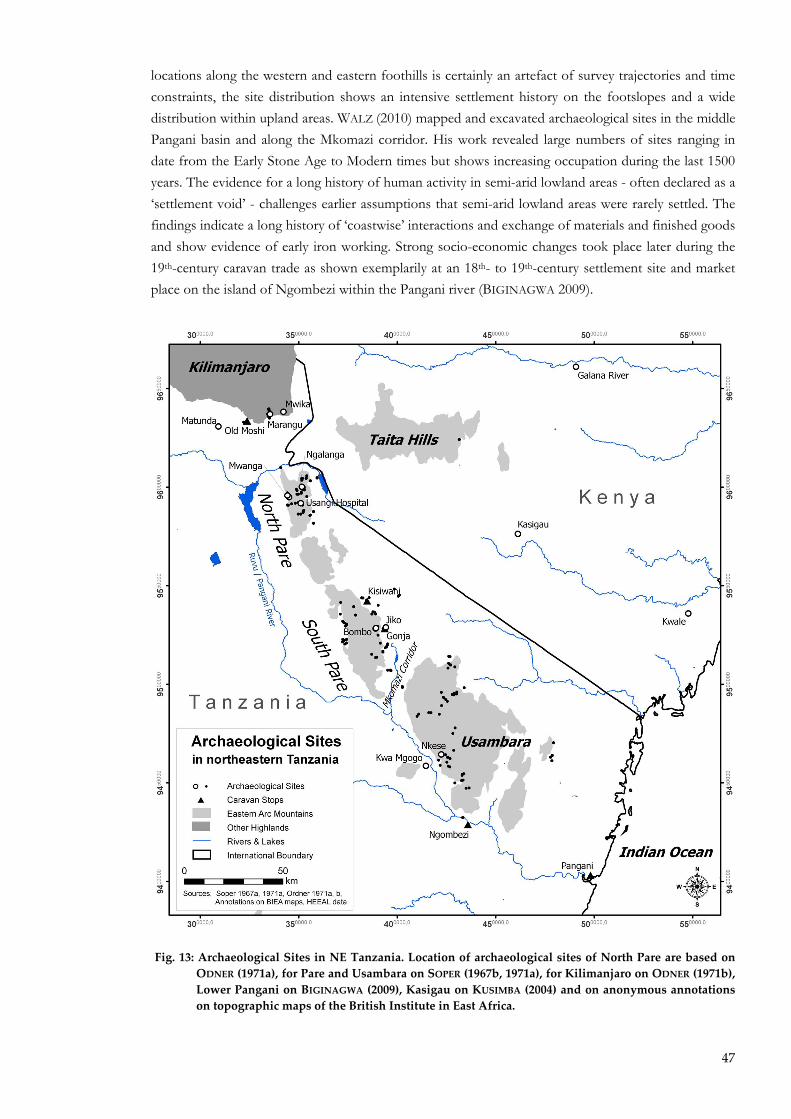
47
locations along the western and eastern foothills is certainly an artefact of survey trajectories and time constraints, the site distribution shows an intensive settlement history on the footslopes and a wide distribution within upland areas. WALZ (2010) mapped and excavated archaeological sites in the middle Pangani basin and along the Mkomazi corridor. His work revealed large numbers of sites ranging in date from the Early Stone Age to Modern times but shows increasing occupation during the last 1500 years. The evidence for a long history of human activity in semi-arid lowland areas - often declared as a �settlement void� - challenges earlier assumptions that semi-arid lowland areas were rarely settled. The findings indicate a long history of �coastwise� interactions and exchange of materials and finished goods and show evidence of early iron working. Strong socio-economic changes took place later during the 19th-century caravan trade as shown exemplarily at an 18th- to 19th-century settlement site and market place on the island of Ngombezi within the Pangani river (BIGINAGWA 2009).
Fig. 13: Archaeological Sites in NE Tanzania. Location of archaeological sites of North Pare are based on ODNER (1971a), for Pare and Usambara on SOPER (1967b, 1971a), for Kilimanjaro on ODNER (1971b), Lower Pangani on BIGINAGWA (2009), Kasigau on KUSIMBA (2004) and on anonymous annotations on topographic maps of the British Institute in East Africa.
48
A closer look at the study area itself, the North Pare Mountains, shows that archaeological investigations are confined to early observations by FOSBROOKE (1954; 1957), ODNER�s (1971a) excavation at Usangi hospital in North Pare, a short survey by CHAMI (1995a) and recent work in progress by STUMP (2010) (cf. Fig. 14). The earliest evidence of human occupation in Pare are unclassified flaked stones found at several upland and lowland sites (ODNER 1971a). These sites are located at the foothills of the mountains (Mwanga, Kwakoa), at Lake Jipe (Makuyuni) as well as within the upland basins (Usangi, Kivindu, Mruma) and ridges (Iria la Bora Mboji) and suggest that Stone Age hunter-gatherers dwelled in the montane forests of the Eastern Arc Mountains. References to former pygmy populations exist within the oral traditions not only in the Pare Mountains (KIMAMBO 1969), but also at Kilimanjaro (DUNDAS 1924), Mt. Kenya, in the Aberdares, and Cherangani (SUTTON 1966). In Pare they are remembered in oral histories as Vimbiji (Kipare) or Sivira (Kigweno). Whether or not these stone industries are remains of these �small people� or of a second group of hunting-gathering people without houses remembered in Kipare as Vasi or Wasi (KIMAMBO 1969) remains speculation. Likewise, it is unclear if former non-Pare communities referred to within local histories as Wandorobo � and said to have been at least partly absorbed within the Wambo clan (KIMAMBO 1969) � included earlier Late Stone Age hunter-gathers, or whether they represent a different pre-Pare population using Eburran phase 5 technology.
References to an early occupation, possibly by agriculturalists, arises again from oral histories synthesised by KIMAMBO (1969). The so-called Wagalla were expelled from Pare by the first Wapare settlers, which ascribe their land rights to this early land conflict. The narratives tell, that the Wagalla lived on the eastern slope near Lake Jipe and iron smelting sites on the eastern slopes of Pare have been tentatively attributed to these pre-Wapare populations (FOSBROOKE 1957).
Early archaeological evidence is available for the bordering lowlands, especially the Tsavo area in Southern Kenya and the middle Pangani basin. In the Tsavo plains near the Galana River, Early, Middle and Late Stone Age lithic scatters are reported, and open-air sites buried under alluvial sediments of the Galana River show that Pastoral Neolithic groups grazed their cattle in the lowlands bordering the Pare Mountains (WRIGHT 2004). The remains include pottery of the Narosura tradition as well as domestic cattle bones and cowry shells and are dated between c. 3700 and c. 1400 14C BP (WRIGHT 2005). Although surprisingly early, the sites confirm pastoralist settlement in southern Kenya since the beginning of the Pastoral Neolithic.
Early Iron Age sites with evidence of iron smelting or Kwale ware are widespread in the Pare and Usambara Mountains, and Kwale ware - a variant of the dimple-based Urewe ware and characterised by its bevelled rim - is first recorded from the type site Kwale near Mombasa, where associated charcoal has been dated to between AD 80 and AD 600 (SOPER 1967a). Similar ages were obtained for Kwale ware recovered at Bombo Kaburi in South Pare dated by charcoal from a disturbance fill containing pottery to (SOPER 1967b). Despite some slag at the type site of Kwale and iron-smelting furnaces dating to the first centuries AD at Nkese, Usambara (SCHMIDT 1988), no direct evidence for early iron-working was recovered from the South Pare sites.
Around the 8th century AD, Triangular Incised Ware spreads along the Tanzanian coast (CHAMI 1995b). In the interior, a new local pottery tradition emerges slightly later. Maore ware, named after the first findings at Gonja Maore, South Pare, appears but does not substitute the traditional Kwale pottery, which continues in use. Maore ware has a graphitic surface and is either thick, crude and irregular or thin-walled and has a graphite surface (SOPER 1967b). Maore Group A ware recovered from a refuse mound at Gonja Maore and is dated by associated charcoal samples to between AD 700
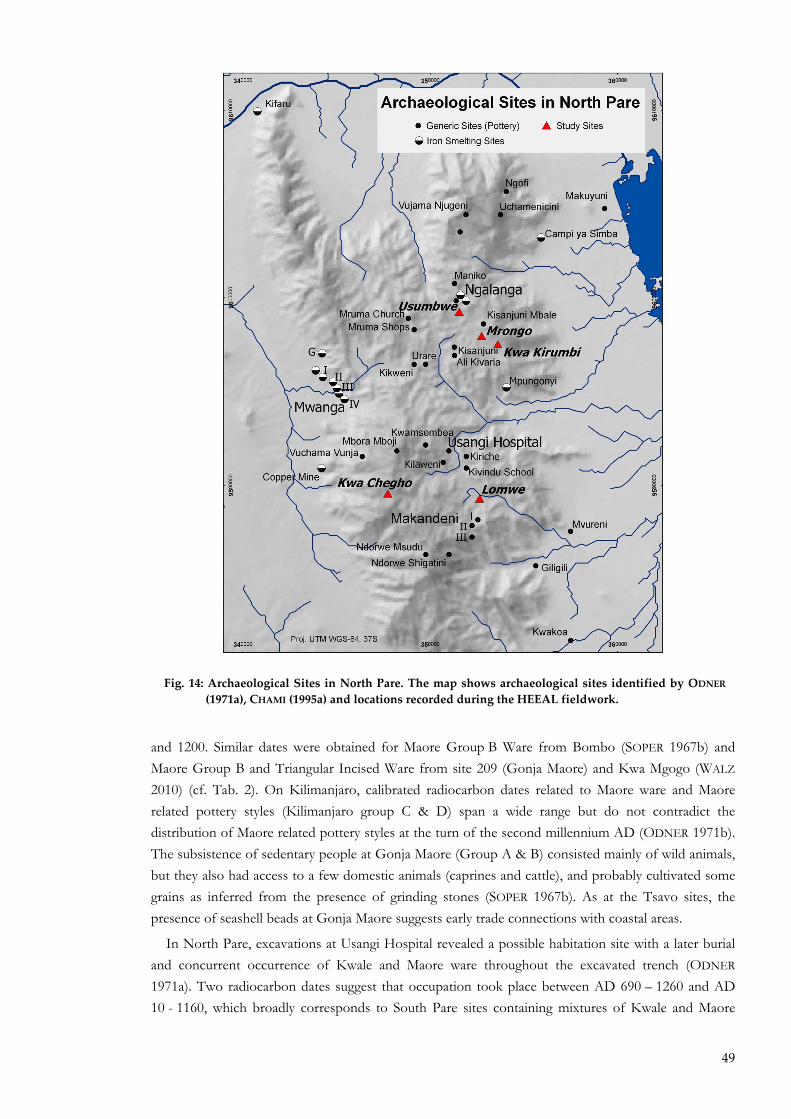
49
and 1200. Similar dates were obtained for Maore Group B Ware from Bombo (SOPER 1967b) and Maore Group B and Triangular Incised Ware from site 209 (Gonja Maore) and Kwa Mgogo (WALZ 2010) (cf. Tab. 2). On Kilimanjaro, calibrated radiocarbon dates related to Maore ware and Maore related pottery styles (Kilimanjaro group C & D) span a wide range but do not contradict the distribution of Maore related pottery styles at the turn of the second millennium AD (ODNER 1971b). The subsistence of sedentary people at Gonja Maore (Group A & B) consisted mainly of wild animals, but they also had access to a few domestic animals (caprines and cattle), and probably cultivated some grains as inferred from the presence of grinding stones (SOPER 1967b). As at the Tsavo sites, the presence of seashell beads at Gonja Maore suggests early trade connections with coastal areas.
In North Pare, excavations at Usangi Hospital revealed a possible habitation site with a later burial and concurrent occurrence of Kwale and Maore ware throughout the excavated trench (ODNER 1971a). Two radiocarbon dates suggest that occupation took place between AD 690 � 1260 and AD 10 - 1160, which broadly corresponds to South Pare sites containing mixtures of Kwale and Maore
Fig. 14: Archaeological Sites in North Pare. The map shows archaeological sites identified by ODNER (1971a), CHAMI (1995a) and locations recorded during the HEEAL fieldwork.
50
ware. Counterintuitively, the deposits that produced these dates sandwiched a layer that produced a fourth millennium BC date and contained reworked stone flakes. ODNER (1971a) reasons that if the stone flakes are reworked Later Stone Age artefacts, an early occupation site might have been disturbed by the later settlement and the excavated deposits therefore also contained reworked charcoal fragments older than the pottery in question. Reconnaissance surveys undertaken by ODNER (1971a), CHAMI (1995a), and during the HEEAL project also attest to widespread occurrences of Later Iron Age pottery in the Pare highlands and include a stratified layer of wattle- and stake-impressed house daub and pottery recorded in the vicinity of Raa, Ugweno, during HEEAL surveys in 2010. A charcoal sample from a fine burnt layer immediately underlying this daub deposit dates to AD 1450 - 1650. The difficulty in locating further direct evidence of occupation sites might suggest that the settlement pattern of dispersed and perhaps relatively short-lived homesteads observed in the 19th century by BAUMANN (1891) may have been the norm throughout Pare history.
Numerous iron smelting sites are located on the lower foothills and the upper pediments of the Pare Mountains as well as within the mountain areas. At Mwanga IIIA, an iron smelting furnace associated with Maore group B pottery known from South Pare was dated to 780 � 1260 AD (ODNER 1971a). During HEEAL fieldwork smelting sites at Mwanga were revisited and the primary backfills of smelting furnaces dated to AD 1290 - 1440 at Mwanga C (probably Odner�s Mwanga IIIA or IIIB) and AD 1040 - 1260 at Mwanga A (Odner�s Mwanga I). So far, dating of furnaces suggests that iron smelting in Pare predominately dates to the early second millennium AD, and no evidence for earlier iron smelting in the first millennium AD such as at Kwale or Nkese has been recorded. Iron working, however, persisted throughout the second millennium as is attested by a pile of over 100 used ironworking tuyeres located in a mid-slope position at Mwanga G (AD 1440 � 1640) and an even later date of AD 1640 - 1730 (78.4% probability at 2σ) for a ditch fill associated with three iron-smithing hearths at Ngalanga in the Ugweno highlands.
4.4.2 Oral traditions of the Wapare
Oral traditions are an important source for the reconstruction of the Pare history. Isaria Kimambo recorded oral histories, traditional practices and clan histories throughout North and South Pare and synthesised a fairly consistent narrative of the history of the Wapare as told by the then current inhabitants. The following overview of the history of Pare encompassing the last five hundred years is based on his ethnohistorical work �A political history of the Pare� (KIMAMBO 1969) and further publications �The Pare� (KIMAMBO 1968), and �Custodians of the Land� (MADDOX et al. 1996).
According to these oral traditions, the ancestors of the Wagweno (inhabitants of Ugweno), the founder community of Pare, immigrated from Taita in Kenya. Oral traditions in Ugweno, North Pare, reach up to 22 generations back, however crosschecking the accounts of different clan lineages suggests that reliable information can only be extracted for the last sixteen generations. Assuming that an average generation lasts about 30 years, the Wagweno moved to Pare between 500 and 700 years ago. About 16 generations ago � around AD 1520 following KIMAMBO (1969) � the ruling Washana clan of blacksmiths was ambushed and the Wasuya clan took power and established a complex political system. The timing and the arrival of the Wagweno in Pare, however, may be questioned - not only on the grounds of the historical accuracy of oral narratives but also by differing assessments of the longevity of KIMAMBO�S genealogy. WINTER (1992) suggests that generations may be as short as sixteen years, and hence that societal transformation and Wagweno hegemony may only date to the 18th century.
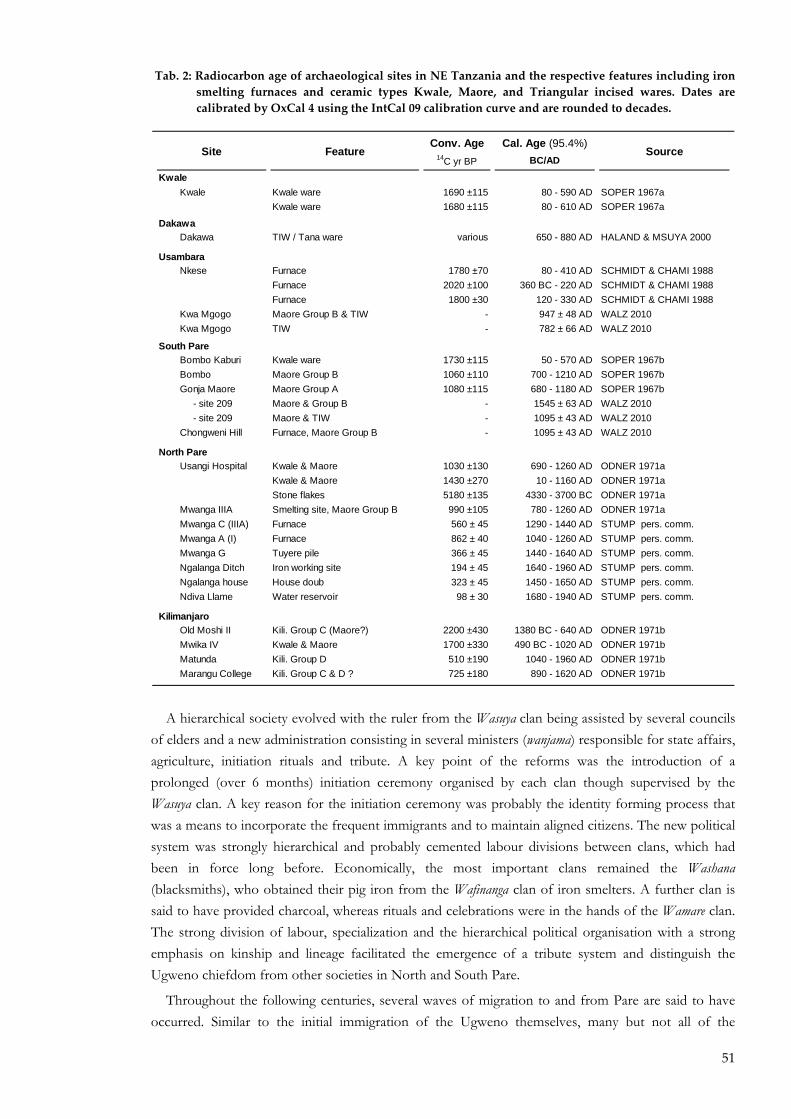
51
Tab. 2: Radiocarbon age of archaeological sites in NE Tanzania and the respective features including iron smelting furnaces and ceramic types Kwale, Maore, and Triangular incised wares. Dates are calibrated by OxCal 4 using the IntCal 09 calibration curve and are rounded to decades.
Conv. Age Cal. Age (95.4%)14C yr BP BC/AD
Kwale Kwale Kwale ware 1690 ±115 80 - 590 AD SOPER 1967a
Kwale ware 1680 ±115 80 - 610 AD SOPER 1967a
DakawaDakawa TIW / Tana ware various 650 - 880 AD HALAND & MSUYA 2000
UsambaraNkese Furnace 1780 ±70 80 - 410 AD SCHMIDT & CHAMI 1988
Furnace 2020 ±100 360 BC - 220 AD SCHMIDT & CHAMI 1988Furnace 1800 ±30 120 - 330 AD SCHMIDT & CHAMI 1988
Kwa Mgogo Maore Group B & TIW - 947 ± 48 AD WALZ 2010Kwa Mgogo TIW - 782 ± 66 AD WALZ 2010
South Pare Bombo Kaburi Kwale ware 1730 ±115 50 - 570 AD SOPER 1967bBombo Maore Group B 1060 ±110 700 - 1210 AD SOPER 1967bGonja Maore Maore Group A 1080 ±115 680 - 1180 AD SOPER 1967b - site 209 Maore & Group B - 1545 ± 63 AD WALZ 2010 - site 209 Maore & TIW - 1095 ± 43 AD WALZ 2010Chongweni Hill Furnace, Maore Group B - 1095 ± 43 AD WALZ 2010
North Pare Usangi Hospital Kwale & Maore 1030 ±130 690 - 1260 AD ODNER 1971a
Kwale & Maore 1430 ±270 10 - 1160 AD ODNER 1971aStone flakes 5180 ±135 4330 - 3700 BC ODNER 1971a
Mwanga IIIA Smelting site, Maore Group B 990 ±105 780 - 1260 AD ODNER 1971aMwanga C (IIIA) Furnace 560 ± 45 1290 - 1440 AD STUMP pers. comm. Mwanga A (I) Furnace 862 ± 40 1040 - 1260 AD STUMP pers. comm. Mwanga G Tuyere pile 366 ± 45 1440 - 1640 AD STUMP pers. comm. Ngalanga Ditch Iron working site 194 ± 45 1640 - 1960 AD STUMP pers. comm. Ngalanga house House doub 323 ± 45 1450 - 1650 AD STUMP pers. comm. Ndiva Llame Water reservoir 98 ± 30 1680 - 1940 AD STUMP pers. comm.
Kilimanjaro Old Moshi II Kili. Group C (Maore?) 2200 ±430 1380 BC - 640 AD ODNER 1971bMwika IV Kwale & Maore 1700 ±330 490 BC - 1020 AD ODNER 1971bMatunda Kili. Group D 510 ±190 1040 - 1960 AD ODNER 1971bMarangu College Kili. Group C & D ? 725 ±180 890 - 1620 AD ODNER 1971b
Feature SourceSite
A hierarchical society evolved with the ruler from the Wasuya clan being assisted by several councils of elders and a new administration consisting in several ministers (wanjama) responsible for state affairs, agriculture, initiation rituals and tribute. A key point of the reforms was the introduction of a prolonged (over 6 months) initiation ceremony organised by each clan though supervised by the Wasuya clan. A key reason for the initiation ceremony was probably the identity forming process that was a means to incorporate the frequent immigrants and to maintain aligned citizens. The new political system was strongly hierarchical and probably cemented labour divisions between clans, which had been in force long before. Economically, the most important clans remained the Washana (blacksmiths), who obtained their pig iron from the Wafinanga clan of iron smelters. A further clan is said to have provided charcoal, whereas rituals and celebrations were in the hands of the Wamare clan. The strong division of labour, specialization and the hierarchical political organisation with a strong emphasis on kinship and lineage facilitated the emergence of a tribute system and distinguish the Ugweno chiefdom from other societies in North and South Pare.
Throughout the following centuries, several waves of migration to and from Pare are said to have occurred. Similar to the initial immigration of the Ugweno themselves, many but not all of the
52
migrations are reported to be related to famines. The melting pot of Pare assimilated migrants acquainted with farming from Taita, South Pare, Usambara, Nguru, and Kilimanjaro as well as Kamba. An exception was the pastoralist Wambugu clan which probably was forced to evade the pressure of Maasai groups and finally settled in the mountain areas of Usambara and Pare (KIMAMBO 1969; CONTE 1999). The newcomers were allowed to settle in still uninhabited areas and the availability of arable land underlines the lack of any population pressure far into the 19th century, when groups from Kilimanjaro displaced during the Orombe wars found refuge in the northernmost part of North Pare (SHERIDAN 2001).
From his review, Kimambo reasons that long-distance trade passed nearly unnoticed prior to 1860 and North Pare had remained a fairly peaceful place in the first part of the 19th century. When von der Decken arrived in North Pare in 1862, he was impressed by flowering maize and banana fields in the lowlands, and by prospering iron production on the eastern foothills of the mountains. On the other hand, passing of strangers and caravan food supply was less common in North Pare than in the previously visited South Pare as a gun shot, the common �call for food� signal of the caravans in South Pare, was ignored. Unfamiliar and suspicious of foreigners or aware of the looming changes their presence announced, the Pare people looked at the caravan with distrust and feared that the intruders had disturbed the peacefulness (mphorere) of their land (VON DER DECKEN 1869).
During the heyday of the 19th-century caravan trade (1850 to 1880), no historical accounts are available. When Baumann passed through Pare thirty years later in 1890, things had changed. Beside dispersed homesteads, BAUMANN (1890) encountered two with stockade fortified settlements erected at Mashewa (Lomwe area, chief Maguera) and Kiritche (Usangi area, chief Kengia and Naguvu). The diffusion of firearms by Swahili traders and the possibility of acquiring wealth outside the traditional system of dependency and lineage weakened the traditional political and economic power structures. Tensions between two, only recently immigrated clans - the Wasangi and Wambaga - about initiation ceremonies and political influence grew and resulted in violent confrontations and finally the eviction of the Usangi leaders. Violence increased during repeated clashes. Clan chiefs but also independent gangs of young men took advantage of the power vacuum and uncontrolled robbery and slave raiding started. The Pare communities, debilitated by clan rivalries, turned into easy prey for cattle and slave raids of Maasai and Wachagga raiding parties. The shift of the economic focus from subsistence agriculture and cattle herding to ivory and later slave trade is best reflected by the establishment of new markets by Kengia, the victorious Wambaga chief. Particularly the establishment of a slave market attracted the long-distances caravan trade. The situation worsened when in the years between 1870 and 1880 several epidemics devastated Pare and cholera and smallpox took their death toll (KOPONEN 1988b). At the end of the century between the years 1887 and 1892 a strong famine remembered as the Mnyime famine hit Pare. Triggered by a probably benignant climatic drought, the devastating famine was the result of the collapse of the political and economic system debilitated by epidemics and warfare exacerbated by the long-distance (slave) trade (KIMAMBO 1969; KOPONEN 1988b; KIMAMBO 1996; SHERIDAN 2001). Thus, the late 19th century is remembered in Pare as kibonda: a time of heightened mortality, insecurity and violence (KIMAMBO 1969; SHERIDAN 2001). The incorporation of Pare into the world system by long-distance trade effectively destroyed within a few years a functioning political and economical system based on tradition, kinship, and interdependency.
53
4.4.3 Colonial Rule and Independence
During German and British colonial rule, the political and economic situation stabilised, but the repeated reorganisation of political leadership further corroded traditional channels of power and organisation. Population began to rise from about 10,000 habitants in North Pare in 1900 to over 100,000 in 1990. Pare, which previous had received immigrants, experienced for the first time male out-migration (SHERIDAN 2001). The decline of local and traditional resource management during colonial administration and the strong influence of central government influence and the lack of management by the new government lead to an open-access situation and consequent resource abuse. Formerly protected areas near water sources and swampy valley bottoms were turned into farmland. Similarly, the corrosion of traditional beliefes and power structures resulted in the encroachment of sacred forests (mshitu, mpungi) and communal forest reserves (SHERIDAN 2000, 2004).
4.5 Production, land use and culture
4.5.1 Social organisation & Agriculture
The social organisation and the recent political history of North Pare are discussed in depth by KIMAMBO (1968, 1969, 1991) and SHERIDAN (2000, 2001, 2004). In the 19th century, Pare was a hierarchical society with a strong emphasis on kinship and lineage relationships. Nucleated villages were uncommon in Pare, and the settlement pattern was dominated by dispersed farmsteads located in the direct vicinity of the agricultural fields. Although nowadays a predominantly agricultural society, economic wealth and political influence were measured in cattle and oral traditions suggest a long tradition of herding � in the lowlands as well as the uplands. As among the Massai, cattle were the symbol of status and essential to gain respect and influence.
Collected manure is used to fertilise fields, especially the banana groves, located strategically below the cattle stables. Cattle were stall-fed since the late 19th century (VON DER DECKEN 1869) although observations by BAUMANN (1890) suggest that formerly cattle herds were grazing in the empty upland meadows and had been strongly reduced during warfare and political instability at the end of the 19th century and especially by Massai and Wachagga raids (MEYER 1890). Old cattle tracks (iria) leading down from the escarpment to the plain, the cattle based Pare calendar, and oral accounts (KIMAMBO 1969; SHERIDAN 2001) show that animal husbandry was far more important in the early 19th century and has declined since the early visits of von der Decken, Baumann and Meyer.
The main crops cultivated in Pare today are maize, banana, plantain, beans, sugar cane, cassava, yams, and several root-crops, as well as few vegetables. Cash crops are nearly absent in the North Pare uplands. Coffee was introduced in colonial times but has never played a similarly important role as on Mt. Kilimajaro. Only a few coffee plantations remain today. Sisal plantations on the other hand are common along the foothills.
Bananas and plantains are an important staple. There is considerable debate about the time and place these major south-east Asian food plants were introduced to Africa (NEUMANN & HILDEBRAND 2009). Linguistic research between the Great Lakes led to the conclusion that cultivation of banana took place in the later part of the first millennium AD (SCHOENBRUN 1993b). Based on phytolith analysis, early dispersion dates around 2,500 BP in Cameroon (MBIDA MINDZIE et al. 2006) and Uganda (LEJJU et al. 2006) have been proposed. Due to the problematic identification of Musa phytoliths the broad time frame of introduction still remains unknown (NEUMANN & HILDEBRAND
54
2009). Nevertheless, banana and plantains played a crucial role in the occupation and cultivation of the submontane forest zone of many of the �islands of agriculture� in many parts of Africa.
Whereas bananas are grown in permanent often manured plots, other crops undergo crop rotation and short fallow periods betweeen 3 � 5 years (BAUMANN 1891; KOTZ 1922). The traditional cereals sorghum and millet and root crops like yams were replaced by introduced maize and beans. Already in 1861 VON DER DECKEN (1869) had been offered New World crops such as beans, maize, and pumpkins and thirty years later, BAUMANN (1890) and MEYER (1890) describe markets where rice, Hirse (sorghum/millet), cassava (mhogo), sugar cane, yams, butter and honey were offered. On Kilimanjaro finger millet is known to have been a major pre-colonial crop, but only MEYER (1890) reports Hirse (sorghum/millet) from North Pare and BAUMANN (1890) even describes sorghum as very rare. Maize on the other hand was widespread in Pare during the middle of the 19th century, but was not widely cultivated on Kilimanjaro (TAGSETH 2008). The observations of apparent regional differences in food crops might be caused by either incomplete traveller accounts biased by seasonal crop variation but also could reflect different ways of food adoption.
4.5.2 Landesque Capital
Terraces and irrigation furrows are characteristic features of the Pare Mountains. The investment of labour in the construction of landesque capital like irrigation systems and terraces as well as labour intensive tasks like manuring and stall feeding are generally taken as evidence of an intensive agricultural production system aimed to increase agricultural yields (HÅKANSSON 2008; STUMP 2010).
The most apparent landesque capital in Pare is terraces. Different types of terraces can be observed in North and South Pare ranging from simple trash lines (misingi) to elaborate stone-lined terraces (mafinga) built of fieldstones (SHERIDAN 2001). Although there is no doubt that terraces were constructed by the Pare in the 19th century (BAUMANN 1890:228), the absolute dating of these features turned out quite difficult as most of the present features are either recent or rebuilt. With the incentive of irrigation rehabilitation, development organization (TIP, TFAP, GTZ) have convinced local farmers to construct new and rehabilitate old terraces with explicit aim of reducing soil erosion on the steep cultivated slopes. In consequence, a growing number of new terraces have been established during the last 20 years.
Irrigation systems in North Pare are widespread, but are far from being spatially comprehensive. The distribution of hill furrows is restricted to catchments of sufficient size and elevation to offer reliable water sources such as uphill springs, swamps or permanent streams. Irrigation features are reported from the slope of the high mountains Ngofe, Kindoroko and Kamwalla, where water is available from springs and streams and along the escarpment edge, where water can easily be diverted from streams. On the undulating central Pare upland at Msangeni, Ngweni, and Mruma, however, irrigation is nearly absent. Water reservoirs (ndiva in Kipare/Chasu) play a crucial role for both agricultural as well as domestic water supply and irrigation was deeply imbedded in spiritual notions of fertility and gender as well as socioeconomic power structures of land tenure and clientage (SHERIDAN 2001, 2002).
During the 20th century traditional concepts of communal labour and kinship based authority eroded, and out-migration of the male labour force and general economic diversification threatened Pare agriculture and culture. Irrigation features deteriorated until the last decades, when development agencies started to revive upland and lowland irrigation systems in combination with the promotion of soil conservation methods, particularly the (re-)construction of terraces.
55
In Pare, irrigation is not (and probably never has been) crucial for agricultural production, but allows a secure second growing period, thus playing an important role by enhancing yields. The reasons for the investment of labour in landesque capital to increase yields beyond the necessary is discussed in the following chapter focusing on the establishment of locally restricted islands of intensive agricultural in East Africa.
4.6 Islands of intensive agriculture Outstanding features of �landesque capital� such as terraces and irrigation features have early on
drawn the attention of European travellers, agronomists, economists as well as historians and archaeologists. The occurrence of these clusters of organised systems of intensive agriculture, distributed unevenly over East Africa has prompted many attempts to explain agricultural intensification in an African context (WIDGREN & SUTTON 2004). Known as �islands of intensive agriculture� they are situated in or closely to ecologically favoured mountain environments, which due to altitude, a temperate climate and enhanced orographic rainfall act as �water towers� and provide seasonal or perennial water supplies. KOPONEN (1988b) distinguishes between grain-based cultivation in areas of moderate to low rainfall such as plateaus and lowlands, and predominantly banana-based cultivation in well-watered isolated mountain areas.
Grain-based rain-fed agriculture is widely distributed in semiarid lowland plains (e.g. Il Chamus (ANDERSON 1989), Engaruka at the footslope of the Ngorongoro crater highlands (SUTTON 1984; STUMP 2006; WESTERBERG et al. 2010) as well as intermediate highland areas with moderate rainfall like the Mbulu highlands (BÖRJESON 2004, 2007), the Iraqw agriculture in the Irangi Hills (KANGALAWE et al. 2008) and the Pokot and Marakwet in the northern Cherangani Highlands (DAVIES 2008). Specialised agricultural systems based primarily on perennial banana cultivation are found in most of the ecologically favoured mountain areas like Usambara (FEIERMAN 1990), Pare (KIMAMBO 1996; SHERIDAN 2001, 2002; HÅKANSSON 2008), Taita (FLEURET 1985), and Kilimanjaro (TAGSETH 2008). Here the establishment of irrigation systems is an optional investment to secure and increase high returns of seasonal, rain-fed cultivation.
All of the mentioned agricultural centres stand out by the deliberate investment in labour and landesque capital in order to increase or secure yields per unit land (BOSERUP 1965; HÅKANSSON 1989). To achieve higher returns three types of investment are observed:
• labour intensification: weeding, manuring, ridging. • capital intensification: construction of landesque capital: by means of labour investment long-
lasting features such as irrigation reservoirs, dams, and furrows, terraces are established or new land is cleared. Value and returns from the land are increased.
• change in technology: new varieties of crops, ploughing, land use change e.g. agroforestry, shorter fallow periods.
Most options require the availability of labour to be invested in recurrent tasks such as weeding, manuring and ridging as well as one-off labour for construction work, where labour or capital is invested to create long-lasting features to improve and enhance the productivity of the given land e.g. via irrigation, terracing or conversion of unused to cultivated land.
56
4.6.1 Land degradation as driver of intensive agriculture?
Incentives for labour intensification are strongly debated and several socioeconomic models have been proposed to explain the increased labour investment. (BÖRJESON 2004; WIDGREN & SUTTON 2004; HÅKANSSON & WIDGREN 2007; STUMP 2010). In general terms, agricultural intensification to boost production can be interpreted as a response to food shortage - either due to external factors like climatic fluctuations and recurrent famines or internal changes such as population growth - or the need for surplus production to fulfil the demand of tribute for either social or ritual reasons.
The classical Malthusian explanation (MALTHUS 1809) of population growth and declining yields as a consequence of soil exhaustion and land degradation has been contested by BOSERUP (1965) who suggests that population pressure stimulates inventions and agricultural intensification and hence allows for cycles of population growth. A local variant of the Boserup model, the siege situation, has been suggested for communities unable to expand due to confinement by surrounding hostile enemies or a restricted area of arable land, both leading to the need for local enhancement of food production.
In the East African context and especially in the case of North Pare, land shortage or overpopulation pressure as a driving force to increase yields is unlikely as population densities in the 19th century are assumed to have been very low. (SHERIDAN 2002; DAVIES 2008; HÅKANSSON 2008; HÅKANSSON et al. 2008; STUMP & TAGSETH 2009). Oral traditions collected by KIMAMBO (1969) repeatedly mention migration waves to and from North Pare and the warm welcome for the newly arriving settlers suggests strongly that land was abundant (KIMAMBO 1991; SHERIDAN 2001). BÖRJESON (2007) proposed a different explanatory model, where the creation of landesque capital may have preceded population growth. Based on his work in the Mbulu highlands, Böjerson describes the unintentional creation of terraces by annual tilling along fixed field borders. This process of incremental accumulation of landesque capital results in terraces, however without additional labour investment nor intention nor organisation. In the same vein STUMP (2010) cautions that many assumed deliberate investments for future benefits might be simply necessary for present cultivation and therefore do not represent intentional agricultural intensification. The unintentional creation of landesque capital in turn induces a positive feedback, increases returns, attracts settlers and stimulates population growth and indirectly the growth of local and regional exchange networks.
For North Pare, two further models are particularly important. The first builds on the intrinsic socioeconomic situation of North Pare, the second tries to put the intensification of local cultivation practices into a global context of trade. Against the notion of the incremental and possibly unintentional nature of the creation of landesque capital SHERIDAN (2002) proposes active investment. He reckons that in an immigration country like Pare without shortage of land, the investment in landesque capital like irrigation furrows would attract new settlers. The immigrants would establish a patron - client relation with the irrigation builders, thereby increasing the labour force, tributes and social approval of the founder family of the irrigation system. Following SHERIDAN (2002), the investment in landesque capital and the later returns from dependent farmers would have emerged as an alternative to livestock clientage, which was increasingly threatened by cattle raids during the turmoil of the late 19th century.
In generally however, agricultural intensification in 19th-century East Africa is discussed as having been stimulated by the caravan trade and the incorporation into the economic world system (HÅKANSSON & WIDGREN 2007; LANE 2010). Regions along the caravan routes such as Ugogo (CHRISTIANSSON 1981), Mbulu (BÖRJESON 2004), Pare (KIMAMBO 1969), and Il Chamus
57
(ANDERSON 1989) experienced an agricultural boom during the second half of the 19th century, when the caravan trade was at its apogee. It seems reasonable to assume that increasing food demand by passing caravans and ivory hunters in the mid-19th century stimulated food production and made labour investment worthwhile.
So far, however, the debates among historians and archaeologists lack firm evidence of the antiquity of the landesque capital. Whereas the rise and fall of recent agricultural centres such as Il Chamus (ANDERSON 1989) can be traced historically, the origin of intensive agriculture and landesque capital in areas with older traditions has been difficult to assess (for example STUMP 2006; WESTERBERG et al. 2010). On Kilimanjaro irrigations systems were well established around 1840 and following oral accounts and indirect genealogical dating TAGSETH (2008) infers that hill furrow irrigation existed since at least the 17th century and certainly before the arrival of the Marangu and Kilema tribes from Ukamba. In the Usambaras, irrigation systems are said to pre-date the establishment of the Kilindi kingdom in the 18th century (FEIERMAN 1990: 65). In North Pare, the age of establishment of hill furrows and water reservoirs is only vaguely remembered and the present inhabitants do not attest a very old antiquity to these features for which 19th-century dates are given (STUMP, pers. comm.).
Intriguing though is the fact that the known construction of irrigation systems and terraces in the 19th century falls together with the observation of widespread land degradation by the early European travellers, which could have triggered the agricultural intensification. Lacking written accounts it is left to archaeological and environmental investigations to study the ways soil erosion, land degradation and the establishment of landesque capital might have been linked. While archaeological investigations are in process, the present study of slope deposits and past erosion focuses on the question of when and if accelerated soil erosion turned into irreversible land degradation and if this could have been a crucial step triggering the intensification of agriculture in North Pare.

58
59
5 METHODS
5.1 Transect and soil profile placement
Present day agricultural soils and corresponding slope deposits were investigated in three study areas. At each location a soil transect from the hilltop to the valley bottom was established. Each catena covers accretion, transportation and sloughing zone and soil profiles were recorded on the valley bottom, the colluvial footslope, the transportational lower and middle slope and within the erosion zone of the mid-slope and upper slopes.
Selection of slopes for the establishment of soil transects was determined by minimizing the influence of recent human landscaping especially earthworks such as terracing for house construction and road building. Slope morphology determined the approximate location of the slope catena and the soil profiles. Preference was given to concave swale positions. Head slopes more likely to contain a complete sediment record were preferred over nose slopes prone to erosion. For the final location of individual soil profiles preferences of the land owners had to be taken into account.
5.2 Soil description and sampling
Soil pits (0.9 x 1.4m) were excavated to depths between 50cm (paralithic contact) on mid-slopes and maximal 5m at the valley bottom. If bedrock or saprolite were not encountered within the excavated pit, augering ensured recovery and description of deeper sediment deposits.
Soil profiles were described following the guidelines outlined in the World Reference Base for Soil Resources (IUSS WORKING GROUP WRB 2007) and the Soil Taxonomy (SOIL SURVEY STAFF 2003) and complemented when necessary following the Bodenkundliche Kartieranleitung (AG BODEN 1994). Soil description comprised characteristics of horizon boundary, stone content and shape, soil density and humus estimations, and root quantity estimation. Texture, soil structure, biological activity and the occurrence and characteristics of mottles and concretions were recorded (cf. Tab. 3 for soil parameters recorded in the field). Potsherds were collected where encountered and charcoal samples were taken, if suitable amounts could be recovered.
Soil samples were taken from outlined soil horizons and stratigraphic layers, generally every 10cm, and stored in plastic bags. The spacing of auger samples was discontinuous, according to amount and quality of the recovered sample. Recovery was hampered and partly incomplete in saturated sediments below the water table due to sample loss. All samples were initially air-dried in Tanzania. After arrival in York they were oven-dried at about 40°C. Sample aggregates were gently broken down by a mortar to pass a 2mm sieve (SCHLICHTING et al. 1995; SHEPPARD & ADDISON 2007).
5.3 Soil colour, pH, and bulk density Munsell colours are reported for air-dry and moist soil aggregates. pH was determined in the
laboratory in a 1:1 water-to-soil ratio. Distilled water was chosen over an electrolyte solution to reflect an electrolyte poor environment of strongly weathered soils (SCHACHTSCHABEL et al. 1998). Bulk density was determined by measuring the oven-dry weight of samples obtained from sampling rings with a known volume. Further analyses were conducted on the fine earth fraction.
60
5.4 Geographical Information System (GIS)
Free available spatial GIS data was obtained from a range of sources (selection presented in Tab. 4). ArcGIS 9, as the most common GIS program was employed to display and transform the data. Base projection is the UTM WGS84 datum. A hydrological stream network and watersheds were derived from the hydrologically conditioned, pre-processed HydroSHEDS DEM. Panchromatic Spot 5 satellite images were obtained via the OASIS project. Aerial photographs were obtained from the Rhodes House collection, Oxford, with permission of the Director of Surveys and Mapping Division, Tanzania. They were georeferenced to the 5m high resolution Spot 5 image of North Pare (Path 141, Track 357, 31.10.2005).
5.5 Organic carbon and stable carbon isotope analysis Stable carbon isotope analysis was carried out for selected samples only. A subsample of fine earth
was dried over night at 105°C and ground with a ball-mill for 3 min at 25 rpm. Between 3 and 50 mg oven-dry samples were weighed into silver capsules. Judging from visible estimation of the carbon content, weights were adjusted to contain similar amounts of carbon (ELLERT & ROCK 2007). Inorganic carbon was eliminated by small-scale acidification following the procedures outlined by ELLERT & ROCK (2007). Up to 50µl of concentrated HCl was added to the samples in silver capsules using a micropipette. After removal of inorganic carbon by acidification and in the absence of geological sources of elemental carbon (e.g. coal, graphite) the remaining carbon fraction comprises organic and charcoal carbon and is referred to as (total) organic carbon (Corg).
Organic carbon and δ13C were measured in a continuous flow isotope ratio mass spectrometer GC-IRMS (Gas Chromatograph � Isotope Ratio Mass Spectrometer) after combustion at 1000°C in a SerCon ANCA-GSL (Automated Nitrogen Carbon Analysis for Gas Solids and Liquids). Samples were measured in triplicates and standard deviations are provided. Overall precision calculated as the average of the standard deviations of triplicates was <0.2� for stable isotope and <0.15% for carbon analysis. For several single samples exceptionally large standard deviations were observed, which are ascribed to sample heterogeneity and/or sample loss during acidification. δ13C values are reported in the standard delta notation (EHLERINGER & RUNDEL 1989):
10001tan
13 ×⎟⎟⎠
⎞⎜⎜⎝
⎛−=
dards
samplesample R
RCδ
Rsample and Rstandard refer, respectively, to the molar isotope ratio of the sample and standard e.g.
13Csample/12Csample. δ13C sample is the isotope ratio difference between the sample and the PeeDee Belemite (PDB) standard normalised by the standard and commonly reported in parts per thousand [�]. Sample preparation was done at York; measurement was conducted in collaboration with Dr. Arnoud Boom, Department of Geography, University of Leicester.
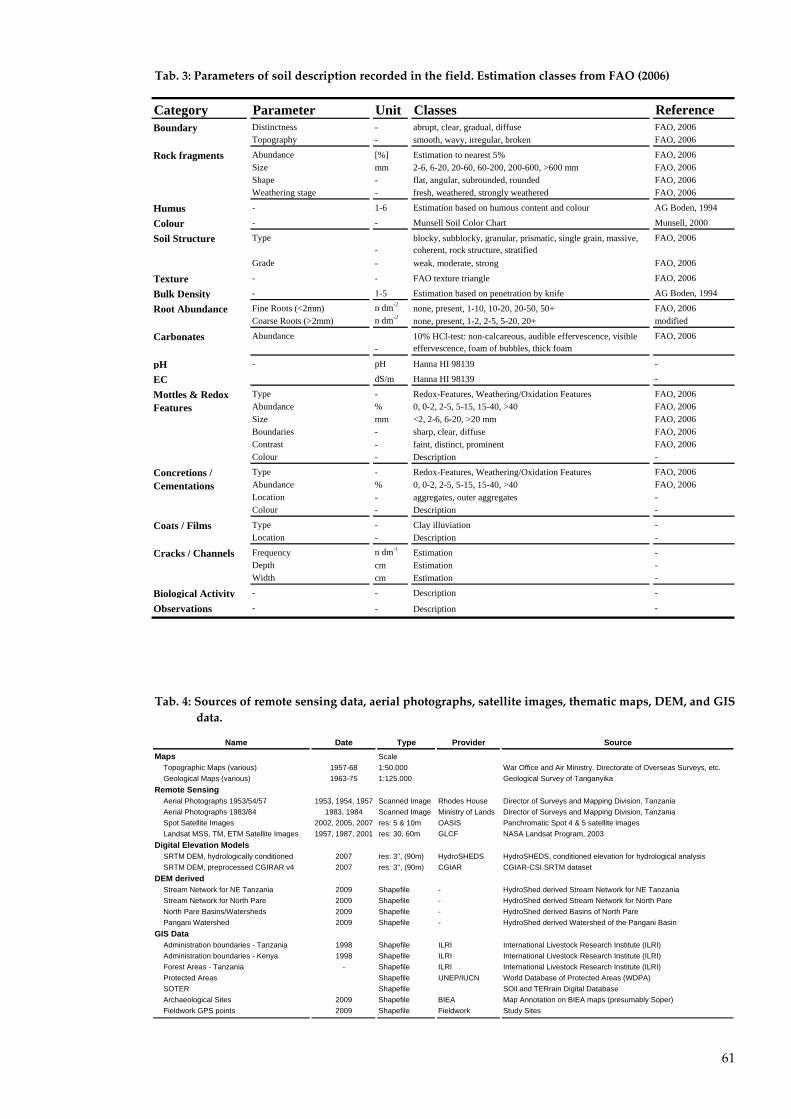
61
Tab. 3: Parameters of soil description recorded in the field. Estimation classes from FAO (2006)
Category Parameter Unit Classes ReferenceDistinctness - abrupt, clear, gradual, diffuse FAO, 2006Topography - smooth, wavy, irregular, broken FAO, 2006
Abundance [%] Estimation to nearest 5% FAO, 2006Size mm 2-6, 6-20, 20-60, 60-200, 200-600, >600 mm FAO, 2006Shape - flat, angular, subrounded, rounded FAO, 2006Weathering stage - fresh, weathered, strongly weathered FAO, 2006
Humus - 1-6 Estimation based on humous content and colour AG Boden, 1994
Colour - - Munsell Soil Color Chart Munsell, 2000
Type-
blocky, subblocky, granular, prismatic, single grain, massive, coherent, rock structure, stratified
FAO, 2006
Grade - weak, moderate, strong FAO, 2006
Texture - - FAO texture triangle FAO, 2006
Bulk Density - 1-5 Estimation based on penetration by knife AG Boden, 1994
Fine Roots (<2mm) n dm-2 none, present, 1-10, 10-20, 20-50, 50+ FAO, 2006Coarse Roots (>2mm) n dm-2 none, present, 1-2, 2-5, 5-20, 20+ modified
Carbonates Abundance-
10% HCl-test: non-calcareous, audible effervescence, visible effervescence, foam of bubbles, thick foam
FAO, 2006
pH - pH Hanna HI 98139 -
EC dS/m Hanna HI 98139 -
Type - Redox-Features, Weathering/Oxidation Features FAO, 2006Abundance % 0, 0-2, 2-5, 5-15, 15-40, >40 FAO, 2006Size mm <2, 2-6, 6-20, >20 mm FAO, 2006Boundaries - sharp, clear, diffuse FAO, 2006Contrast - faint, distinct, prominent FAO, 2006Colour - Description -
Type - Redox-Features, Weathering/Oxidation Features FAO, 2006Abundance % 0, 0-2, 2-5, 5-15, 15-40, >40 FAO, 2006Location - aggregates, outer aggregates -Colour - Description -
Type - Clay illuviation -Location - Description -
Frequency n dm-1 Estimation -Depth cm Estimation -Width cm Estimation -
Biological Activity - - Description -
Observations - - Description -
Concretions / Cementations
Coats / Films
Cracks / Channels
Boundary
Rock fragments
Root Abundance
Mottles & Redox Features
Soil Structure
Tab. 4: Sources of remote sensing data, aerial photographs, satellite images, thematic maps, DEM, and GIS data.
Name Date Type Provider SourceMaps Scale
Topographic Maps (various) 1957-68 1:50.000 War Office and Air Ministry. Directorate of Overseas Surveys, etc.Geological Maps (various) 1963-75 1:125.000 Geological Survey of Tanganyika
Remote SensingAerial Photographs 1953/54/57 1953, 1954, 1957 Scanned Image Rhodes House Director of Surveys and Mapping Division, TanzaniaAerial Photographs 1983/84 1983, 1984 Scanned Image Ministry of Lands Director of Surveys and Mapping Division, TanzaniaSpot Satellite Images 2002, 2005, 2007 res: 5 & 10m OASIS Panchromatic Spot 4 & 5 satellite imagesLandsat MSS, TM, ETM Satellite Images 1957, 1987, 2001 res: 30, 60m GLCF NASA Landsat Program, 2003
Digital Elevation ModelsSRTM DEM, hydrologically conditioned 2007 res: 3'', (90m) HydroSHEDS HydroSHEDS, conditioned elevation for hydrological analysisSRTM DEM, preprocessed CGIRAR v4 2007 res: 3'', (90m) CGIAR CGIAR-CSI SRTM dataset
DEM derived Stream Network for NE Tanzania 2009 Shapefile - HydroShed derived Stream Network for NE TanzaniaStream Network for North Pare 2009 Shapefile - HydroShed derived Stream Network for North PareNorth Pare Basins/Watersheds 2009 Shapefile - HydroShed derived Basins of North ParePangani Watershed 2009 Shapefile - HydroShed derived Watershed of the Pangani Basin
GIS DataAdministration boundaries - Tanzania 1998 Shapefile ILRI International Livestock Research Institute (ILRI)Administration boundaries - Kenya 1998 Shapefile ILRI International Livestock Research Institute (ILRI)Forest Areas - Tanzania - Shapefile ILRI International Livestock Research Institute (ILRI)Protected Areas Shapefile UNEP/IUCN World Database of Protected Areas (WDPA)SOTER Shapefile SOil and TERrain Digital DatabaseArchaeological Sites 2009 Shapefile BIEA Map Annotation on BIEA maps (presumably Soper)Fieldwork GPS points 2009 Shapefile Fieldwork Study Sites
62
5.6 Particle Size Analysis A combined sieving and pipette method as outlined by SCHLICHTING (1995) and KROETSCH AND
WANG (2007) was applied. An oven-dry subsample of about 20g fine earth (<2mm) was pretreated with 30% hydrogen peroxide (H2O2) in to remove organic matter. The reaction was accelerated by gentle heating in a water bath. Dispersion of fine aggregates and clay minerals was achieved by shaking overnight in a solution of sodium metaphosphate and sodium carbonate (SCHLICHTING et al. 1995; KROETSCH & WANG 2007). Sand fractions were separated from the fines by wet sieving trough stacked sieves. The remaining silt and clay fraction was quantitatively transferred into 1l cylinders agitated with a plunger for about four minutes and left to settle down. At temperature dependant time intervals, small aliquots of suspended fines were extracted using a pipette (GUTACHTERAUSSCHUSS
FORSTLICHE ANALYTIK 2005). The fractions were oven dried and weighed. After correction for the amount of dispersion agent and sample loss, the proportional amount of the silt and clay fractions were calculated.
Upland samples show pH values <6 and therefore absence of carbonates could be safely assumed. Iron oxides and iron coatings are common in tropical soils. Removal of iron oxides by sodium hydrosulphite treatment was not pursued, however. The results therefore are biased towards larger particle sizes. Given the predominance of clays the overestimation of particle size may not affect classification but may obscure clay translocation.
5.7 Magnetic susceptibility parameters
Magnetic susceptibility (χlf) was measured on a Bartington MS2B Dual Frequency Magnetic Susceptibility System at the University of York. Air dry subsamples of bulk soil were transferred to 10cm² cylindrical bottles and measured for magnetic susceptibility in a constant applied magnetic field (DEARING 1994). The obtained volume magnetic susceptibility κ [-] was transformed to mass specific
susceptibility χlf [m³ kg-3] by accounting for the known bulk density of weighted 10cm² samples. To
obtain the coefficient of frequency dependency (χfd%) magnetic susceptibility was measured at two
different frequencies 4.65 kHz (χhf) and 0.465 kHz (χlf) of the external magnetic field (DEARING 1994). The susceptibility reduction at higher frequencies is expressed as percentage frequency dependent susceptibility χfd% = (χlf � χhf)/χlf x 100.
5.8 14C AMS radiocarbon dating
Charcoal and humin fraction of soil samples were dated by measuring the decay of unstable 14C at the Waikato Radiocarbon Dating Laboratory, New Zealand and at the Centro di Datazione e Diagnostica (CEDAD) at the Dipartimento di Ingegneria dell�Innovazione, Università del Salento, Italy. Samples for radiocarbon dating were cleaned, oven dried at 105°C, weighed and submitted wrapped in aluminium foil. Laboratory pre-treatment for charcoal and soil samples included mechanical cleaning of visual contaminates like obvious recent roots and a chemical pre-treatment by acid-base-acid (ABA) wash to remove carbonates and chemical contaminants. Treatment of soil samples and bulk peat samples by acid-base-acid separated the insoluble and generally older humin fraction from the mobile humic and fulvic acids (HIGHAM 2002).
63
Conventional radiocarbon dates are reported as 14C years BP and are calibrated using the OxCal online radiocarbon date calibration program at http://c14.arch.ox.ac.uk (RAMSEY 1995). Calibration is based on the international radiocarbon curve IntCal 09 (REIMER et al. 2009). Calibrated dates are rounded to decades and are reported as years BP, ka BP, or years BC/AD.
5.9 Optical‐stimulated luminescence dating
5.9.1 Sampling and sample preparation
Samples for OSL dating were taken using black plastic gutter pipes and wrapping the samples in light-proof plastic bags (BATEMAN & ARMITAGE, pers. communication). Sample preparation was done according to the standard sample preparation protocol of the SCIDAR laboratory, University of Sheffield (BOULTER & BATEMAN 2008). Pure quartz samples were obtained under subdued red light using a series of cleaning steps involving the removal of carbonates, organic matter and finally separation of the coarse sand fraction 90-250µm. Quartz was extracted by heavy liquid separation using sodium polytungstate (density 2.7 g cm-3) from either the 90-180 or the 125-180 µm size fractions. Quartz samples were than etched for one hour with 40% HF to remove the alpha radiation affected outer layer of the quartz grains (10µm) and to eliminate potential feldspar contamination. The purity of quartz grains was checked by stimulation of a subsample with infrared light and recording of an infrared stimulated luminescence signal.
5.9.2 SAR protocol and dose recovery preheat test
A single aliquot regenerative (SAR) dose protocol (MURRAY & WINTLE 2000, 2003) was applied to determine the equivalent Dose (DE). Subsequently growth curves were established measuring five regeneration points including a zero dose to monitor recuperation of charge and a recycling point, which was used to check the sensitivity correction procedure (WINTLE & MURRAY 2006). For each sample between 24 and 35 single aliquots were measured. Aliquots with a recycling ratio outside 1 ± 0.1 were discarded. Samples were mounted on 9.8mm aluminium discs and measured by an upgraded TL-DA-12 luminescence reader (Risø National Laboratory, Roskilde, Denmark). A 150 W Halogen lamp filtered by a Schott GG-420+ SWP interference filter provided optical stimulation. Quantification of luminescence was done by a Thorn EMI 9235QA photomultiplier tube preceded by a 5mm Hoya-340 filter. A 90Sr/90Y β-source (0.061 Gy s-1) provided irradiation. Detailed descriptions of the SAR protocol, recovery preheat tests and data analyses are given in the Appendix D.1.
5.10 Loss‐on‐ignition Sequential loss-on-ignition (BALL 1964; DEAN 1974) is a cost effective standard method to estimate
organic and inorganic carbon content of a soil or sediment sample (HEIRI et al. 2001; BENGTSSON & ENELL 2003; SANTISTEBAN et al. 2004). In the present study it was envisaged that loss-on-ignition (LOI) could be applied as a rough and fast estimation of the organic matter content of colluvial deposits.
Loss-on-ignition protocols differ significantly between laboratories; therefore a standardised methodology proposed by HEIRI et al. (2001) was adopted. The amount of organic matter was determined by weight loss after ignition at 550°C. Samples and empty crucibles were oven dried at 105°C overnight and cooled down in a desiccator. Crucibles were weighed and about 3g of soil was
64
added. Samples were placed in a muffle furnace, gradually heated and ignited for 4h at 550°C. Hot crucibles were placed in a desiccator using tongs and weighed when cooled to room temperature to obtain the weight percent organic matter.
5.11 Charcoal analysis by nitric‐acid‐digestion The quantification of charcoal followed the nitric acid digestion method proposed by WINKLER
(1985) and modified by VERARDO (1997) and KURTH et al. (2006). Quantification of carbon was determined by element analysis (LAIRD & CAMPBELL 2000) to obtain absolute amounts of nitric-acid-resistant carbon (NARC). To digest the organic matter, between 0.5-3g of ground oven dry sample was transferred to Kjedahl test tubes. Concentrated nitric acid was added in steps to a total amount of about 20ml. After the initial reaction has slowed down the tubes were placed in a heating block and left to digest for 2 hours at 75°C (LAIRD & CAMPBELL 2000). The samples were then quantitatively transferred to centrifuge tubes, centrifuged and washed three times with deionised water until supernatant run clear. The residua were dried overnight at 105°C, cooled down in a desiccator and weighted to obtain sample weight after digestion. After homogenisation, a subsample was measured for elemental carbon content by a Vario CN-element analyzer, at the Environmental Department, University of York. The initial amount of nitric-acid-resistant-carbon is calculated taking into account the weight loss during digestion. Nitric-acid-resistant carbon was determined for samples from the Lomwe Swamp core and the soil profile Lomwe 10.
5.12 Pollen analysis Along the 438cm long core, 45 subsamples were prepared and pollen types were identified by
Veronica Muiruri at the Palynology and Palaeobotany Laboratory, National Museum of Kenya, Nairobi. Pollen preparation followed the standard pollen concentration method as outlined by (FÆGRI & IVERSEN 1989). Pollen grains were counted and identified on one slide per sample using a Leitz microscope at x400 magnification.
5.12.1 Pollen sum
Pollen data is presented as relative proportions of a pollen sum (BIRKS & BIRKS 1980; FÆGRI & IVERSEN 1989) based on arboreal and non-arboreal plant taxa including Poaceae. These taxa are expected to be derived predominantly from non-local vegetation, although vegetation of the basin bottom might have contributed during drier periods. Swamp taxa, aquatics, spores and taxa, which are likely to be dispersed unevenly and aberrantly due to the close vicinity of the pollen producing plants or to their particular dispersion mechanism, are excluded from the pollen sum to avoid distortion of the pollen diagram (FÆGRI & IVERSEN 1989). At Lomwe, the local swamp vegetation is represented by Cyperaceae, Liliaceae, Ludwigia, Hydrocotyle, and Typha, and omitted from the pollen sum. Monolete (reniform) and trilete spores and entomophilious Asclepiadaceae are excluded from the pollen sum.
Taxa excluded from the pollen sum are reported as percentages of the pollen sum plus themselves (BIRKS & BIRKS 1980; FÆGRI & IVERSEN 1989). No attempt was made to calculate separate pollen sums for local (basin bottom or slope vegetation) and non-local (regional) pollen types as proposed by MARCHANT & TAYLOR (2000), as the segregation of a possible dry basin bottom vegetation can not be based on objective criteria.
65
5.12.2 Pollen diagram
Pollen diagrams were constructed using C2 (JUGGINS 2007). According to their published ecological affinities (COETZEE 1967; GREENWAY 1973; LIND & MORRISON 1974; WHITE 1983; LOVETT 1993b; LOVETT & PÓCS 1993; MARCHANT 1997; MARCHANT & TAYLOR 2000; DHARANI 2002; LOVETT et al. 2006a) taxa were grouped into broad ecological classes:
• arboreal taxa typical for montane and submontane forest of the Eastern Arc Mountains, • arboreal taxa common in semi-arid bushland and woodland possibly derived from the lower
slopes and foothills of the Pare Mountains as well as by long-distance dispersal from the lowland plains of Tsavo and Mkomazi,
• arboreal, non-native, introduced forest taxa • non-arboreal taxa of shrubs and herbs, loosely grouped according to their :
o affinity to montane forests,
o reported occurrence in woodlands, clearings, and glades and
o possible association with anthropogenic disturbance or cultivation
• wetland taxa, including Cyperaceae, and insect pollinated Asclepiadaceae. • spores.
To facilitate presentation, pollen types with low abundances are excluded from the pollen diagram (GORDON & BIRKS 1972). Only taxa with a maximum percentage of more than 2% and occurring in more than one sample are presented (29 out of 72 taxa). Pollen types only occurring within one slide (i.e. one depth) cannot confidently be used as palaeoecological indicators for past environments. Additionally, a lack of representativeness due to low absolute pollen counts and strong domination by single species led to the exclusion of the seven lowermost samples below 360cm depth.
5.12.3 Numerical analysis: Zonation and ordination of pollen data
Numerical methods offer a consistent and reproducible way of analysing stratigraphic change without the use of a priori information about the process involved in its formation and therefore reduce the bias introduced by subjective zonation (BIRKS 1986). To facilitate presentation and interpretation of the data, pollen zones of similar and uniform pollen assemblages were delimited by numerical zonation. The pollen zones suggested by depth-constrained cluster analysis were then independently confirmed by a non-constrained ordination method (GORDON & BIRKS 1972; BIRKS 1986).
Pollen zones of the Lomwe Swamp were identified by using the CONISS - Constrained Incremental Sums of Squares cluster analysis (GRIMM 1987) - a hierarchical and agglomerative procedure implemented in the psimpoll program (BENNETT 2009). Before calculation of the dissimilarity matrix, proportions were recalculated and a square root transformation down-weighted abundant and up-weighted less common taxa in order to reduce the influence of outliers (BIRKS 1986; GRIMM 1987; 2009). In combination with the applied dissimilarity matrix of squared Euclidean distances (also minimum variance or Ward method), the square root transformation results in the chord distance of Edwards and Cavalli Sforza (PRENTICE 1986; GRIMM 1987). The zonation algorithm minimizes the within-zone dispersion (sum of squares) or the mean within-zone dispersion (variance) of the clusters to be formed (GRIMM 1987). In a palaeoecological context, zonation has to be stratigraphically constrained and grouping of samples is limited to adjacent samples in the direct stratigraphic vicinity.
66
As a non-constrained ordination method, principal component analysis (PCA) was carried out using PCOrd (MCCUNE & MEFFORD 1999). A linear relationship of species abundance and principal factors suggested PCA over detrended correspondence analysis (DCA) more suitable for unimodal species distribution. PCA ordinates samples in a more dimensional space and axis are chosen so as to minimise the sum of squared distances from the points to the axis (PRENTICE 1980; PRENTICE 1986). The cross product matrix was calculated via a correlation matrix, which transforms the original data to be centred and standardised to unit standard deviation. This approach assures that all species are treated as equally important (GREIG-SMITH 1983). The �arch�-effect, a common problem of ordination methods when the data set shows a gradual species turnover was not observed (PRENTICE 1986; JONGMAN et al. 1987).
For coherence, data preparation for statistical analysis followed the same criteria as for the pollen diagram. In addition, local wetland taxa and spores were excluded as zonation of the non-local pollen is aspired.
5.13 Phytolith analysis Phytoliths were extracted and classified for 40 samples from the Lomwe swamp core by Veronica
Muiruri at the Palynology and Palaeobotany Laboratory, National Museum of Kenya, Nairobi. Phytoliths extraction followed standard procedures outlined by (PIPERNO 2006). In brief, about 10-20g of sediment is shaken overnight for 24h in a dispergent agent (EDTA/Calgon) to deflocculate clay minerals and organic components. The sand fraction was segregated by wet sieving through a 250µm sieve and clays were separated by repeated gravity sedimentation. Organic matter destruction was done by cooking in concentrated nitric acid spiked with a small amount of potassium chlorate (KClO3). Phytoliths have a specific gravity of 1.5 - 2.3gcm-³ and are separated from the mineral fraction (quartz 2.65gcm-³) by heavy liquid separation. The density of the heavy liquid (zinc bromid or sodium polytungstate) is adjusted to 2.3gcm-³ and phytoliths floating on the surface are extracted washed and dried in Acetone/Ethanol and mounted on microscope slides using benzyl benzoate.
5.13.1 Phytolith classification
Phytolith types were identified and named according to the ICPN classification (MADELLA et al. 2005). Phytoliths were grouped following the classifications discussed by MULHOLLAND & RAPP (1992), PIPERNO (2006), BREMOND et al. (2008), and NEUMANN et al. (2009) and important categories are summarised in Tab. 5.
• Hair cell and hair base phytoliths are commonly produced in grasses but also by eudicots, where they occur predominantly in seeds, fruits, and leaves. Typical families include Asteraceae, Boraginaceae, Cucurbitaceae, Dilleniaceae, Moraceae, Ulmaceae, and Urticaceae.
• Globular spheres with a variety of decorations are produced in a wide range of arboreal and herbaceous monocots and eudicots but have not been isolated from grasses and therefore are indicative of forested landscapes. Spheres of monocts and eudicots tend to vary in sizes, whereas globular echinate spheres are diagnostic for palms.
• Sclerenchyma phytoliths are almost completely restricted to trees and shrubs and therefore a good indicator of forest or wooded vegetation.
• Silica bodies or short cell phytoliths are characteristic for grasses. Grass (leaf) phytoliths occur in a wide range of shapes. Generic grass phytoliths include long cells, parallepipedal and cuneiform
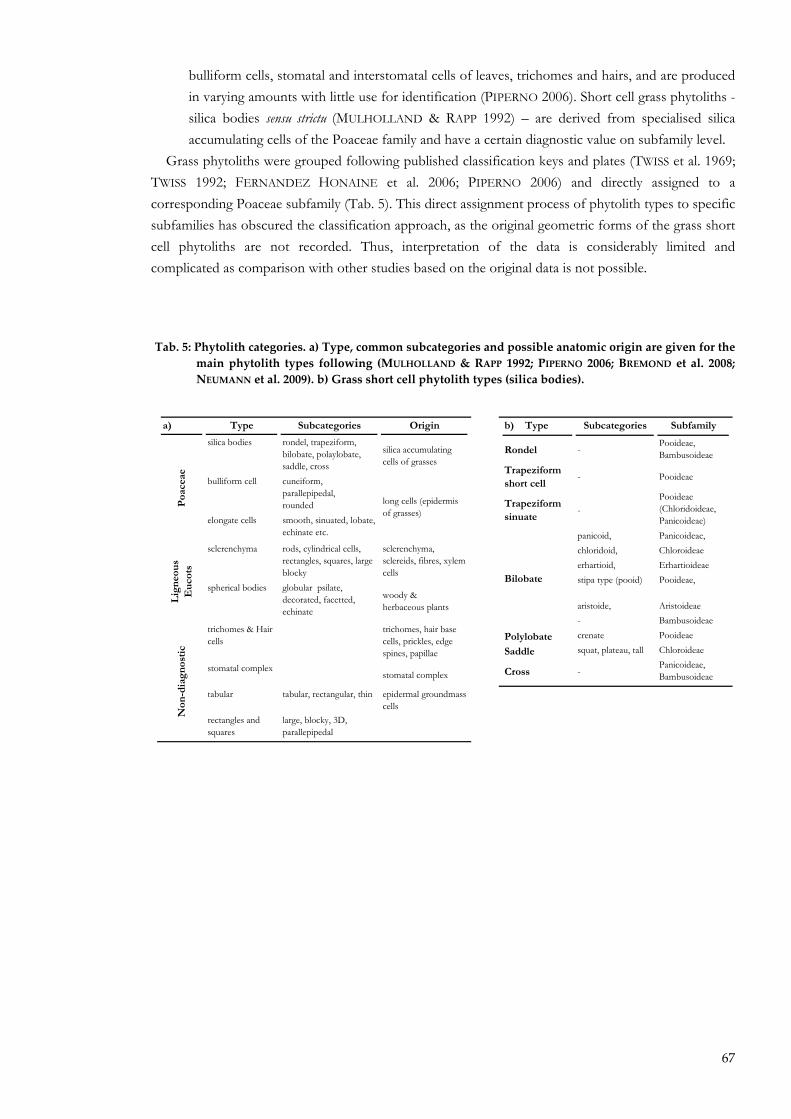
67
bulliform cells, stomatal and interstomatal cells of leaves, trichomes and hairs, and are produced in varying amounts with little use for identification (PIPERNO 2006). Short cell grass phytoliths - silica bodies sensu strictu (MULHOLLAND & RAPP 1992) � are derived from specialised silica accumulating cells of the Poaceae family and have a certain diagnostic value on subfamily level.
Grass phytoliths were grouped following published classification keys and plates (TWISS et al. 1969; TWISS 1992; FERNANDEZ HONAINE et al. 2006; PIPERNO 2006) and directly assigned to a corresponding Poaceae subfamily (Tab. 5). This direct assignment process of phytolith types to specific subfamilies has obscured the classification approach, as the original geometric forms of the grass short cell phytoliths are not recorded. Thus, interpretation of the data is considerably limited and complicated as comparison with other studies based on the original data is not possible.
Tab. 5: Phytolith categories. a) Type, common subcategories and possible anatomic origin are given for the main phytolith types following (MULHOLLAND & RAPP 1992; PIPERNO 2006; BREMOND et al. 2008; NEUMANN et al. 2009). b) Grass short cell phytolith types (silica bodies).
a) Type Subcategories Origin
silica bodies rondel, trapeziform, bilobate, polaylobate, saddle, cross
silica accumulating cells of grasses
bulliform cell cuneiform, parallepipedal, rounded
elongate cells smooth, sinuated, lobate, echinate etc.
sclerenchyma rods, cylindrical cells, rectangles, squares, large blocky
sclerenchyma, sclereids, fibres, xylem cells
spherical bodies globular psilate, decorated, facetted, echinate
woody & herbaceous plants
trichomes & Hair cells
trichomes, hair base cells, prickles, edge spines, papillae
stomatal complexstomatal complex
tabular tabular, rectangular, thin epidermal groundmass cells
rectangles and squares
large, blocky, 3D, parallepipedal
long cells (epidermis of grasses)
Poa
ceae
Lig
neo
us
Eu
cots
Non
-dia
gno
stic
b) Type Subcategories Subfamily
Rondel -Pooideae, Bambusoideae
Trapeziform short cell
- Pooideae
Trapeziform sinuate
-Pooideae (Chloridoideae, Panicoideae)
panicoid, Panicoideae,chloridoid, Chloroideaeerhartioid, Erhartioideaestipa type (pooid) Pooideae,
aristoide, Aristoideae- Bambusoideae
Polylobate crenate Pooideae
Saddle squat, plateau, tall Chloroideae
Cross -Panicoideae, Bambusoideae
Bilobate

68
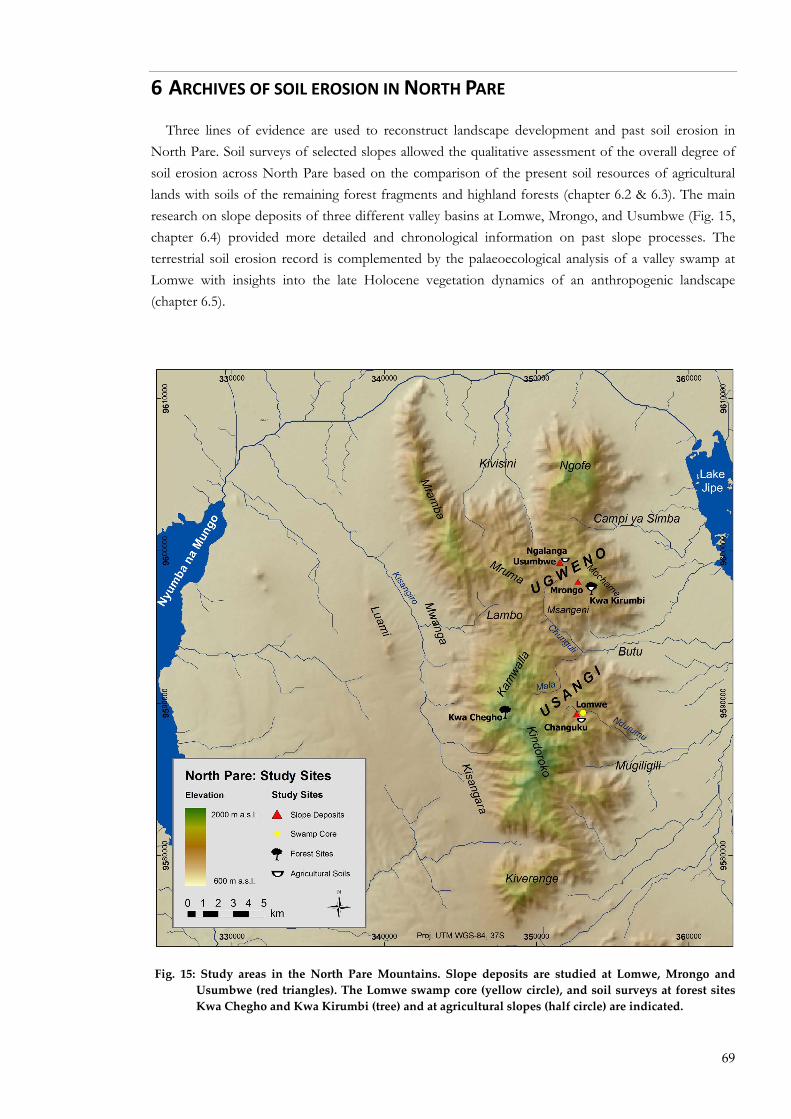
69
6 ARCHIVES OF SOIL EROSION IN NORTH PARE
Three lines of evidence are used to reconstruct landscape development and past soil erosion in North Pare. Soil surveys of selected slopes allowed the qualitative assessment of the overall degree of soil erosion across North Pare based on the comparison of the present soil resources of agricultural lands with soils of the remaining forest fragments and highland forests (chapter 6.2 & 6.3). The main research on slope deposits of three different valley basins at Lomwe, Mrongo, and Usumbwe (Fig. 15, chapter 6.4) provided more detailed and chronological information on past slope processes. The terrestrial soil erosion record is complemented by the palaeoecological analysis of a valley swamp at Lomwe with insights into the late Holocene vegetation dynamics of an anthropogenic landscape (chapter 6.5).
Fig. 15: Study areas in the North Pare Mountains. Slope deposits are studied at Lomwe, Mrongo and Usumbwe (red triangles). The Lomwe swamp core (yellow circle), and soil surveys at forest sites Kwa Chegho and Kwa Kirumbi (tree) and at agricultural slopes (half circle) are indicated.

70
6.1 Study areas The present study focuses on the anthropogenic aspect of landscape development. The study sites
were thus deliberately placed in areas shaped by agricultural land use and were distributed to cover a large (Lomwe), medium (Mrongo) and a small (Usumbwe) valley basin within the undulating upland plateau between 1200 and 1400m a.s.l.
The core settlement areas of the Pare chiefdoms Ugweno (Mrongo and Usumbwe) and Usangi (Lomwe) have been important cultural and political centres during the last 400 years (KIMAMBO 1969) and were chosen for geoarchaeological investigations of past human land use. Oral traditions collected by KIMAMBO (1969) emphasise the cultural and potentially archaeological (CHAMI 1995a) importance of Ugweno (Fig. 16). Two sites were investigated in Ugweno, the heartland of the Pare settlement: Mrongo, in the Masumbeni valley and Usumbwe, downslope of the prominent Ngalanga hill. The Ngalanga hill is the mythical origin of the Washana clan (Iron smelter) and thought to be one of the first settlement foci of the Pare occupation (KIMAMBO 1969). Locally informed archaeological surveys of the HEEAL project revealed a number of former iron smelting sites in the Ngalanga area.
Following the oral histories collected by Kimambo, immigrants from South Pare settled much later in the flat Usangi valley suggesting a slightly different settlement history of the southern and northern areas of North Pare (KIMAMBO 1969). Slope deposits were investigated at Lomwe, a small extension of the southernmost part of the Usangi valley, after a survey revealed a buried peat layer under a now partly dry valley bottom. The survey was extended along the Changuku hill to study recent soils on agricultural fields. Additionally, a core was extracted from the small Lomwe swamp and subjected to palaeoecological investigations.
In both Ugweno and Usangi, landesque capital is present. Irrigation reservoirs (ndivas), furrows (msingi) and also terraces are widespread in the Usangi valley but also occur frequently along the eastern escarpment in the Ugweno region. On the grounds of a known settlement history and anthropogenic landscape transformations (KIMAMBO 1969; SHERIDAN 2001) the areas of Ugweno and Usangi were given preference over the Mruma and Lambo basins in the north-eastern part of the Mountain range, which appear to have been less important as settlement centres (but see FOSBROOKE 1954 for archaeological evidence of market activities at Mruma).
6.2 Agricultural soils and eroded lands Most of the Pare upland is under cultivation and densely settled. The intensity of cultivation varies
and a mosaic of agricultural land use types can be observed. Perennial banana groves located generally near or downslope of homesteads and often irrigated, alternate with annually cultivated maize fields, small horticultural plots or perennial grasses providing cow fodder. Terracing and irrigation are common, particularly in the Usangi area. Evidence of soil erosion can be observed widely, particularly subsoil and saprolite exposure indicating advanced land degradation. Soil erosion varies considerably between fields according to the local land use history and the geomorphological landscape position.
To obtain a general overview about soil types and erosion stages of soils under different land use types, exemplary soil profiles were established on slopes above the study areas Usumbwe/Ngalanga and Lomwe. In each study area, a set of soils were selected representing the dominant land use and soil type. These were, in the first instance, well-managed banana groves (Kwa Kirumbi 6, Ngalanga 2) and agricultural fields on eroded slopes (Kwa Kirumbi 5, Ngalanga 3, Makongweni, Changuku 1, Changuku 2, Fig. 15).
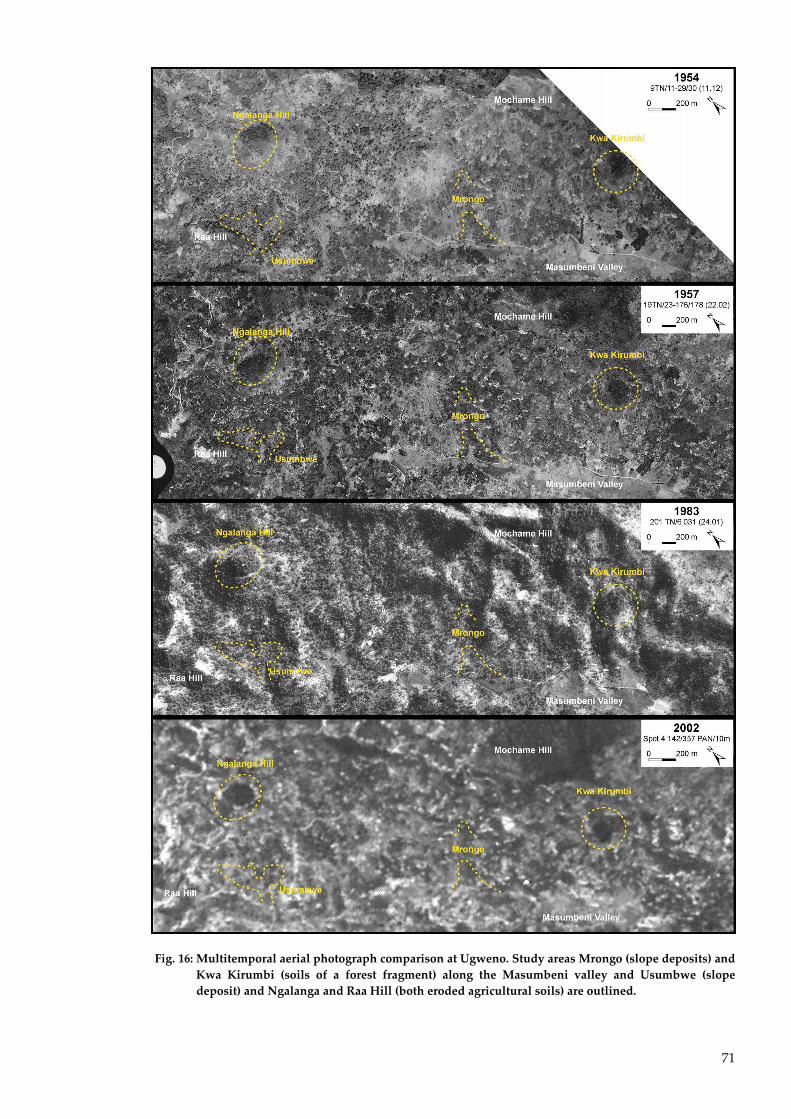
71
Fig. 16: Multitemporal aerial photograph comparison at Ugweno. Study areas Mrongo (slope deposits) and Kwa Kirumbi (soils of a forest fragment) along the Masumbeni valley and Usumbwe (slope deposit) and Ngalanga and Raa Hill (both eroded agricultural soils) are outlined.
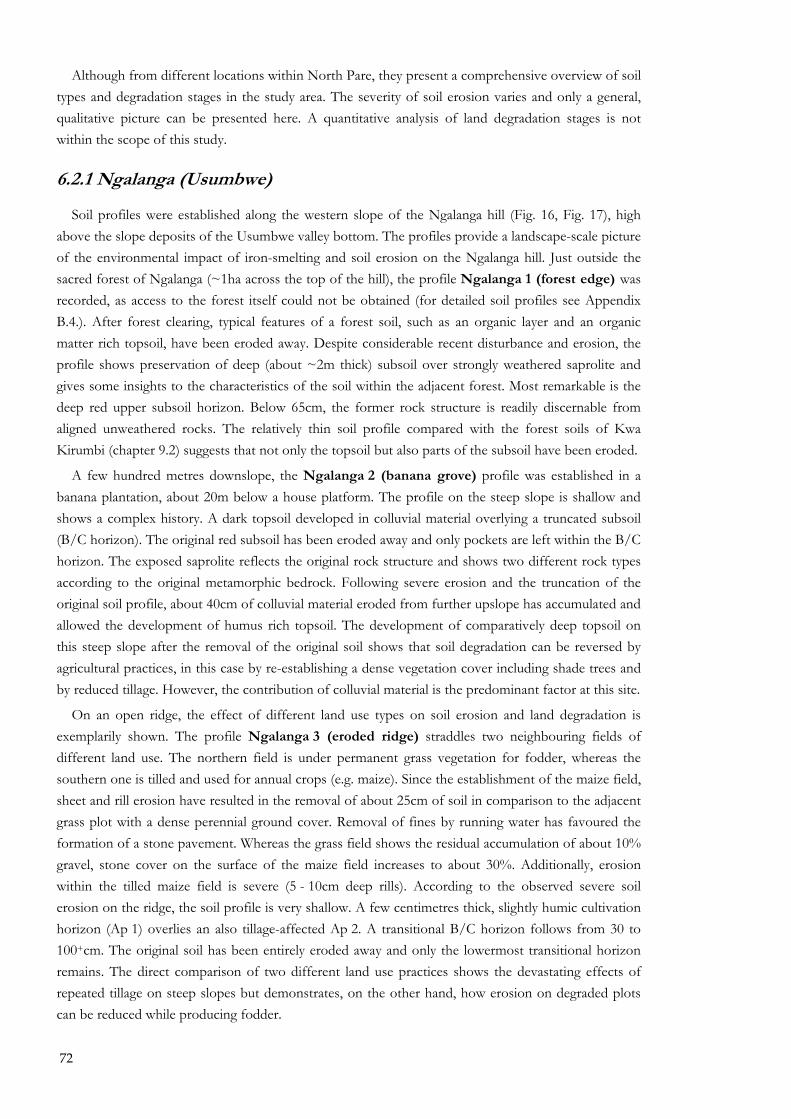
72
Although from different locations within North Pare, they present a comprehensive overview of soil types and degradation stages in the study area. The severity of soil erosion varies and only a general, qualitative picture can be presented here. A quantitative analysis of land degradation stages is not within the scope of this study.
6.2.1 Ngalanga (Usumbwe)
Soil profiles were established along the western slope of the Ngalanga hill (Fig. 16, Fig. 17), high above the slope deposits of the Usumbwe valley bottom. The profiles provide a landscape-scale picture of the environmental impact of iron-smelting and soil erosion on the Ngalanga hill. Just outside the sacred forest of Ngalanga (~1ha across the top of the hill), the profile Ngalanga 1 (forest edge) was recorded, as access to the forest itself could not be obtained (for detailed soil profiles see Appendix B.4.). After forest clearing, typical features of a forest soil, such as an organic layer and an organic matter rich topsoil, have been eroded away. Despite considerable recent disturbance and erosion, the profile shows preservation of deep (about ~2m thick) subsoil over strongly weathered saprolite and gives some insights to the characteristics of the soil within the adjacent forest. Most remarkable is the deep red upper subsoil horizon. Below 65cm, the former rock structure is readily discernable from aligned unweathered rocks. The relatively thin soil profile compared with the forest soils of Kwa Kirumbi (chapter 9.2) suggests that not only the topsoil but also parts of the subsoil have been eroded.
A few hundred metres downslope, the Ngalanga 2 (banana grove) profile was established in a banana plantation, about 20m below a house platform. The profile on the steep slope is shallow and shows a complex history. A dark topsoil developed in colluvial material overlying a truncated subsoil (B/C horizon). The original red subsoil has been eroded away and only pockets are left within the B/C horizon. The exposed saprolite reflects the original rock structure and shows two different rock types according to the original metamorphic bedrock. Following severe erosion and the truncation of the original soil profile, about 40cm of colluvial material eroded from further upslope has accumulated and allowed the development of humus rich topsoil. The development of comparatively deep topsoil on this steep slope after the removal of the original soil shows that soil degradation can be reversed by agricultural practices, in this case by re-establishing a dense vegetation cover including shade trees and by reduced tillage. However, the contribution of colluvial material is the predominant factor at this site.
On an open ridge, the effect of different land use types on soil erosion and land degradation is exemplarily shown. The profile Ngalanga 3 (eroded ridge) straddles two neighbouring fields of different land use. The northern field is under permanent grass vegetation for fodder, whereas the southern one is tilled and used for annual crops (e.g. maize). Since the establishment of the maize field, sheet and rill erosion have resulted in the removal of about 25cm of soil in comparison to the adjacent grass plot with a dense perennial ground cover. Removal of fines by running water has favoured the formation of a stone pavement. Whereas the grass field shows the residual accumulation of about 10% gravel, stone cover on the surface of the maize field increases to about 30%. Additionally, erosion within the tilled maize field is severe (5 - 10cm deep rills). According to the observed severe soil erosion on the ridge, the soil profile is very shallow. A few centimetres thick, slightly humic cultivation horizon (Ap 1) overlies an also tillage-affected Ap 2. A transitional B/C horizon follows from 30 to 100+cm. The original soil has been entirely eroded away and only the lowermost transitional horizon remains. The direct comparison of two different land use practices shows the devastating effects of repeated tillage on steep slopes but demonstrates, on the other hand, how erosion on degraded plots can be reduced while producing fodder.
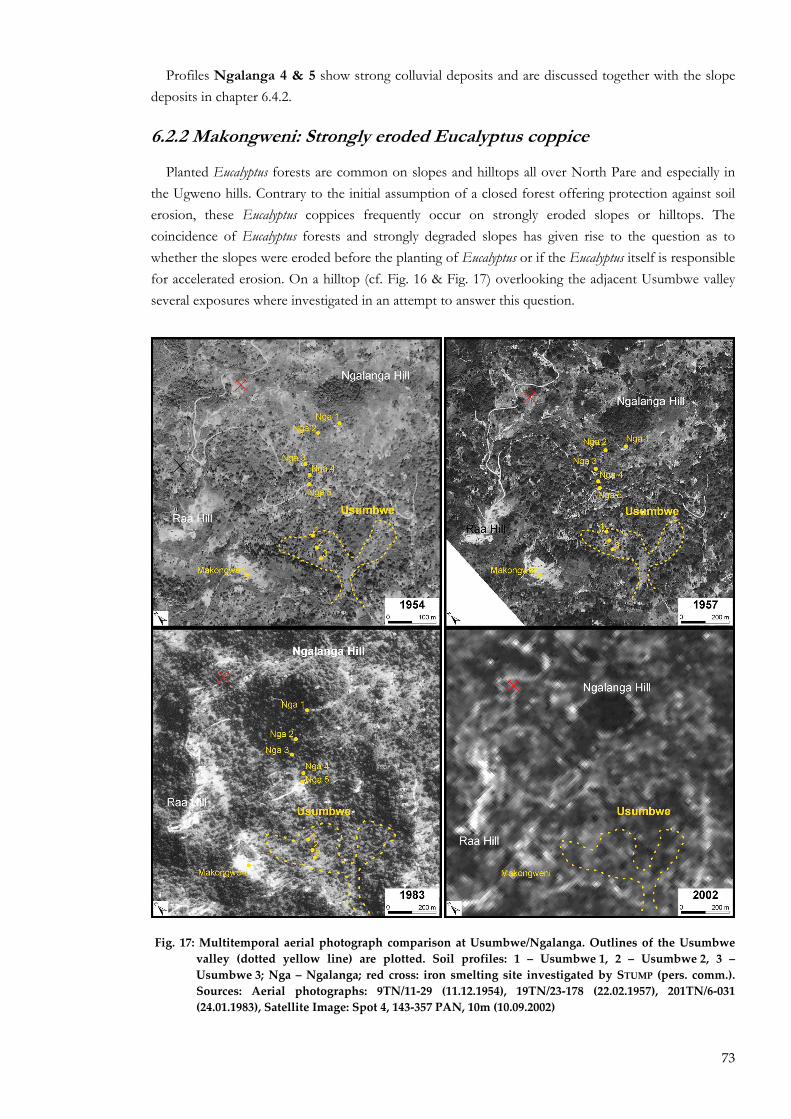
73
Profiles Ngalanga 4 & 5 show strong colluvial deposits and are discussed together with the slope deposits in chapter 6.4.2.
6.2.2 Makongweni: Strongly eroded Eucalyptus coppice
Planted Eucalyptus forests are common on slopes and hilltops all over North Pare and especially in the Ugweno hills. Contrary to the initial assumption of a closed forest offering protection against soil erosion, these Eucalyptus coppices frequently occur on strongly eroded slopes or hilltops. The coincidence of Eucalyptus forests and strongly degraded slopes has given rise to the question as to whether the slopes were eroded before the planting of Eucalyptus or if the Eucalyptus itself is responsible for accelerated erosion. On a hilltop (cf. Fig. 16 & Fig. 17) overlooking the adjacent Usumbwe valley several exposures where investigated in an attempt to answer this question.
Fig. 17: Multitemporal aerial photograph comparison at Usumbwe/Ngalanga. Outlines of the Usumbwe valley (dotted yellow line) are plotted. Soil profiles: 1 � Usumbwe 1, 2 � Usumbwe 2, 3 � Usumbwe 3; Nga � Ngalanga; red cross: iron smelting site investigated by STUMP (pers. comm.). Sources: Aerial photographs: 9TN/11‐29 (11.12.1954), 19TN/23‐178 (22.02.1957), 201TN/6‐031 (24.01.1983), Satellite Image: Spot 4, 143‐357 PAN, 10m (10.09.2002)
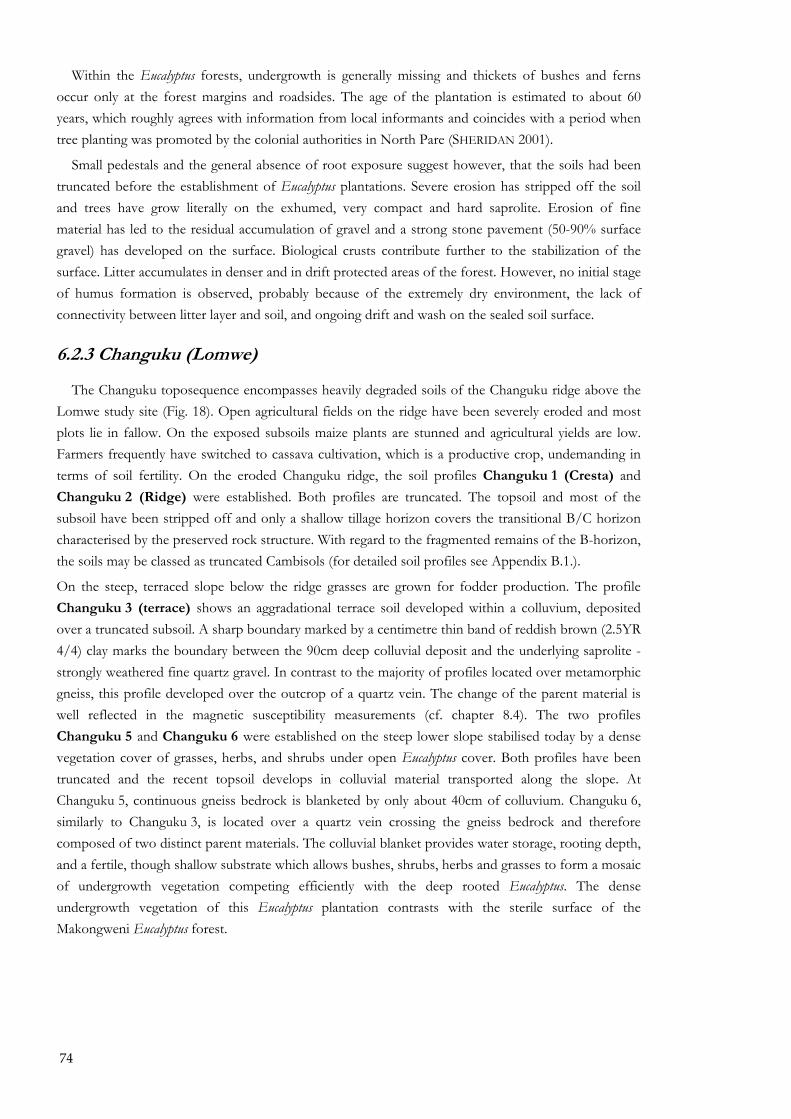
74
Within the Eucalyptus forests, undergrowth is generally missing and thickets of bushes and ferns occur only at the forest margins and roadsides. The age of the plantation is estimated to about 60 years, which roughly agrees with information from local informants and coincides with a period when tree planting was promoted by the colonial authorities in North Pare (SHERIDAN 2001).
Small pedestals and the general absence of root exposure suggest however, that the soils had been truncated before the establishment of Eucalyptus plantations. Severe erosion has stripped off the soil and trees have grow literally on the exhumed, very compact and hard saprolite. Erosion of fine material has led to the residual accumulation of gravel and a strong stone pavement (50-90% surface gravel) has developed on the surface. Biological crusts contribute further to the stabilization of the surface. Litter accumulates in denser and in drift protected areas of the forest. However, no initial stage of humus formation is observed, probably because of the extremely dry environment, the lack of connectivity between litter layer and soil, and ongoing drift and wash on the sealed soil surface.
6.2.3 Changuku (Lomwe)
The Changuku toposequence encompasses heavily degraded soils of the Changuku ridge above the Lomwe study site (Fig. 18). Open agricultural fields on the ridge have been severely eroded and most plots lie in fallow. On the exposed subsoils maize plants are stunned and agricultural yields are low. Farmers frequently have switched to cassava cultivation, which is a productive crop, undemanding in terms of soil fertility. On the eroded Changuku ridge, the soil profiles Changuku 1 (Cresta) and Changuku 2 (Ridge) were established. Both profiles are truncated. The topsoil and most of the subsoil have been stripped off and only a shallow tillage horizon covers the transitional B/C horizon characterised by the preserved rock structure. With regard to the fragmented remains of the B-horizon, the soils may be classed as truncated Cambisols (for detailed soil profiles see Appendix B.1.).
On the steep, terraced slope below the ridge grasses are grown for fodder production. The profile Changuku 3 (terrace) shows an aggradational terrace soil developed within a colluvium, deposited over a truncated subsoil. A sharp boundary marked by a centimetre thin band of reddish brown (2.5YR 4/4) clay marks the boundary between the 90cm deep colluvial deposit and the underlying saprolite - strongly weathered fine quartz gravel. In contrast to the majority of profiles located over metamorphic gneiss, this profile developed over the outcrop of a quartz vein. The change of the parent material is well reflected in the magnetic susceptibility measurements (cf. chapter 8.4). The two profiles Changuku 5 and Changuku 6 were established on the steep lower slope stabilised today by a dense vegetation cover of grasses, herbs, and shrubs under open Eucalyptus cover. Both profiles have been truncated and the recent topsoil develops in colluvial material transported along the slope. At Changuku 5, continuous gneiss bedrock is blanketed by only about 40cm of colluvium. Changuku 6, similarly to Changuku 3, is located over a quartz vein crossing the gneiss bedrock and therefore composed of two distinct parent materials. The colluvial blanket provides water storage, rooting depth, and a fertile, though shallow substrate which allows bushes, shrubs, herbs and grasses to form a mosaic of undergrowth vegetation competing efficiently with the deep rooted Eucalyptus. The dense undergrowth vegetation of this Eucalyptus plantation contrasts with the sterile surface of the Makongweni Eucalyptus forest.
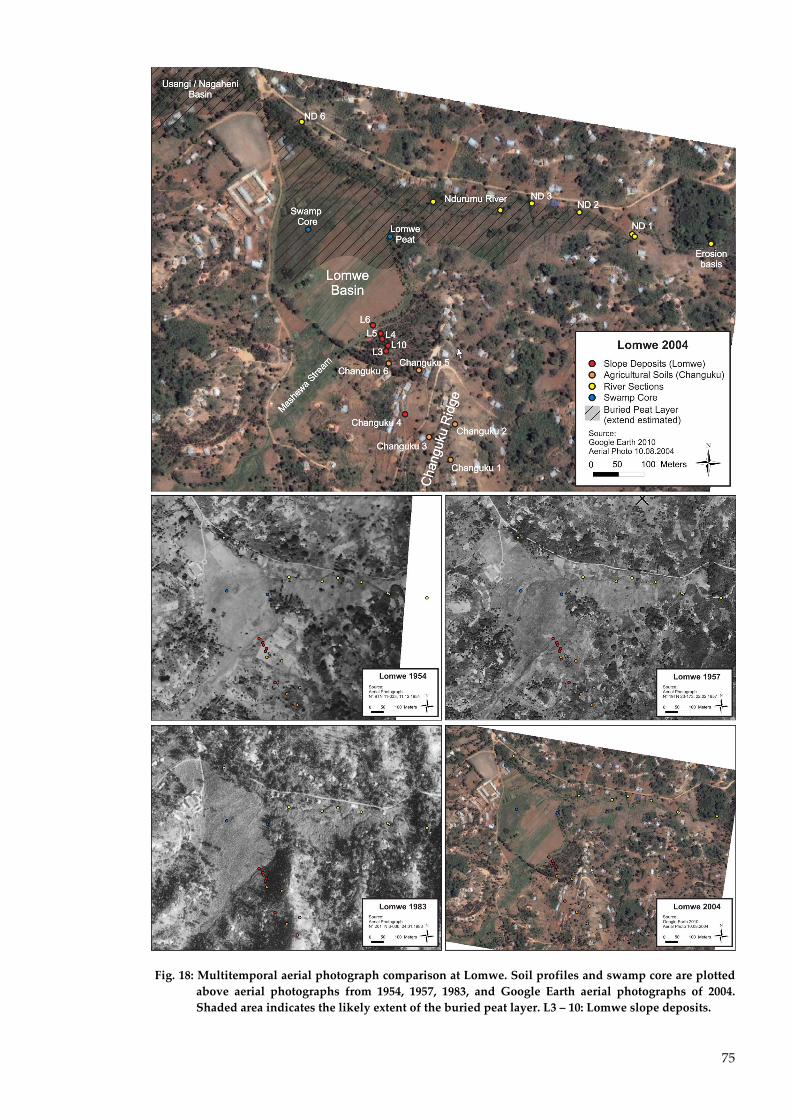
75
Fig. 18: Multitemporal aerial photograph comparison at Lomwe. Soil profiles and swamp core are plotted above aerial photographs from 1954, 1957, 1983, and Google Earth aerial photographs of 2004. Shaded area indicates the likely extent of the buried peat layer. L3 � 10: Lomwe slope deposits.

76
6.2.4 Kwa Kirumbi: Agricultural soils
A mosaic of agricultural land use can be found in the direct vicinity of the Kwa Kirumbi forest - well managed terraced banana groves with shade trees and irrigation channels as well as strongly eroded maize and cassava fields on unterraced slopes (Fig. 16). The soil Kwa Kirumbi 6 (banana
grove) represents a stabilised slope, where terracing, manure application and the constant vegetation cover of a banana plantation effectively reduced the erosion hazard, although accumulation of surface gravel and incipient sheet and rill erosion were recorded. At Kwa Kirumbi 5 (eroded slope) in contrast, severe rill erosion has cut up to 10cm deep channels into the bare soil surface sealed by puddle erosion and only a sparse fallow vegetation of cow grass (Miscanthus spp.) grows here (for detailed soil profiles see Appendix B.6.).
Hoeing, the local method of tillage, has led to the creation of a �plough� or better tillage horizon of varying depth. Accumulation of organic material on the ground is only observed within shaded areas and in fields where tillage is reduced, such as shaded banana groves. The bright soil colours indicate a generally low amount of organic matter within the soil. Whereas the well managed banana grove has a dark brown (7.5YR 3/3; moist) topsoil, the cultivation horizon of the eroded slope is much brighter (yellowish red 5YR 4/6, moist) and can only be recognised by a slightly granular soil structure and the apparent incorporation of colluvic material during tillage. Soil depths were estimated following auger survey. Impenetrable saprolite was encountered at 215cm depth at Kwa Kirumbi 6 and within only 105cm at the eroded site. Frequent rock outcrops in the vicinity of Kwa Kirumbi 5 further suggest an advanced thinning of the soil layer.
6.3 Forest soils and Sacred Groves Forest soils were investigated at two sites: Kwa Chegho and Kwa Kirumbi. The Kwa Chegho
Mountain is a closed, but disturbed forest environment at about 1800 m a.s.l. on the western slopes of the mountain block. Within the elevation range of the main zone of settlement and agriculture between 1200 - 1500m a.s.l. only a few contiguous forest patches with a size sufficient to retain the original vegetation and soil characteristics remain. Due to their importance as sacred groves, access to and research on these is restricted. Fortunately, access was negotiated for Kwa Kirumbi forest, a small forest remnant on the border between Mbore and Malekano village in Masumbeni/Ugweno, which allowed the establishment of several soil profiles in a surviving section of intact mid-altitude forest.
6.3.1 Kwa Chegho forest
Kwa Chegho mountain is located on the central North Pare mountain ridge between the summits of Kamwalla (1920m a.s.l.) and Kindoroko (2112m a.s.l.). Early aerial photographs taken in 1954 and 1957 show, that the Kwa Chegho and Kamwalla mountains had been almost entirely deforested in the first part of the 20th century (Fig. 19). In 1954, only scattered remnants of natural forest remained, mainly as small belts around the Chegho swamp margin, along streams and on a few ridges. Most of the slopes and hilltops were either bare or covered by low vegetation. A network of paths indicates intensive use of the area, which must have gone beyond the initial clearance, firewood collection and probably included grazing of animals. Three years later in 1957, regrowth of secondary vegetation is observed. During the following decades, forests recovered and by 1983 succession stages of secondary forest cover most slopes. Over time, canopies of forest fragments grew together, gaps closed and forest established itself again as the dominant vegetation type. Reforestation was supported by the
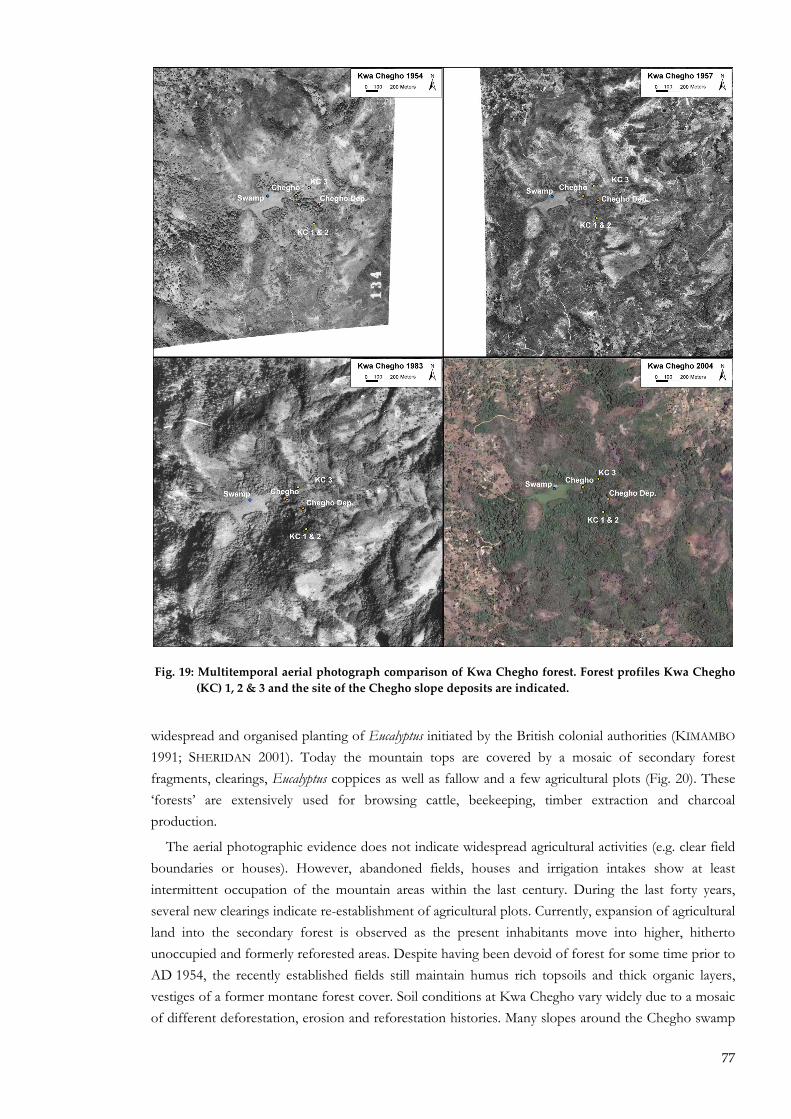
77
widespread and organised planting of Eucalyptus initiated by the British colonial authorities (KIMAMBO 1991; SHERIDAN 2001). Today the mountain tops are covered by a mosaic of secondary forest fragments, clearings, Eucalyptus coppices as well as fallow and a few agricultural plots (Fig. 20). These �forests� are extensively used for browsing cattle, beekeeping, timber extraction and charcoal production.
The aerial photographic evidence does not indicate widespread agricultural activities (e.g. clear field boundaries or houses). However, abandoned fields, houses and irrigation intakes show at least intermittent occupation of the mountain areas within the last century. During the last forty years, several new clearings indicate re-establishment of agricultural plots. Currently, expansion of agricultural land into the secondary forest is observed as the present inhabitants move into higher, hitherto unoccupied and formerly reforested areas. Despite having been devoid of forest for some time prior to AD 1954, the recently established fields still maintain humus rich topsoils and thick organic layers, vestiges of a former montane forest cover. Soil conditions at Kwa Chegho vary widely due to a mosaic of different deforestation, erosion and reforestation histories. Many slopes around the Chegho swamp
Fig. 19: Multitemporal aerial photograph comparison of Kwa Chegho forest. Forest profiles Kwa Chegho (KC) 1, 2 & 3 and the site of the Chegho slope deposits are indicated.
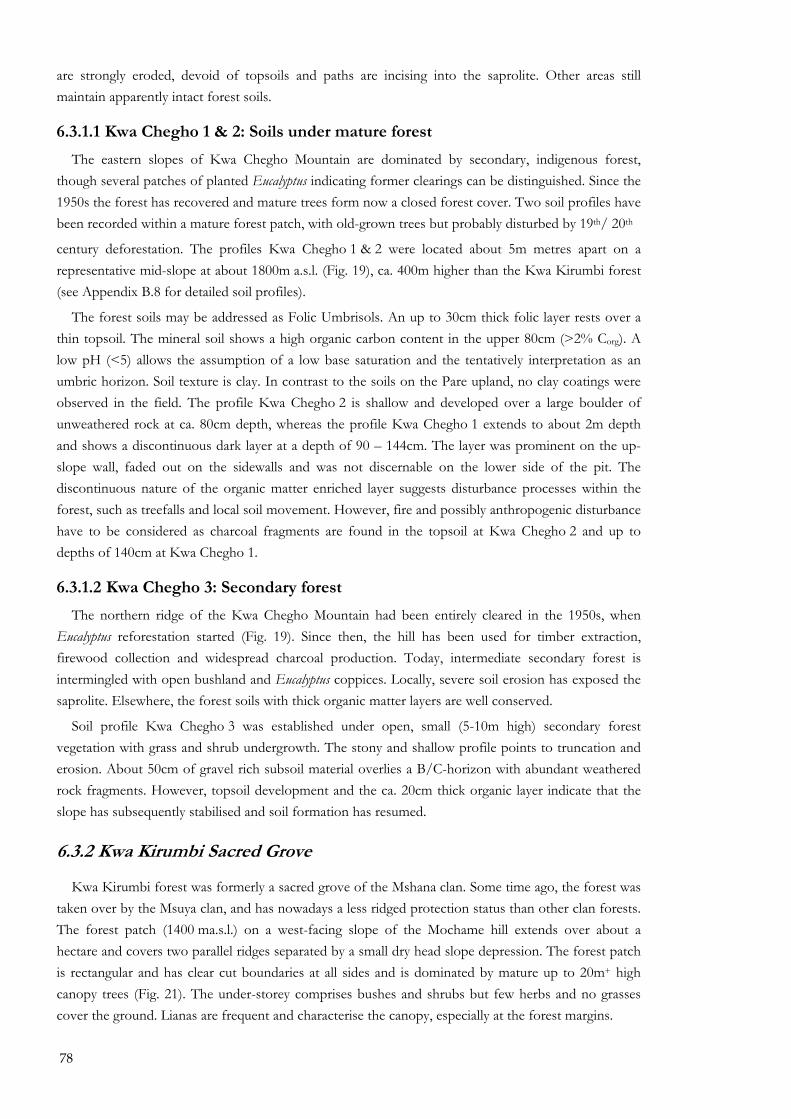
78
are strongly eroded, devoid of topsoils and paths are incising into the saprolite. Other areas still maintain apparently intact forest soils.
6.3.1.1 Kwa Chegho 1 & 2: Soils under mature forest
The eastern slopes of Kwa Chegho Mountain are dominated by secondary, indigenous forest, though several patches of planted Eucalyptus indicating former clearings can be distinguished. Since the 1950s the forest has recovered and mature trees form now a closed forest cover. Two soil profiles have been recorded within a mature forest patch, with old-grown trees but probably disturbed by 19th/ 20th
century deforestation. The profiles Kwa Chegho 1 & 2 were located about 5m metres apart on a representative mid-slope at about 1800m a.s.l. (Fig. 19), ca. 400m higher than the Kwa Kirumbi forest (see Appendix B.8 for detailed soil profiles).
The forest soils may be addressed as Folic Umbrisols. An up to 30cm thick folic layer rests over a thin topsoil. The mineral soil shows a high organic carbon content in the upper 80cm (>2% Corg). A low pH (<5) allows the assumption of a low base saturation and the tentatively interpretation as an umbric horizon. Soil texture is clay. In contrast to the soils on the Pare upland, no clay coatings were observed in the field. The profile Kwa Chegho 2 is shallow and developed over a large boulder of unweathered rock at ca. 80cm depth, whereas the profile Kwa Chegho 1 extends to about 2m depth and shows a discontinuous dark layer at a depth of 90 � 144cm. The layer was prominent on the up-slope wall, faded out on the sidewalls and was not discernable on the lower side of the pit. The discontinuous nature of the organic matter enriched layer suggests disturbance processes within the forest, such as treefalls and local soil movement. However, fire and possibly anthropogenic disturbance have to be considered as charcoal fragments are found in the topsoil at Kwa Chegho 2 and up to depths of 140cm at Kwa Chegho 1.
6.3.1.2 Kwa Chegho 3: Secondary forest
The northern ridge of the Kwa Chegho Mountain had been entirely cleared in the 1950s, when Eucalyptus reforestation started (Fig. 19). Since then, the hill has been used for timber extraction, firewood collection and widespread charcoal production. Today, intermediate secondary forest is intermingled with open bushland and Eucalyptus coppices. Locally, severe soil erosion has exposed the saprolite. Elsewhere, the forest soils with thick organic matter layers are well conserved.
Soil profile Kwa Chegho 3 was established under open, small (5-10m high) secondary forest vegetation with grass and shrub undergrowth. The stony and shallow profile points to truncation and erosion. About 50cm of gravel rich subsoil material overlies a B/C-horizon with abundant weathered rock fragments. However, topsoil development and the ca. 20cm thick organic layer indicate that the slope has subsequently stabilised and soil formation has resumed.
6.3.2 Kwa Kirumbi Sacred Grove
Kwa Kirumbi forest was formerly a sacred grove of the Mshana clan. Some time ago, the forest was taken over by the Msuya clan, and has nowadays a less ridged protection status than other clan forests. The forest patch (1400 ma.s.l.) on a west-facing slope of the Mochame hill extends over about a hectare and covers two parallel ridges separated by a small dry head slope depression. The forest patch is rectangular and has clear cut boundaries at all sides and is dominated by mature up to 20m+ high canopy trees (Fig. 21). The under-storey comprises bushes and shrubs but few herbs and no grasses cover the ground. Lianas are frequent and characterise the canopy, especially at the forest margins.
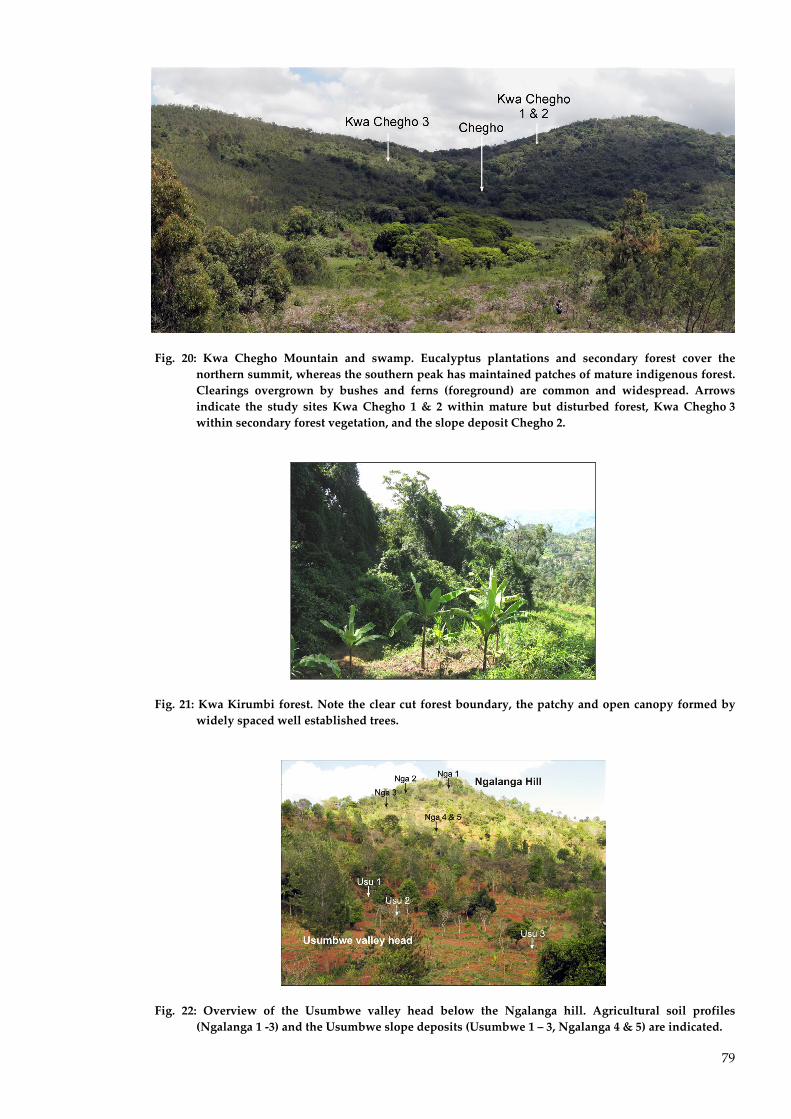
79
Fig. 20: Kwa Chegho Mountain and swamp. Eucalyptus plantations and secondary forest cover the northern summit, whereas the southern peak has maintained patches of mature indigenous forest. Clearings overgrown by bushes and ferns (foreground) are common and widespread. Arrows indicate the study sites Kwa Chegho 1 & 2 within mature but disturbed forest, Kwa Chegho 3 within secondary forest vegetation, and the slope deposit Chegho 2.
Fig. 21: Kwa Kirumbi forest. Note the clear cut forest boundary, the patchy and open canopy formed by widely spaced well established trees.
Fig. 22: Overview of the Usumbwe valley head below the Ngalanga hill. Agricultural soil profiles (Ngalanga 1 ‐3) and the Usumbwe slope deposits (Usumbwe 1 � 3, Ngalanga 4 & 5) are indicated.

80
Despite its protection as a communal forest, Kwa Kirumbi forest is strongly encroached upon by local farmers. Occasional firewood extraction and reports of organised extraction of organic soil layers for manure purposes (Ahadi Msuya 2010, pers. comm.), as well as numerous canopy gaps and evidence of selective logging are indicators of heavy pressure on the forest ecology. The evidence from the established forest soil profiles confirms a complex history of disturbance and intervention.
6.3.2.1 Kwa Kirumbi 1 - 4: Soils of forest fragments
Four soil profiles were recorded within Kwa Kirumbi forest (Fig. 23). Two soil pits were excavated on a west facing ridge; on top of the crest (Kwa Kirumbi 1) and on the upper slope (Kwa Kirumbi 2). Two further profiles were established via auger survey at the bottom of the adjacent head slope depression (Kwa Kirumbi 4) and on the corresponding steep slope (Kwa Kirumbi 3).
The most distinctive feature of the investigated forest soils is the prominent organic layer composed of litter and partly decomposed organic material held together by a very dense root mat. The thickness of the organic layer varies between 5 and 30cm. Bioturbation and decomposition however have ensured the incorporation of enough mineralogenic material so as to prevent its classification as a folic horizon at most locations. The dark, organic carbon rich topsoils can be classified as umbric mineral horizons (>1% Corg, >50cm) if the low pH (<4.5) of the mineral soil is accepted to indicate a low base saturation (for detailed soil profiles and analytical results see Appendix B.7). Elevated pH values between 5 and 6 measured for the organic layer reflects the base pump effect and the release of basic cations during humus decomposition.
The depth of the studied soil profiles generally exceeds 2m. The intensive dark red colours (5 - 2.5YR) of the subsoils are indicative of rubification. Below approximately 1.5m depth, subsoil development is less pronounced and gradually bright yellowish and whitish colours indicated increasing amounts of unweathered soil material. At the transition to the saprolite, unweathered rock fragments become more frequent, the clay content decreases and pH increases slightly. The soil texture throughout the topsoil and subsoils is clay (>40% clay). A texture change to clay loam is only recorded at about 100cm depth in the comparatively shallow profile on the ridge (Kwa Kirumbi 1). Clay coatings were observed in the subsoil (50 - 120cm) of Kwa Kirumbi 1 & 2, however the lack of an increase in clay content prevents the delimitation of an argillic Bt horizon (cf. chapter 5.6). Despite the corroboration of clay illuviation, the soils are tentatively classified as Acrisols. Alternatively, the soils might belong to the Nitisols reference group, although no nutty aggregates have been observed.
Soil profile Kwa Kirumbi 2 (upper slope) reveals that disturbance is a common feature within this sacred grove. A buried Ah horizon was identified between 35 and 55cm depth. The buried topsoil is overlain by mineral soil and a recent organic horizon. A high number of potsherds (20 fragments) as well as charcoal fragments were recovered from the buried topsoil and the colluvial overburden. Occurrence of potsherds is also recorded from the topsoil of Kwa Kirumbi 1 (forest ridge); although here no charcoal was recovered.
Disturbance and even soil movement is also suggested by a preliminary auger survey of the small head slope depression at Kwa Kirumbi 4. About 3m of homogeneous colluvial material with frequent occurrence of charcoal rest over a distinctly brighter material. Together with charcoal fragments up to a depth of 125cm at the steep forested slope of Kwa Kirumbi 3 this suggests reworking and incorporation of charcoal during material movem/ent along the slope and a deep colluvial deposit in the valley bottom.
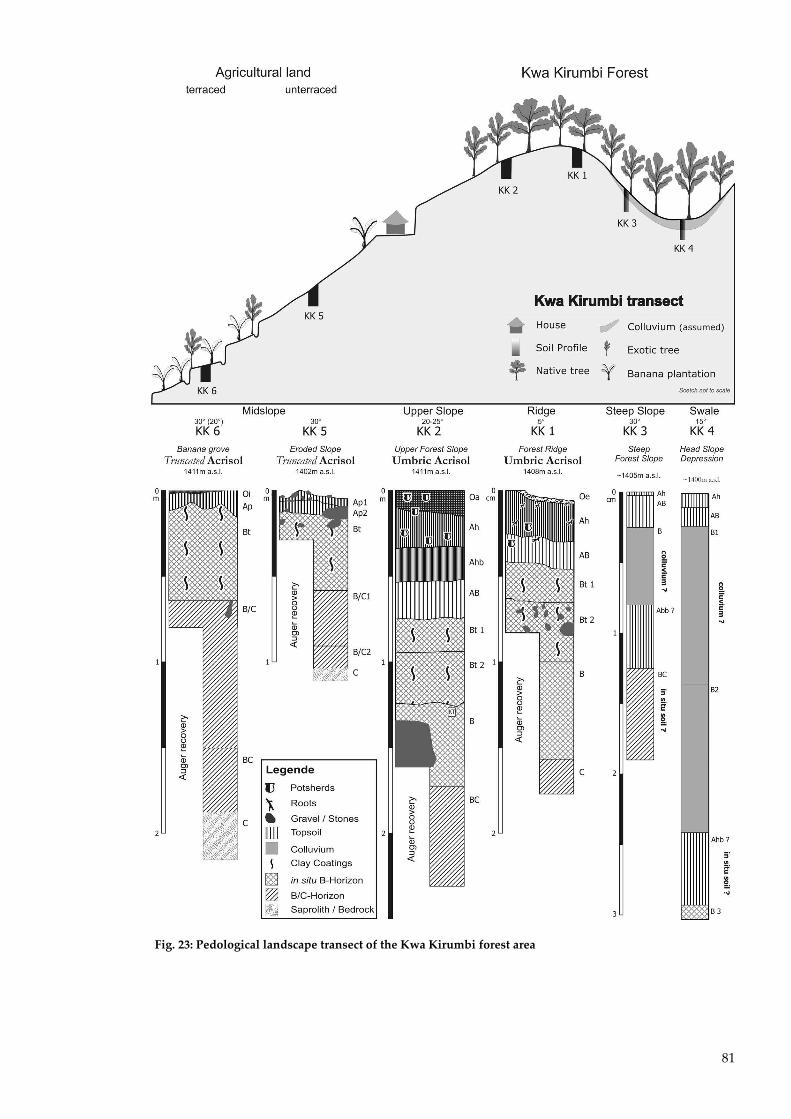
81
Fig. 23: Pedological landscape transect of the Kwa Kirumbi forest area

82
6.4 Slope Deposits: The terrestrial record This chapter provides an overview of the three study areas Mrongo, Usumbwe and Lomwe, their
most recent land use history and a short introduction to the stratigraphy of their colluvial deposits. Analytical results are presented in detail and context in chapter 7. As a representative example, profile Mrongo 10 is presented here, whereas detailed descriptions of the stratigraphy and the analytical results of each profile can be found in the Appendix B.
6.4.1 Mrongo
6.4.1.1 Mrongo creek
At the heart of Ugweno, the elongated Msumbeni valley stretches from Kifula village in the north to Minja High School in the south (Fig. 16). The area is densely populated and cultivated. The western slopes of the valley descend straight into the valley swamp and only valley bottom sediments are likely to be preserved. The eastern slopes of the Mochame Mountain (~ 1600 a.sl.) are longer, more gentle and seasonal streams have created a number of small creeks. The Mrongo creek was chosen as study site due to a reduced housing density and a gentle footslope suggesting accumulation of slope deposits (Fig. 24). The slopes retreat about 200m from the main valley to form the small creek of the seasonal Mrongo stream. Incised in a small channel on the slope, the stream spreads out on the valley bottom forming localised sand fans.
Aerial photographs of the Mrongo area taken in 1954 and 1957 show that only one small fragment of forest had remained into the 20th century (Fig. 25). Particular during the first part of the 20th century, open fields and relative few trees characterised the Ugweno landscape. Only within the last 40 years, large-scale tree planting has created a mosaic of agricultural and wooded land, which dominates the impression of the Pare landscape today. Banana groves are represented by homogeneous areas of intermediate grey, widespread on the 1954 and 1957 aerial photographs, as banana leaves create a homogeneous dark reflection signal. High reflection and bright grey colours mirror bare soil, tillaged fields or fallow vegetation with low ground cover. Compared with the bare ridge to the north and slopes higher upper the mountain the Mrongo catchment has maintained a relatively high vegetation cover, mainly because of the banana plantation, which persisted in place throughout the 20th century. (cf. Fig. 16).
The creek is intensively cultivated and well-managed agroforestry plots have been established. Banana (Musa spp.), coffee (Coffea sp.), taro (Colocasia esculenta, cocoyam) and pepper are grown under dispersed shade trees and accompanied by beans and maize as seasonal crops. The soil is covered by a discontinuous organic layer (Oi-horizon) of plant remains (litter, most importantly banana leaves), which are partly incorporated into the plough horizon by hoeing.
6.4.1.2 Slope deposits
At the Mrongo creek (Fig. 24, Fig. 27) between 4.5m (Mrongo 4) and 7.5m (Mrongo 3) of colluvial deposits bury a former stable ground surface (unit I) characterised by dark buried topsoils, about 10cm thick, which developed over about 2m of subsoil before auger survey indicates saprolite.
Three different phases of slope deposit formation have been identified. The lower half of the deposit (unit II) is made up of brown (7.5YR 5/4, dry) to reddish brown (5YR 4/4, moist) clay with few weathered gravel, occasional occurrence of dark, organic matter rich aggregates, clay coatings, and the presence of charcoal.
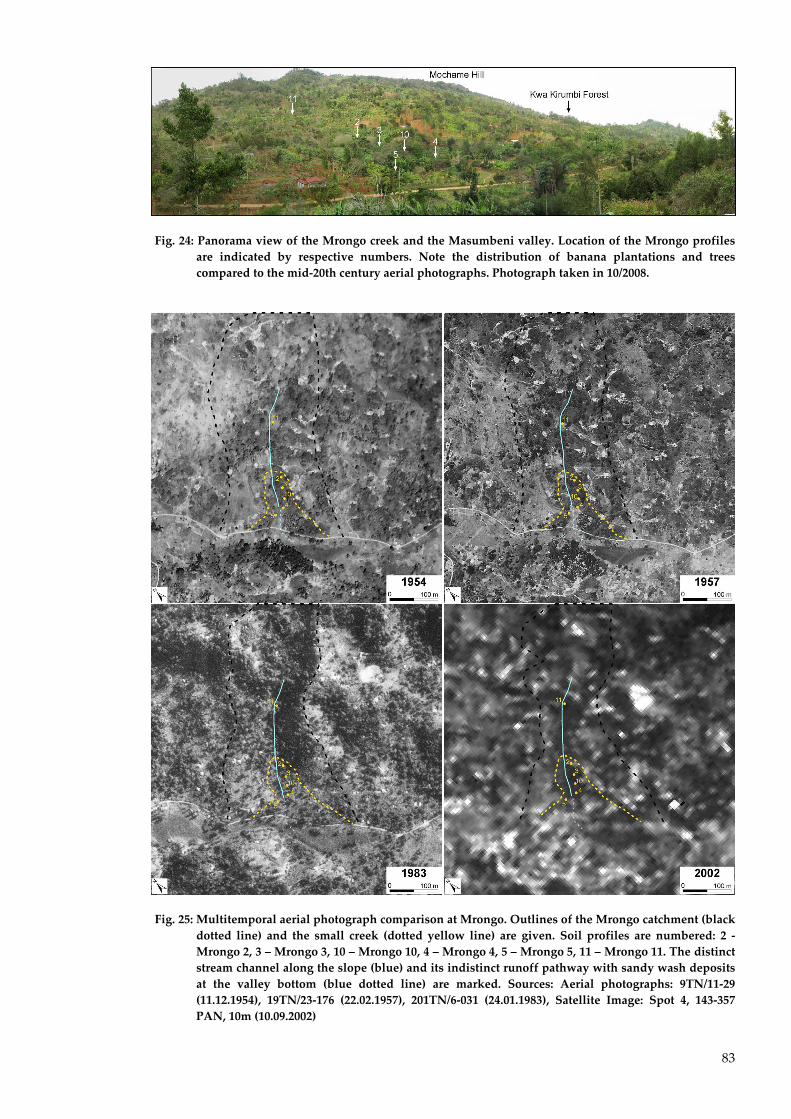
83
Fig. 24: Panorama view of the Mrongo creek and the Masumbeni valley. Location of the Mrongo profiles are indicated by respective numbers. Note the distribution of banana plantations and trees compared to the mid‐20th century aerial photographs. Photograph taken in 10/2008.
Fig. 25: Multitemporal aerial photograph comparison at Mrongo. Outlines of the Mrongo catchment (black dotted line) and the small creek (dotted yellow line) are given. Soil profiles are numbered: 2 ‐ Mrongo 2, 3 � Mrongo 3, 10 � Mrongo 10, 4 � Mrongo 4, 5 � Mrongo 5, 11 � Mrongo 11. The distinct stream channel along the slope (blue) and its indistinct runoff pathway with sandy wash deposits at the valley bottom (blue dotted line) are marked. Sources: Aerial photographs: 9TN/11‐29 (11.12.1954), 19TN/23‐176 (22.02.1957), 201TN/6‐031 (24.01.1983), Satellite Image: Spot 4, 143‐357 PAN, 10m (10.09.2002)
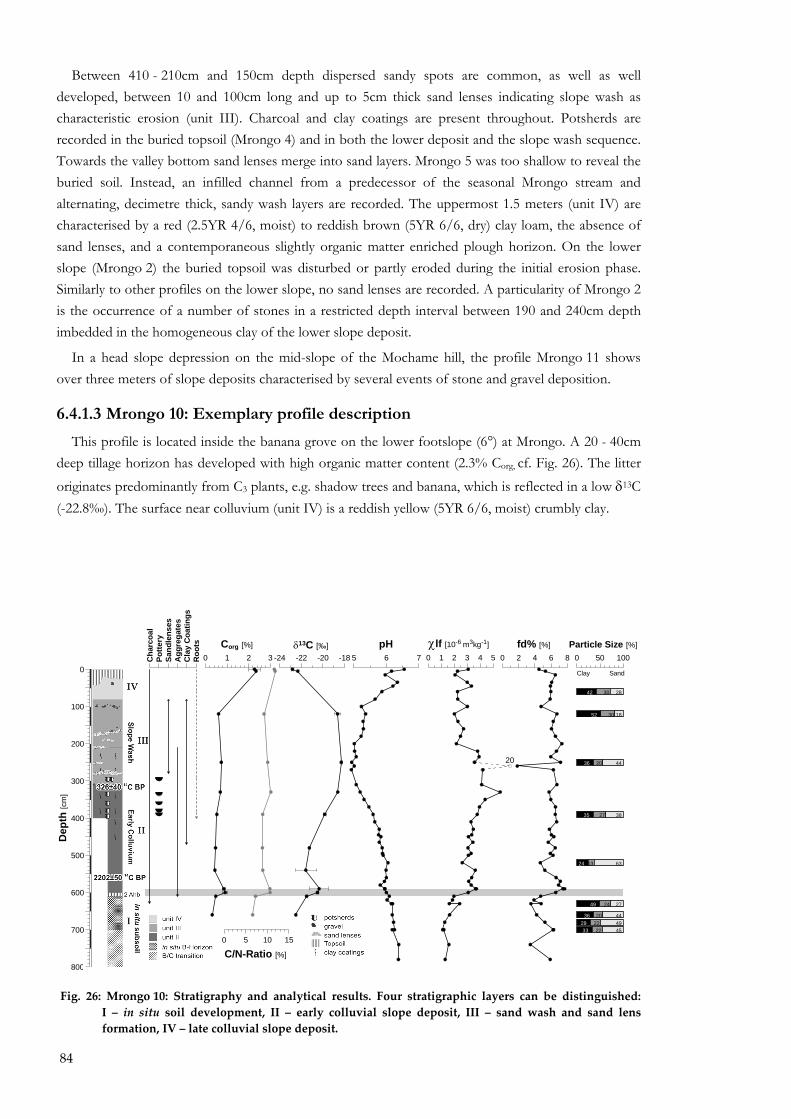
84
Between 410 - 210cm and 150cm depth dispersed sandy spots are common, as well as well developed, between 10 and 100cm long and up to 5cm thick sand lenses indicating slope wash as characteristic erosion (unit III). Charcoal and clay coatings are present throughout. Potsherds are recorded in the buried topsoil (Mrongo 4) and in both the lower deposit and the slope wash sequence. Towards the valley bottom sand lenses merge into sand layers. Mrongo 5 was too shallow to reveal the buried soil. Instead, an infilled channel from a predecessor of the seasonal Mrongo stream and alternating, decimetre thick, sandy wash layers are recorded. The uppermost 1.5 meters (unit IV) are characterised by a red (2.5YR 4/6, moist) to reddish brown (5YR 6/6, dry) clay loam, the absence of sand lenses, and a contemporaneous slightly organic matter enriched plough horizon. On the lower slope (Mrongo 2) the buried topsoil was disturbed or partly eroded during the initial erosion phase. Similarly to other profiles on the lower slope, no sand lenses are recorded. A particularity of Mrongo 2 is the occurrence of a number of stones in a restricted depth interval between 190 and 240cm depth imbedded in the homogeneous clay of the lower slope deposit.
In a head slope depression on the mid-slope of the Mochame hill, the profile Mrongo 11 shows over three meters of slope deposits characterised by several events of stone and gravel deposition.
6.4.1.3 Mrongo 10: Exemplary profile description
This profile is located inside the banana grove on the lower footslope (6°) at Mrongo. A 20 - 40cm deep tillage horizon has developed with high organic matter content (2.3% Corg, cf. Fig. 26). The litter originates predominantly from C3 plants, e.g. shadow trees and banana, which is reflected in a low δ13C (-22.8�). The surface near colluvium (unit IV) is a reddish yellow (5YR 6/6, moist) crumbly clay.
Clay Sand
42
52
36
35
24
49
362933
30
30
20
27
13
24
202222
28
18
44
38
63
27
444945
0 50 100Particle Size [%]
0 2 4 6 8fd% [%]
20
0 1 2 3 4 5
χlf [10-6 m3kg-1]
5 6 7pH
0 5 10 15
C/N-Ratio [%]
-24 -22 -20 -18δ13C [‰]
0 1 2 3Corg [%]
800
700
600
500
400
300
200
100
0
Dep
th [c
m]
Cha
rcoa
lPo
ttery
Sand
lens
esA
ggre
gate
s C
lay
Coa
tings
Roo
ts
Fig. 26: Mrongo 10: Stratigraphy and analytical results. Four stratigraphic layers can be distinguished: I � in situ soil development, II � early colluvial slope deposit, III � sand wash and sand lens formation, IV � late colluvial slope deposit.
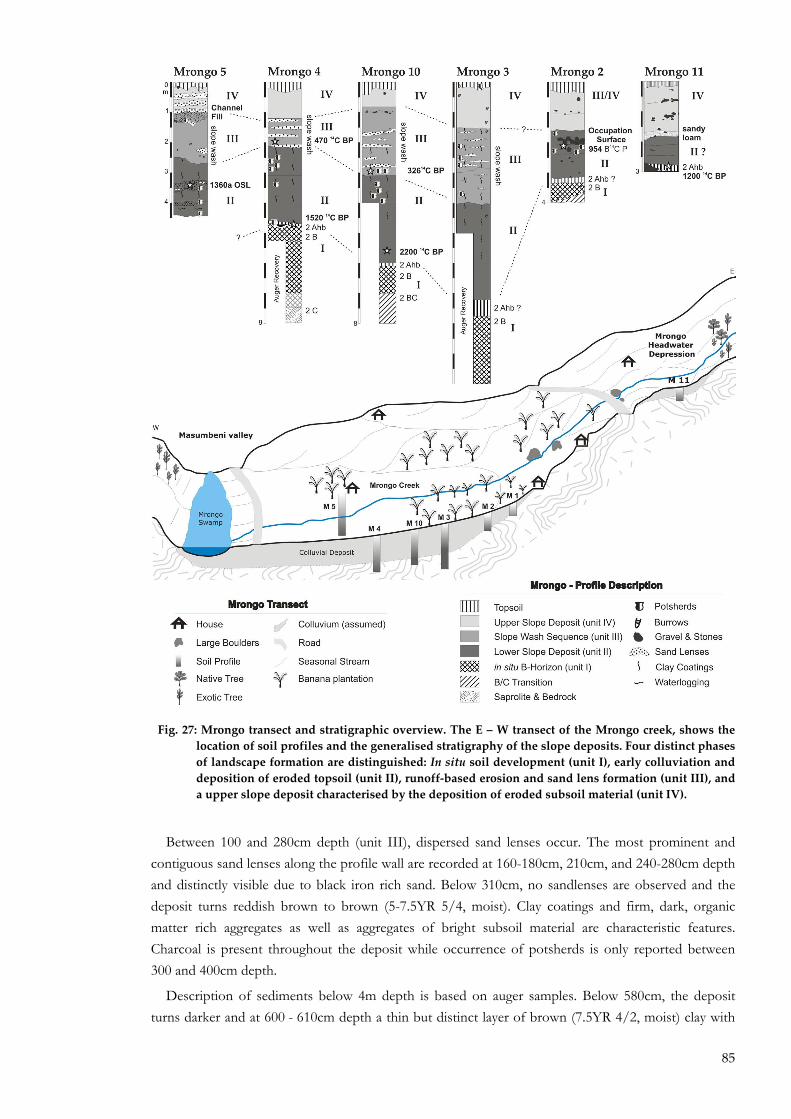
85
Fig. 27: Mrongo transect and stratigraphic overview. The E � W transect of the Mrongo creek, shows the location of soil profiles and the generalised stratigraphy of the slope deposits. Four distinct phases of landscape formation are distinguished: In situ soil development (unit I), early colluviation and deposition of eroded topsoil (unit II), runoff‐based erosion and sand lens formation (unit III), and a upper slope deposit characterised by the deposition of eroded subsoil material (unit IV).
Between 100 and 280cm depth (unit III), dispersed sand lenses occur. The most prominent and contiguous sand lenses along the profile wall are recorded at 160-180cm, 210cm, and 240-280cm depth and distinctly visible due to black iron rich sand. Below 310cm, no sandlenses are observed and the deposit turns reddish brown to brown (5-7.5YR 5/4, moist). Clay coatings and firm, dark, organic matter rich aggregates as well as aggregates of bright subsoil material are characteristic features. Charcoal is present throughout the deposit while occurrence of potsherds is only reported between 300 and 400cm depth.
Description of sediments below 4m depth is based on auger samples. Below 580cm, the deposit turns darker and at 600 - 610cm depth a thin but distinct layer of brown (7.5YR 4/2, moist) clay with
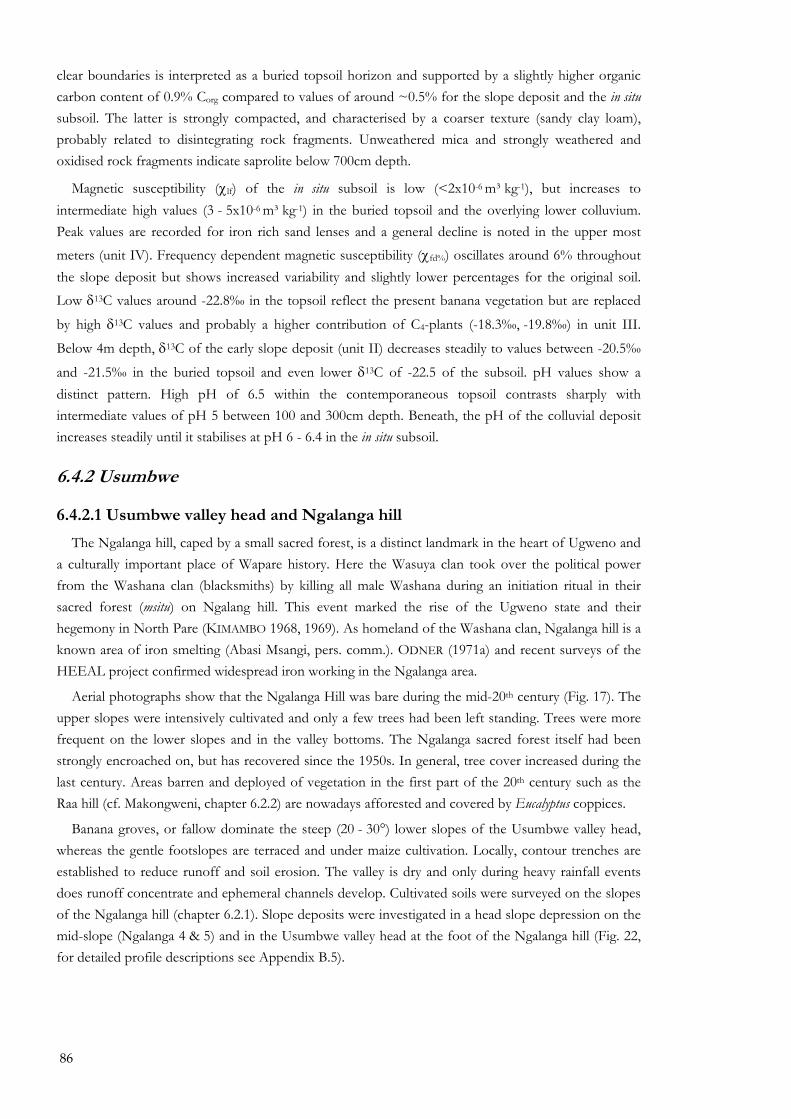
86
clear boundaries is interpreted as a buried topsoil horizon and supported by a slightly higher organic carbon content of 0.9% Corg compared to values of around ~0.5% for the slope deposit and the in situ subsoil. The latter is strongly compacted, and characterised by a coarser texture (sandy clay loam), probably related to disintegrating rock fragments. Unweathered mica and strongly weathered and oxidised rock fragments indicate saprolite below 700cm depth.
Magnetic susceptibility (χlf) of the in situ subsoil is low (<2x10⁻⁶ m³ kg-1), but increases to intermediate high values (3 - 5x10⁻⁶ m³ kg-1) in the buried topsoil and the overlying lower colluvium. Peak values are recorded for iron rich sand lenses and a general decline is noted in the upper most meters (unit IV). Frequency dependent magnetic susceptibility (χfd%) oscillates around 6% throughout the slope deposit but shows increased variability and slightly lower percentages for the original soil. Low δ13C values around -22.8� in the topsoil reflect the present banana vegetation but are replaced
by high δ13C values and probably a higher contribution of C4-plants (-18.3�, -19.8�) in unit III.
Below 4m depth, δ13C of the early slope deposit (unit II) decreases steadily to values between -20.5�
and -21.5� in the buried topsoil and even lower δ13C of -22.5 of the subsoil. pH values show a distinct pattern. High pH of 6.5 within the contemporaneous topsoil contrasts sharply with intermediate values of pH 5 between 100 and 300cm depth. Beneath, the pH of the colluvial deposit increases steadily until it stabilises at pH 6 - 6.4 in the in situ subsoil.
6.4.2 Usumbwe
6.4.2.1 Usumbwe valley head and Ngalanga hill
The Ngalanga hill, caped by a small sacred forest, is a distinct landmark in the heart of Ugweno and a culturally important place of Wapare history. Here the Wasuya clan took over the political power from the Washana clan (blacksmiths) by killing all male Washana during an initiation ritual in their sacred forest (msitu) on Ngalang hill. This event marked the rise of the Ugweno state and their hegemony in North Pare (KIMAMBO 1968, 1969). As homeland of the Washana clan, Ngalanga hill is a known area of iron smelting (Abasi Msangi, pers. comm.). ODNER (1971a) and recent surveys of the HEEAL project confirmed widespread iron working in the Ngalanga area.
Aerial photographs show that the Ngalanga Hill was bare during the mid-20th century (Fig. 17). The upper slopes were intensively cultivated and only a few trees had been left standing. Trees were more frequent on the lower slopes and in the valley bottoms. The Ngalanga sacred forest itself had been strongly encroached on, but has recovered since the 1950s. In general, tree cover increased during the last century. Areas barren and deployed of vegetation in the first part of the 20th century such as the Raa hill (cf. Makongweni, chapter 6.2.2) are nowadays afforested and covered by Eucalyptus coppices.
Banana groves, or fallow dominate the steep (20 - 30°) lower slopes of the Usumbwe valley head, whereas the gentle footslopes are terraced and under maize cultivation. Locally, contour trenches are established to reduce runoff and soil erosion. The valley is dry and only during heavy rainfall events does runoff concentrate and ephemeral channels develop. Cultivated soils were surveyed on the slopes of the Ngalanga hill (chapter 6.2.1). Slope deposits were investigated in a head slope depression on the mid-slope (Ngalanga 4 & 5) and in the Usumbwe valley head at the foot of the Ngalanga hill (Fig. 22, for detailed profile descriptions see Appendix B.5).
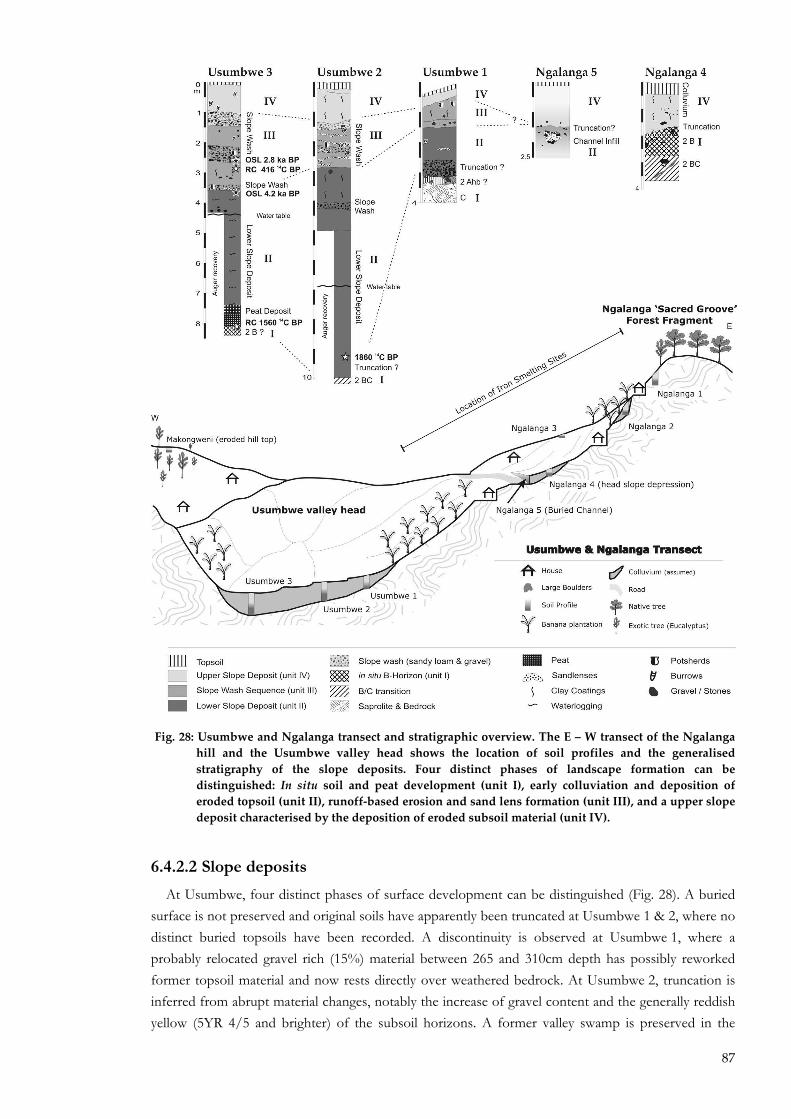
87
Fig. 28: Usumbwe and Ngalanga transect and stratigraphic overview. The E � W transect of the Ngalanga hill and the Usumbwe valley head shows the location of soil profiles and the generalised stratigraphy of the slope deposits. Four distinct phases of landscape formation can be distinguished: In situ soil and peat development (unit I), early colluviation and deposition of eroded topsoil (unit II), runoff‐based erosion and sand lens formation (unit III), and a upper slope deposit characterised by the deposition of eroded subsoil material (unit IV).
6.4.2.2 Slope deposits
At Usumbwe, four distinct phases of surface development can be distinguished (Fig. 28). A buried surface is not preserved and original soils have apparently been truncated at Usumbwe 1 & 2, where no distinct buried topsoils have been recorded. A discontinuity is observed at Usumbwe 1, where a probably relocated gravel rich (15%) material between 265 and 310cm depth has possibly reworked former topsoil material and now rests directly over weathered bedrock. At Usumbwe 2, truncation is inferred from abrupt material changes, notably the increase of gravel content and the generally reddish yellow (5YR 4/5 and brighter) of the subsoil horizons. A former valley swamp is preserved in the
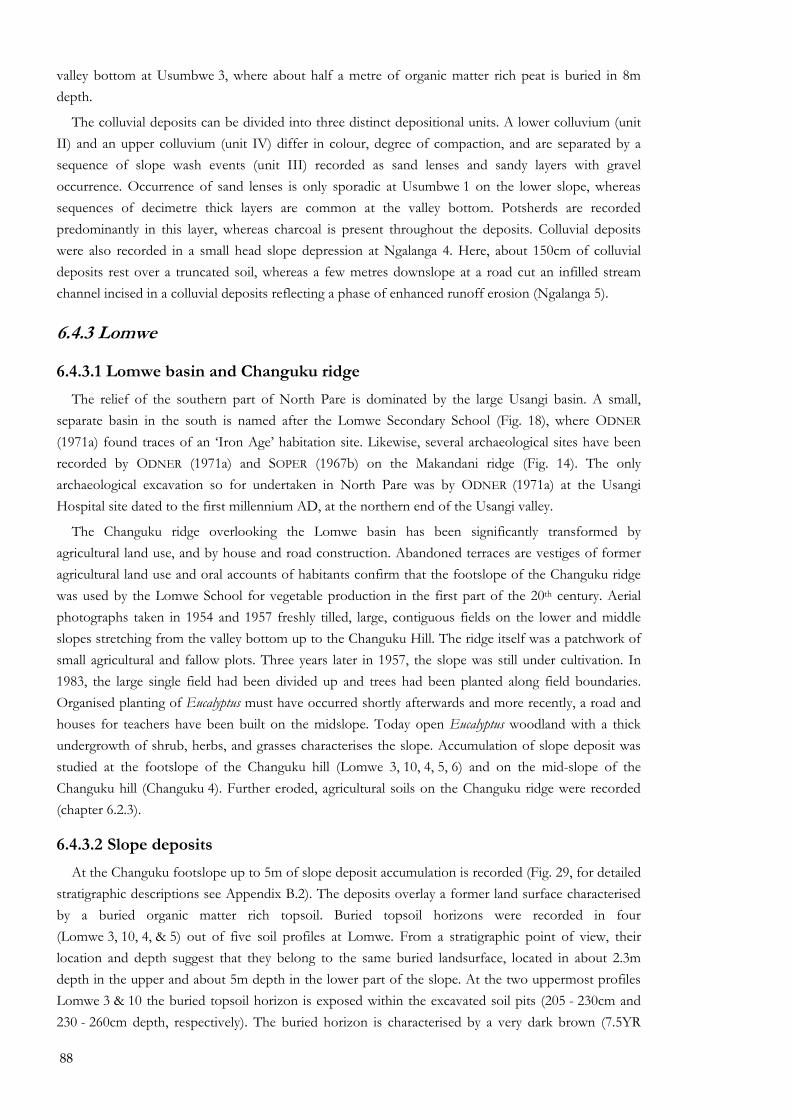
88
valley bottom at Usumbwe 3, where about half a metre of organic matter rich peat is buried in 8m depth.
The colluvial deposits can be divided into three distinct depositional units. A lower colluvium (unit II) and an upper colluvium (unit IV) differ in colour, degree of compaction, and are separated by a sequence of slope wash events (unit III) recorded as sand lenses and sandy layers with gravel occurrence. Occurrence of sand lenses is only sporadic at Usumbwe 1 on the lower slope, whereas sequences of decimetre thick layers are common at the valley bottom. Potsherds are recorded predominantly in this layer, whereas charcoal is present throughout the deposits. Colluvial deposits were also recorded in a small head slope depression at Ngalanga 4. Here, about 150cm of colluvial deposits rest over a truncated soil, whereas a few metres downslope at a road cut an infilled stream channel incised in a colluvial deposits reflecting a phase of enhanced runoff erosion (Ngalanga 5).
6.4.3 Lomwe
6.4.3.1 Lomwe basin and Changuku ridge
The relief of the southern part of North Pare is dominated by the large Usangi basin. A small, separate basin in the south is named after the Lomwe Secondary School (Fig. 18), where ODNER (1971a) found traces of an �Iron Age� habitation site. Likewise, several archaeological sites have been recorded by ODNER (1971a) and SOPER (1967b) on the Makandani ridge (Fig. 14). The only archaeological excavation so for undertaken in North Pare was by ODNER (1971a) at the Usangi Hospital site dated to the first millennium AD, at the northern end of the Usangi valley.
The Changuku ridge overlooking the Lomwe basin has been significantly transformed by agricultural land use, and by house and road construction. Abandoned terraces are vestiges of former agricultural land use and oral accounts of habitants confirm that the footslope of the Changuku ridge was used by the Lomwe School for vegetable production in the first part of the 20th century. Aerial photographs taken in 1954 and 1957 freshly tilled, large, contiguous fields on the lower and middle slopes stretching from the valley bottom up to the Changuku Hill. The ridge itself was a patchwork of small agricultural and fallow plots. Three years later in 1957, the slope was still under cultivation. In 1983, the large single field had been divided up and trees had been planted along field boundaries. Organised planting of Eucalyptus must have occurred shortly afterwards and more recently, a road and houses for teachers have been built on the midslope. Today open Eucalyptus woodland with a thick undergrowth of shrub, herbs, and grasses characterises the slope. Accumulation of slope deposit was studied at the footslope of the Changuku hill (Lomwe 3, 10, 4, 5, 6) and on the mid-slope of the Changuku hill (Changuku 4). Further eroded, agricultural soils on the Changuku ridge were recorded (chapter 6.2.3).
6.4.3.2 Slope deposits
At the Changuku footslope up to 5m of slope deposit accumulation is recorded (Fig. 29, for detailed stratigraphic descriptions see Appendix B.2). The deposits overlay a former land surface characterised by a buried organic matter rich topsoil. Buried topsoil horizons were recorded in four (Lomwe 3, 10, 4, & 5) out of five soil profiles at Lomwe. From a stratigraphic point of view, their location and depth suggest that they belong to the same buried landsurface, located in about 2.3m depth in the upper and about 5m depth in the lower part of the slope. At the two uppermost profiles Lomwe 3 & 10 the buried topsoil horizon is exposed within the excavated soil pits (205 - 230cm and 230 - 260cm depth, respectively). The buried horizon is characterised by a very dark brown (7.5YR
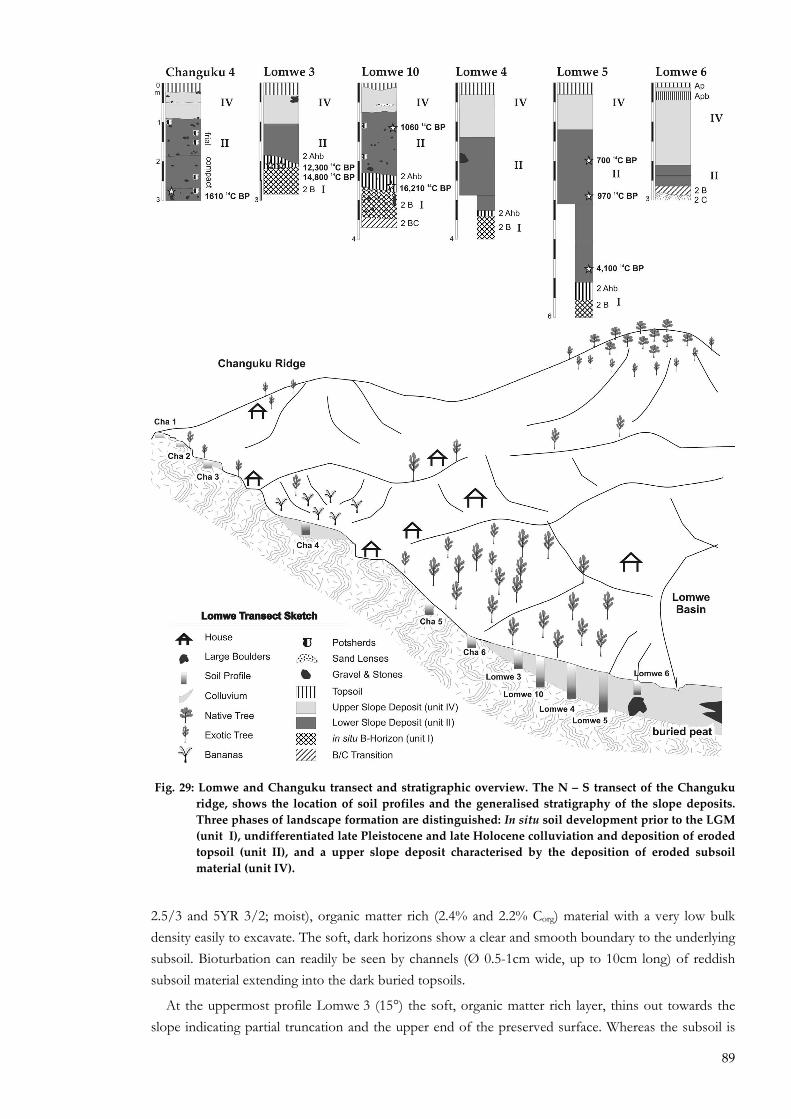
89
2.5/3 and 5YR 3/2; moist), organic matter rich (2.4% and 2.2% Corg) material with a very low bulk density easily to excavate. The soft, dark horizons show a clear and smooth boundary to the underlying subsoil. Bioturbation can readily be seen by channels (Ø 0.5-1cm wide, up to 10cm long) of reddish subsoil material extending into the dark buried topsoils.
At the uppermost profile Lomwe 3 (15°) the soft, organic matter rich layer, thins out towards the slope indicating partial truncation and the upper end of the preserved surface. Whereas the subsoil is
Fig. 29: Lomwe and Changuku transect and stratigraphic overview. The N � S transect of the Changuku ridge, shows the location of soil profiles and the generalised stratigraphy of the slope deposits. Three phases of landscape formation are distinguished: In situ soil development prior to the LGM (unit I), undifferentiated late Pleistocene and late Holocene colluviation and deposition of eroded topsoil (unit II), and a upper slope deposit characterised by the deposition of eroded subsoil material (unit IV).
90
characterised by a high stone content (many 30% gravel and stones) at Lomwe 3, a transition horizon (ABb) at Lomwe 10 grades into a red (2.5YR 4/5, moist) subsoil horizon with many (20%) coarse gravel and a very high bulk density. Clay coatings were observed within the original subsoil. At Lomwe 4 & 5 samples of dark reddish brown (7.5YR and 5YR 2.5/2, moist), organic matter rich (1.9% and 2.4%, respectively) soil layers in a depth exceeding 3m were only obtained via auger survey. The dark layers rest consistently above a lighter coloured horizons characterised by higher gravel content, interpreted as in situ subsoil.
The slope deposits burying the former land surface can be separated into a lower, earlier deposit characterised by a low bulk density, dark colours and the presence of different types of aggregates and an upper, later colluvium with a high bulk density and reddish colours and sand admixture. Most pronounced are the characteristics of the slope deposits immediately overlying the buried topsoils at Lomwe 3 and Lomwe 10. At both profiles the former topsoils are buried by about 1 to 1.5m of reddish brown (5YR 4/4, moist), soft and crumbly soil material, with a low to moderate bulk density (for details see Tab. 11). This early slope deposit is readily recognised as such by its soft character and the heterogeneity of its materials: a variety of different weathered rock types, the occurrence of dark, organic matter rich aggregates as well as distinct aggregates of reddish material, common occurrence of charcoal and occasional occurrence of potsherds. In the lower part of this layer distinguishable aggregates of buried topsoil material are mixed into the deposit. No clay coatings are observed in this lower slope deposit.
The upper 1 - 1.5m of deposits at all Lomwe profiles are bright reddish in colour and much denser than the underlying lower colluvium. Gravel content tends to be lower (<5%) and organic matter rich aggregates are not found. At Lomwe 3 and 10 these are distinct, homogeneous red (2.5YR 4/6 � 5/7; moist) clays with a high bulk density. Sand lenses are recorded from between 50cm and 75cm depth at Lomwe 10.
Upper and lower deposits are much more homogeneous at Lomwe 4 and Lomwe 5. The transitions are gradual in colour, density and gravel content and boundaries are diffuse. Though less distinct, colour and bulk density differences as well as the presence of clay coatings are recorded. No buried soil or surface is recorded at the lowermost profile (Lomwe 6), where 3m of deposits rest over bedrock or a large boulder, impeding further excavation. Bulk densities are high throughout this profile and comparable to the upper deposition unit. In the light of much deeper deposits a few metres upslope and only a thin weathering zone between the deposit and the weathered rock it is likely that a large boulder translocated during a strong (tectonic?) instability event was buried here.
6.5 Lomwe Swamp: The palaeoecological record
Under the sediments of the Lomwe basin, an organic matter rich peat layer was discovered, indicating that strong and rapid environmental changes have taken place in the past (Fig. 18). The small permanent wetland in the northeastern part of the Lomwe basin offered the possibility to extract an undisturbed swamp core for stratigraphic and palaeoecological analysis.
6.5.1 Study Site: Lomwe Basin
The Usangi basin is the result of NW-SE oriented faulting, having resulted in an elongated and oversised basin ideal for capturing sediments. Infilled with sediments, swamps have developed on the flat basin bottom. The drainage pattern is tectonically controlled and water of the extensive former
91
Ngagheni swamp (�Ngaghe� grass - Cyperus rotundus - is reported to have formerly grown in the swampy valley bottom of the Usangi basin SHERIDAN 2001) in the Usangi valley drains both north via the Mala to the Chunguli river and south via the Ndurumu stream. The Ngagheni swamp was drained in the 20th century and since has become important for horticulture cultivation (SHERIDAN 2001).
The Lomwe basin is separated from the main Usangi valley by a small hillock, allowing a certain hydrological independence from the main basin as discussed below. The Lomwe basin was drained by the school in the first part of the 20th century and is nowadays intensively cultivated. Only a small wetland remained in the north-eastern part of the Lomwe basin. The original Mashewa stream is strongly reduced due to water management and drainage by a number of parallel furrows. The former stream channel on the southern edge of the basin is nowadays partly abandoned. Only during episodic flooding is the channel reactivated, acting as the main drainage. Especially, rains during the 1948 El Niño events are said to have flooded the entire basin, impeded passage, and destroyed homesteads (Mwalimu Shana 2008, pers. comm.). Aerial photographs from 1954 (Fig. 18) show that the current wetland was well established; the 1957 photograph suggests an indistinct alluvial fan and waterlogging at backswamp positions.
Bedrock outcrops determine the local erosion basis and control absolute incision of the Ndurumu stream and hence drainage of the Ngagheni basin (Fig. 18). Deeply incised into the sediments of the Ngagheni basin (up to 3m) the Ndurumu stream passes the Lomwe basin, where its cross section shows a two stepped profile. The stream probably incised during a recent erosion phase into an older, wider and less defined channel.
Outcrops of organic matter rich peat are exposed along the Ndurumu stream and along drainage furrows, where they are buried under one to three metres of colluvial and alluvial hillwash sediments (Fig. 30). The buried peat extends into the main Ngagheni basin, where it phases out. Downstream, the first occurrence is recorded over an in situ rock outcrop (ND1) shortly before the stream drops down the mountain. Here, the 10cm thin peat layer is buried under about 2-3m of sediments. Along the Ndurumu stream, occasional occurrence of coarse fluvial sediments e.g. sands (ND 2) and gravel (ND 3) is reported. Exposures along drainage furrows show varying thickness of the peat layer (between 30 and 100cm) and a thinning out towards the middle of the Lomwe basin.
6.5.2 Stratigraphy of the Lomwe Basin
The Lomwe basin sediments were recorded at three sites: The Lomwe swamp core, the peat profile and the Ndurumu 6 river cut. Dried, partly decomposed peat is exposed at a stream bank at Ndurumu 6, whereas drainage channels have exposed a fresh peat section in the eastern part of the basin (Peat Profile). Here a soil profile was established and peat samples were obtained to a depth of 4m using an Edelman auger. Finally, a 438cm long core was extracted from the Lomwe swamp using a half tube Russian peat corer. Sediment description followed the classification of unconsolidated sediments proposed by TROELS-SMITH (1955) and was complimented by a modern classification approach put forward by SCHNURRENBERGER et al. (2003).
6.5.2.1 Swamp Core
The stratigraphy of the swamp core is representative for the stratigraphy of the Lomwe basin. At the base of the core organic matter free, coarse clayey sand with a minor fine gravel component impeded further core recovery (421-438cm, cf. Fig. 31). This basal sand is overlain by a grey (2.5Y 6/1) organic matter free sandy clay with slightly increasing organic matter content between 365 and 343cm depth.
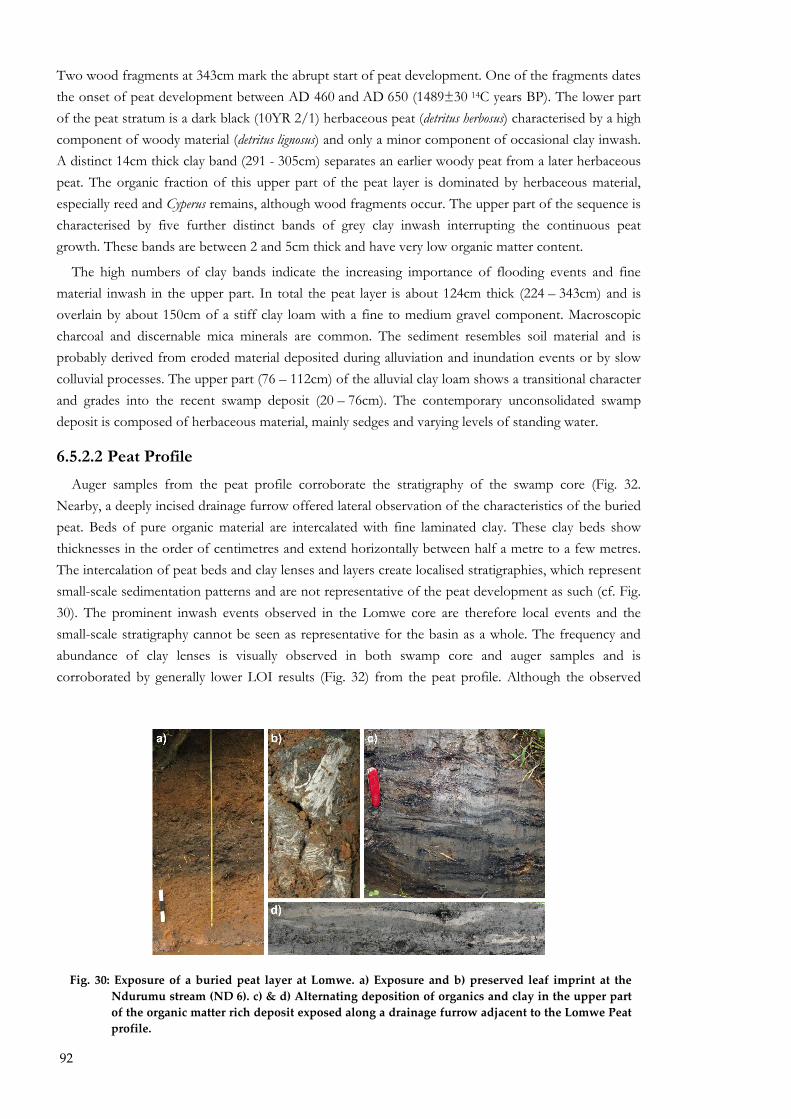
92
Two wood fragments at 343cm mark the abrupt start of peat development. One of the fragments dates the onset of peat development between AD 460 and AD 650 (1489±30 14C years BP). The lower part of the peat stratum is a dark black (10YR 2/1) herbaceous peat (detritus herbosus) characterised by a high component of woody material (detritus lignosus) and only a minor component of occasional clay inwash. A distinct 14cm thick clay band (291 - 305cm) separates an earlier woody peat from a later herbaceous peat. The organic fraction of this upper part of the peat layer is dominated by herbaceous material, especially reed and Cyperus remains, although wood fragments occur. The upper part of the sequence is characterised by five further distinct bands of grey clay inwash interrupting the continuous peat growth. These bands are between 2 and 5cm thick and have very low organic matter content.
The high numbers of clay bands indicate the increasing importance of flooding events and fine material inwash in the upper part. In total the peat layer is about 124cm thick (224 � 343cm) and is overlain by about 150cm of a stiff clay loam with a fine to medium gravel component. Macroscopic charcoal and discernable mica minerals are common. The sediment resembles soil material and is probably derived from eroded material deposited during alluviation and inundation events or by slow colluvial processes. The upper part (76 � 112cm) of the alluvial clay loam shows a transitional character and grades into the recent swamp deposit (20 � 76cm). The contemporary unconsolidated swamp deposit is composed of herbaceous material, mainly sedges and varying levels of standing water.
6.5.2.2 Peat Profile
Auger samples from the peat profile corroborate the stratigraphy of the swamp core (Fig. 32. Nearby, a deeply incised drainage furrow offered lateral observation of the characteristics of the buried peat. Beds of pure organic material are intercalated with fine laminated clay. These clay beds show thicknesses in the order of centimetres and extend horizontally between half a metre to a few metres. The intercalation of peat beds and clay lenses and layers create localised stratigraphies, which represent small-scale sedimentation patterns and are not representative of the peat development as such (cf. Fig. 30). The prominent inwash events observed in the Lomwe core are therefore local events and the small-scale stratigraphy cannot be seen as representative for the basin as a whole. The frequency and abundance of clay lenses is visually observed in both swamp core and auger samples and is corroborated by generally lower LOI results (Fig. 32) from the peat profile. Although the observed
Fig. 30: Exposure of a buried peat layer at Lomwe. a) Exposure and b) preserved leaf imprint at the Ndurumu stream (ND 6). c) & d) Alternating deposition of organics and clay in the upper part of the organic matter rich deposit exposed along a drainage furrow adjacent to the Lomwe Peat profile.
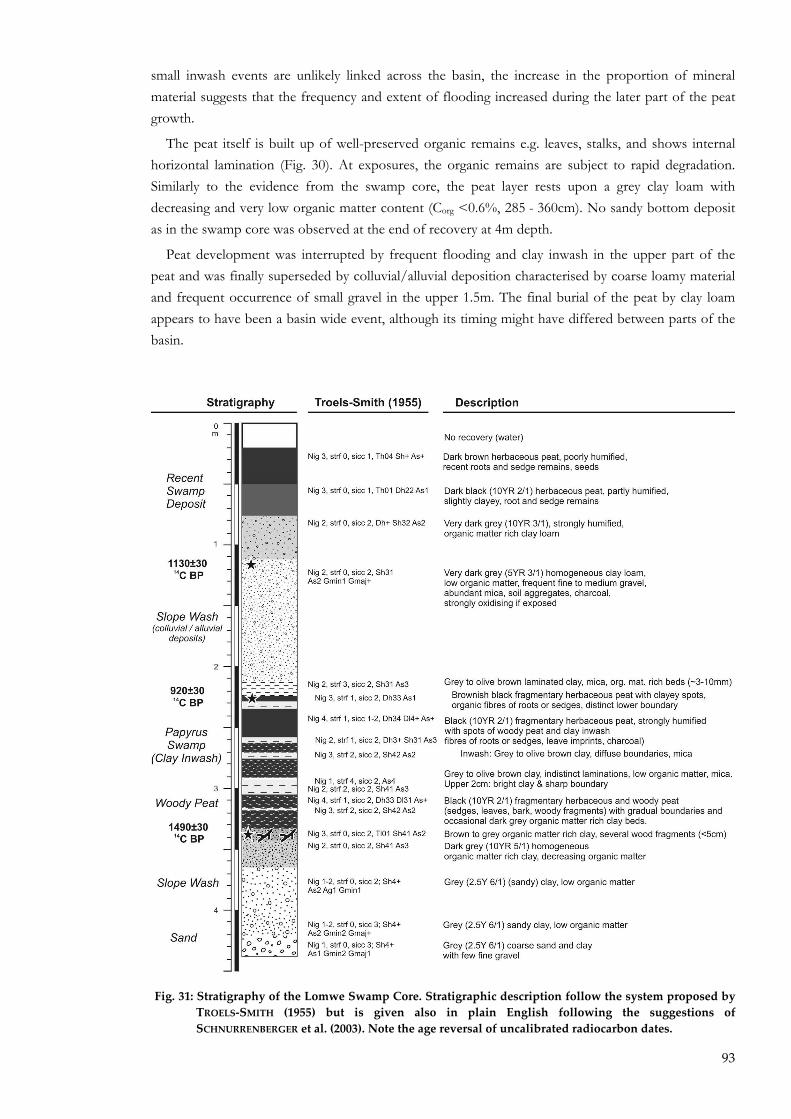
93
small inwash events are unlikely linked across the basin, the increase in the proportion of mineral material suggests that the frequency and extent of flooding increased during the later part of the peat growth.
The peat itself is built up of well-preserved organic remains e.g. leaves, stalks, and shows internal horizontal lamination (Fig. 30). At exposures, the organic remains are subject to rapid degradation. Similarly to the evidence from the swamp core, the peat layer rests upon a grey clay loam with decreasing and very low organic matter content (Corg <0.6%, 285 - 360cm). No sandy bottom deposit as in the swamp core was observed at the end of recovery at 4m depth.
Peat development was interrupted by frequent flooding and clay inwash in the upper part of the peat and was finally superseded by colluvial/alluvial deposition characterised by coarse loamy material and frequent occurrence of small gravel in the upper 1.5m. The final burial of the peat by clay loam appears to have been a basin wide event, although its timing might have differed between parts of the basin.
Fig. 31: Stratigraphy of the Lomwe Swamp Core. Stratigraphic description follow the system proposed by TROELS‐SMITH (1955) but is given also in plain English following the suggestions of SCHNURRENBERGER et al. (2003). Note the age reversal of uncalibrated radiocarbon dates.
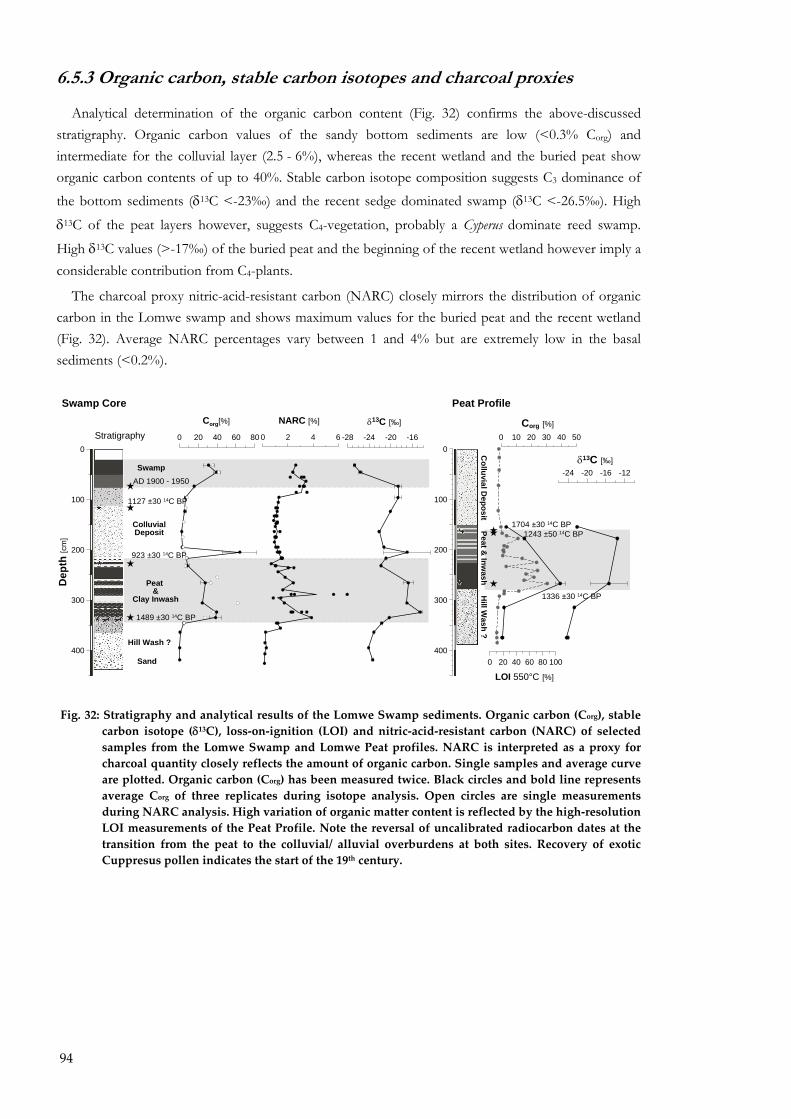
94
6.5.3 Organic carbon, stable carbon isotopes and charcoal proxies
Analytical determination of the organic carbon content (Fig. 32) confirms the above-discussed stratigraphy. Organic carbon values of the sandy bottom sediments are low (<0.3% Corg) and intermediate for the colluvial layer (2.5 - 6%), whereas the recent wetland and the buried peat show organic carbon contents of up to 40%. Stable carbon isotope composition suggests C3 dominance of the bottom sediments (δ13C <-23�) and the recent sedge dominated swamp (δ13C <-26.5�). High
δ13C of the peat layers however, suggests C4-vegetation, probably a Cyperus dominate reed swamp.
High δ13C values (>-17�) of the buried peat and the beginning of the recent wetland however imply a considerable contribution from C4-plants.
The charcoal proxy nitric-acid-resistant carbon (NARC) closely mirrors the distribution of organic carbon in the Lomwe swamp and shows maximum values for the buried peat and the recent wetland (Fig. 32). Average NARC percentages vary between 1 and 4% but are extremely low in the basal sediments (<0.2%).
0 2 4 6
NARC [%]
-28 -24 -20 -16
δ13C [‰]
0 20 40 60 80
Corg[%]
400
300
200
100
0
Dep
th [c
m]
1489 ±30 14C BP
1127 ±30 14C BP
923 ±30 14C BP
-24 -20 -16 -12δ13C [‰]
0 20 40 60 80 100
LOI 550°C [%]
0 10 20 30 40 50Corg [%]
400
300
200
100
0
Peat Profile
ColluvialDeposit
Peat &
Clay Inwash
Hill Wash ?
1243 ±50 14C BP
1336 ±30 14C BP
1704 ±30 14C BP
Swamp
Sand
Swamp Core
Stratigraphy
Colluvial D
epositPeat &
Inwash
Hill W
ash ?
AD 1900 - 1950
Fig. 32: Stratigraphy and analytical results of the Lomwe Swamp sediments. Organic carbon (Corg), stable carbon isotope (δ13C), loss‐on‐ignition (LOI) and nitric‐acid‐resistant carbon (NARC) of selected samples from the Lomwe Swamp and Lomwe Peat profiles. NARC is interpreted as a proxy for charcoal quantity closely reflects the amount of organic carbon. Single samples and average curve are plotted. Organic carbon (Corg) has been measured twice. Black circles and bold line represents average Corg of three replicates during isotope analysis. Open circles are single measurements during NARC analysis. High variation of organic matter content is reflected by the high‐resolution LOI measurements of the Peat Profile. Note the reversal of uncalibrated radiocarbon dates at the transition from the peat to the colluvial/ alluvial overburdens at both sites. Recovery of exotic Cuppresus pollen indicates the start of the 19th century.
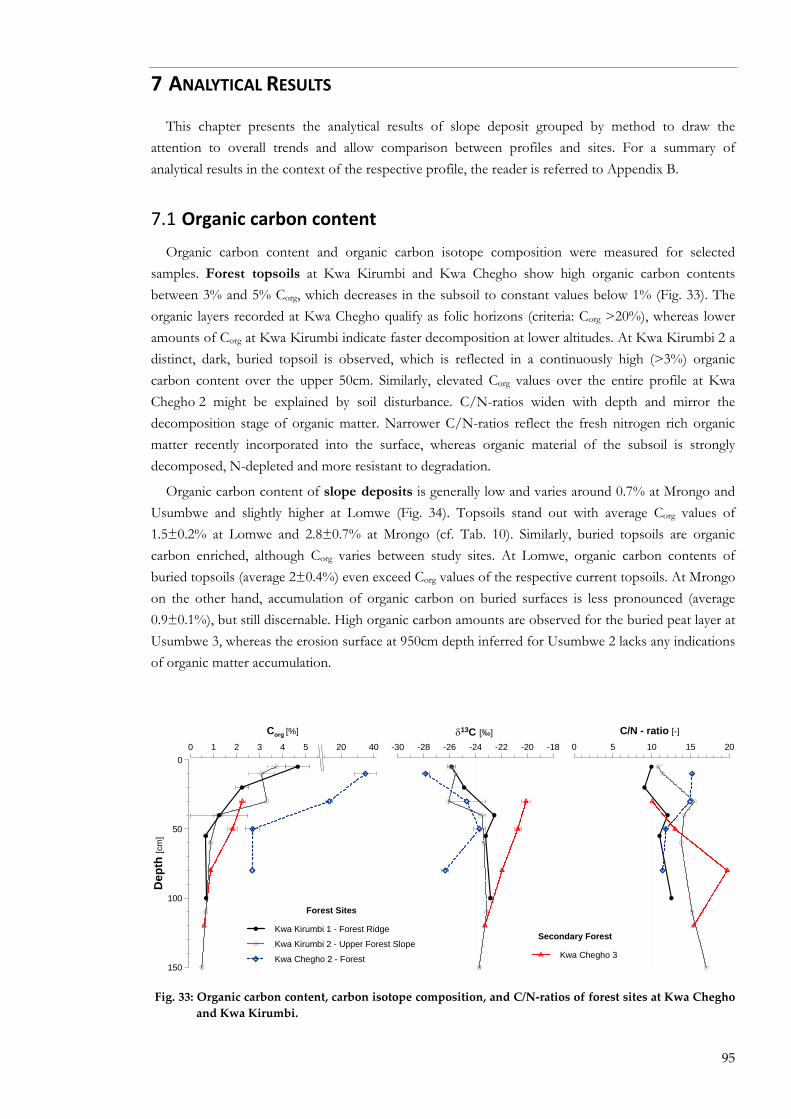
95
7 ANALYTICAL RESULTS
This chapter presents the analytical results of slope deposit grouped by method to draw the attention to overall trends and allow comparison between profiles and sites. For a summary of analytical results in the context of the respective profile, the reader is referred to Appendix B.
7.1 Organic carbon content Organic carbon content and organic carbon isotope composition were measured for selected
samples. Forest topsoils at Kwa Kirumbi and Kwa Chegho show high organic carbon contents between 3% and 5% Corg, which decreases in the subsoil to constant values below 1% (Fig. 33). The organic layers recorded at Kwa Chegho qualify as folic horizons (criteria: Corg >20%), whereas lower amounts of Corg at Kwa Kirumbi indicate faster decomposition at lower altitudes. At Kwa Kirumbi 2 a distinct, dark, buried topsoil is observed, which is reflected in a continuously high (>3%) organic carbon content over the upper 50cm. Similarly, elevated Corg values over the entire profile at Kwa Chegho 2 might be explained by soil disturbance. C/N-ratios widen with depth and mirror the decomposition stage of organic matter. Narrower C/N-ratios reflect the fresh nitrogen rich organic matter recently incorporated into the surface, whereas organic material of the subsoil is strongly decomposed, N-depleted and more resistant to degradation.
Organic carbon content of slope deposits is generally low and varies around 0.7% at Mrongo and Usumbwe and slightly higher at Lomwe (Fig. 34). Topsoils stand out with average Corg values of 1.5±0.2% at Lomwe and 2.8±0.7% at Mrongo (cf. Tab. 10). Similarly, buried topsoils are organic carbon enriched, although Corg varies between study sites. At Lomwe, organic carbon contents of buried topsoils (average 2±0.4%) even exceed Corg values of the respective current topsoils. At Mrongo on the other hand, accumulation of organic carbon on buried surfaces is less pronounced (average 0.9±0.1%), but still discernable. High organic carbon amounts are observed for the buried peat layer at Usumbwe 3, whereas the erosion surface at 950cm depth inferred for Usumbwe 2 lacks any indications of organic matter accumulation.
0 5 10 15 20
C/N - ratio [-]
-30 -28 -26 -24 -22 -20 -18δ13C [‰]
0 1 2 3 4 5 20 40
Corg [%]
150
100
50
0
Dep
th [c
m]
Forest Sites
Kwa Kirumbi 1 - Forest Ridge
Kwa Kirumbi 2 - Upper Forest Slope
Kwa Chegho 2 - Forest
Secondary Forest
Kwa Chegho 3
Fig. 33: Organic carbon content, carbon isotope composition, and C/N‐ratios of forest sites at Kwa Chegho and Kwa Kirumbi.
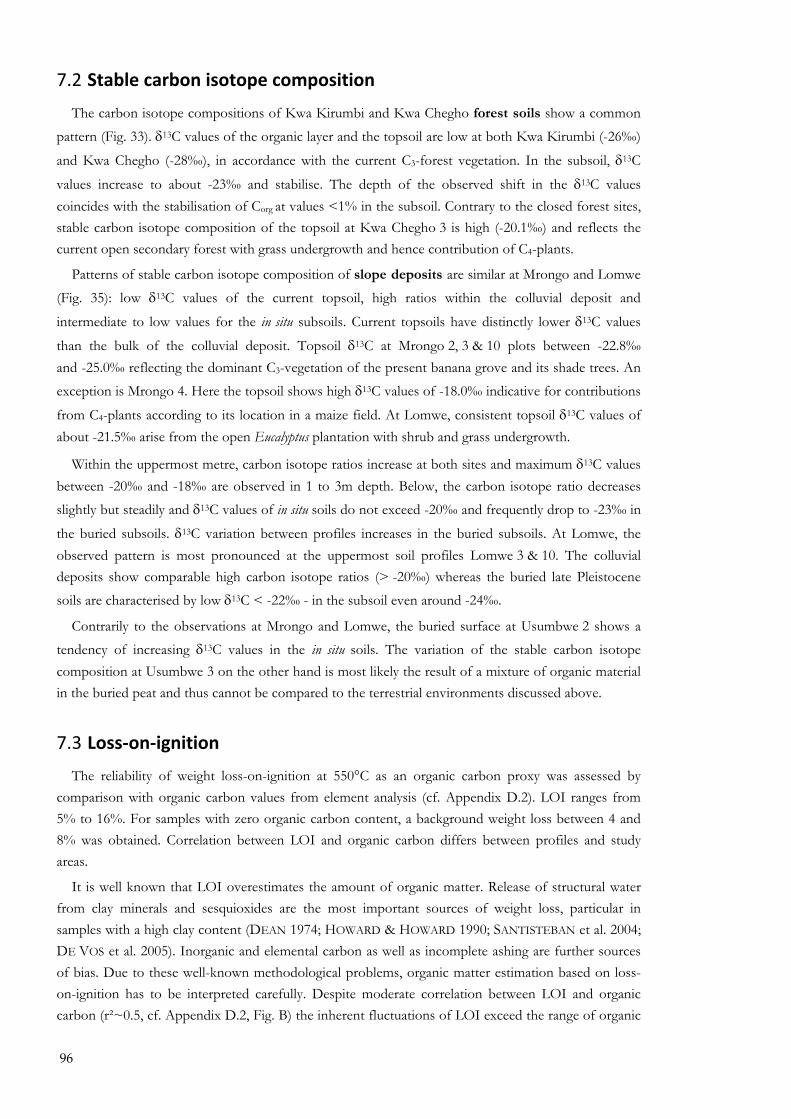
96
7.2 Stable carbon isotope composition
The carbon isotope compositions of Kwa Kirumbi and Kwa Chegho forest soils show a common pattern (Fig. 33). δ13C values of the organic layer and the topsoil are low at both Kwa Kirumbi (-26�)
and Kwa Chegho (-28�), in accordance with the current C3-forest vegetation. In the subsoil, δ13C
values increase to about -23� and stabilise. The depth of the observed shift in the δ13C values coincides with the stabilisation of Corg at values <1% in the subsoil. Contrary to the closed forest sites, stable carbon isotope composition of the topsoil at Kwa Chegho 3 is high (-20.1�) and reflects the current open secondary forest with grass undergrowth and hence contribution of C4-plants.
Patterns of stable carbon isotope composition of slope deposits are similar at Mrongo and Lomwe (Fig. 35): low δ13C values of the current topsoil, high ratios within the colluvial deposit and
intermediate to low values for the in situ subsoils. Current topsoils have distinctly lower δ13C values
than the bulk of the colluvial deposit. Topsoil δ13C at Mrongo 2, 3 & 10 plots between -22.8� and -25.0� reflecting the dominant C3-vegetation of the present banana grove and its shade trees. An exception is Mrongo 4. Here the topsoil shows high δ13C values of -18.0� indicative for contributions
from C4-plants according to its location in a maize field. At Lomwe, consistent topsoil δ13C values of about -21.5� arise from the open Eucalyptus plantation with shrub and grass undergrowth.
Within the uppermost metre, carbon isotope ratios increase at both sites and maximum δ13C values between -20� and -18� are observed in 1 to 3m depth. Below, the carbon isotope ratio decreases slightly but steadily and δ13C values of in situ soils do not exceed -20� and frequently drop to -23� in
the buried subsoils. δ13C variation between profiles increases in the buried subsoils. At Lomwe, the observed pattern is most pronounced at the uppermost soil profiles Lomwe 3 & 10. The colluvial deposits show comparable high carbon isotope ratios (> -20�) whereas the buried late Pleistocene soils are characterised by low δ13C < -22� - in the subsoil even around -24�.
Contrarily to the observations at Mrongo and Lomwe, the buried surface at Usumbwe 2 shows a tendency of increasing δ13C values in the in situ soils. The variation of the stable carbon isotope composition at Usumbwe 3 on the other hand is most likely the result of a mixture of organic material in the buried peat and thus cannot be compared to the terrestrial environments discussed above.
7.3 Loss‐on‐ignition The reliability of weight loss-on-ignition at 550°C as an organic carbon proxy was assessed by
comparison with organic carbon values from element analysis (cf. Appendix D.2). LOI ranges from 5% to 16%. For samples with zero organic carbon content, a background weight loss between 4 and 8% was obtained. Correlation between LOI and organic carbon differs between profiles and study areas.
It is well known that LOI overestimates the amount of organic matter. Release of structural water from clay minerals and sesquioxides are the most important sources of weight loss, particular in samples with a high clay content (DEAN 1974; HOWARD & HOWARD 1990; SANTISTEBAN et al. 2004; DE VOS et al. 2005). Inorganic and elemental carbon as well as incomplete ashing are further sources of bias. Due to these well-known methodological problems, organic matter estimation based on loss-on-ignition has to be interpreted carefully. Despite moderate correlation between LOI and organic carbon (r²~0.5, cf. Appendix D.2, Fig. B) the inherent fluctuations of LOI exceed the range of organic

97
carbon variation between the bulk of the deposits and buried topsoils (differences between 0.1 � 0.4% Corg). LOI does not reflect the slightly increased organic carbon content at Mrongo, although the strong Corg enriched soils at Lomwe (~3%) were detected. Being unable to pick up the small but important organic matter accumulation of prominent and crucial soil features such as buried topsoils, weight loss-on-ignition was discarded as an adequate method to accurately describe small organic matter variations in the studied slope deposits.
0 1 2 3
LomweCorg [%]
0 1 2 3
UsumbweCorg [%]
Usumbwe 2
Usumbwe 3
0 2 4 6 8 10
Usumbwe 3
0 1 2 3 4
MrongoCorg [%]
Mrongo 2
Mrongo 3
Mrongo 10
Mrongo 41000
900
800
700
600
500
400
300
200
100
0
Dep
th [c
m]
Lomwe 3
Lomwe 10
Lomwe 4
Lomwe 5
Buried Topsoil
Fig. 34: Organic carbon content of slope deposits. To allow stratigraphic comparison between profiles of different depth, buried topsoils and inferred former surfaces (grey shaded areas) are indicated separately for each profile. Note the change of scale for the different study sites.
-26 -24 -22 -20 -18
Lomweδ13C [‰]
-26 -24 -22 -20 -18
Usumbweδ13C [‰]
Usumbwe 2
Usumbwe 3
-26 -24 -22 -20 -18 -16
Mrongoδ13C [‰]
Mrongo 2
Mrongo 3
Mrongo 10
Mrongo 41000
900
800
700
600
500
400
300
200
100
0
Dep
th [c
m]
Lomwe 3
Lomwe 10
Lomwe 4
Lomwe 5
Buried Topsoil
Fig. 35: Stable carbon isotope composition of hillslope deposits at Mrongo, Usumbwe and Lomwe. To allow stratigraphic comparison between profiles of different depth, buried topsoils and inferred former surfaces (grey shaded areas) are indicated separately for each profile. Standard deviation of three replicates is plotted.

98
7.4 pH Forest soils show elevated pH values in topsoil and organic layer and low pH in the subsoil (Fig.
36). At Kwa Kirumbi, topsoil and organic layer pH values range between 5 and 6.5; at Kwa Chegho the topsoil pH increase is less pronounced. Values decline in the subsoil and vary between pH 4 and 4.5 at Kwa Kirumbi and slightly higher between pH 4.5 and 5 at Kwa Chegho. A slight increase is noticed in several profiles within the transitional B/C horizons, where weathered rock material becomes frequent. The elevated pH in the organic layer and topsoil can be explained by litter fall, the input of fresh organic matter and hence a constant supply of basic cations. This base-pump mechanism counteracts the effects of leaching, cation removal, and acidification reflected by depressed pH of subsoil horizons.
Agricultural soils show a higher pH (>5) than forest soils and an increased variability between profiles and sites (Fig. 36). Generally, higher pH values of eroded soils under agricultural use can be ascribed to the rejuvenation of the soils by erosion and the removal of leached material of former top- and subsoils. The exposed subsoil or even B/C-transition horizons are less acidic and have a higher pH. Nevertheless, elevated pH values of the topsoil reflect incipient organic matter accumulation or the admixture of base-rich topsoil material by disturbance. Exceptional high topsoil pH of 6.5 at Ngalanga 2 (banana grove) might not only be the result of in situ organic matter accumulation and decomposition under dense banana vegetation, but also due to the colluvial overburden and probably manure and waste application below a habitation site. The exceptional low pH of the severely eroded Makongweni profile might be related to distinct bedrock material or acidification under Eucalyptus forest.
pH profiles of colluvial slope deposits show a characteristic s-shaped pattern (Fig. 37). The uppermost metre of the slope deposits shows elevated pH (pH > 6). Below, pH declines to about pH 5 in 1 � 3m depth. This pH depression generally coincides with the occurrence of layers of hillwash deposits characterised by gravel and sand lens occurrence. In the lower slope deposit, pH values increase again and pH of buried in situ soils generally exceeds pH 6. Deviations from the general pH pattern are observed at Usumbwe and Lomwe. At Usumbwe 3, pH drops to a minimum pH of 3.6 between 7 and 8m depth due to strong organic acids of the buried, organic matter rich peat. At Lomwe, pH profiles do not show the distinct pattern observed at Mrongo and Usumbwe. pH values remain fairly constant and do not show any distinct change with depth. In situ soils and colluvial overburden show homogeneous pH values.
7.5 Magnetic Susceptibility
Magnetic susceptibility (χlf) of forest soils, agricultural soils, and slope deposits range from 0.05 to 10.7 x10⁻⁶ m³kg-1 and shows significant differences between sites. Low values between 0.05 and 2.7 x10⁻⁶ m³kg-1 are observed at the forest site Kwa Kirumbi, whereas at Kwa Chegho χlf is higher and ranges from 2.2 to 10.7 x10⁻⁶ m³kg-1. Agricultural and eroded soils show intermediate magnetic susceptibility values that differ between study sites. Low χlf values <4.1 x10⁻⁶ m³kg-1, are common in the Ugweno area (Ngalanga, Usumbwe, Makongweni), while slightly higher values <6.5 x10⁻⁶ m³kg-1 prevail at Changuku/Lomwe. Slope deposits show intermediate values and range between 0.5 and 7 x10⁻⁶ m³kg-1 at Mrongo and Usumbwe, whereas higher χlf values at Lomwe frequently reach up to 10 x10-6 m³kg-1.
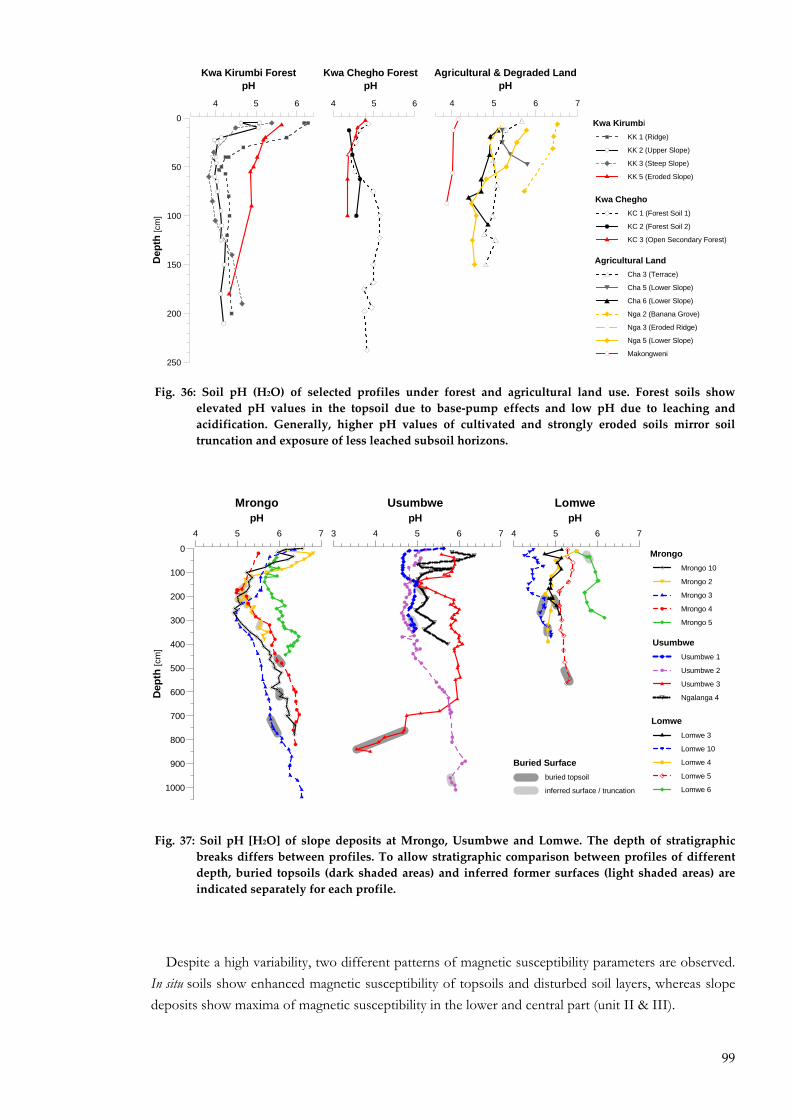
99
4 5 6 7
Agricultural & Degraded LandpH
Agricultural Land
Cha 3 (Terrace)
Cha 5 (Lower Slope)
Cha 6 (Lower Slope)
Nga 2 (Banana Grove)
Nga 3 (Eroded Ridge)
Nga 5 (Lower Slope)
Makongweni
4 5 6
Kwa Chegho ForestpH
250
200
150
100
50
0
Dep
th [c
m]
4 5 6
Kwa Kirumbi ForestpH
Kwa KirumbiKK 1 (Ridge)
KK 2 (Upper Slope)
KK 3 (Steep Slope)
KK 5 (Eroded Slope)
Kwa Chegho KC 1 (Forest Soil 1)
KC 2 (Forest Soil 2)
KC 3 (Open Secondary Forest)
Fig. 36: Soil pH (H2O) of selected profiles under forest and agricultural land use. Forest soils show elevated pH values in the topsoil due to base‐pump effects and low pH due to leaching and acidification. Generally, higher pH values of cultivated and strongly eroded soils mirror soil truncation and exposure of less leached subsoil horizons.
4 5 6 7
LomwepH
3 4 5 6 7
UsumbwepH
UsumbweUsumbwe 1
Usumbwe 2
Usumbwe 3
Ngalanga 4
4 5 6 7
MrongopH
Mrongo Mrongo 10
Mrongo 2
Mrongo 3
Mrongo 4
Mrongo 5
1000
900
800
700
600
500
400
300
200
100
0
Dep
th [c
m]
Lomwe Lomwe 3
Lomwe 10
Lomwe 4
Lomwe 5
Lomwe 6
Buried Surfaceburied topsoil
inferred surface / truncation
Fig. 37: Soil pH [H2O] of slope deposits at Mrongo, Usumbwe and Lomwe. The depth of stratigraphic breaks differs between profiles. To allow stratigraphic comparison between profiles of different depth, buried topsoils (dark shaded areas) and inferred former surfaces (light shaded areas) are indicated separately for each profile.
Despite a high variability, two different patterns of magnetic susceptibility parameters are observed. In situ soils show enhanced magnetic susceptibility of topsoils and disturbed soil layers, whereas slope deposits show maxima of magnetic susceptibility in the lower and central part (unit II & III).
100
7.5.1 Forest and Agricultural soils
The pattern of enhanced magnetic susceptibility of topsoils is best observed at forest soils of Kwa Kirumbi - despite very low absolute χlf values (Fig. 38). Susceptibility is slightly elevated in the topsoil and upper subsoil (1 - 2 x10⁻⁶ m³kg-1) but decreases in the lower subsoil and the B/C-transition horizon. At Kwa Chegho 1, χlf is high and variable but drops sharply at the BC-transition. Similarly, χlf decreases in the truncated subsoil of Kwa Chegho 3. Absolute magnetic susceptibility of agricultural soils differs strongly between sites, but generally lack variation with depth. An exception is Changuku 3 (terrace), where the high χlf of the colluvial overburden contrasts sharply with low values in the truncated C-horizon.
Frequency dependent magnetic susceptibility (χfd%) ranges from low percentages <1% to high values up to 12% (Fig. 38). Again, forest soils of Kwa Kirumbi show a distinctive pattern of topsoil enhancement: elevated χfd% (4 - 8%) for topsoils, colluvial deposits and upper subsoils but very low
χfd% (<2%) in the lower subsoil and B/C-transition horizons. At Kwa Chegho, this pattern is reflected by the partly eroded profile Kwa Chegho 3 (open secondary forest), whereas the closed forest profiles Kwa Chegho 1 & 2 show high and homogeneous χfd% (6 - 8%). No clear pattern is observed on
agricultural sites, where χfd% is strongly site-specific. Exceptional high values (8 - 11%) are shown at Makongweni.
7.5.2 Slope Deposits
Magnetic susceptibility values (χlf) of topsoils of slope deposits are uniform within sites but differ between study areas. At Mrongo and Usumbwe, they vary between 2.1 and 3.2 x10⁻⁶ m³kg-1, but are consistently higher at Lomwe, where values range from 4.3 to 5.2 x10⁻⁶ m³kg-1. A consistent pattern of magnetic susceptibility is observed at the two Ugweno sites Mrongo and Usumbwe. Low magnetic susceptibility (<3 x10⁻⁶ m3kg-1) in the topsoil and the upper part of the slope deposits increases to intermediate magnetic susceptibility values ranging from 4 to 6 x10⁻⁶ m³kg-1 below 50 - 250cm depth in the central part of the deposits. The shift from intermediate to low χlf in the upper part of the profiles coincides well with the occurrence of sand lenses (cf. chapter 8.3). The black iron sands are dominated by primary ferrimagnetic iron minerals characterised by exceptionally high χlf values between 10 and 24 x10-6 m³kg-1 and a very low frequency dependent susceptibility. A second shift takes place at the former ground surfaces. χlf drops sharply and values of <2 x10⁻⁶ m3kg-1 characterise the in situ subsoils.
Frequency dependent susceptibility values (χfd%) oscillate around 6 - 7% (Mrongo) and 8 - 9% (Usumbwe), ranging from minima around ~2% recorded in the buried subsoils to maxima around ~12% in the colluvial deposits at Usumbwe. Generally, highest variability as well as lowest frequency dependency ratios are observed for the buried subsoils. Exceptions are upper footslope profiles (Mrongo 2 & 3) where χfd% values increase. χfd% values of the buried topsoils and the slope deposits are high but fluctuate in a site-specific range. Only within the uppermost metres of the deposits, frequency dependency tends to decline slightly compared to the previous levels.
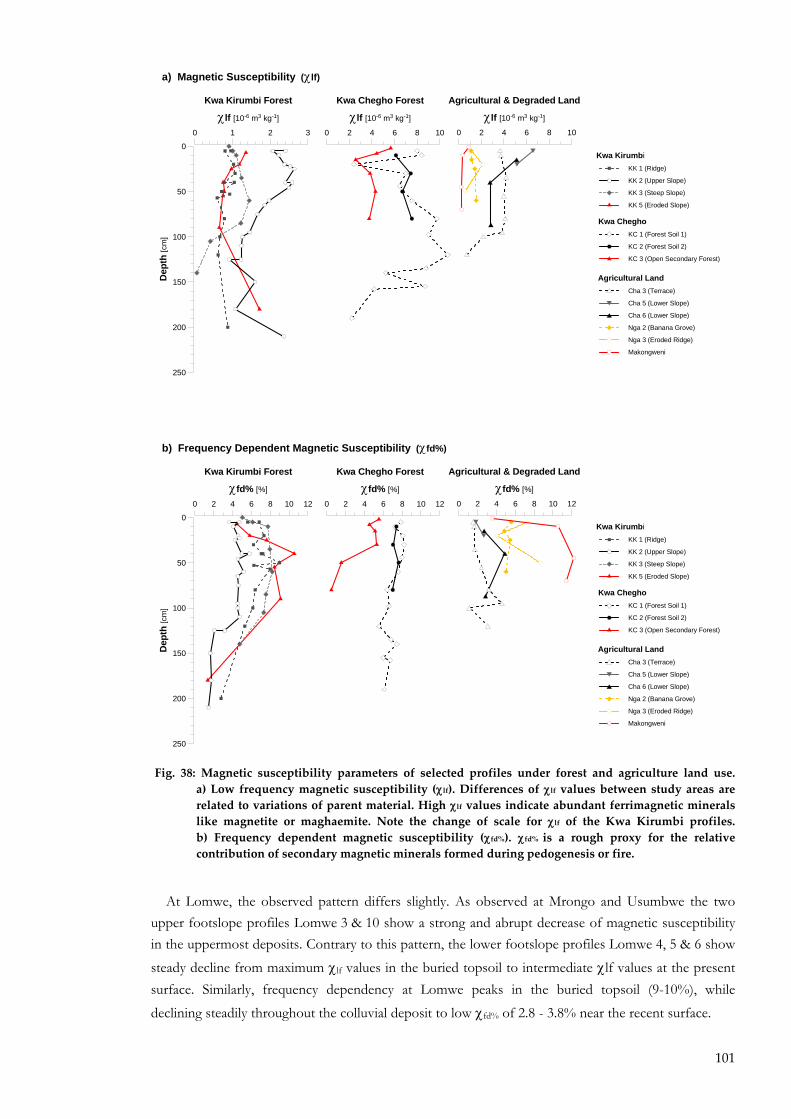
101
0 2 4 6 8 10
Agricultural & Degraded Land
χlf [10-6 m3 kg-1]
Agricultural Land
Cha 3 (Terrace)
Cha 5 (Lower Slope)
Cha 6 (Lower Slope)
Nga 2 (Banana Grove)
Nga 3 (Eroded Ridge)
Makongweni
0 2 4 6 8 10
Kwa Chegho Forest
χlf [10-6 m3 kg-1]
250
200
150
100
50
0
Dep
th [c
m]
0 1 2 3
Kwa Kirumbi Forest
χlf [10-6 m3 kg-1]
Kwa KirumbiKK 1 (Ridge)
KK 2 (Upper Slope)
KK 3 (Steep Slope)
KK 5 (Eroded Slope)
Kwa Chegho KC 1 (Forest Soil 1)
KC 2 (Forest Soil 2)
KC 3 (Open Secondary Forest)
a) Magnetic Susceptibility (χlf)
0 2 4 6 8 10 12
Agricultural & Degraded Land
χfd% [%]
Agricultural Land
Cha 3 (Terrace)
Cha 5 (Lower Slope)
Cha 6 (Lower Slope)
Nga 2 (Banana Grove)
Nga 3 (Eroded Ridge)
Makongweni
0 2 4 6 8 10 12
Kwa Chegho Forest
χfd% [%]
250
200
150
100
50
0
Dep
th [c
m]
0 2 4 6 8 10 12
Kwa Kirumbi Forest
χfd% [%]
Kwa KirumbiKK 1 (Ridge)
KK 2 (Upper Slope)
KK 3 (Steep Slope)
KK 5 (Eroded Slope)
Kwa Chegho KC 1 (Forest Soil 1)
KC 2 (Forest Soil 2)
KC 3 (Open Secondary Forest)
b) Frequency Dependent Magnetic Susceptibility (χfd%)
Fig. 38: Magnetic susceptibility parameters of selected profiles under forest and agriculture land use. a) Low frequency magnetic susceptibility (χlf). Differences of χlf values between study areas are related to variations of parent material. High χlf values indicate abundant ferrimagnetic minerals like magnetite or maghaemite. Note the change of scale for χlf of the Kwa Kirumbi profiles. b) Frequency dependent magnetic susceptibility (χfd%). χfd% is a rough proxy for the relative contribution of secondary magnetic minerals formed during pedogenesis or fire.
At Lomwe, the observed pattern differs slightly. As observed at Mrongo and Usumbwe the two upper footslope profiles Lomwe 3 & 10 show a strong and abrupt decrease of magnetic susceptibility in the uppermost deposits. Contrary to this pattern, the lower footslope profiles Lomwe 4, 5 & 6 show steady decline from maximum χlf values in the buried topsoil to intermediate χlf values at the present surface. Similarly, frequency dependency at Lomwe peaks in the buried topsoil (9-10%), while declining steadily throughout the colluvial deposit to low χfd% of 2.8 - 3.8% near the recent surface.
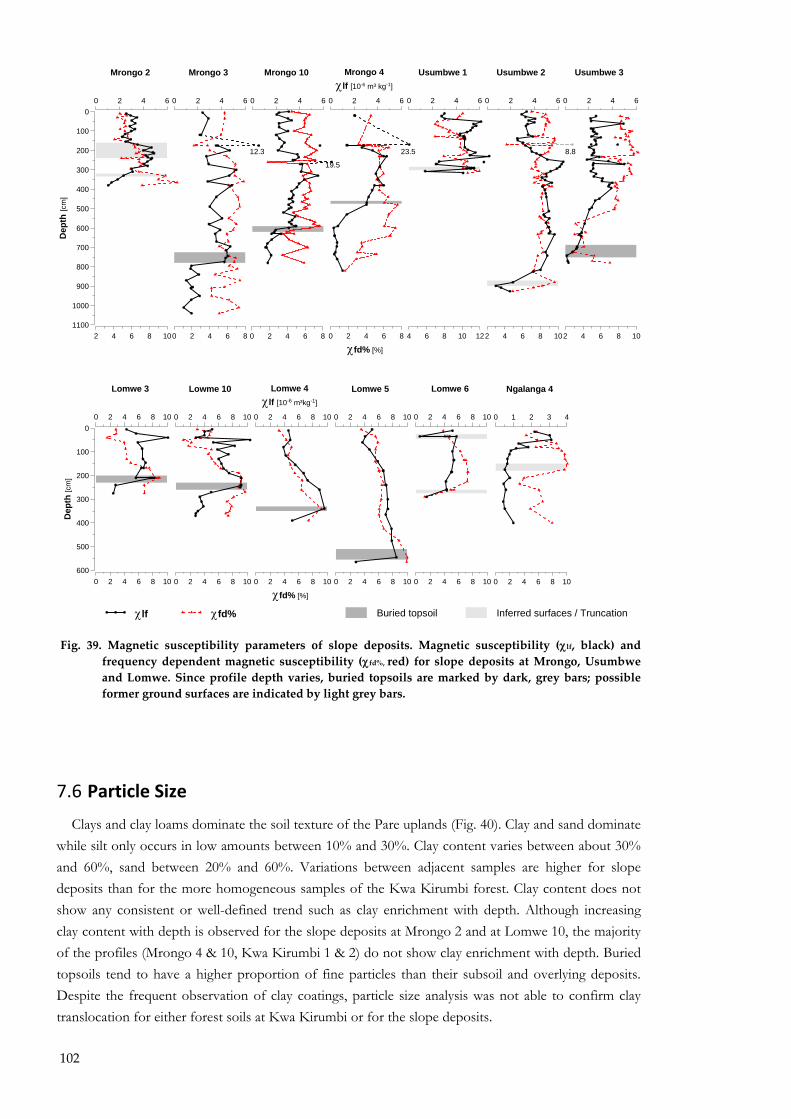
102
600
500
400
300
200
100
0
Dep
th [c
m]
0 2 4 6 8 100 2 4 6 8 100 2 4 6 8 100 2 4 6 8 10
χfd% [%]
0 2 4 6 8 100 2 4 6 8 10
0 1 2 3 4
Ngalanga 4
0 2 4 6 8 10
Lomwe 6
0 2 4 6 8 10
Lomwe 5
0 2 4 6 8 10
Lomwe 4χlf [10-6 m³kg-1]
0 2 4 6 8 10
Lowme 10
0 2 4 6 8 10
Lomwe 3
2 4 6 8 102 4 6 8 104 6 8 10 12
0 2 4 6
Usumbwe 3
0 2 4 6
Usumbwe 2
0 2 4 6
Usumbwe 1
χlf χfd%
1100
1000
900
800
700
600
500
400
300
200
100
0
Dep
th [c
m]
0 2 4 6 8
χfd% [%]
0 2 4 6 80 2 4 6 82 4 6 8 10
0 2 4 6
Mrongo 4χlf [10-6 m³ kg-1]
0 2 4 6
Mrongo 10
0 2 4 6
Mrongo 3
0 2 4 6
Mrongo 2
12.3 23.5
19.5
8.8
Buried topsoil Inferred surfaces / Truncation
Fig. 39. Magnetic susceptibility parameters of slope deposits. Magnetic susceptibility (χlf, black) and frequency dependent magnetic susceptibility (χfd%, red) for slope deposits at Mrongo, Usumbwe and Lomwe. Since profile depth varies, buried topsoils are marked by dark, grey bars; possible former ground surfaces are indicated by light grey bars.
7.6 Particle Size Clays and clay loams dominate the soil texture of the Pare uplands (Fig. 40). Clay and sand dominate
while silt only occurs in low amounts between 10% and 30%. Clay content varies between about 30% and 60%, sand between 20% and 60%. Variations between adjacent samples are higher for slope deposits than for the more homogeneous samples of the Kwa Kirumbi forest. Clay content does not show any consistent or well-defined trend such as clay enrichment with depth. Although increasing clay content with depth is observed for the slope deposits at Mrongo 2 and at Lomwe 10, the majority of the profiles (Mrongo 4 & 10, Kwa Kirumbi 1 & 2) do not show clay enrichment with depth. Buried topsoils tend to have a higher proportion of fine particles than their subsoil and overlying deposits. Despite the frequent observation of clay coatings, particle size analysis was not able to confirm clay translocation for either forest soils at Kwa Kirumbi or for the slope deposits.
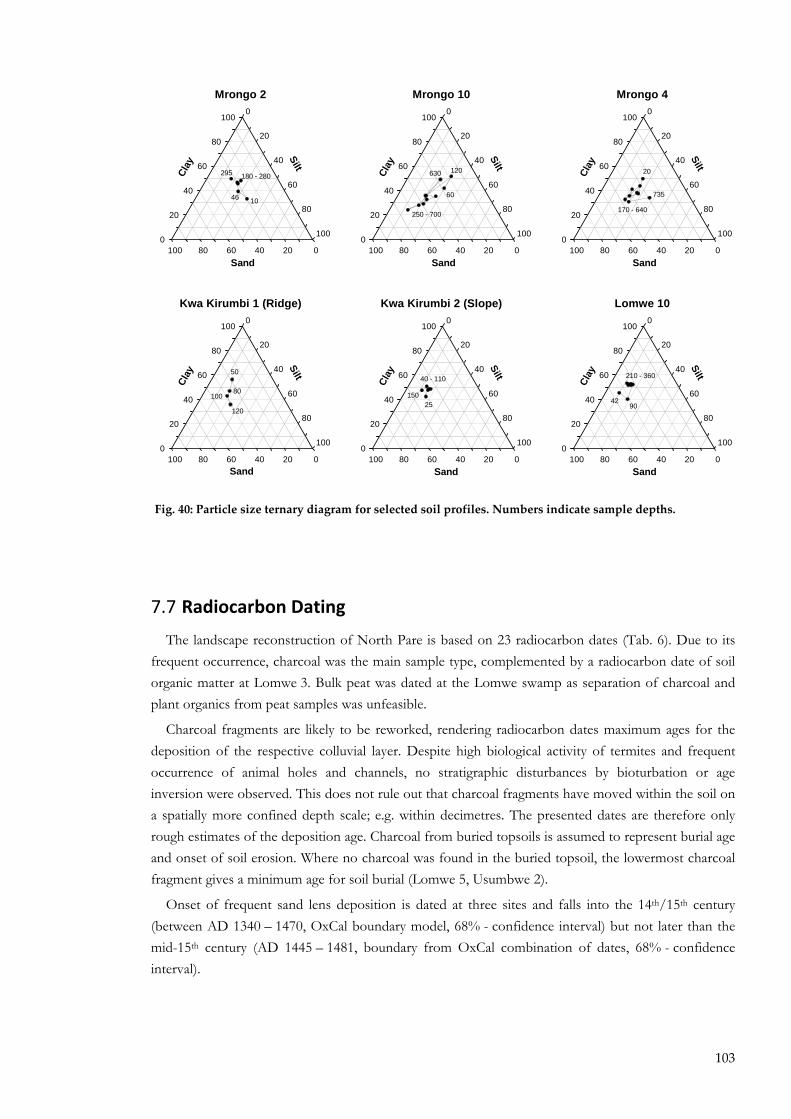
103
Mrongo 2
Silt
0
20
40
60
80
100
Clay
0
20
40
60
80
100
Sand020406080100
Mrongo 10
Silt
0
20
40
60
80
100
Clay
0
20
40
60
80
100
Sand020406080100
Mrongo 4Silt
0
20
40
60
80
100
Clay
0
20
40
60
80
100
Sand020406080100
Kwa Kirumbi 2 (Slope)Silt
0
20
40
60
80
100
Clay
0
20
40
60
80
100
Sand020406080100
Kwa Kirumbi 1 (Ridge)
Silt
0
20
40
60
80
100
Clay
0
20
40
60
80
100
Sand020406080100
Lomwe 10
Silt
0
20
40
60
80
100
Clay
0
20
40
60
80
100
Sand020406080100
1046
295 180 - 280
250 - 700
60
120630 20
735
170 - 640
210 - 360
9042
120
50
10080
25150
40 - 110
Fig. 40: Particle size ternary diagram for selected soil profiles. Numbers indicate sample depths.
7.7 Radiocarbon Dating The landscape reconstruction of North Pare is based on 23 radiocarbon dates (Tab. 6). Due to its
frequent occurrence, charcoal was the main sample type, complemented by a radiocarbon date of soil organic matter at Lomwe 3. Bulk peat was dated at the Lomwe swamp as separation of charcoal and plant organics from peat samples was unfeasible.
Charcoal fragments are likely to be reworked, rendering radiocarbon dates maximum ages for the deposition of the respective colluvial layer. Despite high biological activity of termites and frequent occurrence of animal holes and channels, no stratigraphic disturbances by bioturbation or age inversion were observed. This does not rule out that charcoal fragments have moved within the soil on a spatially more confined depth scale; e.g. within decimetres. The presented dates are therefore only rough estimates of the deposition age. Charcoal from buried topsoils is assumed to represent burial age and onset of soil erosion. Where no charcoal was found in the buried topsoil, the lowermost charcoal fragment gives a minimum age for soil burial (Lomwe 5, Usumbwe 2).
Onset of frequent sand lens deposition is dated at three sites and falls into the 14th/15th century (between AD 1340 � 1470, OxCal boundary model, 68% - confidence interval) but not later than the mid-15th century (AD 1445 � 1481, boundary from OxCal combination of dates, 68% - confidence interval).
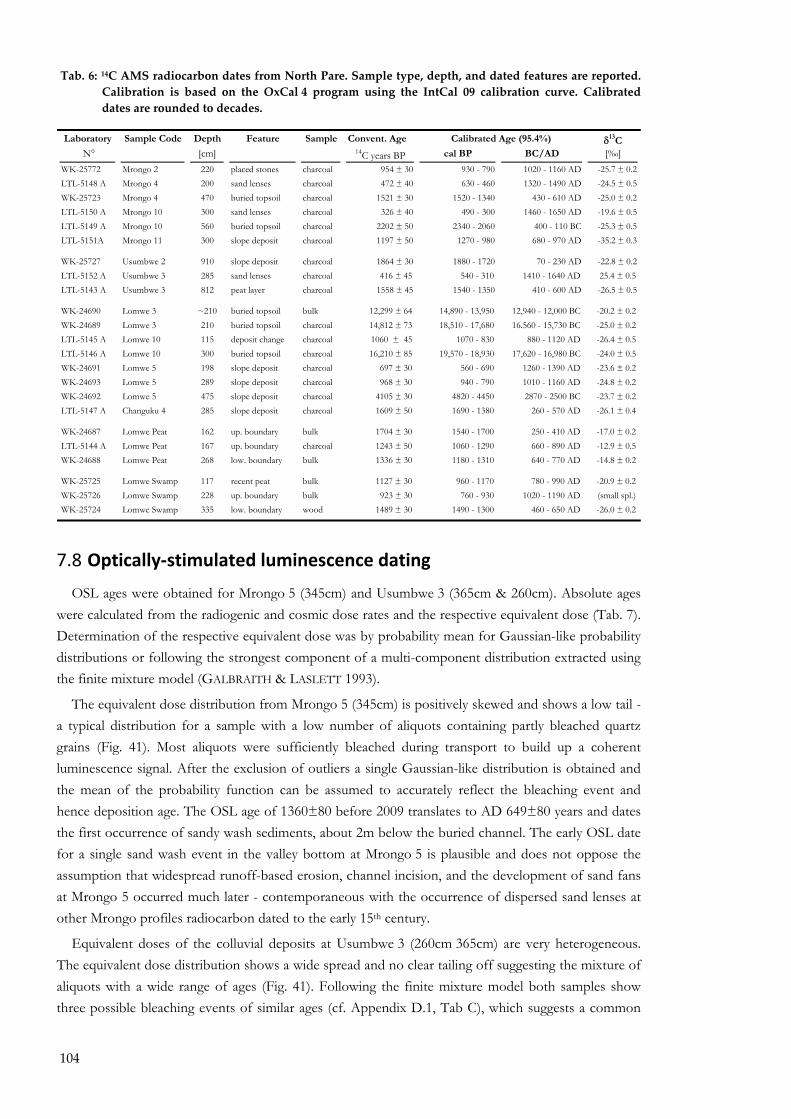
104
Tab. 6: 14C AMS radiocarbon dates from North Pare. Sample type, depth, and dated features are reported. Calibration is based on the OxCal 4 program using the IntCal 09 calibration curve. Calibrated dates are rounded to decades.
Laboratory Sample Code Depth Feature Sample Convent. Age δ13C N° [cm] 14C years BP cal BP BC/AD [�]
WK-25772 Mrongo 2 220 placed stones charcoal 954 ± 30 930 - 790 1020 - 1160 AD -25.7 ± 0.2LTL-5148 A Mrongo 4 200 sand lenses charcoal 472 ± 40 630 - 460 1320 - 1490 AD -24.5 ± 0.5WK-25723 Mrongo 4 470 buried topsoil charcoal 1521 ± 30 1520 - 1340 430 - 610 AD -25.0 ± 0.2LTL-5150 A Mrongo 10 300 sand lenses charcoal 326 ± 40 490 - 300 1460 - 1650 AD -19.6 ± 0.5LTL-5149 A Mrongo 10 560 buried topsoil charcoal 2202 ± 50 2340 - 2060 400 - 110 BC -25.3 ± 0.5LTL-5151A Mrongo 11 300 slope deposit charcoal 1197 ± 50 1270 - 980 680 - 970 AD -35.2 ± 0.3
WK-25727 Usumbwe 2 910 slope deposit charcoal 1864 ± 30 1880 - 1720 70 - 230 AD -22.8 ± 0.2LTL-5152 A Usumbwe 3 285 sand lenses charcoal 416 ± 45 540 - 310 1410 - 1640 AD 25.4 ± 0.5LTL-5143 A Usumbwe 3 812 peat layer charcoal 1558 ± 45 1540 - 1350 410 - 600 AD -26.5 ± 0.5
WK-24690 Lomwe 3 ~210 buried topsoil bulk 12,299 ± 64 14,890 - 13,950 12,940 - 12,000 BC -20.2 ± 0.2WK-24689 Lomwe 3 210 buried topsoil charcoal 14,812 ± 73 18,510 - 17,680 16.560 - 15,730 BC -25.0 ± 0.2LTL-5145 A Lomwe 10 115 deposit change charcoal 1060 ± 45 1070 - 830 880 - 1120 AD -26.4 ± 0.5LTL-5146 A Lomwe 10 300 buried topsoil charcoal 16,210 ± 85 19,570 - 18,930 17,620 - 16,980 BC -24.0 ± 0.5WK-24691 Lomwe 5 198 slope deposit charcoal 697 ± 30 560 - 690 1260 - 1390 AD -23.6 ± 0.2WK-24693 Lomwe 5 289 slope deposit charcoal 968 ± 30 940 - 790 1010 - 1160 AD -24.8 ± 0.2WK-24692 Lomwe 5 475 slope deposit charcoal 4105 ± 30 4820 - 4450 2870 - 2500 BC -23.7 ± 0.2LTL-5147 A Changuku 4 285 slope deposit charcoal 1609 ± 50 1690 - 1380 260 - 570 AD -26.1 ± 0.4
WK-24687 Lomwe Peat 162 up. boundary bulk 1704 ± 30 1540 - 1700 250 - 410 AD -17.0 ± 0.2LTL-5144 A Lomwe Peat 167 up. boundary charcoal 1243 ± 50 1060 - 1290 660 - 890 AD -12.9 ± 0.5WK-24688 Lomwe Peat 268 low. boundary bulk 1336 ± 30 1180 - 1310 640 - 770 AD -14.8 ± 0.2
WK-25725 Lomwe Swamp 117 recent peat bulk 1127 ± 30 960 - 1170 780 - 990 AD -20.9 ± 0.2WK-25726 Lomwe Swamp 228 up. boundary bulk 923 ± 30 760 - 930 1020 - 1190 AD (small spl.)WK-25724 Lomwe Swamp 335 low. boundary wood 1489 ± 30 1490 - 1300 460 - 650 AD -26.0 ± 0.2
Calibrated Age (95.4%)
7.8 Optically‐stimulated luminescence dating
OSL ages were obtained for Mrongo 5 (345cm) and Usumbwe 3 (365cm & 260cm). Absolute ages were calculated from the radiogenic and cosmic dose rates and the respective equivalent dose (Tab. 7). Determination of the respective equivalent dose was by probability mean for Gaussian-like probability distributions or following the strongest component of a multi-component distribution extracted using the finite mixture model (GALBRAITH & LASLETT 1993).
The equivalent dose distribution from Mrongo 5 (345cm) is positively skewed and shows a low tail - a typical distribution for a sample with a low number of aliquots containing partly bleached quartz grains (Fig. 41). Most aliquots were sufficiently bleached during transport to build up a coherent luminescence signal. After the exclusion of outliers a single Gaussian-like distribution is obtained and the mean of the probability function can be assumed to accurately reflect the bleaching event and hence deposition age. The OSL age of 1360±80 before 2009 translates to AD 649±80 years and dates the first occurrence of sandy wash sediments, about 2m below the buried channel. The early OSL date for a single sand wash event in the valley bottom at Mrongo 5 is plausible and does not oppose the assumption that widespread runoff-based erosion, channel incision, and the development of sand fans at Mrongo 5 occurred much later - contemporaneous with the occurrence of dispersed sand lenses at other Mrongo profiles radiocarbon dated to the early 15th century.
Equivalent doses of the colluvial deposits at Usumbwe 3 (260cm 365cm) are very heterogeneous. The equivalent dose distribution shows a wide spread and no clear tailing off suggesting the mixture of aliquots with a wide range of ages (Fig. 41). Following the finite mixture model both samples show three possible bleaching events of similar ages (cf. Appendix D.1, Tab C), which suggests a common
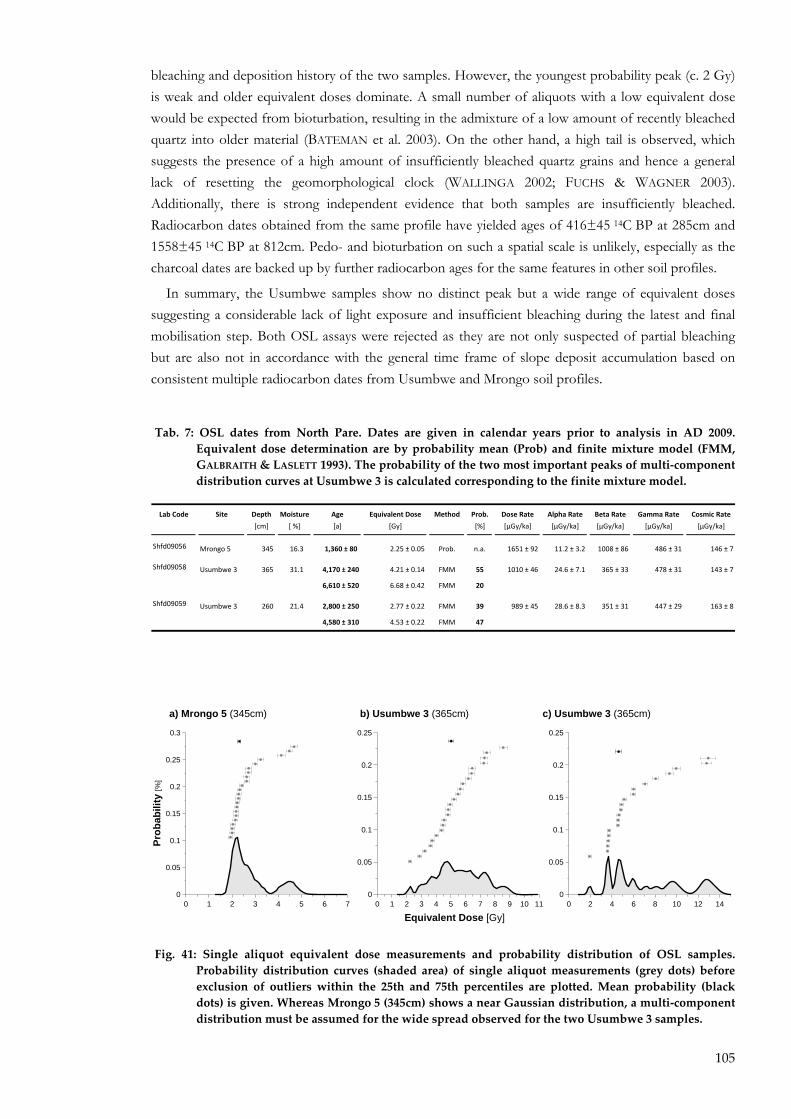
105
bleaching and deposition history of the two samples. However, the youngest probability peak (c. 2 Gy) is weak and older equivalent doses dominate. A small number of aliquots with a low equivalent dose would be expected from bioturbation, resulting in the admixture of a low amount of recently bleached quartz into older material (BATEMAN et al. 2003). On the other hand, a high tail is observed, which suggests the presence of a high amount of insufficiently bleached quartz grains and hence a general lack of resetting the geomorphological clock (WALLINGA 2002; FUCHS & WAGNER 2003). Additionally, there is strong independent evidence that both samples are insufficiently bleached. Radiocarbon dates obtained from the same profile have yielded ages of 416±45 14C BP at 285cm and 1558±45 14C BP at 812cm. Pedo- and bioturbation on such a spatial scale is unlikely, especially as the charcoal dates are backed up by further radiocarbon ages for the same features in other soil profiles.
In summary, the Usumbwe samples show no distinct peak but a wide range of equivalent doses suggesting a considerable lack of light exposure and insufficient bleaching during the latest and final mobilisation step. Both OSL assays were rejected as they are not only suspected of partial bleaching but are also not in accordance with the general time frame of slope deposit accumulation based on consistent multiple radiocarbon dates from Usumbwe and Mrongo soil profiles.
Tab. 7: OSL dates from North Pare. Dates are given in calendar years prior to analysis in AD 2009. Equivalent dose determination are by probability mean (Prob) and finite mixture model (FMM, GALBRAITH & LASLETT 1993). The probability of the two most important peaks of multi‐component distribution curves at Usumbwe 3 is calculated corresponding to the finite mixture model.
Lab Code Site Depth Age Equivalent Dose Method Prob. Dose Rate Alpha Rate Beta Rate Gamma Rate Cosmic Rate
[cm] [a] [Gy] [%] [µGy/ka] [µGy/ka] [µGy/ka] [µGy/ka] [µGy/ka]
Shfd09056 Mrongo 5 345 16.3 1,360 ± 80 2.25 ± 0.05 Prob. n.a. 1651 ± 92 11.2 ± 3.2 1008 ± 86 486 ± 31 146 ± 7
Shfd09058 Usumbwe 3 365 31.1 4,170 ± 240 4.21 ± 0.14 FMM 55 1010 ± 46 24.6 ± 7.1 365 ± 33 478 ± 31 143 ± 7
6,610 ± 520 6.68 ± 0.42 FMM 20
Shfd09059 Usumbwe 3 260 21.4 2,800 ± 250 2.77 ± 0.22 FMM 39 989 ± 45 28.6 ± 8.3 351 ± 31 447 ± 29 163 ± 8
4,580 ± 310 4.53 ± 0.22 FMM 47
[ %]
Moisture
0
0.05
0.1
0.15
0.2
0.25
0 2 4 6 8 10 12 14
c) Usumbwe 3 (365cm)
0
0.05
0.1
0.15
0.2
0.25
0 1 2 3 4 5 6 7 8 9 10 11
Equivalent Dose [Gy]
b) Usumbwe 3 (365cm)
0
0.05
0.1
0.15
0.2
0.25
0.3
Prob
abili
ty [%
]
0 1 2 3 4 5 6 7
a) Mrongo 5 (345cm)
Fig. 41: Single aliquot equivalent dose measurements and probability distribution of OSL samples. Probability distribution curves (shaded area) of single aliquot measurements (grey dots) before exclusion of outliers within the 25th and 75th percentiles are plotted. Mean probability (black dots) is given. Whereas Mrongo 5 (345cm) shows a near Gaussian distribution, a multi‐component distribution must be assumed for the wide spread observed for the two Usumbwe 3 samples.
106
7.9 Pollen record Total counts vary considerably between 2 to 1981 grains per slide; terrestrial pollen varies between
nil and 1449 per slide. A total of 72 different morphotypes were identified in the Lomwe Swamp Core, including 65 terrestrial pollen types, 6 wetland taxa, monolete (reniform) and trilete spores (Tab. 8 & Appendix C). Only 29 taxa are displayed in the pollen diagram (Fig. 42) and subjected to statistical analysis, whereas rare taxa (18 taxa only occurred in one depth interval and 38 taxa show maximum abundance proportions <2%) were excluded.
The terrestrial pollen sum shows high variation particularly within the buried peat below 220cm. Low total counts together with exceptionally high numbers of Asclepiadaceae and spores are responsible for low pollen sums and a high artificial variation. Single spikes of Dobera, Cleome, Eucalyptus/Syzygium, and Cuppresus/Juniperus are probably the result of uneven pollen deposition such as the inclusion of an entire inflorescence or catkins.
During the pollen identification process, several morphotypes had to be reclassified. Morphotypes initially counted as Urticaceae-type pollen were finally classed as Acalpyha. Tribulus-type pollen were re-classed and are now recorded as Ilex (similar ecology), likewise Tremma as Celtis (similar ecology). Pollen identified initially as Maesa were re-classed and is shown as Dobera. Due to their importance as ecological indicators and as stratigraphic time markers, two further pollen morphotypes Eucalyptus/Syzygium and Cupressus/Juniperus are discussed in detail in chapter 8.9.1.3.
7.9.1 Zonation and Ordination
Three major pollen zones can be separated on the bases of the two independent ordination methods - depth-constrained cluster analysis and unconstrained principal component analysis. Boundaries of the obtained pollen zones coincide with the stratigraphic delimitation of recent wetland (PZ III), hillwash deposit (PZ II) and buried peat layer (PZ I). Pollen samples from the first two zones fall into well-defined groups in both the cluster analysis (Fig. 42) and the PCA ordination (Fig. 43). The lowermost cluster (PZ I) on the other hand does not form a homogeneous cluster.
For the upper two pollen zones, sub zones are identified by both cluster analysis and PCA. Subzones (IIIa & IIIb) are characterised by distinct pollen assemblages and coincide with the stratigraphic boundaries between transition and the final establishment of the recent wetland. Similarly, two subzones (IIa & IIb) are distinguished within PZ II, albeit on a low dissimilarity level. The buried peat below 220cm (PZ I) shows a high between-sample variability, mirrored by high dispersion values of group joints in the dendrogram and a wide spread in the ordination plot. Whereas outliers are readily distinguished in the ordination plot, single samples distort the depth-constrained cluster analysis and may result in the splitting of an otherwise homogeneous cluster in two zones (e.g. sample 295cm, clay inwash). Forced inclusion of one distinct sample in a homogeneous cluster results in a dispersion increase and the loss of variance between originally heterogeneous clusters. Despite the exclusion of rare taxa, depth-constrained cluster analysis turned out to be an inadequate method to analyse the highly variable floral composition of the buried peat sequence. Final delimitation of pollen zones is based on comparison of both ordination results. This semi-objective approach was preferred over the non-critical adoption of significance values derived from a broken-stick model for the cluster analysis as proposed by BENNETT (1996).
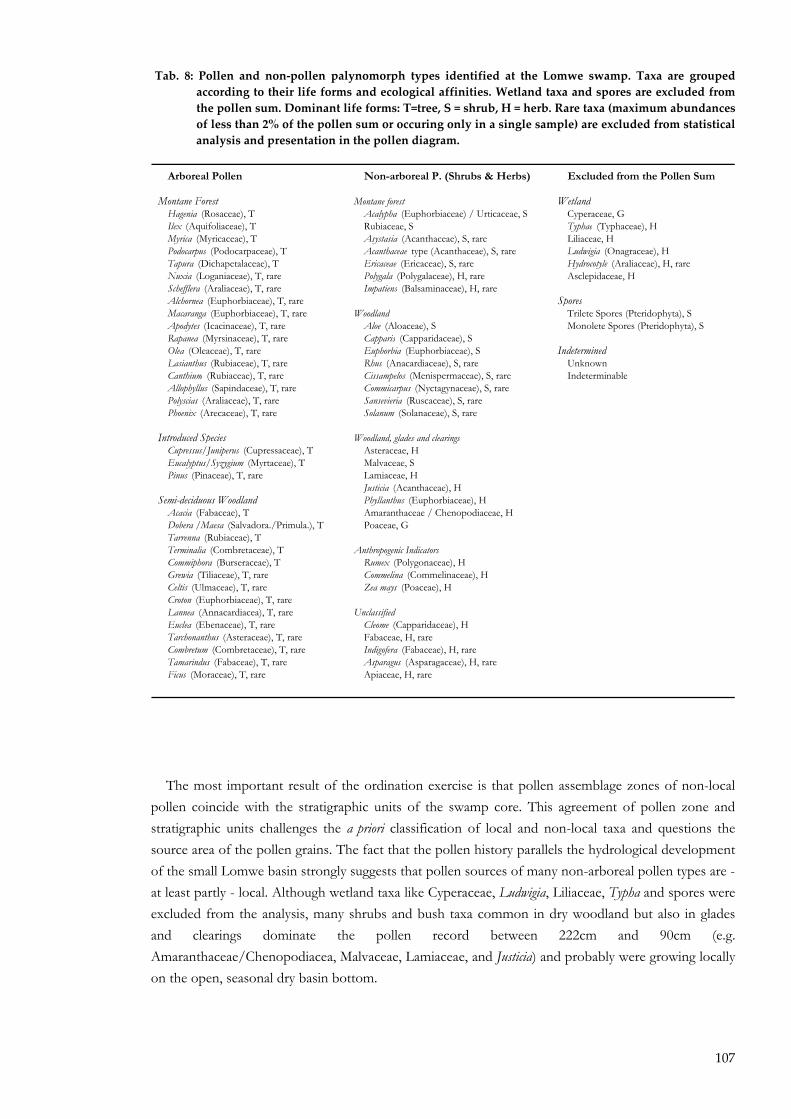
107
Tab. 8: Pollen and non‐pollen palynomorph types identified at the Lomwe swamp. Taxa are grouped according to their life forms and ecological affinities. Wetland taxa and spores are excluded from the pollen sum. Dominant life forms: T=tree, S = shrub, H = herb. Rare taxa (maximum abundances of less than 2% of the pollen sum or occuring only in a single sample) are excluded from statistical analysis and presentation in the pollen diagram.
Arboreal Pollen Non-arboreal P. (Shrubs & Herbs) Excluded from the Pollen Sum
Montane Forest Montane forest WetlandHagenia (Rosaceae), T Acalypha (Euphorbiaceae) / Urticaceae, S Cyperaceae, GIlex (Aquifoliaceae), T Rubiaceae, S Typhae (Typhaceae), HMyrica (Myricaceae), T Asystasia (Acanthaceae), S, rare Liliaceae, HPodocarpus (Podocarpaceae), T Acanthaceae type (Acanthaceae), S, rare Ludwigia (Onagraceae), HTapura (Dichapetalaceae), T Ericaceae (Ericaceae), S, rare Hydrocotyle (Araliaceae), H, rareNuxia (Loganiaceae), T, rare Polygala (Polygalaceae), H, rare Asclepidaceae, HSchefflera (Araliaceae), T, rare Impatiens (Balsaminaceae), H, rareAlchornea (Euphorbiaceae), T, rare SporesMacaranga (Euphorbiaceae), T, rare Woodland Trilete Spores (Pteridophyta), SApodytes (Icacinaceae), T, rare Aloe (Aloaceae), S Monolete Spores (Pteridophyta), SRapanea (Myrsinaceae), T, rare Capparis (Capparidaceae), SOlea (Oleaceae), T, rare Euphorbia (Euphorbiaceae), S IndeterminedLasianthus (Rubiaceae), T, rare Rhus (Anacardiaceae), S, rare Unknown Canthium (Rubiaceae), T, rare Cissampelos (Menispermaceae), S, rare IndeterminableAllophyllus (Sapindaceae), T, rare Commicarpus (Nyctagynaceae), S, rarePolyscias (Araliaceae), T, rare Sansevieria (Ruscaceae), S, rarePhoenix (Arecaceae), T, rare Solanum (Solanaceae), S, rare
Introduced Species Woodland, glades and clearingsCupressus/Juniperus (Cupressaceae), T Asteraceae, HEucalyptus/Syzygium (Myrtaceae), T Malvaceae, SPinus (Pinaceae), T, rare Lamiaceae, H
Justicia (Acanthaceae), HSemi-deciduous Woodland Phyllanthus (Euphorbiaceae), H
Acacia (Fabaceae), T Amaranthaceae / Chenopodiaceae, HDobera /Maesa (Salvadora./Primula.), T Poaceae, GTarrenna (Rubiaceae), TTerminalia (Combretaceae), T Anthropogenic IndicatorsCommiphora (Burseraceae), T Rumex (Polygonaceae), HGrewia (Tiliaceae), T, rare Commelina (Commelinaceae), HCeltis (Ulmaceae), T, rare Zea mays (Poaceae), HCroton (Euphorbiaceae), T, rareLannea (Annacardiacea), T, rare UnclassifiedEuclea (Ebenaceae), T, rare Cleome (Capparidaceae), HTarchonanthus (Asteraceae), T, rare Fabaceae, H, rareCombretum (Combretaceae), T, rare Indigofera (Fabaceae), H, rareTamarindus (Fabaceae), T, rare Asparagus (Asparagaceae), H, rareFicus (Moraceae), T, rare Apiaceae, H, rare
The most important result of the ordination exercise is that pollen assemblage zones of non-local pollen coincide with the stratigraphic units of the swamp core. This agreement of pollen zone and stratigraphic units challenges the a priori classification of local and non-local taxa and questions the source area of the pollen grains. The fact that the pollen history parallels the hydrological development of the small Lomwe basin strongly suggests that pollen sources of many non-arboreal pollen types are - at least partly - local. Although wetland taxa like Cyperaceae, Ludwigia, Liliaceae, Typha and spores were excluded from the analysis, many shrubs and bush taxa common in dry woodland but also in glades and clearings dominate the pollen record between 222cm and 90cm (e.g. Amaranthaceae/Chenopodiacea, Malvaceae, Lamiaceae, and Justicia) and probably were growing locally on the open, seasonal dry basin bottom.
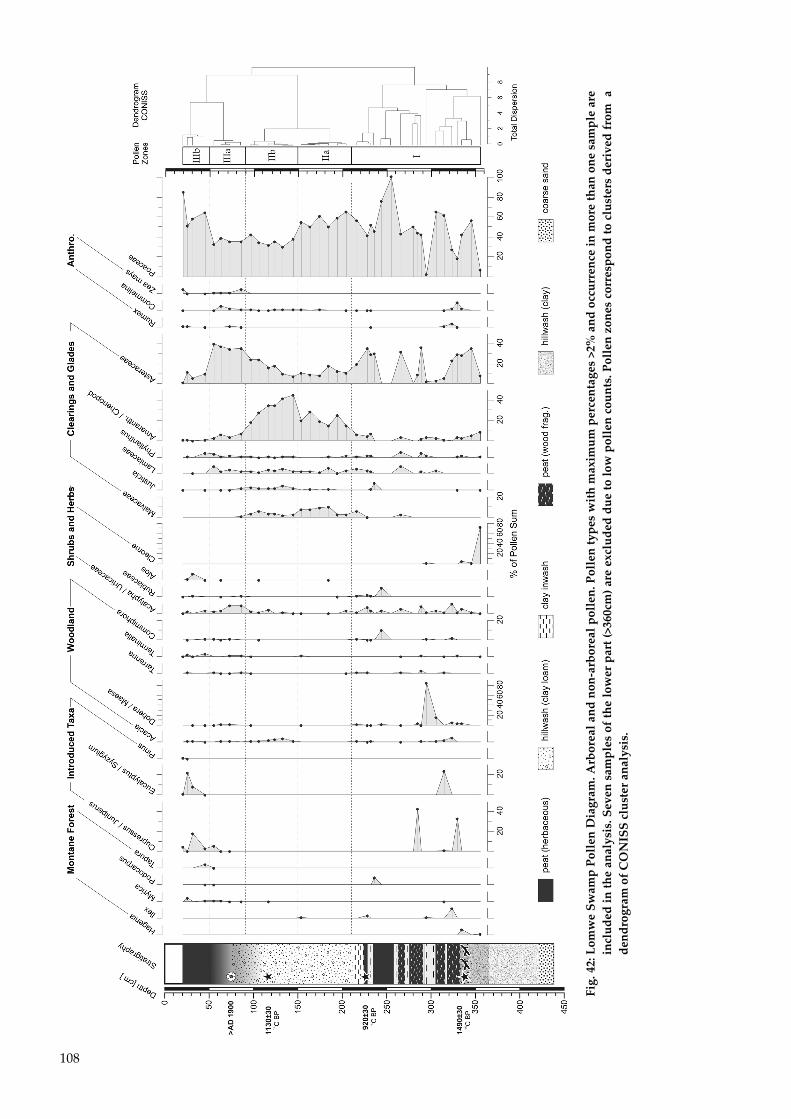
108
Fig. 42: Lomwe Swamp Pollen Diagram. Arboreal and non‐arboreal pollen. Pollen types with maximum percentages >2% and occurrence in more than one sample are
included in the analysis. Seven samples of the lower part (>360cm) are excluded due to low pollen counts. Pollen zones correspond to clusters derived from a
dendrogram of CONISS cluster analysis.
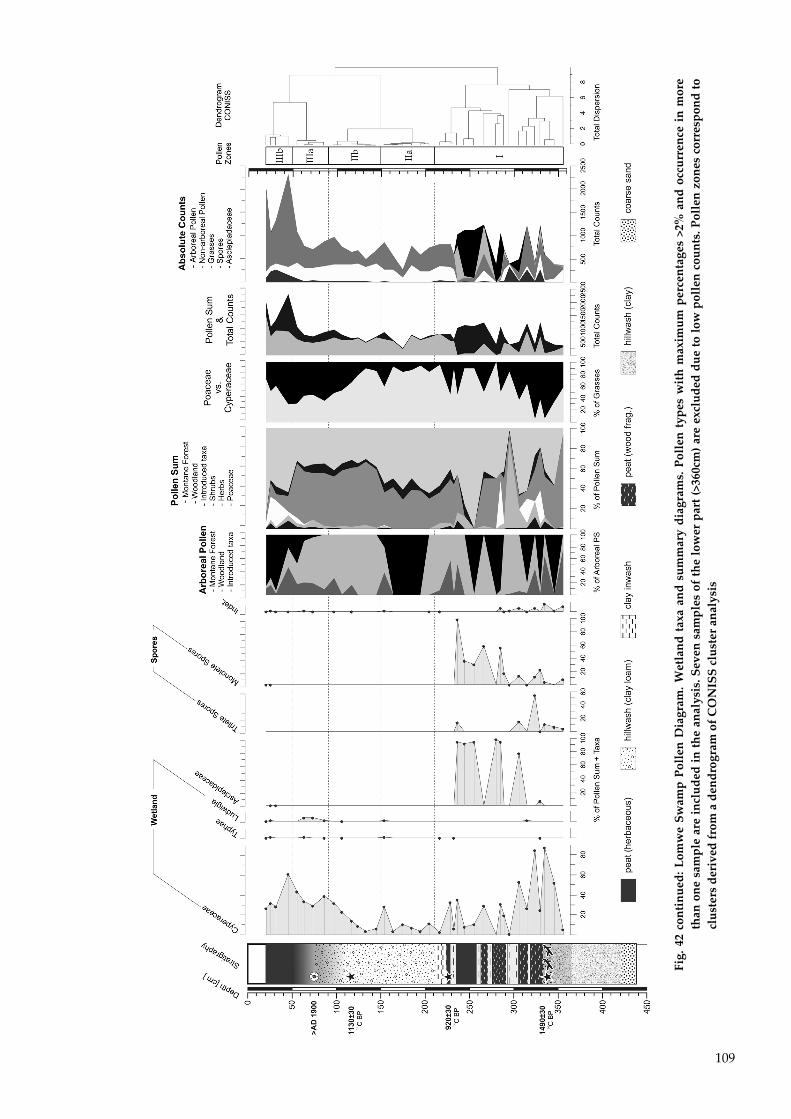
109
Fig. 42 continued: Lomwe Swamp Pollen Diagram. W
etland taxa and summary diagrams. Pollen types with maximum percentages >2% and occurrence in more
than one sample are included in the analysis. Seven samples of the lower part (>360cm) are excluded due to low pollen counts. Pollen zones correspond to
clusters derived from a dendrogram of CONISS cluster analysis

110
7.9.2 Pollen zones
7.9.2.1 Pollen zone I: Buried Peat
The lowermost pollen zone (>210cm) encompasses the buried peat layer and is characterised by highly fluctuating taxa. Arboreal taxa with woodland affinity like Acacia, Tarrenna and Terminalia occur frequently, but only Dobera/Maesa is present throughout the zone. Several spikes of Dobera/Maesa, Cupressaceae and Eucalyptus/Syzygium distort the pollen diagram and suggest an uneven spatial distribution of pollen such as the deposition of catkins by native species growing in the immediate vicinity of the swamp.
The shrubby Acalypha/Urticaceae group is present throughout the zone albeit with low percentages (<10%) � similarly Amaranthaceae/Chenopodiaceae and Phyllanthus. Asteraceae percentages are highly variable but reach up to 50%, especially in the lower part of the zone. Poaceae and Cyperaceae are abundant but fluctuate strongly and show opposing trends in the upper and lower part of the zone. Whereas Cyperaceae dominates the earlier part of the buried peat, Poaceae fluctuates between 15% and 60% but stabilises above 45% in the upper part. Based on the abundance of wetland taxa - Cyperaceae, Asclepiadaceae and spores - the pollen assemblage can be subdivided in a lower and upper peat layer. The lower part (360 - 292cm) is characterised by the occurrence of trilete spores, the presence of few reniform spores (<20%) and the occasional occurrence of Asclepiadaceae and abundant Cyperaceae. High absolute counts of Asclepiadaceae and reniform spores and little Cyperaceae pollen in the upper part (292 � 210cm) suggest a change in wetland vegetation. Additionally, the earliest peat development between 300 and 340cm shows a high number of rare taxa and a comparable high diversity. The extremely high absolute numbers of Asclepiadaceae indirectly results in a small pollen sum, increases variability and favours distortion.
7.9.2.2 Pollen Zone II: Colluvial and alluvial hillwash
Pollen zone II extends from 210cm to 90cm and coincides with the stratigraphic unit of alluvial and colluvial hillwash. Absence of arboreal taxa and dominance of non-arboreal shrubs and herbs typical for semi-deciduous woodland, glades, and clearings characterise PZ II. Dominant families are Amaranthaceae/Chenopodiaceae (15% to 45%) and Malvaceae (up to 10%). Abundance of Asteraceae is low compared to PZ I but rises steadily from about 10% to 30% towards the top of the zone. Further typical taxa that characterise this zone are Lamiaceae, Justicia, and Commelina. Montane forest undergrowth shrubs and herbs are rare and even the omnipresent Acalypha/Urticaceae group is only intermittently present with comparatively low amounts of pollen.
The few arboreal taxa recorded occur towards the upper and lower boundary, whereas tree pollen is absent in the middle part of in pollen zone II. Montane forest taxa are virtually absent in the entire zone with the exception of the occasional occurrence of Ilex. Woodland taxa are slightly better represented with Dobera/Maesa, Tarenna, Commiphora, Celtis and Grewia occurring towards the boundaries and comparatively high abundances of Acacia (1-4%) forming a distinct section in the upper part (97 � 150cm) of the zone.
PZ II can be subdivided in two subzones (IIa and IIb). Arboreal taxa disappear entirely between 150 and 200cm in the lower subzone IIa. They return in the upper subzone IIb with Acacia and Grewia being constantly present and Acacia experiencing maximum percentages. The subzone boundary at 150cm depth shows small but distinct changes in pollen abundances, like a decrease in Malvaceae and an abrupt increase of Amaranthaceae/Chenopodiaceae pollen, which subsequently declines steadily.
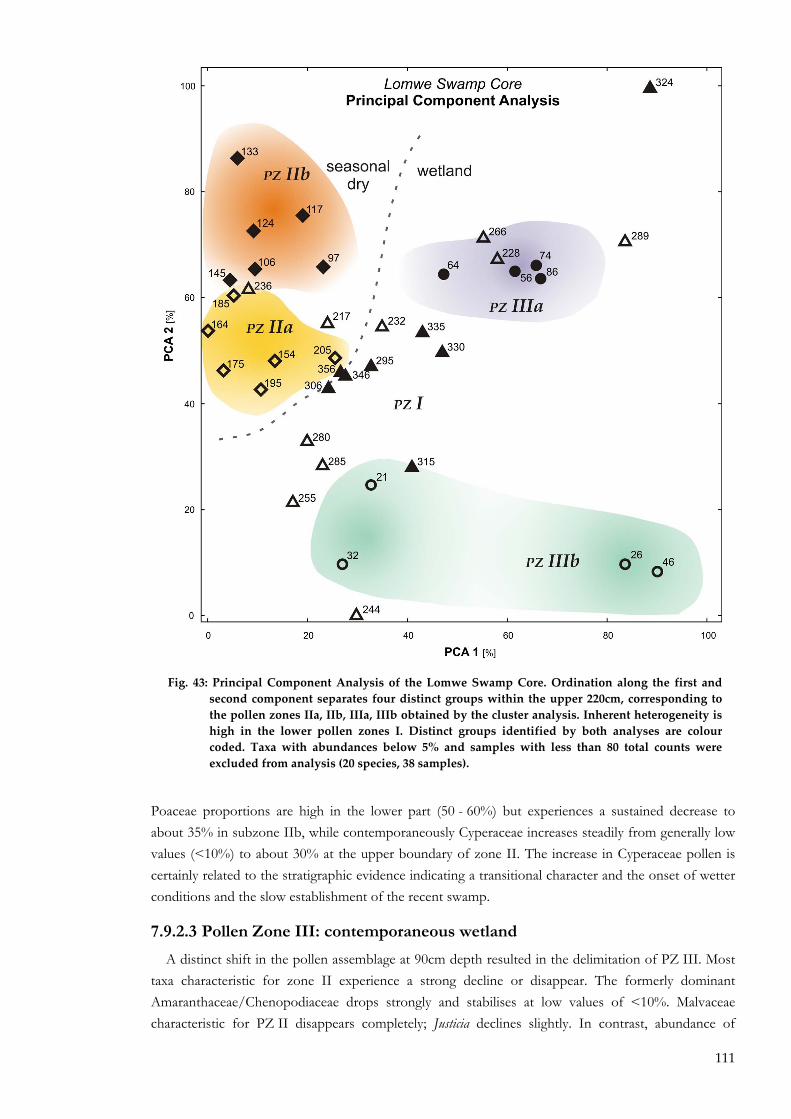
111
Poaceae proportions are high in the lower part (50 - 60%) but experiences a sustained decrease to about 35% in subzone IIb, while contemporaneously Cyperaceae increases steadily from generally low values (<10%) to about 30% at the upper boundary of zone II. The increase in Cyperaceae pollen is certainly related to the stratigraphic evidence indicating a transitional character and the onset of wetter conditions and the slow establishment of the recent swamp.
7.9.2.3 Pollen Zone III: contemporaneous wetland
A distinct shift in the pollen assemblage at 90cm depth resulted in the delimitation of PZ III. Most taxa characteristic for zone II experience a strong decline or disappear. The formerly dominant Amaranthaceae/Chenopodiaceae drops strongly and stabilises at low values of <10%. Malvaceae characteristic for PZ II disappears completely; Justicia declines slightly. In contrast, abundance of
Fig. 43: Principal Component Analysis of the Lomwe Swamp Core. Ordination along the first and second component separates four distinct groups within the upper 220cm, corresponding to the pollen zones IIa, IIb, IIIa, IIIb obtained by the cluster analysis. Inherent heterogeneity is high in the lower pollen zones I. Distinct groups identified by both analyses are colour coded. Taxa with abundances below 5% and samples with less than 80 total counts were excluded from analysis (20 species, 38 samples).
112
Asteraceae pollen, which was depressed during zone II, increases, and peaks at 35-40%. Arboreal taxa re-establish and woodland vegetation dominates, represented by Acacia, Grewia, Celtis, Terminalia, Commiphora, as well as Tarrenna and Dobera/Maesa. Montane forest taxa reappear but only Myrica is present throughout the zone, whereas Nuxia, Podocarpus and Tapura, Olea and Lasianthus only occur in the upper most samples. Acalypha/Urticaceae recovers and is represented with proportions of up to 10%. Most conspicuous however, is the first occurrence of exotic taxa like Zea mays, and shortly after Cupressus. The occurrence of maize is accompanied by ruderal vegetation indicators like Rumex and Commelina.
PZ III comprises two distinct subzones separated clearly by both numerical analyses. The lowermost zone IIIa (90 � 51cm) corresponds to the stratigraphic transition from the alluvium to the recent fen deposit, and mirrors the changes related to the reestablishment of a wetland. Wetter conditions are reflected by the occurrence of Ludwigia, Typha and Liliaceae and most notably by the sustained high proportions of Cyperaceae (>30%). The lower boundary of the zone is defined by the sustained absence of the Malvaceae family, the strong decrease of Amaranthaceae/Chenopodiaceae, elevated Asteraceae percentages and the appearance of Zea mays.
The upper zone IIIb (20 - 51cm) comprises the recent swamp deposit and can be taken as representative for modern pollen deposition on the Lomwe Swamp. In contrast to IIIa, arboreal pollen composition is dominated by high abundances of exotic tree pollen derived from the genera Eucalyptus, Cupressus and Pinus reflecting the recent afforestation with fast growing exotic timber taxa. In addition to Myrica, Nuxia and occasionally Podocarpus and Tapura, a considerable number of rare taxa like Rapanea, Allophylus and Apdoytes, Schefflera, Canthium occur sporadically in this zone and the overall diversity increased. Due to the high numbers of exotic tree pollen counts, the proportional importance of woodland taxa decreases from >70% to <10%. The woodland genera Terminalia and Acacia are still and steadily present and are accompanied by the occasional occurrence of Dobera/Maesa, Commiphora, Tarenna, Grewia, Celtis, Croton, Lannea, and Euclea. Owing to the strong abundance of exotic tree genera, arboreal pollen dominated over non-arboreal pollen for the first time since pollen zone Ia. Despite their proportional decrease, Acalypha pollen is still continuously present. Rubiaceae and Euphorbia as well as Aloe occur frequently.
The most distinct changes between subzone IIIa and IIIb is the complete disappearance of taxa dominating PZ II. Asteraceae pollen, which has dominated the non-arboreal record so far and peaked in zone IIIa (30-40%), is strongly reduced to about less than 10%. Amaranthaceae/Chenopodiaceae which experience its most remarkable decrease in zone III decline further but are present at low levels of <1%. Similarly, Lamiaceae, Justicia and Phyllanthus decrease and are only occasionally present. Low Zea mays pollen influx (<1%) indicates continuous maize cultivation, however only in the uppermost sample does maize represent more than 4% of the pollen sum. After sustained low levels throughout zone II and IIIa, Poaceae increases from around 40% to 60%, whereas Cyperaceae remains high around 30% indicating continuous wetland and swamp conditions of local basin bottom. Phoenix pollen is present and most likely to be derived from a local Phoenix palm.
7.10 Phytolith record Phytolith types were dominated by generic and grass short cell phytoliths (Tab. 9). Generic grass
phytoliths are tabular rectangular (blocky rectangular), cuneiform bulliform cells (Fan shaped) and parallelepipedal bulliform cells (bulliforms). Further, trichomes and hair root cells as well as cells from the stomatal complex are recorded. Undiagnostic types are elongate entire and elongate polylobate
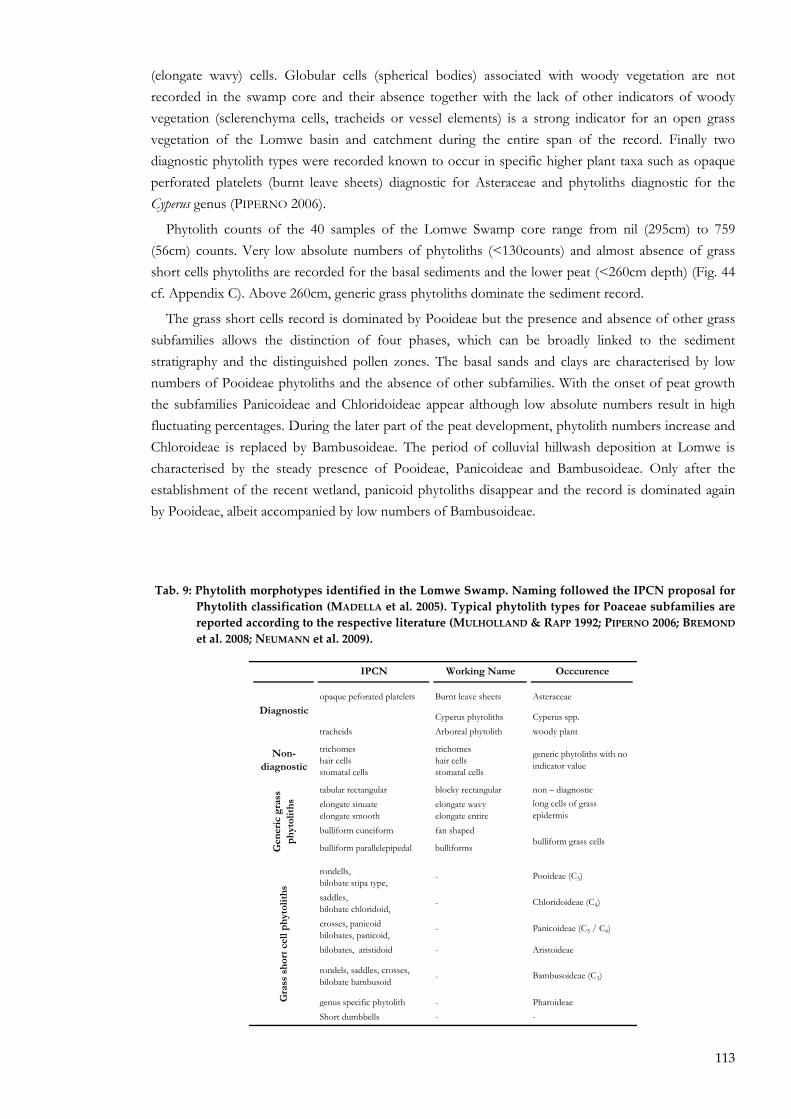
113
(elongate wavy) cells. Globular cells (spherical bodies) associated with woody vegetation are not recorded in the swamp core and their absence together with the lack of other indicators of woody vegetation (sclerenchyma cells, tracheids or vessel elements) is a strong indicator for an open grass vegetation of the Lomwe basin and catchment during the entire span of the record. Finally two diagnostic phytolith types were recorded known to occur in specific higher plant taxa such as opaque perforated platelets (burnt leave sheets) diagnostic for Asteraceae and phytoliths diagnostic for the Cyperus genus (PIPERNO 2006).
Phytolith counts of the 40 samples of the Lomwe Swamp core range from nil (295cm) to 759 (56cm) counts. Very low absolute numbers of phytoliths (<130counts) and almost absence of grass short cells phytoliths are recorded for the basal sediments and the lower peat (<260cm depth) (Fig. 44 cf. Appendix C). Above 260cm, generic grass phytoliths dominate the sediment record.
The grass short cells record is dominated by Pooideae but the presence and absence of other grass subfamilies allows the distinction of four phases, which can be broadly linked to the sediment stratigraphy and the distinguished pollen zones. The basal sands and clays are characterised by low numbers of Pooideae phytoliths and the absence of other subfamilies. With the onset of peat growth the subfamilies Panicoideae and Chloridoideae appear although low absolute numbers result in high fluctuating percentages. During the later part of the peat development, phytolith numbers increase and Chloroideae is replaced by Bambusoideae. The period of colluvial hillwash deposition at Lomwe is characterised by the steady presence of Pooideae, Panicoideae and Bambusoideae. Only after the establishment of the recent wetland, panicoid phytoliths disappear and the record is dominated again by Pooideae, albeit accompanied by low numbers of Bambusoideae.
Tab. 9: Phytolith morphotypes identified in the Lomwe Swamp. Naming followed the IPCN proposal for Phytolith classification (MADELLA et al. 2005). Typical phytolith types for Poaceae subfamilies are reported according to the respective literature (MULHOLLAND & RAPP 1992; PIPERNO 2006; BREMOND et al. 2008; NEUMANN et al. 2009).
IPCN Working Name Occcurence
opaque peforated platelets Burnt leave sheets Asteraceae
Cyperus phytoliths Cyperus spp.tracheids Arboreal phytolith woody plant
trichomes trichomeshair cells hair cellsstomatal cells stomatal cells
tabular rectangular blocky rectangular non � diagnosticelongate sinuate elongate wavyelongate smooth elongate entirebulliform cuneiform fan shaped
bulliform parallelepipedal bulliforms
rondells,bilobate stipa type,saddles,bilobate chloridoid,crosses, panicoidbilobates, panicoid,bilobates, aristidoid - Aristoideae
rondels, saddles, crosses, bilobate bambusoid - Bambusoideae (C3)
genus specific phytolith - PharoideaeShort dumbbells - -
Panicoideae (C3 / C4)
Pooideae (C3)
- Chloridoideae (C4)
Gra
ss s
hor
t ce
ll p
hyt
olit
hs
-
-
Diagnostic
Non-diagnostic
generic phytoliths with no indicator value
Gen
eric
gra
ss
ph
ytol
ith
s long cells of grass epidermis
bulliform grass cells
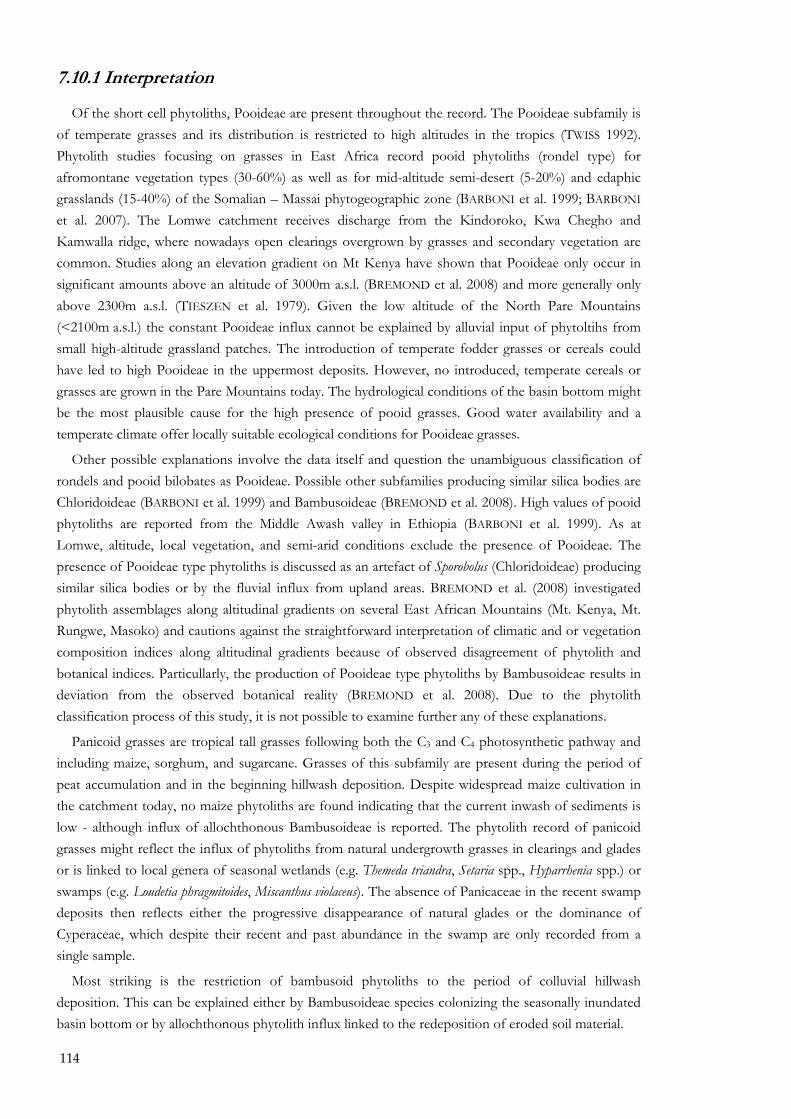
114
7.10.1 Interpretation
Of the short cell phytoliths, Pooideae are present throughout the record. The Pooideae subfamily is of temperate grasses and its distribution is restricted to high altitudes in the tropics (TWISS 1992). Phytolith studies focusing on grasses in East Africa record pooid phytoliths (rondel type) for afromontane vegetation types (30-60%) as well as for mid-altitude semi-desert (5-20%) and edaphic grasslands (15-40%) of the Somalian � Massai phytogeographic zone (BARBONI et al. 1999; BARBONI et al. 2007). The Lomwe catchment receives discharge from the Kindoroko, Kwa Chegho and Kamwalla ridge, where nowadays open clearings overgrown by grasses and secondary vegetation are common. Studies along an elevation gradient on Mt Kenya have shown that Pooideae only occur in significant amounts above an altitude of 3000m a.s.l. (BREMOND et al. 2008) and more generally only above 2300m a.s.l. (TIESZEN et al. 1979). Given the low altitude of the North Pare Mountains (<2100m a.s.l.) the constant Pooideae influx cannot be explained by alluvial input of phytoltihs from small high-altitude grassland patches. The introduction of temperate fodder grasses or cereals could have led to high Pooideae in the uppermost deposits. However, no introduced, temperate cereals or grasses are grown in the Pare Mountains today. The hydrological conditions of the basin bottom might be the most plausible cause for the high presence of pooid grasses. Good water availability and a temperate climate offer locally suitable ecological conditions for Pooideae grasses.
Other possible explanations involve the data itself and question the unambiguous classification of rondels and pooid bilobates as Pooideae. Possible other subfamilies producing similar silica bodies are Chloridoideae (BARBONI et al. 1999) and Bambusoideae (BREMOND et al. 2008). High values of pooid phytoliths are reported from the Middle Awash valley in Ethiopia (BARBONI et al. 1999). As at Lomwe, altitude, local vegetation, and semi-arid conditions exclude the presence of Pooideae. The presence of Pooideae type phytoliths is discussed as an artefact of Sporobolus (Chloridoideae) producing similar silica bodies or by the fluvial influx from upland areas. BREMOND et al. (2008) investigated phytolith assemblages along altitudinal gradients on several East African Mountains (Mt. Kenya, Mt. Rungwe, Masoko) and cautions against the straightforward interpretation of climatic and or vegetation composition indices along altitudinal gradients because of observed disagreement of phytolith and botanical indices. Particullarly, the production of Pooideae type phytoliths by Bambusoideae results in deviation from the observed botanical reality (BREMOND et al. 2008). Due to the phytolith classification process of this study, it is not possible to examine further any of these explanations.
Panicoid grasses are tropical tall grasses following both the C3 and C4 photosynthetic pathway and including maize, sorghum, and sugarcane. Grasses of this subfamily are present during the period of peat accumulation and in the beginning hillwash deposition. Despite widespread maize cultivation in the catchment today, no maize phytoliths are found indicating that the current inwash of sediments is low - although influx of allochthonous Bambusoideae is reported. The phytolith record of panicoid grasses might reflect the influx of phytoliths from natural undergrowth grasses in clearings and glades or is linked to local genera of seasonal wetlands (e.g. Themeda triandra, Setaria spp., Hyparrhenia spp.) or swamps (e.g. Loudetia phragmitoides, Miscanthus violaceus). The absence of Panicaceae in the recent swamp deposits then reflects either the progressive disappearance of natural glades or the dominance of Cyperaceae, which despite their recent and past abundance in the swamp are only recorded from a single sample.
Most striking is the restriction of bambusoid phytoliths to the period of colluvial hillwash deposition. This can be explained either by Bambusoideae species colonizing the seasonally inundated basin bottom or by allochthonous phytolith influx linked to the redeposition of eroded soil material.
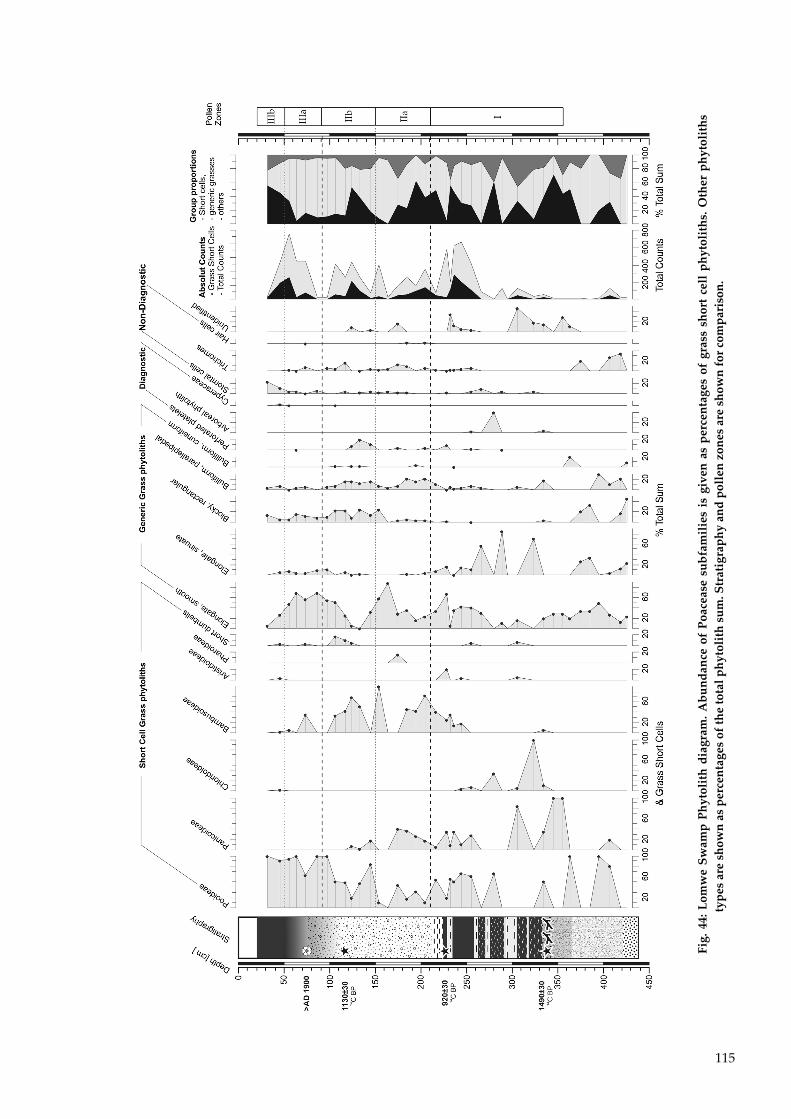
115
Fig. 44: Lomwe Swamp Phytolith diagram. Abundance of Poacease subfamilies is given as percentages of grass short cell phytoliths. Other phytoliths
types are shown as percentages of the total phytolith sum. Stratigraphy and pollen zones are shown for comparison.
116
Most likely is that phytoliths of herbaceous, forest-dwelling Bambusoideae (PIPERNO 2006) have been derived with eroded forest soils of the catchment slopes and been redeposited together with hillwash sediments. Herbaceous Bambusoideae are the most likely source for the bambusoid phytoliths as the well-known woody bamboo, Arundinaria alpina has not been reported on the Pare and Usambara Mountains albeit being present in the southern Eastern Arc Mountains, on Mt. Meru, and on a few spots on Kilimanjaro (LOVETT 1994; GRIMSHAW 1999; HEMP 2006b). The occurrence of Bambusoideae on the catchment slopes would be a strong evidence for an open forest environment with either natural glades or anthropogenic clearings, favouring grass growth in an open forest setting.
The presence of Chloridoideae during the formation of the buried swamp is somehow puzzling as the Chloridoideae subfamily is characteristic for semi-arid grasslands (TWISS 1992). In his phytolith study along an altitudinal gradient on Mt Kenya BREMOND et al. (2008) found that unambiguous identification of the chloridoid saddle type is not possible if Bambusoideae and Arundinoideae are present � both also saddle producers. Therefore, it cannot be ruled out that the counted Chloridoideae saddles are at least partly derived from Bambusoideae, which would extend their occurrence into the period of peat accumulation and result in a constant presence of Bambusoideae in the record. Otherwise, Chloridoideae grasses in the catchment would suggest drier conditions and a local expansion of short grass vegetation � maybe within anthropogenic clearances. The possibility that Chloridoideae phytoliths are derived from the cultivation of the indigenous cereal genera Eragrostis tef (teff) and Eleusine coracana (finger millet) on the slopes should be viewed with caution as no maize phytoliths have been recognised despite current widespread maize cultivation.
The interpretation of the Lomwe phytolith record is hampered by three main difficulties: methodological shortcomings considering the classification of Poaceae subfamilies, the difficulty of discerning between (probably temporally varying) autochthonous and allochthonous phytolith sources, and the tempered climate of the montane environment, where silica bodies from both C3 and C4 subfamilies are likely to occur. Given these complications, the only pattern, which can be interpreted confidently, is the rise and fall of Bambusoideae. The occurrence of Bambusoideae represents the influx of allochthonous phytoliths and reflects increased levels of disturbance, the presence of secondary vegetation in anthropogenic clearings and hence a general, widespread opening up of the montane forests in the Mashewa catchment.
117
8 STRATIGRAPHY AND CHARACTERISTIC FEATURES OF HILLSLOPE DEPOSITS
A stratigraphic framework of slope deposit accumulation is constructed based on the correlation of characteristic sediment features between profiles and sites. The division of slope deposits into stratigraphic units is based on benchmark criteria, that allow the distinction of in situ subsoils and buried topsoils (unit I), as well as different phases of colluvial deposition (units II, III, IV). The most important benchmark characteristics are topsoil development, sand lenses, redeposited soil aggregates, colour changes, and charcoal occurrence. Magnetic susceptibility parameters support the division and facilitate stratigraphic correlation between profiles and sites. Further, stable carbon isotope composition gives insights into the vegetation and forest history of Pare.
8.1 Buried soils and erosion surfaces Former ground surfaces are recognised as either unconformities due to truncation or by the
preservation of a former surface soil. Accretionary soil development on the other hand results in over-thickened and poorly developed soil horizons difficult to identify (CATT 1986; RETALLACK 2001). All three types of former surfaces are recorded in the slope deposits of North Pare.
Distinctive dark buried topsoil horizons were recorded at Mrongo 3, 10, & 4 and Lomwe 3, 10, 4, & 5, but not at Mrongo 2 & 5, Usumbwe 1 & 2, and Lomwe 6, where slope deposits apparently overlie B/C-transition horizons (Fig. 45). The dark layers are about c. 10 - 15cm thin at Mrongo but slightly thicker at Lomwe, show clear-cut boundaries and are readily distinguishable in the field by their dark appearance (generally hue 7.5YR, value <3, chroma <2) suggesting an elevated organic matter content. Buried soils at Lomwe are dark, frail, and organic matter rich (2.0%±0.4 Corg, Tab. 10). Average organic carbon content of dark buried topsoils at Mrongo is much lower (0.9%±0.1) and analytically hardly discernable from the background organic matter content of the slope deposits (0.6%±0.1). The higher organic carbon content at Lomwe confirms the field observation of a thicker, more frail and organic matter rich layer at Lomwe and thinner, less developed and more compacted horizon at Mrongo. The differences between the two buried surfaces are not only of diagenetic nature and due to stronger compaction below deeper deposits at Mrongo, but are likely to reflect an originally strongly organic matter enriched soil, possibly even a buried organic layer at Lomwe. This difference is supported by considerable different age of the two buried surfaces. Whereas the buried topsoils at Lomwe date to the LGM, the burial of the land surface at Mrongo and Usumbwe must have occurred between 400 BC and AD 610 (14C dates of charcoal fragments from buried topsoils, cf. Tab. 6).
The buried land surfaces are not observed at all profiles. A large boulder put an end to excavation at Lomwe 6 and no signs of a former stable surface were recorded. Mrongo 5 was too shallow (4.4m) to reach the bottom of the colluvial deposits. At Usumbwe 2, slope deposits merge at 910cm (charcoal recovery) into a B/C-transition horizon characterised by common, strongly weathered gravel around 9.7m. No distinct boundary between slope deposits and in situ subsoil material was observed. Profiles on the upper footslope (Mrongo 2 & Usumbwe 1) show diffuse, dark grey boundary layers between colluvial material and subsoil or B/C-transition horizons. These layers are often characterised by mottles and dark staining of blackish to dark greyish colours (Fig. 45). The dark staining may have originated from originally higher organic carbon content, however, no Corg increase has been detected (Fig. 34). Alternatively, redoximorphic processes in a probably seasonally waterlogged stratum over more compact bedrock may have promoted dark staining by finely dispersed iron and manganese
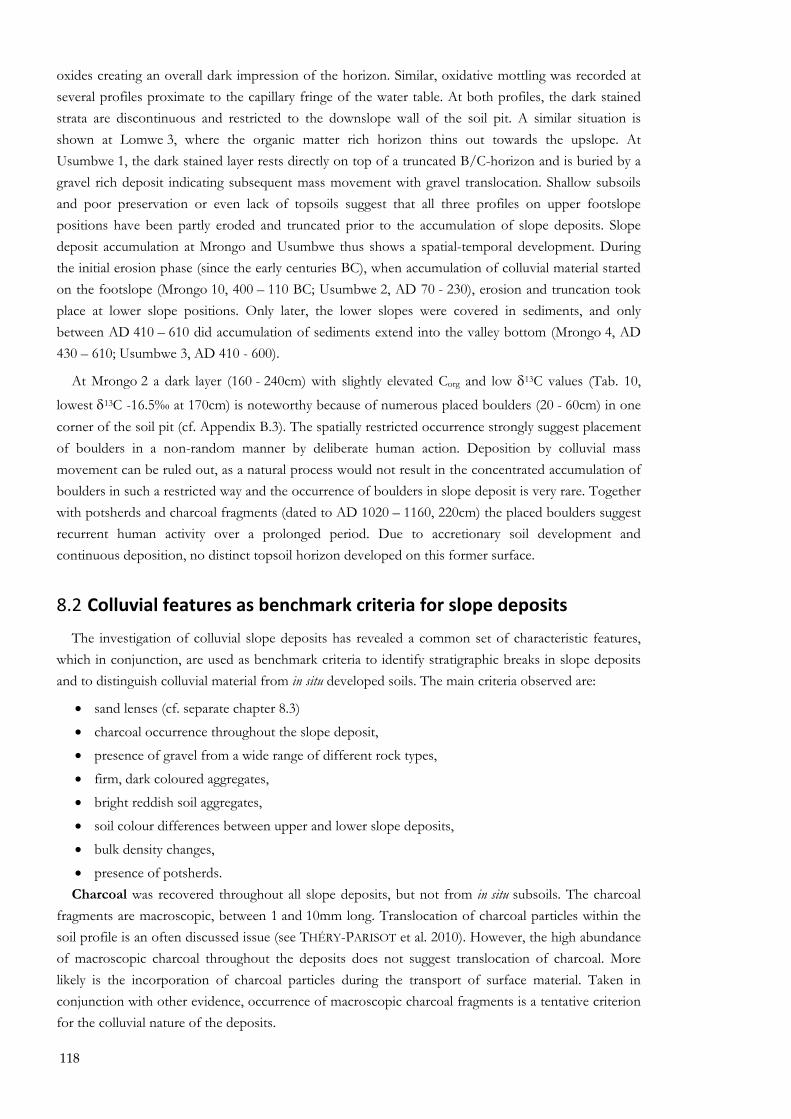
118
oxides creating an overall dark impression of the horizon. Similar, oxidative mottling was recorded at several profiles proximate to the capillary fringe of the water table. At both profiles, the dark stained strata are discontinuous and restricted to the downslope wall of the soil pit. A similar situation is shown at Lomwe 3, where the organic matter rich horizon thins out towards the upslope. At Usumbwe 1, the dark stained layer rests directly on top of a truncated B/C-horizon and is buried by a gravel rich deposit indicating subsequent mass movement with gravel translocation. Shallow subsoils and poor preservation or even lack of topsoils suggest that all three profiles on upper footslope positions have been partly eroded and truncated prior to the accumulation of slope deposits. Slope deposit accumulation at Mrongo and Usumbwe thus shows a spatial-temporal development. During the initial erosion phase (since the early centuries BC), when accumulation of colluvial material started on the footslope (Mrongo 10, 400 � 110 BC; Usumbwe 2, AD 70 - 230), erosion and truncation took place at lower slope positions. Only later, the lower slopes were covered in sediments, and only between AD 410 � 610 did accumulation of sediments extend into the valley bottom (Mrongo 4, AD 430 � 610; Usumbwe 3, AD 410 - 600).
At Mrongo 2 a dark layer (160 - 240cm) with slightly elevated Corg and low δ13C values (Tab. 10,
lowest δ13C -16.5� at 170cm) is noteworthy because of numerous placed boulders (20 - 60cm) in one corner of the soil pit (cf. Appendix B.3). The spatially restricted occurrence strongly suggest placement of boulders in a non-random manner by deliberate human action. Deposition by colluvial mass movement can be ruled out, as a natural process would not result in the concentrated accumulation of boulders in such a restricted way and the occurrence of boulders in slope deposit is very rare. Together with potsherds and charcoal fragments (dated to AD 1020 � 1160, 220cm) the placed boulders suggest recurrent human activity over a prolonged period. Due to accretionary soil development and continuous deposition, no distinct topsoil horizon developed on this former surface.
8.2 Colluvial features as benchmark criteria for slope deposits
The investigation of colluvial slope deposits has revealed a common set of characteristic features, which in conjunction, are used as benchmark criteria to identify stratigraphic breaks in slope deposits and to distinguish colluvial material from in situ developed soils. The main criteria observed are:
• sand lenses (cf. separate chapter 8.3) • charcoal occurrence throughout the slope deposit, • presence of gravel from a wide range of different rock types, • firm, dark coloured aggregates, • bright reddish soil aggregates, • soil colour differences between upper and lower slope deposits, • bulk density changes, • presence of potsherds.
Charcoal was recovered throughout all slope deposits, but not from in situ subsoils. The charcoal fragments are macroscopic, between 1 and 10mm long. Translocation of charcoal particles within the soil profile is an often discussed issue (see THÉRY-PARISOT et al. 2010). However, the high abundance of macroscopic charcoal throughout the deposits does not suggest translocation of charcoal. More likely is the incorporation of charcoal particles during the transport of surface material. Taken in conjunction with other evidence, occurrence of macroscopic charcoal fragments is a tentative criterion for the colluvial nature of the deposits.
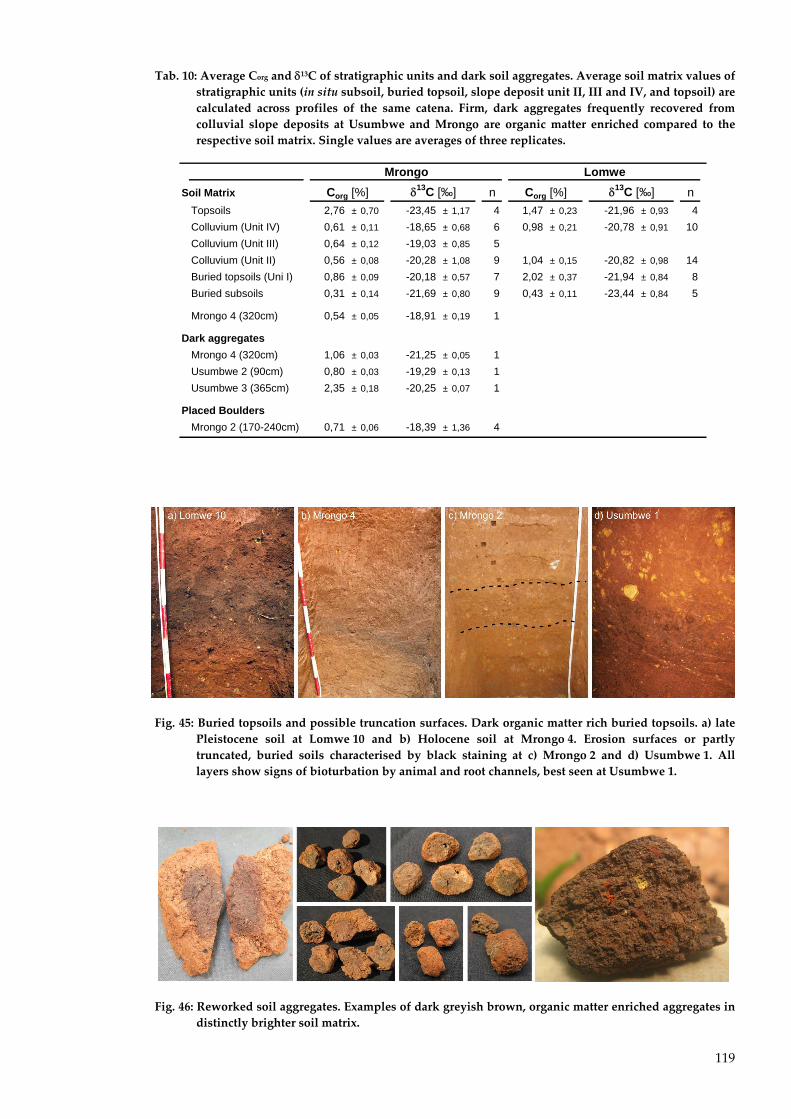
119
Tab. 10: Average Corg and δ13C of stratigraphic units and dark soil aggregates. Average soil matrix values of stratigraphic units (in situ subsoil, buried topsoil, slope deposit unit II, III and IV, and topsoil) are calculated across profiles of the same catena. Firm, dark aggregates frequently recovered from colluvial slope deposits at Usumbwe and Mrongo are organic matter enriched compared to the respective soil matrix. Single values are averages of three replicates.
Soil Matrix n nTopsoils 2,76 ± 0,70 -23,45 ± 1,17 4 1,47 ± 0,23 -21,96 ± 0,93 4Colluvium (Unit IV) 0,61 ± 0,11 -18,65 ± 0,68 6 0,98 ± 0,21 -20,78 ± 0,91 10Colluvium (Unit III) 0,64 ± 0,12 -19,03 ± 0,85 5Colluvium (Unit II) 0,56 ± 0,08 -20,28 ± 1,08 9 1,04 ± 0,15 -20,82 ± 0,98 14Buried topsoils (Uni I) 0,86 ± 0,09 -20,18 ± 0,57 7 2,02 ± 0,37 -21,94 ± 0,84 8Buried subsoils 0,31 ± 0,14 -21,69 ± 0,80 9 0,43 ± 0,11 -23,44 ± 0,84 5
Mrongo 4 (320cm) 0,54 ± 0,05 -18,91 ± 0,19 1
Dark aggregatesMrongo 4 (320cm) 1,06 ± 0,03 -21,25 ± 0,05 1Usumbwe 2 (90cm) 0,80 ± 0,03 -19,29 ± 0,13 1Usumbwe 3 (365cm) 2,35 ± 0,18 -20,25 ± 0,07 1
Placed BouldersMrongo 2 (170-240cm) 0,71 ± 0,06 -18,39 ± 1,36 4
Mrongo LomweCorg [%] δ13C [‰] Corg [%] δ13C [‰]
Fig. 45: Buried topsoils and possible truncation surfaces. Dark organic matter rich buried topsoils. a) late Pleistocene soil at Lomwe 10 and b) Holocene soil at Mrongo 4. Erosion surfaces or partly truncated, buried soils characterised by black staining at c) Mrongo 2 and d) Usumbwe 1. All layers show signs of bioturbation by animal and root channels, best seen at Usumbwe 1.
Fig. 46: Reworked soil aggregates. Examples of dark greyish brown, organic matter enriched aggregates in distinctly brighter soil matrix.
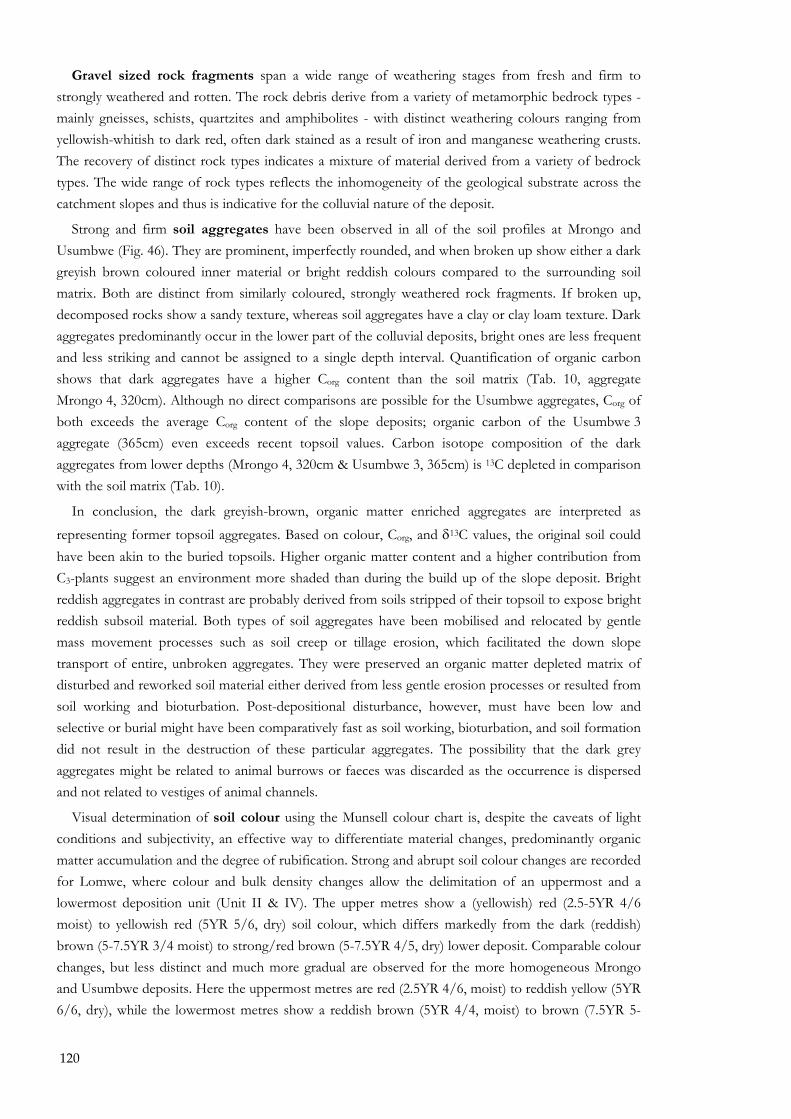
120
Gravel sized rock fragments span a wide range of weathering stages from fresh and firm to strongly weathered and rotten. The rock debris derive from a variety of metamorphic bedrock types - mainly gneisses, schists, quartzites and amphibolites - with distinct weathering colours ranging from yellowish-whitish to dark red, often dark stained as a result of iron and manganese weathering crusts. The recovery of distinct rock types indicates a mixture of material derived from a variety of bedrock types. The wide range of rock types reflects the inhomogeneity of the geological substrate across the catchment slopes and thus is indicative for the colluvial nature of the deposit.
Strong and firm soil aggregates have been observed in all of the soil profiles at Mrongo and Usumbwe (Fig. 46). They are prominent, imperfectly rounded, and when broken up show either a dark greyish brown coloured inner material or bright reddish colours compared to the surrounding soil matrix. Both are distinct from similarly coloured, strongly weathered rock fragments. If broken up, decomposed rocks show a sandy texture, whereas soil aggregates have a clay or clay loam texture. Dark aggregates predominantly occur in the lower part of the colluvial deposits, bright ones are less frequent and less striking and cannot be assigned to a single depth interval. Quantification of organic carbon shows that dark aggregates have a higher Corg content than the soil matrix (Tab. 10, aggregate Mrongo 4, 320cm). Although no direct comparisons are possible for the Usumbwe aggregates, Corg of both exceeds the average Corg content of the slope deposits; organic carbon of the Usumbwe 3 aggregate (365cm) even exceeds recent topsoil values. Carbon isotope composition of the dark aggregates from lower depths (Mrongo 4, 320cm & Usumbwe 3, 365cm) is 13C depleted in comparison with the soil matrix (Tab. 10).
In conclusion, the dark greyish-brown, organic matter enriched aggregates are interpreted as representing former topsoil aggregates. Based on colour, Corg, and δ13C values, the original soil could have been akin to the buried topsoils. Higher organic matter content and a higher contribution from C3-plants suggest an environment more shaded than during the build up of the slope deposit. Bright reddish aggregates in contrast are probably derived from soils stripped of their topsoil to expose bright reddish subsoil material. Both types of soil aggregates have been mobilised and relocated by gentle mass movement processes such as soil creep or tillage erosion, which facilitated the down slope transport of entire, unbroken aggregates. They were preserved an organic matter depleted matrix of disturbed and reworked soil material either derived from less gentle erosion processes or resulted from soil working and bioturbation. Post-depositional disturbance, however, must have been low and selective or burial might have been comparatively fast as soil working, bioturbation, and soil formation did not result in the destruction of these particular aggregates. The possibility that the dark grey aggregates might be related to animal burrows or faeces was discarded as the occurrence is dispersed and not related to vestiges of animal channels.
Visual determination of soil colour using the Munsell colour chart is, despite the caveats of light conditions and subjectivity, an effective way to differentiate material changes, predominantly organic matter accumulation and the degree of rubification. Strong and abrupt soil colour changes are recorded for Lomwe, where colour and bulk density changes allow the delimitation of an uppermost and a lowermost deposition unit (Unit II & IV). The upper metres show a (yellowish) red (2.5-5YR 4/6 moist) to yellowish red (5YR 5/6, dry) soil colour, which differs markedly from the dark (reddish) brown (5-7.5YR 3/4 moist) to strong/red brown (5-7.5YR 4/5, dry) lower deposit. Comparable colour changes, but less distinct and much more gradual are observed for the more homogeneous Mrongo and Usumbwe deposits. Here the uppermost metres are red (2.5YR 4/6, moist) to reddish yellow (5YR 6/6, dry), while the lowermost metres show a reddish brown (5YR 4/4, moist) to brown (7.5YR 5-
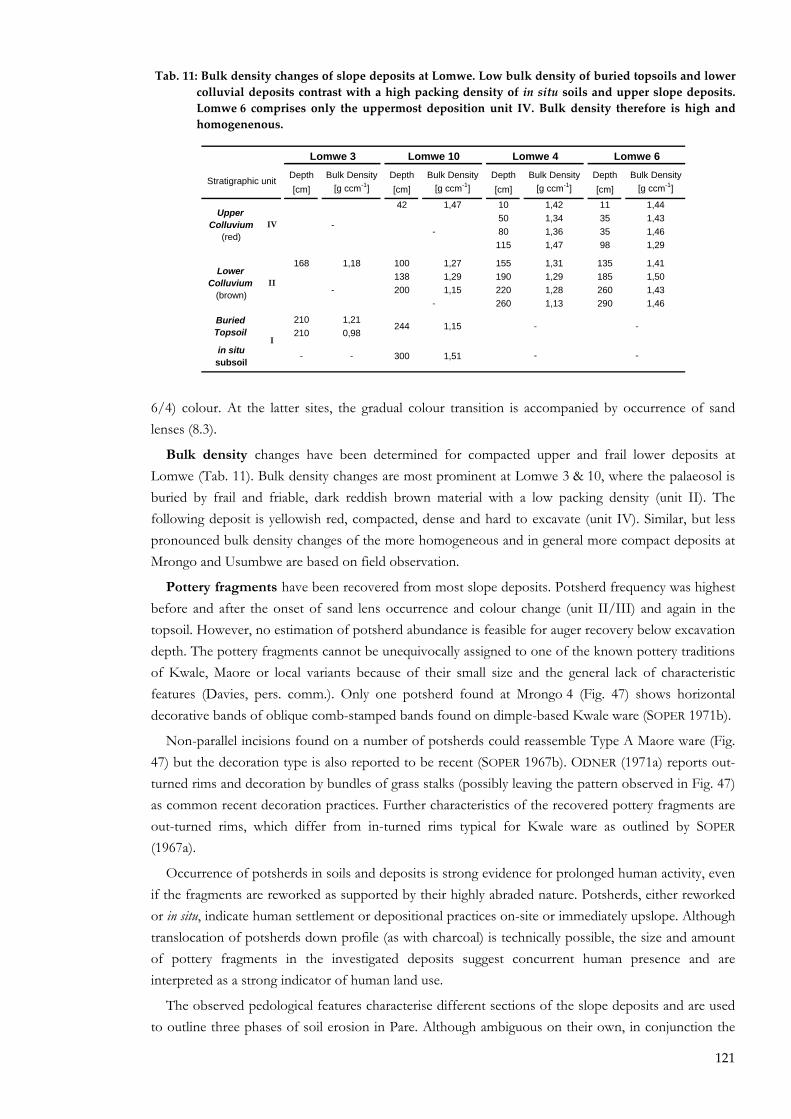
121
6/4) colour. At the latter sites, the gradual colour transition is accompanied by occurrence of sand lenses (8.3).
Bulk density changes have been determined for compacted upper and frail lower deposits at Lomwe (Tab. 11). Bulk density changes are most prominent at Lomwe 3 & 10, where the palaeosol is buried by frail and friable, dark reddish brown material with a low packing density (unit II). The following deposit is yellowish red, compacted, dense and hard to excavate (unit IV). Similar, but less pronounced bulk density changes of the more homogeneous and in general more compact deposits at Mrongo and Usumbwe are based on field observation.
Pottery fragments have been recovered from most slope deposits. Potsherd frequency was highest before and after the onset of sand lens occurrence and colour change (unit II/III) and again in the topsoil. However, no estimation of potsherd abundance is feasible for auger recovery below excavation depth. The pottery fragments cannot be unequivocally assigned to one of the known pottery traditions of Kwale, Maore or local variants because of their small size and the general lack of characteristic features (Davies, pers. comm.). Only one potsherd found at Mrongo 4 (Fig. 47) shows horizontal decorative bands of oblique comb-stamped bands found on dimple-based Kwale ware (SOPER 1971b).
Non-parallel incisions found on a number of potsherds could reassemble Type A Maore ware (Fig. 47) but the decoration type is also reported to be recent (SOPER 1967b). ODNER (1971a) reports out-turned rims and decoration by bundles of grass stalks (possibly leaving the pattern observed in Fig. 47) as common recent decoration practices. Further characteristics of the recovered pottery fragments are out-turned rims, which differ from in-turned rims typical for Kwale ware as outlined by SOPER (1967a).
Occurrence of potsherds in soils and deposits is strong evidence for prolonged human activity, even if the fragments are reworked as supported by their highly abraded nature. Potsherds, either reworked or in situ, indicate human settlement or depositional practices on-site or immediately upslope. Although translocation of potsherds down profile (as with charcoal) is technically possible, the size and amount of pottery fragments in the investigated deposits suggest concurrent human presence and are interpreted as a strong indicator of human land use.
The observed pedological features characterise different sections of the slope deposits and are used to outline three phases of soil erosion in Pare. Although ambiguous on their own, in conjunction the
Tab. 11: Bulk density changes of slope deposits at Lomwe. Low bulk density of buried topsoils and lower colluvial deposits contrast with a high packing density of in situ soils and upper slope deposits. Lomwe 6 comprises only the uppermost deposition unit IV. Bulk density therefore is high and homogenenous.
Depth Bulk Density Depth Bulk Density Depth Bulk Density Depth Bulk Density[cm] [g ccm-1] [cm] [g ccm-1] [cm] [g ccm-1] [cm] [g ccm-1]
42 1,47 10 1,42 11 1,4450 1,34 35 1,4380 1,36 35 1,46115 1,47 98 1,29
168 1,18 100 1,27 155 1,31 135 1,41138 1,29 190 1,29 185 1,50200 1,15 220 1,28 260 1,43
260 1,13 290 1,46
210 1,21210 0,98
in situ subsoil - - 300 1,51
--
--
Lomwe 10 Lomwe 4 Lomwe 6
Upper Colluvium
(red)
Lower Colluvium
(brown)
Buried Topsoil
Lomwe 3
IV
II
I
Stratigraphic unit
-
-
244 1,15 -
-
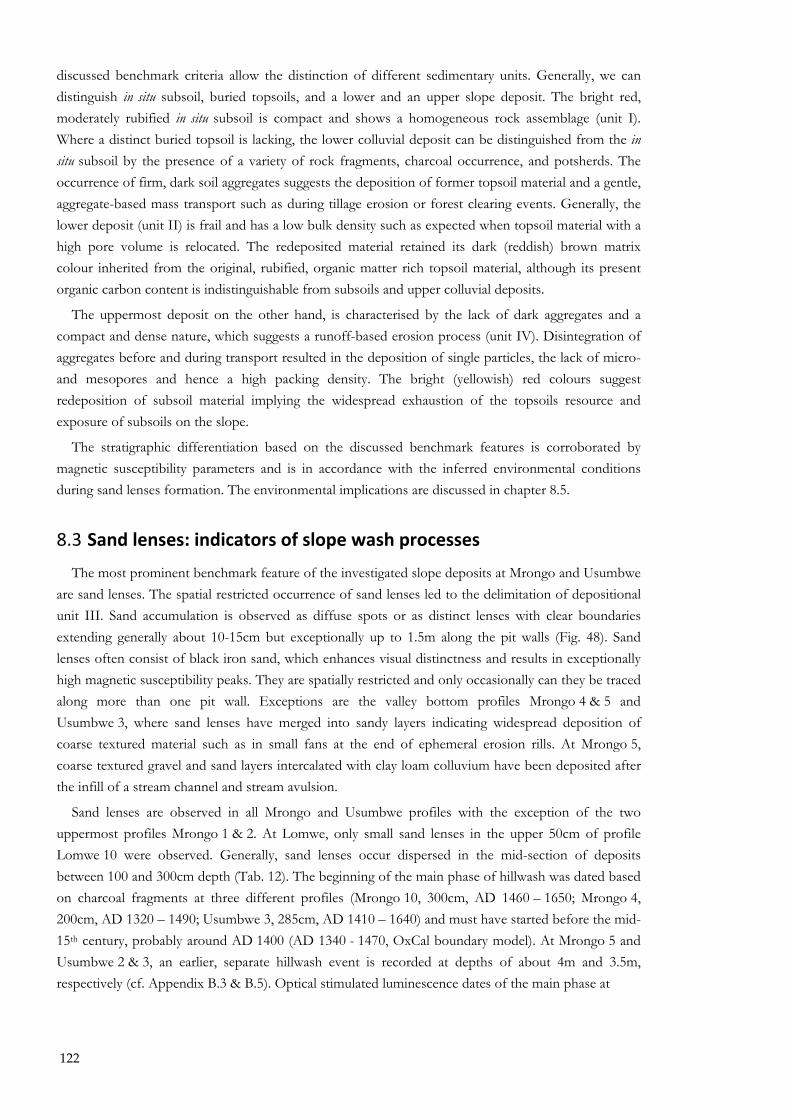
122
discussed benchmark criteria allow the distinction of different sedimentary units. Generally, we can distinguish in situ subsoil, buried topsoils, and a lower and an upper slope deposit. The bright red, moderately rubified in situ subsoil is compact and shows a homogeneous rock assemblage (unit I). Where a distinct buried topsoil is lacking, the lower colluvial deposit can be distinguished from the in situ subsoil by the presence of a variety of rock fragments, charcoal occurrence, and potsherds. The occurrence of firm, dark soil aggregates suggests the deposition of former topsoil material and a gentle, aggregate-based mass transport such as during tillage erosion or forest clearing events. Generally, the lower deposit (unit II) is frail and has a low bulk density such as expected when topsoil material with a high pore volume is relocated. The redeposited material retained its dark (reddish) brown matrix colour inherited from the original, rubified, organic matter rich topsoil material, although its present organic carbon content is indistinguishable from subsoils and upper colluvial deposits.
The uppermost deposit on the other hand, is characterised by the lack of dark aggregates and a compact and dense nature, which suggests a runoff-based erosion process (unit IV). Disintegration of aggregates before and during transport resulted in the deposition of single particles, the lack of micro- and mesopores and hence a high packing density. The bright (yellowish) red colours suggest redeposition of subsoil material implying the widespread exhaustion of the topsoils resource and exposure of subsoils on the slope.
The stratigraphic differentiation based on the discussed benchmark features is corroborated by magnetic susceptibility parameters and is in accordance with the inferred environmental conditions during sand lenses formation. The environmental implications are discussed in chapter 8.5.
8.3 Sand lenses: indicators of slope wash processes The most prominent benchmark feature of the investigated slope deposits at Mrongo and Usumbwe
are sand lenses. The spatial restricted occurrence of sand lenses led to the delimitation of depositional unit III. Sand accumulation is observed as diffuse spots or as distinct lenses with clear boundaries extending generally about 10-15cm but exceptionally up to 1.5m along the pit walls (Fig. 48). Sand lenses often consist of black iron sand, which enhances visual distinctness and results in exceptionally high magnetic susceptibility peaks. They are spatially restricted and only occasionally can they be traced along more than one pit wall. Exceptions are the valley bottom profiles Mrongo 4 & 5 and Usumbwe 3, where sand lenses have merged into sandy layers indicating widespread deposition of coarse textured material such as in small fans at the end of ephemeral erosion rills. At Mrongo 5, coarse textured gravel and sand layers intercalated with clay loam colluvium have been deposited after the infill of a stream channel and stream avulsion.
Sand lenses are observed in all Mrongo and Usumbwe profiles with the exception of the two uppermost profiles Mrongo 1 & 2. At Lomwe, only small sand lenses in the upper 50cm of profile Lomwe 10 were observed. Generally, sand lenses occur dispersed in the mid-section of deposits between 100 and 300cm depth (Tab. 12). The beginning of the main phase of hillwash was dated based on charcoal fragments at three different profiles (Mrongo 10, 300cm, AD 1460 � 1650; Mrongo 4, 200cm, AD 1320 � 1490; Usumbwe 3, 285cm, AD 1410 � 1640) and must have started before the mid-15th century, probably around AD 1400 (AD 1340 - 1470, OxCal boundary model). At Mrongo 5 and Usumbwe 2 & 3, an earlier, separate hillwash event is recorded at depths of about 4m and 3.5m, respectively (cf. Appendix B.3 & B.5). Optical stimulated luminescence dates of the main phase at
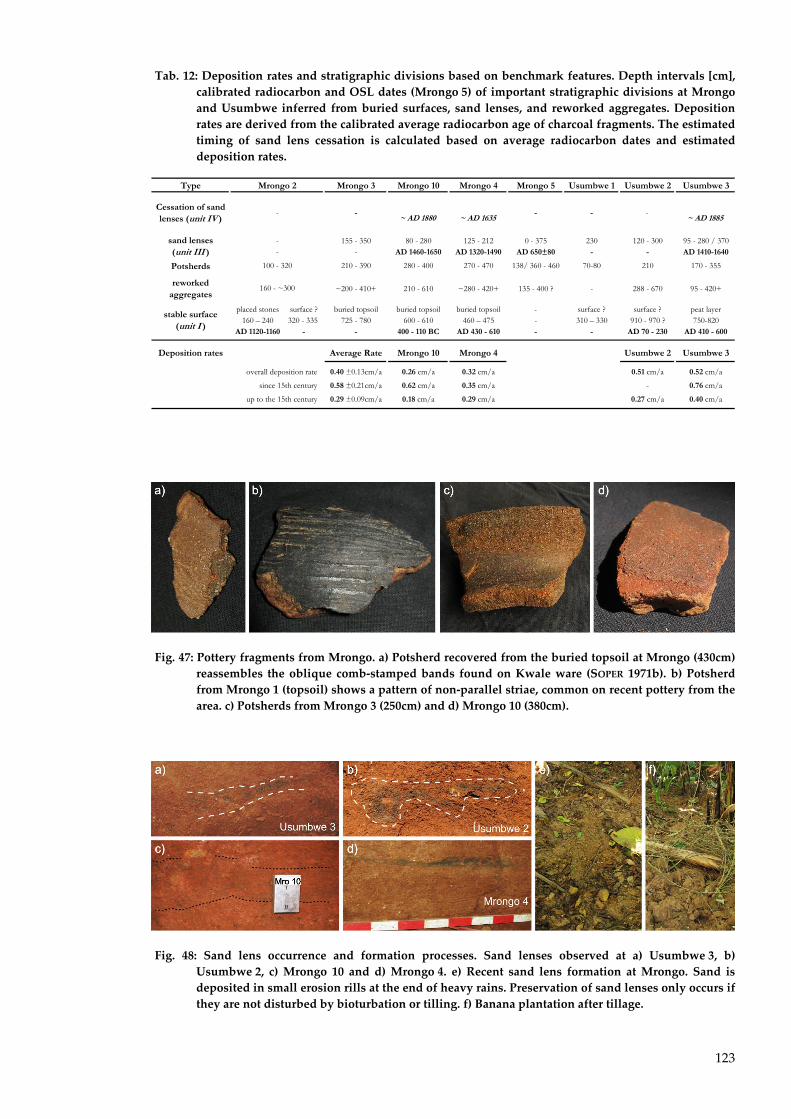
123
Tab. 12: Deposition rates and stratigraphic divisions based on benchmark features. Depth intervals [cm], calibrated radiocarbon and OSL dates (Mrongo 5) of important stratigraphic divisions at Mrongo and Usumbwe inferred from buried surfaces, sand lenses, and reworked aggregates. Deposition rates are derived from the calibrated average radiocarbon age of charcoal fragments. The estimated timing of sand lens cessation is calculated based on average radiocarbon dates and estimated deposition rates.
Type Mrongo 3 Mrongo 10 Mrongo 4 Mrongo 5 Usumbwe 1 Usumbwe 2 Usumbwe 3
Cessation of sand lenses (unit IV )
-
~ AD 1880
~ AD 1635- - -
~ AD 1885
155 - 350 80 - 280 125 - 212 0 - 375 230 120 - 300 95 - 280 / 370- AD 1460-1650 AD 1320-1490 AD 650±80 - - AD 1410-1640
Potsherds 210 - 390 280 - 400 270 - 470 138/ 360 - 460 70-80 210 170 - 355
reworked aggregates
~200 - 410+ 210 - 610 ~280 - 420+ 135 - 400 ? - 288 - 670 95 - 420+
placed stones surface ? buried topsoil buried topsoil buried topsoil - surface ? surface ? peat layer160 � 240 320 - 335 725 - 780 600 - 610 460 � 475 - 310 � 330 910 - 970 ? 750-820
AD 1120-1160 - - 400 - 110 BC AD 430 - 610 - - AD 70 - 230 AD 410 - 600
Deposition rates Average Rate Mrongo 10 Mrongo 4 Usumbwe 2 Usumbwe 3
overall deposition rate 0.40 ±0.13cm/a 0.26 cm/a 0.32 cm/a 0.51 cm/a 0.52 cm/a
since 15th century 0.58 ±0.21cm/a 0.62 cm/a 0.35 cm/a - 0.76 cm/a
up to the 15th century 0.29 ±0.09cm/a 0.18 cm/a 0.29 cm/a 0.27 cm/a 0.40 cm/a
stable surface (unit I )
Mrongo 2
-
100 - 320
160 - ~300
sand lenses (unit III )
--
Fig. 47: Pottery fragments from Mrongo. a) Potsherd recovered from the buried topsoil at Mrongo (430cm) reassembles the oblique comb‐stamped bands found on Kwale ware (SOPER 1971b). b) Potsherd from Mrongo 1 (topsoil) shows a pattern of non‐parallel striae, common on recent pottery from the area. c) Potsherds from Mrongo 3 (250cm) and d) Mrongo 10 (380cm).
Fig. 48: Sand lens occurrence and formation processes. Sand lenses observed at a) Usumbwe 3, b) Usumbwe 2, c) Mrongo 10 and d) Mrongo 4. e) Recent sand lens formation at Mrongo. Sand is deposited in small erosion rills at the end of heavy rains. Preservation of sand lenses only occurs if they are not disturbed by bioturbation or tilling. f) Banana plantation after tillage.
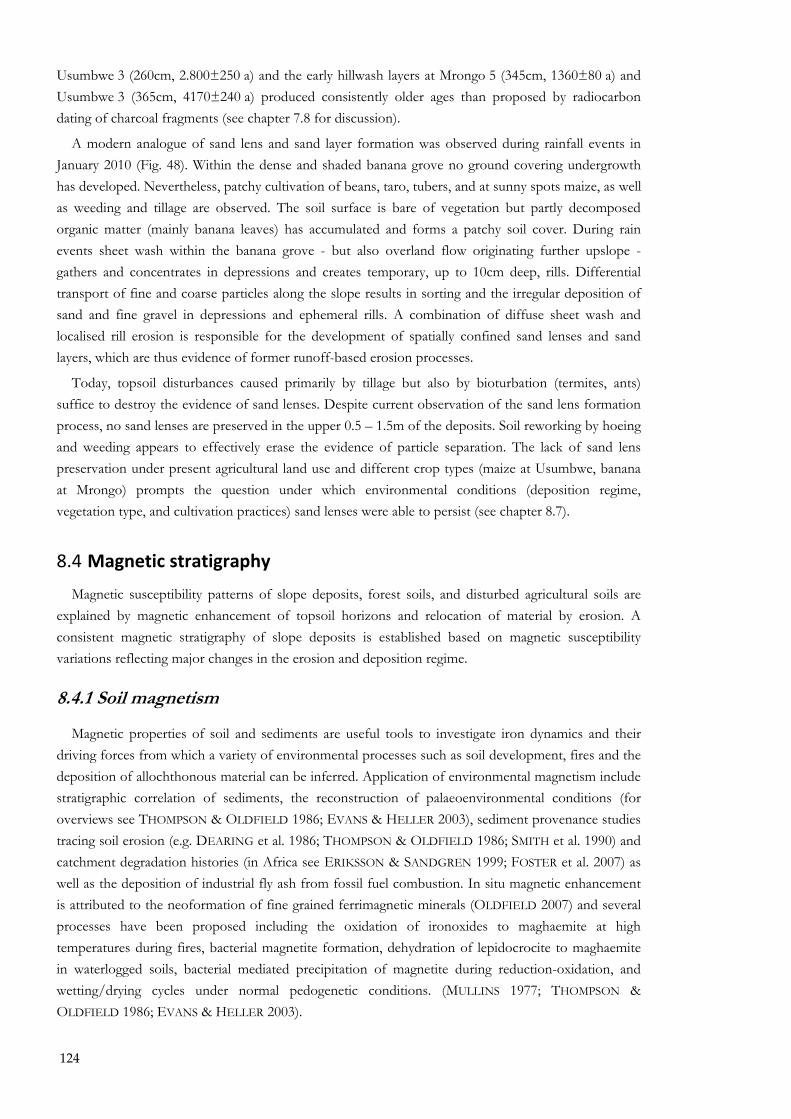
124
Usumbwe 3 (260cm, 2.800±250 a) and the early hillwash layers at Mrongo 5 (345cm, 1360±80 a) and Usumbwe 3 (365cm, 4170±240 a) produced consistently older ages than proposed by radiocarbon dating of charcoal fragments (see chapter 7.8 for discussion).
A modern analogue of sand lens and sand layer formation was observed during rainfall events in January 2010 (Fig. 48). Within the dense and shaded banana grove no ground covering undergrowth has developed. Nevertheless, patchy cultivation of beans, taro, tubers, and at sunny spots maize, as well as weeding and tillage are observed. The soil surface is bare of vegetation but partly decomposed organic matter (mainly banana leaves) has accumulated and forms a patchy soil cover. During rain events sheet wash within the banana grove - but also overland flow originating further upslope - gathers and concentrates in depressions and creates temporary, up to 10cm deep, rills. Differential transport of fine and coarse particles along the slope results in sorting and the irregular deposition of sand and fine gravel in depressions and ephemeral rills. A combination of diffuse sheet wash and localised rill erosion is responsible for the development of spatially confined sand lenses and sand layers, which are thus evidence of former runoff-based erosion processes.
Today, topsoil disturbances caused primarily by tillage but also by bioturbation (termites, ants) suffice to destroy the evidence of sand lenses. Despite current observation of the sand lens formation process, no sand lenses are preserved in the upper 0.5 � 1.5m of the deposits. Soil reworking by hoeing and weeding appears to effectively erase the evidence of particle separation. The lack of sand lens preservation under present agricultural land use and different crop types (maize at Usumbwe, banana at Mrongo) prompts the question under which environmental conditions (deposition regime, vegetation type, and cultivation practices) sand lenses were able to persist (see chapter 8.7).
8.4 Magnetic stratigraphy
Magnetic susceptibility patterns of slope deposits, forest soils, and disturbed agricultural soils are explained by magnetic enhancement of topsoil horizons and relocation of material by erosion. A consistent magnetic stratigraphy of slope deposits is established based on magnetic susceptibility variations reflecting major changes in the erosion and deposition regime.
8.4.1 Soil magnetism
Magnetic properties of soil and sediments are useful tools to investigate iron dynamics and their driving forces from which a variety of environmental processes such as soil development, fires and the deposition of allochthonous material can be inferred. Application of environmental magnetism include stratigraphic correlation of sediments, the reconstruction of palaeoenvironmental conditions (for overviews see THOMPSON & OLDFIELD 1986; EVANS & HELLER 2003), sediment provenance studies tracing soil erosion (e.g. DEARING et al. 1986; THOMPSON & OLDFIELD 1986; SMITH et al. 1990) and catchment degradation histories (in Africa see ERIKSSON & SANDGREN 1999; FOSTER et al. 2007) as well as the deposition of industrial fly ash from fossil fuel combustion. In situ magnetic enhancement is attributed to the neoformation of fine grained ferrimagnetic minerals (OLDFIELD 2007) and several processes have been proposed including the oxidation of ironoxides to maghaemite at high temperatures during fires, bacterial magnetite formation, dehydration of lepidocrocite to maghaemite in waterlogged soils, bacterial mediated precipitation of magnetite during reduction-oxidation, and wetting/drying cycles under normal pedogenetic conditions. (MULLINS 1977; THOMPSON & OLDFIELD 1986; EVANS & HELLER 2003).
125
Basic magnetic parameters are magnetic susceptibility (χlf) and frequency dependent magnetic
susceptibility (χfd%). Magnetic susceptibility is controlled by the type, amount, size, and shape of magnetic minerals and varies over several orders of magnitude allowing distinction between different mineral types and their amount (THOMPSON & OLDFIELD 1986; DEARING 1994). Frequency dependency, on the other hand, is a rough means to estimate mineral grain size distribution of the dominant magnetic minerals. Neoformation of secondary magnetic minerals during weathering, pedogenesis and fire results in the first instance in the production of small mineral grains, predominantly superparamagnetic or single domain minerals with a high magnetic susceptibility (DEARING 1994). In contrast, primary minerals consist of larger multidomain grains with a lower susceptibility. With higher frequencies of the applied magnetic field, superparamagnetic grains start to behave like single domain grains and overall susceptibility decreases. Frequency dependent susceptibility is a rough measure of the amount of small, superparamagnetic mineral grains generally associated with the neoformation of secondary minerals.
Based on two basic magnetic parameters, the present study identified primary and secondary ferrimagnetic minerals (magnetite and maghaemite) as the dominant iron species and interpretations are based on the amount of magnetic susceptibility (χlf) whereas distinction between primary (unweathered rocks) and secondary sources (pedogenesis, fires, allochthonous material) relies on the frequency dependency (χfd%).
8.4.2 Type and source of magnetic minerals
Soils and deposits of North Pare show high absolute values of magnetic susceptibility (2 - 11 x10-6 m³kg-1) indicative for the presence of ferrimagnetic minerals such as magnetite (Fe3O4), maghaemite (γ-Fe2O3) and titanomaghaemite characterised by high χlf between 200 - 1000 x10-6 m³kg-1 (DEARING 1994). Small amounts of these dominant iron oxides suffice to cause the high magnetic susceptibility. The red colour of the investigated soils (Hue 2.5 - 5YR) points to a high amount of secondary oxides - predominantly hematite (α-Fe2O3) and goethite (α-FeOOH). These are canted
antiferromagnetic iron oxides formed during pedogenesis and have χlf values about 2 - 3 orders less (0.3-2 x10⁻⁶ m3kg-1) than ferrimagnetic minerals (DEARING 1994). Despite their abundance, antiferromagnetic minerals contribute only marginally to the high bulk susceptibility measured in Pare.
The high absolute values of soil magnetic susceptibility measured in North Pare exceed the range commonly discussed for pedogenetic enhancement in temperate regions (generally <1 x10⁻⁶ m³kg-1). Higher χlf values up to 10 x10-6 m³kg-1 however, are reported from volcanic bedrock (MAHER 1986) and ultrabasic bedrock geology (DEARING 1994) but also from soils developed over phyllites and sandstone (HENDRICKX et al. 2005) in Ghana. Even higher χlf is generally associated with fly ash or restricted to burned topsoil horizons (MAHER 1986; DEARING 1994).
The generally high background susceptibility of the North Pare soils is probably the result of the (ultra-) mafic bedrock geology (BAUERNHOFER et al. 2008a). Ferrimagnetic, primary magnetite minerals are common in metamorphic basement rocks and particularly in the granulites and gneisses of the Pare Mountain range. Being an accessory element of the pyroxene and hornblende granulites and quartzites of North Pare (BAGNALL 1962), resistant magnetite grains are released by weathering and are ubiquitous in Pare soils. Mobilised, magnetite grains become differentially enriched in the bedload of streams. Beside locally restricted occurrence of gangue ore, these black magnetite iron bearing sands
126
have been the main ore supply for the famous Pare iron industry during the past two millennia (VON
DER DECKEN 1869; MEYER 1890; KIMAMBO 1969).
8.4.3 Pedogenetic enhancement and source variation
Magnetic topsoil enhancement is recorded for forests soils at Kwa Kirumbi. The increase of magnetic susceptibility between subsoil and topsoil indicates a higher concentration of ferrimagnetic minerals, whereas the rising frequency dependency suggests that formation of small grained, secondary, and hence pedogenetic iron minerals is responsible for the χlf increase (cf. Fig. 38). The magnetic trend observed at Kwa Kirumbi reflects the classical processes of topsoil enhancement by slow oxidation after bacterial mediated fermentation as proposed by several authors (LE BORGNE 1960; MULLINS 1977; DEARING et al. 1986). High absolute χlf of eroded agricultural soils but also of forest soils at Kwa Chegho imply strong magnetic enhancement by magnetite or maghemite formation. Frequent and repeated surface fire events and rapid, high temperature oxidation of ubiquitous ironoxides hematite and goethite to magnetite or maghemite are the most likely process to explain the high χlf measured. (THOMPSON & OLDFIELD 1986; EVANS & HELLER 2003)
Most of the investigated soils have experienced disturbance, often accompanied by deposition of reworked, eroded material from upslope. Eroded material is transported along the slope and becomes temporarily part of the topsoil. It is then magnetically enhanced by biologically mediated fermentation, fire, or by mixture and incorporation of enhanced topsoil material. The abrupt change of magnetic parameters is pronounced at erosion surfaces, where colluvial overburden rest directly on the truncated subsoil (e.g. Changuku 3, terrace). Less distinct colluvial deposits and disturbance events at Changuku 5 & 6 and Ngalanga 2 &5 and Kwa Chegho 1 & 2 might be responsible for the generally high χlf and χfd% values, without the development of distinct depth trends. The high χfd% observed for the strongly eroded soil at Makongweni remains problematic, as it suggests pedogenetic formation of secondary minerals, which contrasts with the initial weathering stage of the sampled C- horizon.
Magnetic enhancement is site-specific and the absolute values of magnetic susceptibility differ strongly between study sites. Susceptibility at Kwa Chegho and Lomwe varies between 2-8 x10⁻⁶ m³kg-1; at Kwa Kirumbi and Ngalanga χlf never exceeds 3 x10⁻⁶ m³kg-1. Similarly, absolute χlf
differences are observed between slope deposits at Usumbwe and Lomwe. The absolute χlf differences may be attributed to different bedrock geology controlling abundance, size and shape of ferrimagnetic minerals.
Set against a background of high concentrations of primary, ferrimagnetic minerals, distinction of pedogenetic enhanced magnetic properties becomes increasingly sophisticated (DEARING et al. 1986). In the study area, it is not possible to infer unequivocally topsoil development, subsoil extent, or soil - bedrock transition from absolute magnetic susceptibility parameters. Instead, relative susceptibility changes between in situ soils and the overlying colluvial deposits are used to delimit stratigraphically the extent and nature of slope deposits.
8.4.4 Magnetic stratigraphy of slope deposits
The colluvial slope deposits at Mrongo, Usumbwe, and Lomwe share a distinct magnetic susceptibility pattern, which is superimposed on the absolute susceptibility differences between the study areas. The interpretation of this pattern draws on the discussed observation that disturbed soils and reworked material is generally magnetically enhanced compared to in situ subsoil horizons.
127
At Mrongo and Usumbwe low magnetic susceptibility of in situ subsoils (unit I) contrasts with a rapid χlf increase in the buried topsoil and a plateau of high susceptibility in the lower colluvial deposit
(unit II). Only in the uppermost deposit, χlf decreases again to intermediate values. This pattern of magnetic susceptibility reflects the stratigraphic subdivisions established through field observations in previous chapters and sheds light into a complex deposition history (cf. generalised diagram Fig. 49).
Low magnetic susceptibility and frequency dependency values (χlf generally not exceeding 2 x10⁻⁶ m³kg-1) are observed for subsoil horizons, where susceptibility is controlled by primary minerals. The coupled increase of both magnetic parameters in buried topsoils and colluvial deposits points to pedogenetic enhancement as the dominant driving force. High χlf values are indicative of the presence of ferrimagnetic minerals (magnetite or maghemite), whereas intermediate to high frequency dependency suggests the neoformation of secondary, fine grained, superparamagnetic minerals. Thus, the magnetic enhancement of the buried topsoils is likely the result of soil development and pedogenetic and microbial mediated magnetic enhancement in the presence of soil organic matter (MULLINS 1977; THOMPSON & OLDFIELD 1986; EVANS & HELLER 2003). Similar, if not more important, is the frequent occurrence of fires, as evidenced by the abundance of charcoal fragments, which further promotes the formation of ferrimagnetic minerals throughout the deposits.
Soil erosion on the valley slopes resulted initially in the relocation of enhanced topsoil material. The eroded topsoil material was temporarily stored along the slope and remained a prolonged time within the biologically active surface layer, giving time for magnetic enhancement and formation of secondary iron minerals by pedogenetic processes, microbial activity, and recurrent surface fires. Mixing of eroded material from different sources (whether topsoils and subsoils material or material from distinct bedrock geology) may have caused fluctuations of the magnetic properties.
Magnetic susceptibility declines in the uppermost deposits and stabilises on an intermediate level, whereas χfd% remains high indicating that magnetic grain size classes and hence contribution of secondary, pedogenetic minerals is not affected by the decreasing concentration of ferrimagnetic minerals. Despite reduced χlf values, pedogenesis or fires are still the dominant factors controlling
susceptibility, although the absolute magnitude of enhancement is reduced. The observed χlf decrease is therefore interpreted to reflect the deposition of weakly magnetic subsoil material. This is in accordance to the observed shift to brighter (yellowish) red soil colours and a compact soil structure of the uppermost deposits (chapter 8.2). The magnetic parameters thus support and strengthen the field observation that after centuries of soil erosion on the slope, topsoils had been eroded away and the proportion of eroded subsoil material increased significantly.
The magnetic susceptibility pattern of the Lomwe profiles differs from the Mrongo/Usumbwe sites. Instead of a rapid shift, χlf and χfd% decrease in tandem from the buried topsoils towards the surface. The steady decrease of both parameters reflects a continuous reduction of the absolute amount of ferrimagnetic minerals at the same time as frequency dependency and hence the proportion of secondary minerals declines. The coupled decline of both parameters indicates that at Lomwe pedogenetic enhancement has declined continuously since erosion began and that erosion of topsoil and later subsoil material has been a steady and continuous process.
8.4.5 Sand lenses
Exceptionally high χlf peaks reflect the occurrence of dark iron rich sand lenses (Mrongo 3, 10, & 4) with a high concentrations of ferrimagnetic minerals - probably primary, ilmenitic magnetite (ILES
128
2011). The χlf peaks are matched by sharp drops of χfd% confirming dominance of primary minerals characterized by large multidomain grains and hence a low frequency dependency. Further changes in the concentrations of primary, ferrimagnetic minerals are reflected by paired excursions of high χlf and
depressed χfd% values observed at several sites (e.g. Usumbwe 1, Lomwe 3 & 10). Less pronounced, systematically opposing trends of both parameters are characteristic for the fluctuations observed within most profiles. These opposing trends reflect variations of primary mineral concentrations superimposed on the high magnetic susceptibility caused by secondary iron oxides.
8.4.6 Waterlogging
Seasonal or permanent waterlogged conditions below the groundwater table promote a reducing environment. Anaerobic conditions lead to the reduction of Fe3+ and the dissolution of iron(hydro)oxides. Soluble Fe2+ is not magnetic and might be leached resulting in a permanent depletion of iron minerals. As small particles are more susceptible to dissolution than larger grains, reductive conditions favour the dissolution of fine grained, superparamagnetic, secondary iron hydroxides, thus obliterating selectively the evidence of pedogenetic magnetic enhancement (THOMPSON & OLDFIELD 1986).
Decreasing magnetic susceptibility coincides with evidence of seasonal waterlogging at Mrongo 4 (mottles at 500cm, water table at 720cm, Nov. 2009). At Usumbwe 3, χlf and frequency dependency both decline below the watertable (450cm, Dec. 2009), although minimum values (~0.3 10-6 m³kg-1) are attributed to the buried organic layer. Contrastingly, the dry season water table at Usumbwe 2 (690cm, Dec. 2009) is not accompanied by any change in magnetic properties. At the fringe of the water table secondary formation of iron(hydr)oxides such as lepidocrocite or ferrihydrite is expected. These, however, are paramagnetic, have a low χlf, and remain undetected in the presence of ferrimagnetic minerals.
At mid-footslope positions (Mrongo 3 & Usumbwe 2) overall variability increases in the buried in situ soils possibly related to seasonal waterlogging. At upper footslope positions (Mrongo 2 & Usumbwe 1) increasing frequency dependency of dry profile bottoms to values of >10% might be related to the observation of active weathering along the B/C-transition, as indicated by oxidation crusts around weathered rock fragments. If this is the case, it remains unclear why this trend is not reflected in the overall magnetic susceptibility, which in contrast shows decreasing values.
8.4.7 Summary
he magnetic stratigraphy based on two basic susceptibility parameters supports the interpretation of magnetically enhanced topsoil eroded and deposited during an early erosion stage and subsequent deposition of less enhanced subsoil reflecting widespread soil erosion and land degradation on the catchment slopes (Fig. 49). However, both primary magnetite derived from the local parent material, and secondary iron oxides from pedogenetic enhancement, contribute to the observed susceptibility patterns. The high background χlf values of the magnetite rich Pare geology requires the measurement of further magnetic parameters (e.g. ARM, IRM) to discern unambiguously between the two sources. The identification of different colluvial deposits by susceptibility changes, however, remains unaffected by the exact process of magnetic differentiation.
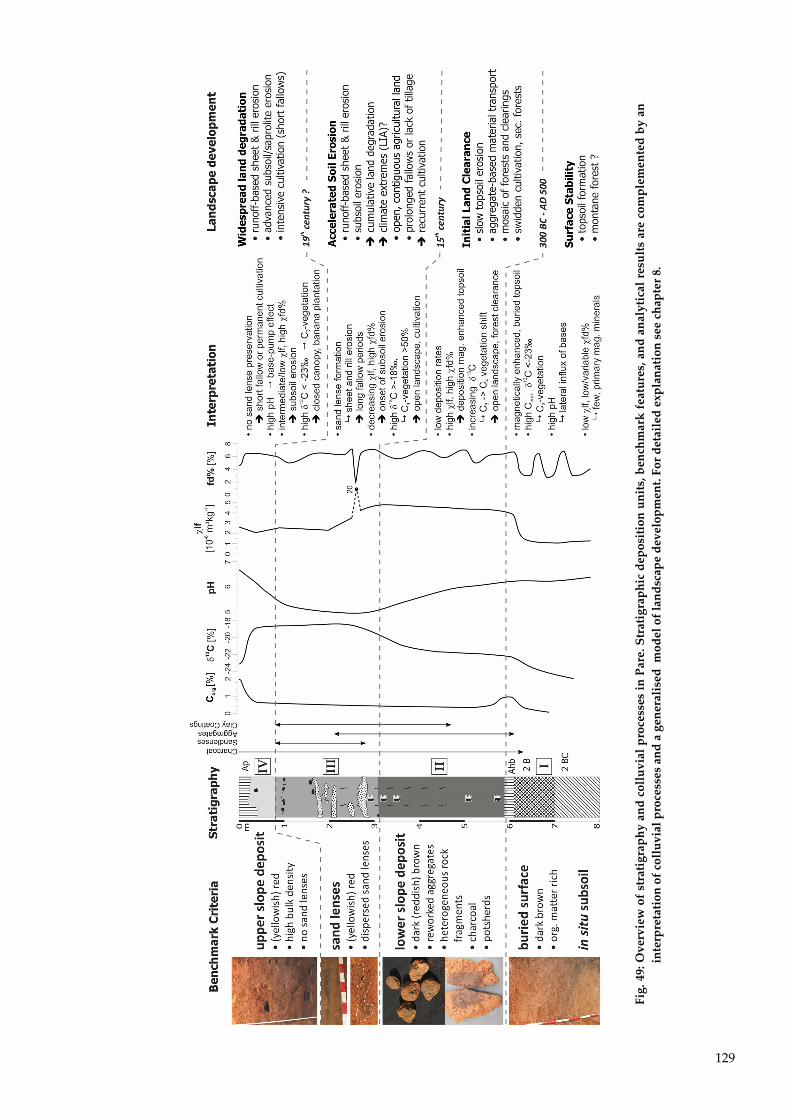
129
Fig. 49: Overview of stratigraphy and colluvial processes in Pare. Stratigraphic deposition units, benchmark features, and analytical results are complemented by an
interpretation of colluvial processes and a generalised model of landscape development. For detailed explanation see chapter 8.
130
8.5 Vegetation change: Evidence from stable carbon isotopes.
The history of vegetation change in upland Pare is based on three lines of evidence: comparison of multitemporal aerial photographs of the 20th century, organic carbon and stable carbon isotope composition of slope deposits, and palaeoecological pollen and phytolith analysis of the Lomwe Swamp core. This chapter focuses on changes in the stable carbon isotope composition of terrestrial archives, whereas the palaeoecological findings are discussed in chapter 9.5.
8.5.1 Stable carbon isotopes and vegetation change
The stable carbon isotope composition of plants differs according to their photosynthetic pathway (FARQUHAR et al. 1989; RUNDEL et al. 1989; SAGE & MONSON 1999). Commonly, C3, C4 and CAM plants with a distinct range of δ13C values are differentiated. Due to their efficient carbon fixation
mechanism, C4 plants (δ13C: -13 - -10) are more tolerant to water-stress and dominate in dry
environments particularly tropical grasslands, whereas C3 plants (δ13C: -32 - -23) are mainly trees and grasses of temperate or high-altitude locations (RUNDEL et al. 1989; SAGE & MONSON 1999). In palaeopedological studies, stable carbon isotope compositions have been widely used to infer vegetation change in East African environments (SCHWARTZ et al. 1986; AMBROSE & SIKES 1991; SCHWARTZ et al. 1996; ESHETU & HÖGBERG 2000; RUNGE 2001b; ESHETU 2002; DRIESE et al. 2004; GILLSON et al. 2004; ZECH 2006; TERWILLIGER et al. 2008; GEBRU et al. 2009).
δ13C variation of single species varies according to the isotope fractionation processes controlled by local humidity and temperature conditions as well as canopy effects (BOUTTON et al. 1998; CERLING 1999). Bulk δ13C of soil organic matter in C3-environments range from -35 to -28� in mesic, closed canopy environments and up to -23�, where dominated by xeric C3-plants (CERLING 1999). Higher δ13C values between -23� and -10� indicate varying contributions from C4 plants (Fig. 50).
In the present study, δ13C values of slope deposits vary in a narrow range between -18� and -25� and isotope composition changes result from both variations in the humidity and temperature conditions of the C3-environment and the admixture of C4 plants. Consequently, small δ13C variations are not to be interpreted as indicators of vegetation change and it is not possible to infer the exact type of vegetation from carbon isotope composition. It is however reasonable to assume that lower δ13C values indicate a generally more forested landscape, whereas a higher contribution of C4 biomass points to open vegetation or an agricultural landscape.
8.5.2 Forest soils
The Kwa Chegho and Kwa Kirumbi forests harbour mature, although disturbed, montane forests. Stable carbon isotope signatures of recent forest soils at both sites reflect the extant C3-forest vegetation (<-25�), whereas open secondary forest shows elevated δ13C (-20.1�, Kwa Chegho 3) reflecting a mixed vegetation of C4-grasses and C3-trees and shrubs. All investigated forest profiles show increasing δ13C values in the subsoil levelling out at about -23� (Fig. 33). Material translocations
and possibly anthropogenic disturbance are recorded as negative δ13C deviations of the buried soils at 80cm at Kwa Chegho 2 and between 28 � 45cm at Kwa Kirumbi 2 but do not alter the observation of a general δ13C increase in the subsoil.

131
-35
-30
-25
-20
-15
-10
δ13C
(org
anic
car
bon)
100 80 60 40 20 0C3 biomass (%)
closed canopy
xeric
fore
stde
posi
ts
Fig. 50: C3‐C4 mixing diagram. Relative biomass contribution of C3 and C4 plants inferred from δ13C values. C3 endmembers are ‐23� for xeric and ‐28� for mesic environments. C4 endmembers are ‐10� and ‐13� (modified after CERLING 1999). δ13C ranges of forest soils (left: topsoil, right: subsoil) and slope deposits (left to right: topsoil, colluvium, buried topsoil and in situ subsoil) at Mrongo are shown.
The tendency to higher δ13C values in the subsoil can be explained by either past vegetation change
or as the artefact of isotopic fractionation during decomposition. In the first case, the δ13C shift reflects a change of the predominant photosynthetic pathway: The contemporaneous C3-environment of a closed forest replaced a former open woodland or dry forest with contributions from C4-plants. An alternative explanation for elevated subsoil δ13C values is isotope fractionation during soil organic matter decomposition (BALESDENT & MARIOTTI 1996; WYNN 2007). With depth and hence age of the organic matter δ13C values are known to increase between 1.5� and possible up to 4 to 6� (BALESDENT et al. 1993; BALESDENT & MARIOTTI 1996; WYNN 2007). The observed isotopic shift over time has been attributed to three processes: Historical changes in atmospheric carbon isotope composition and carbon concentration since industrialisation, differential decay of biochemical fractions with differing δ13C values, and isotopic fractionation by decomposing organisms (MELILLO et al. 1989; BALESDENT & MARIOTTI 1996; BOUTTON 1996; WYNN 2007). The most important process regarding the increase of δ13C with depth is the isotopic enrichment of 13C by fractionation during microbial respiration or fermentation. During microbial decomposition, the lighter 12C is preferentially respirated, whereas 13C is incorporated into the biomass. The more the original soil carbon content has been reduced, the more important is the process of δ13C enrichment, which can be modelled by a
Rayleigh distillation function (WYNN 2007). In East Africa, a similar trend of increasing δ13C with depth was observed in subsoils of an Ultisol under ancient forest vegetation in the Kagamega forest, Kenya, considered to be a �living remnant� of Pleistocene forests (KRULL et al. 2002). A distinct 13C enrichment of about +4� to +6� was reported by KRULL et al. (2002) and WYNN (2007), whereas the average δ13C shift between topsoil and subsoil at Pare is only moderate (~ +2.5�).

132
Isotope fractionation during organic matter decomposition could explain the observed trend to higher δ13C values in modern steady state forest subsoils, without the need to speculate about former vegetation change. In the absence of further corroborating evidence of Holocene montane forest decline and subsequent recovery, the observed δ13C shift within the overlap of the C3 and C4-domains is interpreted as the result of isotopic fractionation.
8.5.3 Slope deposits
A common pattern is observed for colluvial slope deposits at Mrongo and Lomwe. Albeit not equally pronounced at every profile, two major vegetation shifts during the built-up of the slope deposits can be identified. Low δ13C values of the buried soils (<-22�) followed by an increase throughout the colluvial deposits indicate a growing contribution from C4-vegetation. In the topsoil, an abrupt return to low δ13C values reflects the contemporary dominance of C3-vegetation.
Buried, in situ soils show low to intermediate δ13C values in the same range as the aforementioned forest subsoils (Fig. 35). Considering carbon isotope fractionation by decomposition, the intermediate subsoil δ13C values might be derived from an initially even lower carbon isotope ratio thus indicating a possible far higher contribution of C3-plants than the present isotope composition suggests. Isotope fractionation might explain the high δ13C of subsoil horizons of both forest and buried soils, and does not question the assumption of prehistoric montane forest cover in upland Pare.
Similarly to the differences in organic carbon content (chapter 8.1), δ13C values of in situ subsoils at Lomwe (-22.5 - -24.8�) show a higher contribution of C3-plants than at Mrongo (-21.5� to -22.6�) suggesting a more humid forest environment at the end of the LGM than during the late Holocene.
The stable carbon isotope composition of buried topsoils differs from the isotope signature of contemporaneous dry forests and savannah woodland (~-19�, Tab. 13) and hence rules out the former expansion of woodland environments into mid-altitude Pare. On the other hand, δ13C values of buried topsoils show a higher contribution of C4-plants than expected from current montane forest environments. Isotopic fractionation is offered to explain this discrepancy, although not all evidence support the 13C enrichment with time and depth. The buried soils of the slope deposits do not show the depth pattern expected from the isotope fractionation model and discussed above for forest soils. Instead, δ13C of buried topsoils general exceeds δ13C of buried subsoils (Fig. 35). Of course, the higher 13C/12C-ratios of buried topsoils could be the consequence of admixture of C4-plant material by disturbance or perhaps partial truncation during the burial process or be related to bioturbation during the accretion of the slope deposit.
Both explanatory approaches have considerable caveats. While the possibility of isotopic fractionation does not categorically rule out a former drier environment, the isotopic evidence for a prolonged mid to late Holocene dry period (before or around 2000 BP) is not convincing (see chapter 10.4). Given the possibility of an alternative explanation by isotope fractionation, the postulation of drastic reduction of forest cover about 2,000 years ago and subsequent reestablishment of a humid montane forest in Pare is not justified. For now, it is reasonable to adhere to the conservative assumption of a closed montane forest environment having prevailed throughout the Holocene.
Stable carbon isotope composition of the colluvial slope deposits show increasing δ13C from bottom to top reflecting a slow change from a C3 dominated vegetation to a mixed C3/C4 environment. δ13C values of the uppermost metres are high (> -20�) at all sites and suggest a
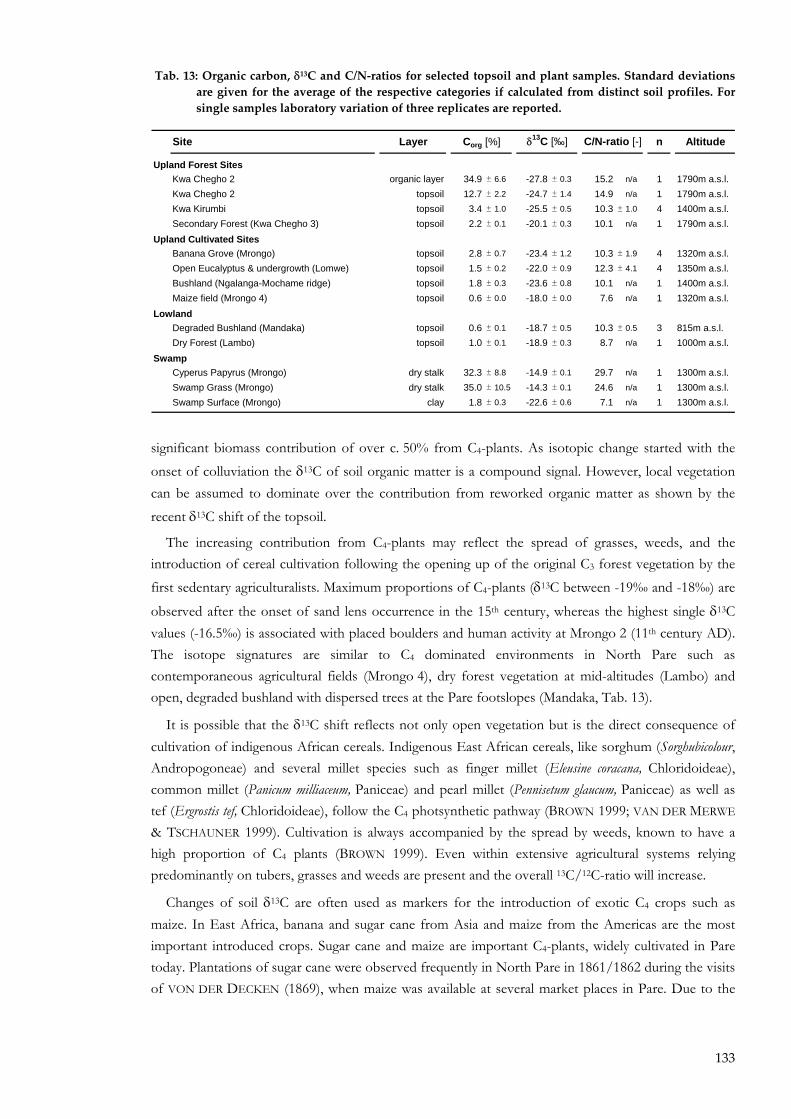
133
significant biomass contribution of over c. 50% from C4-plants. As isotopic change started with the onset of colluviation the δ13C of soil organic matter is a compound signal. However, local vegetation can be assumed to dominate over the contribution from reworked organic matter as shown by the recent δ13C shift of the topsoil.
The increasing contribution from C4-plants may reflect the spread of grasses, weeds, and the introduction of cereal cultivation following the opening up of the original C3 forest vegetation by the first sedentary agriculturalists. Maximum proportions of C4-plants (δ13C between -19� and -18�) are
observed after the onset of sand lens occurrence in the 15th century, whereas the highest single δ13C values (-16.5�) is associated with placed boulders and human activity at Mrongo 2 (11th century AD). The isotope signatures are similar to C4 dominated environments in North Pare such as contemporaneous agricultural fields (Mrongo 4), dry forest vegetation at mid-altitudes (Lambo) and open, degraded bushland with dispersed trees at the Pare footslopes (Mandaka, Tab. 13).
It is possible that the δ13C shift reflects not only open vegetation but is the direct consequence of cultivation of indigenous African cereals. Indigenous East African cereals, like sorghum (Sorghubicolour, Andropogoneae) and several millet species such as finger millet (Eleusine coracana, Chloridoideae), common millet (Panicum milliaceum, Paniceae) and pearl millet (Pennisetum glaucum, Paniceae) as well as tef (Ergrostis tef, Chloridoideae), follow the C4 photsynthetic pathway (BROWN 1999; VAN DER MERWE & TSCHAUNER 1999). Cultivation is always accompanied by the spread by weeds, known to have a high proportion of C4 plants (BROWN 1999). Even within extensive agricultural systems relying predominantly on tubers, grasses and weeds are present and the overall 13C/12C-ratio will increase.
Changes of soil δ13C are often used as markers for the introduction of exotic C4 crops such as maize. In East Africa, banana and sugar cane from Asia and maize from the Americas are the most important introduced crops. Sugar cane and maize are important C4-plants, widely cultivated in Pare today. Plantations of sugar cane were observed frequently in North Pare in 1861/1862 during the visits of VON DER DECKEN (1869), when maize was available at several market places in Pare. Due to the
Tab. 13: Organic carbon, δ13C and C/N‐ratios for selected topsoil and plant samples. Standard deviations are given for the average of the respective categories if calculated from distinct soil profiles. For single samples laboratory variation of three replicates are reported.
Site Layer n Altitude
Upland Forest SitesKwa Chegho 2 organic layer 34.9 ± 6.6 -27.8 ± 0.3 15.2 n/a 1 1790m a.s.l.Kwa Chegho 2 topsoil 12.7 ± 2.2 -24.7 ± 1.4 14.9 n/a 1 1790m a.s.l.Kwa Kirumbi topsoil 3.4 ± 1.0 -25.5 ± 0.5 10.3 ± 1.0 4 1400m a.s.l.Secondary Forest (Kwa Chegho 3) topsoil 2.2 ± 0.1 -20.1 ± 0.3 10.1 n/a 1 1790m a.s.l.
Upland Cultivated SitesBanana Grove (Mrongo) topsoil 2.8 ± 0.7 -23.4 ± 1.2 10.3 ± 1.9 4 1320m a.s.l.Open Eucalyptus & undergrowth (Lomwe) topsoil 1.5 ± 0.2 -22.0 ± 0.9 12.3 ± 4.1 4 1350m a.s.l.Bushland (Ngalanga-Mochame ridge) topsoil 1.8 ± 0.3 -23.6 ± 0.8 10.1 n/a 1 1400m a.s.l.Maize field (Mrongo 4) topsoil 0.6 ± 0.0 -18.0 ± 0.0 7.6 n/a 1 1320m a.s.l.
Lowland Degraded Bushland (Mandaka) topsoil 0.6 ± 0.1 -18.7 ± 0.5 10.3 ± 0.5 3 815m a.s.l.Dry Forest (Lambo) topsoil 1.0 ± 0.1 -18.9 ± 0.3 8.7 n/a 1 1000m a.s.l.
SwampCyperus Papyrus (Mrongo) dry stalk 32.3 ± 8.8 -14.9 ± 0.1 29.7 n/a 1 1300m a.s.l.Swamp Grass (Mrongo) dry stalk 35.0 ± 10.5 -14.3 ± 0.1 24.6 n/a 1 1300m a.s.l.Swamp Surface (Mrongo) clay 1.8 ± 0.3 -22.6 ± 0.6 7.1 n/a 1 1300m a.s.l.
Corg [%] δ13C [‰] C/N-ratio [-]
134
widespread presence indigenous C4 grasses and cereals, their introduction did not have a strong impact on the δ13C signature of the soil.
Banana and plantains are C3 plants. Cultivated in plantations or agroforestry systems, a closed canopy and the subduction of C4-plants allows their distinction from annual cereal cropping systems by low δ13C values of the soil organic matter. The δ13C record from the investigated sites does not
show any evidence for past banana plantations. On the contrary, a rapid shift to more negative δ13C values in the topsoils indicates the very recent establishment of the Mrongo banana grove.
Topsoil δ13C values at Mrongo and Lomwe are low and increase rapidly within the uppermost 30cm. The isotopic shift to C3 dominated vegetation occurs within the upper 10 � 30cm and is interpreted as a recent change in vegetation cover and land use. Most accentuated at Mrongo, low topsoil δ13C (-22.8, -23.7� and -25.0�, respectively) reflects the present C3 vegetation of a banana grove dominated by bananas, shade trees, and shade tolerant undergrowth. This recent vegetation change is however spatially restricted to the banana plantation. Beyond this, at Mrongo 4, no isotopic change is observed and topsoil δ13C (-18�) reflects the present cultivation of C4 plants like maize and sugar cane. Aerial photographs taken in the years 1954, 1957, and 1983 show that the banana plantation had been established in its present boundaries before 1954. Involving only the uppermost 30cm, the δ13C shift suggests that the banana grove has not been a persistent landscape feature and
probably does not predate the mid-19th century. At Lomwe, high topsoil δ13C values are similarly related to recent land use changes. Here, Eucalyptus afforestation during the 20th century resulted in the decrease of the topsoil δ13C.
8.5.4 Summary
Stable carbon isotope composition of buried soils does not allow the unambiguous assignment of a vegetation type. Although a forest environment is likely to have prevailed when the first settlers arrived in Pare, no distinction between humid montane or drier submontane forests can be made. It is reasonable to assume that initial land clearing was responsible for both the onset of colluviation and the concurrent spread of C4-vegetation. Cultivation of C4 sorghum and millet varieties probably has contributed to higher 13C/12C-ratios, but the opening of the landscape alone and the spread of grasses and weeds with a high proportion of C4 plants would have been sufficient to cause the slow shift of the stable carbon isotope composition. Highest δ13C values are recorded for the period following the onset of sand lenses occurrence in the 14th/15th century suggesting the end of the initial land clearing phase and an increased intensity of agricultural land use.
8.6 From hillwash processes to a history of land use and erosion
Several processes might be responsible for the onset of runoff-generated erosion in the 14th/15th century as deduced from the onset of sand lense occurrence: the cumulative effects of progressive forest clearance and land degradation; a change of the agricultural land use practices; social, cultural and population transformations; - or climate dynamics, particularly precipitation changes. In the following, environmental conditions associated with sand lens formation and preservation are discussed emphasizing particularly the impact of land use practices and progressive forest clearance. The possible impacts of regional factors such as climate dynamics or cultural transformations on runoff-based erosion are reviewed in chapter 10.4.5.
135
8.6.1 Drivers of enhanced slope wash and sand lens formation
The formation of wash layers and sand lenses occurs today during moderate to strong rainfall events in a seasonal climate. Higher rainfall per se does not necessarily lead to higher rainfall erosivity. Rather than the amount, it is the intensity and distribution of rainfall events and particularly a seasonal rainfall regime with strong, single rainfall events will increase precipitation erosivity and promote runoff production and sand lens formation. During the late Holocene, Pare has been under the influence of a seasonal climate; however, the intensity might have changed over time. The reconstruction of past precipitation distribution is a difficult task and past climate variability on a yearly basis has been subject to many speculations. Particular during the Little Ice Age, roughly contemporaneous with the period of sand lens occurrence, climatic variability in East Africa increased and several drought periods interrupted a generally intermediate humid climate. Fluctuating climatic conditions and pronounced seasonal precipitation during drought periods might have contributed and triggered short-lived surface runoff events, sheet wash and rill erosion (see chapter 10.4.5).
At the same time, however, the internal development of the Pare environment had reached a threshold. When sand lens formation started in the 15th century, the slopes of Pare had experienced about 1500 years of soil erosion. The cumulative effects of several hundred years of slow but progressive soil erosion on the slopes had resulted in the loss of topsoils and the exhumation of subsoils as indicated by decreasing magnetic susceptibility and changing colour of slope deposits. In the 14th/15th century, soils on the slopes had been truncated and for the first time the effects of prolonged erosion and land degradation came to the fore.
Whereas the eroded topsoils had been well structured, frail, pore rich, stabilised by high amounts of organic matter as well as loosened by a biological activity, the now exposed subsoils have a low pore volume and only initial soil structure. Not only was soil fertility of the exposed subsoils lower, but also infiltration capacity was considerable reduced thus increasing runoff production.
On the slope scale, progressive forest clearance has resulted in the expansion of the cultivated area. Larger, contiguous fields and probably shorter fallow periods (as discussed below) provided increasingly larger areas for runoff production. Expansion of agricultural fields and cleared, disturbed land resulted in longer overall slope length; less possibility of intermediate water and sediment storage such as within patches of dense forest vegetation; and in consequence a rising amount of surface runoff. Increasing areas of runoff production combined with a reduced infiltration capacity must have resulted in a general higher overland flow and triggered sheet wash, runoff concentration and finally rill erosion. As a trigger for sand lens formation, we identify a combination of progressive soil erosion since the beginning of farming about 2000 years ago and a seasonal precipitation pattern providing strong rainfall events.
8.6.2 Land use practices and the preservation of sand lenses
Agricultural land use interferes directly with ecosystem processes and controls soil erodibility, infiltration capacity and hence runoff-production and erosion processes.
Preservation of sand lenses (unit III) in agricultural environments requires special circumstances and land use practices. On the field scale, tillage practices, crop types and planting techniques like monocultures or mixed agroforestry systems as well as the location of field boundaries, paths and homesteads play an important role in controlling runoff-generation and deposition and hence the
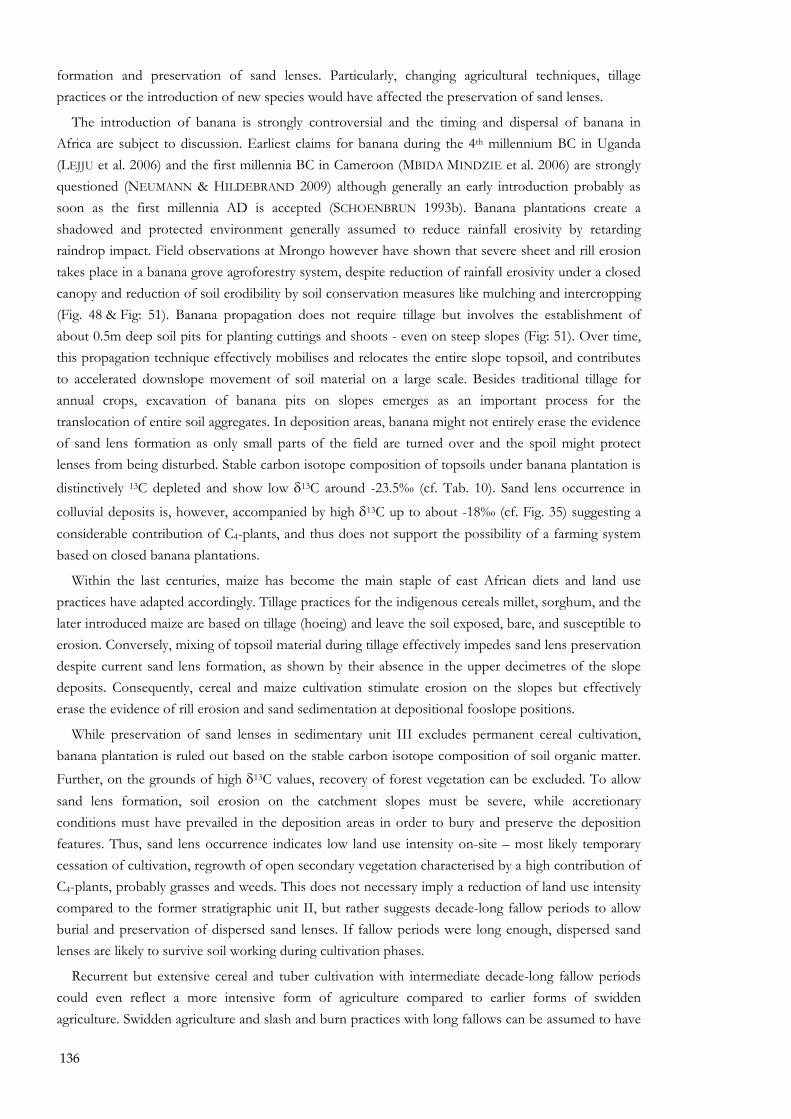
136
formation and preservation of sand lenses. Particularly, changing agricultural techniques, tillage practices or the introduction of new species would have affected the preservation of sand lenses.
The introduction of banana is strongly controversial and the timing and dispersal of banana in Africa are subject to discussion. Earliest claims for banana during the 4th millennium BC in Uganda (LEJJU et al. 2006) and the first millennia BC in Cameroon (MBIDA MINDZIE et al. 2006) are strongly questioned (NEUMANN & HILDEBRAND 2009) although generally an early introduction probably as soon as the first millennia AD is accepted (SCHOENBRUN 1993b). Banana plantations create a shadowed and protected environment generally assumed to reduce rainfall erosivity by retarding raindrop impact. Field observations at Mrongo however have shown that severe sheet and rill erosion takes place in a banana grove agroforestry system, despite reduction of rainfall erosivity under a closed canopy and reduction of soil erodibility by soil conservation measures like mulching and intercropping (Fig. 48 & Fig: 51). Banana propagation does not require tillage but involves the establishment of about 0.5m deep soil pits for planting cuttings and shoots - even on steep slopes (Fig: 51). Over time, this propagation technique effectively mobilises and relocates the entire slope topsoil, and contributes to accelerated downslope movement of soil material on a large scale. Besides traditional tillage for annual crops, excavation of banana pits on slopes emerges as an important process for the translocation of entire soil aggregates. In deposition areas, banana might not entirely erase the evidence of sand lens formation as only small parts of the field are turned over and the spoil might protect lenses from being disturbed. Stable carbon isotope composition of topsoils under banana plantation is distinctively 13C depleted and show low δ13C around -23.5� (cf. Tab. 10). Sand lens occurrence in
colluvial deposits is, however, accompanied by high δ13C up to about -18� (cf. Fig. 35) suggesting a considerable contribution of C4-plants, and thus does not support the possibility of a farming system based on closed banana plantations.
Within the last centuries, maize has become the main staple of east African diets and land use practices have adapted accordingly. Tillage practices for the indigenous cereals millet, sorghum, and the later introduced maize are based on tillage (hoeing) and leave the soil exposed, bare, and susceptible to erosion. Conversely, mixing of topsoil material during tillage effectively impedes sand lens preservation despite current sand lens formation, as shown by their absence in the upper decimetres of the slope deposits. Consequently, cereal and maize cultivation stimulate erosion on the slopes but effectively erase the evidence of rill erosion and sand sedimentation at depositional fooslope positions.
While preservation of sand lenses in sedimentary unit III excludes permanent cereal cultivation, banana plantation is ruled out based on the stable carbon isotope composition of soil organic matter. Further, on the grounds of high δ13C values, recovery of forest vegetation can be excluded. To allow sand lens formation, soil erosion on the catchment slopes must be severe, while accretionary conditions must have prevailed in the deposition areas in order to bury and preserve the deposition features. Thus, sand lens occurrence indicates low land use intensity on-site � most likely temporary cessation of cultivation, regrowth of open secondary vegetation characterised by a high contribution of C4-plants, probably grasses and weeds. This does not necessary imply a reduction of land use intensity compared to the former stratigraphic unit II, but rather suggests decade-long fallow periods to allow burial and preservation of dispersed sand lenses. If fallow periods were long enough, dispersed sand lenses are likely to survive soil working during cultivation phases.
Recurrent but extensive cereal and tuber cultivation with intermediate decade-long fallow periods could even reflect a more intensive form of agriculture compared to earlier forms of swidden agriculture. Swidden agriculture and slash and burn practices with long fallows can be assumed to have
137
prevailed during the early centuries of agriculture, when occasional forest clearance in a sparsely populated landscape was followed by �fallows� long enough for forest to re-establish. The slow change of the stable carbon isotope composition in the lower most colluvium supports the notion that the retreat of forest was a slow process until the 15th century when low δ13C values indicate that secondary vegetation grown during fallows did not develop into mature forests anymore. Thus, in the 15th century, a shifting cultivation regime with rotating fallows long enough to allow preservation of deposition features but short enough to prevent the establishment of a closed secondary forest is proposed.
Definitions of farming practices and terminologies differ widely and the terms shifting cultivation, swidden cultivation, and slash-and-burn are often used synonymously to describe �any continuing agricultural system in which impermanent clearings are cropped for shorter periods in years than they are fallowed� (CONKLIN 1961; see also GREENLAND ; RAINTREE & WARNER 1986). Whereas swidden cultivation and slash-and-burn generally are used to refer to land reclamation, shifting cultivation implies a broader meaning. However, terminologies do not allow differentiation between initial forest clearance or recurrent cultivation, sedentary or temporary settlement or the intensity of the land use (cf. chitemene systems). In particularly the length of fallow requires differentiation in, for example, long (forest), intermediate (bush) and short (grass) fallow (BOSERUP 1965). More intensive, often permanent, farming practices such as ley farming (animal husbandry and manure input during fallow periods) and crop rotation complicate the picture. To differentiate between the lengths of the fallow period and hence cultivation intensity, the present study applies the broader term shifting cultivation to describe recurrent farming of the same field with fallow periods of different length. Less intensive cultivation practices are referred to here as swidden agriculture and characterised by land reclamation by slash-and-burn; the abandonment of fields after cultivation for very long �fallows�, thereby allowing forest to re-establish; and perhaps also the shifting of settlements.
Cessation of sand lens preservation (unit IV) was not directly dated as calibration of single, subrecent radiocarbon dates since AD 1700 produces broad and ambiguous age ranges. Rough age estimation is obtained assuming constant deposition since the dated onset of sand lens formation. Cessation of sand lenses falls between AD 1780 (Mrongo 4) and AD 1900 (Mrongo 10, Usumbwe 3, cf. Tab. 12), a period of considerable economic and political change in East Africa.
Fig: 51: Important present day soil erosion processes. Contour trenches on steep slopes help visualise the magnitude of sediment transport during runoff events under dense banana plantation: a) recently excavated trench at Usumbwe and b) half year old infilled trench above Mrongo 2. Tillage erosion associated with banana transplanting: c) banana pit and related spoil material on a 25° steep slope, d) cut and fill feature resulting from banana planting, exposed in the contour trench shown in a).

138
Currently, sheet wash and rill erosion are observed in open maize fields and under dense banana plantations and it must be assumed that the sand lens formation processes has continued uninterrupted since the 15th century. Sand lenses, however, are not recorded within the upper metres of the deposits suggesting that preservation has been effectively subdued during the last centuries.
No strong climatic shift has been observed that would explain a temporary cessation of hillwash during the 20th century and a very recent resumption of a seasonal precipitation regime (NICHOLSON 2000; HASTENRATH 2001). Instead, as noted above, soil working is the most likely driver of sand lens destruction. Today, hoeing for cereals, maize, and beans and the occasional digging of banana pits effectively prevents sand lens preservation and as such, the lack of sand lenses within the upper deposits is indicative for permanent cultivation or a significant reduction in fallow periods. The current permanent cultivation of the comparably fertile slope deposits thus represents a further intensification of agricultural land use compared to the previous period, when prolonged decadal-long fallows must have prevailed. Annual tillage (or very short fallow periods of a few years only) might be a response to increased population pressure, declining soil fertility of the slope soils or to other incentives of agricultural intensification discussed further in chapter 4.6 & 10.4.6.
In summary, runoff-based erosion and the formation of sand lenses are the consequence of progressive and cumulative soil erosion during fifteen centuries of extensive swidden farming practices of a perhaps semi-sedentary population. Around the 15th century, the intensity of land use increased probably because of societal transformations, population growth or due to fertility decline of eroded soils. Recurrent cultivation of fields may have resulted in regular - albeit initially decade long - fallow periods preventing forest re-establishment but allowing sand lens preservation. Intensification of agricultural land use following societal transformations triggered by the 19th-century caravan trade or population growth in the 20th century is likely to have led to a further reduction of fallow periods and thus the destruction of sand lenses.
8.7 Post depositional translocation processes within slope deposits
8.7.1 Base cation enrichment
pH profiles of forest soils reflect current soil development: elevated topsoil pH due to base pump effects, leaching and acidification in the subsoil, and intermediate pH values near the weathering front. After truncation of agricultural soils, slightly weathered B/C-material with a generally higher pH becomes exposed. Locally, addition of reworked material might contribute to an elevated pH.
Post-depositional leaching processes as well as differing pH values inherited from the colluvial parent material are likely to be responsible for the pH pattern of slope deposits. Analogous to forest soils, pH of the uppermost slope deposits is elevated due to biogeochemical cycling and the steady influx of basic cations by decomposition of above ground biomass. Near surface leaching in the upper metres of the slope deposits causes a lowering of the pH, whereas correlated accumulation of bases takes place in the lower part of the colluvium and within the buried soils. In addition to vertical influx, lateral influx of dissolved elements from higher landscape positions contributed to the elevated pH of slope deposits. Basic cations leached from the subsoil of slope soils percolate within the groundwater and may be retained in the valley bottom. Post-depositional base enrichment via groundwater flow is likely to be a major cause of high pH values >6 observed in the lowermost deposits/buried soils. Lateral influx is supported by a spatial trend to higher overall pH values for valley bottom locations (Mrongo 5, Usumbwe 3, Lomwe 6) compared to footslope profiles within the slope transects.
139
In addition to dissolved element transport, re-deposition of eroded slope material might also have contributed to the observed pH pattern in slope deposits. During early erosion stages, deposition of topsoil material with a comparatively high pH was later replaced by partly leached subsoil material with a lower pH. Recently slightly weathered subsoil and B/C-material is mobilised. The concurrent occurrence of sand lenses and low pH values might be a temporal coincidence or may be a consequence of enhanced leaching due to improved drainage in sandy material.
8.7.2 Clay illuviation
Clay coatings are observed in colluvial deposits and soils of forests and eroded agricultural slopes. Although their presence may indicate the initial formation of clay enriched, argic illuviation horizons, absolute clay enrichment was not confirmed by particle size analysis. Clay contents of subsoil horizons at Kwa Kirumbi do not suggest clay translocation and enrichment, but rather clay formation during pedogenesis in the most weathered upper decimetres of the soil. The failure to detect clay enrichment by particle size analysis might be attributed to the presence of clay bound to ironoxides, not destroyed during pre-treatment. Thus, further research may be required.
Particle size variation between adjacent samples is higher in colluvial deposits than in situ soils. The particle size variations of the colluvial deposits demonstrate that particle size composition is controlled, in the first instance by the delivery of material with varying particle size fractions and not by post-depositional pedogenetic processes. Deposition of sorted sediments during runoff events and their subsequent incorporation into the soil matrix contribute to the observed particle size variability.
The frequent and abundant occurrence of clay coatings in the slope deposits is indirect evidence for the disturbance process �erosion�. Colluvial deposit are likely to favour clay translocation. Erosion leads to dispersion and mobilisation of clay minerals. When the runoff water infiltrates on the footslope, clay particles not sedimented on the surface are dragged into pores and are translocated within the infiltrating water stream. This transportation process possesses a much higher energy compared to clay translocation within the profile itself, and hence clay illuviation becomes much more effective. Preconditions, however, are favourable physical soil conditions � particularly open macropores and the absence of surface sealing. Soil disturbances, such as soil and tillage erosion and bioturbation by termites and ants, clear the path for disaggregated soil material to erode and disperse, and provide the corresponding macropores through which water infiltrates and clay illuviation can take place.
The lack of particle size differentiation in the slope deposits is attributed to the particular setting. In contrast to conventional clay translocation, the main source of the transported clay minerals is not an elluvial horizon but appears to be the fine fraction of eroded and transported material. This circumvents clay depletion of the uppermost deposit. As infiltration depth shifts during the built-up of the deposit no distinct clay enriched horizon develops. Further, particle size variation suggests that the heterogeneous texture of the colluvium outweighs post-depositional changes of the clay content.
8.8 Nitric‐acid‐resistant‐carbon: Charcoal or resistant organic matter?
Nitric-acid-resistant carbon (NARC) is a widely used, though disputed, charcoal proxy (WINKLER 1985; LAIRD & CAMPBELL 2000; KURTH et al. 2006). The NARC content of the Lomwe swamp core closely mirrors the distribution of total organic carbon and shows maxima for the buried and the recent peat (Fig. 32). The close relationship between nitric-acid-resistant and total organic carbon questions the efficacy of the nitric acid digestion method to discern between charcoal and highly
140
recalcitrant organic matter. The stratigraphic coincidence suggests that either the digestion agent fails to effectively remove the recalcitrant highly resistant organic fractions of the peat or that the standard combination of time, temperature and amount of nitric acid is inadequate to completely digest the high amount of organic matter of the peat layer. If nitric acid digestion of organic matter is incomplete, the amount of recovered carbon may depend on the initial amount of digestible material and represents a methodological shortcoming. A taphonomic explanation of the concurrent maxima of NARC and organic carbon could be differential sedimentation favouring charcoal deposition in wetlands compared to terrestrial deposition environments. Only if these possibilities are excluded can the charcoal proxy be interpreted in terms of palaeofire frequency. Still, the high �charcoal� occurrence during peat development is more likely to reflect local swamp fires instead of a regional palaeofire signal. Given these uncertainties, the origin of the nitric-acid-resistant carbon in the Lomwe swamp core can not be determined satisfactory.
A similar conclusion can be drawn from NARC quantification of the Lomwe 10 soil profile (cf. Appendix Fig. D.3). Again, elevated NARC values coincide with high organic carbon values in the buried topsoil. The slope deposits themselves show a constant background �charcoal� content. These observations suggest in the first place accumulation of residual charcoal � or recalcitrant organic matter - on the former ground surface but do not elucidate the fire history.
These preliminary analyses caution against the interpretation of the NARC content in terms of a charcoal proxy for past fire frequency as the ability of the method to discern charcoal and recalcitrant organic matter is questioned. Extension of the trial run to further soil profiles was not justified and interpretation of NARC as a palaeofire proxy was abandoned.
In East Africa several charcoal records are based on the nitric-acid-digestion method of Winkler (FINCH et al. 2009; MUMBI 2009; FINCH & MARCHANT 2010; RUCINA et al. 2010). Similar to the present study, the nitric-acid-resistant carbon content is often closely linked to changes in sediment stratigraphy (HOWELL 2009; RUCINA et al. 2009; FINCH & MARCHANT in prep.). In several cases however the NARC increase could be confirmed independently by microscopic charcoal count (MARCHANT 1997; RUCINA et al. 2009). The present study cautions against the interpretation of NARC as a direct charcoal proxy, as a methodological bias must be considered when NARC correlates with total organic matter. Instead of using chemical methods, measuring carbon along a continuum depending on strength and type of the oxidant, other characteristics of charcoal such as colour (charcoal count, reflection analysis) or chemical signature (biomarker analysis) are recommended which might give an independent and more reliable picture of charcoal occurrence.
8.9 Chronology of the Lomwe swamp core
8.9.1 Exotic taxa as stratigraphic markers
Stratigraphic markers enable the indirect dating of a sequence by being unambiguously related to a known event in time. A number of different stratigraphic markers have been used to support the dating of sedimentary sequences such as the occurrence of tephra (PYLE 1999), algal blooms (VERSCHUREN et al. 2000) or the first occurrence of non-native species (FINCH & MARCHANT 2010, in prep.). At Lomwe, pollen types of two introduced species � Zea mays and Cupressus � are potential stratigraphic markers dating, respectively, the arrival of the new world crop maize and later the impact of colonial afforestation measures.
141
8.9.1.1 Maize
The earliest occurrence of Zea mays pollen (86cm depth) coincides with the establishment of the recent wetland and predates by about 12cm the occurrence of the exotic tree genera Cupressus at 74cm, Eucalyptus at 46cm, and finally Pinus at 26cm depth.
The spread of maize through Africa has been subject to discussion as the fragmentary historical record only offers broad bracketing dates (GOODWIN 1953; JEFFREYS 1963; MIRACLE 1963, 1965; MCCANN 2001). Its initial introduction to West Africa by the Portuguese cannot be fixed to an exact date, but must have happened between 1502 and 1550. Since then, maize has been adopted widely by many local African populations as it offers higher yields and matures faster than native cereals such as sorghum and millet and allowed the expansion of the agricultural frontier into subhumid and humid forest environments, until then reserved for the banana (MCCANN 2001).
In East Africa, maize is thought to have arrived with Portuguese traders, who in the 16th century established trading posts along the Swahili coast. The earliest accounts are from Madagascar, where a priest was growing milho zaburro in 1561 and it is assumed to have arrived in Mozambique by 1570 (MIRACLE 1965). WHITE (1949) reports that maize was established on Pemba and Zanzibar in 1643, were it was grown to provide the Portuguese garrison at Mombasa with food. The spread of maize into the interior remains obscure, as written accounts only exist for the Swahili coast. Historical accounts start only in 1848, when the missionary Krapf (1858) reports maize as a major staple of the Wakamba in Kenya. In 1861, VON DER DECKEN (1869) reports maize from markets in Pare and MCCANN (2001) discusses maize as one of the staples of the mid-nineteenth century Swahili caravan trade. The earliest palaeoecological records place maize at Lake Naivasha around AD 1690 (LAMB et al. 2003) and at Kwasebuge swamp in the South Pare Mountains around AD 1700 (FINCH & MARCHANT in prep.) and suggest a rapid spread of the New World crop in the East African interior.
The direct stratigraphic proximity of Zea mays and Cupressus pollen suggests only a minor time lag between the introduction of maize and the first plantation of Cupressus and limits the use of maize pollen as a stratigraphic time marker indicating a post AD 1643 date. Maize cultivation in pre-colonial Pare as suggested by the Kwasebuge pollen record might have been relatively restricted and therefore it might not be recorded in the Lomwe swamp. Invisibility of maize pollen, despite the presence of the plant, is a common problem as Zea mays is known to be a poorly dispersed pollen type. Transport distances are particular short due to the large size (>80µm) and mass of the pollen grains. Effective pollen dispersal has been shown to be limited to about 60m, at which point the concentration of pollen grains has dropped to less than 1% (RAYNOR et al. 1972; BANNERT & STAMP 2007).
Considering the poor pollen dispersion, the historical fact of maize cultivation in the mid-19th century, and palaeoecological evidence from South Pare, early maize cultivation is likely to have taken place on a small scale in North Pare but probably was not as important as it became in later times. Therefore, it is proposed here that maize pollen remained undetected in the Lomwe pollen record until maize cultivation expanded rapidly during the 19th century.
8.9.1.2 Introduced tree species
Apart from food crops, there is no evidence that Portuguese traders introduced other exotic species to the East African shores. The first exotic trees in Tanzania are reported from the Bagamoyo Mission, founded in 1869 (SCHABEL 1990). In 1893, the German colonial government established an experimental station in Dar es Salaam and as early as 1895 when seeds were distributed to private planters and government stations for testing. A few years later in 1902 the Biological-Agricultural
142
Station at Amani in Wilhelmstal/Lushoto in the Usambara Mountains was established and large scale seed testing of indigenous and exotic trees commenced (SCHABEL 1990). Most important exotic tree species are Cupressus, Eucalyptus, Grevillea, and Pinus. In North Pare exotic tree species might have been introduced shortly after AD 1900, however only in the 1950s did tree planting became popular when schools and the Mass Literacy Scheme in 1952 were responsible for the planting of over half a million trees in North Pare (SHERIDAN 2001). As stratigraphic marker, Cupressus and Eucalyptus pollen point to sometime between AD 1900 and 1950.
8.9.1.3 Classification of Cupressus/Juniperus and Eucalyptus/Syzygium pollen
Straightforward interpretation of Cupressus and Eucalyptus pollen as stratigraphic markers is however problematic as both resemble similar native pollen types and therefore cannot be unambiguously assigned to a sole genus. However, close examination allows separation of exotic and native taxa based on circumstantial evidence.
The first morphotype is of the Myrtaceae family and classified as either Syzygium or Eucalyptus. Syzygium is an indigenous tree genus, which occurs frequently at riverine locations, at lake and swamp margins, as well as within upper and dry montane forests (LOVETT et al. 2006b). Introduced Eucalyptus is of high economic importance and ubiquitous in North Pare where it is planted in extended plantations as well as scattered throughout farmed and forested areas. The most recent swamp deposits are expected to reflect the widespread distribution and the dominance of this exotic timber genus. The pollen morphotypes of Syzygium and Eucalyptus are very similar and distinction between them is not always possible (Marchant, Muiruri & Rucina 2010, pers. comm.). In the pollen record of Lomwe Swamp, Eucalyptus/Syzygium pollen occurs in high numbers in the upper 50cm and in a single spike at 315cm depth. The high occurrence of this pollen type in the upper part of the swamp deposit is confidently interpreted as Eucalyptus as minor contribution from native Syzygium can be discounted.
The second morphotype is of the Cupressaceae family suggesting either Juniperus or Cupressus. Juniperus, a widespread dry montane forest genus occurring between 1500 � 2200m a.s.l. (HAMILTON 1981; LOVETT 1993b), has a high economic value and is a preferred timber for building and construction. Cupressus is not native to East Africa and was introduced during early colonial times. Nowadays Cupressus is widespread throughout Pare, but unlikely Eucalyptus, Cupressus occurs as single trees or as a boundary marker and not in plantations. Pollen types of Juniperus and Cupressus are similar and differentiating them is difficult. Its pollen type occurs in high numbers in the upper 80cm as well as in three samples from the lower part of the profile (285, 315, 330cm). Today, Juniperus is absent from the agricultural mid-altitudes of Pare, which backs the interpretation of the large quantity of this pollen type in the uppermost metre as exotic Cupressus.
Single spikes of Eucalyptus/Syzygium and Cupressus/Juniperus pollen in the lower part of the profile cannot be related to introduced species due to a deposition age >1000 BP. Their occurrence in depths where exotic genera cannot be expected has to be interpreted as native Syzygium and Juniperus.
8.9.2 Radiocarbon date reversals and allochthonous material influx
Early wetland establishment and its subsequent burial at Lomwe are dated independently at two sites: the swamp core and at the peat profile. At both sites, radiocarbon dates relating to the burial of the peat layer and the hillwash deposit indicate date reversals (cf. Fig. 32 & Fig. 52). Early wetland formation started roughly around AD 600, whereas radiocarbon dates for the onset of accelerated hillwash deposition and peat burial are reversed and range between AD 200 and AD 1200. Due to
143
contamination of bulk samples by old reworked carbon, only a maximum age of ~AD 1200 can be given for the burial of the peat. The following paragraphs discuss the causes and consequences of reversed dates and the reliability of the time interval given above for peat accumulation.
Dating of mixed materials is probably the main reason for the inconsistent chronology. With the exception of a recovered wood fragment (Lomwe, 335cm) and charcoal fragments (peat profile 167cm), radiocarbon dating had to rely on the total organic carbon fraction. A more reliable approach entailing dating of macrofossils (stalks and leaves) failed as the separation of charcoal and plant material was not successful. Bulk organic material comprises the entirety of organic matter fractions and includes carbon from a variety of sources most importantly plant material, soil organic matter, and charcoal, which might be locally derived or redeposited and reworked, and thus of mixed ages.
Two ways of contamination have to be considered. Contamination by young organic carbon resulting in age underestimation, and the incorporation of old carbon diluting the 14C content and resulting in age overestimation (MATTHEWS 1985; OLSSON 1991; HIGHAM 2002). Sources of young carbon are incorporation of roots and contamination during pre-treatment and handling. Bioturbation may result in either age over- or underestimation. Incorporation of old reworked organic matter or charcoal is generally related to taphonomic processes such as the admixture of allochthonous material or artefacts and leads to age overestimation. Additionally, radiocarbon age of the recalcitrant humus fractions, stabilised within soil aggregates and clay-humus complexes, generally describes the mean residence time of organic carbon in the soil and thus result in a considerable age overestimation (MATTHEWS 1985). Charcoal on the other hand is strongly resistant to decay and accurately dates carbon fixation. Due to its low density, charcoal particles are more susceptible to erosion than soil organic matter and when exposed might be mobilised during normal rainfall events. The influx of old, decay resistant charcoal produced during past fires on the slopes may play an important role for the overestimation of the burial age.
For the start of peat accumulation, age underestimation due to post-depositional processes such as bioturbation, incorporation of roots, and contamination by modern carbon are thought to be minimal. The clear layering and the well-preserved organic remains of the peat deposit exclude strong bioturbation. Intact and recent roots were removed during pre-treatment. Contribution from decomposed roots is likely to be minimal due to the high water table and the absence of recent roots. Contamination by modern carbon during sampling and pre-treatment is negligible as great care was taken during the sampling process. Two radiocarbon dates from the swamp core (1489±30 14C BP, wood fragment) and the peat profile (1336±30 14C BP, total organics) are derived from two different materials and suggest a narrow time interval for the establishment of the former wetland. The inbuilt age of the small wood sample is estimated to be less than 20 years (about 2 cm thick fragments), whereas the sample from the peat profile (268cm) postdates the onset of changing hydrological conditions and peat growth by about 5cm. The onset of wetland conditions at Lomwe is estimated to fall between 1450 and 1350 BP, i.e. around AD 600 or the turn of the 7th century (Fig. 52).
The cessation of peat accumulation is dated by two samples from the peat profile showing reversed (162cm, 1704±30 14C BP, bulk) and inverted (167cm, 1243±50 14C BP, charcoal) dates compared to the agreed date for wetland establishment (Fig. 52). A more reasonable age for the burial by hillwash deposits is obtained from the swamp core (228cm, 923±30 14C BP, bulk), although at 117cm depth a reversed age for the recent establishment of the present wetland (1127±30 14C BP, bulk) was obtained.
The reversed radiocarbon ages from bulk and charcoal samples occur at the transition to the hillwash deposit and suggest basin wide influx of old carbon rather than local disturbance events or
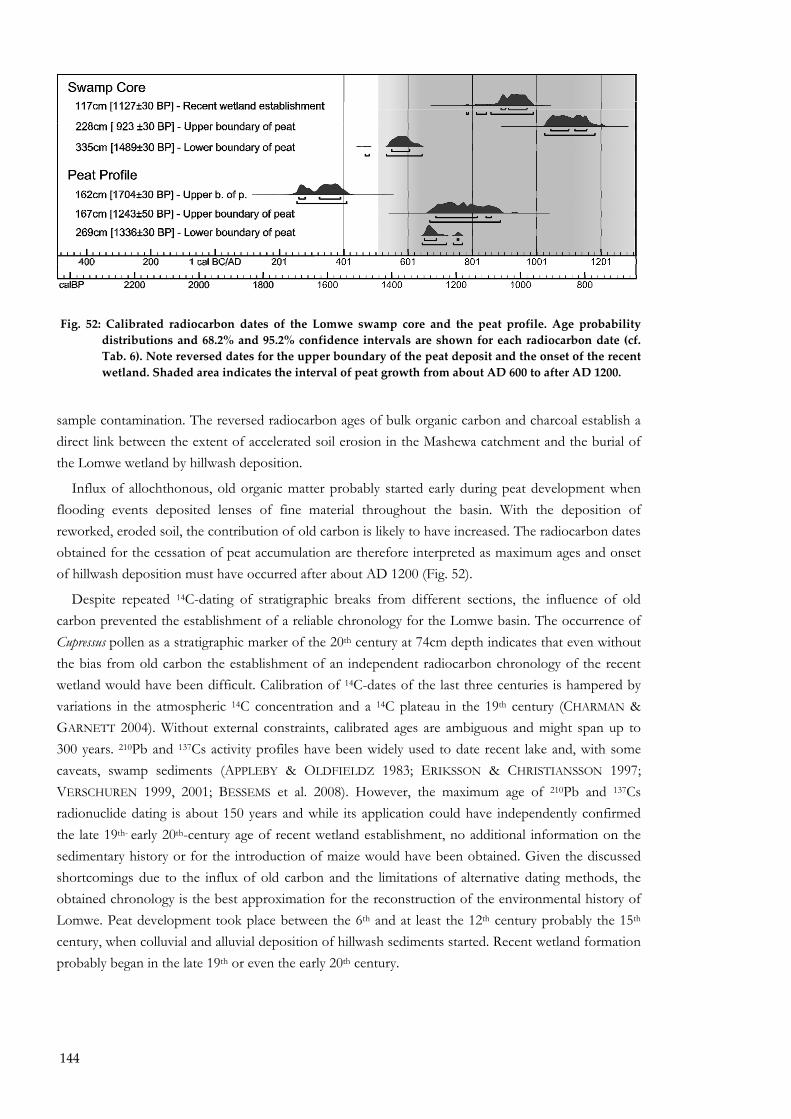
144
sample contamination. The reversed radiocarbon ages of bulk organic carbon and charcoal establish a direct link between the extent of accelerated soil erosion in the Mashewa catchment and the burial of the Lomwe wetland by hillwash deposition.
Influx of allochthonous, old organic matter probably started early during peat development when flooding events deposited lenses of fine material throughout the basin. With the deposition of reworked, eroded soil, the contribution of old carbon is likely to have increased. The radiocarbon dates obtained for the cessation of peat accumulation are therefore interpreted as maximum ages and onset of hillwash deposition must have occurred after about AD 1200 (Fig. 52).
Despite repeated 14C-dating of stratigraphic breaks from different sections, the influence of old carbon prevented the establishment of a reliable chronology for the Lomwe basin. The occurrence of Cupressus pollen as a stratigraphic marker of the 20th century at 74cm depth indicates that even without the bias from old carbon the establishment of an independent radiocarbon chronology of the recent wetland would have been difficult. Calibration of 14C-dates of the last three centuries is hampered by variations in the atmospheric 14C concentration and a 14C plateau in the 19th century (CHARMAN & GARNETT 2004). Without external constraints, calibrated ages are ambiguous and might span up to 300 years. 210Pb and 137Cs activity profiles have been widely used to date recent lake and, with some caveats, swamp sediments (APPLEBY & OLDFIELDZ 1983; ERIKSSON & CHRISTIANSSON 1997; VERSCHUREN 1999, 2001; BESSEMS et al. 2008). However, the maximum age of 210Pb and 137Cs radionuclide dating is about 150 years and while its application could have independently confirmed the late 19th- early 20th-century age of recent wetland establishment, no additional information on the sedimentary history or for the introduction of maize would have been obtained. Given the discussed shortcomings due to the influx of old carbon and the limitations of alternative dating methods, the obtained chronology is the best approximation for the reconstruction of the environmental history of Lomwe. Peat development took place between the 6th and at least the 12th century probably the 15th century, when colluvial and alluvial deposition of hillwash sediments started. Recent wetland formation probably began in the late 19th or even the early 20th century.
Fig. 52: Calibrated radiocarbon dates of the Lomwe swamp core and the peat profile. Age probability distributions and 68.2% and 95.2% confidence intervals are shown for each radiocarbon date (cf. Tab. 6). Note reversed dates for the upper boundary of the peat deposit and the onset of the recent wetland. Shaded area indicates the interval of peat growth from about AD 600 to after AD 1200.
145
9 LANDSCAPE DEVELOPMENT IN NORTH PARE
9.1 Forest soils Soil profiles established in the Kwa Chegho and Kwa Kirumbi forests have shown that disturbance
has been an essential part of the forest history. Although no direct evidence for the causes and processes of disturbance can be presented yet, several lines of evidence warrant further discussion.
9.1.1 Kwa Chegho
Tentatively classified as Folic Umbrisols, the Kwa Chegho forest soils represent soil development under high-altitude montane forests at Kwa Chegho, Kwamwalla, Kindoroko and Ngofe. Despite an intact topsoil and a thick organic layer, subsoil disturbances are recorded by frequent occurrence of charcoal and past soil movement. The disturbance is linked to widespread deforestation during the first part of the 20th century as shown by a strongly fragmented forest cover on aerial photographs from 1953. Since then, indigenous forest has recovered, supported by widespread planting of exotic trees, and a closed canopy forest reestablished. Today, only patches of fully-grown Eucalyptus are evidence of former widespread encroachment. On the other hand, selective logging, widespread charcoal production, firewood collection, and grazing are contemporaneous disturbance factors. Early 20th century deforestation observed at Kwa Chegho weakens the representative character of the investigated soils but at the same time emphasises the ubiquitous nature of disturbance within North Pare�s high-altitude forests.
9.1.2 Kwa Kirumbi
The Kwa Kirumbi forest profiles show soil disturbances even within the protected area of a former sacred grove. The occurrence of abundant potsherds accompanied by charcoal and even soil movement corroborates repeated human activity and probably a long history as places of ritual activities as suggested by SHERIDAN (2001) and KIMAMBO (1969). However, the frequent occurrence of potsherds has to be put into perspective. Considering the small area of the forest fragments and the limited area suitable for ceremonial activities such as gentle slopes and flat ridges, the recovery of sacrificial remains might not be representative for the entire forest fragment. Deep slope deposits in the small valley head depression (Kwa Kirumbi 3 & 4) on the other hand warrant further research into the forest history.
9.1.3 Complex history of forest soils
The investigated profiles show that forest soils in the Pare Mountains have a complex history. They are often polygenetic and are likely to have experienced aggradation as well as erosion phases. Mass movements and fires are widespread within the forested environments (see YLHÄISI 2004 for recent forest fires). The presence of colluvial deposits and the widespread recovery of significant amounts of charcoal were unexpected and warrant further investigation.
Whether of natural or anthropogenic origin, fires have been part of this forest ecosystem for a considerable span of time and the widespread occurrence of charcoal at both forest sites raises questions about the long-term history of disturbance in mountain forests, forest fragments and protected sacred groves. Disturbance events like fire, mass movements, and anthropogenic impacts on
146
varying scales have shaped the ecology of the small Kwa Kirumbi forest fragments as well as the Kwa Chegho forest. The impact on its forest ecology is not readily discernable from an initial glimpse, and changes in species composition await further research. However, the forest relicts preserved as sacred groves are the only means of obtaining a broad picture of the potential natural vegetation cover of the otherwise deforested agricultural upland zone.
The soils found within these forest patches are representative examples of present forest soils in an elevation zone, now more widely shaped by settlement and agriculture. Although they narrate a history of disturbance and human activities and show evidence of colluvial mass movement, the soils under protective forest cover have not been affected by intensive human land use within living memory. True, these soils are disturbed and may not be exactly representative of undisturbed forest soils (assuming these still exist anywhere) but they are substantially deeper and more humic than agricultural soils on similar slopes. Despite the discussed shortcomings, the Kwa Kirumbi and Kwa Chegho forest soils can be taken as representative baseline soils to which soils under recent and past agriculture can be compared, thus allowing the qualitative assessment of soil degradation due to forest clearance and agriculture. In consequence, the differences between forest and agricultural soils have to be thought of as a minimum level of change.
9.2 Qualitative assessment of soil erosion
The degree of soil erosion was qualitatively assessed by comparison of soil development depth between forest and agricultural soils. Depth of soil development was calculated as depth of the B/C-transition. In cases of colluvial overburden, the deposit was subtracted to obtain soil depth after erosion (instances of colluvial overburden are shown above the zero line in Fig. 53). The depth of the B/C-transition is given by either the alignment of rocks reflecting former rock structure or by the recovery of abundant saprolitic material in soil auger samples, both accompanied by a prominent brightening of soil colour (value >4/6 and chroma >6/7, moist/dry). Although the presence of weathered rocks and structural alignment of saprolitic rocks may vary depending on the bedrock chemistry, depth of weathering is a readily available criterion to evaluate the depth of soil development and to qualitatively assess soil loss by comparing soil depths of forested and eroded environments. Distinction between subsoil, B/C-transition and the original saprolite (C-horizon) is particularly difficult where horizon boundaries are inferred from auger samples.
In general, agricultural soils are severely eroded and have lost their original topsoil and most of their subsoil. Often, incipient topsoils have developed within a mixture of in situ and transported colluvial material. The majority of agricultural fields are characterised by bright surface soil colours indicating a lack of soil development and rubification, as well as by the presence of unweathered rock fragments. Often saprolite is exposed at the surface. Although exact delimitation of soil depth is difficult as the B/C-transition horizon is characterised by gradual transitions from the B-horizon to the saprolite, soil development in most agricultural soils does not exceed 30cm. An exception is Ngalanga 1 in direct vicinity to the Ngalanga forest, which only recently has experienced erosion and still maintains a comparably deep subsoil. Within the upper 30cm of the profile, all studied agricultural profiles preserve weathered saprolitic rocks aligned along the original rock structure. These rocks are generally strongly weathered, disintegrate under moderate pressure and grade with depth into continuous saprolite. Aggregate formation and rubification indicated by red (2.5YR � 5YR) material shows soil development between in situ rocks and within cracks of the decomposing saprolite.
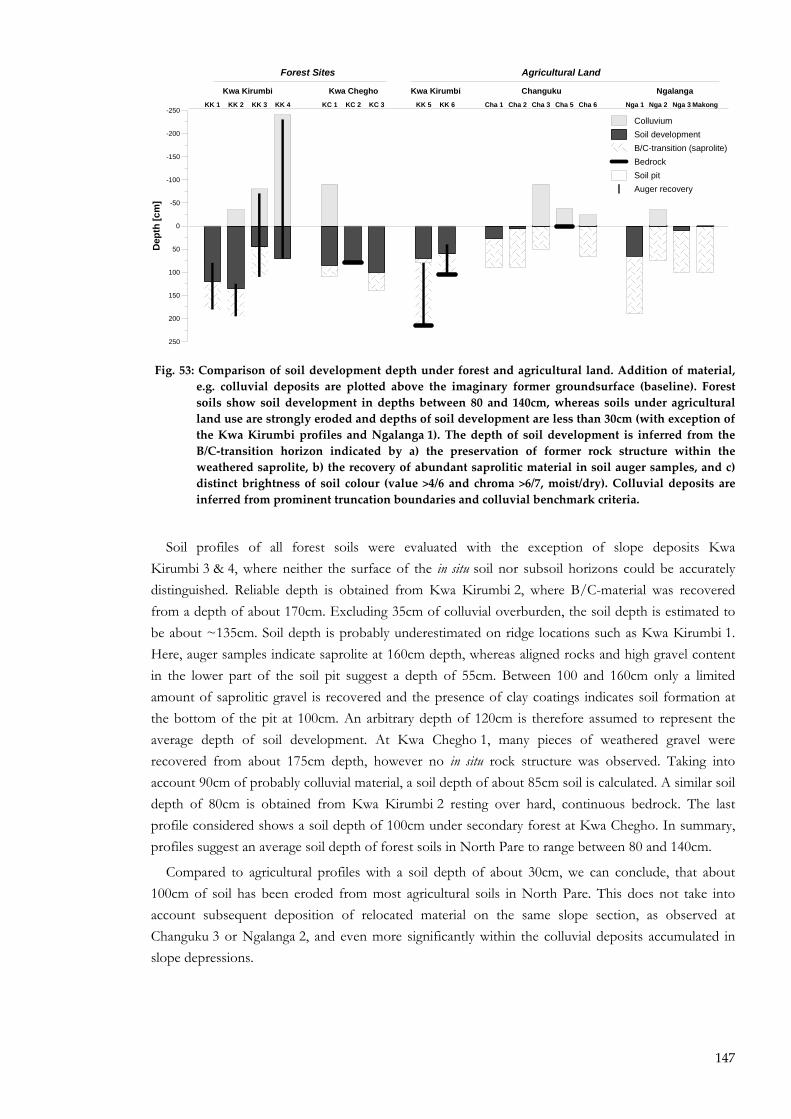
147
250
200
150
100
50
0
-50
-100
-150
-200
-250
Dep
th [c
m]
KK 1 KK 2 KK 3 KK 4 KC 1 KC 2 KC 3 KK 5 KK 6 Cha 1 Cha 2 Cha 3 Cha 5 Cha 6 Nga 1 Nga 2 Nga 3 Makong
ColluviumSoil developmentB/C-transition (saprolite)BedrockSoil pitAuger recovery
Kwa Kirumbi Kwa Chegho Changuku NgalangaKwa Kirumbi
Forest Sites Agricultural Land
Fig. 53: Comparison of soil development depth under forest and agricultural land. Addition of material, e.g. colluvial deposits are plotted above the imaginary former groundsurface (baseline). Forest soils show soil development in depths between 80 and 140cm, whereas soils under agricultural land use are strongly eroded and depths of soil development are less than 30cm (with exception of the Kwa Kirumbi profiles and Ngalanga 1). The depth of soil development is inferred from the B/C‐transition horizon indicated by a) the preservation of former rock structure within the weathered saprolite, b) the recovery of abundant saprolitic material in soil auger samples, and c) distinct brightness of soil colour (value >4/6 and chroma >6/7, moist/dry). Colluvial deposits are inferred from prominent truncation boundaries and colluvial benchmark criteria.
Soil profiles of all forest soils were evaluated with the exception of slope deposits Kwa Kirumbi 3 & 4, where neither the surface of the in situ soil nor subsoil horizons could be accurately distinguished. Reliable depth is obtained from Kwa Kirumbi 2, where B/C-material was recovered from a depth of about 170cm. Excluding 35cm of colluvial overburden, the soil depth is estimated to be about ~135cm. Soil depth is probably underestimated on ridge locations such as Kwa Kirumbi 1. Here, auger samples indicate saprolite at 160cm depth, whereas aligned rocks and high gravel content in the lower part of the soil pit suggest a depth of 55cm. Between 100 and 160cm only a limited amount of saprolitic gravel is recovered and the presence of clay coatings indicates soil formation at the bottom of the pit at 100cm. An arbitrary depth of 120cm is therefore assumed to represent the average depth of soil development. At Kwa Chegho 1, many pieces of weathered gravel were recovered from about 175cm depth, however no in situ rock structure was observed. Taking into account 90cm of probably colluvial material, a soil depth of about 85cm soil is calculated. A similar soil depth of 80cm is obtained from Kwa Kirumbi 2 resting over hard, continuous bedrock. The last profile considered shows a soil depth of 100cm under secondary forest at Kwa Chegho. In summary, profiles suggest an average soil depth of forest soils in North Pare to range between 80 and 140cm.
Compared to agricultural profiles with a soil depth of about 30cm, we can conclude, that about 100cm of soil has been eroded from most agricultural soils in North Pare. This does not take into account subsequent deposition of relocated material on the same slope section, as observed at Changuku 3 or Ngalanga 2, and even more significantly within the colluvial deposits accumulated in slope depressions.

148
9.3 Ugweno: A history of anthropogenic soil erosion The slope deposits investigated at Mrongo and Usumbwe in the Ugweno district can be divided into
four depositional units corresponding to distinct periods of landscape change (cf. Fig. 27 & Fig. 28). Stratigraphic descriptions, laboratory analysis and benchmark features like sand lenses and reworked soil aggregates make it possible to differentiate distinct erosion and deposition processes and infer an environmental history of Pare.
9.3.1 Unit I: Mid-Holocene stable land surface and forest environment
The lowermost stratigraphic unit comprises in situ soils, now buried below several metres of colluvial slope deposits. The original soils developed over saprolite and are characterised by a high content of rock fragments and bright yellowish and reddish colours indicating only incipient rubification as expected in swale positions. The in situ soil have intermediate to high pH values interpreted as secondary accumulation of base cations by vertical and lateral soil water advection. Low magnetic susceptibility indicates a low amount of ferrimagnetic minerals and predominantly secondary pedogenetic minerals according to a high but variable frequency dependency.
A former land surface is reconstructed based on several buried topsoils. The dark coloured horizons show a slightly elevated organic carbon content and enhanced magnetic susceptibility. The absence of distinct, buried topsoils at upper footslope positions (Mrongo 2, Usumbwe 1) and the lack of a distinct boundary between in situ and colluvial material at Usumbwe 2 suggests partial truncation of the former land surface at lower slope positions probably during the initial phase of erosion. Stable carbon isotope ratios of buried topsoils and particularly subsoils indicate the predominance of C3-vegetation. Taking into account the effects of isotopic fractionation during microbial soil organic matter decomposition (chapter 8.5) closed canopy montane forest vegetation is assumed.
9.3.2 Unit II: Initial, anthropogenic soil erosion (since ~200 BC)
Concurrent accumulation of homogeneous slope deposits at Mrongo and Usumbwe marks the onset of regional land clearance and soil erosion. Burial of the mid-Holocene surface started at mid-footslope positions, around 400 � 110 BC (2340 - 2060 BP) at Mrongo 10 and 70 - 230 AD (1880 � 1720 BP) at Usumbwe 2. In the course of the following centuries deposit accumulation extended into the valley bottoms and between 410 and 610 AD (1340 -1540 BP) the lower footslopes at Mrongo 4 and Usumbwe 3 were buried. Despite the spatial and temporal trend on the footslope, land clearance extended rapidly into higher altitudes and accumulation of sediments in head slope depressions at Mrongo 11 and Changuku 4 was in progress during the mid-first millennium AD (deposits older than AD 680 � 970 and AD 260 � 570, respectively).
Gravel of distinct rock types, reworked soil aggregates and the presence of charcoal and potsherds characterises the lower slope deposit. Occurrence of potsherds and abundant charcoal point to land clearance by sedentary agriculturalists as the cause of soil erosion. Initial forest clearing probably was fragmentary and took place over centuries. Glades, agricultural fields, and secondary vegetation created a mosaic of different vegetation and land use types. Soil erosion was retarded within this patchwork of forests, secondary vegetation and agricultural fields, and initially only surface material was mobilised. Topsoils on steep slopes are readily displaced during forest clearance and disturbance by tillage, whereas erosion by running water was still reduced due to a good infiltration capacity and small fields.
149
Magnetic susceptibility remains high throughout unit II indicating the deposition of magnetically enhanced topsoil material, which remained long enough within the biologically active zone to become magnetically enhanced. pH of the lower deposit is high, probably due to the deposition of base rich topsoil material and lateral advection of bases.
The vegetation composition begins to change. Contribution of C4-vegetation increases slowly but steadily and is attributed to the spread of C4-grasses and weeds in agricultural fields and clearings. More importantly, the slight shift might reflect the cultivation of indigenous African cereals like sorghum and millet, typically following C4-photosynthetic pathways. As the δ13C shift is slow and gradual, regrowth of secondary forest on cleared land such as under a regime of swidden agriculture is proposed. Alternatively, mixed cultivation involving banana might have been practiced.
9.3.3 Unit III: Accelerated runoff-based soil erosion & sand lens formation
(14th/15th to 19th century)
Soil erosion accelerated concurrently with the occurrence of sand lenses and layers. Three charcoal fragments (Mrongo 4 & 10, Usumbwe 3) date the onset of sand lens formation between AD 1340 and AD 1470. Average deposition rates double from ~0.3cm/a in the early phase of soil erosion (unit II) to 0.6cm/a since the 14th/15th century (unit III and IV, cf. Tab. 12). The widespread occurrence of both sand lenses and sand layers since the 14th/15th century indicates a drastic change of the erosion and deposition processes. Formerly, soil erosion had been dominated by slow mass movement, soil creep, and particularly tillage erosion characterised by the displacement of entire aggregates. Now, runoff-based transport such as sheet wash and localised rill erosion has become an important part of soil movement. Sand lenses formed only in the restricted range of middle and lower footslope positions. Due to comparable steep (~10°) slopes, sand lenses are absent at the upper footslope profiles (Mrongo 2, Usumbwe 1). At valley bottom locations, the dispersed sand lenses of middle footslope positions merge into distinct sand layers (<3°, Mrongo 4 & 5, Usumbwe 3). Here, concentrated runoff is no longer confined to rills and spreads out depositing small sand fans at the end of ephemeral or seasonal rills.
Evidence of concentrated runoff is observed at the mid-slope of the Ngalanga hill (Ngalanga 4 & 5, Fig. 54, Appendix, B.4). Buried under slope deposits, a former stream channel is exposed on a road cut and suggests an early phase of severe land degradation dominated by linear runoff erosion and channel formation. Although undated, the incision of the seasonal channel into deposits on the mid-slope of Ngalanga hill is likely to be linked to the onset of sand layer deposition in the valley bottom at Usumbwe 3.
Similarly, an infilled and buried channel at the valley bottom at Mrongo 5 (Fig. 27 & Fig. 54, Appendix B.3) provides evidence for increased runoff and landscape instability. Although undated, the stratigraphic position of the buried channel (1.4m depth) correlates with the 14th/15th century occurrence of sand lenses at other Mrongo profiles. The channel has been filled by medium to coarse gravel, stones and boulders, which excludes human water management likely to have resulted in slippage of soil material from the channel walls. Single, strong rainfall events, able to rapidly mobilise gravel and stones, must have been responsible for the exceptional stream load. Channel abandonment might have been the consequence of channel avulsion, but overlying sand layers, also observed at Mrongo 4 and Usumbwe 3, indicate subsequent deposition in a fan-like environment and rather suggest the temporary absence of a permanent channel until incision and establishment of the present day channel.
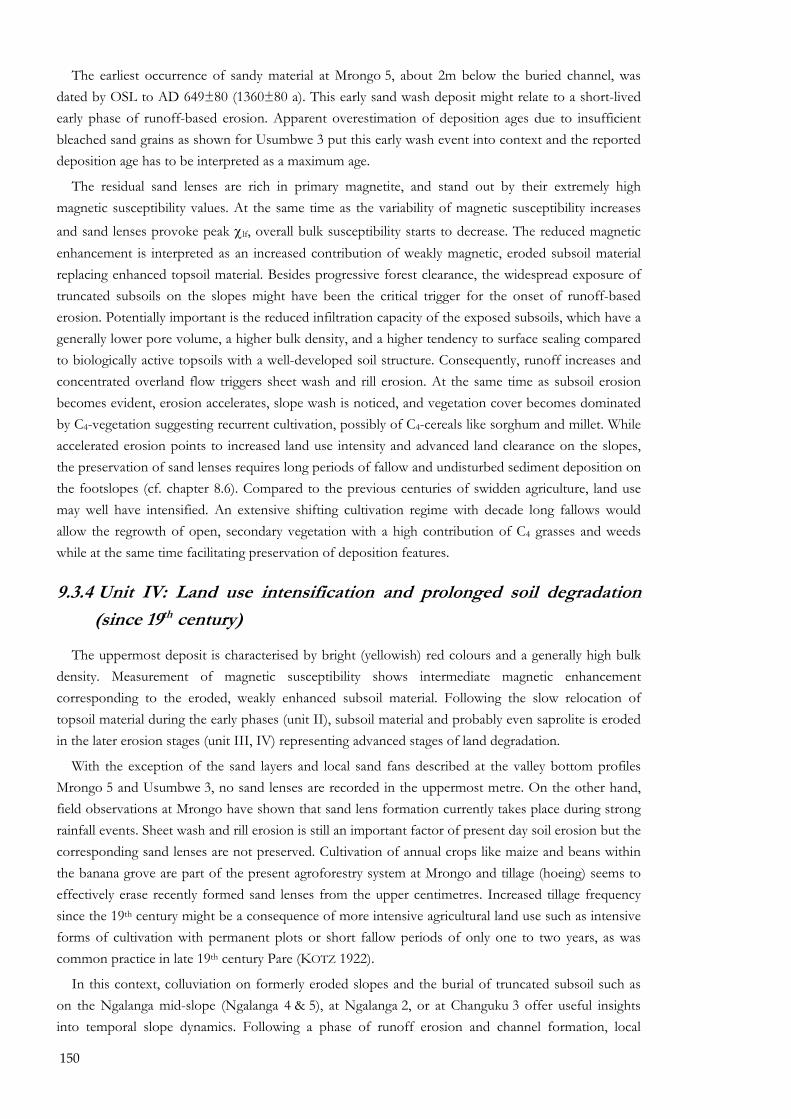
150
The earliest occurrence of sandy material at Mrongo 5, about 2m below the buried channel, was dated by OSL to AD 649±80 (1360±80 a). This early sand wash deposit might relate to a short-lived early phase of runoff-based erosion. Apparent overestimation of deposition ages due to insufficient bleached sand grains as shown for Usumbwe 3 put this early wash event into context and the reported deposition age has to be interpreted as a maximum age.
The residual sand lenses are rich in primary magnetite, and stand out by their extremely high magnetic susceptibility values. At the same time as the variability of magnetic susceptibility increases and sand lenses provoke peak χlf, overall bulk susceptibility starts to decrease. The reduced magnetic enhancement is interpreted as an increased contribution of weakly magnetic, eroded subsoil material replacing enhanced topsoil material. Besides progressive forest clearance, the widespread exposure of truncated subsoils on the slopes might have been the critical trigger for the onset of runoff-based erosion. Potentially important is the reduced infiltration capacity of the exposed subsoils, which have a generally lower pore volume, a higher bulk density, and a higher tendency to surface sealing compared to biologically active topsoils with a well-developed soil structure. Consequently, runoff increases and concentrated overland flow triggers sheet wash and rill erosion. At the same time as subsoil erosion becomes evident, erosion accelerates, slope wash is noticed, and vegetation cover becomes dominated by C4-vegetation suggesting recurrent cultivation, possibly of C4-cereals like sorghum and millet. While accelerated erosion points to increased land use intensity and advanced land clearance on the slopes, the preservation of sand lenses requires long periods of fallow and undisturbed sediment deposition on the footslopes (cf. chapter 8.6). Compared to the previous centuries of swidden agriculture, land use may well have intensified. An extensive shifting cultivation regime with decade long fallows would allow the regrowth of open, secondary vegetation with a high contribution of C4 grasses and weeds while at the same time facilitating preservation of deposition features.
9.3.4 Unit IV: Land use intensification and prolonged soil degradation
(since 19th century)
The uppermost deposit is characterised by bright (yellowish) red colours and a generally high bulk density. Measurement of magnetic susceptibility shows intermediate magnetic enhancement corresponding to the eroded, weakly enhanced subsoil material. Following the slow relocation of topsoil material during the early phases (unit II), subsoil material and probably even saprolite is eroded in the later erosion stages (unit III, IV) representing advanced stages of land degradation.
With the exception of the sand layers and local sand fans described at the valley bottom profiles Mrongo 5 and Usumbwe 3, no sand lenses are recorded in the uppermost metre. On the other hand, field observations at Mrongo have shown that sand lens formation currently takes place during strong rainfall events. Sheet wash and rill erosion is still an important factor of present day soil erosion but the corresponding sand lenses are not preserved. Cultivation of annual crops like maize and beans within the banana grove are part of the present agroforestry system at Mrongo and tillage (hoeing) seems to effectively erase recently formed sand lenses from the upper centimetres. Increased tillage frequency since the 19th century might be a consequence of more intensive agricultural land use such as intensive forms of cultivation with permanent plots or short fallow periods of only one to two years, as was common practice in late 19th century Pare (KOTZ 1922).
In this context, colluviation on formerly eroded slopes and the burial of truncated subsoil such as on the Ngalanga mid-slope (Ngalanga 4 & 5), at Ngalanga 2, or at Changuku 3 offer useful insights into temporal slope dynamics. Following a phase of runoff erosion and channel formation, local
151
stabilization of the slope took place. Colluvial deposits, found today on previously eroded slopes, record a subsequent shift from erosion to a deposition environment. Soil erosion, however, continued on a large-scale further upslope and on the ridges, providing the material now stored on mid-slope depressions. The spatial mosaic of erosion and localised deposition observed today on the slopes is dynamic in time and space and is controlled by past trajectories of land use including agricultural intensification and soil conservation measures.
Overall, deposition rates and hence erosion on the slopes increased since the widespread removal of topsoils in the 15th century, and recent observations of sheet wash and rill erosion confirm the ongoing importance of runoff-based erosion despite local implementation of soil conservation measures. Exposure of truncated and infertile subsoils on the slopes is the legacy of two millennia of soil erosion resulting from unsustainable land use practices.
9.4 Lomwe: Holocene landscape development
Slope deposits at Lomwe revealed a buried late Pleistocene land surface but two distinct deposition phases. Late Holocene sediments overlying the late Pleistocene topsoil suggest a prolonged hiatus, probably an undetected erosion event prior to anthropogenic colluviation.
9.4.1 Unit IP: Late Glacial land surface and forest environment
Buried organic matter rich horizons at Lomwe are evidence for a stable land surface during the Last Glacial Maximum. Radiocarbon dates of charcoal and soil organic matter span a period of about 6000 years suggesting a prolonged phase of morphological stability during the later part of the glacial dry period. Charcoal fragments dated to 18.5 - 17.7 ka BP at Lomwe 3 and 19.5 - 18.0 ka BP at Lomwe 10 show that fire events occurred during the LGM. On the other hand, the humin fraction of soil organic matter at Lomwe 3 suggest soil burial several thousand years later (14.9 - 13.9 ka BP).
Generally, radiocarbon dates of soil organic matter are younger than the age of initial soil development but older than the burial event (MATTHEWS 1985; CATT 1986; WANG et al. 1996). During soil development, mixing and incorporation of fresh organic matter rejuvenates the apparent soil age and thus it is only possible to obtain a minimum age for the beginning of soil formation
Fig. 54: Buried and infilled stream channels at Mrongo and Ngalanga/Usumbwe. a) Buried channel incised in truncated subsoil on the mid‐slope of the Ngalanga hill. b) & c) Buried channel in valley bottom deposits at Mrongo 5, overlain by decimetre thick sand layers after channel avulsion or abandonment. d) Present, intermittent Mrongo stream
152
(SCHARPENSEEL & SCHIFFMANN 1977; WANG et al. 1996). Whereas the most labile organic matter fractions are readily decomposed, stable organic carbon compounds accumulate and their proportion increases with time. Burial of a soil ideally cuts off the incorporation of further organic material; however the age of burial might be overestimated by as much as the apparent mean residence time of soil organic matter (WANG et al. 1996). Decomposition after burial as well as admixture of young carbon derived from roots or percolating organic acids might further influence the 14C content of the soil carbon (MATTHEWS 1985; CATT 1986). Despite the discussed caveats, buried topsoil horizons with high organic carbon content are assumed to be far from a steady state and are generally understood to allow reliable dating of the burial age (GEYH 2005). At Lomwe 3, the possibility and the magnitude of an inherited apparent steady stage age of recalcitrant organic matter cannot be assessed with any certainty but is likely to exceed contamination by young carbon as the buried horizon shows clear-cut boundaries, and the contribution from roots and percolation of humic acids is reduced by pre-treatment � thus a maximum age of soil burial is assumed.
Charcoal fragments, in the first instance at least, date fire events during the LGM when temperature depression and aridity were at their maximum in East Africa (GASSE et al. 2008). Whereas inbuilt ages of the burned wood are negligible when compared to the time span concerned, reworking and temporal storage of charcoal fragments before burial is a serious source of overestimation of the real burial age. Considering that radiocarbon dates differ by material and hence event dated (fire vs. incorporation of soil organic matter), soil burial around 14 ka BP is assumed.
High organic carbon contents between 1.9% and 2.4% Corg indicate strong accumulation of organic matter typical for a cool and moist montane forest environment and retarded decomposition. The comparatively low stable carbon isotope ratios of the organic matter (δ13C: -22.5� to -24.8�) are
similar to δ13C values observed for subsoils of present forest soils. Taking into account isotope
fractionation during decomposition (cf. chapter 8.5) topsoil δ13C at the time of burial is likely to have reflected a closed canopy C3 montane forest environment, similar to the Kwa Chegho forest. The stable morphological conditions under closed forest however, did not exclude occasional forest fires. Probably around 14 ka BP, this former surface soil was sealed by a rapid natural erosion event, possibly triggered by rapid climatic change at the end of the LGM.
9.4.2 Unit II: Early and late Holocene landscape instability �
The LGM soil is overlain by a distinctly dark (reddish) brown lower slope deposit with a low bulk density interpreted to represent an early phase of slow topsoil erosion in a sheltered environment, probably during early land clearance phases.
Radiocarbon dates obtained from Lomwe 5 at 475cm (2,870 � 2,500 BC), 289cm (AD 1010 � 1160) and 198cm (AD 1260 - 1390) suggest that most of the lower slope deposit has accumulated during the last two millennia. The slope deposit at Lomwe 10 dates almost entirely to the last two millennia as inferred from a potsherd (age <2000 BP) in 210cm depth - about 40cm above the buried soil - and a radiocarbon date of 880 � 1120 AD at 115cm depth. A first millennium AD date for the onset of anthropogenic soil erosion at Lomwe is also supported by the recovery of potsherds in deposits dating to 260 � 570 AD (285cm) at the small head slope depression Changuku 4 (cf. Appendix B.2).
As most of the deposit has accumulated during the last two millennia, the initial deposit burying the late Pleistocene soil turns out to be very shallow comprising less than half a metre at both Lomwe 5 and Lomwe 10. Rapid and deep burial was necessary to preserve the 15cm thick organic matter rich
153
LGM topsoil, prevented its mineralization, and conserved the distinct horizon boundaries. Material of unknown but sufficient depth to cut off disturbance of the buried horizons was deposited and a new stable surface developed. The lack of this postulated late Pleistocene to early Holocene land surface is best explained by a hiatus. Subsequent erosion, most likely linked to the onset of anthropogenic land clearance, removed - at least partially - the blanketing cover, before accumulation of the present, potsherd bearing, anthropogenic colluvium began. The mid-Holocene charcoal from Lomwe 5 must then be interpreted as reworked during later erosion processes.
This scenario postulates the deposition of similar material during two temporally wide spaced and causally distinct erosion events: erosion triggered by climatic change at the end of the LGM and anthropogenically induced soil erosion of the past millennia. On the other hand, an erosional hiatus is supported by the upslope thinning of the buried topsoil at Lomwe 3, which together with similar evidence from Usumbwe 1 and Mrongo 2 suggests that the anthropogenic build-up of sediments was preceded by initial erosion on lower slope positions. Based on the available data, the exact circumstance of early slope deposit formation at Lomwe can not be deciphered yet.
The close occurrence of potsherds and mid-Holocene charcoal above a late Pleistocene surface suggest that an early overburden has been partly eroded during the initial phase of anthropogenic soil erosion. The major part of the present slope deposits built up during the last two millennia.
9.4.3 Unit III/IV: Accelerated soil erosion and land degradation
The uppermost deposits at Lomwe are characterised by bright (yellowish) red colours and a high bulk density. The pronounced colour and density changes allow clear distinction between the early phase of topsoil translocation (unit II) and this later phase of subsoil erosion. The presence of sand lenses recorded at Lomwe 10 and inferred from peak χlf at Lomwe 3 indicate that the change of source material was accompanied by a changing erosion pattern, although not as pronounced as at Mrongo and Usumbwe.
Contrary to the pronounced material changes, analytical results do not corroborate two distinct deposition units as observed at Mrongo and Usumbwe. Instead, continuously decreasing magnetic susceptibility parameters suggest a gradual transition from topsoil erosion in the lower deposit to subsoil erosion in the upper deposit, the latter showing similar magnetic susceptibility values as the eroded subsoils at Changuku. Likewise, stable carbon isotope composition gradual increases from the buried surface to the upper colluvium (Fig. 35) reflecting an increasing contribution of C4-plants interpreted as an opening up of the former forest cover and the progressive spread of cultivation and fallow land.
The upper colluvial deposit is undated but, assuming constant deposition rates, charcoal samples from the upper part of the lower deposit (Lomwe 10, 115cm, AD 880 � 1120 & Lomwe 5, 198cm, AD 1260 � 1390) allow extrapolation of the start of the final phase of soil erosion at Lomwe into the late 16th century. The establishment of Eucalyptus and the development of a dense ground cover since AD 1957 are reflected in an abrupt shift of topsoil δ13C. Topsoil development suggests that soil erosion might have diminished as the steep lower slope above the catena stabilised.
The reconstruction of the colluviation history at Lomwe is complicated by disturbance and possibly repeated truncation events. A postulated erosional hiatus prior to the deposition of anthropogenic colluvium is necessary to explain the observed chronology. Although analytical measurements do not pick up either the proposed hiatus or the distinct boundary between the two colluvial layers shown by

154
material changes, the general trends of δ13C and magnetic parameters are in accordance with the processes discussed in detail for Mrongo and Usumbwe. Initial erosion of topsoil material was replaced in the upper deposit by erosion of subsoil material estimated to have started in the 16th century � slightly but in accordance with the onset of runoff-based subsoil erosion and sand lens formation at Mrongo. Despite the Pleistocene age of the buried soil, the Lomwe deposits record anthropogenic erosion since the first centuries AD, and their stratigraphy reflects the trajectory of land degradation observed for soils on the Changuku ridge.
9.5 Lomwe Swamp: Vegetation and environmental history
The composition of the pollen diagram of the mid-altitude Lomwe Swamp resembles lowland pollen records such as Namelok in Amboseli (RUCINA et al. 2010), the Kanderi and Ziwani swamps in Tsavo (GILLSON 2004, 2006) and the Lake Challa record (RUCINA et al.) but differs markedly from montane forest environments of the Uluguru (FINCH et al. 2009), Udzungwa (MUMBI et al. 2008) and South Pare Mountains (FINCH & MARCHANT in prep.). Even swamp records from comparable altitudes in the Usambara Mountains (Derema, Mbomole and Madumu swamps, ~950m a.s.l., MUMBI 2009) show higher contribution of montane forest taxa than observed at Lomwe.
The pollen record of the Lomwe swamp is characterised by strong fluctuations and a general lack of taxa constancy (cf. Appendix C). Only four families (Asteraceae, Amaranthaceae/Chenopodiaceae, Poaceae, and Cyperaceae) - but no genus or specie - are present over the entire pollen record. The arboreal pollen record is especially fragmentary, and montane forest elements are infrequent and rare.
Non-arboreal pollen dominates the pollen record. In addition to Asteraceae and Amaranthaceae/Chenopodiaceae, shrubs like Acalypha, Justicia, and of the Malvaceae family as well as herbs like Lamiaceae and Phyllanthus occur. Following HAMILTON (1982), most of the taxa dominating the Lomwe pollen record are known to occur on disturbed land (Justicia, Lamiaceae, Rumex, Asteraceae, Grewia, Chenopodiaceae, Malvaceae). The fragmentary occurrence of taxa, the general absence of tree pollen, and the dominance of taxa typical for secondary vegetation usually interpreted as disturbance indicators, suggest that the entire record reflects a strongly disturbed environment. Thus the pollen record is interpreted as representing the temporal and spatial mosaic of secondary vegetation and cultivated land in an agricultural landscape after forest clearance.
9.5.1 � before the 6th century
Only limited evidence is available for the period prior to the establishment of the early swamp environment. Very low pollen counts, low phytoliths counts, and low organic matter levels characterise both the clay and the sterile sandy bottom sediment. The absence of diatoms precludes the possibility of a former lake bed as proposed by ODNER (1971a). The rapid transition from coarse sand, over sandy clay to clay questions the interpretation that this is an in situ soil profile with weathered sterile subsoil grading into a sandy saprolite and rather suggests sorting and hence alluvial sediments. The distinct sandy bottom sediments - also recovered from below an organic layer at Usumbwe 3 - suggest a phase of fluvial activity and sand deposition. Although rapid sedimentation would explain the low levels of pollen, phytoliths, and organic carbon, the fine texture of the overlying clay requires a slow deposition environment and probably corresponds to a former phase of colluviation and alluviation during terrestrial - but much better aerated - conditions than the latter hillwash deposit. The lack of a distinct topsoil development prior to the establishment of the early wetland might imply an erosional

155
hiatus. The environmental conditions prior to the swamp establishment in the 6th century AD remain speculative because of inconsistent and fragmentary data and warrants further investigation (for further discussion of sandy bottom sediments and a possible erosional hiatus see chapter 10.3).
9.5.2 The early swamp environment (6th � 12th century, PZ I)
Wetland conditions established rapidly in the 6th to 7th century AD. The early phase of peat growth is characterised by a woody to herbaceous well-laminated peat deposit with occasional clay inwash. Recovery of wood fragments and Cyperus stalks, high δ13C values and abundant Cyperaceae pollen suggest that the local swamp vegetation was a Cyperus dominated reed swamp with few arboreal species. Cyperus is one of the few wetland plants following the C4-pathway (HILLAIRE-MARCEL et al. 1989; GICHUKI et al. 2001) and stands or floating mats of pure Cyperus are a common feature of lowland and mid-altitude swamps in East Africa (LIND & MORRISON 1974). A Cyperus sample from a pure stand at Mrongo/Ugweno shows high δ13C values (Tab. 13). Elevated δ13C values also suggest that the recent swamp started as a Cyperus wetland, which is supported by the local name � Ngagheni � for the Usangi basin (Ngaghe - Kipare for Cyperus). Preserved wood fragments suggest the local presence of shrubs or trees; however, the pollen record does not support the idea of a swamp forest, as pollen from possible swamp trees are rare.
Around 300cm a decline in Cyperaceae pollen and the high abundance of monolete spores and Asclepiadaceae pollen suggest a change to a more herbaceous peat characterised by members of the Asclepiadaceae family and ferns. Asclepiadaceae, the milkweed, is an entomophilous, insect-pollinated family comprising forbs, herbs and lianas of dry environments often succulent and with milky sap (AGNEW 1974). The general habitat of the family is arid and semi-arid grassland but they also occur in montane grasslands up to around 2700m a.s.l. and apparently show a preference for frequently burned areas (GOYDER 2009). Although not a wetland taxa, several species, especially of the genera Asclepias, Pachycarpus and Tylophora, are reported from seasonal flooded areas, on lake shores or grassy swamps (BULLOCK 1953; GOYDER 1998, 2009). Due to their unique pollination system Asclepiadaceae pollen is unlikely to be far-travelled and it must be assumed that the parent plant formed part of the very local swamp vegetation. Asclepiadaceae are also recorded in swamp deposits from the Udzungwa Mountains, where they occur mainly during wet phases of the Holocene and from Durumu, West Usambara (MUMBI et al. 2008), albeit in low abundances.
The regional arboreal vegetation signature is characterised by low and sporadic occurrence of montane forest genera. The most common genera Hagenia, Ilex, Myrica, and Nuxia are not exclusive montane forest taxa but are also reported from secondary vegetation after forest clearance (LIND &
MORRISON, 1974 citing GILCHRIST, 1952). More abundant are semi-deciduous woodland taxa, like the dominant Dobera/Maesa group but also Acacia, Tarrenna, Terminalia, Commiphora, Grewia, and Celtis (GREENWAY 1973; LOVETT 1993b; KIAGE & LIU 2009).
The non-arboreal pollen record further emphasises the importance of open, probably semi-deciduous woodland in the early period. The genus Acalypha is represented by 30 species in East Africa mainly perennial shrubs, occasionally trees and herbs with a very high export ability (HAMILTON 1972; HAMILTON 1982). It is most common in moist lower montane forest environments, particularly in secondary vegetation (LIND & MORRISON 1974). Being a well dispersed pollen type the parent taxa might be found in the remaining forest fragments on the mountain tops or as undergrowth and within secondary vegetation within the catchment area.
156
The ecologically widespread Asteraceae family is the most abundant non-arboreal taxa in the record. Asteraceae pollen in lower montane and savannah settings are derived from undergrowth vegetation of open woodland and bushland. Continuous abundance of Asteraceae pollen (between 10% and 20%) is recorded for the Namelok swamp in Amboseli (RUCINA et al.) as well as swamps in Tsavo National Park (GILLSON 2004, 2006). The sustained occurrence of Asteraceae pollen throughout the Lomwe core suggests that the parent plants have been common in the catchment.
Members of the Amaranthaceae/Chenopodiaceae group are found in semi-arid environments as well as in seasonally flooded areas and are generally a dry indicator (KIAGE & LIU 2009; RUCINA et al. in prep.). Amaranthaceae/Chenopodiaceae pollen is common in Acacia � Commiphora bushland (WHITE 1983) and is reported to be abundant in the eastern plains of NE Tanzania (VOLLESEN et al. 1999). Similarly, Phyllanthus is known to be a dry indicator (KIAGE & LIU 2009).
The pollen assemblage of PZ I represents an open woodland with Acalypha, Asteraceae and Amaranthaceae/Chenopodiaceae and Poaceae undergrowth - similar to lowland savannah woodland or disturbed secondary vegetation. An open, shrub and herb dominated vegetation with semi-deciduous woodland, instead of the assumed submontane forest deduced from the present forest fragments, must have covered the mid-altitudes of North Pare since AD 600. In the absence of strong climatic controls, the lack of a closed canopy forest is attributed to widespread anthropogenic land clearance before the 6th century AD (cf. chapter 10.4).
9.5.3 Beyond the threshold: Widespread soil erosion since the 12th century
(PZ II)
The beginning of PZ II coincides with the onset of mineral material deposition and reflects drastic environmental changes in the Lomwe watershed. Already in PZ I peat growth was frequently interrupted by the deposition of fine clay lenses pointing to frequent flooding events of the basin bottom. But only around AD 1200 was the former swamp abruptly buried by a mineral material facies. The general lack of organic matter accumulation reflects cessation of peat development and at least seasonal dry conditions. The deposited clay loam with fine to medium gravel points to a medium energy transport regime - distinctly different from the occasional formation of alluvial clay lenses.
Catastrophic flooding by one or several high-energy events, triggered by heavy rains and causing land or mudslides in the watershed, could explain the comparatively rapid shift from organic to mineral material and the good preservation stage of the organic matter. Deposits resulting from mudslides or avalanches are characterised by a chaotic mixture of fine and coarse sediments, including stones and large boulders. The deposition of homogeneous clay loam with a minor gravel component and the lack of greater than gravel-sized material do not support the assumption of a catastrophic single event. Instead, a combination of colluvial mobilisation along the Mashewa valley and subsequent short distance alluvial transport resulted in the accumulation of 1.5 � 2m thick sediments. A radial flow pattern suggesting a gentle alluvial fan can be observed on the 1957 aerial photograph (Fig. 18).
The shift from organic to mineral deposition and the transport of gravel-sized material implies a drastic change of the hydrological conditions and the runoff regime in the Mashewa catchment. Anthropogenic land use and land clearance in Pare has been shown to have provoked prolonged soil erosion since about 2000 years ago (chapter 9.3). During initial clearance phases, overland flow might only have occurred locally within small spots of cleared land and results in local redistribution of eroded material on the slopes and occasionally in a runoff-event leading to clay inwash in the basin. As
157
deforestation continues, the exposure of bare soil offers readily available material for erosion. Clearings merge and contiguous open areas are established allowing the transport of eroded material into the streams and out of the catchment. The clearing of forest, the erosion of topsoils, and general agricultural land use, favour soil compaction and reduce the infiltration capacity of the soil. Increasing amounts of surface water leads to the concentration of overland flow and subsequent runoff-based erosion. The availability of soil material for erosion and the higher transport capacity of overland flow and stream discharge due to enhanced runoff, trigger soil erosion on the slope and the transport of eroded material into the basin.
It is this important catchment specific threshold of contiguous land being cleared and becoming susceptible to erosion, which has been crossed here. Runoff-based transport of eroded material now sets in and coarse mineral material is transported over short distances to sediment traps such as lakes and swamps. In this interpretation, the mineral deposits of the Lomwe swamp is the result of large�scale soil exposure in the catchment, which was in turn a consequence of progressive forest and woodland clearing. Human land use has passed a threshold, and triggered profound changes of the environmental processes, accelerating soil erosion and leading ultimately to land degradation (for climatic influence see chapter 10.4.4).
9.5.3.1 Open landscape of the past centuries
The pollen record parallels the changes of the core stratigraphy and supports the interpretation of clearing related vegetation change triggering soil erosion and deposition. Good preservation of pollen in PZ II indicates a high water table during most of this period and hence a probably only seasonally dry wetland. The predominantly terrestrial character of the Lomwe basin after AD 1200 is reflected in the pollen assemblage from the local basin vegetation. Low abundance of Cyperaceae indicates a reduced extent of the wetland and high numbers of local non-arboreal taxa (Amaranthaceae/ Chenopodiaceae, Malvaceae, Lamiaceae, and Justicia) support seasonally dry conditions. The dominant Amaranthaceae/Chenopodiaceae group generally indicates arid environments but also occurs frequently in seasonally inundated areas. Semi-woody genera of the Malvaceae (e.g. Hibiscus, Sparrmania, Triumfetta) are among the first to invade cleared areas of land in submontane and montane forest areas (LIND & MORRISON 1974 citing GILCHRIST 1952), but they are also widespread in savannah bushland and woodland and occur frequently in seasonally flooded areas (15 out of the 37 species of Malvaceae present in the Mkomazi reserve include seasonally inundated grasslands VOLLESEN et al. (1999)). The distinct record of PZ II suggests that dry land taxa like Amaranthaceae/Chenopodiaceae, tolerant of seasonally waterlogged soils, and the coloniser genera of the Malvaceae, accompanied by Lamiaceae and Justicia invaded the basin bottom shortly after the change in sedimentation took place.
In addition, both Malvaceae and Amaranthaceae/Chenopodiaceae are known to occur in recent clearings and are together with Asteraceae indicators of disturbance. Asteraceae, however, declines during PZ II. As Asteraceae are not specifically wetland plants, their occurrence is unlikely to be linked to wetland formation. Asteraceae occur in low numbers as undergrowth in the forest but are more characteristic as herbs and shrubs in woodland vegetation. Similar unexplained abundance changes of Asteraceae and Amaranthaceae/Chenopodiaceae in an antiphase manner were observed by RUCINA et al. (2010) in Amboseli. If the abundance of Asteraceae and Amaranthaceae/Chenopodiaceae is interpreted in terms of a regional pollen signal derived from the lowland savannah woodland, then the antiphase occurrence with Amaranthaceae might indicate that the latter not only occurred in the basin bottom (if at all), but is also derived from regional pollen fallout and therefore indicates a dry climatic phase, when Amaranthaceae dominated above Asteraceae.

158
Following this interpretation, the conspicuous timing at the onset of the alluvial deposition phase points to a strong drought event. Enhanced soil erosion and subsequent alluvial deposition then must be interpreted as being the result of strong seasonal runoff-events and erosion being facilitated by the opening of the vegetation cover due to aridity. This scenario does not exclude the importance of anthropogenic impact and is discussed in detail in chapter 10.4.2.
Remarkable is the total absence of arboreal � both montane and woodland - pollen during PZ IIa. Disappearance of tree taxa due to reduced precipitation is an unlikely scenario in the relatively moisture buffered mountain environment � instead it probably reflects the advanced clearing stages of the Lomwe catchment. Although the absence of arboreal pollen seems to strengthen the interpretation of advanced forest clearing, it needs to be noted that transported and redeposited soil is very likely to contain old, reworked tree pollen stored in the topsoil of the surrounding hills (MSAKY et al. 2005). The lack of reworked tree pollen is explained by early deforestation starting even before the establishment of the wetland in the 6th century AD. In this scenario, the initial forest topsoil has been eroded during early phases of cultivation and is probably stored in sinks on footslopes along the Mashewa stream. Material eroded and transported at this stage is either pollen poor subsoil or thoroughly reworked and pollen depleted topsoil material.
The absence of arboreal vegetation and the dominance of taxa typical for disturbed or secondary vegetation support the interpretation that forests were completely cleared by the 12th century. Contiguous, open, agricultural land facilitated increased runoff- generation. Soil erosion accelerated and crossed an environmental threshold triggering colluvial and alluvial deposition of hillwash sediments from the Mashewa catchment on the seasonally dry valley bottom. This new processes framework reflects the advanced stage of land degradation of the catchment in the 12th century.
9.5.4 The recent wetland (PZ III, ~19th to 20th century)
Wetland conditions return between 110 and 80cm depth. The recent swamp is restricted to the north-western corner of the basin and differs in several ways from the early basin wide wetland. The recent swamp formation is most likely the consequence of fan-like sedimentation of the Mashewa stream creating a backswamp position with reduced deposition in the northern part of the basin (Fig. 18). This swale position on its own promotes a higher water-table and waterlogging, and thus favourable conditions for the accumulation of organic matter and wetland development.
Decreasing sediment load or decreasing magnitude of runoff events would have contributed but are not crucial to explaining restricted deposition in the southern part and formation of a morphological depression in the northern part of the basin. Decreasing sediment load might be related to a slow down of the land degradation process as a consequence of soil conservation measures or exhaustion of the soil resources on the slopes. The decline in sediment load and wetland formation (since 110cm) predates possible effects of colonial soil conservation measures, which postdate the introduction of non-native tree species at 74cm depth. Indigenous terracing reported by early European travellers in the mid-19th century (VON DER DECKEN 1869; MEYER 1890; BAUMANN 1891) might have at least locally reduced soil erosion and sediment load, though it remains unclear whether terraces were constructed in the immediate area. On the other hand, progressive soil erosion over centuries has removed the top- and later subsoils of the Mashewa catchment and has exposed the underlying saprolite and bedrock. A reduction in sediment load might be the result of a declining supply of transportable source material directly reflecting the severe stage of land degradation and soil erosion in the catchment.

159
Wetter climatic conditions during the last ~150 years would have contributed to a rising water-table and facilitated the establishment of the wetland. From the occurrence of the time-stratigraphic marker Cupressus, the onset of swamp development can be placed in the late 19th century. Framed by two drought periods in the beginning and during the last two decades of the 19th century, the mid 19th century is assumed to have been comparatively wet, whereas the subsequent 20th century is characterised by a more balanced, intermediate climate (HASTENRATH 2001; NICHOLSON & YIN 2001). Although the establishment of the recent wetland might have been favoured by wetter conditions, precipitation variation alone cannot explain the timing of swamp establishment and the subsequent persistence of the wetland. Incremental development of the morphological swale location, probably facilitated by decreasing sediment load due to material depletion or soil conservation measures are the most likely factors for recent wetland establishment.
9.5.4.1 Contemporaneous vegetation
Pollen zone IIIa reflects the stratigraphic change from mineral to organic sediments. The steady increase of Cyperaceae culminates at 90cm and wetland genera Ludwigia and Typha indicate swamp vegetation. The establishment of the permanent swamp falls together with the first evidence of introduced Zea mays in the pollen record and the increase of ruderal vegetation like Rumex and Commelina � the first possible evidence for agriculture. The abrupt and complete disappearance of Malvaceae and the steady decline of Amaranthaceae/Chenopodiaceae (reflecting the increase in Cyperaceae) strongly support their interpretation as dominant basin bottom vegetation during the dry period. The final decline of the herb and shrub vegetation (Amaranthaceae/Chenopodiaceae, Lamiacae, and Justicia pollen disappear and Asteraceae decreases) and the increase in Poaceae in the uppermost samples might be related to a more intensive use of the dry basin bottom for cultivation and grazing during the late 20th century.
Arboreal taxa return in PZ III and show their highest diversity. Whereas woodland taxa such as Acacia, Dobera/Maesa, Tarrenna, Terminalia, Commiphora, are most likely far-travelled pollen from the Mkomazi and Tsavo plains, the rise of Acalypha, Myrica and Nuxia accord with recovery of secondary forests in the (sub)montane forest zone (cf. chapter 10.4.7). The rise in arboreal pollen is dominated by Cupressus and Eucalyptus reflecting their introduction by German foresters shortly after AD 1900 and afforestation and widespread planting of exotic trees in the mid-20th century (cf. chapter 8.9.1.2). Although present in the upper samples, Pinus plays a minor role in North Pare as can be judged from the low occurrence in the pollen record, which reflects the absence of pine plantations in North Pare.
9.5.4.2 Recent stream incision
Clear stratigraphies at stream banks show that the Ndurumu and Mashewa streams incised into the most recent sediments of the Lomwe basin. Several factors suggest that the incision of the Ndurumu stream might be another consequence of land use practices and prolonged land degradation.
Traditionally the moist basin bottoms were protected from cultivation and only during exceptionally dry periods did cultivation extend into the wetlands. As a consequence of declining traditional land use practices under colonial rule in the first part of the 20th century, parts of the swampy valley bottoms at Lomwe and Ngagheni were drained for cultivation (SHERIDAN 2001). The artificial drainage is likely to have had a positive feedback on the incision of streams, and was possibly even its sole cause.
In addition, removal of the topsoil cover and advanced subsoil erosion has reduced the infiltration and water retention capacity of the Mashewa catchment. With the decline of water retention capacity, runoff increases temporally, and the discharge regime becomes more seasonal A higher transport

160
capacity during seasonal runoff events combined with a reduced sediment load, as discussed for the establishment of the small backswamp at Lomwe, would have promoted stream incision.
The incision caused the lowering of the watertable, allowed cultivation on the now permanently dry Lomwe basin bottom and probably reduced the extent of the remaining swamp, although no direct impact is discernable from the pollen record itself.
161
10 ENVIRONMENTAL HISTORY OF NORTH PARE
The environmental history of the three Pare catchments was reconstructed on the basis of sedimentological, palaeopedological and palaeoecological research. This synthesis presents a model of landscape development for North Pare (Fig. 55 & Fig. 57) emphasising the anthropogenic impact and the importance of slow but cumulative clearance and erosion processes for triggering rapid landscape changes. Vegetation changes are discussed in the context of regional climate dynamics; however, their importance controlling environmental change during the last 2000 years is questioned.
10.1 Late Pleistocene transition The Last Glacial Maximum (LGM) in East Africa was dry and cold climate (BARKER & GASSE
2003; KIAGE & LIU 2006; GASSE et al. 2008). The hydrological balance of most East African lakes was negative and the shallow, eastern rift valley lakes Manyara (HOLDSHIP 1976), Magadi (ROBERTS et al. 1993), Naivasha (RICHARDSON 1966; RICHARDSON & DUSSINGER 1986), and Bogoria (TIERCELIN et al. 1981) dried out or experienced marked low stands. Severe drought is reported from Lake Victoria, which desiccated completely (TALBOT & LÆRDAL 2000; STAGER et al. 2002). Lake levels of the deep Western Rift Valley lakes Tanganyika (FELTON et al. 2007), Albert (BEUNING et al. 1997), and Turkana (OWEN et al. 1982) fell considerably. Dry and cold conditions between ~24 ka and ~14 ka BP were interrupted by short periods of wetter climate recorded by lake transgressions at Lake Victoria and Lake Albert. Pollen records confirm a dry and cold Last Glacial Maximum (JOLLY et al. 1997; KIAGE & LIU 2006). Expansion of grasslands are recorded at numerous sites for example at Lake Naivasha (MWORIA MAITIMA 1991) as well as in the Burundi highlands (BONNEFILLE & RIOLLET 1988). From the Kashiru swamp, Burundi, BONNEFILLE et al. (1990) reconstructed a temperature decrease of about 4.2°C and precipitation drop of 30% during the LGM.
The oldest terrestrial archive in North Pare is the Lomwe slope deposit (cf. Fig. 55). The organic matter rich buried topsoils evidence a prolonged phase of morphological stability during the heights of the LGM. Charcoal fragments from the buried soil record fire events during the glacial dry period (19.5 - 18.9 ka BP and 18.5 - 17.7 ka BP), but it is the radiocarbon date of soil organic matter (14.9 � 13.9 ka BP) that is interpreted to give a maximum age for slope instability leading to the burial of the late Pleistocene land surface (chapter 9.4.1).
A montane forest environment prevailed at Pare during dry glacial times. Thickness, organic matter content, and stable carbon isotope composition of the buried soil at Lomwe resemble humus rich, umbric forest soils under montane forest vegetation. Persistence of montane forest vegetation during the LGM is in accordance with palaeoecological studies at Dama swamp (2100m a.s.l.) in the Udzungwa (MUMBI et al. 2008) and Deva-Deva (2600m a.s.l.) in the Uluguru Mountains (FINCH et al. 2009). At both of these sites, vegetation composition of the investigated upper montane forests remained stable throughout the major climatic fluctuations of the LGM. The stability of upper montane forests of the Eastern Arc Mountains contrasts with distinct downward shifts of the subalpine, ericaceous belt inferred from buried topsoils between 2000 and 3000m a.s.l. on Mount Kilimanjaro (ZECH 2006). Here black organic matter rich palaeosols are interpreted as having developed under ericaceous vegetation, which extended downslope during cold and dry phases of the LGM, the Younger Dryas, and Holocene dry spells. A recent downward shift of the subalpine, ericaceous vegetation belt on Kilimanjaro has been attributed to increased fire frequency stimulated by
162
decreasing precipitation in the course of global warming (HEMP 2005, 2009). Increasing fires during former dry phases might have played a similar role leading to the depression of vegetation belts on Kilimanjaro, whereas the impact of fire was probably buffered by smaller areas of subalpine heathlands on the lower and smaller Eastern Arc Mountains. Temperature-driven depression of altitudinal vegetation belts during the LGM (ZECH 2006) are likely to have stabilised montane forests at mid-altitudes between 1200 and 2000m a.s.l. in Pare, where climatic and ecological conditions remained stable despite the extreme dryness of the LGM and allowed a closed montane forest to prevail, albeit disturbed by occasional forest fires.
Slope instability around 14.9 - 13.9 ka BP at Lomwe coincides with the first phase of climatic amelioration and precipitation increase in East Africa. The transition from the LGM to the warm and humid climate of the early Holocene started around 15 � 14 ka BP (GASSE et al. 2008) and took place in several steps, interrupted by climatic drawbacks such as the Younger Dryas (12.8 � 11.5 ka BP). Lake levels at Lake Victoria (STAGER et al. 2002) and Lake Albert (BEUNING et al. 1997) rose between 15 � 14 ka BP and the White Nile flow reassumed (WILLIAMS et al. 2006). By about 10 ka BP, lake level high stands are reported from most of the eastern Rift Valley lakes (GASSE 2000; BARKER & GASSE 2003; GASSE et al. 2008).
The rapid climatic transition from dry and cold glacial conditions to the moist and warm climate had considerable impact on the mobilisation and transport of sediments. The time lag between climatic change, precipitation and temperature increase on the one hand, and the retarded reorganisation of the vegetation adjusting to the new environmental conditions on the other, are often stressed to explain erosion pulses, especially at the end of the LGM (THOMAS 1994; THOMAS & THORP 1995). Generally, the delayed re-establishment of closed (forest) vegetation results in a temporal disequilibrium of the climate � vegetation system producing enhanced runoff and leading to soil erosion as the land surface adjusts to the new external driving forces. Enhanced geomorphologic activity during the transition phase of rapid climatic change at the beginning of the Holocene is recorded in several terrestrial archives for example from Zambia (THOMAS 2001b), the Eastern Congo (RUNGE 2001a) and Central Tanzania (ERIKSSON et al. 2000). However, slope instability at this time was not spatially comprehensive as no enhanced slope deposit formation was observed at the long-term record from Mindu Mountains in Central Tanzania (SØRENSEN 2001).
In central Tanzania, the footslope of the semi-arid Irangi hills (Kondoa) are covered by several layers of extensive pedisediments, recording distinct phases of soil erosion (ERIKSSON et al. 2000). The earliest phase of erosion and hillwash deposition dates between 14.5 and 11.4 ka BP and is roughly contemporaneous with the inferred slope instability in Pare. Currently semi-arid, a strongly reduced vegetation cover can be assumed for the Irangi hills during the LGM offering little protection against erosive rainfall events during the transition to a wetter climate. For the semi-humid North Pare upland (1300m a.s.l.) on the other hand, montane forest vegetation has been proposed. Under a closed forest canopy, precipitation increase, although abrupt, is unlikely to have provoked enhanced soil erosion. Alternatively, increased precipitation and soil moisture could have resulted in local slope instability and mass wasting events such as slumping or landslides. The homogeneity of the deposits, however, excludes mass wasting processes as relief forming factors at Lomwe. Tectonic activity is a further possible cause of slope instability along the Pangani Graben. However, in the absence of any strong indications for earthquake induced mass movement, climate dynamics are the mostly likely trigger.
Although the exact mechanisms are not fully understood, climatic fluctuations during post-glacial warming and wetting stages are the most likely natural drivers of slope instability. Short-lived climatic

163
fluctuations may have played a major role by temporarily opening up the forest cover or promoting fires and creating conditions suitable for erosion and the burial of former surface soils. The restriction of the LGM soils to only one of the three study areas puts late Pleistocene slope instability into perspective as localised disturbance cannot be conclusively ruled out.
10.2 Early Holocene surface stability So far, no dated sediments of the early and mid-Holocene have been recovered in North Pare. The
buried land surface at Mrongo and Usumbwe dates to around 2000 BP. Its buried soils are deep (2 to 3m), and have developed in situ over subsoils with increasing gravel content and weathered rock fragments. The overlying late Holocene deposits (4 � 9m) have smoothed the land surface and levelled a much more accentuated mid-Holocene mountain relief of narrow valley bottoms and steep slopes. The lack of early to mid-Holocene slope deposits is explained by either landscape stability under closed (forest) vegetation or by an erosional hiatus preceding the late Holocene accumulation phase.
During the moist and warm climatic optimum of the early Holocene, high lake level stands (GASSE 2000) and forest expansions are reported throughout East Africa (HAMILTON 1982; KIAGE & LIU 2006). Evergreen forest expanded around Lake Victoria (KENDALL 1969), and at Lake Naivasha an increase in tree pollen indicates downward expansion of montane forests in the Central Rift Valley (MWORIA MAITIMA 1991). A continuous history of montane forest vegetation is reported from the Eastern Arc Mountains. According to palaeoecological studies at Dama and Deva-Deva swamps, montane forests between 2000 and 2600m a.s.l. remained stable throughout the Glacial Maximum and the early Holocene (MUMBI et al. 2008; FINCH et al. 2009). Given widespread forest expansion during the warm and moist early Holocene, it is reasonable to assume a continuous montane forest environment in the North Pare upland.
In Rwanda, slope creep has been identified as the predominant geomorphological process of the early Holocene, where MOEYERSONS (2001) proposes that high water tables and increased soil moisture facilitated slope creep and slow flow of the deeply weathered surface mantle, and that large scale soil creep processes took place. Over time, the slope creep bulged into the valleys eventually narrowing and damming them. The slow early Holocene slope creep accentuated the characteristic convex slope forms of the Rwandan bas-fonds. In the comparable North Pare environment, no evidence for such widespread slope creep has been observed. Asymmetry of tectonically derived valley forms and partial infilling of the valley bottoms suffice to explain the occurrence of steep slopes in North Pare.
10.3 Mid‐Holocene aridity?
Hydrological changes during the mid-Holocene might have affected the Pare highland. From about ~8 ka BP on precipitation and lake levels in East Africa declined during several drying steps (GASSE 2000; JUNG et al. 2004). The timing of these drying events varies regionally but appears to be triggered by abrupt and short lived droughts around 8.2, 5.2 and ~4 ka BP recorded by dust peaks in the Kilimanjaro ice cores (THOMPSON et al. 2002). The latest and most profound climatic change occurred around 4 ka BP, when declining northern summer insolation crossed a threshold and non-linear feedback processes led to the end of the African Humid Period, the onset of increasing aridity in northern Africa, and the desiccation of the Sahara desert (DEMENOCAL et al. 2000a; DEMENOCAL et al. 2000b). Throughout East Africa, lake levels declined (MARCHANT & HOOGHIEMSTRA 2004) and

164
seismic stratigraphy of Lake Challa records three prolonged low stands with ponded sedimentation during the mi-Holocene (8�6.7, 5.9�4.7, and 3.6�3.0 ka BP; VERSCHUREN et al. 2009). Similarly, a strong dry phase is recorded around 3.8 BP at Lake Manyara (HOLDSHIP 1976). Lake levels declined in the Naivasha basin from 5 ka BP onward and the three present day lakes Nakuru, Elmentaita and Naivasha separated. The most severe dryness and desiccation of the Crescent Island Crater lake occurred after 3 ka BP (RICHARDSON & DUSSINGER 1986) but before c. 1865 - 1605 BP (VERSCHUREN 2001).
Mid-Holocene drought also affected vegetation cover in most of Central Africa and East Africa (MARCHANT & HOOGHIEMSTRA 2004), where decreasing precipitation, recurrent droughts and a shift to a more seasonal rainfall pattern since about 4 ka BP have been identified as causing the increase of drought tolerant taxa, the spread of semi-deciduous forests (TAYLOR 1993; TAYLOR & MARCHANT 1996), and the spread of swamp forests (TAYLOR 1990). Palaeoecological evidence for aridity, however, is limited in Kenya and Tanzania. Altitudinal shifts of the savannah � montane forest boundary are reported from the Mau escarpment in the Central rift valley in Kenya. AMBROSE (1986) observed a strong increase of stable carbon isotope composition (~7�) in the subsoil of current forest soils between 2000 and 3000m a.s.l. Albeit relying on a single (and quite young) minimum age for soil formation (soil organic matter), AMBROSE (1986) proposes an altitudinal upwards migration of the savannah-forest boundary of about 300 to 500m during the mid-Holocene dry phase. Climatically induced forest retreat in Pare would have started on the escarpment and in dry habitats, with shallow slope and ridge locations being the first to open up and be exposed to erosion.
Whilst no slope deposits are recorded from the mid-Holocene, undated sands recorded below late Holocene peat deposits in valley bottom locations might be related to mid-Holocene material translocation (observed at Lomwe swamp, Mrongo swamp (data not presented) and at Usumbwe 3). These sterile sands (>50cm thick) represent the base of recovered sediments in the valley bottom. Sandy bottom sediments in upland valleys are also reported from bas-fonds in a similarly fossilised Tertiary landscape near Butare in southern Rwanda (GRUNERT et al. 2004; KERSTING 2010), while mid-Holocene erosion is inferred from buried soils at Kesubo floodplain, Kenya (DRIESE et al. 2004). KERSTING (2010) links the sandy bottom sediments to erosion during the mid-Holocene dry period. Strong seasonal precipitation events in an open landscape caused enhanced sheet wash processes on the slopes and the deposition of sands in the valley bottom. Near the study area, the sediments of Lake Challa show three distinct mid-Holocene lake level lowstands as well as occasional mass-wasting events (VERSCHUREN et al. 2009). Swamps of higher altitudes in the Eastern Arc Mountains (Dama, Deva-Deva, Kwasebuge) targeted for palaeoecological studies present continuous sedimentation histories as far back as the Pleistocene and do not show mid-Holocene slope instability (MUMBI et al. 2008; FINCH et al. 2009; FINCH et al. in prep.).
Additional evidence for an erosion period in Pare is inferred from stratigraphic inconsistencies of the slope deposits. Not only sands under late Holocene peats, but also truncation of the late Holocene surfaces (Mrongo 2, Usumbwe 1 & 2, and Lomwe 3) and particularly the thin late Pleistocene deposit at Lomwe, combined with the lack of a distinct deposition unit linked to the mid-Holocene charcoal fragment at Lomwe, all suggest an erosional hiatus directly preceding the accumulation of anthropogenic deposits (cf. chapter 9.4.2). Instead of being related to mid-Holocene erosion events, stratigraphic evidence suggests that truncation took place during the initial erosion pulse triggered by anthropogenic land clearance.

165
Fig. 55: Holocene landscape development at Lomwe, North Pare.
166
The present study can neither substantiate nor rule out soil erosion and accumulation of sandy bottom sediments during the mid-Holocene. The causation and age of the sandy bottom sediments as well as their subsequent partial entrainment warrants further investigation. The lack of dated mid-Holocene sediments and considering that more benign climatic conditions prevailed during the mid-Holocene than during the LGM, it is reasonable to assume that stable landscape conditions and a montane forest prevailed during the early and mid-Holocene in the mid-altitudes of North Pare.
10.4 Late Holocene, anthropogenic landscape development
The late Holocene has seen major environmental changes as well as socio-economic transformations. The reconstruction of landscape development in North Pare based on terrestrial archives at Usumbwe, Mrongo and Lomwe reveals four major stages of landscape change (Fig. 55 & Fig. 57): 1. Onset of soil erosion and accumulation of colluvial slope deposits since 300 BC - AD 500 concurrent with the occurrence of Early Iron Age (EIA) pottery; 2. Valley damming and wetland establishment between AD 600 and AD 1200; 3. Widespread forest clearing and catchment wide soil erosion since the 12th century; 4. A change to an erosion-deposition regime characterised by runoff-based erosion in the 15th century AD signalling increasingly severe land degradation as evidenced by subsoil erosion.
10.4.1 Early Iron Age settlers and onset of soil erosion (3thc. BC � 6thc. AD)
Hillwash and accumulation of corresponding slope deposits dating between 400 � 110 BC (Mrongo 10), AD 70 - 230 (Usumbwe 2), and AD 430 � 610 (Changuku 4) represent the most drastic environmental change recorded in the terrestrial archives over the last 20,000 years. The onset of enhanced and sustained soil erosion in Pare falls into a time of socio-economic and cultural change in East Africa. During the first millennium BC, food production in East Africa underwent a substantial transformation. After a prolonged standstill in Northern Kenya, herding began to spread into areas that now fall in Tanzania (BOWER 1991; GIFFORD-GONZALEZ 1998; KAREGA-MUNENE 2003). Only a few centuries later roughly around 500 BC agricultural food production and iron working emerged in the Great Lakes Region (CLIST 1987; SCHMIDT 1997b). The spread of agriculture and iron working in East Africa was formerly explained by migration of Bantu speaking populations from their assumed secondary dispersal centre within the Interlacustrine region, though this view has been modified more recently to stress a spread of ideas, technologies and languages rather than a migration of people per se (SCHOENBRUN 1993a; EHRET 2001; EGGERT 2005). Mainly based on linguistic research, these new subsistence strategies such as mixed farming and herding systems now appear to have developed as a consequence of cultural contact of different population groups, each with its own set of crops and technologies (SCHOENBRUN 1993a; LANE 2004). Although zooarchaeological and archaeobotanical data is limited (although see LANE et al. 2007), this change in subsistence practices is reflected in the material culture evidence through the recognition of distinct ceramic styles and manufacturing techniques associated with Early Iron Age agriculturalists such as Urewe ware from the Ugandan highlands and around Lake Victoria (KIRIAMA 1993; ASHLEY 2010).
In north-eastern Tanzania, the advent of agriculture is commonly inferred from the distribution of Kwale ware, a pottery type related to the interlacustrine Urewe ware (SOPER 1967a). Although such correlations between pottery types and particular subsistence techniques has been questioned for this area and period (PHILLIPSON 1977), occupation sites including Kwale ware and iron smelting sites
167
dating to the early centuries AD are recorded in the Usambara Mountains (SCHMIDT 1988) and on the foothills of the South Pare mountains (SOPER 1967b). In the present study, Early Iron Age pottery was recovered from slope deposits dated to AD 430 � 610 (Mrongo 4) and 260 � 570 AD (Changuku 4). Potsherds and the accumulation of slope deposits confirm the presence of Early Iron Age populations and suggest agricultural land use in North Pare since 300 BC - 600 AD. The present work supports early occupation and settlement of forested mountain environments (SCHMIDT 1989) in contrast to earlier assumptions made by SOPER (1967b) and FOSBROOKE (1957) that Early Iron Age people settled predominantly on the footslopes and only later migrated to the highlands (see also AMBROSE 1984). Initially, forest clearing and farming in the upland probably concentrated on favourable and level terrain along the valley footslopes and depressions on the slopes. During this initial phase of occupation swidden agriculture may well prevailed. After slash-and-burn, disturbed forests and fallow fields had time to recover and develop into secondary forests. Forest recovery allowed topsoils to recuperate and soil erosion was intermittent and localised.
Iron tools enhanced the efficiency of slash-and-burn practices to create clearings for crop production, and fuel demand for iron working further increased the pressure on the forest resources. Whereas various taxa were used for fuel in the early years of iron smelting in the Buhaya region at Lake Victoria, later centuries witnessed a much more selective firewood extraction (SCHMIDT 1997a). Either way, the fuelwood demand contributed to forest clearance, removing locally the protective vegetation cover and exposing forest soils to erosion. The temporal coincidence between the onset of enhanced soil erosion and the advent of new ways of food production involving and depending on the transformation of the ecological environment strongly suggests a causal link.
A phase of inferred aridity in East Africa around 2000 years ago has been reported (Fig. 56), but this event is not thought to be the cause of prolonged soil erosion in Pare. Water levels of Rift Valley lakes fell at the same time as indications of anthropogenic land clearance and soil erosion appear in the pollen records. Most palaeoecological studies therefore emphasise the difficulty of distinguishing between anthropogenic and climatic induced vegetation change during the last three millennia. Low lake levels are indicted by high magnesium concentration in the sediments of Lake Edward (RUSSELL & JOHNSON 2005) and by ostracode distributions of Lake Tanganyika (ALIN & COHEN 2003). Lake Naivasha desiccated completely prior c. 1865 - 1605 BP (VERSCHUREN 2001) and BIT-indices are interpreted as indicting erosion around 2 - 1.6 ka BP at Lake Challa (VERSCHUREN et al. 2009). With the exception of Lake Naivasha, which apparently dried out completely (see RICHARDSON & DUSSINGER 1986 for a possibly older date of 3000 BP for lake desication), the drought period around 2000 BP was not exceptional compared with other much more abrupt and prolonged droughts during the Holocene. Specifically, none of the strong drought periods recorded by ponded sedimentation at Lake Challa (VERSCHUREN et al. 2009), analcime formation at Lake Manyara around 3.8 ka BP (HOLDSHIP 1976) or the dry spells of 8.3, 5.2 and ~4 ka BP recorded in the glaciers of Mount Kilimanjaro (THOMPSON et al. 2002) had severe environmental impacts on the Pare landscape and do not appear to have resulted in soil erosion or formation of slope deposits in the Pare uplands.
Sustained soil erosion in Pare continued despite subsequent climatic amelioration without cessation up to the present. Precipitation decline around 2000 BP is unlikely to have caused a strong enough reduction of vegetation to prompt and maintain high levels of soil erosion during the fluctuating climatic conditions of the following two millennia. Climatic fluctuations like the well-documented drought periods around the beginning of the Common Era, the Medieval Warm Period or the Little Ice Age are likely to have influenced and perhaps probably amplified - but not initially caused - slope
168
instability and soil erosion. Instead of directly causing environmental change, droughts may have stimulated the human occupation of well-watered mountain environments. Additionally, climate-induced vegetation stress and the promotion of forest fires during arid conditions would have enhanced the efficiency of slash-and-burn practices for forest clearance. The advent of sedentary agriculturalists with their new suit of subsistence strategies remains the crucial factor to explain the distinct and long-lasting impact of late Holocene soil erosion on the Pare landscape.
During the first millennium BC, human presence becomes more and more apparent in the environmental archives, as people began to consciously exert changes to the East African environment. Discerning between human activity and climatic or ecological driving forces in pollen records from Africa is hampered by the absence of distinct pollen from domesticated indigenous crops and hence a reliance on indirect evidence from increasing pollen from weeds and secondary vegetation. Changes in the floristic composition have been picked up early in palaeoecological records from the Rukiga Highland in southern Uganda. Expansion of secondary vegetation at the expense of forest started around 2500 BP (TAYLOR 1990; TAYLOR et al. 1999), contemporaneous with the early dates for iron smelting in the broader region recorded by CLIST (1987). At Lake Masoko in southern Tanzania increased burning, the expansion of grasslands, and the presence of Ricinus communis pollen, is interpreted as forest clearance by humans from about AD 400 (VINCENS et al. 2003).
Whereas pollen-based studies seem to pick up likely anthropogenic changes in the vegetation cover, direct evidence for anthropogenic landscape change based on terrestrial archives is observed only several centuries later. Severe soil erosion as a result of land clearance, farming and iron smelting is inferred from the deposition of limonite nodules in Lake Ikimba around AD 450 - 500, and is accompanied by a decrease of arboreal pollen (LASESIKI 1983 in SCHMIDT 1997b). At Gaseke, in the Butare region of Rwanda, deep (up to 4 m), loamy valley deposits accumulated after about 1500 BP and overlie undated mid-Holocene sandy sediments. KERSTING (2010) suggests that the expansion of Bantu speaking farmers and concomitant change in subsistence practices prevented natural reforestation after the end of the mid-Holocene dry phase. Higher precipitation levels during the late Holocene and a reduced vegetation cover resulted in increased runoff and hence the deposition of loamy sediments in the valley bottoms. The rich archaeological record from the Interlacustrine region has shown Early Iron Age furnaces dating back to the middle of the first millennium BC (CLIST 1987; SCHMIDT 1997a). Compared to the early adoption of farming and iron working between the Great Lakes, landscape modification and soil erosion at Butare and Lake Ikimba commenced late. This can be explained as during early periods of settlement, occupation sites and anthropogenic impact are localised and dispersed. Similarly, terrestrial sediments are site-specific archives and only allow accurate reconstruction of such local environmental histories. Thus, a number of sites are required to establish a reliable and comprehensive regional chronology. The spatially and temporally limited significance of local swamp archives has been shown by the distinct timing of the imprint of human land use on three adjacent swamps in a small area of the Rukiga Highlands in Uganda (TAYLOR & MARCHANT 1996).
In North Pare the onset of soil erosion and inferred human agricultural land use spans several centuries between roughly 300 BC and AD 500. Based on three radiocarbon dates from two neighbouring catchments, the large age range shows the variability of deposition histories on a local scale. Given the wide temporal range of the dates, it is imprudent to select a fixed date for the beginning of significant anthropogenic landscape transformation. On the other hand, the progressively younger burial ages along the footslope at Mrongo and Usumbwe reflect the spatial dynamic of colluviation starting near the break of slope and advancing forward into the valley bottom (chapter
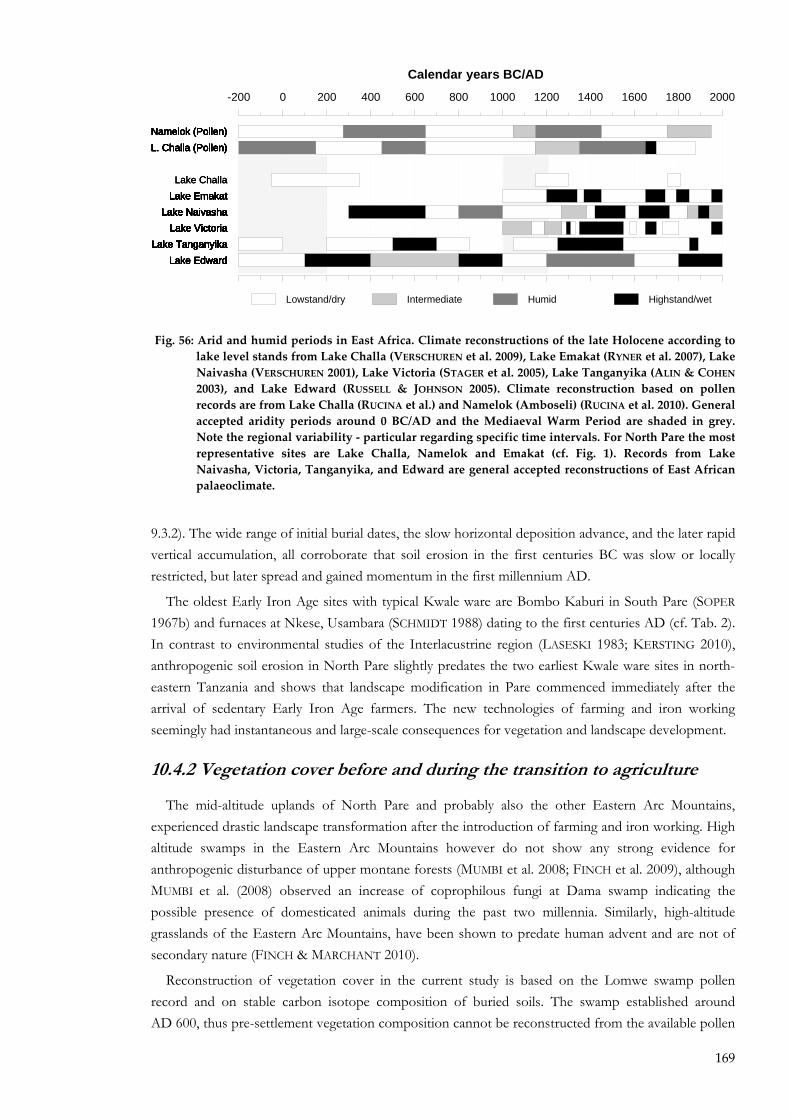
169
9.3.2). The wide range of initial burial dates, the slow horizontal deposition advance, and the later rapid vertical accumulation, all corroborate that soil erosion in the first centuries BC was slow or locally restricted, but later spread and gained momentum in the first millennium AD.
The oldest Early Iron Age sites with typical Kwale ware are Bombo Kaburi in South Pare (SOPER 1967b) and furnaces at Nkese, Usambara (SCHMIDT 1988) dating to the first centuries AD (cf. Tab. 2). In contrast to environmental studies of the Interlacustrine region (LASESKI 1983; KERSTING 2010), anthropogenic soil erosion in North Pare slightly predates the two earliest Kwale ware sites in north-eastern Tanzania and shows that landscape modification in Pare commenced immediately after the arrival of sedentary Early Iron Age farmers. The new technologies of farming and iron working seemingly had instantaneous and large-scale consequences for vegetation and landscape development.
10.4.2 Vegetation cover before and during the transition to agriculture
The mid-altitude uplands of North Pare and probably also the other Eastern Arc Mountains, experienced drastic landscape transformation after the introduction of farming and iron working. High altitude swamps in the Eastern Arc Mountains however do not show any strong evidence for anthropogenic disturbance of upper montane forests (MUMBI et al. 2008; FINCH et al. 2009), although MUMBI et al. (2008) observed an increase of coprophilous fungi at Dama swamp indicating the possible presence of domesticated animals during the past two millennia. Similarly, high-altitude grasslands of the Eastern Arc Mountains, have been shown to predate human advent and are not of secondary nature (FINCH & MARCHANT 2010).
Reconstruction of vegetation cover in the current study is based on the Lomwe swamp pollen record and on stable carbon isotope composition of buried soils. The swamp established around AD 600, thus pre-settlement vegetation composition cannot be reconstructed from the available pollen
Lake EdwardLake EdwardLake EdwardLake EdwardLake EdwardLake EdwardLake EdwardLake EdwardLake TanganyikaLake TanganyikaLake TanganyikaLake TanganyikaLake TanganyikaLake TanganyikaLake TanganyikaLake TanganyikaLake TanganyikaLake TanganyikaLake TanganyikaLake Tanganyika
Lake VictoriaLake VictoriaLake VictoriaLake VictoriaLake VictoriaLake VictoriaLake VictoriaLake VictoriaLake VictoriaLake VictoriaLake VictoriaLake NaivashaLake NaivashaLake NaivashaLake NaivashaLake NaivashaLake NaivashaLake NaivashaLake NaivashaLake NaivashaLake NaivashaLake NaivashaLake Naivasha
Lake EmakatLake EmakatLake EmakatLake EmakatLake EmakatLake EmakatLake EmakatLake EmakatLake EmakatLake EmakatLake ChallaLake ChallaLake Challa
L. Challa (Pollen)L. Challa (Pollen)L. Challa (Pollen)L. Challa (Pollen)L. Challa (Pollen)L. Challa (Pollen)L. Challa (Pollen)L. Challa (Pollen)Namelok (Pollen)Namelok (Pollen)Namelok (Pollen)Namelok (Pollen)Namelok (Pollen)Namelok (Pollen)Namelok (Pollen)
-200 0 200 400 600 800 1000 1200 1400 1600 1800 2000
Calendar years BC/AD
Highstand/wetIntermediateLowstand/dry Humid
Fig. 56: Arid and humid periods in East Africa. Climate reconstructions of the late Holocene according to lake level stands from Lake Challa (VERSCHUREN et al. 2009), Lake Emakat (RYNER et al. 2007), Lake Naivasha (VERSCHUREN 2001), Lake Victoria (STAGER et al. 2005), Lake Tanganyika (ALIN & COHEN 2003), and Lake Edward (RUSSELL & JOHNSON 2005). Climate reconstruction based on pollen records are from Lake Challa (RUCINA et al.) and Namelok (Amboseli) (RUCINA et al. 2010). General accepted aridity periods around 0 BC/AD and the Mediaeval Warm Period are shaded in grey. Note the regional variability ‐ particular regarding specific time intervals. For North Pare the most representative sites are Lake Challa, Namelok and Emakat (cf. Fig. 1). Records from Lake Naivasha, Victoria, Tanganyika, and Edward are general accepted reconstructions of East African palaeoclimate.
170
data. Generally, the first millennium AD is accepted to have been a relatively humid time (Fig. 56). Despite climatic conditions similar or wetter than today, the pollen record of the early phase of wetland establishment suggests semi-deciduous open woodland with sporadic occurrence of montane taxa, whereas present day forest fragments of the Pare plateau suggest humid lower montane forest vegetation. Three possible explanations are discussed to explain the under-representation of pollen from lower montane forests and the apparent absence of widespread humid forests in the first millennium AD.
First, the pollen signature of the submontane forests might be weak. Low pollen production or insufficient pollen dispersal can lead to a low pollen count of humid forest taxa. A literature review of published observations on pollen dispersal capacities (COETZEE 1967; HAMILTON 1972; HAMILTON 1982; MARCHANT & TAYLOR 1998) does not indicate any severe restriction on submontane forest taxa pollen production or dispersal in general. Consequently, the pollen signature probably accurately reflects the absence of submontane humid forest in the landscape surrounding the Lomwe swamp.
Second, the remaining forest fragments and sacred groves scattered throughout North Pare are not representative of the pre-farming vegetation cover of the mid-altitude upland. Humid lower montane forest was always restricted to sites with special ecological conditions or has even been created by human intention (GILLSON et al. 2003). Following this hypothesis, semi-deciduous woodland and thicket with floristic elements of the lowland savannah vegetation covered the North Pare upland during the first millennium AD. Dry woodland would have ascended the mountains, and humid forest was restricted to ecologically favoured refuges e.g. along streams. Thanks to cultural protection, these refugia of humid forest vegetation persisted until the present as sacred groves. However, present day forest fragments are scattered throughout North Pare on hilltops, slopes, and valley bottoms and are not restricted to particular humid environments. Dry woodlands as suggested might resemble vegetation found today on the comparatively arid Kiverenge hill and Mramba ridge dominated by taxa like Acacia, Commiphora, Combretum, Dodonea. But, even those two arid hilltops harbour a variety of dry forest taxa like Olea capensis, Brachyleana huillensis, Albizia, Newtonia buchananii, and Podocarpus (LOVETT & PÓCS 1993), which are absent from the impoverished pollen record of the first millennia AD. Finally, the intermediate to humid climate proposed for the first millennia AD (VERSCHUREN 2001; ALIN & COHEN 2003; RUSSELL et al. 2007; VERSCHUREN et al. 2009) does not support arguments for a dry woodland on the Pare plateau.
Thirdly, the lack of pollen reflecting a closed lower montane forest environment around AD 600 is the result of advanced anthropogenic transformation towards an open landscape. From terrestrial archives widespread forest clearance is inferred since the beginning of the Common Era. Following this scenario, the period of peat development at Lomwe swamp covers the post-clearance period, when submontane forest had been cleared substantially and open grass and bushland had begun to dominate. Scattered patches of secondary and remaining forest fragments prevailed and later obtained protection status as sacred groves. Such a fragmented landscape matches the pollen record: sporadic occurrence of typical montane forest taxa, but dominance of secondary vegetation and far-travelled woodland pollen from the plains. The latter probably encroaching upon the mountain slopes as a consequence of fires and favoured by changing microclimatic conditions following forest clearance.
Stable carbon isotope composition of buried topsoils at Mrongo show δ13C values (-21 - -23�) suggesting a mixed but C3-plant dominated environment. Although stable carbon isotopes do not allow assignment of vegetation types, δ13C reference values do allow exclusion of secondary bushland as well as semi-arid woodland and dry forests on the Pare slopes on the basis of their distinctly higher
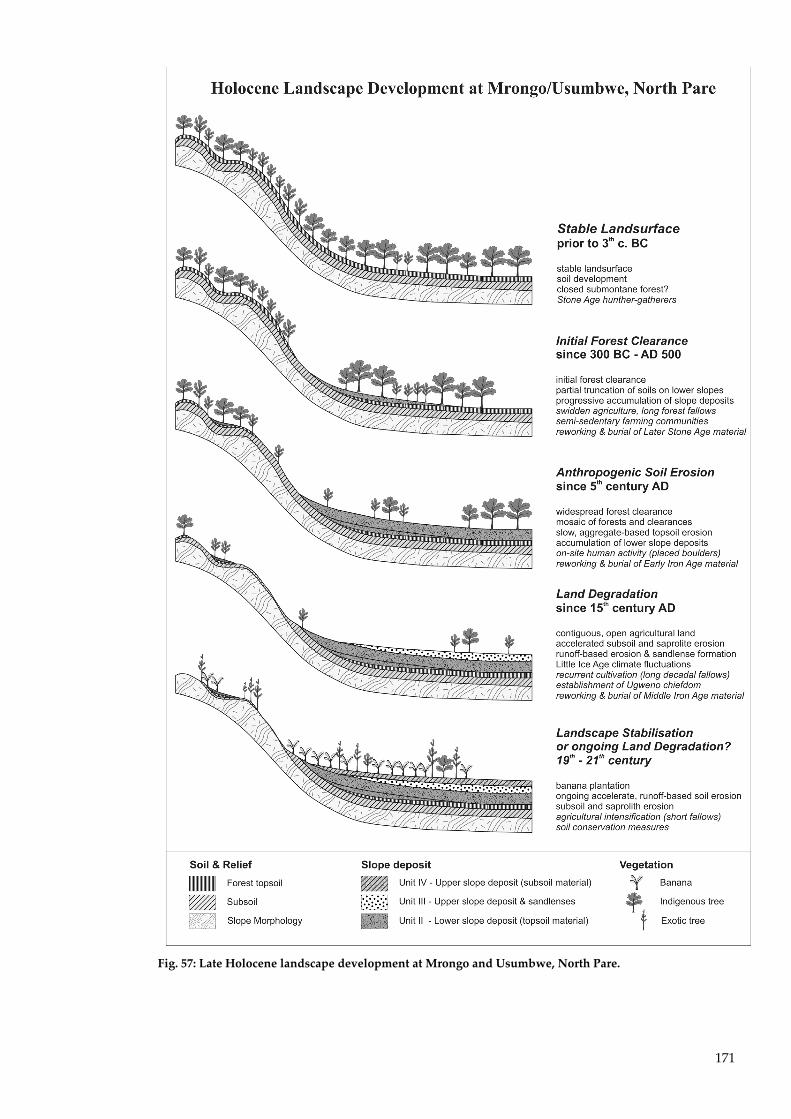
171
Fig. 57: Late Holocene landscape development at Mrongo and Usumbwe, North Pare.
172
δ13C values (Tab. 13). Taking into account isotopic fractionation shown to occur in present day forest
soils (chapter 8.5), it appears likely that the intermediate δ13C values of buried subsoil at Mrongo are derived from a (sub-) montane forest akin to present day Kwa Kirumbi. The tentative suggestion from stable carbon isotope data needs to be viewed with caution and does not definitely prove the assumption of a dense pre-agriculture forest cover such as conveniently assumed by NEWMARK (1998; 2002) and HALL et al. (2009), and questioned by GILLSON et al. (2003). However, in conjunction with the Lomwe pollen record, the increasing stable carbon isotope composition of the slope deposits does
indicate anthropogenic vegetation change in the first millennium AD and an opening up of a previous forest or woodland vegetation. At the time of swamp establishment, the original vegetation cover � probably a humid lower montane forest � has already been lost and was replaced by a mosaic of shifting agricultural fields and secondary forests of various succession stages dominated by woodland taxa, shrubs, and grasses as is reflected in both the pollen and the stable isotope record.
10.4.3 Wetland establishment and peat growth (6 � 12th century)
Generally, explanations of wetland formation invoke precipitation shifts and result in the reconstruction of regional climate dynamics. At Lomwe, peat establishment around AD 600 takes place in a period of intermediate climatic conditions that is generally assumed to be comparatively humid but which also spans the dry phase of the Medieval Warm Period (cf. Fig. 56). A climatic explanation could be stressed when linking the onset of wetland establishment at Lomwe with a short wet period in the mid-first millennium AD inferred from the nearest palaeoecological records at Lake Challa (RUCINA et al. in prep.) and Namelok (RUCINA et al. 2010). However, comparable climatic conditions have occurred several times during the Holocene as well as within the last two millennia, but have not resulted in similar wetland deposits.
Instead of climatic causes, anthropogenic soil erosion and the damming of drainage channels by the accumulation of corresponding deposits in the valley bottom are proposed as possible drivers of wetland formation at Lomwe. Rapid colluviation at crucial key locations of the Ndurumu stream could have acted as a barrier, effectively damming the small valley. Increased sediment load contributed to stream aggradation, additionally favoured by low slope gradients and low transport capacity of the small streams on the Pare plateau, thus preventing incision and clearing away of debris. In consequence, the water table of the valley rose and the Lomwe and Usangi swamps established. Instead of invoking ambiguous climate records, local human-induced morphological change is proposed to explain the abrupt onset of peat development around AD 600 at Lomwe.
New or re-establishment of swamps in cultivated mountain areas has rarely been documented in East Africa as most palaeoecological work focuses on undisturbed, high altitude swamps or crater lakes likely to provide records over long time intervals. However, wetlands are a common feature of flat valley bottoms not only in the intensively cultivated plateau zone of the Pare and Usambara Mountains but also in the highlands of Uganda and Rwanda. The proposed mechanism of anthropogenic soil erosion triggering the establishment of swamps can be tested there. Possible further humanly-made swamps might be found in the agricultural zone of Usambara, where three small wetlands surrounded by fields and settlements were investigated by MUMBI (2009). Similar to the Lomwe core, radiocarbon date reversals complicate the deposition histories and may point to anthropogenic disturbance, particularly as the establishment of all three wetlands is likely to have occurred within the last 300 years during a period of intensive human landscape transformation.
173
Few palaeoecological studies in East Africa discuss the causes of initial wetland establishment or link the pollen record and sediment stratigraphy to address the soil erosion history of the catchment. Although anthropogenically influenced and disturbed archives might be difficult to interpret, sediment stratigraphy offers important insights in settlement and land use histories, particularly useful for geoarchaeological research.
10.4.4 Catchment wide soil erosion (since the 12th century)
Initially a shallow swamp with small trees and or bushes, the Lomwe wetland developed into a papyrus swamp as concordantly shown by plant remains and high δ13C values indicating dominance of C4 swamp plants like Cyperus papyrus. At the same time, deposition of clay lenses free of organic matter indicates increased periodic flooding. Although the exact chronology of the swamp deposits is hampered due to the admixture of old reworked carbon, rapid burial by eroded hillwash sediments occurred after AD 1200 and may even be linked to later slope deposition formation discussed in chapter 10.4.5). With the onset of mineral deposition, tree pollen vanishes completely, whilst disturbance indicators and taxa typical for open secondary bushland dominate the pollen record. This indicates that most of the catchment was cleared and forests were replaced by non-arboreal secondary vegetation or cultivated land. Both the pollen and the sediment record suggest catchment wide forest clearance as a precondition for the observed hydrological change and the shift in the erosion/deposition regime. Soil erosion is no longer restricted to a single slope or confined to temporary clearances within a mosaic of regrowing secondary forest such as assumed for the early phase of cultivation. Instead, fields and clearings have merged and the lack of vegetation boundaries along longer and contiguous slopes initiated a higher energy erosion regime with strong runoff events. The eroded soil material is no longer relocated locally on the slope or deposited on the footslope but transported into the receiving Mashewa stream and finally deposited in the Lomwe basin.
The anthropogenic land degradation outlined above was enhanced by climatic change at the beginning of the second millennia AD. Between AD 1000 and 1270 a prolonged lowstand is reported from Lake Naivasha (VERSCHUREN et al. 2000; VERSCHUREN 2001). Roughly contemporaneous with the Medieval Warm Period (MWP, AD 800 - 1200) of temperate regions, this drought period is also recorded as a lowstand at Lake Challa (VERSCHUREN et al. 2009) and Lake Emakat (RYNER et al. 2007). Low stands are also reported from Lakes Tanganyika (ALIN & COHEN 2003) and Edward (RUSSELL & JOHNSON 2005), although palaeoecological work suggests asynchronicity or even an opposing trend for the Ugandan highlands (ROBERTSHAW et al. 2005; SSEMMANDA et al. 2005). Although prolonged and regionally significant, the magnitude of approximately two hundred years of more arid conditions was not as pronounced as preceding mid-Holocene aridity phases e.g. around 2000 BP, when lake desiccation at Lake Naivasha has been observed.
In palaeoecological studies, the MWP has rarely been picked up - exceptions being the Amboseli basin and Lake Challa. At Namelok swamp a short period of abundant pollen from grasses and savannah taxa accompanies a decline in Syzygium (RUCINA et al. 2010), whereas at Lake Challa the exposed lake bed was invaded by Cyperaceae and Poaceae (RUCINA et al. in prep.). Although palaeoecological evidence from nearby sites support a dry MWP, climate fluctuations during the MWP alone cannot be held responsible for the observed strong vegetation change, particularly the total absence of arboreal taxa in a montane environment, and can explain neither the abrupt onset nor the prolonged deposition of mineral material at Lomwe. Prolonged aridity debilitates the resilience of ecosystems and thus the MWP may have facilitated and enhanced the effect of anthropogenic land
174
degradation but did not cause environmental change at Lomwe. Against the background of a more arid climate, progressive anthropogenic forest clearance and opening up of the vegetation cover around AD 1200 pushed the ecological system of the Lomwe watershed beyond an ecosystem immanent threshold, and severe soil erosion and material discharge set in.
10.4.5 Accelerated and runoff-based soil erosion � the legacy of past land
degradation? (15th to 19th century)
In the 15th century, processes of erosion and deposition on the Pare slopes changed. Thus far relocation of soil material occurred principally by tillage erosion, rainsplash and overland flow (cf. chapters 8.6 & 9.3.2). However, on the turn of the 14th to the 15th century (between AD 1340 and AD 1470) runoff-based erosion becomes important at the same time as deposition rates start to increase. Three factors are thought to control the changing erosion and deposition regime: magnitude and pattern of precipitation, changes in cultivation techniques and land use intensity, and crossing of ecological thresholds as a consequence of cumulative effects of land degradation arising from prolonged forest clearance and past soil erosion.
Accelerated and runoff-based erosion is inferred from sand lenses recorded in the slope deposits, indicating differential transport and deposition of coarse particles, typical for sheet wash and rill erosion. A precondition for sheet wash and rill erosion is runoff concentration, which is enhanced by strong precipitation and reduced infiltration. Strong but infrequent rainfall events under a seasonal rainfall regime favour runoff production, rill erosion, and hence sand lens formation. Infiltration capacity on the other hand depends on the cultivation technique, crop types, slope length, and roughness, but particularly on topsoil properties such as soil structure, bulk density, and abundance of macro pores.
In the study areas, centuries of slow soil erosion have reduced soil depth substantially. Frail porous topsoil material has been eroded away and subsoils are exposed and now subject to mobilisation as shown by decreasing magnetic susceptibility values of the correlated deposits. Infiltration capacity of exposed subsoil horizons is considerably reduced due to a high packing density, a compact soil structure, and a low pore volume of subsoils. Forest clearance and the establishment of large, contiguous fields facilitate runoff production by increasing source area, slope length, and by reducing the number of temporary sediment traps such as small forests fragments. Farming practices such as mulching, organic matter incorporation and the choice of crop types also influence infiltration capacity and runoff production. However, sand lenses and hence rill erosion have been observed on bare fields, on maize fields, and under dense banana plantations, suggesting other parameters are more decisive.
The combination of reduced infiltration capacity due to topsoil erosion and subsoil exposure, changing land use practices such as the establishment of larger contiguous fields and reduced fallow periods (cf. chapter 8.6), all play together resulting in enhanced soil erosion rates and runoff based material transport. After fifteen centuries of slow but progressive forest clearance and topsoil erosion, soil erosion crossed an environmental threshold and a new set of processes took over. Subsoil exposure and increased runoff are the first obvious consequences of irrevocable land degradation after centuries of unnoticed resource depletion.
Following oral accounts, the history of the present day Wagweno people commenced when the mythical founder migrated to Pare after being expelled for food theft from the Taita mountains (KIMAMBO 1969). Being oral traditions, these narratives need not be taken literally and certainly need
175
not refer to wholesale migration of communities or clans but instead may reflect the creation of a cultural Wagweno identity. Nevertheless, explicit reference to food insecurity - as with many later migrations � may indicate migrations as a consequence of famine and possible climatic droughts (KIMAMBO 1969). Based on oral histories, KIMAMBO (1969) reports that major socioeconomic change in North Pare occurred about 16 generations ago and estimated this cultural transition to fall in the late 15th or early 16th century. Although WINTER (1992) has questioned Kimambo�s chronology on the grounds that some Pare genealogies appear to treat male siblings as different generations, the rough temporal correspondence between the changing erosion regime and the emergence of a new organised and hierarchical society might be more than mere coincidence and warrants discussion. The shift in economic and political power and the establishment of Wasuya rule marked the emergence of a hierarchical society characterised by labour division, a strong kinship based organisation and a politically instrumentalised initiation ceremony. Strong labour division and a tribute system point to organised resource exploitation, and this could conceivably lead to an increasing pressure on the shifting cultivation cycle, reducing fallow periods and encouraging encroachment on forests and secondary vegetation.
If so, the reorganisation of society and land use practices might have had serious consequences on the Pare environment. While an intensification of land use is likely, long fallow periods must have prevailed on the studied footslopes to allow sand lenses to be buried and preserved (cf. chapter 8.6). However, long fallow periods up to several decades might still represent an intensification stage compared to previous periods of swidden agriculture, when fields were left open to be overgrown by secondary forests. Since the 15th century, recurrent cultivation of the same field but with long decadal fallow periods is proposed. This practice agrees with the sedimentological evidence of sand lens preservation and accelerated erosion and fits with concurrent cultural transformation proposed by historical research (KIMAMBO 1969).
The emergence of a stratified society and organised resource exploitation in the 15th/16th century as suggested by KIMAMBO (1969) could have triggered land use intensification and shorter fallow periods. In this context, it is noteworthy to emphasise the selective nature of the impact cultural transformation may have on the environment. The spread of TIW wares since 5th century AD along the coast (CHAMI 1994) and the later occurrence of Maore ware in the Pare Mountains has often been hypothesised to relate to cultural change (e.g. SOPER 1967b) but is not reflected in the environmental record of North Pare. The environmental history of Pare so far, however, does not depend on cultural change. Progressive land degradation on its own, as outlined above, is in itself sufficient to explain the observed change in the environmental process system and might even has caused the reduction of fallow periods due to decreasing soil fertility after topsoil removal.
Climate dynamics or the advent of new food crops such as banana are further external factors which might have triggered rill erosion, migration and socioeconomic change. In the Great Lakes Region of Uganda detailed oral accounts and genealogical information are available and narrate the rise and fall of the interlacustrine kingdoms (SCHOENBRUN 1998). Several palaeoecological studies have pointed out correlations between political changes, shifts in the subsistence practices and climate dynamics � with particular focus on recurrent droughts associated with the Little Ice Age (ROBERTSHAW & TAYLOR 2000; TAYLOR et al. 2000; TAYLOR & ROBERTSHAW 2001; ROBERTSHAW et al. 2005; LEJJU 2009).
During the Little Ice Age (LIA, AD 1550 � 1850) prolonged aridity has been reported from the interlacustrine highlands (TAYLOR et al. 2000; RUSSELL et al. 2007) at Lake Edward (RUSSELL & JOHNSON 2005; RUSSELL & JOHNSON 2007) and Lake Tangayika (ALIN & COHEN 2003; STAGER et
176
al. 2009). An opposing climatic trend and generally wetter conditions are observed for the eastern part including Lake Victoria (STAGER et al. 2005) and Lake Naivasha. Most relevant for North Pare are regional palaeoclimatic reconstructions from Northern Tanzania and Southern Kenya. Lake level changes at Lake Naivasha (VERSCHUREN et al. 2000; VERSCHUREN 2001), Lake Emakat (RYNER et al. 2007) and Lake Challa (VERSCHUREN et al. 2009) suggest generally wetter conditions in north-eastern Tanzania after the marked dry period of the MWP. Lake levels rose after about AD 1200 but were frequently interrupted by short-lived, decadal drought events. At Lake Naivasha drought events are correlated with maxima of sunspot activity (VERSCHUREN et al. 2000): a pattern also shown by δ18O signatures from the Kilimanjaro ice cap recording a generally colder climate (THOMPSON et al. 2002) or, if stable isotope discrimination is interpreted in terms of dilution, a more humid environment (GASSE 2002) interrupted by drought periods. Similarly, a prolonged dry period between AD 1450 and 1650 at Lake Emakat emphasises the importance of drought events during a period of generally enhanced humidity (RYNER et al. 2007). Variability of precipitation during the Little Ice Age was high not only along an east-west gradient (RUSSELL et al. 2007) but also on a regional scale. Decadal drought events were common even in the wetter eastern part, as the lowstand of Lake Emakat illustrates. Compression or southward movement of the ITCZ as a consequence of irradiation decline during the sunspot minima possibly coupled with ENSO variations have been proposed to explain the spatial variability of LIA climate dynamics (RUSSELL & JOHNSON 2007; RUSSELL et al. 2007; STAGER et al. 2009).
In Northern Tanzania drier conditions around AD 1400 suggested by declining lake levels at Lake Emakat have been interpreted as triggering the implementation and expansion of irrigated agriculture at nearby Engaruka (WESTERBERG et al. 2010). Engaruka on the footslopes of the Ngorongoro Crater highlands is well known for its large and extensive stream-fed irrigation features and maintained a considerable population in a semi-arid environment (STUMP 2006). For Pare, the varying lake level records and the contradictory pollen records from Namelok swamp (RUCINA et al. 2010) - indicating dry conditions - and Lake Challa (RUCINA et al.) - implying increased precipitation - suggest more locally variable climatic patterns, however. Rainfall after prolonged dry periods is likely to have a similar impact and may have accentuated a seasonal precipitation pattern, which has been identified as favouring runoff-based erosion and the formation of sand lenses. On the other hand, rill erosion and sand lens formation are observed under contemporary intermediate climatic conditions in fields with or without the protective vegetation cover of banana plantations. Therefore, it is unlikely that particular climatic conditions were the sole reason causing runoff production and hence rill erosion and sand lens formation during a restricted time period.
In conclusion, it would appear that widespread runoff-based erosion developed since the 15th century as a long-term consequence of prolonged soil erosion, topsoil removal and land degradation initiated by the expansion of agriculture in North Pare. The creation of a Wagweno identity and the related cultural and socioeconomic changes dated through genealogical sources to the 15th/16th century may have been accompanied by new farming practices and a shift from swidden agriculture and slash-and-burn practices towards a more intensified agricultural land use characterised by further agricultural expansion and recurrent cultivation of established fields. Nevertheless, long fallow periods of a decade or more must have prevailed for centuries to allow the preservation of sand lenses cited here as evidence of runoff-based erosion. Although the exact local climatic conditions are unknown, decadal droughts during the LIA with sporadic and seasonal rainfall events are likely to have contributed to generate runoff-based erosion under open secondary vegetation.
177
10.4.6 Possible impact of 19th-century agricultural intensification
It has been argued that the establishment of economic trade networks during the 19th-century caravan trade stimulated major socio-economic and political changes and promoted agricultural intensification in Pare (HÅKANSSON & WIDGREN 2007; HÅKANSSON 2008; HÅKANSSON et al. 2008). Landesque capital such as terraces and irrigation systems reported from 19th-century Pare (MEYER 1890; BAUMANN 1891) have been taken as material evidence for what is otherwise difficult to prove agricultural intensification (HÅKANSSON & WIDGREN 2007; HÅKANSSON 2008; STUMP 2010). However, several other mechanisms have been proposed to explain the creation of landesque capital and the application of soil conservation methods in Pare (SHERIDAN 2002; STUMP 2010), Mbulu (BÖRJESON 2004, 2007), and Engaruka (WESTERBERG et al. 2010), and the motives as well as the age of agricultural intensification in Pare remains inconclusive. At the onset of this research it was envisaged that the land use change brought about by this assumed agricultural intensification might have influenced the magnitude and type of soil erosion processes and thus would affect the sedimentary record of slope deposits.
Contrary to the expectations, colluvial deposits in all of the three study areas did not reveal any direct evidence for successful soil conservation measures and landesque capital in Pare. Further, the subrecent deposits corresponding to the period of interest could not be dated directly due to the inherent ambiguities of single radiocarbon dates from the last three centuries. Despite dating uncertainties and the lack of a strong change in the erosion and deposition processes, there is indirect evidence for land use intensification in the 19th century. Accelerated and runoff-based erosion started in the 15th century and sand lense formation continues until the present day. Although undated, the cessation of sand lens preservation is interpolated to have taken place between AD 1780 and AD 1900 and coincides roughly with the 19th-century caravan trade (Tab. 12). Cessation of sand lens preservation in slope deposits has been linked to destruction by regular soil working, reflecting a more permanent cultivation during the deposition of the uppermost slope deposits (chapter 8.6). This assumption agrees with observations by KOTZ (1922:146), who reports fallows of one to two years followed by a three to four year period of cultivation for the first decade of the 20th century. Such a reduction of fallow periods would have erased the imprint of runoff-erosion in the colluvium preserved by sand lenses since the 15th century. Building on KOTZ (1922) observations, intensification of agricultural practises must have taken place prior to the turn of the 20th century. Given the lack of a firm chronology, identification of a more specific time is not possible. Whether shorter fallows and the inferred step of agricultural intensification were related to the assumed economic boom stimulated by the caravan trade (HÅKANSSON 2008) or, in contrast, was initially a consequence of political commotion and population concentration in the late 19th century and later maintained by economic and political stability and subsequent population growth during the early colonial period, warrants further investigation.
10.4.7 20th-century land cover changes
Land use changes in the last century have been studied on various scales. Based on satellite images, aerial photographs and map evaluation, forest cover changes of the Eastern Arc Mountains (NEWMARK 1998; NEWMARK ; HALL et al. 2009), and more specific land use change in the Pare Mountains (YLHÄISI 2004) and Taita Hills (PELLIKKA et al. 2009) have been investigated. NEWMARK
(1998; 2002) and recently HALL (2009) have made an attempt to estimate the total forest loss of the Eastern Arc Mountains since the beginning of anthropogenic forest clearance about 2000 years ago.
178
The prehistoric forest cover is arbitrarily assumed to have covered the mountains down to its base on the eastern, windward side and about 400m higher on the leeward side due to rain shadow effects. Estimates of forest loss range from 76% to 80% for the Eastern Arc Mountains (NEWMARK 1998; NEWMARK 2002). In North Pare, HALL et al. (2009) calculate forest loss to about 92% by AD 2000. Considering only indigenous forests, YLHÄISI (2004) concludes that only 4% (15 km²) of the potential forest area (365 km³) of the North Pare Mountain still holds closed primary forest. The high forest reduction in North Pare compared to other Eastern Arc Mountains is probably the combined result of its small size and the tectonic plateau setting, which facilitated cultivation and settlement and thus a high population density.
The study of HALL et al. (2009) shows that 89% of the estimated original indigenous forest in North Pare had been cleared before AD 1955 (75% for all Eastern Arc Mountains). In a similar way, aerial photographs from the 1950s (Fig. 25, Fig. 17, Fig. 18) support the picture outlined by historical accounts for the end of the 19th century (MEYER 1890; BAUMANN 1891): A general lack of forests, few dispersed trees within large areas of open cultivated land, or secondary vegetation in various succession stages from bare land, ferns and shrubs, to bushland and finally secondary forest. Most recent clearances had affected large areas of the Kamwalla and Kwa Chegho/Kirumwi mountains, where bare ground and shrub vegetation covered the mountain tops in the 1950s (Fig. 19). Timber demand for colonial infrastructure projects like the Dar-es-Salam � Moshi railway construction, as well as construction of missionary stations and private enterprises, prompted the establishment of logging companies in the Usambara mountains (SCHABEL 1990; CONTE 1999). Although in North Pare no logging concessions are known, similar incentives can be assumed for the early 20th-century deforestation.
The pollen record from Lomwe reflects a total lack of arboreal taxa after the 12th century and the general absence of trees and forests continues until the 19th century. Only within the last century did a diverse set of trees ranging from woodland to montane forest taxa emerge. Dominated by the exotic Cupressus and Eucalyptus, the return of arboreal taxa mirrors the successful colonial afforestation efforts. Conservation measures such as the gazetting of forest reserves started during German occupation, but widespread reforestation schemes were implemented only between 1935 and 1955 during British rule. Alone in 1951, over half a million trees were planted in North Pare (SHERIDAN 2001: 287). Declining deforestation rates in the late 20th century are observed at most Eastern Arc Mountains and are likely to arise out of the decreasing availability of forest resources but also must be attributed to successful conservation strategies. In North Pare, high initial deforestation rates of 25% between 1955 and 1975 declined to 3.7% between 1975 and 2000 (HALL et al. 2009). PELLIKKA et al. (2009) takes a contrary view studying forest cover change in the nearby Taita Hills, where total forest cover of selected areas declined only marginally (2%) between 1955 and 2004 but indigenous forest was reduced by up to 50%. The results of PELLIKKA et al. (2009) and HALL et al. (2009) show that strong conservation efforts and the reduction of the overall deforestation rates due to successful local reforestation measures mask the ongoing severe clearance of ecologically important indigenous forest.
In Pare, the planting of trees is a means to maintain tenure rights by low labour investment and tree planting (e.g. Grevillea, Cupressus or Eucalyptus) along field borders and as shade trees in agroforestry systems soon became popular. The seedlings planted throughout Pare in the 1950s changed the Pare vegetation cover: a mostly treeless landscape in AD 1890 as observed by MEYER (1890), BAUMANN (1891) and VON DER DECKEN (1869) is today characterised by small plantation forests on eroded hilltops and widespread scattered trees and tree clumps offering firewood and fodder.
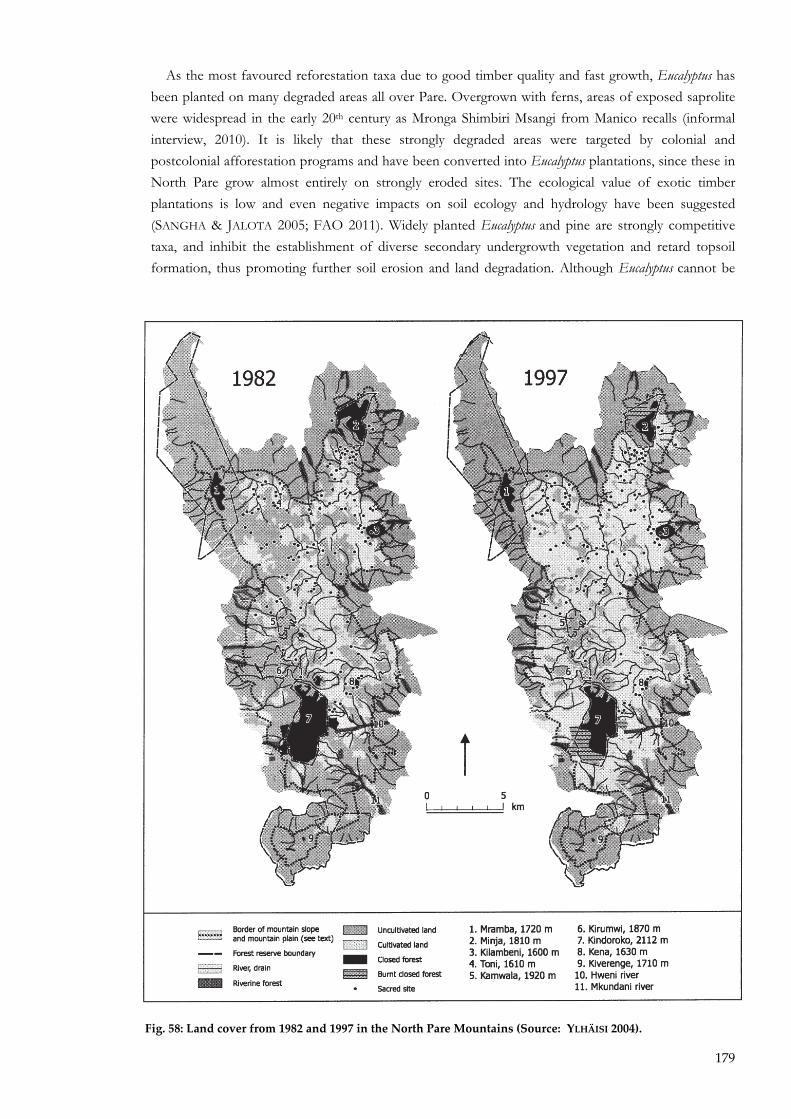
179
As the most favoured reforestation taxa due to good timber quality and fast growth, Eucalyptus has been planted on many degraded areas all over Pare. Overgrown with ferns, areas of exposed saprolite were widespread in the early 20th century as Mronga Shimbiri Msangi from Manico recalls (informal interview, 2010). It is likely that these strongly degraded areas were targeted by colonial and postcolonial afforestation programs and have been converted into Eucalyptus plantations, since these in North Pare grow almost entirely on strongly eroded sites. The ecological value of exotic timber plantations is low and even negative impacts on soil ecology and hydrology have been suggested (SANGHA & JALOTA 2005; FAO 2011). Widely planted Eucalyptus and pine are strongly competitive taxa, and inhibit the establishment of diverse secondary undergrowth vegetation and retard topsoil formation, thus promoting further soil erosion and land degradation. Although Eucalyptus cannot be
Fig. 58: Land cover from 1982 and 1997 in the North Pare Mountains (Source: YLHÄISI 2004).
180
blamed for the initial degradation, it currently fails to protect the soil surface and hinders topsoil formation by impeding undergrowth. Exceptions are observed in fertile areas such as on slope deposits at Lomwe or under mixed secondary forest vegetation at Kwa Chegho.
The rapidly increasing North Pare population during the 20th century (SHERIDAN 2002) created the demand for new agricultural land, construction timber, charcoal and firewood putting pressure on the forest resources. The clan and family based land tenure system also contributed to the fragmentation of farms and the expansion of the agricultural frontier. Between 1982 and 1997 the area of cultivated land increased by 68% from 73 km² to 123 km² (YLHÄISI 2004) but the expansion took place at the expense of �uncultivated land� converted into agriculture (Fig. 58). This category includes open dry forests on the escarpment as well as swampy valley bottoms and riverine thickets, but the better part consisted of secondary bushland and woodland of various succession stages on former cultivated land.
The expansion of agricultural land into traditionally protected areas such as swamps, stream banks, sacred groves and high altitude indigenous forests was not only a consequence of increasing population pressure but accompanied the decline of traditional values and belief systems (SHERIDAN 2001, 2004). Colonial rule, post-independence governmental politics, and the Christian and Islamic missions questioned traditional sets of values and beliefs and undermined the authority of elders and clan leaders. Traditional environmental protection mechanisms such as the conservation of traditional forest reserves and restrictions on swamp and riverine cultivation have been eroded, whereas governmental and non-governmental efforts for protection are seen with distrust and lack legitimacy as they are often imposed without consideration of local needs and traditions (SHERIDAN 2001).
Today, land clearing and expansion of agricultural land takes place in highland areas >1600m a.s.l. At the same time, fallow land and encroachment of secondary vegetation is observed on many plots within the agriculturally favourable Pare upland. The Pare land tenure system of male partible inheritance, whereby land is divided equally between the sons, is responsible for the fragmentation of agricultural land into small uneconomic plots and stimulates the out-migration of young people unable to make a living from these small plots. While many agricultural plots lie fallow because of the migration of their owners, communal tasks like the running of irrigation systems become harder and economic efficiency declines further. The consequence of this artificial land shortage is the expansion of the agricultural frontier into the less populated lowland and highland areas fostering clearance of the remaining indigenous forests.
10.5 Behind the paradigms: Does the land lie?
Environmental narratives of land degradation and the often non-consensual implementation of soil, vegetation and biodiversity conservation measures have been a central part of African development policies in the last century. The apparent demise of agricultural land as stated by ecological assessments of land degradation in the context of rapid population growth and influenced by the American Dust Bowl experience and exceptional climatic famines in the Sahel prompted calls to action. The observation of widespread land degradation under traditional agricultural practices turned into a general concept and prevailed as received wisdom (REIJ et al. 1996; KONING & SMALING 2005; MUCHENA et al. 2005). During the 20th century degradation narratives have become commonplace in most of Africa and have shaped land development projects, influenced the establishment of conservation areas, and may even have replaced local and traditional histories of environmental change in order to attract funding (JONES 1996; LEACH & MEARNS 1996).
181
These narratives of ubiquitous land degradation - the so called �lie of the land� (LEACH & MEARNS 1996) - were challenged by new, often historically oriented research bringing forward positive histories and portraying sustainable, indigenous land use and soil conservation practices, alongside traditional protection of forests, and human-made landscape domestication that increased productivity and even biodiversity (TIFFEN et al. 1994; LEACH & MEARNS 1996; FAIRHEAD & LEACH 1999). The polarization of views between the received wisdom of generalised land degradation on one hand and an also generalised critique of orthodox development strategies based on positive case studies of traditional land use on the other, has opened the discussion about the wider framework of land degradation and human-environment interactions including social (livelihood, vulnerability, culture), economic (prices, trade networks, subventions), political (tenure, poverty) as well as agricultural, climatic and environmental factors (KONING & SMALING 2005; MUCHENA et al. 2005). Most importantly however, historicity of landscapes was recognised as a crucial aspect of environmental work to understand the present state of ecological and agricultural systems (CHRISTIANSSON 1981; LANE 2010). Further, emphasis has been put upon the ubiquitous nature of human activity even in long-assumed �virgin� environments (WILLIS et al. 2004). The integration of palaeoenvironmental work to understand long-term environmental developments has added a whole new dimension to the debate over land degradation, sustainable agricultural practices, and development strategies (MARCHANT et al. 2010). The investigation of landscapes as dynamic and historical systems yet again shows that trajectories of environmental change are local and site-specific and warrant careful investigation of the actual causes and processes responsible for present day conditions.
The investigation of colluvial deposits in Pare does not indicate that indigenous soil conservation measures such as terracing, irrigation and manure application did decelerate soil erosion. Deposits concurrent with both the post-15th-century Wagweno state and the assumed agricultural intensification during the 19th century are characterised by high deposition rates and subsoil erosion and indicate enhanced soil erosion and land degradation rather than effective soil conservation. The lack of preserved evidence from slope deposits, however, does not rule out that the construction of terraces, the establishment of the irrigation system, or manure application did take place and were attempts to maintain soil productivity. But, they were not successful enough to decelerate soil erosion on the particular slopes. Similarly, 20th-century afforestation and implementation of soil conservation measures as well as increased fallow periods due to out-migration is not (yet?) documented in the sedimentary record.
The fact that indigenous people have dwelled in the landscape for millennia and adapted their livelihood strategies according to their environment does not necessarily imply sustainable land use or the application of effective soil conservation practices. The present study shows that from at least the early first millennium AD, land use in Pare had long-term environmental consequences and thus, over this period, has not been sustainable. Although imperceivable in the beginning, the soil resource has been depleted slowly but steadily. Land degradation, however, only became apparent when ecological thresholds were trespassed and a new process system established. Two examples of process shifts have been presented: catchment wide forest clearance triggering the onset of mineral material deposition in the Lomwe swamp and area-wide exhaustion of the topsoil resource leading to subsequent runoff-based subsoil erosion.
Ecosystem resilience and non-linear behaviour near environmental thresholds are difficult to assess parameters of ecosystems, particularly when investigating dynamic systems and human-climate-environment interactions. Precipitation changes during the MWP or the LIA can be correlated with
182
changes of the environmental record in Pare, although this study does not hold them responsible for the observed changes in the erosion regime. Rather than climatic changes, the protecting vegetation cover and the properties of the soil surface changed after clearance and topsoil erosion. Given the new boundary conditions, continuous land use under a constant climate may suffice to trigger landscape transformation. This conclusion differs from many other scholars who emphasise the dominance of climatic influence on environmental change, generally, because direct anthropogenic forcing cannot be corroborated.
Following the shift from one process framework to another, the impact of internal and external interventions may change although direction and magnitude remain the same. Consequently, evaluation of resource exploitation strategies has to take into account the respective historical, ecological and socio-economic framework. Thus, indigenous land use techniques common in pre-colonial times might not be viable options under different contemporaneous circumstances. Population growth, distinct socio-economic and cultural structures, but also different climatic and - as the present study shows - pedological conditions require the adaptation of livelihood strategies. Whereas swidden agriculture might have been an acceptable land use practices during the early centuries of farming, it set off unnoticed a history of soil erosion requiring agricultural adaptation, and possibly starting a cycle of agricultural intensification in Pare sensu BOSERUP (1965). Adaptations of land use and agricultural intensification have the potential to conserve the soil resources; however generally follow with a time lag. Thus, agricultural intensification itself is an indicator that former land use has become unsustainable under new boundary conditions. Today, establishment of drastic soil conservation measures such as terraces is the latest move and a best guess to stabilise the Pare environment in the long run (although soil fertility might decrease in the short term, being one of the reasons for reluctant acceptance by local farmers). Whether or not the currently proposed soil conservation practices will be more successful than former attempts is beyond present knowledge and only time will tell.
Blaming any single generation of farmers, agricultural officers or scholars for accelerated soil erosion or unsuccessful conservation measures will be misleading. Instead, the challenge today is to understand the development of the anthropogenic landscape, its past trajectories and critical turning points and confront the often complex histories of land degradation, with all the available knowledge of today - as generations before have attempted under their respective circumstances.
183
11 CONCLUSION
The present study set out to investigate the past soil erosion history of North Pare based on the colluvial record of slope deposits. Its aim was to elucidate the interactions of climate dynamics, anthropogenic land use, vegetation change, and to reconstruct environmental processes and landscape development particularly since the introduction of agriculture and iron smelting. The approach combined geoarchaeological, pedological, and palaeoecological techniques to establish a history of landscape change in North Pare and put historical accounts and present day narratives of land degradation into perspective.
In contrast to previous archaeological, historical, and palaeoecological studies in Pare, the applied landscape-based approach focuses on the characteristics and features of terrestrial archives to infer past surface processes and reconstruct Holocene landscape evolution. The investigation of slope deposits as corresponding archives of soil erosion directly linked to landscape processes is not only a new methodological approach in East Africa but also sheds light on the late Holocene landscape history in north-eastern Tanzania so far subject to speculation.
The identification of soil and surface processes draws on sedimentary and pedogenetic benchmark features primarily aggregates and sand lenses and was supported by magnetic susceptibility as criteria of subsoil and topsoil erosion, whilst stable carbon isotope composition was employed as a proxy for vegetation cover. Although in the first instance a history of soil erosion, the findings have strong implications for the temporal development of past vegetation cover and particularly land use. The correspondence of site-specific developments from three study sites confirms their regional significance and allows extrapolation of observed patterns and processes from the only suggestive data of single profiles to a generalised model of North Pare landscape development.
The most important finding is the confirmation of over 2000 years of land clearance, farming and probably iron working based on the sedimentary record, which supplements the more limited archaeological evidence for early occupation in Pare. Widespread burial of soils, the occurrence of potsherds, abundant charcoal, and subsequent uninterrupted soil erosion in North Pare corroborates the timing and hence the rapid spread of food producing subsistence strategies suggested by dispersed archaeological findings in north-eastern Tanzania. A pronounced shift from an early period of slow topsoil erosion to an accelerated and runoff-based erosion regime since the 15th century corresponds with the onset of both climatic fluctuations of the Little Ice Age and the extrapolated establishment of the Ugweno state in North Pare. This temporal coincidence opens the debate about timing and impact of human-climate-environment interactions prior to the 19th century, so far dominated by oral accounts and undated changes in pottery traditions.
Whereas the onset of land clearance in the course of expansion of farming and iron working has left a strong imprint in the terrestrial archives, there is only suggestive evidence for 19th-century agricultural intensification. Against the background of 2000 years of prolonged soil erosion, evidence for truncated subsoils and the lack of arboreal vegetation since the 15th century confirm the existence of a bare and treeless landscape as reported by 19th-century European travellers and observed on mid-20th-century aerial photos: a degraded environment that prompted subsequent colonial soil conservation and afforestation measures.
Finally, the lack of slope deposits dating to the early and mid-Holocene corroborates surface stability similar to findings from pedisediments in the Irangi Hills and the Mindu Mountains, and is in accordance with palaeoecological findings of vegetation stability in the Eastern Arc Mountains. Only
184
rapid and strong climatic change during warming and wetting steps at the end of the late Pleistocene has left its imprint in the terrestrial record of Pare. The silence of the terrestrial record in Pare contrasts with active slope dynamics on neighbouring Kilimanjaro and fluctuating lake levels in most of East Africa during the Holocene.
The coincidence of shifting erosion processes and material change in the 15th century is interpreted as the result of an internal development: prolonged cumulative erosion leading to the exposure of subsoils and triggering a new set of erosion processes. This explanation draws the attention from the study of external changes (e.g. climate, tectonics and land use changes) to the consequences of prolonged and directed internal developments in a non-equilibrium system. It leads to a retrospective evaluation of the ecosystem resilience, particularly the ecosystem response to the directed long-term impact of farming, and examines the implications of such a rapid transition to a new process framework. In retrospective, it becomes possible to identify critical impacts or trends, which ultimately resulted in resource exhaustion and system change, but it also highlights, when possibilities of recovery where used or neglected.
Ecological thresholds play a crucial role in landscape development and in vegetation and climate dynamics. The identification of such a changeover from one state to another is, however, difficult. Both of the pivotal events presented here - damming of streams by excessive sediment supply in response to widespread land clearance at Lomwe and accelerated runoff-based soil erosion as a consequence of subsoil exposure at Mrongo and Usumbwe - are preceded by a prolonged state of apparent stability and a rapid transition to a new processes framework with a distinct environmental imprint. Once the environmental process framework has changed, the response to external and internal drivers is readjusted and the same external impact may cause different results. Despite the temporal coincidence with oral historical evidence for societal transformation and the climatic fluctuations of the Little Ice Age, the observed environmental changes in Pare since the 15th century are attributed here to prolonged anthropogenic land use; albeit that favourable climatic conditions or changes in the land use techniques might have contributed or enhanced the observed effects.
The emphasis on anthropogenic land use brought forward by the present study deviates from a wide range of palaeoecological and lake-level based climate reconstructions and may stimulate further discussion and investigation. It highlights the different responses of palaeoarchives depending on type, location, size, and investigation method. High-altitude locations far removed from early farming communities record human impact only after a time delay, as do large lake catchments, regardless of their physical proximity to the events in question. Small sediment traps in agricultural zones, in contrast, are likely to be dominated by anthropogenic instead of climatic influences and respond immediately and strongly to such local disturbance. Site selection and choice of investigation method for the respective research question thus warrants close consideration when tracing the impact of human land use.
An important aspect of past land use reconstruction is the tentative suggestion that characteristic features of slope deposits reflect increasing levels of land use intensity. Based on the interpretation of sand lens occurrence, this interpretation presents an indirect but consistent picture of intensifying land use. Slow erosion during land clearance in the early centuries of the first millennium is explained by extensive swidden agriculture and secondary forest regrowth. Since the 15th century, sand lens preservation and accelerated soil erosion in an open cultivated landscape suggest recurrent cultivation of the same field albeit with long decadal fallow periods. Finally, short fallows or permanent cultivation
185
inferred from the suppression of sand lens preservation since the 19th/20th century reflect the most recent intensification stage.
For archaeological research, the reconstructed landscape development of Pare has important implications. The advanced erosion of slopes predicts a lack of archaeological sites in North Pare, particularly Early Iron Age sites. On the slopes, sites are likely to be eroded, their remains reworked, translocated and stored in the slope deposits. In situ sites might only be found at footslope positions or in slope depressions where colluvial deposits have buried and preserved the evidence; though in this latter circumstance they will be hard or impossible to locate by common surface survey techniques. Thus, the present distribution of reported archaeological sites does not reflect the original distribution but is biased by subsequent site destruction and erosion of the former surfaces.
Narratives of land degradation and environmental development find themselves discussed between two extremes: one that sees indigenous land use as adapted to the local environment through the maintenance and conservation of resources, whilst the other regards local land use as predisposed to resource depletion, either because individuals do not perceive the long-term dangers of such a strategy, or because it is imposed by circumstances (e.g. economics) beyond their control. The late Holocene environmental history of the North Pare Mountains presents a clear picture of long-term soil erosion over the past two millennia and enhanced land degradation during the last five hundred years. It demonstrates that indigenous land use practices are not necessarily sustainable or adapted to their environment and instead may have long-term consequence and lead to progressive land degradation. The environmental history of North Pare once more highlights that reconstructed environmental narratives are always site-specific and present conditions are the result of a local historical development that precludes generalisations of the underlying causes.
11.1 Caveats and methodological critique
Multi-proxy approaches comprehensively address different aspects of environmental records by combining a variety of analyses. The approach is robust and does not rely on a single parameter, which may or may not be suitable for the respective research question. On the other hand, the selected methods might not be able to answer the research questions straightforwardly and, as time and resources are limited, in depth investigations of complex questions related to a single method are not possible. Several of the questions left open by this study relate to such limitations and partly warrant further in depth analysis.
The assumption of an originally closed canopy, montane forest in upland Pare has been questioned strongly (GILLSON et al. 2003). The reconstruction presented here of pre-farming vegetation cover remains only tentative. It was not possible to unambiguously reconstruct vegetation prior to the onset of soil erosion as the pollen record did not extend beyond the 6th century AD. While stable carbon isotope composition of buried soils is in accordance with an expected subhumid C3 vegetation cover, it does not confirm the assumption of a montane forest. To clarify the possible bias induced by the isotopic fractionation of soil organic matter and strengthen the evidence from stable carbon isotopes, reference soil profiles along an altitudinal and vegetation transect would be necessary, but were not possible during the current study due to time constraints.
The third approach to past vegetation composition, phytolith analysis, was envisaged to replace pollen analysis in the terrestrial archives. However, a difficult to interpret phytolith record from the swamp, and a preliminary phytolith analysis of colluvial deposits, both highlighted problems posed by
186
the lack of an available reference collection, and by a high variation of phytolith types between swamp and terrestrial deposits. The apparent absence of grass phytoliths in the colluvial deposits complicate matters, and requires further research. Thus, phytolith analysis at Pare was abandoned within the scope of this study.
Magnetic susceptibility patterns became a key parameter to differentiate between topsoil and subsoil erosion and to highlight the onset of accelerated soil erosion and land degradation. Exceptionally high magnetic susceptibility values are explained by the base and iron-rich rocks of Pare. Further, pedogenetic enhancement is identified as the principal process responsible for magnetic differentiation of slope deposits. In this study, the differentiation between pedogenetic enhancement and primary magnetic minerals is based only on the magnetic susceptibility and frequency dependency. To identify the dominant iron species responsible for the observed susceptibility pattern and to differentiate between neoformation of magnetic minerals and the admixture of primary minerals from distinct geological sources, a combination of element assays of iron sand and bulk soil samples together with further magnetic analysis, particularly remanence ratios (e.g. IRM, SIRM, ARM), will be necessary.
The deposition chronology is based on radiometric and optically stimulated luminescence dating. Whereas radiocarbon dating of charcoal fragments provided a consistent time frame for the accumulation of slope deposits, OSL dating appeared to be biased by insufficiently bleached sediments. Taking into account both reworking of charcoal fragments and problems of insufficient bleaching in colluvial settings it is not possible to decide at the outset of a study which of both techniques will be reliable. Although two of the three OSL dates from the present study had to be rejected, adjustments of the technique (e.g. single grain analysis) may prove successful in similar environments.
Loss-on-ignition as organic matter proxy was abandoned during the laboratory work as it transpired that LOI was not capable of picking up small organic matter variations in the buried topsoils. Although a useful tool for a rough characterisation of organic matter rich sediments, it is not suitable for quantitative estimation of the organic matter content of carbon poor and clay rich sediments.
Charcoal estimation by nitric acid digestion recovered charcoal carbon qualitatively but correlation of nitric-acid-resistant carbon with total organic carbon hinted either at a methodical problem or the absence of an interpretable variation in both the swamp and one terrestrial deposit. As methodical uncertainties outweighed the anticipated interpretative value, the method was abandoned.
The course of this research not only demonstrated the limitations of some of the methods applied, but also identified several other methods that could benefit similar projects in the future. The interpretation of pedogenetic features of the slope deposits would have been greatly enhanced by micromophological analysis of the different deposition units. Micromorphological confirmation of the type and material of reworked aggregates, the extent and nature of sand lenses, as well as implications from fabric and structure for post-depositional soil formation could have increased the explanatory power of the pedological benchmark features. A preliminary suite of micromorphology samples were taken from several of the profiles discussed here in 2010 by the author in collaboration with Stump; the results from which are forthcoming.
The emerging land degradation narrative will benefit from a detailed soil fertility assay such as cation exchange capacity, base saturation, and aluminium concentration. Comparison of present-day eroded agricultural soils with the soils of forest fragments and different units of the slope deposits may confirm the assumed decline of soil fertility after erosion of topsoils. A soil fertility assessment will
187
enhance the discussion of causes and mechanisms of agricultural intensification in Pare and may explain decreasing fallow times.
In a similar way, monitoring of current soil erosion would be a further step to quantify present day soil erosion. Instead of traditional plot based methods, 137Cs measurements allow the calculation of soil erosion rates and can be used to indirectly date the last forty years of slope deposit accumulation. This more spatial approach would have allowed the two dimensional findings from the slope deposits to be extended to the catchment scale.
While several of the applied analytical techniques turned out to be unsuitable to answer the research questions in this specific environment, the range of techniques allowed the characterisation of slope deposit accumulation from different perspectives. It is this strength of the multiproxy approach to integrate evidence from different techniques, different archives and from different processes, which has allowed not only a reconstruction of landscape evolution but also a number of inferences to be drawn concerning vegetation and climate dynamics and land use techniques.
11.2 Directions for future research The present research into the environmental history of Pare has identified several areas that warrant
further research. The perspectives are restricted to addressing direct implications from this thesis.
The present study has identified a spatial bias of palaeoecological and palaeoenvironmental research. Especially semi-arid lowland areas and agriculturally transformed sub-humid mid-altitudes of mountainous regions have been neglected so far, largely because the focus of previous studies has been on long time series reconstructed from cores taken from medium to large lakes and high-altitude swamps. Thus, the history of lowland vegetation and lower montane forests is fragmentary. Particularly, the fluctuation of the forest-savannah boundary might be sensitive to environmental changes during the Holocene and is likely to have experienced the strongest anthropogenic transformation. Palaeoecological investigations of lowland settings, involving a comprehensive study of past and present phytolith distribution, will complement the high-altitude records particularly in view of an accurate climate history not biased towards exceptionally humid environments.
Detailed research is particularly missing for the agriculturally important mid-altitudes. Besides the vegetation and settlement history, the apparent late Holocene age of mid-altitudinal swamps in Pare has prompted the hypothesis of widespread valley damming as a consequence of anthropogenic soil erosion. Mid-altitudinal wetland establishment warrants further investigations focusing on possible damming as well as a possible palaeoecological reconstruction of pre-farming vegetation. Valley bottom sands on the other hand, have led to the postulation of a mid-Holocene erosion period. Targeted investigations of mid-Holocene sedimentary sequences will be necessary to shed light on the exact nature and timing of these erosion periods, which seem to be characterised by sediment clearing out and hiatus, rather than by the accumulation of slope deposits.
Having stressed the differential developments in lowland, mid-altitudes and highland areas, landscape development of the Pare foothills and surrounding lowlands awaits detailed investigation. Late Holocene sediments exposed in recent gullies along the foothills of Pare were described as part of the HEEAL fieldwork, however, and suggest that anthropogenic soil erosion was not restricted to the densely settled uplands of modern times. Although not reported upon here, erosion of the Pare foothills is likely to be associated with the high number of exposed iron smelting sites, and is subject to ongoing work by the author in collaboration with Stump, Iles and Lane. Investigation of terrestrial
188
archives along the Pare foothills will include the dating of both the remaining archaeological remains and the timing of accelerated erosion. The comparison of the environmental history of lowland, upland and highland sites promises comprehensive insights into the spatial variation of Holocene climate dynamics and anthropogenic land use as drivers of soil erosion and landscape development.
The onset of soil erosion in Pare has been linked to the spread of farming and iron working in the last centuries BC. The impact of fuelwood demand by iron working communities is a controversial topic and several attempts for quantification have been made (e.g. SCHMIDT 1997a). In Pare, a high number of iron smelting sites are known, but only a few have been dated so far and do not yet give a comprehensive picture of the developments and changes over time. The assumption that iron working has played a crucial role for land clearance and subsequent soil erosion cannot yet be confirmed. So far, iron working sites in North Pare are restricted to the second millennium AD, and there is nothing but circumstantial evidence for the contribution of fuelwood extraction to deforestation. Further dating of iron working sites in upland and lowland Pare will indicate if iron working took place continuously or if periods of more intensive smelting and smithing occurred. However, the implications of the present work and the almost complete erosion of topsoils on the Pare slopes question the success of the proposed approach. Early Iron Age sites are likely to have been eroded away during the first millennium AD and it is therefore anticipated that only most recent archaeological sites will have remained in situ and can be dated accurately. The present study of slope dynamics and deposit formation has provided important background information for the likely state of preservation of Early Iron Age sites in North Pare and thus contributes to the design of archaeological survey strategies but may also explain a possible archaeological void in the first millennium AD. Known to be a centre of iron production, documenting the extent of past iron working in Pare still remains a challenging task.
This thesis has shown that farming and perhaps iron working had instantaneous and large-scale consequences for the development of the North Pare landscape. To allow such a generalised model of landscape development to be drawn, a spatially comprehensive approach must combine the evidence from a representative numbers of sites, each with its own local history and take into account the high local variability of not only slope processes but also climatic and anthropogenic drivers. The present study emphasises the importance of human landscape transformation in the late Holocene and cautions against interpretations of environmental records based only on external controls such as climate change. Instead, it draws attention to ecosystem resilience and the consequences of progressive internal developments and the importance of ecological thresholds for rapid environmental change.
The presented multi-proxy approach allowed detailed examination of specific deposition features from which slope processes and past land use practices were inferred, thus elucidating timing, causes, and consequences of past resource exploitation strategies. Pedological - geoarchaeological studies of landscape development provide important contextual details for historical, archaeological and ecological research and may even allow the retrospective evaluation of the sustainability of past land use practices.

189
APPENDIX
A Soil Data (On CD‐ROM)
A.1 Analytical Data - Slope Deposits
A.2 Analytical Data � Forest and Cultivated Soil Profiles
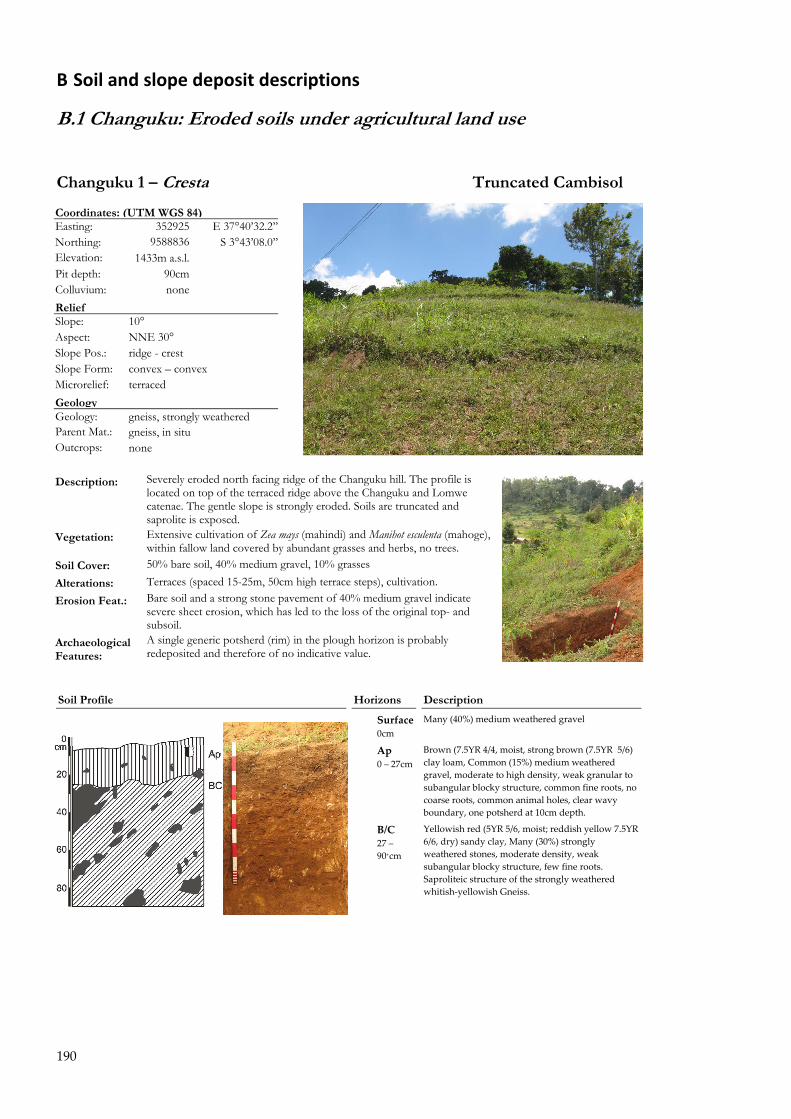
190
B Soil and slope deposit descriptions
B.1 Changuku: Eroded soils under agricultural land use
Changuku 1 � Cresta Truncated Cambisol
Coordinates: (UTM WGS 84) Easting: 352925 E 37°40�32.2�� Northing: 9588836 S 3°43�08.0�� Elevation: 1433m a.s.l. Pit depth: 90cm Colluvium: none Relief Slope: 10° Aspect: NNE 30° Slope Pos.: ridge - crest Slope Form: convex � convex Microrelief: terraced Geology Geology: gneiss, strongly weathered Parent Mat.: gneiss, in situ Outcrops: none
Description: Severely eroded north facing ridge of the Changuku hill. The profile is
located on top of the terraced ridge above the Changuku and Lomwe catenae. The gentle slope is strongly eroded. Soils are truncated and saprolite is exposed.
Vegetation: Extensive cultivation of Zea mays (mahindi) and Manihot esculenta (mahoge), within fallow land covered by abundant grasses and herbs, no trees.
Soil Cover: 50% bare soil, 40% medium gravel, 10% grasses Alterations: Terraces (spaced 15-25m, 50cm high terrace steps), cultivation. Erosion Feat.: Bare soil and a strong stone pavement of 40% medium gravel indicate
severe sheet erosion, which has led to the loss of the original top- and subsoil.
Archaeological Features:
A single generic potsherd (rim) in the plough horizon is probably redeposited and therefore of no indicative value.
Soil Profile Horizons Description
Surface0cm
Many (40%) medium weathered gravel
Ap 0 � 27cm
Brown (7.5YR 4/4, moist, strong brown (7.5YR 5/6) clay loam, Common (15%) medium weathered gravel, moderate to high density, weak granular to subangular blocky structure, common fine roots, no coarse roots, common animal holes, clear wavy boundary, one potsherd at 10cm depth.
B/C 27 � 90+cm
Yellowish red (5YR 5/6, moist; reddish yellow 7.5YR 6/6, dry) sandy clay, Many (30%) strongly weathered stones, moderate density, weak subangular blocky structure, few fine roots. Saproliteic structure of the strongly weathered whitish‐yellowish Gneiss.
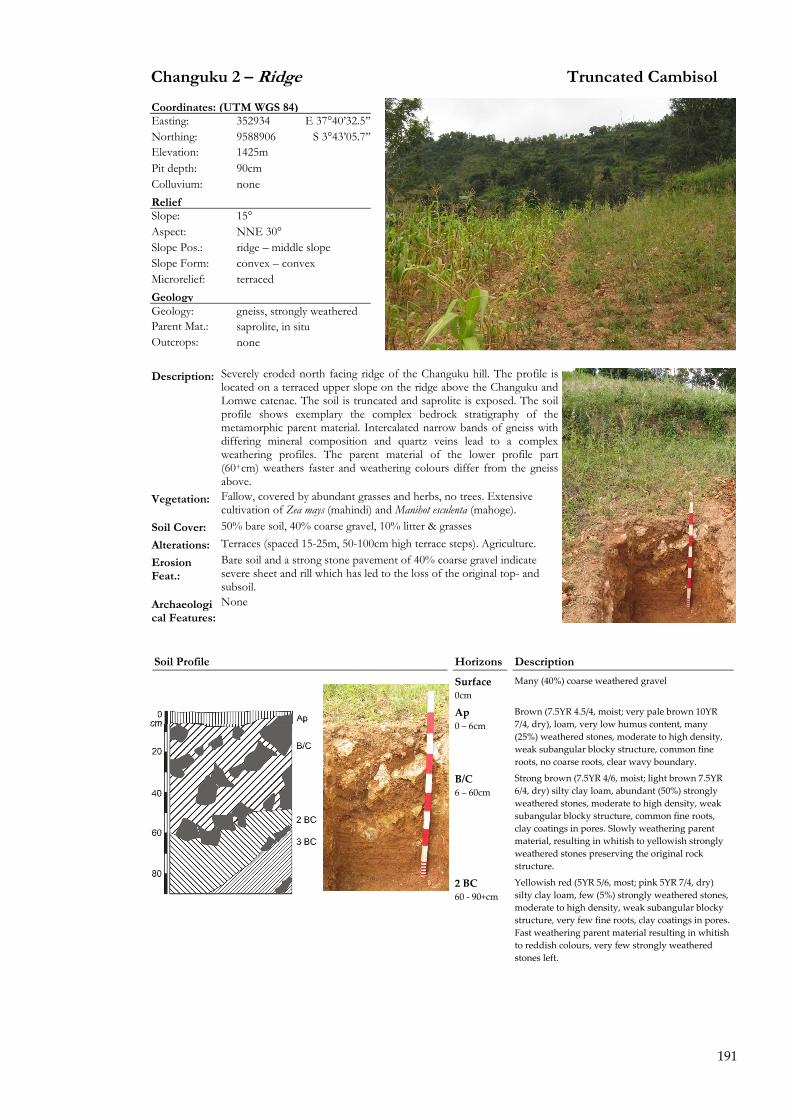
191
Changuku 2 � Ridge Truncated Cambisol
Coordinates: (UTM WGS 84) Easting: 352934 E 37°40�32.5��Northing: 9588906 S 3°43�05.7��Elevation: 1425m Pit depth: 90cm Colluvium: none Relief Slope: 15° Aspect: NNE 30° Slope Pos.: ridge � middle slope Slope Form: convex � convex Microrelief: terraced Geology Geology: gneiss, strongly weathered Parent Mat.: saprolite, in situ Outcrops: none
Description: Severely eroded north facing ridge of the Changuku hill. The profile is
located on a terraced upper slope on the ridge above the Changuku and Lomwe catenae. The soil is truncated and saprolite is exposed. The soil profile shows exemplary the complex bedrock stratigraphy of the metamorphic parent material. Intercalated narrow bands of gneiss with differing mineral composition and quartz veins lead to a complex weathering profiles. The parent material of the lower profile part (60+cm) weathers faster and weathering colours differ from the gneiss above.
Vegetation: Fallow, covered by abundant grasses and herbs, no trees. Extensive cultivation of Zea mays (mahindi) and Manihot esculenta (mahoge).
Soil Cover: 50% bare soil, 40% coarse gravel, 10% litter & grasses Alterations: Terraces (spaced 15-25m, 50-100cm high terrace steps). Agriculture. Erosion Feat.:
Bare soil and a strong stone pavement of 40% coarse gravel indicate severe sheet and rill which has led to the loss of the original top- and subsoil.
Archaeological Features:
None
Soil Profile Horizons Description
Surface 0cm
Many (40%) coarse weathered gravel
Ap 0 � 6cm
Brown (7.5YR 4.5/4, moist; very pale brown 10YR 7/4, dry), loam, very low humus content, many (25%) weathered stones, moderate to high density, weak subangular blocky structure, common fine roots, no coarse roots, clear wavy boundary.
B/C 6 � 60cm
Strong brown (7.5YR 4/6, moist; light brown 7.5YR 6/4, dry) silty clay loam, abundant (50%) strongly weathered stones, moderate to high density, weak subangular blocky structure, common fine roots, clay coatings in pores. Slowly weathering parent material, resulting in whitish to yellowish strongly weathered stones preserving the original rock structure.
2 BC 60 ‐ 90+cm
Yellowish red (5YR 5/6, most; pink 5YR 7/4, dry) silty clay loam, few (5%) strongly weathered stones, moderate to high density, weak subangular blocky structure, very few fine roots, clay coatings in pores. Fast weathering parent material resulting in whitish to reddish colours, very few strongly weathered stones left.
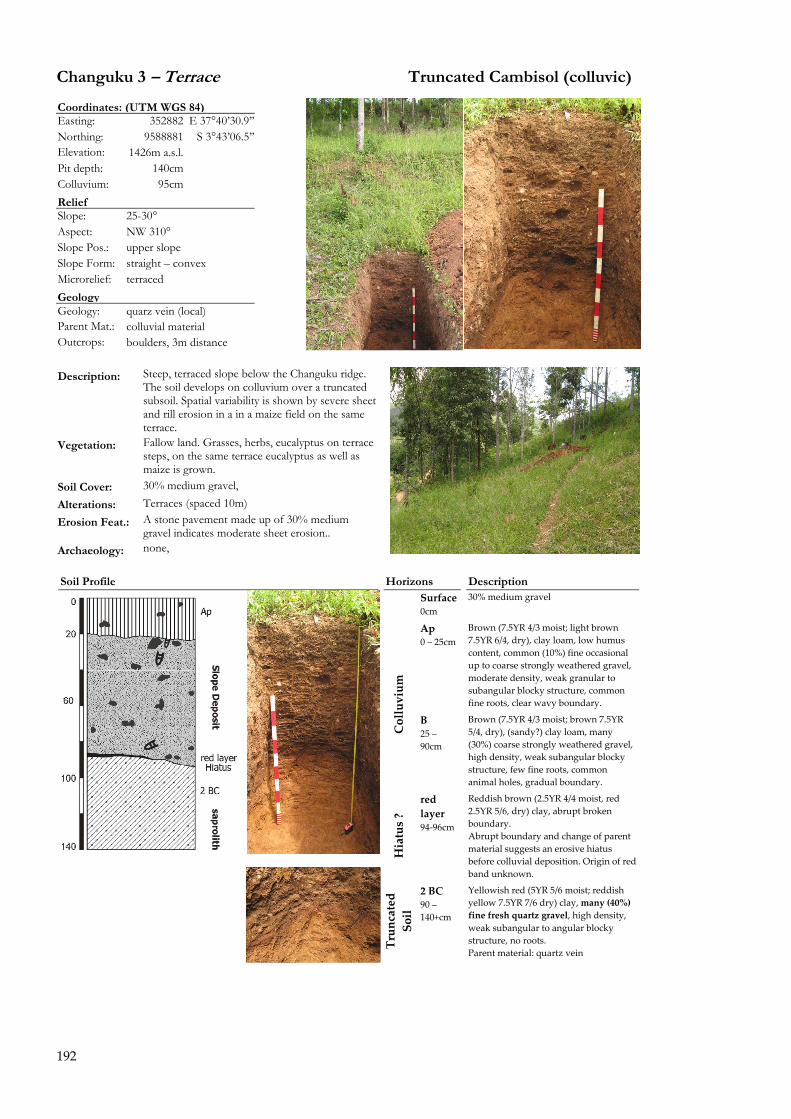
192
Changuku 3 � Terrace Truncated Cambisol (colluvic)
Coordinates: (UTM WGS 84) Easting: 352882 E 37°40�30.9�� Northing: 9588881 S 3°43�06.5�� Elevation: 1426m a.s.l. Pit depth: 140cm Colluvium: 95cm Relief Slope: 25-30° Aspect: NW 310° Slope Pos.: upper slope Slope Form: straight � convex Microrelief: terraced Geology Geology: quarz vein (local) Parent Mat.: colluvial material Outcrops: boulders, 3m distance
Description: Steep, terraced slope below the Changuku ridge.
The soil develops on colluvium over a truncated subsoil. Spatial variability is shown by severe sheet and rill erosion in a in a maize field on the same terrace.
Vegetation: Fallow land. Grasses, herbs, eucalyptus on terrace steps, on the same terrace eucalyptus as well as maize is grown.
Soil Cover: 30% medium gravel, Alterations: Terraces (spaced 10m) Erosion Feat.: A stone pavement made up of 30% medium
gravel indicates moderate sheet erosion.. Archaeology: none,
Soil Profile Horizons Description
Surface0cm
30% medium gravel
Ap 0 � 25cm
Brown (7.5YR 4/3 moist; light brown 7.5YR 6/4, dry), clay loam, low humus content, common (10%) fine occasional up to coarse strongly weathered gravel, moderate density, weak granular to subangular blocky structure, common fine roots, clear wavy boundary.
Colluvium
B 25 � 90cm
Brown (7.5YR 4/3 moist; brown 7.5YR 5/4, dry), (sandy?) clay loam, many (30%) coarse strongly weathered gravel, high density, weak subangular blocky structure, few fine roots, common animal holes, gradual boundary.
Hiatus ?
red layer 94‐96cm
Reddish brown (2.5YR 4/4 moist, red 2.5YR 5/6, dry) clay, abrupt broken boundary. Abrupt boundary and change of parent material suggests an erosive hiatus before colluvial deposition. Origin of red band unknown.
Truncated
Soil
2 BC 90 � 140+cm
Yellowish red (5YR 5/6 moist; reddish yellow 7.5YR 7/6 dry) clay, many (40%) fine fresh quartz gravel, high density, weak subangular to angular blocky structure, no roots. Parent material: quartz vein
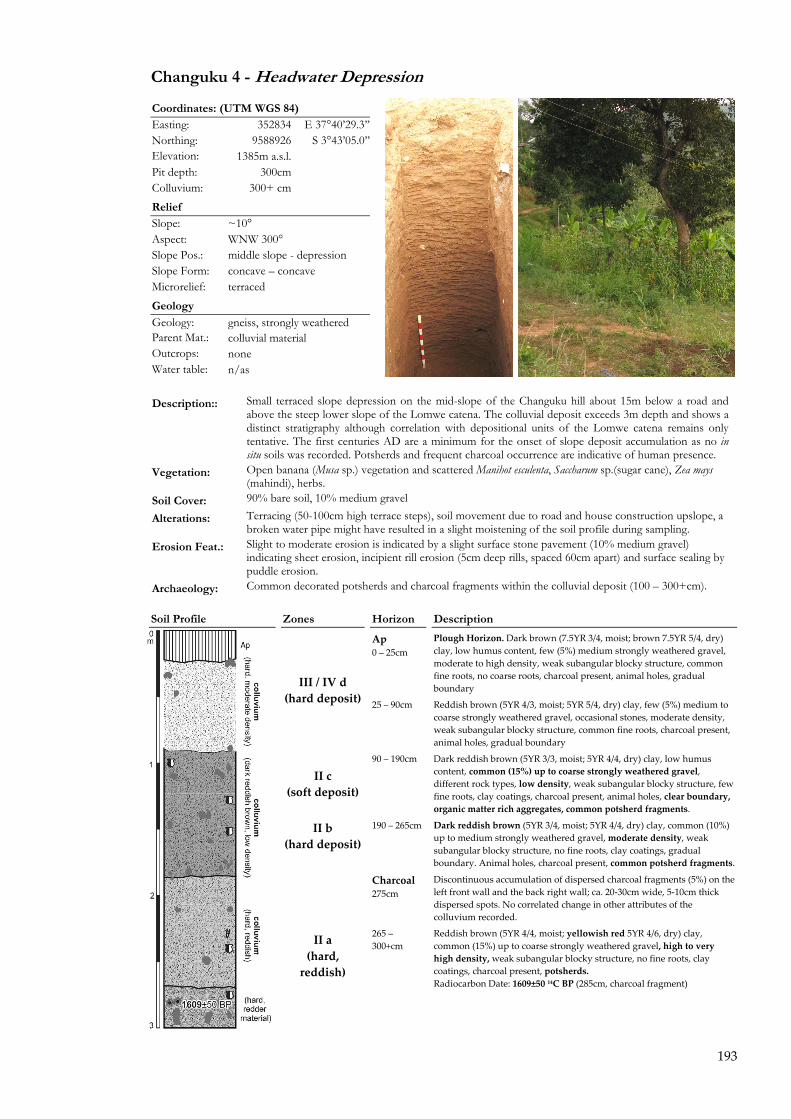
193
Changuku 4 - Headwater Depression
Coordinates: (UTM WGS 84) Easting: 352834 E 37°40�29.3�� Northing: 9588926 S 3°43�05.0�� Elevation: 1385m a.s.l. Pit depth: 300cm Colluvium: 300+ cm
Relief Slope: ~10° Aspect: WNW 300° Slope Pos.: middle slope - depression Slope Form: concave � concave Microrelief: terraced Geology Geology: gneiss, strongly weathered Parent Mat.: colluvial material Outcrops: none Water table: n/as Description:: Small terraced slope depression on the mid-slope of the Changuku hill about 15m below a road and
above the steep lower slope of the Lomwe catena. The colluvial deposit exceeds 3m depth and shows a distinct stratigraphy although correlation with depositional units of the Lomwe catena remains only tentative. The first centuries AD are a minimum for the onset of slope deposit accumulation as no in situ soils was recorded. Potsherds and frequent charcoal occurrence are indicative of human presence.
Vegetation: Open banana (Musa sp.) vegetation and scattered Manihot esculenta, Saccharum sp.(sugar cane), Zea mays (mahindi), herbs.
Soil Cover: 90% bare soil, 10% medium gravel
Alterations: Terracing (50-100cm high terrace steps), soil movement due to road and house construction upslope, a broken water pipe might have resulted in a slight moistening of the soil profile during sampling.
Erosion Feat.: Slight to moderate erosion is indicated by a slight surface stone pavement (10% medium gravel) indicating sheet erosion, incipient rill erosion (5cm deep rills, spaced 60cm apart) and surface sealing by puddle erosion.
Archaeology: Common decorated potsherds and charcoal fragments within the colluvial deposit (100 � 300+cm). Soil Profile Zones Horizon Description
Ap 0 � 25cm
Plough Horizon. Dark brown (7.5YR 3/4, moist; brown 7.5YR 5/4, dry) clay, low humus content, few (5%) medium strongly weathered gravel, moderate to high density, weak subangular blocky structure, common fine roots, no coarse roots, charcoal present, animal holes, gradual boundary III / IV d
(hard deposit) 25 � 90cm Reddish brown (5YR 4/3, moist; 5YR 5/4, dry) clay, few (5%) medium to coarse strongly weathered gravel, occasional stones, moderate density, weak subangular blocky structure, common fine roots, charcoal present, animal holes, gradual boundary
II c (soft deposit)
90 � 190cm Dark reddish brown (5YR 3/3, moist; 5YR 4/4, dry) clay, low humus content, common (15%) up to coarse strongly weathered gravel, different rock types, low density, weak subangular blocky structure, few fine roots, clay coatings, charcoal present, animal holes, clear boundary, organic matter rich aggregates, common potsherd fragments.
II b (hard deposit)
190 � 265cm Dark reddish brown (5YR 3/4, moist; 5YR 4/4, dry) clay, common (10%) up to medium strongly weathered gravel, moderate density, weak subangular blocky structure, no fine roots, clay coatings, gradual boundary. Animal holes, charcoal present, common potsherd fragments.
Charcoal 275cm
Discontinuous accumulation of dispersed charcoal fragments (5%) on the left front wall and the back right wall; ca. 20‐30cm wide, 5‐10cm thick dispersed spots. No correlated change in other attributes of the colluvium recorded.
II a (hard, reddish)
265 � 300+cm
Reddish brown (5YR 4/4, moist; yellowish red 5YR 4/6, dry) clay, common (15%) up to coarse strongly weathered gravel, high to very high density, weak subangular blocky structure, no fine roots, clay coatings, charcoal present, potsherds. Radiocarbon Date: 1609±50 14C BP (285cm, charcoal fragment)
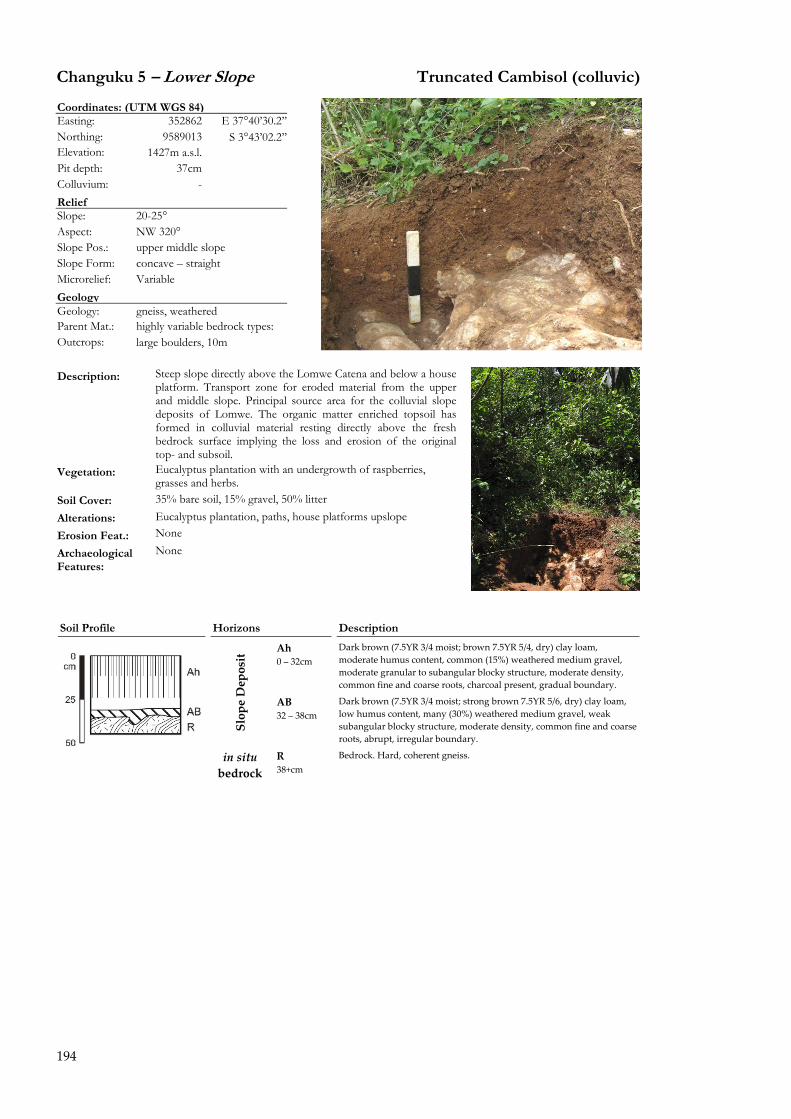
194
Changuku 5 � Lower Slope Truncated Cambisol (colluvic)
Coordinates: (UTM WGS 84) Easting: 352862 E 37°40�30.2�� Northing: 9589013 S 3°43�02.2�� Elevation: 1427m a.s.l. Pit depth: 37cm Colluvium: - Relief Slope: 20-25° Aspect: NW 320° Slope Pos.: upper middle slope Slope Form: concave � straight Microrelief: Variable Geology Geology: gneiss, weathered Parent Mat.: highly variable bedrock types: Outcrops: large boulders, 10m
Description: Steep slope directly above the Lomwe Catena and below a house
platform. Transport zone for eroded material from the upper and middle slope. Principal source area for the colluvial slope deposits of Lomwe. The organic matter enriched topsoil has formed in colluvial material resting directly above the fresh bedrock surface implying the loss and erosion of the original top- and subsoil.
Vegetation: Eucalyptus plantation with an undergrowth of raspberries, grasses and herbs.
Soil Cover: 35% bare soil, 15% gravel, 50% litter Alterations: Eucalyptus plantation, paths, house platforms upslope Erosion Feat.: None
Archaeological Features:
None
Soil Profile Horizons Description
Ah 0 � 32cm
Dark brown (7.5YR 3/4 moist; brown 7.5YR 5/4, dry) clay loam, moderate humus content, common (15%) weathered medium gravel, moderate granular to subangular blocky structure, moderate density, common fine and coarse roots, charcoal present, gradual boundary.
Slope Deposit
AB 32 � 38cm
Dark brown (7.5YR 3/4 moist; strong brown 7.5YR 5/6, dry) clay loam, low humus content, many (30%) weathered medium gravel, weak subangular blocky structure, moderate density, common fine and coarse roots, abrupt, irregular boundary.
in situ bedrock
R 38+cm
Bedrock. Hard, coherent gneiss.
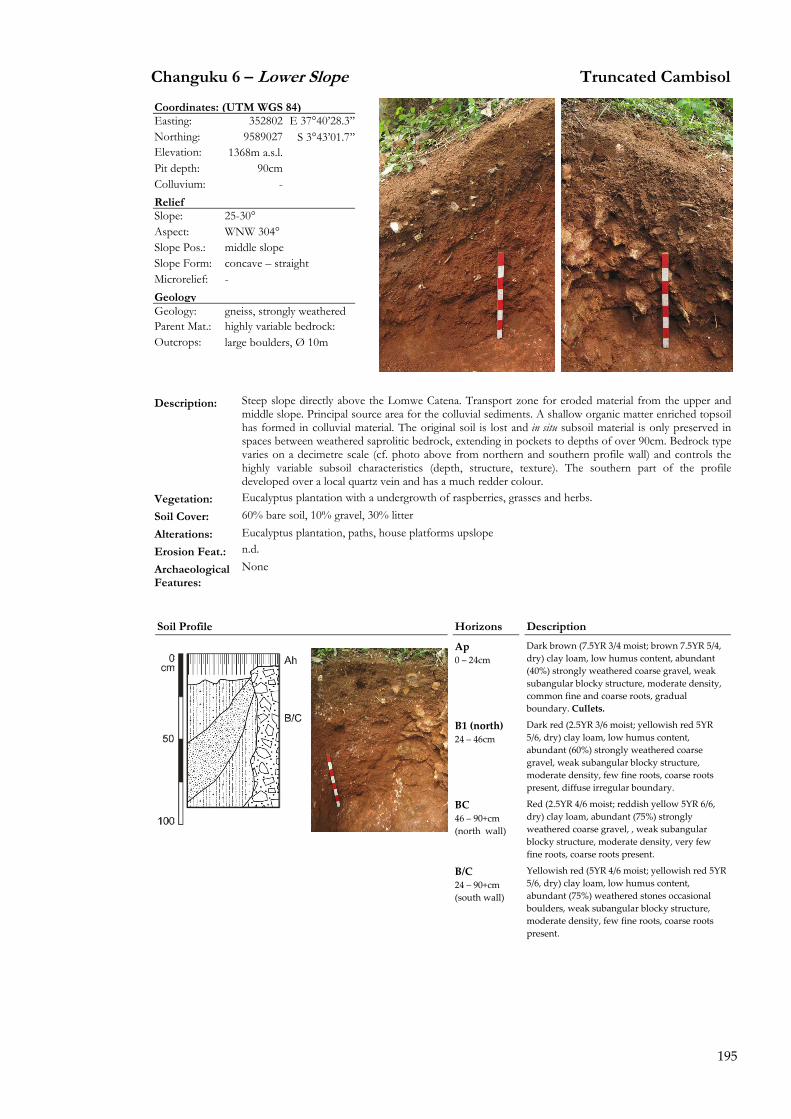
195
Changuku 6 � Lower Slope Truncated Cambisol
Coordinates: (UTM WGS 84) Easting: 352802 E 37°40�28.3��Northing: 9589027 S 3°43�01.7��Elevation: 1368m a.s.l. Pit depth: 90cm Colluvium: - Relief Slope: 25-30° Aspect: WNW 304° Slope Pos.: middle slope Slope Form: concave � straight Microrelief: - Geology Geology: gneiss, strongly weathered Parent Mat.: highly variable bedrock: Outcrops: large boulders, Ø 10m
Description: Steep slope directly above the Lomwe Catena. Transport zone for eroded material from the upper and
middle slope. Principal source area for the colluvial sediments. A shallow organic matter enriched topsoil has formed in colluvial material. The original soil is lost and in situ subsoil material is only preserved in spaces between weathered saprolitic bedrock, extending in pockets to depths of over 90cm. Bedrock type varies on a decimetre scale (cf. photo above from northern and southern profile wall) and controls the highly variable subsoil characteristics (depth, structure, texture). The southern part of the profile developed over a local quartz vein and has a much redder colour.
Vegetation: Eucalyptus plantation with a undergrowth of raspberries, grasses and herbs. Soil Cover: 60% bare soil, 10% gravel, 30% litter Alterations: Eucalyptus plantation, paths, house platforms upslope Erosion Feat.: n.d.
Archaeological Features:
None
Soil Profile Horizons Description
Ap 0 � 24cm
Dark brown (7.5YR 3/4 moist; brown 7.5YR 5/4, dry) clay loam, low humus content, abundant (40%) strongly weathered coarse gravel, weak subangular blocky structure, moderate density, common fine and coarse roots, gradual boundary. Cullets.
B1 (north) 24 � 46cm
Dark red (2.5YR 3/6 moist; yellowish red 5YR 5/6, dry) clay loam, low humus content, abundant (60%) strongly weathered coarse gravel, weak subangular blocky structure, moderate density, few fine roots, coarse roots present, diffuse irregular boundary.
BC 46 � 90+cm (north wall)
Red (2.5YR 4/6 moist; reddish yellow 5YR 6/6, dry) clay loam, abundant (75%) strongly weathered coarse gravel, , weak subangular blocky structure, moderate density, very few fine roots, coarse roots present.
B/C 24 � 90+cm (south wall)
Yellowish red (5YR 4/6 moist; yellowish red 5YR 5/6, dry) clay loam, low humus content, abundant (75%) weathered stones occasional boulders, weak subangular blocky structure, moderate density, few fine roots, coarse roots present.

196
B.2 Lomwe: Slope deposit descriptions
Lomwe 3 � Late Pleistocene topsoil
Lomwe 3: Analysis Overview
0 2 4 6 8 10fd% [%]
0 2 4 6 8 10 12
χlf [10-6 m3kg-1]
4.5 5 5.5
pH
0 10 20 30 40
C/N-Ratio [%]
-26 -24 -22 -20 -18δ13C [‰]
5 10 15
LOI 550°C [%]
0 1 2 3Corg [%]
300
200
100
0
Dep
th [c
m]
Cha
rcoa
l
Coordinates: (UTM WGS 84)
Easting: 352807 Northing: 9589045 Elevation: 1341m a.s.l. Pit depth: 285cm Colluvium: 140+cm Relief Slope: ~15° Aspect: NNW 338° Slope Pos.: lower slope Slope Form: concave � concave Microrelief: terraced Geology Geology: gneiss, strongly weathered Parent Mat.: colluvial material Outcrops: none Water table: n/a
Uppermost colluvial soil profile recording a buried late Pleistocene topsoil in 2m depth. The soft very dark brown and organic matter rich buried forest soil is most prominent at the lower right corner of the soil pit and thins out towards the upper corners. The distinct topsoil horizon is buried by about a metre of dark reddish brown colluvial material of a similarly low bulk density (<1.2g ccm-1), which is overlain by a further metre of compact red material. A charcoal fragment from the buried dates to 14.812±73 14C BP, whereas soil organic.matter shows a younger radiocarbon age of 12.299±64 14C BP. The buried forest soil rests on a bright in situ subsoil horizons.
Description:
to cross a small terrace step. The construction of the terrace however did not lead to any visible alterations of the soil material
Vegetation: Eucalyptus with a thick undergrowth of ograsses and herbs. Soil Cover: n.d. Alterations: Terracing, agriculture, paths Erosion Feat.: n.d.
A. Features: None
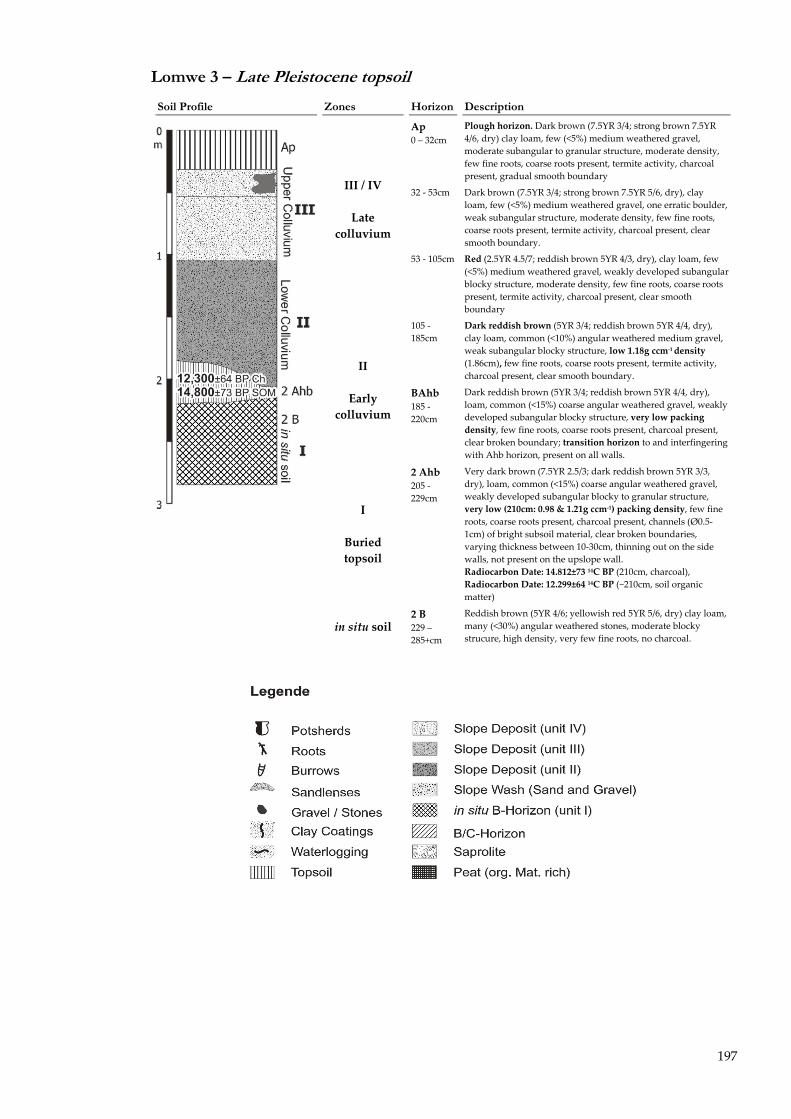
197
Lomwe 3 � Late Pleistocene topsoil
Soil Profile Zones Horizon Description
Ap 0 � 32cm
Plough horizon. Dark brown (7.5YR 3/4; strong brown 7.5YR 4/6, dry) clay loam, few (<5%) medium weathered gravel, moderate subangular to granular structure, moderate density, few fine roots, coarse roots present, termite activity, charcoal present, gradual smooth boundary
32 ‐ 53cm Dark brown (7.5YR 3/4; strong brown 7.5YR 5/6, dry), clay loam, few (<5%) medium weathered gravel, one erratic boulder, weak subangular structure, moderate density, few fine roots, coarse roots present, termite activity, charcoal present, clear smooth boundary.
III / IV
Late colluvium
53 ‐ 105cm Red (2.5YR 4.5/7; reddish brown 5YR 4/3, dry), clay loam, few
(<5%) medium weathered gravel, weakly developed subangular blocky structure, moderate density, few fine roots, coarse roots present, termite activity, charcoal present, clear smooth boundary
105 ‐ 185cm
Dark reddish brown (5YR 3/4; reddish brown 5YR 4/4, dry), clay loam, common (<10%) angular weathered medium gravel, weak subangular blocky structure, low 1.18g ccm‐1 density (1.86cm), few fine roots, coarse roots present, termite activity, charcoal present, clear smooth boundary.
II
Early colluvium
BAhb 185 ‐ 220cm
Dark reddish brown (5YR 3/4; reddish brown 5YR 4/4, dry), loam, common (<15%) coarse angular weathered gravel, weakly developed subangular blocky structure, very low packing density, few fine roots, coarse roots present, charcoal present, clear broken boundary; transition horizon to and interfingering with Ahb horizon, present on all walls.
I
Buried topsoil
2 Ahb 205 ‐ 229cm
Very dark brown (7.5YR 2.5/3; dark reddish brown 5YR 3/3, dry), loam, common (<15%) coarse angular weathered gravel, weakly developed subangular blocky to granular structure, very low (210cm: 0.98 & 1.21g ccm‐1) packing density, few fine roots, coarse roots present, charcoal present, channels (Ø0.5‐1cm) of bright subsoil material, clear broken boundaries, varying thickness between 10‐30cm, thinning out on the side walls, not present on the upslope wall. Radiocarbon Date: 14.812±73 14C BP (210cm, charcoal), Radiocarbon Date: 12.299±64 14C BP (~210cm, soil organic matter)
in situ soil 2 B 229 � 285+cm
Reddish brown (5YR 4/6; yellowish red 5YR 5/6, dry) clay loam, many (<30%) angular weathered stones, moderate blocky strucure, high density, very few fine roots, no charcoal.
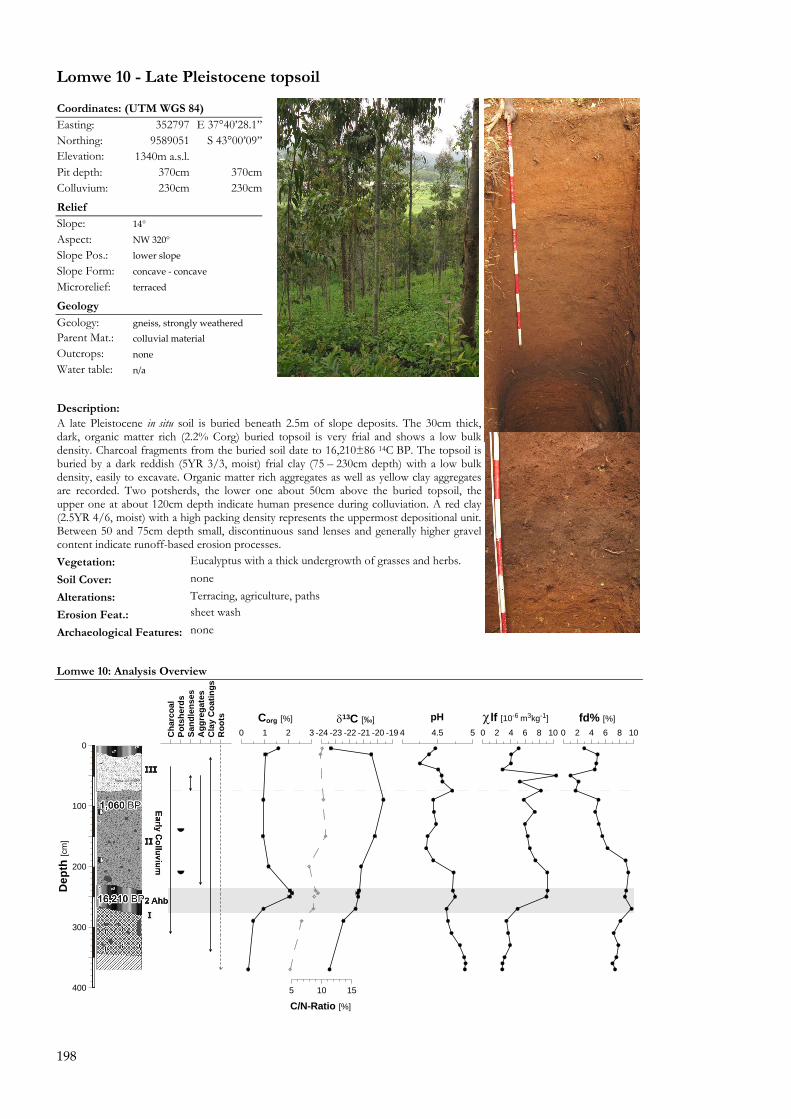
198
Lomwe 10 - Late Pleistocene topsoil
Lomwe 10: Analysis Overview
0 2 4 6 8 10fd% [%]
0 2 4 6 8 10
χlf [10-6 m3kg-1]
4 4.5 5
pH
5 10 15
C/N-Ratio [%]
-24 -23 -22 -21 -20 -19δ13C [‰]
0 1 2 3Corg [%]
400
300
200
100
0
Dep
th [c
m]
Cha
rcoa
lPo
tshe
rds
Sand
lens
esA
ggre
gate
sC
lay
Coa
tings
Roo
ts
Coordinates: (UTM WGS 84) Easting: 352797 E 37°40�28.1�� Northing: 9589051 S 43°00�09�� Elevation: 1340m a.s.l. Pit depth: 370cm 370cm Colluvium: 230cm 230cm
Relief Slope: 14° Aspect: NW 320° Slope Pos.: lower slope Slope Form: concave ‐ concave Microrelief: terraced Geology Geology: gneiss, strongly weathered Parent Mat.: colluvial material Outcrops: none Water table: n/a
Description: A late Pleistocene in situ soil is buried beneath 2.5m of slope deposits. The 30cm thick, dark, organic matter rich (2.2% Corg) buried topsoil is very frial and shows a low bulk density. Charcoal fragments from the buried soil date to 16,210±86 14C BP. The topsoil is buried by a dark reddish (5YR 3/3, moist) frial clay (75 � 230cm depth) with a low bulk density, easily to excavate. Organic matter rich aggregates as well as yellow clay aggregates are recorded. Two potsherds, the lower one about 50cm above the buried topsoil, the upper one at about 120cm depth indicate human presence during colluviation. A red clay (2.5YR 4/6, moist) with a high packing density represents the uppermost depositional unit. Between 50 and 75cm depth small, discontinuous sand lenses and generally higher gravel content indicate runoff-based erosion processes. Vegetation: Eucalyptus with a thick undergrowth of grasses and herbs. Soil Cover: none Alterations: Terracing, agriculture, paths Erosion Feat.: sheet wash
Archaeological Features: none
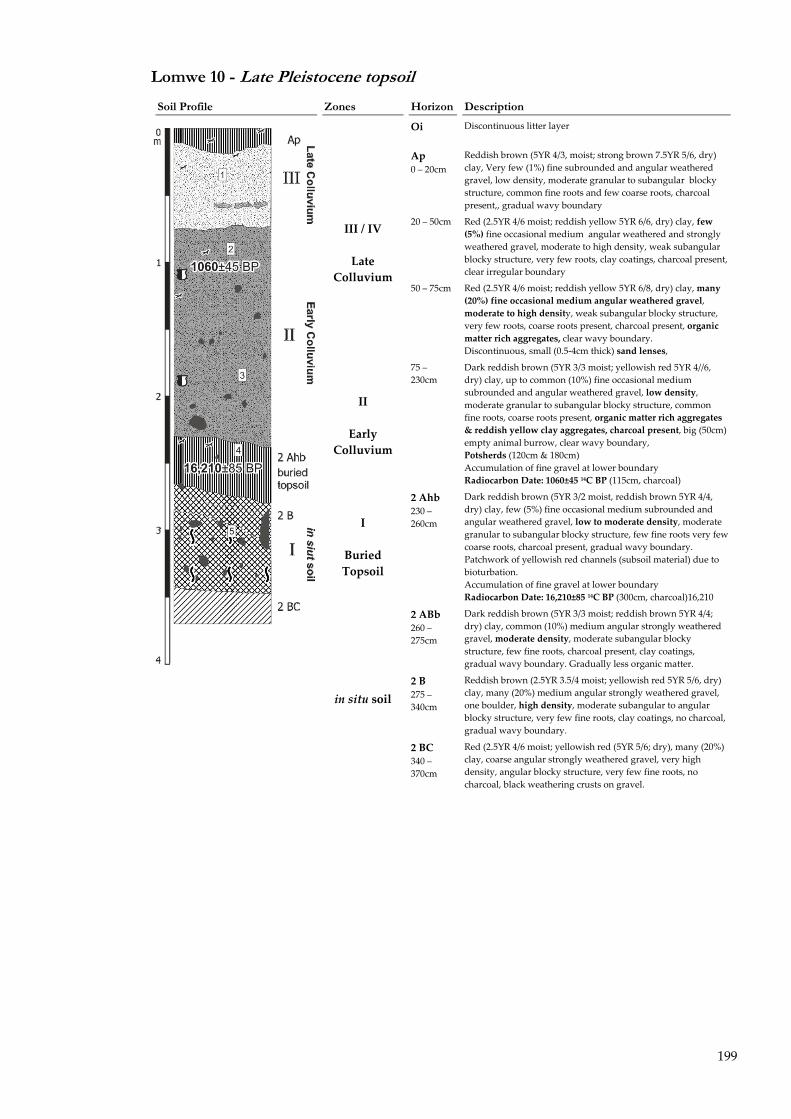
199
Lomwe 10 - Late Pleistocene topsoil
Soil Profile Zones Horizon Description
Oi Discontinuous litter layer
Ap 0 � 20cm
Reddish brown (5YR 4/3, moist; strong brown 7.5YR 5/6, dry) clay, Very few (1%) fine subrounded and angular weathered gravel, low density, moderate granular to subangular blocky structure, common fine roots and few coarse roots, charcoal present,, gradual wavy boundary
20 � 50cm Red (2.5YR 4/6 moist; reddish yellow 5YR 6/6, dry) clay, few (5%) fine occasional medium angular weathered and strongly weathered gravel, moderate to high density, weak subangular blocky structure, very few roots, clay coatings, charcoal present, clear irregular boundary
III / IV
Late Colluvium
50 � 75cm Red (2.5YR 4/6 moist; reddish yellow 5YR 6/8, dry) clay, many (20%) fine occasional medium angular weathered gravel, moderate to high density, weak subangular blocky structure, very few roots, coarse roots present, charcoal present, organic matter rich aggregates, clear wavy boundary. Discontinuous, small (0.5‐4cm thick) sand lenses,
75 � 230cm
Dark reddish brown (5YR 3/3 moist; yellowish red 5YR 4//6, dry) clay, up to common (10%) fine occasional medium subrounded and angular weathered gravel, low density, moderate granular to subangular blocky structure, common fine roots, coarse roots present, organic matter rich aggregates & reddish yellow clay aggregates, charcoal present, big (50cm) empty animal burrow, clear wavy boundary, Potsherds (120cm & 180cm) Accumulation of fine gravel at lower boundary Radiocarbon Date: 1060±45 14C BP (115cm, charcoal)
II
Early Colluvium
I
Buried Topsoil
2 Ahb 230 � 260cm
Dark reddish brown (5YR 3/2 moist, reddish brown 5YR 4/4, dry) clay, few (5%) fine occasional medium subrounded and angular weathered gravel, low to moderate density, moderate granular to subangular blocky structure, few fine roots very few coarse roots, charcoal present, gradual wavy boundary. Patchwork of yellowish red channels (subsoil material) due to bioturbation. Accumulation of fine gravel at lower boundary Radiocarbon Date: 16,210±85 14C BP (300cm, charcoal)16,210
2 ABb 260 � 275cm
Dark reddish brown (5YR 3/3 moist; reddish brown 5YR 4/4; dry) clay, common (10%) medium angular strongly weathered gravel, moderate density, moderate subangular blocky structure, few fine roots, charcoal present, clay coatings, gradual wavy boundary. Gradually less organic matter.
2 B 275 � 340cm
Reddish brown (2.5YR 3.5/4 moist; yellowish red 5YR 5/6, dry) clay, many (20%) medium angular strongly weathered gravel, one boulder, high density, moderate subangular to angular blocky structure, very few fine roots, clay coatings, no charcoal, gradual wavy boundary.
in situ soil
2 BC 340 � 370cm
Red (2.5YR 4/6 moist; yellowish red (5YR 5/6; dry), many (20%) clay, coarse angular strongly weathered gravel, very high density, angular blocky structure, very few fine roots, no charcoal, black weathering crusts on gravel.
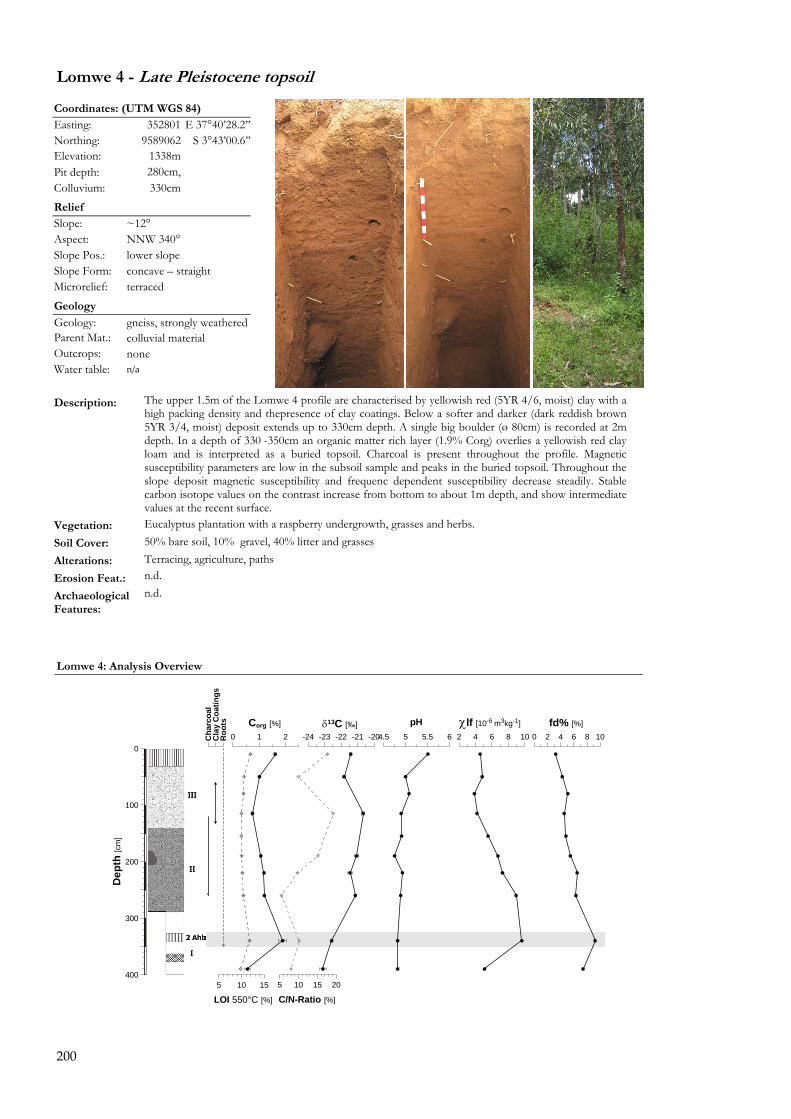
200
Lomwe 4 - Late Pleistocene topsoil
Lomwe 4: Analysis Overview
0 2 4 6 8 10fd% [%]
2 4 6 8 10
χlf [10-6 m3kg-1]
4.5 5 5.5 6
pH
5 10 15 20
C/N-Ratio [%]
-24 -23 -22 -21 -20δ13C [‰]
5 10 15
LOI 550°C [%]
0 1 2Corg [%]
400
300
200
100
0
Dep
th [c
m]
Cha
rcoa
lC
lay
Coa
tings
Roo
ts
Coordinates: (UTM WGS 84) Easting: 352801 E 37°40�28.2�� Northing: 9589062 S 3°43�00.6�� Elevation: 1338m Pit depth: 280cm, Colluvium: 330cm
Relief Slope: ~12° Aspect: NNW 340° Slope Pos.: lower slope Slope Form: concave � straight Microrelief: terraced Geology Geology: gneiss, strongly weathered Parent Mat.: colluvial material Outcrops: none Water table: n/a
Description: The upper 1.5m of the Lomwe 4 profile are characterised by yellowish red (5YR 4/6, moist) clay with a
high packing density and thepresence of clay coatings. Below a softer and darker (dark reddish brown 5YR 3/4, moist) deposit extends up to 330cm depth. A single big boulder (ø 80cm) is recorded at 2m depth. In a depth of 330 -350cm an organic matter rich layer (1.9% Corg) overlies a yellowish red clay loam and is interpreted as a buried topsoil. Charcoal is present throughout the profile. Magnetic susceptibility parameters are low in the subsoil sample and peaks in the buried topsoil. Throughout the slope deposit magnetic susceptibility and frequenc dependent susceptibility decrease steadily. Stable carbon isotope values on the contrast increase from bottom to about 1m depth, and show intermediate values at the recent surface.
Vegetation: Eucalyptus plantation with a raspberry undergrowth, grasses and herbs. Soil Cover: 50% bare soil, 10% gravel, 40% litter and grasses Alterations: Terracing, agriculture, paths Erosion Feat.: n.d.
Archaeological Features:
n.d.
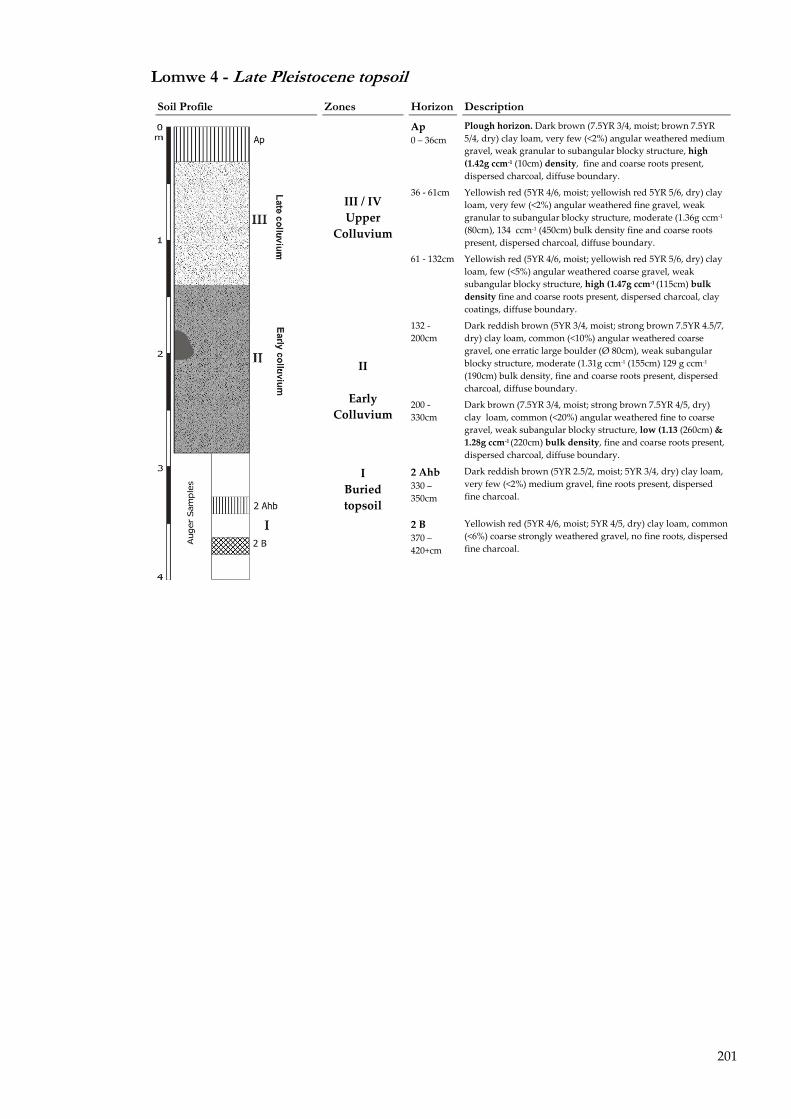
201
Lomwe 4 - Late Pleistocene topsoil
Soil Profile Zones Horizon Description
Ap 0 � 36cm
Plough horizon. Dark brown (7.5YR 3/4, moist; brown 7.5YR 5/4, dry) clay loam, very few (<2%) angular weathered medium gravel, weak granular to subangular blocky structure, high (1.42g ccm‐1 (10cm) density, fine and coarse roots present, dispersed charcoal, diffuse boundary.
36 ‐ 61cm Yellowish red (5YR 4/6, moist; yellowish red 5YR 5/6, dry) clay loam, very few (<2%) angular weathered fine gravel, weak granular to subangular blocky structure, moderate (1.36g ccm‐1 (80cm), 134 ccm‐1 (450cm) bulk density fine and coarse roots present, dispersed charcoal, diffuse boundary.
III / IV Upper
Colluvium
61 ‐ 132cm Yellowish red (5YR 4/6, moist; yellowish red 5YR 5/6, dry) clay loam, few (<5%) angular weathered coarse gravel, weak subangular blocky structure, high (1.47g ccm‐1 (115cm) bulk density fine and coarse roots present, dispersed charcoal, clay coatings, diffuse boundary.
132 ‐ 200cm
Dark reddish brown (5YR 3/4, moist; strong brown 7.5YR 4.5/7, dry) clay loam, common (<10%) angular weathered coarse gravel, one erratic large boulder (Ø 80cm), weak subangular blocky structure, moderate (1.31g ccm‐1 (155cm) 129 g ccm‐1 (190cm) bulk density, fine and coarse roots present, dispersed charcoal, diffuse boundary.
II
Early Colluvium
200 ‐ 330cm
Dark brown (7.5YR 3/4, moist; strong brown 7.5YR 4/5, dry) clay loam, common (<20%) angular weathered fine to coarse gravel, weak subangular blocky structure, low (1.13 (260cm) & 1.28g ccm‐1 (220cm) bulk density, fine and coarse roots present, dispersed charcoal, diffuse boundary.
I Buried topsoil
2 Ahb 330 � 350cm
Dark reddish brown (5YR 2.5/2, moist; 5YR 3/4, dry) clay loam, very few (<2%) medium gravel, fine roots present, dispersed fine charcoal.
2 B 370 � 420+cm
Yellowish red (5YR 4/6, moist; 5YR 4/5, dry) clay loam, common (<6%) coarse strongly weathered gravel, no fine roots, dispersed fine charcoal.
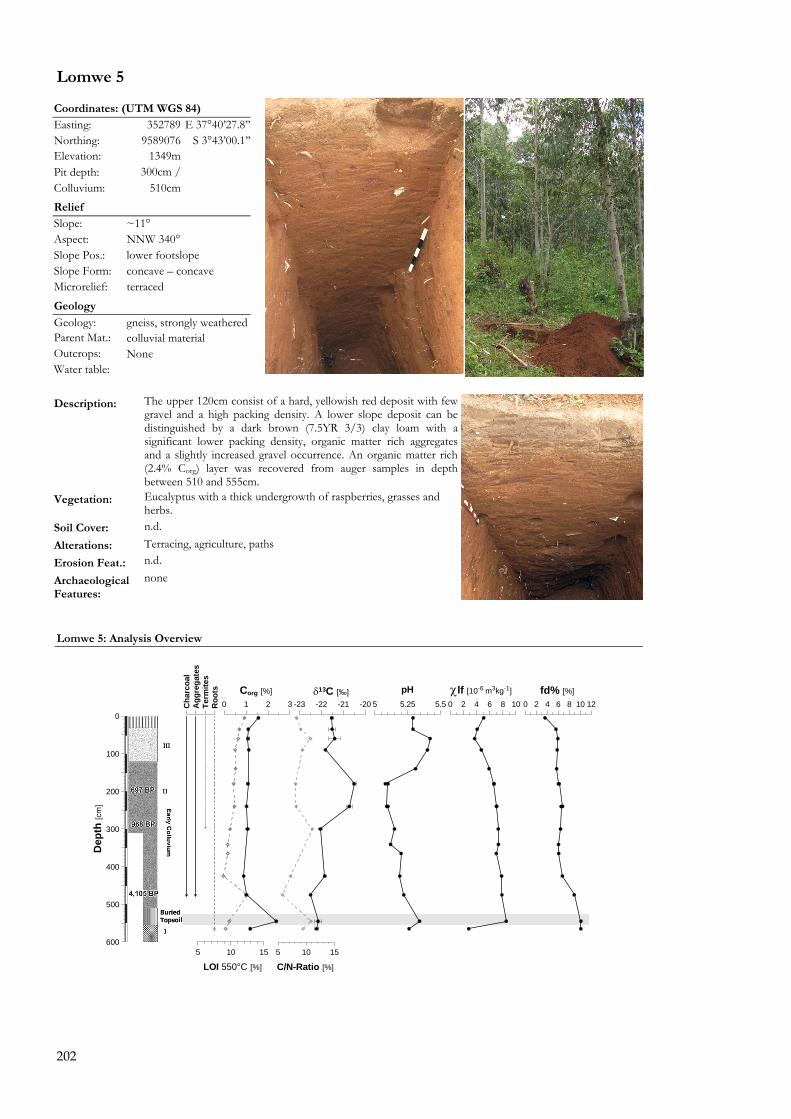
202
Lomwe 5
Lomwe 5: Analysis Overview
0 2 4 6 8 10 12fd% [%]
0 2 4 6 8 10
χlf [10-6 m3kg-1]
5 5.25 5.5
pH
5 10 15
C/N-Ratio [%]
-23 -22 -21 -20δ13C [‰]
5 10 15
LOI 550°C [%]
0 1 2 3Corg [%]
600
500
400
300
200
100
0
Dep
th [c
m]
Cha
rcoa
lA
ggre
gate
sTe
rmite
sR
oots
Coordinates: (UTM WGS 84) Easting: 352789 E 37°40�27.8�� Northing: 9589076 S 3°43�00.1�� Elevation: 1349m Pit depth: 300cm / Colluvium: 510cm
Relief Slope: ~11° Aspect: NNW 340° Slope Pos.: lower footslope Slope Form: concave � concave Microrelief: terraced Geology Geology: gneiss, strongly weathered Parent Mat.: colluvial material Outcrops: None Water table: Description: The upper 120cm consist of a hard, yellowish red deposit with few
gravel and a high packing density. A lower slope deposit can be distinguished by a dark brown (7.5YR 3/3) clay loam with a significant lower packing density, organic matter rich aggregates and a slightly increased gravel occurrence. An organic matter rich (2.4% Corg) layer was recovered from auger samples in depth between 510 and 555cm.
Vegetation: Eucalyptus with a thick undergrowth of raspberries, grasses and herbs.
Soil Cover: n.d. Alterations: Terracing, agriculture, paths Erosion Feat.: n.d.
Archaeological Features:
none
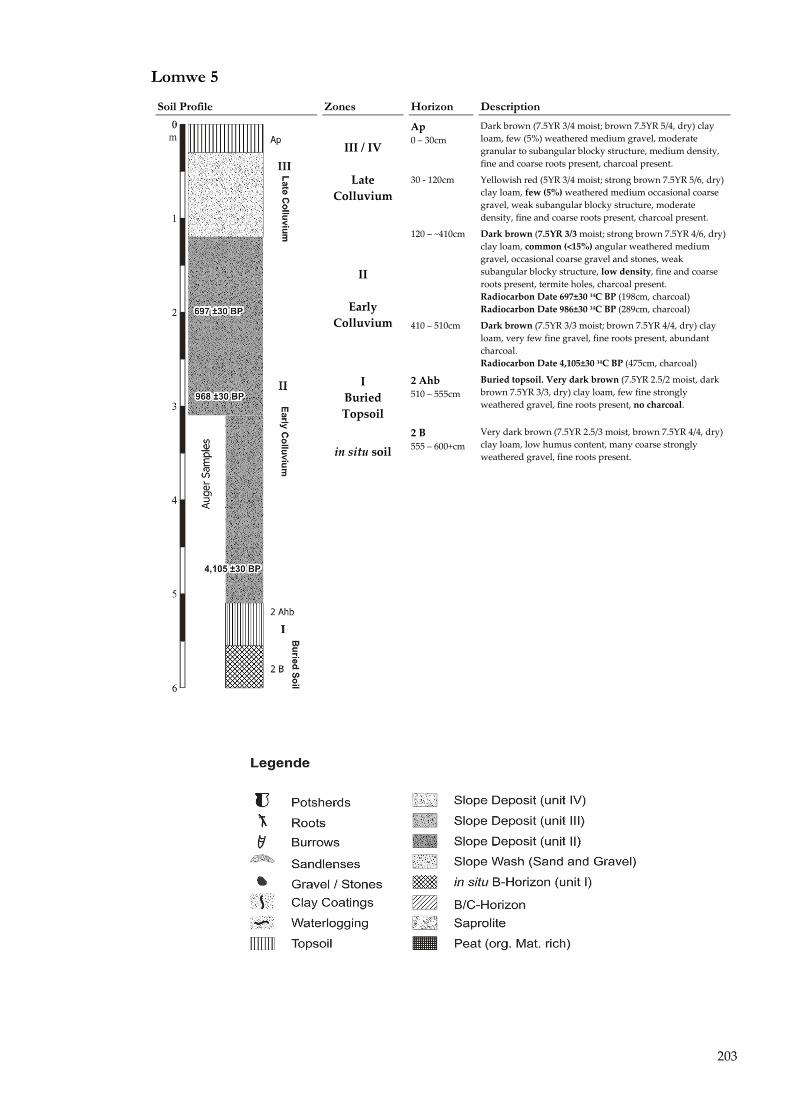
203
Lomwe 5
Soil Profile Zones Horizon Description
Ap 0 � 30cm
Dark brown (7.5YR 3/4 moist; brown 7.5YR 5/4, dry) clay loam, few (5%) weathered medium gravel, moderate granular to subangular blocky structure, medium density, fine and coarse roots present, charcoal present.
III / IV
Late Colluvium
30 ‐ 120cm Yellowish red (5YR 3/4 moist; strong brown 7.5YR 5/6, dry) clay loam, few (5%) weathered medium occasional coarse gravel, weak subangular blocky structure, moderate density, fine and coarse roots present, charcoal present.
120 � ~410cm Dark brown (7.5YR 3/3 moist; strong brown 7.5YR 4/6, dry) clay loam, common (<15%) angular weathered medium gravel, occasional coarse gravel and stones, weak subangular blocky structure, low density, fine and coarse roots present, termite holes, charcoal present. Radiocarbon Date 697±30 14C BP (198cm, charcoal) Radiocarbon Date 986±30 14C BP (289cm, charcoal)
II
Early Colluvium 410 � 510cm
Dark brown (7.5YR 3/3 moist; brown 7.5YR 4/4, dry) clay loam, very few fine gravel, fine roots present, abundant charcoal. Radiocarbon Date 4,105±30 14C BP (475cm, charcoal)
I Buried Topsoil
2 Ahb 510 � 555cm
Buried topsoil. Very dark brown (7.5YR 2.5/2 moist, dark brown 7.5YR 3/3, dry) clay loam, few fine strongly weathered gravel, fine roots present, no charcoal.
in situ soil 2 B 555 � 600+cm
Very dark brown (7.5YR 2.5/3 moist, brown 7.5YR 4/4, dry) clay loam, low humus content, many coarse strongly weathered gravel, fine roots present.
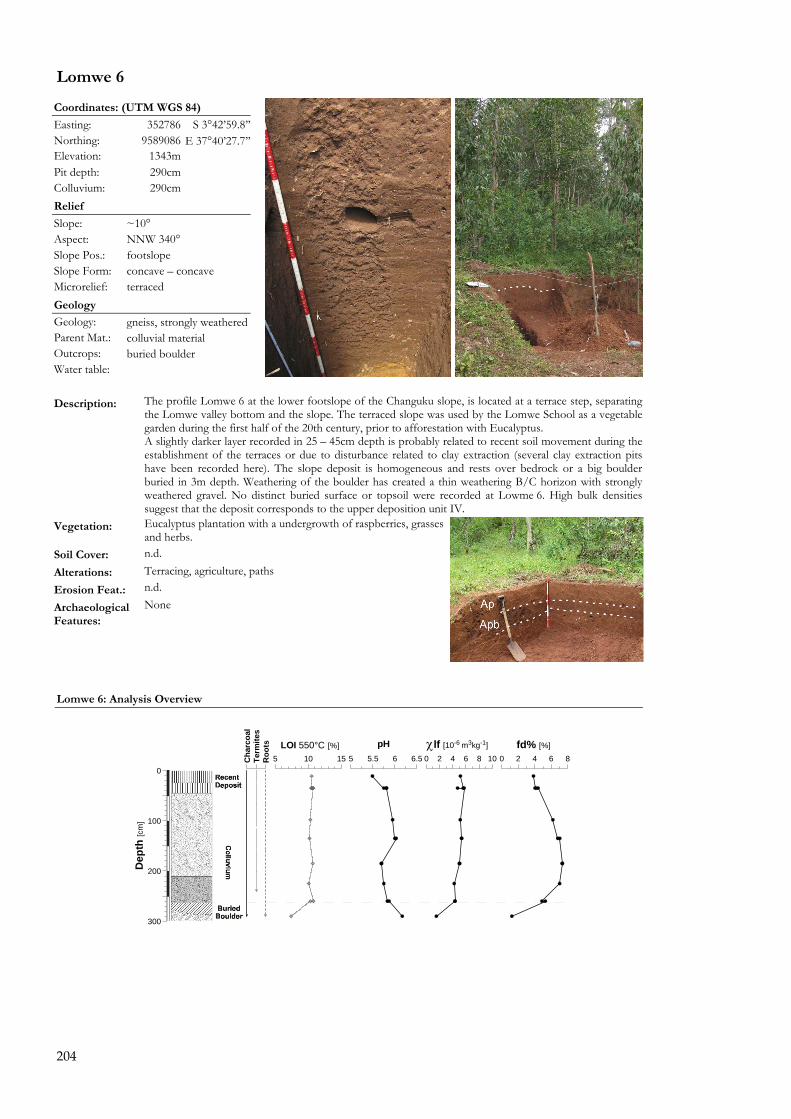
204
Lomwe 6
Lomwe 6: Analysis Overview
0 2 4 6 8fd% [%]
0 2 4 6 8 10
χlf [10-6 m3kg-1]
5 5.5 6 6.5
pH5 10 15
LOI 550°C [%]
300
200
100
0
Dep
th [c
m]
Cha
rcoa
lTe
rmite
sR
oots
Coordinates: (UTM WGS 84) Easting: 352786 S 3°42�59.8�� Northing: 9589086 E 37°40�27.7�� Elevation: 1343m Pit depth: 290cm Colluvium: 290cm Relief Slope: ~10° Aspect: NNW 340° Slope Pos.: footslope Slope Form: concave � concave Microrelief: terraced Geology Geology: gneiss, strongly weathered Parent Mat.: colluvial material Outcrops: buried boulder Water table: Description: The profile Lomwe 6 at the lower footslope of the Changuku slope, is located at a terrace step, separating
the Lomwe valley bottom and the slope. The terraced slope was used by the Lomwe School as a vegetable garden during the first half of the 20th century, prior to afforestation with Eucalyptus. A slightly darker layer recorded in 25 � 45cm depth is probably related to recent soil movement during the establishment of the terraces or due to disturbance related to clay extraction (several clay extraction pits have been recorded here). The slope deposit is homogeneous and rests over bedrock or a big boulder buried in 3m depth. Weathering of the boulder has created a thin weathering B/C horizon with strongly weathered gravel. No distinct buried surface or topsoil were recorded at Lowme 6. High bulk densities suggest that the deposit corresponds to the upper deposition unit IV.
Vegetation: Eucalyptus plantation with a undergrowth of raspberries, grasses and herbs.
Soil Cover: n.d. Alterations: Terracing, agriculture, paths Erosion Feat.: n.d.
Archaeological Features:
None
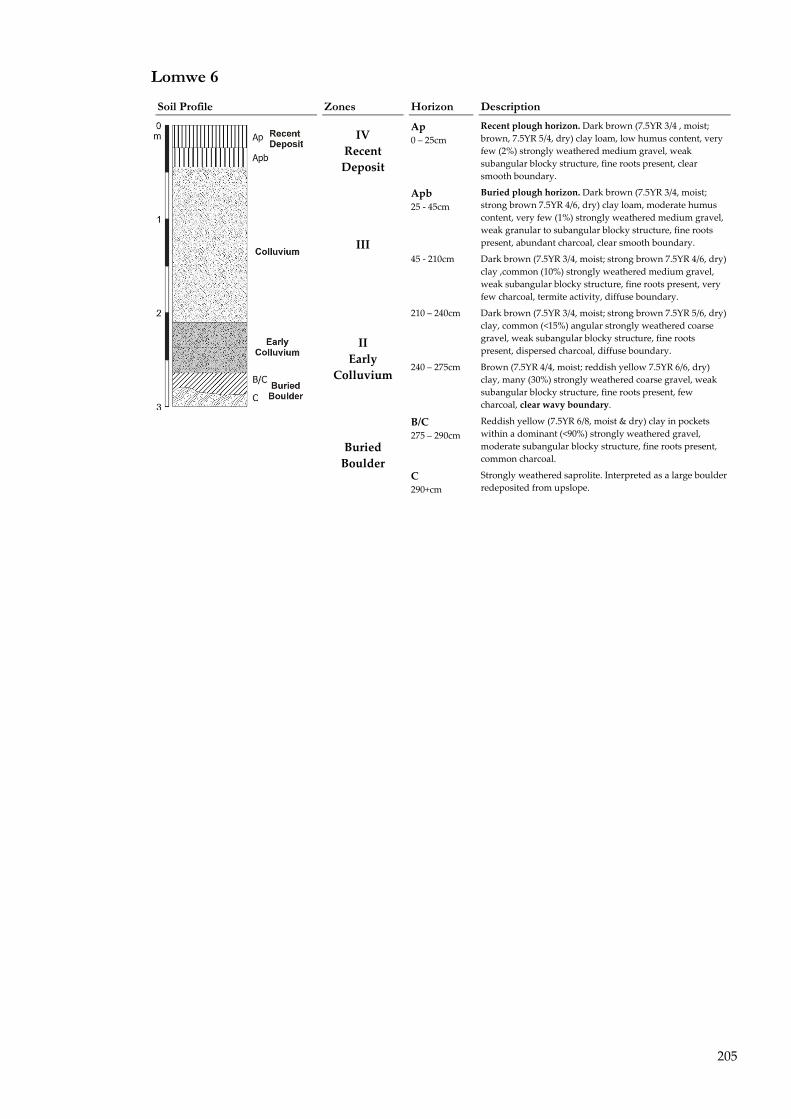
205
Lomwe 6
Soil Profile Zones Horizon Description
IV Recent Deposit
Ap 0 � 25cm
Recent plough horizon. Dark brown (7.5YR 3/4 , moist; brown, 7.5YR 5/4, dry) clay loam, low humus content, very few (2%) strongly weathered medium gravel, weak subangular blocky structure, fine roots present, clear smooth boundary.
Apb 25 ‐ 45cm
Buried plough horizon. Dark brown (7.5YR 3/4, moist; strong brown 7.5YR 4/6, dry) clay loam, moderate humus content, very few (1%) strongly weathered medium gravel, weak granular to subangular blocky structure, fine roots present, abundant charcoal, clear smooth boundary. III
45 ‐ 210cm Dark brown (7.5YR 3/4, moist; strong brown 7.5YR 4/6, dry) clay ,common (10%) strongly weathered medium gravel, weak subangular blocky structure, fine roots present, very few charcoal, termite activity, diffuse boundary.
210 � 240cm Dark brown (7.5YR 3/4, moist; strong brown 7.5YR 5/6, dry) clay, common (<15%) angular strongly weathered coarse gravel, weak subangular blocky structure, fine roots present, dispersed charcoal, diffuse boundary.
II Early
Colluvium 240 � 275cm Brown (7.5YR 4/4, moist; reddish yellow 7.5YR 6/6, dry)
clay, many (30%) strongly weathered coarse gravel, weak subangular blocky structure, fine roots present, few charcoal, clear wavy boundary.
B/C 275 � 290cm
Reddish yellow (7.5YR 6/8, moist & dry) clay in pockets within a dominant (<90%) strongly weathered gravel, moderate subangular blocky structure, fine roots present, common charcoal.
Buried Boulder
C 290+cm
Strongly weathered saprolite. Interpreted as a large boulder redeposited from upslope.
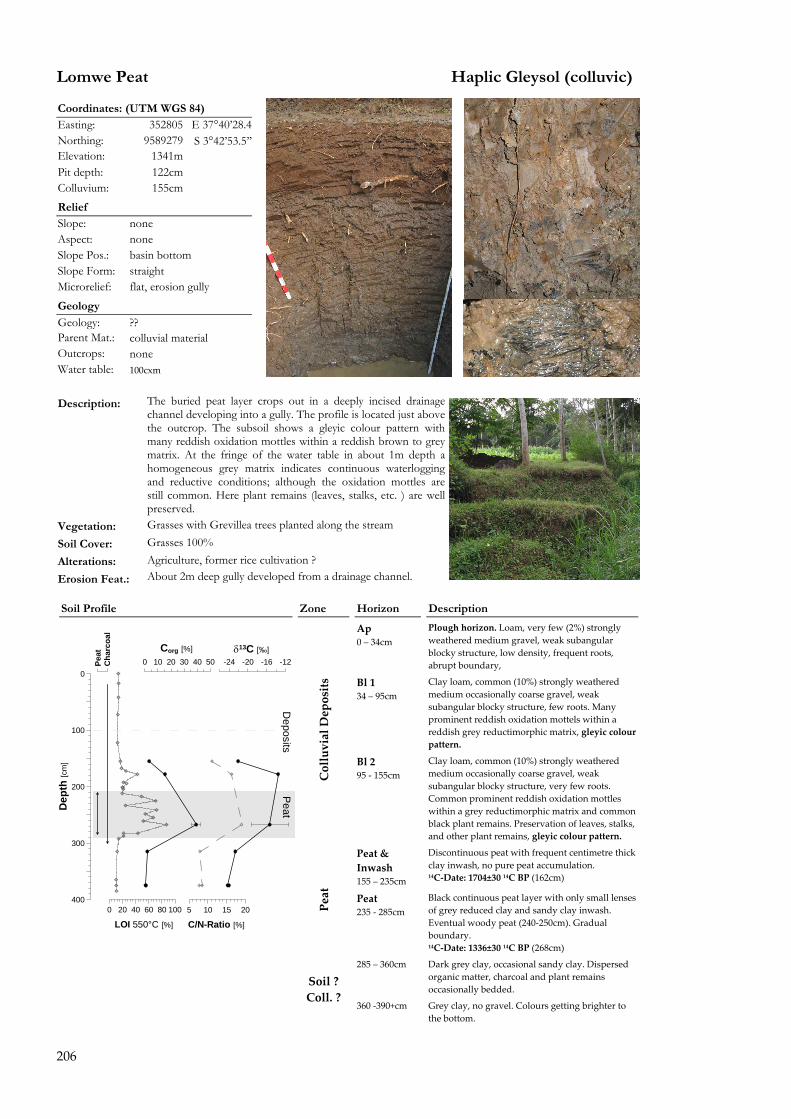
206
Lomwe Peat Haplic Gleysol (colluvic)
Soil Profile Zone Horizon Description
Ap 0 � 34cm
Plough horizon. Loam, very few (2%) strongly weathered medium gravel, weak subangular blocky structure, low density, frequent roots, abrupt boundary,
Bl 1 34 � 95cm
Clay loam, common (10%) strongly weathered medium occasionally coarse gravel, weak subangular blocky structure, few roots. Many prominent reddish oxidation mottels within a reddish grey reductimorphic matrix, gleyic colour pattern.
Colluvial Deposits
Bl 2 95 ‐ 155cm
Clay loam, common (10%) strongly weathered medium occasionally coarse gravel, weak subangular blocky structure, very few roots. Common prominent reddish oxidation mottles within a grey reductimorphic matrix and common black plant remains. Preservation of leaves, stalks, and other plant remains, gleyic colour pattern.
Peat & Inwash 155 � 235cm
Discontinuous peat with frequent centimetre thick clay inwash, no pure peat accumulation. 14C‐Date: 1704±30 14C BP (162cm)
Peat
Peat 235 ‐ 285cm
Black continuous peat layer with only small lenses of grey reduced clay and sandy clay inwash. Eventual woody peat (240‐250cm). Gradual boundary. 14C‐Date: 1336±30 14C BP (268cm)
285 � 360cm Dark grey clay, occasional sandy clay. Dispersed organic matter, charcoal and plant remains occasionally bedded.
Peat
Deposits
5 10 15 20
C/N-Ratio [%]
-24 -20 -16 -12δ13C [‰]
0 20 40 60 80 100
LOI 550°C [%]
0 10 20 30 40 50Corg [%]
400
300
200
100
0
Dep
th [c
m]
Peat
Cha
rcoa
l
Soil ? Coll. ?
360 ‐390+cm Grey clay, no gravel. Colours getting brighter to the bottom.
Coordinates: (UTM WGS 84) Easting: 352805 E 37°40�28.4 Northing: 9589279 S 3°42�53.5�� Elevation: 1341m Pit depth: 122cm Colluvium: 155cm
Relief Slope: none Aspect: none Slope Pos.: basin bottom Slope Form: straight Microrelief: flat, erosion gully Geology Geology: ?? Parent Mat.: colluvial material Outcrops: none Water table: 100cxm
Description: The buried peat layer crops out in a deeply incised drainage
channel developing into a gully. The profile is located just above the outcrop. The subsoil shows a gleyic colour pattern with many reddish oxidation mottles within a reddish brown to grey matrix. At the fringe of the water table in about 1m depth a homogeneous grey matrix indicates continuous waterlogging and reductive conditions; although the oxidation mottles are still common. Here plant remains (leaves, stalks, etc. ) are well preserved.
Vegetation: Grasses with Grevillea trees planted along the stream Soil Cover: Grasses 100% Alterations: Agriculture, former rice cultivation ? Erosion Feat.: About 2m deep gully developed from a drainage channel.
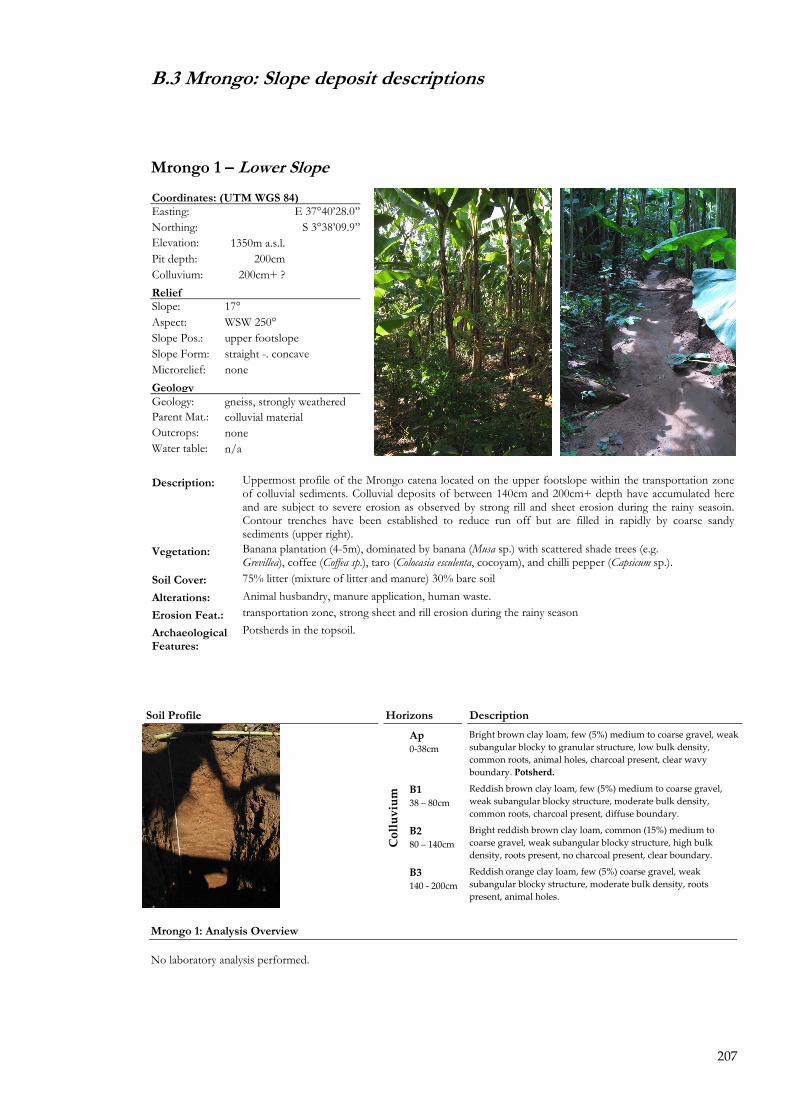
207
B.3 Mrongo: Slope deposit descriptions
Mrongo 1 � Lower Slope
Coordinates: (UTM WGS 84) Easting: E 37°40�28.0�� Northing: S 3°38�09.9�� Elevation: 1350m a.s.l. Pit depth: 200cm Colluvium: 200cm+ ? Relief Slope: 17° Aspect: WSW 250° Slope Pos.: upper footslope Slope Form: straight -. concave Microrelief: none Geology Geology: gneiss, strongly weathered Parent Mat.: colluvial material Outcrops: none Water table: n/a
Description: Uppermost profile of the Mrongo catena located on the upper footslope within the transportation zone
of colluvial sediments. Colluvial deposits of between 140cm and 200cm+ depth have accumulated here and are subject to severe erosion as observed by strong rill and sheet erosion during the rainy seasoin. Contour trenches have been established to reduce run off but are filled in rapidly by coarse sandy sediments (upper right).
Vegetation: Banana plantation (4-5m), dominated by banana (Musa sp.) with scattered shade trees (e.g. Grevillea), coffee (Coffea sp.), taro (Colocasia esculenta, cocoyam), and chilli pepper (Capsicum sp.).
Soil Cover: 75% litter (mixture of litter and manure) 30% bare soil Alterations: Animal husbandry, manure application, human waste. Erosion Feat.: transportation zone, strong sheet and rill erosion during the rainy season
Archaeological Features:
Potsherds in the topsoil.
Soil Profile Horizons Description
Ap 0‐38cm
Bright brown clay loam, few (5%) medium to coarse gravel, weak subangular blocky to granular structure, low bulk density, common roots, animal holes, charcoal present, clear wavy boundary. Potsherd.
B1 38 � 80cm
Reddish brown clay loam, few (5%) medium to coarse gravel, weak subangular blocky structure, moderate bulk density, common roots, charcoal present, diffuse boundary.
B2 80 � 140cm
Bright reddish brown clay loam, common (15%) medium to coarse gravel, weak subangular blocky structure, high bulk density, roots present, no charcoal present, clear boundary.
Colluvium
B3 140 ‐ 200cm
Reddish orange clay loam, few (5%) coarse gravel, weak subangular blocky structure, moderate bulk density, roots present, animal holes.
Mrongo 1: Analysis Overview No laboratory analysis performed.
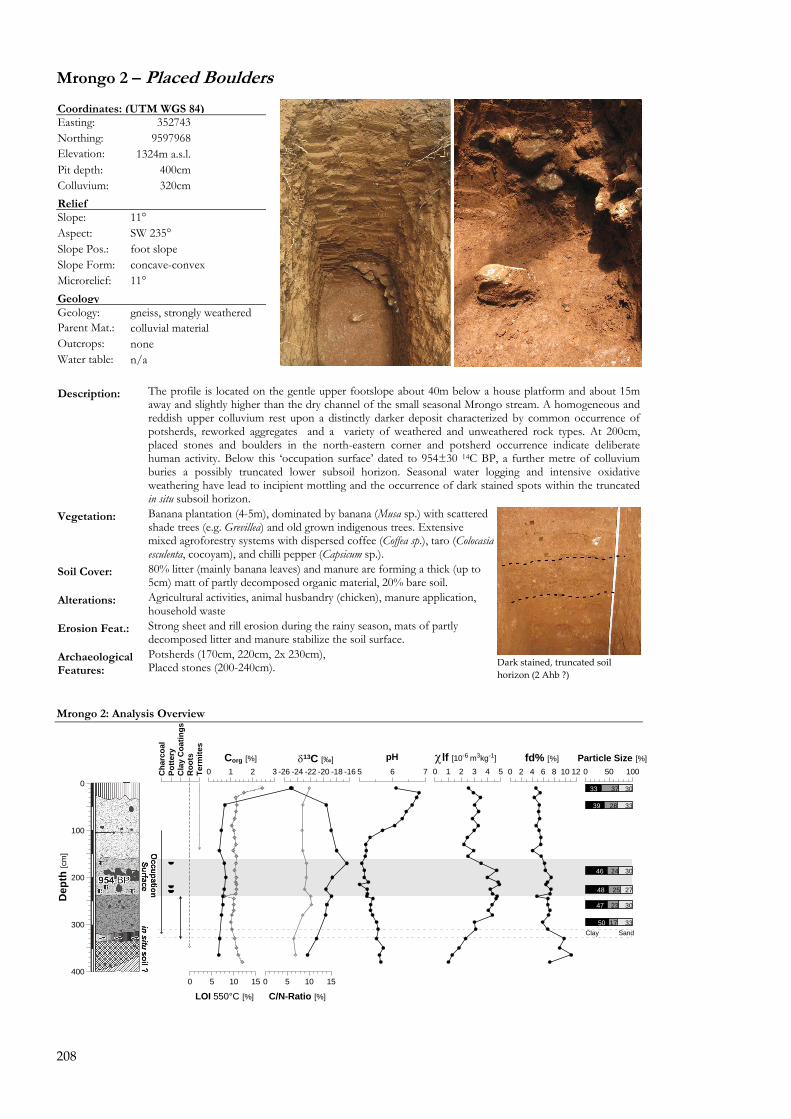
208
Mrongo 2 � Placed Boulders
Coordinates: (UTM WGS 84) Easting: 352743 Northing: 9597968 Elevation: 1324m a.s.l. Pit depth: 400cm Colluvium: 320cm Relief Slope: 11° Aspect: SW 235° Slope Pos.: foot slope Slope Form: concave-convex Microrelief: 11° Geology Geology: gneiss, strongly weathered Parent Mat.: colluvial material Outcrops: none Water table: n/a
Description: The profile is located on the gentle upper footslope about 40m below a house platform and about 15m
away and slightly higher than the dry channel of the small seasonal Mrongo stream. A homogeneous and reddish upper colluvium rest upon a distinctly darker deposit characterized by common occurrence of potsherds, reworked aggregates and a variety of weathered and unweathered rock types. At 200cm, placed stones and boulders in the north-eastern corner and potsherd occurrence indicate deliberate human activity. Below this �occupation surface� dated to 954±30 14C BP, a further metre of colluvium buries a possibly truncated lower subsoil horizon. Seasonal water logging and intensive oxidative weathering have lead to incipient mottling and the occurrence of dark stained spots within the truncated in situ subsoil horizon.
Vegetation: Banana plantation (4-5m), dominated by banana (Musa sp.) with scattered shade trees (e.g. Grevillea) and old grown indigenous trees. Extensive mixed agroforestry systems with dispersed coffee (Coffea sp.), taro (Colocasia esculenta, cocoyam), and chilli pepper (Capsicum sp.).
Soil Cover: 80% litter (mainly banana leaves) and manure are forming a thick (up to 5cm) matt of partly decomposed organic material, 20% bare soil.
Alterations: Agricultural activities, animal husbandry (chicken), manure application, household waste
Erosion Feat.: Strong sheet and rill erosion during the rainy season, mats of partly decomposed litter and manure stabilize the soil surface.
Archaeological Features:
Potsherds (170cm, 220cm, 2x 230cm), Placed stones (200-240cm). Dark stained, truncated soil
horizon (2 Ahb ?)
Mrongo 2: Analysis Overview
Clay Sand
33
39
46
48
47
50
37
28
24
25
23
17
30
33
30
27
30
33
0 50 100Particle Size [%]
0 2 4 6 8 10 12fd% [%]
0 1 2 3 4 5
χlf [10-6 m3kg-1]
5 6 7
pH
0 5 10 15
C/N-Ratio [%]
-26 -24 -22 -20 -18 -16δ13C [‰]
0 5 10 15
LOI 550°C [%]
0 1 2 3Corg [%]
400
300
200
100
0
Dep
th [c
m]
Cha
rcoa
lPo
ttery
Cla
y C
oatin
gsR
oots
Term
ites
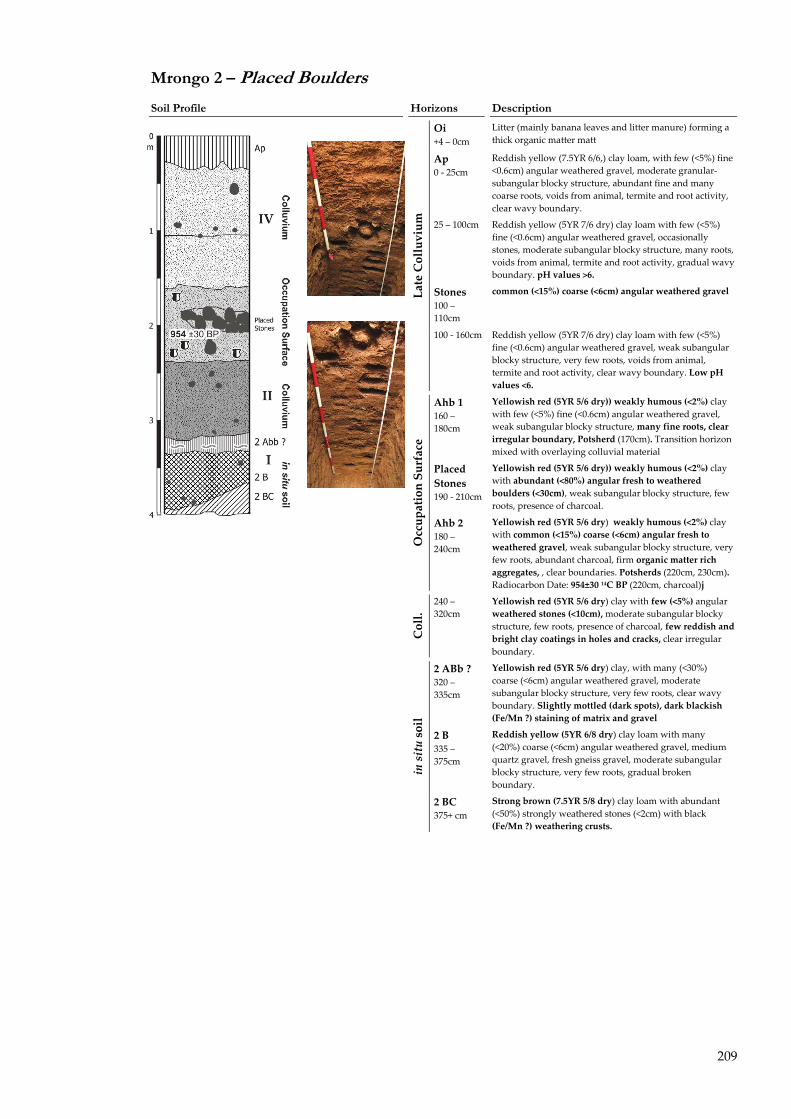
209
Mrongo 2 � Placed Boulders
Soil Profile Horizons Description
Oi +4 � 0cm
Litter (mainly banana leaves and litter manure) forming a thick organic matter matt
Ap 0 ‐ 25cm
Reddish yellow (7.5YR 6/6,) clay loam, with few (<5%) fine <0.6cm) angular weathered gravel, moderate granular‐subangular blocky structure, abundant fine and many coarse roots, voids from animal, termite and root activity, clear wavy boundary.
25 � 100cm Reddish yellow (5YR 7/6 dry) clay loam with few (<5%) fine (<0.6cm) angular weathered gravel, occasionally stones, moderate subangular blocky structure, many roots, voids from animal, termite and root activity, gradual wavy boundary. pH values >6.
Stones 100 � 110cm
common (<15%) coarse (<6cm) angular weathered gravel Late Colluvium
100 ‐ 160cm Reddish yellow (5YR 7/6 dry) clay loam with few (<5%) fine (<0.6cm) angular weathered gravel, weak subangular blocky structure, very few roots, voids from animal, termite and root activity, clear wavy boundary. Low pH values <6.
Ahb 1 160 � 180cm
Yellowish red (5YR 5/6 dry)) weakly humous (<2%) clay with few (<5%) fine (<0.6cm) angular weathered gravel, weak subangular blocky structure, many fine roots, clear irregular boundary, Potsherd (170cm). Transition horizon mixed with overlaying colluvial material
Placed Stones 190 ‐ 210cm
Yellowish red (5YR 5/6 dry)) weakly humous (<2%) clay with abundant (<80%) angular fresh to weathered boulders (<30cm), weak subangular blocky structure, few roots, presence of charcoal.
Occupation Surface
Ahb 2 180 � 240cm
Yellowish red (5YR 5/6 dry) weakly humous (<2%) clay with common (<15%) coarse (<6cm) angular fresh to weathered gravel, weak subangular blocky structure, very few roots, abundant charcoal, firm organic matter rich aggregates, , clear boundaries. Potsherds (220cm, 230cm). Radiocarbon Date: 954±30 14C BP (220cm, charcoal)j
Coll.
240 � 320cm
Yellowish red (5YR 5/6 dry) clay with few (<5%) angular weathered stones (<10cm), moderate subangular blocky structure, few roots, presence of charcoal, few reddish and bright clay coatings in holes and cracks, clear irregular boundary.
2 ABb ? 320 � 335cm
Yellowish red (5YR 5/6 dry) clay, with many (<30%) coarse (<6cm) angular weathered gravel, moderate subangular blocky structure, very few roots, clear wavy boundary. Slightly mottled (dark spots), dark blackish (Fe/Mn ?) staining of matrix and gravel
2 B 335 � 375cm
Reddish yellow (5YR 6/8 dry) clay loam with many (<20%) coarse (<6cm) angular weathered gravel, medium quartz gravel, fresh gneiss gravel, moderate subangular blocky structure, very few roots, gradual broken boundary.
in situ soil
2 BC 375+ cm
Strong brown (7.5YR 5/8 dry) clay loam with abundant (<50%) strongly weathered stones (<2cm) with black (Fe/Mn ?) weathering crusts.
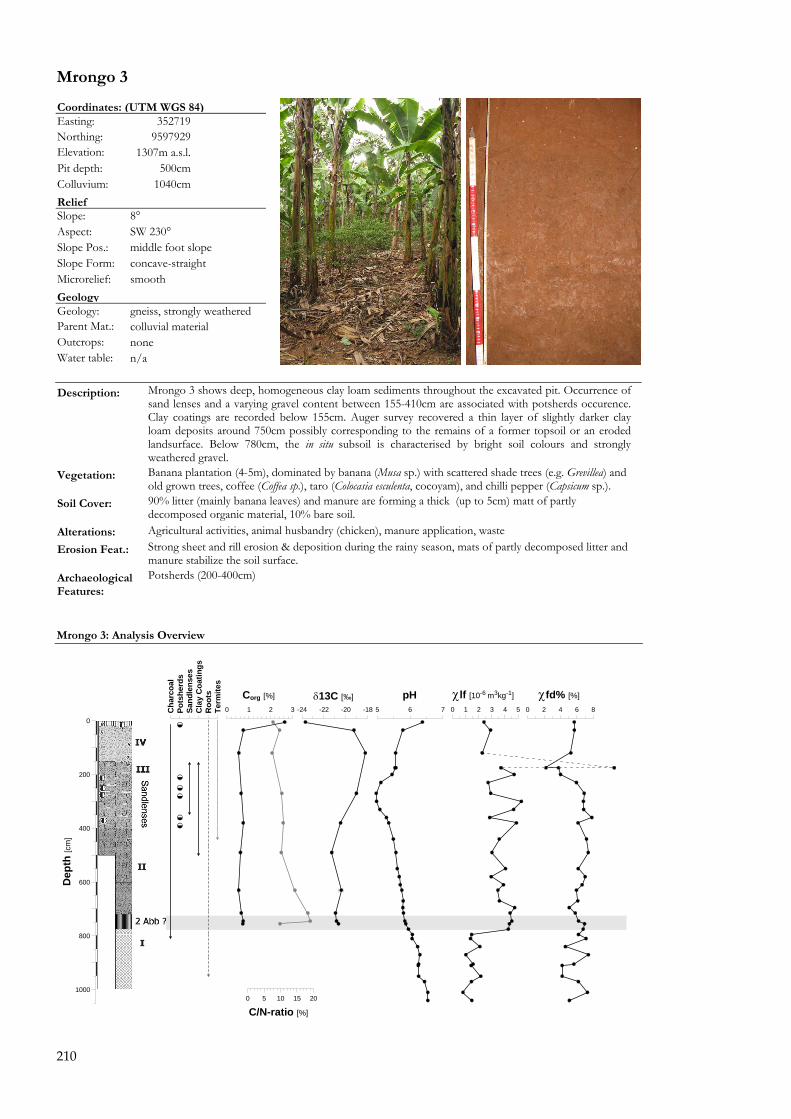
210
Mrongo 3
Coordinates: (UTM WGS 84) Easting: 352719 Northing: 9597929 Elevation: 1307m a.s.l. Pit depth: 500cm Colluvium: 1040cm Relief Slope: 8° Aspect: SW 230° Slope Pos.: middle foot slope Slope Form: concave-straight Microrelief: smooth Geology Geology: gneiss, strongly weathered Parent Mat.: colluvial material Outcrops: none Water table: n/a
Description: Mrongo 3 shows deep, homogeneous clay loam sediments throughout the excavated pit. Occurrence of
sand lenses and a varying gravel content between 155-410cm are associated with potsherds occurence. Clay coatings are recorded below 155cm. Auger survey recovered a thin layer of slightly darker clay loam deposits around 750cm possibly corresponding to the remains of a former topsoil or an eroded landsurface. Below 780cm, the in situ subsoil is characterised by bright soil colours and strongly weathered gravel.
Vegetation: Banana plantation (4-5m), dominated by banana (Musa sp.) with scattered shade trees (e.g. Grevillea) and old grown trees, coffee (Coffea sp.), taro (Colocasia esculenta, cocoyam), and chilli pepper (Capsicum sp.).
Soil Cover: 90% litter (mainly banana leaves) and manure are forming a thick (up to 5cm) matt of partly decomposed organic material, 10% bare soil.
Alterations: Agricultural activities, animal husbandry (chicken), manure application, waste Erosion Feat.: Strong sheet and rill erosion & deposition during the rainy season, mats of partly decomposed litter and
manure stabilize the soil surface. Archaeological Features:
Potsherds (200-400cm)
Mrongo 3: Analysis Overview
0 2 4 6 8
χfd% [%]
0 1 2 3 4 5
χlf [10-6 m3kg-1]
5 6 7
pH
0 5 10 15 20
C/N-ratio [%]
-24 -22 -20 -18
δ13C [‰]0 1 2 3
Corg [%]
1000
800
600
400
200
0
Dep
th [c
m]
Cha
rcoa
lPo
tshe
rds
Sand
lens
esC
lay
Coa
tings
Roo
tsTe
rmite
s
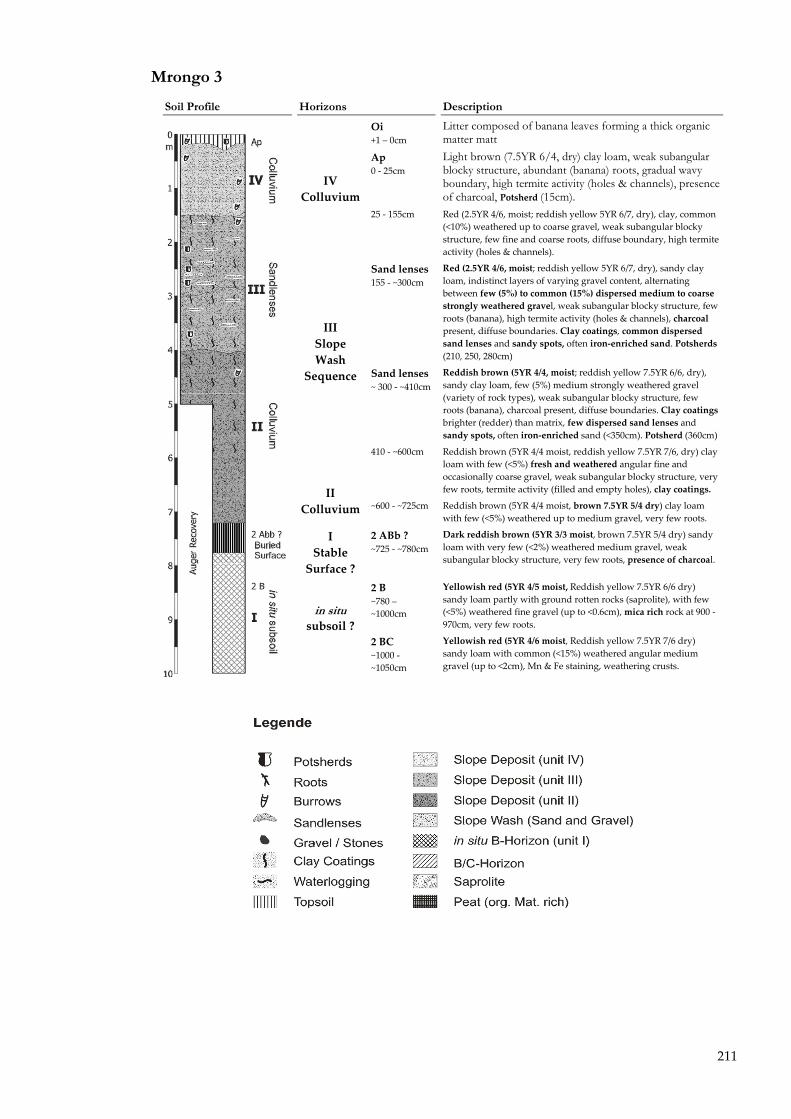
211
Mrongo 3
Soil Profile Horizons Description
Oi +1 � 0cm
Litter composed of banana leaves forming a thick organic matter matt
Ap 0 ‐ 25cm
Light brown (7.5YR 6/4, dry) clay loam, weak subangular blocky structure, abundant (banana) roots, gradual wavy boundary, high termite activity (holes & channels), presence of charcoal, Potsherd (15cm).
IV Colluvium
25 ‐ 155cm Red (2.5YR 4/6, moist; reddish yellow 5YR 6/7, dry), clay, common (<10%) weathered up to coarse gravel, weak subangular blocky structure, few fine and coarse roots, diffuse boundary, high termite activity (holes & channels).
Sand lenses 155 ‐ ~300cm
Red (2.5YR 4/6, moist; reddish yellow 5YR 6/7, dry), sandy clay loam, indistinct layers of varying gravel content, alternating between few (5%) to common (15%) dispersed medium to coarse strongly weathered gravel, weak subangular blocky structure, few roots (banana), high termite activity (holes & channels), charcoal present, diffuse boundaries. Clay coatings, common dispersed sand lenses and sandy spots, often iron‐enriched sand. Potsherds (210, 250, 280cm)
III Slope Wash
Sequence Sand lenses ~ 300 ‐ ~410cm
Reddish brown (5YR 4/4, moist; reddish yellow 7.5YR 6/6, dry), sandy clay loam, few (5%) medium strongly weathered gravel (variety of rock types), weak subangular blocky structure, few roots (banana), charcoal present, diffuse boundaries. Clay coatings brighter (redder) than matrix, few dispersed sand lenses and sandy spots, often iron‐enriched sand (<350cm). Potsherd (360cm)
410 ‐ ~600cm Reddish brown (5YR 4/4 moist, reddish yellow 7.5YR 7/6, dry) clay loam with few (<5%) fresh and weathered angular fine and occasionally coarse gravel, weak subangular blocky structure, very few roots, termite activity (filled and empty holes), clay coatings. II
Colluvium ~600 ‐ ~725cm Reddish brown (5YR 4/4 moist, brown 7.5YR 5/4 dry) clay loam with few (<5%) weathered up to medium gravel, very few roots.
I Stable Surface ?
2 ABb ? ~725 ‐ ~780cm
Dark reddish brown (5YR 3/3 moist, brown 7.5YR 5/4 dry) sandy loam with very few (<2%) weathered medium gravel, weak subangular blocky structure, very few roots, presence of charcoal.
2 B ~780 � ~1000cm
Yellowish red (5YR 4/5 moist, Reddish yellow 7.5YR 6/6 dry) sandy loam partly with ground rotten rocks (saprolite), with few (<5%) weathered fine gravel (up to <0.6cm), mica rich rock at 900 ‐ 970cm, very few roots.
in situ subsoil ?
2 BC ~1000 ‐ ~1050cm
Yellowish red (5YR 4/6 moist, Reddish yellow 7.5YR 7/6 dry) sandy loam with common (<15%) weathered angular medium gravel (up to <2cm), Mn & Fe staining, weathering crusts.

212
Mrongo 10 � Buried Topsoil
Coordinates: (UTM WGS 84) Easting: 352709 E Northing: 9597916 S 3°38�12.3�� Elevation: 1305m a.s.l. Pit depth: 400/740cm Colluvium: 600cm Relief Slope: 6° Aspect: SSW 210° Slope Pos.: toe slope Slope Form: convex � convex Microrelief: smooth Geology Geology: gneiss, strongly weathered Parent Mat.: colluvial material Water table: n/a
Description: Located in a banana grove on the toe slope, the profile Mrongo 10 shows a treepart slope deposit over an
in situ soil. A plough horizon has developed in reddish yellow crumbly clay of the upper colluvial deposit. Between 80 and 310cm depth a distinct deposit of coarse, sandy slope wash material is characterised by the occurrence of continuous and discontinuous sand lenses, distinctly visible by black iron rich sand. Below 310cm the deposit turns reddish brown to brown (5-7.5YR 5/4, moist), clay coatings are observed and firm organic matter rich aggregates as well as aggregates of bright subsoil material are present. Several potsherds are recovered between 3 and 4m depth. Around 580cm the colluvium turns darker and at 600-610cm depth a thin but distinct layer of brown (7.5YR 4/2, moist) clay with clear boundaries suggests a buried topsoil horizon. Recovery of strongly weathered saprolitic rock fragments and unweathered mica suggests transition to the strongly weathered saprolite between 700 and 800cm depth. Banana plantation (4-5m), dominated by banana (Musa sp.) with scattered shade trees (e.g. Grevillea), coffee (Coffea sp.), taro (Colocasia esculenta, cocoyam), and chilli pepper (Capsicum sp.). Seasonal plants are maize
Vegetation:
(Zea mays) and ground covering beans. Soil Cover: 90% litter, 10% bare soil Alterations: animal husbandry (chicken), agriculture Erosion Feat.: moderate sheet and rill erosion, hidden by continuous tillage.
Arch. Features : Potsherds (290, 335, 360, 380, 390cm) Mrongo 10: Analysis Overview
Clay Sand
42
52
36
35
24
49
362933
30
30
20
27
13
24
202222
28
18
44
38
63
27
444945
0 50 100Particle Size [%]
0 2 4 6 8fd% [%]
20
0 1 2 3 4 5
χlf [10-6 m3kg-1]
5 6 7pH
0 5 10 15
C/N-Ratio [%]
-24 -22 -20 -18δ13C [‰]
0 1 2 3Corg [%]
800
700
600
500
400
300
200
100
0
Dep
th [c
m]
Cha
rcoa
lPo
ttery
Sand
lens
esA
ggre
gate
s C
lay
Coa
tings
Roo
ts
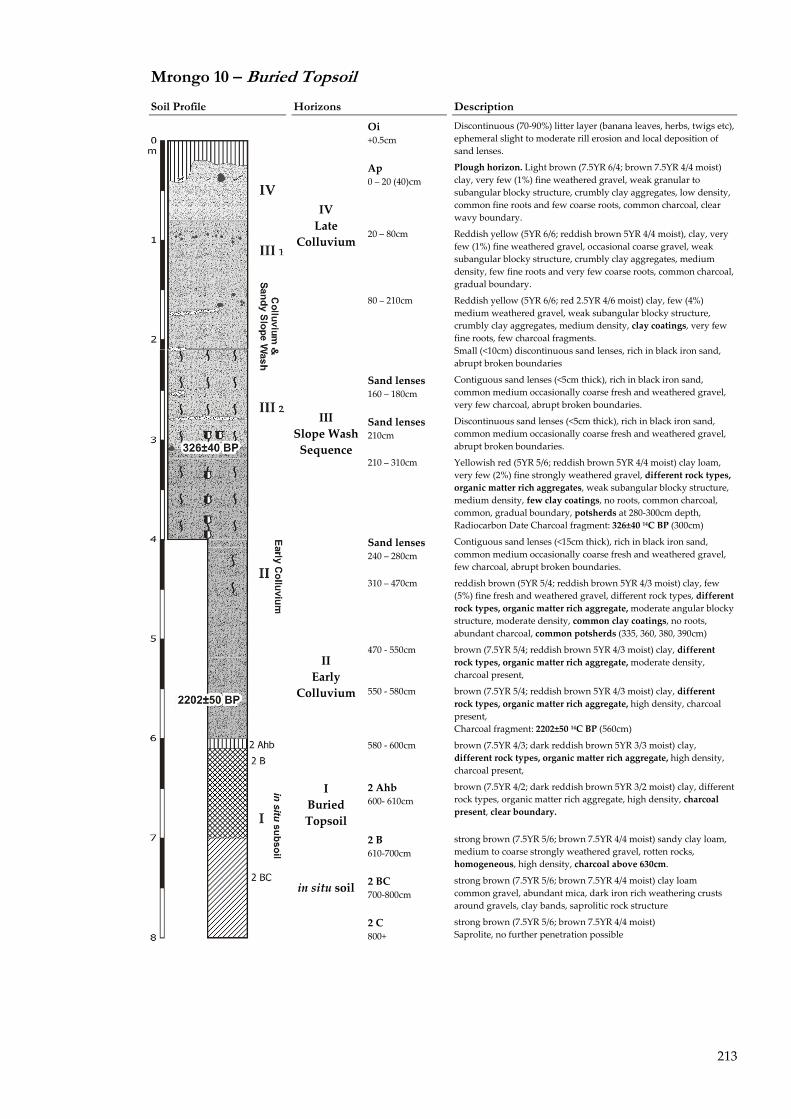
213
Mrongo 10 � Buried Topsoil
Soil Profile Horizons Description
Oi +0.5cm
Discontinuous (70‐90%) litter layer (banana leaves, herbs, twigs etc), ephemeral slight to moderate rill erosion and local deposition of sand lenses.
Ap 0 � 20 (40)cm
Plough horizon. Light brown (7.5YR 6/4; brown 7.5YR 4/4 moist) clay, very few (1%) fine weathered gravel, weak granular to subangular blocky structure, crumbly clay aggregates, low density, common fine roots and few coarse roots, common charcoal, clear wavy boundary.
IV Late
Colluvium 20 � 80cm Reddish yellow (5YR 6/6; reddish brown 5YR 4/4 moist), clay, very
few (1%) fine weathered gravel, occasional coarse gravel, weak subangular blocky structure, crumbly clay aggregates, medium density, few fine roots and very few coarse roots, common charcoal, gradual boundary.
80 � 210cm Reddish yellow (5YR 6/6; red 2.5YR 4/6 moist) clay, few (4%) medium weathered gravel, weak subangular blocky structure, crumbly clay aggregates, medium density, clay coatings, very few fine roots, few charcoal fragments. Small (<10cm) discontinuous sand lenses, rich in black iron sand, abrupt broken boundaries
Sand lenses 160 � 180cm
Contiguous sand lenses (<5cm thick), rich in black iron sand, common medium occasionally coarse fresh and weathered gravel, very few charcoal, abrupt broken boundaries.
Sand lenses 210cm
Discontinuous sand lenses (<5cm thick), rich in black iron sand, common medium occasionally coarse fresh and weathered gravel, abrupt broken boundaries.
210 � 310cm Yellowish red (5YR 5/6; reddish brown 5YR 4/4 moist) clay loam, very few (2%) fine strongly weathered gravel, different rock types, organic matter rich aggregates, weak subangular blocky structure, medium density, few clay coatings, no roots, common charcoal, common, gradual boundary, potsherds at 280‐300cm depth, Radiocarbon Date Charcoal fragment: 326±40 14C BP (300cm)
III Slope Wash Sequence
Sand lenses 240 � 280cm
Contiguous sand lenses (<15cm thick), rich in black iron sand, common medium occasionally coarse fresh and weathered gravel, few charcoal, abrupt broken boundaries.
310 � 470cm reddish brown (5YR 5/4; reddish brown 5YR 4/3 moist) clay, few (5%) fine fresh and weathered gravel, different rock types, different rock types, organic matter rich aggregate, moderate angular blocky structure, moderate density, common clay coatings, no roots, abundant charcoal, common potsherds (335, 360, 380, 390cm)
470 ‐ 550cm brown (7.5YR 5/4; reddish brown 5YR 4/3 moist) clay, different rock types, organic matter rich aggregate, moderate density, charcoal present,
550 ‐ 580cm brown (7.5YR 5/4; reddish brown 5YR 4/3 moist) clay, different rock types, organic matter rich aggregate, high density, charcoal present, Charcoal fragment: 2202±50 14C BP (560cm)
II Early
Colluvium
580 ‐ 600cm brown (7.5YR 4/3; dark reddish brown 5YR 3/3 moist) clay, different rock types, organic matter rich aggregate, high density, charcoal present,
I Buried Topsoil
2 Ahb 600‐ 610cm
brown (7.5YR 4/2; dark reddish brown 5YR 3/2 moist) clay, different rock types, organic matter rich aggregate, high density, charcoal present, clear boundary.
2 B 610‐700cm
strong brown (7.5YR 5/6; brown 7.5YR 4/4 moist) sandy clay loam, medium to coarse strongly weathered gravel, rotten rocks, homogeneous, high density, charcoal above 630cm.
2 BC 700‐800cm
strong brown (7.5YR 5/6; brown 7.5YR 4/4 moist) clay loam common gravel, abundant mica, dark iron rich weathering crusts around gravels, clay bands, saprolitic rock structure
in situ soil
2 C 800+
strong brown (7.5YR 5/6; brown 7.5YR 4/4 moist) Saprolite, no further penetration possible
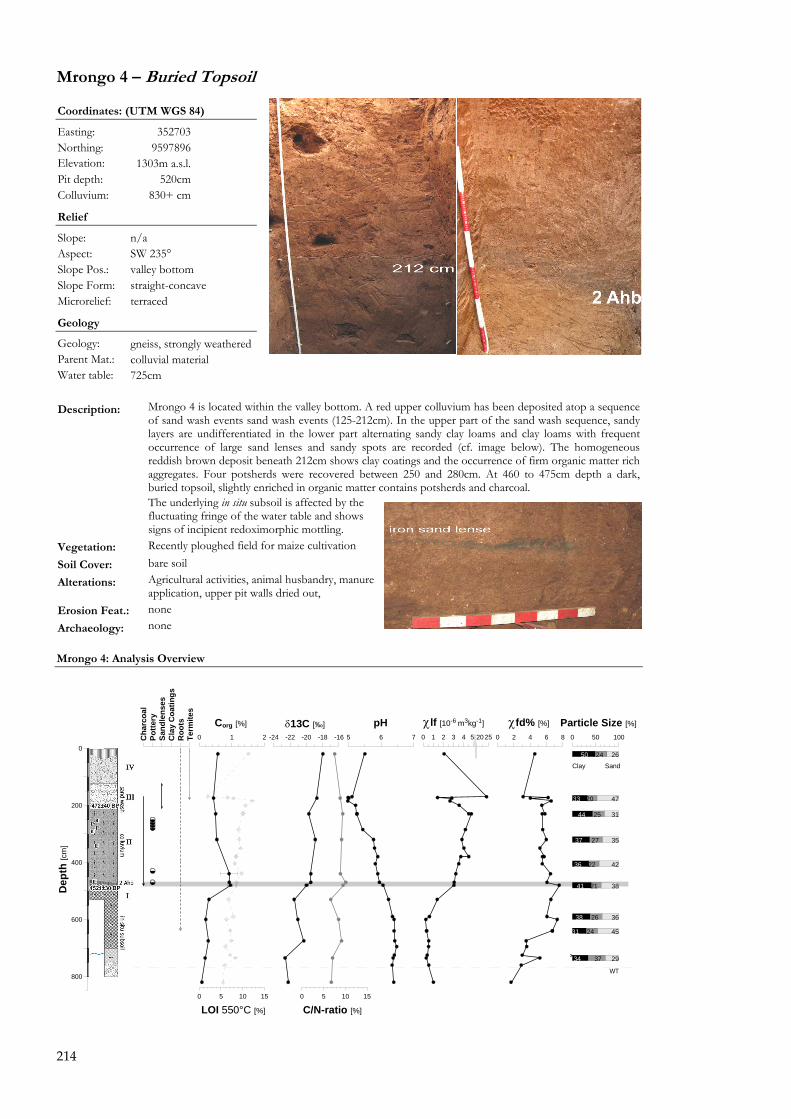
214
Mrongo 4 � Buried Topsoil
Coordinates: (UTM WGS 84)
Easting: 352703 Northing: 9597896 Elevation: 1303m a.s.l. Pit depth: 520cm Colluvium: 830+ cm
Relief
Slope: n/a Aspect: SW 235° Slope Pos.: valley bottom Slope Form: straight-concave Microrelief: terraced
Geology
Geology: gneiss, strongly weathered Parent Mat.: colluvial material Water table: 725cm
Mrongo 4 is located within the valley bottom. A red upper colluvium has been deposited atop a sequence of sand wash events sand wash events (125-212cm). In the upper part of the sand wash sequence, sandy layers are undifferentiated in the lower part alternating sandy clay loams and clay loams with frequent occurrence of large sand lenses and sandy spots are recorded (cf. image below). The homogeneous reddish brown deposit beneath 212cm shows clay coatings and the occurrence of firm organic matter rich aggregates. Four potsherds were recovered between 250 and 280cm. At 460 to 475cm depth a dark, buried topsoil, slightly enriched in organic matter contains potsherds and charcoal.
Description:
The underlying in situ subsoil is affected by the fluctuating fringe of the water table and shows signs of incipient redoximorphic mottling.
Vegetation: Recently ploughed field for maize cultivation Soil Cover: bare soil Alterations: Agricultural activities, animal husbandry, manure
application, upper pit walls dried out, Erosion Feat.: none Archaeology: none Mrongo 4: Analysis Overview
WT
50
33
44
37
36
41
38
31
34
24
20
25
27
22
21
26
24
37
26
47
31
35
42
38
36
45
29
0 50 100
Particle Size [%]
0 2 4 6 8
χfd% [%]
0 1 2 3 4 5 20 25
χlf [10-6 m3kg-1]
5 6 7
pH
0 5 10 15
C/N-ratio [%]
-24 -22 -20 -18 -16
δ13C [‰]
0 5 10 15
LOI 550°C [%]
0 1 2
Corg [%]
800
600
400
200
0
Dep
th [c
m]
Cha
rcoa
lPo
ttery
Sand
lens
esC
lay
Coa
tings
Roo
tsTe
rmite
s
Clay Sand
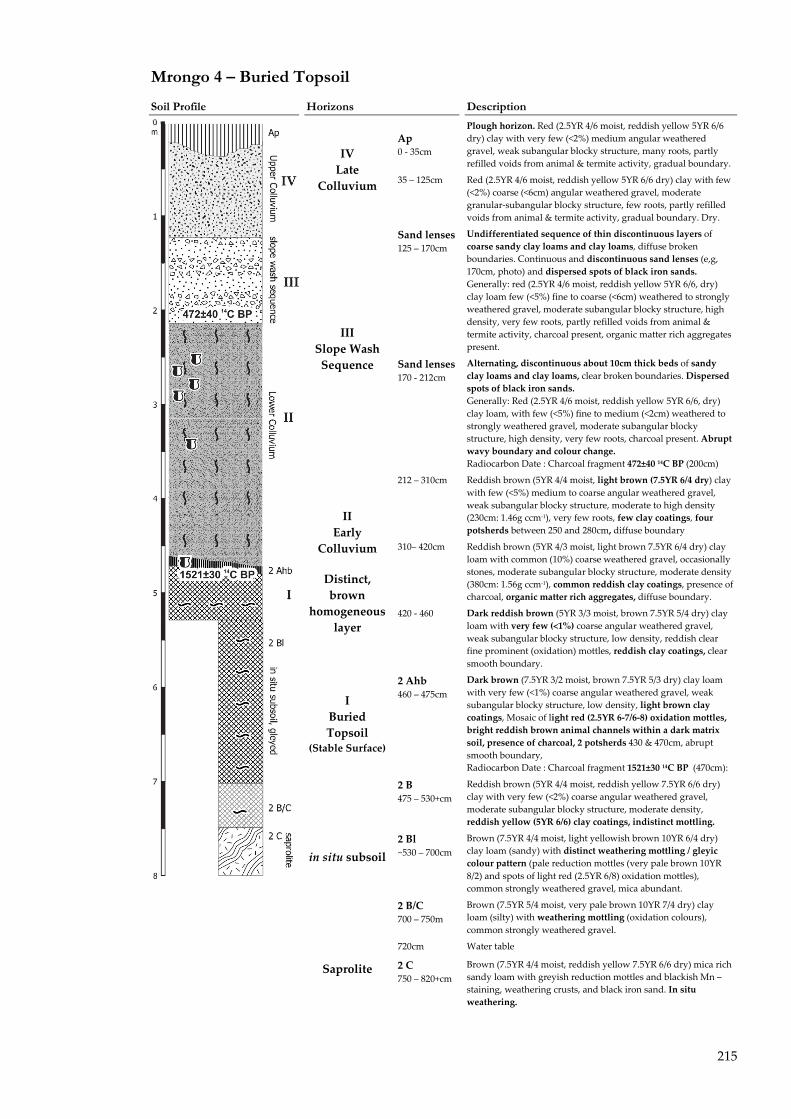
215
Mrongo 4 � Buried Topsoil
Soil Profile Horizons Description
Ap 0 ‐ 35cm
Plough horizon. Red (2.5YR 4/6 moist, reddish yellow 5YR 6/6 dry) clay with very few (<2%) medium angular weathered gravel, weak subangular blocky structure, many roots, partly refilled voids from animal & termite activity, gradual boundary.
IV Late
Colluvium 35 � 125cm Red (2.5YR 4/6 moist, reddish yellow 5YR 6/6 dry) clay with few (<2%) coarse (<6cm) angular weathered gravel, moderate granular‐subangular blocky structure, few roots, partly refilled voids from animal & termite activity, gradual boundary. Dry.
Sand lenses125 � 170cm
Undifferentiated sequence of thin discontinuous layers of coarse sandy clay loams and clay loams, diffuse broken boundaries. Continuous and discontinuous sand lenses (e,g, 170cm, photo) and dispersed spots of black iron sands. Generally: red (2.5YR 4/6 moist, reddish yellow 5YR 6/6, dry) clay loam few (<5%) fine to coarse (<6cm) weathered to strongly weathered gravel, moderate subangular blocky structure, high density, very few roots, partly refilled voids from animal & termite activity, charcoal present, organic matter rich aggregates present.
III Slope Wash Sequence Sand lenses
170 ‐ 212cm Alternating, discontinuous about 10cm thick beds of sandy clay loams and clay loams, clear broken boundaries. Dispersed spots of black iron sands. Generally: Red (2.5YR 4/6 moist, reddish yellow 5YR 6/6, dry) clay loam, with few (<5%) fine to medium (<2cm) weathered to strongly weathered gravel, moderate subangular blocky structure, high density, very few roots, charcoal present. Abrupt wavy boundary and colour change. Radiocarbon Date : Charcoal fragment 472±40 14C BP (200cm)
212 � 310cm Reddish brown (5YR 4/4 moist, light brown (7.5YR 6/4 dry) clay with few (<5%) medium to coarse angular weathered gravel, weak subangular blocky structure, moderate to high density (230cm: 1.46g ccm‐1), very few roots, few clay coatings, four potsherds between 250 and 280cm, diffuse boundary
310� 420cm Reddish brown (5YR 4/3 moist, light brown 7.5YR 6/4 dry) clay loam with common (10%) coarse weathered gravel, occasionally stones, moderate subangular blocky structure, moderate density (380cm: 1.56g ccm‐1), common reddish clay coatings, presence of charcoal, organic matter rich aggregates, diffuse boundary.
II Early
Colluvium
Distinct, brown
homogeneous layer
420 ‐ 460 Dark reddish brown (5YR 3/3 moist, brown 7.5YR 5/4 dry) clay loam with very few (<1%) coarse angular weathered gravel, weak subangular blocky structure, low density, reddish clear fine prominent (oxidation) mottles, reddish clay coatings, clear smooth boundary.
I Buried Topsoil
(Stable Surface)
2 Ahb 460 � 475cm
Dark brown (7.5YR 3/2 moist, brown 7.5YR 5/3 dry) clay loam with very few (<1%) coarse angular weathered gravel, weak subangular blocky structure, low density, light brown clay coatings, Mosaic of light red (2.5YR 6‐7/6‐8) oxidation mottles, bright reddish brown animal channels within a dark matrix soil, presence of charcoal, 2 potsherds 430 & 470cm, abrupt smooth boundary, Radiocarbon Date : Charcoal fragment 1521±30 14C BP (470cm):
2 B 475 � 530+cm
Reddish brown (5YR 4/4 moist, reddish yellow 7.5YR 6/6 dry) clay with very few (<2%) coarse angular weathered gravel, moderate subangular blocky structure, moderate density, reddish yellow (5YR 6/6) clay coatings, indistinct mottling.
2 Bl ~530 � 700cm
Brown (7.5YR 4/4 moist, light yellowish brown 10YR 6/4 dry) clay loam (sandy) with distinct weathering mottling / gleyic colour pattern (pale reduction mottles (very pale brown 10YR 8/2) and spots of light red (2.5YR 6/8) oxidation mottles), common strongly weathered gravel, mica abundant.
in situ subsoil
2 B/C 700 � 750m
Brown (7.5YR 5/4 moist, very pale brown 10YR 7/4 dry) clay loam (silty) with weathering mottling (oxidation colours), common strongly weathered gravel.
720cm Water table
Saprolite
2 C 750 � 820+cm
Brown (7.5YR 4/4 moist, reddish yellow 7.5YR 6/6 dry) mica rich sandy loam with greyish reduction mottles and blackish Mn � staining, weathering crusts, and black iron sand. In situ weathering.
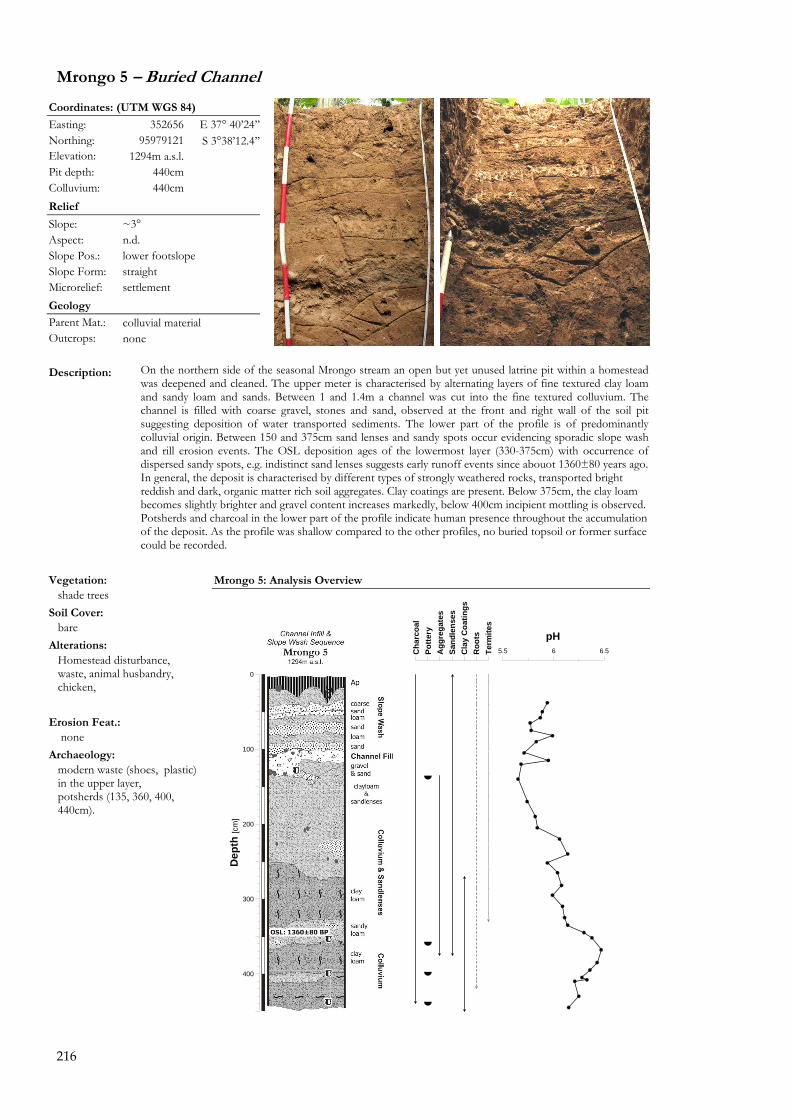
216
Mrongo 5 � Buried Channel
Coordinates: (UTM WGS 84) Easting: 352656 E 37° 40�24�� Northing: 95979121 S 3°38�12.4�� Elevation: 1294m a.s.l. Pit depth: 440cm Colluvium: 440cm Relief Slope: ~3° Aspect: n.d. Slope Pos.: lower footslope Slope Form: straight Microrelief: settlement Geology Parent Mat.: colluvial material Outcrops: none
Description: On the northern side of the seasonal Mrongo stream an open but yet unused latrine pit within a homestead
was deepened and cleaned. The upper meter is characterised by alternating layers of fine textured clay loam and sandy loam and sands. Between 1 and 1.4m a channel was cut into the fine textured colluvium. The channel is filled with coarse gravel, stones and sand, observed at the front and right wall of the soil pit suggesting deposition of water transported sediments. The lower part of the profile is of predominantly colluvial origin. Between 150 and 375cm sand lenses and sandy spots occur evidencing sporadic slope wash and rill erosion events. The OSL deposition ages of the lowermost layer (330-375cm) with occurrence of dispersed sandy spots, e.g. indistinct sand lenses suggests early runoff events since abouot 1360±80 years ago. In general, the deposit is characterised by different types of strongly weathered rocks, transported bright reddish and dark, organic matter rich soil aggregates. Clay coatings are present. Below 375cm, the clay loam becomes slightly brighter and gravel content increases markedly, below 400cm incipient mottling is observed. Potsherds and charcoal in the lower part of the profile indicate human presence throughout the accumulation of the deposit. As the profile was shallow compared to the other profiles, no buried topsoil or former surface could be recorded.
Vegetation: shade trees Soil Cover: bare Alterations: Homestead disturbance, waste, animal husbandry, chicken,
Erosion Feat.: none Archaeology: modern waste (shoes, plastic) in the upper layer, potsherds (135, 360, 400, 440cm).
Mrongo 5: Analysis Overview
5.5 6 6.5
pH
400
300
200
100
0
Dep
th [c
m]
Cha
rcoa
lPo
ttery
Agg
rega
tes
Sand
lens
esC
lay
Coa
tings
Roo
tsTe
rmite
s
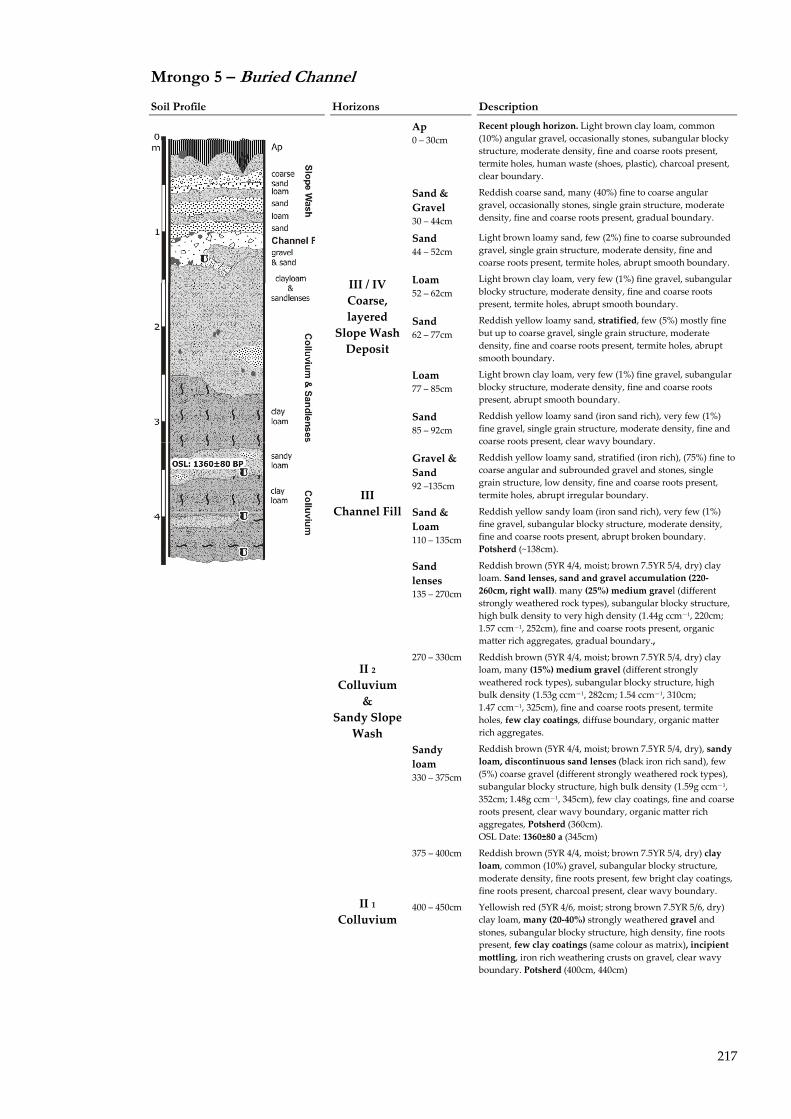
217
Mrongo 5 � Buried Channel
Soil Profile Horizons Description
Ap 0 � 30cm
Recent plough horizon. Light brown clay loam, common (10%) angular gravel, occasionally stones, subangular blocky structure, moderate density, fine and coarse roots present, termite holes, human waste (shoes, plastic), charcoal present, clear boundary.
Sand & Gravel 30 � 44cm
Reddish coarse sand, many (40%) fine to coarse angular gravel, occasionally stones, single grain structure, moderate density, fine and coarse roots present, gradual boundary.
Sand 44 � 52cm
Light brown loamy sand, few (2%) fine to coarse subrounded gravel, single grain structure, moderate density, fine and coarse roots present, termite holes, abrupt smooth boundary.
Loam 52 � 62cm
Light brown clay loam, very few (1%) fine gravel, subangular blocky structure, moderate density, fine and coarse roots present, termite holes, abrupt smooth boundary.
Sand 62 � 77cm
Reddish yellow loamy sand, stratified, few (5%) mostly fine but up to coarse gravel, single grain structure, moderate density, fine and coarse roots present, termite holes, abrupt smooth boundary.
Loam 77 � 85cm
Light brown clay loam, very few (1%) fine gravel, subangular blocky structure, moderate density, fine and coarse roots present, abrupt smooth boundary.
III / IV Coarse, layered
Slope WashDeposit
Sand 85 � 92cm
Reddish yellow loamy sand (iron sand rich), very few (1%) fine gravel, single grain structure, moderate density, fine and coarse roots present, clear wavy boundary.
Gravel & Sand 92 �135cm
Reddish yellow loamy sand, stratified (iron rich), (75%) fine to coarse angular and subrounded gravel and stones, single grain structure, low density, fine and coarse roots present, termite holes, abrupt irregular boundary. III
Channel Fill Sand & Loam 110 � 135cm
Reddish yellow sandy loam (iron sand rich), very few (1%) fine gravel, subangular blocky structure, moderate density, fine and coarse roots present, abrupt broken boundary. Potsherd (~138cm).
Sand lenses 135 � 270cm
Reddish brown (5YR 4/4, moist; brown 7.5YR 5/4, dry) clay loam. Sand lenses, sand and gravel accumulation (220‐260cm, right wall). many (25%) medium gravel (different strongly weathered rock types), subangular blocky structure, high bulk density to very high density (1.44g ccm�1, 220cm; 1.57 ccm�1, 252cm), fine and coarse roots present, organic matter rich aggregates, gradual boundary.,
270 � 330cm Reddish brown (5YR 4/4, moist; brown 7.5YR 5/4, dry) clay loam, many (15%) medium gravel (different strongly weathered rock types), subangular blocky structure, high bulk density (1.53g ccm�1, 282cm; 1.54 ccm�1, 310cm; 1.47 ccm�1, 325cm), fine and coarse roots present, termite holes, few clay coatings, diffuse boundary, organic matter rich aggregates.
II 2 Colluvium
& Sandy Slope
Wash Sandy loam 330 � 375cm
Reddish brown (5YR 4/4, moist; brown 7.5YR 5/4, dry), sandy loam, discontinuous sand lenses (black iron rich sand), few (5%) coarse gravel (different strongly weathered rock types), subangular blocky structure, high bulk density (1.59g ccm�1, 352cm; 1.48g ccm�1, 345cm), few clay coatings, fine and coarse roots present, clear wavy boundary, organic matter rich aggregates, Potsherd (360cm). OSL Date: 1360±80 a (345cm)
375 � 400cm Reddish brown (5YR 4/4, moist; brown 7.5YR 5/4, dry) clay loam, common (10%) gravel, subangular blocky structure, moderate density, fine roots present, few bright clay coatings, fine roots present, charcoal present, clear wavy boundary.
II 1 Colluvium
400 � 450cm Yellowish red (5YR 4/6, moist; strong brown 7.5YR 5/6, dry) clay loam, many (20‐40%) strongly weathered gravel and stones, subangular blocky structure, high density, fine roots present, few clay coatings (same colour as matrix), incipient mottling, iron rich weathering crusts on gravel, clear wavy boundary. Potsherd (400cm, 440cm)
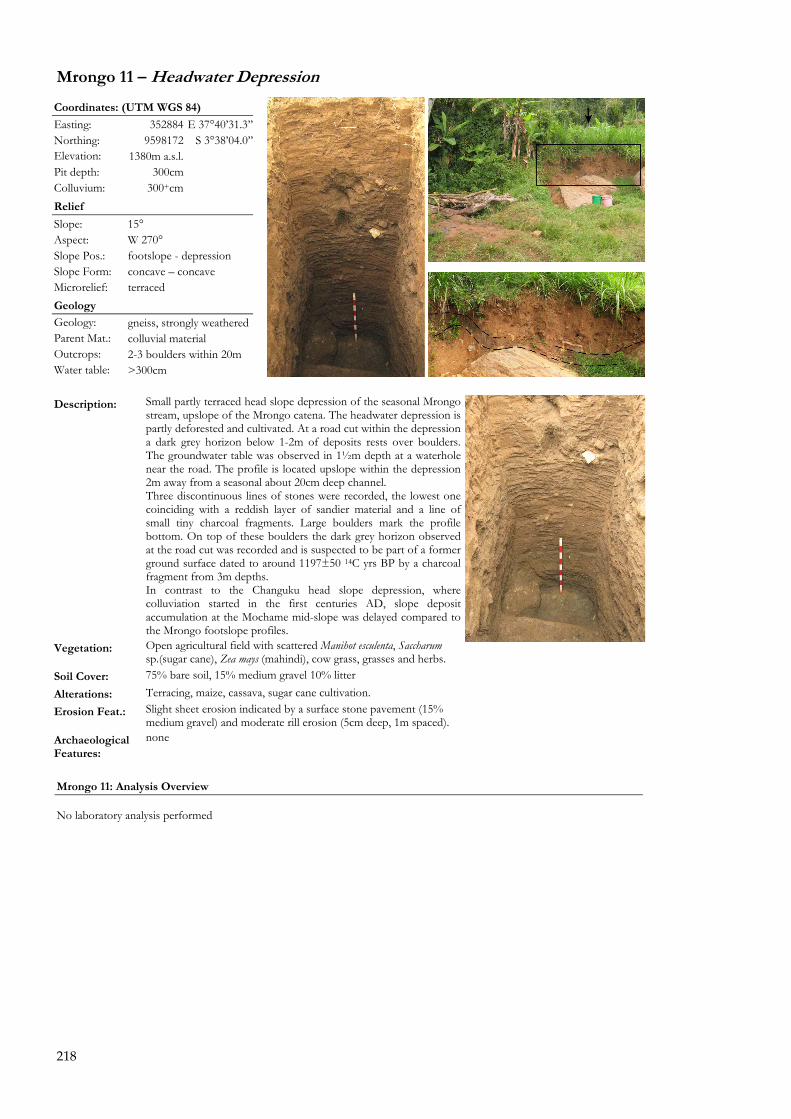
218
Mrongo 11 � Headwater Depression
Coordinates: (UTM WGS 84) Easting: 352884 E 37°40�31.3�� Northing: 9598172 S 3°38�04.0�� Elevation: 1380m a.s.l. Pit depth: 300cm Colluvium: 300+cm Relief Slope: 15° Aspect: W 270° Slope Pos.: footslope - depression Slope Form: concave � concave Microrelief: terraced Geology Geology: gneiss, strongly weathered Parent Mat.: colluvial material Outcrops: 2-3 boulders within 20m Water table: >300cm
Description: Small partly terraced head slope depression of the seasonal Mrongo
stream, upslope of the Mrongo catena. The headwater depression is partly deforested and cultivated. At a road cut within the depression a dark grey horizon below 1-2m of deposits rests over boulders.The groundwater table was observed in 1½m depth at a waterhole near the road. The profile is located upslope within the depression 2m away from a seasonal about 20cm deep channel. Three discontinuous lines of stones were recorded, the lowest one coinciding with a reddish layer of sandier material and a line of small tiny charcoal fragments. Large boulders mark the profile bottom. On top of these boulders the dark grey horizon observed at the road cut was recorded and is suspected to be part of a former ground surface dated to around 1197±50 14C yrs BP by a charcoal fragment from 3m depths. In contrast to the Changuku head slope depression, where colluviation started in the first centuries AD, slope deposit accumulation at the Mochame mid-slope was delayed compared to the Mrongo footslope profiles.
Vegetation: Open agricultural field with scattered Manihot esculenta, Saccharum sp.(sugar cane), Zea mays (mahindi), cow grass, grasses and herbs.
Soil Cover: 75% bare soil, 15% medium gravel 10% litter Alterations: Terracing, maize, cassava, sugar cane cultivation. Erosion Feat.: Slight sheet erosion indicated by a surface stone pavement (15%
medium gravel) and moderate rill erosion (5cm deep, 1m spaced). Archaeological Features:
none
Mrongo 11: Analysis Overview No laboratory analysis performed
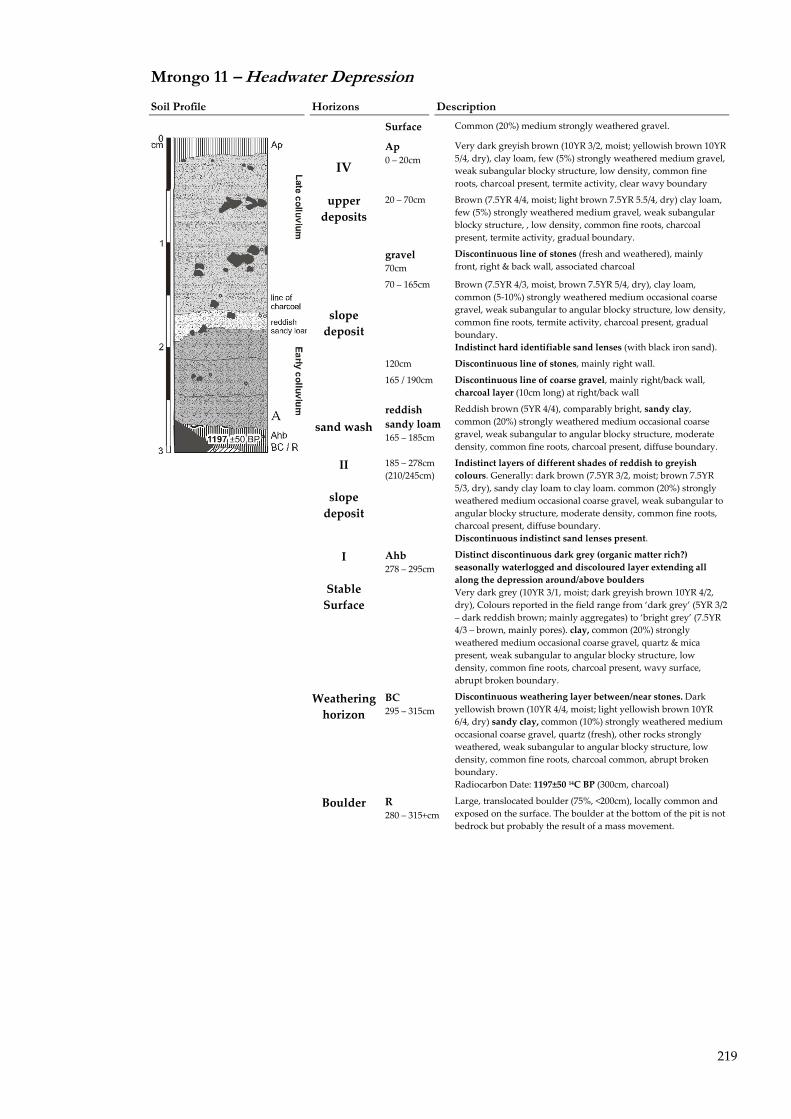
219
Mrongo 11 � Headwater Depression
Soil Profile Horizons Description
Surface Common (20%) medium strongly weathered gravel.
Ap 0 � 20cm
Very dark greyish brown (10YR 3/2, moist; yellowish brown 10YR 5/4, dry), clay loam, few (5%) strongly weathered medium gravel, weak subangular blocky structure, low density, common fine roots, charcoal present, termite activity, clear wavy boundary
IV
upper deposits
20 � 70cm Brown (7.5YR 4/4, moist; light brown 7.5YR 5.5/4, dry) clay loam, few (5%) strongly weathered medium gravel, weak subangular blocky structure, , low density, common fine roots, charcoal present, termite activity, gradual boundary.
gravel 70cm
Discontinuous line of stones (fresh and weathered), mainly front, right & back wall, associated charcoal
70 � 165cm Brown (7.5YR 4/3, moist, brown 7.5YR 5/4, dry), clay loam, common (5‐10%) strongly weathered medium occasional coarse gravel, weak subangular to angular blocky structure, low density, common fine roots, termite activity, charcoal present, gradual boundary. Indistinct hard identifiable sand lenses (with black iron sand).
120cm Discontinuous line of stones, mainly right wall.
slope deposit
165 / 190cm Discontinuous line of coarse gravel, mainly right/back wall, charcoal layer (10cm long) at right/back wall
sand wash
reddish sandy loam 165 � 185cm
Reddish brown (5YR 4/4), comparably bright, sandy clay, common (20%) strongly weathered medium occasional coarse gravel, weak subangular to angular blocky structure, moderate density, common fine roots, charcoal present, diffuse boundary.
II
slope deposit
185 � 278cm (210/245cm)
Indistinct layers of different shades of reddish to greyish colours. Generally: dark brown (7.5YR 3/2, moist; brown 7.5YR 5/3, dry), sandy clay loam to clay loam. common (20%) strongly weathered medium occasional coarse gravel, weak subangular to angular blocky structure, moderate density, common fine roots, charcoal present, diffuse boundary. Discontinuous indistinct sand lenses present.
I
Stable Surface
Ahb 278 � 295cm
Distinct discontinuous dark grey (organic matter rich?) seasonally waterlogged and discoloured layer extending all along the depression around/above boulders Very dark grey (10YR 3/1, moist; dark greyish brown 10YR 4/2, dry), Colours reported in the field range from �dark grey� (5YR 3/2 � dark reddish brown; mainly aggregates) to �bright grey� (7.5YR 4/3 � brown, mainly pores). clay, common (20%) strongly weathered medium occasional coarse gravel, quartz & mica present, weak subangular to angular blocky structure, low density, common fine roots, charcoal present, wavy surface, abrupt broken boundary.
Weathering horizon
BC 295 � 315cm
Discontinuous weathering layer between/near stones. Dark yellowish brown (10YR 4/4, moist; light yellowish brown 10YR 6/4, dry) sandy clay, common (10%) strongly weathered medium occasional coarse gravel, quartz (fresh), other rocks strongly weathered, weak subangular to angular blocky structure, low density, common fine roots, charcoal common, abrupt broken boundary. Radiocarbon Date: 1197±50 14C BP (300cm, charcoal)
Boulder R 280 � 315+cm
Large, translocated boulder (75%, <200cm), locally common and exposed on the surface. The boulder at the bottom of the pit is not bedrock but probably the result of a mass movement.

220
B.4 Ngalanga: Eroded soil under agricultural land use
Ngalanga 1 � Forest Edge Cambisol?
Coordinates: (UTM WGS 84) Easting: 351977 E 37°40�02.0�� Northing: 9599468 S 3°37�21.7�� Elevation: 1461m a.s.l. Pit depth: ~200cm Colluvium: none Relief Slope: n/a Aspect: S 360° Slope Pos.: upper shoulder Slope Form: convex-convex Microrelief: none Geology Geology: gneiss, strongly weathered Parent Mat.: bedrock Outcrops: 1x 10m Ø1m
Description: The profile was located at the edge of the Ngalanga sacred grove on top of the Ngalanga hill in a strongly
disturbed area between a house platform and the forest. Despite the strong recent disturbance and erosion the profile shows the preservation of a deep subsoil ~2m over strongly weathered saprolite and points to what a potential forest subsoil on the Ngalanga hill looks like. Most striking are the dark red upper subsoil horizons. Comparison with the Ngalanga ridge and banana plantation profiles shows that these soils have potentially lost about >1m of their original soil.
Vegetation: Shrub and grass cover on the profile surface; indigenous and introduced tree species at the forest boundary.
Soil Cover: Bare soil (70%), litter (30%) Alterations: Agriculture, animal husbandry, waste, erosion Erosion Feat.: Sheet and rill erosion
Archaeological Features:
none Clay coatings in saprolite material
Soil Profile Horizons Description
Ah 0 � 2cm
Brown (7.5YR 4/3, moist, 7.5YR 5/4, dry) clay, charcoal present, clear boundary.
AB 2 � 10cm
Dark reddish brown (5YR 3/3, moist; reddish brown 5YR 4/4, dry), clay common (15%) fine to medium weathered gravel, moderate subangular blocky structure, high density, few fine roots, charcoal present, clear boundary.
B 1 10 � 40cm
Reddish brown (2.5YR 4/4, moist; red 2.5YR 4/6, dry), clay common (10%) fine to medium weathered gravel, weak moderate subangular blocky structure, low bulk density (1.26g ccm‐1, 35cm), few fine roots, clear boundary
B 2 40 � 65cm
Reddish brown (2.5YR 4/4, moist; red 2.5YR 5/8, dry), clay, common (15%) fine to medium weathered gravel, weak subangular blocky structure, low bulk density (1.12g ccm‐1, 50cm) high density, few fine roots, gradual bound.
In situ subsoil
B/C 65 � 190
Red (2.5YR 4/6, moist; red 2.5YR 5/8, dry), clay many (20%‐30%) up to coarse strongly weathered gravel, subangular blocky structure, low to moderate bulk density (1.37g ccm‐1, 85cm; 1.34g ccm‐1, 130cm; 1.20g ccm‐1, 175cm), clay coatings in rocks structure. Preserved rock structure.
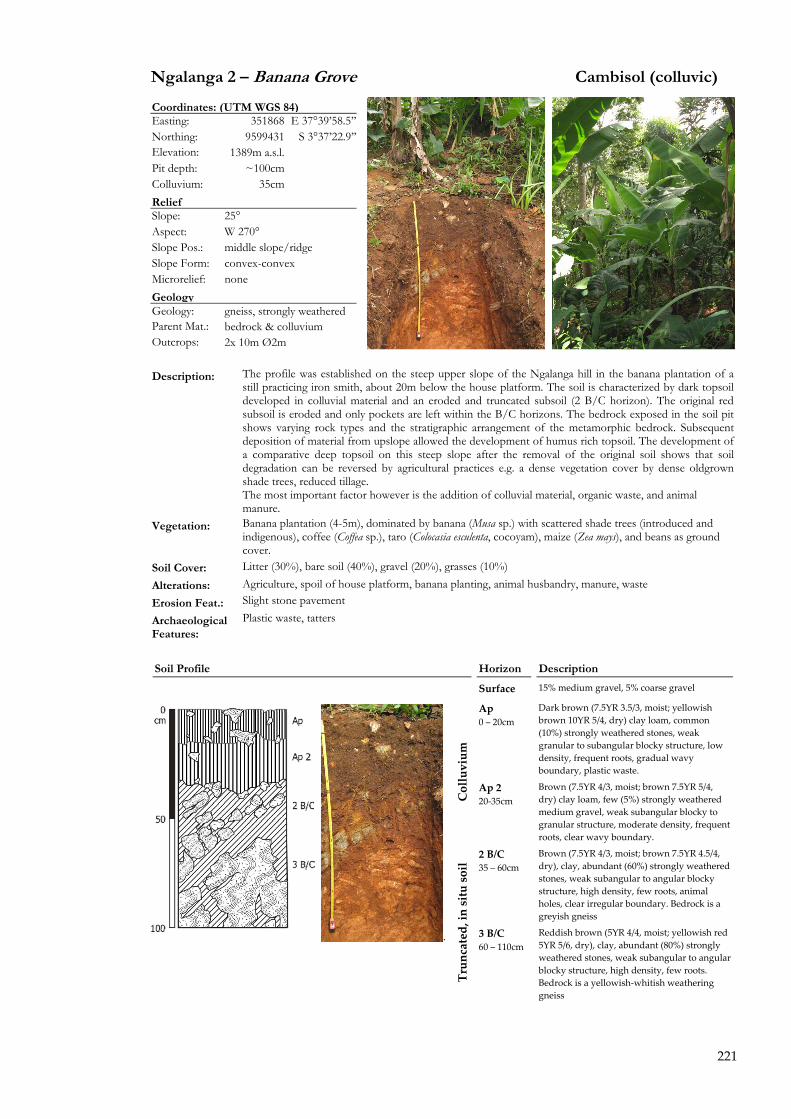
221
Ngalanga 2 � Banana Grove Cambisol (colluvic)
Coordinates: (UTM WGS 84) Easting: 351868 E 37°39�58.5��Northing: 9599431 S 3°37�22.9��Elevation: 1389m a.s.l. Pit depth: ~100cm Colluvium: 35cm Relief Slope: 25° Aspect: W 270° Slope Pos.: middle slope/ridge Slope Form: convex-convex Microrelief: none Geology Geology: gneiss, strongly weathered Parent Mat.: bedrock & colluvium Outcrops: 2x 10m Ø2m Description: The profile was established on the steep upper slope of the Ngalanga hill in the banana plantation of a
still practicing iron smith, about 20m below the house platform. The soil is characterized by dark topsoil developed in colluvial material and an eroded and truncated subsoil (2 B/C horizon). The original red subsoil is eroded and only pockets are left within the B/C horizons. The bedrock exposed in the soil pit shows varying rock types and the stratigraphic arrangement of the metamorphic bedrock. Subsequent deposition of material from upslope allowed the development of humus rich topsoil. The development of a comparative deep topsoil on this steep slope after the removal of the original soil shows that soil degradation can be reversed by agricultural practices e.g. a dense vegetation cover by dense oldgrown shade trees, reduced tillage. The most important factor however is the addition of colluvial material, organic waste, and animal manure.
Vegetation: Banana plantation (4-5m), dominated by banana (Musa sp.) with scattered shade trees (introduced and indigenous), coffee (Coffea sp.), taro (Colocasia esculenta, cocoyam), maize (Zea mays), and beans as ground cover.
Soil Cover: Litter (30%), bare soil (40%), gravel (20%), grasses (10%) Alterations: Agriculture, spoil of house platform, banana planting, animal husbandry, manure, waste Erosion Feat.: Slight stone pavement
Archaeological Features:
Plastic waste, tatters
Soil Profile Horizon Description
Surface 15% medium gravel, 5% coarse gravel
Ap 0 � 20cm
Dark brown (7.5YR 3.5/3, moist; yellowish brown 10YR 5/4, dry) clay loam, common (10%) strongly weathered stones, weak granular to subangular blocky structure, low density, frequent roots, gradual wavy boundary, plastic waste.
Colluvium
Ap 2 20‐35cm
Brown (7.5YR 4/3, moist; brown 7.5YR 5/4, dry) clay loam, few (5%) strongly weathered medium gravel, weak subangular blocky to granular structure, moderate density, frequent roots, clear wavy boundary.
2 B/C 35 � 60cm
Brown (7.5YR 4/3, moist; brown 7.5YR 4.5/4, dry), clay, abundant (60%) strongly weathered stones, weak subangular to angular blocky structure, high density, few roots, animal holes, clear irregular boundary. Bedrock is a greyish gneiss
Truncated, in situ soil
3 B/C 60 � 110cm
Reddish brown (5YR 4/4, moist; yellowish red 5YR 5/6, dry), clay, abundant (80%) strongly weathered stones, weak subangular to angular blocky structure, high density, few roots. Bedrock is a yellowish‐whitish weathering gneiss
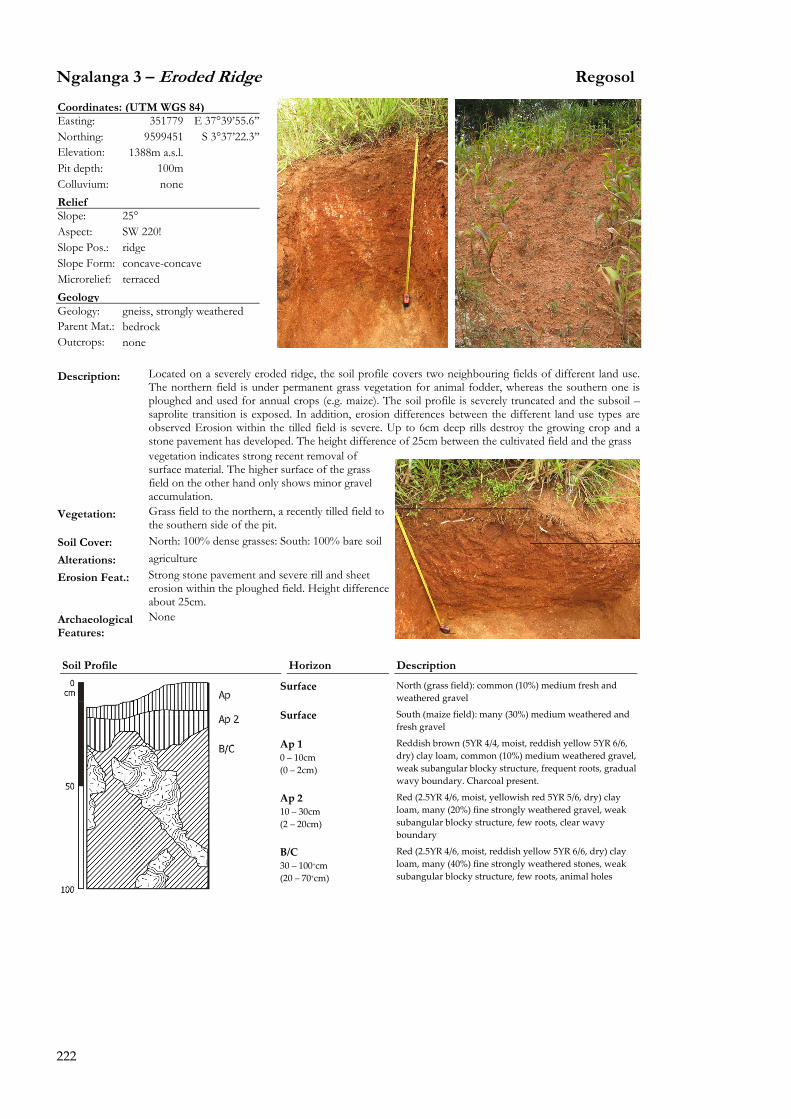
222
Ngalanga 3 � Eroded Ridge Regosol
Coordinates: (UTM WGS 84) Easting: 351779 E 37°39�55.6�� Northing: 9599451 S 3°37�22.3�� Elevation: 1388m a.s.l. Pit depth: 100m Colluvium: none Relief Slope: 25° Aspect: SW 220! Slope Pos.: ridge Slope Form: concave-concave Microrelief: terraced Geology Geology: gneiss, strongly weathered Parent Mat.: bedrock Outcrops: none Description: Located on a severely eroded ridge, the soil profile covers two neighbouring fields of different land use.
The northern field is under permanent grass vegetation for animal fodder, whereas the southern one is ploughed and used for annual crops (e.g. maize). The soil profile is severely truncated and the subsoil � saprolite transition is exposed. In addition, erosion differences between the different land use types are observed Erosion within the tilled field is severe. Up to 6cm deep rills destroy the growing crop and a stone pavement has developed. The height difference of 25cm between the cultivated field and the grass
vegetation indicates strong recent removal of surface material. The higher surface of the grass field on the other hand only shows minor gravel accumulation.
Vegetation: Grass field to the northern, a recently tilled field to the southern side of the pit.
Soil Cover: North: 100% dense grasses: South: 100% bare soil Alterations: agriculture Erosion Feat.: Strong stone pavement and severe rill and sheet
erosion within the ploughed field. Height difference about 25cm.
Archaeological Features:
None
Soil Profile Horizon Description
Surface North (grass field): common (10%) medium fresh and weathered gravel
Surface South (maize field): many (30%) medium weathered and fresh gravel
Ap 1 0 � 10cm (0 � 2cm)
Reddish brown (5YR 4/4, moist, reddish yellow 5YR 6/6, dry) clay loam, common (10%) medium weathered gravel, weak subangular blocky structure, frequent roots, gradual wavy boundary. Charcoal present.
Ap 2 10 � 30cm (2 � 20cm)
Red (2.5YR 4/6, moist, yellowish red 5YR 5/6, dry) clay loam, many (20%) fine strongly weathered gravel, weak subangular blocky structure, few roots, clear wavy boundary
B/C 30 � 100+cm (20 � 70+cm)
Red (2.5YR 4/6, moist, reddish yellow 5YR 6/6, dry) clay loam, many (40%) fine strongly weathered stones, weak subangular blocky structure, few roots, animal holes
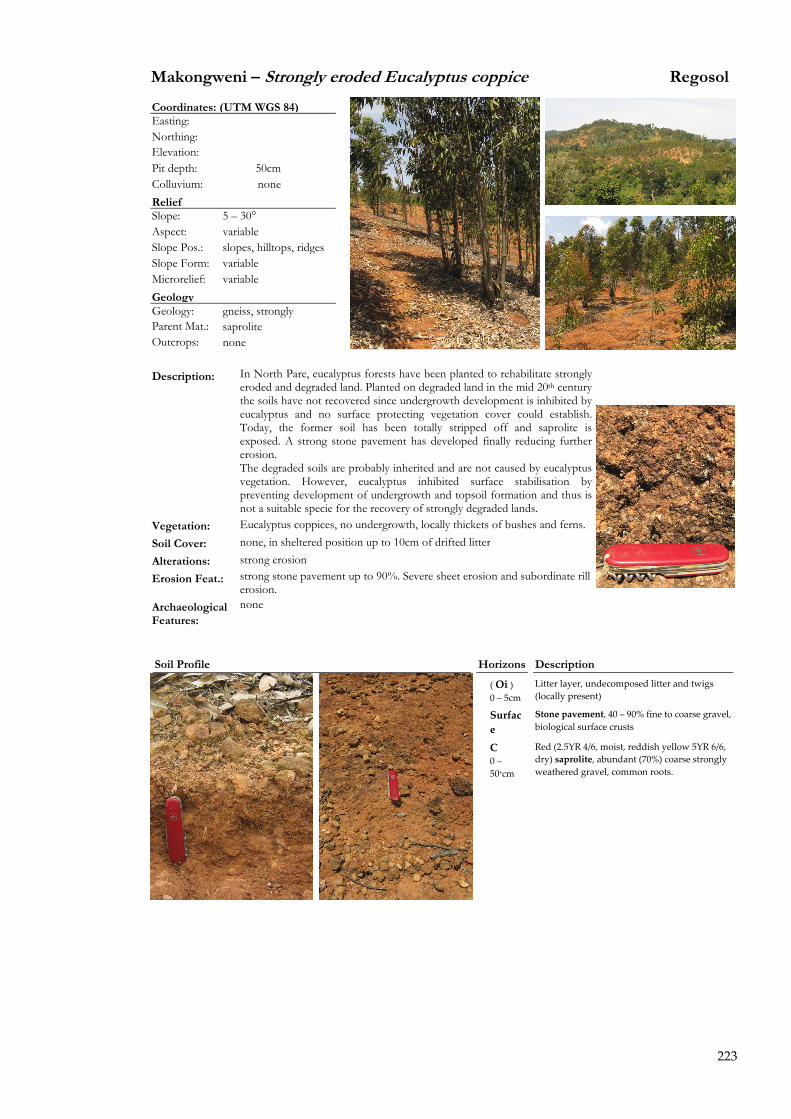
223
Makongweni � Strongly eroded Eucalyptus coppice Regosol
Coordinates: (UTM WGS 84) Easting: Northing: Elevation: Pit depth: 50cm Colluvium: none Relief Slope: 5 � 30° Aspect: variable Slope Pos.: slopes, hilltops, ridges Slope Form: variable Microrelief: variable Geology Geology: gneiss, strongly Parent Mat.: saprolite Outcrops: none
Description: In North Pare, eucalyptus forests have been planted to rehabilitate strongly
eroded and degraded land. Planted on degraded land in the mid 20th century the soils have not recovered since undergrowth development is inhibited by eucalyptus and no surface protecting vegetation cover could establish. Today, the former soil has been totally stripped off and saprolite is exposed. A strong stone pavement has developed finally reducing further erosion. The degraded soils are probably inherited and are not caused by eucalyptus vegetation. However, eucalyptus inhibited surface stabilisation by preventing development of undergrowth and topsoil formation and thus is not a suitable specie for the recovery of strongly degraded lands.
Vegetation: Eucalyptus coppices, no undergrowth, locally thickets of bushes and ferns. Soil Cover: none, in sheltered position up to 10cm of drifted litter Alterations: strong erosion Erosion Feat.: strong stone pavement up to 90%. Severe sheet erosion and subordinate rill
erosion. Archaeological Features:
none
Soil Profile Horizons Description
( Oi ) 0 � 5cm
Litter layer, undecomposed litter and twigs (locally present)
Surface
Stone pavement, 40 � 90% fine to coarse gravel, biological surface crusts
C 0 � 50+cm
Red (2.5YR 4/6, moist, reddish yellow 5YR 6/6, dry) saprolite, abundant (70%) coarse strongly weathered gravel, common roots.
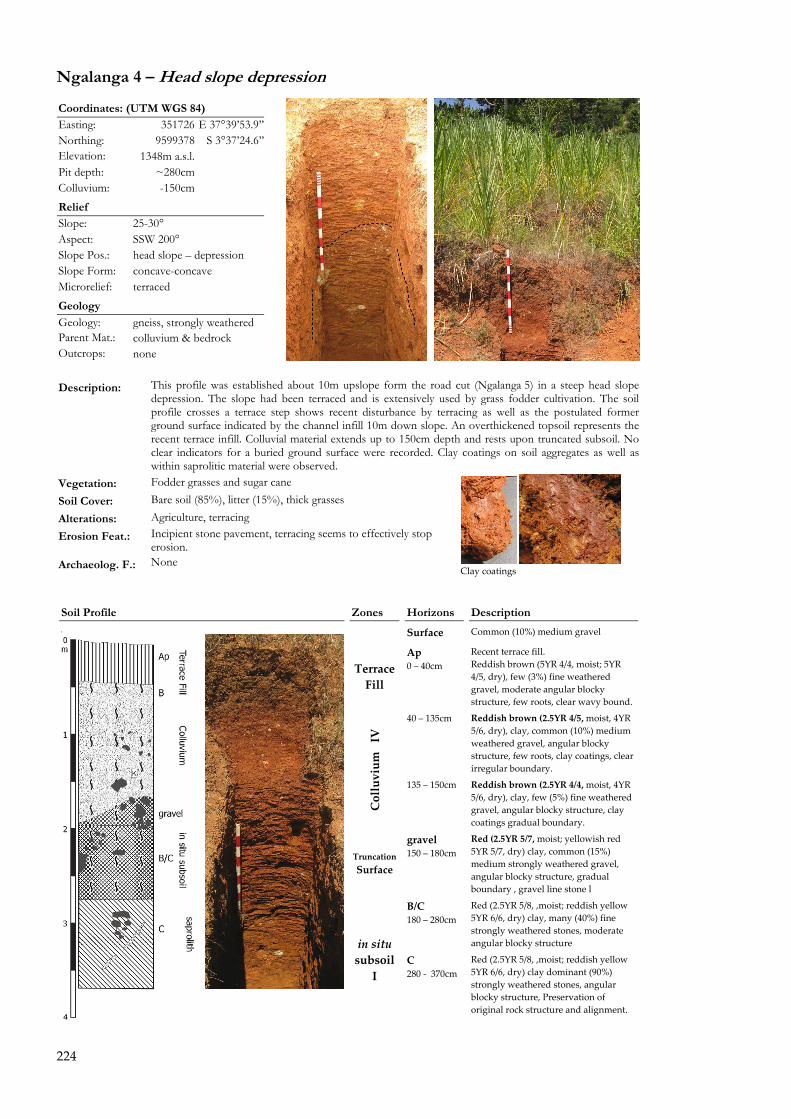
224
Ngalanga 4 � Head slope depression
Coordinates: (UTM WGS 84) Easting: 351726 E 37°39�53.9�� Northing: 9599378 S 3°37�24.6�� Elevation: 1348m a.s.l. Pit depth: ~280cm Colluvium: -150cm
Relief Slope: 25-30° Aspect: SSW 200° Slope Pos.: head slope � depression Slope Form: concave-concave Microrelief: terraced Geology Geology: gneiss, strongly weathered Parent Mat.: colluvium & bedrock Outcrops: none Description: This profile was established about 10m upslope form the road cut (Ngalanga 5) in a steep head slope
depression. The slope had been terraced and is extensively used by grass fodder cultivation. The soil profile crosses a terrace step shows recent disturbance by terracing as well as the postulated former ground surface indicated by the channel infill 10m down slope. An overthickened topsoil represents the recent terrace infill. Colluvial material extends up to 150cm depth and rests upon truncated subsoil. No clear indicators for a buried ground surface were recorded. Clay coatings on soil aggregates as well as within saprolitic material were observed.
Vegetation: Fodder grasses and sugar cane Soil Cover: Bare soil (85%), litter (15%), thick grasses Alterations: Agriculture, terracing Erosion Feat.: Incipient stone pavement, terracing seems to effectively stop
erosion. Archaeolog. F.: None
Clay coatings
Soil Profile Zones Horizons Description
Surface Common (10%) medium gravel
Terrace Fill
Ap 0 � 40cm
Recent terrace fill. Reddish brown (5YR 4/4, moist; 5YR 4/5, dry), few (3%) fine weathered gravel, moderate angular blocky structure, few roots, clear wavy bound.
40 � 135cm Reddish brown (2.5YR 4/5, moist, 4YR 5/6, dry), clay, common (10%) medium weathered gravel, angular blocky structure, few roots, clay coatings, clear irregular boundary.
Colluvium IV
135 � 150cm Reddish brown (2.5YR 4/4, moist, 4YR 5/6, dry), clay, few (5%) fine weathered gravel, angular blocky structure, clay coatings gradual boundary.
TruncationSurface
gravel 150 � 180cm
Red (2.5YR 5/7, moist; yellowish red 5YR 5/7, dry) clay, common (15%) medium strongly weathered gravel, angular blocky structure, gradual boundary , gravel line stone l
B/C 180 � 280cm
Red (2.5YR 5/8, ,moist; reddish yellow 5YR 6/6, dry) clay, many (40%) fine strongly weathered stones, moderate angular blocky structure
in situ subsoil I
C 280 ‐ 370cm
Red (2.5YR 5/8, ,moist; reddish yellow 5YR 6/6, dry) clay dominant (90%) strongly weathered stones, angular blocky structure, Preservation of original rock structure and alignment.
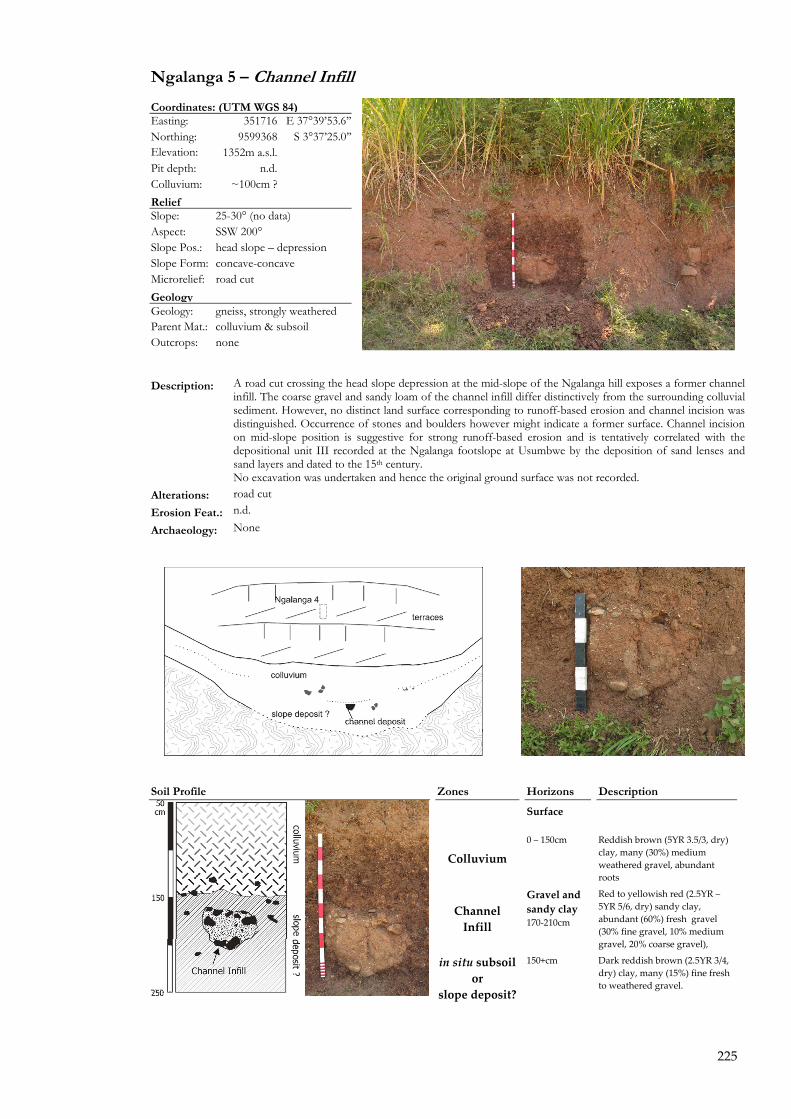
225
Ngalanga 5 � Channel Infill
Coordinates: (UTM WGS 84) Easting: 351716 E 37°39�53.6��Northing: 9599368 S 3°37�25.0��Elevation: 1352m a.s.l. Pit depth: n.d. Colluvium: ~100cm ? Relief Slope: 25-30° (no data) Aspect: SSW 200° Slope Pos.: head slope � depression Slope Form: concave-concave Microrelief: road cut Geology Geology: gneiss, strongly weathered Parent Mat.: colluvium & subsoil Outcrops: none
Description: A road cut crossing the head slope depression at the mid-slope of the Ngalanga hill exposes a former channel infill. The coarse gravel and sandy loam of the channel infill differ distinctively from the surrounding colluvial sediment. However, no distinct land surface corresponding to runoff-based erosion and channel incision was distinguished. Occurrence of stones and boulders however might indicate a former surface. Channel incision on mid-slope position is suggestive for strong runoff-based erosion and is tentatively correlated with the depositional unit III recorded at the Ngalanga footslope at Usumbwe by the deposition of sand lenses and sand layers and dated to the 15th century. No excavation was undertaken and hence the original ground surface was not recorded.
Alterations: road cut
Erosion Feat.: n.d.
Archaeology: None
Soil Profile Zones Horizons Description
Surface
Colluvium 0 � 150cm Reddish brown (5YR 3.5/3, dry)
clay, many (30%) medium weathered gravel, abundant roots
Channel Infill
Gravel and sandy clay 170‐210cm
Red to yellowish red (2.5YR � 5YR 5/6, dry) sandy clay, abundant (60%) fresh gravel (30% fine gravel, 10% medium gravel, 20% coarse gravel),
in situ subsoilor
slope deposit?
150+cm
Dark reddish brown (2.5YR 3/4, dry) clay, many (15%) fine fresh to weathered gravel.
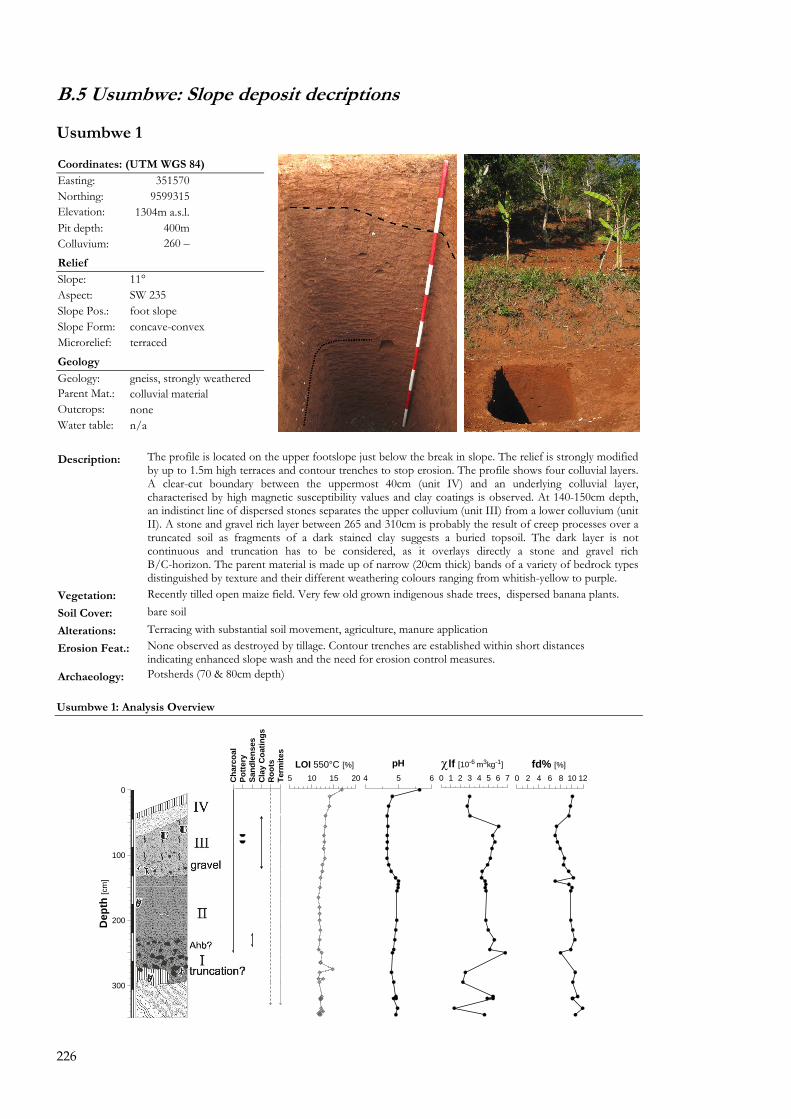
226
B.5 Usumbwe: Slope deposit decriptions
Usumbwe 1
Usumbwe 1: Analysis Overview
0 2 4 6 8 10 12fd% [%]
0 1 2 3 4 5 6 7
χlf [10-6 m3kg-1]
4 5 6
pH5 10 15 20
LOI 550°C [%]
300
200
100
0
Dep
th [c
m]
Cha
rcoa
lPo
ttery
Sand
lens
esC
lay
Coa
tings
Roo
tsTe
rmite
s
Coordinates: (UTM WGS 84) Easting: 351570 Northing: 9599315 Elevation: 1304m a.s.l. Pit depth: 400m Colluvium: 260 �
Relief Slope: 11° Aspect: SW 235 Slope Pos.: foot slope Slope Form: concave-convex Microrelief: terraced Geology Geology: gneiss, strongly weathered Parent Mat.: colluvial material Outcrops: none Water table: n/a Description: The profile is located on the upper footslope just below the break in slope. The relief is strongly modified
by up to 1.5m high terraces and contour trenches to stop erosion. The profile shows four colluvial layers. A clear-cut boundary between the uppermost 40cm (unit IV) and an underlying colluvial layer, characterised by high magnetic susceptibility values and clay coatings is observed. At 140-150cm depth, an indistinct line of dispersed stones separates the upper colluvium (unit III) from a lower colluvium (unit II). A stone and gravel rich layer between 265 and 310cm is probably the result of creep processes over a truncated soil as fragments of a dark stained clay suggests a buried topsoil. The dark layer is not continuous and truncation has to be considered, as it overlays directly a stone and gravel rich B/C-horizon. The parent material is made up of narrow (20cm thick) bands of a variety of bedrock types distinguished by texture and their different weathering colours ranging from whitish-yellow to purple.
Vegetation: Recently tilled open maize field. Very few old grown indigenous shade trees, dispersed banana plants. Soil Cover: bare soil Alterations: Terracing with substantial soil movement, agriculture, manure application Erosion Feat.: None observed as destroyed by tillage. Contour trenches are established within short distances
indicating enhanced slope wash and the need for erosion control measures. Archaeology: Potsherds (70 & 80cm depth)
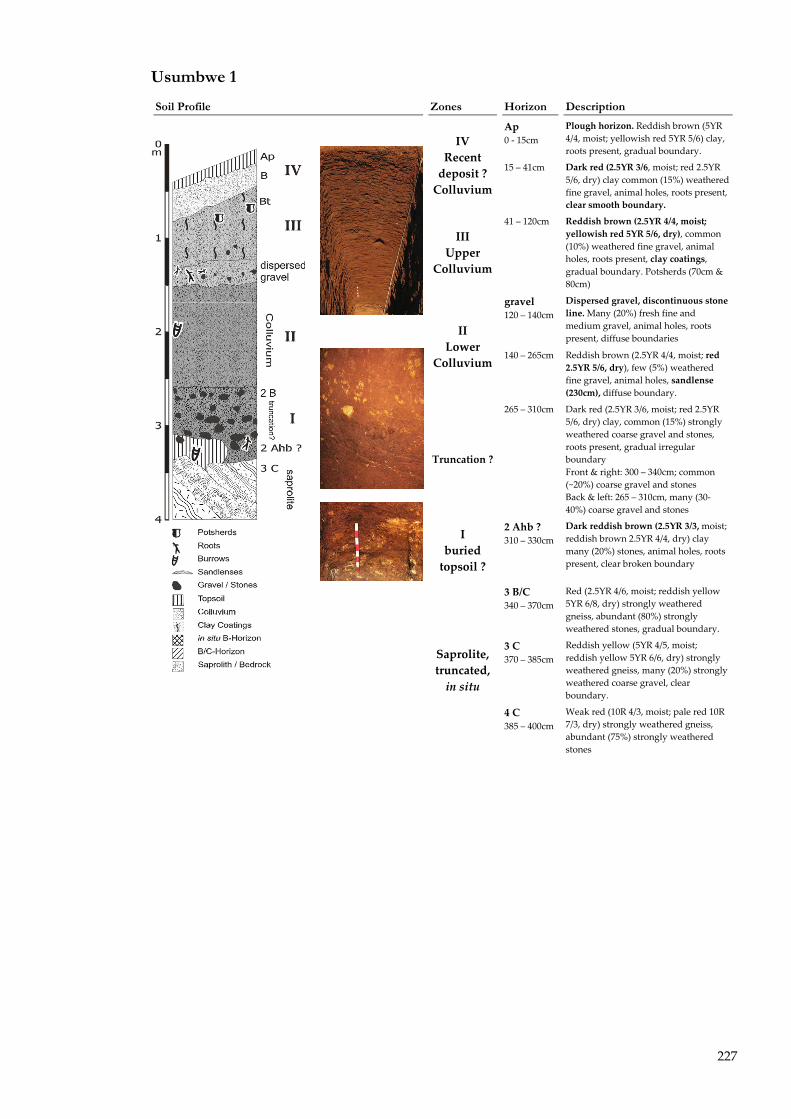
227
Usumbwe 1
Soil Profile Zones Horizon Description
Ap 0 ‐ 15cm
Plough horizon. Reddish brown (5YR 4/4, moist; yellowish red 5YR 5/6) clay, roots present, gradual boundary.
IV Recent deposit ? Colluvium
15 � 41cm Dark red (2.5YR 3/6, moist; red 2.5YR 5/6, dry) clay common (15%) weathered fine gravel, animal holes, roots present, clear smooth boundary.
III Upper
Colluvium
41 � 120cm Reddish brown (2.5YR 4/4, moist; yellowish red 5YR 5/6, dry), common (10%) weathered fine gravel, animal holes, roots present, clay coatings, gradual boundary. Potsherds (70cm & 80cm)
gravel 120 � 140cm
Dispersed gravel, discontinuous stone line. Many (20%) fresh fine and medium gravel, animal holes, roots present, diffuse boundaries
II Lower
Colluvium 140 � 265cm Reddish brown (2.5YR 4/4, moist; red
2.5YR 5/6, dry), few (5%) weathered fine gravel, animal holes, sandlense (230cm), diffuse boundary.
Truncation ?
265 � 310cm Dark red (2.5YR 3/6, moist; red 2.5YR 5/6, dry) clay, common (15%) strongly weathered coarse gravel and stones, roots present, gradual irregular boundary Front & right: 300 � 340cm; common (~20%) coarse gravel and stones Back & left: 265 � 310cm, many (30‐40%) coarse gravel and stones
I buried topsoil ?
2 Ahb ? 310 � 330cm
Dark reddish brown (2.5YR 3/3, moist; reddish brown 2.5YR 4/4, dry) clay many (20%) stones, animal holes, roots present, clear broken boundary
3 B/C 340 � 370cm
Red (2.5YR 4/6, moist; reddish yellow 5YR 6/8, dry) strongly weathered gneiss, abundant (80%) strongly weathered stones, gradual boundary.
3 C 370 � 385cm
Reddish yellow (5YR 4/5, moist; reddish yellow 5YR 6/6, dry) strongly weathered gneiss, many (20%) strongly weathered coarse gravel, clear boundary.
Saprolite, truncated, in situ
4 C 385 � 400cm
Weak red (10R 4/3, moist; pale red 10R 7/3, dry) strongly weathered gneiss, abundant (75%) strongly weathered stones
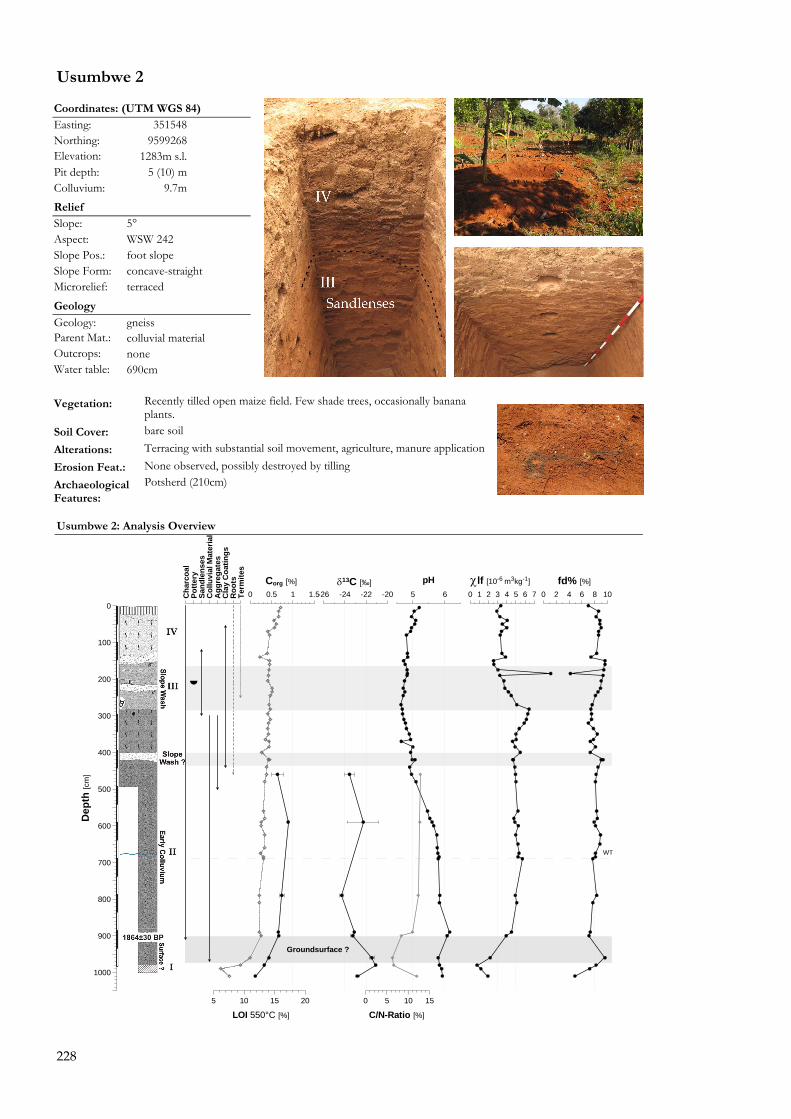
228
Usumbwe 2
Usumbwe 2: Analysis Overview
WT
Groundsurface ?
0 2 4 6 8 10fd% [%]
0 1 2 3 4 5 6 7
χlf [10-6 m3kg-1]
5 6
pH
0 5 10 15
C/N-Ratio [%]
-26 -24 -22 -20δ13C [‰]
5 10 15 20
LOI 550°C [%]
0 0.5 1 1.5Corg [%]
1000
900
800
700
600
500
400
300
200
100
0
Dep
th [c
m]
Cha
rcoa
lPo
ttery
Sand
lens
esC
ollu
vial
Mat
eria
lA
ggre
gate
sC
lay
Coa
tings
Roo
tsTe
rmite
s
Coordinates: (UTM WGS 84) Easting: 351548 Northing: 9599268 Elevation: 1283m s.l. Pit depth: 5 (10) m Colluvium: 9.7m
Relief Slope: 5° Aspect: WSW 242 Slope Pos.: foot slope Slope Form: concave-straight Microrelief: terraced Geology Geology: gneiss Parent Mat.: colluvial material Outcrops: none Water table: 690cm
Vegetation: Recently tilled open maize field. Few shade trees, occasionally banana
plants. Soil Cover: bare soil Alterations: Terracing with substantial soil movement, agriculture, manure application Erosion Feat.: None observed, possibly destroyed by tilling Archaeological Features:
Potsherd (210cm)
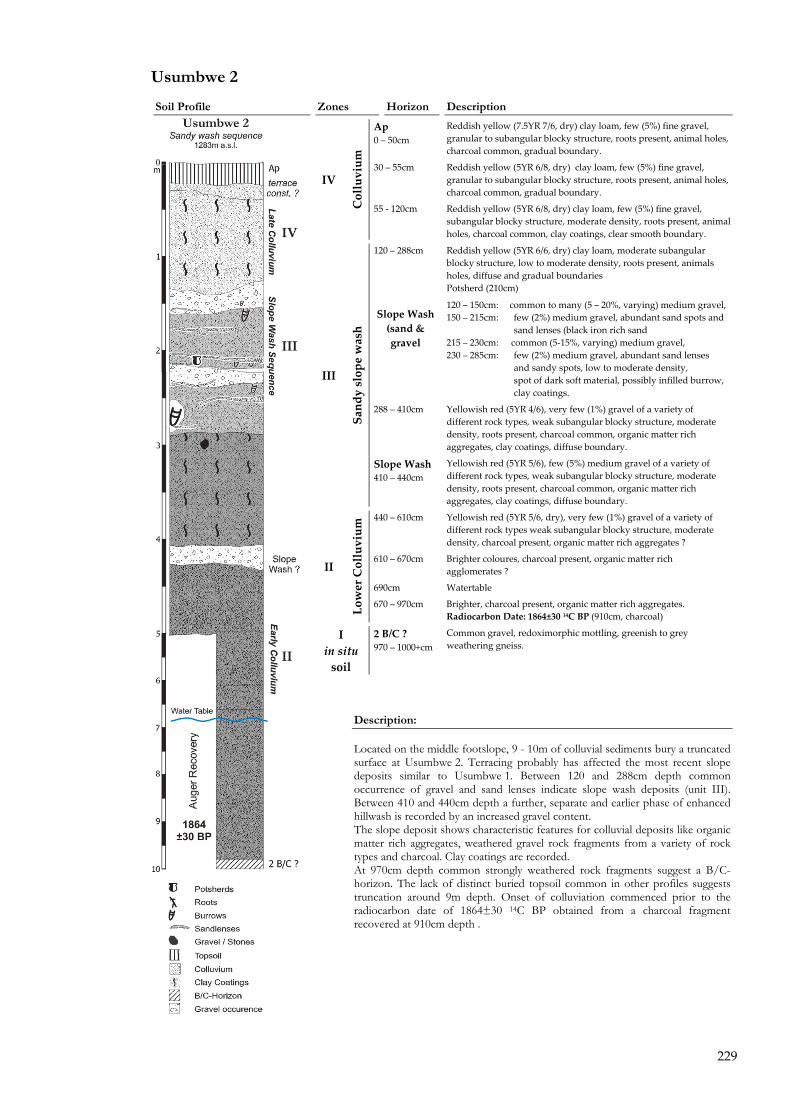
229
Usumbwe 2
Soil Profile Zones Horizon Description
Ap 0 � 50cm
Reddish yellow (7.5YR 7/6, dry) clay loam, few (5%) fine gravel, granular to subangular blocky structure, roots present, animal holes, charcoal common, gradual boundary.
30 � 55cm Reddish yellow (5YR 6/8, dry) clay loam, few (5%) fine gravel, granular to subangular blocky structure, roots present, animal holes, charcoal common, gradual boundary.
IV
Colluvium
55 ‐ 120cm Reddish yellow (5YR 6/8, dry) clay loam, few (5%) fine gravel, subangular blocky structure, moderate density, roots present, animal holes, charcoal common, clay coatings, clear smooth boundary.
Reddish yellow (5YR 6/6, dry) clay loam, moderate subangular blocky structure, low to moderate density, roots present, animals holes, diffuse and gradual boundaries Potsherd (210cm)
120 � 288cm Slope Wash (sand & gravel
120 � 150cm: common to many (5 � 20%, varying) medium gravel, 150 � 215cm: few (2%) medium gravel, abundant sand spots and sand lenses (black iron rich sand 215 � 230cm: common (5‐15%, varying) medium gravel, 230 � 285cm: few (2%) medium gravel, abundant sand lenses and sandy spots, low to moderate density, spot of dark soft material, possibly infilled burrow, clay coatings.
288 � 410cm Yellowish red (5YR 4/6), very few (1%) gravel of a variety of different rock types, weak subangular blocky structure, moderate density, roots present, charcoal common, organic matter rich aggregates, clay coatings, diffuse boundary.
III Sandy slope wash
Slope Wash 410 � 440cm
Yellowish red (5YR 5/6), few (5%) medium gravel of a variety of different rock types, weak subangular blocky structure, moderate density, roots present, charcoal common, organic matter rich aggregates, clay coatings, diffuse boundary.
440 � 610cm Yellowish red (5YR 5/6, dry), very few (1%) gravel of a variety of different rock types weak subangular blocky structure, moderate density, charcoal present, organic matter rich aggregates ?
610 � 670cm Brighter coloures, charcoal present, organic matter rich agglomerates ?
690cm Watertable
II
Lower Colluvium
670 � 970cm Brighter, charcoal present, organic matter rich aggregates. Radiocarbon Date: 1864±30 14C BP (910cm, charcoal)
I in situ soil
2 B/C ? 970 � 1000+cm
Common gravel, redoximorphic mottling, greenish to grey weathering gneiss.
Description:
Located on the middle footslope, 9 - 10m of colluvial sediments bury a truncated surface at Usumbwe 2. Terracing probably has affected the most recent slope deposits similar to Usumbwe 1. Between 120 and 288cm depth common occurrence of gravel and sand lenses indicate slope wash deposits (unit III). Between 410 and 440cm depth a further, separate and earlier phase of enhanced hillwash is recorded by an increased gravel content. The slope deposit shows characteristic features for colluvial deposits like organic matter rich aggregates, weathered gravel rock fragments from a variety of rock types and charcoal. Clay coatings are recorded. At 970cm depth common strongly weathered rock fragments suggest a B/C-horizon. The lack of distinct buried topsoil common in other profiles suggests truncation around 9m depth. Onset of colluviation commenced prior to the radiocarbon date of 1864±30 14C BP obtained from a charcoal fragment recovered at 910cm depth .
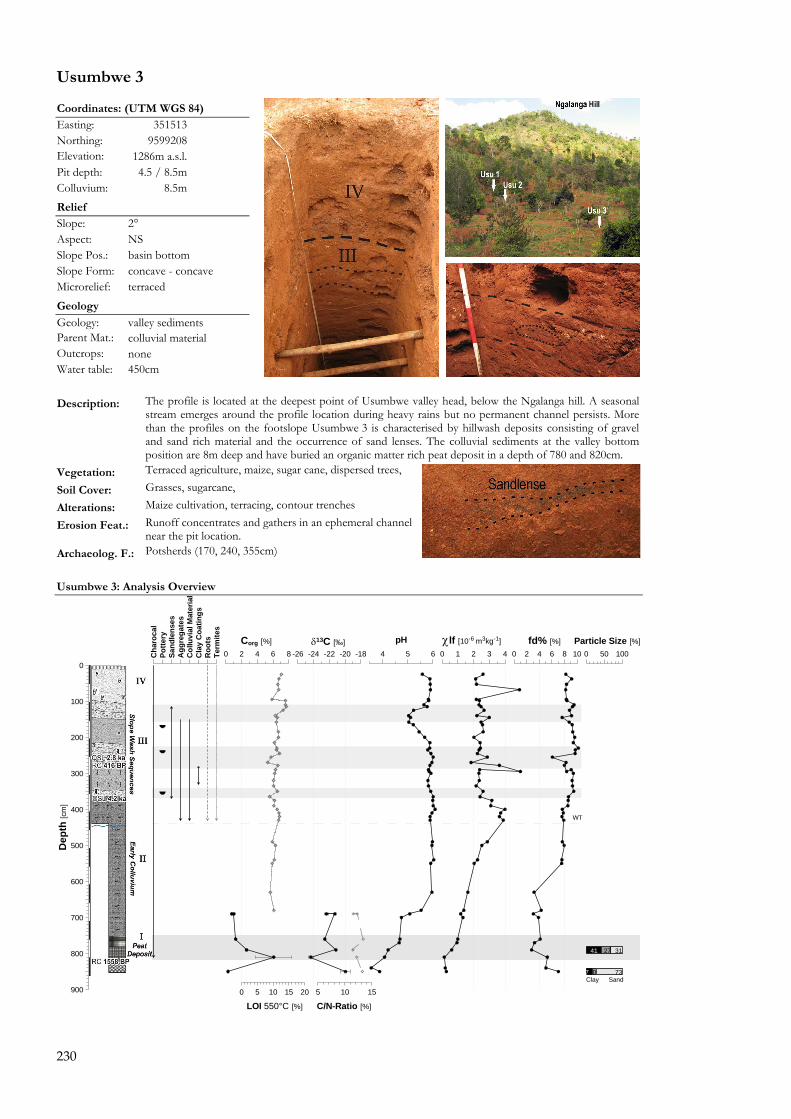
230
Usumbwe 3
Usumbwe 3: Analysis Overview
SandClay
WT
41
17
27
10
31
73
0 50 100Particle Size [%]
0 2 4 6 8 10fd% [%]
0 1 2 3 4
χlf [10-6 m3kg-1]
4 5 6
pH
5 10 15
C/N-Ratio [%]
-26 -24 -22 -20 -18δ13C [‰]
0 5 10 15 20
LOI 550°C [%]
0 2 4 6 8Corg [%]
900
800
700
600
500
400
300
200
100
0
Dep
th [c
m]
Cha
roca
lPo
ttery
Sand
lens
esA
ggre
gate
sC
ollu
vial
Mat
eria
lC
lay
Coa
tings
Roo
tsTe
rmite
s
Coordinates: (UTM WGS 84) Easting: 351513 Northing: 9599208 Elevation: 1286m a.s.l. Pit depth: 4.5 / 8.5m Colluvium: 8.5m
Relief Slope: 2° Aspect: NS Slope Pos.: basin bottom Slope Form: concave - concave Microrelief: terraced Geology Geology: valley sediments Parent Mat.: colluvial material Outcrops: none Water table: 450cm
Description: The profile is located at the deepest point of Usumbwe valley head, below the Ngalanga hill. A seasonal
stream emerges around the profile location during heavy rains but no permanent channel persists. More than the profiles on the footslope Usumbwe 3 is characterised by hillwash deposits consisting of gravel and sand rich material and the occurrence of sand lenses. The colluvial sediments at the valley bottom position are 8m deep and have buried an organic matter rich peat deposit in a depth of 780 and 820cm.
Vegetation: Terraced agriculture, maize, sugar cane, dispersed trees,
Soil Cover: Grasses, sugarcane,
Alterations: Maize cultivation, terracing, contour trenches
Erosion Feat.: Runoff concentrates and gathers in an ephemeral channel near the pit location.
Archaeolog. F.: Potsherds (170, 240, 355cm)

231
Usumbwe 3
Soil Profile Zones Horizon Description Ap 0 � 40cm
Recent plough horizon. Clay loam, low humus content, very few (1%) strongly weathered medium gravel, weak subangular blocky to granular structure, common fine and coarse roots, high termite activity, frequent animal holes, charcoal present.
IV Upper colluvium 40 � 95cm Yellowish red (5YR 4/5, moist; yellowish red 5YR 5/6, dry) clay
loam, few (2%) medium strongly weathered gravel, weak subangular blocky structure, moderate density, common fine and coarse roots, termites present, frequent animal holes, abundant charcoal, clear boundary.
95 � 155cm Alternating layers (~20cm) of varying gravel content, clear boundaries. Generally: Yellowish red (5YR 4/6, moist; yellowish red 5YR 5/6, dry) sandy clay , weak subangular blocky structure, moderate density, fine and coarse roots present, termites present, few charcoal, organic matter rich aggregates, common sand lenses.
Slope Wash
(gravel & sands)
95 � 115cm few (2%) medium gravel, iron gravel 115 ‐ 135 common (5) up to coarse gravel 135 ‐ 155 many (30%) up to coarse gravel
Colluvium
155 � 220cm
Yellowish red (5YR 5/6, moist; yellowish red 5YR 5/6, dry) clay loam, very few (1%) medium strongly weathered gravel, weak subangular blocky structure, moderate density, fine roots present, termites present, frequent organic matter rich aggregates, many charcoal. Potsherd (170cm)
220 � 280cm
Alternating layers (~10cm) of varying gravel content and clear boundaries. Generally: reddish brown (5YR 4/4, moist; yellowish red 5YR 5/6, dry) sandy clay loam, alternating many (20‐30%) and few (1‐10%) medium to coarse gravel, weak subangular blocky structure, moderate density, fine roots present, termites present, very few charcoal, Slope
Wash (gravel & sands)
220 ‐ 235 many (30%) up to coarse gravel, clayey 235 ‐ 255 very few (1%) medium gravel, clayey, potsherd (240cm) 250 ‐ 265 many (30%) up to coarse gravel, sandy, OSL: 2.800±250 a (260cm) 265 ‐ 275 common (10%) medium gravel, sandy 275 ‐ 280 many (20%) medium gravel, sandy 14C Date: 416±45 14C BP (285cm, charcoal)
Colluvium
280 � 350cm
Reddish brown (5YR 4/4, moist; red 2.5YR 5/6, dry), sandy clay loam, few (2%) to common (10%) medium to coarse strongly weathered gravel, low to moderate density, weak subangular blocky structure, fine roots present, termites present, many charcoal, clay coatings in root channels
III
Slope Wash Sequence
Slope Wash
(sand lenses)
350 � 370cm
Reddish brown (5YR 4/4, moist; yellowish red 5YR 5/6, dry), sandy clay loam, sand lenses, very few (1%) medium strongly weathered gravel, low density, weak subangular blocky structure, fine roots present, termites present, common charcoal, clear smooth boundary. Potsherd (355cm). OSL2: 4.170±240 a (365cm)
Colluviumseasonally waterlogged
370 � 500cm
Dark reddish brown (5YR 3/3, moist; yellowish red 5YR 4/6, dry) sandy clay, very few (1%) medium strongly weathered gravel, low density, weak subangular to angular blocky structure, fine roots present, termites present, organic matter rich aggregates, charcoal present, gleyed and discoloured due to seasonal waterlogging, grey reductimorphic colours increases below 430cm.
450cm Watertable (13.11.08) � Recovery via auger survey
500 � 685cm
Dark reddish brown (5YR 3/3, moist; brown 7.5YR 5/4, dry) Very few (1%) fine gravel, redoximorphic mottling, organic matter rich aggregates ?, finely dispersed charcoal
II Lower
colluviumcolluvium permanently waterlogged
685 � ~750cm
Dark brown (10YR 3/3, moist; brown 10YR 5/3, dry) Very few (1%) fine gravel, redoximorphic mottling, less coloured more gleyed, organic matter rich aggregates ?, finely dispersed charcoal.
2 Oab 1 ~750‐ 780cm
Very dark greyish brown (10YR 3/2, moist; greyish brown 10YR 5/2, dry), clay, very few up to medium gravel, organic matter rich, abundant charcoal I
Stable Surface
Peat Deposit 2 Oab 2
780 � 820cm
Black (10YR 2/1, moist; dark grey 10YR 4/1, dry), organic matter rich, peat‐like deposit (bark fragments ?), few up to coarse gravel, abundant charcoal. Radiocarbon Date: 1558±45 14C BP (812cmm, charcoal)
in situ soil ?
Sand 820 � 850+cm
Dark grey (2.5Y 4/1, moist; grey 2.5Y 6/1, dry), loamy sand, discoloured grey, reductimorph matrix, reductive colour pattern, organic material diminishes at about 840cm (A13) 850cm (A14), homogeneous grey, no organic matter, no charcoal.

232
B.6 Kwa Kirumbi: Forest soils
Kwa Kirumbi 1 � Forest Ridge Umbric Acrisol ?
Coordinates: (UTM WGS 84) Geology
Easting: 353659 E 37°40�56.4�� Bedrock Geology: Gneiss, strongly weatheredNorthing: 9597500 S 3°38�25.9�� Parent Material: in situ weathered Gneiss Elevation: 1408m a.s.l. Rock Outcrops: none
Relief Profile Data
Slope: 5° Pit depth: 80cm / 180cm Auger Aspect: W 280° Colluvium: none Slope Pos.: ridge Water table: - Slope Form: convex � convex Drainage: good Microrelief: smooth E37° 40 56.4 S3 38 25.9 Description: Kwa Kirumbi was formerly a sacred groove of the Mshana clan before
it was taken over by the Msuya clan and therefore has nowadays a less ridged protection status than other sacred groves. The Kwa Kirumbi Forest Ridge profile is located on top of the asymmetrical northern ridge about 20m from the forest boundary and about two meters from the steep slope into the head slope depression. The profile shows a well developed forest soils with a thick organic layer and an organic matter rich topsoil over a 1.5m deep subsoil. Clay coatings indicate argilluviation and led to the tentative classification of an Acrisol, although no clay increase was observed nor was a clay deplete eluvial horizon recorded.
Vegetation: Strongly intervened natural ridge forest with up to 30-40m high canopy trees, a 4m high intermediate layer of small trees and a 2m high shrub & bush layer. No grasses.
Soil Cover: Litter (about 1cm) Alterations: Firewood extraction, selective timber logging, occasional litter and raw
humus extraction for manure, ritual worship.
Soil Profile Horizon Description
Oi +0.5cm
Litter composed of leaves, twigs and bark
Oe 0 ‐ 1.5cm
Thin layer of moderately decomposed organic material, many fine and common coarse roots, diffuse boundary.
Ah umbric Hz 1.5 � 28cm
Dark brown (7.5YR 3/2, moist; dark greyish brown 10YR 4/2, dry) organic matter rich (2‐5%), moderate granular structure, many fine and common coarse roots, gradual wavy boundary. Potsherd.
AB 28 � 45cm
Yellowish red (5YR 4/6, moist; brown 7.5YR 5/4, dry), clay, very few strongly weathered coarse angular gravel, weak granular to subangular blocky structure, few fine and coarse roots, clear wavy boundary. Potsherd.
Bt 1 45 ‐ 55cm
Yellowish red (5YR 4/6, moist; 5YR 5/6, dry), clay, very few strongly weathered coarse angular gravel, weak subangular blocky structure, clay coatings, few roots, gradual irregular boundary.
Bt 2 55 ‐ 100
Yellowish red (5YR 4/6, moist; strong brown 7.5YR 5/6, dry), clay loam, many strongly weathered coarse gravel and stones, weak subangular to angular blocky structure, clay coatings, few roots
B 100 � 160cm
Reddish brown (5YR 4/4, moist; strong brown 7.5YR 5/6, dry) clay loam, few strongly weathered gravel, gradual boundary.
C 160 � 180+cm
Yellowish red (5YR 5/6, moist; reddish yellow 7.5YR 7/7, dry), abundant strongly weathered yellowish whitish gneiss gravel, saprolite.
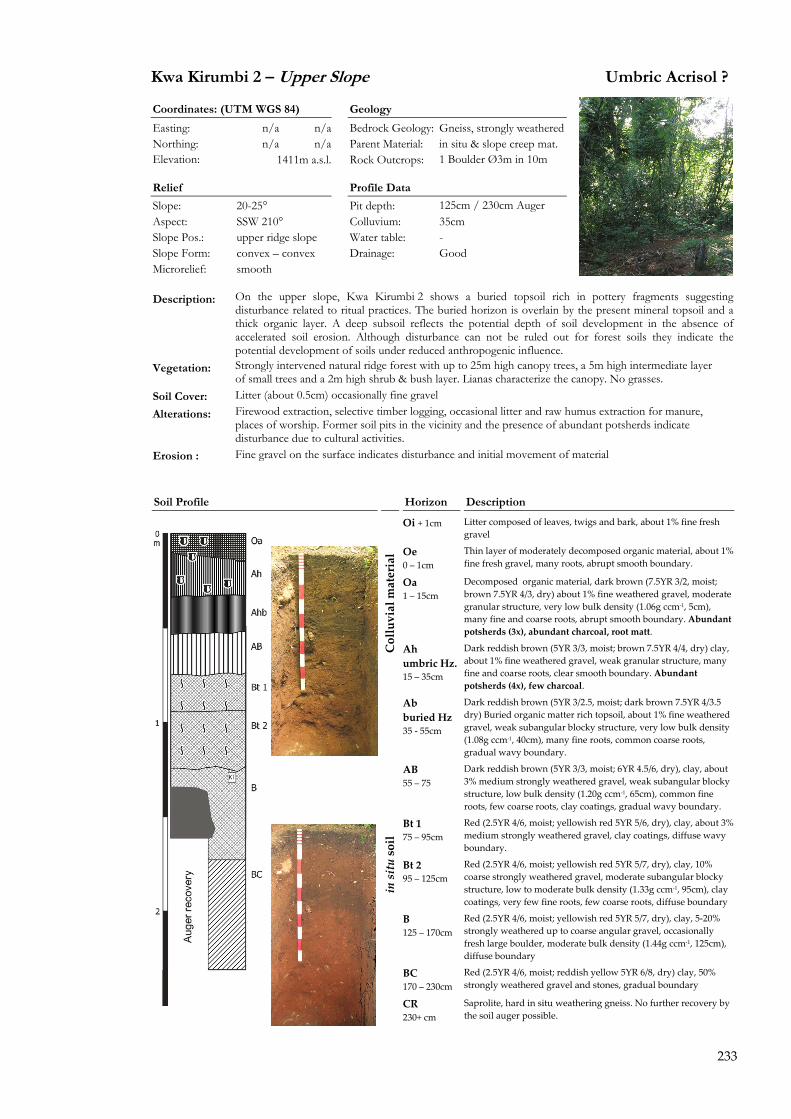
233
Kwa Kirumbi 2 � Upper Slope Umbric Acrisol ?
Coordinates: (UTM WGS 84) Geology
Easting: n/a n/a Bedrock Geology: Gneiss, strongly weathered Northing: n/a n/a Parent Material: in situ & slope creep mat. Elevation: 1411m a.s.l. Rock Outcrops: 1 Boulder Ø3m in 10m
Relief Profile Data Slope: 20-25° Pit depth: 125cm / 230cm Auger Aspect: SSW 210° Colluvium: 35cm Slope Pos.: upper ridge slope Water table: - Slope Form: convex � convex Drainage: Good Microrelief: smooth Description: On the upper slope, Kwa Kirumbi 2 shows a buried topsoil rich in pottery fragments suggesting
disturbance related to ritual practices. The buried horizon is overlain by the present mineral topsoil and a thick organic layer. A deep subsoil reflects the potential depth of soil development in the absence of accelerated soil erosion. Although disturbance can not be ruled out for forest soils they indicate the potential development of soils under reduced anthropogenic influence.
Vegetation: Strongly intervened natural ridge forest with up to 25m high canopy trees, a 5m high intermediate layer of small trees and a 2m high shrub & bush layer. Lianas characterize the canopy. No grasses.
Soil Cover: Litter (about 0.5cm) occasionally fine gravel Alterations: Firewood extraction, selective timber logging, occasional litter and raw humus extraction for manure,
places of worship. Former soil pits in the vicinity and the presence of abundant potsherds indicate disturbance due to cultural activities.
Erosion : Fine gravel on the surface indicates disturbance and initial movement of material
Soil Profile Horizon Description
Oi + 1cm Litter composed of leaves, twigs and bark, about 1% fine fresh gravel
Oe 0 � 1cm
Thin layer of moderately decomposed organic material, about 1% fine fresh gravel, many roots, abrupt smooth boundary.
Oa 1 � 15cm
Decomposed organic material, dark brown (7.5YR 3/2, moist; brown 7.5YR 4/3, dry) about 1% fine weathered gravel, moderate granular structure, very low bulk density (1.06g ccm‐1, 5cm), many fine and coarse roots, abrupt smooth boundary. Abundant potsherds (3x), abundant charcoal, root matt.
Colluvial material
Ah umbric Hz.15 � 35cm
Dark reddish brown (5YR 3/3, moist; brown 7.5YR 4/4, dry) clay, about 1% fine weathered gravel, weak granular structure, many fine and coarse roots, clear smooth boundary. Abundant potsherds (4x), few charcoal.
Ab buried Hz 35 ‐ 55cm
Dark reddish brown (5YR 3/2.5, moist; dark brown 7.5YR 4/3.5 dry) Buried organic matter rich topsoil, about 1% fine weathered gravel, weak subangular blocky structure, very low bulk density (1.08g ccm‐1, 40cm), many fine roots, common coarse roots, gradual wavy boundary.
AB 55 � 75
Dark reddish brown (5YR 3/3, moist; 6YR 4.5/6, dry), clay, about 3% medium strongly weathered gravel, weak subangular blocky structure, low bulk density (1.20g ccm‐1, 65cm), common fine roots, few coarse roots, clay coatings, gradual wavy boundary.
Bt 1 75 � 95cm
Red (2.5YR 4/6, moist; yellowish red 5YR 5/6, dry), clay, about 3% medium strongly weathered gravel, clay coatings, diffuse wavy boundary.
Bt 2 95 � 125cm
Red (2.5YR 4/6, moist; yellowish red 5YR 5/7, dry), clay, 10% coarse strongly weathered gravel, moderate subangular blocky structure, low to moderate bulk density (1.33g ccm‐1, 95cm), clay coatings, very few fine roots, few coarse roots, diffuse boundary
B 125 � 170cm
Red (2.5YR 4/6, moist; yellowish red 5YR 5/7, dry), clay, 5‐20% strongly weathered up to coarse angular gravel, occasionally fresh large boulder, moderate bulk density (1.44g ccm‐1, 125cm), diffuse boundary
BC 170 � 230cm
Red (2.5YR 4/6, moist; reddish yellow 5YR 6/8, dry) clay, 50% strongly weathered gravel and stones, gradual boundary
in situ soil
CR 230+ cm
Saprolite, hard in situ weathering gneiss. No further recovery by the soil auger possible.
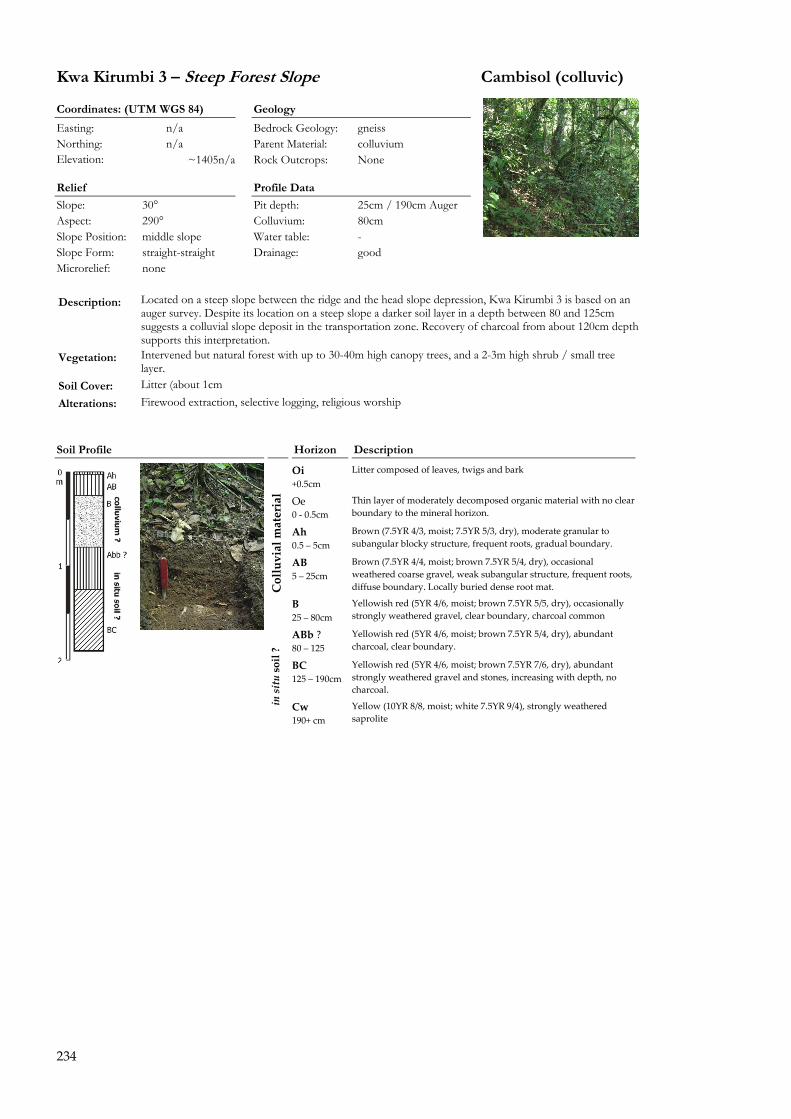
234
Kwa Kirumbi 3 � Steep Forest Slope Cambisol (colluvic)
Coordinates: (UTM WGS 84) Geology
Easting: n/a Bedrock Geology: gneiss Northing: n/a Parent Material: colluvium Elevation: ~1405n/a Rock Outcrops: None
Relief Profile Data Slope: 30° Pit depth: 25cm / 190cm Auger Aspect: 290° Colluvium: 80cm Slope Position: middle slope Water table: - Slope Form: straight-straight Drainage: good Microrelief: none Description: Located on a steep slope between the ridge and the head slope depression, Kwa Kirumbi 3 is based on an
auger survey. Despite its location on a steep slope a darker soil layer in a depth between 80 and 125cm suggests a colluvial slope deposit in the transportation zone. Recovery of charcoal from about 120cm depth supports this interpretation.
Vegetation: Intervened but natural forest with up to 30-40m high canopy trees, and a 2-3m high shrub / small tree layer.
Soil Cover: Litter (about 1cm Alterations: Firewood extraction, selective logging, religious worship
Soil Profile Horizon Description
Oi +0.5cm
Litter composed of leaves, twigs and bark
Oe 0 ‐ 0.5cm
Thin layer of moderately decomposed organic material with no clear boundary to the mineral horizon.
Ah 0.5 � 5cm
Brown (7.5YR 4/3, moist; 7.5YR 5/3, dry), moderate granular to subangular blocky structure, frequent roots, gradual boundary.
AB 5 � 25cm
Brown (7.5YR 4/4, moist; brown 7.5YR 5/4, dry), occasional weathered coarse gravel, weak subangular structure, frequent roots, diffuse boundary. Locally buried dense root mat. C
olluvial material
B 25 � 80cm
Yellowish red (5YR 4/6, moist; brown 7.5YR 5/5, dry), occasionally strongly weathered gravel, clear boundary, charcoal common
ABb ? 80 � 125
Yellowish red (5YR 4/6, moist; brown 7.5YR 5/4, dry), abundant charcoal, clear boundary.
BC 125 � 190cm
Yellowish red (5YR 4/6, moist; brown 7.5YR 7/6, dry), abundant strongly weathered gravel and stones, increasing with depth, no charcoal.
in situ soil ?
Cw 190+ cm
Yellow (10YR 8/8, moist; white 7.5YR 9/4), strongly weathered saprolite
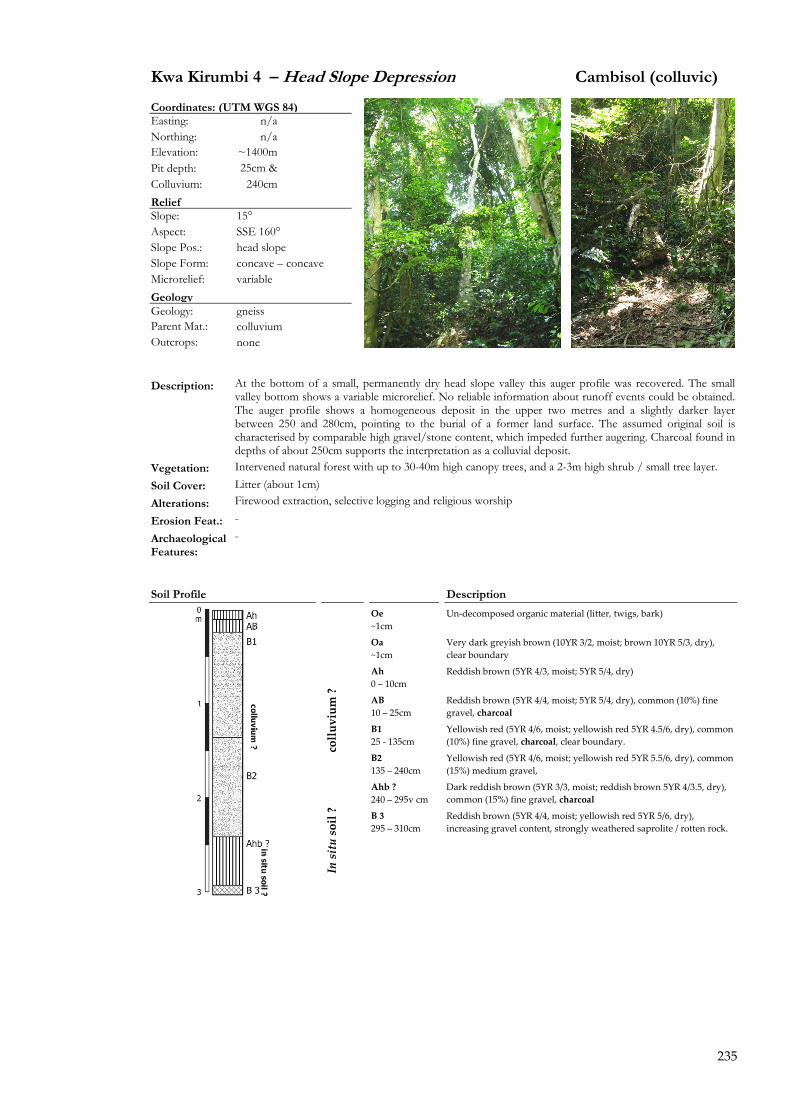
235
Kwa Kirumbi 4 � Head Slope Depression Cambisol (colluvic)
Coordinates: (UTM WGS 84) Easting: n/a Northing: n/a Elevation: ~1400m Pit depth: 25cm & Colluvium: 240cm Relief Slope: 15° Aspect: SSE 160° Slope Pos.: head slope Slope Form: concave � concave Microrelief: variable Geology Geology: gneiss Parent Mat.: colluvium Outcrops: none
Description: At the bottom of a small, permanently dry head slope valley this auger profile was recovered. The small valley bottom shows a variable microrelief. No reliable information about runoff events could be obtained. The auger profile shows a homogeneous deposit in the upper two metres and a slightly darker layer between 250 and 280cm, pointing to the burial of a former land surface. The assumed original soil is characterised by comparable high gravel/stone content, which impeded further augering. Charcoal found in depths of about 250cm supports the interpretation as a colluvial deposit.
Vegetation: Intervened natural forest with up to 30-40m high canopy trees, and a 2-3m high shrub / small tree layer. Soil Cover: Litter (about 1cm) Alterations: Firewood extraction, selective logging and religious worship Erosion Feat.: -
Archaeological Features:
-
Soil Profile Description
Oe ~1cm
Un‐decomposed organic material (litter, twigs, bark)
Oa ~1cm
Very dark greyish brown (10YR 3/2, moist; brown 10YR 5/3, dry), clear boundary
Ah 0 � 10cm
Reddish brown (5YR 4/3, moist; 5YR 5/4, dry)
AB 10 � 25cm
Reddish brown (5YR 4/4, moist; 5YR 5/4, dry), common (10%) fine gravel, charcoal
B1 25 ‐ 135cm
Yellowish red (5YR 4/6, moist; yellowish red 5YR 4.5/6, dry), common (10%) fine gravel, charcoal, clear boundary. co
lluvium ?
B2 135 � 240cm
Yellowish red (5YR 4/6, moist; yellowish red 5YR 5.5/6, dry), common (15%) medium gravel,
Ahb ? 240 � 295v cm
Dark reddish brown (5YR 3/3, moist; reddish brown 5YR 4/3.5, dry), common (15%) fine gravel, charcoal
B 3 295 � 310cm
Reddish brown (5YR 4/4, moist; yellowish red 5YR 5/6, dry), increasing gravel content, strongly weathered saprolite / rotten rock.
In situ soil ?

236
B.7 Kwa Kirumbi: Eroded soils under agricultural land use
Kwa Kirumbi 5 � Terraced banana grove Truncated Acrisol ?
Coordinates: (UTM WGS 84) Geology
Easting: 353570 E 37°40�53.5�� Bedrock Geology: Gneiss, strongly weathered Northing: 9597525 S 3°38�25.1�� Parent Material: in situ & transported Mat. Elevation: 1411m a.s.l. Rock Outcrops: none
Relief Profile Data Slope: 30° (terraces 20°) Pit depth: 80cm & Auger Aspect: W 280° Colluvium: none Slope Pos.: upper slope Water table: - Slope Form: convex � convex Drainage: Good Microrelief: smooth Description: Terraced and irrigated banana groove about 50m below a house platform.
Terraces spaced about 15-20m reducing the slope angel from about 30° to 20°. The complete soil profile shows an intact soil development although soil depth appears slightly reduced compared to the nearby forest soils. Well developed clay coatings indicate argilluviation.
Vegetation: Banana groove, dominated by banana with a few trees and bushes planted on the terrace steps, dispersed coffee and cocoyam. Beans together with weeds and grasses cover the ground.
Soil Cover: 60% bare soil, 40% litter Alterations: Terracing, animal husbandry (chicken, cattle), manure application, fires, house
construction works Erosion Feat.: Exposed bare soil. Incipient sheet and rill erosion
Soil Profile Horizon Description
Oi +0.5cm
Discontinuous (10%) litter layer consistent of banana and tree leaves, very few (1%) fine gravel, occasional stones, abrupt brocken boundary.
Ap
0 � 10 (25)cm
Dark brown (7.5YR 3/3, moist; brown 7.5YR 5/4, dry) clay, very few (1%) medium weathered gravel, moderate granular to subangular blocky structure, low bulk density (1.17g ccm‐1, 8cm), few roots, abundant charcoal, clear irregular boundary.
Bt
10 � 60cm
Reddish brown (5YR 4/4, moist; yellowish red 5YR 5/6, dry) clay, common weathered and strongly weathered coarse gravel, occasional weathered in situ boulders, weak subangular blocky to blocky structure, high bulk density (1.45g ccm‐1, 20cm), frequent clay coatings, very few roots, frequent charcoal, gradual boundary.
B/C
60 �150cm
Yellowish red (5YR 4/6, moist; reddish yellow 5YR 6/8, dry) clay, common strongly weathered coarse gravel, weak subangular blocky to blocky structure, very high bulk density (1.61g ccm‐1, 80cm), frequent clay coatings, gradual boundary.
BC
150 � 190
Yellowish red (5YR 4/6, moist; reddish yellow 5YR 6/8, dry) clay, many strongly weathered gravel.
C 190 � 215+cm
Yellowish red (5YR 5/6, moist; reddish yellow 7.5YR 7/8) clay, many strongly weathered gravel. Continuous saprolite, no further penetration possible, spinning.
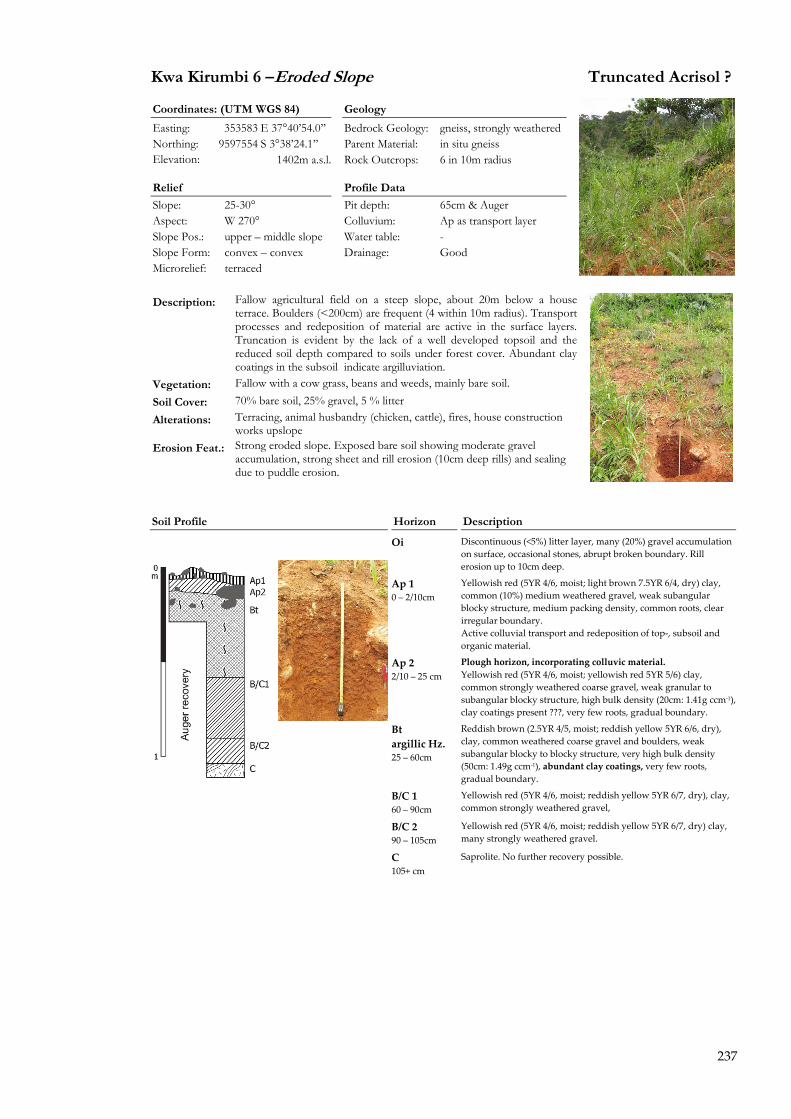
237
Kwa Kirumbi 6 �Eroded Slope Truncated Acrisol ?
Coordinates: (UTM WGS 84) Geology
Easting: 353583 E 37°40�54.0�� Bedrock Geology: gneiss, strongly weathered Northing: 9597554 S 3°38�24.1�� Parent Material: in situ gneiss Elevation: 1402m a.s.l. Rock Outcrops: 6 in 10m radius
Relief Profile Data Slope: 25-30° Pit depth: 65cm & Auger Aspect: W 270° Colluvium: Ap as transport layer Slope Pos.: upper � middle slope Water table: - Slope Form: convex � convex Drainage: Good Microrelief: terraced Description: Fallow agricultural field on a steep slope, about 20m below a house
terrace. Boulders (<200cm) are frequent (4 within 10m radius). Transport processes and redeposition of material are active in the surface layers. Truncation is evident by the lack of a well developed topsoil and the reduced soil depth compared to soils under forest cover. Abundant clay coatings in the subsoil indicate argilluviation.
Vegetation: Fallow with a cow grass, beans and weeds, mainly bare soil. Soil Cover: 70% bare soil, 25% gravel, 5 % litter Alterations: Terracing, animal husbandry (chicken, cattle), fires, house construction
works upslope Erosion Feat.: Strong eroded slope. Exposed bare soil showing moderate gravel
accumulation, strong sheet and rill erosion (10cm deep rills) and sealing due to puddle erosion.
Soil Profile Horizon Description
Oi
Discontinuous (<5%) litter layer, many (20%) gravel accumulation on surface, occasional stones, abrupt broken boundary. Rill erosion up to 10cm deep.
Ap 1 0 � 2/10cm
Yellowish red (5YR 4/6, moist; light brown 7.5YR 6/4, dry) clay, common (10%) medium weathered gravel, weak subangular blocky structure, medium packing density, common roots, clear irregular boundary. Active colluvial transport and redeposition of top‐, subsoil and organic material.
Ap 2 2/10 � 25 cm
Plough horizon, incorporating colluvic material. Yellowish red (5YR 4/6, moist; yellowish red 5YR 5/6) clay, common strongly weathered coarse gravel, weak granular to subangular blocky structure, high bulk density (20cm: 1.41g ccm‐1), clay coatings present ???, very few roots, gradual boundary.
Bt argillic Hz. 25 � 60cm
Reddish brown (2.5YR 4/5, moist; reddish yellow 5YR 6/6, dry), clay, common weathered coarse gravel and boulders, weak subangular blocky to blocky structure, very high bulk density (50cm: 1.49g ccm‐1), abundant clay coatings, very few roots, gradual boundary.
B/C 1 60 � 90cm
Yellowish red (5YR 4/6, moist; reddish yellow 5YR 6/7, dry), clay, common strongly weathered gravel,
B/C 2 90 � 105cm
Yellowish red (5YR 4/6, moist; reddish yellow 5YR 6/7, dry) clay, many strongly weathered gravel.
C 105+ cm
Saprolite. No further recovery possible.
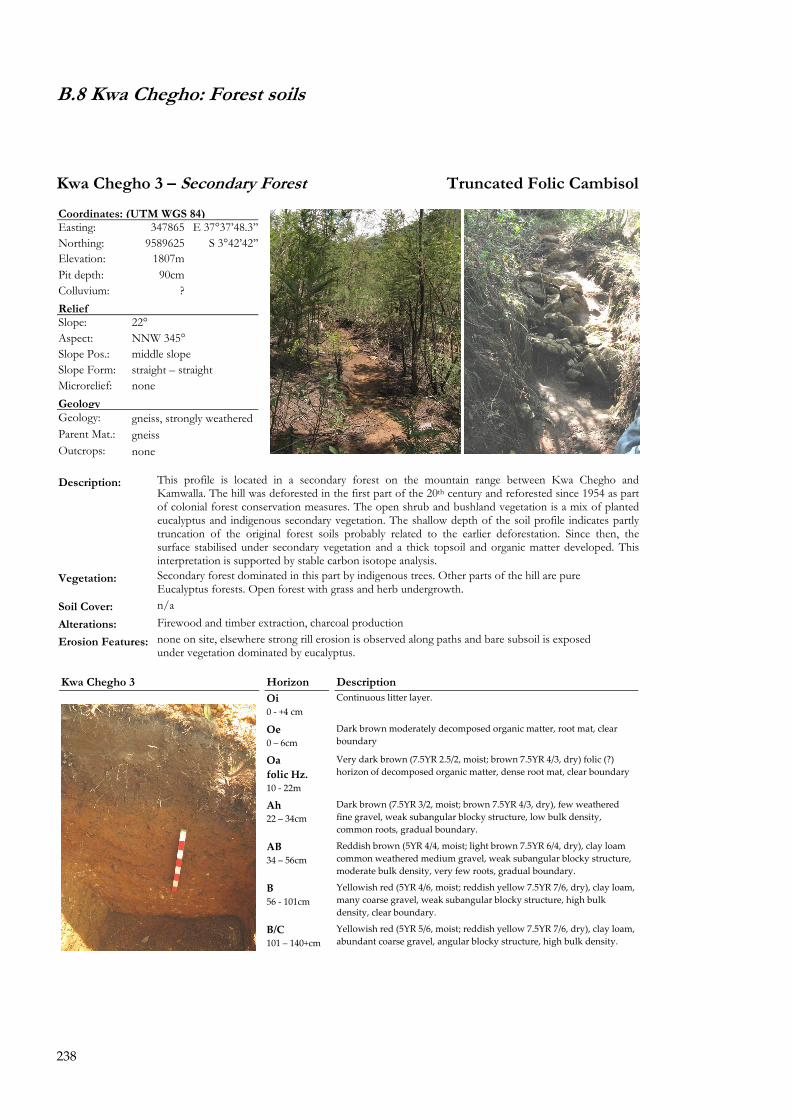
238
B.8 Kwa Chegho: Forest soils
Kwa Chegho 3 � Secondary Forest Truncated Folic Cambisol
Coordinates: (UTM WGS 84) Easting: 347865 E 37°37�48.3�� Northing: 9589625 S 3°42�42�� Elevation: 1807m Pit depth: 90cm Colluvium: ? Relief Slope: 22° Aspect: NNW 345° Slope Pos.: middle slope Slope Form: straight � straight Microrelief: none Geology Geology: gneiss, strongly weathered Parent Mat.: gneiss Outcrops: none
Description: This profile is located in a secondary forest on the mountain range between Kwa Chegho and Kamwalla. The hill was deforested in the first part of the 20th century and reforested since 1954 as part of colonial forest conservation measures. The open shrub and bushland vegetation is a mix of planted eucalyptus and indigenous secondary vegetation. The shallow depth of the soil profile indicates partly truncation of the original forest soils probably related to the earlier deforestation. Since then, the surface stabilised under secondary vegetation and a thick topsoil and organic matter developed. This interpretation is supported by stable carbon isotope analysis.
Vegetation: Secondary forest dominated in this part by indigenous trees. Other parts of the hill are pure Eucalyptus forests. Open forest with grass and herb undergrowth.
Soil Cover: n/a Alterations: Firewood and timber extraction, charcoal production Erosion Features: none on site, elsewhere strong rill erosion is observed along paths and bare subsoil is exposed
under vegetation dominated by eucalyptus.
Kwa Chegho 3 Horizon Description Oi 0 ‐ +4 cm
Continuous litter layer.
Oe 0 � 6cm
Dark brown moderately decomposed organic matter, root mat, clear boundary
Oa folic Hz. 10 ‐ 22m
Very dark brown (7.5YR 2.5/2, moist; brown 7.5YR 4/3, dry) folic (?) horizon of decomposed organic matter, dense root mat, clear boundary
Ah 22 � 34cm
Dark brown (7.5YR 3/2, moist; brown 7.5YR 4/3, dry), few weathered fine gravel, weak subangular blocky structure, low bulk density, common roots, gradual boundary.
AB 34 � 56cm
Reddish brown (5YR 4/4, moist; light brown 7.5YR 6/4, dry), clay loam common weathered medium gravel, weak subangular blocky structure, moderate bulk density, very few roots, gradual boundary.
B 56 ‐ 101cm
Yellowish red (5YR 4/6, moist; reddish yellow 7.5YR 7/6, dry), clay loam, many coarse gravel, weak subangular blocky structure, high bulk density, clear boundary.
B/C 101 � 140+cm
Yellowish red (5YR 5/6, moist; reddish yellow 7.5YR 7/6, dry), clay loam, abundant coarse gravel, angular blocky structure, high bulk density.
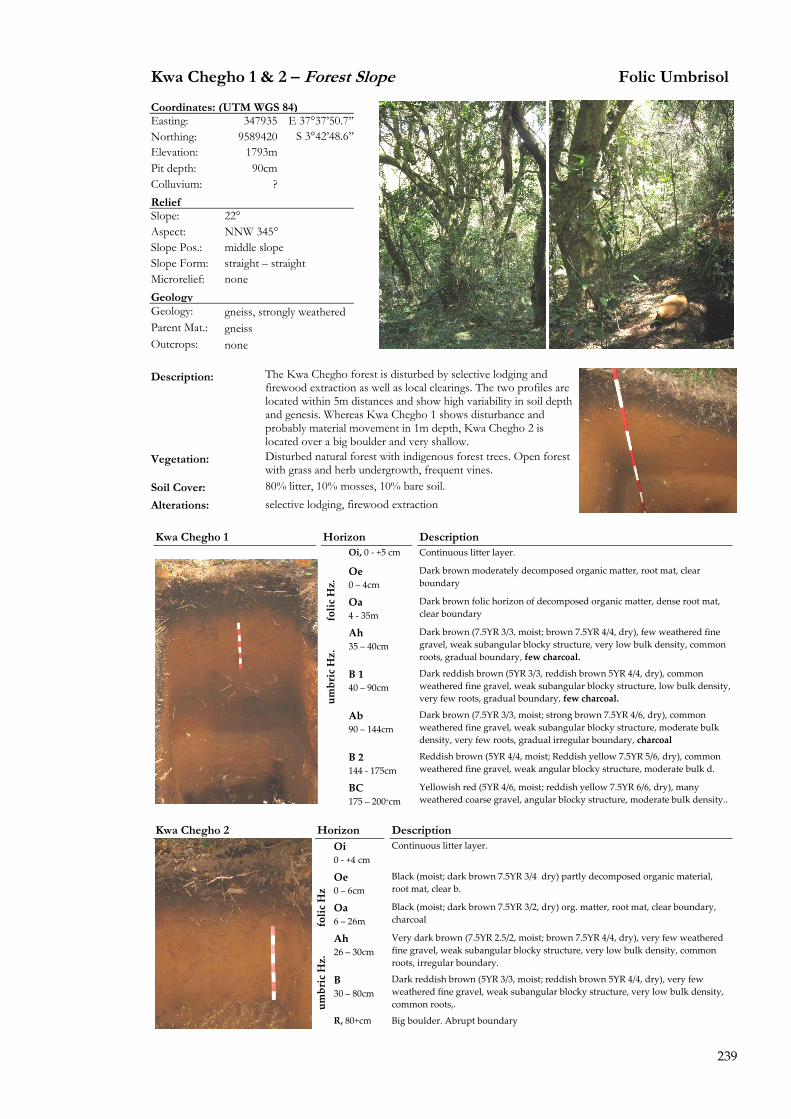
239
Kwa Chegho 1 & 2 � Forest Slope Folic Umbrisol
Coordinates: (UTM WGS 84) Easting: 347935 E 37°37�50.7��Northing: 9589420 S 3°42�48.6��Elevation: 1793m Pit depth: 90cm Colluvium: ? Relief Slope: 22° Aspect: NNW 345° Slope Pos.: middle slope Slope Form: straight � straight Microrelief: none Geology Geology: gneiss, strongly weathered Parent Mat.: gneiss Outcrops: none Description: The Kwa Chegho forest is disturbed by selective lodging and
firewood extraction as well as local clearings. The two profiles are located within 5m distances and show high variability in soil depth and genesis. Whereas Kwa Chegho 1 shows disturbance and probably material movement in 1m depth, Kwa Chegho 2 is located over a big boulder and very shallow.
Vegetation: Disturbed natural forest with indigenous forest trees. Open forest with grass and herb undergrowth, frequent vines.
Soil Cover: 80% litter, 10% mosses, 10% bare soil. Alterations: selective lodging, firewood extraction Kwa Chegho 1 Horizon Description
Oi, 0 ‐ +5 cm Continuous litter layer.
Oe 0 � 4cm
Dark brown moderately decomposed organic matter, root mat, clear boundary
folic Hz.
Oa 4 ‐ 35m
Dark brown folic horizon of decomposed organic matter, dense root mat, clear boundary
Ah 35 � 40cm
Dark brown (7.5YR 3/3, moist; brown 7.5YR 4/4, dry), few weathered fine gravel, weak subangular blocky structure, very low bulk density, common roots, gradual boundary, few charcoal.
umbric Hz.
B 1 40 � 90cm
Dark reddish brown (5YR 3/3, reddish brown 5YR 4/4, dry), common weathered fine gravel, weak subangular blocky structure, low bulk density, very few roots, gradual boundary, few charcoal.
Ab 90 � 144cm
Dark brown (7.5YR 3/3, moist; strong brown 7.5YR 4/6, dry), common weathered fine gravel, weak subangular blocky structure, moderate bulk density, very few roots, gradual irregular boundary, charcoal
B 2 144 ‐ 175cm
Reddish brown (5YR 4/4, moist; Reddish yellow 7.5YR 5/6, dry), common weathered fine gravel, weak angular blocky structure, moderate bulk d.
BC 175 � 200+cm
Yellowish red (5YR 4/6, moist; reddish yellow 7.5YR 6/6, dry), many weathered coarse gravel, angular blocky structure, moderate bulk density..
Kwa Chegho 2 Horizon Description
Oi 0 ‐ +4 cm
Continuous litter layer.
Oe 0 � 6cm
Black (moist; dark brown 7.5YR 3/4 dry) partly decomposed organic material, root mat, clear b.
folic Hz
Oa 6 � 26m
Black (moist; dark brown 7.5YR 3/2, dry) org. matter, root mat, clear boundary, charcoal
Ah 26 � 30cm
Very dark brown (7.5YR 2.5/2, moist; brown 7.5YR 4/4, dry), very few weathered fine gravel, weak subangular blocky structure, very low bulk density, common roots, irregular boundary.
umbric Hz.
B 30 � 80cm
Dark reddish brown (5YR 3/3, moist; reddish brown 5YR 4/4, dry), very few weathered fine gravel, weak subangular blocky structure, very low bulk density, common roots,.
R, 80+cm Big boulder. Abrupt boundary
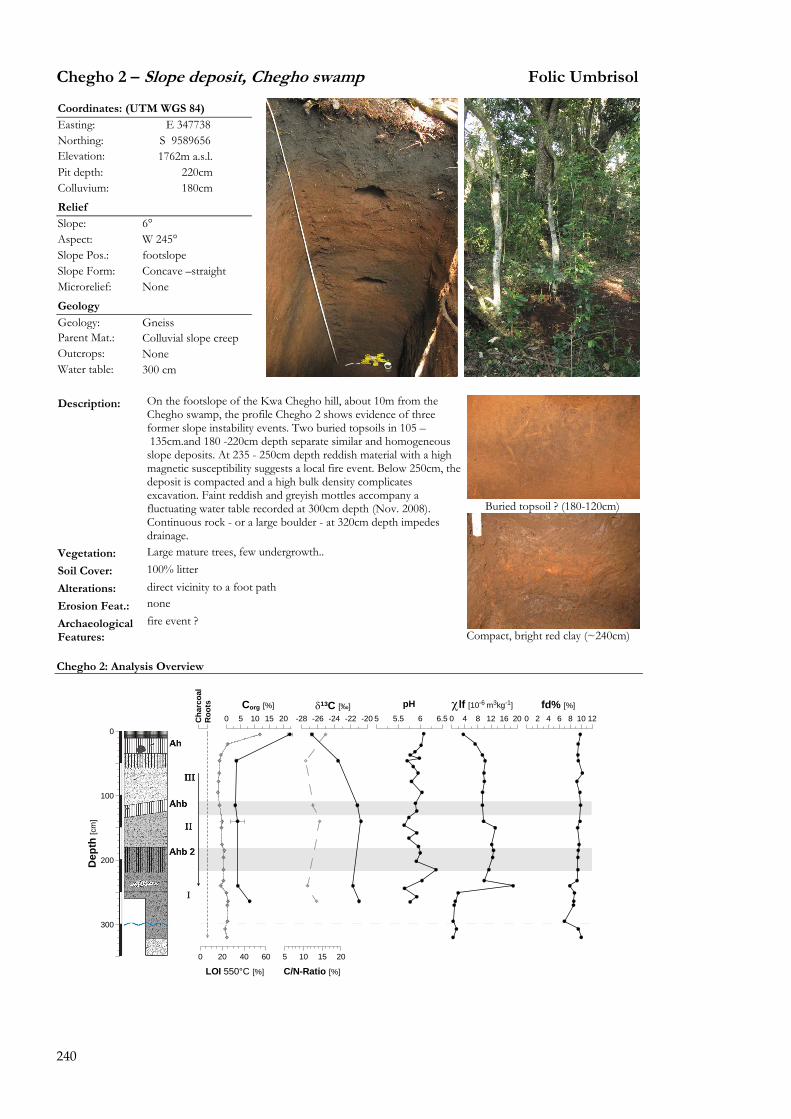
240
Chegho 2 � Slope deposit, Chegho swamp Folic Umbrisol
Chegho 2: Analysis Overview
0 2 4 6 8 10 12fd% [%]
0 4 8 12 16 20
χlf [10-6 m3kg-1]
5 5.5 6 6.5
pH
5 10 15 20
C/N-Ratio [%]
-28 -26 -24 -22 -20δ13C [‰]
0 20 40 60
LOI 550°C [%]
0 5 10 15 20Corg [%]
300
200
100
0
Dep
th [c
m]
Cha
rcoa
lR
oots
Coordinates: (UTM WGS 84) Easting: E 347738 Northing: S 9589656 Elevation: 1762m a.s.l. Pit depth: 220cm Colluvium: 180cm
Relief Slope: 6° Aspect: W 245° Slope Pos.: footslope Slope Form: Concave �straight Microrelief: None Geology Geology: Gneiss Parent Mat.: Colluvial slope creep Outcrops: None Water table: 300 cm Description: On the footslope of the Kwa Chegho hill, about 10m from the
Chegho swamp, the profile Chegho 2 shows evidence of three former slope instability events. Two buried topsoils in 105 � 135cm.and 180 -220cm depth separate similar and homogeneous slope deposits. At 235 - 250cm depth reddish material with a high magnetic susceptibility suggests a local fire event. Below 250cm, the deposit is compacted and a high bulk density complicates excavation. Faint reddish and greyish mottles accompany a fluctuating water table recorded at 300cm depth (Nov. 2008). Continuous rock - or a large boulder - at 320cm depth impedes drainage.
Vegetation: Large mature trees, few undergrowth.. Soil Cover: 100% litter Alterations: direct vicinity to a foot path Erosion Feat.: none
Archaeological Features:
fire event ?
Buried topsoil ? (180-120cm)
Compact, bright red clay (~240cm)

241
Chegho 2
Soil Profile Zones Horizon Description
Oi +1 � 0cm
Litter. Leaves and visible plant remains, slightly decomposed, clear wavy boundary.
Oe 0 � 4cm
Moderately decomposed organic matter with a very dense root matt folic Hz.
Oa 4 � 12cm
Black (7.5YR 2.5/1 moist) moder horizon with abundant roots, gradual wavy boundary.
Ah 12 � 38cm
Black (7.5YR 2.5/1 moist and dry) clay loam, few (<5%) angular weathered medium gravel, one boulder (<60cm) weak subangular blocky structure, many roots, gradual smooth boundary.
AB 38 ‐ 60cm
Very dark brown (7.5YR 2.5/2 moist, dark brown 7.5YR 3/3 dry) clay loam, few (<5%) weathered angular fine gravel (<0.6cm), weak subangular blocky structure, many fine and coarse roots, clear irregular boundary; tongues of Ah material within the Bw horizon.
Slpe deposit III
Umbric Hz.
60 � 105cm Dark reddish brown (5YR 3/3 moist & dry) clay loam, very few (<2%) weathered angular fine gravel (<0.6cm), weak to moderate subangular blocky structure, few fine and coarse roots, charcoal common, clear wavy boundary
Buried topsoil
Ahb 105 � 135cm
Black (5YR 2.5/1 moist, very dark grey 7.5YR 3/1 dry) clay loam, very few (<2%) weathered angular fine gravel (<0.6cm), weak subangular blocky structure, many fine and few coarse roots, charcoal common, clear wavy boundary; distinct mixing of Bw material along root and animal channels, in the lower part spots of bright reddish material
Slope deposit II
135 � 180cm Very dark brown (7.5YR 2.5/2 moist, reddish brown 7.5YR 4/4 dry) clay loam, very few (<2%) weathered angular fine gravel (<0.6cm), weak subangular blocky structure, few fine and very few coarse roots, few charcoal, gradual wavy boundary.
Buried topsoil
Ahb 2 180 � 220cm
Black (7.5YR 2.5/1 moist, dark brown 7.5YR 3/2 dry) clay loam, very few (<2%) weathered angular fine gravel (<0.6cm), weak‐moderate subangular blocky structure, very few fine and coarse roots, charcoal common, gradual wavy boundary, distinct mixing of B material along animal and root channels.
220 � 248cm Black (10YR 2/1 moist, brown 7.5YR 4/3 dry) clay loam, very few (<2%) weathered angular fine gravel (<0.6cm), weak‐moderate subangular blocky structure, very few fine and coarse roots, charcoal common, diffuse broken boundary.
fire ? 235 � 250cm About 2dm² spot on east wall of dark reddish brown (5YR 3/4 moist, yellowish red (5YR 5/6 dry) hard clay loam Sl
ope deposit I
248 � 320cm Black (7.5YR 2.5/1 moist, very dark grey (7.5YR 3/1 dry) clay loam, high bulk density, moderate organic matter ?, with many (20%) faint reddish and greyish mottles with diffuse boundaries, few (<2%) weathered angular fine gravel (<0.6cm), moderate subangular blocky structure, few charcoal.
300cm Watertable
Boulder ? R 325cm
Weathered gneiss bedrock or boulder, above bedrock free groundwater.
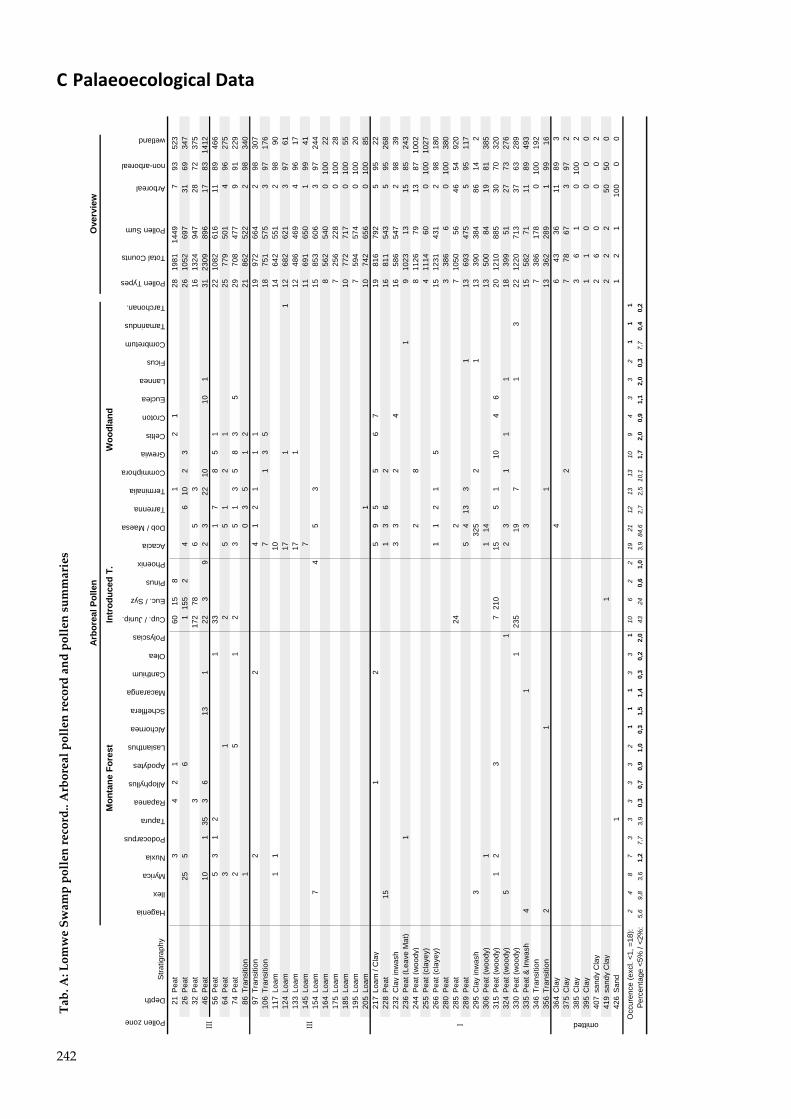
242
C Palaeoecological Data
Tab. A: Lomwe Swamp pollen record.. Arboreal pollen record and pollen summaries
Pollen zone
Depth
Stra
tigra
phy
Hagenia
Ilex
Myrica
Nuxia
Podocarpus
Tapura
Rapanea
Allophyllus
Apodytes
Lasianthus
Alchornea
Schefflera
Macaranga
Canthium
Olea
Polyscias
Cup. / Junip.
Euc. / Syz
Pinus
Phoenix
Acacia
Dob / Maesa
Tarrenna
Terminalia
Commiphora
Grewia
Celtis
Croton
Euclea
Lannea
Ficus
Combretum
Tamarindus
Tarchonan.
Pollen Types
Total Counts
Pollen Sum
Arboreal
non-arboreal
wetland
21P
eat
34
21
6015
81
21
2819
8114
497
9352
326
Pea
t25
56
115
52
46
102
326
1052
697
3169
347
32P
eat
317
278
65
316
1324
947
2872
375
46P
eat
101
353
613
122
39
23
2210
101
3123
0989
617
8314
1256
Pea
t5
31
21
331
78
51
2210
8261
611
8946
664
Pea
t3
12
55
12
125
779
501
496
275
74P
eat
25
12
35
13
58
35
2970
847
79
9122
986
Tran
sitio
n1
03
51
221
862
522
298
340
97Tr
ansi
tion
22
41
21
11
1997
266
42
9830
710
6Tr
ansi
tion
71
35
1875
157
53
9717
611
7Lo
am1
110
1464
255
12
9890
124
Loam
171
112
682
621
397
6113
3Lo
am17
112
486
469
496
1714
5Lo
am7
1169
165
01
9941
154
Loam
74
53
1585
360
63
9724
416
4Lo
am8
562
540
010
022
175
Loam
725
622
80
100
2818
5Lo
am10
772
717
010
055
195
Loam
759
457
40
100
2020
5Lo
am1
1074
265
60
100
8521
7Lo
am /
Cla
y1
25
95
56
719
816
792
595
2222
8P
eat
151
36
216
811
543
595
268
232
Cla
y in
was
h3
32
416
586
547
298
3923
6P
eat (
Leav
e M
at)
11
910
2313
1585
243
244
Pea
t (w
oody
)2
88
1126
7913
8710
0225
5P
eat (
clay
ey)
411
1460
010
010
2726
6P
eat (
clay
ey)
11
21
515
1231
431
298
180
280
Pea
t3
386
60
100
380
285
Pea
t24
27
1050
5646
5492
028
9P
eat
54
133
113
693
475
595
117
295
Cla
y in
was
h3
325
21
1339
038
486
142
306
Pea
t (w
oody
)1
114
1350
084
1981
385
315
Pea
t (w
oody
)1
23
721
015
51
104
620
1210
885
3070
320
324
Pea
t (w
oody
)5
12
31
11
1839
951
2773
276
330
Pea
t (w
oody
)1
235
197
13
2212
2071
337
6328
933
5P
eat &
Inw
ash
41
315
582
7111
8949
334
6Tr
ansi
tion
738
617
80
100
192
356
Tran
sitio
n2
11
1336
228
91
9916
364
Cla
y4
643
3611
893
375
Cla
y2
778
673
972
385
Cla
y3
61
010
02
395
Cla
y1
10
00
040
7sa
ndy
Cla
y2
60
00
241
9sa
ndy
Cla
y1
22
250
500
426
San
d1
12
110
00
0
Occ
uren
ce (e
xcl.
<1, =
18):
24
87
33
33
32
11
13
31
106
22
1921
1213
1310
94
33
21
11
Per
cent
age
<5%
/ <2
%:
5,6
9,8
3,6
1,2
7,7
3,9
0,3
0,7
0,9
1,0
0,3
1,5
1,4
0,3
0,2
2,0
4324
0,6
1,0
3,9
84,6
2,7
2,5
10,1
1,7
2,0
0,9
1,1
2,0
0,3
7,7
0,4
0,2
III I
Arb
orea
l Pol
len
omitted
III
Mon
tane
For
est
Intr
oduc
ed T
.W
oodl
and
Ove
rvie
w
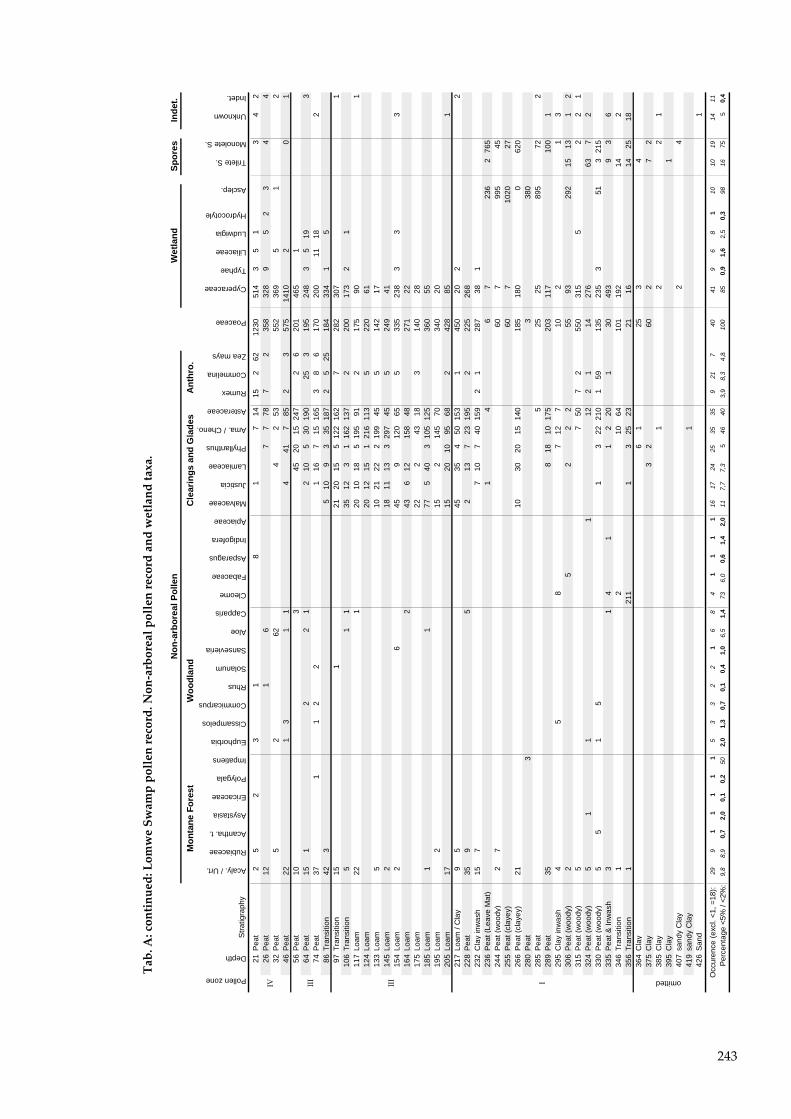
243
Tab. A: continued: Lomwe Swamp pollen record. Non‐arboreal pollen record and wetland taxa.
Pollen zone
Depth
Stra
tigra
phy
Acaly. / Urt.
Rubiaceae
Acantha. t.
Asystasia
Ericaceae
Polygala
Impatiens
Euphorbia
Cissampelos
Commicarpus
Rhus
Solanum
Sansevieria
Aloe
Capparis
Cleome
Fabaceae
Asparagus
Indigofera
Apiaceae
Malvaceae
Justicia
Lamiaceae
Phyllanthus
Ama. / Cheno.
Asteraceae
Rumex
Commelina
Zea mays
Poaceae
Cyperaceae
Typhae
Liliaceae
Ludwigia
Hydrocotyle
Asclep.
Trilete S.
Monolete S.
Unknown
Indet.
21P
eat
25
23
18
17
1415
262
1230
514
35
13
42
26P
eat
121
67
778
72
358
328
95
23
44
32P
eat
52
624
253
552
369
51
246
Pea
t22
13
11
441
785
23
575
1410
20
156
Pea
t10
345
2015
247
26
201
465
164
Pea
t15
12
21
210
530
190
253
195
248
35
193
74P
eat
371
12
21
167
1516
53
86
170
200
1118
286
Tran
sitio
n42
35
109
335
187
25
2518
433
41
597
Tran
sitio
n15
121
2015
512
216
27
282
307
110
6Tr
ansi
tion
51
135
123
116
213
72
200
173
21
117
Loam
221
2010
185
195
912
175
901
124
Loam
2012
151
216
113
522
061
133
Loam
510
2122
219
945
514
217
145
Loam
218
1113
329
745
524
941
154
Loam
26
459
120
655
335
238
33
316
4Lo
am2
436
1215
848
271
2217
5Lo
am22
243
183
140
2818
5Lo
am1
177
540
310
512
536
055
195
Loam
215
214
570
340
2020
5Lo
am17
1520
1095
682
428
851
217
Loam
/ C
lay
95
4535
450
153
145
020
22
228
Pea
t35
95
213
723
195
222
526
823
2C
lay
inw
ash
157
710
740
159
21
287
381
236
Pea
t (Le
ave
Mat
)1
46
723
62
765
244
Pea
t (w
oody
)2
760
799
545
255
Pea
t (cl
ayey
)60
710
2027
266
Pea
t (cl
ayey
)21
1030
2015
140
185
180
062
028
0P
eat
33
380
285
Pea
t5
2525
895
722
289
Pea
t35
818
1017
520
311
710
01
295
Cla
y in
was
h4
58
712
710
21
330
6P
eat (
woo
dy)
25
22
255
9329
215
131
231
5P
eat (
woo
dy)
57
507
255
031
55
22
132
4P
eat (
woo
dy)
51
11
122
114
276
637
233
0P
eat (
woo
dy)
55
15
13
2221
01
5913
523
53
513
215
335
Pea
t & In
was
h3
14
11
220
130
493
93
634
6Tr
ansi
tion
12
1064
101
192
142
356
Tran
sitio
n1
211
13
2523
2116
1425
1836
4C
lay
61
253
437
5C
lay
32
602
72
385
Cla
y1
22
139
5C
lay
140
7sa
ndy
Cla
y2
441
9sa
ndy
Cla
y1
426
San
d1
Occ
uren
ce (e
xcl.
<1, =
18):
299
11
11
15
33
22
16
84
11
11
1617
2425
3535
921
740
419
68
110
1019
1411
Perc
enta
ge <
5% /
<2%
:9,
88,
90,
72,
00,
10,
250
2,0
1,3
0,7
0,1
0,4
1,0
6,5
1,4
736,
00,
61,
42,
011
7,7
7,3
546
403,
98,
34,
810
085
0,9
1,6
2,5
0,3
9816
755
0,4
Woo
dlan
dC
lear
ings
and
Gla
des
Anth
ro.
omitted
Mon
tane
For
est
Spor
esIn
det.
Wet
land
Non
-arb
orea
l Pol
len
III IIV III
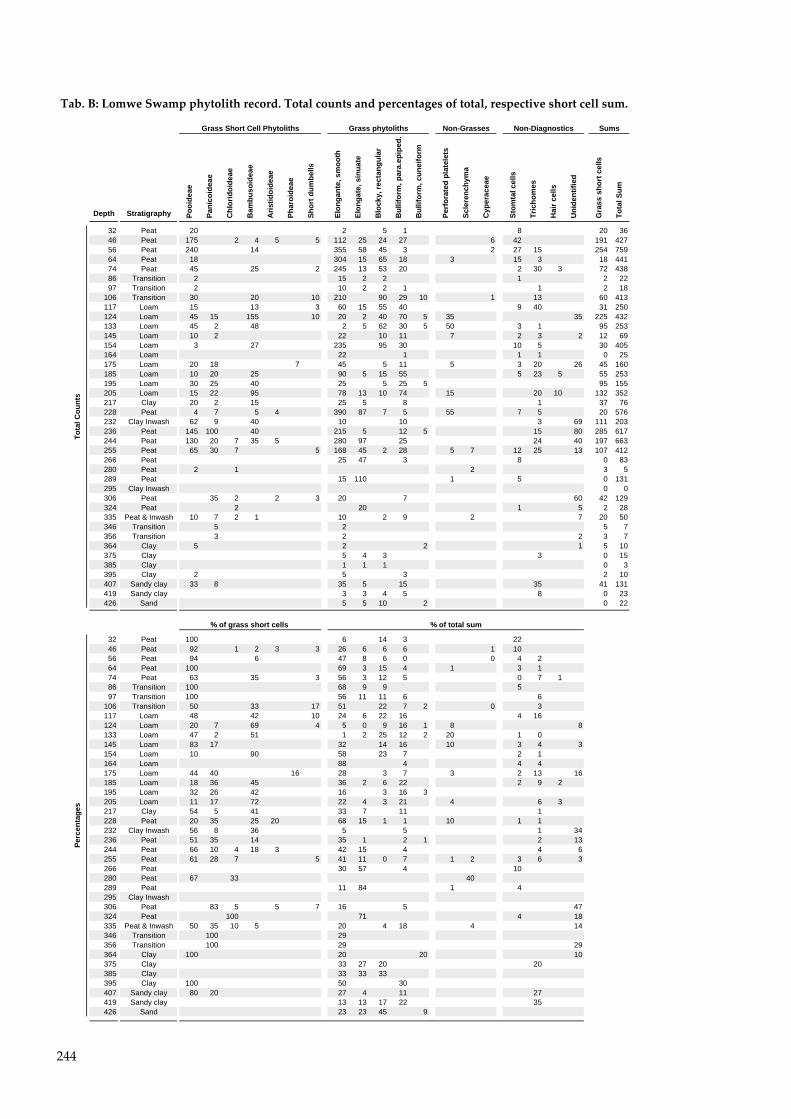
244
Tab. B: Lomwe Swamp phytolith record. Total counts and percentages of total, respective short cell sum.
Depth Stratigraphy Pooi
deae
Pani
coid
eae
Chl
orid
oide
ae
Bam
buso
idea
e
Aris
tidoi
deae
Phar
oide
ae
Shor
t dum
bells
Elon
gant
e, s
moo
th
Elon
gate
, sin
uate
Blo
cky,
rect
angu
lar
Bul
lifor
m, p
ara.
epip
ed.
Bul
lifor
m, c
unei
form
Perf
orat
ed p
late
lets
Scle
renc
hym
a
Cyp
erac
eae
Stom
tal c
ells
Tric
hom
es
Hai
r cel
ls
Uni
dent
ified
Gra
ss s
hort
cel
ls
Tota
l Sum
32 Peat 20 2 5 1 8 20 3646 Peat 175 2 4 5 5 112 25 24 27 6 42 191 42756 Peat 240 14 355 58 45 3 2 27 15 254 75964 Peat 18 304 15 65 18 3 15 3 18 44174 Peat 45 25 2 245 13 53 20 2 30 3 72 43886 Transition 2 15 2 2 1 2 2297 Transition 2 10 2 2 1 1 2 18
106 Transition 30 20 10 210 90 29 10 1 13 60 413117 Loam 15 13 3 60 15 55 40 9 40 31 250124 Loam 45 15 155 10 20 2 40 70 5 35 35 225 432133 Loam 45 2 48 2 5 62 30 5 50 3 1 95 253145 Loam 10 2 22 10 11 7 2 3 2 12 69154 Loam 3 27 235 95 30 10 5 30 405164 Loam 22 1 1 1 0 25175 Loam 20 18 7 45 5 11 5 3 20 26 45 160185 Loam 10 20 25 90 5 15 55 5 23 5 55 253195 Loam 30 25 40 25 5 25 5 95 155205 Loam 15 22 95 78 13 10 74 15 20 10 132 352217 Clay 20 2 15 25 5 8 1 37 76228 Peat 4 7 5 4 390 87 7 5 55 7 5 20 576232 Clay Inwash 62 9 40 10 10 3 69 111 203236 Peat 145 100 40 215 5 12 5 15 80 285 617244 Peat 130 20 7 35 5 280 97 25 24 40 197 663255 Peat 65 30 7 5 168 45 2 28 5 7 12 25 13 107 412266 Peat 25 47 3 8 0 83280 Peat 2 1 2 3 5289 Peat 15 110 1 5 0 131295 Clay Inwash 0 0306 Peat 35 2 2 3 20 7 60 42 129324 Peat 2 20 1 5 2 28335 Peat & Inwash 10 7 2 1 10 2 9 2 7 20 50346 Transition 5 2 5 7356 Transition 3 2 2 3 7364 Clay 5 2 2 1 5 10375 Clay 5 4 3 3 0 15385 Clay 1 1 1 0 3395 Clay 2 5 3 2 10407 Sandy clay 33 8 35 5 15 35 41 131419 Sandy clay 3 3 4 5 8 0 23426 Sand 5 5 10 2 0 22
32 Peat 100 6 14 3 2246 Peat 92 1 2 3 3 26 6 6 6 1 1056 Peat 94 6 47 8 6 0 0 4 264 Peat 100 69 3 15 4 1 3 174 Peat 63 35 3 56 3 12 5 0 7 186 Transition 100 68 9 9 597 Transition 100 56 11 11 6 6
106 Transition 50 33 17 51 22 7 2 0 3117 Loam 48 42 10 24 6 22 16 4 16124 Loam 20 7 69 4 5 0 9 16 1 8 8133 Loam 47 2 51 1 2 25 12 2 20 1 0145 Loam 83 17 32 14 16 10 3 4 3154 Loam 10 90 58 23 7 2 1164 Loam 88 4 4 4175 Loam 44 40 16 28 3 7 3 2 13 16185 Loam 18 36 45 36 2 6 22 2 9 2195 Loam 32 26 42 16 3 16 3205 Loam 11 17 72 22 4 3 21 4 6 3217 Clay 54 5 41 33 7 11 1228 Peat 20 35 25 20 68 15 1 1 10 1 1232 Clay Inwash 56 8 36 5 5 1 34236 Peat 51 35 14 35 1 2 1 2 13244 Peat 66 10 4 18 3 42 15 4 4 6255 Peat 61 28 7 5 41 11 0 7 1 2 3 6 3266 Peat 30 57 4 10280 Peat 67 33 40289 Peat 11 84 1 4295 Clay Inwash306 Peat 83 5 5 7 16 5 47324 Peat 100 71 4 18335 Peat & Inwash 50 35 10 5 20 4 18 4 14346 Transition 100 29356 Transition 100 29 29364 Clay 100 20 20 10375 Clay 33 27 20 20385 Clay 33 33 33395 Clay 100 50 30407 Sandy clay 80 20 27 4 11 27419 Sandy clay 13 13 17 22 35426 Sand 23 23 45 9
Tota
l Cou
nts
% of grass short cells % of total sum
Perc
enta
ges
SumsGrass Short Cell Phytoliths Non-Grasses Non-DiagnosticsGrass phytoliths
245
D Analytical Techniques
D.1 Optically-stimulated lumincescence dating
Dose recovery preheat test
The OSL signal is a compound signal from different electrons traps and it is not possible to discriminated luminescence from different types of traps by means of the shine down curve (AITKEN 1998). Therefore, it is crucial to empty thermally shallow and unstable traps before the optical stimulation by heating the sample to an adequate preheat temperature. This ensures that only energy released from deep and stable traps is considered (WINTLE & MURRAY 2000). To evaluate the suitability of the SAR protocol parameters for the specific samples from the different environmental settings a dose recovery preheat test (Fig. A) was performed to determine adequate preheat temperatures. The test involves the irradiation of a previously totally bleached sample with a known artificial dose, which subsequently is treated as unknown and measured by a SAR protocol (WINTLE & MURRAY 2006). A dose recovery preheat plateau test was performed for a representative sample and suitable preheat temperature was selected after evaluation of the recovery ratio, the recycling ratio and the recuperation of charge measured by the zero dose regeneration point. For each temperature three samples were irradiated by a known artificial dose, which was treated as unknown and measured by a full SAR protocol. The temperature which best recovered the laboratory dose and showed acceptable recycling ratios was used as preheat temperature in the subsequent SAR protocols.
The recovery ratios as well as the recuperation of charge data of the two preheat tests samples increase with higher temperatures. This suggests some contribution from the thermal transfer of charge during preheating and optical stimulation or in the case of charge recuperation carry over from the previous test dose signal (WINTLE & MURRAY 2006). Preheat temperature for the samples from colluvial sediments of Usumbwe and Mrongo were determined from the sample Shfd09059 - Usumbwe 3 (260cm) and a preheat temperature of 240°C was chosen because of a good recovery ratio and better growth curve behaviour than observed for lower temperatures also showing good recuperation values (Fig. A). OSL signals were measured at 125°C for 80 s after 10 s of experimentally determined preheat. To correct for sensitivity changes the luminescence signals were corrected using the response to a test dose of 6.1 Gy after a cut-heat of 160°C (MURRAY & WINTLE 2000). The luminescence signal was determined as the difference between the integrated OSL signal of the first 1.6 s of illumination and the background signal integrated over the final 16 s of the shine down curve. MURRAY & WINTLE (2000) as well as BANERJE et al. (2000) recommend only the first 0.3 � 0.8 s of the initial signal to be used to obtain an enhanced signal-to-noise ratio. For most of the samples a delayed increase in luminescence from the first to the second/third channel (0.6, 0.96 s) was observed. The larger integral for the initial signal was chosen to cover all of this initial delay of the luminescence signal.
Dose rate calculation
The amount of ionising radiation the sample received during burial is measured from subsamples of the immediately surrounding material. Ionising radiation is made up of α-, β-, and γ-, radiation emitted by the decay of radioactive elements (mainly U, Th, K and Rb) within the minerals of the sample itself and the surrounding material and additionally contributions from cosmic radiation. The dose rate was measured by quantification of parent nuclides via ICP-MS (Inductively-coupled plasma mass spectrometry) and calculation of the resulting radiation. The cosmogenic dose rate is calculated from
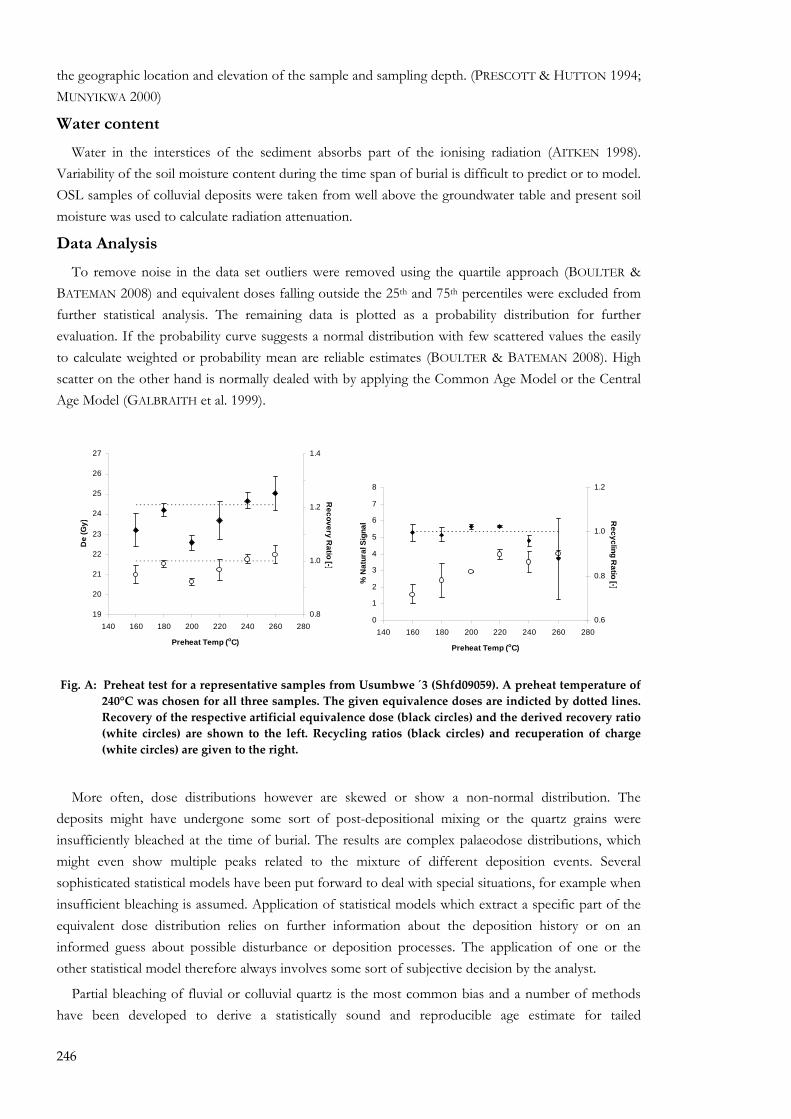
246
the geographic location and elevation of the sample and sampling depth. (PRESCOTT & HUTTON 1994; MUNYIKWA 2000)
Water content
Water in the interstices of the sediment absorbs part of the ionising radiation (AITKEN 1998). Variability of the soil moisture content during the time span of burial is difficult to predict or to model. OSL samples of colluvial deposits were taken from well above the groundwater table and present soil moisture was used to calculate radiation attenuation.
Data Analysis
To remove noise in the data set outliers were removed using the quartile approach (BOULTER & BATEMAN 2008) and equivalent doses falling outside the 25th and 75th percentiles were excluded from further statistical analysis. The remaining data is plotted as a probability distribution for further evaluation. If the probability curve suggests a normal distribution with few scattered values the easily to calculate weighted or probability mean are reliable estimates (BOULTER & BATEMAN 2008). High scatter on the other hand is normally dealed with by applying the Common Age Model or the Central Age Model (GALBRAITH et al. 1999).
19
20
21
22
23
24
25
26
27
140 160 180 200 220 240 260 280
Preheat Temp (oC)
De
(Gy)
0.8
1.0
1.2
1.4R
ecovery Ratio [-]
0
1
2
3
4
5
6
7
8
140 160 180 200 220 240 260 280
Preheat Temp (oC)
% N
atur
al S
igna
l
0.6
0.8
1.0
1.2
Recycling R
atio [-]
Fig. A: Preheat test for a representative samples from Usumbwe ´3 (Shfd09059). A preheat temperature of 240°C was chosen for all three samples. The given equivalence doses are indicted by dotted lines. Recovery of the respective artificial equivalence dose (black circles) and the derived recovery ratio (white circles) are shown to the left. Recycling ratios (black circles) and recuperation of charge (white circles) are given to the right.
More often, dose distributions however are skewed or show a non-normal distribution. The deposits might have undergone some sort of post-depositional mixing or the quartz grains were insufficiently bleached at the time of burial. The results are complex palaeodose distributions, which might even show multiple peaks related to the mixture of different deposition events. Several sophisticated statistical models have been put forward to deal with special situations, for example when insufficient bleaching is assumed. Application of statistical models which extract a specific part of the equivalent dose distribution relies on further information about the deposition history or on an informed guess about possible disturbance or deposition processes. The application of one or the other statistical model therefore always involves some sort of subjective decision by the analyst.
Partial bleaching of fluvial or colluvial quartz is the most common bias and a number of methods have been developed to derive a statistically sound and reproducible age estimate for tailed
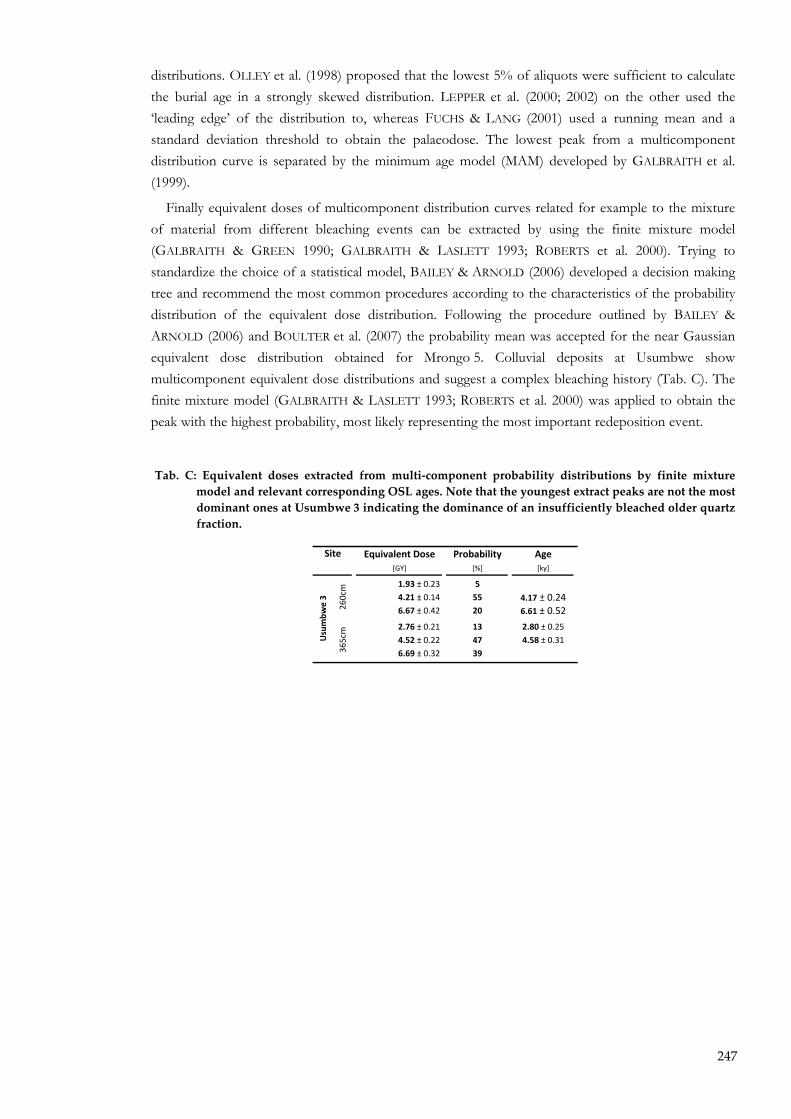
247
distributions. OLLEY et al. (1998) proposed that the lowest 5% of aliquots were sufficient to calculate the burial age in a strongly skewed distribution. LEPPER et al. (2000; 2002) on the other used the �leading edge� of the distribution to, whereas FUCHS & LANG (2001) used a running mean and a standard deviation threshold to obtain the palaeodose. The lowest peak from a multicomponent distribution curve is separated by the minimum age model (MAM) developed by GALBRAITH et al. (1999).
Finally equivalent doses of multicomponent distribution curves related for example to the mixture of material from different bleaching events can be extracted by using the finite mixture model (GALBRAITH & GREEN 1990; GALBRAITH & LASLETT 1993; ROBERTS et al. 2000). Trying to standardize the choice of a statistical model, BAILEY & ARNOLD (2006) developed a decision making tree and recommend the most common procedures according to the characteristics of the probability distribution of the equivalent dose distribution. Following the procedure outlined by BAILEY &
ARNOLD (2006) and BOULTER et al. (2007) the probability mean was accepted for the near Gaussian equivalent dose distribution obtained for Mrongo 5. Colluvial deposits at Usumbwe show multicomponent equivalent dose distributions and suggest a complex bleaching history (Tab. C). The finite mixture model (GALBRAITH & LASLETT 1993; ROBERTS et al. 2000) was applied to obtain the peak with the highest probability, most likely representing the most important redeposition event.
Tab. C: Equivalent doses extracted from multi‐component probability distributions by finite mixture model and relevant corresponding OSL ages. Note that the youngest extract peaks are not the most dominant ones at Usumbwe 3 indicating the dominance of an insufficiently bleached older quartz fraction.
Equivalent Dose Probability Age[GY] [%] [ky]
1.93 ± 0.23 54.21 ± 0.14 55 4.17 ± 0.246.67 ± 0.42 20 6.61 ± 0.52
2.76 ± 0.21 13 2.80 ± 0.254.52 ± 0.22 47 4.58 ± 0.316.69 ± 0.32 39
Site
260cm
365cm
Usumbw
e 3
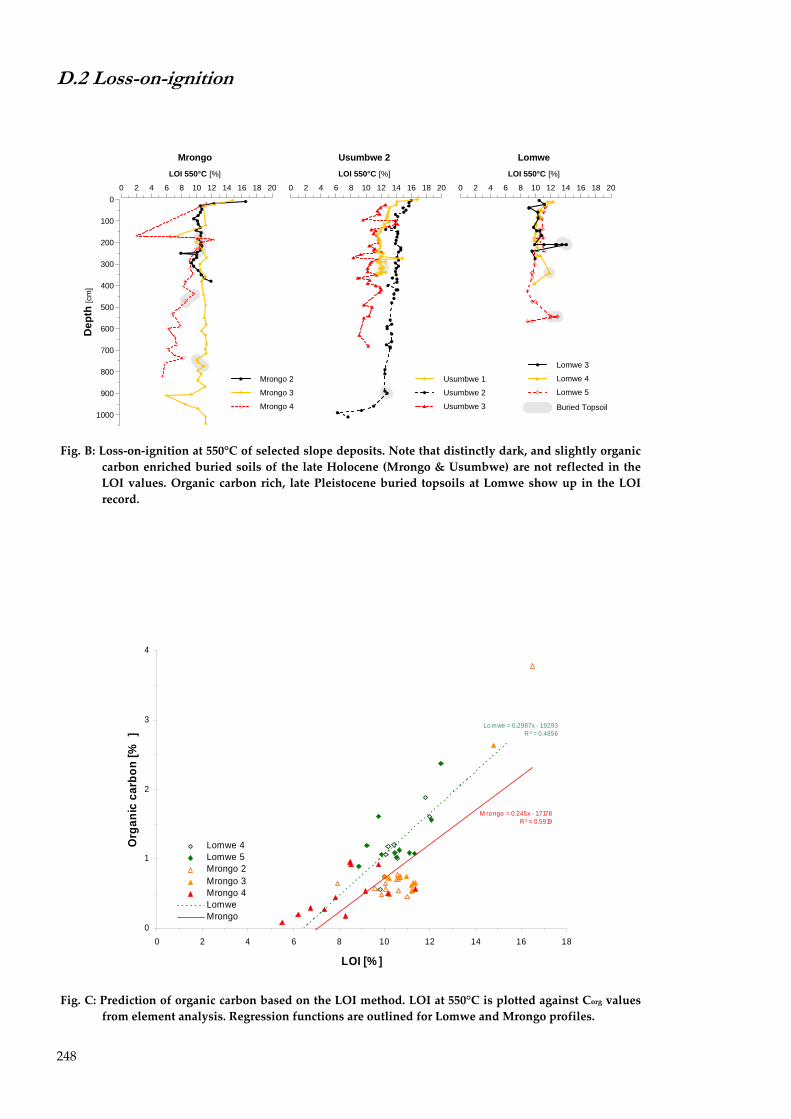
248
D.2 Loss-on-ignition
0 2 4 6 8 10 12 14 16 18 20
LomweLOI 550°C [%]
0 2 4 6 8 10 12 14 16 18 20
Usumbwe 2LOI 550°C [%]
Usumbwe 1
Usumbwe 2
Usumbwe 3
0 2 4 6 8 10 12 14 16 18 20
MrongoLOI 550°C [%]
Mrongo 2
Mrongo 3
Mrongo 41000
900
800
700
600
500
400
300
200
100
0
Dep
th [c
m]
Lomwe 3
Lomwe 4
Lomwe 5
Buried Topsoil
Fig. B: Loss‐on‐ignition at 550°C of selected slope deposits. Note that distinctly dark, and slightly organic carbon enriched buried soils of the late Holocene (Mrongo & Usumbwe) are not reflected in the LOI values. Organic carbon rich, late Pleistocene buried topsoils at Lomwe show up in the LOI record.
Lo mwe = 0.2987x - 1.9293R 2 = 0.4856
M ro ngo = 0.245x - 1.7178R 2 = 0.5919
0
1
2
3
4
0 2 4 6 8 10 12 14 16 18
LOI [% ]
Org
anic
car
bon
[%]
Lomwe 4Lomwe 5Mrongo 2Mrongo 3Mrongo 4 LomweMrongo
Fig. C: Prediction of organic carbon based on the LOI method. LOI at 550°C is plotted against Corg values from element analysis. Regression functions are outlined for Lomwe and Mrongo profiles.
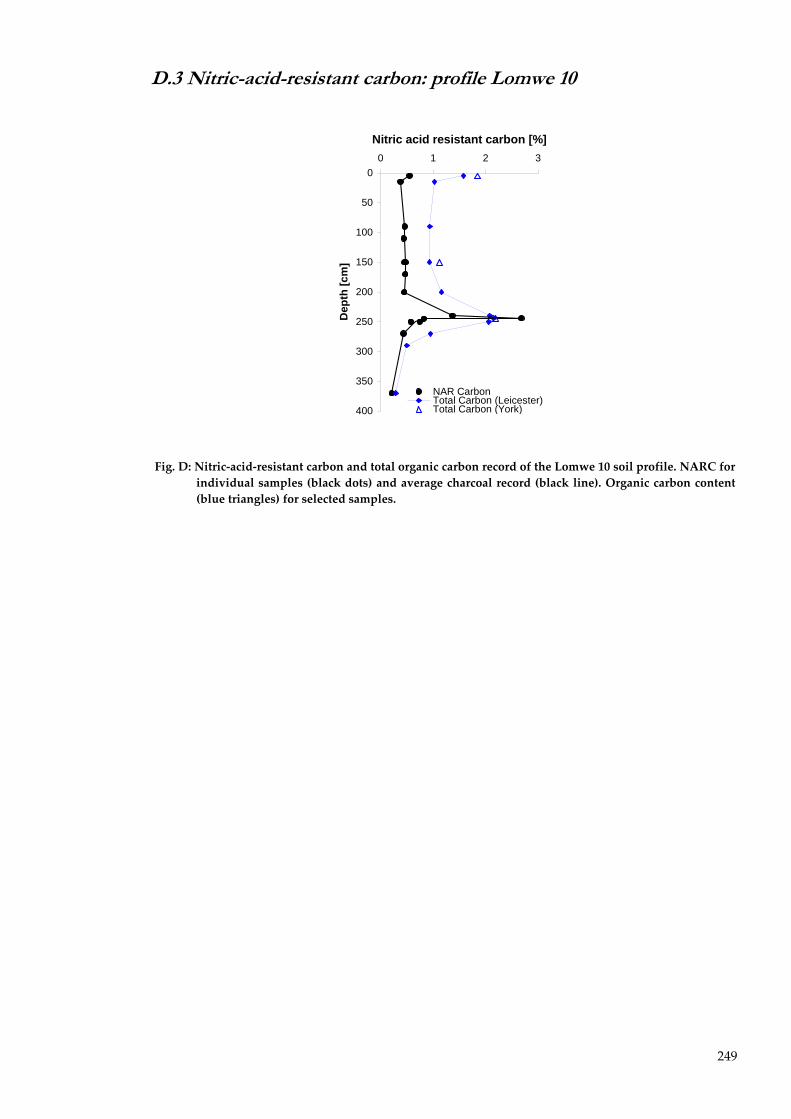
249
D.3 Nitric-acid-resistant carbon: profile Lomwe 10
0
50
100
150
200
250
300
350
400
Dep
th [c
m]
0 1 2 3
Nitric acid resistant carbon [%]
NAR CarbonTotal Carbon (Leicester)Total Carbon (York)AV
Fig. D: Nitric‐acid‐resistant carbon and total organic carbon record of the Lomwe 10 soil profile. NARC for individual samples (black dots) and average charcoal record (black line). Organic carbon content (blue triangles) for selected samples.

251
REFERENCES
ACRES BD, BLAIR RAINS A, KING RB, LAWTON RM, MITCHELL AJB and RACKHAM LJ (1985): African Dambos: their distribution, characteristics and use. In Dambos: small channelless valleys in the tropics (eds. FT MICHAEL and AS GOUDIE). Zeitschrift für Geomorphologie N° Suppl. 52, pp. 63-86. Gebrüder Borntraeger, Berlin.
AG BODEN (1994): Bodenkundliche Kartieranleitung. 4th ed, Hannover. AGNEW ADQ (1974): Upland Kenya Wild Flowers. A flora of the ferns and herbaceous flowering plants of Upland Kenya.
Oxford University Press, London. AHNERT F (1999): Einführung in die Geomorphologie. UTB. Ulmer, Stuttgart. AITKEN MJ (1998): An introduction to optical dating. Oxford Univ. Press, Oxford. ALIN SR and COHEN AS (2003): Lake-level history of Lake Tanganyika, East Africa, for the past 2500 years
based on ostracode-inferred water-depth reconstruction. Palaeogeography, Palaeoclimatology, Palaeoecology 199(1-2), 31-49.
ALPERS EA (1975): Ivory & Slaves in East Central Africa. Univ. of Calif. Pr., Berkeley. AMBROSE SH (1984): The Introduction of Pastoral Adaptions to the Highlands of East Africa. In From hunters to
farmers: the causes and consequences of food production in Africa (ed. JD CLARK), pp. 212-239. University of California Press, Berkeley.
AMBROSE SH (1986): Stable carbon and nitrogen isotope analysis of human and animal diet in Africa. Journal of Human Evolution 15(8), 707-731.
AMBROSE SH and SIKES NE (1991): Soil Carbon Isotope Evidence for Holocene Habitat Change in the Kenya Rift Valley. Science 253(5026), 1402-1405.
ANDERSON DM (1989): Agriculture and Irrigation Technology at Lake Baringo in the Nineteenth Century. Azania 24, 84-97.
APPLEBY PG and OLDFIELDZ F (1983): The assessment of 210Pb data from sites with varying sediment accumulation rates. Hydrobiologia 103(1), 29-35.
ARROYO-KALIN M (2010): The Amazonian Formative: Crop Domestication and Anthropogenic Soils. Diversity 2(4), 473-504.
ASHLEY CZ (2010): Towards a Socialised Archaeology of Ceramics in Great Lakes Africa. African Archaeological Review 27(2), 135-163.
ASHLEY GM, MAITIMA MWORIA J, MUASYA AM, OWEN RB, DRIESE SG, HOVER VC, . . . BLATT SH (2004): Sedimentation and recent history of a freshwater wetland in a semi-arid environment: Loboi Swamp, Kenya, East Africa. Sedimentology 51(6), 1301-1321.
AYALA G and FRENCH C (2005): Erosion modeling of past land-use practices in the Fiume di Sotto di Troina river valley, north-central Sicily. Geoarchaeology 20(2), 149-167.
BAGNALL PS (1960): The Geology of the North Pare Mountains. Records Geological Survey Tanganyika 10, 7-16. BAGNALL PS (1962): Geological Survey of Tanganyika: North Pare (Lake Jipe). Quarter Degree Sheet 73.
1:250,000, Geological Survey Division, Dodoma. BAGNALL PS, DUNDAS D and HARTLEY EW (1963): Geological Survey of Tanganyika: Lushoto. Quarter Degree
Sheet 109. 1:250,000, Geological Survey Division, Dodoma. BAILEY GN, REYNOLDS SC and KING GCP (2011): Landscapes of human evolution: models and methods of
tectonic geomorphology and the reconstruction of hominin landscapes. Journal of Human Evolution 60(3), 257-280.
BAILEY GN and KING GCP (2011): Dynamic landscapes and human dispersal patterns: tectonics, coastlines, and the reconstruction of human habitats. Quaternary Science Reviews 30(11-12), 1533-1553.
BAILEY RM and ARNOLD LJ (2006): Statistical modelling of single grain quartz De distributions and an assessment of procedures for estimating burial dose. Quaternary Science Reviews 25(19-20), 2475-2502.
BALÉE W (2006): The Research Program of Historical Ecology. Annual Review of Anthropology 35(1), 75-98. BALESDENT J, GIRARDIN C and MARIOTTI A (1993): Site-Related δ13C of Tree Leaves and Soil Organic Matter in
a Temperate Forest. Ecology 74(6), 1713-1721. BALESDENT J and MARIOTTI A (1996): Measurement of Soil Organic Matter Turnover Using 13C Natural
Abundance. In Mass Spectrometry of Soils (eds. TW BOUTTON and S-I YAMASAKI), pp. 83-112. Marcel Dekker, New York.
BALL DF (1964): Loss-on-ignition as an estimate of organic matter and organic carbon in non-calcareous soils. European Journal of Soil Science 15(1), 84-92.
BANERJEE D, BOTTER-JENSEN L and MURRAY AS (2000): Retrospective dosimetry: estimation of the dose to quartz using the single-aliquot regenerative-dose protocol. Applied Radiation and Isotopes 52(4), 831-844.
BANNERT M and STAMP P (2007): Cross-pollination of maize at long distance. European Journal of Agronomy 27(1), 44-51.
252
BARBONI D, BONNEFILLE R, ALEXANDRE A and MEUNIER JD (1999): Phytoliths as paleoenvironmental indicators, West Side Middle Awash Valley, Ethiopia. Palaeogeography, Palaeoclimatology, Palaeoecology 152(1-2), 87-100.
BARBONI D, BREMOND L and BONNEFILLE R (2007): Comparative study of modern phytolith assemblages from inter-tropical Africa. Palaeogeography, Palaeoclimatology, Palaeoecology 246(2-4), 454-470.
BARHAM L and MITCHELL P (2008): The first Africans. Cambridge World Archaeology (ed. N YOFFEE). Cambridge Univ. Press, New York.
BARKER P and GASSE F (2003): New evidence for a reduced water balance in East Africa during the Last Glacial Maximum: implication for model-data comparison. Quaternary Science Reviews 22(8-9), 823-837.
BATEMAN MD, FREDERICK CD, JAISWAL MK and SINGHVI AK (2003): Investigations into the potential effects of pedoturbation on luminescence dating. Quaternary Science Reviews 22(10-13), 1169-1176.
BAUERNHOFER A, HAUZENBERGER C, WALLBRECHER E, MUHONGO S, HOINKES G, MOGESSIE A, . . . TENCZER V (2008a): Geochemistry of basement rocks from SE Kenya and NE Tanzania: indications for rifting and early Pan-African subduction. International Journal of Earth Sciences 98(8), 1809-1834.
BAUERNHOFER AH, HAUZENBERGER CA, WALLBRECHER E, HOINKES G, MUHONGO S and MATHU EM (2008b): Pan-African deformation in SE Kenya and NE Tanzania: Geotectonic implications for the development of the north-central Mozambique Belt. African Journal of Science and Technology 9(1), 50-71.
BAUMANN O (1890): In Deutsch-Ostafrika während des Aufstandes. Reise der Dr. Hans Meyer´schen Expedition in Usambara. Eduard Hölzel Verlag, Wien und Olmütz.
BAUMANN O (1891): Usambara und seine Nachbargebiete. Dietrich Reimer, Berlin. BENGTSSON L and ENELL M (2003): Chemical Analysis. In Handbook of Holocene Palaeoecology and Palaeohydrology
(ed. BE BERGLUND), pp. 423-451. The Blackburn Press, Caldwell. BENNETT KD (1996): Determination of the number of zones in a biostratigraphical sequence. New Phytologist
132(1), 155-170. BENNETT KD (2009): psimpoll v4.27, Belfast. BESSEMS I, VERSCHUREN D, RUSSELL JM, HUS J, MEES F and CUMMING BF (2008): Palaeolimnological evidence
for widespread late 18th century drought across equatorial East Africa. Palaeogeography, Palaeoclimatology, Palaeoecology 259(2-3), 107-120.
BEUNING KRM, TALBOT MR and KELTS K (1997): A revised 30,000-year paleoclimatic and paleohydrologic history of Lake Albert, East Africa. Palaeogeography, Palaeoclimatology, Palaeoecology 136(1-4), 259-279.
BIGINAGWA TJ (2009): Excavation of 19th century caravan trade halts iin north-eastern Tanzania: A preliminary report. Nyame Akuma 72, 52-60.
BIOT Y, LAMBERT R and PERKIN S (1992): What's the problem? An essay on land degradation, science and development in sub-Saharan Africa. Discussion Paper, University of East Anglia, Norwich.
BIOT Y (1995): Rethinking research on land degradation in developing countries. World Bank Publications. BIRD M (1995): Fire, prehistoric humanity, and the environment. Interdisciplinary Science Reviews 20, 141-154. BIRKS HJB and BIRKS HH (1980): Quaternary Palaeoecology. Edward Arnold, London. BIRKS HJB (1986): Numerical zonation, comparison and correlation of Quaternary pollen-stratigraphic data. In
Handbook of Holocene Palaeoecology and Palaeohydrology (eds. BE BERGLUND and M RALSKA-JASIEWICZOWA), pp. 743-774. Wiley, Chichester.
BLENCH R and MACDONALD KC (2000): The origins and development of African livestock: archaeology, genetics, linguistics, and ethnography. Routledge.
BONNEFILLE R and RIOLLET G (1988): The Kashiru pollen sequence (Burundi) palaeoclimatic implications for the last 40,000 yr B.P. in tropical Africa. Quaternary Research 30(1), 19-35.
BONNEFILLE R, ROELAND JC and GUIOT J (1990): Temperature and rainfall estimates for the past 40,000 years in equatorial Africa. Nature 346(6282), 347-349.
BOREJSZA A, RODRÍGUEZ LÓPEZ I, FREDERICK CD and BATEMAN MD (2008): Agricultural slope management and soil erosion at La Laguna, Tlaxcala, Mexico. Journal of Archaeological Science 35(7), 1854-1866.
BÖRJESON L (2004): History Under Siege: Intensive Agriculture in the Mbulu Highlands, Tanzania, 19th Century to the Present. Ph.D. Dissertation. Stockholm University, Stockholm.
BÖRJESON L (2007): Boserup Backwards? Agricultural Intensification as 'Its Own Driving Force' in the Mbulu Highlands, Tanzania. Geografiska Annaler. Series B, Human Geography 89(3), 249-267.
BORK H-R (2003): Bodenbildung, Bodenerosion und Reliefentwicklung im Mittel- und Jungholozän Deutschlands. Forschungen zur deutschen Landeskunde N° 253. Deutsche Akademie für Landeskunde, Selbstverl., Flensburg.
BORK H-R and LANG A (2003): Quantification of past soil erosion and land use / land cover changes in Germany. In Long Term Hillslope and Fluvial System Modelling (eds. A LANG, R DIKAU and K HENNRICH) N° 101, pp. 231-239. Springer Berlin Heidelberg, Berlin, Heidelberg.
BOSERUP E (1965): The Conditions of Agricultural Growth: The Economics of Agrarian Change Under Population Pressure. Unwin university books. Allen and Unwin, London.
253
BOTHA GA, DE VILLIERS JM and VOGEL JC (1990a): Cyclicity of erosion, colluvial sedimentation and palaeosol formation in Quaternary hillslope deposits from northern Natal, South Africa. Palaeoecology of Africa and the surrounding islands N° 21 (eds. K HEINE and RR MAUD), pp. 195-210. Balkema, Rotterdam.
BOTHA GA, DE VILLIERS JM and VON BRUNN V (1990b): Pedostratigraphy: An analysis of different systems of nomenclature and their application to subdivision of the Masotcheni Formation, South Africa. Palaeoecology of Africa and the surrounding islands N° 21 (eds. K HEINE and RR MAUD), pp. 211-223. Balkema, Rotterdam.
BOTHA GA, WINTLE AG and VOGEL JC (1994): Episodic late quaternary palaeogully erosion in northern KwaZulu-Natal, South Africa. Catena 23(3-4), 327-340.
BOTHA GA and FEDOROFF N (1995): Palaeosols in Late Quaternary colluvium, northern KwaZulu-Natal, South Africa. Journal of African Earth Sciences 21(2), 291-311.
BOTHA GA (1996): Cyclical colluvial accretion on bedrock pediments during the Late Quaternary in northern KwaZulu-Natal, South Africa. Zeitschrift für Geomorphologie Suppl.-Bd. 103, 85-102.
BOULTER C, BATEMAN MD and FREDERICK CD (2007): Developing a protocol for selecting and dating sandy sites in East Central Texas: Preliminary results. Quaternary Geochronology 2(1-4), 45-50.
BOULTER C and BATEMAN M (2008): Guidelines for optically-stimulated luminescence dating of sediment. Sheffield Centre for International Drylands Research, Sheffield.
BOUTTON TW (1996): Stable Carbon Isotope Ratios of Soil Organic Matter and Their Use as Indicators of Vegetation and Climate Change. In Mass Spectrometry of Soils (eds. S-I YAMASAKI and TW BOUTTON), pp. 47-82. Marcel Dekker, New York.
BOUTTON TW, ARCHER SR, MIDWOOD AJ, ZITZER SF and BOL R (1998): δ13C values of soil organic carbon and their use in documenting vegetation change in a subtropical savanna ecosystem. Geoderma 82(1-3), 5-41.
BOWER J (1991): The Pastoral Neolithic of East Africa. Journal of World Prehistory 5(1), 49-82-82-49-82-82. BOWMAN D (2005): Understanding a flammable planet � climate, fire and global vegetation patterns. New
Phytologist 165(2), 341-345. BREMOND L, ALEXANDRE A, WOOLLER MJ, HÉLY C, WILLIAMSON D, SCHÄFER PA, . . . GUIOT J (2008):
Phytolith indices as proxies of grass subfamilies on East African tropical mountains. Global and Planetary Change 61(3-4), 209-224.
BREWER R, CROOK KAW and SPEIGHT JG (1970): Proposal for Soil-Stratigraphic units in the Australian Stratigraphic code. Journal of the Geological Society of Australia 17(1), 103-103.
BRNCIC TM, WILLIS KJ, HARRIS DJ and WASHINGTON R (2007): Culture or climate? The relative influences of past processes on the composition of the lowland Congo rainforest. Philosophical Transactions of the Royal Society B: Biological Sciences 362(1478), 229-242.
BROCKINGTON D and HOMEWOOD K (2001): Degradation Debates and Data Deficiencies: The Mkomazi Game Reserve, Tanzania. Africa: Journal of the International African Institute 71(3), 449-480.
BROCKINGTON D (2002): Fortress conservation: the preservation of the Mkomazi Game Reserve, Tanzania. James Currey Publishers.
BROWN H (1999): Agronomic Implications of C4 Photosynthesis. In C4 Plant Biology (eds. RF SAGE and RK MONSON), pp. 473-508. Academic Press, San Diego.
BULLOCK AA (1953): Notes on African Asclepiadaceae. III. Kew Bulletin 8(3), 329-362. BURESH RJ, SANCHEZ PA and CALHOUN F (1997): Replenishing Soil Fertility in Africa. SSA Special Publication N°
51. American Society of Agronomy-Soil Science Society of America, Madison. BURGESS ND, BUTYNSKI TM, CORDEIRO NJ, DOGGART NH, FJELDSAÅ J, HOWELL KM, . . . STUART SN
(2007): The biological importance of the Eastern Arc Mountains of Tanzania and Kenya. Biological Conservation 134(2), 209-231.
BURTON RF (1860): The Lake Regions of Central Africa. N° 1-2. Longman, London. BUTLER BE (1959): Periodic Phenomena in Landscapes as a Basis for Soil Studies. Soil Publication No.14,
Commonwealth Scientific and Industrial Research Organization, Melbourne. BUTLER BE (1982): A new system for soil studies. Journal of Soil Science 33(4), 581-595. BUTZER KW (1981): Rise and Fall of Axum, Ethiopia: A Geo-Archaeological Interpretation. American Antiquity
46(3), 471-495. BUTZER KW (2005): Environmental history in the Mediterranean world: cross-disciplinary investigation of cause-
and-effect for degradation and soil erosion. Journal of Archaeological Science 32(12), 1773-1800. BUTZER KW (2008): Challenges for a cross-disciplinary geoarchaeology: The intersection between environmental
history and geomorphology. Geomorphology 101(1-2), 402-411. CASELDINE CJ and TURNEY C (2010): The bigger picture: towards integrating palaeoclimate and environmental
data with a history of societal change. Journal of Quaternary Science 25(1), 88-93. CASSON L (1989): The Periplus maris Erythraei. Princeton Univ. Pr., Princeton. CATT JA (1986): Soils and Quaternary Geology. Monographs on soil and resource surveys N° 11. Clarendon Press,
Oxford u.a. CERLING TE (1999): Palaeorecords of C4 Plants and Ecosystems. In C4 Plant Biology (eds. RF SAGE and RK
MONSON), pp. 445-472. Academic Press, San Diego.
254
CHAMI F (1995a): A Preliminary Report of Ugweno Archaeological Survey, July 1995, University of Dar-es-Salaam, Dar-es-Salaam.
CHAMI FA (1994): The Tanzanian coast in the first millennium AD: an archaeology of the iron-working, farming communities. Studies in African archaeology N° 7. Societas Archaeologica Upsaliensis, Uppsala.
CHAMI FA (1995b): The first millenium AD on the East Coast: a new look at the cultural sequence and interactions. Azania 30, 232-237.
CHAMI FA (1999): Roman Beads from the Rufiji Delta, Tanzania: First Incontrovertible Archaeological Link with the Periplus. Current Anthropology 40(2), 237-241.
CHARMAN DJ and GARNETT MH (2004): Chronologies for Recent Peat Deposits Using Wiggle-matched Radiocarbon Ages: Problems with Old Carbon Contamination. Radiocarbon 47(1), 135-145.
CHILDS TS and HERBERT EW (2005): Metallurgy and its Consequences. In African archaeology: A Critical Introduction (ed. AB STAHL). Blackwell studies in global archaeology N° 3, pp. 276-300. Blackwell Publishing, Malden.
CHRISTIANSSON C (1981): Soil erosion and sedimentation in semi-arid Tanzania. Ph.D. Dissertation. Scandinavian Inst. of African Studies, Uppsala.
CHRISTIANSSON C (1986): Soil Erosion and Conservation in the Drylands. In Tanzania - crisis and struggle for survival (eds. J BOESEN, HJ KJELL, J KOPONEN and R ODGAARD), pp. 143-157. Scandinavian Institute of African Studies, Uppsala.
CHRISTIANSSON C (1992): From the "DUSER Project" to "Man - Land Interrelations...": A Note on Soil Erosion Research and Conservation in Central Tanzania, 1968-1992. Geografiska Annaler. Series A, Physical Geography 74(2/3), 61-63.
CHRISTIANSSON C and KIKULA IS (1996): Changing Environments: Research on Man-Land Interrelations in Semi-Arid Tanzania. Regional Soil Conservation Unit Report N° 13. Regional Soil Conservation Unit & Swedish International Development Cooperation Agency (SIDA), Nairobi.
CLARKE ML, VOGEL JC, BOTHA GA and WINTLE AG (2003): Late Quaternary hillslope evolution recorded in eastern South African colluvial badlands. Palaeogeography, Palaeoclimatology, Palaeoecology 197(3-4), 199-212.
CLEAVER KM and SCHREIBER GA (1994): Reversing the Spiral: The Population, Agriculture, and Environment Nexus in Sub-Saharan Africa. Directions in Development. The World Bank, Washington.
CLIST B (1987): A critical reappraisal of the chronological framework of the Early Urewe Iron Age industry. Muntu 6, 35-62.
COE MJ, MCWILLIAM NC, STONE GN and PACKER MJ (1999): Mkomazi: The Ecology, Biodiversity and Conservation of a Tanzanian Savanna. Royal Geographical Society (with The Institute of British Geographers), London.
COETZEE JA (1967): Pollen Analytical Studies in East and Southern Africa. Palaeoecology of Africa and of the Sourrounding Islands and Antarctica N° 3 (ed. EM VAN ZINDEREN BAKKER). Balkema, Cape Town.
CONKLIN HC (1961): The Study of Shifting Cultivation. Current Anthropology 2(1), 27-61. CONTE CA (1999): The forest becomes desert: forest use and environmental change in Tanzania's West
Usambara mountains. Land Degradation & Development 10(4), 291-309. COSTANZA R, GRAUMLICH L, STEFFEN W, CRUMLEY C, DEARING J, HIBBARD K, . . . SCHIMEL D (2007):
Sustainability or Collapse: What Can We Learn from Integrating the History of Humans and the Rest of Nature? AMBIO: A Journal of the Human Environment 36(7), 522-527.
COUTU A (2011): Tracing the links between elephants, humans, and landscapes during the 19th century East African ivory trade: a bioarchaeological study. Ph.D. Dissertation. University of York, York.
CRUMLEY C (2006): Historical Ecology: Integrated Thinking at Multiple Temporal and Spatial Scales. In The World System and the Earth System: Global Socioenvironmental Change and Sustainability Since the Neolithic (eds. A HORNBORG and CL CRUMLEY), pp. 15-28. Left Coast Press.
CRUMLEY DCL (1994): Historical Ecology: Cultural Knowledge and Changing Landscapes. SAR Press. DAHLBERG A (1994): Contesting views and changing paradigms: the land degradation debate in Southern Africa. Nordic
Africa Institute. DALE D and ASHLEY CZ (2010): Holocene hunter-fisher-gatherer communities: new perspectives on Kansyore
Using communities of Western Kenya. Azania: Archaeological Research in Africa 45(1), 24-24. DANIELS RB (1992): Soil geomorphology. Wiley, New York. DARBYSHIRE I, LAMB H and UMER M (2003): Forest clearance and regrowth in northern Ethiopia during the last
3000 years. The Holocene 13(4), 537-546. DAVIES M (2008): The irrigation system of the Pokot, northwest Kenya. Azania 43, 50-76. DE OLIVEIRA MAT, BEHLING H and PESSENDA LCR (2008a): Late-Pleistocene and mid-Holocene
environmental changes in highland valley head areas of Santa Catarina state, Southern Brazil. Journal of South American Earth Sciences 26(1), 55-67.
DE OLIVEIRA MAT, BEHLING H, PESSENDA LCR and DE LIMA GL (2008b): Stratigraphy of near-valley head quaternary deposits and evidence of climate-driven slope-channel processes in southern Brazilian highlands. Catena 75(1), 77-92.
DE PAUW E (1983): Tanzania - Soils and Physiography. 1:2,000,000, FAO, Dar-es-Salaam.
255
DE VILLIERS JM (1990): The nature of pedological evidence for climatic change during the Quaternary. Palaeoecology of Africa and the surrounding islands N° 21 (eds. K HEINE and RR MAUD), pp. 225-236. Balkema, Rotterdam.
DE VOS B, VANDECASTEELE B, DECKERS J and MUYS B (2005): Capability of Loss-on-Ignition as a Predictor of Total Organic Carbon in Non-Calcareous Forest Soils. Communications in Soil Science and Plant Analysis 36(19), 2899-2921.
DEAN WE (1974): Determination of carbonate and organic matter in calcareous sediments and sedimentary rocks by loss on ignition; comparison with other methods. Journal of Sedimentary Research 44(1), 242-248.
DEARING JA, MORTON RI, PRICE TW and FOSTER IDL (1986): Tracing movements of topsoil by magnetic measurements: two case studies. Physics of The Earth and Planetary Interiors 42(1-2), 93-104.
DEARING JA (1994): Environmental magnetic susceptibility using the Bartington MS2 system. Chi Publishing, Kenilworth. DEMENOCAL P, ORTIZ J, GUILDERSON T, ADKINS J, SARNTHEIN M, BAKER L and YARUSINSKY M (2000a):
Abrupt onset and termination of the African Humid Period:: rapid climate responses to gradual insolation forcing. Quaternary Science Reviews 19(1-5), 347-361.
DEMENOCAL P, ORTIZ J, GUILDERSON T and SARNTHEIN M (2000b): Coherent High- and Low-Latitude Climate Variability During the Holocene Warm Period. Science 288(5474), 2198-2202.
DENNY P (1978): Nyumba ya Mungu reservoir, Tanzania The general features. Biological Journal of the Linnean Society 10(1), 5-28.
DHARANI N (2002): Field Guide to Common Trees and Shrubs of East Africa. Struik Publishers, Cape Town. DOTTERWEICH M, SCHMIDTCHEN G and BORK HR (2002): The struggle of man against soil erosion throughout
the past centuries in Northeast Germany. In Man and Soil in the Third Millenium (eds. JL RUBIO, RPC MORGAN, S ASINS and V ANDREU). Proceedings of the third International Congress of the European Society for Soil Conservatio N° 1, pp. 273-281. Geoforma Ediciones Logroño.
DOTTERWEICH M (2008): The history of soil erosion and fluvial deposits in small catchments of central Europe: Deciphering the long-term interaction between humans and the environment -- A review. Geomorphology 101(1-2), 192-208.
DOWNIE C and WILKINSON P (1972): The geology of Kilimanjaro. The results of the Joint Sheffield University-Tanzania Geological Survey Expeditions in 1953 and 1957. University of Sheffield, Department of Geology, Sheffield.
DRECHSEL P, KUNZE D and DE VRIES FP (2001): Soil Nutrient Depletion and Population Growth in Sub-Saharan Africa: A Malthusian Nexus? Population & Environment 22(4), 411-423.
DREIBRODT S (2005): Detecting heavy precipitation events during the Holocene from soils, gully fills, colluvia and lake sediments examples from the Belauer See catchment (northern Germany). Zeitschrift der Deutschen Gesellschaft für Geowissenschaften 156, 573-588.
DREIBRODT S, LUBOS C, TERHORST B, DAMM B and BORK HR (2010a): Historical soil erosion by water in Germany: Scales and archives, chronology, research perspectives. Quaternary International 222(1-2), 80-95.
DREIBRODT S, LOMAX J, NELLE O, LUBOS C, FISCHER P, MITUSOV A, . . . BORK H-R (2010b): Are mid-latitude slopes sensitive to climatic oscillations? Implications from an Early Holocene sequence of slope deposits and buried soils from eastern Germany. Geomorphology 122(3-4), 351-369.
DRIESE SG, ASHLEY GM, LI Z-H, HOVER VC and OWEN RB (2004): Possible Late Holocene equatorial palaeoclimate record based upon soils spanning the Medieval Warm Period and Little Ice Age, Loboi Plain, Kenya. Palaeogeography, Palaeoclimatology, Palaeoecology 213(3-4), 231-250.
DUNDAS C (1924): Kilimanjaro and its people. Witherby, London. EAMCEF (2009): Eastern Arc Mountains Conservation Endowment Fund, accessed 28.08.2009,
www.easternarc.or.tz. EBINGER CJ, BECHTEL TD, FORSYTH DW and BOWIN CO (1989): Effective Elastic Plate Thickness Beneath the
East African and Afar Plateaus and Dynamic Compensation of the Uplifts. Journal of Geophysical Research 2883-2901., 2883-2901.-2883-2901.
EGGERT MKH (2005): The Bantu Problem and African Archaeology. In African archaeology: A Critical Introduction (ed. AB STAHL). Blackwell studies in global archaeology N° 3, pp. 301-326. Blackwell Publishing, Malden.
EHLERINGER JR and RUNDEL PW (1989): Stable Isotopes: History, Units, and Instrumentation. In Stable Isotopes in Ecological Research (eds. PW RUNDEL, JR EHLERINGER and KA NAGY). Ecological Studies N° 68, pp. 1-15. Springer, New York.
EHRET C (1998): An African Classical Age. Eastern and Southern Africa in World History, 1000 B.C. to A.D. 400. James Currey, Oxford.
EHRET C (2001): Bantu Expansions: Re-Envisioning a Central Problem of Early African History. The International Journal of African Historical Studies 34(1), 5-41.
ELLERT BH and ROCK L (2007): Stable Isotopes in Soil and Environmental Research. In Soil Sampling and Methods of Analysis (eds. MR CARTER and EG GREGORICH), pp. 693-711. CRC Press.
ELLIS EC (2011): Anthropogenic transformation of the terrestrial biosphere. Philosophical Transactions of the Royal Society A: Mathematical, Physical and Engineering Sciences 369(1938), 1010-1035.
EMBRECHTS J and DE DAPPER M (1987): Morphology and genesis of hillslope pediments in the Febe area (South-Cameroon). Catena 14(1-3), 31-43.
256
ENGLER A (1910): Die Pflanzenwelt Afrikas insbesondere seiner tropischen Gebiete. Die Vegetation der Erde. Wilhelm Engelmann, Leipzig.
ERIKSSON MG and CHRISTIANSSON C (1997): Accelerated soil erosion in Central Tanzania during the last few hundred years. Physics and Chemistry of The Earth 22(3-4), 315-320.
ERIKSSON MG (1998): Landscape and Soil Erosion History in Central Tanzania. Naturgeogrfiska Institutionen N° 12. Stockholm University, Stockholm.
ERIKSSON MG (1999): Influence of crustal movements on landforms, erosion and sediment deposition in the Irangi Hills, central Tanzania. Geological Society, London, Special Publications 162(1), 157-168.
ERIKSSON MG and SANDGREN P (1999): Mineral magnetic analyses of sediment cores recording recent soil erosion history in central Tanzania. Palaeogeography, Palaeoclimatology, Palaeoecology 152(3-4), 365-383.
ERIKSSON MG, OLLEY JM and PAYTON RW (2000): Soil erosion history in central Tanzania based on OSL dating of colluvial and alluvial hillslope deposits. Geomorphology 36(1-2), 107-128.
ESHETU Z and HÖGBERG P (2000): Reconstruction of Forest Site History in Ethiopian Highlands Based on ¹³C Natural Abundance of Soils. Ambio 29(2), 83-89.
ESHETU Z (2002): Historical C3-C4 Vegetation Pattern on Forested Mountain Slopes: Its Implication for Ecological Rehabilitation of Degraded Highlands of Ethiopia by Afforestation. Journal of Tropical Ecology 18(5), 743-758.
EVANS ME and HELLER F (2003): Environmental magnetism: Principles and applications of enviromagnetics. International geophysics series N° 86 (eds. R DMOWSKA, JR HOLTON and TH ROSSBY). Academic Press, San Diego.
EVANS R (1990): Soil Erosion: Its Impact on the English and Welsh Landscape since Woodland Clearance. In Soil Erosion on Agricultural Land (eds. J BOARDMAN, IDL FOSTER and JA DEARING), pp. 231-254. John Wiley & Sons, Chichester.
FÆGRI K and IVERSEN J (1989): Textbook of Pollen Analysis. (eds. PE KALAND and K KRZYWINSKI). Wiley, Chichester.
FAIRHEAD J and LEACH M (1999): Misreading the African landscape. African studies series N° 90. Cambridge University Press, Cambridge.
FAO (2011): Eucalyptus in East Africa, Socio-economic and environmental issues. by Gessesse Dessie. Planted Forests and Trees Working Paper, Teklu Erkossa. Forest Management Team, Forest Management Division. FAO, Rome (unpublished).
FARQUHAR GD, EHLERINGER JR and HUBICK KT (1989): Carbon Isotope Discrimination and Photosynthesis. Annual Review of Plant Physiology and Plant Molecular Biology 40(1), 503-537.
FATTAHI M, WALKER R, HOLLINGSWORTH J, BAHROUDI A, NAZARI H, TALEBIAN M, . . . STOKES S (2006): Holocene slip-rate on the Sabzevar thrust fault, NE Iran, determined using optically stimulated luminescence (OSL). Earth and Planetary Science Letters 245(3-4), 673-684.
FEIERMAN S (1990): Peasant Intellectuals: anthropology and history in Tanzania. University of Wisconsin Press, Madison. FELTON AA, RUSSELL JM, COHEN AS, BAKER ME, CHESLEY JT, LEZZAR KE, . . . TIERCELIN JJ (2007):
Paleolimnological evidence for the onset and termination of glacial aridity from Lake Tanganyika, Tropical East Africa. Palaeogeography, Palaeoclimatology, Palaeoecology 252(3-4), 405-423.
FERNANDEZ HONAINE M, ZUCOL AF and OSTERRIETH ML (2006): Phytolith Assemblages and Systematic Associations in Grassland Species of the South-Eastern Pampean Plains, Argentina. Ann Bot 98(6), 1155-1165.
FINCH J, LENG MJ and MARCHANT R (2009): Late Quaternary vegetation dynamics in a biodiversity hotspot, the Uluguru Mountains of Tanzania. Quaternary Research 72(1), 111-122.
FINCH J and MARCHANT R (2010): A palaeoecological investigation into the role of fire and human activity in the development of montane grasslands in East Africa. Vegetation History and Archaeobotany 20(2), 109-124.
FINCH J and MARCHANT R (in prep.): A late Holocene record of forest history and human impacts from the Eastern Arc Mountains of Tanzania and Kenya.
FINCH J, WOOLLER MJ and MARCHANT R (in prep.): A 40,000-yr record of ecosystem dynamics from the Eastern Arc Mountains of Tanzania.
FISHER CT, POLLARD HP, ISRADE-ALCANTARA I, GARDUNO-MONROY VH and BANERJEE SK (2003): From the Cover: A reexamination of human-induced environmental change within the Lake Patzcuaro Basin, Michoacan, Mexico. Proceedings of the National Academy of Sciences 100(8), 4957-4962.
FLEURET P (1985): The Social Organization of Water Control in the Taita Hills, Kenya. American Ethnologist 12(1), 103-118.
FLOHN H (1964): Über die Ursachen der Aridität Nordost-Afrikas. Würzburger Geographische Arbeiten 12, 25-41. FOSBROOKE HA (1954): Further Light on Rock Engravings in Northern Tanganyika. Man 54, 101-102. FOSBROOKE HA (1957): Early Iron Age Sites in Tanganyika relative to Traditional History. In Third Pan-African
Congress on Prehistory. Livingston 1955 (eds. DJ CLARK and S COLE), pp. 318-325. Chatto & Windus, London. FOSTER IDL, BOARDMAN J and KEAY-BRIGHT J (2007): Sediment tracing and environmental history for two
small catchments, Karoo Uplands, South Africa. Geomorphology 90(1-2), 126-143. FREEMAN-GRENVILLE GSP (1962): The medieval History of the coast of Tanganyika: with special reference to recent
archaeological discoveries. Oxford University Press, London.
257
FRENCH C, LEWIS H, SCAIFE R and ALLEN M (2005): New perspectives on Holocene landscape development in the southern English chalklands: The upper Allen valley, Cranborne Chase, Dorset. Geoarchaeology 20(2), 109-134.
FRENCH C, SULAS F and MADELLA M (2009): New geoarchaeological investigations of the valley systems in the Aksum area of northern Ethiopia. Catena 78(3), 218-233.
FRENCH C (2010): People, Societies, and Landscapes. Science 328(5977), 443-444. FRENCH CAI and WHITELAW TM (1999): Soil erosion, agricultural terracing and site formation processes at
Markiani, Amorgos, Greece: The micromorphological perspective. Geoarchaeology 14(2), 151-189. FRÖHLICH H, OPP C and SCHOLTEN T (2005): Periglacial layer or anthropogenoic layer? - A small scale analysis
of their spatial distribution under forest. Zeitschrift für Geomorphologie N. F. Suppl.-Vol. 139, 203-219. FRYIRS KA, BRIERLEY GJ, PRESTON NJ and SPENCER J (2007): Catchment-scale (dis)connectivity in sediment
flux in the upper Hunter catchment, New South Wales, Australia. Geomorphology 84(3-4), 297-316. FUCHS M and LANG A (2001): OSL dating of coarse-grain fluvial quartz using single-aliquot protocols on
sediments from NE Peloponnese, Greece. Quaternary Science Reviews 20(5-9), 783-787. FUCHS M and WAGNER GA (2003): Recognition of insufficient bleaching by small aliquots of quartz for
reconstructing soil erosion in Greece. Quaternary Science Reviews 22(10-13), 1161-1167. FUCHS M (2007): An assessment of human versus climatic impacts on Holocene soil erosion in NE Peloponnese,
Greece. Quaternary Research 67(3), 349-356. FUCHS M and LANG A (2009): Luminescence dating of hillslope deposits--A review. Geomorphology 109(1-2), 17-
26. FUCHS M, FISCHER M and REVERMAN R (2010): Colluvial and alluvial sediment archives temporally resolved by
OSL dating: Implications for reconstructing soil erosion. Quaternary Geochronology 5(2-3), 269-273. GALBRAITH RF and GREEN PF (1990): Estimating the component ages in a finite mixture. International Journal of
Radiation Applications and Instrumentation. Part D. Nuclear Tracks and Radiation Measurements 17(3), 197-206. GALBRAITH RF and LASLETT GM (1993): Statistical models for mixed fission track ages. Nuclear Tracks and
Radiation Measurements 21(4), 459-470. GALBRAITH RF, ROBERTS RG, LASLETT GM, YOSHIDA H and OLLEY JM (1999): Optical Dating of single and
multiple grains of quartz from Jinmium Rock Shelter, Northern Australia: Part I, Experimental design and statistical models. Archaeometry 41(2), 339-364.
GASSE F (2000): Hydrological changes in the African tropics since the Last Glacial Maximum. Quaternary Science Reviews 19(1-5), 189-211.
GASSE F (2002): Kilimanjaro's Secrets Revealed. Science 298(5593), 548-549. GASSE F (2006): Climate and hydrological changes in tropical Africa during the past million years. Comptes Rendus
Palevol 5(1-2), 35-43. GASSE F, CHALIÉ F, VINCENS A, WILLIAMS MAJ and WILLIAMSON D (2008): Climatic patterns in equatorial and
southern Africa from 30,000 to 10,000 years ago reconstructed from terrestrial and near-shore proxy data. Quaternary Science Reviews 27(25-26), 2316-2340.
GEBRU T, ESHETU Z, HUANG Y, WOLDEMARIAM T, STRONG N, UMER M, . . . TERWILLIGER VJ (2009): Holocene palaeovegetation of the Tigray Plateau in northern Ethiopia from charcoal and stable organic carbon isotopic analyses of gully sediments. Palaeogeography, Palaeoclimatology, Palaeoecology 282(1-4), 67-80.
GENTRY AH (1988): Changes in Plant Community Diversity and Floristic Composition on Environmental and Geographical Gradients. Annals of the Missouri Botanical Garden 75(1), 1-34.
GERRARD J (1992): Soil Geomorphology. Chapman & Hall, London. GEYH MA (2005): 14C dating - still a challenge for users ? Zeitschrift für Geomorphologie N. F. Suppl. Vol. 139, 63-
86. GICHUKI J, TRIEST L and DEHAIRS F (2001): The use of stable carbon isotopes as tracers of ecosystem
functioning in contrasting wetland ecosystems of Lake Victoria, Kenya. Hydrobiologia 458(1), 91-97. GIFFORD-GONZALEZ D (1998): Early Pastoralists in East Africa: Ecological and Social Dimensions. Journal of
Anthropological Archaeology 17(2), 166-200. GIFFORD-GONZALEZ D (2005): Pastoralism and its Consequences. In African archaeology: A Critical Introduction (ed.
AB STAHL). Blackwell studies in global archaeology N° 3, pp. 187-224. Blackwell Publishing, Malden. GILCHRIST B (1952). In Report on Central African Rail Link Development Survey (eds. I OVERSEAS CONSULTANTS, G
SIR ALEXANDER and PARTNERS) N° 1-2. Colonial Office, London. GILLSON L, SHERIDAN M and BROCKINGTON D (2003): Representing environments in flux: case studies from
East Africa. Area 35(4), 371-389. GILLSON L (2004): Testing non-equilibrium theories in savannas: 1400 years of vegetation change in Tsavo
National Park, Kenya. Ecological Complexity 1(4), 281-298. GILLSON L, WALDRON S and WILLIS KJ (2004): Interpretation of Soil δ13C as an Indicator of Vegetation Change
in African Savannas. Journal of Vegetation Science 15(3), 339-350. GILLSON L and WILLIS KJ (2004): 'As Earth's testimonies tell': wilderness conservation in a changing world.
Ecology Letters 7(10), 990-998.
258
GILLSON L (2006): A �large infrequent disturbance� in an East African savanna. African Journal of Ecology 44(4), 458-467.
GILLSON L and HOFFMAN MT (2007): Rangeland Ecology in a Changing World. Science 315(5808), 53-54. GILLSON L and DUFFIN KI (2007): Thresholds of potential concern as benchmarks in the management of
African savannahs. Philosophical Transactions of the Royal Society B: Biological Sciences 362(1478), 309-319. GOLDAMMER JG (1992): Feuer in Waldökosystemen der Tropen und Subtropen. Birkhäuser Verlag AG. GOODWIN AJH (1953): The Origin of Maize. The South African Archaeological Bulletin 8(29), 13-14. GORDON AD and BIRKS HJB (1972): Numerical Methods in Quaternary Palaeoecology. I. Zonation of Pollen
Diagrams. New Phytologist 71(5), 961-979. GOYDER DJ (1998): A Revision of Pachycarpus E. Mey. (Asclepiadaceae: Asclepiadeae) in Tropical Africa with
Notes on the Genus in Southern Africa. Kew Bulletin 53(2), 335-374. GOYDER DJ (2009): A synopsis of Asclepias (Apocynaceae: Asclepiadoideae) in tropical Africa. Kew Bulletin 64(3),
369-399. GREENLAND DJ (1974): Evolution and development of different types of shifting cultivation. In Shifting
Cultivation and Soil Conservation in Africa. FAO Soils Bulletin N° 24. FAO, Rome. GREENWAY PJ (1973): A classification of the vegetation of East Africa. Kirkia 9, 1-68. GREIG-SMITH P (1983): Quantitative Plant Ecology. Blackwell Scientific, Oxford. GRIFFITHS JC (1993): The geological evolution of East Africa. In Biogeography and ecology of the rain forests of eastern
Africa (eds. JC LOVETT and SK WASSER), pp. 9-21. Cambridge University Press, Cambridge. GRIMM EC (1987): CONISS: a FORTRAN 77 program for stratigraphically constrained cluster analysis by the
method of incremental sum of squares. Computers & Geosciences 13(1), 13-35. GRIMSHAW JM (1999): The Afromontane Bamboo, Yushania alpina, on Kilimanjaro. Journal of East African
Natural History 88(1), 79-83. GRUNDERBEEK MV, DOUTRELEPONT H and ROCHE E (1984): Influence humaine sur le milieu au Rwanda et
Burundi à l�âge du fer ancien (220�665 A.D.) apports de la palynologie et de l�étude des charbons de bois. Revue de Paléobiologie, 221-229.
GRUNERT J, MUND J-P and CHRIST T (2004): Die Marais in Süd-Rwanda. Geoökologische Ausstattung und Landnutzungspotential versumpfter, tropischer Talböden. In 20 Jahre Länderpartnerschaft Rheinland-Pfalz - Rwanda. Koblenzer Geographisches Kolloquium N° 26, pp. 79-106. Hartmann, Koblenz.
GUTACHTERAUSSCHUSS FORSTLICHE ANALYTIK (2005): Handbuch Forstliche Analytik. Handbuch Forstliche Analytik. Bundesministerium für Verbraucherschutz, Ernährung und Landwirtschaft.
HÅKANSSON NT (1994): Grain, Cattle, and Power: Social Processes of Intensive Cultivation and Exchange in Precolonial Western Kenya. Journal of Anthropological Research 50(3), 249-276.
HÅKANSSON NT (2004): The Human Ecology of World Systems in East Africa: The Impact of the Ivory Trade. Human Ecology 32(5), 561-591.
HÅKANSSON TN (1989): Social and Political Aspects of Intensive Agriculture in East Africa: Some Models from Cultural Anthropology. Azania 24, 12-20.
HÅKANSSON TN and WIDGREN M (2007): Labour and landscapes: The political economy of landesque capital in nineteenth century Tanganyika. Geografiska Annaler: Series B, Human Geography 89(3), 233-248.
HÅKANSSON TN, WIDGREN M and BÖRJESON L (2008): Historical and Regional Perspectives on Landscape Transformations in Northeastern Tanzania, 1850�2000. International Journal of African Historical Studies 41(3), 369-382.
HÅKANSSON TN (2008): Regional Political Ecology and Intensive Cultivation in Pre-Colonial and Colonial South Pare, Tanzania. International Journal of African Historical Studies 41(3), 433-460.
HÅLAND R and MSUYA CS (2000): Pottery Production, Iron Working, and Trade in the Early Iron Age: The case of Dakawa, east-central Tanzania. Azania 35, 77-103.
HALL J, BURGESS ND, LOVETT J, MBILINYI B and GEREAU RE (2009): Conservation implications of deforestation across an elevational gradient in the Eastern Arc Mountains, Tanzania. Biological Conservation 142(11), 2510-2521.
HAMILTON A (1998): Vegetation, Climate and Soil: Altitudinal Relationships on the East Usambara Mountains, Tanzania. Journal of East African Natural History 87(1), 85-89.
HAMILTON AC (1972): The interpretation of pollen diagrams from highland Uganda. Palaeoecology of Africa N° 7 (ed. EM VAN ZINDEREN BAKKER). Balkema, Rotterdam.
HAMILTON AC (1981): The quaternary history of African forests: its relevance to conservation. African Journal of Ecology 19(1-2), 1-6.
HAMILTON AC (1982): Environmental History of East Africa: A Study of the Quaternary. Academic Press, London. HAMILTON AC (1989a): History of Ressource Utilization and Managment. The pre-colonial period. In Forest
conservation in the East Usambara Mountains, Tanzania (eds. R BENSTED-SMITH and AC HAMILTON), pp. 35-37. IUCN, Gland, Switzerland and Cambridge, UK.
HAMILTON AC (1989b): Soils. In Forest Conservation in the East Usambara Mountains, Tanzania (eds. A HAMILTON and R BENSTED-SMITH). IUCN conservation library, pp. 87-95. The IUCN Tropical Forest Programme.
259
HAMILTON AC (1989c): The Climate of the East Usambaras. In Forest conservation in the East Usambara Mountains, Tanzania (eds. AC HAMILTON and R BENSTED-SMITH), pp. 97-102. IUCN, Gland, Switzerland and Cambridge, UK.
HASTENRATH S (2001): Variations of East African Climate during the Past Two Centuries. Climatic Change 50, 209-217.
HASTENRATH S and LAMB PJ (2004): Climate dynamics of atmosphere and ocean in the equatorial zone: a synthesis. International Journal of Climatology 24(13), 1601-1612.
HASTENRATH S (2007): Circulation mechanisms of climate anomalies in East Africa and the equatorial Indian Ocean. Dynamics of Atmospheres and Oceans 43(1-2), 25-35.
HEIRI O, LOTTER AF and LEMCKE G (2001): Loss on ignition as a method for estimating organic and carbonate content in sediments: reproducibility and comparability of results. Journal of Paleolimnology 25, 101-110.
HEMP A (2005): Climate change-driven forest fires marginalize the impact of ice cap wasting on Kilimanjaro. Global Change Biology 11(7), 1013-1023.
HEMP A (2006a): Continuum or zonation? Altitudinal gradients in the forest vegetation of Mt. Kilimanjaro. Plant Ecology 184(1), 27-42.
HEMP A (2006b): Vegetation of Kilimanjaro: hidden endemics and missing bamboo. African Journal of Ecology 44(3), 305-328.
HEMP A (2009): Climate change and its impact on the forests of Kilimanjaro. African Journal of Ecology 47(s1), 3-10.
HENDRICKX JMH, HARRISON JBJ, VAN DAM RL, BORCHERS B, NORMAN DI, DEDZOE CD, . . . FRIESEN J (2005): Magnetic soil properties in Ghana. Paper presented, Orlando, FL, USA.
HIGHAM T (2002): radiocarbon WEB-info, accessed 25.08.2010, http://www.c14dating.com/. HILLAIRE-MARCEL C, AUCOUR A-M, BONNEFILLE R, RIOLLET G, VINCENS A and WILLIAMSON D (1989):
13C/Palynological evidence of differential residence times of organic carbon prior to its sedimentation in East African Rift Lakes and peat bogs. Quaternary Science Reviews 8(3), 207-212.
HOLDSHIP SA (1976): The Palaeolimnology of Lake Manyara, Tanzania: A diatom analysis of a 56 meter sediment core. Doctoral thesis. Duke University, Michigan.
HOWARD PJA and HOWARD DM (1990): Use of organic carbon and loss-on-ignition to estimate soil organic matter in different soil types and horizons. Biology and Fertility of Soils 9(4), 306-310.
HOWELL LK (2009): Ecosystem and climatic dynamics of southeast Mount Kenya. Report Series No.6, NERC Isotope Geoscience Laboratory.
HUANG CC, JIA Y, PANG J, ZHA X and SU H (2006): Holocene colluviation and its implications for tracing human-induced soil erosion and redeposition on the piedmont loess lands of the Qinling Mountains, northern China. Geoderma 136(3-4), 838-851.
ILES L (2011): Pare Mountains, pilot study: iron production at Mwanga C, University College London, London. ISRIC, FAO and UNEP (2004): Soil and Terrain Database for Southern Africa (SOTER), Access: 18.03.2009.
http://www.isric.org/. IUSS WORKING GROUP WRB (2007): World Reference Base for Soil Resources 2006, first update 2007. Soil Resources
Report No.103, FAO, Rome. IVERSEN ST (1991): The Usambara Mountains, NE Tanzania: Phytogeography of the vascular plant flora. Acta Univ. Ups.
Symb. Bot. Ups N° 19, 3. Almquist & Wiksell, Uppsala. JEFFREYS MDW (1963): How Ancient Is West African Maize? Africa: Journal of the International African Institute
33(2), 115-131. JENNY H (1941): Factors of soil formation. McGraw-Hill, New York. JOLLY D, TAYLOR D, MARCHANT R, HAMILTON A, BONNEFILLE R, BUCHET G and RIOLLET G (1997):
Vegetation Dynamics in Central Africa Since 18,000 yr BP: Pollen Records from the Interlacustrine Highlands of Burundi, Rwanda and Western Uganda. Journal of Biogeography 24(4), 495-512.
JONES S (1996): Discourses on land degradation in the Uluguru mountains, Tanzania: Evolution and influences. Journal of Rural Studies 12(2), 187-199.
JONGMAN RH, TER BRAAK CJF and VAN TONGEREN OFR (1987): Data analyis in community and landscape ecology. Pudoc, Wageningen.
JUGGINS S (2007): C2 Software for ecological and palaeoecological data analysis and visualisation. v1.6.6, Newcastle University, Newcastle upon Tyne.
JUNG SJA, DAVIES GR, GANSSEN GM and KROON D (2004): Stepwise Holocene aridification in NE Africa deduced from dust-borne radiogenic isotope records. Earth and Planetary Science Letters 221(1-4), 27-37.
KANGALAWE RYM, CHRISTIANSSON C and ÖSTBERG W (2008): Changing land-use patterns and farming strategies in the degraded environment of the Irangi Hills, central Tanzania. Agriculture, Ecosystems & Environment 125(1-4), 33-47.
KAREGA-MUNENE (2003): The East African Neolithic: A Historical Perspective. In East African Archaeology: Foragers, Potters, Smiths, and Traders (eds. CM KUSIMBA and SB KUSIMBA), pp. 17-32. Unversity of Pennsylvania, Philadelphia.
KENDALL RL (1969): An Ecological History of the Lake Victoria Basin. Ecological Monographs 39(2), 121-176.
260
KERSTING P (2010): Geomorphologische Untersuchungen im Land der tausend Hügel - oder: Wie europäisch ist die rwandische Landschaftsentwicklung? Forum ifl N° 13. Leibnitz-Institut für Länderkunde, Leipzig.
KIAGE LM and LIU K-B (2006): Late Quaternary paleoenvironmental changes in East Africa: a review of multiproxy evidence from palynology, lake sediments, and associated records. Progress in Physical Geography 30(5), 633-658.
KIAGE LM and LIU K-B (2009): Palynological evidence of climate change and land degradation in the Lake Baringo area, Kenya, East Africa, since AD 1650. Palaeogeography, Palaeoclimatology, Palaeoecology 279(1-2), 60-72.
KIMAMBO IN (1968): The Pare. In Tanzania Before 1900 (ed. AD ROBERTS), pp. 16-36. East African Publishing House, Nairobi.
KIMAMBO IN (1969): A political history of the Pare of Tanzania, c. 1500-1900. Peoples of East Africa N° 3. East African Pub. House, Nairobi.
KIMAMBO IN (1991): Penetration & protest in Tanzania. The impact of the world economy on the Pare 1860-1960. Currey, London.
KIMAMBO IN (1996): Environmental Control & Hunger in the Mountains & Plains of Northeastern Tanzania. In Custodians of the land. Ecology and Culture in the History of Tanzania (eds. G MADDOX, JL GIBLIN and IN KIMAMBO), pp. 271-271. James Currey, London.
KIMARO DN, POESEN J, MSANYA BM and DECKERS JA (2008): Magnitude of soil erosion on the northern slope of the Uluguru Mountains, Tanzania: Interrill and rill erosion. Catena 75(1), 38-44.
KINLUND P (1996): Does land degradation matter? Almqvist & Wiksell Internat., Stockholm. KIRIAMA HO (1987): Archaeo-Metallurgy of Iron Smelting Slags from a Mwitu Tradition Site in Kenya. The South
African Archaeological Bulletin 42(146), 125-130. KIRIAMA HO (1993): The iron-using communities in Kenya. In The Archaeology of Africa: Food, metals and towns
(eds. T SHAW, P SINCLAIR, B ANDAH and A OKPOKO), pp. 484-498. Routledge, London. KJEKSHUS H (1977): Ecology control and economic development in East African history. Heinemann, London. KLEBER A (2006): "Kolluvium" does not equal "colluvium". Zeitschrift für Geomorphologie 50(4), 541-542. KONING N and SMALING E (2005): Environmental crisis or 'lie of the land'? The debate on soil degradation in
Africa. Land Use Policy 22(1), 3-11. KOPONEN J (1988a): People and production in late precolonial Tanzania. Monographs of the Finnish Society for
Development Studies N° 2. Scandinavian Institute of African Studies, Helsinki. KOPONEN J (1988b): War, Famine, and Pestilence in Late Precolonial Tanzania: A Case for a Heightened
Mortality. The International Journal of African Historical Studies 21(4), 637-676. KOTTEK M, GRIESER J, BECK C, RUDOLF B and RUBEL F (2006): World Map of the Koppen-Geiger climate
classification updated. Meteorologische Zeitschrift 15, 259-263. KOTZ E (1922): Im Banne der Furcht: Sitten und Gebräuche der Wapare in Ostafrika. Advent-Verlag, Hamburg. KRAPF JL (1858): Reisen in Ostafrika ausgeführt in den Jahren 1837-1855. Im Selbstverlage des Verfassers, Kornthal.
Reprint 1964, Brockhaus, Stuttgart. KROETSCH D and WANG C (2007): Particle Size Distribution. In Soil Sampling and Methods of Analysis (eds. MR
CARTER and EG GREGORICH). Canadian Society of Soil Science, CRC Press, Boca Raton. KRULL ES, BESTLAND EA and GATES WP (2002): Soil organic matter decomposition and turnover in a tropical
Ultisol; evidence from δ13C, δ15N and geochemistry. Radiocarbon 44(1), 93-112. KURTH VJ, MACKENZIE MD and DELUCA TH (2006): Estimating charcoal content in forest mineral soils.
Geoderma 137(1-2), 135-139. KUSIMBA CM (2004): Archaeology of Slavery in East Africa. The African Archaeological Review 21(2), 59-88. LAIRD LD and CAMPBELL ID (2000): High resolution palaeofire signals from Christina Lake, Alberta: a
comparison of the charcoal signals extracted by two different methods. Palaeogeography, Palaeoclimatology, Palaeoecology 164(1-4), 111-123.
LAMB H, DARBYSHIRE I and VERSCHUREN D (2003): Vegetation response to rainfall variation and human impact in central Kenya during the past 1100 years. The Holocene 13(2), 285-292.
LANE P (2004): The �moving frontier� and the transition to food production in Kenya. Azania: Archaeological Research in Africa 39(1), 243-243.
LANE P, SEITSONEN O, HARVEY P, MIRE S and ODEDE F (2007): The Transition to Farming in Eastern Africa: New Faunal and Dating Evidence from Wadh Lang�o and Usenge, Kenya. Antiquity 81, 62-81.
LANE PJ, MAPUNDA B and ERIKSSON M (2001): Soil erosion, iron smelting and human settlement in the Haubi Basin, north-central Tanzania. Antiquities 75(290), 803-804.
LANE PJ (2009): Environmental Narratives and the History of Soil Erosion in Kondoa District, Tanzania: An Archaeological Perspective. International Journal of African Historical Studies 42(3), 457-483.
LANE PJ (2010): Developing Landscape Historical Ecologies in Eastern Africa: An Outline of Current Research and Potential Future Directions. African Studies 69(2), 299-322.
LANG A and HÖNSCHEIDT S (1999): Age and source of colluvial sediments at Vaihingen-Enz, Germany. Catena 38(2), 89-107.
261
LANG A (2003): Phases of soil erosion-derived colluviation in the loess hills of South Germany. Catena 51(3-4), 209-221.
LASESKI RA (1983): Modern pollen data and Holocene climate change in Eastern Africa. PhD Dissertation. Brown University, Providence.
LE BORGNE E (1960): Les propriétés magnétique du sol. Application a la prospection des sites archéologiques. Archaeo-Physika 1, 1-20.
LE DREZEN Y, LESPEZ L, RASSE M, GARNIER A, COUTARD S, HUYSECOM E and BALLOUCHE A (2010): Hydrosedimentary records and Holocene environmental dynamics in the Yamé Valley (Mali, Sudano-Sahelian West Africa). Comptes Rendus Geoscience 342(3), 244-252.
LE GALL B, NONNOTTE P, ROLET J, BENOIT M, GUILLOU H, MOUSSEAU-NONNOTTE M, . . . DEVERCHÈRE J (2008): Rift propagation at craton margin.: Distribution of faulting and volcanism in the North Tanzanian Divergence (East Africa) during Neogene times. Tectonophysics 448(1-4), 1-19.
LEACH M and MEARNS R (1996): The Lie of the Land: Challenging Received Wisdom on the African Environment. International African Institute & James Currey, Oxford.
LEJJU BJ, ROBERTSHAW P and TAYLOR D (2006): Africa's earliest bananas? Journal of Archaeological Science 33(1), 102-113.
LEJJU JB (2009): Vegetation dynamics in western Uganda during the last 1000 years: climate change or human induced environmental degradation? African Journal of Ecology 47(s1), 21-29.
LEPPER K, LARSEN NA and MCKEEVER SWS (2000): Equivalent dose distribution analysis of Holocene eolian and fluvial quartz sands from Central Oklahoma. Radiation Measurements 32(5-6), 603-608.
LEPPER K and W. S. MCKEEVER S (2002): An Objective Methodology for Dose Distribution Analysis. Radiation Protection Dosimetry 101(1-4), 349-352.
LESPEZ L, LE DREZEN Y, GARNIER A, RASSE M, EICHHORN B, OZAINNE S, . . . HUYSECOM E (2011): High-resolution fluvial records of Holocene environmental changes in the Sahel: the Yamé River at Ounjougou (Mali, West Africa). Quaternary Science Reviews 30(5-6), 737-756.
LIND EM and MORRISON MES (1974): East African vegetation. Longman, London. LINDSTROM MJ, NELSON WW and SCHUMACHER TE (1992): Quantifying tillage erosion rates due to moldboard
plowing. Soil and Tillage Research 24(3), 243-255. LOVETT JC (1989): The Botanical Importance of the East Usambara Forests in Relation to Other Forests in
Tanzania. In Forest Conservation in the East Usambara Mountains Tanzania (eds. AC HAMILTON and R BENSTED-SMITH), pp. 207-212. IUCN, Forest Division, Ministry of Lands, Natural Resources and Tourisum, Dar-es-Salaam.
LOVETT JC and PÓCS T (1993): Assessment of the condition of the Catchment Forest Reserves, a botanical appraisal. Kilimanjaro Region. Catchment Forestry Report, Ministry of Tourism, Natural Resources and the Environment, Dar es Salaam.
LOVETT JC (1993a): Climatic history and forest distribution in eastern Africa. In Biogrography and ecology of the rain forests of eastern Africa (eds. JC LOVETT and SK WASSER), pp. 23-29. Cambridge University Press, Cambridge.
LOVETT JC (1993b): Eastern Arc moist forest flora. In Biogrography and ecology of the rain forests of eastern Africa (eds. JC LOVETT and SK WASSER), pp. 33-56. Cambridge University Press, Cambridge.
LOVETT JC (1994): Notes on moist forest bamboos and bambusoid grasses in eastern Tanzania. E. A. N. H. S. Bull. 24, 2-5.
LOVETT JC (1996): Elevational and Latitudinal Changes in Tree Associations and Diversity in the Eastern Arc Mountains of Tanzania. Journal of Tropical Ecology 12(5), 629-650.
LOVETT JC (1998): Importance of the Eastern Arc Mountains for Vascular Plants. Journal of East African Natural History 87(1), 59-74.
LOVETT JC, RUFFO CK, GEREAU RE and TAPLIN JRD (2006a): Field Guide to the Moist Forest Trees of Tanzania. The Society for Environmental Exploration, UK and the University of Dar es Salaam, Tanzania.
LOVETT JC, MARSHALL AR and CARR J (2006b): Changes in tropical forest vegetation along an altitudinal gradient in the Udzungwa Mountains National Park, Tanzania. African Journal of Ecology 44(4), 478-490.
LUNDGREN L (1980): Comparison of Surface Runoff and Soil Loss from Runoff Plots in Forest and Small-Scale Agriculture in the Usambara Mts., Tanzania. Geografiska Annaler. Series A, Physical Geography 62(3/4), 113-148.
MÄCKEL R (1974): Dambos: A study in morphodynamic activity on the plateau regions of Zambia. Catena 1, 327-365.
MÄCKEL R and WALTHER D (1984): The age and geomorphological interpretation of Late Pleistocene and Holocene deposits in the Nyiru-Ndotos Mountain region and adjacent plains, Northern Kenya. Palaeoecology of Africa and the surrounding islands N° 16 (eds. EM VAN ZINDEREN BAKKER SR and JA COETZEE), pp. 343-350. Balkema, Rotterdam.
MÄCKEL R (1989): Age and constitution of flood plain deposits in the Engare Ondare drainage area, Kenya. Palaeoecology of Africa and the surrounding islands N° 20 (ed. K HEINE), pp. 79-86. Balkema, Rotterdam.

262
MÄCKEL R (1992): New 14C data of Kenya and their geomorphological and palaeoecological interpretation. Palaeoecology of Africa and the surrounding islands N° 23 (ed. K HEINE), pp. 117-128. Balkema, Rotterdam.
MADDOX G, GIBLIN JL and KIMAMBO IN (1996): Custodians of the land ecology and culture in the history of Tanzania. James Currey, London :.
MADELLA M, ALEXANDRE A and BALL T (2005): International Code for Phytolith Nomenclature 1.0. Annals of Botany 96(2), 253-260.
MAHANEY WC and SLOWPOKE RGVH (1991): Stratigraphy and geochemistry of a sequence of Quaternary palaeosols in the Lower Teleki Valley, Mount Kenya, East Africa - Implications for interregional correlations. Journal of Quaternary Science 6(3), 245-256.
MAHANEY WC (1992): Weathering and geochronology of a Quaternary paleosol sequence in Lower Teleki Valley, Mount Kenya. Catena 19(1), 99-118.
MAHER BA (1986): Characterisation of soils by mineral magnetic measurements. Physics of The Earth and Planetary Interiors 42(1-2), 76-92.
MALTHUS TR (1809): An essay on the principle of population, as it affects the future improvement of society. Roger Chew Weightman, Washington.
MANNING K, PELLING R, HIGHAM T, SCHWENNIGER J-L and FULLER DQ (2011): 4500-Year old domesticated pearl millet (Pennisetum glaucum) from the Tilemsi Valley, Mali: new insights into an alternative cereal domestication pathway. Journal of Archaeological Science 38(2), 312-322.
MARCHANT R (1997): Late Quaternary montane vegetation dynamics in Bwindi-Impenetrable Forest, Central Africa. PhD Dissertation. University of Hull, Hull.
MARCHANT R and TAYLOR D (1998): Dynamics of montane forest in central Africa during the late Holocene: a pollen-based record from western Uganda. The Holocene 8(4), 375-381.
MARCHANT R and TAYLOR D (2000): Pollen representivity of montane forest taxa in south-west Uganda. New Phytologist 146(3), 515-525.
MARCHANT R and HOOGHIEMSTRA H (2004): Rapid environmental change in African and South American tropics around 4000 years before present: a review. Earth-Science Reviews 66(3-4), 217-260.
MARCHANT R, MUMBI C, BEHERA S and YAMAGATA T (2007): The Indian Ocean dipole - the unsung driver of climatic variability in East Africa. African Journal of Ecology 45(1), 4-16.
MARCHANT R, FINCH J, KINYANJUI R, MUIRURI V, MUMBI C, PLATTS PJ and RUCINA S (2010): Palaeoenvironmental perspectives for sustainable development in East Africa. Climate of the Past Discussions 6(3), 963-1007.
MARSHALL F (1990): Origins of Specialized Pastoral Production in East Africa. American Anthropologist 92(4), 873-894.
MARSHALL F and HILDEBRAND E (2002): Cattle Before Crops: The Beginnings of Food Production in Africa. Journal of World Prehistory 16(2), 99-143-143-199-143-143.
MASUKI KFG and BAKUTI JM (1994): Soil Fertility Assessment for Five Villages in North Pare Mountains, Mwanga District, Kilimanjaro Region, Tanzania National Soil Service & TFAP.
MATTHEWS JA (1985): Radiocarbon dating of surface and buried soils: principles, problems and prospects. In Geomorphology and Soils (eds. KS RICHARDS, RR ARNETT and S ELLIS), pp. 269-288. Allen & Unwin, London.
MBEGU AC (1996): The Problems of Soil conservation and Rehabilitation Lessons from the HADO Project. In Changing Environments: Research on Man-Land Interrelations in Semi-Arid Tanzania. (eds. C CHRISTIANSSON and IS KIKULA). Regional Soil Conservation Unit Report N° 13, pp. 147-157. Regional Soil Conservation Unit & Swedish International Development Cooperation Agency (SIDA), Nairobi.
MBIDA MINDZIE C, DE LANGHE E, VRYDAGHS L, DOUTRELEPONT H, SWENNEN R, VAN NEER W and MARET PD (2006): Phytolith Evidence for the Early Presence of Domesticated Banana (Musa) in Africa. In Documenting domestication: new genetic and archaeological paradigms (ed. MA ZEDER), pp. 68-81. University of California Press.
MCCANN J (2001): Maize and Grace: History, Corn, and Africa's New Landscapes, 1500�1999. Comparative Studies in Society and History 43(2), 246-272.
MCCUNE B and MEFFORD MJ (1999): PC-ORD for Windows, MjM Software, Gleneden Beach. MCWILLIAM NC and PACKER MJ (1999): Climate of Mkomazi: variability and importance. In Mkomazi: The
Ecology, Biodiversity and Conservation of a Tanzanian Savanna (eds. MJ COE, NC MCWILLIAM, GN STONE and MJ PACKER), pp. 15-24. Royal Geographical Society (with The Institute of British Geographers), London.
MELILLO JM, ABER JD, LINKINS AE, RICCA A, FRY B and NADELHOFFER KJ (1989): Carbon and nitrogen dynamics along the decay continuum: Plant litter to soil organic matter. Plant and Soil 115(2), 189-198.
MEYER H (1890): Ostafrikanische Gletscherfahrten: Forschungsreisen im Kilimandscharo-Gebiet. Duncker & Humblot, Leipzig.
MILNE G (1935): Some suggested units of classification and mapping particularly for East African soils. Soil Research 4(3), 183-198.
MILNE G (1936a): A Provisional Soil Map of East Africa. 1:2,000,000, East African Agricultural Research Station, Amani.
263
MILNE G (1936b): Normal Erosion as a Factor in Soil Profile Development. Nature 138, 548-549. MILNE G (1937): Essays in applied pedology. I. Soil type and soil management in relation to plantation
agriculture in East Usambara. The East African Agricultural Journal 3, 7-20. MILNE G (1947): A Soil Reconnaissance Journey Through Parts of Tanganyika Territory December 1935 to
February 1936. Journal of Ecology 35(1/2), 192-265. MIRACLE MP (1963): Interpretation of Evidence on the Introduction of Maize into West Africa. Africa: Journal of
the International African Institute 33(2), 132-135. MIRACLE MP (1965): The Introduction and Spread of Maize in Africa. The Journal of African History 6(1), 39-55. MITTERMEIER RA, MYERS N, THOMSEN JB, DA FONSECA GAB and OLIVIERI S (1998): Biodiversity hotspots
and major tropical wilderness areas: approaches to setting conservation priorities. Cons. Biol. 12, 516-520. MOEYERSONS J (1988): The complex nature of creep movements on steeply sloping ground in Southern Rwanda.
Earth Surface Processes and Landforms 13(6), 511-524. MOEYERSONS J (1991): Ravine formation on steep slopes: Forward versus regressive erosion. Some case studies
from Rwanda. Catena 18(3-4), 309-324. MOEYERSONS J (2001): The palaeoenvironmental significance of Late Pleistocene and Holocene creep and other
geomorphic processes, Butare, Rwanda. Palaeoecology of Africa and the surrounding islands 27, 37-50. MOEYERSONS J (2003): The topographic thresholds of hillslope incisions in southwestern Rwanda. Catena 50(2-
4), 381-400. MONTGOMERY DR (2007): Soil erosion and agricultural sustainability. Proceedings of the National Academy of Sciences
104(33), 13268-13272. MOREAU RE (1933): Pleistocene Climatic Changes and the Distribution of Life in East Africa. Journal of Ecology
21(2), 415-435. MORGAN WTW (1961): East Africa. Soils. In East Africa: It's people and ressources. D.O.S. (Misc) 299G. 1:4,000,000,
Hawkins Ltd. & East African Literature Bureau, Nairobi. MORRISON RB (1978): Quaternary Soil Stratigraphy - Concepts, Methods, and Problems. In Quaternary Soils (ed.
WC MAHANEY), pp. 77-108. Geo Abstracts, Norwich. MSAKY ES, LIVINGSTONE D and DAVIS OK (2005): Paleolimnological investigations of anthropogenic
environmental change in Lake Tanganyika: V. Palynological evidence for deforestation and increased erosion. Journal of Paleolimnology 34(1), 73-83.
MUCHENA FN, ONDURU DD, GACHINI GN and DE JAGER A (2005): Turning the tides of soil degradation in Africa: capturing the reality and exploring opportunities. Land Use Policy 22(1), 23-31.
MULHOLLAND SC and RAPP GJ (1992): A Morphological Classification of Grass Silica-Bodies. In Phytolith Systematics: Emerging Issues (eds. GJ RAPP and SC MULHOLLAND). Advances in Archaeological and Museum Science N° 1 (eds. MJ AITKEN, EV SAYRE and RE TAYLOR), pp. 65-90. Plenum Press, New York.
MULLINS CE (1977): Magnetic Susceptibility of the soil and is significance in soil sience. A Review. European Journal of Soil Science 28(2), 223-246.
MUMBI CT, MARCHANT R, HOOGHIEMSTRA H and WOOLLER MJ (2008): Late Quaternary vegetation reconstruction from the Eastern Arc Mountains, Tanzania. Quaternary Research 69(2), 326-341.
MUMBI CT (2009): Late Quaternary vegetation reconstruction from the Eastern Arc Mountains, Tanzania. Ph.D. Dissertation. University of York, York.
MUNYIKWA K (2000): Cosmic ray contribution to environmental dose rates with varying overburden thickness. Ancient TL 18(2), 27-34.
MURRAY AS and WINTLE AG (2000): Luminescence dating of quartz using an improved single-aliquot regenerative-dose protocol. Radiation Measurements 32(1), 57-73.
MURRAY AS and WINTLE AG (2003): The single aliquot regenerative dose protocol: potential for improvements in reliability. Radiation Measurements 37(4-5), 377-381.
MUTAKYAHWA MKD, IKINGURA JR and MRUMA AH (2003): Geology and geochemistry of bauxite deposits in Lushoto District, Usambara Mountains, Tanzania. Journal of African Earth Sciences 36(4), 357-369.
MWIHOMEKE ST, MSANGI TH, MABULA CK, YLHÄISI J and MNDEME KCH (1998): Traditionally Protected Forests and Nature Conservation in the North Pare Mountains and Handeni District, Tanzania. Journal of East African Natural History 87(1), 279-290.
MWORIA MAITIMA J (1991): Vegetation response to climatic change in central Rift Valley, Kenya. Quaternary Research 35(2), 234-245.
MYERS N, MITTERMEIER RA, MITTERMEIER CG, DA FONSECA GAB and KENT J (2000): Biodiversity hotspots for conservation priorities. Nature 403(6772), 853-858.
NEUMANN K, FAHMY A, LESPEZ L, BALLOUCHE A and HUYSECOM E (2009): The Early Holocene palaeoenvironment of Ounjougou (Mali): Phytoliths in a multiproxy context. Palaeogeography, Palaeoclimatology, Palaeoecology 276(1-4), 87-106.
NEUMANN K and HILDEBRAND E (2009): Early Bananas in Africa: The state of the art. Ethnobotany Research & Applications 7, 353-362.
NEWMARK VWD (2002): Conserving Biodiversity in East African Forests: A Study of the Eastern Arc Mountains. Ecological Studies N° 155. Springer, Berlin.
264
NEWMARK WD (1998): Forest Area, Fragmentation, and Loss in the Eastern Arc Mountains: Implications For the Conservation of Biological Diversity. Journal of East African Natural History 87(1), 29-36.
NGOMANDA A, NEUMANN K, SCHWEIZER A and MALEY J (2009a): Seasonality change and the third millennium BP rainforest crisis in southern Cameroon (Central Africa). Quaternary Research 71(3), 307-318.
NGOMANDA A, CHEPSTOW-LUSTY A, MAKAYA M, FAVIER C, SCHEVIN P, MALEY J, . . . JOLLY D (2009b): Western equatorial African forest-savanna mosaics: a legacy of late Holocene climatic change? Clim. Past 5(4), 647-659.
NICHOLSON S and YIN X (2001): Rainfall Conditions in Equatorial East Africa during the Nineteenth Century as Inferred from the Record of Lake Victoria. Climatic Change 48(2), 387-398.
NICHOLSON SE and FLOHN H (1980): African environmental and climatic changes and the general atmospheric circulation in late pleistocene and holocene. Climatic Change 2(4), 313-348.
NICHOLSON SE (1996): A Review of Climate Dynamics and Climate Variability in Eastern Africa. In The Limnology, Climatology and Palaeoclimatology of the East African Lakes (eds. TC JOHNSON and EO ODADA), pp. 25-56. Gordon and Breach Science Publishers, Amsterdam.
NICHOLSON SE (2000): The nature of rainfall variability over Africa on time scales of decades to millenia. Global and Planetary Change 26(1-3), 137-158.
NYSSEN J, POESEN J, HAILE M, MOEYERSONS J and DECKERS J (2000): Tillage erosion on slopes with soil conservation structures in the Ethiopian highlands. Soil and Tillage Research 57(3), 115-127.
NYSSEN J, POESEN J, MOEYERSONS J, DECKERS J, HAILE M and LANG A (2004): Human impact on the environment in the Ethiopian and Eritrean highlands--a state of the art. Earth-Science Reviews 64(3-4), 273-320.
NYSSEN J, POESEN J and DECKERS J (2009): Land degradation and soil and water conservation in tropical highlands. Soil and Tillage Research 103(2), 197-202.
ODNER K (1971a): Usangi Hospital and other Archaeological Sites in the North Pare Mountains, North-eastern Tanzania. Azania 6, 89-130.
ODNER K (1971b): A Preliminary Report of an Archaeological Survey on the Slopes of Kilimanjaro. Azania 6, 131-150.
OGLE BR (2001): The need for socio-economic and environmental indicators to monitor degraded ecosystem rehabilitation: a case study from Tanzania. Agriculture,Ecosystems & Environment 87(2), 151-157.
OLDFIELD F (2007): Sources of fine-grained magnetic minerals in sediments: a problem revisited 10.1177/0959683607085135. The Holocene 17(8), 1265-1271.
OLLEY J, CAITCHEON G and MURRAY A (1998): The distribution of apparent dose as determined by Optically Stimulated Luminescence in small aliquots of fluvial quartz: Implications for dating young sediments. Quaternary Science Reviews 17(11), 1033-1040.
OLSSON IU (1991): Accuracy and precision in sediment chronology. Hydrobiologia 214(1), 25-34. ÖSTBERG W (1986): The Kondoa transformation: coming to grips with soil erosion in Central Tanzania. Nordiska
Afrikainstitutet, Uppsala. OWEN RB, BARTHELME JW, RENAUT RW and VINCENS A (1982): Palaeolimnology and archaeology of
Holocene deposits north-east of Lake Turkana, Kenya. Nature 298(5874), 523-529. PARTRIDGE TC, DEMENOCAL PB, LORENTZ SA, PAIKER MJ and VOGEL JC (1997): Orbital forcing of climate
over South Africa: A 200,000-year rainfall record from the pretoria saltpan. Quaternary Science Reviews 16(10), 1125-1133.
PAUSAS JG and KEELEY JE (2009): A Burning Story: The Role of Fire in the History of Life. BioScience 59(7), 593-601.
PAYTON RW, CHRISTIANSSON C, SHISHIRA EK, YANDA P and ERIKSSON MG (1992): Landform, Soils and Erosion in the North-Eastern Irangi Hills, Kondoa, Tanzania. Geografiska Annaler. Series A, Physical Geography 74(2/3), 65-79.
PAYTON RW and SHISHIRA EK (1994): Effects of Erosion and Sedimentation on Land Quality: Defining Pedogenetic Baselines in the Kondoa District of Tanzania. In Soi sience and sustainable land management in the tropics (eds. JK SYERS and DL RIMMER), pp. 88-119. CAB International, London.
PELLIKKA PKE, LÖTJÖNEN M, SILJANDER M and LENS L (2009): Airborne remote sensing of spatiotemporal change (1955-2004) in indigenous and exotic forest cover in the Taita Hills, Kenya. International Journal of Applied Earth Observation and Geoinformation 11(4), 221-232.
PHILLIPSON DW (1977): The later prehistory of Eastern and Southern Africa. Heinemann, London. PHILLIPSON DW (2005): African Archaeology. Cambridge world archaeology. Cambridge University Press,
Cambridge. PIMENTEL D, HARVEY C, RESOSUDARMO P, SINCLAIR K, KURZ D, MCNAIR M, . . . BLAIR R (1995):
Environmental and Economic Costs of Soil Erosion and Conservation Benefits. Science 267(5201), 1117-1123.
PIPERNO DR (2006): Phytoliths: A Comprehensive Guide for Archaeologists and Palaeoecologists. Altamira Press, Oxford.
265
PORAT N, DULLER GAT, AMIT R, ZILBERMAN E and ENZEL Y (2009): Recent faulting in the southern Arava, Dead Sea Transform: Evidence from single grain luminescence dating. Quaternary International 199(1-2), 34-44.
PRENTICE IC (1980): Multidimensional scaling as a research tool in quaternary palynology: A review of theory and methods. Review of Palaeobotany and Palynology 31, 71-104.
PRENTICE IC (1986): Multivariate methods for data analysis. In Handbook of Holocene Palaeoecology and Palaeohydrology (eds. BE BERGLUND and M RALSKA-JASIEWICZOWA), pp. 775-797. Wiley, Chichester.
PRESCOTT JR and HUTTON JT (1994): Cosmic ray contributions to dose rates for luminescence and ESR dating: Large depths and long-term time variations. Radiation Measurements 23(2-3), 497-500.
PYLE DM (1999): Widely dispersed Quaternary tephra in Africa. Global and Planetary Change 21(1-3), 95-112. RAINTREE JB and WARNER K (1986): Agroforestry pathways for the intensification of shifting cultivation.
Agroforestry Systems 4, 39-54. RAMSEY BC (1995): Radiocarbon calibration and analysis of stratigraphy: the OxCal program. Radiocarbon 37,
425-430. RAPP A, BERRY L and TEMPLE PH (1972a): Soil Erosion and Sedimentation in Tanzania. The Project. Geografiska
Annaler. Series A, Physical Geography 54(3/4), 105-109. RAPP A, AXELSSON V, BERRY L and MURRAY-RUST DH (1972b): Soil Erosion and Sediment Transport in the
Morogoro River Catchment, Tanzania. Geografiska Annaler. Series A, Physical Geography 54(3/4), 125-155. RAPP A (1972): Conclusions from the Duser Soil Erosion Project in Tanzania. Geografiska Annaler. Series A,
Physical Geography 54(3/4), 377-379. RAUNET M (1985): Les bas-fonds en Afrique et à Madagascar. In Dambos: small channelless valleys in the tropics (eds.
MF THOMAS and AS GOUDIE). Zeitschrift für Geomorphologie N° Suppl. 52, pp. 25-62. Gebrüder Borntraeger, Berlin.
RAYNOR GS, OGDEN EC and HAYES JV (1972): Dispersion and Deposition of Corn Pollen from Experimental Sources1. Agron. J. 64(4), 420-427.
REIJ C, SCOONES I and TOULMIN C (1996): Sustaining the soil. Earthscan Publ., London. REIMER PJ, BAILLIE MGL, BARD E, BAYLISS A, BECK JW, BLACKWELL PG, . . . WEYHENMEYER CE (2009):
IntCal09 and Marine09 radiocarbon age calibration curves, 0 - 50,000 years cal BP. Radiocarbon 51(4), 1111-1150.
RETALLACK GJ (1998): Core concepts of paleopedology. Quaternary International 51-52, 203-212. RETALLACK GJ (2001): Soils of the past. Wiley-Blackwell. RICHARDSON JL (1966): Changes in Level of Lake Naivasha, Kenya, during Postglacial Times. Nature 209(5020),
290-291. RICHARDSON JL and RICHARDSON AE (1972): History of an African Rift Lake and Its Climatic Implications.
Ecological Monographs 42(4), 499-534. RICHARDSON JL and DUSSINGER RA (1986): Paleolimnology of mid-elevation lakes in the Kenya Rift Valley.
Hydrobiologia 143(1), 167-174. ROBERTS N, TAIEB M, BARKER P, DAMNATI B, ICOLE M and WILLIAMSON D (1993): Timing of the Younger
Dryas event in East Africa from lake-level changes. Nature 366(6451), 146-148. ROBERTS RG, GALBRAITH RF, YOSHIDA H, LASLETT GM and OLLEY JM (2000): Distinguishing dose
populations in sediment mixtures: a test of single-grain optical dating procedures using mixtures of laboratory-dosed quartz. Radiation Measurements 32(5-6), 459-465.
ROBERTSHAW P and TAYLOR D (2000): Climate Change and the Rise of Political Complexity in Western Uganda. The Journal of African History 41(01), 1-28.
ROBERTSHAW P, TAYLOR D, DOYLE S and MARCHANT R (2005): Famine, Climate and Crisis in Western Uganda. In Past Climate Variability through Europe and Africa (eds. RW BATTARBEE, F GASSE and CE STICKLEY) N° 6, pp. 535-549. Springer, Dordrecht.
ROCKEL SJ (2006): Forgotten Caravan Towns in the 19th Century Tanzania: Mbwamaji and Mpwapwa. Azania 41, 1-25.
ROGERS DJ and RANDOLPH SE (1988): Tsetse Flies in Africa: Bane or Boon? Conservation Biology 2(1), 57-65. ROMMENS T, VERSTRAETEN G, PEETERS I, POESEN J, GOVERS G, VAN ROMPAEY A, . . . LANG A (2007):
Reconstruction of late-Holocene slope and dry valley sediment dynamics in a Belgian loess environment. The Holocene 17(6), 777-788.
RUCINA SM, MUIRURI VM, KINYANJUI RN, MCGUINESS K and MARCHANT R (2009): Late Quaternary vegetation and fire dynamics on Mount Kenya. Palaeogeography, Palaeoclimatology, Palaeoecology 283(1-2), 1-14.
RUCINA SM, MUIRURI VM, DOWNTON L and MARCHANT R (2010): Late-Holocene savanna dynamics in the Amboseli Basin, Kenya. The Holocene 20(5), 667-677.
RUCINA SM, VERSCHUREN D, GELORINI V and MARCHANT R (in prep.): Late-Holocene dynamics of savanna vegetation in the Mt. Kilimanjaro region of southern Kenya.
RUNDEL PW, EHLERINGER JR and NAGY KA (1989): Stable Isotopes in Ecological Research. Springer, New York.
266
RUNGE J (2001a): On the age of stone-lines and hillwash sediments in the eastern Congo basin - palaeoenvironmental implications. In Proceedings of the XVth Inqua Conference, Durban, South Arica. Palaeoecology of Africa and the surrounding islands N° 27 (eds. J RUNGE and K HEINE), pp. 19-36. Balkema, Lisse.
RUNGE J (2001b): Stable carboin isotope (d13C) analysis of alluvial sediments and Holocene environmental changes in the Mbari valley in the Southeast of the Central African Republic (CAR). Palaeoecology of Africa and the surrounding islands N° 27 (eds. J RUNGE and K HEINE), pp. 135-151. Balkema, Lisse.
RUNGE J (2008): Dynamics of forest ecosystems in Central Africa during the Holocene. Palaeoecology of Africa N° 28. Taylor & Francis, Leiden.
RUSSELL JM and JOHNSON TC (2005): A high-resolution geochemical record from Lake Edward, Uganda Congo and the timing and causes of tropical African drought during the late Holocene. Quaternary Science Reviews 24(12-13), 1375-1389.
RUSSELL JM and JOHNSON TC (2007): Little Ice Age drought in equatorial Africa: Intertropical Convergence Zone migrations and El Niño�Southern Oscillation variability. Geology 35(1), 21-24.
RUSSELL JM, VERSCHUREN D and EGGERMONT H (2007): Spatial complexity of �Little Ice Age� climate in East Africa: sedimentary records from two crater lake basins in western Uganda. The Holocene 17(2), 183-193.
RYNER M, HOLMGREN K and TAYLOR D (2007): A record of vegetation dynamics and lake level changes from Lake Emakat, northern Tanzania, during the last c. 1200 years. Journal of Paleolimnology 40(2), 583-601.
SAGE RF and MONSON RK (1999): C4 Plant Biology. Academic Press, San Diego, Calif. SAGGERSON EP (1972): East Africa: Geology. In East Africa: It´s peoples and ressources (ed. WTW MORGAN).
1:4000000, Oxford University Press, Nairobi. SAJI NH, GOSWAMI BN, VINAYACHANDRAN PN and YAMAGATA T (1999): A dipole mode in the tropical Indian
Ocean. Nature 401(6751), 360-363. SAMKI JK (1977): Provisional Soils Map of Tanzania. 1:2,000,000, Survey and Mapping Division, Dodoma. SANCHEZ PA (2002): Soil Fertility and Hunger in Africa. Science 295(5562), 2019-2020. SANGHA K and JALOTA R (2005): Value of Ecological Services of Exotic Eucalyptus tereticornis and Native
Dalbergia sissoo Tree Plantations of North-Western India. Conservat Soc 3(1), 92-109. SANTISTEBAN JI, MEDIAVILLA R, LÓPEZ-PAMO E, DABRIO CJ, ZAPATA MBR, GARCÍA MJG, . . . MARTÍNEZ-
ALFARO PE (2004): Loss on ignition: a qualitative or quantitative method for organic matter and carbonate mineral content in sediments? Journal of Paleolimnology 32(3), 287-299.
SCHABEL HG (1990): Tanganyika Forestry under German Colonial Administration, 1891-1919. Forest & Conservation History 34(3), 130-141.
SCHACHTSCHABEL P, BLUME H-P, BRÜMMER G, HARTGE KH and SCHWERTMANN U (1998): Lehrbuch der Bodenkunde. Ferdinand Enke Verlag, Stuttgart.
SCHARPENSEEL HW and SCHIFFMANN H (1977): Soil radiocarbon analysis and soil dating. Surveys in Geophysics 3(2), 143-156.
SCHLICHTING E, BLUME H-P and STAHR K (1995): Bodenkundliches Praktikum. 2 ed. Pareys Studientexte N° 81. Blackwell Wissenschafts-Verlag, Berlin.
SCHMIDT PR and CHILDS ST (1985): Innovation and Industry during the Early Iron Age in East Africa: The KM2 and KM3 Sites of Northwest Tanzania. The African Archaeological Review 3, 53-94.
SCHMIDT PR (1988): Eastern Expressions of the "Mwitu" tradition: Early Iron Age insdustry of the Usambara Mountains, Tanzania. Nyame Akuma 30, 36-37.
SCHMIDT PR (1989): Early Exploitation and Settlement in the Usambara Mountains. In Forest Conservation in the East Usambara Mountains, Tanzania (eds. AC HAMILTON and R BENSTED-SMITH). IUCN conservation library, pp. 75-78. The IUCN Tropical Forest Programme.
SCHMIDT PR (1997a): Iron technology in East Africa. Indiana Univ. Press, Bloomington. SCHMIDT PR (1997b): Archaeological Views on a History of Landscape Change in East Africa. The Journal of
African History 38(03), 393-421. SCHMITT A, DOTTERWEICH M, SCHMIDTCHEN G and BORK H-R (2003): Vineyards, hopgardens and recent
afforestation: effects of late Holocene land use change on soil erosion in northern Bavaria, Germany. CATENA 51(3-4), 241-254.
SCHNURRENBERGER D, RUSSELL J and KELTS K (2003): Classification of lacustrine sediments based on sedimentary components. Journal of Paleolimnology 29(2), 141-154.
SCHOENBRUN DL (1993a): We Are What We Eat: Ancient Agriculture between the Great Lakes. The Journal of African History 34(1), 1-31.
SCHOENBRUN DL (1993b): Cattle Herds and Banana Gardens: The Historical Geography of the Western Great Lakes Region, ca AD 800-1500. The African Archaeological Review 11(1), 39-72.
SCHOENBRUN DL (1998): A Green Place, a Good Place: Agrarian Change, Gender, and Social Identity in the Great Lakes Region to the 15th Century. Social history of Africa. James Curray, Oxford.
SCHWARTZ D, MARIOTTI A, LANFRANCHI R and GUILLET B (1986): 13C/12C Ratios of soil organic matter as indicators of vegetation changes in the Congo. Geoderma 39(2), 97-103.
267
SCHWARTZ D, DE FORESTA H, MARIOTTI A, BALESDENT J, MASSIMBA JP and GIRARDIN C (1996): Present Dynamics of the Savanna-Forest Boundary in the Congolese Mayombe: A Pedological, Botanical and Isotopic (13C and 14C) Study. Oecologia 106(4), 516-524.
SHEPPARD SC and ADDISON JA (2007): Soil Sample Handling and Storage. In Soil Sampling and Methods of Analysis (eds. MR CARTER and EG GREGORICH). CRC Press.
SHERIDAN MJ (2000): The Sacred Forests of North Pare, Tanzania: Indigenous conservation, local politics, and land tenure. Working Papers in African Studies No.224, African Studies Center, Boston.
SHERIDAN MJ (2001): Cooling the land: The political ecology of the North Pare Mountains, Tanzania. PhD Dissertation. Boston University, Boston.
SHERIDAN MJ (2002): An Irrigation Intake Is like a Uterus: Culture and Agriculture in Precolonial North Pare, Tanzania. American Anthropologist 104(1), 79-92.
SHERIDAN MJ (2004): The Environmental Consequences of Independence and Socialism in North Pare, Tanzania, 1961-88. The Journal of African History 45(1), 81-102.
SHERIFF A (1987): Slaves, spices & ivory in Zanzibar. Integration of an Eastern African commercial empire into the world economy, 1770-1873. Currey, London.
SHISHIRA EK and PAYTON RW (1996): The Causes and Effects of Accelerated Soil Erosion and Sedimentation in the Kondoa Eroded Area: Evidence from the Lake Haubi Basin, Kondoa District, Tanzania. In Changing Environments: Research on Man-Land Interrelations in Semi-Arid Tanzania. (eds. C CHRISTIANSSON and IS KIKULA). Regional Soil Conservation Unit Report N° 13. Regional Soil Conservation Unit & Swedish International Development Cooperation Agency (SIDA), Nairobi.
SHOWERS KB (2005): Imperial gullies: soil erosion and conservation in Lesotho. Ohio University Press. SIMONSON RW (1978): A Multiple-Process Model of Soil Genesis. In Quaternary Soils (ed. WC MAHANEY), pp. 1-
26. Geo Abstracts, Norwich. SMITH AB (1992): Origins and Spread of Pastoralism in Africa. Annual Review of Anthropology 21, 125-141. SMITH JP, FULLEN MA and TAVNER S (1990): Some Magnetic and Geochemical Properties of Soils Developed
on Triassic Substrates and their Use in the Characterization of Colluvium. In Soil Erosion on Agricultural Land (eds. J BOARDMAN, IDL FOSTER and JA DEARING). British Geomorphological Research Group Symposia Series, pp. 255-271. John Wiley & Sons, Chichester.
SMOLLA G (1957): Prähistorische Keramik aus Ostafrika. Tribus 6, 35-64. SOIL SURVEY STAFF (2003): Keys to Soil Taxonomy. 9th ed. United States Department of Agriculture & Natural
Resources Conservation Services. SOPER RC (1967a): Kwale: An Early Iron Age Site in South-Eastern Kenya. Azania 2, 1-17. SOPER RC (1967b): Iron Age Sites in North-Eastern Tanzania. Azania 2, 19-36. SOPER RC (1971a): A general Review of the Early Iron Age of the Southern Half of Africa. Azania 6, 5-38. SOPER RC (1971b): Early Iron Age Pottery Types from East Africa: Comparative Analysis. Azania 6, 39-52. SØRENSEN R (2001): Stratigraphy and formation of a Late Pleistocene colluvial apron in Morogoro district,
Central Tanzania. In Proceedings of the XVth Inqua Conference, Durban, South Arica. Palaeoecology of Africa and the surrounding islands N° 27 (eds. J RUNGE and K HEINE), pp. 95-116. Balkema, Lisse.
SSEMMANDA I, RYVES DB, BENNIKE O and APPLEBY PG (2005): Vegetation history in western Uganda during the last 1200 years: a sedimentbased reconstruction from two crater lakes. The Holocene 15(1), 119-132.
STAGER JC, MAYEWSKI PA and MEEKER LD (2002): Cooling cycles, Heinrich event 1, and the desiccation of Lake Victoria. Palaeogeography, Palaeoclimatology, Palaeoecology 183(1-2), 169-178.
STAGER JC, RYVES D, CUMMING BF, MEEKER LD and BEER J (2005): Solar variability and the levels of Lake Victoria, East Africa, during the last millenium. Journal of Paleolimnology 33(2), 243-251.
STAGER JC, COCQUYT C, BONNEFILLE R, WEYHENMEYER C and BOWERMAN N (2009): A late Holocene paleoclimatic history of Lake Tanganyika, East Africa. Quaternary Research 72(1), 47-56.
STEVERDING D (2008): The history of African trypanosomiasis. Parasites & Vectors 1(1), 3-3. STUHLMANN F (1894): Mit Emin Pascha ins Herz von Afrika. Reimer, Berlin. STUMP D (2006): The development and expansion of the field and irrigation systems at Engaruka, Tanzania.
Azania 41, 69-94. STUMP D and TAGSETH M (2009): The History of pre-Colonial and Early Colonial Agriculture on Mount
Kilimanjaro: A Review. In Culture, History and Identity: Landscapes of Inhabitation in the Mount Kilimanjaro Area, Tanzania (ed. TAR CLACK). BAR International Series, pp. 107-124. Archaeopress, Oxford.
STUMP D (2010): Intensification in Context: Archaeological Approaches to Precolonial Field Systems in Eastern and Southern Africa. African Studies 69(2), 255-255.
SULAS F, MADELLA M and FRENCH C (2009): State formation and water resources management in the Horn of Africa: the Aksumite Kingdom of the northern Ethiopian highlands. World Archaeology 41(1), 2-15.
SULAS F (2010): Environmental and cultural interplay in highland Ethiopia: Geoarchaeology at Aksum. University of Cambridge, Cambridge.
SUNSERI T (2007): The political ecology of the copal trade in the Tanzanian coastal hinterland, c. 1820�1905. The Journal of African History 48(02), 201-220.
268
SUTTON JEG (1966): The Archaeology and Early Peoples of the Highlands of Kenya and Northern Tanzania. Azania 1, 37-57.
SUTTON JEG (1984): Irrigation and Soil-Conservation in African Agricultural History with a Reconsideration of the Inyanga Terracing (Zimbabwe) and Engaruka Irrigation Works (Tanzania). The Journal of African History 25(1), 25-41.
SWETNAM TW, ALLEN CD and BETANCOURT JL (1999): Applied Historical Ecology: Using The Past To Manage For The Future. Ecological Applications 9(4), 1189-1206.
TAGSETH M (2008): The Expansion of Traditional Irrigation in Kilimanjaro, Tanzania. International Journal of African Historical Studies 41(3), 461-490.
TALBOT MR and LÆRDAL T (2000): The Late Pleistocene - Holocene palaeolimnology of Lake Victoria, East Africa, based upon elemental and isotopic analyses of sedimentary organic matter. Journal of Paleolimnology 23(2), 141-164.
TAYLOR D and MARCHANT R (1996): Human Impact in the Interlacustrine region: long-term pollen records from the Rukiga Highlands. Azania 29-30, 283-295.
TAYLOR D, MARCHANT RA and ROBERTSHAW P (1999): A sediment-based history of medium altitude forest in central Africa: a record from Kabata Swamp, Ndale volcanic field, Uganda. Journal of Ecology 87(2), 303-315.
TAYLOR D, ROBERTSHAW P and MARCHANT RA (2000): Environmental change and political-economic upheaval in precolonial western Uganda. The Holocene 10(4), 527-536.
TAYLOR D and ROBERTSHAW P (2001): Sedimentary sequences in western Uganda as records of human environmental impacts. Palaeoecology of Africa and the surrounding islands 27, 63-76.
TAYLOR DM (1990): Late quaternary pollen records from two Ugandan mires: evidence for environmental changes in the Rukiga Highlands of southwest Uganda. Palaeogeography, Palaeoclimatology, Palaeoecology 80(3-4), 283-300.
TAYLOR DM (1993): Environmental change in montane southwest Uganda: a pollen record for the Holocene from Ahakagyezi Swamp. The Holocene 3(4), 324-332.
TEMME AJAM, BAARTMAN JEM, BOTHA GA, VELDKAMP A, JONGMANS AG and WALLINGA J (2008): Climate controls on late Pleistocene landscape evolution of the Okhombe valley, KwaZulu-Natal, South Africa. Geomorphology 99(1-4), 280-295.
TEMPLE PH and MURRAY-RUST DH (1972): Sheet Wash Measurements on Erosion Plots at Mfumbwe, Eastern Uluguru Mountains, Tanzania. Geografiska Annaler. Series A, Physical Geography 54(3/4), 195-202.
TEMPLE PH (1972): Measurements of Runoff and Soil Erosion at an Erosion Plot Scale with Particular Reference to Tanzania. Geografiska Annaler. Series A, Physical Geography 54(3/4), 203-220.
TEMPLE PH and SUNDBORG Å (1972): The Rufiji River, Tanzania Hydrology and Sediment Transport. Geografiska Annaler. Series A, Physical Geography 54(3/4), 345-368.
TERWILLIGER VJ, ESHETU Z, COLMAN A, BEKELE T, GEZAHGNE A and FOGEL ML (2008): Reconstructing palaeoenvironment from δ13C and δ15N values of soil organic matter: A calibration from arid and wetter elevation transects in Ethiopia. Geoderma 147(3-4), 197-210.
THÉRY-PARISOT I, CHABAL L and CHRZAVZEZ J (2010): Anthracology and taphonomy, from wood gathering to charcoal analysis. A review of the taphonomic processes modifying charcoal assemblages, in archaeological contexts. Palaeogeography, Palaeoclimatology, Palaeoecology 291(1-2), 142-153.
THOMAS MF (1994): Geomorphology in the Tropics Study of Weathering and Denudation in Low Latitudes. Wiley, Chichester :.
THOMAS MF and THORP MB (1995): Geomorphic response to rapid climatic and hydrologic change during the late pleistocene and early holocene in the humid and sub-humid tropics. Quaternary Science Reviews 14(2), 193-207.
THOMAS MF and THORP MB (1996): The response of geomorphic systems to climatic and hydrological change during the Late Glacial and early Holocene in the humid and sub-humid tropics. Geological Society, London, Special Publications 115(1), 139-153.
THOMAS MF (2000): Late Quaternary environmental changes and the alluvial record in humid tropical environments. Quaternary International 72(1), 23-36.
THOMAS MF (2001a): Landscape sensitivity in time and space - an introduction. Catena 42(2-4), 83-98. THOMAS MF (2001b): On the age and signifcance of Quaternary colluvium in eastern Zambia. In Proceedings of the
XVth Inqua Conference, Durban, South Arica. Palaeoecology of Africa and the surrounding islands N° 27 (eds. J RUNGE and K HEINE), pp. 117-134. Balkema, Lisse.
THOMPSON LG, MOSLEY-THOMPSON E, DAVIS ME, HENDERSON KA, BRECHER HH, ZAGORODNOV VS, . . . BEER J (2002): Kilimanjaro Ice Core Records: Evidence of Holocene Climate Change in Tropical Africa. Science 298(5593), 589-593.
THOMPSON R and OLDFIELD F (1986): Environmental magnetism. Allen & Unwin, London. THORBAHN PF (1983): The precolonial ivory trade of East Africa: reconstruction of a human-elephant
ecosystem. Ph.D. Dissertation. Univ.Microfilms, Ann Arbor Michigan. TIERCELIN J, RENAUT RW, DELIBRIAS G, LE FOURNIER J and BIEDA S (1981): Late Pleistocene and Holocene
lake level fluctuations in the Lake Bogoria Basin, Northern Kenya Rift Valley. Palaeoecology of Africa and the
269
surrounding islands N° 13 (eds. JA COETZEE and EM VAN ZINDEREN BAKKER), pp. 105-120. Balkema, Rotterdam.
TIESZEN LL, SENYIMBA MM, SIMEON KI and TROUGHTON JH (1979): The Distribution of C3 and C4 Grasses and Carbon Isotope Discrimination along an Altitudinal and Moisture Gradient in Kenya. Oecologia 37(3), 337-350.
TIFFEN M, MORTIMORE M and GICHUKI F (1994): More people, less erosion. Wiley, Chichester. TOOTH S, BRANDT D, HANCOX PJ and MCCARTHY TS (2004): Geological controls on alluvial river behaviour: a
comparative study of three rivers on the South African Highveld. Journal of African Earth Sciences 38(1), 79-97.
TROELS-SMITH JA (1955): Karakterisering af lose jordarter. Characterization of unconsolidated sediments. Geological Survey of Denmark Series IV, N° 3. C. A. Reitzel, Kopenhagen.
TWISS PC, SUESS E and SMITH RM (1969): Morphological Classification of Grass Phytoliths1. Soil Sci. Soc. Am. J. 33(1), 109-115.
TWISS PC (1992): Predicted World Distribution of C3 and C4 Grass Phytoliths. In Phytolith Systematics: Emerging Issues (eds. GJ RAPP and SC MULHOLLAND). Advances in Archaeological and Museum Science N° 1 (eds. MJ AITKEN, EV SAYRE and RE TAYLOR), pp. 113-128. Plenum Press, New York.
VAN DER MERWE NJ and TSCHAUNER H (1999): C4 Plants and the Development of Human Societies. In C4 Plant Biology (eds. RF SAGE and RK MONSON), pp. 509-550. Academic Press, San Diego.
VAN OOST K, GOVERS G, DE ALBA S and QUINE TA (2006): Tillage erosion: a review of controlling factors and implications for soil quality. Progress in Physical Geography 30(4), 443-466.
VEGAS-VILARRÚBIA T, RULL V, MONTOYA E and SAFONT E (2011): Quaternary palaeoecology and nature conservation: a general review with examples from the neotropics. Quaternary Science Reviews 30(19-20), 2361-2388.
VERARDO DJ (1997): Charcoal Analysis in Marine Sediments. Limnology and Oceanography 42(1), 192-197. VERSCHUREN D (1999): Sedimentation controls on the preservation and time resolution of climate-proxy records
from shallow fluctuating lakes. Quaternary Science Reviews 18(6), 821-837. VERSCHUREN D, LAIRD KR and CUMMING BF (2000): Rainfall and drought in equatorial east Africa during the
past 1,100 years. Nature 403(6768), 410-414. VERSCHUREN D (2001): Reconstructing fluctuations of a shallow East African lake during the past 1800 yrs from
sediment stratigraphy in a submerged crater basin. Journal of Paleolimnology 25(3), 297-311. VERSCHUREN D, SINNINGHE DAMSTE JS, MOERNAUT J, KRISTEN I, BLAAUW M, FAGOT M and HAUG GH
(2009): Half-precessional dynamics of monsoon rainfall near the East African Equator. Nature 462(7273), 637-641.
VINCENS A, WILLIAMSON D, THEVENON F, TAIEB M, BUCHET G, DECOBERT M and THOUVENY N (2003): Pollen-based vegetation changes in southern Tanzania during the last 4200 years: climate change and/or human impact. Palaeogeography, Palaeoclimatology, Palaeoecology 198(3-4), 321-334.
VÖLKEL J (1995): Periglaziale Deckschichten und Böden im Bayerischen Wald und seinen Randgebieten als geogene Grundlagen landschaftsökologischer Forschung im Bereich naturnaher Waldstandorte. Borntraeger, Berlin.
VOLLESEN K, ABDALLAH R, COE MJ and MBOYA E (1999): Checklist: Vascular plants and pteridophytes of Mkomazi. In Mkomazi: The Ecology, Biodiversity and Conservation of a Tanzanian Savanna (eds. M COE, N MCWILLIAM, G STONE and M PACKER), pp. 81-116. Royal Geographical Society (with The Institute of British Geographers), London.
VON DER DECKEN CC (1869): Reisen in Ost-Afrika in den Jahren 1859 bis 1865. C.F. Winter'sche Verlagshandlung, Leipzig.
VON HELLERMANN P (2010): Black wattle, eucalyptus, pine: colonial tree planting and its legacies in the South Pare Mountains, Tanzania. Paper presented at 79th Anglo American Conference of Historians, 1st & 2nd July 2010, London.
WALKER PH, BECKMANN GG and BREWER R (1984): Definition and use of the term �pedoderm�. Journal of Soil Science 35(3), 505-510.
WALLINGA J (2002): On the detection of OSL age overestimation using Single-Aliquot Techniques. Geochronometria 21, 17-26.
WALZ JR (2010): Route to a regional past: An archaeology of the Lower Pangani (Ruvu) Basin, Tanzania, 500-1900 C.E. Ph.D. Dissertation. University of Florida.
WANG Y, AMUNDSON R and TRUMBORE S (1996): Radiocarbon Dating of Soil Organic Matter. Quaternary Research 45(3), 282-288.
WARDELL DA (1991): Proposal for a natural forest conservation and management programme in the North Pare mountains, Mwanga District, Kilimanjaro Region, Tanzania, TFAP, BAFMP, GTZ/IBD.
WEBSTER JB (1979): Chronolgy, Migration and Draught in Interlacustrine Africa. Dalhousie African Study Series. Longman, London.
WESTERBERG L-O and CHRISTIANSSON C (1999): Highlands in East Africa: Unstable Slopes, Unstable Environments? Ambio 28(5), 419-429.
270
WESTERBERG L-O, HOLMGREN K, BÖRJESON L, HÅKANSSON TN, LAULUMAA V, RYNER MA and ÖBERG H (2010): The development of the ancient irrigation system at Engaruka, northern Tanzania: physical and societal factors. The Geographical Journal 176(4), 304-318.
WHITE ACA (1949): Maize names as indicators of economic contacts. Uganda Journal 13, 61-81. WHITE F (1983): The vegetation of Africa. Natural resources research. UNESCO, Paris. WIDGREN M and SUTTON JEG (2004): Islands of intensive agriculture in Eastern Africa: past and present.
Kulturgeografiska Institutionen : Meddelande / B N° 121. British Institut in Eastern Africa, Nairobi. WIDGREN M (in press): Landscape research in a world of domesticated landscapes: The role of values, theory,
and concepts. Quaternary International. WILLIAMS M, TALBOT M, AHARON P, ABDL SALAAM Y, WILLIAMS F and INGE BRENDELAND K (2006): Abrupt
return of the summer monsoon 15,000 years ago: new supporting evidence from the lower White Nile valley and Lake Albert. Quaternary Science Reviews 25(19-20), 2651-2665.
WILLIS KJ, GILLSON L and BRNCIC TM (2004): How "Virgin" Is Virgin Rainforest? Science 304(5669), 402-403. WINKLER MG (1985): Charcoal analysis for paleoenvironmental interpretation: A chemical assay. Quaternary
Research 23(3), 313-326. WINTER JC (1992): 175 years of Language Shifts in Gweno. In Language Death: Factual and Theoretical Explorations
with Special Reference to East Africa. (ed. M BRENZINGER), pp. 285-298. Moulton de Gruyter, New York. WINTLE AG and MURRAY AS (2000): Quartz OSL: Effects of thermal treatment and their relevance to
laboratory dating procedures. Radiation Measurements 32(5-6), 387-400. WINTLE AG and MURRAY AS (2006): A review of quartz optically stimulated luminescence characteristics and
their relevance in single-aliquot regeneration dating protocols. Radiation Measurements 41(4), 369-391. WRIGHT DK (2004): Results of recent archaeological work in Tsavo East National Park, Kenya. Nyama Akuma
61, 39-41. WRIGHT DK (2005): New Perspectives on Early Regional Interaction Networks of East African Trade: A View
from Tsavo National Park, Kenya. African Archaeological Review 22(3), 111-140. WRIGLEY C (1997): The Periplus and Related Matters. Azania: Archaeological Research in Africa 32(1), 112-112. WYNN JG (2007): Carbon isotope fractionation during decomposition of organic matter in soils and paleosols:
Implications for paleoecological interpretations of paleosols. Palaeogeography, Palaeoclimatology, Palaeoecology 251(3-4), 437-448.
WYNNE-JONES S (2010): Lines of Desire: Power and Materiality Along a Tanzanian Caravan Route. Journal of World Prehistory 23(4), 219-237.
YAMAGATA T, BEHERA SK, RAO SA, GUAN Z, ASHOK K and SAJI HN (2003): Comments on �Dipoles, Temperature Gradients, and Tropical Climate Anomalies�. Bulletin of the American Meteorological Society 84(10), 1418-1422.
YANDA PZ (2000): Use of soil horizons for assessing soil degradation and reconstructing chronology of degradation processes: the case of Mwisanga Catchment, Kondoa, central Tanzania. Geomorphology 34(3-4), 209-225.
YLHÄISI J (2004): Indigenous forests fragmentation and the signifi cance of ethnic forests for conservation in the North Pare, the Eastern Arc Mountains, Tanzania. Fennia 182(2), 109-132.
ZECH M (2006): Evidence for Late Pleistocene climate changes from buried soils on the southern slopes of Mt. Kilimanjaro, Tanzania. Palaeogeography, Palaeoclimatology, Palaeoecology 242(3-4), 303-312.
ZECH M, LEIBER K, ZECH W, POETSCH T and HEMP A (in press): Late Quaternary soil genesis and vegetation history on the northern slopes of Mt. Kilimanjaro, East Africa. Quaternary International.
ZOLITSCHKA B, BEHRE K-E and SCHNEIDER J (2003): Human and climatic impact on the environment as derived from colluvial, fluvial and lacustrine archives--examples from the Bronze Age to the Migration period, Germany. Quaternary Science Reviews 22(1), 81-100.