A pragmatic approach for soil erosion risk assessment within policy hierarchies
13
Author's personal copy Land Use Policy 27 (2010) 997–1009 Contents lists available at ScienceDirect Land Use Policy journal homepage: www.elsevier.com/locate/landusepol A pragmatic approach for soil erosion risk assessment within policy hierarchies Martin Volk a , Markus Möller b,∗ , Daniel Wurbs b a UFZ - Helmholtz Center for Environmental Research, Department of Computational Landscape Ecology, Permoserstr. 15, 04318 Leipzig, Germany b Geoflux GbR, Lessingstr. 37, 06114 Halle (Saale), Germany 1 article info Article history: Received 30 May 2009 Received in revised form 3 December 2009 Accepted 8 December 2009 Keywords: Soil erosion Soil protection Scales Processes Models Agricultural policy abstract This paper presents a methodological framework for scale-specific assessment of soil erosion by water. The framework enables the definition of hierarchical, functional and modular nested reference units which result from the integrated consideration of policy, process and model hierarchies. The framework is applied on three planning levels: at first, large scale zones are designated that show a defined risk potential for soil erosion (first level: catchments and drainage areas in the German Federal State of Saxony-Anhalt, ca. 20,000 km 2 ). By both increasing model complexity and spatio-temporal resolution of input data, the results are locally specified within these risk zones (second level: designated farms and fields in a study area of 141 km 2 ). This is the basis for the prediction of soil erosion areas and sediment transport to hydrologic drainage networks as well as for small scale management and measure planning (third level: designated field blocks in the study area). On this level, the mitigation of soil erosion and sediment entry to the river system is demonstrated by simulating the introduction of conservation management practices, vegetation and riparian buffer strips. We used a modified version of the empirical Universal Soil Loss Equation (USLE) ABAGflux, which includes functions to better describe sedimentation and sediment transport to hydrologic drainage networks. Aggregation and statistical methods like SICOM and k means cluster analysis were applied for objective ranking and classification of the simulation results. The study aims at contributing to an improved applicability of data and methods for the assessment of soil erosion by water and soil protec- tion on relevant planning scales. In addition, the results are considered to be important for an improved transfer of methods developed in science to their application in soil erosion risk management. © 2010 Elsevier Ltd. All rights reserved. Introduction An estimated 115 million ha or 12% of Europe’s total land area are subject to water erosion (CEC, 2006), leading to losses of about 53 Euro per hectare and year in agricultural areas. The main problems for soils in the European Union are contamination and losses due to increasing soil erosion (Boardman and Poesen, 2006). It is widely believed that Europe’s soil resource will con- tinue to deteriorate, probably as a result of changes in climate, land use – including the increased cultivation of energy plants – and human activities in general (Gobin et al., 2004; Tóth et al., 2007). In Germany, an average soil loss of 5.5 t ha −1 yr −1 for arable land under the present soil management conditions is estimated (Auerswald, 2006) exceeding the assumed average annual soil for- mation rate of about 0.3–1.5 t ha −1 yr −1 (LUBW, 1995). Processes of soil erosion by water are the result of a disturbance of the bal- ∗ Corresponding author. Tel.: +49 345 1352244; fax: +49 345 2394019. E-mail address: moeller@geoflux.de (M. Möller). 1 http://www.geoflux.de. ance between climate, terrain and land use (Herz, 1973, 1980). Soil erosion is a natural process. However, erosion is often accel- erated by conflicts between agricultural production goals and soil health goals (Schmidt and Petry, 2005). Erosion reduces on-farm soil productivity and contributes to water quality problems as it causes the accumulation of sediments and agrochemicals in water- ways. Prolonged erosion causes soil loss over time, and reduces soil ecological functions such as biomass production and filtering capacity (Gobin et al., 2004). Many planning and management the- ories and formulas have been developed in order to reduce soil loss from landscapes and river basins and, as a consequence, sediment transport to hydrologic drainage networks and reservoirs (Amore et al., 2004). Fullen (2003) suggests soil conservation services in Europe (similar to the US) and that “a participatory approach to soil conservation should be adopted, involving farmers and inter- ested members of the public, and there should be a cost-share partnership between government and farmers in funding conser- vation work on farms”. All these suggestions and effects make clear that soil and water protection have to be considered together; the connection of land at risk of soil erosion to rivers has to be taken into account as a potential source of water pollution. Hence this 0264-8377/$ – see front matter © 2010 Elsevier Ltd. All rights reserved. doi:10.1016/j.landusepol.2009.12.011
-
Upload
independent -
Category
Documents
-
view
1 -
download
0
Transcript of A pragmatic approach for soil erosion risk assessment within policy hierarchies

Author's personal copy
Land Use Policy 27 (2010) 997–1009
Contents lists available at ScienceDirect
Land Use Policy
journa l homepage: www.e lsev ier .com/ locate / landusepol
A pragmatic approach for soil erosion risk assessment within policy hierarchies
Martin Volka, Markus Möllerb,∗, Daniel Wurbsb
a UFZ - Helmholtz Center for Environmental Research, Department of Computational Landscape Ecology, Permoserstr. 15, 04318 Leipzig, Germanyb Geoflux GbR, Lessingstr. 37, 06114 Halle (Saale), Germany1
a r t i c l e i n f o
Article history:Received 30 May 2009Received in revised form 3 December 2009Accepted 8 December 2009
Keywords:Soil erosionSoil protectionScalesProcessesModelsAgricultural policy
a b s t r a c t
This paper presents a methodological framework for scale-specific assessment of soil erosion by water.The framework enables the definition of hierarchical, functional and modular nested reference unitswhich result from the integrated consideration of policy, process and model hierarchies. The framework isapplied on three planning levels: at first, large scale zones are designated that show a defined risk potentialfor soil erosion (first level: catchments and drainage areas in the German Federal State of Saxony-Anhalt,ca. 20,000 km2). By both increasing model complexity and spatio-temporal resolution of input data, theresults are locally specified within these risk zones (second level: designated farms and fields in a studyarea of 141 km2). This is the basis for the prediction of soil erosion areas and sediment transport tohydrologic drainage networks as well as for small scale management and measure planning (third level:designated field blocks in the study area). On this level, the mitigation of soil erosion and sediment entry tothe river system is demonstrated by simulating the introduction of conservation management practices,vegetation and riparian buffer strips.
We used a modified version of the empirical Universal Soil Loss Equation (USLE) ABAGflux, whichincludes functions to better describe sedimentation and sediment transport to hydrologic drainagenetworks. Aggregation and statistical methods like SICOM and k means cluster analysis were appliedfor objective ranking and classification of the simulation results. The study aims at contributing to animproved applicability of data and methods for the assessment of soil erosion by water and soil protec-tion on relevant planning scales. In addition, the results are considered to be important for an improvedtransfer of methods developed in science to their application in soil erosion risk management.
© 2010 Elsevier Ltd. All rights reserved.
Introduction
An estimated 115 million ha or 12% of Europe’s total landarea are subject to water erosion (CEC, 2006), leading to lossesof about 53 Euro per hectare and year in agricultural areas. Themain problems for soils in the European Union are contaminationand losses due to increasing soil erosion (Boardman and Poesen,2006). It is widely believed that Europe’s soil resource will con-tinue to deteriorate, probably as a result of changes in climate,land use – including the increased cultivation of energy plants –and human activities in general (Gobin et al., 2004; Tóth et al.,2007). In Germany, an average soil loss of 5.5 t ha−1 yr−1 for arableland under the present soil management conditions is estimated(Auerswald, 2006) exceeding the assumed average annual soil for-mation rate of about 0.3–1.5 t ha−1 yr−1 (LUBW, 1995). Processesof soil erosion by water are the result of a disturbance of the bal-
∗ Corresponding author. Tel.: +49 345 1352244; fax: +49 345 2394019.E-mail address: [email protected] (M. Möller).
1 http://www.geoflux.de.
ance between climate, terrain and land use (Herz, 1973, 1980).Soil erosion is a natural process. However, erosion is often accel-erated by conflicts between agricultural production goals and soilhealth goals (Schmidt and Petry, 2005). Erosion reduces on-farmsoil productivity and contributes to water quality problems as itcauses the accumulation of sediments and agrochemicals in water-ways. Prolonged erosion causes soil loss over time, and reducessoil ecological functions such as biomass production and filteringcapacity (Gobin et al., 2004). Many planning and management the-ories and formulas have been developed in order to reduce soil lossfrom landscapes and river basins and, as a consequence, sedimenttransport to hydrologic drainage networks and reservoirs (Amoreet al., 2004). Fullen (2003) suggests soil conservation services inEurope (similar to the US) and that “a participatory approach tosoil conservation should be adopted, involving farmers and inter-ested members of the public, and there should be a cost-sharepartnership between government and farmers in funding conser-vation work on farms”. All these suggestions and effects make clearthat soil and water protection have to be considered together; theconnection of land at risk of soil erosion to rivers has to be takeninto account as a potential source of water pollution. Hence this
0264-8377/$ – see front matter © 2010 Elsevier Ltd. All rights reserved.doi:10.1016/j.landusepol.2009.12.011
Author's personal copy
998 M. Volk et al. / Land Use Policy 27 (2010) 997–1009
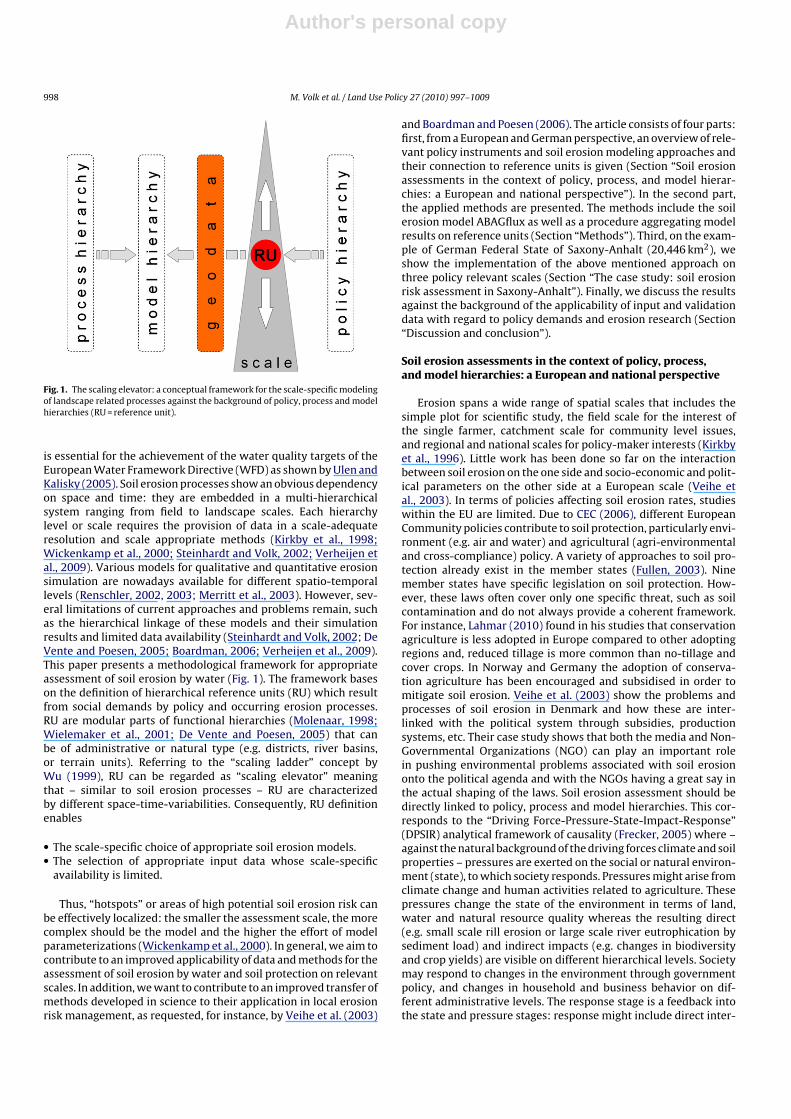
Fig. 1. The scaling elevator: a conceptual framework for the scale-specific modelingof landscape related processes against the background of policy, process and modelhierarchies (RU = reference unit).
is essential for the achievement of the water quality targets of theEuropean Water Framework Directive (WFD) as shown by Ulen andKalisky (2005). Soil erosion processes show an obvious dependencyon space and time: they are embedded in a multi-hierarchicalsystem ranging from field to landscape scales. Each hierarchylevel or scale requires the provision of data in a scale-adequateresolution and scale appropriate methods (Kirkby et al., 1998;Wickenkamp et al., 2000; Steinhardt and Volk, 2002; Verheijen etal., 2009). Various models for qualitative and quantitative erosionsimulation are nowadays available for different spatio-temporallevels (Renschler, 2002, 2003; Merritt et al., 2003). However, sev-eral limitations of current approaches and problems remain, suchas the hierarchical linkage of these models and their simulationresults and limited data availability (Steinhardt and Volk, 2002; DeVente and Poesen, 2005; Boardman, 2006; Verheijen et al., 2009).This paper presents a methodological framework for appropriateassessment of soil erosion by water (Fig. 1). The framework baseson the definition of hierarchical reference units (RU) which resultfrom social demands by policy and occurring erosion processes.RU are modular parts of functional hierarchies (Molenaar, 1998;Wielemaker et al., 2001; De Vente and Poesen, 2005) that canbe of administrative or natural type (e.g. districts, river basins,or terrain units). Referring to the “scaling ladder” concept byWu (1999), RU can be regarded as “scaling elevator” meaningthat – similar to soil erosion processes – RU are characterizedby different space-time-variabilities. Consequently, RU definitionenables
• The scale-specific choice of appropriate soil erosion models.• The selection of appropriate input data whose scale-specific
availability is limited.
Thus, “hotspots” or areas of high potential soil erosion risk canbe effectively localized: the smaller the assessment scale, the morecomplex should be the model and the higher the effort of modelparameterizations (Wickenkamp et al., 2000). In general, we aim tocontribute to an improved applicability of data and methods for theassessment of soil erosion by water and soil protection on relevantscales. In addition, we want to contribute to an improved transfer ofmethods developed in science to their application in local erosionrisk management, as requested, for instance, by Veihe et al. (2003)
and Boardman and Poesen (2006). The article consists of four parts:first, from a European and German perspective, an overview of rele-vant policy instruments and soil erosion modeling approaches andtheir connection to reference units is given (Section “Soil erosionassessments in the context of policy, process, and model hierar-chies: a European and national perspective”). In the second part,the applied methods are presented. The methods include the soilerosion model ABAGflux as well as a procedure aggregating modelresults on reference units (Section “Methods”). Third, on the exam-ple of German Federal State of Saxony-Anhalt (20,446 km2), weshow the implementation of the above mentioned approach onthree policy relevant scales (Section “The case study: soil erosionrisk assessment in Saxony-Anhalt”). Finally, we discuss the resultsagainst the background of the applicability of input and validationdata with regard to policy demands and erosion research (Section“Discussion and conclusion”).
Soil erosion assessments in the context of policy, process,and model hierarchies: a European and national perspective
Erosion spans a wide range of spatial scales that includes thesimple plot for scientific study, the field scale for the interest ofthe single farmer, catchment scale for community level issues,and regional and national scales for policy-maker interests (Kirkbyet al., 1996). Little work has been done so far on the interactionbetween soil erosion on the one side and socio-economic and polit-ical parameters on the other side at a European scale (Veihe etal., 2003). In terms of policies affecting soil erosion rates, studieswithin the EU are limited. Due to CEC (2006), different EuropeanCommunity policies contribute to soil protection, particularly envi-ronment (e.g. air and water) and agricultural (agri-environmentaland cross-compliance) policy. A variety of approaches to soil pro-tection already exist in the member states (Fullen, 2003). Ninemember states have specific legislation on soil protection. How-ever, these laws often cover only one specific threat, such as soilcontamination and do not always provide a coherent framework.For instance, Lahmar (2010) found in his studies that conservationagriculture is less adopted in Europe compared to other adoptingregions and, reduced tillage is more common than no-tillage andcover crops. In Norway and Germany the adoption of conserva-tion agriculture has been encouraged and subsidised in order tomitigate soil erosion. Veihe et al. (2003) show the problems andprocesses of soil erosion in Denmark and how these are inter-linked with the political system through subsidies, productionsystems, etc. Their case study shows that both the media and Non-Governmental Organizations (NGO) can play an important rolein pushing environmental problems associated with soil erosiononto the political agenda and with the NGOs having a great say inthe actual shaping of the laws. Soil erosion assessment should bedirectly linked to policy, process and model hierarchies. This cor-responds to the “Driving Force-Pressure-State-Impact-Response”(DPSIR) analytical framework of causality (Frecker, 2005) where –against the natural background of the driving forces climate and soilproperties – pressures are exerted on the social or natural environ-ment (state), to which society responds. Pressures might arise fromclimate change and human activities related to agriculture. Thesepressures change the state of the environment in terms of land,water and natural resource quality whereas the resulting direct(e.g. small scale rill erosion or large scale river eutrophication bysediment load) and indirect impacts (e.g. changes in biodiversityand crop yields) are visible on different hierarchical levels. Societymay respond to changes in the environment through governmentpolicy, and changes in household and business behavior on dif-ferent administrative levels. The response stage is a feedback intothe state and pressure stages: response might include direct inter-
Author's personal copy
M. Volk et al. / Land Use Policy 27 (2010) 997–1009 999
ventions in the environment, such as cleaning up a river (responseinfluences state), or changing tax incentives to promote an environ-mental adapted agricultural practice (response influences pressure,pressure influences state). Research institutions and engineeringcompanies react to the arising demands by the development ofmodels that try to simulate the processes on different hierarchi-cal levels. The results of these simulations can be used to deriveoptions for soil protection measures for politicians and authori-ties (Renschler, 2002; Frielinghaus and Funk, 2003; Gobin et al.,2004).
Policy hierarchy
Policy instruments related to soil protection in Germany con-centrate on regulation of land management practices and oneconomic incentives, mostly in the frame of the EU CommonAgricultural Policy (CAP) second pillar measures. The CAP mid-term review (CEC, 2002) foresees an increased level of integrationof environmental measures. The CAP maintains and introducesa set of soil conservation measures. Sustainable developmentmeasures such as erosion and flood prevention fall under theregional and agricultural structural funds. Against the backgroundof the European agricultural support, main issue of the CAPreform is a sanction mechanism that is based on the “coupling”of direct or compensation payments to the farmers with “pub-lic goods” (cross-compliance, good agricultural and environmentalconditions). The regulation of land management practices takesso-called “best management practices in agriculture” (BMP) asreference, as defined in the “Bundesnaturschutzgesetz” (FederalNature Conservation Act), the “Bundesbodenschutzgesetz” (Fed-eral Soil Protection Act, FSPA) and regulations at Federal and Statelevel referring to fertilizer application rates and crop protection.The definition of “best management practice” provides targets andguidelines for what the society considers as sustainable agriculturalland use with the aim of shaping the relation between agricul-ture, nature conservation and landscape planning (Deumlich et al.,2006a). Additionally, incentive policy measures such as the agri-environmental programs are increasingly conceived as means toensure and remunerate the production of non-commodities suchas the protection of abiotic and biotic natural resources and main-tenance of infrastructures and attractive locations in rural areas(Schmidt and Petry, 2005; Rossing et al., 2007). Both CAP andFSPA address the farm and field level. While the CAP follows amarket-oriented approach that aims to strengthen soil protectionby financial support (Rothstein, 2003), FSPA defines regulations ofsoil-related precaution and hazard prevention (Fullen et al., 2006).
Another important legal guideline of the German soil protectionis connected with the EU Water Framework Directive (WFD; Volket al., 2008, 2009). The WFD aims at safeguarding ecological, quali-tative and quantitative functions of water, and focuses on remedialactions within river basin management plans (EU, 2003). The gen-eral objective of the WFD is to achieve a good ecological statusin all water bodies (rivers, lakes, groundwater, coastal waters) ofthe member countries of the European Union by 2015. One of thefundamental improvements of the WFD in Germany is the use ofriver basins and/or drainage areas as reference units. A key com-ponent of the WFD is the development of river basin managementplans which set the actions required within each river basin and/ordrainage area units to achieve set environmental quality objectives.Within the process of the management planning the characteriza-tion of the river basin (including an inventory of surface ecosystemsand surface water bodies with which the groundwater body isconnected) plays a major role, because already in this early stagedecisions are made about which spatial and ecological-economicmeasures for water bodies are relevant or significant to the WFD.
The criteria for the identification of the pressure and the evaluationof the impacts (significance criteria) are categorized in Appendix IIof the WFD. A clear reference to the agricultural use of soils showsnon-point source discharge (nutrient, pesticide and heavy metalentry) and phosphorus loads that can be closely linked to processesof soil erosion.
LAWA (2002) and EU (2003) assume that the objective of theWFD can only be achieved with changes of the present agri-cultural practice. Synergy effects are expected especially fromWFD, CAP and BMP which should lead (i) to a closer relation-ship between agri-enviromental and other promotion measures,(ii) to an improvement of the agricultural advice activities and (iii)to a more forceful and stringent BMP implementation. Althoughthe WFD defines only one report scale level of 1:500,000 weconsider the definition of suitable scale level necessary where pro-tection measures and management actions occur (Volk et al., 2008).That means that soil erosion processes are embedded in a hier-archical multi-functional system in which reference units (here:river basins, drainage areas) and legal-administrative scopes (here:farms, fields) interfere with each other. This requires the develop-ment of scale-specific tools for the investigation of the ecologicalsituation in hierarchical reference units and of the effects of waterand soil protection measures.
Process and model hierarchy
The processes of soil erosion follow the organization princi-ples of hierarchical systems. The same soil erosion factors takeeffect on each abstraction level. However, the importance of thesingle factors for the soil erosion processes changes with the dif-ferent scale levels (Steinhardt and Volk, 2003; Verheijen et al.,2009).
Falkenmark and Rockström (2004) give an example for that:“The water causing the erosion often originates in overland runoffproduced on degraded land upgradient where the soil surface haslow permeability. Runoff will start at the micro-scale as sheet flow,and accumulate into rill flow on small areas within a field (<1 ha).Rills will aggregate into small gullies in a small catchment (gener-ally < 5 ha), which then merge into major gullies at the catchmentlevel”. Consequently, scaling up or down of erosion rates is impos-sible (Verheijen et al., 2009), but methods to simulate erosion aswell as the measures to prevent soil erosion have to adapt to thedifferent conditions of these different scales. In spite of the often-times existing lack of suitable data and methods for these relevantscales, scientists and environmental managers must neverthelesskeep in mind the hierarchical organization of soil erosion processes.In many times this can be done by using pragmatic procedures assuggested in this study.
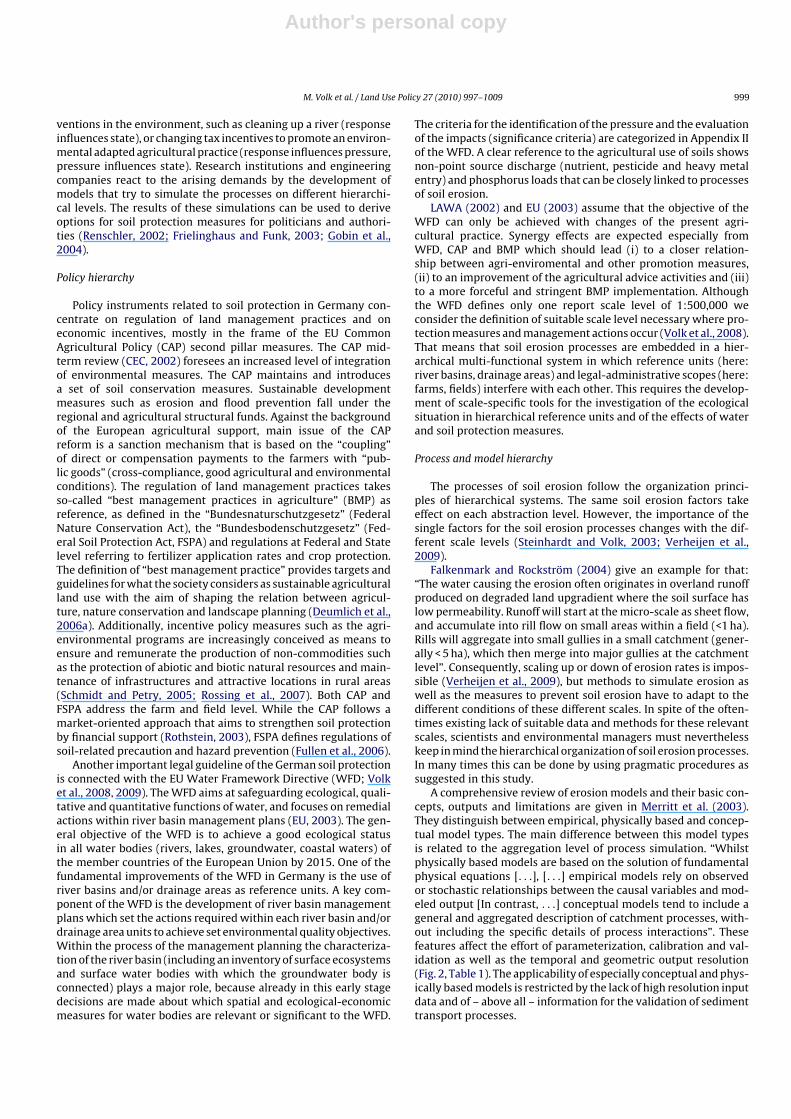
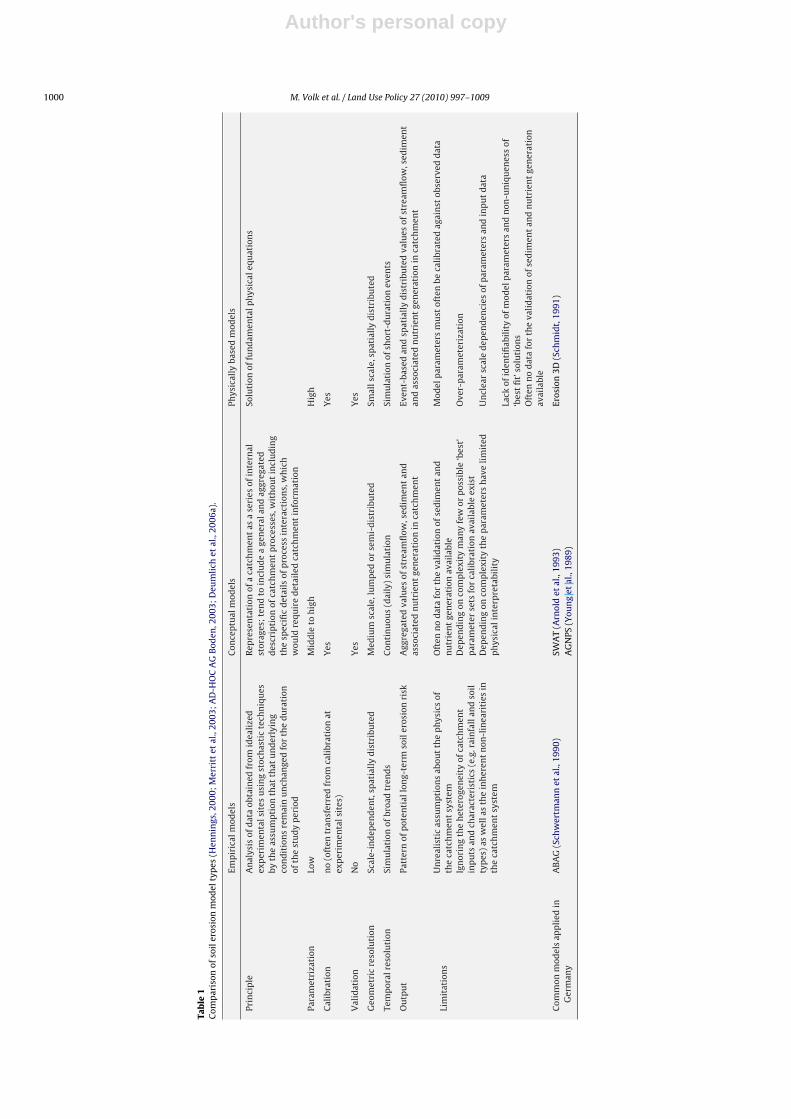
A comprehensive review of erosion models and their basic con-cepts, outputs and limitations are given in Merritt et al. (2003).They distinguish between empirical, physically based and concep-tual model types. The main difference between this model typesis related to the aggregation level of process simulation. “Whilstphysically based models are based on the solution of fundamentalphysical equations [. . .], [. . .] empirical models rely on observedor stochastic relationships between the causal variables and mod-eled output [In contrast, . . .] conceptual models tend to include ageneral and aggregated description of catchment processes, with-out including the specific details of process interactions”. Thesefeatures affect the effort of parameterization, calibration and val-idation as well as the temporal and geometric output resolution(Fig. 2, Table 1). The applicability of especially conceptual and phys-ically based models is restricted by the lack of high resolution inputdata and of – above all – information for the validation of sedimenttransport processes.
Author's personal copy
1000 M. Volk et al. / Land Use Policy 27 (2010) 997–1009
Tab
le1
Com
par
ison
ofso
iler
osio
nm
odel
typ
es(H
enn
ings
,200
0;M
erri
ttet
al.,
2003
;A
D-H
OC
AG
Bod
en,2
003;
Deu
mli
chet
al.,
2006
a).
Emp
iric
alm
odel
sC
once
ptu
alm
odel
sPh
ysic
ally
base
dm
odel
s
Prin
cip
leA
nal
ysis
ofd
ata
obta
ined
from
idea
lize
dex
per
imen
tals
ites
usi
ng
stoc
has
tic
tech
niq
ues
byth
eas
sum
pti
onth
atth
atu
nd
erly
ing
con
dit
ion
sre
mai
nu
nch
ange
dfo
rth
ed
ura
tion
ofth
est
ud
yp
erio
d
Rep
rese
nta
tion
ofa
catc
hm
ent
asa
seri
esof
inte
rnal
stor
ages
;te
nd
toin
clu
de
age
ner
alan
dag
greg
ated
des
crip
tion
ofca
tch
men
tp
roce
sses
,wit
hou
tin
clu
din
gth
esp
ecifi
cd
etai
lsof
pro
cess
inte
ract
ion
s,w
hic
hw
ould
requ
ire
det
aile
dca
tch
men
tin
form
atio
n
Solu
tion
offu
nd
amen
talp
hys
ical
equ
atio
ns
Para
met
riza
tion
Low
Mid
dle
toh
igh
Hig
h
Cal
ibra
tion
no
(oft
entr
ansf
erre
dfr
omca
libr
atio
nat
exp
erim
enta
lsit
es)
Yes
Yes
Val
idat
ion
No
Yes
Yes
Geo
met
ric
reso
luti
onSc
ale-
ind
epen
den
t,sp
atia
lly
dis
trib
ute
dM
ediu
msc
ale,
lum
ped
orse
mi-
dis
trib
ute
dSm
alls
cale
,sp
atia
lly
dis
trib
ute
d
Tem
por
alre
solu
tion
Sim
ula
tion
ofbr
oad
tren
ds
Con
tin
uou
s(d
aily
)si
mu
lati
onSi
mu
lati
onof
shor
t-d
ura
tion
even
ts
Ou
tpu
tPa
tter
nof
pot
enti
allo
ng-
term
soil
eros
ion
risk
Agg
rega
ted
valu
esof
stre
amfl
ow,s
edim
ent
and
asso
ciat
edn
utr
ien
tge
ner
atio
nin
catc
hm
ent
Even
t-ba
sed
and
spat
iall
yd
istr
ibu
ted
valu
esof
stre
amfl
ow,s
edim
ent
and
asso
ciat
edn
utr
ien
tge
ner
atio
nin
catc
hm
ent
Lim
itat
ion
sU
nre
alis
tic
assu
mp
tion
sab
out
the
ph
ysic
sof
the
catc
hm
ent
syst
emO
ften
no
dat
afo
rth
eva
lid
atio
nof
sed
imen
tan
dn
utr
ien
tge
ner
atio
nav
aila
ble
Mod
elp
aram
eter
sm
ust
ofte
nbe
cali
brat
edag
ain
stob
serv
edd
ata
Ign
orin
gth
eh
eter
ogen
eity
ofca
tch
men
tin
pu
tsan
dch
arac
teri
stic
s(e
.g.r
ain
fall
and
soil
typ
es)
asw
ella
sth
ein
her
ent
non
-lin
eari
ties
inth
eca
tch
men
tsy
stem
Dep
end
ing
onco
mp
lexi
tym
any
few
orp
ossi
ble
‘bes
t’p
aram
eter
sets
for
cali
brat
ion
avai
labl
eex
ist
Ove
r-p
aram
eter
izat
ion
Dep
end
ing
onco
mp
lexi
tyth
ep
aram
eter
sh
ave
lim
ited
ph
ysic
alin
terp
reta
bili
tyU
ncl
ear
scal
ed
epen
den
cies
ofp
aram
eter
san
din
pu
td
ata
Lack
ofid
enti
fiab
ilit
yof
mod
elp
aram
eter
san
dn
on-u
niq
uen
ess
of‘b
est
fit’
solu
tion
sO
ften
no
dat
afo
rth
eva
lid
atio
nof
sed
imen
tan
dn
utr
ien
tge
ner
atio
nav
aila
ble
Com
mon
mod
els
app
lied
inG
erm
any
AB
AG
(Sch
wer
tman
net
al.,
1990
)SW
AT
(Arn
old
etal
.,19
93)
Eros
ion
3D(S
chm
idt,
1991
)A
GN
PS(Y
oun
get
al.,
1989
)
Author's personal copy
M. Volk et al. / Land Use Policy 27 (2010) 997–1009 1001
Fig. 2. Model types, soil eroision processes and refererence units depending onspace and time.
Methods
ABAGflux
A popular empirical approach for the prediction of large scalesoil erosion and the designation of potential risk zones for soilerosion is the Universal Soil Loss Equation (USLE, Wishmeier andSmith, 1978) or its German adaptation (Eq. (1); Schwertmann et al.,1990).
A = R × K × L × S × C × P (1)
where A is the mean annual soil loss in t ha−1 yr−1, R the meanannual erosivity for a defined period, K is the soil erodibility indicat-ing a soil’s susceptibility to the erosive forces and gives the amountof soil loss per unit erosivity, LS is the length-slope factor, C is the
cover management factor. The support practice factor P was notconsidered within this study. It reflects the effects of practices thatwill reduce the amount of water runoff and thus reduce the erosionrate. LS and C are ratios of soil loss on a given unit plot.
The USLE has been proven as suitable in numerous studies fordecades (Eq. (1)). This can be attributed to – in comparison to phys-ically based models – low data and parameter requirements aswell as its scale-independent geometric resolution which is oftena limitation of lumped conceptual models (Table 1). A significantUSLE disadvantage consists of the overestimation of erosive slopelengths and the lacking possibilities for process-oriented simula-tions like sediment transport (Winchell et al., 2008). By means ofthe modification of single factors of the USLE as well as with theinclusion of further methods based on terrain analysis these deficitscould be minimized. This would result in a method to model cross-scale mean soil erosion rates and transport pathways as a basis forthe efficient simulation of water and soil protection measures.
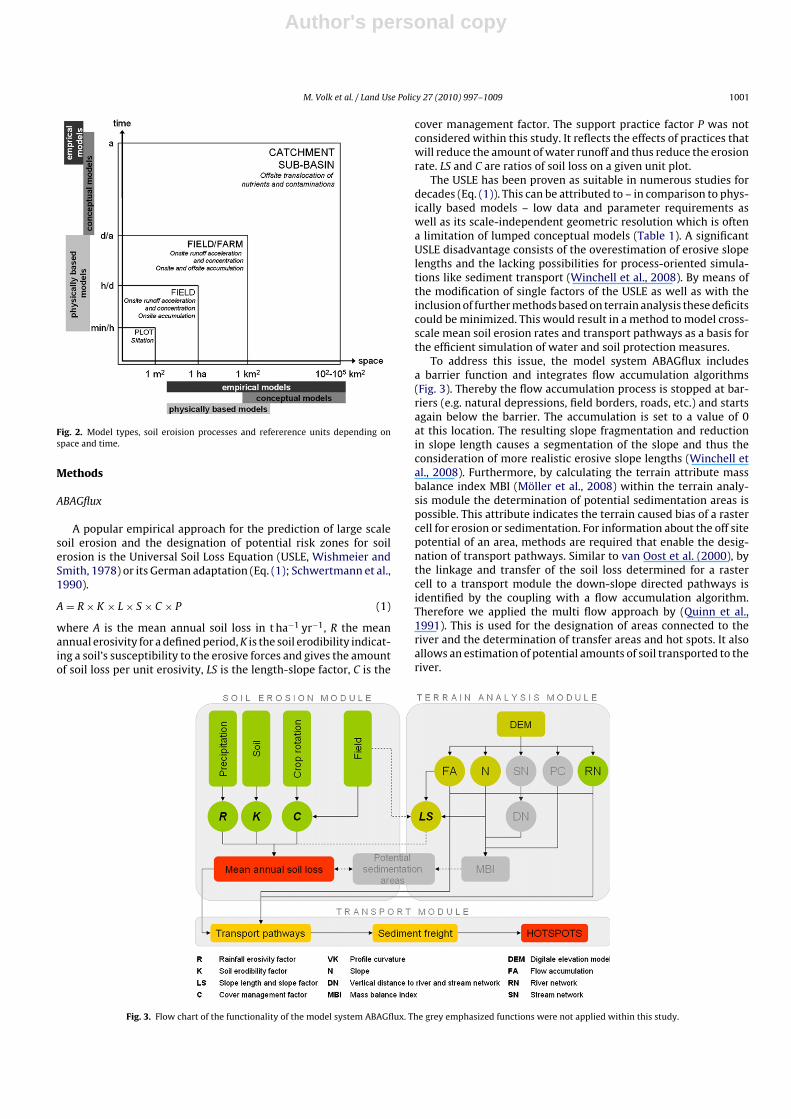
To address this issue, the model system ABAGflux includesa barrier function and integrates flow accumulation algorithms(Fig. 3). Thereby the flow accumulation process is stopped at bar-riers (e.g. natural depressions, field borders, roads, etc.) and startsagain below the barrier. The accumulation is set to a value of 0at this location. The resulting slope fragmentation and reductionin slope length causes a segmentation of the slope and thus theconsideration of more realistic erosive slope lengths (Winchell etal., 2008). Furthermore, by calculating the terrain attribute massbalance index MBI (Möller et al., 2008) within the terrain analy-sis module the determination of potential sedimentation areas ispossible. This attribute indicates the terrain caused bias of a rastercell for erosion or sedimentation. For information about the off sitepotential of an area, methods are required that enable the desig-nation of transport pathways. Similar to van Oost et al. (2000), bythe linkage and transfer of the soil loss determined for a rastercell to a transport module the down-slope directed pathways isidentified by the coupling with a flow accumulation algorithm.Therefore we applied the multi flow approach by (Quinn et al.,1991). This is used for the designation of areas connected to theriver and the determination of transfer areas and hot spots. It alsoallows an estimation of potential amounts of soil transported to theriver.
Fig. 3. Flow chart of the functionality of the model system ABAGflux. The grey emphasized functions were not applied within this study.
Author's personal copy
1002 M. Volk et al. / Land Use Policy 27 (2010) 997–1009
SICOM
The aggregation of USLE assessment on drainage areas wasrealized by the Site Comparison Method SICOM (Deumlich et al.,2006b) which aggregates classified values to a Comparison IndexCI. CI belongs to complexity metrics characterizing landscape struc-ture (see Gustavson, 1998) and is calculated using Eq. (2). Ci is thecomparison class, that represents clustered (see Section “k meanscluster analysis”) and ranked values. The ranking is carried outby the highest value of USLE assessment (highest ranking). ACi
is equivalent to the proportion of Ci within the reference units(here: drainage areas). As the name implies, the resulting CI valuesallow the relative comparison of reference units within a superiorreference unit (here: Federal State of Saxony-Anhalt). The advan-tage of this method compared to mean average approaches is that(i) no absolute (and mostly not validated) USLE values are used,(ii) the spatial heterogeneity of soil erosion assessment classesis considered, and (iii) scale-specific assessments can be carriedout.
CI =∑n
i=1(Ci × ACi)
n × 10with ∈ [0, 10] (2)
k means cluster analysis
The application of SICOM requires a classification of thecontinuous USLE results. Existing threshold based classificationschemas as suggested by (Hennings, 2000) do not consider thevariability which is affected by different factor calculation algo-rithms (Volk et al., 2001). For instance, the LS factor can be
calculated by a number of approaches (e.g. Moore and Wilson,1992; Desmet and Grovers, 1996; Hickey, 2000) leading to dif-ferent value ranges. Hence, we carried out a qualitative andstatistical grouping of USLE values by means of the k meansclustering algorithm within the R environment (Reimann et al.,2008). An advantage of this approach is that the metric featurespace can be structured in an automatic and comprehensiblemanner.
The case study: soil erosion risk assessment inSaxony-Anhalt
As part of the WFD, the planning of environmental measuresrequires an evaluation of the non-point source pollution affectingthe surface water bodies (see Section “Policy hierarchy”). These pol-lutants include mainly sediments and nutrients from agriculturaland forest land. Their entry into the water bodies has to be miti-gated or avoided. The evaluation of the potential sediment-boundnutrient entry to surface water bodies requires models that enableboth the state-wide estimation of soil erosion and the potentialsediment entry from agricultural land into the rivers. Simultane-ously, the results of soil erosion risk assessment should provide aregional decision basis for the European agricultural support. Apartfrom this requirements, specific conditions in Saxony-Anhalt has tobe considered:
• Cost efficiency: all the necessary efforts for model setup andapplication should be as small as possible.
• The database for the validation of sediment entry is still insuffi-cient.
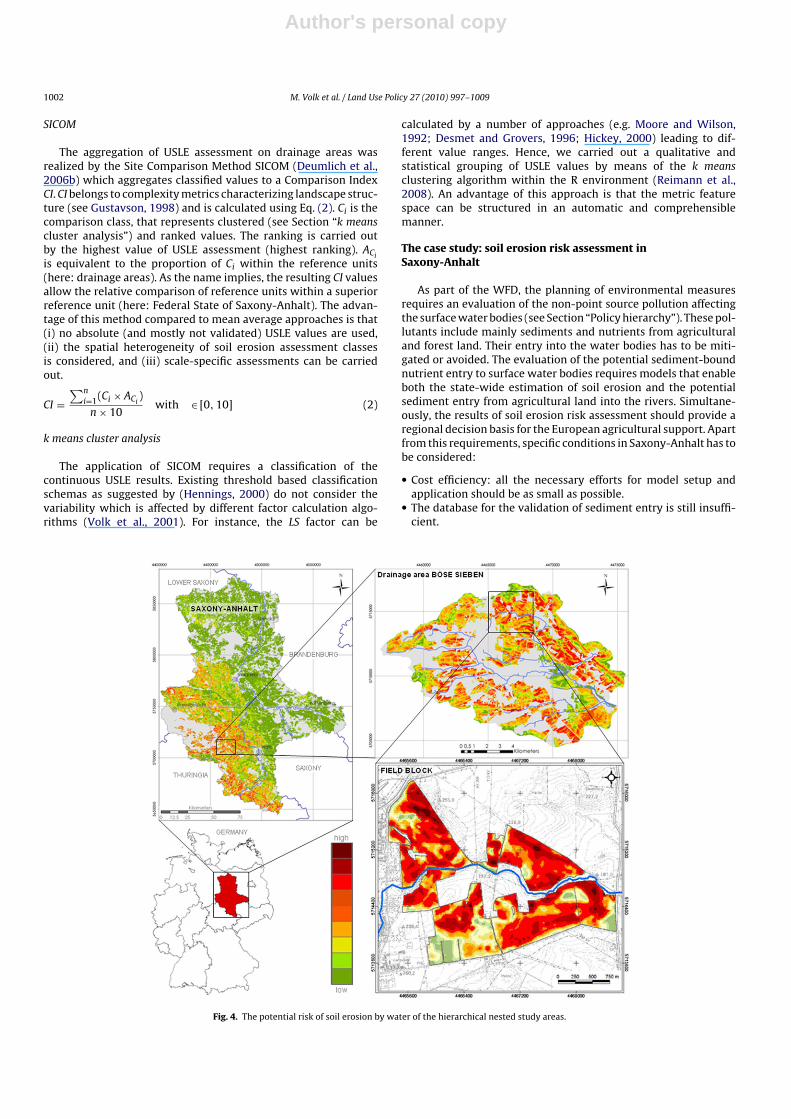
Fig. 4. The potential risk of soil erosion by water of the hierarchical nested study areas.
Author's personal copy
M. Volk et al. / Land Use Policy 27 (2010) 997–1009 1003
Tab
le2
Hie
rarc
hic
alle
vel,
inp
ut
dat
a,ap
pli
edm
eth
ods
and
resu
lts.
Hie
rarc
hic
alle
vel
Inp
ut
dat
aM
eth
ods
Res
ult
s
1st
leve
lmac
ro-s
cale
1:10
0,00
0–1:
500,
000
Fed
eral
Stat
e
DEM
40m
×40
mSo
ilm
ap1:
50,0
00B
ioto
pe
and
lan
du
sety
pes
1:10
,000
Exte
nd
edU
SLE
app
roac
h(b
arri
erfu
nct
ion
)St
ate-
wid
ep
oten
tial
and
nat
ura
lris
kas
sess
men
tof
soil
eros
ion
byFi
eld
bou
nd
arie
sk
mea
ns–
clu
ster
anal
ysis
Wat
erag
greg
ated
ind
rain
age
area
sPr
ecip
itat
ion
dat
afr
omm
eteo
rolo
gica
lnet
wor
kof
low
den
sity
Site
com
par
ison
met
hod
SIC
OM
Sele
ctio
nof
hig
hri
skar
eas
2nd
leve
lmes
o-sc
ale
1:25
,000
–1:5
0,00
0d
rain
age
area
DEM
40m
×40
mSo
ilm
ap1:
10,0
00B
ioto
pe
and
lan
du
sety
pes
1:10
,000
Exte
nd
edU
SLE
app
roac
h(b
arri
erfu
nct
ion
)Lo
cali
zati
onof
onsi
tean
dof
fsit
eri
skar
eas
Fiel
dbo
un
dar
ies
Sim
pli
fied
sed
imen
ttr
ansp
ort
algo
rith
mSe
lect
ion
offi
eld
sw
ith
hig
hri
skof
soil
eros
ion
and
sed
imen
ttr
ansp
ort
Cro
pro
tati
ond
ata
Aer
iali
mag
ein
terp
reta
tion
Riv
ern
etw
ork
1:10
,000
Prec
ipit
atio
nd
ata
from
met
eoro
logi
caln
etw
ork
ofh
igh
den
sity
3rd
leve
lmic
ro-s
cale
1:50
00–1
:10,
000
fiel
dbl
ock
DEM
10m
×10
mSo
ilm
ap1:
10,0
00B
ioto
pe
and
lan
du
sety
pes
1:10
,000
Exte
nd
edU
SLE
app
roac
h(b
arri
erfu
nct
ion
)Fi
eld
bou
nd
arie
sSi
mp
lifi
edse
dim
ent
tran
spor
tal
gori
thm
Scen
ario
sfo
rre
du
ctio
nof
the
sed
imen
tan
dn
utr
ien
ten
try
into
the
rive
rsD
etai
led
crop
rota
tion
and
agri
cult
ura
lpra
ctic
ed
ata
Sim
ula
tion
ofca
sesc
enar
ios
Econ
omic
alfa
rmd
ata
Aer
iali
mag
ein
terp
reta
tion
Cos
t-be
nefi
t-sc
enar
ios
Riv
ern
etw
ork
1:10
,000
Fiel
dw
ork
Prec
ipit
atio
nd
ata
from
met
eoro
logi
caln
etw
ork
ofh
igh
den
sity
Econ
omic
alba
lan
cin
g
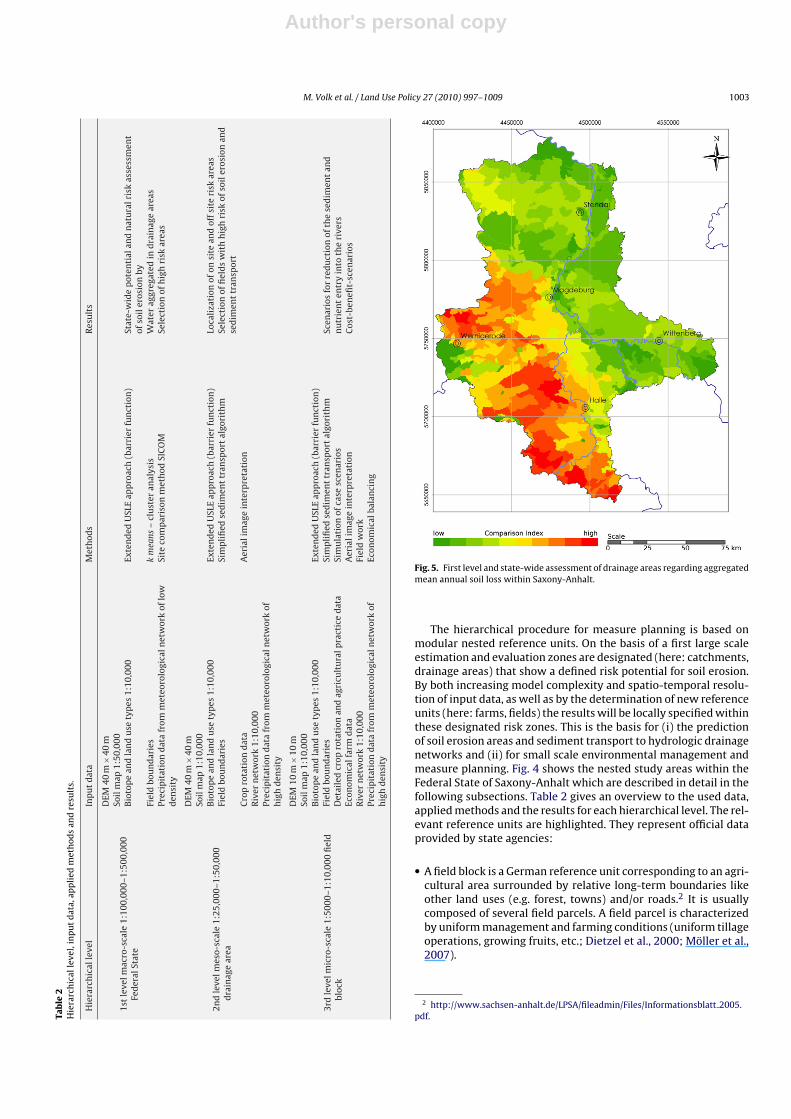
Fig. 5. First level and state-wide assessment of drainage areas regarding aggregatedmean annual soil loss within Saxony-Anhalt.
The hierarchical procedure for measure planning is based onmodular nested reference units. On the basis of a first large scaleestimation and evaluation zones are designated (here: catchments,drainage areas) that show a defined risk potential for soil erosion.By both increasing model complexity and spatio-temporal resolu-tion of input data, as well as by the determination of new referenceunits (here: farms, fields) the results will be locally specified withinthese designated risk zones. This is the basis for (i) the predictionof soil erosion areas and sediment transport to hydrologic drainagenetworks and (ii) for small scale environmental management andmeasure planning. Fig. 4 shows the nested study areas within theFederal State of Saxony-Anhalt which are described in detail in thefollowing subsections. Table 2 gives an overview to the used data,applied methods and the results for each hierarchical level. The rel-evant reference units are highlighted. They represent official dataprovided by state agencies:
• A field block is a German reference unit corresponding to an agri-cultural area surrounded by relative long-term boundaries likeother land uses (e.g. forest, towns) and/or roads.2 It is usuallycomposed of several field parcels. A field parcel is characterizedby uniform management and farming conditions (uniform tillageoperations, growing fruits, etc.; Dietzel et al., 2000; Möller et al.,2007).
2 http://www.sachsen-anhalt.de/LPSA/fileadmin/Files/Informationsblatt 2005.pdf.
Author's personal copy
1004 M. Volk et al. / Land Use Policy 27 (2010) 997–1009
• Drainage areas correspond to so-called surface water bodieswhich can be defined as a significant element of the drainagesystem (Van der Perk, 2006).
The procedure described in the following subsections is part ofthe official implementation of soil precaution and hazard preven-tion in Saxony-Anhalt (Wilhelm, 2008; Wilhelm and Feldwisch,2010) which follows the corresponding guidance of the GermanFederal Soil Association (Bundesverband Boden, BVB, 2004). Theguidance helps authorities to decide where and when defined mea-sures of precaution and/or prevention are nessecary. ABAGflux isforeseen as an auxiliary tool for the localization of such areas andthe assessment of possible sanction’s effectiveness.
First level assessment
The parameters required for the USLE calculation correspond tothe macro-scale target scale (Table 2: 1st hierarchical level). Onlysuch areas are considered that were derived from the thematic class“intensive agriculture” of the digital map of biotope and land usetypes in a scale of 1:10,000 (FANC, 2002). This thematic class wassubdivided by field blocks boundaries which acted as barriers forthe LS factor calculation.
The regions with the highest potential risk for soil erosion arelocated mainly in the South of Saxony-Anhalt, in the foreland ofthe Harz Mountains and in the West, in the Magdeburger Boerde,as the region is called. Due to the most fertile soils on Germany (e.g.Chernozems), the landscape is influenced by an intensive agricul-ture. The soils are at strong risk of erosion because of heterogeneouslandscape terrain, the erodibility of the dominant loess substrateand the intense summer rainstorm events.
The USLE results were statistically classified into nine classes(Fig. 4, top left) and aggregated by SICOM methodology to drainageareas (Fig. 5) which correspond to defined WFD surface water bod-
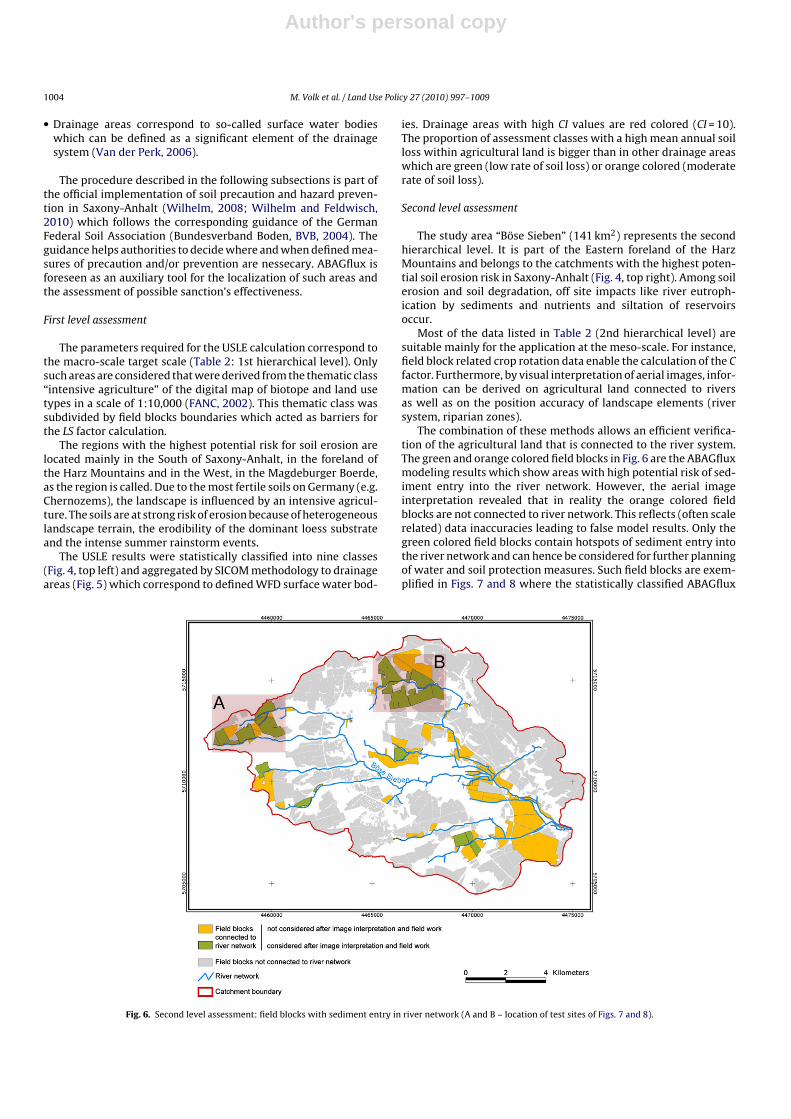
Fig. 6. Second level assessment: field blocks with sediment entry in river network (A and B – location of test sites of Figs. 7 and 8).
ies. Drainage areas with high CI values are red colored (CI = 10).The proportion of assessment classes with a high mean annual soilloss within agricultural land is bigger than in other drainage areaswhich are green (low rate of soil loss) or orange colored (moderaterate of soil loss).
Second level assessment
The study area “Böse Sieben” (141 km2) represents the secondhierarchical level. It is part of the Eastern foreland of the HarzMountains and belongs to the catchments with the highest poten-tial soil erosion risk in Saxony-Anhalt (Fig. 4, top right). Among soilerosion and soil degradation, off site impacts like river eutroph-ication by sediments and nutrients and siltation of reservoirsoccur.
Most of the data listed in Table 2 (2nd hierarchical level) aresuitable mainly for the application at the meso-scale. For instance,field block related crop rotation data enable the calculation of the Cfactor. Furthermore, by visual interpretation of aerial images, infor-mation can be derived on agricultural land connected to riversas well as on the position accuracy of landscape elements (riversystem, riparian zones).
The combination of these methods allows an efficient verifica-tion of the agricultural land that is connected to the river system.The green and orange colored field blocks in Fig. 6 are the ABAGfluxmodeling results which show areas with high potential risk of sed-iment entry into the river network. However, the aerial imageinterpretation revealed that in reality the orange colored fieldblocks are not connected to river network. This reflects (often scalerelated) data inaccuracies leading to false model results. Only thegreen colored field blocks contain hotspots of sediment entry intothe river network and can hence be considered for further planningof water and soil protection measures. Such field blocks are exem-plified in Figs. 7 and 8 where the statistically classified ABAGflux

Author's personal copy
M. Volk et al. / Land Use Policy 27 (2010) 997–1009 1005
Fig. 7. Third level assessment on the example of selected field blocks. (a) Test site B: potential soil erosion risk and hotspots of sediment entry. (b) Test site A: visualizationof scale effect (Left: DEM 40 × 40 m, Right: DEM 10 × 10 m).
result, the accumulated transport loads and the hotspots are visu-alized.
Third hierarchy level: planning and evaluation of measures
The third hierarchical level consists of field blocks along the river“Wilder Graben” within the “Böse Sieben” catchment. The selectedreference units are characterized by high potential soil erosion andsediment entry risk into the river “Böse Sieben” (Fig. 7a). Due tothe related degree of detail at this level, a DEM with a higher spa-tial resolution was applied. Because of the scale effects of a higherDEM resolution (steeply sloping and higher LS factor) (Thompsonet al., 2001), a higher potential soil erosion risk is calculated. But themost important effect is the more accurate designation of potentialsediment entries into the river (Fig. 7b).
In addition to the use of higher resolution DEM, field work wasdone to get detailed information about current erosion pattern,and to validate the location of hot spots. Crop rotation schemes,
agricultural management practices and economical issues werealso recorded by means of field work and interviews (Table 2: 3rdhierarchical level). On the example of selected field blocks, the fol-lowing measures were simulated and their effects on soil and waterprotection evaluated (Fig. 8).
Soil conservation practices on agricultural landReduction of soil tillage intensity or implementation of con-
servation practices can positively affect numerous soil properties,such as aggregate stability, macroporosity and saturated hydraulicconductivity which increases infiltration rates and reduces surfacerunoff, nutrient loss and soil erosion (Jones et al., 1969; Pitkänenand Nuutinen, 1998; Schmidt et al., 2001; Kirsch et al., 2002;Pandey et al., 2005; Tripathi et al., 2005). The modification ofsoil tillage can be realized in the model by the adaptation of theC factor. The area-wide mitigation of the soil erosion leads toa reduction of the sediment and nutrient entries into the rivers(Fig. 8a).
Author's personal copy
1006 M. Volk et al. / Land Use Policy 27 (2010) 997–1009
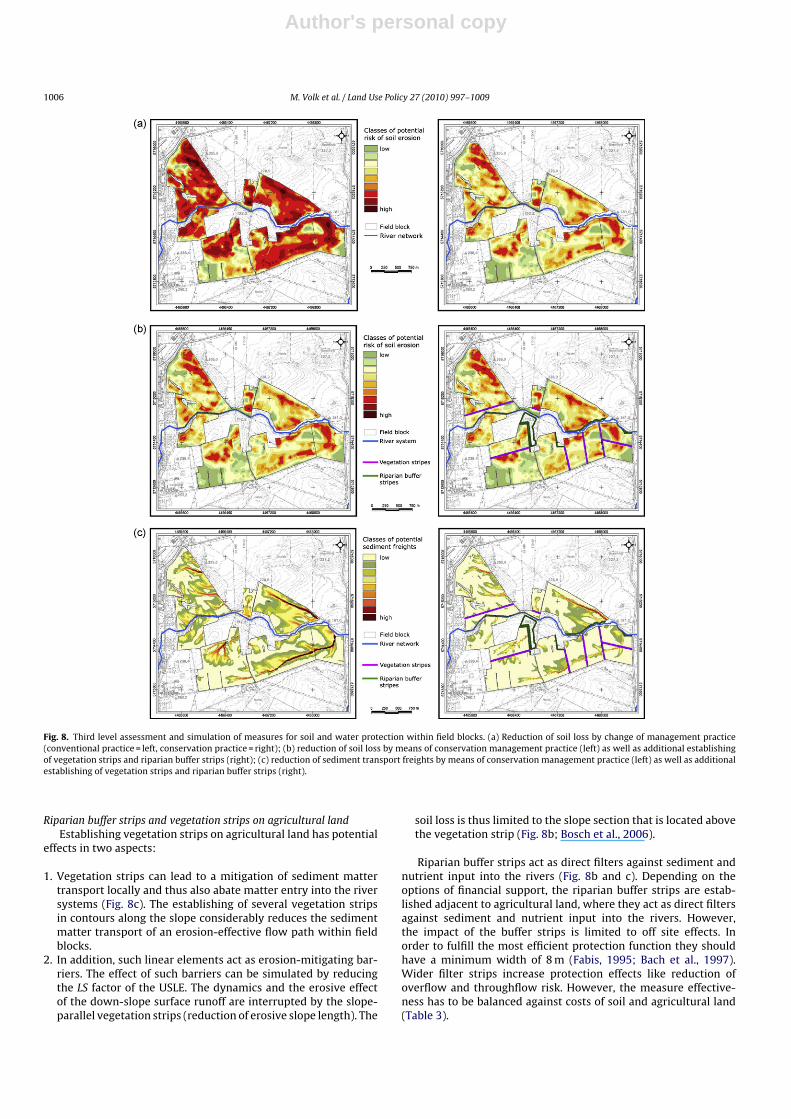
Fig. 8. Third level assessment and simulation of measures for soil and water protection within field blocks. (a) Reduction of soil loss by change of management practice(conventional practice = left, conservation practice = right); (b) reduction of soil loss by means of conservation management practice (left) as well as additional establishingof vegetation strips and riparian buffer strips (right); (c) reduction of sediment transport freights by means of conservation management practice (left) as well as additionalestablishing of vegetation strips and riparian buffer strips (right).
Riparian buffer strips and vegetation strips on agricultural landEstablishing vegetation strips on agricultural land has potential
effects in two aspects:
1. Vegetation strips can lead to a mitigation of sediment mattertransport locally and thus also abate matter entry into the riversystems (Fig. 8c). The establishing of several vegetation stripsin contours along the slope considerably reduces the sedimentmatter transport of an erosion-effective flow path within fieldblocks.
2. In addition, such linear elements act as erosion-mitigating bar-riers. The effect of such barriers can be simulated by reducingthe LS factor of the USLE. The dynamics and the erosive effectof the down-slope surface runoff are interrupted by the slope-parallel vegetation strips (reduction of erosive slope length). The
soil loss is thus limited to the slope section that is located abovethe vegetation strip (Fig. 8b; Bosch et al., 2006).
Riparian buffer strips act as direct filters against sediment andnutrient input into the rivers (Fig. 8b and c). Depending on theoptions of financial support, the riparian buffer strips are estab-lished adjacent to agricultural land, where they act as direct filtersagainst sediment and nutrient input into the rivers. However,the impact of the buffer strips is limited to off site effects. Inorder to fulfill the most efficient protection function they shouldhave a minimum width of 8 m (Fabis, 1995; Bach et al., 1997).Wider filter strips increase protection effects like reduction ofoverflow and throughflow risk. However, the measure effective-ness has to be balanced against costs of soil and agricultural land(Table 3).

Author's personal copy
M. Volk et al. / Land Use Policy 27 (2010) 997–1009 1007
Table 3Third level assessment: comparison of measure variants regarding loss of soil andof agricultural land.
Measure variant Soil loss(t ha−1 yr−1)
Loss of agriculturalland (ha)
Conventional soil tillage 5.4 –Conservation tillage and riparian
buffer strips2.2 30.4
Additional implementation ofvegetation strips and change oftillage direction
1.9 38.0
Discussion and conclusion
In the last few years, European (WFD, CAP) and national pol-icy instruments (FSPA) were established (Ulen and Kalisky, 2005;Deumlich et al., 2006a) focusing on different threats by soil erosionand scales:
• The decrease of water quality by sediment and nutrient pollutionas well as the loss of soil functions and fertility were identified asmain impacts of soil erosion (Frielinghaus and Funk, 2003; Gobinet al., 2004; Tóth et al., 2007).
• While CAP and FSPA address farms and fields corresponding mesoand micro scale, WFD uses meso and macro-scale river basins anddrainage areas as reference units (Fig. 2, Table 2).
On the example of the German Federal State of Saxony-Anhalt,our study presents an applied and effective implementation ofsharing WFD, CAP and FSPA aspects including both risk modelingof soil erosion and sediment entry in river network. Against thebackground of existing policy instruments on the one hand andthe availability of input and validation data on the other hand weexplained which erosion model approach has been proven to besuitable to meet the requirements. The applied procedure is anexample for a conceptual framework for the scale-specific model-ing of landscape related processes against the background of policy,process and model hierarchies. A framework implementation couldbe realized as simplified decision support system (e.g. Bierkens etal., 2000). Some important issues regarding soil erosion modelingwill be discussed in the following subsections.
Which model is appropriate?
As documented in this article and in Merritt et al. (2003), a widerange of models exist for use in simulating soil erosion, sedimenttransport and associated pollutant transport. These models differin terms of complexity, processes considered, and the data requiredfor model calibration and model use. In general there is no “best”model for all applications. The most appropriate model will dependon the intended use and the characteristics of the catchment beingconsidered. Further important factors are data requirements of themodel including the spatial and temporal variation of model inputsand outputs; and the objectives of the model user(s), including theease of use of the model, the scales at which model outputs arerequired and their form (such as concentration vs. load).
We used a modified version of the empirical Universal SoilLoss Equation (USLE) ABAGflux, which includes functions to betterdescribe landscape structure-related processes such as sedimen-tation and sediment transport to hydrologic drainage networks,as well as additional statistical methods such as the comparisonmethod SICOM and k means cluster analysis in a hierarchical proce-dure. We have shown that the approach can be applied – dependingon the planning and information level – to watersheds, farms, fieldsor even landforms or slope positions. We are aware of the weak-
nesses and uncertainties of the USLE and its modified versions. Asalready emphasized by van Rompaey et al. (2003) we recommendthat the regional erosion estimates should be used with caution asthe uncertainty involved in the model predictions is not known.But we have chosen this empirical approach because of a lack ofscale-specific calibration and validation data, which is neverthe-less still a main problem with all kinds of environmental analysisand management (Stroosnijder, 2005).
Although we postulate the importance of using scale-adequatemethods and data, we were not able to implement this “perfectly”because of a lack of data and measurements for all the relevantscales. However, the use of ABAGflux including the transport mod-ule and the capability to determine transfer sediment areas (landto river) allows a simplified hierarchical and nested procedurewith different levels of detail regarding the relevant processes.Currently, we work together with the State Agency for Flood Pro-tection and Water Management Saxony-Anhalt on a comparison ofour approach with other conceptual and physically based models(physically based models especially on the third level) to prove theaccuracy and efficiency of the methods.
Which monitoring strategies and validation data do we need?
Field scaleValidation data on field scale are only occasionally available.
Event-based and direct measurements needed by physically basederosion models often require high equipment and personnel cost.In contrast, indirect and cost-effective measurements like “changein surface elevation” method provide middle-term and long-terminformation about soil removal or sediment deposit (Stroosnijder,2005) which can be also used for the validation of empirical erosionmodels like USLE. However, erosion by wind, water and tillage hasto be considered separately (van Oost et al., 2006).
Catchment scaleAs shown by Volk et al. (2009), a problem yet to be addressed is
the general lack of measured sediment transport and water qualitydata to calibrate and validate erosion and water quality models.This adds considerable uncertainty to already complicated anduncertainty situations. Thus, improved strategies for sedimenta-tion transport measurements, water quality monitoring, and dataaccessibility must be established to achieve the environmental tar-gets of soil protection strategies or of the WFD.
van Rompaey et al. (2003), which carried out a soil risk assess-ment for Italy using the USLE, used sedimentation records in lakesand reservoirs for a “validation” and an estimation of the sedi-ment transport rates. The mean annual sediment volume that istrapped in reservoirs can be measured. This provides sedimentflux data (i) at a regional spatial scale (the size of the contribut-ing area) and (ii) at a long timescale (since the year of constructionor last cleaning of the reservoir). It should, however, be kept inmind that not all of the eroded sediment reaches the outlet of thedrainage basin. An important fraction of the sediment is depositedat intermediate locations depending on the drainage density andthe spatial configuration of both land cover and topography. Theyshowed that the variation accounted for their predicted values(using the USLE) by validation with the observed values is 70%(if the data from the alpine drainage basins are left out of thedata set).
Amore et al. (2004) also used measurement of deposited sed-iments in reservoirs for their work on scale effects in USLE andWEPP applications for soil erosion computation from three Sicilianbasins. This method can indeed help to get an idea about the accu-racy of soil erosion risk assessments using empirical equations. Butwe have to keep in mind that these rates are different from region

Author's personal copy
1008 M. Volk et al. / Land Use Policy 27 (2010) 997–1009
to region and even reservoirs or data for sedimentation rates fromreservoirs are not available everywhere.
Which measure should be applied?
While riparian buffer strips are considered as the last option tomitigate the consequences of soil erosion, area-wide soil protectionlike conservation tillage measures lead to an essential reduction ofsoil loss (Schmidt et al., 2001; Deumlich et al., 2006a). The addi-tional implementation of slope length reducing vegetation strips onagricultural land would result in a further reduction and thus also ina mitigation of potential sediment entries. But the detailed imple-mentation of buffer strips and vegetation strips comes along withthe loss of agricultural land. The related economic consequences forthe concerned farmers have to be compensated by financial incen-tives in the frame of the European Agricultural Support, whereassavings in costs for, e.g. sediment removal can be used to increaseregional erosion control subsidies. This would also ensure a higherlevel of farmer participation (e.g. Morschel et al., 2004). Finally,the efficiency of vegetation and riparian buffer strips depends ona lot of factors like topography, substratum or vegetation coverage(Morschel et al., 2004; Dorioz et al., 2006). Thus, we are currentlyinvestigating such dependencies in the “Böse Sieben” catchment.
Which information do we need?
The question is always which information level is needed byenvironmental planners and stakeholders. Expertise within thestakeholder groups exists to undertake field-based assessment atfiner spatial scales. On the basis of our own experience we agreewith the findings of Newham et al. (2004): planners and stake-holder organisations are aiming to enhance their ability to identifyhow their individual actions fit in an integrated approach to deal-ing with soil erosion or water quality issues at the catchment scale.Their most immediate need is to identify priority areas at risk forsoil erosion, stream reaches and subcatchments requiring manage-ment intervention to improve soil protection and water quality.Stakeholder groups also need information to assist in deciding onappropriate methods of management intervention by consideringthe costs of remediation and their potential environmental bene-fits. Our methodological framework for scale-specific assessmentof soil erosion by water is developed for such support.
Acknowledgements
The authors wish to thank David Bosch, Tifton, GA, USA, fordiscussion and helpful comments to improve the quality of thispaper. The presented case study was part of a project funded by theState Agency for Flood Protection and Water Management Saxony-Anhalt (LHW) and supported by Steffen Kußmann (LHW), MatthiasSchrödter (State Agency for Agriculture, Forests and Horticulture)and Michael Steininger (Institute for Applied Land Evaluation andSoil Conservation).
References
AD-HOC AG Boden, 2003. Methodenkatalog zur Bewertung natürlicher Bodenfunk-tionen, der Archivfunktion des Bodens, der Gefahr der Entstehung schädlicherBodenveränderungen sowie der Nutzungsfunktion ‘Rohstofflagerstätte’ nachBBodSchG. Arbeitshefte Boden 2 (2), 1–73.
Amore, E., Modica, C., Nearing, M., Santoro, V., 2004. Scale effect in USLE and WEPPapplication for soil erosion computation from three Sicilian basins. Journal ofHydrology 293, 100–114.
Arnold, J., Allen, P., Bernhardt, G., 1993. A comprehensive surface-groundwater flow-model. Journal of Hydrology 142, 47–69.
Auerswald, K., 2006. Germany. In: Soil Erosion in Europe. John Wiley & Sons, Chich-ester, West Sussex, England, pp. 213–230.
Bach, M., Fabis, J., Frede, H.-G., 1997. Filterwirkung von Uferstreifen für Stoffeinträgein Gewässer in unterschiedlichen Landschaftsräumen, volume 28 of Mitteilun-gen des DVWK. Deutscher Verband für Wasserwirtschaft und Kulturbau e. V,Bonn.
Bierkens, M., Finke, P., de Willigen, P., 2000. Upscaling and downscaling – methodsfor environmental research. In: Developments in Plant and Soil Sciences. KluwerAcademic Publishers, Dordrecht.
Boardman, J., 2006. Soil erosion science: reflections on the limitations of currentapproaches. Catena 68, 73–86.
Boardman, J., Poesen, J., 2006. Soil erosion in Europe: major processes, causes andconsequences. In: Soil Erosion in Europe. John Wiley & Sons, Chichester, WestSussex, England, pp. 479–488.
Bosch, D., Sullivan, D., Sheridan, J., 2006. Hydrological impacts on land-use changesin coastal plain watersheds. Transactions of the ASABE 49 (2), 423–432.
BVB, 2004. Bundesverband Boden: Handlungsempfehlung zur Gefahrenabwehrbei Bodenerosion durch Wasser, volume 1 of BVB-Merkblatt. Fachausschuss“‘Gefahrenabwehr bei Bodenerosion”’ des Bundesverbandes Boden e.V, St.Augustin, Germany.
CEC, 2002. Mid-term review of the Common Agricultural Policy. In: Technical ReportCOM 394. Commission of the European Communities, Brussels, Belgium.
CEC, 2006. Thematic strategy for soil protection. In: Technical Report COM 231.Commission of the European Communities, Brussels, Belgium.
De Vente, J., Poesen, J., 2005. Predicting soil erosion and sediment yield at the basinscale: scale issues and semi-quantitative models. Earth Science Reviews 71,95–125.
Desmet, P., Grovers, P., 1996. A GIS procedure for automatically calculating the USLELS factor on topographically complex landscape units. Journal of Soil and WaterConservation 51, 427–433.
Deumlich, D., Funk, R., Frielinghaus, M., Schmidt, W.-A., Nitzsche, O., 2006a. Basicsof effective erosion control in German agriculture. Journal of Plant Nutrition andSoil Science 169, 370–381.
Deumlich, D., Kiesel, J., Thiere, J., Reuter, H., Völker, L., Funk, R., 2006b. Applicationof the SIte COmparison Method (SICOM) to assess the potential erosion risk—abasis for the evaluation of spatial equivalence of agri-environmental measures.Catena 68 (2–3), 141–152.
Dietzel, H., Diemann, R., Jacobs, R., Otto, R., 2000. Schlaggröße und Schlagform inAckerbaugebieten der neuen Bundesländer. Zeitschrift für Kulturtechnik undLandentwicklung 41, 68–73.
Dorioz, J., Wang, D., Poulenard, J., abd Trévisan, D., 2006. The effect of grass bufferstrips on phosphorus dynamics: a critical review and synthesis as a basis forapplication in agricultural landscapes in France. Agriculture, Ecosystems & Envi-ronment 117, 4–21.
EU, Ed., 2003. European Communities – identification of water bodies, vol-ume 2 of guidance document – common implementation strategy for thewater framework directive., http://www.wrrl-info.de/docs/Guidance doc 2waterbodies.pdf.
Fabis, J., 1995. Retentionsleistung von Uferstreifen im Mittelgebirgsraum, Volume12 of Boden und Landschaft, Schriftenreihe zur Bodenkunde, Landeskultur undLandschaftsökologie. Universität Gießen, Gießen, Germany.
Falkenmark, M., Rockström, J., 2004. Balancing Water for Humans and Nature. TheNew Approach in Ecohydrology. Sterling, Earthscan, London.
FANC (Ed.), 2002. A System for the Survey of Biotope and Land Use Types(Survey Guide): Standard Biotope and Land Use Types for FCIR AerialPhotograph Supported Biotope and Land Use Survey for the FederalRepublic of Germany, Volume 73 of Schriftenreihe für Landespflege undNaturschutz, Bonn-Bad Godesberg, Germany. Federal Agency for NatureConservation.
Frecker, K., 2005. Beyond GDP: Enabling Democracy with Better Measures of SocialWell-being. The Kiessling Papers. Trudeau Centre for Peace and Conflict Studies,University of Toronto, Toronto.
Frielinghaus, M., Funk, R., 2003. Soil indicator systems – the basis for soil conser-vation decisions. In: Francaviglia, R. (Ed.), Agricultural Impacts on Soil Erosionand Soil Biodiversity: Developing Indicators for Policy Analysis. Organisation forEconomic Co-operation and Development (OECD), Rome, Italy.
Fullen, M., 2003. Soil erosion and conservation in northern Europe. Progress inPhysical Geography 27, 331–358.
Fullen, M., Arnalds, A., Bazzoffi, P., Booth, C., Castillo, V., Kértesz, Martin, P., Ritsema,C., Benet, A., Souchère, V., Vandekerckhove, L., Verstraeten, G., 2006. Govern-ment and agency response to soil erosion risk in europe. In: Boardman, J., Poesen,J. (Eds.), Soil Erosion in Europe. Wiley & Sons, Chichester, West Sussex, England,pp. 806–827.
Gobin, A., Jones, R., Kirkby, M., Campling, P., Goversa, G., Kosmas, C., Gentile, A.,2004. Indicators for pan-European assessment and monitoring of soil erosionby water. Environmental Science & Policy 7, 25–38.
Gustavson, E., 1998. Quantifying landscape spatial pattern: what is the state of theart? Ecosystems 1, 143–156.
Hennings, V., 2000. Methodendokumentation Bodenkunde - Auswertemethodenzur Beurteilung der Empfindlichkeit und Belastbarkeit von Böden. In: Num-ber SG1 in Geologisches Jahrbuch, Sonderhefte. Reihe G. Stuttgart, 2nd ed.Schweizerbart’sche Verlagsbuchhandlung, Germany.
Herz, K., 1973. Beitrag zur Theorie der landschaftsanalytischen Maßstabsbereiche.Petermann’s Geographische Mitteilungen 117 (2), 91–96.
Herz, K., 1980. Ein Begriffssystem der Bodenerosion. Wissenschaftliche Zeitschriftder Pädagogischen Hochschule Dresden, Beiheft 3, 3–10.
Hickey, R., 2000. Slope angle and slope length solution for GIS. Cartography 29, 1–8.

Author's personal copy
M. Volk et al. / Land Use Policy 27 (2010) 997–1009 1009
Jones, J., Moody, J., Lillard, J., 1969. Effects of tillage, no-tillage, and mulch on soilwater and plant growth. Agronomy Jornal 94, 299–304.
Kirkby, M., Abrahart, R., McMahon, M., Shao, J., Thornes, J., 1998. MEDALUS soilerosion models for global change. Geomorphology 24, 35–49.
Kirkby, M., Imeson, A., Bergkamp, G., 1996. Scaling up processes and models fromthe field plot to the watershed and regional areas. Journal of Soil and WaterConservation 51 (5), 391–396.
Kirsch, K., Kirsch, A., Arnold, J., 2002. Predicting sediment and phosphorus loadsin the Rock River Basin using SWAT. Transactions of the ASABE 45, 1757–1769.
Lahmar, R., 2010. Adoption of conservation agriculture in Europe: lessons of theKASSA project. Land Use Policy 27 (1), 4–12.
LAWA, 2002. Gemeinsamer Bericht von LAWA und LABO zu Anforderungen aneine nachhaltige Landwirtschaft aus Sicht des Gewässer- und Bodenschutzesvor dem Hintergrund der Wasserrahmenrichtlinie. LänderarbeitsgemeinschaftWasser, Hannover, Germany, http://www.lawa.de/lawaroot/pub/kostenlos/wrrl/Landwirtschaftspapier-Stand 24-04-02neu.pdf.
LUBW, 1995. Prognose von Bodenerosion, volume 4 of Materialien zumBodenschutz. Landesanstalt f”ur Umwelt, Messungen und Naturschutz Baden-Württemberg (LUBW), Karlsruhe, http://www.lubw.baden-wuerttemberg.de/servlet/is/17077.
Merritt, W., Letcher, R., Jakeman, A., 2003. A review of erosion and sediment trans-port models. Environmental Modelling & Software 18, 761–799.
Molenaar, M., 1998. An introduction to the theory of spatial object modelling.In: Research Monographs in Geographical Information Systems. Tayler &Francis.
Möller, M., Lymburner, L., Volk, M., 2007. The comparison index: a tool for assess-ing the accuracy of image segmentation. International Journal of Applied EarthObservation and Geoinformation 9, 311–321.
Möller, M., Volk, M., Friedrich, K., Lymburner, L., 2008. Placing soil genesis and trans-port processes into a landscape context: a multi-scale terrain analysis approach.Journal of Plant Nutrition and Soil Science 171, 419–430.
Moore, I., Wilson, J., 1992. Length-slope factors for the revised universal soil lossequation. Journal of Soil and Water Conservation 47 (5), 423–428.
Morschel, J., Fox, D., Bruno, J.F., 2004. Limiting sediment deposition on roadways:topographic controls on vulnerable roads and cost analysis of planting grassbuffer strips. Environmental Science & Policy 7, 39–45.
Newham, L., Letcher, R., Jakeman, A., Kobyashi, T., 2004. A framework for inte-grated hydrologic, sediment and nutrient export modelling for catchment-scalemanagement. Environmental Modelling & Software 19, 1029–1038.
Pandey, V., Panda, S., Sudhakar, S., 2005. Modelling of an agricultural watershedusing remote sensing and a geographic information system. Biosystems Engi-neering 90 (3), 331–347.
Pitkänen, J., Nuutinen, V., 1998. Earthworm contributions to infiltration and sur-face runoff after 28 years of different soil management. Applied Soil Ecology 9,411–415.
Quinn, P., Beven, K., Chevallier, P., Planchon, O., 1991. The prediction of hillslopeflow paths for distributed hydrological modelling using digital terrain models.Hydrological Processes 5, 59–79.
Reimann, C., Filzmoser, P., Garrett, R., Dutter, R., 2008. Statistical Data AnalysisExplained. Wiley & Sons, Chichester, West Sussex, UK.
Renschler, C., 2002. Soil erosion assessment tools from point to regional scales – therole of geomorphologists in land management research and implementation.Geomorphology 47, 189–209.
Renschler, C., 2003. Designing geo-spatial interfaces to scale process models: theGeoWEPP approach. Hydrological Processes 17, 1005–1017.
Rossing, W., Zander, P., Josien, E., Groot, J., Meyer, B., Knierim, A., 2007. Integrativemodelling approaches for analysis of impact of multifunctional agriculture: areview for France, Germany and The Netherlands. Agriculture, Ecosystems &Environment 120, 41–57.
Rothstein, B., 2003. Landwirtschaftlicher Bodenschutz - Sicherung der Schutzfunk-tion durch Optimierung naturwissenschaftlicher, juristischer und ökonomis-cher Handlungsziele. Bodenschutz und Altlasten, Bd. 14. Erich SchmidtVerlag.
Schmidt, G., Petry, D., 2005. Möglichkeiten und Grenzen der Bodenfunktionsbe-wertung bei der Umsetzung von Bodenschutzzielen. In: Möller, M., Helbig, H.(Eds.), GIS-gestützte Bewertung von Bodenfunktionen – Datengrundlagen undLösungsansätze. Wichmann, Heidelberg, pp. 147–160.
Schmidt, J., 1991. A mathematical model to simulate rainfall erosion. In: Bork, H.-R., De Ploey, J., Schick, A. (Eds.), Erosion, Transport and Deposition Processes:Theories and Models, volume Supplement 19 of Catena, pp. 101–109.
Schmidt, W., Zimmerling, B., Nitzsche, O., Krück, S., 2001. Conservation tillage – anew strategy in flood control. In: Marsalek, J. (Ed.), Advances in Urban StormWater and Agricultural Runoff Source Control, Volume 74 of NATO ScienceSeries, pp. 287–292.
Schwertmann, U., Vogl, W., Kainz, M., 1990. Bodenerosion durch Wasser: Vorhersagedes Abtrags und Bewertung von Gegenmaßnahmen. Ulmer.
Steinhardt, U., Volk, M., 2002. An investigation of water and matter balance on themeso-landscape scale: a hierarchical approach for landscape research. Land-scape Ecology 17 (1), 1–12.
Steinhardt, U., Volk, M., 2003. Meso-scale landscape analysis based on landscape bal-ance investigations: problems and hierarchical approaches for their resolution.Ecological Modelling 168, 251–265.
Stroosnijder, L., 2005. Measurement of erosion: is it possible? Catena 64, 162–173.Thompson, J., Bell, J., Butler, C., 2001. Digital elevation model resolution: effects
on terrain attribute calculation and quantitative soil-landscape. Geoderma 100,67–89.
Tripathi, M., Panda, R., Raghuwanshi, N., 2005. Development of effective manage-ment plan for critical subwatersheds using swat model. Hydological Processes19, 809–826.
Tóth, G., Stolbovoy, V., Montanarella, L., 2007. Soil quality and sustainability evalu-ation: an integrated approach to support soil-related policies of the Europeanunion. In: Technical Report EUR 22721 EN. Office for Official Publications of theEuropean Communities, Luxembourg.
Ulen, B., Kalisky, T., 2005. Water erosion and phosphorus problems in an agriculturalcatchment: lessons from implementation of the EU water framework directive.Environmental Science & Policy 8 (5), 485–492.
Van der Perk, M., 2006. Soil and Water Contamination: From Molecular to Catch-ment. Taylor & Francis.
van Oost, K., Govers, G., Desmet, P., 2000. Evaluating the effects of changes in land-scape structure on soil erosion by water and tillage. Landscape Ecology 15,577–589.
van Oost, K., Govers, G., De Alba, S., Quine, T., 2006. Tillage erosion: a review of con-trolling factors and implications for soil quality. Progress in Physical Geography30, 443–466.
van Rompaey, A., Bazzoffi, P., Jones, R., Montanarella, L., Govers, G., 2003. Validationof soil erosion risk assessments in Italy. In: Technical Report EUR 20676 EN,European Soil Bureau Research. Office for Official Publications of the EuropeanCommunities, Luxembourg.
Veihe, A., Hasholt, B., Schitz, I., 2003. Soil erosion in Denmark: processes and politics.Environmental Science & Policy 6, 37–50.
Verheijen, F., Jones, R., Rickson, R., Smith, C., 2009. Tolerable versus actual soil ero-sion rates in europe. Earth-Science Reviews 94, 23–38.
Volk, M., Hirschfeld, J., Dehnhardt, A., Schmidt, G., Bohn, C., Liersch, S., Gassmann, P.,2008. Integrated ecological–economic modelling of water pollution abatementmanagement options in the Upper Ems River Basin. Ecological Economics 66,66–76.
Volk, M., Liersch, S., Schmidt, G., 2009. Towards the implementation of the europeanwater framework directive? Lessons learned from water quality simulations inan agricultural watershed. Land Use Policy 36 (3), 580–588.
Volk, M., Steinhardt, U., Gränitz, S., Petry, D., 2001. Probleme und Möglichkeitender mesoskaligen Abschätzung des Bodenabtrages mit einer Variante der ABAG.Wasser & Boden 53 (12), 24–30.
Wickenkamp, V., Duttmann, R., Mosimann, T., 2000. A multiscale appraoch to pre-dicting soil erosion on cropland using empirical and physically based soil erosionmodells in a geographic informations system. In: Schmidt, J. (Ed.), Soil Erosion:Applictaion of Physically Based Models. Springer, Berlin, Heidelberg.
Wielemaker, W., de Bruin, S., Epema, G., Veldkamp, A., 2001. Significance and appli-cation of the multi-hierarchical landsystem in soil mapping. Catena 43, 15–34.
Wilhelm, F., 2008. Bodenschutzrechtliche Anforderungen an den Erosionsschutzund ihre Umsetzung. In Bodenerosion: Grundlagen und Handlungsstrategienfür den Boden- und Gewässerschutz in Sachsen-Anhalt. Halle (Saale), Germany,pp. 23–26 http://www.geoflux.de/workshop-bodenerosionLSAb.pdf.
Wilhelm, F., Feldwisch, N., 2010. Gesetzliche Anforderungen an den Erosionsschutzund ihre Umsetzung in Sachsen-Anhalt. In: Helbig, H., Möller, M., Schmidt, G.(Eds.), Bodenerosion durch Wasser in Sachsen-Anhalt: Ausmaß, Wirkungen undVermeidungsstrategien. Erich Schmidt Verlag, pp. 83–88.
Winchell, M., Jackson, S., Wadley, A., Srinivasan, R., 2008. Extension and valida-tion of a geographic information system-based method for calculating theRevised Universal Soil Loss Equation length-slope factor for erosion risk assess-ments in large watersheds. Journal of Soil and Water Conservation 63 (3),105–111.
Wishmeier, W., Smith, D., 1978. Predicting Rainfall Erosion Losses—A Guide to Con-servation Planning, Volume 537 of USDA Agr. Handbook. US Department ofAgriculture Science and Education Administration, Washington, DC.
Wu, J., 1999. Hierarchy and scaling: information along a scaling ladder. CanadianJournal of Remote Sensing 25 (4), 367–380.
Young, R., Onstad, C., Bosch, D., Anderson, W., 1989. AGNPS: a nonpoint-source pol-lution model for evaluation agricultural watersheds. Journal of Soil and WaterConservation 44 (2), 4522–4562.