Hierarchies of Nutrition Expertise in Post- Revolutionary Bolivia
Upload
independentCategory
view
1download
0
Characteristics of Performance-Optimal Multi-Level Cache Hierarchies
Steven Przybylski, Mark Horowitz, John Hennessy
Computer Systems Laboratory, Stanford University, Stanford University, CA., 94305
Abstract
The increasing speed of new generation processors will exacerbate the already large difference between CPU cycle times and main memory access times. As this difference grows, it wilI be increasingly difficult to build single-level caches that are both fast enough to match these fast cycle times and large enough to effectively hide the slow main memory access times. One solution to this problem is to use a multi-level cache hierarchy. This paper examines the relationship between cache organization and program execution time for multi-level caches. We show that a first-level cache dramatically reduces the number of references seen by a second-level cache, without having a large effect on the number of second-level cache misses. This reduction in the number of second-level cache hits changes the optimal design point by decreasing the importance of the cycle-time of the second-level cache relative to its size. The lower the f&-level cache miss rate, the less important the second- level cycle time becomes. This change in relative importance of cycle time and miss rate makes associativity more attractive and increases the optimal cache size for second-level caches over what they would be for an equivalent single-level cache system.
1. Introduction
Multi-level cache hierarchies are memory systems in which there are two or more levels of caching between the CPU and main memory. It is widely accepted that the large difference between CPU cycle times and main memory access times will continue to grow, and that computer implementors will have to use multi-level memory hierarchies to get the best system performance [3, 12,13]. Several studies have shown that
Permission to copy without fee all or part of this material is granted provided that the copies are not made or distributed for direct commercial advantage, the ACM copyright notice and the title of the publication and its date appear, and notice is given that copying is by permission of the Association for Computing Machinery. To copy otherwise, or to republish, requires a fee and/or specific permission.
0 1989 ACM 0884-7495/89/0000/Q114$01.50 I14
in many situations there is substantial opportunity for performance improvement by increasing the depth of the memory hierarchy [4,5, 10, 11, 151. This paper presents empirical and analytical results regarding the behaviour of caches within multi-level hierarchies.
Recent work has shown how the tradeoffs inherent in cache design change when the metric used for evaluating cache performance is shifted from cache miss rates to overall system performance [6,8]. This earlier work showed that a designer needs to pay close attention to cache organizational changes that affect cycle time, and that the best overall performance is obtained when the designer balances the conflicting goals of a short cycle time and a low miss ratio. A change in the cache organization that decreases the miss ratio can decrease performance if an accompanying increase in the cycle time results in a greater increase in the time spent handling cache hits than the reduction in the time spent handling cache misses. This paper extends the use of system performance as the key metric to the analysis of multi- level cache. hierarchies. The goal is to find the multi-level hierarchy that maximizes the overall performance while satisfying alI the implementation constraints.
Two unavoidable conclusions made in an earlier paper motivate the use of multi-level cache hierarchies [8]. First, there is an upper bound on the performance that can be achieved through the use of a single level of caching; after a certain point, the performance cannot he improved by changing any of the cache’s parameters (including the cache size). Second, the difference between the optimal CPU cycle time and the minimum realizable cycle time is potentially very large. By reducing the cache miss penalty of the cache closest to the CPIJ, multi-level cache hierarchies can simultaneously break the single-level performance barrier and help a designer strive towards the dual performance goals of a low mean cycles per instruction (CPI) and a short CPU cycle time.
One step towards finding the best realizable hierarchy is understanding how the different levels of caching in a multi-level hierarchy interact with., and influence, one another. The interaction between levels of caching is presented in two ways. Section 3 shows that if the miss ratio is appropriately defined then a cache’s miss ratio is independent of the presence of the other caches in the hierarchy. This important result allows us to transfer our

experience and intuition about the relationship between a cache’s organizational parameters (size, associativity, block size) and its miss rate from the single-level domain to the multi-level &sign problem. Sections 4 and 5 then look specifically at the important cache design tradeoffs between a cache’s cycle time and both its size and associativity. These sections closely parallel the two sections in our earlier paper on single-level cache design [S]. A comparison between these and the previously reported results helps illuminate the differences between the single-level design problem and the design of a cache within a multi-level hierarchy. Section 6 summarizes the results and predicts some characteristics of future multi-level cache hierarchies,
2. Terminology and Method
We will use Smith’s terminology for cache organizations [12], with a few extensions. In particular, we define several terms for a multi-level hierarchy. We call the cache nearest the CPU the first level cache; level i+Z is further from the CPU than level i. An upstream (or predecessor) cache is closer to the CPU, while a downstream (or successor) cache is closer to main memory (and further from the CPU). In multi-level hierarchies, there are three sets of miss ratios of interest. A local miss ratio of a particular cache is the number of misses experienced by the cache as a fraction of its incoming references. The global miss ratio of a cache is the number of misses incurred by that cache divided by the number of references made by the CPU. Finally, the solo miss ratio of a cache is defined as the miss ratio that we are familiar with in computer systems with a single- level cache hierarchy. It is the miss ratio of a cache would have if it were the only cache in the system. We define miss ratios in terms of read requests (loads and instruction fetches) only. Combining mad and write requests can lead to confusing results since the mechanisms by which reads and writes affect the overall performance are quite different.
Two complementaxy techniques will be used to investigate the performance implications of multi-level cache hierarchies: trace-driven simulation and analytical modelling. The former gives precise answers for the set of caches simulated, while the latter provides a means of explaining the trends shown by simulation, and of generalizing the results to a larger set of cache designs.
To properly measure the performance impact of a multi-level hierarchy using trace-driven simulation, one needs both a simulator that accurately keeps track of time within each level of the hierarchy and a set of representative traces to run through the simulator. For the results to be credible, the simulator must be able to model realistic systems, including write buffering, prefetching, and multiple simultaneous events at the various levels of caching. The simulation environment and empirical method used in this study is an extension of the one used,
and described in detail, in an earlier paper [8]. The simulation system reads a file that specifies the depth of the cache hierarchy and the configuration of each cache. The user has control of the latency of cache operations as well as the organization (total size, set size, block size, fetch size, write strategy, write buffering) of each cache.
Our CPU model is a high performance, RISC-like CPU. It executes one instruction fetch and either zero or one data accesses on every clock cycle in which it is not waiting on the memory system. In our traces, about 50% of non-stall cycles contain a data reference and roughly 35% of those are reads. The base machine for this study is a hypothetical single chip processor that runs at a 1On.s cycle time. The chip contains split 4KB (2KB each I and D) on-chip first-level cache (Ll). Both caches am direct- mapped, with a block size of 4 words. The data cache is write-back, with write hits taking two cycles. Both caches cycle at the same rate as the CPU. There also is a much larger second-level (L2) external cache. Though its size and associativity are varied in the experiments presented here, the default is a 512KB direct-mapped cache with a block size of 8 words. The basic cycle time of the external cache is 3 CPU cycles. It too is a write-back cache, with write hits taking 2 L2 cycles. An Ll cache miss stalls the processor until all of the Ll block is received from the L2 cache. The bus between the integrated processor and the L2 cache is assumed to be 4 words wide, and cycles at the same rate as the L2 cache. Thus, a read request that misses in Ll but hits in L2 suffers a nominal cache miss penalty of 3 CPU cycles. If the request misses in L2 as well, the processor is stalled until the entire L2 block is fetched from main memory.
The memory model used in the simulations decomposes main memory access time into three components. Read operations (from address available to 8 words of data available) take 180 11s. Write operations (from address and data available to write complete) take 100 IX, and at least 120 ns of refresh and cycle time must elapse between successive data operations. The bus between main memory and the L2 cache is also 4 words wide, so that in addition to the main memory operation time, one bus cycle is needed to transmit the address to memory, and two am needed to retrieve the data. The backplane cycle time is set to be the same as the L2 cycle time. The net result is that the L2 cache miss penalty for fetching an 8 word block is between 2701~ and 37Ons, depending on the elapsed rime since the previous operation. BeMreen each of the levels of the hierarchy am write buffers that are 4 entries deep, each entry being the width of a block in the upstream cache.
We use a set of eight large multiprogramming traces for our cache simulations. Four of the traces were generated using ATUM [l] runniug on a VAX 8200. These traces contain system references and have captured actual multiprogramming behavior. Three of these traces are VMS traces and one is an Ultrix trace. The other four traces were generated by interleaving uniprocessor traces from a MIPS Computer System’s R2000 processor. These

traces do not contain system references, but were randomly interleaved to match the context switch intervals seen in the VAX traces. Care was taken to collect data only after the caches had left the cold start region. The traces are described in detail in other publications [2,9].
3. Independence of Cache Layers
The multi-level hierarchy design problem is substantially more complex than the single-level case. Not only is there an additional set of design decisions introduced for each level in the hierarchy, but the optimal choices at each level depend on the characteristics of the adjacent caches. The direct influence of upstream caches can be seen in the miss ratio. Figure 3-1 shows the L2 miss ratios for the base machine described above as the L2 cache size is varied. To reiterate, local metrics refer to parameters measured relative to the input stream to a given level, while global metrics are measured with respect to the CPU reference stream. Thus, the LZ lo& read miss ratic is the number of L2 misses divided by the number of read requests reaching the second-level cache, or alternatively, the ratio of the number of L2 misses to the number of Ll misses. The global miss ratio is the same number of misses divided by the number of reads in the input stream. The L2 solo miss rates result when the Ll cache is removed entirely, and the larger cache is the only one in the system.
L2 Data Sk. (Kt3yt.s)
12 Miss Ratlos: 4KB Ll Cache
Figure 3-1
The local miss ratio for any cache is always dependent on its predecessor’s miss ratio. However, Figure 3-l shows that if the Ll cache is small, and the second cache is significantly larger than the first, then the L2 global miss ratio is the same as its solo cache miss ratio. In this case, the global miss ratio for the L2 cache is completely independent of Ll’s parameters. This independence means that the overall hierarchy design problem can be decomposed to some extent into the design of the individual layers.
For larger first level caches, the independence of the layers still applies. Figure 3-2 shows the L2 miss ratios for a substantially larger Ll cache (32KB total), Again, until a size increment of a factor of 8 is reached, the presence of the upstream cache disturbs the characteristics
of the reference stream reaching the subsequent level sufficiently to noticeably perturb the L2 global miss ratio from the solo miss ratio even for very large caches.
L2 Data Sk (KBytms)
L2 Miss Ratios: 32KS Ll Cache
Figure 3-2
The following sections discuss the tradeoffs between a cache’s cycle time and two important organizational parameters: its size and associativity. Though an upstream cache does not necessarily change the global miss ratios, it does affect the local miss ratios and changes the optimum balance between the conflicting goals of a short cache cycle time and a large cache size and associativity.
4. Speed - Size Tradeoffs
The tradeoff between a temporal and an organizational parameter is investigated experimentally by varying the two design variables simultaneously and comparing their relative effects on performance.’ Figure 4-1 shows the relative execution time for the base two-level system as the L2 size is varied from 4KB to 4MB and the L2 cycle time is varied from 1 through 10 CPU cycles. The L2 cycle time represents the basic SRAM access time: reads that tag hit are completed in this time, while writes take two such cycles. The main memory access portion of the second-level cache miss penalty is kept constant.
These curves are very similar to the curves generated for a single-level cache [8]. They show that as caches get larger, the benefit to performance of further increasing cache size decreases. In contrast, the effect on perfonnauce of a change in cache cycle time is nearly independent of cache size. For small caches, a change in size is more important than a change in cycle time, while for large caches the reverse is true. The interaction between the two levels of caches causes the curves to be somewhat straighter for small caches than in the single- level model.
Taking horizontal slices through the cumes exposes classes of machines with the same performance level. These sets of machines can be mapped on a graph with L2 size on one axis and L2 cycle time on the other. All of the
%ince the CPU cycle time is not ‘being varied, the total cycle count is equivalent to the total execution time.
I 16
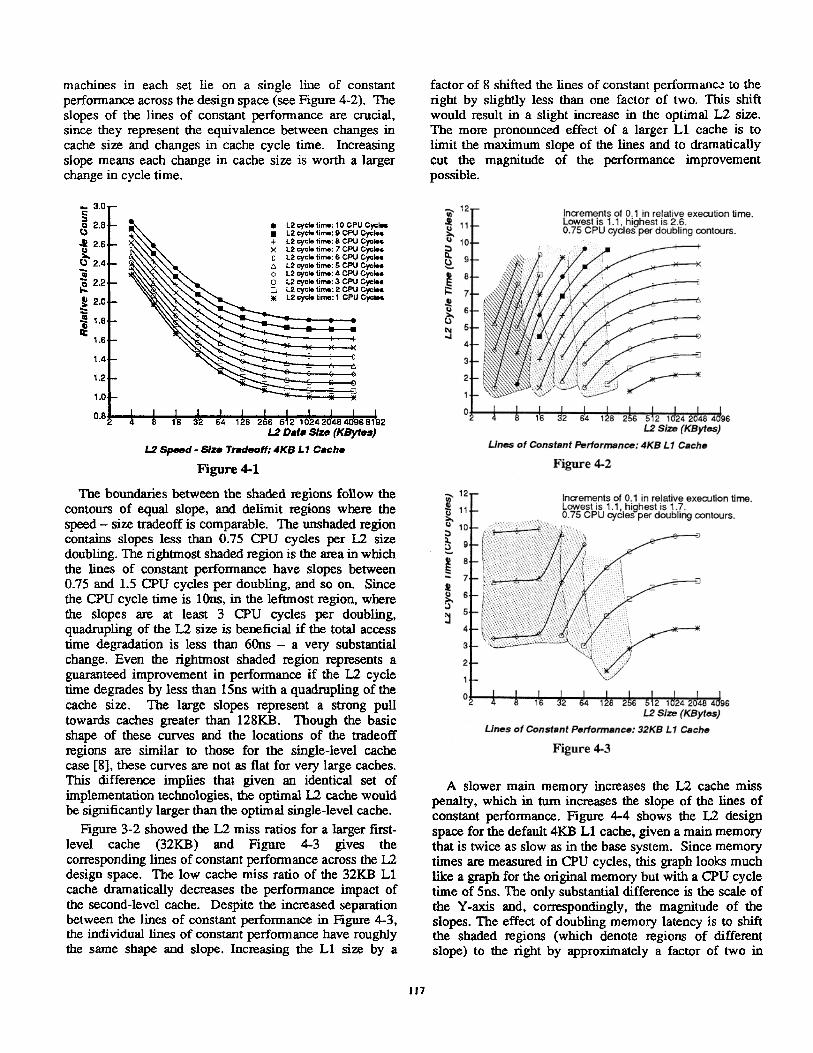
machines in each set lie on a single line of constant factor of 8 shifted the lines of constant performan= to the performance across the design space (see Figure 4-2). The right by slightly less than one factor of two. This shift slopes of the lines of constant performance arc crucial, would result in a slight increase in the optimal L2 size. since they represent the equivalence between changes in The more pronounced effect of a larger Ll cache is to cache size and changes in cache cycle time. Increasing limit the maximum slope of the lines and to dramatically slope means each change in cache size is worth a larger cut the magnitude of the performance improvement change in cycle time. possible.
I 3.0-
s 0 2.%.- : 2.6,-
e 0 2.4.-
3 ;j 2.2,- c
8 2.0.-- : d 1.0.-
’ 1.6~-
l L2 oycb time: 10 CPU Cychs n L2 oycb time: 9 CPU Cycles + L2 cycle time: 8 CPU Cycles x L2 eycb time: 7 CPU Cyc*s c L2 cycl. tma: 6 CPU Cycbr a L2 cycb time: 5 CPU Cyctm 0 L2 ycb tim: 4 CPU Cycks o L2 eycb Lima: 3 CPU Cyctm D L2 cycle lima: 2 CPU Cyc** * L2 cyoh time: 1 CPU Cyckr
Increments of 0.t in relative execution time. Lowest is 1.1, highest is 2.6. 0.75 CPU cycles per doubling contours.
1.4.-
1.2,-
l.O.-
0.0~ ’ ’ ’ ’ ’ ’ ’ ’ ’ ’ ’ 6 1'6 32 64 126 266 512 102420464U9661 2
L2 Dete Size (KBytes)
L2 Speed - Ske Tmdeoff: 4KS Ll Ceehe
Figure 4-l
L2 Size (KBytes)
Lines of Constant psrformenoe: 4KB Ll Cache
Figure 4-2
The boundaries between the shaded regions follow the contours of equal slope, and delimit regions where the speed - size tradeoff is comparable. The unshaded region contains slopes less than 0.75 CPU cycles per L2 size doubling. The rightmost shaded region is the area in which the lines of constant performance have slopes between 0.75 and 1.5 CPU cycles per doubling, and so on. Since the CPU cycle time is lOns, in the leftmost region, where the slopes are at least 3 CPU cycles per doubling, quadrupling of the L2 size is beneficial if the total access time degradation is less than 601x - a very substantial change. Even the rightmost shaded region represents a guaranteed improvement in performance if the L2 cycle time degrades by less than 151x with a quadrupling of the cache size. The large slopes represent a strong pull towards caches greater than 128KB. Though the basic shape of these curves and the locations of the tradeoff regions are similar to those for the single-level cache case [g], these curves are not as flat for very large caches. This difference implies that given an identical set of implementation technologies, the optimal L2 cache would be significantly larger than the optimal single-level cache.
T 12-- % % ” 2
lo.-
e 9.-
c :.-
-8
:
6*-
&-
-. . . . .
..l.. . .
. .--..
Lines of Constenf PeHormsnce: 32KB f.7 Ceche
Figure 4-3
Figure 3-2 showed the L2 miss ratios for a larger first- level cache (32KB) and Figme 4-3 gives the corresponding lines of constant performance across the L2 design space. The low cache miss ratio of the 32KB Ll cache dramatically decreases the performance impact of the second-level cache. Despite the increased separation between the lines of constant performance in Figure 4-3, the individual lines of constant performance have roughly the same shape and slope. Increasing the Ll size by a
A slower main memory increases the L2 cache miss penalty, which in turn increases the slope of the lines of constant performance. Figure 4-4 shows the L2 design space for the default 4KJ3 Ll cache, given a main memory that is twice as slow as in the base system. Since memory times are measured in CPU cycles, this graph looks much like a graph for the original memory but with a CPU cycle time of 5ns. The only substantial difference is the scale of the Y-axis and, correspondingly, the magnitude of the slopes. The effect of doubling memory latency is to shift the shaded regions (which denote regions of different slope) to the right by approximately a factor of two in
117

cache size. An analytical exploration of the L2 speed - size
tradeoffs begins with the general equation relating the total cycle count to the global miss rates and cycle times in a multi-level cache hierarchy. For a two-level hierarchy with negligible write effectsz, the total execution time becomes the sum of the time spent doing reads at each of the three layers of the hierarchy plus the cycles spent doing writes into the first-level cache:
In this equation, NrO,a, is the total cycle count for the execution of a program with Nbd reads (including loads and instruction fetches) and NSrorr stores, nL, and nLz are the
number of CPU cycles needed to do a read of the first- and second-level caches, ML, and Mu are the global read miss ratios of the two caches, nMMred is the number of CPU cycles to complete a fetch from main memory into the L2 cache, and ZLlwirr is the mean number of write and write stall cycles per store in the program.
lrcrements of O:l in rejative execution time. Lowest is 1.1, highest IS 2.y. 0.75 CPU cydes per doubimg contours.
3,-
2.-
l.-
0% ' ' 6 1‘6 32 64 126 266 512 lti24 2046 40 6
L2 Size (KBytes)
Lhes of Constant Pmformance: Stow Main Memory
Figure 4-4
Since the performance is a well behaved function of the cache parameters and the cycle time, the minimum execution time can be found by setting its derivative to zero. When the derivative of the cycle count with respect to the L2 cache size is set to zero, the tradeoff between the second-level cache’s size and cycle time, f=, is exposed. The performance optimal configuration is obtained when the change in the cycle count caused by increasing the time L2 cycle time balances the decrease in the mean time
2The write effects are small because we are using write- back caches with a large amount of write buffering. The writes are mostly hidden between the read requests.
for a miss:
1 %2 1 ah& --
LuRe*d ac, -- = -,,a& (2)
This equation is similar to the one for a single-level cache except for the presence of the IL1 (global) miss ratio on the right hand side of the equation - a potentially large factor. For instance, for the 4KB Ll cache used in the base machine, .& equals about 10. The reason for this
factor is easy to understand. The upstream cache filters most of the references, but does not, to first order, change the misses of the second-level cache. Because there am fewer hits, the cost of handling hits (the L2 cache cycle time) has a smaller effect on the total system performance. The marginal advantage of decreasing the cycle time has been decreased. Yet since the Ll cache does not noticeably affect the total cost of L2 misses, the marginal advantage of decreasing the L2 miss rate remains unchanged. Since an optimal cache matches these two marginal costs, the net effect of the additional factor is to shift the balance towards larger, slower caches.
To be more defmitive about characteristics of the optimal cache size we need a model that describes how the miss rate and cycle time depend on the cache size. Figure 3-1 verifies that for the range: of caches under investigation, the previously reported result that a doubling of the cache size decreases the solo miss rate by a constant factor is true, and the factor for these traces is about 0.69. To first order then, the. miss rate is roughly proportional to the one over the square-root of the cache size. One finds that the lines of constant performance for a second-level cache shift to the left by about a third of a binary order of magnitude in cache size for each doubling of the Ll size. Thus, assuming that the marginal cycle time cost of increasing the cache is independent of cache size, the Ll cache would have to increase sixteen fold for the optimal L2 size to double. Across Figures 4-2 and 4-3, the Ll size increased by a factor of 8, and the lines of constant performance shifted by a factor of 1.74 - close to the 2.04 predicted by this model. Any changes in the L2 cycle time due to this increase in the L2 size would naturally affect the speed half of the speed - size tradeoff and would either incrementally increase or decrease the optimal cache size, depending on the local characteristics of the function linking the L2 speed and L2 size.
As was noted earlier, the miss rate reaches a plateau for very large caches. For these caches, the presence of the other levels in the cache hierarchy does not change the tradeoff; further increases in the cache size are never worthwhile, regardless of how small the cycle time penalty is.
The presence of a Ll cache does not change the influence of the main memory access time, FMRRcd, on the design tradeoffs. Specifically, a change in the cache miss penalty inversely modifies the cycle time half of the balancing equation (Equation 2), thereby reducing the cost

of increasing the cache cycle time. Thus, increasing the L2 cache miss penalty again linearly skews the speed - size tradeoff towards larger caches, as it does for the single-level case.
5. Set Size Tradeoffs
This section examines the costs and benefits of set associativity for caches within a multi-level hierarchy. Following the methodology used previously, the benefits associated with the improved miss ratio due to increased set associativity can be translated into equivalent cycle time changes [6,7,8].
Figure 4-l showed the execution time of a direct- mapped, second-level cache as a function of its size cycle time. When it is compared with similar graphs for 2-way, 4-way and 8-way set associative caches, we can determine the cycle times for equivalently performing machines with the same cache sizes but different associativities. The difference between the cycle times of the two caches is the amount of time available for the implementation of set associativity. If the implementation of set associativity degrades the cycle time over the direct-mapped case by an amount grater than this break-even implementation time, then there is a net decrease in performance. The break- even times for large, single-level caches are consistently too low to warrant a set-associative implementation: generally less than 4 ns for caches greater than 16KB. Within a multi-level hierardhy, however, the break-even times can be substantially larger depending on the effectiveness of the upstream cache. Figures 5-l through 5-3 show the cumulative break-even implementation times for the base 4KB Ll cache. In this case, we represent the break-even implementation times in terms of nanoseconds instead of CPU cycles. The shaded regions are bounded by the 10 ns through 40 ns contours.
Total L2 Size (KSytas)
Set SIza 2 Cycle lha Tradeoff
Figure 5-l
For the base two-level system, and for most of the L2 sizes and cycle times of interest, a &signer has between 10 ns and 20 ns available for the implementation of eight- way set associativity. These times, which correspond to between one and two CPU cycles, are larger for small L2 sizes. When the two caches are of similar size, the direct- mapped L2 1oca.l cache miss ratio is close to one and so
the addition of set associativity causes a large relative decrease in the effective Ll cache miss penalty. Given a 4KB Ll cache, an eight-way set-associative 8KB L2 caches is substantially better at reducing the memory traffic than a direct-mapped cache of the same size.
+a, p2 p.0 4 p.3 p.4 +s~~~~~
.7 +o” p.7 $0.1 321 +la.+
., “-,B,' 9.0 ‘,lb.4 $3.0 $33 1.b $0.2 +w ,ib.7 13.4 $4.
es sb?s,,ps pi.2 13.0 $4. 3.0 +I,., 'SD.2 $1.7 $4.6 +l6. a.7 4t.7 +lo.o 426 +..2 $a
2 Tot81 L2 Size (KBytas)
Set Size 4 Tinm Cycle Tradeoff
Figure 5-2
Sot Ske 8 Cycle lhm Tradeoff
Figure 5-3
Analytically, the Ll cache miss ratio also appears in the equations for the incremental break-even times for the implementation of set associativity. The incremental break-even time, At,, , is the cycle time degradation that is allowed across a doubling of associativity, for instance from 4 to 8, as opposed to across a larger span, such as from a set size of 1 to a set size of 8. Starting with the same simple execution time model used in the previous section, it follows that this break-even increase in cycle the which exactly balances the perfomance improvement due to doubling the associativity is equal to the product of the change in the global miss ratio, the mean main memory access time, and the inverse of the Ll miss ratio:
Therefore, as the upstream cache increases in size, the downstream break-even implementation times also dramaticaIly increase. With each doubling of the upstream cache size, the incremental and cumulative break-even times are multiplied by a factor of 1.45 across the entire L2 design space. Just as in the single-level case, the break- even times increase linearly with the main memory access times.
A likely scenario for multi-level hierarchies involves
119

building the larger second-lcvcl cache out of discrete ?TL parts. Realistically, in this environment, the minimum implementation cycle time overhead for associativity is about the llns select to data-out time for a two-to-one Advanced-Schottky multiplexor [14]. In the above figures, a large portion of the design space has break-even times less than this cutoff. However, recall that a 4KB Ll size was used. Since each doubling in the Ll size decreases its miss ratio by about 28%, the L2 break-even times will increase in the same proportion. As the size of the upstream cache increases, the benefit of set associativity also increases. If the size increments between levels of the hierarchy are small, on the order of four or eight, then the cumulative break-even times are uniformly greater than 17ns, and reach as high as 4511s. If the caches are small, then the L2 cache break-even implementation times are substantially greater than their minimum. Keeping the same cache size ratio, a large second-level cache implies a larger first-level cache, so the Ll miss rate multiplier would be larger and a set associative cache might still be preferable.
To put these large break-even times into perspective, =caIl that the motivation for introducing more levels into the memory hierarchy was to reduce the mean Ll cache miss penalty to decrease the optimal Ll cache size. Adding set-associativity to the second and subsequent levels of caching can help reduce the mean Ll cache miss penalty despite a substantial increase in the deeper cache’s cycle time. The infrequency of access of L2 dramatically increases the importance of a low miss rate over a short cycle time.
6. Conclusions
Multi-level caches provide one means of dealing with the large difference between the CPU cycle time and the access time of the main memory. By providing a second level of caching, one can reduce the cost of the Grst level misses, which in turn improves the overall system performance. Furthermore, by reducing the Ll cache miss penalty, the optimal Ll size is also reduced, increasing the viability of high-performance RISC CPUs coupled with small, short cycle time Ll caches. As with single-level cache design, to optimize system performance the designer must ca&ully weigh the tradeoff between increased hit rates and faster cache cycle times throughout the memory hierarchy. For a multi-level cache, the optimization becomes slightly more complex, since an upstream cache affects the reference pattern seen by the next cache, and hence changes its optimal design point.
One way to partially decouple the caches is to measure the global miss ratios of the caches - the ratio of the number of cache misses to the number of CPU references. This ratio is relatively independent of the upstream caches and is close to the miss ratio that results if all the upstream caches were removed. Although the number of misses that leave a cache is relatively unaffected by upstream
caches, the upstream caches reduce the number of references that are sent to the cache. The resulting large change in the local miss rate modifies, the balance between the change in cycle time and the change in the miss ratio that exists at the optimal design point. The reduction in the number of cache hits dramatically increases the importance of a low miss rate in comparison to a short cycle time for downstream caches.
Equating the effect of the upstream cache to a change in cache size is straightforward. The addition of a 4KB Ll cache, with a 10% miss rate, shifts the lines of constant performance to the right by about se.ven binary orders of magnitude from the single-level case, all things being equal. Locally, a doubling in the Ll cache size is shown to shift the curves of constant perfoxmance about 0.24 powers of two to the right. Thus, the presence of an Ll cache moves the optimal design point for the second-level cache toward larger, slower caches.
Improving the miss rate of the upstream cache increases the viability of set-associative second-level caches. Break- even implementation times arc multiplied by the inverse of the previous cache’s global cache miss ratio. Increasing the set associativity, even at the expense of a significant increment in the L2 cycle time, minimizes the mean Ll cache miss penalty, and therefore helps reduce the optimal Ll speed and size, as desired,
Unfortunately, but not unexpectedly, the empirical and analytical results indicate that the strong motivation to increase the L2 cache size at the expense of its cycle time remains relatively unchanged from the analysis of a single-level hierarchy. However, as the L2 cycle time gets much above 4 CPU cycles, the optimal Ll cache size is significantly increased above its minimum. The magnitude slopes of lines of constant performance, and the optimal L2 speeds and sizes that they forebode, indicate that even with two-level hierarchies the optimal Ll caches will be somewhat larger and slower than computer implementors might desire.
References
1. Agarwal, A., Sites, R., Horowitz, M. ATUM: A New Technique for Capturing Address Traces Using Microcode. Proceedings of the 13th Annual International Symposium on Computer Architecture, Tokyo, Japan, June, 1986, pp. 119-129.
2. Agarwal, A. Analysis of Cache Performance for Operating Systems andMultiprogramming. Ph.D. Th., Stanford University, May 1987. Available as Technical Report CSL-TR-87-332.
3. Baer, J.-L., Wang W.-H. Architectural Choices for Multi-Level Cache Hierarchies. Tech. Rept. TR-87-01-04, Department of Computer Science, University of Washington, January, 1987.
120

4. Colglazicr, D.J. A Perfcrmance Analysis of Multiprocessors using Two-Level Caches. Tech. Rept. CSG-36, Computer Systems Group, University of Illinios, Urbana - Champaign, August, 1984.
5. Gecsei, J. “Determining Hit Ratios for Multilevel Hierarchies”. IBM Journal of Research and Development 18,4 (July 1974), 316-327.
6. Hill, M.D. Aspects of Cache Memory and Instruction BufSer Performance. Ph.D. Th., University of California, Berkeley, November 1987. Available as Technical Report UCB/CSD 87/38 1.
7. Hill, M.D. “The Case for Direct-Mapped Caches”. IEEE Computer 21,12 (December 1988), 25-41.
8. Przybylski, S., Horowitz, M., Hennessy J. Performance Tradeoffs in Cache Design. Proceedings of the 15th Amural International Symposium on Computer Architecture, June, 1988, pp. 290-298.
9. Przybylski, S. Performance-Direct&Memory Hierarchy Design. Ph.D. Th., Stanford University, September 1988. Available as Technical Report CSL m-88-366.
10. Short, R.T. A Simulation Study of Multilevel Cache Memories. Department of Computer Science, University of Washington, January, 1987.
11. Short, R.T., Levy, H.M. A Simulation Study of Two- Level Caches. Proceedings of the 15th Annual International Symposium on Computer Architecture, June, 1988, pp. 81-89.
12. Smith, A.J. “Cache Memories”. ACM Computing Surveys 14,3 (September 1982), 473-530.
13. Smith, A.J. Problems, Directions and Issues in Memory Hierarchies. Proceedings of the 18th Annual Hawaii Conference on System Sciences, 1985, pp. 468-476.
14. ALSIAS Logic Data Book. Texas Instmments, Da&s, TE., 1986.
15. Wilson, A.W. Jr. Hierarchical Cache/Bus Architecture for Shared Memory Multiprocessors, Proceedings of the 14th Annual International Symposium on Computer Architecture, June, 1987, pp. 244-252.
121
Copyright © 2022 FDOKUMEN