.. ;'.' ~.._....\.,.'.'..~-:"'.".,-.'.'."..,.,...,' .'.'.' ..'..•.;."' - Agricultural Marketing ...
Upload
khangminh22Category
view
4download
0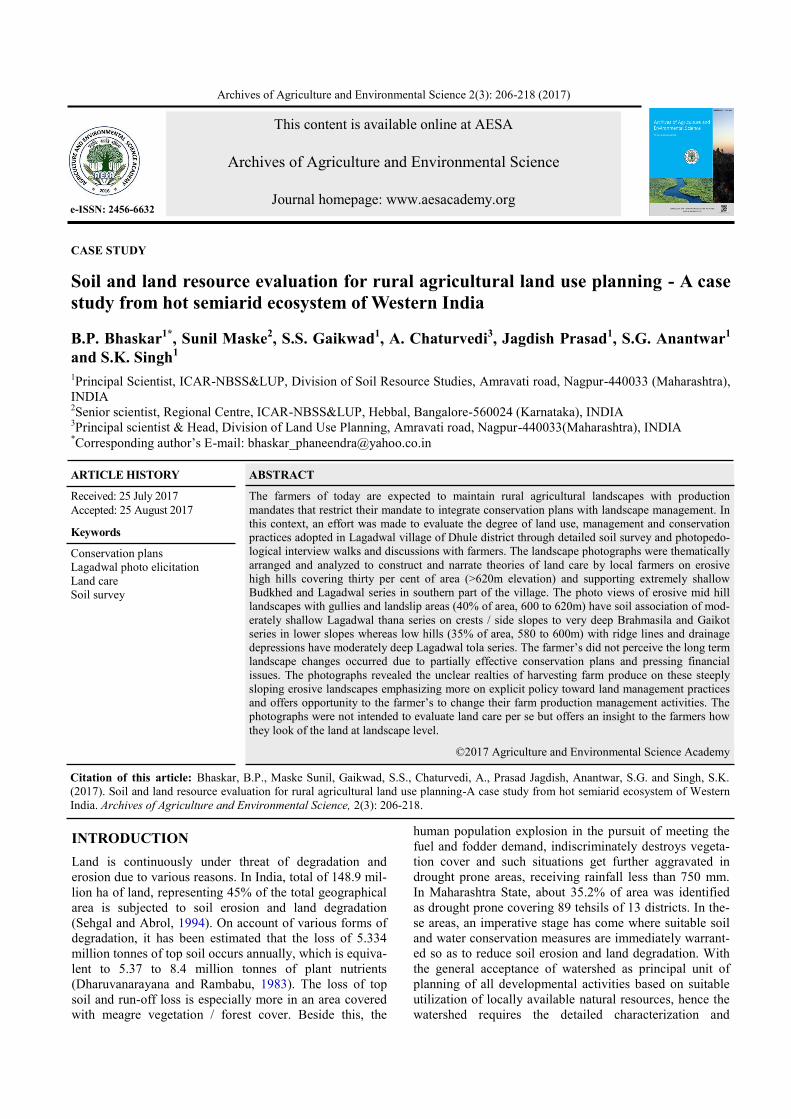
INTRODUCTION
Land is continuously under threat of degradation and
erosion due to various reasons. In India, total of 148.9 mil-
lion ha of land, representing 45% of the total geographical
area is subjected to soil erosion and land degradation
(Sehgal and Abrol, 1994). On account of various forms of
degradation, it has been estimated that the loss of 5.334
million tonnes of top soil occurs annually, which is equiva-
lent to 5.37 to 8.4 million tonnes of plant nutrients
(Dharuvanarayana and Rambabu, 1983). The loss of top
soil and run-off loss is especially more in an area covered
with meagre vegetation / forest cover. Beside this, the
human population explosion in the pursuit of meeting the
fuel and fodder demand, indiscriminately destroys vegeta-
tion cover and such situations get further aggravated in
drought prone areas, receiving rainfall less than 750 mm.
In Maharashtra State, about 35.2% of area was identified
as drought prone covering 89 tehsils of 13 districts. In the-
se areas, an imperative stage has come where suitable soil
and water conservation measures are immediately warrant-
ed so as to reduce soil erosion and land degradation. With
the general acceptance of watershed as principal unit of
planning of all developmental activities based on suitable
utilization of locally available natural resources, hence the
watershed requires the detailed characterization and
CASE STUDY
Soil and land resource evaluation for rural agricultural land use planning - A case
study from hot semiarid ecosystem of Western India
B.P. Bhaskar1*, Sunil Maske2, S.S. Gaikwad1, A. Chaturvedi3, Jagdish Prasad1, S.G. Anantwar1
and S.K. Singh1 1Principal Scientist, ICAR-NBSS&LUP, Division of Soil Resource Studies, Amravati road, Nagpur-440033 (Maharashtra),
INDIA 2Senior scientist, Regional Centre, ICAR-NBSS&LUP, Hebbal, Bangalore-560024 (Karnataka), INDIA 3Principal scientist & Head, Division of Land Use Planning, Amravati road, Nagpur-440033(Maharashtra), INDIA *Corresponding author‟s E-mail: [email protected]
Citation of this article: Bhaskar, B.P., Maske Sunil, Gaikwad, S.S., Chaturvedi, A., Prasad Jagdish, Anantwar, S.G. and Singh, S.K.
(2017). Soil and land resource evaluation for rural agricultural land use planning-A case study from hot semiarid ecosystem of Western
India. Archives of Agriculture and Environmental Science, 2(3): 206-218.
This content is available online at AESA
Archives of Agriculture and Environmental Science
Journal homepage: www.aesacademy.org
Archives of Agriculture and Environmental Science 2(3): 206-218 (2017)
e-ISSN: 2456-6632
ARTICLE HISTORY
Received: 25 July 2017
Accepted: 25 August 2017
Keywords
Conservation plans
Lagadwal photo elicitation
Land care
Soil survey
ABSTRACT
The farmers of today are expected to maintain rural agricultural landscapes with production
mandates that restrict their mandate to integrate conservation plans with landscape management. In
this context, an effort was made to evaluate the degree of land use, management and conservation
practices adopted in Lagadwal village of Dhule district through detailed soil survey and photopedo-
logical interview walks and discussions with farmers. The landscape photographs were thematically
arranged and analyzed to construct and narrate theories of land care by local farmers on erosive
high hills covering thirty per cent of area (>620m elevation) and supporting extremely shallow
Budkhed and Lagadwal series in southern part of the village. The photo views of erosive mid hill
landscapes with gullies and landslip areas (40% of area, 600 to 620m) have soil association of mod-
erately shallow Lagadwal thana series on crests / side slopes to very deep Brahmasila and Gaikot
series in lower slopes whereas low hills (35% of area, 580 to 600m) with ridge lines and drainage
depressions have moderately deep Lagadwal tola series. The farmer‟s did not perceive the long term
landscape changes occurred due to partially effective conservation plans and pressing financial
issues. The photographs revealed the unclear realties of harvesting farm produce on these steeply
sloping erosive landscapes emphasizing more on explicit policy toward land management practices
and offers opportunity to the farmer‟s to change their farm production management activities. The
photographs were not intended to evaluate land care per se but offers an insight to the farmers how
they look of the land at landscape level.
©2017 Agriculture and Environmental Science Academy
207
inventorization of natural resources (Patil et al., 2010;
Manchanda et al., 2002). Mapping and assessment of
erosion prone areas is pre-requisite for planning soil
conservation and watershed management programs (Surya
et al., 2008) and several studies reported potentials use of
remote sensing for characterization and management of
land resources at watershed level (Srinivasa et al., 2008;
Elvis et al., 2009; Solankhe et al., 2009). In recent times,
the necessity of detailed soil survey and soil mapping at
village / watershed level for holistic farm planning taking
into account climate landscape-soil characteristics (Soil
Health Card) and Socio-economic conditions of the farm
holdings linked to Kisan card credit support is therefore
obvious, urgent and cannot brook any further delay
(Velayutham, 2012). The soil series information was used
in evaluating rice based cropping systems in Assam and
proved the usefulness of soil series for agrotechnology
transfer (Dharam Singh et al., 2014 ) and in cotton produc-
tion systems of Yavatmal district (Bhaskar et al., 2014).
The potentials and constraints of basaltic landscape evalua-
tions for agriculture and or rural livelihood in parts of
Maharashtra is well recognized (Bhaskar et al., 2011). In
the last fifty years, the rural policies and agri-
environmental programs (AES) have brought agro- trans-
formations in terms of landscape management and produc-
tion of major commodities in hot semiarid eco-region of
drought prone areas having length of growing period of
120 to 150 days (K4Dd4, Velayutham et al., 1999;
Hunziker and Kienast, 1999). This particular district ac-
counts for the highest percentage of scheduled tribes in the
state. Out of the total district population of 20,50,294,
scheduled tribe population is 831,064 or 40.53 percent
(Walters, 2013). The cultivated area is 4.64 lakh hectares
of total area (806300ha) with 65% of area under food crops
and 56 per cent of land holding less than 2 ha. The agricul-
tural landscape pictures in rural sectors of this part of
Maharashtra offers an opportunity to look into the reflec-
tive realties of drought and difficulties faced by farmers
with a popular idea of how hard it is to farm. The policies
impose the basic obligations on farmers to keep the open
and well managed but agri-developmental programmes are
poorly implemented with multiple aims in the farming. The
present study focuses on the visual perception of cultivated
lands in Lagadwal village of Dhule district, Maharashtra
with the objectives of interpreting and managing produc-
tion value of rural landscapes for conservation at farm
level.
Soil survey describes soil characteristics in a given area,
classify soils according to a standard system of classifica-
tion, plot the boundaries of soils on a map and makes
predictions about the behaviour of soils (Soil Survey
Division Staff, 1993). The physiographic surveys produce
descriptions of soils in a discrete spatial model without
informing variation within the mapping unit (Bregt, 1992).
The soil survey can be interpreted in terms of potential
productivity and land evaluation for assessment. The storie
index assesses the productivity of soils considering four
factors such as Factor A (the degree of soil profile develop-
ment), Factor B (surface texture), Factor C (slope) and
Factor X (other soil and landscape conditions viz., drain-
age, erosion, fertility, alkalinity, acidity and micro relief).
A score ranging from 0 to 100 % is determined for each
factor and scores are then multiplied together to generate
rating index (Storie, 1978). Later these indices were
revised that generates ratings digitally (O‟Geen and
Southard, 2005). The storie indices were proved to be use-
ful in evaluating soil series suitability for maize, soybean,
cowpea and groundnut in three soil series of Northern
region of Ghana (Ziblim et al., 2012). Productivity ratings
(based on physical and chemical properties of soils,
Huddleston, 1982) are reflection of real value for agricul-
ture or forestry (Miller, 1984) but later recognizing the
importance of management in obtaining economic yields,
CER values ( crop equivalent rating) were used as index of
evaluating soils in Minnesota (Rust et al., 1984). These
mapping units are evaluated as per the land evaluation
classification for different kinds of land use systems (FAO,
1983; van Diepen et al., 1991 and Murphy, 1993). Combi-
nation of the FAO Framework for Land Evaluation with
computer technology and expert knowledge on specific
soils and crops has been demonstrated by several authors
(Wood and Dent, 1983, Jones and Thomasson, 1987, Hong
Cheng, 1989 and Robert, 1989). However, transferability
of the analyses is limited because the expert knowledge
applies only to the conditions for which the systems have
been developed and calibrated. The UNCED conference
(1992) - Agenda 21 identified the importance of widely
accepted indicators by which to monitor the status of the
environment. Recently, the World Bank initiated the devel-
opment of Land Quality Indicators (LQIs) to enable moni-
toring of changes in land resources and the sustainability
of managed ecosystems (Pieri et al., 1995). Earlier,
Dumanski (1993) set down generic indicators that could be
developed as „international standards for evaluation and
monitoring of SLM‟: crop yield (trend and variability),
nutrient balance, maintenance of soil cover, soil quality /
quantity, water quality / quantity, net farm profitability,
use of conservation practices. Such indicators may be used
as objectives and parameters in the construction of an
„SLM Model‟ (De Bie et al., 1995). The decline in re-
serves of quality arable land result from the significant loss
of agricultural land through degrading land management
practices (Scherr and Yadav, 1996), from competition for
these reserves for use in forestry, watershed management,
maintenance of biodiversity and from the diversion of ara-
ble land for urban and industrial use. The negative
assessment generally associated with farming, forestry and
grazing had been largely developed in the context of mod-
ern agriculture. The speed and extension of technological,
cultural and economic changes that have occurred in recent
decades are threatening not only the environment but also
the landscapes and rural societies associated with them
(Agnoletti, 2006, 2012 and Antrop, 2006). There is a need
to develop sustainable land management (SLM) systems
through three stage activities involving land character
assessment, participatory activities for community driven
landscape scenarios and modeling of landscape scenarios
and tradeoffs as integral part of the social-ecological
framework, provide opportunities for social learning and
capacity building (Bohnet and Smith, 2007). It was also
B.P. Bhaskar et al. /Arch. Agr. Environ. Sci., 2(3): 206-218 (2017)
208
B.P. Bhaskar et al. /Arch. Agr. Environ. Sci., 2(3): 206-218 (2017)
reported that individual perceptions and the relationship
between visual concepts and aesthetic values of landscape
were to be reliable predictors in case of Belgium (Sevenant
and Antrop, 2010). However, in areas that are not condu-
cive to be simplified and intensive crop production, a mar-
ginalization process has long been underway that has
resulted in the abandonment of rural settlements and activi-
ty (Agnoletti, 2012). The soil information delivery and
education must use modern information delivery tech-
niques coupled with simple landscape-based presentations
of interpreted data (Drohan et al., 2010). It was further said
that the delivery of soil information must be with concep-
tual toposequence models with special purpose soil classi-
fication linked to identifying keys at local level (Grealish
et al., 2015). Although there are number of studies on visu-
al perception of agricultural landscapes, the agricultural
landscape preferences based on visual concepts were
reported and also explained the factors underlying on visu-
al preferences by the local community in Israel (Rechtman,
2013). In land evaluation studies, the agricultural land-
scape photographs in conjunction with soil surveys were
used to measure the perception of farmer‟s about the quali-
ty of landscapes (Tveit et al., 2009; Eija et al., 2014). The
relevance and feasibility of landscape planning in address-
ing and resolving the problems of rural communities in
Ukarane was highlighted and advocated to develop land-
scape plans (Rudenko et al., 2014). Later on, the strong
links of rural development with landscape planning was
discussed in length by Rega (2014). The objective of
present study was therefore to characterize agri-landscape
systems and their dynamics by up-scaling landscape anal-
yses at farm level and used agri-landscape systems to iden-
tify potential zones where reciprocal relationships between
land uses and landscape features were clear. Hence, in this
case study an attempt was made to characterize the agri-
landscape systems in a part of hot semiarid eco system of
Lagadwal village, Dhule district, Maharashtra, India.
MATERIALS AND METHODS
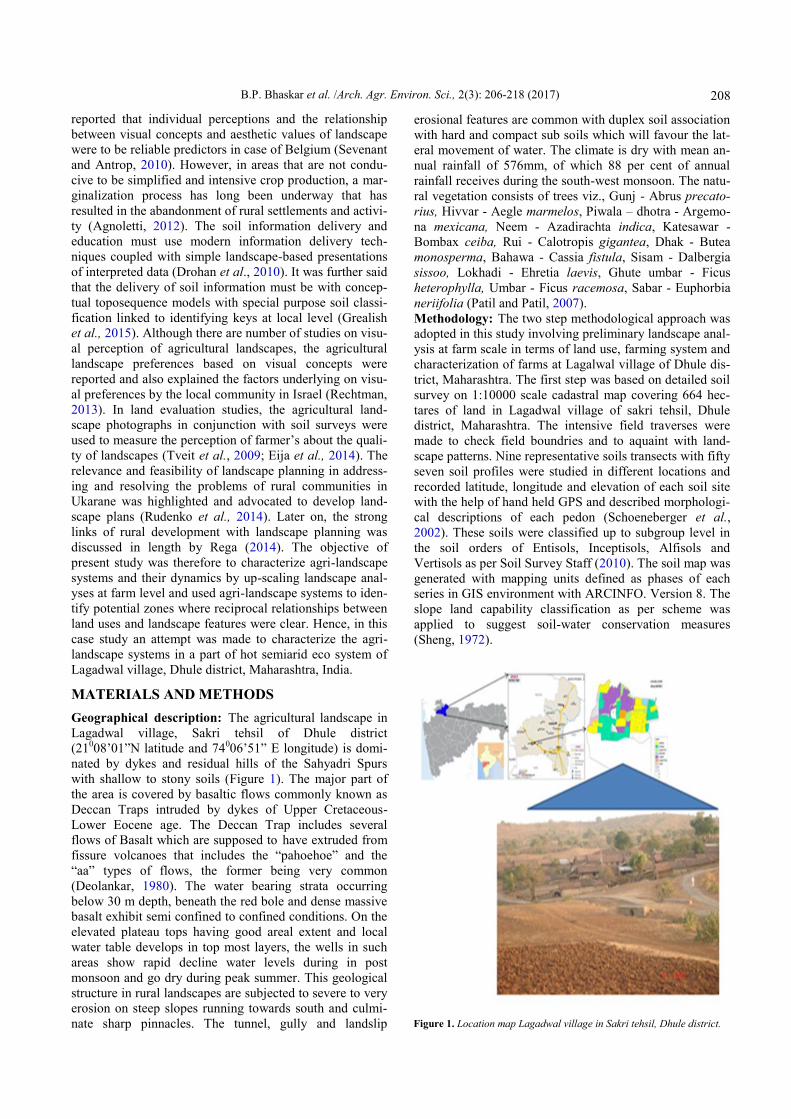
Geographical description: The agricultural landscape in
Lagadwal village, Sakri tehsil of Dhule district
(21008‟01”N latitude and 74006‟51” E longitude) is domi-
nated by dykes and residual hills of the Sahyadri Spurs
with shallow to stony soils (Figure 1). The major part of
the area is covered by basaltic flows commonly known as
Deccan Traps intruded by dykes of Upper Cretaceous-
Lower Eocene age. The Deccan Trap includes several
flows of Basalt which are supposed to have extruded from
fissure volcanoes that includes the “pahoehoe” and the
“aa” types of flows, the former being very common
(Deolankar, 1980). The water bearing strata occurring
below 30 m depth, beneath the red bole and dense massive
basalt exhibit semi confined to confined conditions. On the
elevated plateau tops having good areal extent and local
water table develops in top most layers, the wells in such
areas show rapid decline water levels during in post
monsoon and go dry during peak summer. This geological
structure in rural landscapes are subjected to severe to very
erosion on steep slopes running towards south and culmi-
nate sharp pinnacles. The tunnel, gully and landslip
erosional features are common with duplex soil association
with hard and compact sub soils which will favour the lat-
eral movement of water. The climate is dry with mean an-
nual rainfall of 576mm, of which 88 per cent of annual
rainfall receives during the south-west monsoon. The natu-
ral vegetation consists of trees viz., Gunj - Abrus precato-
rius, Hivvar - Aegle marmelos, Piwala – dhotra - Argemo-
na mexicana, Neem - Azadirachta indica, Katesawar -
Bombax ceiba, Rui - Calotropis gigantea, Dhak - Butea
monosperma, Bahawa - Cassia fistula, Sisam - Dalbergia
sissoo, Lokhadi - Ehretia laevis, Ghute umbar - Ficus
heterophylla, Umbar - Ficus racemosa, Sabar - Euphorbia
neriifolia (Patil and Patil, 2007).
Methodology: The two step methodological approach was
adopted in this study involving preliminary landscape anal-
ysis at farm scale in terms of land use, farming system and
characterization of farms at Lagalwal village of Dhule dis-
trict, Maharashtra. The first step was based on detailed soil
survey on 1:10000 scale cadastral map covering 664 hec-
tares of land in Lagadwal village of sakri tehsil, Dhule
district, Maharashtra. The intensive field traverses were
made to check field boundries and to aquaint with land-
scape patterns. Nine representative soils transects with fifty
seven soil profiles were studied in different locations and
recorded latitude, longitude and elevation of each soil site
with the help of hand held GPS and described morphologi-
cal descriptions of each pedon (Schoeneberger et al.,
2002). These soils were classified up to subgroup level in
the soil orders of Entisols, Inceptisols, Alfisols and
Vertisols as per Soil Survey Staff (2010). The soil map was
generated with mapping units defined as phases of each
series in GIS environment with ARCINFO. Version 8. The
slope land capability classification as per scheme was
applied to suggest soil-water conservation measures
(Sheng, 1972).
Figure 1. Location map Lagadwal village in Sakri tehsil, Dhule district.

209
The field was supported by an interview with the local
farmers to pinpoint the landscape conservation to land-
scape change and the agricultural typology at farm level.
Each geo reference point is linked with photographical file
so as to obtain description of landscape and identification
of land use change at farm level. In the second step, the
landscape photographs during survey were taken and
analyzed to form personal construct theory for deriving
conservation plans (Dalton and Dunnett, 1990). This
involved grouping of photographs under thematic headings
and ordering each group into levels of significance. The
visual preferences of landscape components were identi-
fied and analyzed to do whole farming in accordance with
soil capabilities and connecting farms with central corri-
dors. The results of landscape analysis with expert
knowledge in developing agricultural planning was inte-
grated with local knowledge to draw main agricultural sys-
tems contributing to the landscape in Lagadwal village
directly onto the soil map. The base map showing the
morphological and topographical characteristics are easy to
understand by local farmers and facilitate good interaction
between landscape and agricultural systems that possibly
contributed to change landscapes at farm level. The
schematic methodology is given as under (Figure 2).
RESULTS AND DISCUSSION
Soil landscape systems: A soil landscape is a mapping
unit that has recognizable and specifiable topographic and
soil properties which can be meaningfully represented on a
map and described by concise statements (Tulau, 1994).
Soil landscapes are not uniform in terrain and soil charac-
teristics, but have a definable pattern of variation. For in-
stance, the Lagadwal landscape ranges from gently sloping
ridge crests to very steep side slopes and narrow drainage
lines (Figure 3a). There is considerable variation in slope
gradient, soil depth, drainage characteristics and hence the
properties which determine capability. The village covers
664 hectares of land (ha) having high hills in southern part
(>620m above mean sea level) with distinct steep slopes of
40 to 60 per cent and covers more than 306.3 ha. The
steeper side slopes cover ten per cent of total area with
narrow incised drainage lines (forty six per cent of area)
supporting extremely shallow Budkhed (P1) and Lagadwal
series (P2). The mid hills (600 to 620m) covers thirteen per
cent of area with four land forms viz., broad crests, round-
ed crests and side slopes, gently undulating uplands and
lower slopes. These land forms have moderately shallow
Lagawal Thana series (P3) on crests and side slopes Gaikot
(P4) to and Lagadwal tola (P5) in lower slopes. The low
hills (580 to 600m) have ridge lines and drainage depres-
sions covering thirty five per cent of area with soil associa-
tions of moderately deep Navgaon (P6) and Brahmasila
series (P7). These landscapes show varying degrees of
sheet erosion on undulating plains, gullies near drainage
lines and rocky exposures, stone cover on hill tops and
ridges, crests and side slopes (Figure 4). These agricultural
landscapes suggest themselves as measures to estimate the
impacts of current land use activities on steep lands with
posing questions such as (i) is production sufficient to
subsistence or profit, (ii) does the ground cover capable of
B.P. Bhaskar et al. /Arch. Agr. Environ. Sci., 2(3): 206-218 (2017)
Figure 2. Flow chart of conservation measures at landscape level
based on slope land capability.
Figure 3. Field photos of landforms in Lagadwal village; 3a. High hills: (i) severely eroded summit portions with sparse vegetation, (ii) steep side
slopes with narrow incised 1st order drainage lines and (iii) undulated,
severely eroded back slopes; 3b. Mid hills: (i) broad crests and side slopes (ii) round crests and upper slopes (shoulder) and (iii) undulating
back slopes with rises and lows; 3c. Low hills Li) narrow ridges and side
slopes, (ii) foot slopes along drainage lines and (iii) drainage depressions.
P1.Budkhed series
P3. Lagadwal series
P4.Brahmasila series
P5.Gaikot series
P6.Lagadwal tola series
P1.–Lithic
Ustorthents
P2. Navgaon series
P2.Typic Haplustalfs
P3.Typic
Ustorthents
P4. Chromic Haplusterts
P5.Typic
Haplusterts
P6.Leptic
Haplusterts
Figure 4. Soil-landscape systems in Lagadwal village.
210
B.P. Bhaskar et al. /Arch. Agr. Environ. Sci., 2(3): 206-218 (2017)
maintaining good soil conditions and (iii) is the soil
erosion a cause of declining crop productivity under semi-
arid climate.
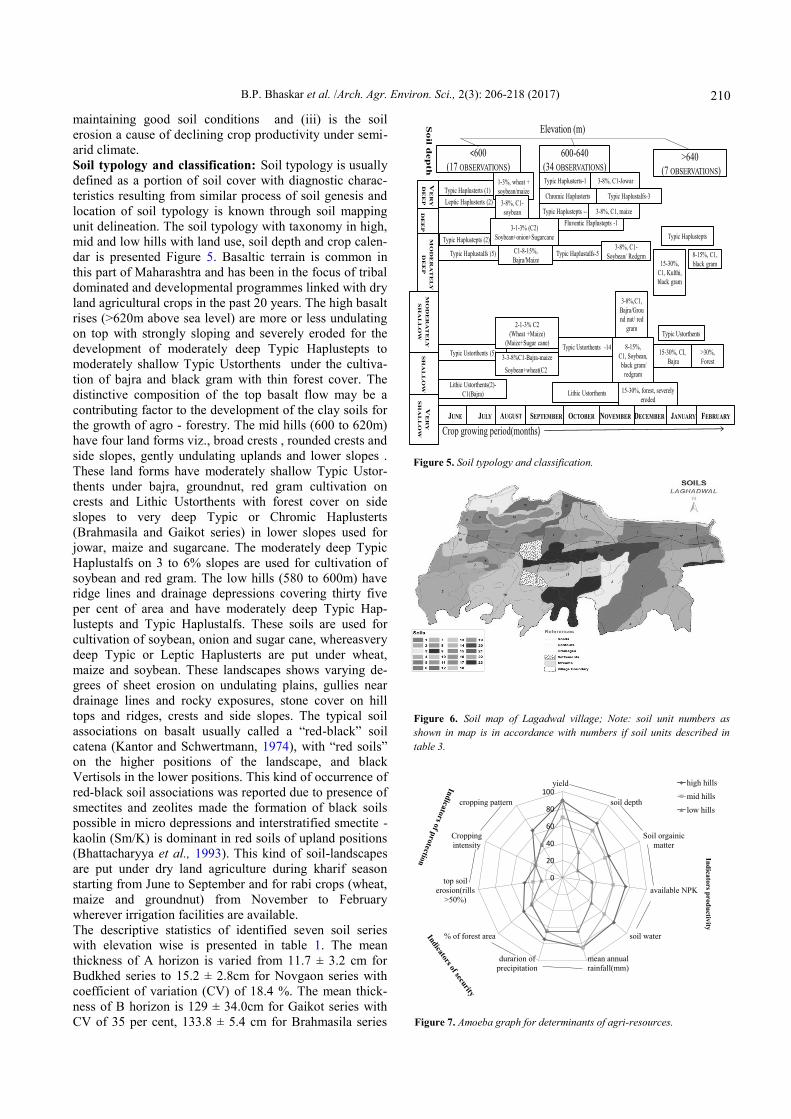
Soil typology and classification: Soil typology is usually
defined as a portion of soil cover with diagnostic charac-
teristics resulting from similar process of soil genesis and
location of soil typology is known through soil mapping
unit delineation. The soil typology with taxonomy in high,
mid and low hills with land use, soil depth and crop calen-
dar is presented Figure 5. Basaltic terrain is common in
this part of Maharashtra and has been in the focus of tribal
dominated and developmental programmes linked with dry
land agricultural crops in the past 20 years. The high basalt
rises (>620m above sea level) are more or less undulating
on top with strongly sloping and severely eroded for the
development of moderately deep Typic Haplustepts to
moderately shallow Typic Ustorthents under the cultiva-
tion of bajra and black gram with thin forest cover. The
distinctive composition of the top basalt flow may be a
contributing factor to the development of the clay soils for
the growth of agro - forestry. The mid hills (600 to 620m)
have four land forms viz., broad crests , rounded crests and
side slopes, gently undulating uplands and lower slopes .
These land forms have moderately shallow Typic Ustor-
thents under bajra, groundnut, red gram cultivation on
crests and Lithic Ustorthents with forest cover on side
slopes to very deep Typic or Chromic Haplusterts
(Brahmasila and Gaikot series) in lower slopes used for
jowar, maize and sugarcane. The moderately deep Typic
Haplustalfs on 3 to 6% slopes are used for cultivation of
soybean and red gram. The low hills (580 to 600m) have
ridge lines and drainage depressions covering thirty five
per cent of area and have moderately deep Typic Hap-
lustepts and Typic Haplustalfs. These soils are used for
cultivation of soybean, onion and sugar cane, whereasvery
deep Typic or Leptic Haplusterts are put under wheat,
maize and soybean. These landscapes shows varying de-
grees of sheet erosion on undulating plains, gullies near
drainage lines and rocky exposures, stone cover on hill
tops and ridges, crests and side slopes. The typical soil
associations on basalt usually called a “red-black” soil
catena (Kantor and Schwertmann, 1974), with “red soils”
on the higher positions of the landscape, and black
Vertisols in the lower positions. This kind of occurrence of
red-black soil associations was reported due to presence of
smectites and zeolites made the formation of black soils
possible in micro depressions and interstratified smectite -
kaolin (Sm/K) is dominant in red soils of upland positions
(Bhattacharyya et al., 1993). This kind of soil-landscapes
are put under dry land agriculture during kharif season
starting from June to September and for rabi crops (wheat,
maize and groundnut) from November to February
wherever irrigation facilities are available.
The descriptive statistics of identified seven soil series
with elevation wise is presented in table 1. The mean
thickness of A horizon is varied from 11.7 ± 3.2 cm for
Budkhed series to 15.2 ± 2.8cm for Novgaon series with
coefficient of variation (CV) of 18.4 %. The mean thick-
ness of B horizon is 129 ± 34.0cm for Gaikot series with
CV of 35 per cent, 133.8 ± 5.4 cm for Brahmasila series
VE
RY
DE
EP
D
EE
P
MO
DE
RA
TE
LY
DE
EP
S
HA
LL
OW
M
OD
ER
AT
EL
Y
SH
AL
LO
W
VE
RY
SH
AL
LO
W
<600
(17 OBSERVATIONS) >640
(7 OBSERVATIONS)
600-640
(34 OBSERVATIONS)
Chromic Haplusterts Typic Haplusterts (1)
Typic Haplustepts (2)
Typic Haplustalfs (5)
Typic Ustorthents (5)
Fluventic Haplustepts -1
Leptic Haplusterts (2)
Typic Haplustepts --
Typic Haplustalfs-5
Lithic Ustorthents(2)-
C1(Bajra)
Typic Ustorthents -14
Lithic Ustorthents
Typic Haplusterts-1
2-1-3% C2
(Wheat +Maize)
(Maize+Sugar cane)
3-3-8%C1-Bajra-maize
Soybean+wheat(C2)
3-1-3% (C2)
Soybean+onion+Sugarcane
C1-8-15%,
Bajra/Maize
1-3%, wheat +
soybean/maize
3-8%, C1-
soybean
3-8%, C1-Jowar
3-8%, C1, maize
Typic Haplustalfs-3
3-8%, C1-
Soybean/ Redgrm
3-8%,C1,
Bajra/Grou
nd nut/ red
gram
8-15%,
C1, Soybean,
black gram/
redgram
15-30%, forest, severely
eroded
Typic Haplustepts
15-30%,
C1, Kulthi,
black gram
8-15%, C1,
black gram
Typic Ustorthents
15-30%, CI,
Bajra
>30%,
Forest
JUNE JULY AUGUST SEPTEMBER DECEMBER NOVEMBER OCTOBER JANUARY FEBRUARY
Elevation (m)
So
il dep
th
Crop growing period(months)
Figure 5. Soil typology and classification.
Figure 6. Soil map of Lagadwal village; Note: soil unit numbers as
shown in map is in accordance with numbers if soil units described in
table 3.
0
20
40
60
80
100yield
soil depth
Soil orgainic
matter
available NPK
soil water
mean annual
rainfall(mm)
durarion of
precipitation
% of forest area
top soil
erosion(rills
>50%)
Cropping
intensity
cropping pattern
high hills
mid hills
low hills
Ind
icato
rs pro
du
ctivity
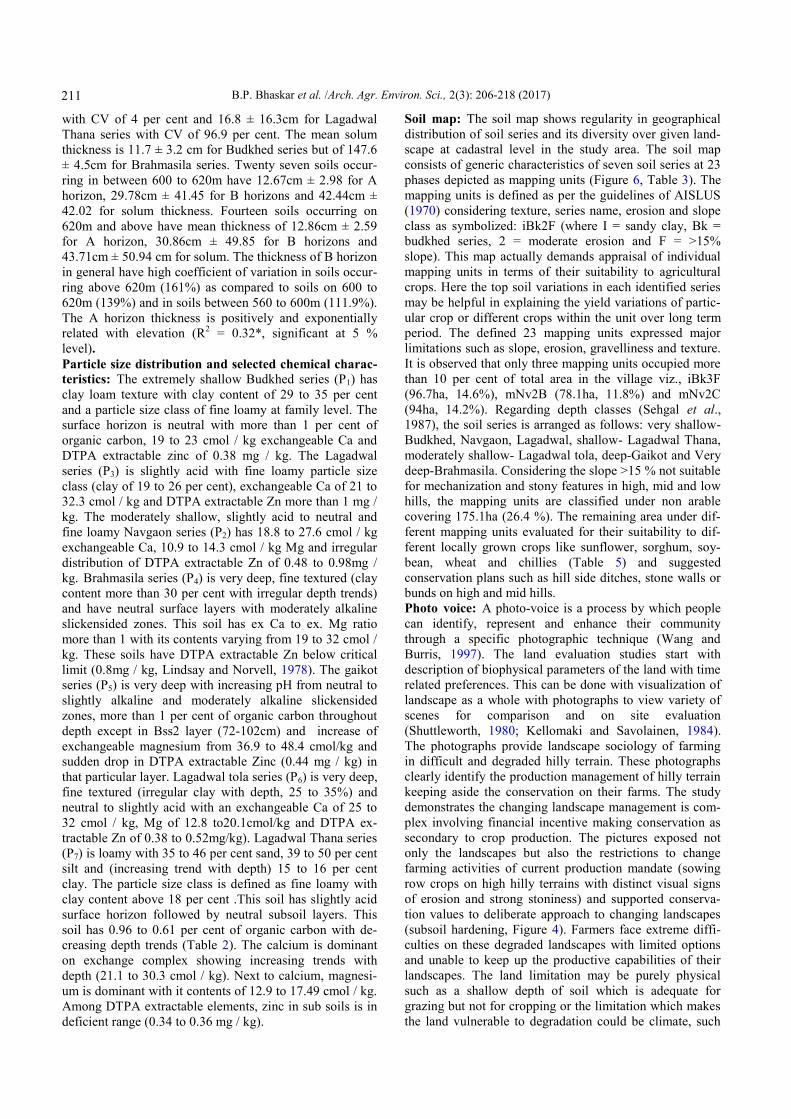
Figure 7. Amoeba graph for determinants of agri-resources.
211
B.P. Bhaskar et al. /Arch. Agr. Environ. Sci., 2(3): 206-218 (2017)
with CV of 4 per cent and 16.8 ± 16.3cm for Lagadwal
Thana series with CV of 96.9 per cent. The mean solum
thickness is 11.7 ± 3.2 cm for Budkhed series but of 147.6
± 4.5cm for Brahmasila series. Twenty seven soils occur-
ring in between 600 to 620m have 12.67cm ± 2.98 for A
horizon, 29.78cm ± 41.45 for B horizons and 42.44cm ±
42.02 for solum thickness. Fourteen soils occurring on
620m and above have mean thickness of 12.86cm ± 2.59
for A horizon, 30.86cm ± 49.85 for B horizons and
43.71cm ± 50.94 cm for solum. The thickness of B horizon
in general have high coefficient of variation in soils occur-
ring above 620m (161%) as compared to soils on 600 to
620m (139%) and in soils between 560 to 600m (111.9%).
The A horizon thickness is positively and exponentially
related with elevation (R2 = 0.32*, significant at 5 %
level).
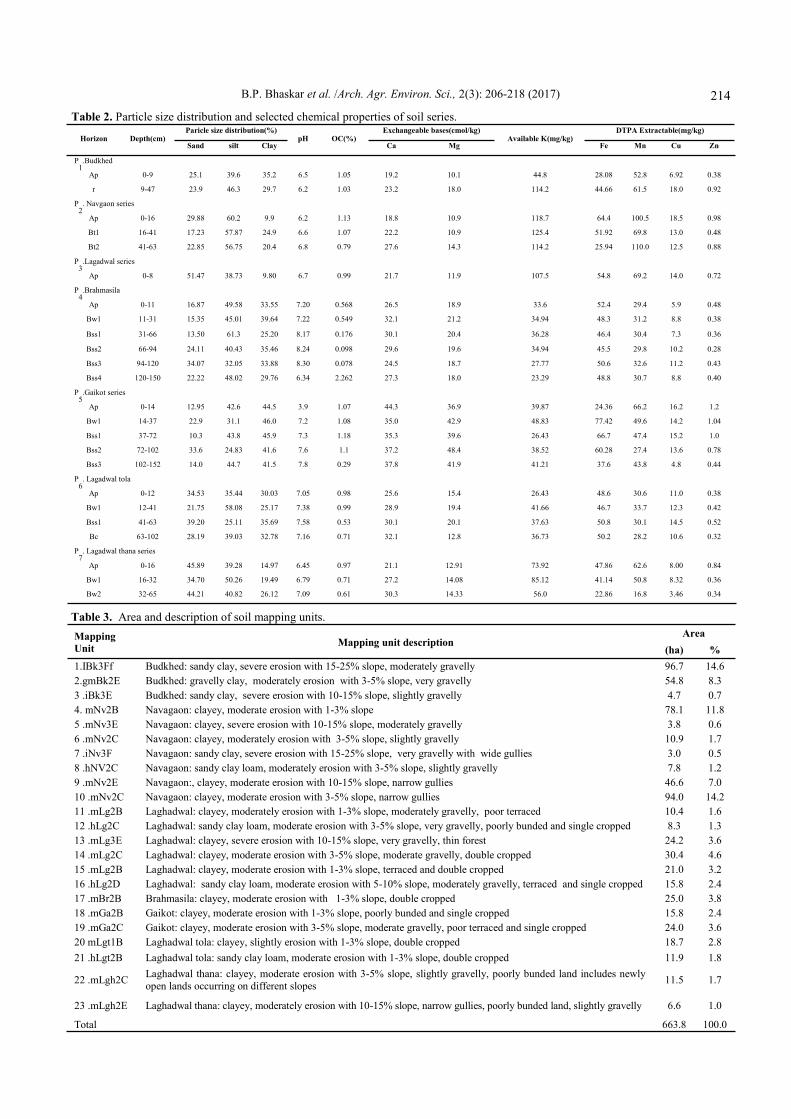
Particle size distribution and selected chemical charac-
teristics: The extremely shallow Budkhed series (P1) has
clay loam texture with clay content of 29 to 35 per cent
and a particle size class of fine loamy at family level. The
surface horizon is neutral with more than 1 per cent of
organic carbon, 19 to 23 cmol / kg exchangeable Ca and
DTPA extractable zinc of 0.38 mg / kg. The Lagadwal
series (P3) is slightly acid with fine loamy particle size
class (clay of 19 to 26 per cent), exchangeable Ca of 21 to
32.3 cmol / kg and DTPA extractable Zn more than 1 mg /
kg. The moderately shallow, slightly acid to neutral and
fine loamy Navgaon series (P2) has 18.8 to 27.6 cmol / kg
exchangeable Ca, 10.9 to 14.3 cmol / kg Mg and irregular
distribution of DTPA extractable Zn of 0.48 to 0.98mg /
kg. Brahmasila series (P4) is very deep, fine textured (clay
content more than 30 per cent with irregular depth trends)
and have neutral surface layers with moderately alkaline
slickensided zones. This soil has ex Ca to ex. Mg ratio
more than 1 with its contents varying from 19 to 32 cmol /
kg. These soils have DTPA extractable Zn below critical
limit (0.8mg / kg, Lindsay and Norvell, 1978). The gaikot
series (P5) is very deep with increasing pH from neutral to
slightly alkaline and moderately alkaline slickensided
zones, more than 1 per cent of organic carbon throughout
depth except in Bss2 layer (72-102cm) and increase of
exchangeable magnesium from 36.9 to 48.4 cmol/kg and
sudden drop in DTPA extractable Zinc (0.44 mg / kg) in
that particular layer. Lagadwal tola series (P6) is very deep,
fine textured (irregular clay with depth, 25 to 35%) and
neutral to slightly acid with an exchangeable Ca of 25 to
32 cmol / kg, Mg of 12.8 to20.1cmol/kg and DTPA ex-
tractable Zn of 0.38 to 0.52mg/kg). Lagadwal Thana series
(P7) is loamy with 35 to 46 per cent sand, 39 to 50 per cent
silt and (increasing trend with depth) 15 to 16 per cent
clay. The particle size class is defined as fine loamy with
clay content above 18 per cent .This soil has slightly acid
surface horizon followed by neutral subsoil layers. This
soil has 0.96 to 0.61 per cent of organic carbon with de-
creasing depth trends (Table 2). The calcium is dominant
on exchange complex showing increasing trends with
depth (21.1 to 30.3 cmol / kg). Next to calcium, magnesi-
um is dominant with it contents of 12.9 to 17.49 cmol / kg.
Among DTPA extractable elements, zinc in sub soils is in
deficient range (0.34 to 0.36 mg / kg).
Soil map: The soil map shows regularity in geographical
distribution of soil series and its diversity over given land-
scape at cadastral level in the study area. The soil map
consists of generic characteristics of seven soil series at 23
phases depicted as mapping units (Figure 6, Table 3). The
mapping units is defined as per the guidelines of AISLUS
(1970) considering texture, series name, erosion and slope
class as symbolized: iBk2F (where I = sandy clay, Bk =
budkhed series, 2 = moderate erosion and F = >15%
slope). This map actually demands appraisal of individual
mapping units in terms of their suitability to agricultural
crops. Here the top soil variations in each identified series
may be helpful in explaining the yield variations of partic-
ular crop or different crops within the unit over long term
period. The defined 23 mapping units expressed major
limitations such as slope, erosion, gravelliness and texture.
It is observed that only three mapping units occupied more
than 10 per cent of total area in the village viz., iBk3F
(96.7ha, 14.6%), mNv2B (78.1ha, 11.8%) and mNv2C
(94ha, 14.2%). Regarding depth classes (Sehgal et al.,
1987), the soil series is arranged as follows: very shallow-
Budkhed, Navgaon, Lagadwal, shallow- Lagadwal Thana,
moderately shallow- Lagadwal tola, deep-Gaikot and Very
deep-Brahmasila. Considering the slope >15 % not suitable
for mechanization and stony features in high, mid and low
hills, the mapping units are classified under non arable
covering 175.1ha (26.4 %). The remaining area under dif-
ferent mapping units evaluated for their suitability to dif-
ferent locally grown crops like sunflower, sorghum, soy-
bean, wheat and chillies (Table 5) and suggested
conservation plans such as hill side ditches, stone walls or
bunds on high and mid hills.
Photo voice: A photo-voice is a process by which people
can identify, represent and enhance their community
through a specific photographic technique (Wang and
Burris, 1997). The land evaluation studies start with
description of biophysical parameters of the land with time
related preferences. This can be done with visualization of
landscape as a whole with photographs to view variety of
scenes for comparison and on site evaluation
(Shuttleworth, 1980; Kellomaki and Savolainen, 1984).
The photographs provide landscape sociology of farming
in difficult and degraded hilly terrain. These photographs
clearly identify the production management of hilly terrain
keeping aside the conservation on their farms. The study
demonstrates the changing landscape management is com-
plex involving financial incentive making conservation as
secondary to crop production. The pictures exposed not
only the landscapes but also the restrictions to change
farming activities of current production mandate (sowing
row crops on high hilly terrains with distinct visual signs
of erosion and strong stoniness) and supported conserva-
tion values to deliberate approach to changing landscapes
(subsoil hardening, Figure 4). Farmers face extreme diffi-
culties on these degraded landscapes with limited options
and unable to keep up the productive capabilities of their
landscapes. The land limitation may be purely physical
such as a shallow depth of soil which is adequate for
grazing but not for cropping or the limitation which makes
the land vulnerable to degradation could be climate, such

212
B.P. Bhaskar et al. /Arch. Agr. Environ. Sci., 2(3): 206-218 (2017)
as low or erratic rainfall.
Farmer’s view on agricultural landscapes: The farmer‟s
in the village have unique perspective on arable agricultur-
al landscapes for signs of farming practices and its impact
is dependent on the level of knowledge connecting man-
agement practices and the appearance of forms and colours
in the fields. The photographic representations show that
rural agrarian communities are generally preferred land-
scapes that have natural, verdant, forested, traditionally
cultural, mixed order / disorder, half - open and contain
water (Brush et al., 2000). The farmer‟s view the land as
production unit for food and fodder needs of rural dwellers
and consider daily practical difficulties in working on agri-
culture in their individual farms. It is because farmers
understand the everyday practices involved in shaping
farm landscapes that they are able to interpret and appreci-
ate fully what they are seeing in their conventional produc-
tion-based farming activities. The field photos provide an
opportunity to farmer‟s to assess their own and other
farmers‟ skills (i.e. embodied cultural capital) from the
appearance of the landscape under „productivist‟ behaviour
(Burton, 2004). The Lagadwal village consists of rolling
hills under mixed arable / livestock farming. The agricul-
tural landscapes are subjected to seasonal changes through
seasonal production cycles of soybean-sorghum based
systems. The bullock drawn ploughed fields are visually
attractive because of the regularity of furrow depth, the
way in which the topsoil has been turned and the straight-
ness of lines in the field. As season progresses, the evi-
dence of ploughing disappears as crop emerges and trace
out the errors if any in skills of ploughing and sowing
seeds with visible signs of crop density. The poor crop
stand and yield of soybean in midhills and jowar in high
hills clearly indicate the difficulties to work on stony soils
(> 50%surface stone cover) with lack of machinery skills
to work on these landscapes. It is clear from the photo-
graphs that the inhabitant tribal farmers are not able to
perceive the subtle changes in agricultural landscapes due
to their faulty farming practices such as felling of trees in
high hills, poor bunding and terracing, signs of high
degree of dissections all along the drainage lines, subsoil
hardening and opening of landscapes for agriculture. The
conservation of agricultural mosaics (of soybean on broad
crest slopes of midhills, drainage floors in low hill regions
for paddy and wheat through the combination of drainage
and leveling with contour bunds (Figures 3a, b) is now
regarded as critical and needs landscape initiatives that
explicitly increase food production, ecosystem conserva-
tion and rural livelihood. The intrinsic value in appearance
of landscapes as expressed within local discourse as nega-
tive nature (eroded crest slopes of high hills, money driven
production systems, illegal logging of trees lack of green
cover that livestock eats and lack of scenic value) with
barren landscapes symbolizing the connection of farmer‟s
role in nurturing the soil. The soil erosion is
accentuated by poor practices of farmers on steep hillsides
expose to the direct impact of raindrops on clearing and
burning, planting with little attempts at soil preservation
(Figures 3a, b). Planting is done up and down the hillsides,
so that the inter-row is left bare providing ideal conditions
for rill erosion down the hill. There is also no attempt to
cover the soil by using mulches or cover crops particularly
during the inter-crop period. There was some intercropping
seen, but unfortunately this was also planted down the hill.
The use of any form of barriers to slow down or stop the
movement of soil is also minimal.
The complex nature of farming makes integrated
approaches necessary, both in order to improve their
understanding and in turn in the implementation of sound
management strategies. Indicators used in local agro-
ecosystems are both qualitative and quantitative and then
multi-criteria algorithmic (mathematical) methods able to
deal with mixed information. Some of these techniques
employed in integrating soil-land information with photo
voice techniques is discussed below for deriving thematic
based land evaluation programmes. The AMOEBA, a
radar graph shows that various indicators are represented
over axes moving away from the center (Figure 7). The
numerical values assumed to be the target for each of the
various indicators are normalized. They all lie at the same
distance from the origin and therefore represent a circum-
ference of a circle used as benchmark. In this way, it is
immediately clear which values of the various indicators
(characterizing the actual state of the monitored agro - eco-
system) fall short or exceed the target. In this example,
various indicators can be represented on the axes moving
out from the origin on a standard scale from 0 to 100,
where 0 refers to the worst imaginable situation and 100
stands for a ideal situation of agriculture in the study area
(Gomiero and giam Pietro, 2005).
The farm data enabled us to identify several potential
drivers influencing the agri-landscapes and to determine
the potentials of agri - resources in Lagadwal village. The
indicators of productivity identified at landscape level are
soil depth, soil organic matter, available N P K and soil
water status during crop growing period whereas indicators
of security includes mean annual rainfall (< 570mm), dura-
tion of rainfall, per cent of forest area and indicators of
protection includes top soil erosion where > 50% rills are
visible, cropping intensity and cropping pattern (Figure 7).
These indicators when analyzed for three sections of hills ,
it is clear that top soil erosion is severe with loss of forest
vegetation and seasonally grown coarse grain crops such as
jowar and bajra over stony soils. It is opined that the crop
yield on mid and low hills is mainly determined by soil
depth and soil water status where in general high cropping
intensity under well irrigation is observed with cropping
systems viz., soybean, onion, chillies and floriculture.
The matrix diagram is made to integrate landscape
elements with indicators and management options for
sustainable agriculture in the hill lands of Lagadwal village
having two distinct colour boxes indicating the change of
themes to work out on these landscapes with discussion of
local farmer‟s (Table 4). Looking into the indicators, the
management options are selected based on farmer‟s opin-
ion by combining and graphically representing as listed
indicators and options mentioned to characterize arable
land typology as per the structure of themes identified for
land evaluation at landscape level. During resource inven-
tory in Lagadwal village, nineteen experienced farmers
213
B.P. Bhaskar et al. /Arch. Agr. Environ. Sci., 2(3): 206-218 (2017)
having an age > 45 years (6 in high hills, 5 in midhills and
8 in low hills) are interviewed with photos of landscapes so
as to collect the views and themes to opt for sustainable
agriculture. The photo voice of farmer‟s at high hills shows
that the major constraints for farming are unevenness of
land surface, effective soil depth, strong slopes and poor
condition of forest cover that needs multispecies buffer
zones and agroforestry. At midhills, all farmers‟ agreed
upon the poor condition of forest cover but lower level of
subsoil compaction problems and have limited options for
diverse crop rotations and increase of crop variety and di-
versity. At low hills, the farmer‟s expressed that they are
not aware of subsoil compaction, top soil erosion, options
of cover crops and grass field borders. They are not aware
of strip or grasses on contours as conservation measure to
check top soil erosion at low hills.
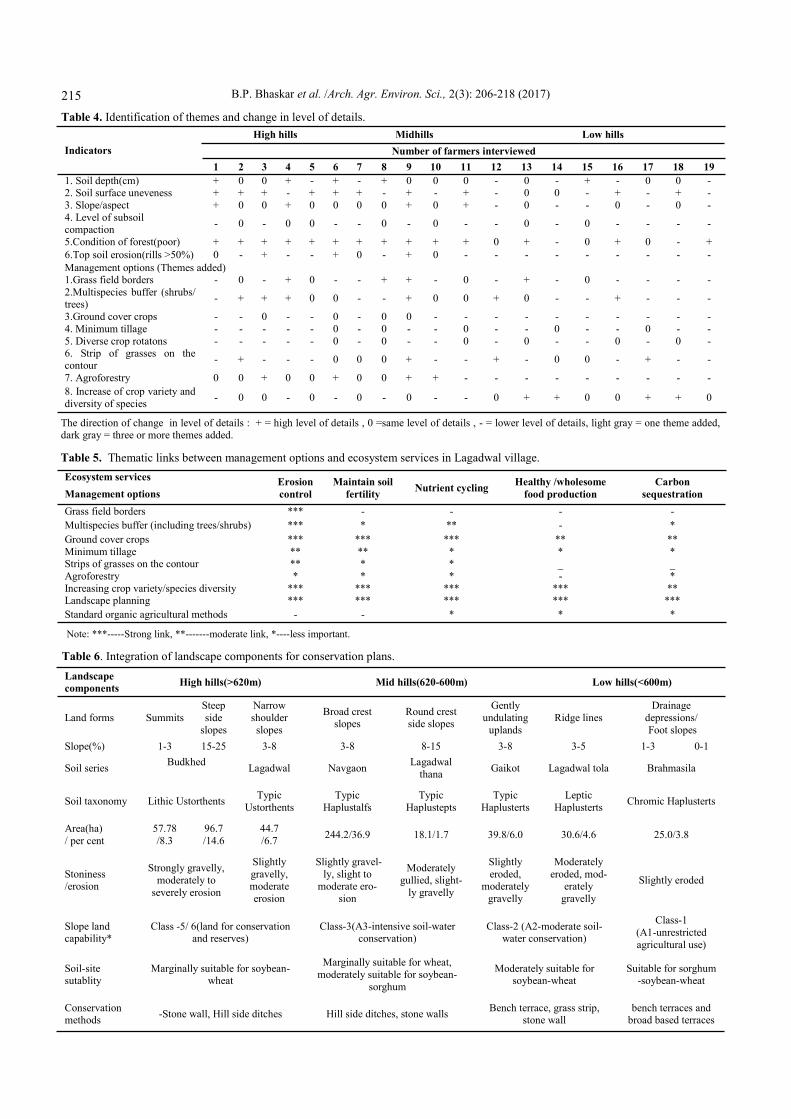
It is clear from amoeba and matrix diagram that the kind of
linkages needed for implementing management options for
ecosystems services existing in rural landscapes of Lagadwal
village (Table 5). There are five ecosystem services viz.,
erosion control, maintenance of soil fertility, nutrient cy-
cling, wholesome food production and carbon sequestration
and 10 management options are considered to assess the
degree of links needed for evaluating at landscape level.
The results shows strong link of landscape planning with
increasing crop variety and species diversity (as not observed
at farm level in Lagadwal village), crop rotation and ground
cover crops and less important link with strip grasses on con-
tours, agroforestry and grass field borders.
Conservation of rural agricultural landscapes: Rural
landscapes are under varying degrees of human influence.
Conservation of rural landscapes in this part of Maharash-
tra is really a challenging task because of its rapid deple-
tion of natural resources and off conventional strategy. The
land users grow crops that fetch profit and / or subsistence
while conservationists recommended crops for soil conser-
vation. The major concern on steep lands of Lagadwal
village is a pronounced dry season with sparse vegetation
cover and leaving the soil exposed to intense rains during
rainy season, a perfect setting for erosion. These steep
lands have fertility problems in addition to erodability. The
slope land capability classification shows that the high hills
are classified as class-4 class where crop production needs
intensive soil-water conservation treatments whereas broad
crest slopes in midhills and narrow ridgelines in low hills
needs moderate soil-water conservation treatments. It is
clear in the mind to say that production oriented agriculture
in low hills and agricultural marginalization in high hills
have effects on altering habitat and make them barren or
abandoned in the period of severe droughts. The shallow
soils on steep slopes needs a cost effective conservation
treatment like planting tree crops by the use of intermittent
terraces (orchard terraces) with one line of trees followed
by close-growing cover crop. On gentle slopes (usually up
to 2% or 3%), it is usually possible to control erosion by
carrying out contour cultivation or by growing alternative
crops in strips along the contour (strip cropping), or by
dividing up the arable land with strips of grass laid out on
the contour (grass strips, Table 6). The landscape-based
approach to conservation helps integration of the ecologi-
cal needs with visual dimensions between people and land-
scapes. The generation of soil mapping is inseparably re-
lated to landscape-focused approaches to visualize
spatially-specific landscape conservation needs to local
agrarian communities. Agricultural lands should be man-
aged as part of the matrix surroundings by protecting and
promoting local crop and livestock diversity, maintaining
connectivity between native habitats within agricultural
landscapes, planting hedge rows around farm fields, protect-
ing spatially targeted perennial natural and planted vegeta-
tion, maintaining continuous year-round soil cover to en-
hance rainfall infiltration; managing inputs and wastes to
minimize agricultural pollution of natural habitats; and
designing farming systems to mimic the structure and func-
tion of natural ecosystems. The agri-environmental issues
emerged from the rural landscape study at lagadwal village
for implementation of conservation planning is given under:
Landscape perspective: Agricultural landscapes are mo-
saics of natural features and agricultural (and other) land
uses in a particular geographic region. The activities include
are: protecting and promoting local crop and livestock diver-
sity, maintaining connectivity between native habitats within
agricultural landscapes and designing farming systems to
mimic the structure and function of natural ecosystems.
Community involvement in landscape management is
prerequisite for protecting habitats and promoting regional
approaches to create bridges between farmers and govern-
ment policy to bring broader changes at landscape level.
The technological constraints are lack of a sufficiently
detailed land resource database where land constraints are
systematically identified and interpreted according to up-to
-date technology, lack of adequately trained specialists to
live and work in steep land areas and lack of well- coordi-
nated technology transfer networks for steep land areas.
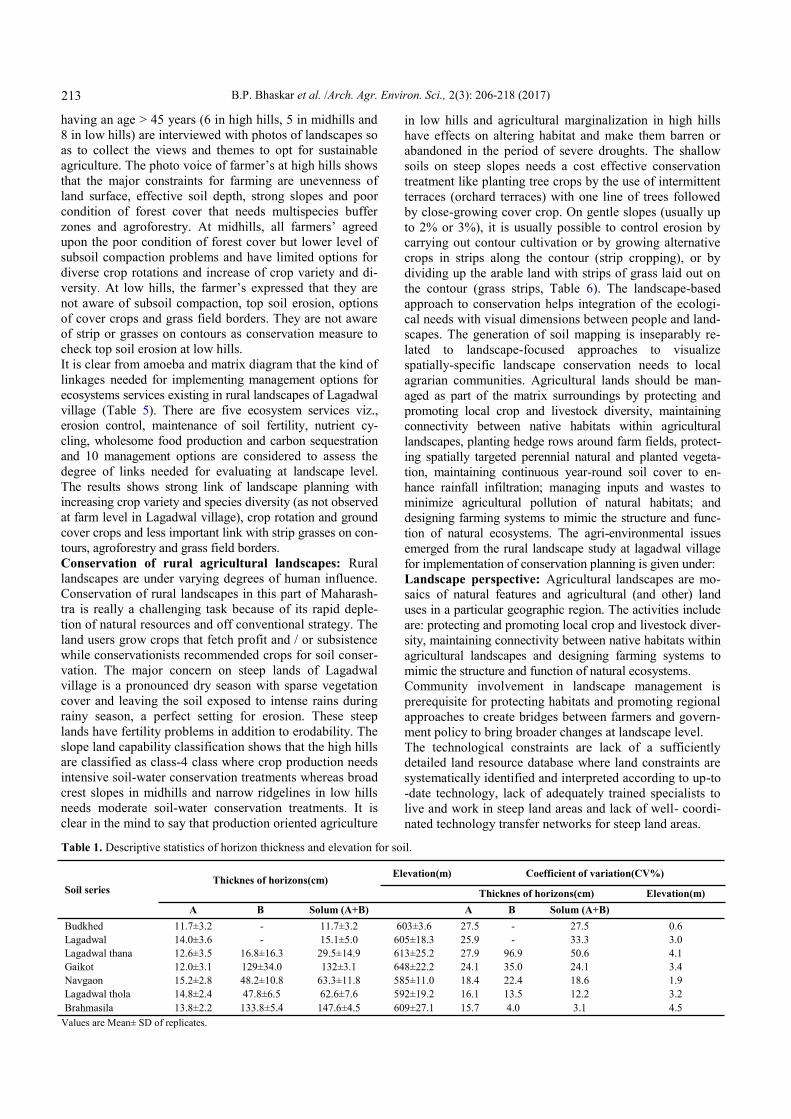
Table 1. Descriptive statistics of horizon thickness and elevation for soil.
Soil series Thicknes of horizons(cm)
Elevation(m) Coefficient of variation(CV%)
Thicknes of horizons(cm) Elevation(m)
A B Solum (A+B) A B Solum (A+B)
Budkhed 11.7±3.2 - 11.7±3.2 603±3.6 27.5 - 27.5 0.6
Lagadwal 14.0±3.6 - 15.1±5.0 605±18.3 25.9 - 33.3 3.0
Lagadwal thana 12.6±3.5 16.8±16.3 29.5±14.9 613±25.2 27.9 96.9 50.6 4.1
Gaikot 12.0±3.1 129±34.0 132±3.1 648±22.2 24.1 35.0 24.1 3.4
Navgaon 15.2±2.8 48.2±10.8 63.3±11.8 585±11.0 18.4 22.4 18.6 1.9
Lagadwal thola 14.8±2.4 47.8±6.5 62.6±7.6 592±19.2 16.1 13.5 12.2 3.2
Brahmasila 13.8±2.2 133.8±5.4 147.6±4.5 609±27.1 15.7 4.0 3.1 4.5
Values are Mean± SD of replicates.
214
B.P. Bhaskar et al. /Arch. Agr. Environ. Sci., 2(3): 206-218 (2017)
Table 2. Particle size distribution and selected chemical properties of soil series.
Horizon Depth(cm)
Paricle size distribution(%) pH OC(%)
Exchangeable bases(cmol/kg) Available K(mg/kg)
DTPA Extractable(mg/kg) Sand silt Clay Ca Mg Fe Mn Cu Zn
P1
.Budkhed Ap 0-9 25.1 39.6 35.2 6.5 1.05 19.2 10.1 44.8 28.08 52.8 6.92 0.38 r 9-47 23.9 46.3 29.7 6.2 1.03 23.2 18.0 114.2 44.66 61.5 18.0 0.92
P2
. Navgaon series Ap 0-16 29.88 60.2 9.9 6.2 1.13 18.8 10.9 118.7 64.4 100.5 18.5 0.98 Bt1 16-41 17.23 57.87 24.9 6.6 1.07 22.2 10.9 125.4 51.92 69.8 13.0 0.48 Bt2 41-63 22.85 56.75 20.4 6.8 0.79 27.6 14.3 114.2 25.94 110.0 12.5 0.88
P3
.Lagadwal series Ap 0-8 51.47 38.73 9.80 6.7 0.99 21.7 11.9 107.5 54.8 69.2 14.0 0.72
P4
.Brahmasila Ap 0-11 16.87 49.58 33.55 7.20 0.568 26.5 18.9 33.6 52.4 29.4 5.9 0.48
Bw1 11-31 15.35 45.01 39.64 7.22 0.549 32.1 21.2 34.94 48.3 31.2 8.8 0.38 Bss1 31-66 13.50 61.3 25.20 8.17 0.176 30.1 20.4 36.28 46.4 30.4 7.3 0.36 Bss2 66-94 24.11 40.43 35.46 8.24 0.098 29.6 19.6 34.94 45.5 29.8 10.2 0.28 Bss3 94-120 34.07 32.05 33.88 8.30 0.078 24.5 18.7 27.77 50.6 32.6 11.2 0.43 Bss4 120-150 22.22 48.02 29.76 6.34 2.262 27.3 18.0 23.29 48.8 30.7 8.8 0.40
P5
.Gaikot series Ap 0-14 12.95 42.6 44.5 3.9 1.07 44.3 36.9 39.87 24.36 66.2 16.2 1.2
Bw1 14-37 22.9 31.1 46.0 7.2 1.08 35.0 42.9 48.83 77.42 49.6 14.2 1.04 Bss1 37-72 10.3 43.8 45.9 7.3 1.18 35.3 39.6 26.43 66.7 47.4 15.2 1.0 Bss2 72-102 33.6 24.83 41.6 7.6 1.1 37.2 48.4 38.52 60.28 27.4 13.6 0.78 Bss3 102-152 14.0 44.7 41.5 7.8 0.29 37.8 41.9 41.21 37.6 43.8 4.8 0.44
P6
. Lagadwal tola Ap 0-12 34.53 35.44 30.03 7.05 0.98 25.6 15.4 26.43 48.6 30.6 11.0 0.38
Bw1 12-41 21.75 58.08 25.17 7.38 0.99 28.9 19.4 41.66 46.7 33.7 12.3 0.42 Bss1 41-63 39.20 25.11 35.69 7.58 0.53 30.1 20.1 37.63 50.8 30.1 14.5 0.52 Bc 63-102 28.19 39.03 32.78 7.16 0.71 32.1 12.8 36.73 50.2 28.2 10.6 0.32
P7
. Lagadwal thana series Ap 0-16 45.89 39.28 14.97 6.45 0.97 21.1 12.91 73.92 47.86 62.6 8.00 0.84
Bw1 16-32 34.70 50.26 19.49 6.79 0.71 27.2 14.08 85.12 41.14 50.8 8.32 0.36 Bw2 32-65 44.21 40.82 26.12 7.09 0.61 30.3 14.33 56.0 22.86 16.8 3.46 0.34
Table 3. Area and description of soil mapping units.
Mapping
Unit Mapping unit description
Area
(ha) %
1.IBk3Ff Budkhed: sandy clay, severe erosion with 15-25% slope, moderately gravelly 96.7 14.6
2.gmBk2E Budkhed: gravelly clay, moderately erosion with 3-5% slope, very gravelly 54.8 8.3
3 .iBk3E Budkhed: sandy clay, severe erosion with 10-15% slope, slightly gravelly 4.7 0.7
4. mNv2B Navagaon: clayey, moderate erosion with 1-3% slope 78.1 11.8
5 .mNv3E Navagaon: clayey, severe erosion with 10-15% slope, moderately gravelly 3.8 0.6
6 .mNv2C Navagaon: clayey, moderately erosion with 3-5% slope, slightly gravelly 10.9 1.7
7 .iNv3F Navagaon: sandy clay, severe erosion with 15-25% slope, very gravelly with wide gullies 3.0 0.5
8 .hNV2C Navagaon: sandy clay loam, moderately erosion with 3-5% slope, slightly gravelly 7.8 1.2
9 .mNv2E Navagaon:, clayey, moderate erosion with 10-15% slope, narrow gullies 46.6 7.0
10 .mNv2C Navagaon: clayey, moderate erosion with 3-5% slope, narrow gullies 94.0 14.2
11 .mLg2B Laghadwal: clayey, moderately erosion with 1-3% slope, moderately gravelly, poor terraced 10.4 1.6
12 .hLg2C Laghadwal: sandy clay loam, moderate erosion with 3-5% slope, very gravelly, poorly bunded and single cropped 8.3 1.3
13 .mLg3E Laghadwal: clayey, severe erosion with 10-15% slope, very gravelly, thin forest 24.2 3.6
14 .mLg2C Laghadwal: clayey, moderate erosion with 3-5% slope, moderate gravelly, double cropped 30.4 4.6
15 .mLg2B Laghadwal: clayey, moderate erosion with 1-3% slope, terraced and double cropped 21.0 3.2
16 .hLg2D Laghadwal: sandy clay loam, moderate erosion with 5-10% slope, moderately gravelly, terraced and single cropped 15.8 2.4
17 .mBr2B Brahmasila: clayey, moderate erosion with 1-3% slope, double cropped 25.0 3.8
18 .mGa2B Gaikot: clayey, moderate erosion with 1-3% slope, poorly bunded and single cropped 15.8 2.4
19 .mGa2C Gaikot: clayey, moderate erosion with 3-5% slope, moderate gravelly, poor terraced and single cropped 24.0 3.6
20 mLgt1B Laghadwal tola: clayey, slightly erosion with 1-3% slope, double cropped 18.7 2.8
21 .hLgt2B Laghadwal tola: sandy clay loam, moderate erosion with 1-3% slope, double cropped 11.9 1.8
22 .mLgh2C Laghadwal thana: clayey, moderate erosion with 3-5% slope, slightly gravelly, poorly bunded land includes newly
open lands occurring on different slopes 11.5 1.7
23 .mLgh2E Laghadwal thana: clayey, moderately erosion with 10-15% slope, narrow gullies, poorly bunded land, slightly gravelly 6.6 1.0
Total 663.8 100.0
215
B.P. Bhaskar et al. /Arch. Agr. Environ. Sci., 2(3): 206-218 (2017)
Table 4. Identification of themes and change in level of details.
Indicators
High hills Midhills Low hills
Number of farmers interviewed
1 2 3 4 5 6 7 8 9 10 11 12 13 14 15 16 17 18 19
1. Soil depth(cm) + 0 0 + - + - + 0 0 0 - 0 - + - 0 0 - 2. Soil surface uneveness + + + - + + + - + - + - 0 0 - + - + -
3. Slope/aspect + 0 0 + 0 0 0 0 + 0 + - 0 - - 0 - 0 -
4. Level of subsoil compaction
- 0 - 0 0 - - 0 - 0 - - 0 - 0 - - - -
5.Condition of forest(poor) + + + + + + + + + + + 0 + - 0 + 0 - +
6.Top soil erosion(rills >50%) 0 - + - - + 0 - + 0 - - - - - - - - -
Management options (Themes added) 1.Grass field borders - 0 - + 0 - - + + - 0 - + - 0 - - - -
2.Multispecies buffer (shrubs/
trees) - + + + 0 0 - - + 0 0 + 0 - - + - - -
3.Ground cover crops - - 0 - - 0 - 0 0 - - - - - - - - - -
4. Minimum tillage - - - - - 0 - 0 - - 0 - - 0 - - 0 - -
5. Diverse crop rotatons - - - - - 0 - 0 - - 0 - 0 - - 0 - 0 - 6. Strip of grasses on the contour
- + - - - 0 0 0 + - - + - 0 0 - + - -
7. Agroforestry 0 0 + 0 0 + 0 0 + + - - - - - - - - -
8. Increase of crop variety and
diversity of species - 0 0 - 0 - 0 - 0 - - 0 + + 0 0 + + 0
The direction of change in level of details : + = high level of details , 0 =same level of details , - = lower level of details, light gray = one theme added, dark gray = three or more themes added.
Table 5. Thematic links between management options and ecosystem services in Lagadwal village.
Ecosystem services Erosion
control
Maintain soil
fertility Nutrient cycling
Healthy /wholesome
food production
Carbon
sequestration Management options
Grass field borders *** - - - -
Multispecies buffer (including trees/shrubs) *** * ** - *
Ground cover crops *** *** *** ** **
Minimum tillage ** ** * * * Strips of grasses on the contour ** * * _ _
Agroforestry * * * - *
Increasing crop variety/species diversity *** *** *** *** ** Landscape planning *** *** *** *** ***
Standard organic agricultural methods - - * * *
Note: ***-----Strong link, **-------moderate link, *----less important.
Table 6. Integration of landscape components for conservation plans.
Landscape
components High hills(>620m) Mid hills(620-600m) Low hills(<600m)
Land forms Summits
Steep
side
slopes
Narrow
shoulder
slopes
Broad crest slopes
Round crest side slopes
Gently
undulating
uplands
Ridge lines
Drainage
depressions/
Foot slopes
Slope(%) 1-3 15-25 3-8 3-8 8-15 3-8 3-5 1-3 0-1
Soil series Budkhed
Lagadwal Navgaon
Lagadwal
thana Gaikot Lagadwal tola Brahmasila
Soil taxonomy Lithic Ustorthents Typic
Ustorthents
Typic
Haplustalfs
Typic
Haplustepts
Typic
Haplusterts
Leptic
Haplusterts Chromic Haplusterts
Area(ha)
/ per cent
57.78
/8.3
96.7
/14.6
44.7
/6.7 244.2/36.9 18.1/1.7 39.8/6.0 30.6/4.6 25.0/3.8
Stoniness
/erosion
Strongly gravelly,
moderately to
severely erosion
Slightly
gravelly,
moderate
erosion
Slightly gravel-
ly, slight to
moderate ero-
sion
Moderately
gullied, slight-
ly gravelly
Slightly
eroded,
moderately
gravelly
Moderately
eroded, mod-
erately
gravelly
Slightly eroded
Slope land capability*
Class -5/ 6(land for conservation and reserves)
Class-3(A3-intensive soil-water conservation)
Class-2 (A2-moderate soil-water conservation)
Class-1
(A1-unrestricted
agricultural use)
Soil-site sutablity
Marginally suitable for soybean-wheat
Marginally suitable for wheat,
moderately suitable for soybean-
sorghum
Moderately suitable for soybean-wheat
Suitable for sorghum-soybean-wheat
Conservation methods
-Stone wall, Hill side ditches Hill side ditches, stone walls Bench terrace, grass strip,
stone wall bench terraces and
broad based terraces

216
B.P. Bhaskar et al. /Arch. Agr. Environ. Sci., 2(3): 206-218 (2017)
Recommendations: The soil and land resource infor-
mation at farm level is generated based on scientific
understanding of soil-landscape mapping techniques and
evaluating the land units according to its capabilities /
suitability‟s to locally adopted crops. The landscape is a
base for exploration of old ideas in new ways and
construction of new theories (Morphy, 1993). The photo-
graphs provide landscape views of farming on difficult
degraded hilly terrain and provide insight management
responses against production mandates of crops. The soil-
landscape information and its evaluation clearly showed
that out of 663hectares of land in Lagadwal village, 175 ha
is no arable with limited agricultural value having defects
of extremely stony, steep gradients, severe erosion and
restricted to poor grazing. The data further reveals that 9.8
per cent of class 1 land suitable for wide range of crops
with well drained soils having at least 60cm depth, good
water holding capacity, slightly stony (up to 5%) and mod-
erate slopes whereas 64.2 per cent of class II and III land
for narrow range of crops with wide variability of yield for
crops like soybean, sunflower, jowar and maize. The soil
survey acknowledges the utility of geo information for agri
development at farm level but needs revision and reori-
entation of theme based strategic research programmes at
landscape level through integrated multi layered analytical
tools to improve the rural land evaluation programmes.
The sustainable agriculture in a conventional mode of
farming on these degraded rural hill landscapes should
focus on agro-ecological approach for establishing network
and integrating agricultural resource management with
community development. The study strongly recommends
conservation agriculture in rainfall scarcity zone as in
study area that features little or no soil disturbance, no
burning, direct seeding into previously untilled soil, crop
rotation, and permanent soil cover, particularly through the
retention of crop residues (Harrington, 2008). In CA, inter-
ventions such as mechanical soil tillage are reduced to an
absolute minimum, and the use of external inputs such as
agrochemicals and nutrients of mineral or organic origin
are applied at an optimum level. There is a lack of farm
level evaluation of soil mapping units adjudged as suitable
for two or more crops and working out crop equivalent
ratings so as to monitor the yield variation in class II and
class III lands. The soil series must be used as an index of
soil information to transfer agrotechnology of that particu-
lar agro-ecology.
Conclusions
An attempt was made in the present study to describe the
agricultural landscape changes as evidenced by photo-
graphs and field survey. The results offered an insight into
the landscape transformation processes with natural con-
straints of stoniness, hard and compact sub soils, effective
rooting depth, slope, low crop productivity and agriculture
oriented towards small productions. This area comes under
disadvantaged area (less favoured areas scheme) with con-
ventional conservation of stone bunds (low cost and less
skill labour job) and decreasing diversity of cultivated
crops (soybean and sorghum). The integration of conserva-
tion plans with landscape elements were made with the
application of slope land capability classification and
suggested suitable conservation treatment in accordance
with soil capability and suitability to modernized the farm-
ing activities in the region. The capability analysis showed
that 46.1 per cent of total area under high hills (>620m) is
classified as class 4 lands which needs conservation treat-
ments such as bench terraces and stone walls for short term
crops whereas broad based terraces and bench terraces for
mid and low hills. The seven soil series identified in the
study will serve as index of soil information in terms of
using the soil in support of a particular type of agriculture
or land use. Often, such a first designation of a soil series,
however, can expand and also become more specific as
soil scientists consult with local users of the soils to cross-
check observations and recognition of advantages and dis-
advantages of a particular series. The aim of this exercise
was to assess the sustainability of smallholder farmers in
sloping uplands of Lagadwal village, Maharashtra.
The specific landscape indicators were developed to
characterize sustainable land management practices. The
landscape scenario‟s provided general measures such as
change from monoculture to diversified use and proposed
to achieve continued agricultural production. As the study
area falls under rainfall scarcity zone, the steep sloppy
lands must be covered with grass or strip buffer zones for
checking top soil erosion and go for wide range of suitable
crops in each mapping unit. The validation of indicators is
not easy due to complexity of sustainability and needs me-
dium to long term evaluation. The feedback from farmer‟s
helped to increase level of confidence among researcher‟s
to adapt the prototype in other parts of basaltic terrain of
Maharashtra. The basic generic structure of integrating
landscape with perceptions of local farmer‟s was used with
change to suit the agro - ecological and socio-cultural sys-
tems. Farmer‟s opined that there should be a provision of
incentives for organic farming practices, for farmers to
revegetate buffer zones and to establish natural habitats on
their land. Environmental education and good extension
services in tribal areas are proposed as ongoing strategies
to achieve participants‟ long term vision.
Open Access: This is open access article distributed under
the terms of the Creative Commons Attribution License,
which permits unrestricted use, distribution, and reproduc-
tion in any medium, provided the original author(s) and the
source are credited.
REFERENCES
Agnoletti, M. (2012). The Italian historical rural landscape.
Cultural values for the environment and rural development,
Springer Verlag, Dordrecht. 2012.
Agnoletti, M. (2006). The development of a historical and
cultural evaluation approach in landscape assessment: The
dynamic of Tuscan Landscape between 1832 and 2004. The
conservation of cultural landscapes; Agnoletti, M. (Ed.) CAB
International, Wallingford and New York, pp: 3-29.
AISLUS (1970). Soil Survey Manual, IARI, New Delhi, pp: 13-61.
Antrop, M. (2006).Sustainable landscapes: Contradiction, fiction
or utopia? Landscape and Urban Planning, 75: 187-197.
Bhaskar, B.P., Dipak Sarkar, Bobade, S.V., Gaikwad, M.S.,
Gaikwad, S.S., Nimkar, A.M., Anantwar, S.G., Patil, S.V.
and Bhattacharyya, Tapas (2011). Land resource evaluation
217
B.P. Bhaskar et al. /Arch. Agr. Environ. Sci., 2(3): 206-218 (2017)
for optimal land use plans in cotton growing Yavatmal
district, Maharasahtra. The Ecoscan., 1: 251-259.
Bhaskar, B.P., Dipak Sarkar, Bobade, S.V., Gaikwad, S.S. and
Anantwar, S.G. (2014). Land evaluation for irrigation in
cotton growing Yavatmal district, Maharashtra. Internation-
al Journal of Research in Agricultural Sciences, 1(2): 128-
136.
Bhattacharyya, T., Pal, D.K. and Deshpande, S.B. (1993). Gene-
sis and transformation of minerals in the formation of red
(Alfisols) and black (Inceptisols and Vertisols) soils on
Deccan basalt in the Western Ghats, India. Journal of Soil
Science, 44(1): 159-171.
Bohnet, I. and Smith, D.M. (2007).Planning future landscapes in
the Wet Tropics of 637 Australia: A social-ecological frame-
work. Landscape and Urban Planning, 80:137-152.
Bregt, A.K. (1992). Processing of soil survey data. Wageningen
Agricultural University doctoral thesis. Pudoc, Wageningen.
Brush, R., Chenoweth, R.E. and Barman, T. (2000). Group differ-
ences in the enjoyability of driving through rural landscapes.
Landscape and Urban Planning, 39-45.
Burton, R.J.F. (2004). Seeing through the “good farmer‟s” eyes:
Towards developing an understanding of the social symbolic
value of “productivist” behaviour. Rural Sociology, 44: 195-
216.
Dalton, P. and Dunnett, G. (1990). A psychology for living:
personal construct theory for professionals and clients.
Wiley and Sons, Chichester.
Deolankar, S.B. (1980). The Deccan Basalts of Maharashtra,
India.-their potential as aquifers. Groundwater. Lecture,
Department of Geology, University of Poona, March, 434-
437.
De, Bie C.A., Beek, K.J. Driessen, P.M. and Zink, J.A. (1995).
Towards operationalization of soil information for sustaina-
ble land management. Position Paper, Brazil Soil Confer-
ence, July 1995. ITC, The Netherlands, pp: 20.
Dharam Singh, Bhaskar, B.P., Baruah, U. and Sarkar Dipak
(2014). Evaluation of rice (Oryza sativa L.) based cropping
systems in major soil series of Brahmaputra Valley, Asom.
Global Journal of Scientific Frontier Research. D. Agricul-
ture and Veterinary, XIV: 65-69.
Dharuvanarayana, V.V. and Ram Babu (1983). Estimation of soil
erosion in India. Journal of Irrigation and Drought Engi-
neering, 109(4): 419-34.
Drohan, P.J., Havlin, J.L., Megonigal, J.P. and Cheng, H.H.
(2010). The Dig it Smithsonian soils exhibition: lessons
learned and goals for the future. Soil Science Society of
America Journal, 74: 697-705.
Dumanski, J. (1993). Sustainable land management for the 21st
Century. Volume 1: workshop summary. Proceedings of the
international workshop on sustainable land management for
the 21st Century. University of Lethbridge, Canada, pp: 50.
Eija, P., Grammatikopoulou, I., Timo Hurme, T., Soini, K. and
Uusitalo, M. (2014). Assessing the Quality of Agricultural
Landscape Change with Multiple Dimensions. Land, 3: 598-
616.
Elvis, A. S., Jagdish Prasad, Nagaraju, M.S.S., Srivastava, Rajeev
and Kauraw, D.L. (2009). Use of remote sensing in charac-
terization and management of Dhamni micro-watershed of
Chandrapur district of Maharashtra. Journal of Indian Socie-
ty for Remote Sensing, 37(1): 129-137.
FAO (1983). Guidelines: Land evaluation for rainfed agriculture.
FAO Soils Bulletin, pp: 52.
Gomiero, T. and Pietro, M.G. (2005).Graphic tools for data repre-
sentation in integrated analysis of farming systems. Interna-
tional Journal of Global Environmental Issues, 5: 264-301.
Grealish, G.J., Fitzpatrick, R.W. and Hutson, J.L. (2015). Soil
survey data reduced by means of user friendly soil identifi-
cation keys and toposequence models to deliver soil infor-
mation for improved soil management. Geo Research
Journal, 6:81-91.
Harrington, L.W. (2008). A Brief History of Conservation Agri-
culture in Latin America, South Asia, and Sub-Saharan Afri-
ca. Conservation Agriculture Newsletter, Issue 2. Depart-
ment of Crop and Soil Sciences, Cornell University, Ithaca,
NY.
Hong Cheng (1989). The Soil resource evaluation system (SRES)
in the Pearl River Delta. In: J. Bouma and A.K. Brecht
(Eds.), Land qualities in space and time. Pudoc,
Wageningen, pp: 265-268.
Huddleston, J.H. (1982). Agricultural productivity rating for soils
of the Willamette valley. Oregon State University. Extension
Service. EC1105.pp: 32.
Hunziker, M. and Kienast, F. (1999). Potential impacts of chang-
ing agricultural activities on scenic beauty- a prototypical
technique for automated rapid assessment. Landscape
Ecology, 14: 161–176.
Jones, R.J.A. and Thomasson, A.J. (1987). Land suitability classi-
fication for temperate arable crops. In Beek, K.J., Burrough,
P.A., McCormack (eds.) Quantified land evaluation proce-
dures. ITC publication No.6.1987; pp: 29-35.
Kantor, W. and Schwertmann, U. (1974). Mineralogy and genesis
of clays in red-black soil toposequences on basic igneous
rocks in Kenya. European Journal of Soil Science, 25 (1): 67
–78.
Kellomaki, S. and Savolainan, R. (1984). The scenic value of the
forest landscape as assessed in the field and the laboratory.
Landscape Planning, 11: 97-107.
Lindsay, W.L. and Norvell, W.A. (1978). Development of DTPA
soil test for zinc, iron, manganese and copper. Soil Science
Society of American Journal, 42: 421-428.
Manchanda, M.L., Kudrat, M. and Tiwari, A.K. (2002). Soil
survey and mapping using remote sensing. Tropical ecology,
43(1): 61-74.
Miller, G.A. (1984). Corn suitability rating: An index to soil
productivity. Iowa State University. PM1168. 1984.
Murphy, H. (1993). Colonisation, history and the construction of
place: the politics of landscape in northern Australia. In
Bender, B. (ed.).Landscape: politics and perspectives. Berg
Publishers, Providence, RI. pp: 205-243.
O. Geen, A.T. and Southard, S.B. (2005). A revised storie index
modeled in NASIS. Soil Survey Horizons, 46(3): 98-109.
Patil, S.L. and Patil, D.A. (2007). Ethnomedicinal plants of Dhule
district, Maharashtra. Natural Product Radiance, 6(2): 148-
151.
Patil, S., Nagaraju, M.S.S. and Rajeev Srivastava. (2010).
Characterization and evaluation of land resources of Basaltic
terrain for watershed management using remote sensing and
GIS. Indian Journal of Soil Sciences, 38(1):16-23.
Pieri, C., Dumanski, J., A. Hamblin, A. and Young, A. (1995).
Land quality indicators. World Bank Discussion Papers no.
315. The World Bank, Washington DC/FAO Rome/UNDP
New York/UNEP Nairobi, pp: 63.
Rechtman, O. (2013). Visual perception of agricultural cultivated
landscapes: Key components as predictors for landscape
preferences. Landscape Research, 38(3): 273-294.
Rega, C. (2014). Landscape planning and rural development: key
issues and options towards integration. Springer. XIII: pp:
147.
Robert P.C. (1989). Land evaluation at farm scale using soil sur-
vey information systems. Land qualities in space and time.
In: J. Bouma and A.K. Brecht (Eds.). Pudoc, Wageningen,
pp: 299-311.
218
B.P. Bhaskar et al. /Arch. Agr. Environ. Sci., 2(3): 206-218 (2017)
Rudenko, L., Maruniak, E. and Lisovskiy, S. (2014). Landscape
planning for Ukrainian rural communities: challenges,
outputs. Geoadria, 19(2): 191-204.
Rust, R.H., Hanson, L.D. and Anderson, J.L. (1984). Productivity
factors and crop ratings for soils of Minnesota. AG-BU-
2199, Minnesota Extension Service, University of Minneso-
ta. St. Paul. pp: 57.
Schoeneberger, P.J., Wysocki, D.A., Benham, E.C. and Brod-
erson, W.D. (2002). Field book for describing and sampling
soils, Version 2.0. Natural Resources Conservation Service,
National Soil Survey Center, Lincoln, NE.
Scherr, S.J. and Yadav, S. (1996). Land degradation in the devel-
oping world: Implications for food, agriculture, and the envi-
ronment to 2020. 2020 Discussion Paper 14. Washington,
DC: International Food Policy Research Institute.
Sevenant, M. and Antrop, M. (2010). Trans disciplinary land-
scape planning: Does the public have aspirations? Experi-
ences from a case study in Ghent (Flanders, Belgium). Land
Use Policy, 27 (2): 373-386.
Sehgal, J.L., Saxena, R.K. and Vadivelu, S. (1987). Field Manu-
al. Soil Resource Mapping of Different states in India.
NBSS&LUP, Nagpur, pp: 73.
Sehgal, J. and Abrol, I.P. (1994). Soil Degradation in India: Sta-
tus and impact. Oxford and IBH Publishing Co. Pvt. Ltd.,
New Delhi.
Sheng, T. C. (1972). A treatment oriented land capability classifi-
cation for hilly land of humid tropics. In Technical Report
No. TA 3112. Food and Agriculture Organization, United
Nations. Rome. Italy.
Shuttleworth, S. (1980). The use of photographs as an environ-
mental presentation medium in landscape studies. Journal
Environment Management, 11: 61-76.
Soil Survey Division Staff (1993). Soil survey manual. Soil
Conservation Service. U.S. Department of Agriculture
Handbook 18.
Soil Survey Staff (2010). Keys to Soil Taxonomy. Eleventh
edition. United States Department of Agriculture. Natural
Resopurce Conservation Service.
Solankhe, P.C., Srivastava, R., Jagdish Prasad, Nagaraju, M.S.S.,
Saxena, R.K. and Barthwal, A.K. (2009). Application of
remote sensing and GIS in watershed characterizations and
management. Journal of Indian Society for Remote Sensing,
33: 239-244.
Srinivasa, S.V., Givindaih, S. and Gowda, H.H. (2008). Prioriti-
zation of sub-watershed for sustainable development and
management of natural resources: An integrated approach
using remote sensing, GIS and socio-economis data. Current
Science, 95(3): 345-354.
Storie, R. (1978). Storie index soil rating. Oakland, University of
California, Division of Agricultural Sciences, Special
Publication 3203.
Surya, J.N., Sidhu, G.S., Lal, T. and Sharma, J.P. (2008). Macro
and Micro Level Soil Resource Mapping for Soil Erosion
Assessment and Conservation in Shiwalik Region of Himala-
yas, India. Proceedings of 15th International Congress on
Soil and Water Conservation, Climate Change and Environ-
mental Sensitivity”of the International Soil Conservation
Organisation (ISCO) held at Hungry pp1-8.
Tveit, M.S. (2009). Indicators of visual scale as predictors of
landscape preference: A comparison between groups. Jour-
nal of Environment Management, 90: 2882–2888.
Tulau, M.J. (1994). Soil Landscapes of the Cooma 1:100 000
Sheet Map. Department of Conservation & Land Manage-
ment, Sydney.
van Diepen, C.A., Van Keulen, H., Wolf, J. and Berkhout, J.A.A.
(1991). Land evaluation: from intuition to quantification. In:
B.A. Stewart (ed.), Advances in Soil Science. Springer, New
York, pp: 139-204.
Velayutham, M., Mandal, D.K., Mandal, C. and Sehgal, J.
(1999). Agro-Ecological Subregions of India for Planning
and Development. NBSS and LUP, Publ. No.35, pp: 372.
Velayutham, M. (2012). National Soil Information System
(NASIS) and Land Resource Mapping for Perspective Land
Use Planning and Pragmatic Farm level Planning. Madras
Agriculture Journal, 99(4-6): 147-154.
UNCED (1992). Agenda 21. Adoption of agreements on environ-
ment and development 1. Means of implementation.
UNCED, Rio de Janeiro.
Walters, S. (2013). A Sociolinguistic Profile of the Bhils of North-
ern Dhule District. SIL Electronic Survey Report, pp: 26.
Wang, C. and Burris, M.A. (1997). Photo voice: concept, meth-
odology and use for participatory needs assessment. Health
Education and Behavior, 24(3): 369-387.
Wood, S.A. and Dent, F.J. (1983). LECS: A land evaluation com-
puter system. AGOF/INS/78/006 Manual; Govt. of
Indonesia, Bogar.
Ziblim, I.A., Anti, D.O. and Augustine Asmah. E. (2012).
Productivity index rating of some soils in the Tolon / Kum-
bungu district of the Northern region of Ghana. Journal of
Soil Science and Environmental Management, 3(6): 154-163.
Copyright © 2022 FDOKUMEN