new zealand agricultural and resource economics society (inc.)
197
Papers Presented at the NEW ZEALAND AGRICULTURAL AND RESOURCE ECONOMICS SOCIETY (INC.) SEVENTH ANNUAL CONFERENCE "WHERE FROM- WHERE TO?" Incorporating The 25th Annual Conference of the New Zealand Branch of the Australian Agricultural And Resource Economics Society (Inc.J Blenheim Country Lodge July 2001 Discussion Paper No. 148 Published on behalf of the New Zealand Agricultural And Resource Economics Society (Inc.) PO Box 19-560 CHRISTCHURCH Telephone & Fax (64) (3) 384 2432 by Agribusiness and Economics Research Unit PO Box 84 Lincoln University CANTERBURY Telephone: (64) (3) 325 2811 Fax: (64) (3) 325 3847 ISSN 1170-7607 ISBN 0-909042-23-3
-
Upload
khangminh22 -
Category
Documents
-
view
0 -
download
0
Transcript of new zealand agricultural and resource economics society (inc.)
Papers Presented at the
NEW ZEALAND AGRICULTURAL AND RESOURCE ECONOMICS SOCIETY (INC.)
SEVENTH ANNUAL CONFERENCE "WHERE FROM- WHERE TO?"
Incorporating The 25th Annual Conference of the New Zealand Branch of the Australian Agricultural
And Resource Economics Society (Inc.J
Blenheim Country Lodge
July 2001
Discussion Paper No. 148
Published on behalf of the New Zealand Agricultural And Resource Economics Society (Inc.)
PO Box 19-560 CHRISTCHURCH
Telephone & Fax (64) (3) 384 2432
by
Agribusiness and Economics Research Unit PO Box 84
Lincoln University CANTERBURY
Telephone: (64) (3) 325 2811 Fax: (64) (3) 325 3847
ISSN 1170-7607 ISBN 0-909042-23-3


CONTENTS
PRESIDENT'S REPORT
GMO'S
Biotechnology In New Zealand: What Do We Know Dan Marsh
New Zealand Consumer Reaction to GM Food: Studies of Beliefs, Attitudes and Intentions to Purchase A Cook
GMO's and the Royal Commission D Wansbrough
Cultural Perspectives on Agriculture P Simons
INFRASTRUCTURE & SERVICES ISSUES
E-commerce In The Primary Sector: Spectre or Saviour M Stoke, C Nixon, I Parminter
Roading Reform: Policies, Progress And Potholes C Perry
Maori, The Crown and the Governance and Management of Assets F Scrimgeour, C Iremonger
Rural T~lecommunications: Its All Up In The Air J Squire
INDUSTRY ISSUES
Identifying the Sectors' Concerns TWharton
Industrialisation of the New Zealand Pork Industry ARyan
Dairying: The New Boom Industry CWard
1
7
12
16
26
32
38
49
53
58
64

Climate Variability and the Economy A Tait, J Fenwick, C Francis
TRADE
67
Trade and the Environment: Linking Trade and Climate Change With Agricultural Production Systems in a Partial Equilibrium Trade Model 72 C Saunders, A Wreford, S Catagay
The Pacific Five Free Trade Area: Impacts on Agriculture in New Zealand 77 J Ballingall
The Current Round of Agricultural Trade Negotiations: Why Bother about Domestic Support? 82 ANRae
ENVIRONMENT #1
Economic Efficiency of Water Allocation: Theory, Overseas Experience and Issues for New Zealand 90 S Ford
A Participation Analysis of Communication Networks to Guide Policy Strategy: Results from a Study of Farm Dairy Emuent Policy Strategies in the State of Victoria 95 T G Panninter, J A Pederson, J Wilson, S Jefford
Social and Economic Impacts Associated with Irrigated Land Use Change 100 H McCrostie Little, N Taylor
Water Resource Issues 106 G McFadden
The Development of Education and Information Strategies for Implementing Environmental Policy: Results from a Study of Farm Dairy Emuent Policy Strategies in the State of Victoria 113 T G Panninter, J A Pederson, J Wilson, S Jefford

ENVIRONMENT # 2
Environmental Taxation in New Zealand: What Place Does it Have? F Scrimgeour, K Piddington
Macroeconometric Modelling with an Environmentally Adjusted Agriculture Sector S Shakur
Sustainable Development Extension - Should Government Intervene? C Nixon, J Yeabsley
Quality of the Environment: What the public thinks A Cook, K D F Hughey, G N Kerr, R Cullen
FOREX & TARRIFS
Hedging Farm Gate Returns K Wilson
Tariff Rate Quotas: Difficult to Model or Plain Simple PM Bishop, C F Nicholson, J E Pratt, A M Novakovic
DAIRY
The Future of Small Dairy Farms in New Zealand; Comparing Methods and Results A E Dooley, C L Massey, E M Hurley
Dairy Mergers and the National Interest RJohnson
FORESTRY
Regional Variation in Radiata Pine Sawlog Prices in New Zealand M Bloomberg, H Bigsby, R Sedcole
Land use Change and Forestry Expansion by Smallholders B Dhakal, H Bigsby, R Cullen
116.
124
129
134
139
147
161
167
175
181


~ NZARES
2001 Conference List of Papers and Authors
Title
Friday 1.00pm Contributed Paper Session:
I.
2.
3.
4.
5.
6.
7.
8.
9.
GMO's:
Malborough Room
Biotechnology in New Zealand: what do we know and how should we study it?
Perceptions of the organic industry towards genetic engineering
New Zealand consumer reaction to GM food: studies of beliefs, attitudes and intentions to purchase
GMO's and the Royal Commission
Cultural perspectives on agriculture
Infrastructure & Services Issues:
ChartRoom
E-commerce in the primary sector: promise or threat?
Roading reform: policies, progress and potholes
Maori, the Crown and the governance and management of assets
Rural Telecommunications: Its all up in the air
Industry Issues:
Seymour Bar
10. Identifying the sectors' concerns
11. Industrialisation of the pork industry
12. Dairy industry profitability
13. Climate variability and the economy
Author
Chair - Phil Journeaux
Marsh, D.
Wreford, A., Holland. J., Kelly, T.
Cook, A.
Wansbrough, D.
Simons, P.
Chair - Murray Doak
Stoke, M., Nixon, c., Panninter, l.
Perry, C.
Scrimgeour, F., Iremonger, C.
Squire, J.
Chair - Sandra Martin
Wharton, T.
Ryan, A.
Ward, C.
Tait, A., Renwick, J., Francis, C.
~ NZARES
List of Papers and Authors Title Author
Friday 3.30pm Contributed Paper Session:
Trade:
Malborough Room Chair - Robin Johnson
14. Trade and the environment: linking a partial eqnilibrium trade Saunders, c., Wreford, A., Catagay, S. model with production systems and their environmental consequences
15. The Pacific Five Free Trade Area: impacts on agriculture in Ballingall, J. New Zealand
16. The Asian Crisis and droughts: impacts on NZ's agriculture Gardiner, P., Forbes, R. sector and the NZ economy
17. The current round of agricultural trade negotiations: why Rae, A. N.
18.
19.
20.
bother about domestic support?
Environment # 1:
ChartRoom
Economic efficiency of water allocation
A Participation analysis of communication networks to guide policy strategy: results from a study of farm dairy effluent policy strategies in the State of Victoria.
Social and economic impacts associated with irrigated land use change
21. The development of education and information strategies for implementing environmental policy: resnlts from a study of farm dairy effluent policy strategies in the State of Victoria
Chair - Dan Marsh
Ford, S.,
Parminter, T.G., Pedersen. J.A., Wilson. J., Jefford, S.
McCrostie Little, H., Taylor. N.,
Parminter, T.G., Pedersen, J.A., Wilson, J., Jefford, S.
~ NZARES
Lis!.Qf..~pers and Authors Title Author
22.
23.
24.
25.
Environment # 2:
Seymour Bar
Environmental taxation in New Zealand: what place does it have?
Macroeconometric modelling with an environmentally adjusted agriculture sector
Sustainable development extension - should Government intervene?
New Zealanders perceptions of the environment and quality of environmental management
Saturday 9.00am Contributed Paper Session:
Forex & Tariffs:
Malborough Room
26. Foreign exchange agreements and agriculture
27. Tariff rate quotas: difficult to model or plain simple?
Dairy:
ChartRoom
28. The future of small dairy farms in New Zealand; comparing methods and results
29. Dairy mergers and the national interest
Forestry:
Seymour Bar
30. Regional variation in Radiata Pine sawlog prices in New Zealand
31. Landuse Change and Forestry Expansion by Smallholders
Chair - Fiona Duncan
Scrimgeour, F., Piddington, K.
Shakur, S.
Nixon, C.
Cook, A., Hughey, K.D.F., Kerr, G. N., Cullen, R.
Chair - Rob Davison
Wilson,K.
Bishop, P.M.
Chair - Frank Scrimgeour
Dooley, A.E., Massey c.L., Hurley, E.M.
Johnson, R.
Chair - Rod Forbes
Bloomberg, M., Bigsby, H., Sedcole, R.
Bigsby, H.
NZARES Annual General Meeting 2001 President's Report
This year NZARES took a further step in defining our own identity as a distinct organisation from the Australian Agricultural and Resource Economics Society, with the selection of a logo. As I noted at the conference opening, the designer described the logo as follows: The "A" draws on the associated Australian Society's logo, as well as standing for agriculture. The "R" incorporated in the logo stands for the resource management aspects of the society, and ends in an uncurling fern frond, which is a symbol of New Zealand. The fern frond also represented an historical resource for Maori, and suggests the natural resources of the land. The sweep of the fern shape and the underlying curve suggest the New Zealand landscape, and the curl of the fern suggests the sea with its many resources. Block lettering was used for the NZARES lettering, to illustrate the strong quantitative and robust analytical underpinnings of the Society. My special thanks to Phil Journeaux for organising the competition, the selection committee (Phil Journeaux and Dan Marsh) for choosing the winner, and of course to the designer.
Our membership continues to grow. Cm1'ently we have 94 NZARES members, and 30 AARES members affiliated to the NZARES, a total financial membership of 124. NZARES membership was 75 in J 999/00, and 84 in J 998/99. [n 1999/2000, we held the AARES conference in Christchurch with no July conference, and this resulted in lower NZARES membership and higher AARES membership. With the exception of 1999/00, the NZARES membership has been steadily increasing over the past few years. The secretariat has been diligent in following up members in recent years with reminders to renew their membership, with positive results.
The major focus for the year has been organising the conference. The conference forms an important part of the development of the agricultural and resource economics profession in New Zealand, by bringing together practitioners, consultants, agribusiness, policy analysts and academics. It provides a constructive and friendly fOlUm to present recent research, air ideas, and make connections with others carrying out allied work.
We remain affiliated to the AARES, and currently the NZARES constitution requires that at least one person on the executive committee be a member of AARES and represent NZARES on th", AARES Council. During the course of this AGM we will vote on a proposed constitution change which (if passed) will have the effect of creating a formal councillor's position on the NZARES committee. Rod has acted as the New Zealand councillor on the AARES this year. He attended the August 2000 AARES meeting, and Robin Johnson stood in as councillor at the pre and post AARES conference meetings in Adelaide in January 2001. No-one from New Zealand was able to attend the May 200 I council meeting.
At the August 2000 council meeting, the sharing of net conference proceeds from AARES conferences was discussed. The following motion was passed:
The Society [AARES] makes a payment to the Local Branch of20% of cash surplus with a maximum of $3,000 from holding a conference. Where the Society holds a conference with others (including NZARES) that the sharing of cash surplus be by negotiation.
The recognition of New Zealand as a "special case" ensures that NZARES will not be financially disadvantaged by holding an AARES conference. The annual conference is an important source of funds for NZARES.
At the January 2001 council meetings, the Australian Society expressed enthusiasm for more New Zealand participation, including membership, and attendance at the annual conference and council meetings. The next AARES conference will be held in Canberra on 12-14 February 2002 - it would be good to have a strong New Zealand contingent attending. I would also like to encourage membership of the Australian Society, and suggest that the new committee attempt to attend most of the council meetings. The annual capitation grant of $1000 from AARES goes some way towards meeting the costs of attending council meetings. Another event to remember is the 2006 IAAE conference which will be held in Brisbane in August.
Another key activity of the Society is the Undergraduate and Postgraduate awards. As a result of the discussion of the best method of selecting candidates for these awards at the last AGM, I liaised with Peter Nuthall at Lincoln University and Evelyn Hurley in Palmerston North, and with their assistance, drew up a staff contact list for the awards at Massey and Lincoln. My thanks to both Peter and Evelyn for their help.
The New Zealand recipient for the 2001 AARES Undergraduate Award went to Graeme Doole, who has just completed his Batchelor of Applied Science (Natural Resource Management) at Massey University. He has an outstanding academic record.
The 2001 NZARES Postgraduate Awards went to:
• Marcelo Monteiro, Lincoln University MCom (Ag) student, thesis topic "Vertical coordination in the NZ beef industry"
• Graeme Doole, Massey University MApplEcon student, thesis topic "A bioeconomic model for the preservation of the NZ Longfin eel with the inclusion of cultural values"
• Arusa Sutthiwongse, University of Waikato PhD student, thesis topic "Resource management case-study: watershed management in Thailand"
Congratulations to the three recipients, and thanks to the university staff who did the selecting.
I wish to express my gratitude to Phil Journeaux, the secretary, and Dan Marsh, the treasurer, and the rest of the committee for their efforts in undertaking the business of the NZARES. I would also like to thank Ron and Susan Sheppard for their assistance with keeping the Society operating smoothly. Finally, I wish Shamim and his new committee all the best for 2001/02.
Irene Parminter

....
Biotechnology in New Zealand: What Do We Know?
By Dan Marsh University ofWaikato Management School
Email: [email protected]
ABSTRACT
The New Zealand Biotechnology 'sector' is wOlthy of study for several reasons. While there is a large and growing international literature on economic aspects of biotechnology innovation these studies concentrate on the United States and Europe. The New Zealand biotechnology sector may be expected to develop along a different trajectory as a consequence of a markedly different set of initial and framework conditions. Government has indicated a strong interest in fosteIing innovation and aims to concentrate on selected areas where New Zealand may be able to develop a new comparative advantage. One such area is biotechnology, which would build on New Zealand's existing comparative advantage in the primary sector (dairy, forestry, meat, wool and horticulture). This paper presents some preliminary results from an ongoing study that aims to fill some of the gaps in our knowledge of innovation processes in New Zealand while using the international literature as a benchmark.
Why Study Biotechnology?
"Biotechnology will profoundly affect the future of agriculture, altering its institutional structures, its products and the way it is practiced". This is the conclusion of a recent paper coauthored by David Zilberman (1997), professor of agricultural and resource economics at the University of California. Technologies that have the potential to transform large parts of the global economy are often called 'revolutionary' and the rapid development of biotechnology over the last 25 years has been called the biotechnology revolution. This article describes the extent to which modern biotechnology is used in New Zealand and draws some international comparisons.
The collection of techniques which make up modern biotechnology are part of the overall process of technical change. This is driven partly by basic science and partly by organisations which put resources into R&D because they expect to be able to realise economic benefits. Success in introducing or imitating new products or processes changes production costs and market competitiveness and contributes ultimately to the evolution of industries affected by technical change (Dosi, 1988). Most people are (or should be) in favour of technical change - it is after all what has enabled us to multiply the incomes and standard of living of millions of people in the developed world. Primary industry is no stranger to technical change; to take one example output per agricultural worker in the USA increased thirty fold over the period from 1880-1980 (Scherer, 1999, p. 18).
The reason why there is so much interest in modern biotechnology is because of the idea that it may be a generic technology of the kind that has so deeply transformed industrial economies in the past. Computers and micro-electronics provide the best known recent example of a pervasive and revolutionary technology. Electronic computing was introduced during and immediately after the Second World War.
Some scientists and engineers thought that uptake would be rapid with immense social consequences including large-scale unemployment. However Diebold (1952) suggested that introduction and diffusion of revolutionary new technologies requires major changes in the capital stock, the skill profile and structure of industry and so usually takes decades rather than years or months. His analysis proved to be remarkably accurate. Even though the computer industry has grown very fast, it took a whole series of complementary changes before computer based innovation could diffuse throughout the economy.
Chris Freeman (1995), a leading innovation economist, suggests that a new group of technologies should meet the following conditions if they are to have major effects on the economy. They should:
• create a new range of products accompanied by improvements in the technical characteristics of many products and processes
• bring about a reduction in the costs of many products and services • be socially and politically acceptable • be environmentally acceptable • have pervasive effects throughout the economic system
Modern biotechnology clearly meets the first condition. It created enormous excitement in the research community and was fuelled by an unparalleled explosion of private venture capital funding (particularly in the USA). The jury is still out on the Freeman's second condition: "so far biotechnology has led to profitable innovations in only a relatively small number of applications in a few sectors in a few countries" (Freeman, 1995, p. 15). New Zealand along with many other countries is in the middle of a heated debate about whether biotechnology is socially, politically or environmentally acceptable. The outcome with respect to these first four conditions will determine the extent to which it has "pervasive effects throughout the economic system" - and whether it can accurately be described as a revolutionary technology.
What is Biotechnology?
The term biotechnology was coined in 1919 by Karl Ereky, a Hungarian engineer to refer to "all the lines of work by which products are produced from raw materials with the aid of living organisms"(Bud, 1989, p. 10). Since then "the word biotechnology has been re-developed at least four times and its definition changed on each occasion" (Kennedy, 1991, p. 218).
The economics literature has tended to focus on modern biotechnology defined by McKelvey as: "biological activities dependent on controlled changes to genes, and thereby intimately coupled to scientific fields such as molecular biology and biochemistry and to genetic engineering and gene therapy ... " (1996, p. 81). Other authors have used a slightly wider definition; for example Eliasson and Eliasson state that: "the biotech field is thought of as consisting of three or four sub-areas: (I) recombinant DNA technology, (2) use of antibodies including phage display, and (3) protein engineering. Sometimes also: fermentation and volume production of (generic) biological substances are defined as a separate biotech area" (Eliasson & Eliasson, 1997, p. 145).
I\)
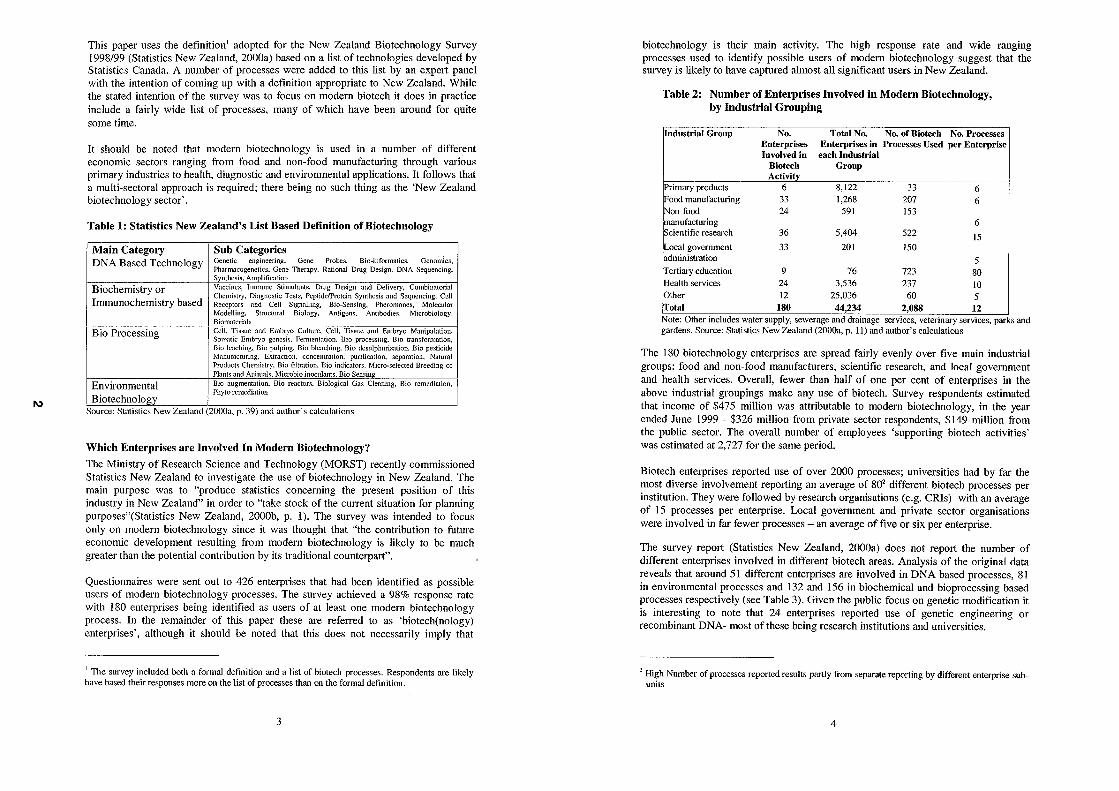
This paper uses the definition' adopted for the New Zealand Biotechnology Survey 1998/99 (Statistics New Zealand, 2000a) based on a list of technologies developed by Statistics Canada. A number of processes were added to this list by an expert panel with the intention of coming up with a definition appropriate to New Zealand. While the stated intention of the survey was to focus on modern biotech it does in practice include a fairly wide list of processes, many of which have been around for quite some time.
It should be noted that modern biotechnology is used in a number of different economic sectors ranging from food and non-food manufacturing through various primary industries to health, diagnostic and environmental applications. It follows that a multi-sectoral approach is required; there being no such thing as the 'New Zealand biotechnology sector'.
Table 1: Statistics New Zealand's List Based Definition of Biotechnology
Main Cateeorv DNA Based Technology
Biochemistry or Immunochemistry based
Bio Processing
Environmental Biotechnology
Sub Categories Genetic engineering, Gene Probes. Bio-informatics. Genomics, Phnrmacogenetics, Gene Therapy, Rational Drug Design, DNA Sequencing, Synthesis. Amplification Vaccines, Tmnlune Stimulants, Drug Design and Delivery, Combinatorial Chemistry. Diagnostic Tests. Peptide/Protein Synthesis and Sequencing. Cell Receptors and Cell Signalling, Bio-Sensing, Pheromones, Molecular Modelling. Structural Biology, Antigens, Antibodies, Microbiology, Biomaterials Cell, Tissue and Embryo Culture. Cell, Tissue and Embryo Manipulation. Somatic Embryo genesis. Fermentation. Bio processing, Bio transformation, Bio leaching. Bio pulping. Bio bleaching, Bio desulphurisation. Bio pesticide Manufacturing, Extraction. concentration. purification, separation, Natural Products Chemistry, Bio filtration. Bio indicators, Micro-selected Breeding of Plants and Animals. Microbia inoculants. Bio Sensing Bio augmentation. Bio reactors. Biological Gas Cleaning. Bio remediation. Phyto remediation
Source: Statistics New Zealand (2000a, p. 39) and author' s calculations
Which Enterprises are Involved In Modern Biotechnology?
The Ministry of Research Science and Technology (MORST) recently commissioned Statistics New Zealand to investigate the use of biotechnology in New Zealand. The main purpose was to "produce statistics concerning the present position of this industry in New Zealand" in order to "take stock of the current situation for planning purposes"(Statistics New Zealand, 2000b, p. 1). The survey was intended to focus only on modern biotechnology since it was thought that "the contribution to future economic development resulting from modern biotechnology is likely to be much greater than the potential contribution by its traditional counterpart".
Questionnaires were sent out to 426 enterprises that had been identified as possible users of modern biotechnology processes. The survey achieved a 98% response rate with 180 enterprises being identified as users of at least one modern biotechnology process. In the remainder of this paper these are referred to as 'biotech(nology) enterprises', although it should be noted that this does not necessarily imply that
I The survey included both a formal definition and a list of biotech processes. Respondents are likely have based their responses more on the list of processes than on the formal definition.
3
biotechnology is their main actlVlty. The high response rate and wide ranging processes used to identify possible users of modern biotechnology suggest that the survey is likely to have captured almost all significant users in New Zealand.
Table 2: Number of Enterprises Involved in Modern Bioteclmology, by Industrial Grouping
ndustrial Group
IPrimary products Food manufacturing Non-food jmanufacturing iScientifiC research
Local government
No. Enterprises Involved in
Biotech Activity
6 33 24
36
33
Total No. No. of Biotech No. Processes Enterprises in Processes Used per Enterprise each Indnstrial
Group
8,122 33 6 1,268 207 6
591 153 6
5,404 522 15 201 150
ladministration 5
~ertiary education 9 76 723 80 I~ealth services 24 3,536 237 10 Other 12 25,036 60 5 ~otal 180 44,234 2,088 12 Note: Other includes water supply, sewerage and drainage services, veterinary services, parks and gardens. Source: Statistics New Zealand (2000a, p. 11) and author's calculations
The 180 biotechnology enterprises are spread fairly evenly over five main industrial groups: food and non-food manufacturers, scientific research, and local government and health services. Overall, fewer than half of one per cent of enterprises in the above industrial groupings make any use of biotech. Survey respondents estimated that income of $475 million was attributable to modern biotechnology, in the year ended June 1999 - $326 million from private sector respondents, $149 million from the public sector. The overall number of employees 'supporting biotech activities' was estimated at 2,727 for the same period.
Biotech enterprises repOlied use of over 2000 processes; universities had by far the most diverse involvement reporting an average of 802 different biotech processes per institution. They were followed by research organisations (e.g. CRIs) with an average of 15 processes per enterprise. Local government and private sector organisations were involved in far fewer processes - an average of five or six per enterprise.
The survey repOli (Statistics New Zealand, 2000a) does not report the number of different enterprises involved in different biotech areas. Analysis of the original data reveals that around 51 different enterprises are involved in DNA based processes, 81 in environmental processes and 132 and 156 in biochemical and bioprocessing based processes respectively (see Table 3). Given the public focus on genetic modification it is interesting to note that 24 enterprises reported use of genetic engineering or recombinant DNA- most of these being research institutions and universities.
2 High Number of processes reported results partly from separate reporting by different enterprise subunits
4
Co)
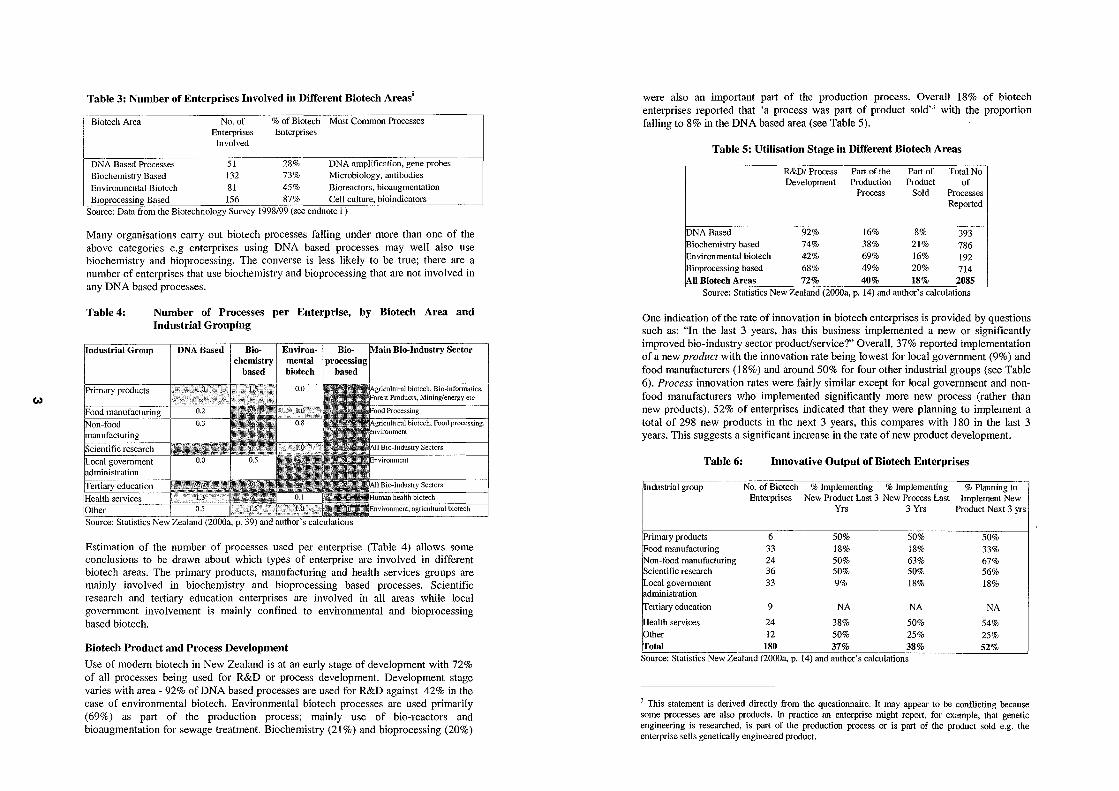
Table 3: Number of Enterprises Involved in Different Biotech Areas i
Biotech Area No. of Enterprises
Involved
% of Biotech Most Common Processes Enterprises
DNA Based Processes 5 I 28% DNA amplification, gene probes Biochemistry Based 132 73% Microbiology, antibodies Environmental Biotech 81 45% Bioreactors, bioaugmentation Bioprocessing Based 156 87% Cell culture, bioindicators
Source: Data liOln the Biotechnology Survey 1998/99 (see endnote i )
Many organisations carry out biotech processes falling under more than one of the above categories e.g enterprises using DNA based processes may well also use biochemistry and bioprocessing. The converse is less likely to be true; there are a number of enterprises that use biochemistry and bioprocessing that are not involved in any DNA based processes.
Table 4: Number of Processes per Enterprise, by Biotech Area and Industrial Grouping
Estimation of the number of processes used per enterprise (Table 4) allows some conclusions to be drawn about which types of enterprise are involved in different biotech areas. The primary products, manufacturing and health services groups are mainly involved in biochemistry and bioprocessing based processes. Scientific research and tertiary education enterpIises are involved in all areas while local government involvement is mainly confined to environmental and bioprocessing based biotech.
Biotech Product and Process Development
Use of modern biotech in New Zealand is at an early stage of development with 72% of all processes being used for R&D or process development. Development stage varies with area - 92% of DNA based processes are used for R&D against 42% in the case of environmental biotech. Environmental biotech processes are used primarily (69%) as part of the production process; mainly use of bio-reactors and bioaugmentation for sewage treatment. Biochemistry (21 %) and bioprocessing (20%)
were also an important part of the production process. Overall 18% of biotech enterprises reported that 'a process was part of product sold" with the proportion falling to 8% in the DNA based area (see Table 5).
Table 5: Utilisation Stage in Different Biotech Areas
R&DI Process Part of the Part of Total No Development Production Product of
Process Sold Processes Reported
DNA Based 92% 16% 8% 393 Biochemistry based 74% 38% 2 I % 786 Environmental biotech 42% 69% 16% 192
ioprocessing based 68% 49% 20% 714
II Biotech Areas 72% 40% 18% 2085 Source: Statistics New Zealand (20003, p. 14) and author's calculations
One indication of the rate of innovation in biotech enterprises is provided by questions such as: "In the last 3 years, has this business implemented a new or significantly improved bio-industry sector product/service?" Overall, 37% reported implementation of a new product with the innovation rate being lowest for local government (9%) and food manufacturers (18%) and around 50% for four other industrial groups (see Table 6). Process innovation rates were fairly similar except for local government and nonfood manufacturers who implemented significantly more new process (rather than new products). 52% of enterprises indicated that they were planning to implement a total of 298 new products in the next 3 years, this compares with 180 in the last 3 years. This suggests a significant increase in the rate of new product development.
Table 6:
Industrial group
iPrimary products :Food manufacturing Non-food manufacturing Scientific research Local government administration
eltiaryeducation
otal
Innovative Output of Biotech Enterprises
No. of Biotech % Implementing % Implementing Enterprises New Product Last 3 New Process Last
Yrs 3 Yrs
6 50% 50% 33 18% 18% 24 50% 63% 36 50% 50% 33 9% 18%
9 NA NA
24 38% 50% 12 50% 25%
180 37% 38%
% Planning to Implement New
Product Next 3 yrs
50% 33% 67% 56% 18%
NA
54% 25% 52%
Source: Statistics New Zealand (20003, p. 14) and author's calculations
3 This statement is derived directly from the questionnaire. It may appear to be conflicting because some processes are also products. In practice an enterprise might report, for example, that genetic engineering is researched, is part of the production process or is part of the product sold e.g. the enterprise sells genetically engineered product.
.j::>,
Innovation rate data is included in OECD and EU innovation surveys but has not been systematically collected in New Zealand'. An innovation survey commissioned by MORST in 1994 asked, "how many completely new product lines have you introduced in the last 5 years?" It was found that the average company had introduced 16 completely new products over that period (Frater, Stuart, Rose, & Andrews, 1995, p. 74). This is a significantly higher level than reported by biotech enterprises, (averaging one new product per enterprise over the last three years) although this may be partly attributable to differences in the survey populations, question formats and timeframe.
The OECD has used 'the share of fums introducing at least one new or improved product or process onto the market over a given period' to compare the innovative output of firms in different member countries. The share of all manufacturing fums that introduced a new product/process in 1994-96 was between 60 and 80% for most OECD members. For fums with 20-49 employees the share was significantly lower -averaging 40% of fums (OECD, 1999, p. 170) - this is similar to the rate of 37-38% repOlted by biotech enterprises in New Zealand.
Further work is required before definite conclusions can be reached on the relative innovative output of New Zealand biotech firms - although the evidence reviewed above does not SUppOlt the idea that New Zealand biotech fums have a particularly high rate of new product or process development.
Patenting as an Indicator of Innovative Activity
The use of data fi'om patenting as an indicator of innovative activity has been well established for many years'. There is also a rapidly increasing literature in the biotechnology area based on analysis of patents (Foltz, Barham, & Kim, 2000; Joly & de Looze, 1996; Malo & Geuna, 1999; McMillan, Narin, & Deeds, 2000).
A preliminary analysis of New Zealand patenting activity in biotechnology was can-ied out using international applications published in the Patent Cooperation Treaty (PCT) Electronic Gazette. The PCT provides for the filing of an international application to have the same effect as a national application in each of the contracted states designated in the application (OECD, 1994, p. 19); it thus provides a useful measure of international patenting activity. Use of applications data provides a more immediate picture, since it can take up to five years from the first application for a patent to be granted.
Methodology based on Engelbrecht and Dan-och (1999) was used to compare New Zealand's rate of patenting with G7 and a reference group of small high-income OECD countries (see Table 2). For the purposes of this analysis modern biotechnology was taken to be synonymous with the International Patent Class CI2N, while a 'Broad Definition' of biotechnology included a number of other classes detailed below".
4 Such a question is expected to be included in the upcoming Businesses Practices Survey to be implemented by Statistics New Zealand in 200 I.
, See Griliches (1990) for an excellent survey. 6 Includes AOIG, AOIH, AOIN, CI2M, CI2N, CI2P, CI2Q - defined as 'General Biotechnology' by Joly and de
7
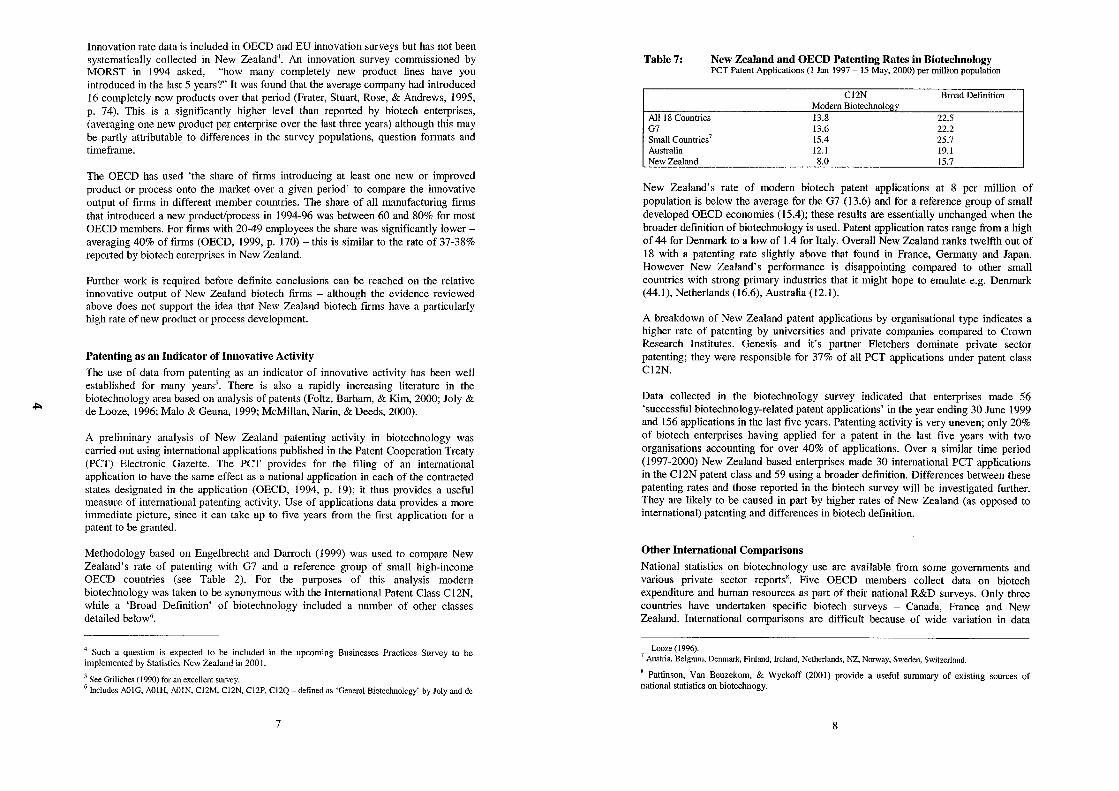
Table 7: New Zealand and OECD Patenting Rates in Biotechnology PCT Patent Applications (l Jan 1997 - 15 May, 2000) per million population
All 18 Countries G7 Small Countries 7
Australia New Zealand
C12N Modern Biotechnology 13.8 13.6 15.4 12.1 8.0
Broad Definition
22.5 22.2 25.7 19.1 15.7
New Zealand's rate of modern biotech patent applications at 8 per million of population is below the average for the G7 (13.6) and for a reference group of small developed OECD economies (15.4); these results are essentially unchanged when the broader definition of biotechnology is used. Patent application rates range from a high of 44 for Denmark to a low of 1.4 for Italy. Overall New Zealand ranks twelfth out of 18 with a patenting rate slightly above that found in France, Germany and Japan. However New Zealand's performance is disappointing compared to other small countries with strong primary industries that it might hope to emulate e.g. Denmark (44.1), Netherlands (16.6), Australia (12.1).
A breakdown of New Zealand patent applications by organisational type indicates a higher rate of patenting by universities and private companies compared to Crown Research Institutes. Genesis and it's partner Fletchers dominate private sector patenting; they were responsible for 37% of all PCT applications under patent class CI2N.
Data collected in the biotechnology survey indicated that enterprises made 56 'successful biotechnology-related patent applications' in the year ending 30 June 1999 and 156 applications in the last five years. Patenting activity is very uneven; only 20% of biotech enterprises having applied for a patent in the last five years with two organisations accounting for over 40% of applications. Over a similar time period (1997-2000) New Zealand based enterprises made 30 international PCT applications in the CI2N patent class and 59 using a broader definition. Differences between these patenting rates and those reported in the biotech survey will be investigated further. They are likely to be caused in part by higher rates of New Zealand (as opposed to international) patenting and differences in biotech definition.
Other International Comparisons
National statistics on biotechnology use are available from some governments and various private sector repOlts'. Five OECD members collect data on biotech expenditure and human resources as part of their national R&D surveys. Only three countries have undertaken specific biotech surveys - Canada, France and New Zealand. International comparisons are difficult because of wide variation in data
Looze (1996). 7 Austria, Belgium, Denmark, Finland, Ireland, Netherlands, NZ, Norway, Sweden, Switzerland.
8 Pattinson, Van Beuzekom, & Wyckoff (2001) provide a useful summary of existing sources of national statistics on biotechnogy.
8
(1J
collection methods and definitions. The Statistics New Zealand biotech survey was closely modelled on work can'ied out by Statistics Canada with some important differences. The New Zealand definition of biotech included several additional processes and so was somewhat wider than that used in Canada. The number of biotech firms is also not directly comparable since the Canadian survey excluded firms that had less than 5 employees and less than $100,000 R&D expenditures'.
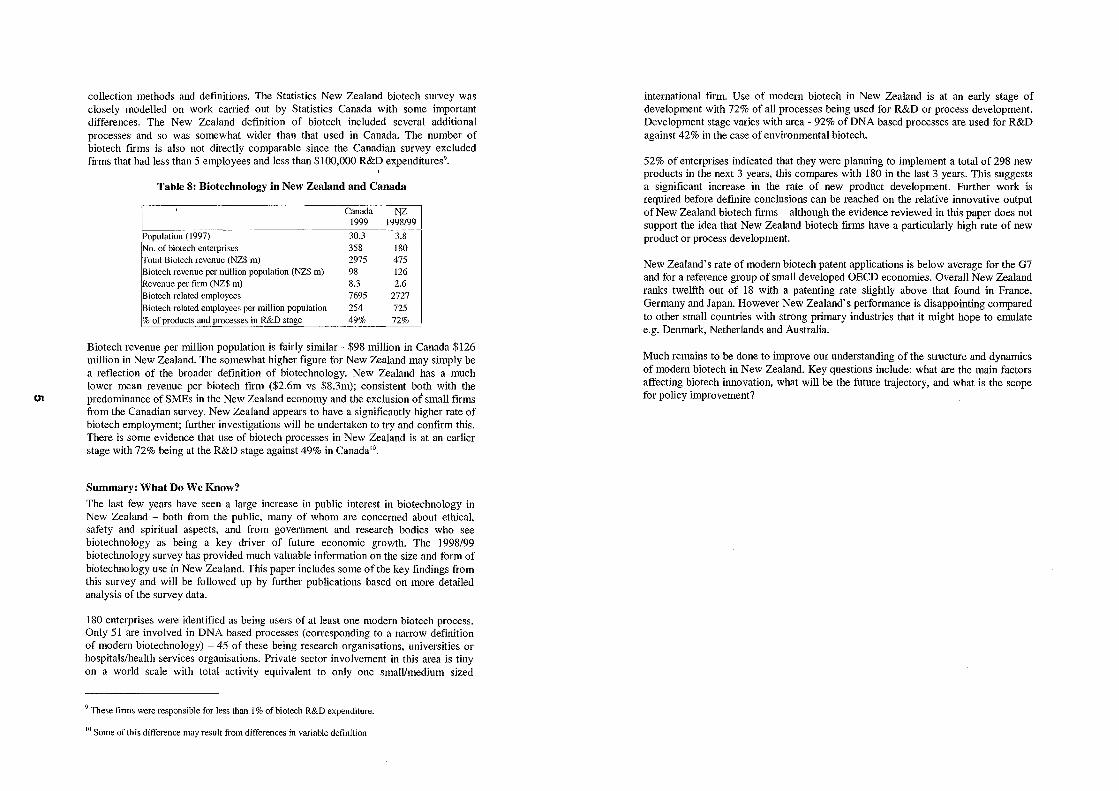
Table 8: Biotechnology in New Zealand and Canada
Canada NZ 1999 1998/99
iPopulation (1997) 30.3 -----u No. of biotech enterprises 358 180
'otal Biotech revenue (NZ$ m) 2975 475 ,Biotech revenue per million population (NZ$ m) 98 126 Revenue per fum (NZ$ m) 8.3 2.6 Biotech related employees 7695 2727 iBiotech related employees per million population 254 725 % of products and processes in R&D stage 49% 72%
Biotech revenue per million population is fairly similar - $98 million in Canada $126 million in New Zealand. The somewhat higher figure for New Zealand may simply be a reflection of the broader definition of biotechnology. New Zealand has a much lower mean revenue per biotech firm ($2.6m vs $8.3m); consistent both with the predominance of SMEs in the New Zealand economy and the exclusion of smail firms fi'om the Canadian survey. New Zealand appears to have a significantly higher rate of biotech employment; further investigations will be undertaken to try and confirm this. There is some evidence that use of biotech processes in New Zealand is at an earlier stage with 72% being at the R&D stage against 49% in Canada '0.
Summary: What Do We Know?
The last few years have seen a large increase in public interest in biotechnology in New Zealand - both fi'om the public, many of whom are concerned about ethical, safety and spiritual aspects, and fi'om government and research bodies who see biotechnology as being a key driver of future economic growth. The 1998/99 biotechnology survey has provided much valuable information on the size and form of biotechnology use in New Zealand. This paper includes some of the key findings from this survey and will be followed up by further publications based on more detailed analysis of the survey data.
180 enterprises were identified as being users of at least one modern biotech process. Only 51 are involved in DNA based processes (con-esponding to a nan-ow definition of modern biotechnology) - 45 of these being research organisations, universities or hospitals/health services organisations. Private sector involvement in this area is tiny on a world scale with total activity equivalent to only one smaIVmedium sized
'These firms were responsible for less than I % of biotech R&D expenditure.
10 Some of this difference may result trom differences in variable definition
international firm. Use of modern biotech in New Zealand is at an early stage of development with 72% of all processes being used for R&D or process development. Development stage varies with area - 92% of DNA based processes are used for R&D against 42% in the case of environmental biotech.
52% of enterprises indicated that they were planning to implement a total of 298 new products in the next 3 years, this compares with 180 in the last 3 years. This suggests a significant increase in the rate of new product development. Further work is required before definite conclusions can be reached on the relative innovative output of New Zealand biotech firms - although the evidence reviewed in this paper does not support the idea that New Zealand biotech firms have a particularly high rate of new product or process development.
New Zealand's rate of modern biotech patent applications is below average for the G7 and for a reference group of small developed OECD economies. Overall New Zealand ranks twelfth out of 18 with a patenting rate slightly above that found in France, Germany and Japan. However New Zealand's performance is disappointing compared to other small countries with strong primary industries that it might hope to emulate e.g. Denmark, Netherlands and Australia.
Much remains to be done to improve our understanding of the structure and dynamics of modern biotech in New Zealand. Key questions include: what are the main factors affecting biotech innovation, what will be the future trajectory, and what is the scope for policy improvement?
References
Bud, R. (1989). History of 'Biotechnology'. Nature, 337(6202) 5 January, 10. Diebold, J. (1952). Automation: The Advent of the Automatic Factory. New York: Van
Nostrand. Dosi, G. (1988). Sources, Procedures, and Microeconomic Effects of Irmovation. ]oul71al of
Economic Literature, 26 September, 1120-1171. Eliasson, G., & Eliasson, A. (1997). The Phannaceutical and Biotechnological Competence
Bloc and the Development of Losec. In B. Carlsson (Ed.), Technological Systems and Industrial Dynamics (Vol. 10). Dordrecht: Kluwer.
Engelbrecht, H.-J., & Darroch, J. (1999). A Comparative Macro-Level Assessment of New Zealand's National Innovation System. Prometheus, 17(3) September, 283-298.
Foltz, J., Barham, B., & Kim, K. (2000). Universities and Agricultural Biotechnology Patents Production. Agribusiness, 1 6( 1), 82-95.
Frater, P., Stuart, G., Rose, D., & Andrews, G. (1995). The New Zealand Innovation Environment. Wellington: The Ber! Foundation.
Freeman, C. (1995). Technological Revolutions: Historical Analogies. In M. Fransman & G. Junne & A. Roobeek (Eds.), The Biotechnology Revolution? Oxford: Blackwell.
Joly, P.-B., & de Looze, M.-A. (1996). An Analysis of Innovation Strategies and Industrial Differentiation Tln'ough Patent Applications: The Case of Plant Biotechnology. Research Policy, 25(7) October, 1027-1045.
Kennedy, M. J. (1991). The Evolution of the Word Biotechnology. Trends in Biotechnology, 9(7) July, 218-220.
Malo, S., & Geuna, A. (1999). Science-Technology Linkages in an Emerging Research Platform: The Case of Combinatorial Chemistry alld Biology. SPRU. (SPRU Electronic Working Paper No. 37)
McKelvey, M. (1996). Evoilltion£ll)' 1nnovations: The Business of Biotechnology. Oxford: Oxford University Press.
McMillan, G. S., Narin, F., & Deeds, D. L. (2000). An Analysis of the Critical Role of Public en Science in Innovation: the Case of Biotechnology. Research Policy, 29(1) January, 1-
8. OECD. (1994). The Measurement of Scientific and Technological Activities. Using Patent
Data as Science alld Technology Indicators: Patent Manual 1994. Paris: OECD. OECD. (1999). OECD Science, Technology and Industry Scoreboard 1999 Benchmarking
Knowledge-Based Economies. Pm'is: OECD. Pattinson, W., Van Beuzekom, B., & Wyckoff, A. (2001). Intel71ationally Comparable
Indicators on Biotechnology: A Stocktaking, A Proposal for Work and Supporting Material. Statistics Canada. (88FOO 17MIE No.9)
Scherer, F. M. (1999). New Perspectives on Economic Growth and Technological Innovation. Washington, D.C: Brookings Institution.
Statistics New Zealand. (2000a). Biotechnology Survey 1998/99. Wellington: Statistics New Zealand.
Statistics New Zealand. (2000b). Draft Objectives for the Biotechnology Survey. Statistics New Zealand.
Zilberman, D., Yarkin, c., & Heiman, A. (1997, August). Agricultural Biotechnology: Economic and International Implications. Paper presented at the International Agricultural Economics Association Meeting, Sacramento, California, USA.
i Access to the data used in this study was provided by Statistics New Zealand under conditions designed to give effect to the security and confidentiality provisions of the Statistics Act 1975. Standard Statistics' random rounding to base three has been applied to all output. Disclaimer. The results presented ill this study are the work (!{ the author not Statistics New Zealand
11

""-I
New Zealand consumer reactions to GM food: Studies of beliefs, attitudes and intentions to purchase.
Andrew Cook Environmental Management and Design Division
Lincoln University cookal @Iincoln.ac.nz
SUMMARY
Consumer concerns are an important factor in the development of genetically modified (GM) foods, as their successful introduction to the marketplace is dependent on the willingness of consumers to purchase them. Studies undertaken in New Zealand of consumer reactions indicate increasing consumer resistance. However, many are opinion surveys and only a handful have sought to explain consumer reactions by exploring relationships between survey items.
This paper draws upon the key results of two New Zealand studies designed to explain personal decisions to purchase or not purchase GM food. Utilising a psychological modelling approach, the studies form the basis for predictions of consumer behaviour, which is explained through the identification of reasons for a person's attitudes and intentions. Based on Ajzen' s (1991) Theory of Planned Behaviour, the studies reveal that beliefs about personal, social and environmental consequences are important in purchase decisions.
Keywords: Consumer attitudes; consumer behaviour; intention
INTRODUCTION
Proponents of genetic engineering have likened its use in agriculture to traditional breeding. For centuJies agriculture has been enhanced through the development of new crops and domestic animals for the efficient production of food for the marketplace. Opponents, however, raise the possibility of detrimental consequences associated with this application of the technology. Environmental risk is one area of dispute with proponents emphasising the risks are low and measurable and critics stressing the catastrophic potential of outcomes and the possibility of factors as yet unknown.
Much of the public debate about the use of genetic engineering in agriculture is carried out by well informed adversaries. In comparison, the public obviously knows less than the experts, but they nevertheless have an impOitant role in the development of the technology through then' acceptance of the technology as a means of food production. Recent studies in New Zealand indicate that public acceptance is declining. The majority of these studies, while useful for providing an indication of public attitudes, have limitations for explaining or predicting consumer behaviour because they fail to study linkages between items (Couchman and Fink-Jensen, 1990; Fitzgerald, Saunders and Wilkinson, 1996; Macer, 1994, 1998). A few recent studies conducted in New Zealand have ventured to explain consumer attitudes and consumer purchase decisions with regard to genetically modified (GM) food (Sharland, 1999;
Gamble et aI, 2000; Cook, 2000; Cook, Fairweather and Campbell, 2000). A similar situation can be found overseas with the majority of studies being in the form of market surveys or opinion polls with only a comparatively small number aimed at comprehensive explanations of consumer behaviour. Given the impact that consumers have on the success of, and possibilities for, GM food, from the industry perspective, meeting this aim would appear essential and from an academic viewpoint, the opportunity for understanding a piece in the puzzle of social change is inviting.
This paper presents the key results of two studies of New Zealanders' attitudes and intentions to buy or not buy GM food. The first (Cook, 2000) surveyed Canterbury residents (N = 266) and the second (Cook, Fairweather and Campbell, 2000) was part of a survey of New Zealand farmers and growers (N = 656). This paper presents these studies to provide for an understanding of New Zealand consumer reactions to GM food. The studies characteJise a sophisticated modelling approach, the Theory of Planned Behaviour (TPB; Ajzen, 1991), which was utilised to provide a comprehensive explanation of consumer behaviour towards GM food. Similar modelling has been undertaken in Europe (Bredahl, 2000) and an adaptation of this European model has been applied in New Zealand to explain purchases of GM tomatoes or jeans made from GM cotton (Gamble, et al 2000). The studies of Canterbury residents and farmers and growers were not representative of the population of New Zealand, though in keeping with prior research, having identified that the model functions for a sub-group it is assumed that the model applies to most people (Ajzen and Fishbein, 1980).
The modelIing approach
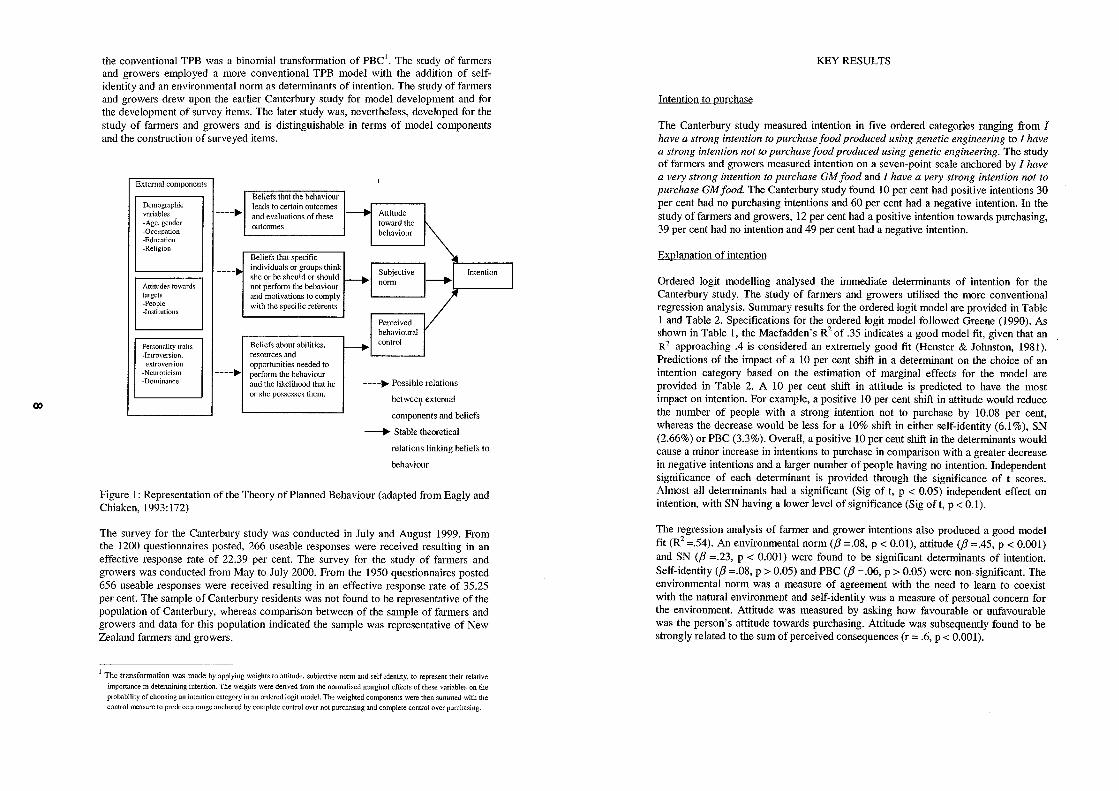
The studies were structured using respective adaptations of the Theory of Planned Behaviour (TPB; Ajzen, 1991). The TPB, shown in Figure I, is designed to explain intentions for behaviours that may be subject to a degree of personal control and is well known within Social Psychology. The TPB poses attitude towards performing a behaviour coupled with motivations to comply with perceived social pressure, termed the subjective norm (SN), and perceived behavioural control (PBC) as determinants of intention. Each of the determinants is held to be formed from a set of referent beliefs. External components including general preferences and demographic factors may also be influential on intention through their influence on its immediate determinants.
Adaptations of the TPB for both the Canterbury study and the study of farmers and growers were the use of additional determinant variables. A range of factors were included as external components. Beliefs that constitute SN and PBC were not measured because these components are generally less important than attitude in determining intention. The Canterbury study was designed to test a number of modifications to the TPB and consequently differed from the standard TPB model in terms of model construction and method of analysis. In this model a type of person measure of self-identity was an additional determinant of intention and was based on whether or not the respondents considered they were the type or person who would purchase GM food. Attitude was not measured dn'ectly, but the beliefs that are held to constitute attitude formed the attitude component. In addition, a further departure from
0)
the conventional TPB was a binomial transformation of PBC'. The study of farmers and growers employed a more conventional TPB model with the addition of selfidentity and an environmental norm as determinants of intention. The study of farmers and growers drew upon the earlier Canterbury study for model development and for the development of survey items. The later study was, nevertheless, developed for the study of farmers and growers and is distinguishable in terms of model components and the construction of surveyed items.
External components
Demographic variables -Age, gender -Occupation -Education -Religion
Attitudes towards targets -People -Institutions
Personality traits ·Introversion,
extroversion -Neuroticism .Dominance
----~
----~
Beliefs that the behaviour leads to certain outcomes and evaluations of these outcomes
Beliefs that specific individuals or groups think she or he should or should not perform the behaviour and motivations to comply with the specific referents
Be1ief.-; about abilities. resources and opportunities needed to perform the behaviour and the likelihood that he or she pO.l>sesses them.
----~ Possible relations
betwee~ external
components and beliefs
---+ Stable theoretical
relations linking beliefs to
behaviour
Figure 1: Representation of the Theory of Planned Behaviour (adapted from Eagly and Chiaken,1993:172)
The survey for the Canterbury study was conducted in July and August 1999. From the 1200 questionnaires posted, 266 useable responses were received resulting in an effective response rate of 22.39 per cent. The survey for the study of farmers and growers was conducted from May to July 2000. From the 1950 questionnaires posted 656 useable responses were received resulting in an effective response rate of 35.25 per cent. The sample of Canterbury residents was not found to be representative of the population of Canterbury, whereas comparison between of the sample of farmers and growers and data for this population indicated the sample was representative of New Zealand farmers and growers.
1 The transformation was made by applying weights to attitude. subjective norm and self-identity, to represent their relative
importance in determining intention. The weights were derived from the nomtalised marginal effects of these variables on the
probability of choosing an intention category in an ordered logit model. The weighted components were then summed with the
control measure to produce a range anchored by complete control over not purchasing and complete control over purchasing.
KEY RESULTS
Intention to purchase
The Canterbury study measured intention in five ordered categories ranging from I have a strong intention to purchase food produced using genetic engineering to I have a strong intention not to purchase food produced using genetic engineering. The study of farmers and growers measured intention on a seven-point scale anchored by I have a very strong intention to purchase GM food and I have a very strong intention not to purchase GM food. The Canterbury study found 10 per cent had positive intentions 30 per cent had no purchasing intentions and 60 per cent had a negative intention. In the study of farmers and growers, 12 per cent had a positive intention towards purchasing, 39 per cent had no intention and 49 per cent had a negative intention.
Explanation of intention
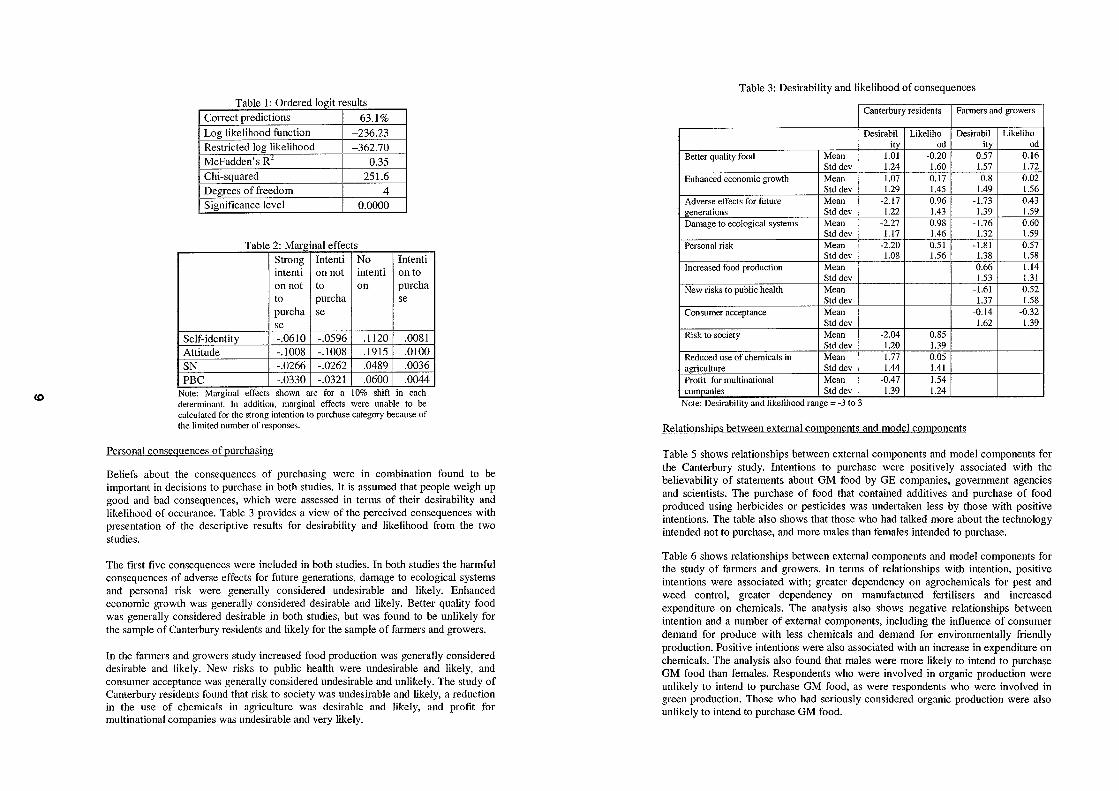
Ordered logit modelling analysed the immediate determinants of intention for the Canterbury study. The study of farmers and growers utilised the more conventional regression analysis. Summary results for the ordered logit model are provided in Table 1 and Table 2. Specifications for the ordered logit model followed Greene (1990). As shown in Table I, the Macfadden's R2 of .35 indicates a good model fit, given that an R 2 approaching .4 is considered an extremely good fit (Henster & Johnston, 1981). Predictions of the impact of a 10 per cent shift in a determinant on the choice of an intention category based on the estimation of marginal effects for the model are provided in Table 2. A 10 per cent shift in attitude is predicted to have the most impact on intention. For example, a positive 10 per cent shift in attitude would reduce the number of people with a strong intention not to purchase by 10.08 per cent, whereas the decrease would be less for a 10% shift in either self-identity (6.1 %), SN (2.66%) or PBC (3.3%). Overall, a positive 10 per cent shift in the determinants would cause a minor increase in intentions to purchase in comparison with a greater decrease in negative intentions and a larger number of people having no intention. Independent significance of each determinant is provided through the significance of t scores. Almost all determinants had a significant (Sig of t, p < 0.05) independent effect on intention, with SN having a lower level of significance (Sig of t, p < 0.1).
The regression analysis of farmer and grower intentions also produced a good model fit (R2 =.54). An environmental norm (/3 =.08, p < 0.01), attitude (/3 =.45, P < 0.001) and SN (/3 =.23, p < 0.001) were found to be significant determinants of intention. Self-identity (/3 =.08, p > 0.05) and PBC (/3 =.06, p > 0.05) were non-significant. The environmental norm was a measure of agreement with the need to learn to coexist with the natural environment and self-identity was a measure of personal concern for the environment. Attitude was measured by asking how favourable or unfavourable was the person's attitude towards purchasing. Attitude was subsequently found to be strongly related to the sum of perceived consequences (r = .6, p < 0.001).
CD
~-~&- &. ~- --- _V};~ .. .Joy ............. '" dered 1,
COITect predictions 63.1% Log likelihood function -236.23 Restricted log likelihood -362.70 McFadden's R- 0.35 Chi-squared 251.6 Degrees of fi'eedom 4 Significance level 0.0000
Table 2: Mar2:inal effect Strong Intenti No Intenti I intenti on not intenti on to on not to on purcha to purcha se purcha se se
Self-identity -.0610 -.0596 .1120 .0081 Attitude -.1008 -.1008 .1915 .0100 SN -.0266 -.0262 .0489 .0036 PBC -.0330 -.0321 .0600 .00441
Note: Mm'ginal effects shown m'e for a 10% shift in each determinant. In addition. marginal effects were unable to be calculated for the strong intention to purchase category because of the limited number of responses.
Personal consequences of purchasing
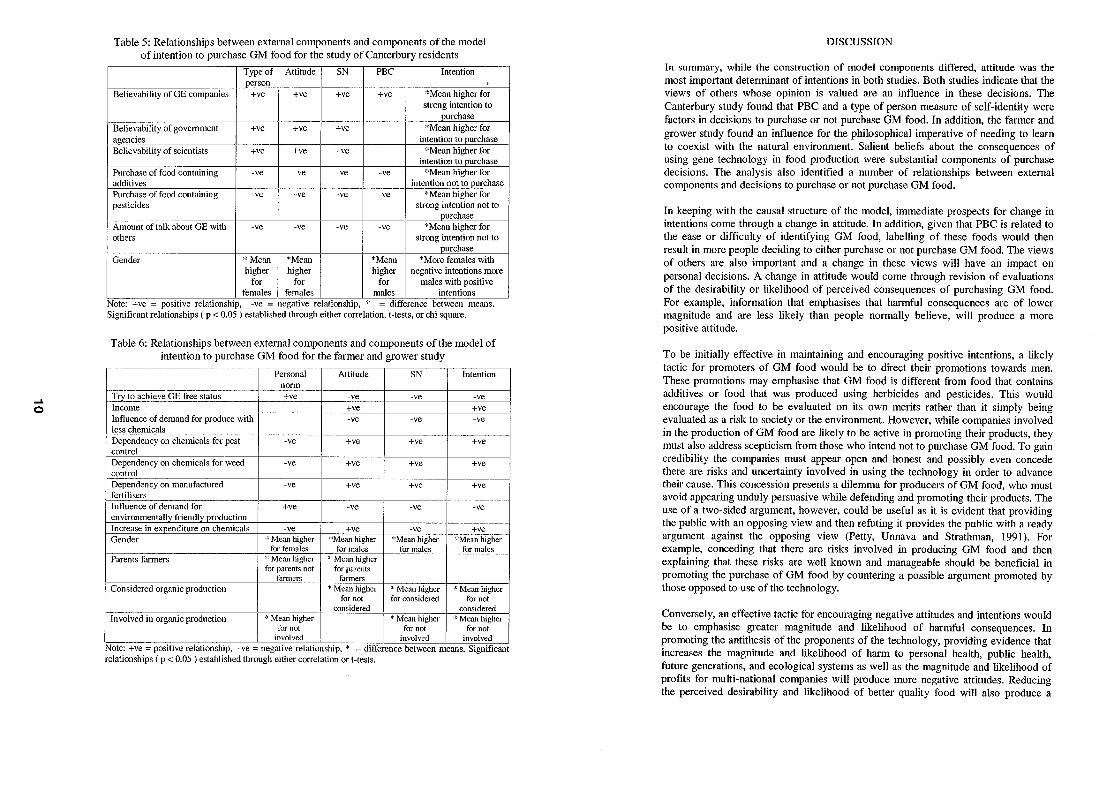
Beliefs about the consequences of purchasing were in combination found to be important in decisions to purchase in both studies. It is assumed that people weigh up good and bad consequences, which were assessed in terms of their desirability and likelihood of occurance. Table 3 provides a view of the perceived consequences with presentation of the descriptive results for desirability and likelihood from the two studies.
The first five consequences were included in both studies. In both studies the harmful consequences of adverse effects for future generations, damage to ecological systems and personal risk were generally considered undesirable and likely. Enhanced economic growth was generally considered desirable and likely. Better quality food was generally considered desirable in both studies, but was found to be unlikely for the sample of Canterbury residents and likely for the sample of farmers and growers.
In the farmers and growers study increased food production was generally considered desirable and likely. New risks to public health were undesirable and likely, and consumer acceptance was generally considered undesirable and unlikely. The study of Canterbury residents found that risk to society was undesirable and likely, a reduction in the use of chemicals in agriculture was desirable and likely, and profit for multinational companies was undesirable and very likely.
Table 3: Desirability and likelihood of consequences
Canterbury residents Fanners and growers
Desirabil Likeliho Desirabil Likeliho ity od ity od I
Better quality food Mean 1.01 -0.20 0.57 0.16 Std dey 1.24 1.60 1.57 1.72
Enhanced economic growth Mean 1.07 0.17 0.8 0.02 Std dey 1.29 1.45 1.49 1.56
Adverse effects for future Mean -2.17 0.96 -1.73 0.43 generations Std dey 1.22 1.43 1.39 1.59 Damage to ecological systems Mean -2.27 0.98 -1.76 0.60
Std dey 1.17 1.46 1.32 1.59 Personal risk Mean -2.20 0.51 -1.81 0.57
Std dey 1.08 1.56 1.38 1.58 Increased food production Mean 0.66 1.14
Std dey 1.53 1.31 New risks to public health Mean -1.61 0.52
Std dey 1.37 1.58 Consumer acceptance Mean -0.14 -0.32
Std dey 1.62 1.39 !
Risk to society Mean -2.04 0.85 Std dey 1.20 1.39
Reduced use of chemicals in Mean 1.77 0.05 agriculture Std dey 1.44 1.41 Profit for multinational Mean -0.47 1.54 companies Std dey 1.39 1.24
Note: Desirability and likelihood range = -3 to 3
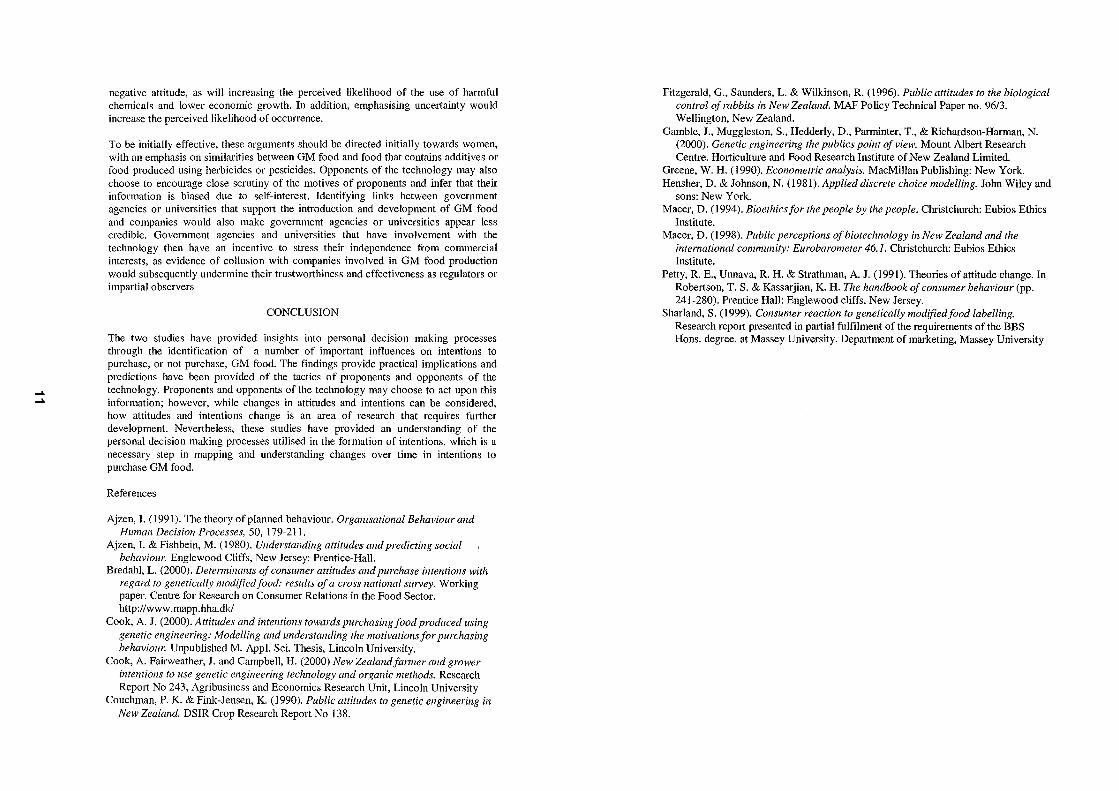
Relationships between external components and model components
Table 5 shows relationships between external components and model components for the Canterbury study. Intentions to purchase were positively associated with the believability of statements about GM food by GE companies, government agencies and scientists. The purchase of food that contained additives and purchase of food produced using herbicides or pesticides was undertaken less by those with positive intentions. The table also shows that those who had talked more about the technology intended not to purchase, and more males than females intended to purchase.
Table 6 shows relationships between external components and model components for the study of farmers and growers. In terms of relationships with intention, positive intentions were associated with; greater dependency on agrochemicals for pest and weed control, greater dependency on manufactured fertilisers and increased expenditure on chemicals. The analysis also shows negative relationships between intention and a number of external components, including the influence of consumer demand for produce with less chemicals and demand for environmentally friendly production. Positive intentions were also associated with an increase in expenditure on chemicals. The analysis also found that males were more likely to intend to purchase GM food than females. Respondents who were involved in organic production were unlikely to intend to purchase GM food, as were respondents who were involved in green production. Those who had seriously considered organic production were also unlikely to intend to purchase GM food.
..... o
Table 5: Relationships between external components and components of the model of intention to purchase GM food for the study of Canterbury residents
Type of Attitude SN PBC Intention person
Believability of GE companies +ve +ve +ve +ve "Mean higher for strong intention to
purchase Believability of government +ve +ve +ve "Mean higher for
-¥~ncies intention to [lurchase Believability of scientists +ve +ve +ve "Mean higher for
intention to purchase Purchase of food containing -ve -ve -ve -ve "'Mean higher for additives intention not to [lurchase Purchase of food containing -ve -ve -ve -ve "'Mean higher for pesticides strong intention not to
purchase Amount of talk about GE with -ve -ve -ve -ve "Mean higher for others strong intention not to
purchase Gender '" Mean "Mean *Mean "More females with
higher higher higher negative intentions more for for for males with positive
females females males intentions Note: +ve = positive relationship, -ve = negative relationship," = difference between means. Significant relationships ( p < 0.05 ) established through either correlation, t-tests, or chi square.
Table 6: Relationships between external components and components of the model of intention to purchase GM food for the farmer and grower study
Personal Attitude SN Intention norm ------_ ..
Try to~chieve GE free status +ve -ve -ve -ve Income +ve +ve Influence of demand for produce with -ve -ve -ve less chenlicals Dependency on chemicals for pest -ve +ve +ve +ve control Dependency on chemicals for weed -ve +ve +ve +ve control Dependency on manufactured -ve +ve +ve +ve fertilisers Influence of demand for +ve -ve -ve -ve environmentally friendly production Increase in expenditure on chemicals -ve +ve -ve +ve Gender '" Mean higher "'Mean higher "'Mean higher "'Mean higher
for females for males for males for males Parents farmers '" Mean higher * Mean higher
for parent<; not for parents farmers farmers
Considered organic production " Mean higher '" Mean higher * Mean higher for not for considered for not
considered considered Involved in organic production :(: Mean higher * Mean higher " Mean higher
for not for not for not involved involved involved
Note: +ve = positive relationship, -ve = negative relationship, '" = difference between means. Significant relationships (p < 0.05 ) established through either correlation or t-tests.
DISCUSSION
In summary, while the construction of model components differed, attitude was the most important determinant of intentions in both studies. Both studies indicate that the views of others whose opinion is valued are an influence in these decisions. The Canterbury study found that PBC and a type of person measure of self-identity were factors in decisions to purchase or not purchase GM food. In addition, the farmer and grower study found an influence for the philosophical imperative of needing to learn to coexist with the natural environment. Salient beliefs about the consequences of using gene technology in food production were substantial components of purchase decisions. The analysis also identified a number of relationships between external components and decisions to purchase or not purchase GM food.
In keeping with the causal structure of the model, immediate prospects for change in intentions come through a change in attitude. In addition, given that PBC is related to the ease or difficulty of identifying GM food, labelling of these foods would then result in more people deciding to either purchase or not purchase GM food. The views of others are also important and a change in these views will have an impact on personal decisions. A change in attitude would come through revision of evaluations of the desirability or likelihood of perceived consequences of purchasing GM food. For example, information that emphasises that harmful consequences are of lower magnitude and are less likely than people normally believe, will produce a more positive attitude.
To be initially effective in maintaining and encouraging positive intentions, a likely tactic for promoters of OM food would be to direct their promotions towards men. These promotions may emphasise that OM food is different from food that contains additives or food that was produced using herbicides and pesticides. This would encourage the food to be evaluated on its own merits rather than it simply being evaluated as a risk to society or the environment. However, while companies involved in the production of OM food are likely to be active in promoting their products, they must also address scepticism from those who intend not to purchase OM food. To gain credibility the companies must appear open and honest and possibly even concede there are risks and uncertainty involved in using the technology in order to advance their cause. This concession presents a dilemma for producers of OM food, who must avoid appearing unduly persuasive while defending and promoting their products. The use of a two-sided argument, however, could be useful as it is evident that providing the public with an opposing view and then refuting it provides the public with a ready argument against the opposing view (Petty, Unnava and Strathman, 1991). For example, conceding that there are risks involved in producing OM food and then explaining that these risks are well known and manageable should be beneficial in promoting the purchase of OM food by countering a possible argument promoted by those opposed to use of the technology.
Conversely, an effective tactic for encouraging negative attitudes and intentions would be to emphasise greater magnitude and likelihood of harmful consequences. In promoting the antithesis of the proponents of the technology, providing evidence that increases the magnitude and likelihood of harm to personal health, public health, future generations, and ecological systems as well as the magnitude and likelihood of profits for multi-national companies will produce more negative attitudes. Reducing the perceived desirability and likelihood of better quality food will also produce a
..... .....
negative attitude, as will increasing the perceived likelihood of the use of harmful chemicals and lower economic growth. In addition, emphasising unceltainty would increase the perceived likelihood of occurrence.
To be initially effective, these arguments should be directed initially towards women, with an emphasis on similarities between GM food and food that contains additives or food produced using herbicides or pesticides. Opponents of the technology may also choose to encourage close scrutiny of the motives of proponents and infer that their information is biased due to self-interest. Identifying links between government agencies or universities that SUppOit the introduction and development of GM food and companies would also make government agencies or universities appear less credible. Government agencies and universities that have involvement with the technology then have an incentive to stress their independence from commercial interests, as evidence of collusion with companies involved in GM food production would subsequently undermine their trustworthiness and effectiveness as regulators or impartial observers
CONCLUSION
The two studies have provided insights into personal decision making processes through the identification of a number of important influences on intentions to purchase, or not purchase, GM food. The findings provide practical implications and predictions have been provided of the tactics of proponents and opponents of the technology. Proponents and opponents of the technology may choose to act upon this information; however, while changes in attitudes and intentions can be considered, how attitudes and intentions change is an area of research that requires further development. Nevertheless, these studies have provided an understanding of the personal decision making processes utilised in the formation of intentions, which is a necessary step in mapping and understanding changes over time in intentions to purchase GM food.
References
Ajzen, 1. (1991). The theory of planned behaviour. Organisational Behaviour and Human Decision Processes, 50, 179-211.
Ajzen, I. & Fishbein, M. (1980). Understanding attitudes and predicting social behaviour. Englewood Cliffs, New Jersey: Prentice-Hall.
Bredahl, L. (2000). Detenninants of consumer attitudes and purchase intentions with regard to genetically modifiedfood: results of a cross national survey. Working paper. Centre for Research on Consumer Relations in the Food Sector. http://www.mapp.hha.dkl
Cook, A. J. (2000). Attitudes alld intentions towards purchasing food produced using genetic engineering: Modelling and understanding the motivations for purchasing behaviour. Unpublished M. App!. Sci. Thesis, Lincoln University.
Cook, A. Fairweather, J. and Campbell, H. (2000) New Zealandfamler and grower intentions to use genetic engineering technology and organic methods. Research Report No 243, Agribusiness and Economics Research Unit, Lincoln University
Couchman, P. K. & Fink-Jensen, K. (1990). Public attitudes to genetic engineering in New Zealand. DSIR Crop Research Report No 138.
Fitzgerald, G., Saunders, L. & Wilkinson, R. (1996). Public attitudes to the biological control of rabbits in New Zealand. MAP Policy Technical Paper no. 96/3. Wellington, New Zealand.
Gamble, J., Muggleston, S., Hedderly, D., Parminter, T., & Richardson-Harman, N. (2000). Genetic engineering the publics point of view. Mount Albert Research Centre. Horticulture and Food Research Institute of New Zealand Limited.
Greene, W. H. (1990). Econometric analysis. MacMillan Publishing: New York. Hensher, D. & Johnson, N. (1981). Applied discrete choice modelling. John Wiley and
sons: New York. Macer, D. (1994). Bioethicsfor the people by the people. Christchurch: Eubios Ethics
Institute. Macer, D. (1998). Public perceptions of biotechnology in New Zealand and the
international community: Eurobarometer 46.1. Christchurch: Eubios Ethics Institute.
Petty, R. E., Unnava, R. H. & Strathman, A. J. (1991). Theories of attitude change. In Robertson, T. S. & Kassarjian, K. H. The handbook of consumer behaviour (pp. 241-280). Prentice Hall: Englewood cliffs, New Jersey.
Sharland, S. (1999). Consumer reaction to genetically modified food labelling. Research report presented in partial fulfilment of the requirements of the BBS Hons. degree. at Massey University. Department of marketing, Massey University
...... I\)
GMOs and the Royal Commission
David Wansbrough Senior Policy Analyst
Ministry of AgIiculture and Forestry, Wellington June 2001
SUMMARY
The Royal Commission on Genetic Modification is due to report on 27 July 2001 on the strategic options available to enable New Zealand to address genetic modification (GM) now and in the future. The commission has conducted one of the world's most comprehensive public inquities into the issues sUlTounding genetic modification, accepting over 10,000 submissions. This paper summarises the closing statement by Counsel assisting the Royal Commission, which sets out the scope of the commission's task, some of the important overarching principles, and some specific problems that the commission will have to address. Finally, it is important to recognise where there is consensus, even in this controversial topic.
key words: Royal Commission Genetic Modification, GM
INTRODUCTION
The government established the Royal Commission on Genetic Modification in April 2000. The commission's chief objective is to inquire into and report on the strategic options available to enable New Zealand to address genetic modification (GM) now and in the future. The commission will identify any legislative, regulatory, institutional or policy changes that are needed.
It was originally due to report on 1 June 2001, and I was going to summarise the report and its recommendations. But the commission has been given a 2-month extension until 27 July so instead, I will summarise the closing submission by Counsel assisting the Royal Commission on 12 March 2001, at the start of the last week of heatings I. In this document, the commission's legal counsel outlines the commission's procedures, the scope of the commission's task, some important overarching principles, and some specific issues that must be addressed.
I want to emphasise that the current government has not yet made any strategic decisions on genetic modification. This paper does not represent government policy but is based on a document published by the commission itself. Officials have not seen drafts of the commission's repolt or had discussions with the commission. Like everybody else, I will not see the recommendations until after 27 July. My personal opinions are confined to observations about the process in the final section.
I accessed 15 March 2001 from www.gmcommission.goVl.nz/inquiry/Formal hearing opening.pdf.
THE COMMISSION'S PROCEDURES
The scale of the commission's activities has been extraordinary. The commission received nearly 11,000 public submissions. There are about 5000 pages of transcIipts from 12 weeks of heaIings. In addition, the commission held 15 public meetings, 10 hui, and a national youth conference.
The evidence covered a vast range of issues: from broad discussions about the values and aspirations of New Zealanders, to detailed scientific arguments about potential environmental risks. A large number of international experts gave evidence to the commission, including some world-famous players in the GM debate. For example: • Percy Schmeiser, sued by Monsanto for having GM crops without a licence, • Patrick Moore, a founder of Greenpeace but now a critic, and • Arpad Pusztai, who fed GM potatoes to rats.
One of the people participating in the hearings and the public debate said, "The Commission has (to my knowledge) been the most comprehensive public inquiry into genetic modification yet seen in the world,,2. Certainly, the commission heard from all sides of the GM debate, and was presented with the best available scientific knowledge. There was one case where a group retracted some of their scientific evidence and part of their submission after the scientific basis was challenged.
MAF, like most government ministries, did not present evidence or take part in cross-examinations. But MAF did make a submission that explained its role in regulating GM products and organisms, and raised some issues relating to the agriculture and forestry sectors. MAF's submission is on the commission's web site www.gmcommission.govLnz and on MAF's own web site www.maf.govt.nz.
WHAT THE COMMISSION WILL AND WON'T DO
The first task for the commission is a factual inquiry about what GM is, what the technology can do, and what the potential consequences are, including the risks and benefits. Counsel assisting the Royal Commission points out that assertions made at the hearings are not necessarily facts, so the commission will have to judge the evidence that was presented, including the scientific evidence about the risks and benefits. The commission will then make a reasoned assessment of the risks.
The commission will have to consider the strategic options available to New Zealand and what would be the best regulatory environment to promote them. This means taking account of community responses both here and, because we are an exporting nation, overseas. Counsel says, "Strategic options that are unacceptable to the community are not viable." Further, counsel cautions against arguing that public opinion is ill informed or irrelevant: "Members of the community are entitled to react to issues in accordance with their beliefs and emotions." The commission must provide leadership and direction for the community by providing accessible factual information with a dispassionate evaluation. Finally, the commission will consider
2 Weaver S, The New Zealand Royal Commission of Inquiry into GE, accessed on 26/6/200 I from context.nelson.org.n7Jstories/sloryReader$1 175.
..... (.)
the Crown's responsibilities under the Treaty ofWaitangi and suggest processes for developing appropriate participation by Maori.
It is interesting to note the things that counsel suggests the commission will NOT do. Firstly, the commission is not conducting a poll or a referendum but will be making its own independent decision. Secondly, although the GM debate rages across the spectrum of economic, social and environmental issues, the commission is unlikely to comment on issues that are not relevant to New Zealand. For example, the potential impacts on developing countries or the merit~ of Golden Rice. The commission is unlikely to recommend changes in areas such as animal welfare that belong to a different area of expertise, unless GM raises specific new problems. Finally, the commission will not make prescriptive suggestions about how its recommendations should be implemented.
OVERARCHING PRINCIPLES
The overarching principles of choice and precaution are present throughout the debate and provide some of the more difficult areas for the commission.
There is a general principle that individuals should be allowed choices as long as exercising those choices does not unreasonably affect others. Unfortunately, it creates difficult questions for the commission rather than providing simple answers -it will be impossible to accommodate everybody'S choices. People's choices are not static and depend on their experience, the available information, and the type of GM product (eg medicine or food). • While some people object to the whole concept of GM organisms, the
commission is unlikely to recommend that New Zealand avoid all GM products because it would prevent people accessing important medicines like insulin.
• For GM food, there are difficult questions about what is meaningful information for consumers and what is the best way of providing it.
• In agticulture, is a huge debate about whether organic agriculture can co-exist with GM agriculture and therefore whether farmers should be able to choose one or the other, or whether there must be a national choice.
• The commission faces an immediate question about whether research should be allowed in contained field trials, with many arguing that it is not possible to sufficiently control the lisks to organic farmers and the environment.
The concepts of safety, risk and precaution will be central to the report. Although everyone presenting to the commission agreed that GM technology requires caution, there is a very wide range of views about the size of the risks and whether they can be managed. However, the commission may not be able to accurately assess the risks and may have to concentrate instead on how the risks can be managed, unless the risks are so great that the only option is to avoid the technology. A key factor in this decision will be the reversibility of any actions.
SPECIFIC PROBLEMS
In addition to the overarching principles, counsel suggests a number of specific topics that the commission must address: the strategic options for New Zealand, the appropriate regulatory structures, intellectual property, liability, and Maori issues.
Strategic options
Given the importance of agriculture and forestry to the New Zealand economy, the greatest debates surround the strategic options in these areas. While there are no plans to use GM organisms in agriculture at present, there are divergent views about possibilities for the future. Many argue that the greatest market opportunities would come from organic products, while others say that New Zealand has to maintain capacity for GM research in case it loses competitive advantage or consumer demands change. In contrast, there is general agreement that GM has a role in medical and scientific research, and that strategic choices in this area would not be affected by choices about primary production.
Future farming options are based around three general scenaIios: • continue the current mix of conventional and organic non-GM farming, • move to predominantly organic farming, or • use GM technology to improve productivity and competitive advantage.
Counsel says it will be difficult for the commission to predict the future of farming, but that it is unlikely to involve completely organic farming. In fact, choosing one of these scenarios is not an urgent task because GM agriculture is not a current option. The only contested issue is whether contained field trials should be allowed and under what conditions.
Regulatory structures
A regulatory system needs several components: a national body to address policy issues and establish guidelines, a body to make decisions, local bodies to handle delegated lesser levels of decisions, and appropriate accountability mechanisms. The commission will have to decide the best structures for these functions. It will also have to recommend a decision-making process that takes account of and balances the scientific, ethical, and community issues.
A regulatory system should be transparent and accountable to the public. This means it must be adequately funded and free from commercial influences. But public accountability must also be balanced against commercial sensitivity, so it is inevitable that some information will not be publicly available.
The scope of regulatory activities would have to be defined in relation to existing regulatory bodies, such as those for medical research and animal welfare. Specific issues raised in hearings include the high compliance costs for low-risk laboratory activities, and the need to get new approvals for organisms that carry exactly the same risks as already approved organisms.
...... -1::0
Liability
The commission will have to answer a number questions about the liability for any adverse effects of GM technology: • Does the current law sufficiently provide for liability? • Can it be enforced, ie will it be too difficult to prove fault and will the courts be
an appropriate forum to resolve conflicts? • Does there need to be a pool of funds to cover a potentially catastrophic or large
scale problem that was be beyond the means of liable companies to remedy? Who should pay for this fund, the developers or the users of GM technology?
Intellectual property
A large part of counsel's paper is devoted to explaining the patent system, implying that it is not well understood. Counsel suggests that concerns about indigenous intellectual property should be handled in the framework of the WAI-262 claim and international discussions about indigenous assets, rather than through the patent laws. However, the commission may consider whether it is appropriate that patents can be refused if they are "contrary to morality", and whether patenting human life and the biological processes for its generation should be clearly prohibited.
Maori issues
Maori issues were prominent in the hearings, although Maori views about GM vm-y. While the Crown must consult appropriately with Maori and actively protect MaoIi interests, this is balanced against the Crown's general responsibility to govern. The Crown is required to do what is reasonable, which amounts to consultation and appropriate negotiation. In context of approvals for GM organisms, the decisionmaker must take account of the principles of the Treaty of Waitangi. While the Crown cannot ignore this requirement, it does not give MaoIi a veto over decisions.
HOW HAS THE COMMISSION ADVANCED THE DEBATE?
For me, the interesting question is whether the commission advances the GM debate in New Zealand. Obviously, it is impossible to give a final answer until after the process is finished, but I think it is possible to make some observations. The commission has the confidence of the public, it has distilled the issues down to the contentious points, and it has highlighted the significant elements of consensus that exists. I wonder how well the public has kept up - one submission suggested that. only 13% of people are aware of the commission's proceedings3
•
The commission has public confidence
Public confidence is one of the strongest driving forces in the GM debate, and is a crucial ingredient for making progress. In announcing the commission, the Minister
, Closing submissions for GE-FREE New Zealand. accessed 26/6/0 I from http://www.gmcommission.gOYLn7Jpublications/PDF submission.hlm!.
for the Environment said that a royal commission has "the highest status and greatest perceived independence of all forms of public inquiry".
The chair of the commission, former Chief Justice Sir Thomas Eichelbaum, commands enormous respect and has been careful to ensure that all parties are treated fairly and consistently. There have been a few complaints - including about lack of consultation - but the sheer number of submissions and length of transcripts demonstrates the extent of consultation and public participation. The commission has made extraordinary efforts to be accessible to the public and has published all its transcripts and submissions on its web site.
The commission has also maintained strict independence from government. Officials have made submissions and provided help or information when we have been asked, but we have not taken part in any deliberations and will not see drafts of the commission' s report.
The commission distilled the issues
Fairly quickly after the hearings stm1ed, the debate moved away from slogans into specific contentious issues. Statements such as "GM will provide benefits" and "GM is a risk to the environment" became arguments about "do GM crops need fewer pesticides?" and "exactly how could pollen from GM crops harm the environment?". Clearly, the commissioners and the regular participants faced a steep learning curve at the beginning. The commission was subsequently able to hold discussions that involved complex and technical scientific issues.
There was some consensus
One of the more important things to come out the commission's process so far is the degree of consensus that developed. It is universally accepted that New Zealand's strategic direction should be towards sustainable development, and that sustainability should include economic, social and environmental factors. The importance of agIiculture and forestry to New Zealand's economy is recognised by all parties, but this is where there is the strongest disagreement about the best strategic direction. Nearly everyone mentions New Zealand's "clean and green" image, but without defining or analysing what it means. Consequently, all sides of the debate used the "clean and green" slogan - it seems to mean all things to all people.
Everyone agrees that decision-making processes should be fair, transparent and well informed. Everyone also agrees that decisions must take account of ethics and cultural values, but there is no agreement about how to balance them against other factors such as scientific evidence, or whether they should be considered in each application. Most argue that the current system could be improved, particularly the mechanisms for consideIing Maori views.
Towards the end of the hearings, there was some acceptance by "anti-GM" groups that there is no such thing as zero risk. On the other hand, "pro-GM" groups stopped saying that GM was simply an extension conventional breeding and took a slightly different approach by arguing that the risks were no different.
.... (J1
There is widespread support, though not quite unanimous, that GM has a role in scientific and medical research and that people should be able to use GM medicines, as long as any experiments and living organisms are confined to laboratOlies. Most parties agree that GM foods should be labelled, but there is no agreement about the extent of labelling (the definition of a GM food), or about whether GM food should be allowed in New Zealand in the first place.
There is no debate about GM agriculture as an immediate option for New Zealandno one is advocating it now, though it may only be a year or two away. The only "live" issue is whether contained field trials should continue to be allowed and under what conditions. Those who contemplate releases of GM organisms (mostly "proGM"), consistently call for the ability to place conditions or restrictions on releases where appropriate.
Finally, everyone agrees that GM must be used carefully. As counsel notes, "none of the interested persons has suggested GM does not require great caution, with full recognition of the power and possible harm from its application."
.... en
CULTURAL PERSPECTIVES ON AGRICULTURE
by Petrus Simons, Integrated Economic Services, Wellington
Abstract How societies think about agriculture depends on their cultural perspective. Using four types of culture (response; mythical; magical and objective/technical) the paper attempts to show how societies have perceived the place and meaning of agriculture in the course of history. The growing influence of an objective/technical culture has driven the development of industrial agriculture and its attendant problems. A different cultural perspective is needed to find solutions. In a culture of response science and technology would be used to find solutions through a wider concept of agricultural development as expressed in the metaphor of a garden.
Introduction The literature on the history of agriculture describes how the state of agriculture has influenced political, economic and social life in various cultures. Thus, the peculiar nature of water control in the Nile river system is said to have led to a central even totalitarian state, in which the class of priests and the class of state officials, in particular the military, were used to keep the peasants in servitude.
This paper seeks to turn the question around to ask how various cultures considered agriculture?
To start this enquiry it might help to take the word agriculture literally, as a composition of two Latin words: ager, a plot of cultivated land and culture, the way of life of a group of people, often seen as concentrated in its cult, or worship life.
Four Types of Cultures Schoon and Jochemsen have identified four main types of CUlture.' 1. Culture of response. Cultural activities are shaped in response to God's calling. Created
reality is perceived on the basis of the relationship between God and his people. The Mosaic law is an example of such a culture with specific institutions such as the sabbath year and the year of jubilee.
2. Mythical or culture of participation. Nature is appreciated as a divine institution. People worship divine powers of nature and aim to participate in them. One tries to be in tune or harmony with such powers. The Deep-Ecology movement and other New Age groups are modern representatives of such a culture of participation.
3. Culture of magic in which people do not merely subject themselves to nature, but also try to safeguard life by means of magic rituals.
4. Objectivising or technical culture. The existence of divine powers is denied. Nature is seen as a neutral mass of objects and to be used to advance life. Technology is used to master this world for purposes of human life. Despite this emphasis on "facts", technology and markets are often deified in such a culture.
I B. Schoon en H. Jochemsen, Een ingrijpend Gebeuren; Het religieus-culturele karakter van techniek door de geschiedenis heen, Instituut voor Cultuurethiek, Amersfoort, 1997, pp.5-7.
This outline is based upon F. de Graaff's work2. De Graaff's analysis begins with the distinction
between man and animal. Animals are guided by instincts. By contrast, man's instincts are very rudimentary. Primitive people believe that animals are guided entirely by numinous powers and that, therefore, they are of a higher order than people, being close to the numinous. Yet, instincts can fail animals in situations for which they are not equipped. Because our human instincts are so weak, albeit by no means absent (we sleep), we have to rely on a larger brain. De Graaff hypothesises that instincts cease to be effective where man experiences an ur-distance between himself and everything else. Whereas animals participate in existence, people are thrown back on themselves and are put in a position where they are confronted with the rest of what is. In a reference to Heidegger, the author puts it this way that we are aware of the distinction between all the beings and Being. Being is not the 'sum' of all the beings. Angst means the awareness of nothing over against all that is (Nichten des Seins). In this sense of being thrown on one's own, people feel guilty. In Heidegger's terms: Dasein (human existence) is guilty. Many religions know of this sense of guilt and appear to relate it to the fact that man has withdrawn from the paradisical situation of being guided by higher powers (as expressed in instincts) and is now guided by analytical power rather than intuition. Gnostic religions have always characterised this as rebellion or a fall into sin.
The ur-distance should be seen as positive. In Israel's religion this signifies the distance between the Creator and humans. In this situation God speaks to humans and thus founds a relationship or covenant in this ur-distance. Man is created in the image of God, which means that is he is put into a relationship. The Word mediates this relationship. It establishes a dialogue. This dialogue extends indirectly to all that has been created. In every encounter with God or with fellow creatures, God speaks and expects a response from man. We can hide from this Voice and will then experience guilt and anxiety. Where the dialogue is restored, the 'angst' and guilt vanish. As animals are guided by instincts they are not spoken to and are not answerable. They cannot resist. They do not know the freedom of either listening or refusing to listen.
De Graaff then defines culture as a human compensation for a lack of instincts. In this sense, it is a way of communicating with that, which lies on the other side of the horizon of our existence. He identifies three basic structures of culture, which may occur intermingled in various cultures. They are: 1. Response, awareness of heart 2. Participation, awareness of soul 3. Manipulation, consciousness of brain.
Response. We hear the voice of the Creator where we are aware of the meaning or destiny, which God has put as divine possibility in every creature. Response or culture then unfolds where people realise this divine destiny. Thus, the creation becomes the kingdom of God. There is a second dialogue here as people address the creature by a name that calls forth its meaning or destiny. Genesis sketches this in Adam's giving names to the animals. Whenever we help to realise the true potential of a creature we speak to it. Thus, culture is a life of conversation or dialogue from heart to heart (God to man, male and female, and people to fellow creatures). Only love can work between hearts.
Participation or Sacral Culture. The crux of these systems is an attempt to become one again with the divine powers which guide animals through instincts and thus to remove the ur-distance. Cultic ritual must be performed to accomplish this, not once but repeatedly because the urdistance is experienced time and again. Ecstasy is part of such cultic performance. The word means literally standing outside oneself. In this state man unites with a numinous power, but never with the God who created heaven and earth. Only dialogue is possible with Him. Nor can it be the power that guides instinctive life. If we became fully one with that power we would cease
'F. de Graaff, A1s Goden Sterven; de crisis van de Westerse cultum, Lemniscaat, Rotterdam, 1969/1970 pp. 26-40.
..... --.J
to be people (acting in history) and would become part of the animal kingdom. So what is the sacral relationship? It is characterised by a static symbol rather than the dynamic symbol of the word in dialogue. In a sacral culture there is not the trust of knowing that the Other will answer if an answer is not immediately forthcoming. Whenever there has been an experience of a graceful encounter, one wants to be able to repeat it whenever required. Hence, the establishment of holy places and objects. The relationship can be fixed by means of an image of wood, stone or metal. The image should bridge the ur-distance at all times. Fixed cultic rites, sacrifices and dances may also have this function. The powers involved take possession of the cultic worshippers. They do not personally communicate to them. Ecstasy takes place through the soul, not the heart. So, people become possessed. The cult intends also to connect the rest of the world to the powers. The ploughing iron is seen as a symbol of the divine phallus. It turns the soil into a womb. A house connects heaven and earth. It is seen as a temple in many cultures.
In the Near East, the Baal culture, a fertility cult, was such a sacral cult. The ritual to be assured of a good harvest was to engage in temple prostitution to ensure that the divine powers of Baal and Astarte would thereby be encouraged to engage in sexual intercourse, so that the spring rains would fall.
Culture as Technique. The last paragraph indicated already a shift from a sacral to a manipulative or technical culture in which one tries to manipulate the divine powers by means of ritual. The image becomes distorted to a human figure, as a human projection onto gods. Magic is, therefore, the forerunner of technology. The projection is not a reflection of the deepest possibility of created reality, but rather a means to control the world. Human subjectivity becomes ever more detached from divine guidance and thus hovers over nothing. Without exception history shows that every culture perishes if it changes the cult into a technology.
These four types do not appear one after another in history. All four types may be represented in modern cultures. In the so-called developing countries one might find sacral cultures as dominating types and the technical objectivising culture as a minority type in their modern sectors. Deep ecology or New Age movements in Western countries are examples of revived sacral cultures.
Objectivising Culture Mazoyer and Roudart's history of agriculture, from the neolithic agricultural revolution to the present is entirely written as an objective account of agricultural systems. They describe agriculture as follows:
"To increase the ecological power of the exploited species in order to increase eventually that of the exploiting species, such is at bottom the logic of the particular relationship between species that make up agriculture and animal rearing. The cultivation or breeding of a species, far from being an end in itself, is on the contrary but the prolonging and reinforcement of that exploitation by other means. Agriculture and animal rearing, therefore, are elaborate forms of mutualism, although an asymmetric mutualism in which the exploiting species needs to develop the exploited species, but in which it is also dependent on the exploited species for its own development.,,3
The authors illustrate this point with reference to ants. Some species of ants grow mushrooms. To this end they develop systems of protection in an environment that has the right temperature and remove other species of mushrooms. They seek to enlarge the growth of mushrooms for their own benefit. However, without mushrooms they would not be able to develop themselves.
, Mazoyer and Roudart, op. cit., page 27.
Thus, farmers grow wheat and rear cattle as a specialised function of humankind, to allow the development of humankind. The difference with ants is that people are able to change their methods and keep doing this through history.
By way of criticism I note that in theory one can imagine human settlements practising the same type of agriculture year after year and century after century on the basis of the same technology and with a balance between births and deaths. Admittedly, such situations have been rare. Yet, they could occur.
Mazoyer and Roudart then develop the idea that farming in a particular setting should be seen as a complex interaction between two main systems. First, it is an organisation and functioning of a cultivated eco-system. Second, it entails the organisation and functioning of a technical, social and economic system. The aim is to exploit the fertility of the cultivated ecosystem in order to satisfy directly (self-consumption) or indirectly (through exchange) a community's needs. This particular approach is very worthwhile. It is also characteristic of Slicher van Bath's approach. However, it uses concepts and ideas derived from cybernetics and information technology typical for the second half of the 20th century in the objectivising culture of the West. It is true that in this way the past can be usefully examined, but such an examination takes the present as its criterion. It is not able to tell us whether people in past periods experienced or perceived success or failure in the same way.
Greek Mythology A. P Bos has based his view on the ground motive of Greek culture, meaning that which drives all its manifestations, on the old myth of a change of gods', as told by Hesiod (between 750 and 650 BC) in the poem Theogonia. Ouranos had married Gaia (Mother Earth). They had 12 children. Ouranos had the temerity of keeping Gaia's children locked up in the earth, within Gaia. Gaia asked the youngest, Chronos, to end this predicament. Chronos then took an iron scythe and cut off Ouranos' genitalia and cast these into the sea. This gave birth to Aphrodite and wherever drops of blood fell, new life emerged. Ouranos then called his ungrateful children Titans, a name which referred to their guilt and to the punishment that would be meted out to them. Chronos married Rhea but feared that Ouranos might take revenge on him. To prevent this he swallowed Rhea's first five children. Rhea, then, tricked him by giving him a stone wrapped in cloth as a substitute for baby Zeus, which was born on Crete. Zeus forced Chronos to spew out the other five children as well as the stone. Grateful for their deliverance the five brothers and sisters granted Zeus power over thunder and lightning. Zeus set up the stone in Delphi. A battle began between Kronos and the Titans on one side and Zeus on the other. Zeus won and locked up Kronos and the other Titans in the underworld.
In his poem "Works and Days" Hesiod gives a vivid account not only of farming but also of the previous golden age when Kronos was in charge. In those days people lived like gods, free from hard work and exertion. It was a time of abundance. Since these people died, they have watched as good demons over the fate of the present generation by keeping evil powers at bay. However, this generation has to work hard for little reward on an unforgiving soil.
By drawing a parallel with Ugaritic myths about the change of seasons, Bos argues that the myth told by Hesiod should be interpreted as referring to the change of seasons. He notes that the Ugaritic myth Balu was recited at the New Year's feasts in September. It talks about a secondgeneration god, which brought the autumn rains, thereby bringing fertility. This god was locked up again in the underworld after god Motu, the god of death and the underworld at the time when the hot sirocco winds began to blow in spring, had challenged him. Whilst Balu is locked up, Attaru is in charge in the upper world. He is a tyrant who requires hard labour from people working on the land.
• A.P. Bos, In de Greep van de Titanen; Inleiding tot een Hoofdstroming van de Griekse Filosofie, Bijten en Schipperheijn, Amsterdam, 1991.

..... 0)
The New Year's festival expressed a belief that the order of the world would continue and also that the ritual performed would guarantee the maintenance of that beneficial order.
Bos posits that the reign of Zeus is associated with the spring and summer season, when work on the land is hard and must be done with a clear mind. The name Zeus refers to the clear skies. The name of Ouranos suggests the starry skies above the earth. In "Works and Days" Hesiod describes the life of farmers throughout the year. Kronos is then the god associated with the rains and with the germination of seeds during the winter. By the time the autumn rains fall and the harvest is celebrated the Titans emerge from the underworld and humankind can look forward to a period of festivities, of song and dance. It is the time when the stocks gathered during the harvest can be consumed and when there is little to be done on the fields. The stone given to Zeus stands in Bos' interpretation for the stones used to mark the boundaries of a plot of land. The stone symbolises that Zeus draws a line between his reign and that of Kronos. The stone in Delphi was called 'omphalos', or navel, an indication that it stood for the emergence of dry cultivable land from the birth waters of the rainy season. Bos then concludes that, if he is correct, Hesiod did not draw a distinction between gods that stand for the worship of the powers of nature and those that guide human culture. One can only infer that the period of hard work under the regime of Zeus is valued less than the period of song and dance under Kronos.
Indeed, the Greeks and Romans believed that manual work was good for slaves and that intellectual and artistic pursuits were of a higher order.
Another aspect highlighted by Bos is that Hesiod portrays the imprisonment of Kronos and the other Titans as a final event, whilst the reign of Kronos on earth is painted as a past golden age. The Titans had to suffer for their misdeeds. Thus, justice prevailed in the world of the gods. Since Hesiod describes his legal dispute with his brother Perses, he suggests that when people observe what is right, they might look forward to a return of a golden age.
Bos extends his interpretation of Hesiod's poem by suggesting that it alludes to a meaning perspective dominating Greek culture, that is a set of foundational beliefs or convictions and associated value judgements, which guide a whole culture and bind it together. As it constitutes human experience it can only be stated in terms of myths and metaphors. As an all-embracing framework of human experience it transcends human daily experience and, therefore, expresses faith.5 Specifically, the Titanic meaning perspective entails the view that human beings are like divine beings deprived of their divine nature because of evil they have done and for which they are locked up in a type of underworld. Yet, restoration is possible. In order to give a taste of Bos' use of this meaning-perspective as governing Greek thinking, it may suffice to refer to his interpretation of Parmenides. Human mortals are living in the darkness of ignorance and doubt, in a dark underworld. However, mortals are able to escape from this state of ignorance in a journey to the light of rational insight and knowledge. It is their own fault if they do not make use of this route of escape. As the poem proceeds it becomes clear that the denizens of the underworld have committed the sin of believing that there are two types of Being: Ught and Night. Each is presumed to be identical to itself and not identical to the other. This implies that the other is called forth from nothing. What is cannot be at the same time identical and notidentical. Hence, mortals have called forth a plurality of phenomena, by means of a logical error. We need to regain a higher divine type of knowledge than the everyday knowledge of many different and changeable phenomena. In other words, true being is one and indivisible. In contrast, the everyday world is changeable and fragmented. It cannot be truly part of Being. Only abstract theoretical thinking can help us escape from the dreadful condition of sticking to what we see and so enable us to regain access to the unity of being or to Being itself, and hence to rock-bottom knowledge. We need to escape from the fragmental and deceptive appearances of everyday life. We should not trust our senses or our daily experiences.6
5 Bos, op. cit., page 24. 'Bos, op. cit., pages 42-53.
Whether or not Bos' interpretation is the correct one, any interpretation of Greek philosophy will emphasise the remarkable emphasis on strict logical and abstract theoretical thinking as one of its cultural heritages. It has stamped Western thinking to a major degree. Similarly, its contempt for the daily labour of artisans and farmers should be noted. This Greek cultural perspective is still a driving force in the technical/objectivising culture of the 21 st century.
Working for a Surplus of Food If Bos is right about the overall meaning perspective guiding a particular culture, then, it follows that cultures of so-called primitive peoples in which myths playa constitutive role should not be interpreted as simply working for a material surplus of food. Mandel argues, from a Marxist point of view, that such societies needed to produce an economic, material surplus before they could free people for other pursuits. 7 He writes;
"The notion of a social surplus product, which casts its root into that of the permanent surplus of the means of subsistence, is essential for a Marxist economic analysis. Indeed, until recently this notion has been accepted not only by a majority of economists, but, more significantly, by all anthropologists, archaeologists, ethnologists and experts in primitive economies."s
The question to be asked is how the meaning perspective of the cultures concerned helped their people to interpret nature and the task of agriculture. If, as animists do, they fear that the powers controlling the land will become angry when disturbed by a plough, then, the agriculture developed will not feature a plough or a tractor. Issues of distribution may be much more important, as an encroachment on the rights to the fruits of the land might also incur the wrath of the gods, if not their own then of those whose rights are tampered with. A mythological meaning perspective of this nature will result in a closed society. It will not seek to produce a larger economic surplus then necessary for its obligations, for example, by seeking to modernise the means of production. Surpluses of food can come about in a number of ways. Nature may be more bountiful than usual. The tribe may have been lucky in war or in the number of children born. The evidence of the experts cited by Mandel should not be doubted. What matters is the interpretation of the evidence. Is it seen as the basis for transforming the life of the tribe or does it function as a way of meeting religious obligations?
Cultures guided by a mythological meaning perspective in which tradition and a set of moral precepts based upon a view that divine powers bind people and nature to a code of right and wrong are key elements, have been widespread until the present time. Increasingly they collide with a modern culture guided by a Greek meaning perspective.
Mandel's view on the need for a surplus production of means of subsistence appears to be part of a Marxist meaning perspective.
Roman Empire For many centuries Rome was a society of agricultural tribes consisting of patricians and plebeians. The former owned land, whilst the latter had to work it. As the whole of Italy was conquered, land was distributed also to the poor. After the Punic Wars (146 BC) when Rome became a colonial power it began to import food and its native agriculture began to decline. The moral decay and great wealth of a world power coupled with declining food production led to chaos. Tiberius Bracchus attempted to reform agriculture but failed. Eventually the wide-flung state and its colonies became an empire under Julius Caesar and Augustus (63 BC-14 AD). Under the latter Rome enjoyed 50 years of peace, a golden age. During his reign the poet Virgil (70BC-19 BC) depicted the wonders of agriculture in his poem the Georgica, for many years read as a textbook on farming as well as an ode to Augustus. Indeed, once Augustus had
7 Ernest Mandel, Traite d'Economie Marxiste, Tome 1, Rene Julliard, Paris, 1962, pp. 21-5l. 8 Ibid., page 47.
..... to
restored some order to the Empire, his task was to revive agriculture. He found an enthusiastic and capable ally in Virgil, who was also the owner of a landed estate. Thousands of retumed soldiers who had been rewarded with a plot of land could learn from the Georgica the art of cultivating land and livestock. In passing we may note a strong Stoic flavour in Virgil's poem, inasmuch as he wanted farmers to follow the laws of nature (Book One) in a rational manner.
Despite frequent wars and internal disturbances after the death of Augustus, the wealth of prominent Romans continued to increase. It had to come chiefly from the land. Nobles purchased land wherever they could. By 400 AD the main crop in Italy was corn. Olives and wine were grown in parts of Italy, Southern Gaul, Greece and Spain. Egypt and Africa supplied cereals. Stock farming, however, was minimal. The lack of manure as fertiliser compelled farmers to plough very frequently. In times of war and drought famine could easily occur. Intensive farming activity required a great deal of manpower, which was often lacking as the supply of slaves became inadequate during the empire's decline. The major landlords then let the most infertile parts of their estates to coloni, on the basis of Egyptian examples. The relationship between lord and tenant was governed by a contract, under which the tenant had to supply labour at seedtime and harvest and to surrender part of the harvest. The major wars of the 3'd century forced the emperors to ease the burden of taxation. Landlords responded by reducing their tenants to the status of slaves. The larger lords attempted to withdraw their estates (latifundia) from the fiscal administration of cities and to become independent territorial units. Productivity on the estates, however, declined and unrest began to increase.9
The rise of Christianity during the Empire had led to a different perspective on the worth of agriculture. St. Augustine (354-430) wrote a book De Opera Monachorum in which he defended the importance of agriculture, especially against the monks, from the perspective of a culture of response to the Creator. He departed in this way from the Greek philosophers who despised manual work and farming.
The German tribes living across the North boundary of the Roman Empire were agrarian. Every tribe owned, communally, a plot of land and was governed by a king. As these tribes became involved in war the king was chosen from ancient families seen as related to the gods. They were kings by the grace of god. Under German custom the king was also owner of the temple on his territory. When they adopted Christianity they insisted on appointing the bishops over their territories.
Middle Ages The first dynasty of kings of Gaul, the Merovingians (400AD-650AD) extended this principle by granting important landed estates to the bishops in their territory. In the Middle Ages this construction was theologically underpinned by the idea that the exalted Christ is both King and Priest. The Pope would then represent Him on earth as priest and the king as king. The idea of the corpus Christianum was born. This entailed that Pope and King should work closely together. The Pope would appoint bishops, but the king would grant them land as independent sources of income. '0
'Joseph Vogt, The Decline of Rome, Weidenfeld, London, 1993, pp. 21ff. '" D.H. Th. Vollenhoven, Het Calvinisme en de Reformatie van de Wijsbegeerte, H.J. Paris, Amsterdam, 1933, pp 164 ff, with a critique of this construction.
As from the 10th century those who believed that the church should be free from domination by the state started to dispute the validity of this construction, for instance the reform movement of Cluny. This questioning encouraged also the emergence of a new power, chiefly economic, based mainly in the increasingly prosperous cities. Vollenhoven noted that such freedom for economic life was right in principle, since economic life should be acknowledged as being nonchurch life. However, one equated church life and Christian life and in consequence freedom for economic life then came to mean a life divorced from the Word of God." In practice this meant that economic life became subservient to the Mammon or the power of money.
In an economic sense, this freedom heralded the advent of the Renaissance in the 13th century. The desire for money spread from private life (the merchants) also to the leaders of States. In North Italian cities leaders operated according to principles of the later Stoa that above the realm of what can be calculated there is an area governed by Fortune, with an unpredictable future such that it stimulated their "virtue" to hazard ever more daring enterprises. t2
The Scholastic theology and philosophy of st. Thomas of Aquinas in the 13th century assigned the life of economics, including arts, crafts and agriculture, to the realm of nature and so sanctioned the freedom it had already acquired. If we connect this with the still hierarchical construction of Middle Aged Society and the '~hirst for money" on the part of feudal lords, including bishops and monasteries, then, it is not surprising that in the 14th century peasants were oppressed.
The outbreak of the plague and the subsequent rise in real wages (shortage of labour) will have made the lords more rather than less determined to secure a higher margin of profit from their estates. Thus, under Richard II a statute of labourers was enacted which prevented the peasantry from taking advantage of the scarcity of labour following the epidemic. Serious disturbances broke out when the poll tax was enforced in 1379. In practice, peasants became virtual slaves in many places. This led to widespread unrest amongst peasants especially durin~ the 15th and 16th centuries. In France, unrest became practically endemic until well into the 19t
century.'3
The 15th century witnessed a revival of business fortunes. This fuelled rather than diminished unrest amongst peasants. This unrest was fermented by the religious struggles of the time. In England, for example the Franciscan Wyclif (died 1384) went back to St. Augustine's view of three church types (the church as the people; the church as the assembly of God's elect and the church as institution), but only by adopting the view that the church consists of the elect. In 1381 the revolting peasants chose Wat Tyler as their leader and went on a rampage of looting and rioting. They learnt from Wyclif that the state had to serve the church, but since he considered the church to be the congregation of the elect, those who were not part of the elect had an uncertain state also in the state. Hence, one felt justified in taking the worldly possessions of the rich as they undoubtedly were the non-elect' . Needless to say that the government then opposed Wyclif.
In a more strictly economic sense, the dissatisfaction of peasants with their lot appears to have been stimulated by the practice of merchants to purchase the produce, which peasants brought to town, at the city gate, so that they could sell it inside the towns at much higher prices.
On the whole the Middle Ages were a period when the Christian culture of response was married in various ways with the beginning of a technicallobjectivising culture.
II Ibidem, page 191. " Vollenhoven, ibidem, page 202. 13 See Gerard Walter, Histoire des Paysans de France, Flammarion, Paris, 1963. "Vollenhoven, ibid., page 228.
I\) o
Reformation The Reformation of the 16th century led by Martin Luther (1483-1546), John Calvin (1509-1564) and Ulrich Zwingli (1484-1531), occurred during a socially and religiously very troubled period. Peasants had suffered the consequences of exploitation by landlords (following the effects of the Black Death and the Hundred Years war between France and England) since 1300. Since 1450 peasants in German lands had been pleading their case for the abolition of serfdom and relief from the burden of taxes, especially the tithe payable to the church. They wanted "divine justice". When Luther started a movement for renewal of the church based upon the Scriptures, the peasants renewed their demands under the single heading of the universal law of divine justice. The Word of God seemed to require church and priests, bishops and monasteries to be poor rather than rich owners of landed estate. Should the Word of God not be obeyed? In 1513-17 there were revolts in Germany under the symbol of the shoe, a contrast to the riding booths of the feudal lords.'5 The movement was inspired from a wide variety of spiritual sources. The Anabaptist movement, for example, preached a type of realised eschatology, which means that the kingdom of God had already come in its fullness, so that all impediments such as social and ecclesiastical hierarchies and institutions such as private property should be abolished forthwith. They were prepared to take up arms to bring this ideal state about. In 1525 throughout Germany a revolutionary mood took hold. In 1525 the peasants formulated their demands in 12 articles. They wanted the right to choose their own pastors, abolition of the tithe and slavery, free hunting, free use of the forests and freedom from villeinage. They supported these claims by quotes from the Bible.
Luther strongly resisted this revolutionary ferment on the part of the peasants, although he acknowledged that their social grievances were justified. He exhorted the princes of Germany to do justice to the rightful demands of the peasants. He accused them of tyranny and reminded them that the rebellion was a sign of God's wrath on them. He urged the peasants to refrain from violence and to avoid the shedding of blood. In order to deal with the grievances in a peaceful manner he suggested that a commission of wise men be convened to arbitrate the issues raised.
Bornkamm's note on Luther's state of mind early in 1525 appears to the point.
"Luther held the rural estate in high regard, especially in contrast to the uncanny moneymad business of the cities. Peasants, after all, represented the earliest form of work instituted by God himself at the dawn of human history. And when Luther liked to recognize peasants and shepherds, instead of clergy and scholars, as the type to whom God had entrusted his revelation, he praised them not really because of their piety but because of God's mercy, which favors the poor, the wretched, and those tested by suffering. To him the unrest of the peasants was no novelty, but for a long time he let it lie on the edge of his horizon. When, for example, he addressed the Christian nobility (1520), his proposals for reform did not even mention the peasants. He put in a good word for the virtues of farming, yet this was only to underscore the pitfalls of business and usury.,,'6
Bornkamm notes that Luther, albeit right in judging the consequences of the rebellion, missed a chance. There was no political power that could have subdued the mighty current of the peasants' revolt. The structures of the Roman Empire to which German Lands were still subject had become too weak to have a unifying and reforming influence.
"For this section see Heinrich Bornkamm, Luther in Mid-Career 1521-1530, The Peasants' War (pp. 355-399), 1979. "Heinrich Bornkanun, Luther in Mid-Career 1521-1530, Fortress Press, 1983, page 364.
"Medieval political structures provided only the framework of territorial states. Yet the peasants' plans for reform were far-sighted, over-arched by the idea of a strong emperor. Not since the days of Charlemagne had there been anything like it. Now reform should be founded on the gospel as the source of law and social righteousness, on equality in society, on a direct economy of production not dependent on trade, and on the requisitioning of church properties for the common good. The features of this model drew inspiration from a romantically transfigured past. Yet, in sharp contrast the territorial rulers were even then introducing the beginnings of the modern administrative or bureaucratic state.,,17
In other words the revolt provided a stepping stone towards the modern nation state. In England, of course, something like this happened when in 1536 the monasteries were dissolved. Anyhow, the resistance to trade must be seen in the light of the growing power of merchants in the 16th
century. It was the time of the Fuggers. Large trading networks were built to connect the various parts of Europe with ports that acted as centres for the exploitation of overseas colonies. Trading enterprises, such as those under control of the Fuggers, integrated trade, manufacture and mining on the basis of their financial power. Prices rose very rapidly not only because of the influx of gold and silver from South America, but also from the rich silver mines exploited by the Fuggers in South Germany. Until 1545 Germany's production of silver exceeded the combined production of the rest of the world.'8 The inexorable rise of prices was one of the causes of social unrest in the 16th century. People trained in scholastic and canonical law, including most of the reformers, were naturally suspicious of merchants, trade, lending at interest and monopolies. They had learnt that money does not give birth to money (Aristotle) and that the price of a good should reflect the value of labour spent on it.
For Luther interest was basically ground rent. So, he could justify the use of money capital to buy interest if the money was used to improve the state of a farm. If the rate of interest were equal to the extra yield of the land, then the deal would be mutually profitable. He cautioned, however, that in practice, the buyer of the interest (the investor) could not care less as to whether the user suffered any risk or bad fortune.'9
John Calvin was not directly confronted with peasant risings as his struggles were much more concerned with capitalist tendencies and inflation in the city of Geneva. In this respect, he developed a clearer understanding of the nature of interest as a reward for capital invested in industry and trade, although he wanted the Government to ensure that interest rates charged would not be socially oppressive.
Nevertheless, in his sermons and Bible commentaries20 Calvin addressed some key issues regarding agriculture. First, Calvin emphasised that what we call nature is the result of God's creation and, therefore, serves as a theatre of His glory. Second, creation is subject to His ordering. It is designed to provide fruits for humankind. In turn, humankind is charged to make it fruitful not for the sake of a few but for the benefit of all. In various places Calvin stresses that originally there would have been an economy of superabundance. There will be sufficient not only for the present generation, but also for a great many generations to come. Third, due to the fall of humankind into sin nature has become ambiguous inasmuch as it carries the signs of God's goodness and grace as well as the signs of His wrath. The later should serve as messages to people to repent and trust in Christ in whom and through whom the whole of creation will be restored in full.
17 Bornkarnm, ibid, page 395. '" Z.W. Sneller, Econornische Inzichten van Maarten Luther, in Bijdragen tot de Economische Geschiedenis, Het Spectrum, Utrecht, 1968, page 66. J9 Martin Luther, Ein Sermon von dem Wucher (1519), Martin Luther Ausgewahlte Schriften, Band IV, InseI Verlag, Frankfurt am Main, 1983, pp.16-18. '" Andre Bieler, La Pensee Economique et Sodale de Calvin, Georg, Geneva, 1959, pp. 425-432.
N ....
The earth is subject to God's laws. Calvin worked this out in two ways. First, the ordering has a political purpose. The fruits of the earth should be fairly distributed. Through its diaconate the church should correct the wrongs of the current (mal)-distribution. The Government should punish those who misuse their wealth and power, in part through the tax system. The Old Testament teaching of the sabbath year (every seventh year the Israelites were to let the land lie fallow and every fiftieth year original land-holdings were to be restored) indicates that the land should not be ruthlessly over-exploited for material gain. Sure, in other countries, less fertile than Israel, a fallow year might be necessary more frequently than every seventh year. The idea of restoring the original distribution of land and to restore the freedom of slaves emphasises the importance of solidarity amongst people. Thus, Calvin stresses that farmers have a great vocation as God's co-workers.
The Reformation can be seen as an attempt to bring about a renewal of culture in the sense of a culture of response.
The Spirit of the Renaissance: Francis Bacon and Descartes Although the movement of the Reformation was by no means opposed to science, the spirit in which they wished to approach science was different from that of the Renaissance. The reformation appreciated science as a way of giving glory to God the Creator and acknowledged Him as the Lawgiver of nature. However, they would hold this for all fields of human endeavour, be it family life, arts, politics or business.
By contrast, the Renaissance thinkers began to see science as an independent source of knowledge. The human mind would create knowledge by means of strict rational thinking. Descartes (1596-1650) was the most radical of these first rationalists. His contemporary, the English politician and scholar Francis Bacon (1561-1626) concentrated on defining and developing a method whereby knowledge would be found in a systematic mechanical manner such that it could be applied for the advancement of humankind. J.G. Crowther called him "the first statesman of science", meaning that according to Bacon science had to be organised and equipped with sufficient resources to the end of achieving practical results in particular to extend the power of the human race over the universe.21 Bacon's method consists of carefully enumerating all manifestations of a phenomenon and then to exclude from its instance that which is particular to that instance. In this way he thought he would discover the general law governing the phenomenon. Basically it is a method of induction.
In his many labours, amongst others as Lord Chancellor, Bacon had also cause to concern himself with agricultural policy. Thus, in 1588 he introduced bills against enclosures and for the maintenance of tillage.2 His main objection to enclosures was that they were leading to depopulation, unemployment (requiring assistance for the poor), decay of tillage, subversion of houses, decrease of charity and impoverishment of the state of the realm. De-popUlation would result in a shortage of good soldiers. Hence a rational control of agriculture was called for. However, in 1612 he advised the king that one way to increase revenue from his lands was to retain control, over the King's wastes and commons, as they were a potential source of much wealth through enclosure and agricultural improvement.23 One can recognise in some of these pOints the arguments deployed in the 20th century to defend State intervention in agriculture.
Crowther notes that in his earlier period Bacon advocated the development of science as a social good for the benefit of all humankind. Later on in life he narrowed that down to those projects which would increase the profits of individual undertakings.
" J.G. Crowther, Francis Bacon; the first statesman of science, The Cresset Press, London, MCMLX. " Crowther, ibid, page 193/94. " Crowther, ibid, page 242.
The spirit of Bacon was said to have inspired some of the major agricultural improvers in the 18th
century such as Jethro Tull. They certainly tackled the problems of agriculture in a systematic experimental fashion with a view to increasing human control over natural processes.
The approach of Rene Descartes to science was much more mathematical and deductive in character. More importantly, his view that animals and plants were no different from machines, being bodies we perceive by our senses, represented a major difference from the usual view of most people that plants are different from material things and animals different from plants. In Part IV of the Principles of Philosophy he argued that by allowing for our senses, as activated by our nerves, we can explain that the soul perceives colours, tastes, pain and pleasure. Descartes believed that the soul was physically located in the brain. Thus, colours are perceived because external objects move in a certain way (magnitude, figure and motion) and so touch particular nerves, which convey the sense of colour to the brain. Colour as such, however, produces only a confused image of a body:
"This cannot be said of any of the other things that fall under our senses, as colours, sounds and the like; for each of these affects but one of our senses, and merely impresses upon our imagination a confused image of itself, affording our understanding no distinct knowledge of what it is.,,24
The emphasis upon the motions of bodies implies that Descartes looks at the world as a mechanical universe and ignores the characteristic differences between material things, plants, animals and people.
It should be emphasised that people like Bacon and Descartes professed to be Christians. We have no reason to doubt their sincerity in this regard. Nevertheless, by considering one particular way of acting in the world or viewing the world, i.e. the scientific/mechanical/mathematical way as the only one that matters, they set the scene for the development of a world view that considers this way of viewing things as the only valid one, the only one able to lead man from darkness to light, to take up Bos' metaphor again.
During the 19th and 20th century this materialistic view has become the dominating way of viewing farming. Animals are machines, which can be altered for the profitability of farming.
Romantic Reaction to the Enlightenment The strong focus on a rational ordering of life and society during the period of scientific rationalism and the Enlightenment (17'h and 18th centuries) called forth a reaction on the part of Jean-Jacques Rousseau (1712-1778). He shared with the Enlightenment thinkers a belief in progress. In "The Social Contract and Discourses" he outlined a process from the happy state in which people were basically animals to a state in which they have some sort of mutual society and live in families in the wild as hunters and gatherers. Inequality becomes part of human society when people find out how to grow corn and how to use iron. Such practices require that one man needs the assistance of others. It requires the institution of property. People who make iron implements need the services of those who grow food and these need the implements of the artificers. The inequality in possessions and in relationships, accounted for many evils. Society and law had to be established.
"Rene Descartes, The Principles of Philosophy, Part N: Of the Earth, in A Discourse on Method, J.M. Dent &Sons, London, 1953, page 222.
I\) I\)
"From society and the lUxury to which it gives birth arise the liberal and mechanical arts, commerce, letters, and all those superfluities which make industry flourish, and enrich and ruin nations. The reason for such destruction is plain. It is easy to see, from the very nature of agriculture, that it must be the least lucrative of all the arts; for, its produce being the most universally necessary, the price must be proportionate to the abilities of the very poorest of mankind.,,25
The state of peasants in France during the 181h century was such that Rousseau's sentiments would not be seen as particularly outlandish. It was the time of the Ancien Regime, marked by an extreme form of feudalism. Peasants were part of the third estate (the first estate was made up of the privileged clergy; the second estate of privileged aristocracy). For centuries, the first and the second estate had cared very little for the peasants. They appreciated them only for their ability to pay a large variety of taxes, included a hated tax on salt. In addition, they were called upon to provide unpaid services on their estates even to the point of keeping the frogs quiet during the night. Risings and disturbances (known as "jacqueries") were very frequent. Something of this spirit of resistance has remained a part of the tradition of French farmers. They still protest violently when they believe that their incomes are threatened by Government measures.
The burden of taxes to be paid by peasants was such that famines were frequent. Moreover, the nobility (less than 1 % of the population but in possession of 20% of the land) had lost interest in farming and had moved to the court or to the army. Farming was neglected. The court's sources of income were the revenues of monopolised industries and the taxes extracted from the farmers. Money flowed from the countryside and the centres of commerce and industry to the court, but there was no similar return flow. Thus, prices rose and money became scarce. Those of the nobility still on the land impoverished and often joined their tenants in their protests.
In order to remedy these evils the Physiocrats pleaded for a reform of the state based on agrarian restructuring. In their view the true wealth of a country lies in the soil. The products of the land can be consumed or serve as inputs into industrial activities. Commerce and industry are totally dependent on agriculture. In order to implement the reforms they had in mind, the land needed to be re-distributed, first, in order to enable intensive farming and, second, to allow farmers a socially attractive lifestyle. Had their reforms been carried out, then the king and the nobility would have been deprived of their financial income. Moreover, the lucrative (for the king that is) grain monopoly would have been abolished.
The Physiocrats thought of the economic system of private property and free markets as '1he natural order". If prices for agricultural products were high, wages paid by industrialists would be high and such high wages would enable the purchase of food at the high prices whilst the farmers would be able to purchase the products of industry. The Physiocrats opposed State intervention in competition and promoted free international trade. If farmers were free to grow what they thought best, they would be able to export part of their surplus. The wealth of a country was not to be found in a pot of gold acquired by unequal trading relationships or extracted from colonies.
French agriculture became a major issue for Government especially after 1870. After World War " the first Plan focussed on a revitalisation of agriculture so as to make it a source of export income. This policy has become foundational to the Common Agricultural Policy of the European Union since 1962. In this way a basic idea of the Physiocrats has been retained to the present day, albeit in a much weakened form, inasmuch as French Governments believe it to be their duty to protect agriculture and to keep it viable as a major source of independence and income.
os J.J. Rousseau, The Social Contract and Discourses, J.M. Dent &Sons, London, first edition 1750, page 111.
Marxism One of Karl Marx's achievements was to focus on social relationships as a method for analysing economic relationships. People who are organised into a socially determined division of labour transform useful objects into commodities. Commodities can be exchanged for money (C-M-C) and money is used to buy commodities. The value that is exchanged is the value of labour:
''Thus the determination of the magnitude of value by labour time is a secret hidden away beneath the manifest fluctuations in the relative values of commodities.,,26
This statement reminds us of the quest of Greek philosophers to find the unchangeable in order not to be fooled by the phenomena of change and decay in the world around us. In terms of 80S'
rendering of the ground-motive of Greek philosophy, Marx aims to show how the deciphered secret can help us not only to understand the exploitation practised by capitalists but also how their system will evolve into one that is free from such exploitation. In the final stages when the capitalist system is about to collapse under the weight of its contradictions, a revolution will be called for to hasten the advent of the communist community. Thus, we need to move out of the underworld of slavery into the bright light of a communist society.
Marx sets out his analysis by contrasting the exchange process of C-M-C with M-C-M, meaning that money is advanced to buy commodities. Money advanced should generate a surplus value. There is no point in advancing money in order to get back exactly the same sum. So, the scheme becomes: M-C-M' where M'=M+dM. The increment dM is surplus value. Once a surplus value has been realised the sum M' can be advanced again. There is no end to this process, in contrast to the scheme C-M-C where commodities are exchanged for commodities and where money is a general form of value. Marx notes:
"Thus use-value is never to be regarded as the direct aim of the capitalist. Nor is the profit on any single transaction his aim, for what he aims at is the never-ending process of profit making. This urge towards absolute enrichment, this passionate hunt for value, is shared by the capitalist with the miser; but whereas a miser is only a capitalist gone mad, a capitalist is a miser who has come to his senses. The unceasing increment of value at which the miser aims in his endeavour to save his money from circulation, is attained by the shrewder capitalist by again and ever again handing over his money to circulation.,,2?
For the capitalist commodities are not just expressions of value but rather money or as he put it "inwardly circumcised Jews" or a means whereby out of money more money can be made.28
The problem is now how surplus value can arise through exchange processes in which only the value of labour is exchanged? To answer this question Marx analyses the use of labour in depth. He begins by defining what labour is:
"Primarily, labour is a process going on between man and nature, a process in which man, through his own activity, initiates, regulates and controls the material reactions between himself and nature.,,29
Arguing against the Physiocrats, Marx notes that agriculture presupposes a comparatively high development of labour power.30 The labour people expend requires instruments fashioned in earlier periods.
"Karl Marx, Capital, Volume I, J.M. Dent & Sons, London, 1930, Everyman's Library (original 1867), page 45. "Ibid, page 139. "Ibid, page 140. '" Ibid, page 169. .10 Ibid, page 171.

I\) W
"Animals and plants, which people are apt to regard as natural products, may not merely be the products of last year's labour, but may, in their extant form, be the products of a transformation which has been going on through many generations, under human control and aided by human labour.,,31
In the process of production surplus value is created inasmuch as the labour time, which is required to maintain the labour power of the workers is less than the time spent on producing the product.
Such surplus value can take a variety of forms. On the large estates in Eastern Europe and in feudal Western Europe it used to take the form of corvee or services in kind to be performed by serfs and villeins on the lord's demesne.32 In manufacturing industries one uses machinery in order to create surplus value (as they make commodities cheaper they reduce the number of hours labourers need to maintain themselves).
The system is such that capitalists gave an incentive to substitute machinery for people in order to maximise their surplus value. This occurs not only through higher productivity in the factories but also through the creation of a reserve army of unemployed workers. As these compete with the employed for work, the wage rate falls and, thereby, increases the surplus value. However, unemployed workers are not in a position to purchase the products produced. Thus, the capitalists are digging their own graves.
In Book II of "Capital" Marx gives an outline of "primary accumulation", including a description of how small peasant farmers in England and Scotland had been removed from their land or turned into "masterless proletarians", whilst in the process great landowners were created. In the 16
th
century money rents fixed for 99 years during a time of rapid inflation increased the money wealth of landowners considerably. Citing Frederick II of Prussia Marx mentions how peasant farmers were expropriated, whilst large factories were set up to produce textiles. Some farmers found work in these factories. However, the many small producers who used to spin flax at home lost that extra income.
'Thenceforward, spindles and looms and raw material, which of yore were means of independent existence for spinners and weavers, are transformed into means for controlling these spinners and weavers, and for extracting unpaid labour from them.,,33
One conclusion that can be drawn is that in Marx's view there is no distinction between a capitalist producer who runs a farm and one who creates surplus value by manufacturing. Each, in his own way, employs labour and uses machinery to increase the creation of surplus value. Each will be subjected to the crises of capitalism resulting from its own success and eventually from its falling rate of profit. This lack of distinction between the two is common to both Marxists and neo-classical economists.
However, within the Marxist movements of the 19th and 20th century there was a preference for triggering the collapse of capitalism as a pre-condition for the establishment of communism by intensifying the class-struggle between workers and industrialists rather than by organising a collapse of capitalist farming. The latter route was taken by Lenin and Stalin in the Soviet Union in a process of enforced industrialisation which required the conversion of peasants to workers in industry. This process was similar to the one Marx described for England from the late 14th to the 19th century.
" Ibid, page 174. " Ibid, page 236ff. " Ibid, page 827.
Marx had already expressed the similar nature of modern agriculture and industry in the Economic and Philosophic Manuscripts of 1844:
"The power of industry over its opposite is at once revealed in the emergence of agriculture as a real industry, most of the work having previously been left to the soil and to the slave of the soil, through whom the land cultivated itself. With the transformation of the slave into a free worker-i.e., into a hireling-the landlord himself is transformed into a captain of industry, into a caJ)italist-a transformation which takes place at first through the intermediary of the tenant farmer.,,34
For Marx labour always involves a relationship with nature:
"But since for the socialist man the entire so-called history of the world is nothing but the begetting of man through human labour, nothing but the begetting of man through human labour, nothing but the coming-to-be of nature for man, he has the visible, irrefutable proof of his birth though himself, of his process of coming-to-be.,,35
We may see in this reference to man's re-birth an effect of the Renaissance on Marx thinking. 36
Individual Property Rights Marx's analysis is supported by the general move towards individual property rights over European history. There has been no support for or interest in incorporating all the land in a cooperative system. Village communities featured basically individual ownership rights to land in addition to the common areas. Thus, the logical step was to move towards the more intensive farming of rotation systems without fallow land by removal of common lands in favour of privately owned land. Often those who had power in local communities such as local lords managed to acquire extra land for enclosure on the death of copyholders or by other means. Between 1700 and 1845 the British Parliament passed 4,000 enclosure Acts (right to carve up communities, rearrange land and to enclose land) which nominated Commissioners to carry out the division of land. Often these Commissioners left the poorest land to the smallest farmers. Thus, the majority of yeomen farmers disappeared by becoming salaried workers on large estates, workers in industry in town or they migrated overseas. By the middle of the 19th century 2,000 large landlords owned estates ranging from 100,000 to 400,000 hectares each, covering in total one third of the land, where there were still 200,000 manors.
New ideas, which had come to the fore during the Renaissance and the period of rationalism, favoured strongly private property rights of individuals on the assumption that the individual was born free and should be free to make contracts during his or her life. The State should protect and defend such rights. Underlying these ideas was the belief that people would be able to tame and control nature on the basis of scientific and experimental methods. These ideas had a growing influence on public opinion during the 17'h and 18th centuries and so helped to blaze a trail for the new agriculture as well as for the new industries based on steam-power. One believed that private owners working in their self-interest would risk their capital and would be willing to experiment and make technical improvements. By treating agriculture in the same way as other industries, however, a major problem has emerged due to the small price elasticities of demand and supply in an industry dominated world-wide by many small producers. Given world prices, an indiVidual farmer believes that he can improve his profitability by increasing the productivity of his labour, animals and land. The resulting increase in supplies, however,
" Karl Marx, Economic and Philosophic Manuscripts of 1844, Foreign languages Publishing House, Moscow, no year, page 88. "Ibid., page 113. 36 Johan van der Hoeven, Karl Marx: The Roots of His Thought, Wedge Publishing Foundation, Toronto, 1976, page 84.
I\) ~
depresses the price and compels farmers to raise their productivity again. This feature of modern agriculture has become known as the treadmill problem.
The Treadmill Problem The serious over-supply problems which emerged after the period of high prices after World War I caused key producing countries to protect their agriculture against low prices. The approach adopted by both the USA and European countries since the depression of the 1930s is very well described and analysed by Van Rompuy37. His general approach is to argue that the Government would intervene in specific economic sectors such as agriculture if the unfettered working of private markets were to produce results contrary to the public interest or to specific Government objectives. He then analyses the special position of agriculture in Western countries in terms of four characteristics: I. In some important agricultural markets, equilibrium of production and demand is not assured. 2. The income of many farmers is lower than that of comparable professional groups, because
incomes in agriculture increase more slowly than in other sectors. 3. The proportion of agriculture in GDP and hence rural populations is trending downward. 4. Prices of agricultural products are subject to large fluctuations. Van Rompuy then points out that the underlying problems are structural and that the current opinion of economists is that, therefore, a structural policy is called for. The four characteristics are all based on the treadmill hypothesis, for which van Rompuy refers to W.W. Cochrane and W.W. Wilcox 1958 textbook on agricultural economics. The global income elasticity of the demand for agricultural products is relatively low. The supply of these products is atomistic, however, so that individual farmers have no control over total supply or prices. As price-takers they must maintain or increase profits by reducing costs through increases in productivity. In agriculture increases in physical productivity tend to imply also a higher volume of production. Collective increases in productivity result in lower prices. Economic productivity tends to be lower than physical productivity. Since economic productivity in other sectors, according to Van Rompuy tends to be higher than in agriculture3
., especially in conditions of rapid general economic expansion and full employment, wages and prices of capital goods used in those sectors increase more rapidly than in agriculture. A higher income elasticity of demand for those other products tends to reduce the relative price of agricultural products. Van Rompuy must assume here monopolistic or oligopolistic competition, although he does not specifically mention it. Thus, agriculture cannot compete on price for labour and capital with those sectors. The high fixed costs in agriculture (often including (family) labour) makes the relatively poor supply conditions worse, in addition to fragmentation of land holdings, poor education and training and worse social amenities in rural areas. Van Rompuy adds that the increase in the services contents of agricultural produce (packaging, processing, distribution) enjoys a higher income elasticity of demand, so that after subtraction of these elements the price received by farmers for their produce is even more depressed.
A structural policy should be flexible. Van Rompuy refers to American economists who pleaded for the use of guaranteed prices announced before the start of a new season. These should take into account the actual situation of demand and supply over the medium term. In addition, they advocated the use of special subsidies to encourage farm workers to re-school and move to urban areas. The Government's general policy of encouraging strong economic growth and full employment should be the best condition for achieving structural change.
However, the policies deployed in the USA and in Western Europe were predominately policies of price and income support. The USA, for instance, used a system of parity prices, the idea being that prices for agricultural products should move in parallel with those prevailing in the rest of the economy. In practice this meant that the Government set intervention prices and was
-'7 v. van Rompuy, Sectorpolitiek, in: J.E. Andriessenen M.A.G. van Meerhaeghe editors,Theorie van de Economische Politiek, H.E. Stenfert Kroese, Leiden, 1962, pp. 381-421. J8 Ibid., page 385.
prepared to buy produce at those prices if market prices dropped below them. European countries operated similar systems. When the EEC's agricultural policy came into effect in 1962 it had likewise a system of intervention prices.
Both systems aimed at providing income support through prices. Such support systems, especially if accompanied by policies deSigned to increase physical productivity through the application of science and technology, tend to increase farm production because it becomes more profitable for individual participating farmers. Since for them the price remains marketdetermined, they can increase their incomes by producing more. To counter the resulting increase in supply, the USA government pronounced limits on areas that could be sown in certain crops, or set aside land from agricultural production. Nevertheless, the Government accumulated large surplus stocks, an experience which the EEC would have as well over the more than 30 years that its agricultural policy has been in operation.
Van Rompuy checks these farm support policies against the following economic policy objectives: I. To achieve an increase in the productivity of agriculture by promoting technical progress by
bringing about a rational development of production and an optimal allocation of factors of production, especially of labour. He calls this a structural policy.
2. To ensure a reasonable standard of living for the rural population; 3. To stabilise markets. 4. To safeguard food supplies. 5. To allow consumers and manufacturers to obtain agricultural products at reasonable prices.
As the author pOints out there are two contradictions between these objectives. Objectives 2 and 4 and 1 and 4 are incompatible, if we assume that the relationships of demand and supply are as analysed above.
In van Rompuy's analysis the relatively poor income position of farmers in Western countries is a direct result of diverging productivity movements between agricultural and non-agricultural sectors, as a result of which agriculture had difficulty retaining resources of labour and capital. Hence his preference for a structural policy which would reverse this divergence. However, if farmers want to maximise their monetary profitability, then the availability of income support or price support alongside a structural policy aimed at increasing technical productivity, regardless of consequences for the long-term fruitfulness of soil, animals or plants could lead to very high increases in production. Farmers tend to regard the natural resources with which they are endowed such as air, water and soil as free goods.
Industrial Agriculture The treadmill problem is a reflection of an industrialisation of agriculture since about the time of the Enlightenment of the 18th century. Through a complex interaction of science, technology and the power of money, farming has ceased to be part of a culture of response or part of a sacral/mythical culture. Animals and plants are considered as factors of production to be exploited for financial gain. Farmers are forced to jump on this bandwagon. They are dependent on the supplies manufactured by business corporations. They produce for anonymous world markets. They have lost their autonomy as people who are able to bear responsibility for the way in which they care for plants, animals and people involved in their farm operations. Many are unable to make a living from farming alone. Many sell out to larger farms.

Is there a Way Out? In order to step off the treadmill, it will be necessary to gain a new cultural perspective on agriculture. A return to mythical and magical cultures is not, in my opinion, an adequate answer to the crises of industrial agriculture. I would seek an answer in terms of Schuurman's metaphor of a garden-city.39 A garden connotes the idea of proper stewardship. It involves a wide and balanced diversity of plants and animals. Justice should be done to the proper nature of plants and animals. This contrasts with the idea of scientific/technical manipulation solely for the purpose of monetary gain. In the perspective of a garden one uses scientific insights to promote, for instance, organic farming. It may also involve giving priority to farming as a means of feeding the population of a country rather than as a means of earning a maximum of foreign exchange through exporting.
Conclusion Since the period of the Renaissance Western agriculture has increasingly been founded upon a scientific-technical basis in the context of a free-market economy. Agriculture has been seen as no different from other industries. This view has led to major problems due to specific characteristics of farming so conceived as a world industry operating under free-trade rules. The intervention systems set up especially after World Wars I and II have been unable to overcome the problems of structural over-supply. If a new direction for agriculture is to be found, then, the problems caused by an objectivising culture should be tackled first. In other words, a new paradigm for agricultural development shOUld be found
~ 39 E. Schuurman. Geloven in Wetenschap en Techniek, Buijten en Schipperheijn, Amsterdam, 1998, pp.149-192.
I\) Q)
E-COMMERCE IN THE PRIMARY SECTOR: SPECTRE OR SAVIOUR?
Mike Stoke(Martech Consulting Group Limited, PO Box 31-308, Milford, Auckland) Chris Nixon (NZ Institute for Economic Research, POBox 3479, Wellington)
Irene Panninter (MAP Policy, Private Bag 3123, Hamilton)1
Abstract
E-commerce is a method of improving the efficiency of business transactions. It has the potential to improve both the availability of information to, and communication between, the parties to a deal. It may drive changes in market channels, reducing the inefficiencies and discontinuities in the value chain. These changes may be described in a demand and supply framework, indicating that prices for output are likely to fall. From a theoretical perspective, it seems unlikely that any fall in input and transaction costs brought about bye-commerce, would compensate for the fall in output price in the primary sector. However, the opportunities offered by ecommerce for product differentiation and customisation, better access to markets and market information, and improved communication between buyer and seller are likely to have a countervailing effect. The apparent success of e-commerce ventures in the primary sector to date, seems to suggest that both sellers and buyers are benefiting from the new market channel. However, the rural telecommunications infrastructure, resistance to change, lack of skills and motivation, and regulatory and institutional rigidities currently limit the extent to which the oppOitunities available are utilised.
Keywords: e-commerce, agriculture, marketing.
INTRODUCTION
In November 2000, the government launched its e-commerce strategy, with the vision:
"New Zealand will be world-class ill embracing e-commerce for competitive advantage".
The Strategy defines e-commerce in the broad sense of "undertaking business processes in a networked environment", rather than the nan'ow sense of businesses advertising or consumers buying on the Internet (business to consumer or B2Cf The Strategy considers that the greatest gains from e-commerce lie in business to business (B2B) e-commerce, and within business communication.
In his introduction to the Strategy, the Honorable Paul Swain (Minister of Commerce) writes that e-commerce opens up "vast new opportunities", and that New Zealand "cannot afford to be left behind". Considerable policy effOit is cunently being directed to ensuring the Strategy's vision is realised. Simultaneously with the
, The views expressed in this paper are those of the authors and do not necessruily reflect the official view of the Ministry of Agriculture and Forestry. 2 The broad definition of e-commerce will be followed in this paper.
implementation of the Strategy, policies are being developed for bridging the "digital divide", improving broadband access for rural areas, and the introduction of egovernment. The incorporation of rural concerns in the e-commerce and digital opportunities strategies, and continuing Government comment on addressing rural telecommunications issues, suggest that the Government is interested in stimulating rural, as well as urban e-commerce.
Is Central Government's enthusiasm for e-commerce well-founded? In the last 18 months, e-commerce's previously stellar progress has faltered. The Economist reports dotcoms3 "dying by the dozen" (The Economist, April 21, 2001) and asked recently "Is there life in e-commerce?" (The Economist, February 3, 2001). That doyenne of e-business, Cisco Systems, which prided itself as a model of the advantages of e-commerce (for example, just in time purchasing, minimal inventory), has been caught out by the downturn in the US economy, writing off $2.2 billion in inventory in the three months to April 2001, and will reduce its workforce by 8,500 people (Economist, April 21 and May 12,2001). Amazon, the biggest B2C dotcom, has closed two facilities and laid off 1300 staff this year, and has yet to make a profit (The Economist, February 3, 2001). Nonetheless, most commentators view these as "growing pains", and maintain that e-commerce has the potential to increase productivity and economic growth, not least because it lowers transaction costs and improves access to information, moving the economy closer to the perfect competition ideal, and therefore improving the allocation of resources.
By 2004 it has been estimated that global "Business to Business" (B2B) e-commerce transactions will be worth US$7 trillion, and by 2010, $21 trillion (Gartner Group, 2000). B2B e-commerce in Australasia is projected to increase from A$17 billion in 2000 to A$235 billion in 2005, but NZ businesses are projected to contribute only 9% ($21 billion) of this (Wetenhall et ai, 2000). By comparison, New Zealand contributes about 13% of Australasia's GOP.
Fundamentally, e-commerce is an enabling technology advance that improves the efficiency of information transmission, price discovery and the processes of transacting exchanges of goods and services. Suppliers benefit from improved efficiency, just-in-time payment and delivery terms, faster stock turnover and lower inventory, and lower costs for their own purchasing. For example, British Telecom claims a 90% fall in the cost of processing transactions, and savings in goods and services costs of 11 % (OECD, 2000). It has been estimated that if the improved stock turnover achieved by Dell computers using e-business techniques were translated across the whole US economy, $US200 billion would be unlocked and corporate bottom lines would improve by 18% (Braddell, 2000). Purchasers also benefit, as e-commerce increases buyer power - buyers have access to better information, and are therefore able to extract better terms and conditions from suppliers.
In the UK it has been estimated that these savings are worth 2-3% of GOP, and for an individual business, a saving of 2-3% of turnover (London Economics, 2000). However, not all sectors are created equal- it has been estimated that the savings in
3 Companies selling on the Internet use ".com" in their domain name.
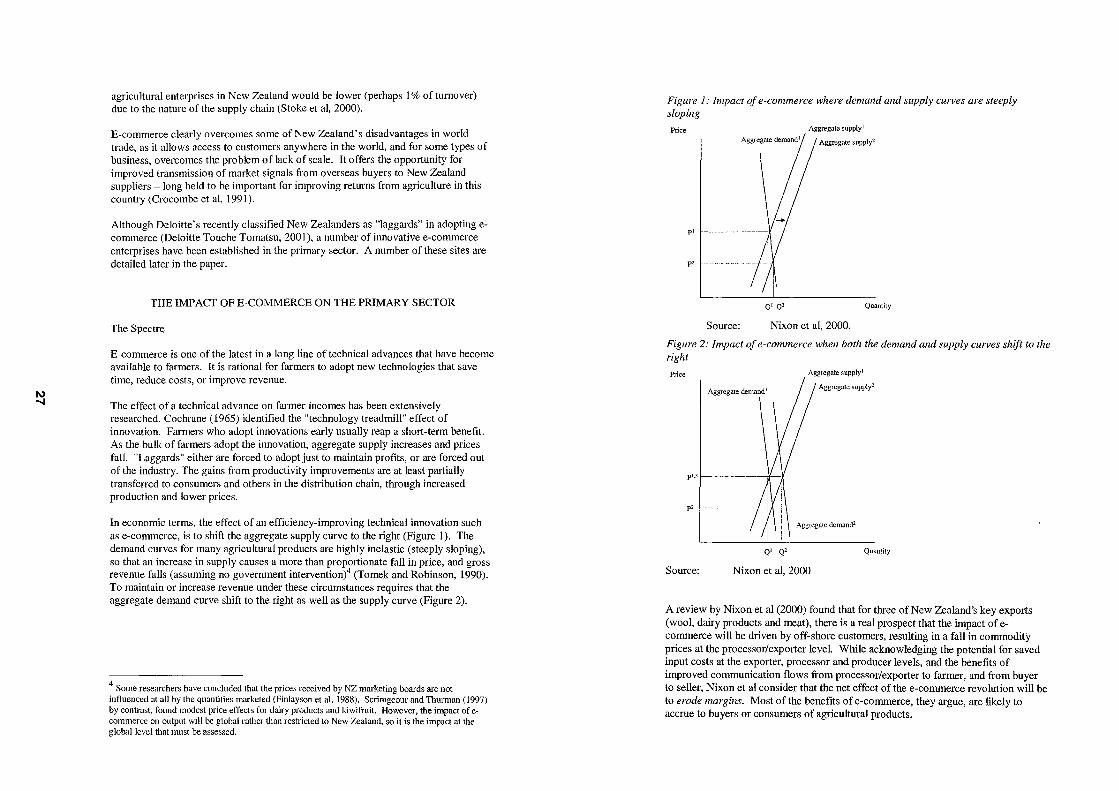
I\) -..j
agricultural enterprises in New Zealand would be lower (perhaps 1% of turnover) due to the nature of the supply chain (Stoke et ai, 2000).
E-commerce clearly overcomes some of New Zealand's disadvantages in world trade, as it allows access to customers anywhere in the world, and for some types of business, overcomes the problem of lack of scale. It offers the opportunity for improved transmission of market signals from overseas buyers to New Zealand suppliers - long held to be important for improving returns from agriculture in this country (Crocombe et ai, 1991).
Although Deloitte's recently classified New Zealanders as "laggards" in adopting ecommerce (Deloitte Touche Tomatsu, 200 I), a number of innovative e-commerce enterprises have been established in the primary sector. A number of these sites are detailed later in the paper.
THE IMPACT OF E-COMMERCE ON THE PRIMARY SECTOR
The Spectre
E-commerce is one of the latest in a long line of technical advances that have become available to farmers. It is rational for farmers to adopt new technologies that save time, reduce costs, or improve revenue.
The effect of a technical advance on farmer incomes has been extensively researched. Cochrane (1965) identified the "technology treadmill" effect of innovation. Farmers who adopt innovations early usually reap a short-term benefit. As the bulk of farmers adopt the innovation, aggregate supply increases and prices fall. "Laggards" either are forced to adopt just to maintain profits, or are forced out of the industry. The gains from productivity improvements are at least prutially transfened to consumers and others in the distribution chain, through increased production and lower prices.
In economic terms, the effect of an efficiency-improving technical innovation such as e-commerce, is to shift the aggregate supply curve to the right (Figure I). The demand curves for many agricultural products are highly inelastic (steeply sloping), so that an increase in supply causes a more than proportionate fall in price, and gross revenue falls (assuming no government intervention)4 (Tomek and Robinson, 1990). To maintain or increase revenue under these circumstances requires that the aggregate demand curve shift to the right as well as the supply curve (Figure 2).
-I Some researchers have concluded that the prices received by NZ marketing boards are uot influenced at all by the quantities marketed (Finlayson et ai, 1988). Scrimgeour and Thurman (1997) by contrast. found modest price effects for dairy products and kiwifruit. However, the impact of ecommerce on output will be global rather than restricted to New Zealand, so it is the impact at the global level that must be assessed.
Figure I: Impact of e-commerce where demand and supply curves are steeply sloping
Price
pI
p'
Source:
QI Q'
Aggregate supplyl
Aggregate supply2
Quantity
Nixon et ai, 2000.
Figure 2: Impact of e-commerce when both the demand and supply curves shift to the right
Price Aggregate supply I
Aggregate supply2
plJ
P'
Aggregate demand:!
QI Q' Quantity
Source: Nixon et ai, 2000
A review by Nixon et al (2000) found that for three of New Zealand's key exports (wool, dairy products and meat), there is a real prospect that the impact of ecommerce will be driven by off-shore customers, resulting in a fall in commodity prices at the processor/exporter level. While acknowledging the potential for saved input costs at the exporter, processor and producer levels, and the benefits of improved communication flows from processor/exporter to farmer, and from buyer to seller, Nixon et al consider that the net effect of the e-commerce revolution will be to erode margins. Most of the benefits of e-commerce, they argue, are likely to accrue to buyers or consumers of agricultural products.
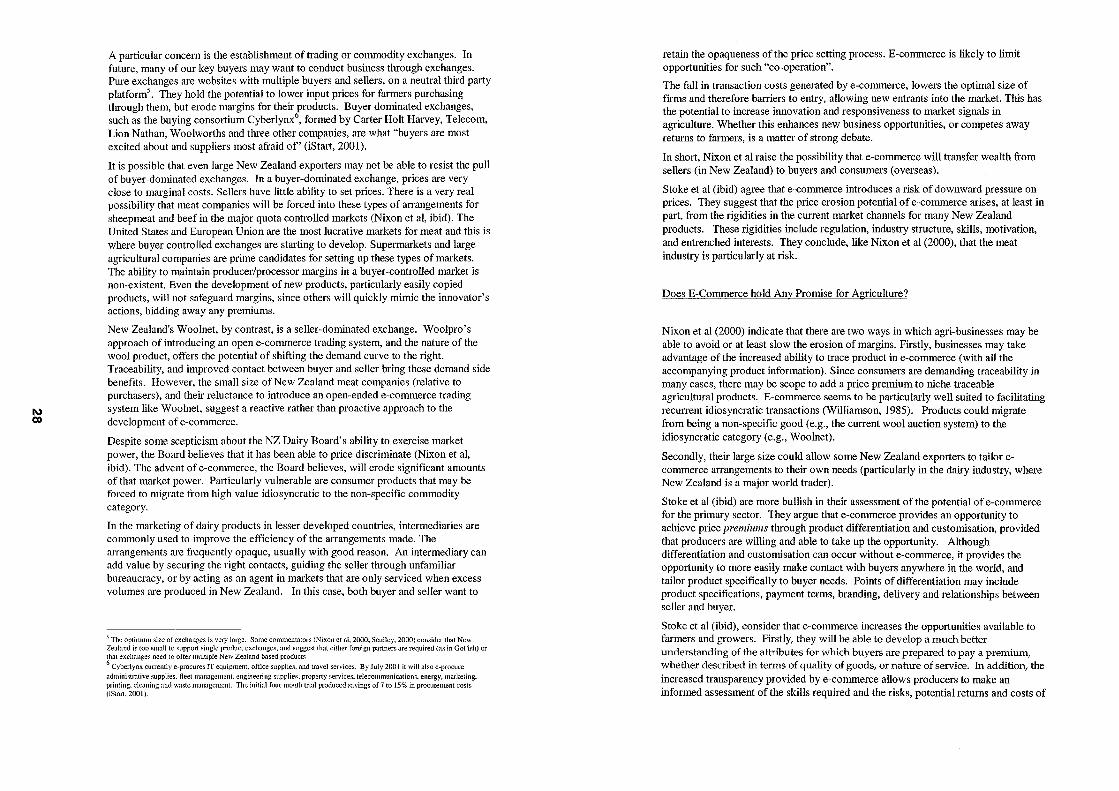
I\) (X)
A particular concern is the establishment of trading or commodity exchanges. In future, many of our key buyers may want to conduct business through exchanges. Pure exchanges are websites with multiple buyers and sellers, on a neutral third party platform5
. They hold the potential to lower input prices for farmers purchasing through them, but erode margins for their products. Buyer dominated exchanges, such as the buying consOltium Cyberlynx6
, formed by Carter Holt Harvey, Telecom, Lion Nathan, Woolworths and three other companies, are what "buyers are most excited about and suppliers most afraid of' (is tart, 2001).
It is possible that even large New Zealand exporters may not be able to resist the pull of buyer-dominated exchanges. In a buyer-dominated exchange, prices are very close to marginal costs. Sellers have little ability to set prices. There is a very real possibility that meat companies will be forced into these types of arrangements for sheepmeat and beef in the major quota controlled markets (Nixon et aI, ibid). The United States and European Union are the most lucrative markets for meat and this is where buyer controlled exchanges are stalting to develop. Supermarkets and large agricultural companies are prime candidates for setting up these types of markets. The ability to maintain producer/processor margins in a buyer-controlled market is non-existent. Even the development of new products, pmticularly easily copied products, will not safeguard margins, since others will quickly mimic the innovator's actions, bidding away any premiums.
New Zealand's Woolnet, by contrast, is a seller-dominated exchange. Woolpro's approach of introducing an open e-commerce trading system, and the nature of the wool product, offers the potential of shifting the demand curve to the right. Traceability, and improved contact between buyer and seller bring these demand side benefits. However, the small size of New Zealand meat companies (relative to purchasers), and their reluctance to introduce an open-ended e-commerce trading system like Woolnet, suggest a reactive rather than proactive approach to the development of e-commerce.
Despite some scepticism about the NZ Dairy Board's ability to exercise market power, the Board believes that it has been able to price discriminate (Nixon et aI, ibid). The advent of e-commerce, the Board believes, will erode significant amounts of that market power. Pmticularly vulnerable are consumer products that may be forced to migrate from high value idiosyncratic to the non-specific commodity category.
In the marketing of dairy products in lesser developed countries, intermediaries are commonly used to improve the efficiency of the arrangements made. The arrangements are frequently opaque, usually with good reason. An intermediary can add value by securing the right contacts, guiding the seller through unfamiliar bureaucracy, or by acting as an agent in markets that are only serviced when excess volumes m'e produced in New Zealand. In this case, both buyer and seller want to
.~ The optinlllill size of exchanges is very large. Some commentators (Nixon et ai, 2000; Sculley, 2000) consider that New Zealand is too small to support single product exchanges, and suggest Ihal either foreign partners nre required (as in GaFish) or that exchanges need to offer multiple New Zealand based products
6 Cyberlynx currently e-procures IT equipment. office supplies. and travel services. By July 2001 it will also e-procure
administrative supplies, fleet management. engineering supplies. property services, telecommunications. energy, marketing, printing. cleaning and wa:-;te management. The initial four month trial produced savings of 7 to 15% in procurement costs (iSlnrt.2001).
retain the opaqueness of the price setting process. E-commerce is likely to limit opportunities for such "co-operation".
The fall in transaction costs generated bye-commerce, lowers the optimal size of firms and therefore barriers to entry, allowing new entrants into the mm·ket. This has the potential to increase innovation and responsiveness to market signals in agriculture. Whether this enhances new business opportunities, or competes away returns to farmers, is a matter of strong debate.
In short, Nixon et al raise the possibility that e-commerce will transfer wealth from sellers (in New Zealand) to buyers and consumers (overseas).
Stoke et al (ibid) agree that e-commerce introduces a risk of downward pressure on prices. They suggest that the price erosion potential of e-commerce arises, at least in part, from the rigidities in the current market channels for many New Zealand products. These rigidities include regulation, industry structure, skills, motivation, and entrenched interests. They conclude, like Nixon et al (2000), that the meat industry is particularly at risk.
Does E-Commerce hold Any Promise for Agriculture?
Nixon et al (2000) indicate that there are two ways in which agri-businesses may be able to avoid or at least slow the erosion of margins. Firstly, businesses may take advantage of the increased ability to trace product in e-commerce (with all the accompanying product information). Since consumers are demanding traceability in many cases, there may be scope to add a price premium to niche traceable agricultural products. E-commerce seems to be particularly well suited to facilitating recurrent idiosyncratic transactions (Williamson, 1985). Products could migrate from being a non-specific good (e.g., the current wool auction system) to the idiosyncratic category (e.g., Woolnet).
Secondly, their large size could allow some New Zealand exporters to tailor ecommerce arrangements to their own needs (particularly in the dairy industry, where New Zealand is a major world trader).
Stoke et al (ibid) are more bullish in their assessment of the potential of e-commerce for the primary sector. They argue that e-commerce provides an opportunity to achieve price premiums through product differentiation and customisation, provided that producers are willing and able to take up the opportunity. Although differentiation and customisation can occur without e-commerce, it provides the opportunity to more easily make contact with buyers anywhere in the world, and tailor product specifically to buyer needs. Points of differentiation may include product specifications, payment terms, branding, delivery and relationships between seller and buyer.
Stoke et al (ibid), consider that e-commerce increases the opportunities available to farmers and growers. Firstly, they will be able to develop a much better understanding of the attributes for which buyers are prepared to pay a premium, whether described in terms of quality of goods, or nature of service. In addition, the increased transparency provided bye-commerce allows producers to make an informed assessment of the skills required and the risks, potential returns and costs of
I\) (D
each option. Growers/farmers will have the option of retaining ownership of their product further down the value chain than they cUlTently do (buying in any processing services required), so as to establish closer contact with end-customers and a greater share of the margin available to the value chain.
In some sectors this opportunity is constrained by the need for aggregation (e.g., dairy) or structural issues (e.g., meat, kiwifruit). Outlands Exporters, for example, found that they could not have their meat products processed and returned to them for marketing - they were forced to lease or acquire processing plants. Where product is compulsorily acquired, producers may be unable to participate in ecommerce, although their marketing body may be able to do so. With product that must be aggregated, such as lnilk, it may be difficult if not impossible to provide traceability, which would enable marketers to differentiate product on the basis of the attributes of a pmticular farm or area from which the product is derived.
Great Expectations?
Stoke et al (ibid) summarise the impacts of e-commerce on the rural sector as follows: • input prices (supply), transaction costs and service providers' need for working
capital will reduce;
• the sector will benefit through better access to markets and better marketing information. Farmers and growers will find that they have more choice in how they interact with their markets and service providers;
• e-commerce introduces a risk of downward pressure on prices as market power moves to buyers, but also provides an 0ppOltunity to achieve price prelniums through product differentiation and customisation, provided that producers are willing and able to take up the oppOltunity;
• new services will be needed, ranging from online market exchanges to celtifying organisations;
• there may be a negative impact on small rural businesses that are unable to pm·ticipate in online pOltals, and there is likely to be increasing difficulty with rural distribution mTangements.
Federated Farmers also believe that e-commerce has the potential to enliven and repopulate rural areas, with the establishment of non-agricultural on-line businesses in rural areas (Stoke et aI, ibid). To a limited extent this is already happening in areas such as the Marlborough Sounds, where a publishing company is based (http://w...".w.C9nt<l£tS.co .. )1z/). along with a website designer (http://www.amtis.coml) and an art gallery (hJJP://www.jJJ~g<l1lITy.co.nz/) which allows for the buying and selling of mt works on-line. Rural tourism enterprises also use the Web (e.g., see http://www.picton.co.nz/).
However, there are substantial hurdles in the way of the primary sector, before the benefits of e-commerce can be reaped. Critical hurdles include the inadequacy of the rural telecommunications infrastructure (Atkins, 2000; Squire, 200 I), a profound
resistance to change in some sectors, a lack of skills and motivation (Botha et aI, 2001), and institutional and regulatory inflexibility.
EXAMINING THE EVIDENCE
There is little evidence to date with which to evaluate the impact of e-commerce on the primary sector. The following thumbnail sketches of a range of primary sector e-commerce activities illustrate the types of enterprises being established. Other than Southfresh, none are more than two years old, but all claim benefits from the ecommerce approach.
Woolnet
Woolnet (http://www.woolnet.co.nz)wasestablishedinI999.Itis an open trading system for wool, and is a subsidiary of Woolpro. The wool sector is characterised by a large number of sellers (16,000 farmers) and a small number of buyers and processors. Traditional selling involves a long disjointed value chain, with limited communication between farmers and consumers. Woolnet was established to lower transaction costs, improve information flows, and allow for sale and purchase regardless of time or location of buyer and seller. Key features may be summarised as follows: • growers can offer wool from the farm or use a service provider • sales can be made on a spot or forward basis • prices can be fixed by the seller or negotiated • terms and conditions may be standard or negotiated • payments are fully integrated and paperless • Woolnet operates 24 hours a day, 7 days a week • Woolnet is integrated with wool testing labs.
The grower/seller has more market power when selling through Woolnet than in an open cry auction, because they can hold out for better prices more easily, and can customise their product to meet buyers' needs. Woolnet currently have over 1100 registered users, and $5 million of business has been carried out on the site in the last 9 months (Maclean, 2001).
Woolnet has long held the view that it should be part of a larger portal for New Zealand agriculture, and in May formed an alliance with Fencepost.com.
Lignus:
Lignus (www.lignus.com) is an e-market place for trading timber that opened in October 2000. It is a negotiation based B2B exchange, built in co~unction with the NZ Timber Industry Federation and the Australian Forest Products Association. Each seller has their own private "workbench", where they specify currency, terms, product they have to sell, and whom they want to send offers to (ie, it is not transparent to all potential buyers). Terms, product specifications, and price are negotiated via the site. When agreement is reached with a buyer, negotiations are closed and pro forma documentation is generated on the Net.

(0) o
In mid-June the site claimed to have signed up companies from 17 countries, 10 forest owners, 43 sawmills, 3 panel mills, 2 plywood/veneer mills, 32 remanufacturers, 40 wholesalers, and 25 retailers. Recently the company was awarded the Forest Research Technology Award.
An alternative site jy:w~y,woodnet.co.nz (established by a forestry consultant in partnership with KPMG) was not yet on-line in mid June.
RDl.com
RDl.com is the rural merchandising subsidiary ofNZ Dairy Group. ASB Bank and NZ Post are minority shareholders in RD I.COM. Established in June 2000, it provides information on suppliers' milk production and quality (password protected), chat rooms, expert advice on farming problems, farm-related news and weather forecasts, and the ability to purchase a wide range of farming supplies under the Anchormart brand. Preferential prices for computers and internet access are available through the site. NZDG took the opportunity to introduce electronic inventory management and centralised purchasing and deliveries for its 27 Anchormart stores as part of the development of RD I.com.
Fencepost.com
Fencepost.com is owned by the Kiwi Dairy Company. It focuses on providing information to farmers (including password-protected information on milk production and quality). As well as Fencepost's alliance with Woolnet, collaboration between Fencepost and Dr Global (the web based medical service http://www.doctorglobal.comlbasedinTaranaki)wasannouncedinMay2001.to provide medical content of interest to farmers on the Fencepost site. A livestock exchange (Live.ex) is also provided on the site, on which buyers list details of the livestock they require, and sellers list details of the livestock they have for sale. Reports are generated for both buyers and sellers that show the best matches, but the transaction is not completed on the site. There is a listing fee for the service. Australian site www.thefarmshed.com.au/index.jhtml and consultant group McKinsey and Co have interests in Fencepost.
With the announcement of the merger between Kiwi and NZDG, RD I.com and Fencepost.com are working through the process of merging the two sites. The merged site will have a combined user base of more than 20,000 people.
~.!!thfresh
Southfresh (www.southfresh.co.nz/index.htrnl) began life as a fish wholesaler, but has gradually increased its involvement in e-commerce to B2B sales of nursery plants, apples and fish. The frrm is now established as a neutral exchange (ie, any buyer or seller can use the exchange - for a fee) specialising in perishable products, as well as a software developer.
Go Fish
Sanford, a New Zealand based fishing firm has joined a seafood alliance (bllp~Lwww.s~afQQg1lJ)jalL~.com/) with major fishing firms based in the USA, UK and Iceland, to purchase fishing supplies (but not at this stage to sell fish). The alliance uses the major fishing exchange www.gofish.com to purchase supplies.
A Selection of Other Sites
Flower growing firm Lilies by Blewden has operated www.1ilies.co.nz since mid-2000. It was established to provide better information to customers on flower availability (quantities, colours), and to simplify the process of ordering and delivering flowers. Prices are estimated by the grower to be 10-15% better than auction prices. The advantages to the flower buyer include not having to get up at 4 am to bid at auction, 24 hourl7 day a week buying, less wastage, and automated logistics. United Flower Auctions also offers Internet purchasing of flowers to florists and other flower retailers (www.buyflowers.co.nz).
Cambrian Meats (bJtP;/lwww.cambrianmeats.co.nz/index.htrnl) is owned by a Waihi farmer, and sells meat directly to restaurants, and more recently to the consumer via the Web. This business differentiates itself on health and quality grounds. A Woodville farmer has established Meat Direct (http://www.meatdirect.co.nz/) to sell meat via the Net in the Wellington area. A Richmond subsidiary, Gourmet Direct, also sells meat directly to the consumer via the Internet (http://marketplace.xtra.co.nz/cgi-biniGourmetDirect.storefront).
Grazing Systems Ltd (www.grazingsystems.co.nz) provides a farm management decision SUppOlt system to subscribers via the Web. The site allows agribusiness and farmers to access linear programming models to analyse best resource use on pastoral based farms. The Internet enables any business to run these applications without upgrading either computer or programs. This site is on a SUbscription only basis, and has been in use for almost a year.
Wrightsons operates a site (http://www.wrightsons.co.nz/) which has a retail facility for farm supplies.
THE VERDICT
It is early days yet for e-commerce globally, and even earlier for e-commerce in the primary sector, so there is little evidence from which to draw a conclusion on its impacts. Given the advantages to buyers, it seems likely that the pressure on all producing sectors to participate in e-commerce exchanges will increase, and that the prices for products sold will fall. In the primary sector, it seems unlikely that any fall in input and transaction costs brought about bye-commerce, would compensate for the fall in output price. However, the opportunities for product differentiation and customisation, better access to markets and market information, and improved communication between buyer and seller offered bye-commerce, offer the potential to hold or even improve margins. Farmers may be able to exercise entrepreneurial
w .....
skills that until now have been stifled by the lack of opportunity to engage in marketing activity.
What evidence is there that farmers are able to achieve price premiums through ecommerce? Such evidence as is available is anecdotal or circumstantial at best. Lilies by Blewden claims a price improvement of 10-15% on auction prices. Woolnet continues to grow in terms of the number of participants and value of wool sold, albeit slowly, suggesting that at least some buyers and sellers see some advantage in participation. Cambrian Meats is expanding into the export market, and joining forces with venison and lamb suppliers, and a company producing gourmet pickles, sauces and preserves, to offer a more complete product range. Southfresh has no difficulty sourcing product, and provides sufficient advantages to both buyer and seller that both groups remain committed to the company.
In short, there is limited evidence of e-commerce' s success in achieving benefits for farmers. Nonetheless, farmers are unlikely to have a choice in whether they participate or not:
E-commerce is a steamroller- its progress is inexorable, we cannot stop it, we can only choose whether to be on the steamroller, or on the road. (pers. C0111111., Toby Warren, Southfresh).
In some sectors, farmers have the choice of being on the steamroller. In others, they have no choice but to remain on the road, because of the rigidities of the sector.
References
Atkins, T, 2000. Telec0111l11unications: Use, Constraints and Potential in Rural Areas. MAF Policy Technical Paper 00119.
Botha, N., B. Small and P. Crutchley, 2001. Addressing the digital divide in New Zealand. MAF Policy Technical Paper 200111 (in press)
Braddell, R., 2000. Ready to !ide the S curve into the trillions. New Zealand Herald, November I, 2000, p. E2.
Cochrane, W.W., 1965. The City Mans' Guide to the Farm Problem. University of Minnesota Press, Minneapolis, Mn.
Crocombe, G.T., M.J. Enright and M.E. Porter, 1991. Upgrading New Zealand's competitive advantage. Oxford University Press.
Deloitte Touche Tomatsu, 2001. Deloitte e-business sUlvey: insights and issues facing New Zealand business.
Finlayson, B., R. Lattimore and B. Ward, 1988. New Zealand's price elasticity of demand revisited. New Zealand Economic Papers 22:25-34
Gartner Group, 2000. The Digital Divide and American Society. Gartner Group.
IStart,2001. Friday Topic: E-procurement is big. Very, very big. http://www.istart.co.nzlindex.cfm?iid=0004568067811 B288EBEOOO 17F0088 W~Ql<!y
London Economics, 2000. The Group Trade Report.
MacLean, 1., 2001. Woolnet Update May II, 2001. http://www.woolnet.co.nzlFrameMain.asp?PageName-Content.asp?ScreenContent
Nixon, c., A. Sundakov and J. Feil, 2000. E-commerce and its projected impacts on agriculture. RepOit prepared by the New Zealand Institute of Economic Research for MAF Policy.
OECD, 2000. The Economic and Social Impact of Electronic Commerce. OECD Directorate for Science, Technology and Industry.
Scrimgeour, F. and W. Thurman, 1997. An economic analysis of agricultural marketing structures in New Zealand. Report prepared for the New Zealand Treasury.
Sculley, A., 2000. B2B exchanges. Paper presented at the E-Commerce Summit, November 1-3, Aotea Centre, Auckland.
Stoke, M., A. Aitken and J. Kerr, 2001. The implications of e-commerce for the primary sector. Report prepared for MAF Policy by Martech ConSUlting Ltd.
Squire, J., 200 I. Telec0111munications: it's all up in the air. Paper presented at the 7th NZARES Annual Conference, Blenheim, 6-7 July 2001.
The Economist, 2001. Is there life in e-commerce? February 3, p. 17-18.
The Economist, 2001. After the flood. April 21, p. 55-56.
The Economist, 2001. Special Report: the new economy - what's left? May 12, p. 83-86.
Tomek, W.G. and K.L. Robinson, 1990. Agricultural product prices. Third edition. Cornell University Press.
Wetenhall, P., G. Sutherland and R. Boven, 2000. After the land grab: B2B ecommerce in Australia and New Zealand. Boston ConSUlting Group.
Williamson, 0., (1985). Economic institutions of capitalism.
Co) I\)
ROADING REFORM: POLICIES, PROGRESS AND POTHOLES
Chas Perry MAF Policy, Nelson
May 2001
Note: The views expressed in this paper are those of the author, and do not necessarily reflect the official view of the Ministry of Agriculture and Forestly.
Abstract
Over the last seven years Government's approach to the potential reform of New Zealand's roading management and funding has ranged from the "big bang" reform approach to a more incremental change strategy. The approach may change, but there are still significant roading issues that need to be addressed. Their impact on the land-based primary production sectors and their processing potential needs to be considered. In 1994 the Land Transport Strategies and Network Funding discussion paper had the slogan "The right funding in the right place at the right time". How far have we progressed along this difficult road? This paper will review the progress to date, discuss the key issues facing roading infrastructure development and will give the author's views on the way forward.
Kevwords: policy, roading, government, reform.
Introduction
The issues surrounding road infrastructure development are not new and there have been many papers and studies evaluating the future transport requirements generated by an expanding economy. These have often focused on the tourism, forestry and dairy industries.
In 1987 Clough and Meister stated that: "Some regional councils have identified a particular "problem" arising from a heavy increase in logging traffic on their roads at some future date: their revenues from rates and other sources may be insufficient to maintain their roads at the current standard". (Clough and Meister, 1987).
Fourteen years later, the problem "at some future date", is now today's reality, and also includes dairy tankers, tourist buses and congestion.
Over the last 7 years, Governments have tried to grapple with the issues of road funding, planning for future demand and management options. While some progress has been made, there is now a broad consensus that New Zealand is facing major problems in the land transport area and these problems need to be urgently addressed.
Policy Deyeloument 1993-1999
In 1993 the Ministry of Transport began a project which sought to establish the true costs of road-use and to explore ways of ensuring road users met these costs more directly. A very extensive consultation process was undertaken, based on a series of eight discussion papers, released between July 1994 and May 1997. (Ministry of Transport, 1994, 1995a&b, 1996a-c, 1997a and Transit New Zealand, 1996).
In 1997 the Government appointed a Roading Advisory Group which was instructed to recommend to Government the essential components of a new road system. These recommendations built on the work of the discussion papers and in particular consideration of the submissions to the discussion document Options For the Future (Ministry of Transport, 1997).
The Roading Advisory Group released its report, Road Reform the Way Forward, in December 1997 (Roading Advisory Group Final Report, 1997). There was a major response to this report and over 13,000 individuals and organisations sent in submissions.
The final discussion paper Better Transport, Better Roads was released in December 1998 and proposed a new road management system (Ministry of Transport, 1998). Over 1100 submissions were received on this paper in April 1999.
The road reform consultation and analysis process between 1993 and 1998 was a very demanding task for the Ministry of Transport. Adding to this workload was the proposal to develop a National Land Transport Strategy, with the first workshop held in October 1996 involving 52 representatives from 42 organisations. This was followed by a second workshop in June 1997. In October 1997 a National Land Transport Strategy Draft Discussion Document was released with submissions due in late December 1997 (Ministry of Transport, October 1997b).
Based on the five years of consultation and evaluation of road management and funding options, the National Government's blueprint for the road reform proposals included:
The development of a National Land Transport Strategy. A proposal to replace the 75 roading authorities (local authorities and Transit New Zealand) with five to nine specialist roading companies owned by the Crown (Transit New Zealand) and by local authorities. Rates would no longer be used to fund roads. Road companies would not be privatised. The introduction of toll roads and congestion pricing through the use of new technology. A greater variety of funding options to fund major capital projects.
With the submissions on the discussion paper Better Transport, Better Roads only being received in late April 1999, and the National Land Transport Strategy still as a draft, time was running out before the November 1999 election. The Government decided to delay any final decision and introduction of the prepared draft legislation
CN CN
on road reform. Time was needed to consider the Better Transp0l1, Better Roads submissions and there was still continuing opposition by local government to the "big bang" approach and the establishment of the five to nine specialist roading companies.
Policy Development 2000 and Beyond
The change of Government in December 1999 resulted in a change in approach.
The Labour-Alliance Coalition Government has stated that it will not proceed with the semi-commercial model for New Zealand's roads detailed in the Better Transport, Better Roads proposal. It is however acknowledged that a lot of useful material came out of the consultations and analysis undertaken by the previous Government.
The Minister of Transport, Mark Gosche, has indicated that an incremental change strategy to the reform of road funding and management is more likely and the Labour-Alliance Coalition Government are still developing their policies relating to the management and funding of roads. Labour's pre-election document on transport, Labour on Transport (Labour 1999), and subsequent presentations by the Minister of Transpor1, (Automobile Association Conference, Chartered Institute of Transport Conference, the Road TranspOlt Forum Conference and the New Zealand Taxi Federation Conference) indicate the areas likely to be targeted for policy development.
The Government acknowledges that there is a broad consensus that New Zealand is facing major problems in the land transp0l1 area and these need to be urgently addressed. The Minister of Transp0l1 and Ministry of Transport spent the first five months after the election consulting on a broad range oftransp0l1 issues with people in the transport and distribution sectors, industry groups and roading authorities.
Based on the Minister's presentations and his discussions with the above groups the potential policy approach for changes to the management and funding of roads would appear to include:
The need to stmt applying practical solutions to fix regional and national land transp0l1 problems. Changes in land transport will be incremental, based on a pragmatic approach. This could include consideration of whether the present management structure of 75 roading authorities can be improved. Shor1-term measures will focus on road safety, the environment and passenger transport. There is a need to develop a New Zealand Transport Strategy to set long-term direction. Examination of the way in which we charge for roads, including options that new technology could provide within the present Road User Chm·ges. It is noted that some of our systems for road charging may be starting to reach their limit and do not cater well for hybrid vehicles, gains in fuel efficiency and the increasing use of light diesel vehicles. New technology also provides the
potential to charge for road use based on the distance travelled by heavy vehicles and the weight carried. The Government favours roading management continuing to lie with bodies which are accountable to local communities. The clustering of local government's roading responsibilities is likely to be encouraged. Investment options in alternative routes through allowing developers to build roads on a build, operate, toll, and transfer back to public ownership basis. The need to move over time to improve road funding because of its significance to the economy and road safety.
There are some similarities between the two Governments on how they may approach the road funding and management issues. These include the need for a national transport strategy to provide long-term direction, improving the way we charge for roads through the use of new technology, the potential to improve the management structure of the roading authorities, and consideration of road investment options such as toll roads.
Perhaps the most important acknowledgement by both governments is that there is an urgent need to confront some difficult issues relating to the funding and management of roads.
Progress
Over the last seven years a number of reforms and initiatives relating to the funding and management of New Zealand's roading infrastructure have been completed. These include:
creation of Transfund, the Land Transport Funding Agency, from 1 July 1996, introduction of competitive pricing for most road related public works, the collection and analysis of large amounts of data relating to road funding, management, environmental and safety externalities and the preparation of a national traffic database, work into weight and dimension rules for heavy vehicles, Transit New Zealand's development of the Auckland State Highway Strategy that will cost $100 million per year for the next ten years, the development of a draft 2010 - Road Safety Strategy, and a local and national government focus on those regions with the most urgent roading needs. For example, the Integrated Transportation Study of the Tairawhiti region comprising Gisborne District and Wairoa District.
New Zealand is ahead of many countries in the way our roads are funded and managed. There are, however, some very key fundamental issues that still need further consideration.
Key Issues for Roading Reform
If solving the issues relating to the funding and management of our roads were easy it would have been achieved many years ago.

Co) ~
The complexity of the issues both from an economic and political point of view should not be underestimated. While not professing to have all the answers, I believe there are a number of key issues that need to be addressed.
A New Zealand Transport Strategy
A New Zealand Transport Strategy should set out the Government's strategic direction for the transport system with regard to long term policy, administration and funding goals. Past experience with the development of a national transport strategy is that the process can be drawn out especially if wide consultation is to be achieved.
This can result in policies being developed and decisions made at the same time or before a strategy is fully developed.
The early development of a New Zealand Transport Strategy sho'uld be a key component in any road reform process. If it is not developed early in the process then the value of the Strategy is open to question.
Rates
The required level of local authority rates input into land transport funding is increasingly recognised as an impediment to local roading infrastructure investment. A major reduction in the use of property taxes as a funding source for carriageway development and maintenance would remove significant distortions and inequities. I can find no justified relationship between the value of a property and the use that the landowner makes of the roading network. In my view, replacing most of the rates funding with user charges is a key requirement to future road funding mechanisms.
This could require; the funding of the road calTiageway from road user charges, the funding of footpaths, roading amenity areas, pedestrian access from rates, the discretionary spending on "upgrading" of road caniageways above normal requirements from rates, ego Cobblestones on road through shopping areas, and a very transparent process to ensure road rate reduction at least equates to the additional funding from road users.
Any change to the funding system would need to consider the impact on the whole road management and funding system as shown in figure I.
Figure I Road management and Funding System (Source: Ministry of Transport)
National Roads Fund
Accident Transfund New Zealand
Compensation New Zealand Police
Highway Public Transport Infrastructure
(Bns lanes and High Occupancy Vehicle lanes
Regional
Councils
Subsidised Public Transport
(contracted bus, train I ferry services
Road construction
and maintenance
Other Alternatives to Roading
(eg barging of logs)
Safety (Administration)
Programme
Land Transport
Safety Authority
Territorial Local
Authorities
Public Transport Infrastructure
(Bus lanes, HOV and bus stations)

w UI
Excise Duty
It is inequitable that about 54 percent of the excise duty from petrol goes into the Crown Account for activities that have nothing to do with road use, compm·ed with diesel where all Road User Charges (RUC's) go into the National Roads Fund. (Refer Figure 2).
Submissions on past consultation discussion documents have highlighted that retention of pm·t of the fuel excise tax on petrol for general government revenue is seen as a major obstacle for acceptance of any new road funding proposals. The fuel excise tax creates inequities between diesel and petrol vehicle users and with other transport modes. The GST component of the excise duty used for general government revenue is seen as a tax on a tax.
In my view, a strategy for eliminating the proportion of fuel excise tax used for general government revenue needs to be developed. This could be implemented over a transition period as the size of the tax ($600 million) is too large to eliminate over a short period.
Figure 2. Petrol Fuel Excise Tax Distribution. (Source Ministry of Transport December 2000)
Local Authority Petrol Tax
0.66 centsllitre
ACC 2.000
centsllitre (5.7%)
Petrol Motorist Petrol
Fuel Excise 34.985
centsllitre
National Roads Fund 13.525
cents/litre (38.7%)
Crown Account 18.775
centsllitre (53.7%)
Petroleum Fuels
Monitoring 0.025centsllitre
«1%)
Often the excise duty on petrol that goes into the Crown Account is defended as an efficient tax mechanism, or is justified as a proxy for the environmental externality costs of cars. It is however, only charged on petrol.
If any group of motorists (petrol, diesel, heavy or light vehicles) are not paying the true costs of using the roading network then transparent, and justified, charges need to be developed.
Borrowing
The current Pay As You Go system for road funding does not support forwardlooking long-term investments. The legislation allowing Transit New Zealand to borrow capital for major projects already exists but has never been used.
In principal, roading authorities should be able to borrow for major roading developments and upgrades. The prospect of75 roading authorities all borrowing funds may not be the most efficient outcome and in my view there would be a need for a national framework related to borrowing and priorities.
If borrowing for major capital works could be organised through roading authority clusters, this may provide a more robust management structure.
Clustering of roading authorities
New Zealand has 75 road providers, 74 local authorities and Transit New Zealand. The Labour Party pre-election document on transport questioned if some aggregation of the current providers might lead to better outcomes for land transport users and the community.
Labour's pre-election document (Labour 011 Transport) stated: "Labour wiJI consider the regional clustering of local governments roading responsibilities."
Clustering of roading authorities raises a number of questions and policy options that would require vigorous analysis. The issues include the size of cluster, the inclusion of State Highways and local roads (along the lines developed in the Marlborough Roads structure) and the role of rates funding in clusters involving a number of local authorities.
There is the potential that clustering may result in some of the predominantly rural districts with large roading problems and funding requirements being excluded from the clusters. The approach to clustering also needs to recognise that the road network, in most circumstances, is a natural monopoly of strategic importance and the network propelties of the total roading system need to be considered.
I question the need for 75 roading providers in a country the size of New Zealand, and clustering of roading authorities could result in financial and administrative advantages.
Co) 0)
Clustering will however only take place if there is a desire by roading authorities to work together. Only recently, Tasman District and Nelson City could not even agree on the timing to update their combined Regional TranspOit Strategy. It is now being updated for each local authority area over consecutive years!
New Technology for Road Charging
The use of new technology (Global Positioning Systems and Load CeIls) for road charging would appear to offer the potential for a fairer and more efficient way of charging for road use.
One of the first steps for the introduction of new technology could be the replacement of Road User Charges for heavy vehicles with charges based on weight caITied, type of road used and distance.
The use of new technology also has the potential to introduce a more neutral charging mechanism between LPG, CNG and possibly hybrid vehicles and can also be used for congestion pricing to charge motorists at higher costs for peak time travel.
Before changing to new technology charging systems there is a need to ensure that compliance costs are not excessive, that it is used in an equitable way, and that national coverage is available.
Impacts of the Primary Production Sectors
Farming and forestry organisations have strongly supported the need for reform of road funding and management. Statistics New Zealand data shows that the primary production sector accounts for over 63 percent of total exports for the year ending December 2000. The rural road that provides access for agriculture or forestry products to a processing plant or port is as crucial a part of the network as the urban motorway.
Some of the key views supported by the primary production sectors are; the need to adhere to the network principal for roading infrastructure, which emphasises the importance of low volume roads as part of the network, rates should not be a major funding mechanism for roads, the use of new technology to enable replacing road user charges and fuel excise tax mechanisms, all charges on road users should be used for the maintenance and development of the road network and associated externality costs, as social services such as health and education are increasingly centralised, the maintenance of rural roads to access these services is an essential part of the social structure of rural conununities, and the number of roading authodties is questioned.
Road reform does have the potential to impact on the primary production sectors and rural conununities. There is a need to ensure that our primary production sectors remain competitive through the provision of an adequate transport infrastructure. There is also a real need to evaluate the impacts on rural conununities of potential
reform proposals such as adopting new technology for charging and the clustering of roading authorities. One concern would be that if future roading funds were strictly aIIocated on road-use, this may disadvantage the lower use rural infrastructure development. The value of the whole network including the lower use rural roads needs to be considered when developing funding aIIocation policies.
"Potholes" to Progress
There are a number of "potholes" in the road reform journey that have the potential to slow down or even staIl the progress. CaIIing for the AA to help is not the answer!
I see six major "potholes" that need to be recognised.
(i) There is the potential to get swamped in a consultation overload as roading is a topic that we can all relate to and have a view on. Thousands of submissions in the past clearly show the potential. In my view the key issues have been well debated and the level of future consultation needs to be carefully considered.
(ii) The three-year Government election cycle has the potential to stall progress, change strategy direction and policy development. I believe an incremental change strategy approach will, to some degree, mitigate this potential impact.
(iii) Local roads are managed by 74 local authorities. Parochial views, aspirations, and the three-year election cycle may, in my view, hinder the potential for voluntary clustering of local authority roading activities.
(iv) There is the potential to lose sight of the importance of the whole network and the role of low use rural roads. A reform process that does not adequately recognise the network properties of roading infrastructure will be strongly resisted by the primary production sectors.
(v) With any change of road funding will come the question of equity with other transport modes, in particular rail.
(vi) The identification of environmental externalities, their impacts, and detennining the appropriate charges on motorists is a difficult issue that needs to be addressed.
The Way Forward
"We can't solve problems by using the same kind of thinking we used when we created them." Albert Einstein
If we are looking for practical solutions and a pragmatic approach to roading infrastructure development my views on the way forward would focus on the following.
There is an urgent need to develop a high levelland transport strategy, to at least give some direction to governments strategic direction for the transport system with regard to long-term policy, administration and funding goals.

Co) .....
Past consultation and CutTent Government objectives should form its basis. If the development of a strategy is lengthy, due to protracted consultation and debate over wording, then its value will be lost considering the urgency required for some major policy decisions. An 80:20 rule approach needs to be used.
The approach of focusing now on some of the key congestion issues in Auckland and regional demands in Gisborne/Wairoa and NOlthland is seen as a pragmatic approach and a positive step forward. The focus on these "hot spots" should not however direct attention away from the need to confi·ont the difficult national issues relating to the funding and management of roads. There needs to be a national solution to our roading infrastructure problems.
I believe there needs to be a major change away from rates funding for roading which is unsustainable in the long-term and represents an impediment to local roading infrastructure development. Replacing most of the rates funding with user charges is a key requirement to future road funding. Such a change is not easy to implement and will require the use of new technology and a willingness by local authorities to change.
In my view there are advantages in reducing the number of roading authorities, however I favour the national state highway network being managed by one authority, Transit New Zealand. There are many examples where the combining of roading authorities would appear quite logical. For example, Nelson City and Tasman District, Kaikoura and Marlborough Roads, Clutha and Southland Districts, Greater Auckland area, and Western Bay of Plenty and Tauranga City.
Finally, there needs to be a system where roading authorities can borrow for major capital works.
Finding a way forward is not an easy job. The vast amount of work undertaken by the Ministry of Transport, extensive consultation, and the information compiled on a range of issues does provide a solid platform to now move forward on some of the key issues in the funding and management of our roading infrastructure.
References:
Clough, PWJ and Meister, AD (1987) The Financial Implications of Forestry Logging Traffic on Rural Roads. Massey University, May 1987
Ministry of Transport (1994a) Land Transport Strategies and Network Funding
Ministry of Transport (I 995a) Land Transport Pricing Study, National Roading Account - The Cost of Roading Infrastructure
Ministry of Transport (J995b) Land Transport Pricing Study, National Roading Account - Roading as an Economic Good
Ministry of TranspOlt (l996a) Land Transport Pricing Study, Environmental Externalities Discussion Paper
Ministry of Transport (1996b) Land Transport Pricing Study, Safety Externalities Discussion Paper
Transit New Zealand (1996) Land Transport Pricing Study, National Traffic Database
Ministry of Transport (1996c) Road Management Options for Reform
Ministry of Transport (1997a) Options for the Future Land Transport Pricing Study
Ministry of Transport (I 997b ) A National Land Transport Strategy Draft Discussion Document
Road Advisory Group Final Report (1997) Road Reform the Way Forward
Ministry of Transport (1998) Better Transport, Better Roads
Labour on Transport (1999) Pre-election document Labour on Transport, October 1999
w QI)
Maori, the Crown and the Governance and Management of Assets
Catherine Iremonger and Frank Scrimgeour Department or Economics, University orWaikato, Private Bag 3105, Hamilton
New Zealand Abstract: The governance and management of iwi assets is a major challenge for many iwi. The challenges related to optimal investment and consumption decisions, appropriate allocation of profits, and appropriate employment of iwi labour and human capital, However the challenges are further complicated by the history of Crown involvement and communal ownership, Critical Crown involvement has involved the Maori Trustee, The Maori Trust Boards Act (1955), The Maori Community Development Act (1962), Te Ture Whenua Act (1993) and ongoing change in Te Puni Kokiri and its predecessors. Communal assets ownership is characterised by overlapping sets of Trusts and [ncOlporations. This paper documents the historical developments of the current governance arrangements, described the current mix of governance arrangements and highlights current areas of debate as [wi leaders, managers, and beneficiaries seek to enhance their peiformance.
Keywords: Maori, Crown, Government, management, Trust Boards
1. Introduction:
The interplay of Maori versus the Crown over the governance and management of Maori owned assets is a long and talked over debate, that is riddled with a number of issues regarding the fair and just development of the Maori people.
Since the signing of the Treaty of Waitangi, Maori have not thrived economically. The relationship between the Crown and Maori had been strained. There has been numerous inequitable decisions that have left the Maori people worse-off, and have helped to alienate even "friendly" Maori from their resources. In addition to resource alienation, struggling tribal organisational structures, a breakdown of Maori social norms, inappropriate decision-making, and undesirable social outcomes will have a large economic impact on the rest of New Zealand. Maori have been handicapped by policy and other inequities that have prevented them from developing and accumulating wealth to the same extent as other New Zealand ethnic groups.
Appropriate governance is a key to developing a constructive response to these challenges. The United Nations Development Program (UNDP,1997) defines governance as the "the exercise of political, economic and administrative authority in the management of a countries organisations or communities affairs. It is a neutral concept comprising the complex mechanics, processes, relationships through which citizens members, and groups mticulated their interest, exercise their rights and mediated their differences" (UNDP, 1997).
In this paper we focus on governance by Maori, but note the constraints placed by government and the Treaty ofWaitangi.
2. Governance and the Treaty of Waitangi
The Maori position is not unique compared to other indigenous people. They still have not been full assimilated or accepted as part of a nation. Loomis (2000) describes the Maori position as a "nation within a nation" that has been type cast by the Crown as a bleating "interest group" within the political economy arena competing with other interest groups for the same resources. Which often leaves Maori on the bottom of the socio-economic scale, similar to other indigenous people who's life supporting functions have been removed from development of natural resources.
Governance of Aotearoa (aka New Zealand) was given to the British Crown through the signing of the Treaty of Waitangi and gives certain rights and privileges to each partner. The Treaty formalised an arrangement, which allowed British citizens to settle in New Zealand under a form of colonial British rule and guaranteeing to the Maori people the protection of their precious possessions and the continuing ownership of, and control over their possessions for so long as they wished that situation to continue. The Treaty of Waitangi of 1840 reaffirmed Maori customary property rights by the words:
"Her Majesty the Queen of England confirms and guarantees to the Chiefs and Tribes of New Zealand to the respective families and individuals thereof the full exclusive and undisturbed possession of their Lands and Estates Forests Fisheries and other properties which they may collectively or individually possess so long as it is their wish and desire to retain the same iu their possession ... "
In order to suppress Maori, and to gain control over Maori assets, the New Zealand Settlement Act and the Suppression of Rebellion Act both passed in 1863 gave government wide ranging powers to confiscate tribal land. Tribes who actively or passively resisted surveyors or sales were regarded as rebels and their land confiscated (sometimes even if they were suspicion of being rebels). In that way the Crown was appropriated over 3 million acres (Durie, 1998).
Prior to 1865 the majority of the Maori world desired peace and the opportunity to continue with their pre war agriculture and economic activities. After 1865 Maori land development was considerably more difficult and the government had no intentions to re-establish the tribes as economic forces (Asher and Naulls, 1987).
The Native Land Act of 1865 established the Native Land Court. The initial role of the Native Land Court was to define the land rights of Maori people under Maori custom and to translate those rights or customary titles into land titles recognisable under European law. This act was the most vigorous in alienating Maori from their lands in that the misallocation of property rights, and aggressive purchasing policies aided colonisation. From 1954, it was called the Maori Land Court (Durie, 1998).
Issues surrounding governance can be seen in Table 1. Many Maori believe that the Crown have not successfully fulfilled their responsibilities. From a Crown
2
Co) CD
perspective, Maori are often viewed as an inconvenience, and as the Crown views themselves as owners of natural resources, they are able to allocate propelty rights. However this approach violates the Treaty and as such provides no useful framework for policy.
Table 1 I d' . New Zealand Maori Perspective Crown Perspective
Maori tribes are seen as tangata whenua Maori are an interest group (people of the lruld) and owners, The Crown are owners of natural The Crown were given kawanatanga resources (governance) or management. The Crown is able to allocate property The Crown hasn't done a very good job rights. at it well where Mami are concerned • The Crown has sovereignty over
• The Crown is responsible for many resources. social, environmental and econOlnic problems through insidious policies
detrimental to Maori. Maori want to self-determination there future.
3. Tribal Structure and Governance
Originally, governance of Maoridom was through the tribal structure. The traditional tribal (iwi) structure was controlled via a system of paramount chiefs, chiefs, and nobles, who organized lay and technocratic people into various tasks. As tribes grew branches split off to form sub tribes named" hapu", that were localized in a particular region. These hapu (through there kinships with the main iwi) would collaborate for various issues and events. The hapu would contain a cluster of Marae or pa (fortified villages) that would house various families (Figure I).
Social cohesion between the various marae and hapu within the iwi structure would require representation of marae and hapu at the higher level of decision-making. This meant that representatives (mainly respected elders Kaumatua and Kuia) from the various marae would meet with others in the same hapu to form a hapu runanga (sub tribe council). Major issues regarding several hapu within a region would require a higher level of decision-making. Representatives from the hapu runanga (Subtribal council) combine to discuss iwi issues and to formulate decision-making strategies.
Iwi Two representatives elected for Iwi form each hapu /
Hapu + ~ Hapu
2 representativeslo~pu from each marae \
Marae marae
1\ =&,m, marae marae
Figure I. (wi Tribal Stmcture (New Zealand Committee on Maori Trust Boards, 1994)
3
4. The Maori Trustee
The position of the Maori Trustee was created by legislation in 1921 to administer Maori land by putting into production so called "redundant" Maori land that was seen to have "absentee" landholders (TPK, 2000a). Currently the Maori Trustees Office comes under the Maori Trustee Act 1953 and is administered by Te Puni Kokiri. In many cases, land was leased out (without the land holders consent) on perpetual leases without inflation-proofed rents, and without the requirement of the lessee to uphold the value ofthe property (Sullivan, 1995).
Monies accumulated from the leases are held in trust at the Maori Trustee Office for landowners to receive. But as generations have past, ownership has not remained transparent, and fragmentation of shares has occurred leading to them being uneconomic and reduces Maori purchasing power for life supporting services (eg. housing, clothing, food, or energy).
The Maori Trustee and the Maori Land Court is also responsible for overseeing the running of the Trusts created under Section 438 the Maori Affairs Act 1953 (refered to as 438 Trusts). Section 438 Trusts that existed when Te Ture Whenua Maori Act 1993 came into force were renamed "Ahu Whenua Trusts" by the Act. Ahu Whenua Trusts are established under Section 215 of the Act. Trustees are appointed by beneficial owners to develop freehold land.
The Maori Trustee is also responsible for Maori Reservations, and trusts and incorporations formed under the Te Ture Whenua Act 1993. These trusts and incorporations form an important part of the current day Maori economic base, and are usually responsible for larger areas of multi-owned land, forestry, and other resources.
A recent development was the creation of the Federation of Maori Authorities (F.O.M.A.). FOMA is a national association of Maori businesses, which are mainly land based, eg, land incorporations, Section 438 Trusts, etc (Ministry of Justice, 1997: Rose, Sanderson, Morgan, Andrews; 1997)
Legislative changes in 1997 and 1998 regarding these Maori Reserves Lands gave little prospects for landowners with respect to being able to control and utilize their own lands, although lessees said that they were eventually willing to pay market rentals (TPK, 1998).
5. Maori Trust Boards Act 1955
Maori Trust Boards were established to administer compensation monies paid by the New Zealand Government to various Maori Tribes in settlement of unjust/illegal land confiscations, lands disputes, lake ownerships and similar grievances under the Maori Trust Boards Act 1955. However, a number of individual Acts of Parliament were written to deal with individual Tribes compensation before and after this legislation.
4
01:0 o
This paternalistic Act gives wide ranging powers over the activities of Maori Trust Boards to the Ministry of Maori Affairs. This has impacted investment decisions and financial management to the detriment of the economic wealth of the Trust Boards. The design of these Trust boards has conflicted with existing tribal structures and resulted in resentment amongst Maori traditionalists.
The New Zealand Committee on Maori Trust Boards undeltook a review of Maori Trust Boards in 1994 and found that " ... it would seem that the Crown had always experienced difficulty in coming to grips with the problems of fragmentation with rentals, its inability to define and identify the true owners of assets in many cases to ascertain the whereabouts of the owners or their successor. And so the problem was handed over to Maori. The Crown opted to pay compensation as a convenient means of solving fragmentation".
Thirteen Trust Boards were created between 1924-1958 and one in 1981 under the Maori Trust Board Act 1955 (New Zealand Committee on Maori Trust Boards, 1994).
Most Trust boards were set up to facilitate the settlement of Crown breaches of Article II and a few others were set up to facilitate the crowns obligations under Article III of the Treaty ofWaitangi.
Compensation was either paid via an annuity or lump sum payment. Trust Boards that received lump sum payments invested in farms, building and so forth. However, the compensation paid was less than the major resource loss that the tribes had lost in the past. Tauranga Moana received a lump sum payment of $250,000 for full and final settlement in 1981. This compensation barely covers 1% of the total resources lost. Also Trust Boards that accepted compensation as annual perpetuity payments were forced to accept compensation that is not inflation proof when other costs of living were rising (Sullivan, 1995; New Zealand Committee on Maori Trust Boards, 1994).
The Te Arawa Maori Trust Board who were set up in 1924 to claim the Rotorua lake beds also complained how government environmental mismanagement lead to the pollution and eventual devaluation of the lake assets. This has lead to a loss of food resources, and lowered the human use of the lake.
Some Iwi were subsumed into other tribes and other iwi trust boards without a tribal mandate causing major conflict within the operations of the Trust Boards (TPK, 1998).
There is a consensus from beneficiaries that Trust Boards are accountable to beneficiaries for the administrations of tribal assets, yet legislation demands that accountability must be to government. In effect the Maori Trust Boards are statutory bodies serving the governments, but also formally gave legal representation for Maori Iwi with respect to Treaty issues.
There were 13 Maori Trust Boards constituted priori to 1981 -which are referred to as the Raupatu Boards and 6 other were created under the 1955 Maori Trust Board Act to secure recognition for iwi, take up an order to pursue Treaty of Waitangi claims, so
5
that an iwi representation body should be enshrined at the highest level (New Zealand Committee on Maori Trust Boards, 1994).
In the end, Maori felt shackled by the limitations imposed on the Trust Boards. They are concerned about the inadequate asset base of most boards and frustrated at the Crowns inability to increase the asset base by settling Treaty of Waitangi claims (New Zealand Committee on Maori Trust Boards, 1994).
In 1993, the Minister of Maori Affairs established a committee chaired by Judge Ken Mason to report on Maori Trust Boards issues, which were to advise:
• If the accountability to the Ministry of Maori Affairs were removed what would be the appropriate accountability of the Board?
• What recourse would be available to those whom a fiduciary duty is owed by the Board?
• What legislative framework would be appropriate for the fiduciary relationships envisaged in the above (TPK, 1998).
The Committees reported in August 1994 that there should be: I An iwi corporation act established 2 An Iwi commissioner appointed under the act 3 The Maori Trust Boards Act be repealed four years after the Iwi
Incorporate Act becomes effective 4 All Trust boards be required to re register under the new act 5 No board be able to reregister until it has prepared a constitution update its
beneficiaries rolls and proved it has an iwi mandate 6 The iwi commissioners role be to facilitate transition between acts and
monitor compliance with the requirement to be met by boards before re registration
Options for reforms included: • Amending the current act to replace the accountability to the Minister with
accountability to beneficiaries and require the Maori land court to oversee process, investigate breaches of the act, appoint members, remove members, and make accounts available for beneficiaries for transparency.
• Repeal and replace the Maori Trust Board Act with a Iwi Incorporation Act (as proposed by the Mason Committees).
o Establish office of the iwi commissioner to approve registration of Boards under the Act.
o Prerequisite criteria for incorporation promotes prudent asset management, requires accountability of boards to beneficiaries and establishes frameworks for validation of iwi representation and mandate.
• Amend the current Act making provisions of Board specific charters o Require board to develop and register charters o Maori Land Court would:
Register charter Verify charter had support of iwi Hear and make determination regarding objection to registration Resolve disputes re: procedures set out in charter
6

,J::o .....
Receive and make accounts available to beneficiaries • Repeal the Act and replace it with legislations, which require the Boards to
reconstitute under other applicable legislation enable the new entities to obtain recognition as the Authorities representative's of the I wi (TPK, 1998a).
Some iwi want to scrap their Trust Boards and replace them with iwi incorporations to allow for more accountability to the beneficiaries (and not to Ministry of Maori Affairs). It is hoped that this will lead to greater economic development for Maori (New Zealand Committee on Maori Trust Boards, 1994).
Some iwi suggest that the Maori Trust Bpard Act 1955 be disbanded and replaced with a traditional marae-based Runanga structure. Many iwi preferred the establishment of "iwi incorporations" under a new Iwi Incorporation Act. However, there were concerns raised about the likely cost of reform for what they referred to as cash strapped iwi organizations. Some suggested there be several iwi commissioners, one for each Maori land court district.
Some issues that were gathered in the Mason Review were: • Regional structures- the Crown has neither the human nor financial means to
be able to address and deal with the raft of individual hapu issues as they arise. • Urban Maori-need a structure that will benefits all Maori as urban Maori
populations are growing • Maori Trust boards and the Treaty ofWaitangi
In 1996, small amendments were made to the Maori Trust Board Act allowing more leeway for Maori Trust Boards to have more control over their own destiny. Current reviews are being undertaken by Te Puni Kokiri to look at reforming Maori Trust Boards even further (TPK, 1998a-d, 1999a).
6. Maori Community Development Act 1962 The Maori Community Development Act supercedes the Maori Social and Economic Advancement Act of 1945, and provides for the establishment and functionings of the Maori Association (NZ Maori Council, District Maori Councils, Maori Executive Committees, Maori Committees, and also the appointment of the Maori Wardens)(TPK, 1999b). This Act's goals were to increase social and human capital by:
• Promoting social and economic advancement of Maori • Promoting harmonious and friendly relations in the community • Promoting Maori well being • Collaboration with government deplUtments on vlU'ious matter including
employment, education, training, housing, and health.
The Act allows for a four-tiered Maori Association Structure of which they are body corporate entities (Figure 2)
7
NZ Maori Council
I District Maori Council
I Maori Executive Committee
Maori Committees
Figure 2: Four Tiered Structure of Maori Associations.
TPK undertook a review of the Maori Community Development Act 1962, which commenced in January 1998. A key objective of the review was to identify how the Act could be updated to meet the challenges of Maori development, and in particular, promote and facilitate the development of Maori communities into the 21" Century.
A comprehensive consultation process was developed to review the progress. At various stages during the review process, nationwide hui were convened, working groups organised and key individuals interviewed. Based on the consultation undertaken, a number of amendments were proposed. These included, amongst other things, placing marae and other local Maori communities at the heart of the amended legislation, and providing structures and mechanisms to SUppOlt and facilitate the development of Maori communities in accordance with their own needs and priorities. Changes have also been made to the present District Maori Council and New Zealand Maori Council structure.
The New Zealand Maori Council is a national body involved in expressing Maori opinion on matters of importance to Maori. Membership drawn from delegates elected by nine district Maori committees (Ministry of Justice, 1997).
Cabinet approved proposals to amend the Act on 9 August 1999, following which instructions were issued to the Parliamentary Counsel Office to draft an amendment Bill (TPK 1999c).
6. lwi Runanga 1986-1990's
Devolution policy implemented in 1989 led to the division of the Department of Maori Affairs in 1989 into two agencies: the Ministry of Maori Affairs (Manatu Maori), policy oriented, and the Iwi Transition Agencies (Te Tira Ahu Iwi), to wind down or transfer departmental programmes to iwi.
The devolution policy government funded programs and services were shifted from central government to tribal organizations. The policy framework dispensed with the direct funding and provision of services to Maori by the Government, replacing this with the devolution of government-funded programmes to iwi authorities set up under the Runanga a Iwi Act 1990 (Sullivan, 1995).
8
.r:. I\)
Devolution aimed to enable Maori to use their traditional institutions and structures for designing and delivering their own programmes and services. The Iwi Transition Agency was to assist iwi in setting up and strengthening their operational base, while at the same time administering the programmes of the former Department of Maori Affairs until they were transfened to iwi authorities or other organizations (TPK, 1999c).
The policy of devolution meant that new legislation required providing government with adequate financial and accountability controls on those organization that would implement government programs under the Runanga a Iwi Act 1990 (Sullivan, 1995). But the new policy of devolution was not supported following the change of government in October 1990. The Iwi Transition Agency and the Ministry of Maori Affairs were disestablished and the Runanga a Iwi Act was repealed. However several trust boards that were established during this regime to take putt in delivering government contracts, still exist (Table 2) (TPK, 1999c).
.............. _ __ .... A ...................................................................... "" ........... _ ......... "' ......................... " ...................
Trust Board Beneficiaries Hauraki Ngati Hako, Hei, Paua, Patukiki, Maniapoto Maniapoto Te Runanga 0 Ngati Porou Ngati Porou Te Runanga 0 Ngati Whatua Descendent of Haumoangai tipuna of Ngati Whatua Wanganui River Maori Trust Board Descendents of Tama Upoko, Hinegaku and Tupoho Ngati Awa Ngati Awa
(Sullivan, 1995).
During 1990, the National Maori Congress (NMC) was established. NMC is a forum of affiliated tribes that presents a national Maori response to issues affecting the development of Maoridom (Ministry of Justice, 1997)
7. Te Ture Whenua Act 1993
With increasing pressure by Maori for self-determination the government introduced the Te Ture Whenua Maori Act in 1993. The aim of the Te Ture Whenua Maori Act 199,Lis the retention of Maori land in Maori ownership, to occupy develop and use their lands for their whanau, hapu and future generating provides owners with wider management options. The kaupapa recognises that Maori land is a taonga tuku iho to be held in trust of future generations (TPK, 1994).
S.l There are five types of Trusts: a. Putea Trust-These trusts are established to deal with any interests in Maori land or general landownership by Maori or shares in a Maori incorporation. These Trusts deal with small landholdings which have become difficult to administer as separate interests or whose owners cannot be identified or located. Before applying to the COUlt to form Putea Trust applicants must attempt to inform the owners in question and give those owners sufficient oppOltunity to consider and give those owners sufficient opportunity to consider the matter. Assets and income of the trust are held for community purposes. Preventing future succession to the land stops further fragmentation of the title (TPK, 1994).
9
b. Whanau Trust-Whanau trusts are designed to enable whanau to bring together their land interest and shareholding. Except for special circumstances, a whanau trust must be formed with the consent of all the owners and can be established in the name of a tipuna of the owners. Assets and income of the trust used to benefit the descendents of the tipuna named in the court order. Individual interests in the land are cancelled and the turangawaewae of the family is preserved.
c. Ahu Whenua Trusts These types of trusts are similar to the Section 438 Trust under the Maori Affairs Act 1953. The aim of these trust is to promote, help use, and administer land in the interest of owners. These trusts preserve individuals rights to succession. Existing 438 trust are now called Ahu Whenua trusts. The owners of the land who wish to establish a trust must have sufficiently opportunity to discuss and consider the application and must ensue that there are no objections (TPK, 1994).
d. Whenua Topu Trusts or Iwi Trust. Established for all or part of the land owned by and members of and iwi or hapu. Owners must have been able to discuss and satisfy the court that no objections. Assets and income of the trust are held for Maori community purpose for the general benefit of the members of iwi or hapu. No succession exists, however holders of large interest may apply to court to have those interest put aside for particular people. Income fi:om those interest would be paid to those specified people (TPK, 1994).
e. Kaitiaki Trust- are set up for people who are unable to manage their affairs through disability. Succession is preserved. A Kaitiaki Trust can be established for any interest in Maori general, or Maori incorporation or personal property to which the person in question is entitled (TPK, 1994).
(. Maori Incorporations Under previous legislation the owners were regarded as beneficiaries rather than landowners. Under the Te Ture Whenua Act 1993 owners in a Maori incorporation hold a direct interest in the land. The Act gives wider powers under the Act (more like standards corporations). Maori corporations who were previously restricted to limited activities, now can get involved in new ventures. This is done by treating different categories of land differently. Bought land can be treated as an investment or there can be and application to a court so the land forms part of the incorporate not affected by the restrictions of the Te Ture Whenua Act 1993. With Maori Freehold land, the Act imposes restrictions on how and whom it can be sold too.
The Act also imposes restrictions including: • Investigations must have approval of 10 % of people • Estate and Succession involves all Maori land • Distribution of estate limit succession to direct line of descendants of the
person making the will. High Court continues to play the lead role in the granting of administration.
10
.1:00 Co)
• Maori land is not available to payoff estate debts and liabilities only the income of such land can be assessed.
• Occupation orders to build houses on Maori land. • Changing titles • Partition, amalgamations, aggregations, exchange ownership, granting
easement, laying out roadings.
Maori Reservations can be set aside under the Te Ture Whenua Maori Act 1993 for Papakainga villages site, marae, fishing ground, timber, urupa (cemetery), reserves, places of cultural or historical interest.
When land has been set aside as a Maori reservation, it is vested in Trustees and must be administered in accordance with the Maori Reservations Regulations 1994. Trustees must be a body corporate of two or more people. Trustees don't have to be owners. The Trustees powers are determined by Trust orders under the Te Ture Whenua Maori Land Act1993 and the Maori Reservations Regulations 1994.
The Maori Reservations Regulations 1994 enhance the kaupapa of Te Ture Whenua Maori Land Act, which promote the retention of land for the benefit of the owners, and facilitate the occupation and development of the land for the benefit of the owners.
The Maori Reservations Regulations 1994 require a charter to drawn up by reservations trustees and beneficiary to decide and the regulations give some guidance as to the type of matters which they may want to include. There is some guidance as to the type of matters which they may want to include:
• Provisions for rotation of trustees, • Additional powers for trustees • A requirement for trustees to call AGM • More emphasis on accountability (TPK, 1994).
8.2 Income Generation off Te Ture Whenua Trusts and Incorporations Total income recorded for the trust and incorporation amounted to nearly $191 million for 1997/98. While the profit margin on sales is high for Maori trusts, they also have high liabilities. Hence, Maori Trusts find it difficult to get finance (TPK, 2000a).
Maori also find that banks and other financial institutions are unwilling to finance Maori because of the problems with multiple ownership and the inability to use Maori land under the Te Ture Whenua Act as collateral because its has to be retained by the land owners under the Act.
A Massey University analysis of the financial performance of 50 Maori authorities indicated that these organizations were characterised in general terms by moderate asset turnover, low production efficiency, high administration and managerial efficiency and low geming. Returns to owner's equity were low on average and this was reflected in low tax payments (TPK, 2000b).
11
Financial benefits to owners averaged 19.3% of after tax profits. Profitability level varied markedly among organizations which higher performing organizations were marginally higher" geared", than average the most significant factors were the higher levels of assets turnover and production efficiency (TPK, 2000b).
8.3 Review of Te Ture Whenua Act A Review of the Te Ture Whenua Act 1993 by TPK in 1998 asks whether the principle of retention is still appropriate. The review of Te Ture Whenua Maori Act 1993 was being carried out to honour an undertaking given in 1993 by the then Minister of Maori Affairs. The review's key objective was to find a way to make the Act more useful and effective, and in particular, make it easier to retain, occupy, develop and use Maori land. It was also to consider the role of the Maori Land Court in assisting the development, utilization, and retention of Maori land, and to examine specific Maori land issues already considered by review committees, such as multiple ownership, fragmentation of title, financing and succession. Finally, the review was to make recommendations for legislative and other changes considered necessary or desirable, in particular to enhance the effectiveness of the Act in terms of its capacity to facilitate the occupation, development and utilisation of Maori land (TPK, 1998, 1999c).
The Maori Purposes Bill 1999 was before the Maori Affairs Select Committee and aimed to remove obstacles that limit the occupation, development and use of Maori land. Te Ture Whenua Maori Amendment Bill 1999 was tabled in Parliament in late 1999 and is currently with the Maori Affairs Select Committee. The main thrust of the Bill is to reduce the interventionist role of the Court, which acknowledges that owners no longer wish to have the same level of supervision and intervention from the Maori Land Court. The Bill also proposes significant changes to make it easier for owners of landlocked Maori land to unlock their land through the Maori Land Court rather than the High Court (TPK, 1999c).
Te Puni Kokiri has formed a working group comprising representatives of education service providers to establish training unit standards for Maori land managers and administrators that may lack the appropriate managerial capability to make informed and proactive decisions. It is intended that these unit standards will form the basis for future trustee training programmes designed to improve the skills and abilities of existing and new trustee to manage the resources under their control effectively and efficiently (TPK, 1999c).
The Maori Economic Development Commission formed 1998 by Te Puni Kokiri was set up to close the gaps, to focus on Maori economic development, to provide policy on Maori, consult with community about development proposals, report to the minister and help mainstream agencies improve their programs for Maori. This Commission has developed a framework for Maori economic development called the Special Purpose Vehicle. It advocates facilitation of Maori enterprise to gain finance and the construction of a comprehensive database of Maori economic asset profiles (Maori Economic Development Commission, 1999). However, no strategies were established by the Maori Economic Development Commission to actually educate Maori into learning how to manage their own resources or businesses. Even thought it was acknowledged by the Commission that business skills
12
01::0 01::0
were lacking in Maori organizations. The Commission's strategy was to directed Maori to the local financial institution or business planner, hence creating a framework of dependency.
8. Charitable Trusts, Incorporated Societies, and Corporations
Movement over the last two decade amongst Maori toward self-determination, has led to the creation of iwi and multi iwi authorities by Maori, to guide and administer their development in social, political, and economy areas. Most of these authorities have been Charitable Trust or Incorporated authorities and in some cases Trust Boards. Charitable Trusts and incorporated societies have trust deeds, constitutions, or charters, which reflect the wishes other their beneficiaries and in essence, the assertion of " tino rangatiratanga" is more enhanced in determining the social and economic direction of iwi (New Zealand Committee on Maori Trust Boards, 1994). In comparison, the Maori Trust Boards Act 1955 limited the input from the Maori beneficiaries and their social and economic development (TPK, I 999c).
The Companies Act 1993, the Incorporated Society Act 1908, the Charitable Trust Act 19:il, and the Trustee Act 1956 could deal with other aspects of accountability more adequately than with the Maori Trust Boards Act 1955.
Some Iwi trusts and incorporations established under these regimes have progressed considerably being able to establish their own business ventures, and/or become contractors of State Service Providers (TPK, 1999c). There Maori urban Authorities and Maori Providers (mixed iwi, hapu, whanau groups) who are catering for the growing number of urbanised Maori people who can not trace their lineage back to a traditional iwi. These types of organisations are heavily involved in the delivery of social services including justice and job training and job creation programmes (Ministry of Justice, 1997).
There are a number of Maori urban authorities. The most prominent are Te Waipereira Trust and Manukau Urban Authority, both Auckland based, and Te Runanga 0 Nga Maata Waka in Christchurch who have set up as incorporated societies (Ministry of Justice, 1997).
10 Institutions and their Effects
Major obstacles to Maori economic development has been the continued interference on the traditional iwi governance structure by the Crown and the pernicious policies relating to MaOli land and other assets and also the identity of Maori themselves. These obstacles have had major effects relating to the flow of different forms of social, man-made, human, cultural and natural capital, which affects the overall wealth and economic development of Maori. Although capital can flow in and out, in most part the capital flows have been flowing out in the case of Maori.
Having land is of vital importance to Maori who believe that the first man (Tane) was descended from the Eatih Mother (Papatuanuku) and that Maori word for land "whenua" also represents the umbilical cord that links man to the Earth. From Papatuanuku numerous children were born to her that represent the different elements
13
of nature or natural processes, which provided Maori with all they needed. The flow of these natural processes are wrapped up in the concept of "mauri" or life-force.
Maori see themselves as guardians of the environment and have developed their own traditional resource management systems. Alteration to the environment affects the quality or quantity of the mauri and would mean that a natural resource may need to be conserved or forbidden from use otherwise dire consequences could happen. These analogies can also be made in systems thinking through the use of feedback mechanisms and the flow of environmental services and products that supply society and the economy.
For Maori, the cost of entry to markets is significantly higher than for· non-Maori. This prevents any significant economic development of the Maori people. The removal of natural capital from Maori has also driven them into urban centres in order to earn wages to pay for life-supporting services. Life supporting services were once the benefits of living and controlling their own lands (Loomis, 2000).
Maori organisations compete with each other for a limited pool of state service resource capita!, leading to a doubling up of services, and fragmentation of state service resource capital, and reducing the resources of these providers perform properly.
As we have seen previously the continued regulation of Maori governance has lead to an array of organisations, with differing power, and administration cultures. The quantity of organisations and the differing lines of hierarchy has lead to miscommunication, uncertainty of leadership, squabbles in decision making and planning, and general break down of traditional social norms and social and cultural capital.
Dasgupta (1990) suggests that social norms breakdown in periods of change (such in the process or colonisation or organisation), and if not replaced leads to market failure. Currently we are seeing this by the large disparities between Maori and nonMaori, and the large dependency Maori have on the State services, by not being able to contribute to welfare generation due to low participation in education and the job market (Ministry of Social Policy, 2001).
Maori Trust Boards and Trusts under the Maori Trustee Reserved Lands are hindered in wealth accumulation due to the restrictive financial management and resource allocation policies by the Maori Trustee regime.
Many unresolved Treaty claims exist for illegally taken natural resources that could help to aid in Maori economic development, but iwi may not have to resources to pursue them. In most cases Trusts and Incorporation formed under Crown legislation are not entitled to place any claims to the Waitangi Commission as they are not regarded as traditional iwi.
Land-based trusts such as those under the Tu Ture Whenua Act 1993 also tend to be disadvantaged by the low quantity of land per capita or also the quality of lands and other natural capital. They are also restricted by not being able to borrow money to
14
01:0 UI
develop resources and restricted to access to markets (Ministry of Maori Development, 1998).
Further detailed information about governance of Maori organisations and the flows of capital can be found in Tables 3-6.
The problem of solving inequities that exist for Maori is through developing the remaining capital they have, to build up their social, human, and cultural capital. From there, these forms of capital will be able to be substituted for natural or man-made capital.
11. Conclusions
Although this paper is not comprehensive, considering there is a range of other types of Maori organisations (such as religious and educational), it does show that significant social, economic, and cultural change has occurred within Maori society through numerous enactments of Parliament affecting the governance and management of assets and Maori themselves.
The governance of Maori people and their resources have been less than adequate since the beginnings of colonisation. This has generally been to the disempowerment of Crown imposed structures on the traditional tribal structure. These policies helped to further alienate Maori from their resources, and to depreciate their cultural, human, and social capital.
Failure to successfully participate in the Market has occurred because over the years Maori have become dependent on the Crown. This is in part due to poor investment in education making them less employable. It has also constrained capacity to plan for the future. The extreme numbers of economically struggling Maori will be a significant tax burden, especially since New Zealand's workforce is aging.
Government failure exists becanse the direct consequence of faulty government policy relating to the formation of the Maori Trustee and the Native Land Court which resulted in misallocation of resources and severely disadvantaging Maori and natural capital, as the social and environmental costs have been borne by Maori through the development and industrialisation of New Zealand (eg. loss of food resources, water pollution forcing Maori to find other ways to find the bare essential for life). The direct consequence of this, has been the loss of natural and man-made capitaL and indirectly, losses in social, cultural, and human capital as resources that would have been able to sustained if natural and man- made forms of capital have not been removed (i.e. sustainability).
State service contracts play an important role in facilitating Maori economic development, but it requires the establishment of some form of formal entity for funds to be allocated. As a result this perpetuates the competition between various Trust providers, and other organisations seeking the same resources. In the end they all tend to be under resourced (Te Puni Kokiri, 2000a).
15
Although government intervention has seemed to be decrease over the years, and many Maori institutions have been established to undertake State service contracts, the low capacity of Maori institutions makes them less viable and handicapped right Ii'om the start.
16
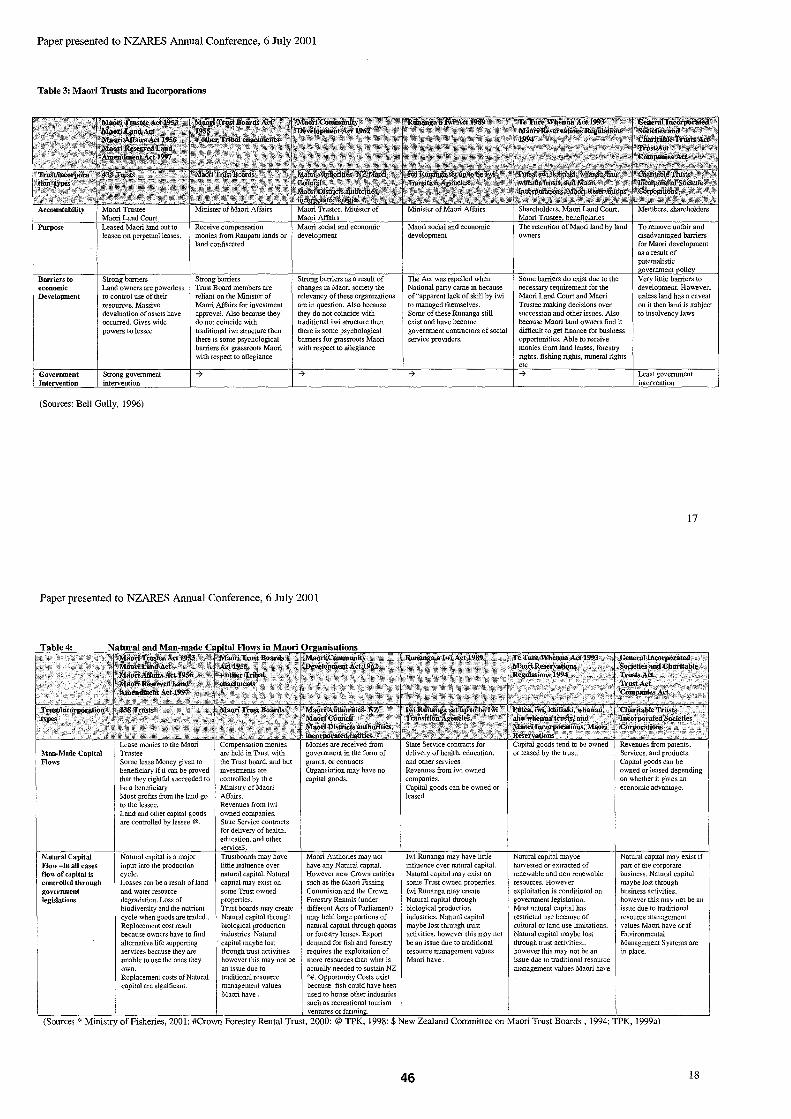
Paper presented to NZARES Annual Conference, 6 July 2001
Table 3: Maori Trusts and Incorporations
economic Development
Land owners are powerless to control use of their resources. Massive devaluation of assets have occurred. Gives wide powers to lessee
(Sources: Bell Gully, 1996)
Strong barriers Trust Board members are reliant on the Minister of Maori Affairs for investment approval. Also because they do not coincide with traditional iwi structure then there is some psychological barriers for grassroots Maori with respect to allegiance
Strong barriers as a result of changes in Maori society the relevancy of these organizations are in question. Also because they do not coincide with traditional iwi structure then there is some psychological barriers for grassroots Maori with respect to allegiance
Paper presented to NZARES Annual Conference, 6 July 2001
Man~Made Capital Flows
Natural Capital Flow -In all cases flow of capital is controlled through government legislations
Some lease Money gh'en to beneficiary if it can be proved that they rightful succeeded to be a beneficiary Most profits from the land go to the lessee.
Compensation monies are held in Trust with the Trust board, and but investments are controlled by th e Ministry of Maori Affairs. Revenues from iwi
Land and other capital goods owned companies. are controlled by lessee @. State Service contracts
for delivery of health.
Natuml capital is a major input into the production cycle. Losses can be a result ofland and water resource degradation. Loss of biodiversity and the nutrient cycle when goods are traded .. Replacement cost result because owners have to find alternative life supporting services because they are unable to use the ones they own. Replacement costs of Natural capital are significant.
education. and other service$. Trustboards may have little influence over natural capital. Natural capital may exist on some Trust owned properties. Trust boards may create Natural capital through biological production industries. Natural
- capital maybe lost through trust activities. however this may not be an issue due to traditional resource management values Maori have.
grants, or contracts Organsiation may have no capital goods.
Maori Authories may not have any Naruml capital. However new Crown entities such as the Maori Fishing Commision and the Crown Foresu)' Rentals (under differenl Acts of Parliament) may held large portions of nmural capital through quotas or forestry leases. Export demand for fish and forestry requires the exploitation of more resources than what is actually needed to sustain NZ ~'#. Opportunity Costs exisl because fish could hnve been used to house other indusuies such as recreational tourism ventures or fannin .
The Act was repelled when National party came in because of "apparent lack of skill by iwi to managed themselves. Some of these Runanga still exist and have become government contractors of social service providers.
Some barriers do exist due to the necessary requirement for the Maori Land Court and Maori Trustee making decisions over succession and other issues. Also because Maori land owners find it difficult to get finance for business opportunities. Able to receive monies from land leases. forestry rights. fishing rights. mineral rights
Very little barriers to development However. unless land has a caveat on it then land is subject to insolvency laws
17
" . ,,·J'e,Ture·WbentiliA<i·.199,r·· ,'" ip,.rieralJncorpoiated::" ~l\:I"~Q~:~~~:a1i(J~"~'"';: ":" ;,gocreties·and,Cbantable" '~.
Revenues from iwi owned companies. Capital goods can be owned or leased
Iwi Runanga may have little influence oyer natural capital. Natural capital may exist on some Trust owned properties. Iwi Runanga may create Natural capital through biological production industries. Natural capital maybe lost through trust activities. however this may not be an issue due to traditional resource management values Maori have.
::Regoililtions'1994.. . . ". "1trktsAct;:',':" : . . TiWt A•i ,. :CO~panieS ~ct:' .
:::-Putea;iWi;.~lqtitiaki, Wbanati~:'" ":Cnamable·Trusts:'· :, "<iliuwhen"" trll$i$,:iirid .... :;<:~ ·.Jntorporated SocieUeS . >MooriInC&:rporatiomlMllfirL; ~~~!~O~:~:·'·' ":"'Rmrvations '~' " ,'"", .. "" ',',"""
Capital goods tend to be owned or leased by the trust.
Natural capital Il1.1ybe har .... ested or extracted of renewable and non renewable resources. However exploitation is conditional on govenunent legislation. Most natural capital has restricted use because of cultural or land use limitations. Natural capital maybe lost through trust activities .. however this may not be an issue due to traditional resource management values Maori have
Revenues from patents. Services. and products. Capital goods can be owned or leased depending on whether it gives an economic advantage.
Natural capital may exist if pan of the corporate business. Natural capital mnybe 10Sl through business activities. however lhis may not be an issue due to traditional resource management values Maori have or if Environmental Management S ysteOls are in place.
(Sources * Ministry of Fisheries, 200 I: #Crown Forestry Rental Trust, 2000: @ TPK, 1998: $ New Zealand Committee on Maori Trust Boards, 1994: TPK, 1999a)
46 18
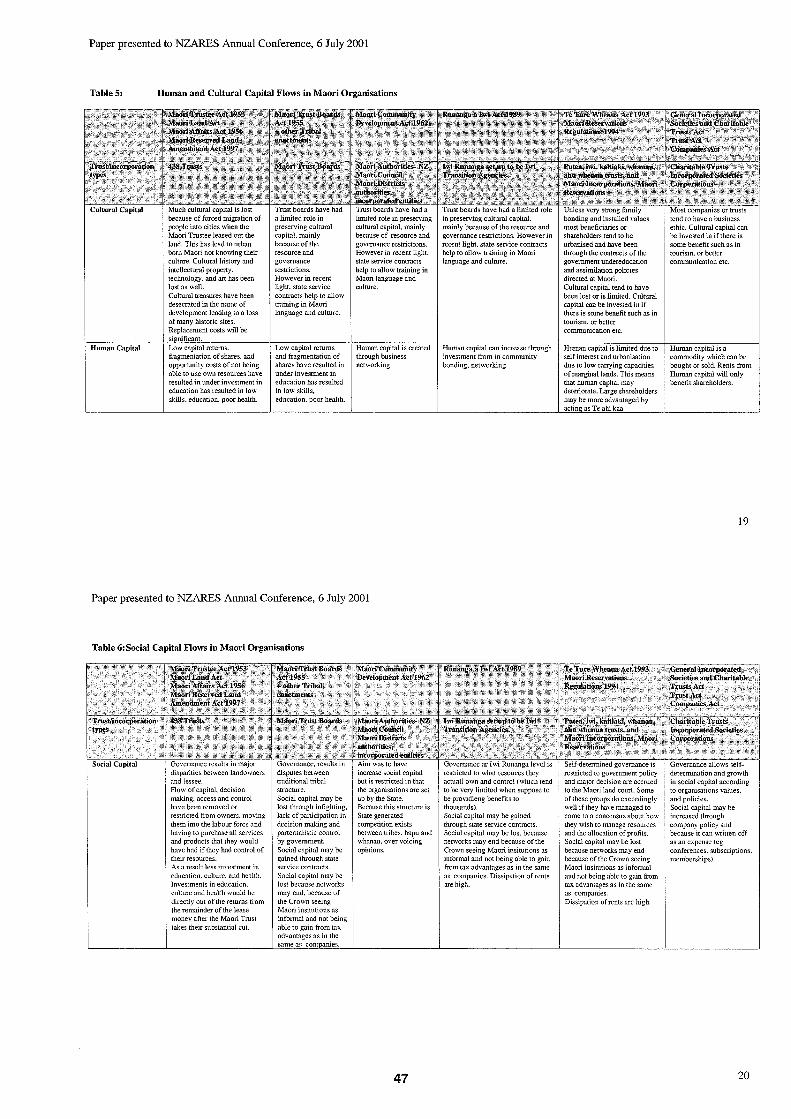
Paper presented to NZARES Annual Conference, 6 July 2001
TableS: Human and Coltural Capital Flows in Maori Organisations
Hwnan Capital
Much cultural capital is lost because of forced migration of people into cities when the Maori Trustee leased out the land. This has lead to urban born Maori not knowing their culture. Cultural history and intellectural property. technology. and art has been lost as well. Cultural treasures have been desecrated in the name of development leading [0 a loss of many historic sites. Replacement costs will be si nificant. Low capital returns. fragmentation of shares. and opportunity costs of not being able to use own resources have resulted in under investment in education has resulted in low skills. education. poor health.
a limited role in preserving cultural capital. mainly because of the resource and governance restrictions. However in recent light, state service contracts help to allow training in Maori language and culture.
Low capital returns and fragmentation of shares have resulted in under investment in education has resulted in low skills. education, poor health.
limited role in preserving cultural capital. mainly because of resource and governance restrictions. However in recent light, state service contracts help to allow training in Maori language and culture.
Human capital is created through business networking
Paper presented to NZARES Annual Conference, 6 July 2001
Table 6: Social Capital Flows in Maori Organisations
'MoorlLanllAct <.'<> Adcl95S· ',<,. lI'~a0ri;\ITairsAct ~56 '.ii6ther·:rn'biii . ~~orl~eserved Lall(l , .•.. , Am ... dDienMcU997" .
Governance results in major disparities between landowners and lessee. Flow of c[lpital. decision making. access and control have been removed or restricted from owners, mo .... ing them into the labour force and having to purchase all sen/ices and products that they would have had if they had control of their resources. As a result less investment in education. culture. and health. Investments in education. culture and heahh would be directly out of the returns from the remainder of the lease money after the Maori Trust takes their substantial cut.
Governance, results in disputes between traditional tribal structure. Social capital may be lost through infighting. lack of participation in decision making and parternalistic control by government. Social capital may be gained through stare ser\'ice contracts. Social capital may be lost because networks nmy end. because of the Crown seeing Maori insitutions as informal and not being able to gain from tax advantages as in the same as com ames.
increase social capital but is restricted in that the organisations are set up by the State. Because this structure is State generated competition exists between tribes. hapu and whanau, over voicing opinions.
47
in preserving cultural capital, mainly because of the resource and governance restrictions. However in recent light. state service contracts help to allow training in Maori language and culture.
Human capital can increase through investment from in community bonding, networking
Governance ar I wi Runanga level is restricted to what resouces they actuall own and control (which tend to be very limited when suppose to be providieng benefits to thousands). Social capital may be gained through state service contracts. Social capital may be lost because networks may end because of the Crown seeing Maori insitutions as informal and nOt being able ro gain from tax. advantages as in the same as companies. Dissipation of rents are high.
Unless very strong family bonding and installed values most beneficiaries or shareholders tend to be urbanised and have been through the contructs of the government undereducation and assimilation policies directed at Maori. Cultural capital tend to have been lost or is limited. Cultural capital can be invested in if there is some benefit such as in tourism. or better communication etc.
Human capital is limited due to self interest and urbanisation due to low carrying capacities of marginal lands. This means that human capital may deteriorate. Large shareholders may be more advantaged by actin as Te ahi kaa
'abli')me6uairoSts,iliHt' > '.: ~~~~:~~~~~~DS~1\(~~r(':
< Reservations,,' .. " '
Self~detennined governance is restricted to government policy and major decision are accrued to the Maori land court. Some of these groups do exceedingly well if they have managed to corne to a concensus about how they wish to manage resources and the allocation of profits. Social capimi may be lost because networks mL'ly end because of the Crown seeing Maori insitutions as infornml and not being able to gain from tax advantages as in the same as companies. Dissipation of rents are high.
some benefit such as in tourism. or better communication etc.
Human capital is a commoditv which can be bought or ~old. Rents from Human capital will only benefit shareholders.
19
'GeileraUileorporated:· .
Governance allows self~ determination and growth in social capital according to organisations values. and policies. Social capital may be increased through company policy and because it can \\Tinen off as an expem;e (eg conferences. subscriptions. memberships).
20
.j:o co
Paper presented to NZARES Annual Conference, 6 July 2001
Bibliography:
I. Asher, G. and H. Naulls (1987): Maori Land. New Zealand Planning Council, Wellington.
2. Bell Gully (1996): Maori Management and Ownership Structures Project, Bell Gully BuddIe Weir Barristers and Solicitors, Auckland, New Zealand.
3. Crown Forestry Rentals Trust (2000): Reports to Appointers 1999-2000, Wellington
4. Dasgupta, P (1990): The Environment as a Commodity. In Oxford Review of Economic Policy. Vol 6 (I) (1990), p51-67
5. Durie, M. (1998): Te Mana. Te Kawanatanga: The Politics of Maori SelfDetermination. Oxford University Press, Oxford.
6. Loomis, T. (2000): The Political Economy of Indigenous Peoples and Development. Working paper, Department of Development Studies, University ofWaikato, Hamilton.
7. Maori Economic Development Commission (1999): To Maatou Tuurura PooOur Vision: The First Report of the Maori Economic Development Commission, Wellington.
8. Ministry of Maori Development (July 1998): A Guide to Laan Securities QrWons and Alternatives. Wellington.
9. Ministry of Social Policy (May 2001): Communities and Government -Potential for Partnership Whakato - pu - Whakaaro. Community Policy Team, Ministry of Social Policy, Wellington, New Zealand
10. New Zealand Committee on Maori Trust Boards (1994): Review of the Maori Trust Boards Act 1955, Wellington.
11. Rose, D., Sanderson. K. Morgan, P., Andrews, G. (1997): The Nature and extent of the Maori Economic Base: A report prepared for Te Puni Kokiri, Business and Economic Research Limited and Federation of Maori Authorities, Wellington.
12. Sullivan, A. (1995): Maori Affairs Policies 1984-1994 and Maori Trust Boards University of Waikato
13. Te Puni Kokiri (TPK)(1993a): Te Ture Whenua Maori Act 1993; A guide to the Regyl(ltions for Maori Incorporation and Maori Reservation, Wellington.
14. Te Puni Kokiri (TPK) (l993b): Te Ture Whenua Maori Act 1993; A summa/Yo Wellington.
15. Te Puni Kokiri (TPK) (1996): Morm of the Maori Trust Boards Act 1955; A discussion paper. Wellington.
16. Te Puni Kokiri (TPK) (l998a): A guide to Maori Land Trust; Te Ture Whenua Maori Act 1993, Wellington.
17. Te Puni Kokiri (TPK) (1998b): Review of the Ture Whenua Act 1993; A ~und paper for consultation hui. Wellington.
18. Te Puni Kokiri (TPK)(1998c):A guide to the Maori Reversed Land Amendment Act 1997. Wellington.
19. Te Puni Kokiri (TPK) (1998d): Review of the Ture Whenua Act 1993; A background paper for consultation hui, Wellington.
20. Te Puni Kokiri (TPK) (l999a): Discussion Paper on the Review of the Maori Community Development Act 1962, Wellington.
21. Te Puni Kokiri (TPK) (1999b): Post Election Briefing Paper, Wellington. 22. Te Puni Kokiri (TPK)(2000a): Launch of Capacity Building seen as an
important step forward for Maori, Kokiri Paetae issue 29 Sept 2000
21
Paper presented to NZARES Annual Conference, 6 July 2001
23. Te Puni Kokiri (TPK) (2000b): Maori in the New Zealand Economy, Wellington.
Legislations
I Charitable Trust Act 1957 2 Companies Act 1993. 3 Incorporated Society Act 1908. 4 Maori Affairs Act 1953. 5 Maori Community Development Act 1962 6 Maori Purposes Bill 1999 7 Maori Reservations Regulations 1994. 8 Maori Reserve Land Amendment Act 1997 9 Maori Social and Economic Advancement Act of 1945 10 Maori Trustee Act 1953 11 Maori Trust Board Act 1955 12 Native LandActof1865 13 New Zealand Settlements Act 1863 14 Runanga Iwi Act 1990 15 Suppression of Rebellion Act 1963 16 TeTure Whenua Maori Act 1993 17 Te Ture Whenua Maori Amendment Bill 1999 18 19 20 Trustee Act 1956
Web Pages
Ministry of Fisheries (200 I): Customary Fishing http://www.mfish.govt.nz/commercial/otherms.htrnl#taia
2 Ministry of Justice (1997): A Guide of Consultation with Maori, Ministry of Justice, Wellington http://www.justice.govt.nz/pubs/reports/ 1998IMaori Consultation/cultural
dmensions.html#Maori organisational structures
3 United Nations Development Program (1997): Governance for Sustainable Human Development, http://mirror.undp.org/magnet/policy/
22
.r::. <D
RURAL TELECOMMUNICATIONS: IT'S ALL UP IN THE AIR
Abstract
John Squire MAF Policy. Whangarei
June 2001
New Zealand's govemment privatised the state run telephone service in 1990. Regulations that the industry operated 'mder were amongst the lightest in the world. Competition in the telecommunication industry has benefited urban customers more than rural customers. Research carried out on behalf of MAF Policy quantified how deficient market forces have been for rural telecommunication users. A Parliamentm'y Inquiry into Telecommunications has reported to government and a draft Telecommunications Bill is now passing through select conuuittee stages prior to being passed into law. Initiatives the government is taking to ensure that all New Zealanders have access to high quality telecommunications are now underway. Renegotiating the Kiwi share obligation with Telecom, and reviewing how government cm] combine with local government, communities and providers of telecommunication services are being undertaken right now. The results of these initiatives are awaited with interest.
Keywords: telecommunications, rural, government, community
Introduction
The world changed forever in 1875 when Alexander Graham Bell patented a device that permitted twoway voice communications over Im'ge distances. Over the next 100 years a network of copper telephone wires was built linking residences and businesses .
As in most western countries a government statutory monopoly, the Post Office, provided telephone services in New Zealand until 1987. Nem'ly all areas were linked up to the copper wire network directly or in a few isolated areas by nan"ow band microwave services. One to one voice communications and telegrams dominated transmissions.
In 1987 a state owned enterprise, Telecom Corporation of NZ, was established and then privatised in 1990. The government retained a Kiwi share which imposed some operational and pricing restrictions on the new company, Telecom NZ Ltd. By world standards New Zealand's telecommunication regulations were very light handed.
We have seen major chmlges to New Zealand's teleconununication industry since 1990. No longer is Telecom NZ Ltd, the only provider. Clear Communications, Vodafone, and TelstraSaturn and many smaller companies are now competing for mm'ket shme. Fibre optic cables, mobile wireless systems, fixed wireless systems mId even satellites are replacing or supplementing the traditional copper wire network. The type of transmission on our telephone system has also changed radically. Consumers now expect the telephone to not only transfer voices between people, but also data, documents, music, pictures and even video between computers. When the internet, which in 1990 was a communication system between academic and research institutions only, was opened to the general public a cOimnunication flood was released. 2000 marked the first year that internet traffic reached 50% of traffic on the Telecom network. Already in 200 I this has climbed to 60%.
Telecom's competitors have been most aggressive in the central business districts of Wellington, Auckland mId ChristchUJ'ch. Telecommunication users outside these areas have had to look on with envy, as they saw their services slipping behind their city equivalents. Anecdotal evidence suggested rural telecommunication services were becoming inadequate for modem demands.
In 2000 the government set up a Pm'liamentm'y Inquiry into TelecOimnunications under the chairmanship of Hugh Fletcher. The Inquiry called for submissions from interested groups. MAF commissioned Dr Trevor Atkins of Hortvision Ltd., (Atkins 2000) to quantify the problems faced by rural New Zealand telecommunication users. The Hon J Sutton used material fi'om this report in his submission to the Inquiry. The Inquiry team duly reported their fmdings to government, who in tum
responded positively to many of the recommendations. A draft Telecommunications Bill is now going through the select committee stages prior to coming back to Parliament for passing into law later this year.
The New Zealand government, as in other countries, has identified the need for broadband services in all areas if the general population is going to be able to participate in the information economy. A group of Ministers under the chairmanship of Paul Swain is developing policies on the government's role in ensuring that rural and provincial New Zealand get better telecommunications. An announcement on this aspect is expected soon.
What did the Atkins study tell us?
Atkins was asked to assess whether or not nIral people, businesses and organisations were receiving adequate telecommunication services. Atkins surveyed 15,612 addresses in 56 rural delivery districts. (approximately 10% of all rural delivery addresses) 1,979 replies were received in the first three weeks following distribution of the questionnaires. Because of time constraints analysis of the first 1000 questionnaires received provided input for the Minister of Agriculture's submission to the Inquiry. Subsequently all 2,351 replies were analysed (Squire, unpublished) which provided an opportunity to test for statistical significance. Data reported in this paper are from all replies. The analysis enabled several additional questions regarding telecommunication services to be answered.
Firstly, were there regional differences in rural telecommunication services? Secondly, did different types of rural users have different demands and face different levels of service? Thirdly, was there any difference in telecommunication services associated with the distance from popUlation centres?
Regional differences.
Replies were divided into three broad areas, Northern North Island, (NNI) Southern North Island (SNI) and South Island (SI). The enterprise types in each of these areas differed significantly.
Table I: Percentage of respondent by enterprise type by region.
Region n Farm Small blocks - Rural Other businesses Rural Non-farm (incl. schools)
residences businesses NNI 924 36 60 8 7 SNI 595 67 41 8 9 SI 826 70 29 12 7
This reflects the diverse rural populations in New Zealand. Telecommunication suppliers have a range of needs of different groups in rural New Zealand.
The only other significant difference between regions was in the use of telecommunications. The reported difference in use is significant at the 5% level.
Table 2: Percentage of respondents reporting use of telecommunication services by region.
Region n Business Family Volunteer Education work
NNI 924 31 43 6 9 SNI 595 38 38 5 7 SI 826 20 60 10 10
Difference in usage of telecommunications could possibly be explained by differences in enterprise type and this is investigated further in the next section.
(1J o
No other differences bet ween regions were significant. This means that the level of telecommunication services and problems associated wilh telecommunications are similar over all regions of New Zealand.
Enterprise type
Respondents were categorised into four groupings. Farm businesses, (FG) which included livestock farms, horticultural and m'able faIms; (n = 1250) Rural non-fann businesses; (BG, n = 75) Small block owners and rural residences; (RG, n = 986) mld rural schools (SG, n = 12). Only properties that were entered into a single category were included in the mlalysis. For example, a property that entered both as a dairy farm and I1lral non-farm business was excluded from the analysis. The difference in reported usage of telecommunications between enterprise types was highly significant.
Table 3: Reported percentage use of telecommunication services by enterprise type.
Enterprise n Business Family Volunteer Education
t""e organisation FG 1250 47 37 13 13 BG 75 55 33 10 13 RG 986 32 54 16 19 SG 12 70 11 17 65
Variations in the usage of telecommunication services by enterprise type explain ne,rrly all the differences between regions described in the first section.
There was also a significmlt difference in the success of obtaining additional lines between enterprises and in the number of telephone lines held by each type of enterprise.
Table 4: Enterprise types success in obtaining additional lines and number of telephone lines held.
Enterprise type % Successfully obtained Number of telephone lines per additional teie[lhone lines respondent
FG 16 1.3 BG 39 1.6
I RG 15 1.2 SG 92 2.0
There was no other significant difference between enterprise types.
Distance from population centres.
Respondents were asked to identify the distance they were from the nem'est village, town and city. There was a suspicion that rural telecommunication users further from population centres faced greater problems with telecommunication services. Respondents were divided in to three groups according to the distance from the nearest town. The closest group (CG) was between 0 and 14 km (mean 8 km) from the nearest town. (n = 662) The intelmediate group (IG) was more than 14 but less than 30 km (mean 22 km) from the nearest tow. (n = 739) The furthest group (FG) was greater thml 30 km (mean 58km) from the nem'est town. (n = 645) As one would expect there was a significant difference between the enterprises found in each group.
Table 5: Enterprise types represented in each distmlce from town group.
Distance to Mean Farnl Small blocks Rural Other nearest town distance businesses Rural Non-farm (inc!.
(km) residences businesses schools) CG 8 34 63 5 0 IG 22 62 36 6 8 FG 58 71 22 8 0
--~
As one would expect there are a greater proportion of small blocks and nrra! residences closer to population centres. However even at the greatest distance from population centres, nearly a third of respondents are non-agriculture groups. Telecommunication services in all rural areas need to satisfy a wide range of users.
The only significant difference in these groups was the level of communication devices owned.
Table 6: The percentage of respondents who own communication devices.
Distance to Telephone Fax Mobile Radio- Computer Satellite nearest phone Telephone dish town CG 99 52 74 4 69 12 IG 99 63 71 5 62 15 FG 97 63 66 6 58 20
The main differences were mobile telephone and computer ownership decreased, while ownership of radio/telephones and satellite dishes increased as distance from the nearest town increased. Only two respondents had no access to fixed or mobile telephone services, and only one respondent was on a party line. More than 80% of respondents who had a computer had internet access. In other words more than half the respondents had access to the internet.
No other difference associated with distance from population centres was statistically significant.
Quality of teleconU1lunications
Respondents were asked if they had experienced problems with their telephone lines. 58% believed they had one or more problems. These are categorised below.
Table 7: Telephone line problems repOlted by respondents.
Type of problem % reporting problem No problem 42 Connection interruDted 20 Slow data download sDeed 25 Line noise 24 Exchange overloading 18 Electric fence interference 22 Unknown I
Note: Some respondents reported more than one problem.
58% of rmal telecommunication users reported one of more telephone line problems. More than two thirds of respondents who had internet access believed they required faster downloads speed. However reasons for slow downloading may be unrelated to telephone line factors.
Emergency III services
In rural areas access to emergency services are important. Fifteen percent of respondents had used the emergency III service in the previous two years. About I in 4 had experienced some problems with the service. Two respondents reported being unable to access the service because of line overloads. By faI' the greatest problem noted was with operators not knowing the district from where the request was being made.
Mobile phone coverage
An alternative to line based telephone services is mobile phones. Telecom and Vodofone, the two suppliers, believe they cover about 95% of the New Zealand population. Complaints about rural mobile service are common. Respondents were asked to characterise the mobile phone coverage in their area.
U1 ....
Table 8: Opinion on mobile phone coverage by owners of mobile phones
Mobile phone coverage comments % owners
No problem with coverage 24 Problems but does not affect business 35 Significant problems that affect business 41
Published mobile phone coverage is assessed using 4watt car kit systems. Coverage using I watt handheld mobile phones will have a considerably reduced coverage area than those advertised. More than 40% of the respondents that owned mobile phones reported coverage problems serious enough to affect the ability to conduct their businesses.
Effect of telecommunications on business efficiency and business type.
More than half (56%) of the business respondents believe their mobile telephone service, and one third believe their fixed line telephone services affects the effiCiency of the business they run. About one in five believe that the level of mobile or fixed telephone services affect the type of business they can run.
Respondents were asked their views on the future of telecommunications and how they might be affected relative to urban counterpruts. 28% thought that they would be seriously disadvantaged in being able to take up new opportunities. Over half (53%) felt that they would not be disadvantaged when compared with their urban equivalents.
Analysis of Atkins data shows that there are real deficiencies in nU'al telecommunications irrespective of where you are in New Zealand, inespective of whether you are a frumer, rural resident or rurally based non-farm business, or irrespective of how far you are from a population centre. Rural New Zealand makes up roughly 13 - 15% of the population - about 450,000 people- similar to the combined size of Christchurch and Dunedin. Think what a hue and cry there would be if those two cities faced the same telecommunication problems as rural New Zealand.
'.'/Jurl§ bandwidth important?
Some people view telecommunications capability as an infrastructural issue on a par with roading and rail networks. No longer do people just want to speak to each other over the telephone. They want their computers to be able to u'ansfer text, music, inlages and even video images to other computers. A second of speech converts to about 8,000 'bits' of information. Therefore voice transmissions require a minimum of 8kbps (kilo bits per second) to transmit voice messages. A second of quality music may require as much as 13,000 'bits of information (13kbps), while a second of high quality video may require as much as 20 million bits of information. (20Mbps)
Putting this another way, a telephone line that can u'ansmit voice at 8kbps would require 16 seconds to download a second of music and more than 42 minutes to download a second of high quality video.
Bandwidth describes how much data can be U'ansmitted in a specified time. The higher the bandwidth the more versatile that telecommunication system is. The Canadirul Broadband Task Force (Industry Canada 200 I) have defined a broadband standard as a 'high capacity two-way link supporting fullmotion, interactive video". They know a telecommunication system meeting this standard will also support a wide range of two-way applications that require less bandwidth.
In most pru1s of New Zealand there is infrastructure that can deliver broadband services. There is the Telecom network, the cellular telephone network, satellite systems and other wireless systems. Each system has its own advantages and disadvantages - no one system satisfies all the requirements in all areas. TelecOlmnunication technologies change rapidly so government's concern is to not tie users to a technology that may be outdated in very short time.
How big is the rural demand for telecommunication services?
A major weakness of rural New Zealand is its dispersed nature. As mentioned before rural New Zealand represents the same number of people as the combined Christchurch and Dunedin population. Aggregating demand for telecommunications from rural areas is one way to attract suppliers.
There are community groups in various parts of New Zealand attempting to do this. For example, the Far North District Council identified 4,500 small businesses, many schools, government departments and medical services who would use broadband telecommunication services. Having better communication systems would assist in attracting doctors to the local hospital, would enable small rural schools to offer a greater range of classes to their pupils and help local businesses to market their wares and skills on world markets. Similar work is going on in Southland, Taranaki, North Canterbury and the Wairarapa. Each area will have its own unique set of requirements.
Telcos are at last becoming interested in providing rural services. Joint proposals that combine skills and facilities of two or more companies are evolving. One thing is sure, there will not be a single solution that satisfies all rural areas. Solutions will require co-operation from central and local government, the local community and telecommunication suppliers.
What initiatives are the government taking?
Government has a vision 'That all New Zealanders will be able to access high speed internet services (l28kbps two-way always on) so we can market New Zealand as a place where you can work, play or learn anywhere, as yon would in any of the major cities.' In an attempt to achieve this goal the government has undertaken several initiatives. The first is to replace the 1987 Telecommunication Act.
What does the 2001 Telecommunications Bill do?
Before I start on this section I must warn you the Bill is at the select committee stage and will not be reported back to Parliament until September this year. The final Act may be different from the draft Bill. I suspect details may change but the overall purpose of the Bill will remain intact.
The Bill attempts to 'promote the long term interests of end-users of telecommunications services' by:
a) Encouraging the telecommunications industry to reach commercially negotiated agreement,
b) Regulating certain telecommunication services to service providers in cases where such regulation will result in net economic benefit to New Zealand. There will be three levels of regulated services,
I) Designated services, 2) Specified services, and 3) Designated multinetwork services.
c) Establishing the position of Telecommunications Commissioner within the Commerce Commission. The Telecommunication Commissioner will have power to
1) Make determinations on disputes over regulated services, 2) Report on desirability of regulating additional services, and 3) Undertake key costing and enforcement activities.
d) Provide machinery that will enable universal service obligations for telecommunications to be implemented and enforced, by
I) declaring what is a universal service obligation, and 2) requiring telecommunication providers who did not provide the US services go contribute
towards the net cost of providing those services.
U1 I\)
e) CmTY over provisions in the Telecommunications Act 1987. These include l) declaration of network operators, 2) Restrictions on connecting to a telecommunication network, 3) Offences regarding misuse of a telephone, 4) Matters of evidence regm'ding computer records, and 5) Maintenance of networks.
Is the Kiwi shm'e a help or hindrance?
In 1989 when Telecom was privatised the Government sought to achieve its social objectives by imposing some conditions on Telecom NZ Ltd. This was done through a Kiwi shm'e agreement. The key requirements were:
To not increase the standard domestic rental faster than the consumer price index, provided that Telecom's overall profitability was not significantly impaired.
For free local calling to be retained as an option for domestic customers. To continue to make telephone service just as widely available as it was in September 1990,
including services to rural areas.
The assumption was made that Telecom use profits /i'om its urban services to subsidise the unprofitable rural services. For example Telecom have estimated the average cost per customer per month for their lowest cost exchanges were just under $22 in 2000. The cost per customer in the highest cost rural exchanges is more than $240 per customer. Residential charges are similar for both types of customer. This is good for rural customers as the real cost to them is hidden.
However, the low price is one reason that competitors have not been attracted to rural areas. For example, a firm interested in providing broadband services to rmal clients can'ied out market research at the recent Mystery Creek Fieldays. Rural people surveyed were unprepared to pay more than the CUlTent cross-subsidised plice for an improved teleconuuunication service. The fmu is now reconsidering its opportunities
Telecom maintains that in spite of great difficulties it has more than satisfied the Kiwi shm'e obligations to rllral customers. There have certainly been great improvements to rural telephone services in the decade since Telecom NZ Ltd was established. Nem'ly all pmty lines have been replaced, close to 100% of homes and businesses are able to connect to the Telecom network, nearly all exchanges have been converted to digital services, and the range of services offered to rural customers has been increased.
As pm"! of the review of the telecommunications industry the Goverruuent is renegotiating the Kiwi shm'e agreement. Part of the new Kiwi share will require Telecom to provide minimum data download speeds of 14.4kbps to 95% of the population and to 9.6kbps to 99% ofthe population. Other requirements, still under negotiation, will require Telecom to meet certain standards of performance and periodically repOlt against these.
TIlere m'e altel11atives to the Kiwi share. Should other telecommunication providers shm'e the cost of maintaining or improving rural infrasU'uctures? Would tendering out the Kiwi shm'e obligation attract other players who could provide the service at lower cost? All these options are being considered as part of the government" s development of information economy policies.
Elecu"ic fence interference.
During the Inquiry into telecommunications a major problem with telephone services was identified as electric fence interference. Telecom have estimated that 40,000 rural subscribers are being affected by electric fences. The government asked MED and MAF to investigate this problem and see if there was anything the government could do to help minimise this problem. Interference could vm'y from audible clicking on the line, to slow internet access, to calls being dropped.
Staff from Telecom and electric fence mmlufacturers studied four properties in Northland, Waikato, West Coast and Southland. The main interference was caused by main electric leads being run along
roadside fences, parallel and close to buried telephone cables. However close behind this was the poor standard of construction and maintenance of the electric fences. Remedial action on most farms would only take a few hours and would at the same time resolve many telephone line problems. At one site 20 electric fences were studied, but not one of these was causing the problem. At another site the offending electric fence was 5.5km from the house experiencing telecommunication difficulties. However after fence modifications internet access speed at the problem site rose from I I kbps to 26kbps.
This group is reporting back to government towards the end of July. The government will then have to decide whether it wants to do anything, and if so what it wants to do.
Conclusions
If rural telecommunications don't show a rapid improvement from the sad state reported by the Atkins study, there will be no 'e' in commerce, government or education for rural people. The rural digital divide will widen and opportunities will be reduced.
However, I have a lot of confidence that rural telecommunications are going to change in the next few yem·s. Competing telcos are at last interested in rural markets; new technology is coming on stream daily; government is developing policies that will facilitate better services for rural people; and rural communities are no longer willing to accept second class telecommunications.
But as the title suggests "Rural telecommunications: Its all up in the air."
References
Dr T Atkins. 2000.Telecommunications: Use, Constraints and Potential in Rural Areas. Report prepared for MAF Policy. (What is the proper reference?)
Industry Canada. Report of the National Broadband Task Force. 200 I http://broadband.gc.caIBroadband-documentlenglish/tablecontent.htm
Telecom NZ Ltd. 2000. Springboard to Success. New Zealand Teleco1lU11Ullications competition in the 2 I" Century

U1 Co)
IDENTIFYING THE SECTORS' CONCERNS
Tony Wharton MAF Policy, PO Box 2526, Wellington
SUMMARY
One of the functions of MAF Policy is to assist the Agricultural, Horticultural and Forestry industries, and rural communities maximise their contribution to New Zealand and to the New Zealand economy, To this end, in 2000 MAF Policy undertook a project to identify with the sectol's their priority areas of concern, particularly those areas of concern that impinged on their businesses, mId where action by MAF or other government agencies may be appropriate,
KEYWORDS
Sector, Government, Concerns, Consultation
INTRODUCTION
One of the functions of MAF Policy is to assist the Agricultural, Horticultural and Forestry industries, and rural communities maximise their contribution to New Zealand and to the New Zealand economy, While MAF m'e not advocates for the primm'y industries and can't intervene to change the Government's identified direction, philosophy or political priorities, it can work to ensure that Government is awm'e of the consequences of its policies; and act to ensure that Government policy is implemented on the sectors neutrally, fairly, effectively, and with the least compliance costs, To this end, in 2000 a project was undertaken to identify with the sectors their priority areas of concern, particularly those areas of concern that impinged on their businesses, and where action by MAF or other government agencies may be appropriate, Once the sector's concerns were identified, they were passed on to the MAF Policy lead analysts for each relevant m'ea, and other relevant government agencies, for analysis and recommendation.
The project was commissioned by Suzanne Kennedy, Temu Leader of MAF Policy's Business Environment mId Rural Affairs group, and undertaken by Tony Wharton and Jagdish Prasad of the Policy Information and Regions group, with assistance from MAF Policy's regional staff,
METHODOLOGY
Based on their financial conl1ibution to the New Zealand economy, the following sectors (presented in alphabetical order) were selected for investigation:
• Apples/Pipfruit • Arable • Beef & Sheepmeat • Dairy • Deer • Forestry • Kiwifruit • Other Fruit • Pigs • Poultry • Vegetables • Wine • Wool
A list of the major businesses and organisations in each of these sectors (at both the primm'y and secondm'Y stages) was developed, and interviews were held with a smuple from each sector /i'om April to June 2000, to gather information about each organisation's concerns. In addition, a number of pan-sector organisations, interest groups, research institutions, mId an agricultural educational provider were also
interviewed. MAF Policy already undertakes annual monitoring of farms in the dairy, sheep and beef, deer, arable and horticultural sectors, and as part of this process farmers are asked about the key issues affecting their businesses. Concerns raised from the Farm Monitoring interviews (as published in the 2000 Fann Monitoring reports) were used for the on-farm concerns for several sectors, rather than duplicating on-farm interviews.
The remainder of the paper presents a summary of the concerns raised by the respondents. The views and opinions expressed are those of the respondents, and not the views of MAF Policy. There has not yet been any attempt to verify the accuracy of claims made by any of the respondents, nor has there been any attempt to prioritise any of the concerns, The areas of concern are presented in alphabetical order,
SUMMARY OF CONCERNS.
ACC
The reform of ACC by the previous National Government lowered costs for some companies and producers, and provided the right drivers and incentives for them to actively move towards safer work practices and to improve health and safety systems, The return to State-run ACC by the present Government was seen as likely to remove these incentives, and increase costs. There was also concern that the current Government had not let the privati sed system run for sufficient time to be able to determine whether lower premiums would be sustained, or if they were merely the result of the private sector rushing in to capture new business.
Access to Farm Inputs
There was strong concern in a number of sectors about the continued availability of veterinary medicines mId agrichemicals in New Zealand, For many international companies the New Zealand market is simply too small to cmTY the high costs of registering these products under the Hazardous Substances and New Organisms Act (1996).
Access to Finance
Access to finance was a concern in the deer and pipfruit sectors, with access to finance considered to have tightened up, The pipfruit sector reported a range of attitudes between banks, with some being supportive of growers, others not. There was a belief that some banks are looking to exit horticulture if they can,
Biosecurity
There was significant concern among the sectors at the risk of a biosecurity failure. Most sectors were concerned about New Zealand's biosecurity capability, given the recent incidents of snakes, scorpions, and the Varroa mite. These were seen to be possible warning signs that things are "creaking at the semus", There was concern that the level of resources given to border control is too low, and that border officials are not adequately trained, There was also a perception that the agricultural sector is not valued highly by Government, and that the Government appeared much quicker to act on biosecurity issues for the forestry industry (e,g.: Tussock Moth), than for agriculture. The outbreak of Varroa Mite was a serious concern for kiwifruit growers, and there was concern about the long term effect of the Varroa mite on clover and the perceived slow reaction by the Government to the incident.
The increased number of tourists coming into New Zealand and the biosecurity risk associated with this were also of concern, Concern was also expressed about the increased biosecurity risks to surrounding farming districts from airports such as Palmerston North and Tauranga becoming international airports,
2
(1J ,J::o
l3iotechnology
There was concern that the voluntary moratorium on genetic modification could put New Zealand behind knowledge development in other nations. Most of the sectors wanted to preserve the ability to use genetic modification. Concern was expressed that New Zealand's agricultural future is highly dependent on developments in biotechnology, and fanners must be able to access this technology. There was concern that much of the debate around genetic modification is ill informed.
Some respondents believed that New Zealand has an overly cautious attitude to genetic modification, and that delays and costs associated with the ERMA process m'e driving biotechnology companies offshore, and dissuading others from setting up in New Zealand. However, there was also some concern that scientists are only able to predict the shOit-term effects of any genetic changes in an organism. Some respondents were pleased that a Royal Commission of Enquiry had been formed to consider and invite debate on the issue, although there was concern that the four-person Royal Commission on Genetic Modification did not include anyone with expertise in economics, international trade policy, or agriculture.
Education
Primm-y:
There were concerns about the longer distances that some rural children have to travel for schooling following the closure of some rural schools because of lower student numbers. Getting and retaining good quality teachers was a concel11 for rural schools, and it was believed that rural schools need more flexibility in their management.
Teltiary:
The low numbers of students choosing to pursue agricultural courses was a concel11, as the proportion of higher academically qualified students at 7th form level coming into agricultural programmes is lower than for other progl'mnmes. There was concern that careers advisors and parents are often negative about agriculture and its future prospects. There was also concern that the university system is not developing the types of skills required by the sectors. Concel11 was expressed about the increasing age of the academics at the agricultural universities. While there was considered to be a positive element to polytechnics offering lower level agricultural courses, concern was expressed about the teaching standards, as students have not been attracted to stay, and the courses have not attracted a good reputation.
Industry:
There was concern about the 'brain-drain' of graduates out of New Zealand, and the lack of opportunities for graduates within the research institutions. There was concel11 that there are now too many ITOs, and a lack of incentives for people to get training. Education was considered by some to be too centralised, and not in contact with the sectors. A lack of graduates in the horticultural industry at all levels was of concern. As horticulture is often a lower-paying indusu'y, graduates will take longer to payoff any student loans, encouraging them to take up jobs in other sectors or overseas.
ElecU'icity
There were concems about the quality, the price, and the irregular supply of electricity in some rural areas. As some rural electricity lines are more than seventy years old, replacement would impose a substantial cost on fanners under a user-pays scheme. The reform of the electricity sector was considered not to have made electricity cheaper; instead prices were believed to have increased for the majority of rural users. There were concerns that the savings promised with restructuring have not come through in many cases. Many farmers and smaller industrial people have found the electricity reforms confusing, and considerable time has been spent working out the best option.
3
Emergency Services
The availability of help in emergencies was of concern to some respondents, as there is often no organised system set up to deal with emergencies. Volunteers for ambulance and fire services are lacking in many rural areas.
Employment Relations Act (200D)
There was concern that the Employment Relations Act may lead to more frequent strikes at export meat plants, resulting in the permanent loss of major overseas contracts for chilled meat products. Some fanners were pmticularly concerned about the costs that may be added to the processing industries and passed back to them if meat-processing workers go on strike. They also foresaw a flowon in costs wherever significant labour is used in the production of farm supplies. The inability to use replacement labour during industrial action was a particular concern to some, given both the perishable nature of many primary products, and animal welfare concerns.
There was concern at the provisions covering the status of an employee following the expiration of fixed term contract, as the standard practice on many dairy fm'ms is for employees to have a one-year tenn after which they move to another farm. In the dairy processing industry there was concern about rmrestricted union access onto restricted areas of the factory floor that requires special sanitary clothing to be worn in order to satisfy market requirements. There was also concern over the potential ability of union officials to demand access to strategic business documents.
The Employment Relations Act was considered by some to contain many vague concepts such as 'goodfaith bargaining' that may have to be defined in court. There was concern that the new system would create confusion and uncertainty. Many companies had already spent time and money implementing the Employment Contracts Act, and considered that it had been working well for them and their employees.
Environmental Issues & The RMA
The Kyoto Protocol was perceived by some to lack scientific grounding, and there was concern that New Zealand's ratification of the Protocol would add costs to the primary sector. There was also concern that there was not yet agreement within the Kyoto Protocol framework on the specific definitions of deforestation and afforestation.
There was concern about the large amount of power that local government has in administering the RMA, and many considered that the application of the RMA between different councils was inconsistent. The time and cost of applying for resource consents was considered excessive, and there was concern with the perceived arbitrary way in which councils charge for inspections and consent applications. Some regional councils were thought to be trying to control activities instead of effects. Many fanners remained concerned about the possible imposition of controls by regional authorities on nitrogen fertiliser use on farms.
Some farmers were concerned about their ability to secure sufficient water for the irrigation of existing and new developments in the face of mounting pressure from conservation interests. Groups with a nonenvironmental or a political motive are able to make frivolous objections against resource consent applications, which can (and have) imposed delays and costs on companies. The lack of national policy statements and national standards for implementing the RMA was also of concern, and some farmers were frustrated by the amount of time taken by the environment court to make decisions.
Food Safety & Standards
There were concel11s over the implementation of the Performance Based Verification (PBV) food safety system in meat processing plants, and the severity of the penalties for non-compliance. Some of the mandatory standards used for PBV were considered by certain respondents not to have any technical foodsafety justification. The increasingly high cost of meat inspection services and the lack of contestability
4
U1 U1
were also of concern. Companies reported that PBV had increased both meat inspection costs and internal compliance costs.
There was concem that domestic meat suppliers are required to operate within a food safety criteria that increasingly includes trade barriers disguised as hygiene or food safety requirements that have no impact at all on food safety. Increasing food and hygiene standards and costs disadvantage abattoirs relative to unregulated suppliers of the domestic meat market, which operate without any controls at all on hygiene or food safety.
There was concem that food labelling needs to be approached very carefully, with a focus on the likely public perceptions of labelled food. There was also concern that compulsory food labelling will be seen as a Technical Barrier to Trade, and other nations may retaliate.
Health Services
There was concem that rural areas are being affected by reductions in health services, that are starting to have a detrimental impact on rural communities. Concem was also expressed about the reversion fi'om the Health Funding Authority to politicised Area Health Boards. Some respondents considered that District Health Boards should be elected on a more pennanent basis with greater regional representation.
Labour
There is a shortage of skilled labour at all levels in agriculture, horticulture and forestry. This was a major concern for all sectors, and a threat to growth. Fewer sons and daughters are returning to family farms, and low numbers of young people are choosing farming as a career option. Farming hds a poor reputation as a career, with perceived low retums and long hours of work. There was concem at the attitude among many school career advisers and the public that farming is only for those with poor academic prospects. In addition, it is becoming increasingly difficult for entrants to the agricultural industry to purchase farms.
There was concern that the meat industry still has a negative 'freezing works' public image, which is believed to be discouraging people fi'om seeking employment in the industry. Much of the labour pool that the meat processing industry draws upon has a low standard of general education, and a poor understanding of agriculture, food, and food hygiene. The seasonal nature of meat processing was still a concern both for the meat companies and for employees. It is costly and undesirable to train staff at the beginning of a season, only to have to lay them off at the end of it.
There was a belief that WINZ national policies do not provide the flexibility needed in rural areas where seasonal work is conunon. The unemployment benefit is inflexible, for example, people who have been temporarily employed may not get work for a week (especially because of rain), are not paid by the grower, and cannot obtain a benefit for that week either.
Local Government
Councils were considered by many to be too domestically focused, and lacking an intemational perspective. There was a sO'ong view that the local govemment resource consent process is very slow, provides no certainty, is costly, and has no conunercial ddver. There was also concern that the local government balance has gone too far in favour of Maori sensitivities. Some respondents considered that there needs to be a reform of local government, as there are too many authorities. Local authorities were seen to be ullsupportive of the 'right to farm' in placing restrictions on certain fanning activities. There were strong concems about the lack of transparency of council rates bills, and many fanners were concerned that they were subsidising urban ratepayers by being made to pay for services that they can not or do not use.
5
Macroeconomic Issues
There was general unease among the sectors at the state of the economy. While lower exchange rates have boosted retums for the export sectors and made competing imports more expensive for the domestic market-oriented sectors, the volatility of the currency and the flow-on inflationary effects on farm inputs was conceming. The political direction of the current Government worried some farmers, as did the implications of government policy on fann profitability and business growth. Concem was expressed that the New Zealand economy was not growing fast enough to encourage and support innovation.
OSH
Many farmers thought OSH has some unrealistic expectations given the conditions on farms, and the fact that farms are inherently dangerous. Some of the OSH rules were considered impractical from a farming perspective. OSH officials were regarded by some as inconsistent in their approach; some officers are tolerant while others too rigid. OSH requirements were perceived by some to be based on potential accidents rather than actual accidents. Visitor safety on farms was a concern, because farms often have multiple points of entry. OSH requirements were also regarded by some as an impediment to employment, as some farmers hesitate to employ young staff due to the higher likelihood of accidents.
Research & Development
Concem was expressed that the amount spent on agricultural research in New Zealand is too low. Both the public and private sectors appeared to be increasingly unwilling to pay for the true cost of contracting R&D services. There was concem that New Zealand's research capabilities will continue shrinking unless growth in commercial investment for research and development is increased. There was concem that the current system of research funding in New Zealand leads to considerable duplication and wastage of money and resources, and that a substantial portion of the total research funding is spent on administration.
There was also concern that the Public Good Science Fund is not targeting agriculture, and is moving away from the country's strengths into more socially based researched. Concern was expressed that the PGSF funding system views arable farming as a sunset industry. Some members of the pork and poultry indusoies were concerned that they do not receive fair levels of PGSF funding relative to their contribution to GDP, and that they are viewed less favourably because they are not export-focused industries. There was concern that the Crown is moving out of productivity research and leaving the sectors to pick it up. The lack of rewards and poor career and pay structures in New Zealand's research sector was considered to be holding back progress. There was also concem that the Science and Technology Advisory Council did not include anyone with expertise in primary production.
Rural Communities
There was Concem about the viability of rural towns, and the difficulties that they are having in attracting doctors, teachers, and other key community roles. There was concem over the ongoing erosion of utilities and services in the rural community, particularly power reticulation, telecommunications and roading. The withdrawal of rural banking services in many areas is a significant concem for rural residents. Many nITal conununities are highly dependent on farming or horticulture, and the closure of local services can make it difficult to attract workers into these areas.
Most rural communities revolve around the local schoo1. There are coneems that when schools close, it causes different communities to be thrown together, which can cause friction. There was concern that rural communities in New Zealand are disintegrating. Crime is on the increase in rural areas, with numerous incidences of theft of stock and equipment from farms,
6
U1 0)
Rural Values
There was concern from several sectors that their 'right to farm' is under threat from urban people without an appreciation of the unique characteristics of agriculture moving onto lifestyle blocks, This is resulting in complaints to local authorities about the noise and odour effects of traditionally accepted fanning practices, The presence of subdivisions is also impacting on the ability of fm'mers to carry out nonnal farming activities. Also of concern was the conversion of productive agricultural and horticultural land into lifestyle blocks, which was considered to crowd out agricultural land and reduce the ability of farmers to maximise the options from their land.
SECTOR SPECIFIC ISSUES
Arable: Many maize growers were concerned that they cannot take advantage of possible export opportunities because maize millers own nearly all of the grain dryers, and therefore farmers can't retain ownership and dry their own grain,
Beef and Sheepmeat: The meat processing industry still has excess capacity, particularly in the North Island. This has led to price wars with companies paying excessive amounts for livestock compared with realistic market returns. There was concern that this will lead to further meat compmly failures if it continues. Many farmers questioned the need for a Meat Board, and wanted to see a return for their levies. The Personal Property Security Act (1999) was considered by one meat processing company to be a faulty piece of legislation.
Dairy: There was concern that the Dairy Board Act (1961) is no longer appropriate for the industry, prevents the dairy companies from exercising ownership or control over the Dairy Board, and inhibits the development of value-added products.
Forestry: Forests are being plmlted in m'eas of the country where they will be uneconOlnic to hm'vest, due to the lack of road and port access. The lack of industry-wide quality standards for timber and finished products was a concern, and there was a perceived lack of leadership in the industry. It was believed that the New Zealand forestry industry does not effectively market its products, but has an 'order-taker' mentality. There was concern at the lack of unity amongst the compmlies in marketing products internationally.
Kiwifruit: The kiwifruit sector was having clifficulty encouraging Maori landowners to plant kiwifi'uit on their Imld for a number of reasons including clifficulties dealing with multiple ownership, and a lack of capital by the landowners.
Pipfruit: There was concem about the increasing influence of overseas supelwm·kets. It was believed that overseas supermarkets are aware that they can influence the pennit process by stating that they won't inaport New Zealmld apples unless they are sourced from a pmticular person via export consent.
Wine: There was concern about the wine industry's rapid expansion, and the impact that this may have on future retul11s.
Wool: The structure of the wool industry was a major concern to many farmers.
Other: There were concerns that with an ageing population and many farmers burdened with debt, fm'm succession will be an issue.
7
Sector Viability
There was concern that the profitability gap between the upper and lower fanning quartiles continues to widen in the sheep and beef sector. Declining prices and rising input costs have impacted heavily on many wool fanners' viability, In the arable sector, the scale of enterprise and capital required, along with seasonal risks and cashflow, is leading to fewer, stronger farms as amalgamations and sales occur.
Industry and business viability was a major concern to many of the pipfruit sector. The sector's recent poor performance was considered by some to be partly because many growers have not addressed problems. There was a view that the culture in the sector and the attitudes of some growers' needs to change. The dairy industry's goal of 4% productivity gain per year has raised concerns about the viability of smaller farms, as they have fewer options for inaproving staff and input productivity than do larger farms. There was also concern that land prices in many sectors are too high for the returns gained, and capital gains from farms are decreasing.
Tariff & Trade Issues
Mm'ket access issues were of significant concern in many sectors, and maintaining and increasing New Zealand's market access for our primary product exports was considered a key priority. There was concern that many of New Zealand's primary product exports face significant tariffs in overseas markets, yet New Zealand has very low levels of tariffs on imports, Concern was expressed that New Zealand producers are disadvantaged by the biosecurity policies of other countries.
There were concerns that a user-pays approach has been adopted for some market access issues, e.g.: MAP charging exporters for negotiating market access on phytosanitary grounds. Once clearance has been obtained, other exporters can free-ride on the initial exporter's investment. MAP's charges for these services are viewed as unfair, as in the past negotiating market access was seen as a core government activity.
Australian wine was reportedly being sold on the New Zealand market at below marginal cost, but under the CER agreement there are no anti-dumping provisions. Australian wines are having a significant impact at the lower end of New Zealand's domestic market, making it difficult for New Zealand wineries to compete, In the kiwifruit industry there is concern about non-Zespri International Limited kiwifruit being exported to Australia by New Zealand companies, and then re-exported to other markets - the 'intentional' export of non-ZIL kiwifruit to any country other than Australia is not permitted. There is a belief by some that the Government should review the bilateral agreements to enforce the existing transhipment controls. There was also concern at perceived global misconceptions surrounding red meat and aninaal welfare issues. A growing proportion of international consumers do not accept that red meat is good for them, or that its production complies with their view of acceptable health and animal welfare standards.
Taxation
There was concern that any further increases in income tax rates will lead to processing and marketing companies, and research institutions, having difficulty in recruiting skilled staff from overseas, and will motivate staff on higher incomes to emigrate to countries where relative net incomes are higher. High tax rates were considered a disincentive for industry investment.
Higher levels of profit than in previous seasons, combined with tax rate increases had producers concerned about managing their taxation. Fanners and growers have to preclict what their incomes are going to be over the following year for tax purposes. If the predictions are incorrect, as they are in most instances due to climate and market fluctuations, producers reported that they are then penalised. Some fanners desired a 'tax-averaging' system that will take the lows and highs out of the tax payment system for primary producers. There were also concerns about the time involved, and the cost associated with administering GST.
8
(J1 "'-I
Excise Tax was a major concern to the winegrape industry, and was considered to be a barrier to new investment. While the domestic price of wine hns remained relatively static over time, the rate of excise tax has continued to increase, leading to shrinking grower and processor margins. Some smaller growers are unhappy with the disproportionate return that they receive from a bottle of wine, where the excise tax is often up to double the grower's retum.
Telecommunications
There were concerns about insufficient lineage and line capacity in IUral areas. The current network exchanges can not sustain the peak loads. Other problems experienced in rural area include deficient fax delivery, and noise on the line due to interruptions from electric fences. Not all Telecom services are available in rural areas, and Emergency III calls do not go through in some areas. While many fmmers are computer literate, many are being shut out of the rapid growth of e-COlmnerce and Intemet usage because of access problems, and producers have encountered problems with data transfers and downloading infornlation. Internet and email access in many rural areas at peak usage times is slow. The use of mobile telephones is not always effective or possible in some rural areas. Cellphone coverage was considered by many to be inadequate in some agritourism locations, such as Matlinborough.
Telecom was reported by one sector interest group to be unaware of the extent of the rural telecommunication issues, and by another to be indifferent to the various concerns. Social responsibility was seen as an industry matter, but Telecom did not see itself as 'the industry'. Kiwi shat'e responsibilities for Telecom were seen as very limited. Some farmers considered that Telecom should not be left with the task of supplying universal access. They considered this issue to be a barrier to growth in the rural sector, atld believed that government intervention was necessary.
TransRort & Roading
There was widespread concern among many in the sectors that road user charges and petrol excise taxes are not dedicated to road development and maintenatlce. The inadequate number of effluent disposal sites for stock trucks was also of concern. Effluent storage trays on trucks get full during long trips and can't be emptied at the side of the roads, while dumping effluent at meat compatlies imposes disposal costs on the companies.
The forestry industry was regarded as being at a disadvantage relative to its overseas competitors due to the low maximum payloads of logging trucks. New Zealand's laden-weight allowances were considered to be among the lowest in the world. It was considered that there was a need for the forward planning of roading to cater for the large increases in forestry traffic predicted for the future, especially in those areas where major hat'vest increases at'e expected. There was concem about the need for farm roads to be maintained, atld questions over who should be made to pay for upgrading bridges in nITal at'eas to cater for forestry traffic.
The Transit New Zealand cost-benefit analysis framework was considered by some respondents to be inappropriate and biased towat'ds flat land and heavy population areas. It fails to recognise the network concept, and is more in favour of max..iJnising benefits. It was considered that the Government should investigate the adoption of a long-term road development strategy in keeping with future road use projections. This may resuit in key arterial roads receiving a more appropriate apportionment of expenditure, and the useful life requirement resulting in more robust design. Road planning and construction was considered inefficient due to the excessive numbers of local authorities involved, the adhoc nature of funding and planning, and differing roading policies between various authorities. There was concern that policy initiatives such as tolls atld increased road user charges would be passed on to fanners through higher freight rates. Many respondents felt that user pays' lnight mean main highways are funded, but not other smaller roads.
The cost and availability of airfreight for perishable goods was of concern, as often goods are not taken as a priority. The costs of transporting perishable goods within New Zealand at'e also extremely high. There was concem that the competitiveness of moving product from the South Island to the North Island was
9
reducing compared to TransTasman freight rates. International shipping was a major cost in many of the sectors, but there had been no developments towards reducing shipping costs.
In many areas the communities can't afford the level of funding needed to maintain local roads, as there are many other demands on their money. The rural elderly in particular face additional challenges when going for driver's licences, such as being made to drive in town when most of their driving may be in country areas.
Other Compliance Costs
There was concern that compliance costs in general are too high in New Zealand, especially the amount of reporting for smaller businesses. Many respondents believed that compliance costs are becoming an impedinlent to fanning and business development. The compounding effect of compliance costs was a concern to many, and it was suggested that a person employing 5 people needs one fulltime person to comply with the paper work.
Other Concerns
Many farmers were very concerned about the theft of stock from fmms, and considered that unless the laws were changed and the penalties considerably increased to act as a deterrent, then the problem will get worse. Marijuana was reported to be a problem in maize growing areas. Many farmers felt at risk and considered that there is insufficient attention from the police when fmmers discover plots in their crop. It was believed that performance has to improve within the primary sector. There was seen to be a need to increase the level of innovation in the land-based biological industry where compat'ative advantage exists and core competence and competitive gains can be made.
Concern was expressed that New Zealand is losing a huge opportunity by not looking closely at the clustering of industries. For example, New Zealand's stainless steel technology development, as used in the dairy industry, was considered to be world-class. This technology could have been adapted for wider use in the wine industry, but instead the New Zealand wine industry is importing overseas equipment.
10

en CO
INDUSTRALISATION OF THE NEW ZEALAND PORK INDUSTRY
Amanda Ryan New Zealand Pork Industry Board
PO Box 4048 Wellington
Internationally the pork industry is becoming co-ordinated and increasingly industrial j in its production and distribution. A review of the changes to the American pork industry has shown how some of these ch\lnges have resulted in an almost completely integrated industry. There is evidence of some of these changes occurring in the New Zealand pork industry with consolidation of the industry, emergence of producer groups and differentiation of products.
Conjecture as to what the New Zealand pork industry could look like in five years time gives an indication of the commercial focus that the industry could achieve, as well as the dramatic change of focus and paradigm shift in thinking that would be required to reach it.
Keywords: Industrialisation, pork industry, integration, New Zealand pork
INTRODUCTION
Patterns and trends are emerging in world agriculture as a result of changes in world food demand, developments in marketing, economic pressures on farms, changes in management and more intensive production systems (Studley 1998). I
More specifically these trends include: • rapidly rising populations and incomes in developing nations which has lifted
the demand for agricultural products; • increasing agriculture production and productivity, with more intensive
production systems; • growth in exporting of agricultural products; • rising consumer expectations of quality and food safety; • increasing number of niches for diversified and branded agricultural products; • polarisation in farm size with fewer and larger commercial farms as well as a
growing number of lifestyle farms; • information technology resulting in increased communication and
management tools; • business relationships getting closer with more alliances and joint ventures.
In some cases these changes have occurred forcibly as agriculture changes from a way of life and independence, to that of a business with dependence on others (Boehlje 1995).
1 The application of modern industrial manufacturing, production, procurement, distribution and coordination concepts to the food and industrial product chain.
Although the term "the Industrialisation of Agriculture" did not occur until the early 1990's (Urban in Boehlje 1995) the broiler industry (chickens raised for meat) underwent major structural change in the 1950s in the USA and is seen as one of the first examples of industrialisation. A simple definition of industrialisation is:
The application of modern industrial manufacturing, production, procurement, distribution and coordination concepts to the food and industrial product chain. (Boehlje 1995)
Boehlje believes the industrialisation of agriculture results in a paradigm shift in thinking and concepts about agriculture, a few of which are summarised below:
Table 1 Paradigm shifts in Agriculture
Old Concept Commodities Assets drive the business Impersonal/open markets
New Concept Specific attribute/differentiated raw materials Customer drives the business Personal/negotiated / closed markets
Investigation was undertaken to determine the extent of industrialisation that had taken place in the New Zealand pork industry, but prior to this a case study was made of industrialisation in the United States pork industry. This industrl' is currently undergoing industrialisation, identified by increasing numbers of hogs sold through contracts, use of new technology and new geographical areas of production and growth in firm size.
SECTION 1. A REVIEW OF INDUSTRIALISATION AND THE USA HOG INDUSTRY
Overviews of the trends occurring within the U.S. hog industry are as follows:
1.1 Changing pattern in types of farms operated Hog farms and farmers are becoming increasingly specialised. In order to reduce the risk of disease outbreaks and improve the use of facilities many hogs are now no longer produced on fan'ow-to-finish operations. Instead hogs are typically produced on three separate sites; a unit for breeding, gestation and farrowing, a nursery facility once the hogs have been weaned, and once the hogs are approximately 10 weeks old, a third site for finishing where they are grown to market weight (Martinez 1999).
1.2 Change in numbers and size of farming operations The number of hog farms in the USA has dropped as declining hog prices has put small andlor inefficient farmers out of business. Records show that there was a drop of 77 percent of farming operations with hogs from 1980 to 1986, or three farms in four (Boehlje et al 1997). The average size of farms has increased. In 1997, 16 percent of the US swine population was raised in operations with between 1,000 and 2,000 head, with "mega-producers" (inventories of over 2,000 head) providing 55
2 Note the term hogs is used in this section in order to stay tme to the literature. Hog is an American tenn and pigs or swine can be used interchangeably.
UI CD
percent of the total supply to market. The total of 71 % of pigs being produced by farmers with over 1,000 head compares to 37 percent in 1987 (Martinez 1999).
1.3 Change in amount of nork nroduced Advances in technology have resulted in larger litters per year per sow, with the numbers of pigs weaned from each litter reaching 8.64 in 1997(Mattinez 1999). Individual hog size has increased, resulting in a given quantity of pork produced from fewer hogs, with less feed and less labour. The amount of pork produced per head of breeding stock is now over 2,500 pounds compared to 1,400 in 1978 (Martinez 1999). Since 1990 the total US pork production has increased by an annual average of 1.8 percent per year.
The growth in production has not been reflected a growth in consumption with a trend of between 48 and 53 pounds per capita per year since 1982 (Boehlje etal 1997). Although production has needed to increase to keep up with growing American population, export of pork now is a growing aspect of the business.
1.4 Change in owners\lin natterm Traditionally hogs have been sold on the open market, with producers growing pigs then selling them to the best buyer at the end of finishing. With production broken down into three sites, large hog producers are establishing production contracts with other growers for specific operations such as finishing. The hog producer or their organisation may provide management services, the hogs, feed and veterinary medicine and contract growers to provide the labour and facilities. These individuals or companies are called integrators.
Other types of integration patterns include a number of producers getting together to co-ordinate and/or own the production, marketing, genetics or processing companies; and joint ventures with feed suppliers, transporters, packers or processors.
1.5 Changes in farms - geogranhy Until recently the USA the hog farm belt matched the grain belt, so where the climate allowed for grain growing, hog farms proliferated. Most of these farms were orientated around using homegrown grains and on-fat'm milling. Hog farming is now occuning in non-traditional farm areas, due to contracting and the utilisation of specialised feed. In North Carolina, the reduction in tobacco cropping and the familiarity of farmers with broiler contracting, has lead to an increase in connl1ercially integrated hog farming (Martinez 1999).
1.6 Growth in Packers In the USA the companies that buy hogs, slaughter and process the pork into either cuts or into further processed products are called packers. The size of these operations has increased with the number of packers with a capacity to kill 1.5 million head growing from 6 plants accounting for 17 percent of total processing in 1982, to 28 plants of this size processing 80 percent of total kill in 1996 (Boehlje etal 1997).
The growth in pig numbers may have outpaced the packer's ability as inadequate capacity in hog slaughter facilities is blamed for the dramatic drop in hog prices in December 1998 to below the prices received in the Great Depression (Jones et al
1999). Access to confirmed "shackle space" within abattoirs has encouraged the formation of contracts between growers and packers.
I. 7 Lowering cost of nroduction Integrators or owners of lat'ge fat'ms have reduced their costs in a number of ways, generally due to increasing scale. A fully integrated operation is likely to contain a feed mill as part of the supply chain and highly specialised feed is created for the specific needs of the hogs and brought on to the farm instead of using smaller less efficient on-farm feed mills (Schrader and Boehlje 1996). With more precise rations and less wastage the result is cost savings, especially when it is commonly accepted that feed makes up 60 to 70 percent of the production of pork meat.
Research has shown that large specialised farms have total costs of production that are at'ound 10 percent lower than traditional farrow-to-finish operations if advantages in inputs such as cheap feed are excluded (Good in Martinez 1999).
1.8 Industry is closer to consumer and nroviding cheaner retail nork nrices Consumers are demanding a greater diversity of products, some with very specific characteristics to be available when they want them. Increasingly as packers and other integrators are closer to the consumer than the producer on-fat'm, they have more knowledge as to the pork products that best suit the market. Therefore through contracts and integration, they are providing the market signals and information to producers. Some integrated companies such as Seaboard farms have decided they cannot compete on the basis of high volume and low cost, and have instead opted for a value-added differentiated product strategy (Boehlje etal 1997).
The growth in the US Hog industry has enabled cheaper pork to appear on the retail market. Fresh pork sales to retailers are usually negotiated day to day, showing only limited branding programmes by retail stores or the integrators (Schrader 1998).
1.9 Control over quality Packers have to bear high fixed costs, but additional costs are associated with vat'iable supply flows and poor-quality hogs. A survey of US pork packing companies found that quality problems such as excess fat, PSE and carcass defects cost about US$IO per hog (National Pork Producers Council in Martinez 1999). It was estimated 80 percent of the total problem cost could be controlled at farm level, which has meant packers are increasingly becoming integrators. They buy hogs based on a market-specific contract that allows for a large stable flow of high quality uniform hogs and therefore lowers their costs and allows for increased growth.
Increasing integration in the hog industry allows for the implementation of food safety regulations as part of a contract. As new methods of reducing pathogens are discovered they can readily be implemented on-farm and as a requirement to fulfil a contract.
1.10 Increasing use of technology Advances have occurred in almost all aspects of hog farming such as genetics, nutrition, housing and veterinary medicine which allows for an improvement in the health of hogs, and therefore the ability to house larger numbers of hogs together.
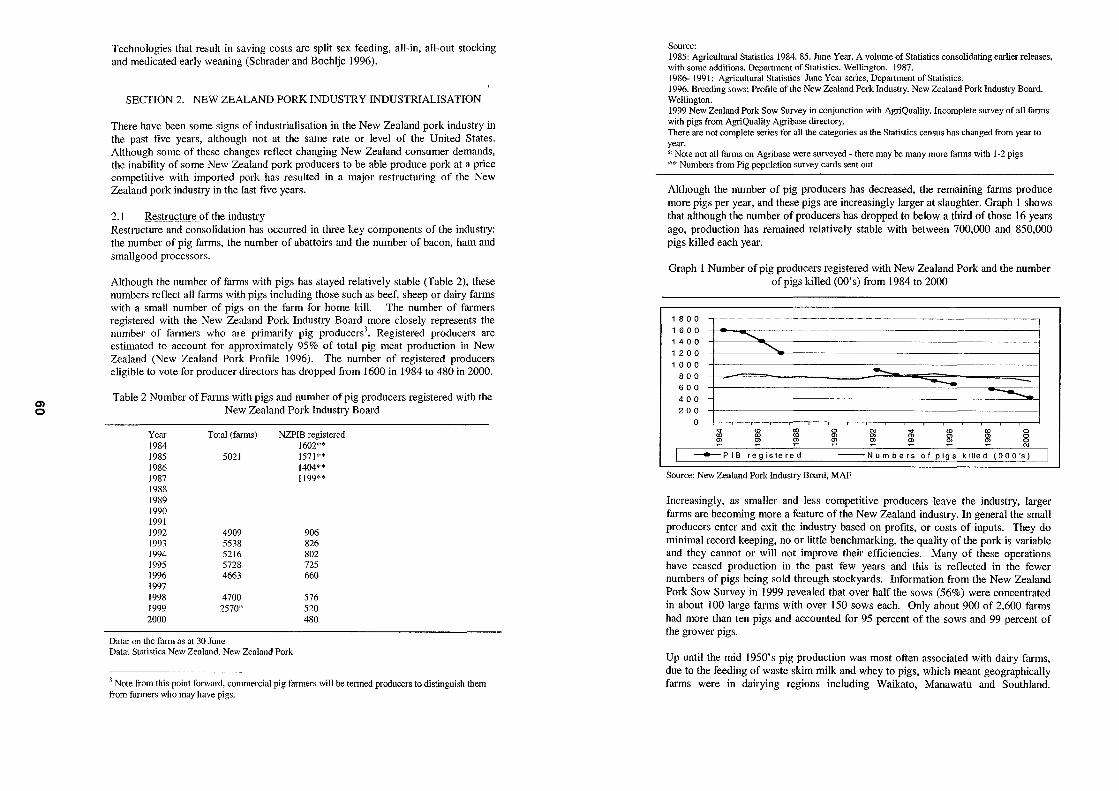
Ol o
Technologies that result in saving costs are split sex feeding, all-in, all-out stocking and medicated early weaning (Schrader and Boehlje 1996).
SECTION 2. NEW ZEALAND PORK INDUSTRY INDUSTRIALISATION
There have been some signs of industrialisation in the New Zealand pork industry in the past five years, although not at the same rate or level of the United States. Although some of these changes reflect changing New Zealand consumer demands, the inability of some New Zealand pork producers to be able produce pork at a plice competitive with imported pork has resulted in a major restructuring of the New Zealand pork industry in the last five years.
2. I Restructure of the industry Restructure and consolidation has occurred in three key components of the industry: the number of pig farms, the number of abattoirs and the number of bacon, ham and smallgood processors.
Although the number of farms with pigs has stayed relatively stable (Table 2), these numbers reflect all farms with pigs including those such as beef, sheep or dairy farms with a small number of pigs on the farm for home kill. The number of farmers registered with the New Zealand Pork Industry Board more closely represents the number of farmers who are primarily pig producers3
. Registered producers are estimated to account for approximately 95% of total pig meat production in New Zealand (New Zealand Pork Profile 1996). The number of registered producers eligible to vote for producer directors has dropped from 1600 in 1984 to 480 in 2000.
Table 2 Number of Farms with pigs and number of pig producers registered with the New Zealand Pork Industry Board
Year Total (fm'ms) 1984 1985 5021 1986 1987 1988 1989 1990 1991 1992 1993 1994 1995 1996 1997 1998 1999 2000
4909 5538 5216 5728 4663
4700 2570"
Data: on the farm as at 30 June
NZPIB registered 1602** 1571** 1404** 1199**
906 826 802 725 660
576 520 480
Data: Statistics New Zealand, New Zealand Pork
. 1 Note from this point forward, commercial pig farmers will be tenned producers to distinguish them from farmers who may have pigs.
Source: 1985: Agricu1tmal Statistics 1984. 85. June Year. A volume of Statistics consolidating earlier releases, with some additions. Department of Statistics. Wellington. 1987. 1986- 1991: Agricultural Statistics June Year series, Department of Statistics. 1996. Breeding sows: Profile of the New Zealand Pork Industry. New Zealand Pork Industry Board. Wellington. 1999 New Zealand Pork Sow Survey in conjunction with AgriQuaiity. Incomplete smvey of all farms with pigs from AgriQuality Agribase directory. There are not complete series for all the categories as the Statistics census has changed from year to year. * Note not all farms on Agribase were surveyed - there may be many more fanns with 1-2 pigs ** Numbers from Pig population survey cards sent out
Although the number of pig producers has decreased, the remaining farms produce more pigs per year, and these pigs are increasingly larger at slaughter. Graph I shows that although the number of producers has dropped to below a third of those 16 years ago, production has remained relatively stable with between 700,000 and 850,000 pigs killed each year.
Graph 1 Number of pig producers registered with New Zealand Pork and the number of pigs killed (OO's) from 1984 to 2000
1800
1600 1400 1200 1000
800 600 400 200
o
........... _ .. _ .. '"'" ............... --- ............. _ .................... _----------
--....... ""'- - --- ---
~ m 00 0 N v W ro 0 00 00 00 m m m m m a m m m m m m m m 0
N
-PIB registered ---Numbers of pigs killed (OOO's)
Source: New Zealand Pork Industry Board, MAP
Increasingly, as smaller and less competitive producers leave the industry, larger farms are becoming more a feature of the New Zealand industry. In general the small producers enter and exit the industry based on profits, or costs of inputs. They do minimal record keeping, no or little benchmarking, the quality of the pork is variable and they cannot or will not improve their efficiencies. Many of these operations have ceased production in the past few years and this is reflected in the fewer numbers of pigs being sold through stockyards. Information from the New Zealand Pork Sow Survey in 1999 revealed that over half the sows (56%) were concentrated in about 100 large farms with over 150 sows each. Only about 900 of 2,600 farms had more than ten pigs and accounted for 95 percent of the sows and 99 percent of the grower pigs.
Up until the mid 1950's pig production was most often associated with dairy farms, due to the feeding of waste skim milk and whey to pigs, which meant geographically farms were in dairying regions including Waikato, Manawatu and Southland .
0') ....
Technology changed allowing for waste dairy products to be utilised and by the mid 1960s most pig farmers had become reliant on grain feeding. This resulted in a geographical change with pig production becoming a significant feature of Canterbury farming. In the year to September 2000, 54 percent of pigs killed were from the South Island, with most production in the North Canterbury district. In the past two years most of the drop in kill has been from the southern half of the North Island, with some producers going out of business.
The number of abattoirs has shown some consolidation in recent years. Historically New Zealand has relied on its meat processing export industry, which resulted in a large number of abattoirs, killing most species and with a wide geographical spread. Many of these abattoirs have adapted to run pigs through their sheep kill lines, with often half a day a week set aside to process the pigs from the local area. In the ten years from 1990 the number of abattoirs killing pigs has dropped from 32 to 15.
Table 3 Number of abattoirs licensed to kill pigs in New Zealand.
11990 11991 11992 11993 1994 199511996 1997 11998 11999 2000
I 32 I 28 I 27 I 23 22 21 I 21 19 I 17 I 16 15 Source:New Zealand Pork. March year.
The Commerce Commission analysed the slaughtering industry in 1995 and stated there was excess capacity in the slaughtering industry and suggested that reducing the number of abattoirs would promote the efficiency and profitability of the industry (Hughes Consulting November 1998). Currently seven out of fifteen abattoirs are killing an average of 44 to 270 pigs a week and represent only 9 percent of the total kill, whereas the top seven abattoirs are killing 88 percent of the total kill. Specialisation is occurring as the four abattoirs with pig-only kill chains killed 53 percent of all the pigs in New Zealand in the year 2000.
Table 4: The number of Bacon, Ham and Smallgoods Processors In New Zealand
r 1989 1990 1991 1992 1993 1994 1995 1 1996 1 1997 1 19?8 1
I 93 95 87 84 77 84 I 77 I 75 I NA* I -~ Source: Bacon, Ham and Small goods Processors, Statistics New Zealand. February year. '" Note: The survey by Statistics New Zealand is no longer being undertaken.
Although Statistics New Zealand is no longer keeping information on the number of bacon, ham and smallgoods processors in New Zealand, it is thought that the number is now less than 50, showing a 50 percent drop in 10 years (Table 4). Many small firms, especially those in rural areas have ceased operations, especially with the increase in imported pork. Currently there are approximately 20 major processors, six of which use 50 - 100 percent imported pork to manufacture bacon, ham and smallgoods (New Zealand Pork Temporary Safeguards Application background information 1999).
The above information has demonstrated the consolidation of the three major aspects of the New Zealand Pork Industry. However there are other indications of industrialisation in the New Zealand pork industry including the development of producer groups, product differentiation and farm specialisation.
2.2 Development of Producer Groups New Zealand pig producers are still by and large price takers. It is estimated 80 to 90 percent of pigs sold by producers are to a regular wholesaler and will usually involve some form of agreement on the expected numbers each week and possibly the grade and/or quality (Hughes Consulting November 1998). In return they are paid the schedule price determined by the wholesaler, with possibly a negotiated "premium" on top of this. It is unlikely that this is a formal contract with any kinds or penalties, rather more a "gentleman's agreement". Some wholesalers are abattoirs that set a schedule and buy a number of species to slaughter and supply carcasses and/or cuts to the retail or butchery trade.
Dissatisfaction with this arrangement has lead to an increasing number of producers working together in the form of producer groups who have become the main wholesalers of pork carcasses. Examples include Pork Corp and Fresh Pork based in Canterbury and Five Star Pork in the Manawatu. In the 2000 year, 60 percent of pigs were thought to be bought or sold through one of these producer groups. Currently the focus of these groups seems to be on assisting producers to sell pigs rather than marketing pork or meeting specific customer requirements.
Although there is little evidence, it is likely that in the future there will be more contractual arrangements and change of ownership patterns within these producer groups as they seek to guarantee supply and quality. The producer groups are starting to investigate the possibilities afforded by alliances between producers including increased buying power for inputs, opportunity to brand their own pork products and benchmarking their production and progress. All producer groups are using some form of benchmarking scheme to track their progress through time, with data collected on-farm by staff and consultant veterinarians, and at the point of kill.
2.3 Development of Product Differentiation Although the producer groups focus on supplying the supermarkets and retail trade with half or full carcasses, product differentiation is occurring of various types. The most basic is the introduction of cutting floors into abattoirs such as Bay City Meats in Timaru. The pig carcass is reduced into primal cuts and sub primals in order to meet a retail market that increasingly, is showing reluctance to have in-supermarket butchers.
Other firms have carved out a market niche by supplying a differentiated product into a specific market.
Examples include: Murrellen Pork - branded quality assured pork using the PQIP system from farm to retail. The Pork Market - supplying restaurant and the highly selective ethnic Chinese market. Waratahfarms - high end restaurant market

Q) I\)
Harmony meats - organic pork Pacific Choice - the cultural Pacific Island market in Auckland
2.4 Specialisation of farmin~ Some parts of the industry are moving towards specialisation of farming and producers buy weaners on the spot market, or receive porkers to finish from another farm. For example Paparoa Prison's piggery currently produces approximately 20,000, 18kg weaner pigs per annum. All this production is sold to Willaden Farms which grows these animals to slaughter-weight under contract to Fresh-Pork.
Information fi'om the New Zealand Pork Sow Survey in 1999 indicated that 291 out of the 911 (or 32 percent) of farms with more than 10 pigs considered themselves to be primarily involved in weaner production. 12 percent of the farms surveyed considered themselves to be involved in finishing the pigs to slaughter weight with the remaining in farrow to finish operations.
SECTION 3: THE NEW ZEALAND PORK INDUSTRY IN FIVE YEARS TIME - THE POTENTIAL
Although there are increasing signs of industrialisation in the New Zealand pork industry, any lack of industrialisation would not be a problem in a traditional commodity market where specific attributes are not demanded, supplies are fully adequate and can be obtained fi.-om various sources, and information flow between stages in the chain are minimal (Schrader and Boehlje 1996). Although this probably defined the New Zealand Pork industry of ten years ago, the current mode of growing and marketing pigs cannot survive in a market that is increasingly demanding greater diversity of pork products, more consistent quality of pigs and more control over a consistent supply of pigs to market. The following are comments and conjecture on what the industry could potentially look like in five years time 4.
3.1 Size and geography of farms The next five years will show even greater division between the small to average size producers and those with large commercial operations. In five year's time the vast majority of pork supplied to the retail markets will come from approximately 100 large farms, a quarter of which will have over 1,000 sows. These farms will be highly specialised operations, with some will concentrating on breeder operations, while others focus on weaners or finishers. Nutritionists and veterinarians will be an integral part of the business, controlling inputs and monitoring costs. Specialised compollnd feed will be the feed of choice with specific rations for each age group of pig. These producers will all know the exact cost of production for their pigs at any given time and will have full and complete records.
Although farms have traditionally been close to the main centres of population, pressure fi'om regional councils regarding emissions to land, air and water will continue to limit the growth of existing farms. For this reason these large farms will either be in a region with a supp011ive council, or new developments in remote, yet climatically suitable areas. Breeding outdoors will continue to be a viable option in
4 Note these are personal comments based on my observations of the New Zealand pork industry and study of the USA hog industry and are not necessarily the views of the New Zealand Pork Industry Board.
Canterbury, but larger straw based housing will be developed for growing and fattening.
3.2 Ownership of the industry In 2005 there will be only three producer wholesaling groups: one in the North Island and two in the South island. 90 percent of the large farms will be involved with some form of contractual arrangement, either supplying their own wholesaler or contracting to a producer group. These will be formal agreements based on numbers, weight, lean meat measurements, appearance (including colour), and eating quality (including texture, taste, tenderness). The producer groups will ensure they get a return on investment and are likely to have invested in more than just pig farms. Other parts of the industry will become integrated with pig farms such as grain production, abattoir operations, processors and retail.
The spot market will be very small and cater for the few remaining small butchers or processors that remain. The determinant of price for pigs on the spot market will be difficult to ascertain and will have to be done on a case by case basis. This is because in five year's time there will no longer be a "schedule price" matrix available through wholesalers, as the vast majority of pigs will be sold or owned based on a contract.
3.3 Consumer Focus The variable supply to market with undersupply and then stockpiling, which has been a feature of the pig industry for many years will no longer be an issue in five year's time. A closer relationship and communication between the wholesalers and buyers will have smoothed the supply curves with the use of forward contracts for supply and forewarning of fluctuations in demand and supply.
The three remaining pig abattoirs for the industry will all have cutting floors and innovations in the cutting of pigs into primal's and an extended shelf life will be providing specific cuts into the retail market. The abattoirs will have contracts with the wholesaler groups, so that they have priority for shackle space. Pork will be seen as a convenient and possibly more healthy and flavoursome alternative to chicken. Consumers will be able to purchase more ready-made and fast porklhamlbacon meal alternatives.
The wholesaler producer groups will have greater knowledge about what the consumer wants in regards to eating quality and consistency and will be able to provide this at a competitive price compared to other meats. They will undertake market research to determine these factors, and use genetics and breeding as one means to achieve them. All three producer groups and other producer owned companies will have branded fresh pork available, as well as a commodity range. Pork will be branded on a perceived attribute the customer is prepared to pay a premium for, for example free range, additive free, organic or quality approved. They will finance marketing campaigns with the major retailers to position their brand. Some farms have already and will continue to specialise into certain markets such as the high quality restaurant grade pork, totally free range or modified pork with health benefits. One or two might even be in completely niche non-food areas such as pig organs for xenotransplantation or production of semen.

Ol W
Consumers will have full confidence that the pork they consume meets their requirements and humane treatment and production practices will be a given. It is likely that there will be a legal requirement for each farm to have a HACCP based system with critical control points to ensure food safety, residue control and potential disease incursions.
3.4 Use of technology In the future, through contracts many farms will share the same genetic stock, the same feed supplier and the same veterinarian and nutritionist. This will make technology transfer much quicker and the uptake of new technologies easier. Producer groups will utilise the internet and other communication strategies in order to run their business and access international technology and knowledge. They will also invest money into solving production issues on-farm, developing added value products and maintaining their human technical resources.
The next ten years will bring the knowledge of the complete pig genome and the possibilities for use of genetic manipulation that it brings. Although the research might not be done in New Zealand, it is likely that New Zealand producers will source genetic stock and semen from overseas in the future in order to remain competitive. They are more likely to use artificial insemination more frequently.
3.5 Growth in industry The New Zealand pork industry will have doubled its output in pig numbers and tonnage by the year 2006 to one million pigs killed per annum. Part of this will be due to increased technologies in the larger farms as well as the consumption of fresh pork and processed pork products having risen to 20kg per capita per year. The main reason for the growth will be to meet the demand from the export market. The tlu'ee producer groups will be providing niche consumer products with the New Zealand Pork brand into a number of Asian markets, with a reputation for quality, consistency and innovation to meet the customer's requirements.
DISCUSSION
The New Zealand pork industry has shown some signs of consolidation, some development of industry wholesaler groups and limited differentiation of product and farlning operations. However the industry as a whole is yet to undertake the paradigm shift in thinking and actions that Boehlje (1995) would characterise as industrialisation. Pigs are still seen as a commodity, selling is based on a carcass and producers of pigs, as a whole do not see themselves as part of the food business. By using conjecture, a future can be envisioned for the New Zealand pork industry, but it is up to leaders within the industry to change their way of thinking about pork production and progress their businesses.
REFERENCES
Boehlje, M. (1995). Industrialization of Agriculture: What are the consequences? Agricultural Economics Miscellaneous RepOlt No. 176. Industrialization of Heartland Agriculture Conference Proceedings. NOIth Dakota State University Department of Agricultural Economics.
Boehlje, M, Clark, K, Hurt, C, Hones, 0, Miller, A, Richert, B, Singleton, W & Schinkckel, A (1997). Food System 21: Gearing up for the New Millennium - The HoglPork Sector. Staff Paper # 97-19. Department of Agricultural Economics. Purdue University.
Dobson, D. (Ed). (1996). Profile of the New Zealand Pork Industry. Updated 2000. New Zealand Pork, Wellington.
Gregory, N.G. and Devine, C.D. (1999). Survey of sow accommodation systems used in New Zealand. New Zealand Journal of Agricultural Research Vol 42: 187-194. The Royal Society of New Zealand.
Hughes Consulting Limited (1998), The Strategic Marketing of Pigs , for New Zealand Pork, Wellington.
Hughes Consulting Limited. (1997). Review of the factors influencing the demand for pigs: Implications for improving the selling system. for New Zealand Pork, Wellington.
Hughes Consulting Limited. (1999). Feasibility Study of Exporting Pork to Selected Markets. Volume I: Key Competitors USA, Canada and Denmark Volume 2 Niche Markets: Organic Pigs, Wild Boar and Pork Variety Meats Volume 3 Emerging Markets: China and Korea Volume 4 Japan Volume 5 Major Markets: Hong Kong Volume 6 Singapore Volume 7 Australia For New Zealand Pork, Wellington.
Jones, B. R, Fulton, J. R and Dooley, F. J (1999). Hog Producer Investment in Value Added Agribusiness: Risk and Return Implications. American Agricultural Economics Association Annual Meeting, Nashville.
MAF Agricultural Statistics (1999). Retrieved from the World Wide Web: URL: http://www.maf.govt.nz/statistics/prirnaryindustries/index.htm
Martinez, Steve W (1999) Vertical Coordination in the Pork and Broiler Industries: Implications for Pork and Chicken Products. Food and Rural Economics Division, Economics Research Service, Agricultural Economic Report No. 777. U.S. Department of Agriculture.
Schrader, Lee F and Boehlje, M (1996). Staff Paper 96-21 Cooperative Coordination in the Hog-Pork System: Examples from Europe and the US. Department of Agricultural Economics. Purdue University.
Schrader, Lee F. (1998). Coordination in the United States Hog I Pork industry. Staff Paper # 98-19. Department of Agricultural Economics. Purdue University.
en ~
DAIRYING mE NEW BOOM INDUSTRY
Chris Ward MAF Policy, Wellington
SUMMARY
Dairying profitability has rapidly increased and, compared to other farming sectors, is providing the best returns on capital. It seems destined to grow mainly in the South Island, as returns on capital are higher. Looking forward, positive global factors seem to outweigh negative factors, yet New Zealand will need to contain our on-farm and beyond production costs to cement ourselves in as the most competitive provider of dairy products to the world.
KEYWORDS
Profitability, returns on capital, positive and negative influences, export driver
Introduction
MAF Farm Monitoring seeks to determine production, financial, and trends and issues information every June. The data gathered provides an excellent, comprehensive, nation-wide picture of the current and forecast on-farm situation. Approximately 100 dairy farmers provide budgets and their responses to a series of topical questions. Combining this information with statistics, forecasting information, and industry comment provides some insight into the current and likely future success of dairy farming.
Current Profitability of Dairy Farming
As shown in Table 1. the profitability of dairy farming in 2000101 has outshone the other major sectors.
Table I: Profitability Between Sectors NTP before tax
Capital Fann Type
No wages involved
Retllm
200012001 of management
atopel1illg 011 Assets
deducted ($)
(%) ($)
Dairy Waikato 147,749 1,690,150 8.7 Dairy Lower North island 167,666 1,305,987 12.8 Dairy Southland 405,245 2,956,987 14.9 S&B Central North Island 125,928 1,546,110 8.0 S&B ManawatulRangitikei 155,047 2,106,139 7.3 Deer North Island 93,630 1,058,750 8.7 Arable Canterbury 74,100 2,088,000 4.4
Returns on capital, after wages of management have been deducted, clearly show higher returns in the South Island, which has a cheaper land resource. Large dairy conversions with irrigation have produced higher per hectare and per cow returns than initially budgeted, aiding higher returns on capital. Table 2 illustrates this situation.
Dairy properties have not only recorded very high returns on opening capital relative to past years, but have, according to MAF Monitoring in May 2001, increased significantly in value as shown in Table 2.
Table 2: Total Capital Involved by Model Value Value
Gain in value 30 June 2000 $lkgMS 30 June 2001 $lkgMS
($) ($) (%)
Northland 1,035,065 18.23 1,141,588 19.33 10.3 Waikato 1,690,150 24.89 1,900,035 27.57 12.4 Lower Nl 1,305,987 21.23 1,406,621 20.99 7.7 Canterbury 3,094,900 17.68 4,217,000 22.10 36.2 Southland 2,956,987 19.51 3,666,639 22.08 24.9
The New Zealand Dairy Board, through its former subsidiary Dexcel, is exhorting farmers to plan and aspire to a 4% improvement per annum in productivity. This is defined as the value of outputs divided by the value of inputs; where the value of outputs is the gross farm revenue and company dividends, and the value of inputs is the cost of total capital, overheads and variable costs.
Looking at progress since this "catch cry" was made reads very encouragingly. For the year ending 30 June 2000, productivity as defined increased by 11 % between 1999 and 2000, 47% this year, and on MAF projections will decrease by 5.6% next year.
What then are the positive influences currently impacting on the dairy sector? MAF sees them as follows:
• World demand increasing faster than world production. The continuation of this is very dependent on world economic growth.
• Asian tastes for products made with cheese.
• A switch by European consumers to cheese as a protein choice, as a consequence of BSE.
• EU production decline as governments provide incentives for more extensive farming.
• Global Co efficiencies, reported to be worth up to $300 million a year.
• Farmer control of the industry, but this may restrict the introduction of new capital for processing. There is plenty of evidence that farmers are looking to expand their farming operations using existing farm cash surpluses rather than buying more shares in their dairy company.
• Our low on-farm costs. A comparison with Britain in 2000 shows the following:
Table 3: New Zealand versus Great Britain on Farm Costs 2000 Year Lower North Island Farm size (ha) 80 Total milksolids (kgMS) 63,000 Number of dairy cows 213 Cost of buying a cow $1,000 Milksolids/cow 315 Return (clkgMS) 358 Variable FWElkgMS - cents 132 Machinery costs/kgMS - cents 36 Fixed costs/kgMS - cents 40 Total costs/kgMS - cents 208
Great Britain 102
90,000 157
$2,400 573 850
296 mostly animal health 152 88
538
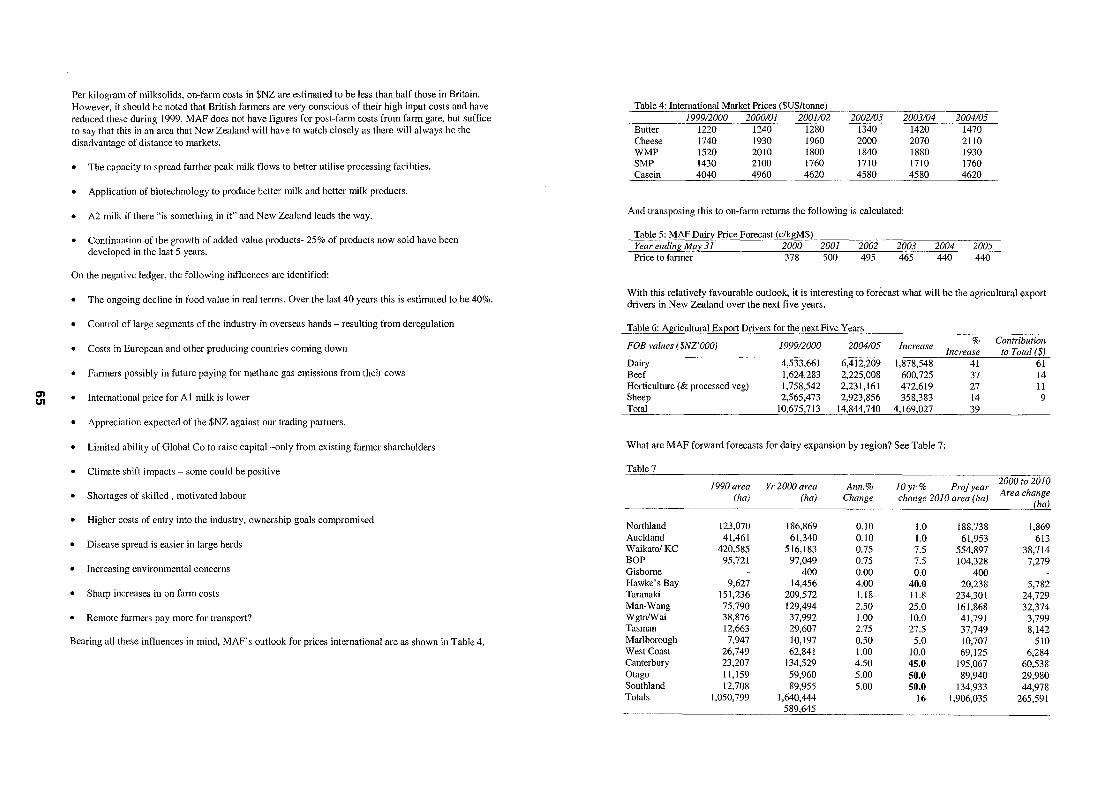
<» U1
Per kilogram of milksolids, on-farm costs in $NZ are estimated to be less than half those in Britain. However, it should be noted that British fanners are very conscious of their high input costs and have reduced these during 1999. MAP does not have figures for post-farm costs from farm gate, but suffice to say that this in an area that New Zealand will have to watch closely as there will always be the disadvantage of distance to markets.
• The capacity to spread further peak milk flows to better utilise processing facilities.
• Application of biotechnology to produce better milk and better milk products.
• A2 milk if there "is something in it" and New Zealand leads the way.
• Continuation of the growth of added value products- 25% of products now sold have been developed in the last 5 years.
On the negative ledger, the following influences are identified:
• The ongoing decline in food value in real terms. Over the last 40 years this is estimated to be 40%.
• Control of large segments of the industry in overseas hands - resulting from deregulation
• Costs in European and other producing countries coming down
• Farmers possibly in future paying for methane gas emissions from their cows
• International price for Al milk is lower
• Appreciation expected of the $NZ against our trading partners.
• Limited ability of Global Co to raise capital-only from existing farmer shareholders
Climate shift impacts - some could be positive
Shortages of skilled, motivated labour
• Higher costs of entry into the industry, ownership goals compromised
• Disease spread is easier in large herds
• Increasing environmental concerns
• Sharp increases ill on farm costs
• Remote farmers pay more for transport?
Bearing all these influences in mind, MAP's outlook for prices international are as shown in Table 4.
Table 4: International Market Prices ($US/tonne) 1999/2000 2000101 2001102 2002103 2003104 2004105
Butter 1220 1240 1280 1340 1420 1470 Cheese 1740 1930 1960 2000 2070 2110 WMP 1520 2010 1800 1840 1880 1930 SMP 1430 2100 1760 1710 1710 1760 Casein 4040 4960 4620 4580 4580 4620
And transposing this to on-farm returns the following is calculated:
Table 5: MAP Dairy Price Forecast (c/kgMS) Year ending May 31 2000 2001 2002 2003 2004 2005 Price to farmer 378 500 495 465 440 440
With this relatively favourable outlook, it is interesting to forecast what will be the agricultural export drivers in New Zealand over the next five years.
Table 6: A!l!icultural EXE0rt Drivers for the next Five Years
FOB values ($NZ'OOO) 1999/2000 2004105 Increase % Contribution
Increase to Total ($) Dairy 4,533,661 6,412,209 1,878,548 41 61 Beef 1,624,283 2,225,008 600,725 37 14 Horticulture (& processed veg) 1,758,542 2,231,161 472,619 27 11 Sheep 2,565,473 2,923,856 358,383 14 9 Total 10,675,713 14,844,740 4,169,027 39
What are MAF forward forecasts for dairy expansion by region? See Table 7:
Table 7
1990 area Yr 2000 area Ann.% 10yr% Projyear 2000 to 2010
(ha) (ha) Change change 2010 area (ha) Area change
Northland 123,070 186,869 0.10 1.0 188,738 1,869 Auckland 41,461 61,340 0.10 1.0 61,953 613 Waikato/KC 420,585 516,183 0.75 7.5 554,897 38,714 BOP 95,721 97,049 0.75 7.5 104,328 7,279 Gisbome 400 0.00 0.0 400 Hawke's Bay 9,627 14,456 4.00 40.0 20,238 5,782 Taranaki 151,236 209,572 1.18 11.8 234,301 24,729 Man-Wang 75,790 129,494 2.50 25.0 161,868 32,374 WgtnlWai 38,876 37,992 1.00 10.0 41,791 3,799 Tasman 12,663 29,607 2.75 27.5 37,749 8,142 Marlborough 7,947 10,197 0.50 5.0 10,707 510 West Coast 26,749 62,841 1.00 10.0 69,125 6,284 Canterbury 23,207 134,529 4.50 45.0 195,067 60,538 Otago 11,159 59,960 5.00 50.0 89,940 29,980 Southland 12,708 89,955 5.00 50.0 134,933 44,978 Totals 1,050,799 1,640,444 16 1,906,035 265,591
589,645
Q) Q)
Conclusion
In conclusion then, dairying has become a significant, strong and positive viewed sector, which is capable of becoming a powerhouse for economic growth in New Zealand.
In the view of MAF, the positive influences outweigh the negative influences, but these negative influences will have to be actively managed,
The opportunity to gain from the expected growth in world demand for dairy products also needs to be carefully managed
New Zealand's, isolation whilst imposing higher transport and marketing costs, is also a strength when it comes to perceptions about the quality and unique nature of our products.
en .......
CLIMATE VARIABILITY AND THE ECONOMY
Andrew Tait, Jim Renwick and Chris Francis National Institute of Water and Atmospheric Research Limited,
POBox 14901, Wellington
SUMMARY
Climatic variability is likely to be a significant contributor to variability in the economic cycle because a significant part of New Zealand's production is based on primary production and related value-added industries. This Treasury-funded exploratory study looks at correlations between several climatic indices and several components of GDP, with an emphasis on the agriculture component of GDP. It also investigates the relationships between national milkfat production and climate. The most significant results are that the agricultural component of GDP is negatively correlated with the strength of the southerly airflow over New Zealand (the stronger the southerly flow, the lower the agricultural component of GDP); milkfat production is negatively correlated with annual days of soil moisture deficit (the greater the number of days of soil moisture deficit, the less the milkfat production); milkfat production is negatively correlated with regional summer temperature (the cooler the summer, the greater the milkfat production) and milkfat production is positively correlated with regional spring and summer rainfall (the higher the rainfall, the greater the milkfat production). It is hoped that this initial study will initiate a more detailed analysis of the impact of climatic variability on the economy in the near future. Key words are: GDP, Agriculture, Milkfat, Climate.
INTRODUCTION AND BACKGROUND
New Zealand's economy is strongly dependent upon agricultural production. This, in turn, is largely influenced by interannual variations in the seasonal climate. For example, a drier than average spring may lead to lower than normal pasture growth rates which may mean that stock numbers are reduced and hence meat or wool or milk production is below average for the year. Maunder (1966a, 1968) developed "agroclimatological models" to quantify the impact of climatic variability on agricultural production. The models were formulated for 18 different agricultural factors (for example wheat yield per acre, butterfat yield per cow, pear production per tree) and used three climatic variables (rainfall, temperature and sunshine) as predictors. Twenty-seven agriculturally based areas around New Zealand were studied. The major finding of these analyses was the significance of climatic factors on butterfat production.
Specifically, Maunder found that an increase in the average October, November, December, January, or February rainfall by at least one standard deviation from the long term mean was associated (significant at the 2.5 percent level) with an increase in
butterfat yield by about 10 pounds per cow. Using 1964 prices, this equated to about NZ$3 per cow (Maunder, 1966b). He thus concluded that a "wet" January, for example, could be ''worth'' an additional NZ$2 million to the South Auckland area (based on a population of 750,000 dairy cows in the area, and an additional value of 1964NZ$2.60 per cow). Likewise, the decreased value was calculated based on a "dry" month.
More recently, a Ministry of Agriculture and Forestry report, MAF (2000), stated that the impact of the 1997/98 drought on New Zealand's GDP was a loss of NZ$618 million, or 0.9% of the actual total for that year, while the 1998/99 drought resulted in a lower loss of NZ$539 million to GDP, or 0.5% of the actual total.
Over the past two decades, most of the studies on the general topic of climate and the economy have used complex models to focus more on the predictive capabilities of climatic data. For example, Winkler et al. (1983) examined the value of climate forecasts using a decision-analytic approach. This involves a theoretical decision such as the choice of two crops to plant in the face of uncertainty as to whether growing season precipitation will be above or below average. Results from this analysis show that even relatively uncertain forecasts are of some economic value.
Specific studies have also been performed, such as that of Adams et al. (1995) and Solow et al. (1998), which investigate the value of improved predictions of the El Nino Southern Oscillation (ENSO) to agricultural production in the United States. They showed that a perfect ENSO forecast is worth between US$145 million (Adams et al.) to US$323 million (Solow et al.) to U.S. agriculture. Katz and Murphy (1997) have written a book that covers these and other methods of studying the economic value of weather and climate forecasts.
In this study, relationships between several components of New Zealand's GDP and several climate variables (see table 1) are investigated. The agriculture component of GDP is analysed further and national milkfat production data are investigated in detail. The goals of this study are to determine whether climate variability has an impact on New Zealand's economy, and to identify how analyses may be focused so that a complete picture of the role of climate variability on the economy can be drawn.
DATA
GDP data, at constant 1991-92 prices, broken down into twenty-eight components by production group, were provided by Treasury. These data are either annually averaged or quarterly, and are from 1977 to the present. The quarterly data are either actual or seasonally adjusted. Nine of the twenty-eight components of GDP were chosen for further study (see table 1) as these components showed variability similar in nature to climatic data (i.e. with no dramatic shifts caused by factors such as changes in definitions or non-climatic (e.g. political) influences). National milkfat processing data (in millions of kg) were also provided by Treasury. These data are annual totals (JuneMay) from 1927 to the present.
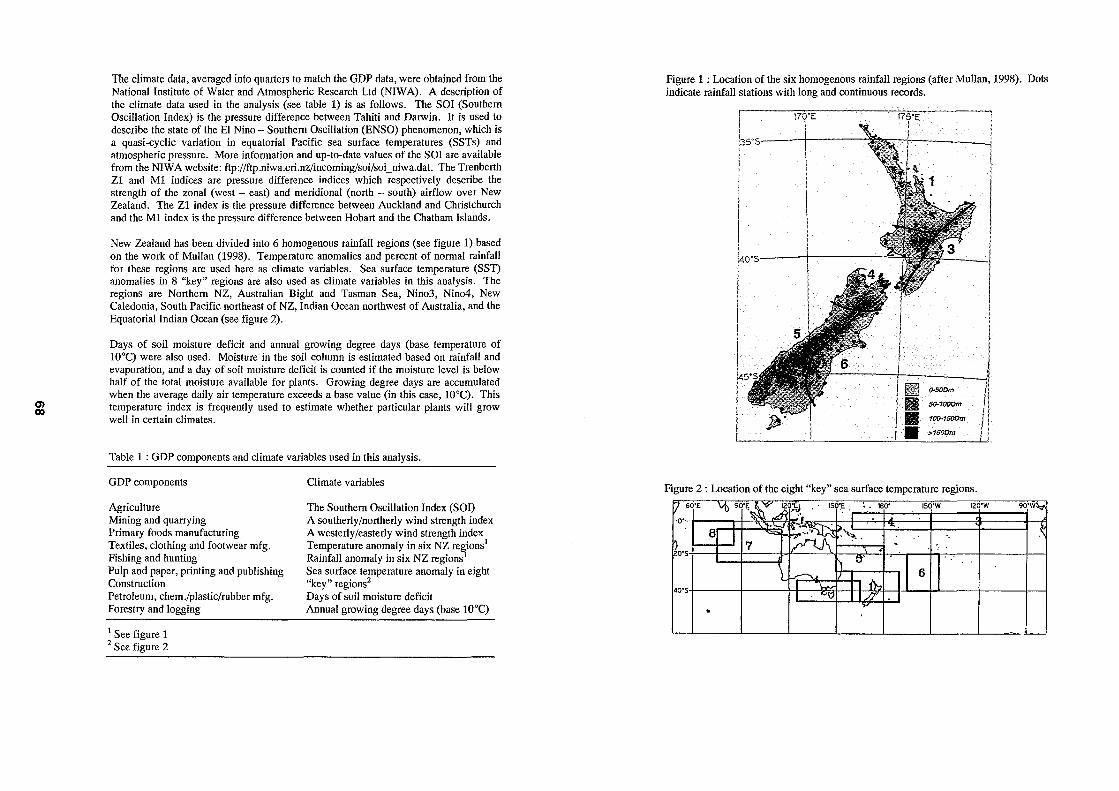
0) 00
The climate data, averaged into quarters to match the GDP data, were obtained from the National Institute of Water and Atmospheric Research Ltd (NIWA). A description of the climate data used in the analysis (see table 1) is as follows. The SOl (Southern Oscillation Index) is the pressure difference between Tahiti and Darwin. It is used to describe the state of the El Nino - Southern Oscillation (ENSO) phenomenon, which is a quasi-cyclic variation in equatorial Pacific sea surface temperatures (SSTs) and atmospheric pressure. More infonnation and up-to-date values of the SOl are available from the NIWA website: ftp://ftp.niwa.crLnz/incoming/soi/soi_niwa.dat. The Trenberth Z1 and M1 indices are pressure difference indices which respectively describe the strength of the zonal (west - east) and meridional (north - south) airflow over New Zealand. The Z1 index is the pressure difference between Auckland and Christchurch and the M1 index is the pressure difference between Hobart and the Chatham Islands.
New Zealand has been divided into 6 homogenous rainfall regions (see figure 1) based on the work of Mullan (1998). Temperature anomalies and percent of nonnal rainfall for these regions are used here as climate variables. Sea surface temperature (SST) anomalies in 8 "key" regions are also used as climate variables in this analysis. The regions are Northern NZ, Australian Bight and Tasman Sea, Nin03, Nin04, New Caledonia, South Pacific northeast of NZ, Indian Ocean northwest of Australia, and the Equatorial Indian Ocean (see figure 2).
Days of soil moisture deficit and annual growing degree days (base temperature of 100C) were also used. Moisture in the soil column is estimated based on rainfall and evaporation, and a day of soil moisture deficit is counted if the moisture level is below half of the total moisture available for plants. Growing degree days are accumulated when the average daily air temperature exceeds a base value (in this case, 100C). This temperature index is frequently used to estimate whether particular plants will grow well in certain climates.
Table 1 : GDP components and climate variables used in this analysis.
GDP components
Agriculture Mining and quarrying Primary foods manufacturing Textiles, clothing and footwear mfg. Fishing and hunting Pulp and paper, printing and publishing Construction Petroleum, chem./plastic/rubber mfg. Forestry and logging
, See figure 1 2 See figure 2
Climate variables
The Southern Oscillation Index (SOl) A southerly/northerly wind strength index A westerly/easterly wind strength index Temperature anomaly in six NZ regions' Rainfall anomaly in six NZ regions' Sea surface temperature anomaly in eight "key" regions2
Days of soil moisture deficit Annual growing degree days (base lO°C)
Figure 1 : Location of the six homogenous rainfall regions (after Mullan, 1998). Dots indicate rainfall stations with long and continuous records.
E > .. o-5ODm
III 5O-100Dm
II 100-150Dm
• >150Dm
Figure 2: Location of the eight "key" sea surface temperature regions.
V 60'E Vb 90'~¥ .Jt:~ .' 150:E. :. 180' 150'W 120'W 90'W~
O' A
:J;j
~ I . ""'. .~ 81 I ~ .... :.. .
? 7 . . ... 0'5
:'\ 0"' . d 6 I'" . I ..,--.". I 1h 40'5 ......
1 . "'\:1 II'/T . .....
~
.L....-

Q) CD
GOP VERSUS CLIMATE
The climate series were averaged over a number of prior quarters (one to eight) and were lagged back in time over a range of quarters (zero to eight). Correlations were calculated as a function of lag and averaging period, for each combination of GOP component and climate data group.
Using the seasonally-adjusted quarterly GOP data, the strongest correlations were between petroleum and related products and temperature around New Zealand and in adjacent oceans (maximum r = -0.69, climate variable = NZ temperature anomaly in region 1, averaging period = 8 quarters, lag = 6 quarters). With respect to primary production, agricultural production goes down after a period of enhanced southerly conditions (r = -0.52, climate variable = Ml index, averaging period = 8 quarters, lag = 3 quarters), and goes up after a period of above average rainfall in the north of both islands (r = 0.47, averaging period = 7 quarters, lag = 5 quarters). Primary foods manufacturing goes down after a period of warm seas upstream of New Zealand, around Tasmania (r = -0.53, climate variable = SST anomaly in region 2, averaging period = 8 quarters, lag = 3 quarters). Table 2 summarises the significant correlations.
Table 2 : "Significant" correlations between quarterly GOP and climate data. At least 30% of the correlations (climate data are averaged between 1 and 8 quarters, and lagged between 0 and 8 quarters) must be significant before pairing is displayed.
GOP component Climate variable Lag Average
Agriculture Tindex Ml -0.52 3 8 Agriculture NZrain region 1 0.47 5 7 Agriculture NZrain region 4 0.47 5 7 Mining and Quarrying NZrain region 5 -0.58 0 8 Primary Foods Mnfg. SST region 2 -0.53 3 8 Textiles, Clthg. and Ftwr. SOl -0.51 6 8 Textiles, Clthg. and Ftwr. NZrain region 2 -0.53 0 7 Textiles, Clthg. and Ftwr. NZrain region 3 -0.47 0 7 Textiles, Clthg. and Ftwr. NZrain region 5 0.55 0 7 Textiles, Clthg. and Ftwr. SST region 6 -0.57 5 6 Petroleum, Chern., Plas. SOl -0.55 4 8 Petroleum, Chern., Plas. NZtemp region 1 -0.69 6 8 Petroleum, Chern., Plas. NZtemp region 2 -0.68 6 8 Petroleum, Chern., Plas. NZtemp region 3 -0.65 6 8 Petroleum, Chern., Plas. NZtemp region 4 -0.65 6 8 Petroleum, Chern., Plas. NZrain region 2 -0.36 0 5 Petroleum, Chern., Plas. SST region 6 -0.50 5 8 Construction SST region 4 -0.59 0 8
MILKFAT ANALYSIS
Milkfat values were supplied on a June-May year. The milkfat data have a strong exponential trend. Oetrending was carried out by either removing a 5-year running mean, or by first-differencing, or by log-differencing (fractional change from one year to the next). The log-difference gave the most stationary looking result, as the direct difference and running mean resulted in a general increase in variance with time of the residual series. All results below are for the "fractional change" series.
Annual milkfat was correlated with the suite of climate time series described in the previous section, as was done for the GOP components. Climate data were averaged up to eight quarters and were lagged by up to four quarters. There was a clear peak in the correlations when a I-quarter lag was applied (Le. comparing the preceding summer data with the following year's fractional change in milkfat). Correlations were strongest (see table 3) for the preceding spring-summer rain (2-quarter average, I-quarter lag) and the preceding summer temperature (I-quarter average, I-quarter lag).
Table 3 : Significant correlations for Milkfat production versus climate indices.
Climate variable
Tindex M1 NZtemp region 1 NZtemp region 1 NZtemp region 4 NZtemp region 5 NZtemp region 5 NZtemp region 6 NZtemp region 6 SST region 3 NZrain region 1 NZrain region 2 NZrain region 2 NZrain region 4 NZrain region 4 NZrain region 6 NZrain region 6
0.31 -0.34 -0.30 -0.35 -0.34 -0.27 -0.43 -0.40 -0.35
0.31 0.38 0.36 0.41 0.41 0.35 0.40
Lag
1 1 1 1 1 1 1 1 1 1 1 1 1 1 1 1
Average
1 1 2 1 1 2 1 2 1 2 1 2 1 2 1 2
Including spring/summer percent of normal rainfall and summer temperature anomalies for all six New Zealand regions as predictors, a linear regression model explains 31.3 percent of the variance in the fractional change in milkfat production. The best predictors are the temperature anomaly in region 6 and the percent of normal rainfall in region 4 (see equation 1). As the temperature data are highly correlated between the six
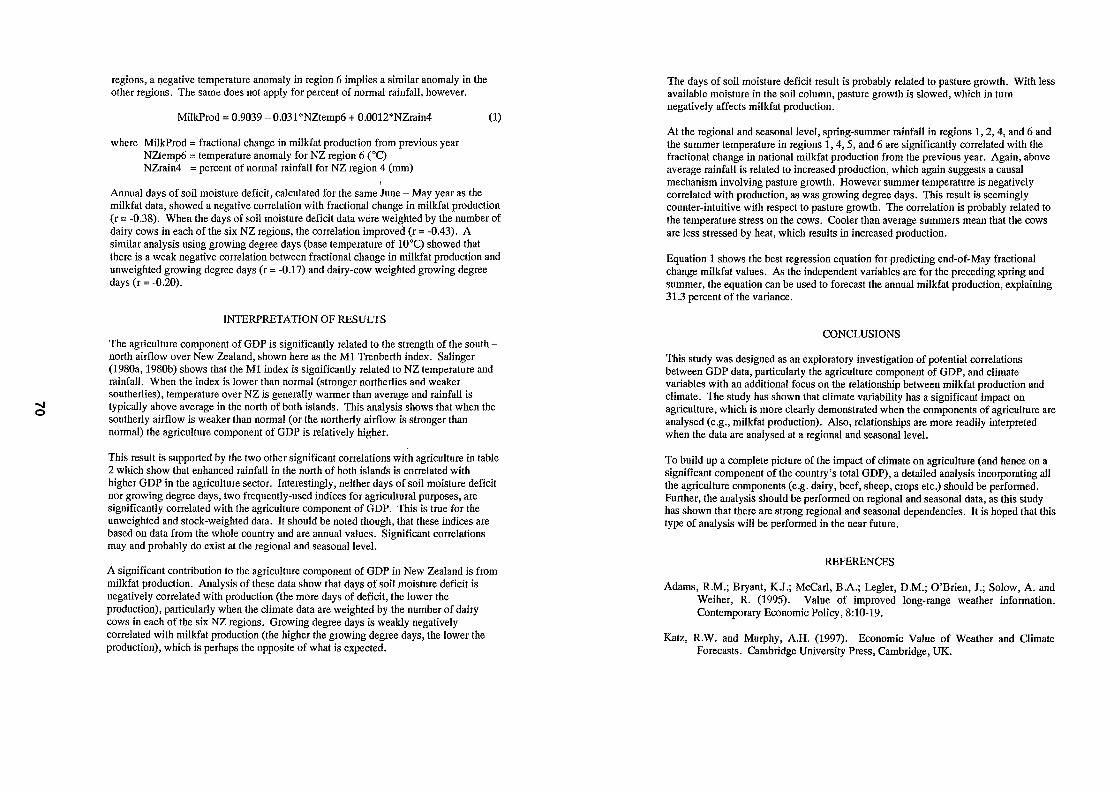
....... o
regions, a negative temperature anomaly in region 6 implies a similar anomaly in the other regions. The same does not apply for percent of normal rainfall, however.
MilkProd = 0.9039 - 0.031 *NZtemp6 + 0.0012*NZrain4
where MilkProd = fractional change in milkfat production from previous year NZtemp6 = temperature anomaly for NZ region 6 ("C) NZrain4 = percent of normal rainfall for NZ region 4 (mm)
(1)
Annual days of soil moisture deficit, calculated for the same June - May year as the milkfat data, showed a negative correlation with fractional change in milkfat production (r = -0.38). When the days of soil moisture deficit data were weighted by the number of dairy cows in each of the six NZ regions, the correlation improved (r = -0.43). A similar analysis using growing degree days (base temperature of lO°C) showed that there is a weak negative correlation between fractional change in milkfat production and unweighted growing degree days (r = -0.17) and dairy-cow weighted growing degree days (r = -0.20).
INTERPRETATION OF RESULTS
The agriculture component of GOP is significantly related to the strength of the south -north airflow over New Zealand, shown here as the Ml Trenberth index. Salinger (1980a, 1980b) shows that the Ml index is significantly related to NZ temperature and rainfall. When the index is lower than normal (stronger northerlies and weaker southerlies), temperature over NZ is gene rail y warmer than average and rainfall is typically above average in the north of both islands. This analysis shows that when the southerly airflow is weaker than normal (or the northerly airflow is stronger than normal) the agriculture component of GOP is relatively higher.
This result is supported by the two other significant correlations with agriculture in table 2 which show that enhanced rainfall in the north of both islands is correlated with higher GOP in the agriculture sector. Interestingly, neither days of soil moisture deficit nor growing degree days, two frequently-used indices for agricultural purposes, are significantly correlated with the agriculture component of GOP. This is true for the unweighted and stock-weighted data. It should be noted though, that these indices are based on data from the whole country and are annual values. Significant correlations may and probably do exist at the regional and seasonal level.
A significant contribution to the agriculture component of GOP in New Zealand is from milkfat production. Analysis of these data show that days of soil moisture deficit is negatively correlated with production (the more days of deficit, the lower the production), particularly when the climate data are weighted by the number of dairy cows in each of the six NZ regions. Growing degree days is weakly negatively correlated with milkfat production (the higher the growing degree days, the lower the production), which is perhaps the opposite of what is expected.
The days of soil moisture deficit result is probably related to pasture growth. With less available moisture in the soil column, pasture growth is slowed, which in turn negatively affects milkfat production.
At the regional and seasonal level, spring-summer rainfall in regions 1, 2, 4, and 6 and the summer temperature in regions 1,4,5, and 6 are significantly correlated with the fractional change in national milkfat production from the previous year. Again, above average rainfall is related to increased production, which again suggests a causal mechanism involving pasture growth. However summer temperature is negatively correlated with production, as was growing degree days. This result is seemingly counter-intuitive with respect to pasture growth. The correlation is probably related to the temperature stress on the cows. Cooler than average summers mean that the cows are less stressed by heat, which results in increased production.
Equation 1 shows the best regression equation for predicting end-of-May fractional change milkfat values. As the independent variables are for the preceding spring and summer, the equation can be used to forecast the annual milkfat production, explaining 31.3 percent of the variance.
CONCLUSIONS
This study was designed as an exploratory investigation of potential correlations between GOP data, particularly the agriculture component of GOP, and climate variables with an additional focus on the relationship between milkfat production and climate. The study has shown that climate variability has a significant impact on agriculture, which is more clearly demonstrated when the components of agriculture are analysed (e.g., milkfat production). Also, relationships are more readily interpreted when the data are analysed at a regional and seasonal level.
To build up a complete picture of the impact of climate on agriculture (and hence on a significant component of the country's total GOP), a detailed analysis incorporating all the agriculture components (e.g. dairy, beef, sheep, crops etc.) should be performed. Further, the analysis should be performed on regional and seasonal data, as this study has shown that there are strong regional and seasonal dependencies. It is hoped that this type of analysis will be performed in the near future.
REFERENCES
Adams, R.M.; Bryant, K.J.; McCarl, B.A.; Legler, O.M.; O'Brien, J.; Solow, A. and Weiher, R. (1995). Value of improved long-range weather information. Contemporary Economic Policy, 8:10-19.
Katz, R.W. and Murphy, A.H. (1997). Economic Value of Weather and Climate Forecasts. Cambridge University Press, Cambridge, UK.
Maunder, W.J. (1966a). An agroclimatological model. Science Record, 16:78-80.
Maunder, W.J. (1966b). Climatic variations and dairy production in New Zealand. New Zealand Science Review, 24(6):69-73.
Maunder, W.J. (1968) Effect of significant climatic factors on agricultural production and incomes: A New Zealand example. Monthly Weather Review, 96(1):39-46.
Ministry of Agriculture and Forestry (2000). Situation and Outlook for NZ Agriculture and Forestry (SONZAF 2000), http://www.maf.govt.nz/MAFnet!publications/ SONZA/sonzafOO/finance.htm.
Mullan, A.B. (1998). Southern Hemisphere sea-surface temperatures and their contemporary and lag association with New Zealand temperature and precipitation. Int. J. Climatology, 18:817-840.
Salinger, M.J. (1980a). New Zealand climate: 1. Precipitation patterns. Monthly Weather Review, 108:1892-1904.
Salinger, M.J. (1980b). New Zealand climate: 2. Temperature patterns. Monthly j Weather Review, 108:1905-1912.
Solow, A.R.; Adams, R.M.; Bryant, K.J.; Legler, D.M.; O'Brien, J.; McCarl, B.A.; Nayda, W. and Weiher, R. (1998). The value of improved ENSO prediction to U.S. agriculture. Climatic Change, 39:47-60.
Winkler, R.L.; Murphy, A.H. and Katz, R.w. (1983). The value of climate information: A decision-analytic approach. Journal of Climatology, 3:187-197.
...... I\)
Trade and the Environment Linking trade and climate change with agricultural production systems in a partial equilibrium
trade model
Saunders, c., Wreford, A., and Cagatay, S. Commerce Division, Lincoln University, Canterbury, New Zealand.
ABSTRACT
The link between trade and the environment has aroused considerable illlerest both in terms of the impact of trade liberalisation on the environment, and also the impact of environmental policy on productioll and trade. This interest is expressed at the global level, especially with the WTO round of negotiatiolls. but also at the micro level where local government and agencies are conce111ed about the impacts {?f policies 011 production alld trade, as well as the local environment.
Of key environmental COllcenl at present is global wanning and its assumed causation by greenhollse gas emissions. Global attempts are being made to reach agreements 011 limiting these greenhouse gas emissio!1S, which will impact OIl NZ and around the wor/d. Any policy developmelll in greenhouse gas emission control is (~f vital importance to NZ agriculture. as approximately 50 percellt of NZ:'1 en-zissiolls come from agriculture. Any serious polhy designed to control greenhollse gas emissions in NZ, such as a carbon tax or tradeable emission pennits, will a./fect the agricultural sector and trade. Thus the applied model, Lincoln Trade and Environment Model (LTEM) enables the impact o.f trade policy on carbO/I emissions to be estimated.
keywords: climate change, partial eqUilibrium modelling, agricultural trade
INTRODUCTION
Climate change is one of the most significant global environmental issues facing our society today, and the subject of international negotiations under the Kyoto Protocol aimed at reducing greenhouse gas emissions. The protocol is based on the principal of reduction of greenhouse gas emissions to varying percentages of 1990 levels for developed countries. The New Zealand government plans to ratify the 1997 Kyoto Protocol to the UN Framework Convention on Climate Change (UNFCCC) by mid-2002 (MfE 1999). The Protocol obliges NZ to reduce its greenhouse gas emissions to 1990 levels, on average, over the period 2008 to 2012. There is an expectation that ongoing international negotiations will consider further reductions in emissions. Naturally this is a significant undertaking and reaching global agreement is pmticularly difficult. At present the proposed mechanisms for these reductions are still being discussed as the reduction period does not begin until later in this decade.
The issue of climate change is of particular importance in New Zealand, on a variety of levels. Being an island nation based predominmlt1y on agriculture, increases in sea level and changes in temperature will have significant effects on some regions and types of agriculture. Furthermore, in New Zealand, 55 percent of greenhouse gas emissions come from agriculture, mld thus agriculture will be the area where some emission reductions must occur, in response to the Kyoto Protocol. While New Zealand supports the reduction of greenhouse gases, any policy designed to limit emissions, such as a carbon tax or tradeable carbon permits, is likely to have a significant impact on the country's agriculture. This study therefore examines in more detail the link between agriculture, in particular livestock sectors and greenhouse gas emissions. It looks at the relationship between production systems and emissions and then trade implications of this using a PE frmnework. In pm1icular, the impact of changes in trade policies is examined.
The following section introduces the two major greenhouse gases produced from the agricultural sector in New Zealmld, and their sources, followed by a selection of policy options available for reducing emissions. A theoretical description of trade and environment modelling follows. The emission factors and equation specification for greenhouse gases preceed a section on cun-ent results. These results are discussed in the context of the expected response of the model to chmlges in policy. The paper fmishes with suggested fill1her research and concluding cOllunents.
Greenhouse Gas Emissions
Direct emissions of carbon dioxide (CO,) from the agricultural sector are low and New Zealand is no exception in this regard. Emissions of methane and nitrous oxide by agriculture are much more significant (MAF 2001). Moreover, both methane and nitrous oxide have much higher global warming potential than CO,. Using CO, as a base (ie. I), methane has a global warming potential of 21, and nitrous oxide 310 (Hassall and Associates 1999).
Consequently, the two greenhouse gases which will be considered in this study are methane and nitrous oxide. Both the gases are produced from a number of different sources in agricUlture.
IPCC methodology
A key organisation established to control scientific and policy-related infonnation about climate change is the Inter-governmental Panel on Climate Change (IPCC) formed by the United Nations Environment Program (UNEP) and the World Meteorological Organisation (WMO). Under the Kyoto Protocol, all countries who are signatories must produce an inventory of the Greenhouse Gas emissions. Guidelines for these inventories are published and form the basis of the following sections.
Methane
With the relatively large ruminant animal population in New Zealand, methane production is significant. Because New Zealand has a small industrial base, uses predominantly renewable sources for electricity generation, and has a relatively large agricultural sector, the greenhouse gas emissions have an unusually high methane to carbon dioxide ratio among developed countries (Lassey et al 1992, MAF2001).
Methane from livestock is produced from two main sources, enteric fennentation and from manure management. The amount of methane produced depends on the amount of food eaten as well as the type and quality of the food.
For the purpose of this study, only emissions from sheep, dairy and non-dairy cattle will be taken into account (Pigs may be added in future, as they may be significant in other countries included in the model). In New Zealand, around 57 percent of methane emissions are from sheep and lambs, 27% from beef cattle, and 17% from dairy cattle (MAF 200 I). The principal determinants of gas from this source are livestock numbers, feed intake per head, and methane production per unit intake by feed type (Lassey et aI., 1992). New Zealand ranks among the top dozen nations who account for about 1.5% of global (Lerner et aI., 1988) livestock emissions.
Methane emissions from manure management - Most animal waste decomposes aerobically on pasture in New Zealand, resulting in relatively low levels of methane emissions from manure management for this country (MfE, 2000). Lasseyet a1. (1992) also assesses emissions from animal wastes, and from effluent processing plants such as abattoirs and dairy factories to be of relatively minor importance.
Nitrous Oxide
Nitrous oxide (N,O), although emitted in much smaller quantities than either methane (ClL) or CO, is important because its relative impact in terms of global warming potential at 200 times that of CO, and 8 times that of Cft, (MAFF 2000). There are a number of sources of this gas produced from agriculture. The first source is defined as animal waste management systems (A WMS). Six alternative regimes for treating animal manure, (anaerobic lagoon, liquid systems, daily spread, solid storage and drylot, pasture range and paddock, used fuel, other system) are identified in the IPCC guidelines.
Emissions from agricultural soils make up a finther source of N,O, which are firrther divided into three sections - (I) direct emission of N20 from agricultural soils (2) direct soil emissions of N,O from animal production, and (3) indirect emissions of N,O from nitrogen used in agriculture.
Direct emissions from agricultural soils are as a result of synthetic fertiliser application, the use of animal waste as fertiliser, N-fixing crops, and crop residues. Direct soil emissions of N,O from animal production is the manure deposited by grazing livestock on pasture range and paddock and left there to

..... W
decompose. This is the major management regime for animal waste in New Zealand. Indirect emissions are from the atmospheric decomposition of NH, and NOx, and leaching.
Policies for reducing emissions
Worldwide, enteric fermentation fi'om ruminant animals contlibute around 15 percent of the global methane source (Crutzen et al 1986). The primary determinant of the emission level is the global stock population, which is expected to increase 65 percent by 2025 and 125 percent by 2100 relative to 1987 levels, in the absence of a response to rising atmospheric methane (Lashof and Tirpak, 1990). Obviously therefore, a reduction in animal numbers would reduce global methane emissions, and this is one policy option. However, improvements to animal husbandry emphasise reducing emissions per unit product (meat, milk, wool etc) rather than emissions per animal as another means of reducing overall methane production. Thus the goal could be to reduce the herd size while sustaining the same out put (MAF 200 I).
For countries with intensively managed livestock, modifying 'enteric ecology' has been suggested as the best prospect in influencing rumen metabolism. Altering pasture quality to increase intake of digestible nutrients per animal has been recommended by Ulyatt et al (1991). It has also been shown by Ulyatt et al (1991), that New Zealand dairy production is 3-5 fold more 'methane efficient' (measured by methane emissions per FOB dollar earned) than meat production. Product substitution may therefore be an option.
Nitrogen applied to the soil, either as a synthetic fertiliser or as animal manure, affects N,O emissions and could also be a policy relevant factor.
On a more general scale, New Zealand may consider a low level carbon tax if policy measures are not on target to achieve the emission reduction targets (MfE, 1999). The Kyoto Protocol provides additional mechanisms to add flexibility to countries in how they can meet their commitments. One of these mechanisms is emissions trading, which is a further possible policy for reducing carbon emissions.
Therefore, the major policy options for reducing cm'bon emissions m'e a reduction in the number of animals or the stocking rate, a cm'bon tax or a tradeable pennit system, a reduction in the amount of nitrogen applied, or a change in the production system. Other options for reducing emissions, such as modifying rumen metabolism are not generally policy driven and will not be discussed here. These policies have the potential to have a huge impact on New Zealand's trade, especially as 70 percent of this country's export em'nings come from agriculture. Hence it is importmlt to estimate the effect of various policies on New Zealand trade and the producer returns in agriculture. 'The following section discusses trade and environment modelling and the modelling framework to be used.
TRADE AND ENVIRONMENT MODELLING
The applied modelling literature offers two main approaches as a base to model the international trade in various contexts: general equilibrium (GE) and partial equilibrium (PE) frameworks. Market equilibrium models of both PE and GE jj-mneworks quantify the response of economic agents to changes in various prices, which adjust to clear markets. The main objective in these models is to determine the equilibrium prices and quantities on sets of markets, which are subject to various policy shocks. Both frameworks can be single- or multi-commodity/country and they can provide solutions in the short, medium and long-tenn time horizon. In both approaches, based on the equation specifications and simulation procedure, either a dynamic (that gives the adjustment path of endogenous variables) or comparative static solution cml be achieved. Other then the technical specifics and country/conunodity coverage, there m'e three main differences between the trade modelling approaches used in PE and GE frameworks. These differences arise based on how the economy is structured, how the parameters of the functions are obtained, and how the international trade is dealt.
Partial equilibrium models focus only on one sector/industry of the economy without considering the linkages with the rest of economy. The coverage of this particular sector however can be extended and disaggregated as long as the data is available. These models also incorporate into their behavioural
relationships exogenous variables such as technical change, world population and household income. On the other hand, general equilibrium models provide a complete representation of the national economy, which include the factor markets, the circular flow of income and expenditure and interindustry relations at an aggregated level mostly. In partial equilibrium framework generally a reduced form approach is utilized for the supply and demand response, which are specified as functions of income, prices and elasticities. However, in a general equilibrium framework the behavioural responses of producers and consumers are explicitly specified as production and consumption functions.
In modelling applications of both of the frameworks the parameters of the equations can be either found by econometric or mathematical procedures or these can be adopted from the other studies by applying appropriate test procedures, In the later case these models are called synthetic. However, applied literature becomes "inadequate" in providing the econometrically estimated parameter values of production and consumption functions specifically when it comes to the agricUltural sector and to particular agricultural commodities. This is mainly due to the lack of data and also to the "quality" of the data collected related to the agricultural sector. On the other hand, it is more common to find the econometrically estimated parameter values of supply and demand functions of the agricultural sector. Therefore, whether the frameworks are synthetic or not, in PE models in which generally supply and demand functions are used, the parameters may be considered more robust since these are the outcomes of econometric procedures which reflect the historical variable behaviour. In GE models, however, the parameters generally are the outcomes of mathematical procedures which reflect only one year's behaviour.
International trade can be modelled either with a "simplistic but transparent" or "complex" approach in both frameworks. In a simplistic approach, classical trade models, goods are assumed to be similar and pelfectly substitutable in international markets and are called homogeneous. In these models, the assumption of large number of suppliers for each good provides the perfectly competitive outcome in the international markets and prices across suppliers equalize. The assumptions of homogeneity and perfect competition imply that countries in the international markets can only be an exporter or an importer of a certain good. It can be concluded that homogeneity and perfect competition simplify the trade modelling procedure in two aspects. First, the model does not need to track explicitly the bilateral trade between countries as the products are homogenous and prices equalize in the international markets. Second, the model needs only to track explicitly a single trade flow for each country, as countries are either exporter or importer. Because of its transparency in tracing the trade pattenlS at commodity and country levels and of ease of interpretation, "simplistic but transparent" approach is used widely in PE frameworks, particularly in agriculture based specific policy analysis.
Since countries report both exports and imports for most of the goods, product differentiation may become important in trade modelling. Product differentiation (heterogeneous products) is a fIrst complexity that can be introduced to the trade modelling procedure. Product differentiation implies that goods are distinguished by other factors than price alone, and hence are viewed as imperfect substitutes in the international markets. Therefore, in these models there is no need for prices to equalize across suppliers as different buyers are willing to pay different plices. Also, product differentiation allows each country to be both a buyer and a seller at the same time, which implies that the trade model has to track twice as many activities explicitly than under the homogeneity assumption. Product differentiation can be introduced in two ways into applied trade models. One way is the use of Armington (1969) approach which assumes that imports and domestic goods are imperfect substitutes in demand (products m'e differentiated by country of origin). The other way is the product differentiation on the supply side which can be introduced by the differences in fixed costs such as R&D or marketing costs. In GE framework, in most cases products are differentiated accordingly with Almington approach. However, lack of data and parameters may result in aggregation of commodities into sub-sectors in some cases. Also, the models may lose the transparency in interpretation and the ability to follow the interactions due to the inclusion of increasing number of trade activities as well as the inter-industry interactions.
Differences in the characterization of the global markets can bring a second complexity to trade modelling. In trade models the global market can be thought as a pool to which each country supplies and others demand from, without specifying explicitly the bilateral relationships. Alternatively, by specifying the bilateral trade relations in the model each country's specific trade amount with each other can be modeled. The pooled approach aggregates supply and demand for a certain good into one figure, and equilibrates demand and supply on a market-wide basis. In this approach supply and
..., 01:>
demand shares of countries in trade can be traced down however, the information regarding the bilateral relationships is not provided. This is called non-spatial approach. The other way to represent global market is bilateral specification, that is the explicit representation of the complete set of interactions between each buyer and seller for each commodity. In GE framework again in most cases bilateral approach is used. However, due to the same reasons stated above the framework may lose the ability to do specific commodity based policy analysis as well as the transparency in terms of ease of simulation and the ease by which relationships can be altered within the model.
The applied model in the research, LTEM, was built by using the VORSIM' modelling framework. LTEM is a multi-country, multi-commodity setting, which focuses on agricultural sector in a partial equilibrium framework, i.e. the linkages of the agricultural sector with the rest of the economy are not considered. The framework is used to analyze the impacts of various domestic and border policies on the country and conilllodity based price, demand, supply and trade levels. LTEM is a price equilibrium, non-spatial model and the conunodities in the LTEM fi'mnework are considered as homogenous. LTEM is a dynamic framework since it provides the time paths of endogenous variables within a short to medium-term time horizon. It allows the application of various domestic and border policies explicitly such as production quotas, set-aside policies, input and/or output related producer subsidies/taxes, consumer subsides/taxes, minimum prices, impOlt tm'iffs and quotas, export subsidies and taxes. The economic welfare implications of policy changes m'e also calculated in the L TEM framework by using the producer and consumer surplus measures. The general equation structure of each commodity at country level in LTEM fi'mnework is represented by six (seven for crops) behavioral equations and one economic identity as in the equations (/) to (8).
ptij = j(WDpt;,ex) (1)
PPij = g(ptij,ZSj) (2)
pCij = h(ptij'Zd j )
qSij =1(ssftij,Zj,PPUJ)
qdij.jo = m(dsjtij' PC'kj' pinc j )
qdij.}c = m'(dsjtU.fi., PC;kj,qSij,Ii'.l
qst ij = n(st.ift ij ,qsij ,JJcij)
qtij = qSij - qd;j - !J.qSIU
(3)
(4)
(5)
(6)
(7)
(8)
The trade price (pt) of a commodity (;) in a country (j) is determined as a function of world mm'ket price (WDpti) of that conunodity and the exchmlge rate (ex), The total effect of world market price on trade ptice of the country is determined by the pdce transmission elasticity, The domestic producer (PP;j) and consumer prices (pc,) are defined as functions of trade price of the related commodity and commodity specific production mId consumption related domestic support/subsidy policies, (bj , Zdj ). The domestic supply and demand equations m'e specified as constant elasticity functions that incorporate both the own and cross-price effects, Domestic supply (qs;) is specified as a function of the supply (SSfti) shifter, which represents the economic factors that may cause shifts, a policy variable (0) that reflects the production related policies, and producer prices of the own and other substitute and complementary commodities (PPijk), Domestic demand (qdij) is specified as a function of the demand (dsftij) shifter, consumer prices of the own and other substitute and complementary commodities (PC;jk) and per capita real income (pincj) created in the economy, The total demand for crops is separated into feed and food demand, In feed demand (qd;) function domestic supply of livestock (qsij,Ii") sector is also included as an explanatory variable, The stocks (qst;) are determined as a function of the stock shifter (stsftij), qumllity supplied (qsij) and consumer price (pc;) of the commodity. Finally, net trade (qtij) of the country () in conunodity C) is detennined as the difference between domestic supply and the sum of domestic demand (also includes (qdijj") in case of crops) and stock changes in the related year. L TEM is a synthetic model since the parameters m'e adopted from the literature,
Basically, the model works by simulating the conunodity based world market clearing price on the domestic quantities and prices, which mayor may not be under the effect of policy changes, in each country, Excess domestic supply or demand in each country spills over onto the world mm'ket to
, See http://members.aol.com/vorecon/vorsim,html.
detennine world prices. The world market-clearing price is detennined at the level, which equilibrates the total demand and supply of each commodity in the world market. LTEM framework can capture the disequilibrium situations in the economy that may result from temporary shortages or excess supply situations by allowing the detennination of stock levels endogenously.
The L TEM framework includes 18 commodities and 17 countries. These are presented in Appendix Tables A I and A2. The dairy sector is modelled as five commodities, raw milk is defined as the farm gate product and then is allocated to either the liquid milk, butter, cheese, whole milk powder or skim milk powder markets depending upon their relative prices subject to physical constraints. The meat sector is disaggregated into sheepmeat, beef and pig meat in the current version of LTEM. However, this sector can be disaggregated into more specific categories based on the availability of the data and related parameters, as the modelling framework allows for replacement of products that are already built in.
Emission factors and equation specification
The challenge of incorporating these two greenhouse gases into the L TEM model is to produce an equation which links all sources of methane and nitrous oxide, Emission factors are very important in this process, The TPCC in its guidelines produces default emission factors for the different sources of gases, for a maximum of eight regions of the world ( North America, Western Europe, Eastern Europe, OceaJlia, Latin America, Asia, Africa and Middle East, and the Indlan Subcontinent), Naturally therefore, these values will vary considerably within each region and New Zealand, as have many other countries, has carried out in-depth research to provide more accurate emission factors, The choice of emission factor is important in detennining the total emission, and therefore accurate emission factors are vital.
To simulate the impact of changing market condltions on productiOll and thus the environment, the factors affecting greenhouse gas emissions have been specified separately aJld will be entered into the model. The qSij equation (4) is modified to include the number of animals (NA j ) and the price of nitrogen (P,,), equation (4). Number of animals is calculated based on the stocking rate (Srij) which is determined by input prices (feed products (PC!d) and price of nitrogen (pn), quantity supplied (qSij) per hectare and relative price of the product's own price to price of closest substitute product, equation (9). The nitrogen use per hectare (N/ha) is defined as a function of relative price of inputs (feed products (pC,d) and price of nitrogen (pn) and quantity supplied (qSi) per hectare. Finally, greenhouse gases (GHG ) will be incorporated into the model through the equation (11), In this equation GHG is specified as a function of applied nitrogen and number of animals and methane and N20 emissions from these sources are converted to their carbon equivalents. Emission factors are implicit in the coefficients and the values for these coefficients are provided by soil scientists at Lincoln (Clough and Sherlock,200l),
qSij =1'(ssjt'i,Zj,PPikj,PNjNA)
SRij = J PC jej ,qsij , pPij) 'l PNj ha PPkj
N -1 PC jej qSij) ha - ~l pc Nj '--,;;;
GHGj = aNA +j3(N,NA)
Data Collection
(4)
(9)
(10)
(11)
Animal numbers m'e of critical importance in detennining the methane and nitrous oxide emissions for each country. A single source of this data that included all the countries in our model and animal types (dairy, non-dairy, sheep and pigs) was not available, hence two major sources were used: the FAO agricultural statistics database, and the USDA database. Essentially the FAO was used for sheep and pigs, and the USDA for dairy and non-dairy. Where statistics were available from both sources, when
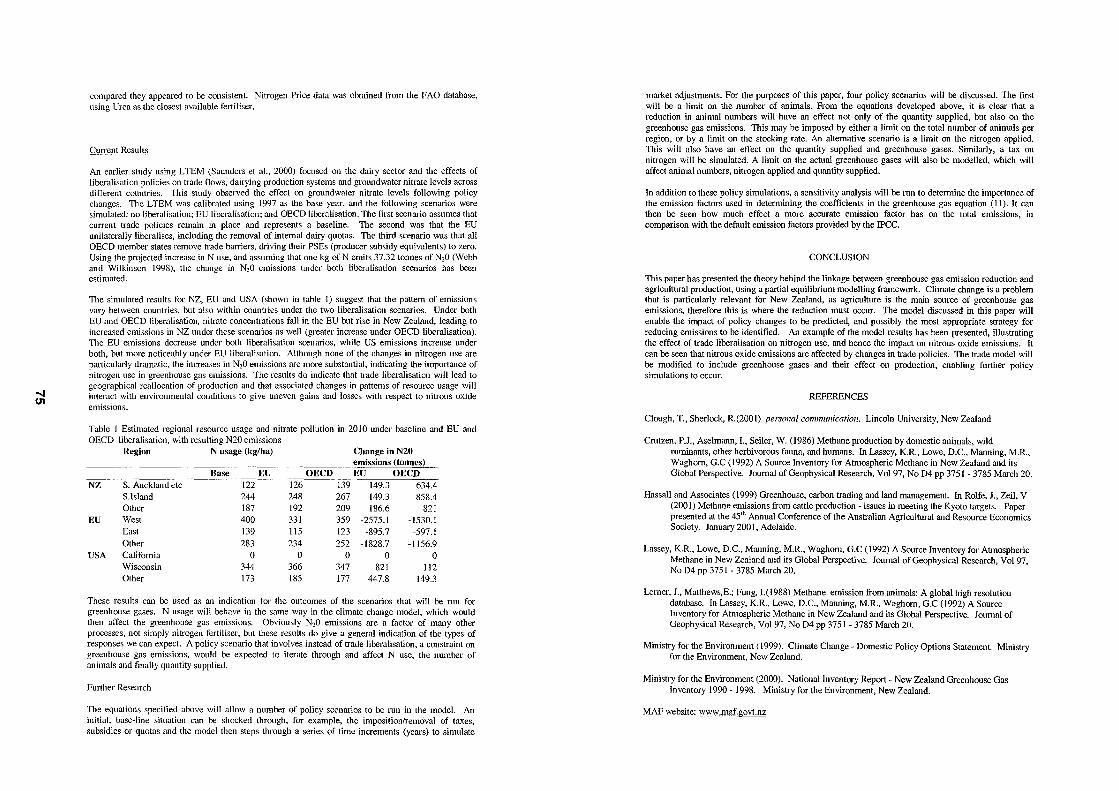
...... U1
compared they appeared to he consistent. Nitrogen Plice data was obtained from the FAa database, using Urea as the closest available fertiliser.
Cun-ent Results
An earlier study using LTEM (Saunders et a\., 2000) focused on the dairy sector and the effects of libcralisation policies on trade flows, dairying production systems and groundwater nitrate levels across different countries. This study observed the effect on groundwater nitrate levels following policy changes. The LTEM was calibrated using 1997 as the base year, and the following scenarios were simulated: no Iiheralisation; EU Iiheralisation; and OECD liheralisation. The fIrst scenario assumes that cutTent trade policies remain in place and represents a baseline. The second was that the EU unilaterally liheralises, including the removal of internal dairy quotas. The third scenario was that all OECD memher states remove trade baniers, driving their PSEs (producer subsidy equivalents) to zero. Using the projected increase in N use, and assuming that one kg of N emits 37.32 tonnes of N20 (Webb and Wilkinson 1998), the change in N,O emissions under both Iiheralisation scenarios has been estimated.
TIle simulated results for NZ, EU and USA (shown in table I) suggest that the pattern of emissions vary between counu'ies, but also within countries under the two liheralisation scenarios. Under both EU and OECD liheralisation, nitrate concentrations fall in the EU but rise in New Zealand, leading to increased emissions in NZ under these scenarios as well (greater increase under OECD liheralisation). The EU emissions decrease under both Iiheralisation scenarios, while US emissions increase under both, but more noticeably under EU liheralisation. Although none of the changes in nitrogen use are pm·ticularly rh'mnatic, the increases in N,O emissions m'e more substantial, indicating the importance of nitrogen use in greenhouse gas emissions. The results do indicate that trade liheralisation will lead to geographical reallocation of production and that associated changes in patterns of resource usage will interact with environmental conditions to give uneven gains and losses with respect to nitrous oxide emissions.
Table I Estimated regional resource usage and nitrate pollution in 20 I 0 under baseline and EU and OECD liheralisation, with resulting N20 emissions
Region N usage (kg/ha) Change in N20 emissions (tonnes)
Base EU OECD EU OECD NZ S. Auckland etc 122 126 139 149.3 634.4
S.lslmld 244 248 267 149.3 858.4 Other 187 192 209 186.6 821
EU West 400 331 359 -2575.1 -1530.1 East 139 115 123 -895.7 -597.1 Other 283 234 252 -1828.7 -1156.9
USA California 0 0 0 0 0 Wisconsin 344 366 347 821 112 Other 173 185 177 447.8 149.3
These results cml he used as an indication for the outcomes of the scenarios that will he nm for greenhouse gases. N usage will behave in the smne way in the climate change model, which would then affect the greenhouse gas emissions. Obviously N,O emissions are a factor of many other processes, not simply nitrogen fertiliser, but these results do give a general indication of the types of responses we can expect. A policy scenm'io that involves instead of trade liheralisation, a constraint on greenhouse gas emissions, would he expected to iterate through and affect N use, the mnnher of animals and finally quantity supplied.
F1Il1her Research
The equations specified above will allow a numher of policy scenmios to he run in the model. An initial, base-line situation can he shocked through, for example, the imposition/removal of taxes, subsidies or quotas and the model then steps through a series of time increments (years) to simulate
market adjustments. For the purposes of this paper, four policy scenarios will he discussed. The fIrst will he a limit on the numher of animals. From the equations developed above, it is clear that a reduction in animal numhers will have an effect not only of the quantity supplied, but also on the greenhouse gas emissions. This may be imposed by either a limit on the total numher of animals per region, or by a limit on the stocking rate. An alternative scenario is a limit on the nitrogen applied. This will also have an effect on the quantity supplied and greenhouse gases. Similarly, a tax on nitrogen will he simulated. A limit on the actual greenhouse gases will also he modelled, which will affect animal numhers, nitrogen applied and quantity supplied.
In addition to these policy simulations, a sensitivity analysis will he run to deten-nine the importance of the emission factors used in determining the coefficients in the greenhouse gas equation (II). It can then he seen how much effect a more accurate emission factor has on the total emissions, in comparison with the default emission factors provided by the IPCC.
CONCLUSION
This paper has presented the theory hehind the linkage hetween greenhouse gas emission reduction and agricultural production, using a partial equilibrium modelling framework. Climate change is a problem that is particularly relevant for New Zealand, as agriculture is the main source of greenhouse gas emissions, therefore this is where the reduction must occur. The model discussed in this paper will enable the impact of policy changes to he predicted, and possibly the most appropriate strategy for reducing emissions to he identifIed. An example of the model results has been presented, illustrating the effect of trade liheralisation on nitrogen use, and hence the impact on nitrous oxide emissions. It can he seen that nitrous oxide emissions are affected by changes in trade policies. The trade model will he modifled to include greenhouse gases and their effect on production, enabling further policy simulations to occur.
REFERENCES
Clough, T., Sherlock, R(200 I) personal communication. Lincoln University, New Zealand
Crutzen, P.J., Aselmann, I., Seiler, W. (1986) Methane production by domestic animals, wild ruminants, other herbivorous fauna, and humans. In Lassey, K.R, Lowe, D.C., Manning, M.R., Waghorn, G.C (1992) A Source Inventory for Atmospheric Methane in New Zealand and its Global Perspective. Journal of Geophysical Research, Vol 97, No D4 pp 3751 - 3785 March 20.
Hassall and Associates (1999) Greenhouse, carbon trading and land management. In Rolfe, J., Zeil, V (2001) Methane emissions from cattle production - issues in meeting the Kyoto targets. Paper presented at the 451h Annual Conference of the Australian Agricultural and Resource Economics Society. January 2001, Adelaide.
Lassey, K.R., Lowe, D.C., Manning, M.R., Waghorn, G.C (1992) A Source Inventory for Atmospheric Methane in New Zealand mld its Global Perspective. Journal of Geophysical Research, Vol 97, No D4 pp 3751 - 3785 March 20.
Lerner, J., Matthews,E.; Fung, 1.(1988) Methane emission from animals: A global high resolution database. In Lassey, K.R., Lowe, D.C., Manning, M.R, Waghorn, G.C (1992) A Source Inventory for Atmospheric Methane in New Zealand and its Global Perspective. Journal of Geophysical Research, Vol 97, No D4 pp 3751 - 3785 March 20.
Ministry for the Environment (1999). Climate Change - Domestic Policy Options Statement Ministry for the Environment, New Zealand.
Ministry for the Environment (2000). National Inventory Report - New Zealand Greenhouse Gas Inventory 1990 - 1998. Ministry for the Environment, New Zealand.
MAP website: www.maf.govt.nz
~
MAFF (2000). The effect of cultivation mId residue incorporation on nitrous oxide emissions from arable soils. Interim project rep0I1 CC0224. MAFF UK
National Science Strategy Committee for Climate Change (2000) A New Zealand Climate Change Research Strategy - Kyoto and Beyond. National Science Strategy Committee for Climate Change, New Zealand.
Rolfe, J., Zeil, V (2001) Methane elnissions from cattle production - issues in meeting the Kyoto tm·gets. Paper presented at the 45'h Annual Conference of the Australian Aglicultural and Resource Economics Society. January 200 I, Adelaide.
Saunders, C.S., Moxey, A.P., Roningen, V.A .• Cagatay, S. (2000). Economic and environmental impacts of global dairy trade liberalisation: some pm1ial equilibrium insights. Paper presented to the NZ Agliclllture and Resource Economics Society Conference, Blenheim June/July 2000.
Taylor. Prue (1998) An ecological approach to intemationallaw. Routledge, London and New York.
Ulyatt, MJ., Betteridge, K.. Costall, D., Knapp. J,. Baldwin, R.L (1991) Methane production by New Zealand mminants. Report prepared for the Ministry for the Environment, DSIR Grasslands, Palmerston NOIth, New Zealand.
Webb, J., Wilkinson, M. (1998) Costing of Options to Reduce N20 Emissions from Agliculture. AEA Technology Appendix in Options to Reduce N20 Emissions report
..,. ..,.
THE PACIFIC FIVE FREE TRADE AREA: IMPACTS ON AGRICULTURE IN NEW ZEALAND
John Ballingall Research Economist
New Zealand Institute of Economic Resem'ch PO Box 3479 Wellington'
SUMMARY
Recent attention has been paid to the possible expansion of the CER agreement between New Zealand mId Australia. One possibility for ml expanded CER is the creation of the Pacific Five, a free trade arrangement between New Zealand, Australia, Singapore, Chile, and the United States. This study provides a general equilibrium analysis of the creation of the Pacific Five, focusing on the implications for New Zealand's agricultural sectors. The results show that while some of these sectors may benefit, New Zealand should be careful when considering its future trade policy direction.
Key words: Pacific 5, agriculture, trade barriers, CER.
INTRODUCTION
In recent years, many nations have shifted their trade policy focus away from multilateral efforts to reduce trade barriers, and have instead moved towards regional free trade arrmlgements. New Zealand is one such nation. As well as pursuing U'ade liberalisation on a global basis via the World Trade Organisation (WTO) and its predecessor the General Agreement on Tariffs and Trade (GATT), New Zealmld entered into a bilateral arrangement with Australia in 1983 - the Closer Economic Relations (CER) trade agreement - and has also looked towards other regional fi'ee trade agreements. In January 200 I, New Zealand entered into a bilateral Closer Economic Partnership (CEP) free trade deal with Singapore, and is cunently exploring the possibility of similar anangements with Korea and Hong Kong.
The CER agreement is now well established, has been reviewed and changed frequently since its inception, and is currently entering a new phase. Satisfied with the format and results of the CER, the governments of New Zealand and Australia are now directing their attentions to expanding the CER. One option for an expanded CER that has been raised is the creation of the Pacific Five (P5) free U'ade agreement. This an'angement would involve New Zealand, Australia, Singapore, Chile, and the United States. A number of ministerial level discussions have taken place between government representatives from these five countries, albeit mainly on a bilateral basis. Most recently, the Singapore Trade Minister George Yeo urged the United States to build on its separate free trade talks with Chile and Singapore to craft a P5 including Australia and New Zealand (Palmer, 200 I).
While a detailed discussion of the probability of a P5 agreement being implemented in the near future is beyond the scope of this paper, one problematic issue that would undoubtedly arise should selious negotiations commence is the high level of agricultural protection afforded to American agricultural producers. Being a relatively efficient producer of agricultural products, New Zealand would expect to become more competitive if these tariffs, quotas, and subsidies were removed. This study aims to determine the economic impacts of the creation of a P5 free trade area, with a focus on the effects on New Zealand agricultural producers. A computable general equilibrium analysis, using the GT AP model, is employed to model the formation of the P5 under two alternative liberalisation scenarios.
, 11lis paper is a section from the author's Masters thesis, completed at Massey University under the supervision of Professor Srikanta Chatterjee and Professor Allan Rae. Many thanks are extended to them both for their contributions during the research.
MULTILATERAL VS REGIONAL TRADE LIBERALISATION: A BRIEF HISTORY
The recent expansion in the number of free trade areas (FT As) observed globally - tbere are now around 220 FTAs worldwide (Yarwood, 2001) - may have given some people the impression that this is a new phenomenon. This, however, is not the case. Moves away from the multilateral approach to the reduction of trade bmriers towards more localised trade negotiations, or regionalism, have a long history.
The 'First Regionalism', as Bhagwati (1993) names it, stemmed from the formation of the European Community (EC) in 1958. Despite tbe fact tbat the EC proposal did not comply fully with tbe GATT legislation, the United States helped push the proposal through to gain GATT approval. Whilst the United States had long been suspicious of FT As, it saw that there could be possible political benefits that would accrue to them from the creation of a trade bloc in Europe (Bhagwati, 1993, p. 28). Naturally, with the world's largest trading nation backing the concept of regionalism, a proliferation of FT A proposals appeared, including an early suggestion for a Pacific Free Trade Area, Many developing nations also entered into discussions on FT As, but bureaucratic inefficiency caused the downfall of most of these proposals, and the first wave of regionalism had virtually disappeared by the end of the decade, the EC notwithstanding.
Multilateral trade negotiations via the GATT forum became very much the vogue in the 1970s and early 1980s, and trade barriers were reduced substantially during this period. This successful period of multilateralism then encountered a number of problems. Since the end of the Tokyo Round of the GATT negotiations in 1979, increasingly complex trade issues such as intellectual property rights have stalled the GATT's ability to curb rising protectionist measures. As membership of the GATT and its successor the WTO has widened - over 140 nations are now WTO members, compared to just 23 in 1947 - reaching a consensus on future action has proved to be difficult. Nations have become frustrated with the slow progress made in multilateral trade negotiations, and have sought an alternative mode of trade liberalisation, This frustration, along with the conversion of the United States from being the staunchest defender of multilateralism into an aggressive follower of regionalism, has led to the recent trend towards regional FTAs - Bhagwati's 'Second Regionalism'.
The introduction and snbsequent success of FT As involving major industrialised nations, such as the North American Free Trade Agreement (NAFT A), the Australia-New Zealand CER, and the EU, have created an impression that such arrangements are here to stay (Schultz, 1996, p. 30; Bhagwati, 1993, p. 31). A further important reason behind the shift away from multilateralism towards regionalism is the possibility that world trade may be polarising into three main centres, namely the EU, North America, and East Asia (Chatterjee, 1999, p. 2). In view of this, many nations wish to form strategic alliances with one or more of the major trading partners in these blocs in order to avoid being 'left in the cold' in future trade negotiations.
Only history will tell if this second wave of regionalism is destined to head in the same direction as' the 'First Regionalism'. What is clear is that the new batch ofFTAs appears to be more permanent in nature than those of the 1960s. New Zealand at least appears keen to continue liberalisation negotiations at a regional level. It must be noted, however, that New Zealand continues to support multilateral, WTO style, trade talks. But in the presence of slow progress on that front, New Zealand's focus has turned to regional FT As as a method of reducing trade barriers. Therefore, interest in the formation of the P5 has remained high.
~ 0)
METHODOLOGY
Computable General Equilibrium models
The method used here to analyse the effects of expanding the CER to include Singapore, Chile and the United States is an applied Computable General EquilibJium (CGE) model. General Equilibrium (GE) models are commonly used tools in economic analysis, and in contrast to partial equilibrium techniques, GE models are able to capture many features of interdependent markets. The effects of shocks to one single market - the removal of trade barriers in this study - are usually felt in many other, related markets, and "general equilibrium is perhaps the only method capable of capturing the relevant feedback and flow-through effects" (Scollay and Gilbert, 2000, p. 177).
The use of CGE models in trade analysis cOlrunonly involves multi-regional, multi-sectoral frameworks. Under utility and profit-maximising behavioural assumptions, the models are initially assumed to be in a state of general equilibJium. In order to examine the effects of a change in trade policy, "experiments are conducted by shocking the initial equilibrium, introducing distortions or removing existing ones, and observing the new equilibrium that results" (Scollay and Gilbert, 2000, p. 177). Whilst there are some cOlrunon criticisms directed at CGE models - mainly with reference to a lack of paranleter specification - they remain popular in the analysis of trade policy as "there are no clearly superior altemative models available" (Shoven and Whalley, 1992, p. 5).
The GT AP model and database
The CGE model used in this study is the Global Trade Analysis Project (GTAP) developed by Thomas Hertel of Purdue University in 1992. GT AP is a relatively standard multi-commodity, mUlti-region trade model which can be shocked from an initial baseline situation to show the effects of a policy change. It is solved using the GEMPACK software (Harrison and Pearson, 1996). The recently developed version 4 of the GT AP database comprises of a complete set of economic accounts and detailed inter-industry linkages for 45 countries and regions, and for a total of 50 sectors. Through the aggregation of both countries and sectors, GT AP allows researchers to manipulate the database according to specific theoretical models in order to isolate the effects of a policy change on a particular region or commodity grouping.
In this study, the database was aggregated into a fourteen region, seventeen commodity model. Since the main focus is on Australia, New Zealand, Chile, Singapore and the United States, these nations were not aggt'egated into any composite regions. The 50 commodities in the database were aggt'egated into seventeen gt·oups, six of which are agt'icultural sectors. The agricultural commodities were intentionally left at a fairly detailed level of aggregation due to their importance in contributing to welfare gains from trade liberalisation.'
One issue that must be addressed before using the GT AP version 4 database to make conclusions and policy recommendations is that the protection levels on bilateral trade flows are from 1995. As such, they may not be an accurate representation of current intemationaltrade policies. This poses a problem because when these tariffs are reduced or eliminated in an experiment creating an FT A, any welfare gains may be inaccurate. To address this issue, a comparison was made between the tariffs used in the GTAP database and CUITent tariff levels.' This comparison was used to compare the GT AP and actual tariffs in New Zealand, Australia, Chile, Singapore and the United States. When significant differences between the GTAP and actual tariffs were found, changes were made to the GTAP database using the AL TERT AX tool in the RunGTAP program.
Liberalisation scenarios In modelling the formation of the P5 FT A, the liberalisation strategy involves the removal of the tariff equivalents in the GTAP database, and also the removal of export subsidies on the agricultural sectors. This liberalisation is /lot on a Most Favoured Nation (MFN) basis: the trade barriers are only removed
, As explained in Scollay and Gilbert (2000, p. 183), the elimination of trade ball'iers in agricultural sectors contributes between 50-70% of all gains from liberalisation in studies of the creation of an APECFTA. , Current tm'iff levels were sourced from '?!Y'_~w-"stariff.grg
on trade between the regions in the FT A. Protection levels of the FT A members with respect to the rest of the world are unaltered. Domestic production subsidies are also left at their pre-FT A levels in the regions forming the FT A. This is because the formation of FT As, at least in the initial stages, often leaves domestic production subsidies unchanged. Such subsidies tend to be addressed and sometimes reduced or removed at a later date, when the FT A becomes more deeply integrated. Since this experiment examines the shOlt-run impacts of the P5 immediately after it is formed - a momentary 'snap-shot' of each economy after the policy shock - it is unlikely that any domestic subsidies would be eliminated.
The majority of FT As phase in their trade barrier reductions over a specified time frame. The reasons behind the gradual abolition of barriers are that the abrupt adoption of completely free trade could potentially have a severe destabilising influence on the members' economies, and also that trade in some commodities is politically sensitive. As explained by Chatterjee, Rae and Shakur (2000, p. 4), "[a]gricultural markets have traditionally been ruled by a different set of regulations, institutions and political considerations than have those in manufactured goods". These agJicultural sectors are particularly important to New Zealand, due to their importance in its external trade, but they are politically sensitive due to the high levels of protection adopted by other governments.
Therefore, two alternative liberalisation scenarios for the creation of the P5 are explored:
Scenario A:
Scenario B:
Tariffs are completely removed on all sectors, except for agJicultural and food commodities. The protection levels in these latter sectors are left unaltered:
Tariffs are completely removed on !!l! sectors, and export subsidies are removed in the agticultural sectors. This would be the full FT A, and would be the ultimate goal of fOrming a FT A. 1hls gives a benchmark against which to compare the results from Option A.
GENERAL RESULTS
Scenario A: No agriculturalliberalisation
Table I shows the key results from scenaJio A. In this first scenario, where agJicultural subsidies and tariffs are not removed, global welfare increases substantially, by US$400 million.s The distribution of this welfare improvement, however, is very uneven. The United States is the main benefactor, its welfare improving by over US$750 million, and Singapore's welfare increases by US$73 million. The welfare gain to the United States is composed almost equally of benefits from an improved terms of trade (TOn and from allocative efficiency gains. Allocative efficiency gains are achieved from the removal of trade barriers when resources are removed from the previously protected sectors in the importing region, and switched into more efficient sectors. Efficiency gains are also made in the exporting region, as more resources are transferred to the sector which has been liberalised (Chatterjee ef ai, 2000).
Australia, on the other hand, suffers considerably from the P5 formation, as its welfare decreases by nearly US$700 million - mainly due to a significant deterioration in its TOT of over 1 %. Chile also suffers greatly, with its EV showing a welfare loss of over US$400 million. This loss can mainly be accounted for by a 1.95% decrease in its TOT. Compared to these two nations' losses, New Zealand's loss of US$67 million is relatively small.
4 These GT AP aggt'egations are: (i) Unprocessed meats and wools (ii) Meat products (iii) The dairy sector (iv) Raw and processed crops, sugar, oils and fats (v) Vegetables, fruits and nuts (vi) Food products not elsewhere classified
; The welfare measure employed in GTAP is that of Equivalent Variation. For further details, see Bowen, Hollander and Viaene (1998, pp. 211-213)

'" CO
Table I: The P5 with no agriculturalliberalisation - key results
Region EV Telmsof Allocative % change Change in % change (1995 US$ trade efficiency inGDP trade balance in terms of
million) effects on effects on (1995 US$ trade EV EV million)
-------------NZ -67.27 -74.76 -7.59 -0.79 -9.29 -0.38 Australia -776.51 -658.18 -33.87 -1.31 72.41 -1.01 Singapore 72.88 60.19 13.33 0.07 27.48 0.05 Chile -409.11 -369.82 -47.45 -2.64 -59.47 -1.95 USA 769.78 396.28 320.45 0.05 -15.80 0.05 World 398.86 -7.537 406.73
Scenario B: Fullliberalisation
The elimination of tariffs and export subsidies on agricultural products results in a less bleak outlook for New Zealand. As shown in Table 2, its welfare loss falls to US$13.6 million, indicating that there are important benefits to be gained through the continuation of lobbying to reduce trade barriers in these sectors. New Zealand's welfare loss in this scenario consists almost entirely of TOT effects -there m'e only very minimal negative resource allocation effects after the formation of the P5.
Australia's loss is also significantly smalier, falling by US$115 million from US$-776 million to US$-661 million. As would be expected, the liberalisation of agricultural products in the United States leads to New Zealand and Australia gaining in welfare (relative to scenario A) at the expense of the United States, The welfare gains experienced by Singapore and the United States decrease, although the benefits m'e still large at US$48 million and US$662 million respectively. Around half of the United States' total welfare gain is due to a more efficient allocation of resources after tariffs are removed. This may be explained by the fact that of the five nations examined, agricultural protection is only significant in the United States, and when it is removed, there are major efficiency gains.
Table 2: The P5 with fullliberalisation - key results
Region EV TenDS of Allocative (1995US$ trade efficiency
million) effects on effects on EV EV .. _ .. _----_._._-_ .. _----, .. _---_. __ ...
NZ -13.57 -25.93 -0.24 Australia -660.89 -564.65 -17.03 Singapore 48.38 35.87 12.97 Chile -413.14 -381.15 -40.23 USA 66?.45 290.64 329.73 World 432.60 -6.787 439.67
% change inGDP
Change in trade balance (1995 US$
% change in tenDS of
trade _____ .. __ . __ !.'!illio~ ____ _
-0.53 2.67 -0.12 -1.19 79.09 -0.86 0.08 26.88 0.03 -2.70 -63.30 -2.0 I 0.04 -22.73 0.04
A FOCUS ON NEW ZEALAND
The over-riding conllibuting factor to New Zealand's welfare losses is the deterioration in its tenDS of trade. Falling export and world prices and rising import prices lead to New Zealanders receiving less for the products that they sell in foreign markets, and spending more on goods purchased overseas. This has a detrimental effect on New Zealand's welfare. The terms of trade change can be broken down into three components in order to analyse their respective importance, and these three variables - the contributions to the change in the terms of trade due to world prices, export prices and import prices - me shown in Table 3.
Table 3: The contribution to New Zealand's change in terms of trade due to changes in World, export, and import prices
No agriculturalliberalisation Fuliliberalisation Change in TOT (%)' -0.384 -0.121 Contribution of World prices -0.031 -0.0 I Contribution of export prices -0.577 -0.316 Contribution of import prices -0.225 -0.205
a The change in the terms of trade is calculated from its three components using the following formula: /'" TOT = Contribution of World prices + Contribution of export prices - Contribution of
import prices
This table shows that changes to the world price in each sector have little effect on New Zealand's tenDS of trade. World prices fall in the vast majority of sectors - although by near negligible amounts - and this has a small detrimental effect on New Zealand's terms of trade because New Zealand's exporters receive a lower price for their goods overseas.
A more important factor in explaining the welfare losses experienced by New Zealand is the decrease in New Zealand's export prices that occur after the P5 is formed. Prices fall in every sector in New Zealand, in both scenarios. 1hls can be explained by the increases in supply in the majority of sectors in New Zealand after protection is removed. The lower export prices received by New Zealand's exporters reduce New Zealand's welfare. Prices fall by around 0.3% - 0.6% in all sectors, with these falls being larger when agricultural products are not Iiberalised. These decreased export prices have a significant negative effect on sectoral producer surpluses (the sum of the differences between the market price and the price at which producers would be willing to supply the commodity). This fall in producer welfare contributes to the decrease in equivalent variation experienced by New Zealand in both scenarios.
The third factor that must be examined when attempting to explain New Zealand's deteriorating terms of trade after the CER is expanded is the change in its import prices. Since New Zealand is reliant on imports for a great deal of its intermediate inputs to production, it is necessary to compare the changes in export prices with those of imported goods. Whilst import prices fall in every sector in both scenarios, they fall by less than the decrease in export prices in the vast majority of cases. Exceptions to this observation include the beverages, wood, transport and manufacturing sectors, but in general, import prices fall by less than export prices. This fact explains why New Zealand's terms of trade deteriorates in each experiment, and this deterioration in tum accounts for the majority of the welfare losses experienced by New Zealand.
IMPACTS ON NEW ZEALAND AGRICULTURE
The creation of the P5 leads to increased domestic output in the six agricultural sectors examined. This is due to a reallocation of resources after tm'iffs are removed. Trade theory suggests that when a tm'iff is removed on a commodity, output of that commodity rises in the countries which are relatively efficient at producing in that sector. Since New Zealand is generally recognised as an efficient producer of agricultural products, we would expect output in these sectors to increase after liberalisation, as resources are switched from other, less efficient sectors. Table 4 overleaf shows the change in agricultural outputs in each scenario.
0) o
Table 4: The percentage change in New Zealand's agricultural output
Sector U;;p;:ocessed;;;e;i~~nd wools Meat products Dail:y Crops, sugar, oils and fats Vegetables, fruits and nuts Food products nec
l'I()"g~iCllltll!"IIill~r."'i_s"!!()I1 ... 0.35 0.31 0.32 0.05 0.20 0.19
Fullliberalisation -_ .. __ ._ .. __ .•.. ,_.,-_., _._._. __ .... _._._ .... __ .. __ .... _ ....
0.09 0.60 1.14 0.16 0.16 0.19
Since it is unlikely that there would be any significant change in domestic demand for agricultural products, it is reasonable to suggest that the majority of this increased output would be exported. That is, there will be some export volume growth. One particularly interesting result is that output in the dairy sector increases by 1.14% after a fully liberalised P5 FT A is implemented. This is due to New Zealand's comparative advantage in dairy production, and also due to the removal of the relatively high level of protection afforded to United States' daiJ·y producers.
So what are the impacts of the FTA on New Zealand's agricultural exports? Table 5 below shows the percentage change in New Zealand's export prices after liberalisation. The results are perhaps not quite what we would have expected. Trade theory tells us that after a tariff on a commodity is removed, prices will rise in the countries which produce that good relatively efficiently. This is not the case for New ZeahUld' s agricultural goods.
Table 5: Percentage change in New Zealand's export prices
Sector No agriculturalliberalisation Fullliberalisation Unprocessed meats and wools -0.58 -0.38 Meat products -0.61 -0.41 Dairy -0.59 -0.39 Crops, sugar, oils atld fats -0.59 -0.42 Vegetables, fruits and nuts -0.58 -0.37 Food pr()cllIcts..l1~________ _________ :Q:~Q_________________ -0.44
One possible explanation for these results is that in terms of opening up new markets for New Zealand's agricultural exports, the creation of the P5 may not be particularly effective. We must remember that large proportions of New Zealand's agricultural exports are destined for key markets in Asia (for example. Korea and Japan). Since the reduction of trade barriers in this research is not on an MFN basis, protection levels in these destinations remain relatively high. That is, markets are not opened up in the destinations for most of New Zealand exports.
Looking at the effect of the reduction in trade barriers within the P5, while New Zealand exports large amounts of agricultural goods to Australia atld - to a lesser degree - Singapore, neither destination places any tariffs on these goods. Chile places a 10% tariff on New Zealand's expOlts, but Chile isn't a major expOlt destination for New Zealand. This means that when the P5 is created, the only significant expansion in the markets for New Zealand's agricultural exports is in the United States. This will lead to increased demand for New Zealand's agricultural goods from the United States. However, this increased dematld may not be large enough to offset the effect on export pdces fi'om the increased production of New Zealand agricultural producers. That is, the supply side effects of the allocation of more resources to agriCUlture in New Zealand (increased supply causing a fall in prices) outweighs the demand effects from the United States (increasing prices).
Despite these export price falls, the changes in value of New Zealand's agricultural exports are still positive in the majority of sectors. Table 6 below shows the change in export values by FT A destination in the two libel'alisation scenmios.
Table 6: Percentage change in New Zealand's agricultural export values by destination
No Agricultural Liberalisation I Full Liberalisation Export Destinatioll Export Destination
Sector AUS CHL SING USA AUS CHL SING USA
Unprocessed meats and wools -0.05 -1.67 0.64 0.61 -0.04 -23.31 -7.47 -11.87
Meat products -0.63 -1.83 0.62 0.59 -0.68 7.66 -1.46 3.42 Dairy -0.60 -1.79 0.65 0.62 -0.75 7.78 0.47 52.40 Crops, sugar, oils and fats 1.22 -1.56 0.66 0.60 1.21 8.11 0.52 5.61 Vegetables, fruits and nuts -0.02 -1.62 0.59 0.54 -0.07 7.96 0.43 0.67 Food products n.e.c -0.68 -1.65 0.66 0.64 -0.71 7.99 0.53 0.73
These results show that some agricultural exporters will make significant gains from the removal of agricultural trade barriers in a P5 FT A. Not surprisingly, there are few gains to be made when agricultural sectors are not liberalised in the first scenario examined. Since agricultural export prices fall in both scenarios, these increased values must be due to stronger volume growth. The result for the dairy sector under the fullliberalisation scenario is an increase in export values to the United States of over 50%. This suggests that there will be very strong volume growth of dairy exports to the United States, reflecting the reallocation of resources following the removal of trade barriers in this sector in the United States. However, this result may also reflect that fact that the tariff equivalent used in the GTAP database for New Zealand's dairy exports to the United States was very high. If this level of protection has been overstated, this would cause gains to New Zealand dairy exporters to also be over-inflated once protection was removed in the FT A"
These results suggest that should negotiations come into fruition regarding the fonnation of the P5 FTA, New Zealand should celtainly push for a significant reduction in the level of protection afforded to United States agricultural producers, as this would result in more favourable outcomes for New Zealand as a whole, and in particular for New Zealand's agricultural producers.
SUMMARY AND CONCLUSIONS
Due to the multitude of difficulties being experienced by many nations when trying to conduct multilateral trade liberalisation negotiations via the WTO, many countries are turning towards smaller, regional FT As in order to reduce trade barriers. New Zealand has been an active participant in such trade agreements. There has been some recent attention paid to expanding the CER agreement beyond Australia. One expansion possibility that has been proposed is the Pacific 5 - a FT A involving New Zealand, Australia, Singapore, Chile, and the United States. This article examines the likely outcomes of such an agreement, using the GT AP general equilibrium model, with a focus on itnplications for New Zealand agriculture.
Contrary to many studies of trade liberalisation including New Zealand, the model shows that welfare decreases in New Zealand by US$67 million when agricultural trade barriers are left unchanged, and by US$14 million when there is liberalisation in all sectors. This clearly demonstrates the importance of these sectors to New Zealand. The majority of the welfare losses can be attributed to a worsening in New Zealand's terms of trade, caused by export prices falling by more than import prices.
The impacts of the P5 on New Zealand's agricultural producers are increased output and decreased export prices. With the majority of the increased output heading overseas, the strong volume increases dominate the weaker prices, leading to higher export sales values for New Zealand's agricultural producers.
6 For dairy products entering the United States, the ad valorem tariff on imports beneath the quota is II %, and for those imports over and above the quota level, the tariff is levied at 70% (Rae, 2000). Thus if the United States receives dairy products well in excess of its set quotas, then an overall tariff on this sector could be close to the GTAP database tariff of 51.77%. However, if this was not the case, then the database's tariff may be higher than the true level of protection.
0) ...
Overall, the welfare losses experienced by New Zealand in this study suggest that that New Zealand should be careful when considering its future trade policy direction, and that it may need to
re-evaluate its attitude towards regional trade agreements. It also indicates that New Zealand should continue to push for liberalisation in the agricultural sectors in any future trade negotiations.
REFERENCES
Bhagwati, J. N. (1993). Regionalism and Multilateralism: An Overview. In New Dimensions in Regional Integration: J. De Melo and A. Panagariya (eds.). pp. 22-51, University'Press, Cambridge, United Kingdom.
Bowen, H. P., A. Hollander, and J-M. Viaene. (1998). Applied International Trade Analysis. MacMillan Press, London.
Chatte.jee, S. (1999). Regional Integration: An Economic Perspective from New Zealand. Ritsumeikan Journal of Asia Pacific Studies, Vol. 2, pp. 35-51.
Chatteljee, S., A. N. Rae, and S. Shakur. (2000). A Bold Millenium Round: Some Signposts for Trade and Welfare Gains from Comprehensive Multisector Reforms. Paper delivered at the Seventh International Convention of the East Asian Economic Association, Singapore, 17-18 November 2000.
Harrison, W. J., and K. R. Pearson. (1996). Computing Solutions for Lm'ge General Equilibrium Models using GEMPACK. Computational Economics, Vol. 9, pp. 83-127.
Palmer. D. (2001). Singapore asks U.S. to back a Pacific 5 trade pact. Reuters news service, 13 May WOI. I
Schultz, S. (1996). Regionalisation of World Trade: Dead End or Way Out? In Multilateralism Versus Regionalism: Trade Issues after the Uruguay Round, M.P. Van Dijk and S. Sideri (eds), pp. 20-39, FrmIk Cass and Co, London.
Scollay, R., and J. Gilbert. (1999). An APEC Food System: Trade and Welfare Implications by 2005 (draft only). APEC Study Center of New Zealand, Auckland, New ZeaImld.
Scollay, R., and J. Gilbe.1. (2000). Measuring the Gains fi'om APEC Trade Liberalisation: An Overview ofCGE Assessments. The World Economy, Vol. 23, No.2, pp. 175-196.
Yarwood, v. (2001). Momentum needed for Asia-Pacific trade talks. New Zealand Herald Online, 21 March 2001.
(XI I\)
THE CURRENT ROUND OF AGRICULTURAL TRADE NEGOTIATIONS: WHY BOTHER ABOUT DOMESTIC SUPPORT?"
Allan N Rae Massey University
SUMMARY
The current WTO agricultural trade negotiations began in March 2000. The previous Round reached agreements in the areas of market access, export competition and domestic support. One possibility is for the current Round to seek agreements under similar headings. Reaching agreement over reductions in domestic support to farmers is complicated by a number of factors, such as the extent to which such support impacts on production decisions, the wishes of governments to support farmers for pursuing multifunctional outcomes from agriculture, and the categorisation of a myriad of policy instruments into green, blue and amber boxes. It therefore poses the risk of considerably extending the negotiations and diverting attention away from other areas of reform. The sustainablility of many domestic support policies requires imposition of trade barriers. Therefore reform of trade barriers may force governments into reforming domestic support without requiring specific international agreements. The paper continues with quantitative assessments, using the GT AP applied general equilibrium model. Trade reform scenarios are analaysed, with and without specific reductions in domestic support. This illustrates the extent to which government domestic support spending might have to increase to compensate farmers when trade barriers are lowered, if current output levels are to be maintained. A conclusion is that trade expansion and welfare gains can be achieved even when domestic support is excluded from the multilateral agreement. This wonld reqnire some countries to significantly expand domestic support expenditures - to the extent that this is unlikely, trade and welfare gains would be further enhanced.
Keywords: WTO, trade reform, domestic support
INTRODUCTION The Uruguay Round Agreement on Agriculture (URAA) grouped reform commitments under the major headings of market access, export competition and domestic support. Inclusion of the latter was an important breakthrough, since it indicated recognition that domestic agricultural policies do link to international trade. However, there is wide agreement that the agreed reductions in domestic support in the URAA have been the least effective in contributing to any subsequent liberalisation of global food and agricultural markets. There are several reasons for this.
While the URAA specified 20% rednctions in domestic support expenditures from an agreed base (13.3% for developing countries), as calculated in the Aggregate Measurement of Support (AMS), qualifying policy instruments were grouped into three categories (the 'amber', 'blue' and 'green' boxes) depending upon their perceived abilities to impact on production and to distort trade flows. The agreed expenditure reduction applied only to those expenditures included in the amber box (such as market price support and input subsidies), and with few exceptions countries have adjusted their domestic support policies so as to comply with this Agreement. In addition to the policy-switching that took place, the general
;' Financial support from the New Zealand Foundation for Science, Research and Technology contract number IERXOOO I is gratefully acknowledged.
achievement of country commitments was facilitated by the fact that the 1986-88 base period was a period of extremely high domestic support. However over 60% of domestic support in OECD countries falls outside the amber classification and has therefore been exempt from the reduction commitments, and overall levels of domestic support in OECD countries have remained high (Figures 1 and 2).
A contributing factor to this outcome was the invention of the blue box towards the end of the Uruguay Round, allowing the EU and USA to exempt their major domestic support programmes from cuts. These are payments associated with production-limiting programmes where payments are based on fixed crop areas and yields, or fixed livestock numbers. While such exemptions have been claimed mainly by the EU and USA, in early 2001 Japan claimed blue box exemption for certain support to rice from 1998, referring to policy changes that would allow it not to measure in the AMS considerable support previously notified as market price support (Kennedy et al. 200 I).
While the AMS was calculated on a product-by-product basis, it was the sum of those expenditures that was to be reduced. Hence countries faced the possibility of making larger cuts in support to non-sensitive sectors allowing support levels to be maintained or even increased in the more politically-sensitive sectors. Also, the de minimus provision allowed the exclusion from the AMS of domestic commodity support that comprised less than 5% of the total production value of the relevant commodity (10% for developing countries).
Qualifying for the green box, and therefore exemption from reductions, are expenditures associated with programmes that have no, or at most minimal, trade-distorting effects or impacts on production. These include such instruments as government-funded general services, direct payments to producers, and payments associated with income insurance, disaster relief, environmental programmes and structural adjustment. Developing countries have been able to include a somewhat larger set of policies in the green box. The question of whether all payments reported in the green box have few or no production or trade effects requires further investigation (OECD 2001). In the 1986-88 base period, domestic support was dominated by amber box measures. During the implementation period, however, green box expenditures increased as amber box measures declined. For the OECD countries as a whole, green box spending was around one-quarter of total domestic support in the base period, but had increased to almost half by 1996 (OECD 2001).
The UR agreement on domestic support measures has been successful to the extent that countries have reformed some policies and have shifted their support emphasis from the amber box instruments to those of the blue and green boxes. This should have reduced somewhat the production and trade distortions due to domestic farm supports. However, the overall level of domestic support has in some countries actually increased. For example, domestic support levels in the EU and USA were higher in the late 1990s than in the 1986-88 base period. In the EU and USA, not only has the total PSE increased from 1986-88 to 1997-99, but the share of domestic support spending in the PSE has also risen (Figures I and 2). Domestic agricultural support payments remain concentrated in the EU, Japan and USA, together accounting for over 90% of total domestic support for the OECD as a whole (OECD 2001). Some would also argue that the green box policies, as defined by current criteria, do in some cases result in production and/or trade distortions.
THE CURRENT AGRICULTURAL NEGOTIATIONS & DOMESTIC SUPPORT
A new Round of agricultural trade negotiations began in March, 2000. In the first phase, which ended in March 200 I, there were 44 proposals and technical papers from 125
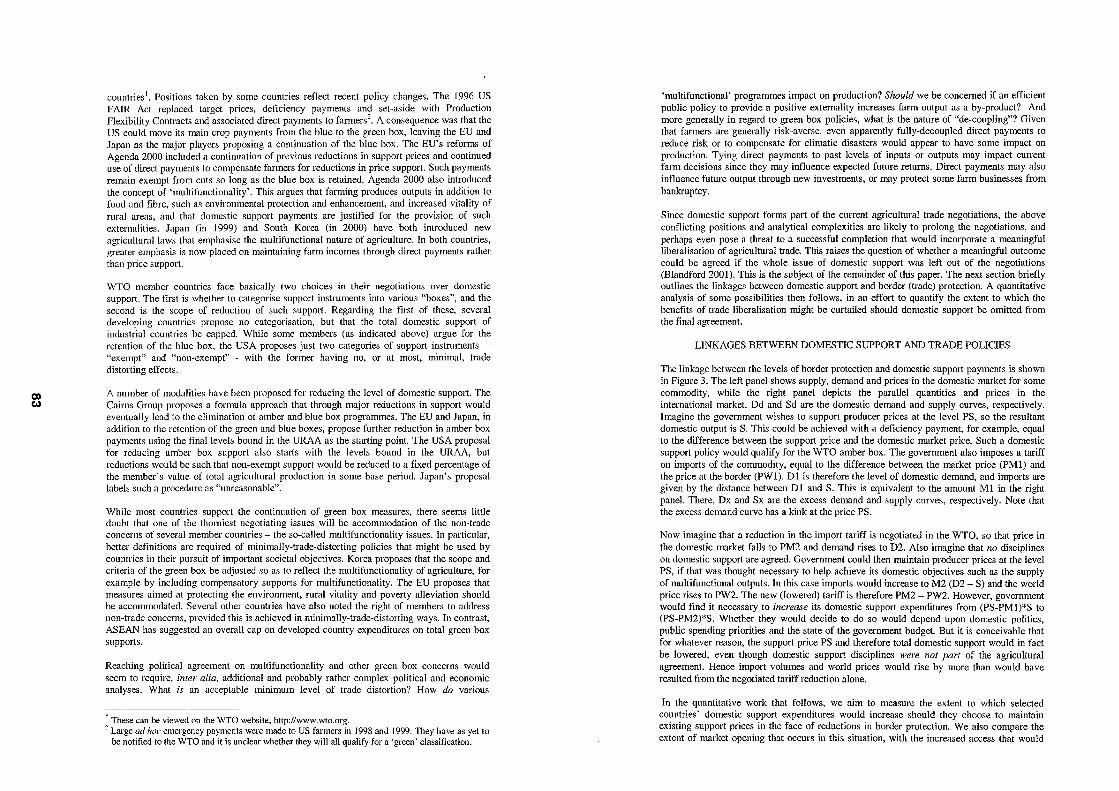
co Co)
countries I. Positions taken by some countries reflect recent policy changes. The 1996 US FAIR Act replaced target prices, deficiency payments and set-aside with Production Flexibility Contracts and associated direct payments to farmers2
• A consequence was that the US could move its main crop payments from the blue to the green box, leaving the EU and Japan as the major players proposing a continuation of the blue box. The EU's reforms of Agenda 2000 included a continuation of previous reductions in support prices and continued use of direct payments to compensate farmers for reductions in price support. Such payments remain exempt from cuts so long as the blue box is retained. Agenda 2000 also introduced the concept of 'multi functionality'. This argues that farming produces outputs in addition to food and fibre, such as environmental protection and enhancement, and increased vitality of rural areas, and that domestic support payments are justified for the provision of such externalities. Japan (in 1999) and South Korea (in 2000) have both introduced new agricultural laws that emphasise the multifunctional nature of agriculture. In both countries, greater emphasis is now placed on maintaining farm incomes through direct payments rather than price support.
WTO member countries face basically two choices in their negotIatIOns over domestic support. The first is whether to categorise support instruments into various "boxes", and the second is the scope of reduction of such support. Regarding the first of these, several developing countries propose no categorisation, but that the total domestic support of industrial countries be capped. While some members (as indicated above) argue for the retention of the blue box, the USA proposes just two categories of support instruments -"exempt" and "non-exempt" - with the former having no, or at most, minimal, trade distorting effects.
A number of modalities have been proposed for reducing the level of domestic support. The Cairns Group proposes a formula approach that through major reductions in support would eventually lead to the elimination of amber and blue box programmes. The EU and Japan, in addition to the retention of the green and blue boxes, propose further reduction in amber box payments using the final levels bound in the URAA as the starting point. The USA proposal for reducing amber box support also starts with the levels bound in the URAA, but reductions would be such that non-exempt support would be reduced to a fixed percentage of the member's value of total agricultural production in some base period. Japan's proposal labels such a procedure as "unreasonable".
While most countries support the continuation of green box measures, there seems little doubt that one of the thorniest negotiating issues will be accommodation of the non-trade concerns of several member countries - the so-called multifunctionality issues. In particular, better definitions are required of minimally-trade-distorting policies that might be used by countries in their pursuit of important societal objectives. Korea proposes that the scope and criteria of the green box be adjusted so as to reflect the multifunctionality of agriculture, for example by including compensatory supports for multifunctionality. The EU proposes that measures aimed at protecting the environment, rural vitality and poverty alleviation should be accommodated. Several other countries have also noted the right of members to address non-trade concerns, provided this is achieved in minimally-trade-distorting ways. In contrast, ASEAN has suggested an overall cap on developed country expenditures on total green box supports.
Reaching political agreement on multifunctionality and other green box concerns would seem to require, inter alia, additional and probably rather complex political and economic analyses. What is an acceptable minimum level of trade distortion? How do various
1 These can be viewed on the WTO website, http://www.wto.org. 2 Large ad hoc emergency payments were made to US farmers in 1998 and 1999. They have as yet to
be notified to the WTO and it is unclear whether they will all qualify for a 'green' classification.
'multifunctional' programmes impact on production? Should we be concerned if an efficient public policy to provide a positive externality increases farm output as a by-product? And more generally in regard to green box policies, what is the nature of "de-coupling"? Given that farmers are generally risk-averse, even apparently fully-decoupled direct payments to reduce risk or to compensate for climatic disasters would appear to have some impact on production. Tying direct payments to past levels of inputs or outputs may impact current farm decisions since they may influence expected future returns. Direct payments may also influence future output through new investments, or may protect some farm businesses from bankruptcy.
Since domestic support forms part of the current agricultural trade negotiations, the above conflicting positions and analytical complexities are likely to prolong the negotiations, and perhaps even pose a threat to a successful completion that would incorporate a meaningful Iiberalisation of agricultural trade. This raises the question of whether a meaningful outcome could be agreed if the whole issue of domestic support was left out of the negotiations (Blandford 2001). This is the subject of the remainder of this paper. The next section briefly outlines the linkages between domestic support and border (trade) protection. A quantitative analysis of some possibilities then follows, in an effort to quantify the extent to which the benefits of trade liberalisation might be curtailed should domestic support be omitted from the final agreement.
LINKAGES BETWEEN DOMESTIC SUPPORT AND TRADE POLICIES
The linkage between the levels of border protection and domestic support payments is shown in Figure 3. The left panel shows supply, demand and prices in the domestic market for some commodity, while the right panel depicts the parallel quantities and prices in the international market. Dd and Sd are the domestic demand and supply curves, respectively. Imagine the government wishes to support producer prices at the level PS, so the resultant domestic output is S. This could be achieved with a deficiency payment, for example, equal to the difference between the support price and the domestic market price. Such a domestic support policy would qualify for the WTO amber box. The government also imposes a tariff on imports of the commodity, equal to the difference between the market price (PM!) and the price at the border (PWI). Dl is therefore the level of domestic demand, and imports are given by the distance between Dl and S. This is equivalent to the amount Ml in the right panel. There, Dx and Sx are the excess demand and supply curves, respectively. Note that the excess demand curve has a kink at the price PS.
Now imagine that a reduction in the import tariff is negotiated in the WTO, so that price in the domestic market falls to PM2 and demand rises to D2. Also imagine that no disciplines on domestic support are agreed. Government could then maintain producer prices at the level PS, if that was thought necessary to help achieve its domestic objectives such as the supply of multifunctional outputs. In this case imports would increase to M2 (D2 - S) and the world price rises to PW2. The new (lowered) tariff is therefore PM2 - PW2. However, government would find it necessary to increase its domestic support expenditures from (PS-PM I )*S to (PS-PM2)*S. Whether they would decide to do so would depend upon domestic politics, public spending priorities and the state of the government budget. But it is conceivable that for whatever reason, the support price PS and therefore total domestic support would in fact be lowered, even though domestic support disciplines were not pm1 of the agricultural agreement. Hence import volumes and world prices would rise by more than would have resulted from the negotiated tariff reduction alone.
In the quantitative work that follows, we aim to measure the extent to which selected countries' domestic support expenditures would increase should they choose to maintain existing support prices in the face of reductions in border protection. We also compare the extent of market opening that occurs in this situation, with the increased access that would
(XI .r;:.
result from reductions in both border protection and domestic support. Two trade reform scenarios will be modelled. The first will attempt to simulate a possible agricultural agreement that includes cuts to both domestic support and border protection. The design of this reform outcome will be influenced by the proposals already submitted to the WTO. The other scenario attempts to shed light on the question "does negotiating domestic support reform really matter?" The regions most concerned about multifunctionality, for example, include the EU, the EFT A countries, Japan and South Korea. In those regions, it will be assumed that governments fully compensate farmers for the tariff cuts by increasing support by sufficient to maintain output levels. That is, such compensation will be assumed to be fully "coupled" in that it directly impacts on production and trade'. Various measures of the gains from trade reform will be compared with those obtained from the first, more complete set of policy reforms. An indication will also be obtained as 10 the potential increase in domestic support expenditures in those regions that provide the compensation.
DESIGN OF POLICY EXPERIMENTS Mark~Lac~~ , Despite the reductions agreed in the UR, agricultural tariffs currently average over 64% (Gibson et al. 2001), compared with about 4% for non-agricultural items. Two major problems continue. One is the average height of the tariff, and the other is the wide dispersion across agricultural tariff rates - and in some cases, such tariff dispersion is associated with the additional problem of tariff escalation. Commodities whose average tariffs exceed the global average include tobacco, dairy, meats and grains. Gibson et al. examined average tariffs in various countries for several commodity groups. In the USA, such tariffs vary from zero to over 100% (tobacco); in the EU and Japan the range of average tariffs in even wider - from zero to 350% (sugar beet) in the EU and from zero to 322% (dairy) in Japan. Such tariff peaks generally make profitable trade impossible. Defining a megatariff as one in excess of 100%, Gibson et af. uncovered 141 megatariffs in the EU schedules, 70% of which are in the dairy and meat sectors. [n Japan, megatariffs account for 63% of all tarift~lines in the dairy sector, with 20 of those rates in excess of 500%.
Of the current proposals for tariff reform (Meilke et af. 200 I), that of the CQ.irns Group is the most aggressive. It argues for deep cuts, using a formula approach that reduces high tariffs by more than low ones. The USA also seeks substantial tariff reductions or elimination of tariff disparities among countries, but does not indicate a particular formula. The EU proposes the same formula as was used in the UR, to give countries the needed flexibility required in lowering tariffs. Japan is not in favour of a formula-based approach to tariff reductions, and proposes modest reductions on a product-by-product basis (the request-andoffer approach) with allowance to exempt some commodities from any reduction. Developing countries have made a number of proposals in this area: some suggest tariff reductions being limited to the developed countries, and some support a formula approach that makes the biggest cuts to the largest tariffs.
Drawing from these proposals, the two scenarios discussed below both include tariff reductions as follows. First, tariffs below 5% ('nuisance' tariffs) will be eliminated. Second, the UR formula of an average 36% reduction in agricultural tariffs will be applied to tariffs above 5%, but excluding the megatariffs. For the latter (tariffs in excess of 100%), the 'Swiss Formula·4 is used, calibrated so that a 100% tariff is cut by 36%, with higher cuts applied to greater tariffs. For example, the chosen calibration would reduce a 200% tariff by
3 Based on recent experiences, such payments would in practice be somewhat more decoupled than this. Thus the reductions in imports, for example, that we quantify in the second scenario may well paint an overly-negative picture.
4 The Swiss formula was used for tariff reductions in industrial goods in the Tokyo Round. The formula can be written as t, = a*to/(a+t,,), where to is the existing tariff and t, is the new tariff. Here, we use a value of a= 178.
53% and a 300% tariff by 63%. The idea of combining approaches in this manner was coined the 'cocktail' approach by Josling and Rae (1999).
Export competition Any future task of reducing agricultural export subsidies is essentially an EU problem. Of the US$27 billion spent by WTO members subsidising exports between 1995 and 1998, the EU accounted for nearly 90%. Over this period, the EU subsidised almost all its exports of coarse grains, butter and skim-milk powder and beef, as well as the majority of its other dairy exports and wheatS.
Country position papers submitted to the WTO as part of the current negotiations indicate a high level of commitment to reduce the levels of export subsidies (Young et af. 2001). The Cairns Group and the USA are pressing for the complete elimination of export subsidies. Several developing countries also propose this outcome, in recognition of the depressing effect of such subsidies on domestic prices and therefore their own production incentives. A somewhat different position is adopted by the EU and Japan (which does not use export subsidies). These countries are in favour of such subsidies being reduced provided that all export measures are disciplined. The latter concerns refer to the so-called implicit export subsidy components of export credits (primarily used by the USA), state trading enterprises (STEs) and food aid, since these institutions and measures can and do include elements of export subsidisation.
The analytical model used in this paper cannot deal effectively with reforms in export credit policies, STEs and food aid. Although some reforms in these areas may be required to extract from the EU a commitment to reduce explicit export subsidies, total implicit export subsidies delivered via export credits for example (as estimated by the OECD 2000a) are described by Young et af. as being relatively small subsidies and unlikely to have major distortive impacts on trade patterns. In the following scenarios, the extreme position of complete removal of explicit export subsidies is not modelled. Rather, the same 'cocktail' of modalities that is applied to tariff reductions is also used to reduce export subsidies. In many cases, this leads to similar reductions as were agreed in the URAA, but it makes larger cuts to the largest subsidies6
•
Domestic supJ.2Qtl The database we access in this study does not dis aggregate domestic support expenditures into their amber, blue and green categories. Therefore it is not possible to consider recategorisation of domestic policies, or to apply different rates of reduction to the different categories, as some countries have proposed (Kennedy et al. 2001). Also, the modelling framework used requires these cuts to be applied at the commodity level, rather than to the sum of domestic support payments.
Three different approaches to dealing with domestic support, within the above constraints, will be explored. First, domestic support", at the commodity level, will be reduced by 20%. This constitutes rather a severe approach to domestic support reduction, as it requires countries to reduce all categories (colours) of support, and does not permit the trading-off of support among commodities. Second, we recognise no cuts in domestic support in some cases. That is, the support-to-market price ratios in the base data will be retained. Third, in
5 More recently, wheat and much pork and poultry has been exported without subsidisation due to a more favourable Euro/$ rate and lower EU support prices (that latter is a good example of the link between domestic support and border policies).
6 [t is the gap between domestic and export prices that is reduced here, rather than the total subsidy expenditures or the subsidised volumes that were addressed in the URAA. Using the same rates of reduction for expOli subsidies as for tariffs has merit in this case since the database used applied observed domestic/world price gaps at the commodity level on both the import and export side. It is therefore logical that equivalent reductions are made to both tariffs and export subsidies.
7 Strictly speaking, it is the ratio of the support price to the market price that will be reduced.

co en
addition to not requiring cuts in domestic support, certain countries (such as those currently embracing farmer compensation and multifunctionality) will be permitted to increase domestic support expenditures by way of compensation for reductions in border protection'. The specific countries and commodities allowed to make such compensation will be revealed as the modelling proceeds. In other words, if domestic support reductions were to be excluded from the current negotiations, we anticipate that some countries would behave in this matmer. To the extent that significant benefits from the remaining (border) policy reforms are achieved under the latter scenario, it may be concluded that the troublesome 'domestic support' component of the current negotiations might be given a lower negotiating priority.
SIMULATION METHODOLOGY AND EXPERIMENTS The GTAP applied general equilibrium model (Hertel 1997) was used to quantify some interactions between reforms in trade policies and domestic support. This is a multi-region model built on a complete set of economic accounts and detailed inter-industry linkages for each of the economies represented. The GT AP production system distinguishes sectors by their intensities in five primary production factors: land (agricultural sectors only), natural resources (extractive sectors only), capital, and skilled and unskilled labour. In trade, products are differentiated by country of origin, allowing bilateral trade to be modelled, and bilateral international transport margins are incorporated and supplied by a global transport sector. The model is solved using GEMPACK (Harrison and Pearson 1996). Data was from the version 4 GTAP database, which is benchmarked to 1995, and was aggregated up to the level of II regions and 15 sectors (Appendix Table I).
The experimental de~igns are described in Table I.
Table I
Exp.#1
Exp.#2
Experimental Design Market Access Export Competition Domestic Support
'cocktail' reduction of ad Explicit export Total support valorem tariff equivalents: 0-5% : eliminated 5-100%: reduced by 36% >100%: use Swiss formula (a=178)
As above
subsidies reduced at reduced by 20%, on a same rate as tariffs commodity-by-
As above
commodity basis
Base total retained, compensation reduced
support but for
bo\'der protection in some regions and commodities
The strategy followed for the construction of Experiment #2 will be as follows. Focus will be on those regions that are cUlTently the major spenders on domestic support policies, and those vigourously embracing multi functionality - we have chosen the EU, the EFT A countries, Japan, South Korea and the USA. Results from the comprehensive reforms of Experiment # I will be examined, and reductions in output in the above countries for selected major supported commodities (grains, oilseeds, beef cattle and milk) will be noted. In all such cases, compensation will be permitted in Experiment #2 such that base period levels of
S Should there be no agreement over domestic support, it is possible that the final levels of domestic support bound in the URAA would continue to apply. This need not rule out this scenm'io, however, since that binding refers only to amber box support. What we do assume here is that all blue or green box support has the same direct impact on production and trade as would amber box support.
output can be maintained. Further iterations may be required if implementation of such compensation leads, in tum, to output reductions in these countries that were not compensated for in a previous iteration. Such compensation is incorporated by modifying the GTAP model closure to allow output to be fixed (exogenised) while endogenising the ratio between support and market prices". Total domestic support expenditure will be computed as the difference between the supply price and the market price, times the volume of output (as explained in Figure 3)10.
RESULTS
Experiment #1 made reductions to tariffs, export subsidies and domestic support. Under this scenario, results indicated that domestic production of wheat, other grains, oilseeds, ruminant livestock and milk would all decline in the EU, EFTA, Japan and Korea. Experiment #2 illustrates a scenario wherein domestic support commitments are set aside in a future WTO agreement, and individual countries are free to do as they wish in regard to domestic support spending. Specifically, Experiment #2 assumes these countries increase domestic support for the commodities mentioned above so as to maintain base levels of output. Such a secondround of model results indicated that production of wheat and milk in the USA would fall (influenced by increased support of those sectors primarily in the EU). Therefore in a third round of computations, compensation was also permitted in the USA for wheat and milk.
In Table 2, focus is on those countries and commodities on which additional compensation payments have been allowed in experiment #2. The first column of numbers contain the commodity trade balances in the base year of 1995. Other data columns give the change in those trade balance~ under the two modelled scenarios. In every case involving the EU, EFT A, Japan and Korea, the comprehensive reforms of experiment #1 result in an increase in net imports or (EU wheat and dairy and EFTA dairy) a reduction in net exports. The USA is a net exporter of each commodity covered by this Table, and the comprehensive reforms result in an increase in those exports.
The earlier discussion of Figure 3 predicted that when the protective regions compensate their farmers for the reductions in tariffs, the increase in net imports (or decrease in net exports) would be less than when such compensation is not paid. The results of Table 2 show that trade balances do deteriorate by less than in the first experiment, and by substantially less in most cases. For example, the EU's 1995 trade surplus in wheat of US$1076 million is reduced by only $25 million when compensation is allowed, compared with a reduction of $443 million under the comprehensive reforms. For dairy products, EU compensation for tariff cuts results in EU net exports falling from $3029 million to $2879 million, rather than to $2108 million with the more complete reforms of experiment #1. Such reduced imports offer less market access for the exporters. So in the case of the USA (which in experiment #2 was permitted compensation payments only for wheat and milk) the increases in exports under comprehensive reforms are substantially reduced in experiment #2.
Impacts on prices and traded volumes at the global level are indicated in Table 3. The comprehensive reforms increase export prices by up to 7% (dairy products), with price increases in the 3%-6% range for several other commodities. The global volumes exported also increase in most cases, especially for coarse grains. Comparing global export volumes across both experiments, the expansion in wheat, beef and dairy trade is greater in the second experiment. Exports of these commodities were heavily subsidised in the base year in the EU, as were dairy exports in the USA. The reductions in export volumes that occur in
9 That is, we swap the variable to (change in the ratio of the supply price to the market price) for qo (change in quantity of output) in the closure for Experiment #2.
10 In GTAP notation, this is estimated as YOA(i,r) - YOM(i,r), where the former is value of output i in region r at agent's prices, and the laller is value of output in region i at market prices.
co 0)
experiment #1 are much smaller in the second experiment since compensation payments have maintained levels of domestic production. Hence global export price increases are generally much smaller in the second simulation - in fact the results suggest that failure to reach agreement on domestic support reductions could see global dairy prices falling relative to the base.
In the event of the agricultural negotiations failing to reach agreement on domestic support, how likely is it that certain regions would use this as an opportunity to provide full compensation to farmers for reduced border protection? Of course we are not in a position to answer this question, but some light is shed from the estimates of Table 4. The GT AP database records that in 1995, the EU spent US$46 billion on domestic support. The modelled reductions in domestic support included in experiment # I would see this total reduced to $36 billion. However, should agreement be reached only for reductions in border protection, and the EU provided full compensation in respect of our chosen major commodities, EU total spending on domestic support would need to increase by nearly 50% to $69 billion. Given the budgetary and enlargement issues confronting the EU at present, it is perhaps improbable that EU domestic support spending could increase to this extent. While such spending has increased substantially over the past decade - from $15 billion in 1986-88 to $43 billion in 1999, this reflected to a large extent the shift from price support to compensation payments as part of the CAP reforms. Over the same period, the total PSE for the EU increased much less - from $95 billion to $114 billion (OECD 2000b). Therefore, in the event that the current negotiations were to reach agreement on the kind of tariff cuts that we model, but not on domestic support, we suggest that the EU would likely back off past practice of providing full compensation to its fanners ".
Similar conclusions may be drawn with respect to the EFf A countries and Japan, who would also face substantial increases in domestic support spending should they opt for full compensation under experiment #2. For example recent trends in Japan's agricultural support spending suggest that it, too, may have difficulties with such a large increase in domestic support. Japan's PSE has increased only moderately in recent times, from US$54 billion in 1986-88 to $59 billion in 1999 (OECD 2000b). And historically, by far the majority of this support has been provided through border protection rather than as domestic support (see Figure I).
Our comprehensive reform scenario produces an increase in global welfare of US$25 billion (Table 5). As expected, the greatest gains occur for the regions with the highest agricultural tariffs or export subsidies - the EU, Japan and EFf A. More efficient allocation of resources provides the bulk of these benefits to the latter regions. Exporting regions such as Australia, NZ, and the USA benefit primarily due to improved terms of trade. The relatively weaker liberalisation of experiment #2 reduces the global welfare gains by half, although as in the first scenario, all regions with the exception of ROW still enjoy welfare enhancement. However the EU experiences just one-third of the gains from the more comprehensive reforms, since the compensation payments to farmers prevent resources from shifting to more efficient uses.
Finally, Table 6 indicates changes in New Zealand's net agricultural exports. The comprehensive policy reforms of the first experiment would increase New Zealand's agricultural and food exports (1995 values) by 25%, or from US$5.8 billion to $7.3 billion. If the policy reforms were restricted to reductions in tariffs and export subsidies, and if certain countries chose to pay compensation to farmers as described above, New Zealand's agricultural exports would increase by less, but that increase would still be almost US$1 billion or about 60% of the increase achieved under the full reform scenario. With beef and
11 We acknowledge that another option for the EU would be to seek a more moderate approach to reducing megatariffs, in which case fuller compensation might be affordable.
dairy farmers in Europe and Northeast Asia receiving compensation in the latter situation, New Zealand's output of these commodities increases by less than in the first scenario, and therefore so do exports.
CONCLUSIONS Negotiating meaningful reductions in domestic support is shaping up as one of the more contentious issues in the current WTO agricultural negotiations. The domestic support instruments used in some countries are linked to trade policy in the sense that reductions in tariffs may be accompanied by increases in domestic support. The question therefore arises, should countries agree to reduced border protection, what would be their responses with respect to domestic support? Should the agricultural negotiations mandate a reduction in domestic support, then that provides the answer. But because of the political and economic complexities of the negotiations on domestic support and the so-called non-trade issues such as multifunctionality, what if no agreement is reached on domestic support? Some countries could conceivably increase domestic support spending, but at least for the substantive tariff reforms modelled here, the increase in total domestic support expenditures in regions such as the EU, EFfA and Japan appear unlikely. Even if they were implemented, the global gains from reductions in border protection alone would be US$25 billion, or one-half of that achievable under a more complete liberalisation.
Finally, an important qualification: the above conclusion rests on the EU and others agreeing to the substantial tariff and export subsidy cuts modelled here. If they knew that domestic support was excluded from the negotiations, they could well seek a more moderate reform of agricultural tariffs so as to make required compensation to farmers more affordable. Note also that the EU and Japan, for example, have already proposed that tariff cuts be 'balanced' and' moderate', which may not be their interpretation of the scenarios assumed in this paper. Further research could replicate the above approach, but assume tariff reductions more consistent with the EU, EFf A and Japanese proposals.
REFERENCES
Blandford, D. (2001). Are disciplines required on domestic support? Estey Centre Journal of International Law and Trade Policy, 2(1):35-59.
Gibson, P., Wainio, J., Whitley, D. and Bohman, M. (2001). Profiles of Tariffs in Global Agricultural Markets. Agricultural Economic Report Number 796, Economic Research Service, USDA, Washington D.C.
Harrison, W.J. and Pearson, K.R. (1996), Computing solutions for large general equilibrium models using GEMPACK. Computational Economics, 9:83-127.
Hertel, T.W. (ed) (1997), Global Trade Analysis: Modeling and Applications, Cambridge University Press, Cambridge and New York.
Josling, T. and Rae, A.N. (1999). Multilateral approaches to market access negotiations in agriculture. Presented to The Conference on Agriculture and the New Trade Agenda in the WTO 2000 Negotiations, The World Bank and The World Trade Organisation, Geneva.
Kennedy, L., Brink, L., Dyck, J. and MacLaren, D. (2001). Domestic Support: Issues and Options in the Agricultural Negotiations. Commissioned Paper Number 16, International Agricultural Trade Research Consortium.

co ......
Meilke, K., Burfisher, M., Rude, J. and Bredahl, M. (200 I). Market Access: Issues and Options in the Agricultural Negotiations. Commissioned Paper Number 14, International Agricultural Trade Research Consortium.
OECD (2000a). An Analysis of Officially Supported Export Credits in Agriculture. COM/AGRICULTURALITDIWP(200)91IFinal. OECD, Paris.
OECD (2000b). Agricultural Policies in OECD Countries: Monitoring and Evaluation 2000. OECD, Paris.
OECD (2001). The Uruguay Round Agreement on Agriculture: An Evaluation of its Implementation in OECD Countries. OECD, Paris.
Young, L.M., Abbott, P.c. and Leetma, S. (2001). Export Competition: Issues and Options in the Agricultural Negotiations. Commissioned Paper Number 15, International Agricultural Trade Research ConsortiulU.
Table 2 Impacts on Net ExportslImports' for the Compensating Regions/Commodities (US$mill)
Base trade balance Change in trade balance
------EX]l#1 EX]l#2
WHEAT EU 1076 -443 -25 EFfA -53 -38 8 Japan -1022 -499 -33 Korea -459 -36 -14 USA 5328 342 85
OTHER GRAINS EU -294 -922 -49 EFfA -63 -44 11 Japan -3056 -358 -58 Korea -1408 -368 -36 USA 8456 1996 849
OILSEEDS EU -4973 -513 -34 EFfA -17 -53 -3 Japan -2285 -77 -36 Korea -504 -8 1 USA 5541 270 68
RUMINANTS/MEATS" EU -1573 -3722 -1284 EFfA -167 -311 -185 Japan -4347 -376 -264 Korea -761 -49 -30 USA 1461 854 516
DAIRY EU 3029 -921 -150 EFfA 161 -734 -20 Japan -845 -1416 -993 Korea -139 -36 -46 USA 161 320
Notes: a. 'Net exports' is the value of exports (fob) less the value of imports (cif). A negative value denotes net imports. b.Ruminants/meats is the sum of the GTAP commodities 'ct!' and 'beef' (see Appendix
Table 2)
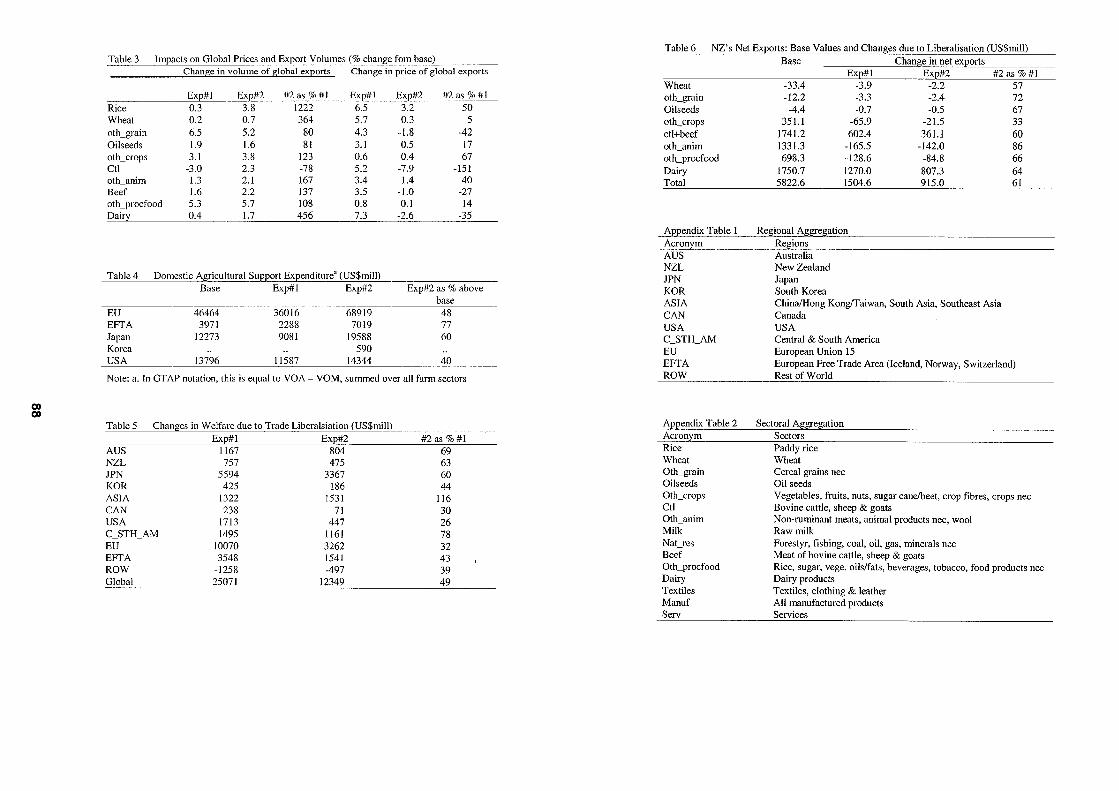
Table 3 Impacts on Global Prices and Export Volumes (% change fom base) Change in volume of global exports Change in price of global exports
~ EXE#2 #2 as %#1 Ex~1 Exp#2 #2 as %#1 Rice 0.3 3.8 1222 6.5 3.2 50 Wheat 0.2 0.7 364 5.7 0.3 5 olh_grain 6.5 5.2 80 4.3 -1.8 -42 Oilseeds 1.9 1.6 81 3.1 0.5 17 oth_crops 3.1 3.8 123 0.6 0.4 67 Ctl -3.0 2.3 -78 5.2 -7.9 -151 olh_anim 1.3 2.1 167 3.4 1.4 40 Beef 1.6 2.2 137 3.5 -1.0 -27 oth_procfood 5.3 5.7 108 0.8 0.1 14 Dairy 0.4 1.7 456 7.3 -2.6 -35
Table 4 Domestic Agricultural Support Expenditure' (US$mill) Base Exp#1 Exp#2 Exp#2 as % above
base EU 46464 36016 68919 48 EFTA 3971 2288 7019 77 Japan 12273 9081 19588 60 Korea 590 USA 13796 11587 14344 40
Note: a. In GT AP notation, this is equal to VOA - VOM, summed over all farm sectors
00 00
Table 5 Changes in Welfare due to Trade Liberalsiation (US$mill) EXE#I EXE#2 #2 as %#1
AUS 1167 804 69 NZL 757 475 63 JPN 5594 3367 60 KOR 425 186 44 ASIA 1322 1531 116 CAN 238 71 30 USA 1713 447 26 C_STH_AM 1495 1161 78 EU 10070 3262 32 EFTA 3548 1541 43 ROW -1258 -497 39 Global 25071 12349 49
Table 6 NZ's Net Export~:Jlase Vi\lues (lnd Changes due to Liberalisation (US$mill)
Wheal olh_grain Oilseeds olh_crops ctl+beef olh_anim oth_procfood Dairy Tolal
Base Change in net eXEorts
-33.4 -12.2
-4.4 351.1
1741.2 1331.3 698.3
1750.7 5822.6
Exp#1 Exp#2 -3.9 -2.2 -3.3 -2.4 -0.7 -0.5
-65.9 -21.5 602.4 361.1
-165.5 -142.0 -128.6 -84.8 1270.0 1504.6
807.3 915.0
#2as%#1 57 72 67 33 60 86 66 64 61
Appendix Table I Regional Aggregation Acronym Regions AUS Australia NZL New Zealand JPN KOR ASIA CAN USA C_STH_AM EU EFTA ROW
Appendix Table 2 Acronym Rice Wheat Oth_grain Oilseeds Oth_crops ClI Oth_anim Milk NaCres Beef Oth_procfood Dairy Textiles Manuf Serv
Japan South Korea China/Hong Kong/Taiwan, South Asia, Southeast Asia Canada USA Central & South America European Union IS European Free Trade Area (Iceland, Norway, Switzerland) Rest of World
Sectoral Aggregation Sectors Paddy rice Wheat Cereal grains nec Oil seeds Vegetables, fruits, nuts, sugar caneibeet, crop fibres, crops nec Bovine cattle, sheep & goats Non-ruminant meats, animal products nec, wool Raw milk Forestyr, fishing, coal, oil, gas, minerals nec Meat of bovine cattle, sheep & goats Rice, sugar, vege. oils/fats, beverages, tobacco, food products nec Dairy products Textiles, clothing & leather All manufactured products Services
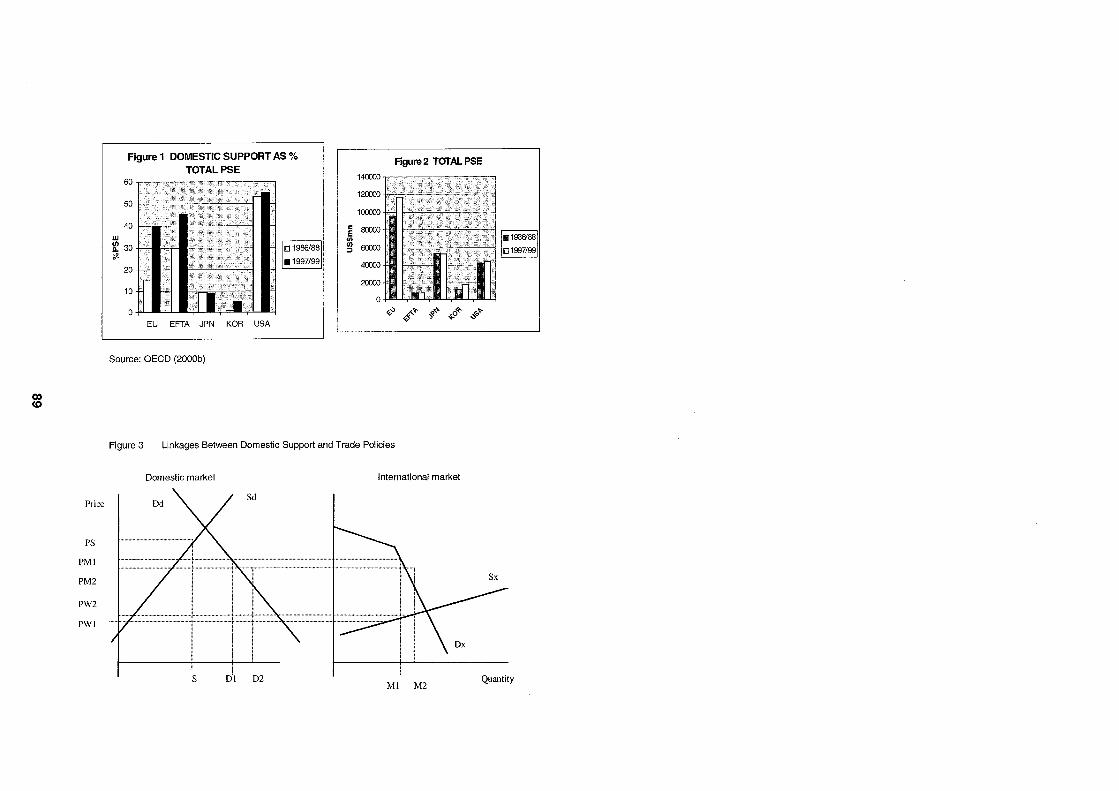
co co
Price
PS
PMI
PM2
PW2
PWI
Figure 1 DOMESTIC SUPPORT AS % TOTALPSE
~~~~--~~~~----~
50 I . I
40 I _. w Ul ~ 30 I ........
20
10
o I' .', ,_ - i""""- i I -"I EU EFTA JPN KOR USA
Source: OECD (2000b)
01986/88
.1997/99
Figure2 TOTAL PSE
140000
120000
100000
~ 80000
'" rg 6OOCO
40000
20000
0 ",,, ff~ §~ *-0'1:- ,,<o~
~
Figure 3 Linkages Between Domestic Support and Trade Policies
Domestic market International market
"-
i S DII D2
MI M2 Quantity
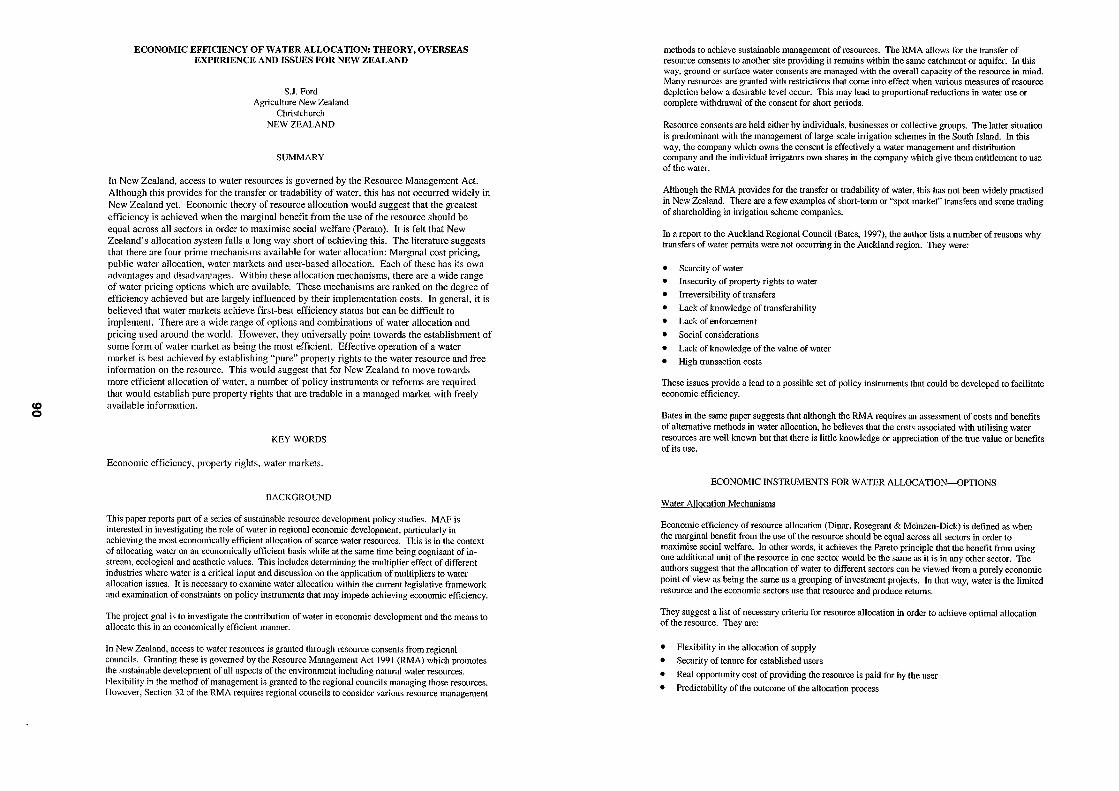
CD o
ECONOMIC EFFICIENCY OF WATER ALLOCATION: THEORY, OVERSEAS EXPERIENCE AND ISSUES FOR NEW ZEALAND
S.l. Ford Agriculture New Zealand
CItristchurch NEW ZEALAND
SUMMARY
In New Zealand, access to water resources is governed by the Resource Management Act. Although this provides for the transfer or tradability of water, this has not occurred widely in New Zealand yet. Economic theory of resource allocation would suggest that the greatest efficiency is achieved when the marginal benefit from the use of the resource should be equal across all sectors in order to maximise social welfare (Perato). It is felt that New Zealand's allocation system falls a long way short of achieving this. The literature suggests that there are four prime mechanisms available for water allocation: Marginal cost pricing, public water allocation, water markets and user-based allocation. Each of these has its own advantages and disadvantages. Within these allocation mechanisms, there are a wide range of water pricing options which are available. These mechanisms are ranked on the degree of efficiency achieved but are largely influenced by their implementation costs. In general, it is believed that water markets achieve first-best efficiency status but can be difficult to implement. There are a wide range of options and combinations of water allocation and pricing used around the world. However, they universally point towards the establishment of some form of water market as being the most efficient. Effective operation of a water market is best achieved by establishing "pure" property rights to the water resource and free information on the resource. This would suggest that for New Zealand to move towards more efficient allocation of water, a nnmber of policy instruments or reforms are required that would establish pure property rights that are tradable in a managed market with freely available information.
KEYWORDS
Economic efficiency, property rights, water markets.
BACKGROUND
This paper reports part of a series of sustainable resource development policy studies. MAF is interested in investigating the role of water in regional economic development, particularly in achieving the most economically efficient allocation of scarce water resources. This is in the context of allocating water on an economically efficient basis while at the same time being cognisant of instream, ecological and aesthetic values. This includes determining the multiplier effect of different industries where water is a critical input and discussion on the application of multipliers to water allocation issues. It is necessary to examine water allocation within the current legislative framework and examination of constraints on policy instruments that may impede achieving economic efficiency.
The project goal is to investigate the contribution of water in economic development and the means to allocate this in an economically efficient manner.
In New Zealand, access to water resources is granted tlu'ough resource consents from regional councils. Granting these is governed by the Resource Management Act 1991 (RMA) which promotes the sustainable development of all aspects of the environment induding natural water resources. Rexibility in the method of management is granted to the regional councils managing those resources. However, Section 32 of the RMA requires regional councils to consider various resource management
methods to achieve sustainable management of resources. The RMA allows for the transfer of resource consents to another site providing it remains within the same catchment or aquifer. In this way, ground or surface water consents are managed with the overal1 capacity of the resource in mind. Many resources are granted with restrictions that come into effect when various measures of resource depletion below a desirable level occur. This may lead to proportional reductions in water use or complete withdrawal of the consent for short periods.
Resource consents are held either by individuals, businesses or collective groups. The latter situation is predominant with the management of large-scale irrigation schemes in the South Island. In this way, the company which owns the consent is effectively a water management and distribution company and the individual irrigators own shares in the company which give them entitlement to use of the water.
Although the RMA provides for the transfer or tradability of water, this has not been widely practised in New Zealand. There are a few examples of short-term or "spot market" transfers and some trading of shareholding in irrigation scheme companies.
In a report to the Auckland Regional Council (Bates, 1997), the author lists a number of reasons why transfers of water permits were not occurring in the Auckland region. They were:
• Scarcity of water • Insecurity of property rights to water
• IITeversibility of transfers
• Lack of knowledge of transferability
• Lack of enforcement
• Social considerations
• Lack of knowledge of the value of water
• High transaction costs
These issues provide a lead to a possible set of policy instruments that could be developed to facilitate economic efficiency.
Bates in the same paper suggests that although the RMA requires an assessment of costs and benefits of alternative methods in water allocation, he believes that the costs associated with utilising water resources are well known but that there is little knowledge or appreciation of the true value or benefits of its use.
ECONOMIC INSTRUMENTS FOR WATER ALLOCATION-OPTIONS
Water Allocation Mechanisms
Economic efficiency of resource allocation (Dinar, Rosegrant & Meinzen-Dick) is defined as when the marginal benefit from the use of the resource should be equal across all sectors in order to maximise social welfare. In other words, it achieves the Pareto principle that the benefit from using one additional unit of the resource in one sector would be the same as it is in any other sector. The authors suggest that the allocation of water to different sectors can be viewed from a purely economic point of view as being the satne as a grouping of investment projects. In that way, water is the limited resource and the economic sectors use that resource and produce returns.
They suggest a list of necessary criteria for resource allocation in order to achieve optimal allocation of the resource. They are:
• Rexibility in the allocation of supply
• Security of tenure for established users
• Real opportunity cost of providing the resource is paid for by the user
• Predictability of the outcome of the allocation process
<0 ....
• Equity of the allocation process
• Political and public acceptability of the allocation process
They suggest that there m·e four prime mechanisms available for water allocation:
I. Marginal Cost Pricing (MCP). In this case, the price of water is equal to the marginal cost of supplying the last unit of that water. This has the advantages of achieving a first-best level of economic efficiency and avoiding the tendency to underprice the resource and therefore averting overuse. However, the difficulty remains in accurately defining MCP itself. This is because MCP can be multi-dimensional, varies over time and will vary with demand. The major disadvantage of this method is that it is difficult to implement and usually requires volumetric monitoring which is costly to administer. It has a high demand on information requirements and if the MCP is set inaccurately will influence demand in the wrong direction.
2. Public Water Allocation. It is difficult to treat water like a mm·ket good because historically is perceived as a public good. In mmly cases, Im·ge-scale development of water resource use is too expensive for the private sector and therefore requires some public investment and administration.
It has the advantages of promoting equity objectives strongly and has the ability to deal with some of the unusual aspects of water resources in that they require lumpy and long time horizons of investments, the water is normally collected in large river basins or aquifers which are interdependent and water is often seen as importmll for regional development.
Public water allocation has the disadvantages that it tends to replace the market mechanism and therefore can lead to waste and m.isallocation. To work properly, it requires coercion and sanctions and has a relatively poor degree of flexibility. Overall, public water allocation does not create initiatives for efficient use .
3. Water Markets. Water markets are loosely defined as an exchange of rights to water. These can occur at two levels. They can be on a spot market that traditionally provides for the trading of short-term rights to water use. A purer definition of a water market is the trading of penuanent property rights to water. Theoretically, water mm·kets are highly resource allocation efficient in that resources will move to the highest value use and therefore achieve the highest economic efficiency. However, water mm·kets sometimes require some degree of government intervention or control to create satisfactory market conditions including defining original allocations, creating institutional and legal fi"ameworks for trade, and perhaps investing in infrastructure to facilitate delivery and distributioll.
The advantages of water markets m·e that the seller can increase profitability and encourages increasing water availability for high value users. Environmental benefits can compete for resources in the mm·ket and it has a greater ability to internalise any externalities that may occur.
Disadvantages of water markets include the difficulties in measuring and defining rights with vm·iable flows and enforcing any rules on owners. One of the biggest disadvantages is the issue of transition from existing water allocation mechanisms to a mm·ket environment in that much of the water value will have already been capitalised into the production system.
4. User-based Allocation. User-based allocation requires collective action from institutions with authority over the allocation and distribution of water. Therefore, establishing property rights to the resource is a critical factor. It has the advmllages that it has the flexibility to adapt delivery to different use requirements over time and has a greater degree of administrative and political acceptability. Its disadvantages are that it needs transparency and can create poor inter-sectoral allocation of water.
Water Pricing Options
Much of the IiteratW"e (Tsur & Dinar, 1995 & 1997 and Johanssen, 2000) examines in great detail the various water plicing options available and their contribution to the goal of achieving economic efficiency of water use. A summary of the water pricing methods (Tsur, 1997) is as follows:
Volumetric Pricing-Requires that the water price be set equal to the marginal cost of water supply. If you do not consider the capital cost of setting up water delivery systems, then this cost of supply consists solely of the costs of delivery. In this case, the marginal cost-pricing rule is optimal. However, water pricing entails other costly activities such as maintaining and reading water meters and administering delivery systems and resolving disputes. It is felt that the costs incurred by these activities which are referred to as implementation costs become an integral part of the real cost of supply and are considered part of the marginal implementation cost. Therefore, the water price should equal the marginal delivery cost as well as the mm·ginal implementation cost. Because the marginal cost-pricing rule ignores implementation costs, it means that volumetric pricing cannot achieve fIrstbest outcomes. This is entirely dependent on implementation costs.
Output Pricing--This method prices water by imposing a tax on the output. This means that the allocation obtained under this system is second best when implementation costs are nil. It has the opportunity to distort decisions regarding input and output away from the first-best outcome. This means that it achieves the second-best level of efficiency but is very dependent on the degree of implementation costs.
Area Pricing--Area pricing requires that farmers pay a fixed fee per hectare or area of land for the right to receive irrigation water. This fee is usually a fixed cost and once paid can no longer affect decisions regarding input and output. It will, however, affect choices of crop or farming system and may cause some users to exit. This in itself reduces demand for water for farmers who do pay the water fee, the demand for water is higher and therefore the resulting water allocation is inefficient. However, implementation costs of this system are small.
Tiered Pricing and Two-part Tariff Pricing--These pricing methods m·e cOllllllon where water demand or supply is variable. It is therefore able to react more closely to supply and demand factors and therefore can achieve first-best efficiency. However, the administration and implementation costs can be relatively large.
Water Markets-Water mm·kets are considered to be highly efficient under conditions that rule a purely and well-informed market. In practice, it is difficult to achieve this degree of efficiency in markets that are governed by restricted delivery systems. It is generally felt that even with slight distortions, water markets outperform all other pricing methods when implementation costs are taken into account.
A table from Dinar compm·ing the major variables of the pricing methods is as follows:
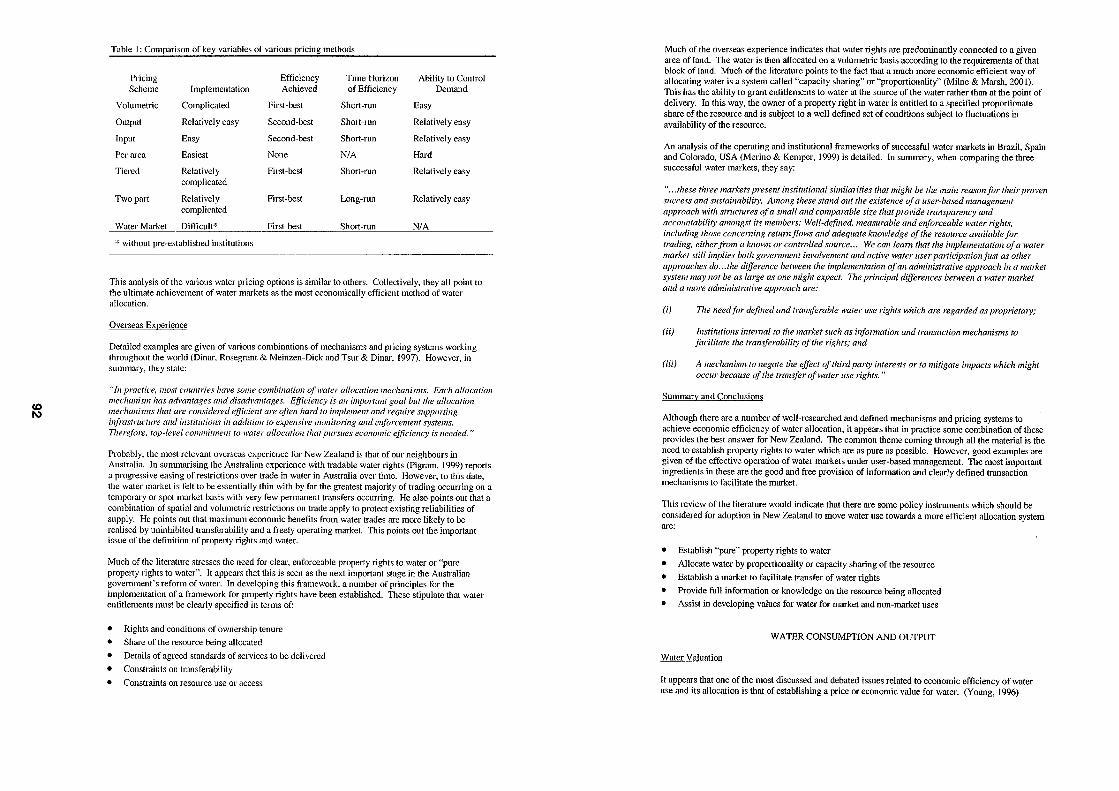
<0 I\)
Table I: Comparison of key variables of various pricing methods
Pricing Efficiency Time Horizon Ability to Control Scheme Implementation Achieved of Efficiency Demand
Volumetric Complicated First-best Short-run Easy
Output Relatively easy Second-best Short-run Relatively easy
Input Easy Second-best Short-run Relatively easy
Per area Easiest None N/A Hard
Tiered Relatively First-best Short-run Relatively easy complicated
Two part Relatively First-best Long-run Relatively easy complicated
Water Market Difficult'" First-best ShOJt-run N/A
" without pre-established institutions
This analysis of the various water pricing options is similar to others. Collectively, they all point to the ultimate achievement of water markets as the most economically efficient method of water allocation.
Overseas Experience
Detailed examples are given of various combinations of mechanisms and pricing systems working throughout the world (Dinar, Rosegrant & Meinzen-Dick and Tsur & Dinar, 1997). However, in summary, they state:
"In practice, most countries have some combination 01 water allocation mechanisms. Each allocatioJl mechanism has advantages al1d disadvallfages. Efficiel1(Y is all important goal bllt the allocatiol1 mechanisms that are considered efficient are often hard to implement and require supporting infrastructure and illstitutions ill addition to expensive monitoring and enforcement systems. Therefore, top-level commitment to water allocation that pursues economic efficiency is needed. "
Probably, the most relevant overseas experience for New Zealand is that of our neighbours in Australia. In suounarising the Australian experience with tradable water rights (Pigram, 1999) reports a progressive easing of restrictions over trade in water in Australia over time. However, to this date, the water market is felt to be essentially thin with by far the greatest majority of trading OCCUlTing on a temporary or spot market basis with very few permanent transfers occurring. He also points out that a combination of spatial and volumetric restrictions on trade apply to protect existing reliabilities of supply. He points out that maximum economic benefits from water trades are more likely to be realised by uninhibited transferability and a freely operating market. This points out the important issue of the definition of property rights and water.
Much of the literature stresses the need for clear, enforceable property rights to water or "pure property rights to water". It appears that this is seen as the next important stage in the Australian governmenCs reform of water. In developing this framework, a number of principles for the implementation of a framework for propelty rights have been established. These stipulate that water entitlements must be clearly specified in terms of:
• Rights and conditions of ownership tenure
• Share of the resource being allocated
• Details of agreed standards of services to be delivered
• Constraints on transferability
• Constraints on resource use or access
Much of the overseas experience indicates that water rights are predominantly connected to a given area of land. The water is then allocated on a volumetric basis according to the requirements of that block of land. Much of the literature points to the fact that a much more economic efficient way of allocating water is a system called "capacity sharing" or "proportiOJJality" (Milne & Marsh, 2001). This has the ability to grant entitlements to water at the source of the water rather than at the point of delivery. In this way, the owner of a property right in water is entitled to a specified proportionate share of the resource and is subject to a well defined set of conditions subject to fluctuations in availability of the resource.
An analysis of the operating and institutional frameworks of successful water markets in Brazil, Spain and Colorado, USA (Merino & Kemper, 1999) is detailed. In summary, when comparing the three successful water markets, they say:
" ... these three markets present institutional similarities that might be the main reason for theirproven success and sllstainability. Among these stand alit the existence of a user-based management approach with stntctures "fa small and comparable size that provide transparency and accountability amongst its members: Well-defined, measurable and enforceable water rights, including those conceming retumflows and adequate knowledge of the resource availablefor trading, eitherfrom a known or controlled source ... We call leam that the implementatiol! of a water market still implies both govemmelll involvement and active water lIser panicipation jllst as other approaches do ... the difference between the implementation "fall administrative approach in a mQ/*et system may not be as large as one might expect. The principal differences between a water market and a more administrative approach are:
(i) The needfor defined and transferable water use rights which are regarded as proprietary;
(ii)
(iii)
Institlltions intemal to the market sllch as infonnation and transaction mechanisms to facilitate the transferability of the rights; and
A mechanism to negate the effect of third party interests or to mitigate impacts which might occur becallse (if the transfer of water use rights. "
Summary and Conclusions
Although there are a number of well-researched and defined mechanisms and pricing systems to achieve economic efficiency of water allocation, it appears that in practice some combination of these provides the best answer for New Zealand. The common theme coming through all the material is the need to establish property rights to water which are as pure as possible. However, good examples are given of the effective operation of water markets under user-based management. The most important ingredients in these are the good and free provision of information and clearly defined transaction mechanisms to facilitate the market.
This review of the literature would indicate that there are some policy instruments which should be considered for adoption in New Zealand to move water use towards a more efficient allocation system are:
• Establish "pure" property rights to water
• Allocate water by proportionality or capacity sharing of the resource
• Establish a market to facilitate transfer of water rights
• Provide full information or knowledge on the resource being allocated
• Assist in developing values for water for market and non-market uses
WATER CONSUMPTION AND OUTPUT
Water Valuation
It appears that one of the most discussed and debated issues related to economic efficiency of water use and its allocation is that of establishing a price or economic value for water. (Young, 1996)
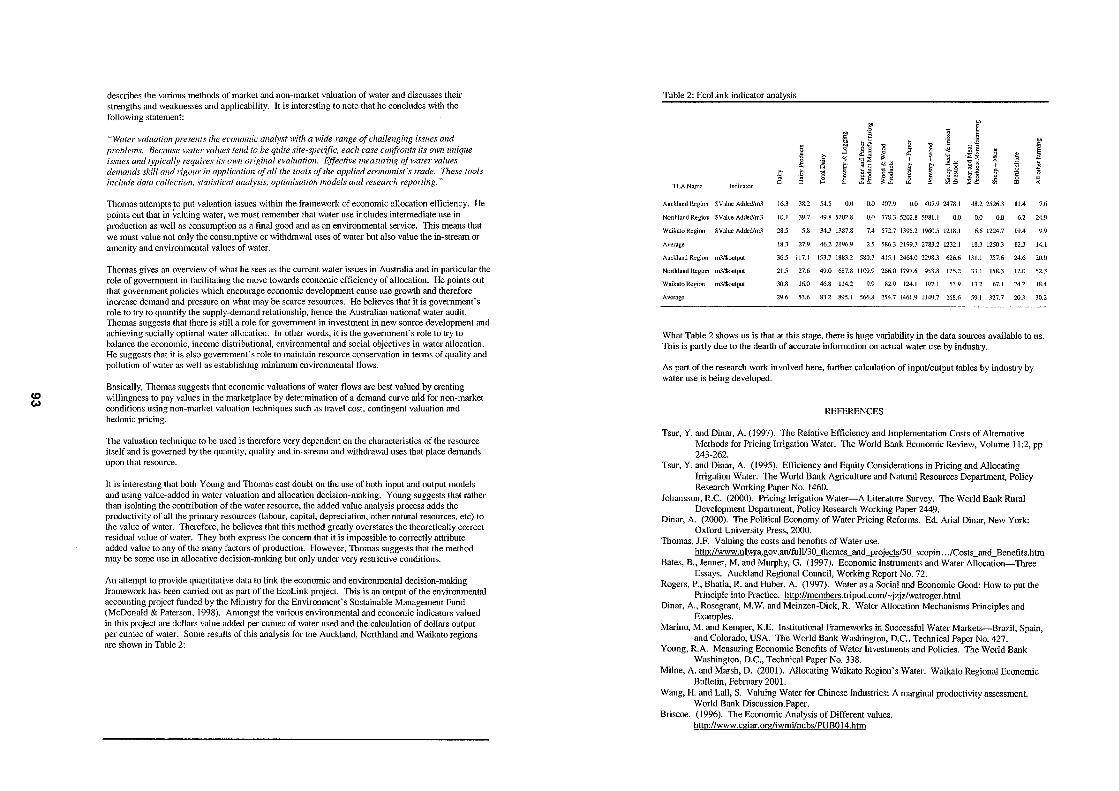
co Co)
describes the various methods of mm'ket and non-market valuation of water and discusses their strengths and weaknesses and applicability. It is interesting to note that he concludes with the following statement:
"Water valuation presents the economic analyst with a wide range of challenging issues and problems. Because water values tend to be quite site-specific, each case cO/ifmnts its OWIl unique issues and typically requires its mvn original evaluation. Effective measuring of water values demands skill and rigo",. in application of all the tools ,,{the applied economist's trade. These tools include data collection, statistical (l1lalysis, optimisation models and research reponing. "
Thomas attempts to put valuation issues within the framework of economic allocation efficiency. He points out that in valuing water, we must remember that water use includes intermediate use in production as well as consumption as a tinal good and as an environmental service. This means that we must value not only the consumptive or withdrawal uses of water but also value the in-stremn or amenity and environmental values of water.
Thomas gives an overview of what he sees as the current water issues in Australia and in particular the role of government in facilitating the move towm'ds economic efficiency of allocation. He points out that government policies which encourage economic development cause use growth and therefore increase demand and pressure on what may be scarce resources. He believes that it is governmenfs role to try to quantify the supply-demand relationship, hence the Australian national water audit. Thomas suggests that there is still a role for government in investment in new source development and achieving socially optimal water allocation. In other words, it is the government's role to try to balance the economic, income distributional, environmental and social objectives in water allocation. He suggests that it is also govel11mcnt's role to maintain resource conservation in tel111S of quality and pollution of water as well as establishing minimum environmental flows.
Basically, Thomas suggests that economic valuations of water flows are best valued by creating willingness to pay values in the marketplace by determination of a demand curve mId for non-market conditions using non-market valuation techniques such as travel cost, contingent valuation and hedonic pricing.
The valuation technique to be used is therefore very dependent on the characteristics of the resource itself and is governed by the quantity, quality and in-stream and withdrawal uses that place demands upon that resource.
It is interesting that both Young and Thomas cast doubt on the use of both input and output models and using value-added in water valuation and allocation decision-making. Young suggests that rather than isolating the contribution of the water resource, the added value analysis process adds the productivity of all the primary resources (labour, capital, depreciation, other natural resources, etc) to the value of water. Therefore, he believes that this method greatly overstates the theoretically correct residual value of water. They both express the concern that it is impossible to correctly attribute added value to any of the many factors of production. However, Thomas suggests that the method may be some use in allocative decision-making but only under very restrictive conditions.
An attempt to provide qumllitative data to link the economic and environmental decision-making framework has been carried out as pm·t of the EcoLink project. This is an output of the environmental accounting project funded by the Ministry for the Environment's Sustainable Management Fund (McDonald & Paterson, 1998). Amongst the various environmental and economic indicators valued in this project m'e dollm's value added per cumec of water used and the calculation of dollm's output per cumec of water. Some results of this analysis for the Auckland, Northland and Waikato regions are shown in Table 2:
Table 2: EcoLink indicator analysis
'" r 1 r .~
[~ l 1 ~~ I ~ .5 ~ o>! 2 :; ~ J ,;;.
~ t:- o>! ~ll + ~ llll .. ~ • u o>! ~. ~ '§t; +
~ ~ " ~ t:- .~ ] e !~ g ~ ~ ~.g 1:' .. ,jj :ll ';l TLANamc Indicator " " & " & & ti ::EO::
Auckland Region $Valuc Addcdlm3 163 38.2 54.S 0.0 0.0 407.9 0.0 407.9 2478.1 48.2 2526.3 11.4 7.6
Northland Region $Value Addet.Vm3 10.1 39.7 49.8 5202.8 0.0 778.3 5202.8 5981.1 0.0 0.0 0.0 6.2 24.9
Waiknto Region $Va]uc Added/m3 28.5 5.8 34.3 1387.8 7.4 572.7 1395.2 1960.5 1218.1 6.6 1224.7 19.4 9.9
Average 18.3 27.9 46.2 2196.9 2.5 586.3 2199.3 2783.2 1232.1 18.3 1250.3 12.3 14.1
Auckland Region m3/$output 36.5 1I7.1 153.7 1883.2 580.7 415.1 2464.0 2298.3 626.6 131.1 757.6 24.6 20.0
Nonhland Region m3/$output 21.5 27.6 49.0 687.8 1109.9 266.0 1797.6 953.8 125.2 33.1 158.3 12.0 52.3
Waikalo Region mll$ouLpUl 30.8 16.0 46.8 114.2 9.9 82.9 124.1 197.1 51.9 13.2 67.1 24.2 18.4
Average 29.6 53.6 81.2 895.1 566.8 254.7 1461.9 1149.7 268.6 59.1 327.7 203 30.2
What Table 2 shows us is that at this stage, there is huge variability in the data sources available to us. This is pmtly due to the dearth of accurate information on actual water use by industry.
As part of the research work involved here, further calculation of input/output tables by industry by water use is being developed.
REFERENCES
Tsur, Y. and Dinar, A. (1997). The Relative Efficiency and Implementation Costs of Alternative Methods for Pricing Irrigation Water. The World Bank Economic Review, Volume 11:2, pp 243-262.
Tsur, Y. and Dinm', A. (J 995). Efficiency and Equity Considerations in Pricing and Allocating Irrigation Water. The World Bank Agriculture and Natural Resources Department, Policy Research Working Paper No. 1460.
Johansson, R.C. (2000). Pricing Irrigation Water-A Literature Survey. The World Bank Rural Development Department, Policy Research Working Paper 2449.
Dinar, A. (2000). The Political Economy of Water Pricing Reforms. Ed. Arial Dinar, New York: Oxford University Press, 2000.
Thomas, J.F. Valuing the costs and benetits of Water use. http://www.nlwra.gov.au/fuI1l30themesandproiects/50_scopin .. .lCosts_and_Benetits.htm
Bates, B., Jenner, M. and Murphy, G. (1997). Economic Instruments and Water Allocation-Three Essays. Auckland Regional Council, Working Report No. 72.
Rogers, P., Bhatia, R. and Huber, A. (1997). Water as a Social and Economic Good: How to put the Principle into Practice. http://members.tripod.com/-jzjz/watroger.html
Dinar, A., Rosegrant, M.W. and Meinzen-Dick, R. Water Allocation Mechanisms Principles and Examples.
Marino, M. and Kemper, K.E. Institutional Frameworks in Successful Water Markets-Brazil, Spain, and Colorado, USA. The World Bank Washington, D.C., Technical Paper No. 427.
Young, R.A. Measuring Economic Benetits of Water Investments and Policies. The World Bank Washington, D.C., Technical Paper No. 338.
Milne, A. and Marsh, D. (2001). Allocating Waikato Region's Water. Waikato Regional Economic Bulletin, February 200 I.
Wang, H. and Lall, S. Valuing Water for Chinese Industries: A marginal productivity assessment. World Bank Discussion.Paper.
Briscoe. (1996). The Economic Analysis of Different values. http://www.cgiar.org/iwmi/pubs/PUBOI4.htm

(0 01:>0
Briscoe, J, (1996), Water as an Economic Good: The idea and what it means in practice. Proceedings of the World Congress of the International Commission on irrigation and Drainage, Cairo, 1996.
Pigram, J. (1999). Tradable Water Rights: The Australian experience. Paper presented to the Taiwan Institute for Economic Research, Taipei, 1999.
McDonald and Patterson. (1998). EcoLink.
<0 U1
A PARTICIPATORY ANALYSIS OF COMMUNICATION NETWORKS TO GUIDE POLICY STRATEGY: RESULTS FROM A STUDY OF FARM DAIRY EFFLUENT STRATEGIES
IN THE STATE OF VICTORIA
Terry Parminter, AgResearch, Private Bag 3123, Hamilton, New Zealand Justine Pedersen, AgResearch, Private Bag 3123, Hamilton, New Zealand
John Wilson, AgResearch, Private Bag 3123, Harnilton, New Zealand Sandra Jefford, GippsDairy, PO Box 353, Warragul3820, Victoria, Australia
SUMMARY
Implementation of a single policy objective is made more difficult when it requires different stakeholders to be aligned and cooperate together. In this project the State of Victoria policy agencies (Environmental Protection Agency and the Department of Natural Resources and the Environment) were seeking an industry strategy that would encourage reductions in effluent contamination of waterways throughout the State.
During the project an industry forum was held that included people from the farming, policy, extension, processing, and science functional groups. The forum used a structured process to first identify issues associated with misalignment between stakeholder groups, and then to devise ways of overcoming these. The forum addressed issues about institutional responsibility, consistency of standards, performance evaluation and reward, and communication.
The project involved focus groups of farmers to identify the sources of information that they used and the functional groups that most influenced their decisions. Following the project, the dairy industry supported the establishment of a statewide coordinator for effluent policy implementation and is continuing with the development of effluent management standards in dairy industry Quality Management Schemes.
This paper provides an outline of the workshop processes used and a description of how alignment of differing expectations was achieved.
INTRODUCTION
Implementation of environmental policy generally requires the co-operation of a number of groups highly influential with the subjects of a policy. Such groups may be only indirectly associated with a specific policy but they still need to be involved because their level of significance is so great. Each of these groups may have strategies and information that can either reinforce or conflict with the implementation of policy (Scharpf 1997, p5). Some environmental policy is still being developed hierarchically between political managers and policy makers and is imposed upon communities of interest. When decisions are made by Regional Councils acting in a hierarchical fashion they are able to be selective about accommodating the preferences of people in communities and they can also ignore any unique inforrnation that policy subjects may have about policy implementation (Scharpf 1997, pI74).
In the environmental area the other organisations that may be necessary to collaborate on policy implementation may have conflicting knowledge, values, and goals to policy organisations. Yet to make progress in developing joint strategy collaborating groups should be homogeneous with respect to their modes of operation (Olsen 1982, p23). Taking a "Practice" or '1unctional group" approach to developing strategies for policy implementation can assist in overcoming conflicting goals and organisational barriers from heterogeneous groups within as well as between organisations. In the application of this approach functional groups based upon common activities, competencies, and values
participate in strategy building (Paine 1997). These functional groups exist within and across organisations.
A previous project in New Zealand has examined and evaluated methods for functional groups to mediate change and enhance their ability to improve the effectiveness of their working together in the context of sustainable agriculture (Parminter et al 1999). This project examined the application of these principles in Victoria, Australia. Other papers presented to this Society cover other aspects of this project (Parminter et al 2000, Parminter et aI2001).
The management of dairy effluent in Victoria is covered by the State Environment Protection Policy (Waters of Victoria). This policy generally states that dairy effluent must be managed in such a way that it is contained on the farm and does not pollute surface or ground waters.
A range of effluent management systems has been developed and recommended by the Environment Protection Authority and the Department of Natural Resources and Environment. These systems include various combinations of processes for containment, solids separation, storage and application to pastures or crops.
The level of compliance with the State Environment Protection Policy through installation and management of dairy effluent on farms has however been very variable.
Govemment extension programs over recent years have been aimed at increasing farmer awareness of effluent management issues and practices, demonstrating systems and assisting individual farmers in installation and management of effluent systems. Effluent management equipment retailers have also provided some assistance with installation of effluent management systems.
These activities have helped to increase awareness and adoption of effective effluent management practices, however currently, the resources invested in extension and regulations are not adequate to achieve levels of compliance required by the legislation and sought by catchment managers and the dairy industry.
A key challenge by industry and government was to identify how they could motivate farmers to manage effluent effectively in the long-term in addition to the initial installation of systems on farms.
METHODS
Participants from various functional groups were invited to attend an industry forum with the aim of identifying how they could encourage and assist farrners to improve their farm effluent disposal systems. The selected functional groups were; processing (e.g. dairy companies), policy (e.g. EPA, Shires, etc), extension/education, research, contracting/sales, and farming. Attendees were selected on the basis that in their daily work they interacted with farmers or other agencies on dairy effluent or related issues.
At the forum, each functional group discussed the topic and then presented to the rest of the forum how their group would benefit from farmers improving their effluent management.
Qualitative and quantitative data from earlier steps in the study about the farm management opportunities were then presented to establish a starting point for further subgroup discussions. During the presentation, four proposed key interventions that could be used by external agencies were put forward for consideration.
After the presentation, attendees were instructed to work through a set of tasks in separate functional groups. This was followed by further work in mixed functional groups. Workshop results were presented back to the entire group at the end of each series of tasks.
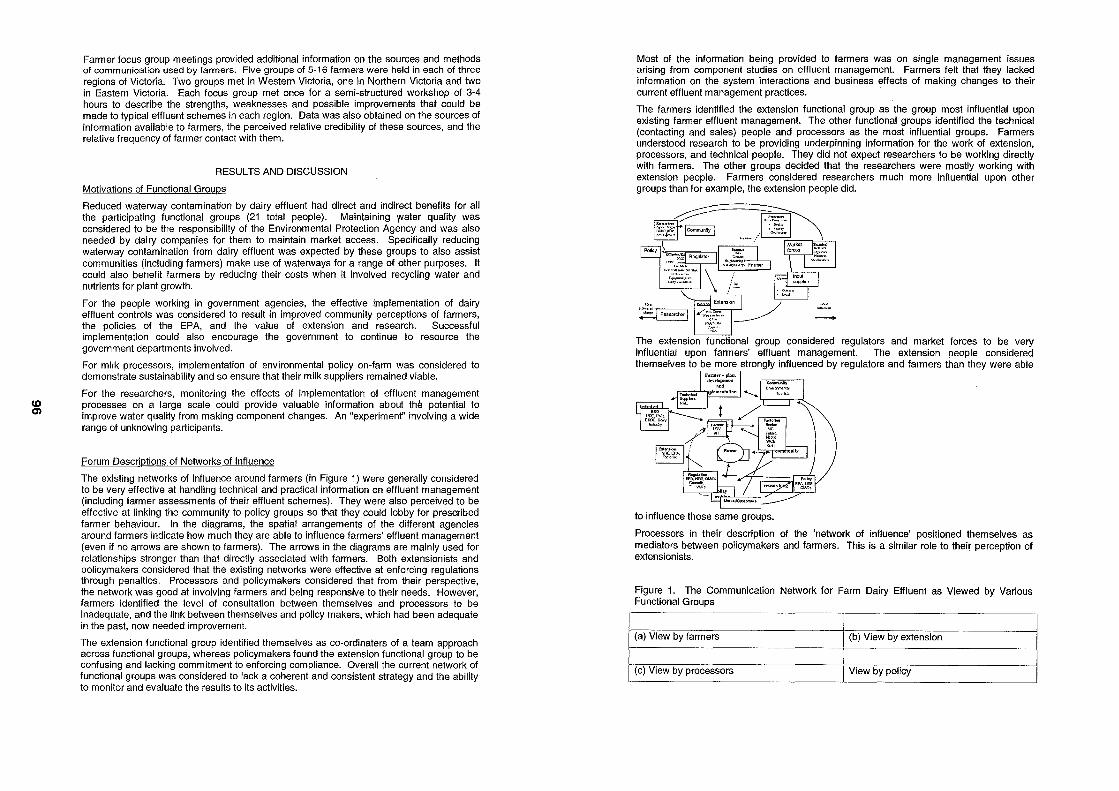
<0 en
Farmer focus group meetings provided additional information on the sources and methods of communication used by farmers. Five groups of 5-16 farmers were held in each of three regions of Victoria. Two groups met in Western Victoria. one in Northern Victoria and two in Eastern Victoria. Each focus group met once for a semi-structured workshop of 3-4 hours to describe the strengths. weaknesses and possible improvements that could be made to typical effluent schemes in each region. Data was also obtained on the sources of information available to farmers. the perceived relative credibility of these sources. and the relative frequency of farmer contact with them.
RESULTS AND DISCUSSION
Motivations of Functional Groups
Reduced waterway contamination by dairy effluent had direct and indirect benefits for all the participating functional groups (21 total people). Maintaining yvater quality was considered to be the responsibility of the Environmental Protection Agency and was also needed by dairy companies for them to maintain market access. Specifically reducing waterway contamination from dairy effluent was expected by these groups to also assist communities (including farmers) make use of waterways for a range of other purposes. It could also benefit farmers by reducing their costs when it involved recycling water and nutrients for plant growth.
For the people working in government agencies. the effective implementation of dairy effluent controls was considered to result in improved community perceptions of farmers. the policies of the EPA. and the value of extension and research. Successful implementation could also encourage the government to continue to resource the government departments involved.
For milk processors. implementation of environmental policy on-farm was considered to demonstrate sustainability and so ensure that their milk suppliers remained viable.
For the researchers. monitoring the effects of implementation of effluent management processes on a large scale could provide valuable information about the potential to improve water quality from making component changes. An "experiment" involving a wide range of unknowing partiCipants.
Forum Descriptions of Networks of Influence
The existing networks of influence around farmers (in Figure 1) were generally considered to be very effective at handling technical and practical information on effluent management (including farmer assessments of their effluent schemes). They were also perceived to be effective at linking the community to policy groups so that they could lobby for prescribed farmer behaviour. In the diagrarns. the spatial arrangements of the different agencies around farmers indicate how much they are able to influence farmers' effluent management (even if no arrows are shown to farmers). The arrows in the diagrams are mainly used for relationships stronger than that directly associated with farmers. Both extensionists and policymakers considered that the existing networks were effective at enforcing regulations through penalties. Processors and policymakers considered that from their perspective. the network was good at involving farmers and being responsive to their needs. However. farmers identified the level of consultation between themselves and processors to be inadequate. and the link between themselves and policy makers. which had been adequate in the past. now needed improvement.
The extension functional group identified themselves as co-ordinaters of a team approach across functional groups. whereas policymakers found the extension functional group to be confusing and lacking commitment to enforcing compliance. Overall the current network of functional groups was considered to lack a coherent and consistent strategy and the ability to monitor and evaluate the results to its activities.
Most of the information being provided to farmers was on single management issues arising from component studies on effluent management. Farmers felt that they lacked information on the system interactions and business effects of making changes to their current effluent management practices.
The farmers identified the extension functional group as the group most influential upon existing farmer effluent management. The other functional groups identified the technical (contacting and sales) people and processors as the most influential groups. Farmers understood research to be providing underpinning information for the work of extension. processors. and technical people. They did not expect researchers to be working directly with farmers. The other groups decided that the researchers were mostly working with extension people. Farmers considered researchers much more influential upon other groups than for example. the extension people did.
~tifr\ ~ ICommunlty I "@ p,nIB'· ~ .. :'-'/ ;::::-,.-.,-,,,-",, ~,.-~.
ffi<l. Ragootor r' ....... mV",n", "",''''''''''''
··~~~t:" \~? ~F'~, Gf5J E"".~[j~0~· --+-
The extension functional group considered regulators and market forces to be very influential upon farmers' effluent management. The extension people considered themselves to be more strongly influenced by regulators and farmers than they were able
I ~ __ . ____ L_
to influence those same groups.
Processors in their description of the 'network of influence' positioned themselves as mediators between policymakers and farmers. This is a similar role to their perception of extensionists.
Figure 1. The Communication Network for Farm Dairy Effluent as Viewed by Various Functional Groups
(a) View by farmers (b) View by extension
I (c) View by processors I View by policy
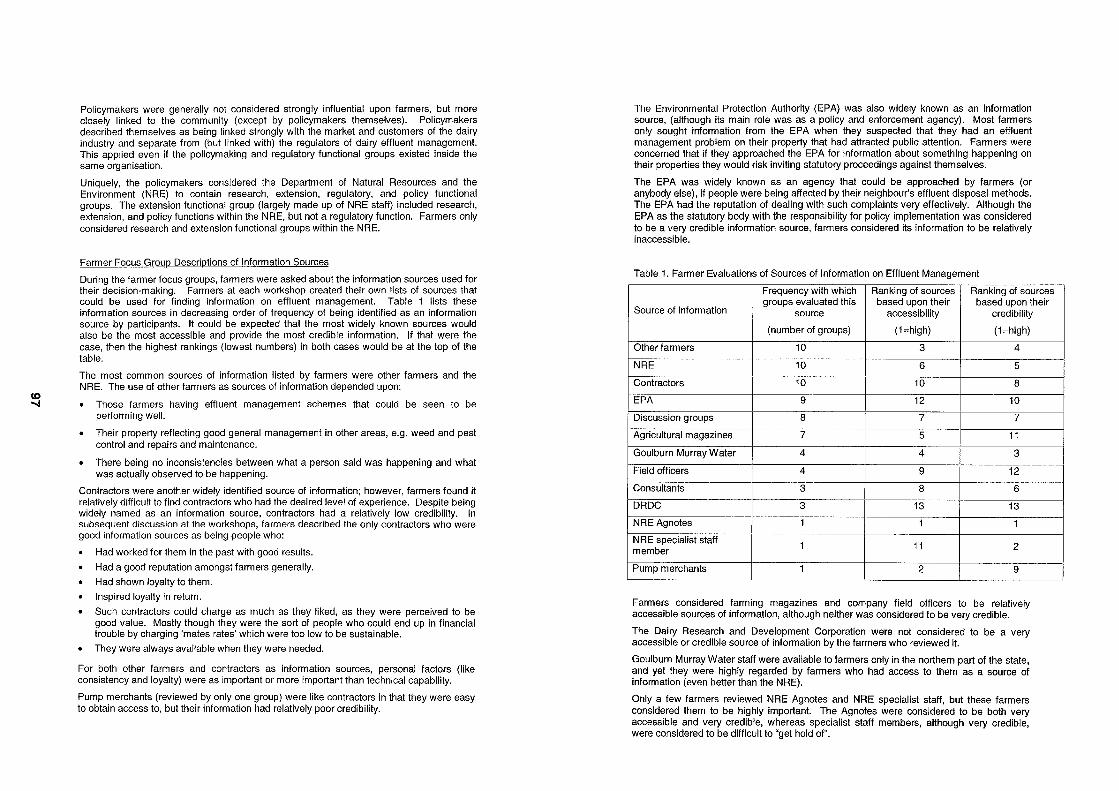
CD ......
Policymakers were generally not considered strongly influential upon farmers, but more closely linked to the community (except by policymakers themselves). Policymakers described themselves as being linked strongly with the market and customers of the dairy industry and separate from (but linked with) the regulators of dairy effluent management. This applied even if the policymaking and regulatory functional groups existed inside the same organisation.
Uniquely, the policymakers considered the Department of Natural Resources and the Environment (NRE) to contain research, extension, regulatory, and policy functional groups. The extension functional group (largely made up of NRE staff) included research, extension, and policy functions within the NRE, but not a regulatory function. Farmers only considered research and extension functional groups within the NRE.
Farmer Focus Group Descriptions of Information Sources
During the farmer focus groups, farmers were asked about the information sources used for their decision-making. Farmers at each workshop created their own lists of sources that could be used for finding information on effluent management. Table 1 lists these information sources in decreasing order of frequency of being identified as an information source by participants. It could be expected that the most widely known sources would also be the most accessible and provide the most credible information. If that were the case, then the highest rankings (lowest numbers) in both cases would be at the top of the table.
The most common sources of information listed by farmers were other farmers and the NRE. The use of other farmers as sources of information depended upon:
Those farmers having effluent management schemes that could be seen to be performing well.
Their property reflecting good general management in other areas, e.g. weed and pest control and repairs and maintenance.
There being no inconsistencies between what a person said was happening and what was actually observed to be happening.
Contractors were another widely identified source of information; however, farmers found it relatively difficult to find contractors who had the desired level of experience. Despite being widely named as an information source, contractors had a relatively low credibility. In subsequent discussion at the workshops, farmers described the only contractors who were good information sources as being people who:
Had worked for them in the past with good results.
Had a good reputation amongst farmers generally.
Had shown loyalty to them.
Inspired loyalty in return.
Such contractors could charge as much as they liked, as they were perceived to be good value. Mostly though they were the sort of people who could end up in financial trouble by charging 'mates rates' which were too low to be sustainable.
They were always available when they were needed.
For both other farmers and contractors as information sources, personal factors (like consistency and loyalty) were as important or more important than technical capability.
Pump merchants (reviewed by only one group) were like contractors in that they were easy to obtain access to, but their information had relatively poor credibility.
The Environmental Protection Authority (EPA) was also widely known as an information source, (although its main role was as a policy and enforcement agency). Most farmers only sought information from the EPA when they suspected that they had an effluent management problem on their property that had attracted public attention. Farmers were concerned that if they approached the EPA for information about something happening on their properties they would risk inviting statutory proceedings against themselves.
The EPA was widely known as an agency that could be approached by farmers (or anybody else), if people were being affected by their neighbour's effluent disposal methods. The EPA had the reputation of dealing with such complaints very effectively. Although the EPA as the statutory body with the responsibility for policy implementation was considered to be a very credible information source, farmers considered its information to be relatively inaccessible.
Table 1. Farmer Evaluations of Sources of Information on Effluent Management
Frequency with which Ranking of sources Ranking of sources
Source of information groups evaluated this based upon their based upon their
source accessibility credibility
(number of groups) (1=high) (1=high)
Other farmers 10 3 4
NRE 10 6 5
Contractors 10 10 8
EPA 9 12 10
Discussion groups 8 7 7
Agricultural magazines 7 5 11
Goulburn Murray Water 4 4 3
Field officers 4 9 12
Consultants 3 8 6
DRDC 3 13 13
NRE Agnotes 1 1 1
NRE specialist staff 1 11 2 member
Pump merchants 1 2 9
Farmers considered farming magazines and company field officers to be relatively accessible sources of information, although neither was considered to be very credible.
The Dairy Research and Development Corporation were not considered to be a very accessible or credible source of information by the farmers who reviewed it.
Goulburn Murray Water staff were available to farmers only in the northern part of the state, and yet they were highly regarded by farmers who had access to them as a source of information (even better than the NRE).
Only a few farmers reviewed NRE Agnotes and NRE specialist staff, but these farmers considered them to be highly important. The Agnotes were considered to be both very accessible and very credible, whereas specialist staff members, although very credible, were considered to be difficult to "get hold of".
CD CO
Proposed Interventions to Address Dairv Farm Effluent Management
The plans outlined by the subgroups at the forum included the following components:
• Establishing consumer need for effective effluent management through market research with people using milk products.
• Developing a process for communicating across functional groups on policy implementation.
• Greater involvement of farmers in developing and extending policy and information.
• Establishing statewide co-ordinators of information e.g. regional dairy project managers, and United Dairy Farmers of Victoria (UDV).
• A process for ensuring compliance to regulations involving farmers, UDV, and Shire Councils.
• Developing performance standards and best management practices for each stage of effluent disposal from collection and storage to application.
• Scheme deSigns by independent agencies that could be varied to meet the needs of individual properties.
• Shires to ensure that building consents for new farm dairies contained adequate proVision for managing effluent.
• Effluent management plans that integrated effluent schemes into whole property management.
• Feedback about the effectiveness of farmer changes - at both the farm and catchment scale.
• Processors to accredit new effluent management schemes and annually check the performance of existing schemes.
• Processors to reward farms that have effective effluent management.
• Co-ordinated strategies for subsidies, penalties, premiums, encouragement, and support.
• Quantification of benefits of adopting the new performance standards for farmers, processors, and communities.
To implement a co-ordinated strategy required that effluent management be considered a priority by all the functional groups involved. As well as the investments being made by other groups, the industry had to be willing to pick up the costs of implementing such a strategy.
CONCLUSIONS
In addition to the points identified by forum participants in their proposed interventions, the project-researchers made the following observations:
• The forum highlighted that a number of functional groups should be involved in the development and implementation of policy. These groups include: farmers, policy makers, regulators, extensionists, contractors, technical sales people, researchers, processor field staff, and rural communities (farmer neighbours). Contractors could also be very influential upon farmer decision making.
• Farmers valued the information provided by other farmers to assist them in their decisions but were selective about the type of farmers suitable for this role.
• Farmers assumed that the communication between researchers and the other functional groups were a lot stronger than they were. Researchers should be more available to government agencies, industry representatives, and extension agencies so that these agencies could use the most technically reliable information available.
• On issues related to environmental standards the industry's own field staff were the most influential extension agents. They needed information to quantify market requirements and the effects of on-farm management changes upon likely farmer returns.
• The responsibilities of each functional group towards regulation (rather than extension) of effluent management needed to be defined. Although the EPA was understood to be the main enforcement agency it only has a maximum of five field staff available to work with the more than 8,000 dairy farmers in the State. It would improve the EPA's relationship with the other functional groups if it separated off its regulatory role entirely. A separate government agency or Shire Councils could be used to carry out the regulatory functions of the EPA.
• The role and capability of NRE staff on effluent management was confusing to the other functional groups and needed clarifying. Farmers considered that NRE staff were representing the requirements of other government departments when they were working with farmers. However in general NRE staff were not willing to enforce government regulations on effluent management. Specialist staff within NRE were highly respected by farmers for decision support information, but farmers had limited access to them due to the low numbers of these specialists.
• The effect of changes to effluent management practices (within farm and across catchments) upon water quality, needs to be quantified. There was little evidence available at the forum to suggest that changes to farm practices would achieve the improvement in water quality expected by government policy agencies.
• The link between market environmental requirements and effluent management practices needed to be made more explicit.
• The impact of the various options for effluent management upon dairy farming systems needs to be evaluated.
• The current resources and so capability of researchers to study the environmental and farm management issues associated with effluent management was inadequate and did not meet the expectations of the other functional groups at the forum.
CD CD
REFERENCES
Olsen, M. (1982). The Rise and Decline of Nations: Economic Growth, Stagflation, and Social Rigidities. Yale University, New Haven, USA
Paine, M.S., (1997). Doing it Together: Technology as Practice in the New Zealand Dairy Sector Communication and Innovation Studies. Wageningen Agricultural University, Wageningen.
Parminter, T.G., Paine M.S., Morriss S., Sheath, G.w., and Wilkinson R.L., (1999). Final Report on Implementation of Sustainable Farming Methods in the New Zealand Dairy Industry. A MAF Policy Report.
Parminter T.G., Pedersen J.A., Wilson JA, Jefford S., 2000b. Farm Effluent Management On Victorian Dairy Farms. Proceedings of the 6th Conference of the New Zealand Agricultural and Resource Economics Society.
Parminter T.G., Pedersen J.A., Wilson J.A., Jefford S., 2001. A participatory analysis of communication networks to guide policy strategy: results from a study of farm dairy effluent strategies in the state of Victoria
Scharpf, F.w. (1997). Games Real Actors Play: Actor-centred institutionalism in policy research. Westview Press, Oxford.
ACKNOWLEDGEMENTS
We appreciated the funding for this project provided by GippsDairy, the Dairy Research and Development Corporation, and the Department of Natural Resources and the Environment. The farmers who willingly contributed their time and enthusiasm to the project get our special thanks because without them this project would not have been possible.
.... o o
Summary
Social and Economic Impacts Associated with
Irrigated Land Use Change
Heather McCrostie Little, Ruris Consultancy, North Canterbury. Nick Taylor, Taylor Baines and Associates, Rangiora
lITigation creates social change. It can transform the land, be a critical asset in the development of economies, re-vitalise people and stabilise communities. The evolution of radical diversification of land production, the subsequent emergence of different rural economies and changed social patterns following irrigation is described. As are the impacts on demography, community social structures, changes in land use, ownership, work and paid labour. Rural towns can be reluctant to appreciate the potential irrigation offers, the changing demands and opportunities. Positioning is needed to capitalise on their hinterland's changed production base while managing the social change that will eventuate.
Key words
lITigation, social change, land use, farm ownership, community
INTRODUCTION
Tlu'oughout the European settlement of New Zealand, water has played a crucial role as both an obstacle and a hazard, (death by drowning was known as the 'New Zealand death') and as a critical asset in the development of the nation's economy. Latterly irrigation was promoted and developed by central government as a means of stimulating primary exports and off setting the nation's balance of payments problem. The last of the central government sponsored irrigation schemes were offered back to their host communities for purchase in the mid- 1980's when government financial support was withdrawn. More recently farmer advocacy, agitation and capital have been responsible for setting up schemes. The genesis of these contemporary schemes can be found in the regularity with which perverse climatic conditions - successive droughts - have been experienced by primary producers, particularly along the east coast of New Zealand and more especially in the South Island.
It has long been accepted that the power of water managed through iITigation can transform the land. But according to Morton (1978) it is not so widely appreciated that "water can transmute a society as definitely and profoundly as it transforms the landscape". Citing historical examples from ancient to modern times, Morton describes the ability of iITigation to colour formerly drab landscapes, replacing dessication with growth; and to increase production, creating wealth and concentrating populations where commerce and community flourish. He argues that the increased production stimulated by iITigation is associated not only with the action of the water on the plants but "with the psychological effect, the sense of security, which the flow of water produces in the farmer's mind".
Nevertheless, several generations of New Zealand farmers viewed irrigation primarily as an 'insurance' against a perverse climate rather than a production management tool. It was not until sophisticated irrigation technology developed allowing spray and sprinkler systems that the full potential of water application came to be realised.
As the potential of in'igated land was recognised, at times heralding a dramatic land use change, so began an almost inevitable change in land ownership as traditional or ageing farmers moved out (McCrostie Little et al. 1998a:5) their place being taken by generally younger farmers who were prepared to respond to irrigation with new, if not 'radical' land practices. It was the rural hinterland therefore that first experienced the social dysfunction of communities in a state of change as generational families moved out and newcomers moved in. Rural settlements and small towns soon found that they too were not exempt from structural disruption and if they were not able to meet the needs of the newcomers they were by-passed.
This paper! traces the development of community irrigation schemes including the role of central and local government. Attitudes and adaptations for farm families are examined, as well as ownership changes. Community level changes associated with new land uses include changes in demographics and work, and also changes to the dynamics of rural communities. Rural areas need to be active in maximising the social benefits of irrigation.
In addition to the economic and social changes created through land use changes associated with the establishment of irrigation, large scale schemes cause environmental impacts. These impacts have their own critical, social consequences, for example, conflict over the use of water resources, or water pollution and infrastructure changes such as transport and roading associated with dairy production. The seriousness of these consequences is acknowledged but the breadth of this paper is insufficient to allow their inclusion at this instance .
IRRIGATION - HISTORICAL EXPERIENCE
Early schemes
The pioneers and early colonists who sought a living from the land quickly learnt that climatic conditions in the antipodes were regularly 'extreme' and that drought was an almost 'normal' summer, and sometimes winter, condition. These first farmers distributed water along valley floors and over plains by a network of open water races. The water was for stock and frequently also for domestic use to supplement rain water storage tanks. Those water races survive today and some were still in domestic use into this century. At least two Canterbury irrigation schemes, the Amuri and the Waimakariri, were built on the network of these century old water races. Such networks were often well in place by the mid-1890's with several notable exceptions, like the Cust drain which was in operation in 1862 draining the Rangiora swamp.
This paper is based on research, including community case studies and key informant interviews, undertaken as part of the FRST funded project "Resource Community Formation and Change" (Contracts TBA801 and TBAX0001), and a review, "Study of Regional Benefits of Water Enhancement in Canterbury - Social Impact of Irrigation", undertaken for Butcher Partners in 2001.
... o ...
Records show that by the turn of the twentieth century small ilTigation schemes were being commissioned by the then public service, Works Department. In 1906 the Stewards scheme, on the Waitaki river, was set-up with water use rights available to the Waitaki County Council. Few knew how to operate the scheme effectively. Nor, at that time, was efficient iITigation technology available to realise the potential of the water (McCrostie Little et al. 1998:2).
Works schemes initiated by government during the 1930's Depression included iITigation projects. Evans and Cant (1976:58-59) argued that the strong Canterbury interest in iITigation at that time resulted from national and local circumstances. The major phase of land subdivision and the bonanza wheat boom had passed, soil fertility had been depleted in many Canterbury areas and the rate of growth in the province lagged behind that of nOlthern regions.
But it was not until the 1950's that County Rural Water Schemes were developed widely (McCrostie Little et al. 1998b). These schemes were a partnership between central and local government and the land owners who provided machinery and labour on a formal 'quid pro quo' basis - no participation, no water on your property. The schemes had a great impact on their host communities and there are anecdotal stories of the agricultural economy of many communities being 'saved' during drought as a result of them. There was clean house water and there was recreational water for public amenities, like school swimming baths. However, there was still too little accessible water to protect a region from prolonged drought.
At the same time, new technology advances in border dyke and spray irrigation prompted some groups to run what became 'experimental schemes'. In the Waitaki valley it was the North Otago Progress League with water taken from the Stewards scheme, in North Canterbury it was the Waireka scheme out of the Waiau river. Farmers appeared impressed with the results but not to the extent of initiating a rash of similar schemes. The matter of irrigation rested for a decade. In the 1960's central government policies of national development lead to their sponsorship of a number of schemes throughout the country. Irrigation was given a higher profile, irrigation was on the move.
Role of Central and Local Government
The focus on irrigation escalated during the 1970's when central government took up the advocacy and financial SUppOit of ilTigation schemes and the on-farm dispersal and management of water. lITigation was just one plank in a policy platform of agricultural SUppOit measures with the wider economic potential to offset the nation's balance of payments deficit. The government was looking for greater financial returns from agricultural exports.
Government transfeITed control of water management to local government; the guiding principle was that encouragement be given to communal schemes for individual properties if recommended by local government. At the same time the National Water and Soil Conservation Authority assumed responsibility for national policy, general supervision of administration and advice to Cabinet Ministers. Scheme approval wound a complex path tlu'ough a series of governmental and quasi-government institutions. Each level was required to assess the scheme against individual institutional criteria and only when approval had been given could the proposal move onto the next assessment. From the first feasibility study to
construction took at least 10 years. In North Canterbury, for example, iITigation was first mooted in the 1950's (Hunt, 1998:5) but the Waiau scheme was not begun until the late 1970's. The full scheme was completed ten years later with the commissioning of the Balmoral development.
By the early 1980's, in a 'deregulated' economic climate government was confronting a situation where some 48 regional irrigation schemes, some with massive cost over-runs, were facing insolvency as farmers with agricultural subsidies removed, spiralling downwards market prices and spiralling upwards interest debt were unable to respond to the capital charges and running costs of the schemes. Negotiations were begun and the schemes were sold back to the community. Treasury agreed that purchase price criteria should be linked to pastoral production market value.
Local government, throughout this time, played a highly visible role alongside their communities, contributing technical advice, labour and machinery as well as acting as an advocate and mediator between the community and the sometimes intransigent bureaucracy.
With the decapitation of central government's controlling interest the role of local government has been refocused. It is still one of advocacy on behalf of rural communities, this time with the public at large, but it can also be an advisory role, as well as financial, one of interim banker as capital or mandatory legal anangements are finalised.
When noting the leadership role of government in the establishment of irrigation schemes the critical role of local leaders should be acknowledged. In every community we studied there was a singular leader who carried his community into an acceptance of irrigation and then steered that community through the often frustrating and always demanding years of advocacy required before a scheme received planning and funding permission. His leadership would be underpinned by a community based group or committee nevertheless each community owes much to the endeavours and perseverance of one person.
These leaders can reflect today on how the iITigation schemes of the 1970's bought large areas of land into intensive or increased production with considerable national benefits. The Amuri Plains, once dry farm terrain of limited production value in the face of continual drought, today produce high returns, "annual gross retums of $61 million" according to one' farming leader.
ATTITUDES AND ADAPTATION
mectations of iITigation
When water reaches the first generation, pastoral farmers with irrigation have few expectations of radically changing their farming techniques - their overwhelming desire is to improve the quality of their stock. They want water to do the one thing for them that drought had not allowed - to grow the best ram they have ever bred. 'Exotic' use of water, like horticulture, would be left to 'the boy' - the next generation. They just wanted, at least once in their careers, to acquit themselves well, demonstrating their skills and knowledge irrespective of the climate.
.... o I\)
When irrigation was first discussed for the Amuri, for example, it was not envisaged that there would be land-use change, just more intensive sheep and beef farming systems. The New Zealand Planning Council and Centre for Agricultural Policy Studies, Massey University (1982:55) suggested tentatively that irrigation might make dairying more attractive. The report acknowledged that most farmers believed that irrigation would lead to more intensive sheep systems, with some possibility of land sub-divided for horticulture.
A limited view ofland use change is, almost without exception, the natural pattern of response when on farm irrigation is fust available. The exception was farmers in the Glenmark scheme at Waipara, where farmers, in the late 1960's early 1970's, were reeling from both successive droughts and low market prices. Economic assessments of the time suggested that many of their farm businesses were close to insolvency. When their scheme came to fruition in the late 1970s and early 1980s they were prepared to listen to alternative land use enterprises, if only to save the family farm.
The fust irrigation lesson to be learnt by farmers and rural communities is that this substantial investment and use of water resources should not be seen simply as an 'insurance' against perverse climate. The application of water is a new daily function with associated water technology, and its use is often linked to youth and enthusiasm - on-farm irrigation can be umemitting work (McCrostie Little et aI., 1998a:5).
In their study of off-farm employment Taylor and McCrostie Little (1995:211) recorded comments made by women working off the farm who also carried out farm work. One fulltime nurse/farmer registered her dislike of irrigation work "/ keep saying I'm not going to shift the irrigation next year". In terms of life style changes Blake and Taylor (1984:9) found that when considering the move into irrigation "most families did not, in fact, anticipate fully the changes that would eventuate".
Dairy farmers, however, always see irrigation as nothing more or nothing less than a management tool.
Agents of change
While central government was actively promoting irrigation the former Ministry of Agriculture and Fisheries(MAF) carried out a positive and practical education role. MAP encouraged farmer enterprise by planting experimental blocks to test the hOiticulture and pastoral potential ofiITigated land. On the Waitaki Plains development, then with its full research and extension service, MAF was a major presence in the community during the 1960's and they suppOlted experimental irrigation, monitoring grass growth and stocking rates. Later, in Waipara, as construction began on the dams in the late 1970s, MAP were hosting the first of a series of field days and farmers inspected crops that included citrus fruit, grapes, feijoas. capsicums, kiwifruit, blackcurrants and a range of nut trees. The following year similar field days demonstrated plantings of stone fruit and export suitable flowers.
Horticulturalists, soil scientists, market experts and other technical advisers were on hand to answer questions or to talk about soil and plant requirements under an irrigation regime. MAP's on farm consultancy service advised farmers on water and stock management. With this expert, free and ready advice some of the risk was taken out of the radical land use change being contemplated by the Waipara farmers. They were able to proceed with the new developments supported by the most up to date knowledge.
Today, this arm of MAP no longer exists and any educational role falls, de facto, on to the shoulders of the irrigation company advancing the scheme. In the place of properly tested experimental plots and accessible information, irrigation farmers wanting to change or adjust their production base must seek out existing farmers and professional advisors. Or learn by the sometimes slow and tortuous path of their own mistakes, losing good production time and increasing the cost of capital development.
Farmer advocates of irrigation frequently support policies of government sponsorship so that farmer capital is freed to concentrate on new land use development. When government withdrew from irrigation development and the schemes were bought by the irrigation community, some farmers found themselves unable to invest in new developments as a result of the capital outlay required to buy into the scheme. The same is true for local, farmerowned schemes. With a stake in the scheme but unable to carry out the planned diversification, and reap the rewards, the farmer may sell their farm at this stage. Lack of development money is one of the reasons that farm ownership changes as a direct result of the establishment of irrigation.
It should be noted that schemes like the Waitaki, the Amuri, Glenmark and the Waimakariri did not grow out of any ideals of full employment for rural people, or innovative land use change, or even prospects of a local economic bonanza. They evolved simply and directly out of the ravages of years of drought on the stock, the land and the people. The schemes grew out of the need to ameliorate the savagery of a drought climate.
Changes in ownership
On the Waitaki, many established dry land sheep farming families sold their farms and were replaced by younger families generally from the North Otago downlands. These farmers were eager to modify traditional farming systems supported by an accessible and regular water supply (Houghton, 1980:55). The younger families invested heavily in farm improvements, including irrigation units, setting about upgrading pasture for cropping and sheep and building bigger and better homes and farm buildings (McCrostie Little et aI., 1998a:5). The Amuri replicates the Waitaki experience with 60% of farms there changing ownership since the advent of irrigation.
Waitaki farmers identified the successive ownership and land use changes as coming in 'waves' (McCrostie Little et a1.1998a) after the introduction of irrigation. The pattern of successive ownership change is as follows.
First wave: The existing pastoral farmers want no more than to improve their traditional base - stock breeding, wool growing. On-farm irrigation is labour intensive and initially capital expensive. These older farmers are reluctant to incur more or new debt and can find the work too physically demanding. Irrigation was a "young persoll' S game" (1998a:5). They will retire in favour of the next generation.
Second wave: This wave will enter into major irrigation investment, often over-capitalising; they increase stock numbers but generally stay with the same production base. These farmers learns that pastoral farming and irrigation are not always compatible and at this stage, sometimes
.... 8
suffering from the results of over-capitalisation, will make the decision to sell, prompting the next 'wave' of irrigation farmers. Should these farmers stay they will radically change the production base into dairying or horticulture. The realisation has now been reached that the land potential lies in new land uses. The shift to dairying is often achieved via a series of interim changes, such as running a small herd alongside such alternatives as bull beef raising. It is, however, more likely that these farmers will not make the total change from pastoral to dairying but will elect to sell, retire or farm elsewhere. Dairying is not the only new land use for in Waipara this wave adopted horticulture; there is some anecdotal evidence to suggest that Waimakariri pastoral/irrigation farmers are also favouring h0l1icuiture through their new scheme.
Third wave: This wave will buy the converted farm; they are dairy farmers by choice and experience and they frequently come into the district from a traditional dairying district often in the North Island. As the third 'wave' of irrigation farmers they will create the 'new' dairy economy in the host district.
The link between ownership and land use change is a fundamental dynamic of irrigation. It is frequently ignored in the irrigation debate yet it impacts not only on farm families but on the social structure of the host community, its settlements and small service towns.
COMMUNITY CHANGE
Changes in ill>pulation
Social change is first represented by the altered patterns of farm ownership, sometimes within households, but more importantly incorporating outside families (McCrostie Little, et al. 1998a: 14:5). In a generational pastoral farming community, farm continuity within the family ensured that change was mainly within the family. But as we have noted, irrigation offers risks and potential that challenge traditional farming and community stability. Different land uses demand different farming skills and frequently attract farmers with different skills and outlooks.
Changes in land use can spark a local perception that the popnlation base has 'exploded' through diversified land use and the commercial and employment opportunities offered by irrigation - when in fact growth has been more modest. For the 10 years 1986 to 1996 the population of the Waitaki Plains area grew by 5%, below the overall New Zealand growth of 7.2%. The growth in population of irrigated areas does becomes significant, however, when compared with the fall in population of surrounding non-irrigated rural communities. In North Canterbury Hunt (1998:29) found that in the Amuri that there was an overall rise in the number of younger to mid-life males and that conversely in the same district there was a decline in the 60 years cohort.
Communities undergoing irrigation development undergo considerable social change as the 'old' families move out and their place is taken by 'new' families. If the community pattern is of generational farming the period of change, particularly at the beginning, can be structurally destructive and for a time the community can become dysfunctional. In the Waitaki social divisions grew between the old and the new families - these were most evident with the entrance of the first dairy families from outside (l998a:18). As well, within this
social context dairying was not a 'highly rated occupation' (1998a:18). Mostly the social dysfunction was caused by a lack of knowledge of the work patterns of the different groups of farmers. When it came to social organisation and district functions such knowledge was imperative if the differing groups were to come together as a community.
Nevertheless, if the former community had grown up knowing their neighbours, as their parents had before them, newcomers were always going to tilt the community'S stable social structure. The philosophy of the sharemilker work contract and the continual movement in and out of dairy workers created feelings of dislocation amongst those of the old community who remained. Yet those who remained had an important function at this time as they create their own element of stability and continuation.
Dairy farming impacts on the age structure of the community. Dairy farming families are in their lower to middle life cycle and sharemilkers are frequently young families. As a consequence, the diminishing school roll now increases, especially in the junior classes. In the Amuri, the school roll has increased by 150%. Not seemingly important on its own, the roll increase again positions the school at the centre of the district's identity. Staff numbers will increase, bringing new young people into the district, centering the school again at the hub of educational, recreational and social activities. An increased school roll can re-vitalise a community.
While the average age of the community may be younger, however, the expectation of youth and enthusiasm taking greater involvement in the provision of community services and facilities may not be fulfilled. The transient nature of sharemilking may mean that some families take little part in the community - often a cause of criticism from more established community members.
Labour, skills and rural services
There are also flow-on effects from the new land use activity and changes in population. If dairying is the new land use contractors profit initially from the economic multiplier effect of the establishment of irrigation as they construct the systems, fence the paddocks and building the new houses and milking sheds. However it is not just new farm management skills that must be learnt, farm workers and local contractors must also change their skills base if they are to survive. Stable employment may no longer be an option if you are a shearer and there is not a sheep left to shear! As a sector, dairying employs more permanent workers than pastoral or arable farming and therefore brings more people into the community. Seasonally horticultural and orchardists employ more than pastoral farming. Anecdotal comments from Waimakariri note the increase in workers since irrigation and diversification there.
Not only must local villages and settlements change their skills base in response to the changes in land use in their hinterland, so must small towns. If like the local village they are not to be by passed in the hunt for workers, maintenance and technological service. When the need to upgrade the skills base to match the changed production base is not recognised, the local district will not be in a position to capitalise on the new economy and development and maintenance business will go elsewhere. Rural service centres and towns need to change step responding to the district's changed land use if they are not to be left out of the new economy.
.... ~
However the question must be asked where and how small contractors can gain new skills? It was during agricultural restructuring that farms eventually shed their on-farm workers who in turn moved into the nearest settlement and became skilled contract workers for independent hire. These workers developed a pOltfolio of skills based on the district's productive land use. It is on these small local businesses that the community economic survival will rest. If they are unable to provide the skills and services the new irrigation farmers require then those services will be sought elsewhere. So the question of where and how accessible training and technological expertise is available becomes a question of the economic survival of the small town if employment skills cannot be matched to the labour market demands.
With technological advances paramount throughout the agricultural sector labour skills become crucial. For instance communities are slow to appreciate that agricultural processing work can no longer be regarded as unskilled factory work. Local education does not always provide for the demands of the highly technically sophisticated industry that agricultural processing, such as diary processing, has become (1998b: 13-15). Small town families whose hopes of finding employment for their early schoolleaver children often feel affronted to discover that there is no unskilled job waiting at the local processing plant and that low qualifications for first-time employees are no longer sufficient.
The building and irrigation contracting industries in particular are financially stimulated during the on-farm construction stages of dairy conversion, creating a series of economic effects that trickle down through the local and regional economies. Employment is created as well as increased expenditure.
However dairy farming is not the only land use option offered by irrigation. The Waipara Valley, host to the Glenmark scheme, is today a major grape growing district, with vineyard cafes, a reputation for fine food and a tourist industry. The district and its small settlement of Waipara are economically alive and well.
To survive, a rural service town requires a role; it needs to be able to service its rural hinterland. There are many examples of depressed small towns bypassed by changed technology and the inability to respond to that technology. On the other hand there are examples of small towns that have responded to the new challenges offered and they flourish. Irrigation will be the clarion call or economic revival for some small town and for others it will be their death knell. What is certain is that irrigation information, technology and skills are not just required of the land users to optimise the economic potential of irrigation, they are critical for the network of small towns supporting the land use changes introduced by irrigation.
CONCLUSIONS
The introduction of irrigation into farming systems creates distinct social impacts through changed and new farming systems and wider demographic and community changes.
On-farm establishment costs, intensive labour requirements and profit margins for both old and new products will be the three deciding factors if irrigation is to be taken up by a farm family. Irrigation is still seen to be 'hard work' and therefore most effective in the hands of 'youth and enthusiasm'. Irrigation shifting routines were seen to be 'socially exclusive' -future new technology development should pursue simpler, less labour demanding and less
time intensive systems. The relationship between youth, enthusiasm and irrigation results in a demographic change in the community with younger farm families replacing middle aged families.
When irrigation is introduced, new land uses such as dairying are attracted into the community. Waves of different people with different skills replace families holding 'traditional' skills, with the result that the community can initially be destabilised. The leadership role of those families who remain, either changing their own skills base or upgrading their existing production to effectively utilise irrigation, is critical during this interim period. These local families act both to validate the new land use and maintain some sense of stability. Where established social constructs are under threat, they become 'social anchors' around whom the new emerging community will gather. Furthermore, there can be a resulting positive impact on local schools, sports and recreation facilities and other social services, strengthening rural communities.
While irrigation changes work patterns and roles of the farm family, demanding a wider skills base, its existence also demands similar changes to the skills base of farming service providers - contractors, skilled labour, rural service providers and small business people. When the production base of the land is changed the service provision must also change if it is to be relevant. Often local skills and resources are not congruent with the new production systems and local workers and small businesses are left outside the new, burgeoning economy. Rural towns which have not recognised the potential of the new irrigation based production system will loose service provision and other commercial activity to towns where these provisions will be sought and satisfied.
Irrigation provides an economic climate in which entrepreneurial innovation flourishes, not only on the land but also in the service towns. First, the potential of the new production base must be realised and second there must be a willingness by a range of farming service providers to extend personal skills and acumen. The research and advisory sectors must respond to the changed land use bought about by irrigation if the local and regional economy is to benefit fully. The rural service sector must continue to be relevant to the new farming systems in a new economy driven by irrigation.
References
Evans, Mary and Cant, Garth (1976). The Effect of Irrigation on Farm Production and Rural Settlement in Mid-Canterbury: A Comparison of the Irrigated and Dryland Farming Zones in the Lyndhurst-Pendarves Area, 1945-1976. New Zealand Geographer, 37, 2:58-66.
Houghton, Ruth M. (1980). Lower Waitaki Communities study. Town and Country Planning Division, Ministry of Works and Development, Dunedin.
Hunt, Lesley(1998). Changing to Cows: the impact of land use change in the Amuri. NSOF Dairy Programme 1997-98 Internal Report 2.2, Agresearch, Lincoln.
McCrostie Little, Heather, Taylor, Nick and Wayne McClintock (1998a). Resource Community Formation and Change: a case study of the Waitaki Plains. Working Paper 14, Taylor Baines and Associates.
... o (J1
McCrostie Little, Heather, Taylor, Nick and Wayne McClintock (I 998b). Resource Community Formation and Change: A case study Clandeboye. Working Paper 13, Taylor Baines and Associates.
Morton, A. H. (1978). Environmental and social impact of irrigation. In Proceedings of the Irrigation Conference, Ashburton, A.R.Taylor (ed), pp 25-3'4, NZ Irrigation Association, Ashburton.
New Zealand Planning 'Council and the Centre for Agricultural Policy Studies, Massey University (1982). Rural Change: Farming and the Rural Community in the 1970's. New Zealand Planning Council and Centre for Agricultural Policy Studies, Massey University.
Taylor, C. Nicholas and McCrostie Little, Heather (1995). Means of Survival?: A Study of Off Farm Employment. Taylor Baines & Associates .

....
WATER RESOURCE ISSUES Grant McFadden
Christchurch
This paper considers aspects of two questions.
Do we have sufficient water for all our future needs? Are our water management and allocation processes adequate to ensure our future needs can be met?
The paper gives some insight into the issues, what various patties are involved in to resolve these issues, and identifies some emerging trends and gaps.
1. Do we have sufficient water for all our future needs?
This question really came to the fore during the 1998 East Coast drought event in both islands. It was fascinating to note the range of both rural and urban people, who started asking questions such as "have we reached the stage where water will limit ourjuture growth opportunities?" or as one farmer put it at a public meeting, "what's ourjuture carrying capacity jar people going to be in these water short catchments ifwe want to mailllain both our environment and our living standards?" Some also questioned who was planning for our long term strategic water needs?
Those comments retlected a severe hydrological drought event. Many aquifers and rivers reached their lowest recorded levels. By contrast, the recent (current?) 2001 drought has had more impact on the South Island than the North Island and it has been an event driven by record low rainfalls rather than low rivers and aquifers.
Water Usage
~ It is helpful to look at some New Zealand water usage data to judge what will influence our ability to obtain all our future water needs. Agricultural uses (ilTigation) clearly dominate water allocated by Councils in New Zealand. (All national and regional water usage data in this paper is from Robb 2000).
This high proportion of water used for irrigation is not unique and similar proportions of use occur in Australia and parts of North America. It merely retlects the high evapo-transpiration component of actively growing biological systems in the hydrological cycle, in relation to the relatively lower consumptive uses of people and industry.
Pagel 0114
Table 1: Water Allocated by Region
Council Water Direct takes Direct takes Water Geothermal Allocated % allocated from % allocated from Allocated from Water
Direct takes surface water ground water Storage (m3/s) allocated (m'/s) (m'/s)
Northland 6.0 95% 5% 2.4 Auckland 3.7 26% 74% 1.9 0.03 Waikato 5 64% 36% 1.2 1.2 Bay of Plenty 8.9 71% 29% 0.2 Gisborne 1.4 69% 31% Hawke's Bay 16.8 33% 67% Taranaki 3.4 96% 4% Manawatu-Wanganui 5.2 44% 56% Wellington 9.8 53% 47% Tasman 7.2 42% 58% 8.8 Marlborough 8.2 29% 71% Canterbury 249.8 67% 33% Otago 81.9 93% 7% 8.1 Southland 2.4 76% 24%
TOTALNZ 410.3 69% 31% 22.4 1.4
Table 2: Use of Allocated water
Water Allocated % of allocation % of allocation for % of allocation Council Direct takes (m3/s) for irrigation Industrial use for public
water sueel;r Northland 6.0 65% 4% 31% Auckland 3.7 43% 16% 40% Waikato 5.6 49% 32% 19% Bay of Plenty 8.9 40% 19% 40% Gisborne 1.4 85% 1% 14% Hawke's Bay 16.8 68% 11% 21% Taranaki 3.4 13% 41% 46% Manawatu-Wanganui 5.2 38% 21% 41% Wellington 9.8 40% 4% 56% Tasmllil 7.2 88% 4% 7% Marlborough 8.2 79% 12% 9% Canterbury 249.8 84% 3% 13% Otago 81.9 85% 10% 5% Southland 2.4 21% 34% 45%
TOTALNZ 410.3 79% 6% 15%
Canterbury and Otago clearly dominate the takes and together they account for 79% of the water allocated in New Zealand.
The rate of inigation expansion has been spectacular and it is continuing. It is calculated from Council records that the irrigated area in New Zealand has been increasing by nearly 50% each decade since the 1970s, Currently the rate of expansion would be even greater.
Page 2 01 14
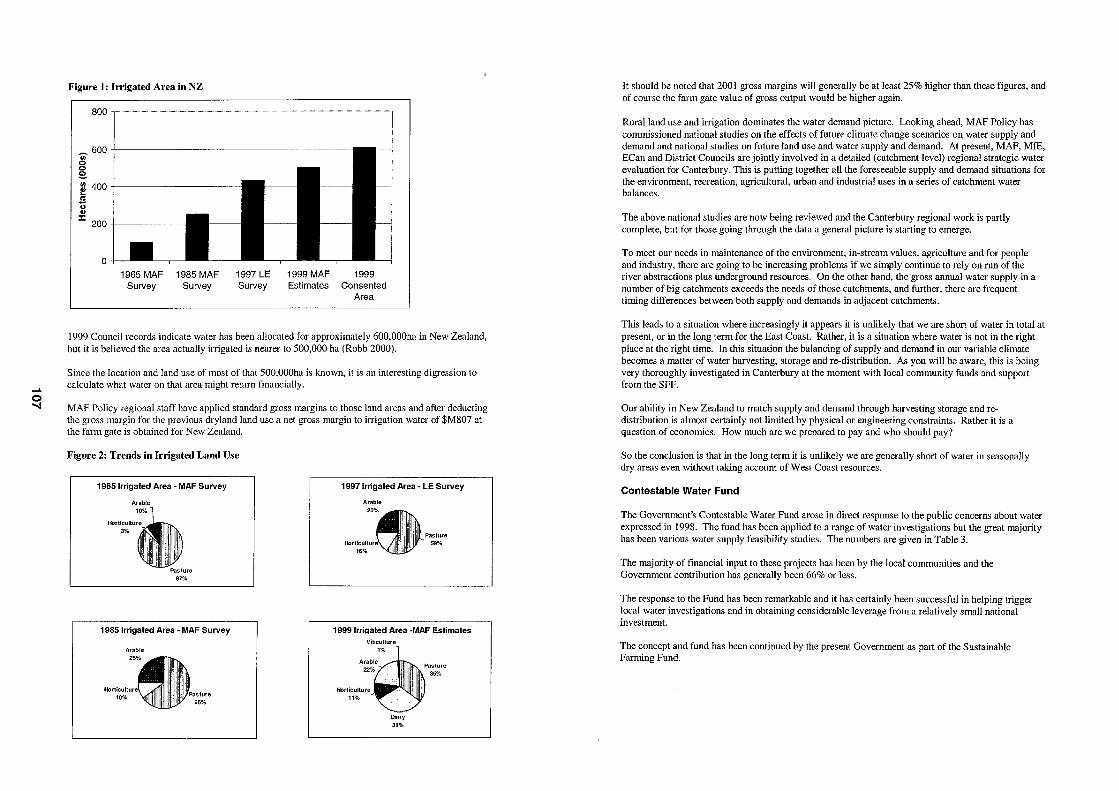
.... o .......
Figure 1: Irrigated Area in NZ
800 T· . . ...................................................... ·················1
~600i-----------o o o ~ ~ 400+1--------------------
S u ~ ~ 200+1----~
o 1965 MAF 1985 MAF
Survey Survey 1997 LE Survey
1999 MAF 1999 Estimates Consented
Area
1999 Council records indicate water has been allocated for approximately 600,000ha in New Zealand, but it is believed the area actually irrigated is nearer to 500,000 ha (Robb 2000).
Since the location and land use of most of that 500,000ha is known, it is an interesting digression to calculate what water on that area might return financially .
MAF Policy regional staff have applied standard gross margins to those land areas and after deducting the gross margin for the previous dryland land use a net gross margin to irrigation water of $M807 at the farm gate is obtained for New Zealand.
Figure 2: Trends in Irrigated Land Use
1965 Irrigated Area - MAF Survey
Arable
1985 Irrigated Area - MAF Survey
Arable
1997 Irrigated Area - LE Survey
Arable
Pasture 59%
1999 Irrigated Area -MAF Estimates
11%
Viticulture 1%
Dairy 31%
35%
It should be noted that 200 I gross margins will generally be at least 25% higher than these figures, and of course the farm gate value of gross output would be higher again.
Rural land use and irrigation dominates the water demand picture. Looking ahead, MAF Policy has commissioned national studies on the effects of future climate change scenarios on water supply and demand and national studies on future land use and water supply and demand. At present, MAF, MfE, ECan and District Councils are jointly involved in a detailed (catchment level) regional strategic water evaluation for Canterbury. This is putting together all the foreseeable supply and demand situations for the environment, recreation, agricultural, urban and industrial uses in a series of catchment water balances.
The above national studies are now being reviewed and the Canterbury regional work is partly complete, but for those going through the data a general picture is starting to emerge.
To meet our needs in maintenance of the environment, in-stream values, agriculture and for people and industry, there are going to be increasing problems if we simply continue to rely on run of the river abstractions plus underground resources. On the other hand, the gross annual water supply in a number of big catchments exceeds the needs of those catchments, and further, there are frequent timing differences between both supply and demands in adjacent catchments.
This leads to a situation where increasingly it appears it is unlikely that we are short of water in total at present, or in the long term for the East Coast. Rather, it is a situation where water is not in the right place at the right time. Tn this situation the balancing of supply and demand in our variable climate becomes a matter of water harvesting, storage and re-distribution. As you will be aware, this is being very thoronghly investigated in Canterbury at the moment with local community funds and support from the SFF.
Our ability in New Zealand to match supply and demand through harvesting storage and redistribution is almost certainly not limited by physical or engineering constraints. Rather it is a question of economics. How much are we prepared to pay and who should pay?
So the conclusion is that in the long term it is unlikely we are generally short of water in seasonally dry areas even without taking account of West Coast resources.
Contestable Water Fund
The Government's Contestable Water Fund arose in direct response to the public concerns about water expressed in 1998. The fund has been applied to a range of water investigations but the great majority has been various water supply feasibility studies. The numbers are given in Table 3.
The majority of financial input to these projects has been by the local communities and the Government contribution has generally been 66% or less.
The response to the Fund has been remarkable and it has certainly been successful in helping trigger local water investigations and in obtaining considerable leverage from a relatively small national investment.
The concept and fund has been continued by the present Government as part of the Sustainable Farming Fund.
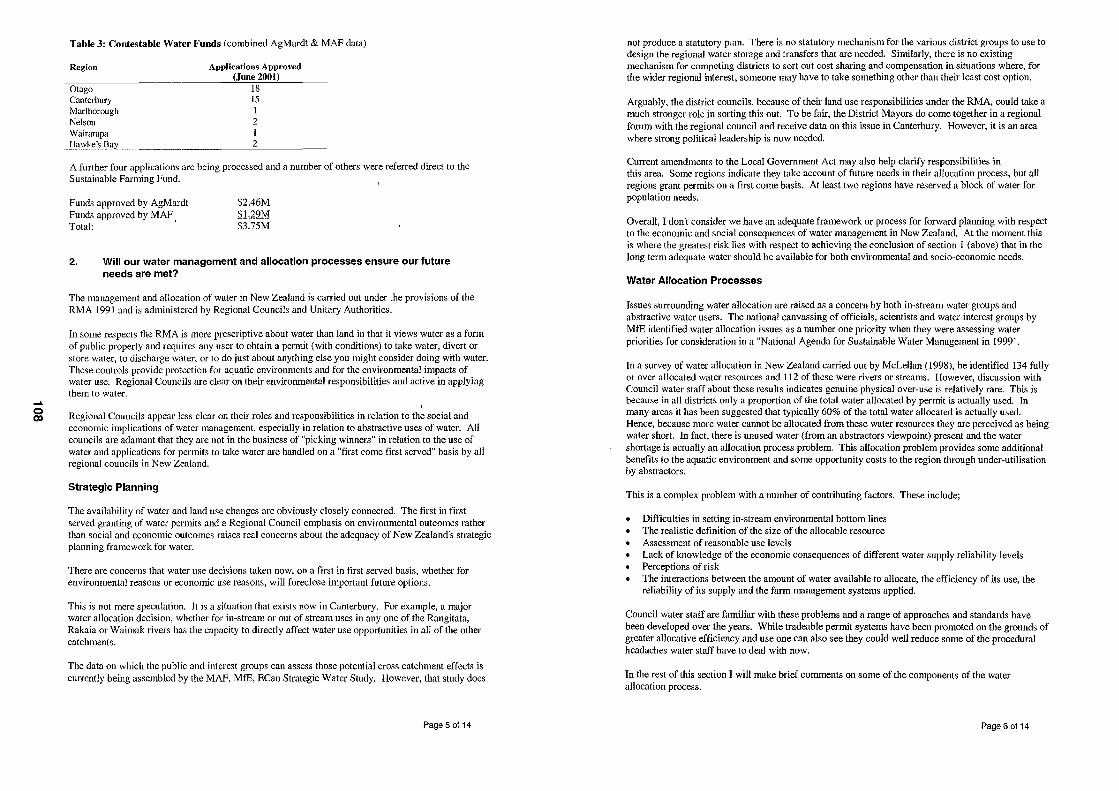
..... o 00
Table 3: Contestable Water Funds (combined AgMardt & MAF data)
Region
Otago Canterblll'Y Marlborough Nelson Wairarapa Hawke's Bay
Applications Approved (June 2001)
18 15 1 2
2
A further four applications are being processed and a number of others were referred direct to the Sustainable Farming Fund.
Funds approved by AgMardt Funds approved by MAF Total:
$2.46M $1.29M $3.7SM
2. Will our water management and allocation processes ensure our future needs are met?
The management and allocation of water in New Zealand is carried out under the provisions of the RMA 1991 and is administered by Regional Councils and Unitary Authorities,
In some respects the RMA is more prescriptive about water than land in that it views water as a form of public property and requires any user to obtain a permit (with conditions) to take water, divert or store water, to discharge water, or to do just about anything else you might consider doing with water. These controls provide protection for aquatic environments and for the environmental impacts of water use. Regional Councils are clear on their environmental responsibilities and active in applying them to water.
Regional Councils appear less clear on their roles and responsibilities in relation to the social and economic implications of water management, especially in relation to abstractive uses of water. All councils are adamant that they are not in the business of "picking winners" in relation to the use of water and applications for permits to take water are handled on a "first come first served" basis by all regional councils in New Zealand.
Strategic Planning
The availability of water and land use changes are obviously closely connected. The first in first served granting of water permits and a Regional Council emphasis on environmental outcomes rather than social and economic outcomes raises real concerns about the adequacy of New Zealand's strategic planning framework for water.
There are concerns that water use decisions taken now, on a first in first served basis, whether for envirollmental reasons or ecollomic use reasons, will foreclose important future options.
This is not mere speculation. It is a situation that exists now in Canterbury. For example, a major water allocation decision, whether for in-stream or out of stream uses in anyone of the Rangitata, Rakaia or Waimak rivers has the capacity to directly affect water use opportunities in all of the other catchments.
The data on which the public and interest groups can assess those potential cross catchment effects is currently being assembled by the MAP, MfE, ECan Strategic Water Study. However, that study does
Page 5 of 14
not produce a statutory plan. There is no statutory mechanism for the various district groups to use to design the regional water storage and transfers that are needed. Similarly, there is no existing mechanism for competing districts to sort out cost sharing and compensation in situations where, for the wider regional interest, someone may have to take something other than their least cost option.
Arguably, the district councils, because of their land use responsibilities under the RMA, could take a much stronger role in sorting this out. To be fair, the District Mayors do come together in a regional forum with the regional council and receive data on this issue in Canterbury. However, it is an area where strong political leadership is now needed.
Current amendments to the Local Government Act may also help clarify responsibilities in this area. Some regions indicate they take account of future needs in their allocation process, but all regions grant permits on a first come basis. At least two regions have reserved a block of water for population needs.
Overall, I don't consider we have an adequate framework or process for forward planning with respect to the economic and social consequences of water management in New Zealand. At the moment this is where the greatest risk lies with respect to achieving the conclusion of section I (above) that in the long term adequate water should be available for both environmental and socio-economic needs.
Water Allocation Processes
Issues surrounding water allocation are raised as a concern by both in-stream water groups and abstractive water users. The national canvassing of officials, scientists and water interest groups by MtE identified water allocation issues as a number one priority when they were assessing water priorities for consideration in a "National Agenda for Sustainable Water Management in 1999".
In a survey of water allocation in New Zealand carried out by McLellan (1998), he identified 134 fully or over-allocated water resources and 112 of these were rivers or streams. However, discussion with Council water staff about these results indicates genuine physical over-use is relatively rare. This is because in all districts only a proportion of the total water allocated by permit is actually used. Tn many areas it has been suggested that typically 60% of the total water allocated is actually used. Hence, because more water cannot be allocated from these water resources they are perceived as being water short. In fact, there is unused water (from an abstractors viewpoint) present and the water shortage is actually an allocation process problem. This allocation problem provides some additional benefits to the aquatic environment and some opportunity costs to the region through under-utilisation by abstractors.
This is a complex problem with a number of contributing factors. These include;
Difficulties in setting in-stream environmental bottom lines The realistic definition of the size of the allocable resource Assessment of reasonable use levels Lack of knowledge of the economic consequences of different water supply reliability levels Perceptions of risk The interactions between the amount of water available to allocate, the efficiency of its use, the reliability of its supply and the farm management systems applied.
Council water staff are familiar with these problems and a range of approaches and standards have been developed over the years. While tradeable permit systems have been promoted on the grounds of greater allocative efficiency and use one can also see they could well reduce some of the procedural headaches water staff have to deal with now.
In the rest of this section I will make brief comments on some of the components of the water allocation process.
Page 6 of 14
..... o CD
Minimum Flows and Environmental Bottom Lines
Many people in the community envisage minimum flows and similar in-stream environmental bottom lines as fully representing all the necessary safeguards to the environment so that the remaining water can all go to abstractive users with a clear conscience.
Unfortunately the reality is certainly not as precise as that and like all biological systems the situation is complex.
There is a wide range between regions in Council staff's technical training and experience in establishing minimum flow regimes. A wide range of methodologies are used and in the final analyses the levels chosen are primarily a mater of judgement. Regional Councils are addressing this and have held a national workshop and are working with MfE on establishing processes to share their experiences and methodologies.
However, I am still surprised to learn to what extent there are problems in specifying what flow levels really mean to in-stream habitat or other environmental values, or even if flow level itself is the critical factor. There are particular difficulties with small streams.
This is an imprecise area with a range of methodologies to choose from, but getting it right is crucial to the long-term interests of both in-stream values and to abstractive users.
This is an area where I would have expected in-stream environmental and fishing interests to be giving some priority for research and to be investing heavily. I am not sure what level of research investment this has.
The Size of the Allocable Resource
There are both hydrological and economic components to this.
For surface water systems there has been a great deal of hydrological measurement done in most developed catchments. For groundwater systems in many parts of New Zealand the sustainable allocative capacity of the systems is much less well understood. This is a priority area for further investigations.
The hydraulic linkage between surface and groundwater systems is an issue. Councils now have a reasonable amount of experience with the methodologies for determining hydraulic linkages. However, water user acceptance of this and of the application of surface water management regimes to wells on adjacent farms remains a hotly debated topic.
The economic component in defining the resource arises because, as permits are granted eventually a point is reached where subsequent permits will effect the water supply volume, timing, frequency or duration of the existing users. The key question is at what point do the effects become significant. This is primarily an economic and risk management question. Fanners are adamant that 100% certainty of supply is the only standard and their bankers would agree. To date, the economic issues surrounding this view or the economic consequences of other levels of supply reliability have not been critically analysed in detail. MAP Policy are initiating work on this.
In this size of the resource decision Councils tend to err or the conservative side and while this decision will lower stress levels all round, it may not be the most economically efficient decision for the region. It also raises equity issues. Various techniques such as the use of A & B permits are used to attempt to improve utilisation at the boundary.
Reliability of Water Supply
The effects of supply reliability are really the same problem as discussed above in relation to defining the resource.
There has been relatively little quantitative work on the effects of variation in the reliability of water supply on abstractive users. This is surprising, because reliability of supply can directly affect the farmer, the catchment allocation process and industry groups and it would seem prudent to understand the economic implications in situations where increasing pressure is coming on the water resource.
Reliability of supply can have an effect on farm management by changes in the volume of water available, the time when it's available, the period for which it is available, or the frequency with which it is available.
Farmers set up their management system to meet their expectation of a certain level of reliability. With the increasing move towards producing products to specification and for specific delivery dates it is likely that their ability to cope with unreliable water supplies is decreasing. Presumably the costs of having an unreliable supply are increasing also. Data is needed on this.
At the catchment or planning level understanding reliability becomes important in defining the allocable resource as was discussed in the previous section. However, it is also important because it is quite probable (hat the characteristics of reliability that optimise the returns for a farming system are not the same as those that would optimise the return to the catchment or region as a whole. There are several districts where pmtial irrigation on many farms would be preferred to full irrigation on a few. In genuinely water short situations a better understanding of this is needed to ensure the full economic implications of water allocation policies are understood.
At the industry level, expansion and investment in things like new dairy processing plants and new vegetable processing plants are also cos ted on the basis of certain assumptions about the reliability and timing of supply of specified product. This is driven by water supply reliability. Some new dairy conversions are in areas without 100% reliability of water supply and quite a number are on soils with a very low water holding capacity and hence are vulnerable to water supply reliability. There will be economic implications for the industry if there is any major variation in the expected (presumably high) levels of reliability.
An interesting point for you as agricultural economists is that there is very little hard farm economic data available from which to analyse the magnitude and significance of decisions on reliability and allocable water. Both council staff and irrigation designers are seeking good data on this and some work and case studies are needed.
Efficiency
Efficiency of water use is one of the current public buzz words. As competition increases between instream interest groups and abstractive users there is a general expectation that water should be used efficiently and hence minimise the amount that is actually taken.
Following the introduction of the RMA the thrust of local and central government agencies programmes on more sustainable land management was not initially paralleled by similar work with water. Accordingly, in the mid 1990s MAF Policy initiated an extensive area of work on in-igation efficiency with Lincoln Ventures Ltd and Agriculture NZ Ltd.
From this emerged a good understanding of the factors involved in the design and the management of efficient irrigation systems. Various best management practices guides have been developed and a range of indicators of efficient irrigation developed and tested.
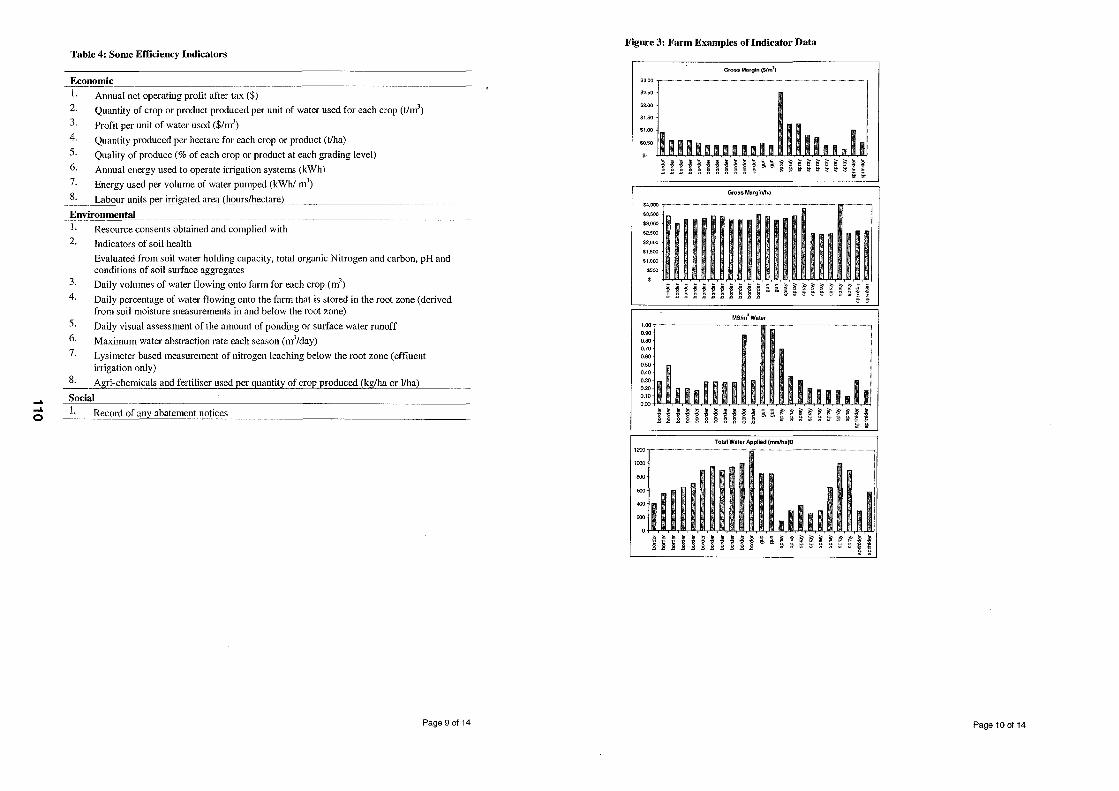
..... ..... o
Table 4: Some Efficiency Indicators
Econonu~'c~ ______________________________________________________________ ___ I.
2.
3.
4.
5.
6.
7.
8.
Annual net operating profit after tax ($)
Quantity of crop or product produced per unit of water used for each crop (tim3)
Profit per unit of water used ($/m3)
Quantity produced per hectare for each crop or product (t/ha)
Quality of produce (% of each crop or product at each grading level)
Annual energy used to operate irrigation systems (kWh)
Energy used per volume of water pumped (kWh! m3)
Labour units per irrigated area->("'h:co:cur:..:s"'/h:=-e::.:c:..:ta=r:..:e"-) ________________________________ _
Envrronmen~t=ru~ __________________________________________________________ __ I.
2.
3.
4.
5.
6.
7.
8.
Resource consents obtained and complied with
Indicators of soil health
Evaluated from soil water holding capacity. total organic Nitrogen and carbon, pH and conditions of soil surface aggregates
Daily volumes of water flowing onto farm for each crop (m3)
Daily percentage of water flowing onto the farm that is stored in the root zone (derived from soil moisture measurements in and below the root zone)
Daily visual assessment of the amount of ponding or surface water runoff
Maximum water abstraction rate each season (m'/day)
Lysimeter based measurement of nitrogen leaching below the root zone (effluent irrigation only)
Agri-chemicals and fertiliser used per quantity of crop produced (kg/ha or I1ha)
Socia=l~ ______________________________________________________________ __ 1. Record of any abatement notices
Page 9 of 14
Figure 3: Farm Examples of Indicator Data
Gross Margin (SImi
=[--- I $1.50
~: I II II II 111111ml. i i~ ii ~~~~~~~~;~!! .c s;,.o .D.D 6!- 6!-
Gross Marginhla
i [IIIIIIIIIIIIIIU,ufllll 0.80 0.70
0.60
O~O
0.40
.g ~.g.g.g ~.g.8.g -8 ~ § § ~ ~ ~ ~ ~ ~ e e-j i 2gZggggg222 OI01~~g.g.g.g.g.ft.~~
MS/m3
Water
~~~~~~~~~~~ g,g,~f[~K[[[~~ .D ..8 .8 ~ ~ 15 15 .D ..8 .0 .0 '" '" W <h II> II> '" '" .§ "§
fr ~
Total Water Applied (mmfha)D 1200 T ........•...•. - .• - •.... ;;;; ........•• --.--.• - •.• - .•• - .•..•....•.•..• -, I
1000
800
600
~ ~ ~ ~ ~ m m m ffi m m § §
~ B B B B B ~ B B ~ B ~ ~ f f f I I I f I j t S} g.
Page 10 of 14
... ... ...
The intention with the efficient irrigation indicator approach is that farmers would build up benchmarks for similar irrigation methods and farming systems. This data could be used to help identify those parts of the system to look into first to achieve improvements. It's similar in concept to the way farm consultants use accounts analyses techniques.
This irrigation indicator approach has been quite widely field tested and received favourable comment from farmers who took part, but to date there has been no concerted effort to implement it further.
From a farm management perspective, probably the most important means of effecting efficiency which was confirmed by the research, was for the fanner to have data on how dry his soil was when he started irrigating and to have a measure of how much water he then actually applied. From an irrigation design perspective probably the most important featnre effecting efficiency was evenness of distribution of water in the root zone.
More recently, Rangitata Diversion Race Ltd has been directly measuring the actual efficiency of several irrigation methods in the field at Winchmore. Surprisingly this had not been done this way previously in New Zealand and earlier figures quoted on efficiency have numerous assumptions. One of RDR Ltd's aims is to establish some reasonable standards that can be expected for the different methods.
The horticulture industry has been very active too and the research and practical application of deficit irrigation in apples and grapes is refining efficient water use to high levels.
The work on irrigation efficiency and best management practices has been incorporated into a "NZ Handbook of Irrigation". This is a large and very comprehensive publication and the major part of it on management aspects is being printed right now. Its preparation has been managed by the Malvern Landcare Group and copies on CD and on websites will follow. There are also SFF projects nnderway which are introducing improved irrigation efficiency opportunities to farmers.
I expect to see continuing calls from the public and interest groups for more work on the efficient use of water. However, in my view the status of irrigation efficiency is that we know enough now about the fundamental design and management aspects of efficiency and the need now is to get more farmers aware of this and involved.
The discussion above refers only to the physical efficiency of water use. The definition adopted for physical efficiency in the recent New Zealand work has been "the proportion of the total amount of water available to the fanner which is retained in the root zone of the plant". For investment decisions in irrigation plant and in farm management decisions a number of factors have to qualify a consideration of physical efficiency of water use.
Irrigation design and irrigation management decisions almost inevitably involve the need to consider some form of trade-off between capital, labour and water efficiency. This raises the question of considering some form of economic efficiency as a broader efficiency measure which could account for all of the contributing elements. More work and guidance would be useful in this area to help Councils and others assess the socio-economic implications of water allocation.
Increasing attention to the components of physical and financial efficiency also draws attention to the advantages of deep soils. Deep soils with high water holding capacities with good irrigation management are able to make much more use of natural rainfall and hence irrigation costs reduce. The corollary of this could be some discounting of very "light" soils for intensive pastoral uses.
Reasonable Use
Councils do not wish to get into the business of prescribing land use. However, they all have guidelines they use when assessing applications for water permits for particular uses. It is reasonable
to presume that they will want to continue to refine these and become more precise, in the interests of reducing the amount of allocated but unused and in the interests of minimising adverse effects of excessive water use.
It is reasonable to presume we will see moves towards the recovery and re-distribution of water currently allocated but unused. That is not a straightforward matter to assess or implement.
Tradable Water Permits
A number of people have advocated a market based tradable water permit system as being a means of obtaining an efficient allocation system and efficient use of water.
The possibilities have been explored quite thoroughly with water users in the Wairarapa, Tasman District and Canterbury. Water users have acknowledged the logic in tradable permit systems but in each case have rejected the system when it came to a final decision.
Exceptions to this have developed within some irrigation schemes. Within the Rangitata Diversion Race schemes individual water allocations have been transferred amongst scheme members for some time.
Where tradable permit proposals have been rejected by districts or catchments it is interesting that the same series of reasons for rejection have always emerged. They are to do with people's concerns about the possibility of the individual losing access to water forever and the possibility of some form of monopoly industry or purchaser taking control of a public resource.
A full description of the issues and concerns is given from two New Zealand case studies in a joint MAF/MfE publication 97/1291997) and in the work of McLellan 1998.
At present there is some work underway which is seeking to better understand the full reasons behind water users rejection of this approach.
It is the writer's opinion that simple practical measures are available to meet all of the objections which have been raised to date. This could be achieved through a combination of a regulated and a market system and it would sit comfortably within the current RMA planning process. It is also the writer's view that the rapidly increasing pressures on water allocation and efficiency use are going to force the development of some form of transferable permit system quite soon. This will probably initially deal with temporary and short term water transfers to optimise use within a season.
Victoria and South Australia have been operating a combined market and regulated approach to water trading for some years. There is plenty of experience there for us to learn from.
Conclusions
In the longer term we have the opportunity to manage our water resources (including storage) in ways which will make it unlikely regions become seriously short of water. In the shorter term we do have water shortages now in various catchments but many of these are the result of the water allocation process itself rather than true physical water shortage.
The competition between agricultural, industrial, environment, recreation and general cOl11l11unity interests in water resources will continue to increase. Concerns about water quality are increasing. These things are going to ensure close scrutiny of the large and expanding use of water by agriculture and horticulture.
Water management and allocation processes are orientated towards environmental management and this is consistent with the thrust of the RMA. Currently, water managers have less understanding of
..... ..... I\)
the economic and social consequences of water management decisions. They are seeking more economic data on water use and councillors are continuing to be pressed by local constituents on matters to do with economic growth as well as environmental issues ..
Water plmming, water use and socio-economic issues are slowly coming closer together.
To help meet the tensions between in-stream and abstractive requirements and the continuing expansion of i.l.Tigation I can foresee a general move towards requiring water allocation to more closely match land uses in real time. A number of things follow from this;
A trend towards more flexible allocation systems that can vary allocation both by land use and time but to prescribed levels of reliability.
The development of systems that provide for short term (a few weeks) and temporary transfer (or trade) in water permits. This happens informally in some schemes now. It has been widely used in South Australia and Victoria. Through a combination of a regulated and a market system it is possible to meet all the objections that have been raised to date about tradeable or transfer systems.
Further development and use of decision support systems to help with the decisions on the marginal return from the use of water at various levels of supply and timing.
Further interest in the deeper soils with high water holding capacity which with proper irrigation management are able to make more use of natural rainfall. The corollary of this could be some discounting of very light soils for intensive pastoral uses.
3. Water Quality
This paper does not intend to develop an in-depth comment on water quality issues. That is a topic in itself. However, a brief comment must be made because water quantity and quality are so closely related and because various quality issues are coming to the fore right now.
In 1993 Smith et al reported comprehensively on fresh water quality in New Zealand rivers and streanas and the influence of agriculture.
The picture this report painted for New Zealand was that water in the upper parts of catchments and rivers was generally in pretty good condition, but the quality of water at the lower end of rivers and streams and in estuaries was often poor. This lowland and coastal concentration of poorer water quality has connections to the patterns of more intensive settlement and more intensive land use both of which also tend to be concentrated in the coastal area and lower parts of catchments.
Large parts of the UK and Europe have very high levels of water contamination with nutrients like nitrates. The UK and Europe are a discerning and important market and the question has been posed as to whether or not we are in a better position with water quality.
As a result, in 1997 MAF Policy initiated a full review of all the New Zealand work on nitrates and groundwater. The science groups working on this were subsequently brought together with policy people and council staff and areas where more information was required were identified. Subsequently, an analyses was done of all the groundwater nitrate records held by Councils in New Zealand. This identified that there are a small number of areas with confined "hot spots" of nitrate contmnination. However, each of these was in predictable areas of very intensive land use and settlement, often close to a city and they are in a situation which can be managed. A very important conclusion was that New Zealand certainly does not have the widespread areas of nitrate contamination of groundwater such as occurs in the UK and Europe. It is a manageable problem which will require continued attention and several sectors are addressing it.
Page 13 of 14
Further, nitrate work has also illustrated that a range of intensive land uses and management practices, including lifestyle and small town settlement could be contributing to nitrate contamination in groundwater.
An important conclusion from this is that ;ill land users, including housing settlements have a part to play in managing groundwater quality. In some respects the problenas are a consequence of our communities deciding to concentrate their settlement pattern and more intensive land use largely in coastal areas and flood plains.
An area of water quality where there is much less data and incomplete information on transmission paths is with the occurrence of health affecting organisms like giardia, campylobacter and cryptosporidia. There have been important recent advances in lower cost methodologies for identifying these organisms. Work is underway on their occurrence and spread. Now that they can be more readily measured, they will no doubt be found more widely and if that were to be the case, it will be important to ensure we use these technological advances in identification to manage such issues constructively.
References
McLellan (1998). Water Allocation in New Zealand. Master of Public Policy Research Paper, Victoria University.
Robb (2000). Information on Water Allocation in New Zealand. Report No. 4375/1. On the MtE website.
MAF Policy Technical Paper 97112. Transferable Water Permits: Two case studies of the issues. (1997). A joint MAF Policy/MtE publication.
MAF Policy Technical Paper 00104 (1998). Field Testing Indicators of Sustainable Irrigated Agriculture. By Wells Barber, Greer, Cum berworth & McIndoe .
Smith, et al (1993). Fresh Water Quality in New Zealand and the Influence of Agriculture. MAF Policy Towards Sustanainable Agriculture Publication 93/10.
MAF Policy Report No 277612 (1997). Nitrate Inputs at Land Surfaces and Groundwater Quality. A Bibliography of NZ Publications.
MAF Policy Technical Paper 2000/15(2000). Implications of Groundwater Nitrate Standards for Agricultural Management.
Page 14 of 14
..... ..... Co)
THE DEVELOPMENT OF EDUCATION AND INFORMATION STRATEGIES FOR IMPLEMENTING ENVIRONMENTAL POLICY: RESULTS FROM A STUDY OF FARM
DAIRY EFFLUENT POLICY STRATEGIES IN THE STATE OF VICTORIA
Terry Parminter, AgResearch, Private Bag 3123, Harnilton, New Zealand Justine Pedersen, AgResearch, Private Bag 3123, Hamilton, New Zealand
John Wilson, AgResearch, Private Bag 3123, Hamilton, New Zealand Sandra Jefford, GippsDairy, PO Box 353, Warragul 3820, Victoria, Australia
SUMMARY
To effectively implement environmental policies for natural resource management, landowners are expected to use available information to assist thern understand the shortterm and long-term relationships between their actions and resource condition. In this project the information required by dairy farmers for them to establish and rnaintain an effective effluent strategy was identified, and recommendations made as to how this information could be best provided.
Five workshops were held with 41 farrners in the west, north and east of Victoria to identify their different goals, decision objectives, and performance expectations. These were compared and the main target groups of farmers identified for policy implementation.
Based upon the results, the authors identified the key messages that each target group needed for them to be motivated to change their effluent managernent practices. Each group required distinctly different forms of information to link the desired behaviour changes with their farrning goals and the different purposes that they had for effluent management.
INTRODUCTION
The size of dairy herds and the volume of water used in milk harvesting are increasing in Victoria. General community and environmental groups are pressuring farmers to deal with community concerns about water quality. People within the dairy industry also want their industry to have a "clean and green" image and want to avoid having regulatory controls imposed upon them.
A project to irnprove the management of dairy effluent, so farmers could make the best use of effluent on farms while complying with EPA legislation, was jointly initiated and funded by GippsDairy, Murray Dairy, WestVic Dairy, the EPA, Victorian Nutrient Management Initiative, DNRE, Catchment Management Authorities, and the Victorian Dairy Industry Authority. This study is one part of that project. Other papers associated with the project have already been reported to this society (Parminter et ai, 2000b
, and Parminter 2001).
The aim of this part of the project was to provide information to the industry and government agencies that would help them increase the proportion of farmers who would adopt an intention not to pollute and then implement an effective dairy effluent scheme.
More detail on all parts of the study can be obtained from the final research report. Copies of this report can be obtained from GippsDairy and the Victoria Dairy Research and Development Corporation (Parminter and Pedersen 2000).
METHODS
Several focus groups of 5-16 farmers were held in each of three regions of Victoria. Two groups met in Western Victoria, one in Northern Victoria and two in Eastern Victoria. Each focus group met once for a serni-structured workshop of 3-4 hours. The workshops were designed to elicit attitudes and opinions on effluent management, including the strengths, weaknesses, and possible improvernents to typical schernes in use in each region. A wide diversity of information and opinion was sought from the focus groups in order to provide an adequate base for quantification of key beliefs in a telephone survey to be conducted later in the project (Parrninter, et al 2000b
).
The methods used at the workshops were based upon Soft Systerns (Checkland & Scholes, 1990) and Participatory Learning and Action (Charnbers, 1987, Mikkelsen 1995) and had previously been used for similar workshops in New Zealand. The people attending each workshop filled out a survey form covering basic demographic information that described their farrning context. Each participant ranked their farming goals and how effluent disposal related to those. The list of goals had been previously used in New Zealand (Parminter and Perkins, 1997) and was lirnited to only those goals associated with farming activities and not those that might have been considered to be family or personal. Workshop participants individually described the purpose of an effluent management scherne, and then worked in small groups to describe a typical scheme for "farmers like me".
Data from the workshops was evaluated using the Excel statistics functions and content analysis using NVivo.
RESULTS
Dernographics of the People Attending the Workshops
The workshops were attended by 41 farmers in total (Table 1). Most of those attending were men, but four women also participated.
The average farm size for those attending the workshops was 146 ha with little variation between regions. Participants from Western Victoria had the highest proportion of dairy farrns on hilly topography. Participants in Western Victoria also had the lowest average milk production per farm.
Table 1: Background about the Farmers Attending the Workshops
ATTRIBUTE REGION
West North East Overall
Number of farmers 8 15 18 41 (total)
Average farm size (ha) 151 148 143 146
Average proportion of 60 10 40 30 farms hilly (%)
Average milk production 0.93 million 1.75 million 1.62 million 1.35 million (Iitres/farm)
, ..
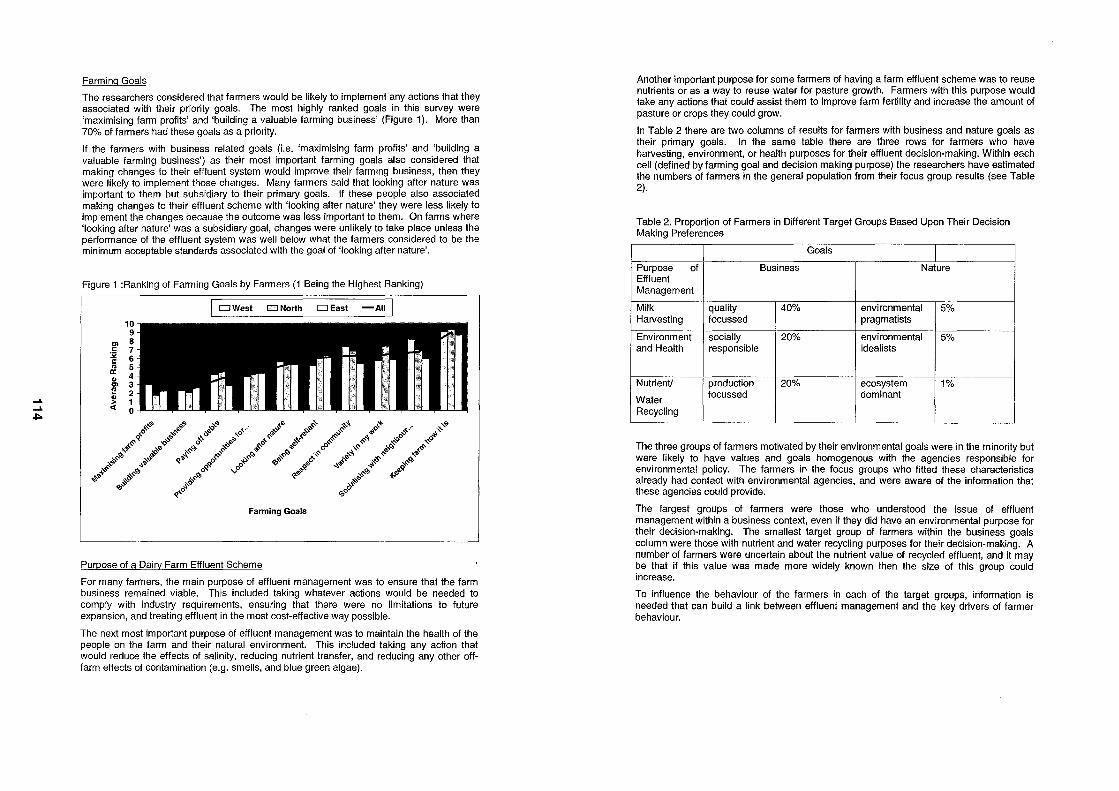
..... ..... 01:0
Farming Goals
The researchers considered that farmers would be likely to implement any actions that they associated with their priority goals. The most highly ranked goals in this survey were 'maximising farm profits' and 'building a valuable farming business' (Figure 1). More than 70% of farmers had these goals as a priority.
If the farmers with business related goals (i.e. 'maximising farm profits' and 'building a valuable farming business') as their most important farming goals also considered that making changes to their effluent system would improve their farming business, then they were likely to implement those changes. Many farmers said that looking after nature was important to them but subsidiary to their primary goals. If these people also associated making changes to their effluent scheme with 'looking after nature' they were less likely to implement the changes because the outcome was less important to them. On farms where 'looking after nature' was a subsidiary goal, changes were unlikely to take place unless the performance of the effluent system was well below what the farmers considered to be the minimum acceptable standards associated with the goal of 'looking after nature'.
Figure 1 :Ranking of Farming Goals by Farmers (1 Being the Highest Ranking)
OWes! o North o East -All I
10 9
'" 8
~ 7 c 6 .. 5 a:
" 4
'" 3 f! 2 ~ 1 ~ 0
~~c, ~ 40 ~-$'0t::J ~ ... c, . ~~~ ~t.;.
it~ If'''
c,o~ ~o"'"
~ ... ::0
0.$-'" ~~ .... t::J
>.~ .,,0 ",'" .~<:-<>;,
q,0
,,-s-~ "¢" .;:,.1$ ,,0'" ,.;$-'" .,,,.'" it'" Po> ° "",<0 ".'Ii
',"> ",,'Ii .Jt it i1:f' ;;:.~ .,.'Ii <I'Ii ;::." Po>'Ii ~.. ~/' ,l ~<:' .;...$' .,c,
-A~ "w ~-!-
~~".0 Po>"-s-~ «-",<oQ
q,$' . ~".", 0 ....,0
0
", <1,0
Po> .,.<:' .~,.,$' +",,,,Q ¢
",,0
Farming Goals
Purpose of a Dairv Farm Effluent Scheme
For many farmers, the main purpose of effluent management was to ensure that the farm business remained viable. This included taking whatever actions would be needed to comply with industry requirements, ensuring that there were no limitations to future expansion, and treating effluent in the most cost-effective way possible.
The next most important purpose of effluent management was to maintain the health of the people on the farm and their natural environment. This included taking any action that would reduce the effects of salinity, reducing nutrient transfer, and reducing any other offfarm effects of contamination (e.g. smells, and blue green algae).
Another important purpose for some farmers of having a farm effluent scheme was to reuse nutrients or as a way to reuse water for pasture growth. Farmers with this purpose would take any actions that could assist them to improve farm fertility and increase the amount of pasture or crops they could grow.
In Table 2 there are two columns of results for farmers with business and nature goals as their primary goals. In the same table there are three rows for farmers who have harvesting, environment, or health purposes for their effluent decision-making. Within each cell (defined by farming goal and decision making purpose) the researchers have estimated the numbers of farmers in the general population from their focus group results (see Table 2).
Table 2. Proportion of Farmers in Different Target Groups Based Upon Their Decision Making Preferences
Goals
Purpose of Business Nature Effluent Management
Milk quality 40% environmental 5% Harvesting focussed pragmatists
Environment socially 20% environmental 5% and Health responsible idealists
Nutrient! production 20% ecosystem 1%
Water focussed dominant
Recycling
The three groups of farmers motivated by their environmental goals were in the minority but were likely to have values and goals homogenous with the agencies responsible for environmental policy. The farmers in the focus groups who fitted these characteristics already had contact with environmental agencies, and were aware of the information that these agencies could provide.
The largest groups of farmers were those who understood the issue of effluent management within a business context, even if they did have an environmental purpose for their decision-making. The smallest target group of farmers within the business goals column were those with nutrient and water recycling purposes for their decision-making. A number of farmers were uncertain about the nutrient value of recycled effluent, and it may be that if this value was made more widely known then the size of this group could increase.
To influence the behaviour of the farmers in each of the target groups, information is needed that can build a link between effluent management and the key drivers of farmer behaviour.
..... ..... U1
In Table 3 the key information for each of the target groups was identified from focus group material.
For "quality focussed" farmers they wanted to know how they could produce top quality milk for processing. They wanted to know the needs of their markets for different specifications of milk products, how farmers' management of effluent could affect these markets, what changes they should be making to their management, and what the likely benefits of those changes would be. In the end they wanted to have transparent milk quality standards and to receive market premiums for achieving them.
Each of the other farmer groups required different information about effluent management to encourage behavioural change. To provide some of this information environmental agencies will need to develop collaborations with other information providers. For instance to provide information to quality focussed farmers will probably require environmental agencies to work together with industry agencies in the preparation and promotion of suitably focussed information.
Figure 3. Key Types of Information Required by Decision Makers in Target Groups ---
Goals
Purpose of Business Nature Effluent Management
Milk quality transparent environmental cost reduction Harvesting focussed standards and pragmatists incentives e.g.
premiums nutrient use
Environment socially easy-care environmental reinforcem ent and Health responsible guidelines idealists of 'safe'
behaviour
Nutrient! production input-output ecosystem biodiversity
Water focussed relationships dominant effects
Recycling ..
CONCLUSIONS
+ Farming goals and the key factors of decision-making can be identified in focus group workshops and used to describe target groups for policy implementation.
+ Business goals were the most dominant goals expressed by the dairy farmers in the focus groups.
+ For most farmers, the standard of effluent management decision-making was determined by its perceived importance to farm business viability.
+ The largest target group of dairy farmers (40%) were those people described as being Quality Focussed. They had business goals for farming and managed their dairy effluent as part of their milk harvesting operation. The development of transparent standards and premiums for good performance was identified as the best way to influence their behaviour.
REFERENCES
Checkland P. & Scholes J., 1990. Soft Systems Methodology in Action, Wiley, NY.
Chambers R., 1987. Rural Development - Putting the Last First, Longman Scientific and Technical, NY.
Mikkelsen B., 1995. Methods for Development Work and Research: a Guide for Practitioners. Sage, India.
NVivo is copyright software for qualitative research, developed by Qualitative Solutions and Research Pty. Ltd., ACN 006 357 213. Australia.
Parminter T.G., Paine M.S., Morriss S., Sheath G.w., and Wilkinson R.S., 1999. A workshop report on implementation of sustainable farming Methods in the New Zealand Dairy Industry, AgResearch Publication.
Parminter T.G., and Pedersen JA, 2000. Understanding the Need for Dairy Effluent Management Systems in the Victorian Dairy Industry: Final report. A public report produced by GippsDairy and the Dairy Research and Development Corporation, Victoria, Australia.
Parminter T.G., Pedersen J.A., Wilson J.A., Jefford S., 2000b. Farm Effluent Management On Victorian Dairy Farms. Proceedings of the 6th Conference of the New Zealand Agricultural and Resource Economics Society.
Parminter T.G., Pedersen J.A., Wilson JA, Jefford S., 2001. A participatory analysis of communication networks to guide policy strategy: results from a study of farm dairy effluent strategies in the state of Victoria
Parminter T.G. and Perkins A.M.L., 1997. Applying an Understanding of Farmers' Values and Goals to Their Farming Styles. Proceedings of the New Zealand Grassland Association (59).
ACKNOWLEDGEMENTS
We appreciated the funding for this project provided by GippsDairy, the Dairy Research and Development Corporation, and the Department of Natural Resources and the Environment. The farmers who willingly contributed their time and enthusiasm to the project get our special thanks because without them this project would not have been· possible.
..... ..... 01
ENVIRONMENTAL TAXATION IN NEW ZEALAND:
1. Introduction
WHAT PLACE DOES IT HAVE?
Frank Scrimgeour and Ken Piddington University of Waikato
6 July 2001
The 2001 Tax Review (McLeod et ai, 2001) includes a timely discussion about the place of environmental taxation in New Zealand. The review's discussion paper released on 20 June 2001 devotes a whole chapter to environmental taxation. This is not surprising given the current influence of the Greens in Parliament, the Kyoto Protocol, and the enthusiasm of some analysts for using economic instruments to achieve environmental outcomes.
In reviewing the academic case for environment taxation it is appropriate to go back to the Pigouvian tradition, and its more recent interpretation by Coase, Tietenberg and others. At its simplest, an efficient Pigouvian tax and an effect regulation achieve the same outcome. The policy analyst is indifferent. However, given the range of real world circumstances, comparisons can be made between doing nothing, imposing a regulation, imposing a tax, implementing a tradable permits system or some other policy instrument. Analysts are left to choose between instruments by comparing each instrument against a set of criteria.
The Tax Review discussion paper takes a cautious approach suggesting that eco-taxes are only appropriate when: "damage of each unit of emissions is the same across the geographic area to which the tax applies; the volume of emission is measurable; and the marginal net damage of emissions is measurable." At a regional level they are more optimistic suggesting "eco-charges may be appropriate at a local level." The review does see a real possibility for carbon taxes and notes there is not research available about the potential impact of methane taxes.
The Tax Review discussion paper conclusions are driven by some critical assumptions. The authors place a tough standard as a requirement for any environmental tax. This requirement is not always met with regulations and other policy instruments. The authors are also concerned about taxes attenuating property rights at all levels of production. This is certainly an impact but it is an efficient impact. The authors suggest that double dividends result from the transfer of rents to the crown and not productive efficiency. This assumption needs to be tested theoretically and empirically. The authors assume New Zealand should be slow to implement taxes as part of our response to the Kyoto protocol. This ignores the possibility that there may be gains from early adoption.
This paper provides some history of the concept of environmental taxation as a framework for further research to address the issues raised by the Taxation Review 2001.
2. Some History
Environmental tax reform has moved rapidly onto the political agenda in many countries over the past decade. In large part, it has been given impetus by the need to deal with the risk of climate change. Despite continuing political stalemate, the Kyoto Protocol forced most OECD countries to think about the mechanisms they would use to limit emissions of greenhouse
gases. Taxation options, such as a carbon tax, held obvious appeal and became the preferred instrument for some countries.
The re-emergence of Green politics, particularly in Europe, has also revived interest in tackling the whole range of environmental problems. Public concern about the lack of practical solutions has been growing and there has been mounting opposition to new forms of environmental risk. (This is reflected in New Zealand in the heat of the debate over genetic engineering.) Each new exposure, such as the BSE episode, ratchets up the level of political awareness.
The discussion of policy options has led to a general consensus that taxes are efficient instruments to achieve environmental targets. Since they also yield revenues, government can look for a wider range of policy packages to win acceptance for this approach. In New Zealand, the Government's decision to hold a wide ranging review of the tax system, and to debate the outcome in the run-up to the 2002 election, creates the ideal opportunity to look at all the issues surrounding various forms of resource-use taxation.
Such taxes are designed to internalise the social costs of environmental degradation. Full cost pricing requires that all costs (present, future, private and external to the user) incurred by society during production and consumption of a good or service be fully covered by the price of that good or service. This is a necessary, but not sufficient, condition for sustainability (Panayotou & Yajun, 1999). In addition to confronting polluters with the full costs of their polluting activities, resource taxes can be used to optimise the consumption mix of renewable resources and non-renewable resources.
Environmental tax reform can cover both incentives for investment in clean technology and penalties for continuing pollution. The mix of instruments selected can induce more rapid or less rapid shifts in behaviour. It is clearly desirable to seek some level of political consensus on the rate at which adjustments should be made. Beyond this, any government or political party would also have the option of signalling the possibility of future taxes or future increases. Through these techniques, the reform process can build a continuous process of improved environmental peiformance. Taxpayers are able to reduce or avoid the tax by changing their behaviour. Hence, taxes create a continuous incentive to decrease pollution (EEA,1996).
For over a decade there has been a push towards development models which are environmentally sensitive. The 1992 Earth Summit articulated the principles of such development, under the umbrella concept of 'Sustainable Development'. This move has coincided with the strong move away from regulatory and interventionist techniques of economic management.
Around the world a new phase of environmental policy has therefore opened up, using market-based incentives for reducing pollution, limiting waste and other environmental goals. Furthermore, as former command economies are restructured, market-based instruments are gaining increasing attention. For instance, China is making use of market-based instruments to integrate its environmental and economic policies (Panayotou & Yajun, 1999).
In integrating these policies, a comprehensive approach to market failure is needed. This is evident in the energy efficiency market where there are many factors working to discourage energy efficiency. These include information gaps, demand for short payback periods and tariff structures that encourage energy supply rather than energy saving. Because of these factors, the exclusive use of a tax to encourage energy efficiency would require it to be set at a penal rate. (EEA, 1996).
..... ..... -....
3. Types of Environmental Taxes
Environmental taxes can be classified into four types according to the way in which the environmental tax is levied (Bosquet, 2000; Panayotou & Yajun, 1999; DECO, 1997):
i. Effluent and Emission Taxes These are a Pigouvian type tax that is directly related to the quantity and quality of pollutants discharged. Examples of these include water pollution effluent taxes and air pollution charges.
ii. Product and Input Taxes These are indirect taxes that are based on products that create environmental extemalities when manufactured, consumed or disposed of. Taxes on motor fuels, pesticides, fertilisers and batteries are examples of this class of environmental tax.
iii. Environmental Subsidies This is where polluters are subsidised to decrease the pollution that they generate.
iv. Investment Tax Incentives Tax credits for environmental protection investments are used in the Netherlands. Accelerated depreciation for pollution control equipment and waste treatment facilities is used in Germany and Japan. Canada, France and Korea undertake both types of incentive measures.
There are three important functions of these various taxes: cost recovery, incentive effects, and revenue raising (EEA, 1996). The choice by governments will be influenced by the weighting they give to these overlapping functions. The design of a specific fiscal measure will also be determined by the same political judgement on priorities.
Cost covering charges are designed to raise funds needed for sustainable management of environmental systems, environmental measures or environmental programs. They include earmarked charges and user charges. For instance, France and Germany impose charges on water pollutants that are designed to raise revenues to cover administration expenses for water quality management and to subsidise water quality improving projects (Hahn, 2000). The Netherlands implemented an aircraft noise charge, imposing a surplus on landing fees. The revenue from this charge is earmarked to finance measures to reduce the noise annoyance of airports including insulation and redevelopment (EEA, 199).
Incentive taxes are designed to achieve a specific environmental impact. The UK landfill tax that was introduced in 1996 is an example of an incentive tax. The purpose of this tax was to internalise externalities and increase waste recycling, while reducing disposal to landfills (Hogg, 1999).
Fiscal environmental taxes are intended primarily to raise income for government expenditures. The environmental effect is considered to be a side-effect (Ribeiro, 1999). The Danish charge on non-hazardous waste disposal is a fiscal environmental tax. The revenues raised by this tax are part of the general budget (EEA, 1996).
For a chronological development of environmental taxes, see EEA, 1996, p. 22
4. Environmental Tax Reform
Environmental tax reform 1 (ETR) is where the tax burden is shifted from factors of production, such as labour and capital, to pollution and the use of natural resources (EC, 1997). The most recent and extensive tax reforms applied in the area of environmental protection have been implemented in Sweden (1990), Norway (1992), Denmark (1994), Netherlands (1995) and Finland (1997) (Alvarez et ai, 1998).
Conventional taxes tend to reduce incentives for work, savings, investment and conservation, while increasing incentives for leisure, consumption, resource depletion and environmental degradation. Hence, the existing system of taxing social benefits introduces a market distortion, while a reformed system that taxes social costs would remove or reduce distortions and mitigate market failures (Panayotou & Yajun, 1999).
Environmental tax reform is therefore a tool that can be used to target the sustainable management of many natural and physical resources. Although this same goal is written into the Resource Management Act (1991), the statute itself offers relatively little guidance or incentive towards its achievement. Many stakeholders would welcome the use of specific taxesltax incentives to lend weight to the Act and accelerate New Zealand's progress towards an ecologically sustainable economy.
Strategic tax reform would potentially involves three complementary activities (DECO, 1997). These are:
i.
ii. iii.
Removal of existing taxes and subsidies that have negative environmental impacts. For example, subsidies on intensive agriculture, fossil fuels or road and air transport will counteract the effect of an environmental tax (EEA, 1996), Restructuring of existing taxes in an environmentally friendly manner, and Introducing new environmental taxes.
4.1 Revenue Recycling
In order to make environmental tax reform politically acceptable, many governments have combined it with tax reduction in other areas. If total revenue is left unchanged this is described as revenue neutrality, although the effects will of course vary for different players in the economy, so the reform is only neutral in terms of the total tax take by government. A further choice is whether to shift the reform in a revenuepositive or revenue-negative direction. Finland and Sweden have both undertaken revenue-negative tax reform.
Environmental tax reform recycles the revenue that is raised by environmental taxes by a tax reduction. This may involve a decrease in employers' social security contributions. These are the non-wage labour tax paid by firms for each worker employed. Alternatively, personal income taxes may be decreased. The purpose of these tax reductions is to increase incentives to work and hire (Bosquet, 2000). The other main revenue recycling instruments are: corporate income tax, specific commodity taxes, general commodity taxes (such as sales or value-added taxes) and employment taxes (Park & Pezzey, 1999).
1 Also called ecological tax reform, green tax reform, environmental fiscal reform, green tax swap, and green tax shifting.
...... ...... co
The revenue-recycling effect of revenue neutral environmental tax reform is influenced by the institutional arrangement for tax. For instance, the taxation of unemployment benefits, the type of tax exemption and price-indexation of unemployment benefits and tax exemptions are important factors in considering the impacts of reform (Koskela & Schab, 1999).
The double dividend debate is concerned with the idea that an environmental tax results in more than just an environmental improvement. The double dividend hypothesis suggests that both the environment and the efficiency of the tax system are improved (Park & Pezzey, 1999). There is disagreement amongst theoretical and empirical studies as to whether the double dividend does occur. It is clearly not an automatic outcome. Some analysts argue that it depends on careful design of any environmental tax system. There is also reason to believe that the tax system becomes less distortionary when the revenue raised by environmental taxes is recycled efficiently.
Both the choice of revenue recycling instrument and the extent of any double dividend will make a difference to the political desirability of environmental tax reform. Relief on labour or income taxes has been the preferred choice of governments to date (Park & Pezzey, 1999). The evidence also suggests that any employment or other social benefits thus generated can be used to win support from groups such as employers and unions, which might not support reform measures purely on the grounds of improved environmental management.
5. The Effectiveness of Environmental Tax Reform
When assessing the effectiveness of an environmental tax, there are two criteria to be considered. First, the effect of the tax on environmental pollution or the use of scarce natural resources. This is the environmental effect. The second criteria is the economic. This involves evaluation of the level of economic resources foregone to achieve the environmental outcome. It includes those costs bome by consumers, firms and taxpayers (EEA, 1996; Ribeiro, 1999).
5.1 Environmental Effectiveness
A positive environmental impact is expected from the imposition of an environmental tax because the incentive effects of the tax lead to a change in behaviour (Ribeiro, 1999).
To be effective, a tax needs to be as closely linked to the externality as possible. Environmental taxes can therefore be ranked in terms of their environmental efficiency with (i) being most efficient and (iii) being least (Pearce, 2000):
i. Tax on pollution itself - A tax on the environmental impact creates an incentive to maintain output by adopting cleaner technologies or inputs.
ii. Tax on input (e.g. coal for electricity generation) - This encourages a switch to an altemative fuel source such as gas, but not to cleaner coal.
iii. Tax on product itself (e.g. electricity) - This creates less demand, but there is no direct incentive for producers to change their fuel mix or engage in energy efficient electricity generation.
6.
The effectiveness of indirect taxes or incentive-based targeting depends on the linkage and ability of the tax to discriminate between those who are polluters, and those who are not (Jackson, 2000). The Swedish sulphur tax implemented in 1991 had a considerable impact. It caused a reduction of the sulphur content of fuel oils by almost 40 percent below the legal standards (OECD, 1997; EEA, 1996).
The carbon dioxide tax in Norway went into effect in 1991. Evidence suggests that carbon dioxide emissions from stationary combustion have decreased up to 21 percent per year, while emissions from households' motor vehicles have been reduced 2-3 percent per year (OECD, 1997; EEA, 1996).
In Denmark, a charge on the disposal of non-hazardous waste decreased the share of waste dumping in overall waste treatment from 39-18 percent. The tax also increased the rate of reuse and recycling from 35-61 percent between 1985 and 1995(OECD, 1997}.
A charge on the sale of batteries was introduced by Sweden in 1991 to cover the costs of collection and disposal. In 1993, the collection rate for lead batteries was 95 percent (EEA, 1996).
5.2 Economic Efficiency
Taxation is an efficient way to meet environmental goals because it minimises the costs of compliance with environmental regulation (Pearce, 2000; Tindale & Holtman, 1996). Unlike command and control regulation, environmental taxes have static efficiency gains where sectors are able to select least cost compliance methods. Taxes have additional dynamic efficiency gains. They signal that it is best to abate in areas with low abatement costs. They also provide continuing incentives for improvements beyond minimal compliance (Pearce, 2000; Jackson, 2000).
Economic efficiency is improved when the environmental goals are to reduce resource use and waste flows. This has been extensively documented in the energy sector, as has the need for clear market-based incentives. Fiscal instruments, including tax rebates, open up a wide range of options for governments when designing a programme of environmental tax reform.
Equity
The equity of environmental taxation matters. This is evident, as concerns about the distributional effects of environmental taxes have hindered the wider use of these marketbased instruments.
6.1 Intragenerational Equity
Any policy measure designed to improve the environmental situation will have distributive effects, but these seem to be more visible in the cast of taxes (OECD, 1997). The distributional impacts of environmental taxes depend on local circumstances, location, the time horizon and how tax revenues are spent (Panayotou & Yajun, 1999).
When environmental taxes are applied to mass consumption products and basic commodities, regressive effects can be expected (OECD, 1997). An environmental
6
..... ..... U)
tax is regressive when the tax represents a higher proportion of the income of lowincome groups than that of the higher income groups. This usually occurs when the tax is applied to a product or input, rather than to emissions or environmental damage (Pearce, 2000). For instance, energy taxes fall heavily on the poor, reflecting the importance of energy expenditures in the budgets of these poorer households (Panayotou & Yajun, 1999; Smith, 1996). Consider taxes on gasoline and vehicle fuels. These are only regressive across those households who own vehicles (Pearce, 2000). Furthermore, it would be possible for the poor to be made worse off if employment was diverted away from sectors of the economy where those on low incomes are predominantly employed (Park & Pezzey, 1999).
When assessing the distributional incidence of the burden of an environmental tax, concern should be for the final incidence (the households that ultimately bear the burden of the tax) rather than the formal incidence (who makes the tax payments) (Smith, 1997). Moreover, it is the net incidence of the policy measure that matters. The net incidence of a tax is the cost of the tax to an individual, minus the benefit that is secured from an increased environmental improvement (Pearce, 2000). Furthermore, the net distributional impact is important. For instance, a regressive impact may affect poorer households, while related environmental improvements may be distributed progressively (OECD, 1997).
The regressive effects of environmental taxes can be overcome by various means. Information campaigns can help to ensure that what is not regressive is seen not to be regressive. It is important that the distributive effects of the policy measure are compared with the appropriate baseline, that is, the alternative policy measure that would otherwise be adopted. In other words, a tax may be regressive, but is it more regressive than the alternative (Pearce, 2000). Note that while some economic instruments may be distribution ally regressive, the resources freed by greater economic efficiency and the revenues that are generated can be more purposely directed at addressing equity issues (Panayotou & Yajun, 1999).
Mitigation involves modification of the policy at the outset to take account of impacts on vulnerable groups. Consider a tax that targets older road vehicles that are not well maintained, or have low efficiency. This would be regressive, as many such vehicles are likely to be owned by lower income groups. An alternative would be to subsidise early retirement of such vehicles (Pearce, 2000). Mitigation can also be undertaken using cross subsidies. For example, lifeline tariffs are familiar in the contexts of electricity and water. These involve prices that are lower for low-income consumers than high-income consumers (Pearce, 2000).
However, the more exemptions or tax discrimination there is, the less effective the tax is at meeting its environmental objective (Pearce, 2000; OECD, 1997). Hence, mitigation efforts should be avoided as far as possible (OECD, 1997).
Compensation provides an alternative to mitigation. This attempts to make vulnerable groups at least no worse off once the policy is implemented. Compensation is preferred to mitigation because it does not reduce the environmental efficiency of a policy. Compensation may be directly related to a tax (for example, specified energy allowance to mitigate an energy tax) or may take the form of a lumpsum payment (for example, households receive payments equal to the average environmental tax payment). Alternatively, the income tax system could be changed to favour households on low incomes, excise taxes could be lowered on goods that are more likely to be bought by low-income households, or investment could be made in job creation schemes (Pearce, 2000; Panayotou & Yajun, 1999; EEA, 1996; Smith, 1996).
The need to finance such compensation partly explains the trend towards revenue neutrality or the recycling of revenue to compensatory use (Pearce, 2000). Can revenue-neutral environmental tax reform be regressive? If the environmental tax that is introduced is more regressive than the tax that is lowered, the overall effect of reform will be regressive (Park & Pezzey, 1999).
6.2 Intergenerational Equity
This concept is central to any policy designed to bring about 'sustainable management' or sustainable development' over a longer time horizon. The environmental ethic has therefore emphasized the rights of future generations to enjoy the same range of resources as those available to the present generation. It has however proved extremely difficult to introduce practical policy instruments to bring this goal within reach.
Environmental economists have argued that natural capital should not be treated as a residual. They make a logical case for treating natural forests, marine resources and other ecosystems as part of a country's resource inventory, using accounting systems that will rapidly reflect any depletion of this natural wealth. It follows that environmental tax reform should bring about some balance between the treatment of man-made capital and natural capital, so that growth (traditionally defined) of the former is not continually achieved at the expense of the latter.
Tax measures and others instruments can be used to reinforce these arguments and create a more even approach to resource management in the longer term. They have not generally been incorporated in the first stages of environmental tax reform . Sometimes they have been introduced separately for reasons that lie outside of environmental policy. This was the case when individual transferable quotas (ITQs) were brought in as the management regime for New Zealand fisheries. As suggested below, sustainable resource use should however be incorporated among the objectives of any programme of environmental tax reform.
7. Competitiveness
There is no significant impact on the competitiveness of individual sectors or whole economies from current environmental policies in OECD countries. Neither is there evidence of industrial relocation to 'pollution havens' (OECD, 1997).
When studying the impact of environmental taxes on competitiveness, there are two components to be addressed: macro-competitiveness and sectoral competitiveness (Pearce, 2000). The competitiveness of the economy as a whole (macro) is what matters (OECD, 1997). Studies on the effects of environmental regulation generally on macrocompetitiveness do not detect any significant impact (Pearce, 2000).
On a sectoral level, energy-intensive sectors will be most affected by environmental tax reform, while labour-intensive sectors will benefit (Bosquet, 2000). In the case of an energy tax, the effects on sectoral competitiveness are small, because the loss of competitiveness from an increase in fuel costs as a result of the tax is offset by a gain in competitiveness from a decrease in labour costs (Barker, 1997).
When favourable treatment is given to energy intensive industries, in response to competitiveness concems, competitive disadvantage for renewable energy sources may

..... I\) o
result (EEA, 1996). Hence, any analysis of competitiveness has to address the question of both winners and losers (EEA, 1996).
There is concem that the impact on competitiveness may also affect the environment. If production is relocated as a result of an environmental tax, the environmental damage is simply shifted elsewhere (EEA, 1996). However, there is no evidence of these 'pollution havens' emerging. This is because many other factors influence a firms decision to locate in a particular country; factors such as the size and growth of potential markets, political stability, labour force competence, ease of access to raw materials or markets and adequacy of infrastructure (OECD, 1997).
Ultimately, the extent to which green tax reform improves the functioning of the economy by decreasing market distortions could enhance the long-term competitiveness of the country as a whole (OECD, 1997).
7.1 Mitigation of adverse effects on competitiveness
There are measures that may be taken to offset any adverse effects thai environmental taxes may have on competitiveness2
. It is important that any such measure do not reduce the environmental effectiveness and economic efficiency of the tax (OECD, 1997).
7. 1. 1 Exemptions Exemptions reduce the overall effectiveness of the tax (Brack, 1998). Exemptions make environmental policy more costly because they narrow the tax base and increase the deadweight loss, as well as compromising environmental objectives (Bohringer & Rutherford, 1997).
7. 1.2 Revenue Recycling Revenue raised from the environmental tax may be used ,to lower pre-existing taxes on labour. Alternatively, it can be used to fund additional public spending on environmental concerns. (Brack, 1998).
7.1.3 Reform energy cost provisions in business taxation Reform of the business tax system to provide energy efficiency incentives by not allowing energy costs to be exempt from tax as a business expense, except for high energy users, and by providing a tax free portion of total costs to all other firms (EEA, 1996).
7.1.4 Tax free thresholds This involves rising taxation with higher levels of consumption of environmental goods such as water and energy. This can lessen the impact of environmental taxes on small firms and households (EEA, 1996).
7.1.5 Border tax adjustments This is the adjustment of tax rates at the border so that exports are rebated by the amount of tax they bear, and imports from untaxed foreign competitors are taxed equivalently (Brack, 1998). However, the rules and practices for such measures are notfully clarified (OECD, 1997).
2 To the extent that it is true that no adverse impacts on competitiveness occur due to imposition of environmental taxes, resources can be focused on education and communication to adjust the misperception that such competitiveness impacts do occur (see Pearce, et ai, 2000, for recommended methods to counter lobbying insisting that competitiveness effects do exist).
7.1.6 International harmonisation Measures needed to mitigate the competitiveness impacts of environmental taxation would be unnecessary if there was harmonisation at, for instance, EU, OECD or even global levels (EEA, 1996). This is best handled by organisations such as the World Trade Organisation.
8. Employment
There is reason to believe that shifting the tax burden from personal income taxes, corporation taxes or value-added taxes towards environmental pollution will increase employment. This is because there will be more demand for labour-intensive commodities as prices change in favour of these. The demand for labour will increase due to the lower cost of labour. Furthermore, the supply of labour will rise, as more people are encouraged to enter the labour market as unemployment falls. This will cause expenditure by government on unemployment benefits and social security to fall (Barker, 1997).
Evidence on this reduction of unemployment is mixed (OECD, 1997). For employment gains to materialise, the labour market must be flexible. H wages are directly linked to the price level, then an environmental tax could cause inflation (Bosquet, 2000).
Potential for an employment double dividend depends on the effectiveness of labour tax cuts in increasing employment and on how much of the burden of environmental taxes is borne by labour. As a significant employment benefit would require substantial cuts in the taxation of labour, broad tax bases would probable be needed to make up the revenue shortfall from reduced labour taxes (OECD, 1997).
Evidence suggests that the best results in terms of employment are obtained when recycling occurs through cuts in social security contributions3
. The mode of recycling of tax revenue plays a significant role in determining employment effects (Bosquet, 2000).
9. Investment, Prices, Economic Activity
Environmental policy instruments impact incentives to invest in environmental research and development (R&D). New technology should be encouraged because it offers fundamental solutions for environmental problems. Technology is emphasised because behavioural changes are hindered by various inertia. Hence, the appropriate choice of policy instruments should accelerate technological innovation (Albrecht, 1999).
Environmental taxes, without important exceptions or escape clauses, offer the clearest incentives for technological innovations - the more expensive the tax, the more incentive that will be created to invest in new emission-reducing technologies (Albrecht, 1999). Consider for instance, the Californian zero emissions requirement for new vehicles. This lead to a huge investment in innovation.
The immediate effect of an isolated increase in environmental taxes would be an increase in the general price level. However, a revenue neutral tax would entail a number of other effects that could partly offset this immediate effect (OECD, 1997).
Economic activity, often measured by gross domestic product (GOP), is positively impacted by environmental taxes. This is because new taxes raise consumer prices and wages, which
3 This is equivalent to ACe payments in the New Zealand context.
..... N .....
depress economic activity. However, after some time, the cuts in social security contributions more than offset the negative impact on demand, leading to gains in employment and GDP (Bosquet, 2000). There are problems with the use of GDP as a measure of economic activity because it does not measure long-term sustainable growth and welfare (Bosquet, 2000).
10. Design and Implementation
10.1 Criteria for consideration of a new policy
Policy reform should be aimed at improving sustainable resource management. There are at least five issues to be addressed when considering a new policy. (Park & Pezzey, 1999):
i. Identification of what causes the environmental damage ii. Assessment of the potential to control the adverse effects iii. Assessment of the potential to develop and introduce new technologies to
minimise of eliminate the environmental damage iv. Assessment of the financial costs to the govemment or agency to monitor the
results of the policy v. Assessment of the political will to impost the costs of control on polluting firms
(and their customers). This is related to the 'polluter-pays principle'.
10.2Determining a tax rate
Who should have the role of determining the appropriate tax rate? Is it the role of environmental government departrnents or econornic government departments? It is not appropriate for the same part of government to be responsible for determining the rate of tax and receiving the revenues (Smith, 1997).
How should the tax rate be set? In an ideal world the rate would be set with regard for economic costs and environmental benefits. There are problems setting a tax rate that will deal with the ecological thresholds for these benefits and costs. In this case regulation may be better.
10.3 Linkage
The effectiveness of environmental taxation depends on linkage. This is the degree to which a tax is linked to the pollution it aims to control (the linkage of tax point and point of pollution) (Paulus, 1994; Smith, 1997). Where the link between the tax point and pollution point is weak, the tax may fail to have the desired impact on pollution. It may also introduce costly distortions into production and consumption decisions (Smith, 1996).
Consider for example the Norwegian charge on domestic waste collection. This charge was based on the number of refuse sacks that households put out for collection. It resulted in some households economising on sacks rather than on waste, and overfilling sacks or dumping illegally (Smith, 1996).
Of course, the benefits of more direct linkage between the tax and the amount of pollution caused must be compared with the possible increase in administration costs (Paulus, 1994).
10.4 Administration and implementation costs
Administration costs are the costs of assessment, collection or enforcement of taxes. Generally, these costs are lower for new environmental taxes that are incorporated into the existing tax administration and controlling systems (Paulus, 1994). The cost of the measurement system depends on the measurement costs per source and the number of emissions sources. Measurement costs per source depend on the range of monitoring technologies, the characteristics of emissions, and the substances involved (Smith, 1997). The incorporation of measurement into normal commercial activities can decrease measurement costs (Paulus, 1994). In general, the administrative costs of environmental taxes compare favourably with other policy tools (EEA, 1996).
10.5 Concordance with existing systems, frameworks and starting points
There may be conflict with the current national tax or legal system if taxes and reforms cannot be embedded into the existing system. This is because they may be inconsistent with the restrictions of these systems. For instance, European Union legislation prevents Member countries from levying particular types of taxes. There must be no interference with the free movement of goods, products, capital and services within the Union (Paulus, 1994).
Additionally, environmental taxes must meet generally accepted policy principles (Paulus, 1994) such as the:
• Polluter-pays principle - polluters should bear the expenses of carrying out measures to ensure that the environment is in an acceptable state;
• Cooperation principle - refers to possibilities for particular societal groups and those affected by particular environmental policy measure to cooperation in environmental policies; and
• Precautionary principle - refers to prevention of environmental problems.
These issues are already being discussed in the case of the Waikato River where resource use taxation is being discussed in the negotiations between the Crown and Tainui over future govemance and management of the river (Way and Scrimgeour, 2000).
10.6 Policy evaluation
In evaluating the impacts of an environmental tax, there are three complications that make evaluation difficult (Ribeiro, 1999). First, there are methodological issues concerned with separating the tax effects from other elements in the baseline and policy package. Second, the data that is available may be limited, it may not be detailed enough, or it may have been collected for other purposes and therefore is not suitable. Third, there is the time factor. It may take up to 10 years for the tax to be effective (EEA, 1996; Ribeiro, 1999).
The evaluation of environmental taxes needs to be built into the design and implementation process so that methodological and data availability problems can be minimised. Linkage of the policy process with the evaluation procedure is given by EEA, 1996, p.32.
..... I\) I\)
10.7 Checklist for successful implementation
The following checklist is taken from EEA (1996, p. 12).
o Studies in advance investigating the potential effects of the tax/policy package, In particular the calculation of the abatement costs in each sector, equity implication, and the benefits and costs of improving eco-efficiency;
o Early and greater involvement of tax/fiscal authorities; o Extensive consultation with stakeholders and the public; o Early announcement of environmental taxes; o Their introduction within a policy package of complementary measures; o Gradual imposition of the tax; o Recycling of revenues to
taxpayers (for example, for environmental measures, via rebates or investment incentives, provision of information and training
- related sectors (for example, some revenues of a waste tax going to the waste sector)
- reduce other taxes such as taxes on labour; o Increasing incentive effect via
- gradually increasing the real price signal over long periods - gradually reducing exemptions;
o Evaluation measures designed into the tax system.
11. Use of Revenue
11.1 Hypothecation (Earmarking)
Hypothecation is where the revenues from a tax are pre-assigned to certain public expenditures or to a particular agency or department (Smith, 1997). This precommitment constrains government spending in a dynamic environment, so it could lead to inefficiency in budgeting and expenditures (Smith, 1997). Hypothecation may create inefficiencies because the tax rate can be determined on the basis of revenue required, and not on the costs and benefits of the tax. Hence, revenue and expenditure requirements move out of line in the long run. Furthermore, it is difficult to determine the appropriate revenue sources for particular expenditures.
On the other hand, most countries give low priority to environmental expenditure, so earmarking serves to raise the priority of particular environmental expenditures. Earmarking creates a more direct relationship so it is expected to increase public support for and acceptability of a new tax. However, there is a need to weight the costs of possible inefficiencies with the benefits of higher support (Paulus, 1994).
It has been suggested that hypothecation is effectively a trade-off between environmental tax reform, which requires that government secures revenues through environmental taxes, and the aim of compensating polluters through recycled revenues (Pearce, 2000). The OECD (1997) recommends that hypothecation should be a transitory approach, if used at all because the inefficient allocation of resource and government spending priorities may become locked in.
11.2 General Policy Expenditure
The revenue raised by environmental taxes may be used to reduce distortionary taxes, decrease public deficits or increase public spending (OECD, 1997).
If environmental tax revenue is used as a substitute for existing tax revenues, there is the question of efficiency and public support. Additionally, the revenue raised may be used to compensate those who suffer from the possible undesirable effects. This raises the issue of determining what is proper and fair compensation.
12. Sustainability of Revenue
Steering effects are the possible tax avoiding changes in behaviour of those confronted with a tax. If the steering effects of an environmental tax are substantial, then tax bases can be largely or completely eroded (Paulus, 1994). This is the main purpose of incentive taxes, however, it is undesirable for revenue raising taxes.
A successful tax, in terms of changing behaviour, creates less revenue (Tindale & Holtman, 1996). Ultimately, the effect of the tax on behaviour depends on the elasticity of the good that is taxed. If it is a necessity with few substitutes, revenue will not fall over time.
13. Conclusion
Environmental tax reform has a strategic role in promoting sustainable development. This is because environmental taxes have the potential to achieve environmental targets as well as raise revenue, thus integrating environmental and economic policy goals. Environmental taxes are most effective in achieving their objectives when they are part of a complete policy package (Kerr, 2001). Moreover, environmental taxes must be carefully designed and implemented to ensure they do not impose costs that offset their potential benefits.
14

..... I\) Co)
14. References
Alvarez, x., A. Gago and X. Labandeira. (1998). Green Tax Reform: Fact and Experiences. Australian Tax Forum, 14(3),361-379.
Albrecht, J. (1999). Policy Instruments and Incentives for Environmental R&D: A Market Driven Approach. Fondazione Eni Enrico Mattei. Nota Oi Lavoro, 17, 1-25.
Barker, T. (1997) Taxing Pollution Instead of Jobs, in O'Riordan, T. (ed.) Ecotaxation. Earthscan: UK.
Bohringer, C. and T.F. Rutheriord. (1997). Carbon Taxes with Exemption in an Open Economy: A General Equilibrium Analysis of the German Tax Initiative. Journal of Environmental Economics and Management, 32, 189-203.
Bosquet, B. (2000) Environmental tax reform: does it work? A survey of the empirical evidence. Ecological Economics, 34, 19-32.
Bovenberg, A.L. and B.J. Heijdra. (1998) Environmental Tax Policy and Intergenerational Distribution. Journal of Public Economics, 67, 1-24.
Brack, D. (1998) Energy/Carbon Taxation, Competitiveness and Trade. Energy Economist, 206,7-11.
EPA (2001). The United States Experience with Economic Incentives for Protecting the Environment. United States EPA.
European Commission (1997) Tax Provisions with a Potential Impact on Environmental Protection. Office for Official Publications of the European Communities: Luxembourg.
European Environmental Agency. (1996). Environmental Taxes: Implementation and Environmental Effectiveness. Environmental Issues Series, No.1. EEA: Luxembourg.
Hahn, R.W. (2000). Economic Prescriptions for Environmental Problems, in Stavins, R.N . (ed.) Economics of the Environment, 4th Ed. Norton: USA.
Hogg, D. (1999). The Effectiveness of the UK Landfill Tax, in Stemer, T. (ed.) The Market and the Environment: the Effectiveness of Market-based Policy Instruments for Environmental Reform. Edward Elgar: UK.
Jackson, T. (2000). The Employment and Productivity Effects of Environmental Taxation: Additional Dividends or Added Distractions? Journal of Environmental Planning and Management, 43(3), 389-406.
Kerr, S. (2001). Ecological Tax Reform. A Report prepared for the Ministry for the Environment, MOTU Economic and Public Policy Research.
Koskela, E. and R. Schab. (1999). Alleviating Unemployment: The Case for Green Tax Reforms. European Economic Review, 43, 1723-1746.
McLeod, et al. (2001). Taxation Review 2001,20 June 2001, New Zealand Government. Norgaard, J. and V. Reppelin-Hili. (2000) Controlling Pollution Using Taxes and Tradable
Permits. International Monetary Fund Economic Issues Paper Number 25. ' OECD. (1997). Environmental Taxes and Green Tax Reform. OECD:Paris. Panayotou T. & W. Yajun. (1999). Green Taxation: International Experience and Relevance
to China. Aileen International: USA Park, A. and J.C.V. Pezzey. (1999). Variations of the Wrong Themes? A Structured Review
of the Double Dividend Debate, in Sterner, T. op cit. Paulus, A. (1994). The Feasibility of Ecological Taxation. Maklu Uitgevers: Antwerpen. Pearce, D., T. Seccombe-Hett, and R.K. Turner. (2000). Market-based Instruments in the
UK: Consultancy to Support Work on Modernising the Economy. Economics for the Environment Consultancy Ltd.
Ribeiro, M.T., K. Schlegelmilch, and D. Gee. (1999). Environmental Taxes Seem to be Effective Instruments for the Environment, in Sterner, T. op cit.
Smith, S. (1996). Taxation and the Environment, in Devereux, M. (ed.) The Economics of Tax Policy. Oxford University Press: New York.
Smith, S. (1997). Environmental Tax DeSign, in O'Riordan, T. op cit.
Tindale, S. and G. Holtman. (1996). Green Tax Reform: Pollution Payments and Labour Cuts. Institute for Public Policy Research: London.
Way, Wand F.G. Scrimgeour. Conflict and the Evolution of Property Rights for Rivers and Streams in New Zealand. Paper presented at NZARES Conference, Blenheim, June 2000.

..... I\) .j::o
Macroeconometric Modelling with an Environmentally Adjusted Agricultural Sector
Abstract
Shamim Shakur Applied and International Economics
Massey University Palmerston North, New Zealand
Dr. A.K. Enamul Haqne Institute of Development, Environment and Strategic Studies
North South University Dhaka, Bangladesh
Traditional national income accounting methods does not make an allowance for the environmental damages incurred while producing the current output. Agriculture is no longer considered to be an environmentally friendly activity. In Bangladesh, efforts to feed an everincreasing population have meant unsustainable farming practices and a steady depletion of the resource base. The quality of the environment has been degraded and ability of the future generations compromised. This calls for "greening" of GDP by deducting negative changes in environmental quality and assigning more weight to environmentally friendly activities in national income calculation.
This paper begins with developing an environmental account for Bangladesh's agricultural sector. This is done by collecting physical data on depletion and degradation of environmental resources and then estimating their costs by appropriate valuation techniques. The environmentally adjusted agricultural sector is then integrated with a Social Accounting MatIix (SAM). Finally, sectoral products for agriculture and forestry are estimated net of environmental cost.
Keywords: Social Accounting Matrix, input-output table, GDP, sustainability
Introduction
The effect of the "green revolution" in Bangladesh has been mixed. Introduction of high yielding varieties (HYV) of rice and associated technology is credited with feeding an ever-expanding population of Bangladesh. The environmental damages done in the process has been formidable, and will probably carry in to the future. Alauddin and Tisdell (1989) noted, a 50 to 200 per cent higher returns on capital compared to labour encouraged an inappropriate choice of inputs like chemical fertilisers and modern irrigation methods over Bangladesh's much abundant labour. Higher doses of chemical fertilisers are responsible for creating conditions where the natural nutrients of the soil are fast depleting.
This study is a first attempt in integrating environmental accounts into national accounts. It has used the economic input-output matrix to develop a social accounting matrix (SAM) for the Bangladesh economy. It has extended the analysis in the satellite account to detelmine the depletion and degradation impact on Gross Domestic Product. As a first attempt, it has confmed the study for agriculture and forestry sector to show that a sustainable income growth would mean a choice between sectors. If a sector has a higher degradation and depletion effect compared to other sector, then income growth using this particular sector may not be the right choice of an economy.
The research is conducted in three stages: to start from a suitable input-output table for the Bangladesh economy, to extend the input-output table into a Social Accounting Matrix (SAM), and fmally to detennine the depletion and degradation impact from agriculture and forestry activities on Gross Domestic Product. The SAM is a matrix presentation of the System of National Accounts (SNA) elaborating the linkages between the supply and use table (commonly known as the 1-0 table) and institutional sector accounts.
System of National Accounts
In its efforts to increase comparability of economic statistics, the United Nations (1953) first published the System of National Accounts (SNA) in 1953. Initially, the SNA was comprised of six standard accounts, based on an underlying structure of production, appropriation, capital reconciliation, external transactions, and government. By 1993, in response to UN Rio Summit, the SNA included system for integrated environmental and Economic Accounting (SEEA) to deal with the environmental issues (United Nations, 1993). The SEEA remains a satellite system, not integrated into SNA. Besides information about economic activities, the SNA now shows the levels of an economy's productive assets and the wealth of its inhabitants at particular points in time.
Input-Output (1-0) Accounts
An input-output model reflects the precise quantitative sectoral relations in an economy. Originally developed by Wassily Leontief (1936), the input-output table has become an indispensable tool in any quantitative exercise. It also provides a detailed analysis of the process of production and the use of goods and services (products) and the income generated from the production process. Transactions of goods and services are broken down by intermediate and final use. A complete 10 table also shows the cost structure of production activities: intermediate inputs, compensation to labour and capital, taxes on production. Later, Leontief also modified input -output model to study environmental issues relating to pollution (Leontief, 1970).
Table 1 illustrates a general structure of an 10 table, according to the European System of Integrated Economic Accounts (Eurostat, 1986).
..... I\) UI
Table 1. General Structure of an Input-Output Table
In the standard Eurostat framework, Matrix A represents an intermediate demand. Rows in the matrix A describe production sector outputs. Columns represent sectors that use outputs of production as intermediate inputs. A breakdown of a final demand on private consumption, government consumption, investment, and export is shown in MaU'ix B. MaUix C gives the information on total domestic production. Matrices D, E and F give the corresponding infonnation on imported goods and services. Payments to labour and capital, depreciation, and indirect taxes are presented in Matrix G. Matrix H is normally empty, and summation over rows in Matrix I gives information on value-added. If an 10 table is balanced, then columns of Matrix J should be the same as the rows of Matrix C because total input equals total output for production sectors.
For Bangladesh, a condensed input-output table corresponding only to an intermediate demands (Matrix A as per Table I) for the economy is shown in Table 2. The Bangladesh Institute of Development Studies (BIDS 1998) constmcted a 1993-9410 table. The CUiTent 10 table is an up-dated version of the BIDS (1998) estimate using 1998-99 national accounts data. The BIDS (1998) 10 Table was constructed with 79 sectors. A complete listing of these component sectors is provided in Appendix I, which shows a relatively well-documented, input-output data in as far as for the aglicultural sector is concerned.
The base year used for the 10 table 2 is 1998-99, the latest period in which complete national accounts data was available from Bangladesh Bureau of Statistics. The 15x 15 use matrix reported forms the core of the input-output table. TI,e input-output coefficients have been used to split out the production value of the various commodities as found in the national statistics. The sectoral GDP column describes the value of
outputs by sectors. The total sum of the cells in the column matrix equals the total domestic production of the Bangladesh economy.
The fO table shows only the relationship between production accounts. Thus, an entry in a cell aij tells the proportion of sector i's output used in the production of a sector j. The use matrix also contains a large number of cells with zero entries. This is because many activities take inputs only from some sectors and not from all sectors. Agriculture and forestry, for example, cannot be expected to use hotels and restaurants as an intermediary input. The crop sector has been aggregated over 15 major crops (paddy, wheat, sugarcane, ... ), while livestock, forestry and fishing (including shrimp farming) has been kept separate (refer to Appendix 1).
Social Accounting Matrix (SAM)
A SAM is an expanded version of an 10 table that is designed to capture specific details of various economic flows in a matrix format. Traditionally applied to analyse causes and consequences of various aspects of inequality among household groups, Graham Pyatt and Erik Thorbecke (1976) showed extended use of SAM as a conceptual and modular framework for policy and planning purposes. A detailed SAM integrates the four existing economic frameworks in the country: (i) System of National Accounts, (ii) Balance of Payments, (iii) Flow-of-Funds, and (iv) Input-Output Table. The SAM, therefore, provides a comprehensive quantified description of the macro-economic and financial interrelationships in the country. A more detailed discussion on the construction and uses of SAM can be found on Pyatt and Round (1985). For our purposes, SAM can provide useful information about intersectorallinkages, including the one's that exist between agriculture and environment, the focus of this research. Table 3 shows the SAM matrix for Bangladesh for the year 1998-99. The SAM is based on the 1998-9910 Table as reported in Table 2 .
For compactness, we have aggregated 79 sectors from BIDS (1998) 1993-94 input-output table to form a 17x17 SAM. The 79 sectors were originally chosen in BIDS (1998) project on the basis of the importance of the sectors and conunodities (paddy, jute, livestock, forestry, RMG, etc.) to reflect, as best as possible, the structure of the Bangladesh economy. 18 agricultural products have been aggregated as "crop" sector while 38 industrial outputs have been aggregated as "manufacturing" sector. Other aggregations done are shown in Appendix 11.
Like the fO Table 2, The SAM, as calculated here, incorporates only the production side, (the input-output table), while the distribution and U'ansfers among various institutions (households, enterprises and government) are ignored. Flexibility of SAM allows division of the sectors into different sub-sectors and in taking account of the transactions among them (i.e. among different sectors and within the sub-sectors.) The primary sector, for example, has been disaggregated into crop, livestock, forest, fishing and mining, and the table could be used to trace the environmental effect of a specific production shift among various sub-sectors.
Let us take a closer look at Table 3 to see its correspondence with 10 table (Table 2). Rows in table 3 represent production sector outputs, which are used as intermediate inputs for other sectors. Columns in Tables 3 represent intermediate consumers (production sectors which use an output of production sectors as intermediate inputs), Looking along a particular column of Table 3, one can see how inputs are used for production in a certain sector. Take for example row 2, livestock. We can see, from column 1, that the crop sector has consumed a livestock output in the value of 16,144, while the third column shows that the forest sector as an insignificant consumer of livestock. Finally, there is a relationship between an fO table and Gross Domestic Product (GDP). Sectoral GDP can be calculated as sum of the columns corresponding to a sector. This is reported in the last column of Table 3. By summing up the entries in this column, we can obtain the GDP figures. GDP is defined as the value of final goods and services produced in a given year. Hence, alternatively, we can extract information on GDP from an fO table by eliminating intermediate production - goods that are used up to produce other goods.
[ Same aggregation also done in constructing an aggregated 10 table, which is presented in Table 2.

.... N en
The Analysis
For Bangladesh, SAM has been developed using the input-output table (Table 2) for the economy and this is shown in Table 3. Based on these 10 and SAM tables and based on the information on forestry acreage, deforestation rate, cultivable land under rice cultivation, we attempted to detennine the depletion and degradation impact on the national economy.
Using the SAM matrix, the following table shows the division of agricultural output for use as intermediate goods and as final demand. A negative entry in this table would mean this sector has a net import.
Table 4: Distribution of Agricultural and Forestry Sector Output as intermediate goods and as final
demand in the economy.
Intermediate Use
Aariculture Forestry
1993-94 76221.7016 14180.70038
1994-95 80032.6034 7272.961837
1995-96 83493.9782 3892.446557
1996-97 88024.803 19159.29465 1997-98 92685.9889 21429.46513
1998-99 96848.3506 17180.30255 Available as Final Demand
1993-94 167950.298 14800.2996: 1994-95 155788.397 22531.03811 1995-96 156431.022 26943.5534-1996-97 167351.197 12919.7053! 1997-98 165371.011 -214291.2987
1998-99 169367.649 -171799.49981
Forestry and agricultural activities generate methane and ammonia emission - both are Green House Gases. In addition, water and land emissions from agriculture include run-off pesticides and soil nutrients. Due to lack of information on valuation, we did not include these in our environmentally adjusted GDP calculations. However, agricultural and forestry activities also causes soil erosion and loss of opportunities for the communities to use forest products. These two impacts are estimated during period 1998-99 using secondary information and reported in Table 5.
Finally, based on the abnve, we have estimated the gross and net (of environmental cost) sectoral product for agriculture and forestry. These are presented in Figure I and Figure 2 in the following pages. Figure I shows that due to erosion, aglicultural sector lost some output. This is nearly 2% of the sectoral product (see Table 5). Figure 2 shows the product of the forestry sector and the adjusted product. It is evident that deforestation (a type of depletion) has reduced the forestry sector output by nearly 50%. The losses are calculated in telIDS of depletion of forest product and soil erosion due to deforestation. The last diagramme, Figure 3, shows the percent loss in GDP if we adjust it for degradation and depletion.
Table 5. Loss of Product due to Erosion and Deforestation (Secondary Estimates)
7325.16 110.547
7435.70689 0.01864749
7074.63 114.970
7189.59971 0.018085
7197.75 125.755
7323.50477 0.01786735
7661.28 126.039
7787.31859 0.01792434
7741.71 131.786
7873.49589 0.01756316
7986.48 131.786
8118.26589 0.01728438
403.3618318 403.361832
0.00101156
419.499757 419.499757
0.00105523
458.8521308 458.852131
0.00111947
459.8877196 459.88772
0.00105854
480.8583925 480.858393
0.00107264
480.8583925 480.858393
0.00102378
Loss from Agriculture Loss from Deforestation
Total Loss Percent of Sectoral Product
Soil Erosion'"
1993·94
1994-95
1995·96
1996·97
1997·98
1998-99
Traditional use of forest resources'"
1993-94
1994·95
1995·96
1996-97
1997-98
1998·99
Indonesian Study has shown that due to soil erosion 3-4% of income Is lost in agriculture. This estimate Is based on Indonesian data. 3% of the forest land is estimated to be degraded every year In Bangladesh. Estimate by Hamid from BangladeSh Agricultural University. This is supported by many other studies. Based on the estimate from Economic Valuation of Environmental Impacts, p233, values includes impact on villagers from loss of extracting forest produces - Madagascar study.
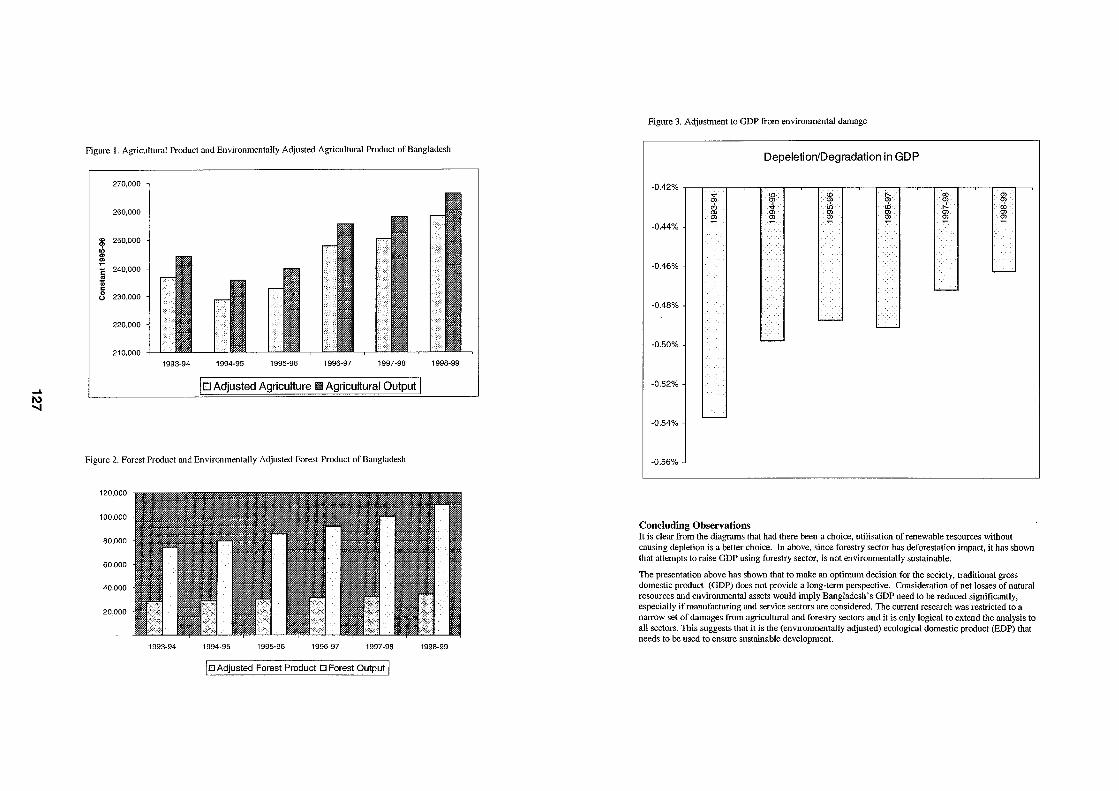
.... I\) ......
Figure I. Agricultural Product and Environmentally Adjusted Agricultural Product of Bangladesh
270,000
260,000
:g 250,000 ob g: E 240,000
~ c 8 230,000
220,000
210,000
1993-94 1994-95 1995-96 1996-97 1997-98 1998-99
10 Adjusted Agrk;ulture fS Agricultural Output I
Figure 2. Forest Product and Environmentally Adjusted Forest Product of Bangladesh
120,000
100,000
80,000
60,000
40,000
20,000
1993-94 1994-95 1995-96 1996-97 1997-98 1998-99
I CI Adjusted Forest Product D Forest Output I
Figure 3. Adjustment to GOP from environmental damage
DepeletionlDegradation in GDP
-0.42% I II ' III ' II ' I] I ' I I ' I ·1 ' Q) Q)
cO Q) Q)
;g; ci;, Q) Q)
-0.44%
-0.46%
-0.48%
-0.50%
-0.52%
-0.54%
-0.56%
Concluding Observations It is clear from the diagrams that had there been a choice, utilisation of renewable resources without causing depletion is a better choice. In above, since forestry sector has deforestation impact, it has shown that attempts to raise GOP using forestry sector, is not environmentally sustainable.
The presentation above has shown that to make an optimum decision for the society, traditional gross domestic product (GOP) does not provide a long-term perspective. Consideration of net losses of natural resources and environmental assets would imply Bangladesh's GOP need to be reduced significantly, especially if manufacturing and service sectors are considered. The current research was restricted to a narrow set of damages from agricultural and forestry sectors and it is only logical to extend the analysis to all sectors. This suggests that it is the (environmentally adjusted) ecological domestic product (EDP) that needs to be used to ensure sustainable development.
~
I\) (II)
References
Alaudddin, M and Tisdell, C (1998). The Environment and Economic Development in South Asia: An Overview Concentrating on Bangladesh Macmillan Press. 1998.
Bangladesh Institute of Development Studies (BIDS 1998). An Input-Output table for the Bangladesh economy 1993-94. BIDS, Dhaka.
Eurostat (1986). National Accounts ESA, input-output tables 1980. Luxembourg: Eurosta!.
Leontief, W.W. (1936). Quantitative Input-Output Relations in the Economic System of the United States. The Review of Economics and Statistics, XVIII (August 1936), 105-25.
Leontief, W.W. (1970). Environmental Repercussions and Economic Stmcture: An Input-Output Approach. Review of Economics and Statistics, 52(3), 262-271.
Pyatt, G., and J.1. Round, eds. (1985). Social Accounting Matrices: A Basis for Planning. The World Bank, Washington D.C.
United Nations (1953). A System of National Accounts and Supporting Tables. Studies in Methods, Series F, No.2, New York.
United Nations (1993). Handbook of National Accounting: Integrated Environmental and Economic accounting, Interim Version, United Nations (STIESA/STATISER.F/61).
... I\) <0
Sustainable Development Extension Nixon C, Yeabsley J, NZIER
Our role in this project MAF have commissioned Landcare with the assistance of the NZIER to explore the arguments associated with govermnent funding and effective involvement in the area of long term environmental sustainability associated with farming. Essentially the NZIER ask why any govermnent (local, regional, and national) should invest in sustainable development extension (and under what criteria) and Landcare detail how govermnent (local, regional, and national) should go about the intervention process (the operational process).
What is environmental extension? Enviromnental extension is a system by which farmers can improve enviromnental outcomes through an educational process using practical research based information. In the past this has been focused on production and productivity issues and to a much lesser extent on enviromnental issues.
In New Zealand this service was largely (although not entirely) based on extending knowledge and technologies available to enhance production and economic gain. Importantly also the extension programmes were linked to subsidy programmes since advice and subsidy programmes were identified with the same govermnent department.
Aims & objectives of a policy regime In general three points stand out: less policy is preferred to more; people should be free to engage in activities unless they are prohibited; and good regulatory design should signal the importance of innovation, economic growth and maintenance and enhancement of New Zealand's standard of living. 1
• Do the benefits from the regime (measured in terms of advancing its aims) justify the full costs associated with the regime? Can the costs be reduced without appreciably compromising the benefits?
Once the ability of the proposed regime to deliver the desired outcome, and the associated costs have been identified, it is essential to step back and ask whether the benefits that will be achieved in practice (not the maximum theoretical benefit) justify the costs that will be incurred. This is not a crude arithmetic process - many of the benefits and costs are unlikely to be able to be quantified in any useful or meaningful way. But a weighing of the gains against the price that New Zealand will pay for those gains is essential, since it is rare that a particular goal is worth pursing at any price, however great.
1 When it comes to the environment, it is widely accepted that the pursuit of economic growth, by itself, increases the risks for environmental damage and that some limits need to be set on the types of activities that may be undertaken, and the manner in which they are undertaken.
Characteristics of farming How do the policy objectives described above link in with the farming industry? We are interested in this because the institutional arrangements and characteristics specific to farming (and how they interact with markets) determine optimal policy choices. Furthermore, the direction of that policy may not be established a priori by theory since farmers may react in a way that is completely unexpected or unintended.
The major test of an enviromnental policy is how farmers react to an economic shock relative to other parts of the economy, Le., what does a farmer do when prices of commodity products reduce sharply? The short answer is; anything they can to maintain the farming lifestyle.
By its nature, a sustainable enviromnental strategy is long term. For an enviromnental policy process to work will require a good deal of education and understanding. It will involve farmers, those involved" on the ground" in the process, and policy designers, as to what is an enviromnentally sustainable approach and what is not, to weather the situations when farmers are under financial stress.
Institutional arrangements
Coase (1937) asked the question: how big should the firm be? This is particularly interesting in farming because casual observation suggests that farms are small in terms of labour employed (although getting bigger) and predominately family owned. To further investigate this issue Allen and Lueck (1998) devised an approach, which connects observations of seasonal production stages, crop cycles, task specialisation, and random weather events to the modem theory of the firm.
Specific farming characteristics
In general, a number of points can be made about farming and the observed behaviour of farmers.' These include:
• The impact of seasonality and number of random shocks that impact on production has a major bearing on farm organisation. This essentially comes down to a trade off between specialisation and moral hazard.' Farms are characterised by family ownership because the costs (including risks) of expanding production and employing further labour are outweighed by the opportunities for moral hazard that seasonality and random shocks present.
• Agriculture is characterised by different, almost separate stages of production. These include, for example, preparing soil, planting crops, applying pesticides, harvesting, packing, processing, and marketing. In a specialised business there is no reason why each of these stages could not be done by a different set of contractors.
, This works closely follows the Allen & Lueck (1998) paper, whose approach brings together earlier work on organisations done by Alchian and Demsetz (1972), Holmstrom and Milgrom (1994), and Becker and Murphy (1992).
, Moral hazard refers to the inability of an employer to effectively monitor or enforce the undertakings of an agreed contract with an employee.
..... Co) o
It is usual, however, for farmers to control all stages of production and some cases processing and marketing. In Coase's words they "make" these products the1l1Selves rather than "buy" in services.
• Another variation on the "make" or "buy" issue is that farms are usually characterised by ownership of land, not renting or short-term leasing. This is a particular characteristic not only of New Zealand farming but most farming operations in the industrialised world. To complicate matters further, these two businesses (owning and producing) have an inherent tension between longerterm land holding and its returns, and the short-term fixation on the price i.e. the tension between short term profit maximising and long term sustainability.
• Farming, as a land based activity, has a significant impact on the environment. The treatment of natural resources whether owned privately or publicly has significance locally, regionally, and nationally. Land management practices have the potential to "spillover", impacting on other parts of the economy. These actions can take a number of forms such as aesthetic and practical.
• There is also some evidence that farmers sometimes exhibit behaviour that is non profit maximising i.e. when prices are favourable they will not increase production as much as a "rational" farmer would, see for example Tauer (1988). Farmers maximise a certain level of income rather than maximising profit returns.
Apart from the last point, the specific characteristics of farming have policy parallels in the regulation of other industries. For example policies applied in heavy industry to prevent pollution may be applicable to enforcing environmental legislation.
The specific characteristics of farming that need to be considered by policy makers include:
• The smallness of farms.
• The number of farmers.
• The people who run the farm own the farm.
This adds complexity and tmderlines the need for flexibility in policies directed at farming. An effective environmental policy requires the "buy in" from all farmers, who learn at differing rates, and have different ideas about the worth of environmental programmes. It also highlights the need for support from various agencies of government for a co-ordinated a policy approach, once farmer "buy in" is achieved.
The changing nature of New Zealand farming is reflected in:
• The relatively new geological structures in New Zealand. Soils, farmer expertise, weather, export orientation, and micro-climates, mean that there is diversity of agricultural activities taking place in New Zealand.
The prices received for the commodities produced on world markets are also volatile, and to a large extent, producers are price takers. On average the net cash flow position of any of our agricultural industries can change dramatically in a short space of time as prices rise and fall, favourable or unfavourable weather conditions prevail, or random shocks occur.
• There are no subsidies given to New Zealand farmers to produce product, therefore overseas market prices are major determin.ant of what is grown on the
3
land. So if the land is suitable to be converted from one activity to another more profitable activity, farmers will do so. Not only is there a diversity of agricultural uses, but land use changes over time.
This means that delivery techniques will vary from region to region because of the different farming practices. Therefore flexibility of policy initiatives and increased interaction between the various stakeholders becomes an important part of any effective process.
Environmental issues It has been customary to categorise effects of environmental degradation (or environmental improvements) as principally on-farm or off-farm effects. This categorisation is often regarded as closely conforming to the division between privately appropriable effects and external effects, but the situation is more complex. For instance, environmental degradation caused by one farmer may impact on all users downstream may be felt on and off farm.
On-site impacts
On-site impacts are more easily identified and managed and quantified relatively easily in a cost-benefit framework.
However, there are also cases where farmers are "expected" to carry out environmentally sustainable farming practices when the economic benefits to farmers are, at best, marginal. For example, a forthcoming paper by Parminter (2001) concludes that:
"The private monetary incentives for planting poplars for erosion control are marginal at best. At all discount rates, the farmer would be better off doing nothing to control erosion, rather than plant poplars and not harvest them .... "
For short term production purposes the cost benefit analysis carried out by Parminter suggests, given normal conditions, that: 'farmers may be better off investing in pines rather than poplars." However, risk averse farmers may be motivated to plant poplars as "insurance" against a one-off on-site erosion event.
This illustration raises questions about the different risk profiles farmers have and how that translates into on-farm behaviour. This increases the complexity of the issues facing farmers as the economic signals counteract what are considered to be sustainable farming practices.
The complexity and the need to change behaviour tmderlines the importance of long term solutions as the lines between the on-site and off-site impacts are blurred. Allen & Kilvington (2001) explore the linkages between research, extension, and effective interaction with users in more detail.
Off-site impacts
Off-site production and community/environmental effects
These are effects, which impact on production processes, but not necessarily on the properties where the erosion originates. Such external effects are principally:
• Reductions in adjoining site outputs where degradation on one property generates any of the on-site effects on another property (e.g. downstream deposition of sediment).
4
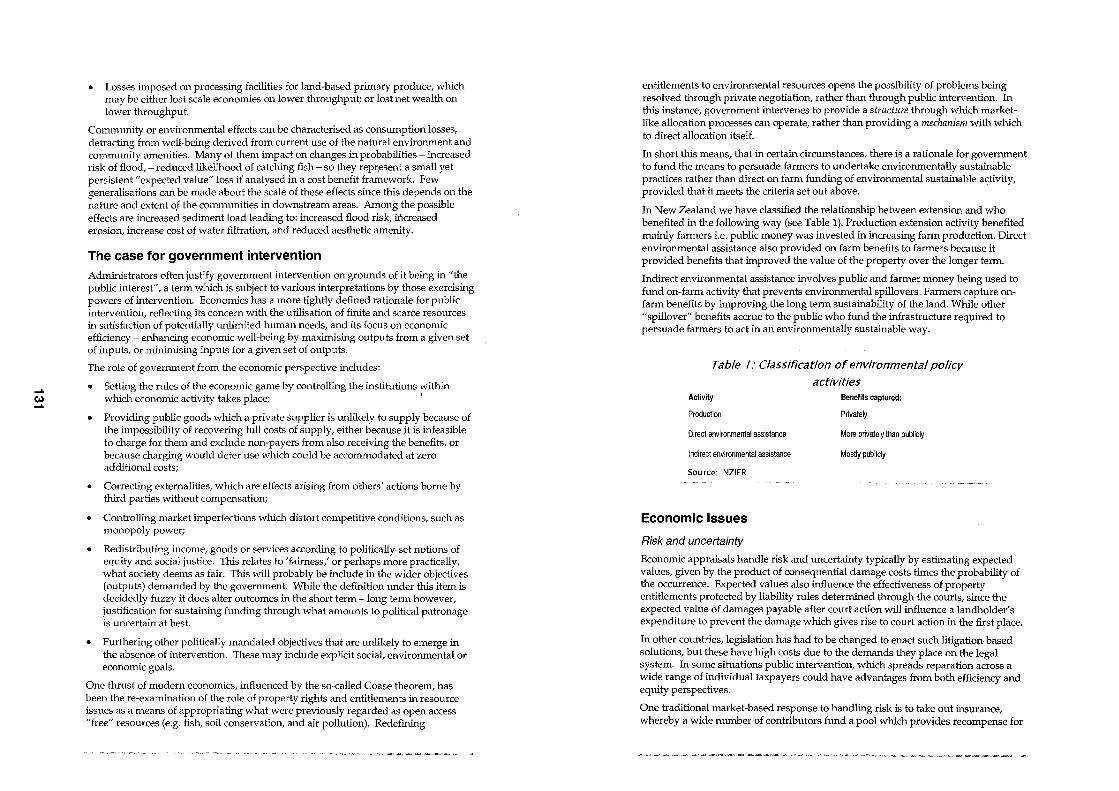
..... Co) .....
• Losses imposed on processing facilities for land-based primary produce, which may be either lost scale economies on lower throughput; or lost net wealth on lower throughput.
Community or environmental effects can be characterised as consumption losses, detracting from well-being derived from current use of the natural environment and community amenities. Many of them impact on changes in probabilities - increased risk of flood, - reduced likelihood of catching fish - so they reprl'sent a small yet persistent" expected value" loss if analysed in a cost benefit framework. Few generalisations can be made about the scale of these effects since this depends on the nature and extent 0'£ the communities in downstream areas. Among the possible effects are increased sediment load leading to: increased flood risk, increased erosion, increase cost of water filtration, and reduced aesthetic amenity.
The case for government intervention Administrators often justify government intervention on grounds of it being in "the public interest", a term which is subject to various interpretations by those exercising powers of intervention. Economics has a more tightly defined ra tionale for public intervention, reflecting its concern with the utilisation of finite and scarce resources in satisfaction of potentially lmlimited human needs, and its focus on economic efficiency - enhancing economic well-being by maximising outputs from a given set of inputs, or minimising inputs for a given set of outputs.
The role of government from the economic perspective includes:
• Setting the rules of the economic game by controlling the institutions within which economic activity takes place; 1
• Providing public goods which a private supplier is unlikely to supply because of the impossibility of recovering full costs of supply, either because it is infeasible to charge for them and exclude non-payers from also receiving the benefits, or because charging would deter use which could be accommodated at zero additional costs;
• Correcting externalities, which are effects arising from others' actions borne by third parties without compensation;
Controlling market imperfections which distort competitive conditions, such as monopoly power;
• Redistributing income, goods or services according to politically-set notions of equity and social justice. This relates to 'fairness,' or perhaps more practically, what society deems as fair. This will probably be include in the wider objectives (outputs) demanded by the government. While the definition under this item is decidedly fuzzy it does alter outcomes in the short term -long term however, justification for sustaining funding through what amounts to political patronage is uncertain at best.
• Furthering other politically mandated objectives that are unlikely to emerge in the absence of intervention. These may include explicit social, environmental or economic goals.
One thrust of modern economics, influenced by the so-called Coase theorem, has been the re-examination of the role of property rights and entitlements in resource issues as a means of appropriating what were previously regarded as open access "free" resources (e.g. fish, soil conservation, and air pollution). Redefining
entitlements to environmental resources opens the possibility of problems being resolved through private negotiation, rather than through public intervention. In this instance, government intervenes to provide a structure through which marketlike allocation processes can operate, rather than providing a mechanism with which to direct allocation itself.
In short this means, that in certain circumstances, there is a rationale for government to fund the means to persuade farmers to undertake environmentally sustainable practices rather than direct on farm funding of environmental sustainable activity, provided that it meets the criteria set out above.
In New Zealand we have classified the relationship between extension and who benefited in the following way (see Table 1). Production extension activity benefited mainly farmers i.e. public money was invested in increasing farm production. Direct environmental assistance also provided on farm benefits to farmers because it provided benefits that improved the value of the property over the longer term.
Indirect environmental assistance involves public and farmer money being used to fund on-farm activity that prevents environmental spillovers. Farmers capture onfarm benefits by improving the long term sustainability of the land. While other "spillover" benefits accrue to the public who fund the infrastructure required to persuade farmers to act in an environmentally sustainable way.
Table 1: Classification of environmental policy activities
Activity
Production
Direct environmental assistance
Indirect environmental assistance
Sou ree: NZIER
Economic Issues
Risk and uncertainty
Benefits captured:
Privately
More privately than publicly
Mostly publicly
Economic appraisals handle risk and uncertainty typically by estimating expected values, given by the product of consequential damage costs times the probability of the occurrence. Expected values also influence the effectiveness of property entitlements protected by liability rules determined through the courts, since the expected value of damages payable after court action will influence a landholder's expenditure to prevent the damage which gives rise to court action in the first place.
In other countries, legislation has had to be changed to enact such litigation-based solutions, but these have high costs due to the demands they place on the legal system. In some situations public intervention, which spreads reparation across a wide range of individual taxpayers could have advantages from both efficiency and equity perspectives.
One traditional market-based response to handling risk is to take out insurance, whereby a wide munber of contributors fund a pool which provides recompense for
..... W II.)
the few who suffer loss. However, the necessary conditions (i.e. a market with out government interference) for an insurance market work are not present for many categories of enviromnental risk, and environmental insurance is costly to arrange.'
Valuation issues
The treatment of "non-market values", principally for off-site effects on environmental quality is an important issue, particularly since any government interventions should be squarely targeted on off-site environmental improvements. These represent the loss of community well-being which would result from degradation of environmental resources which are not provided through a market mechanism. They include: current use values such as those from informal recreation in clear waterways, pleasant landscapes etc.
Various techniques of non-market valuation are available to impute values either by observing "revealed preferences'" in actual behaviour (such as travel cost analysis for recreational demand, "hedonic pricing" for amenity in housing values) or by inquiring into "stated preferences" expressed in surveys designed to mimic hypothetical market-like processes (such as "contingent valuation" of wildlife resources and safety improvements). All these techniques are relatively dataintensive and have not been widely applied in New Zealand. Furthermore, the approaches have well documented limitations and as yet unresolved problems in application, and a major drawback for applying to sustainability issues in that they do not yield values that can be extrapolated beyond the specific study areas.
Sustainability
Does an economic analysis allow policy makers to make definite statements about environmental degradation? Around the world work has been done on devising indexes which estimate the opportlmity cost of environmental damage. However, the procedures used appear to be data intensive (in an area where data is scarce and in some cases questionable) raising doubts about the validity of the approaches and results.
Critical of economic prescriptions, Bradsen (1992) regards high or increasing agricultural productivity as no reason for assuming degradation is absent: the question to be addressed in assessing sustainability is whether long-term capacity is being exceeded. He questions with some justification the methodological grounding of economic analysis, but is less clear on what exactly to put in its place. The strength of an economic approach (in this case cost benefit analysis - see Appendix A) is not that it provides an answer - which may be elusive any way given limited information - but rather that it helps clarify the effects which are implicit in all decisions. Economic appraisal can still be valuable if used as an informative, rather than prescriptive tool, since it provides a consistent approach to harnessing available information and ordering priorities.
-l Conditions for an insurance market to work include: actuarially predictable risk categories, a wide pool of potential policy-holders, and the ability to limit the "moral hazard" of fraudulent claims.
5 Revealed preference examines conswners' behaviour and develops policy on that basis, rather than analysing or developing policy on the expressed opinions of consumers.
7
Conclusions In comparatively recent times government has more tightly defined "economic" rationale which limits intervention to providing public goods and correcting externalities where collective action is demonstrably more effective than private alternatives.
Key to this approach is finding the least cost solution to environmental issues. This may mean developing on an incremental approach to what is already been used successfully" on the ground", rather than building completely new set of institutions. Furthermore, since each environmental problem is different a more flexible "horses for courses" approach is preferable to a "one size fits all" policy prescription.
While farming may have specific characteristics associated with the way it is organised it does not preclude the use of economic instmments used in other industries. However, the use of these instruments to "solve" one environmental issue must not, in tl1e course of its implementation, damage other environmental extension activities being implemented. Since by correcting one environmental problem by forcing farmers to act in a certain way may create mistrust that will make farmers less inclined to be cooperative on other issues that government may wish farmers to do on a voluntary basis.
The case for government intervention revolves arolmd the spillover effects of onfarm environmental degradation. The market will not take care of these externalities that create off-farm effects. If the CBA was positive, government involvement would be most effective, over the long term, through direct "structural" assistance, which builds up the infrastmcture to support farmers who would be providing the on-farm expenditure required to put in place environmental sustainable farm management plans.
Economic tools and an economic way of thinking can help in organising the issues involved, since it helps clarify the effects that are implicit in all decisions. Economic appraisals are valuable if used as an informative, rather than prescriptive tool, since it provides a consistent approach to harnessing available information and ordering priorities i.e. it is only in very rare cases that a policy is worth pursuing at any cost.
Bibliography
Abbott P (1998), OECD Workshop on Emerging Trade Issues in Agriculture: Competition Policy and Agricultural Trade. OECD COM/CA(I'D(I'C/WS (98) 106
Alchian A & Demsetz H (1972), Production, Information Costs, and Economic Organisation. American Economic Review (62) pp777-95.
Allen W & Kilvington M (2001), Sustainable Development Extension. Prepared for the Ministnj of Agriculture and Forestry. Forthcoming.
Allen DW & Lueck D (1998), The nature of the farm. Journal of Law and Economics. Vol XLI. University of Chicago.
Bradson (1992) Issues for an institutional framework for sustainable land use and conservation. Report to the Ministry of Agriculture and Fisheries.
Clough P & Nixon C (1997), White spotted Tussock Moth. NZIER report to Treasury, July 1997.
Clough P & Nixon C (2000), Coughing up for Bovine Tb Control. NZIER report to Treasury, July 2000.
8
..... (0) (0)
Coase RH (1937), The Nature of the Firm. 4 Economica 386.
Gruensprecht, HK and Lave, L (1989), "The economics of Health, Safety and Environmental Regulation," in Schmalensee, R and Willig, R (eds) Handbook of Industrial Organisation, North Holland, Amsterdam.
Hawke, G (1993), Improving Policy Advice, IPS, Wellington.
Johnson NL & RuttanVW (1994), Why are farms so small? World Development. Vol. 22 pp691-706.
Parminter I, M.B. Dodd, A.D. Mackay (2001), Economic analysis of poplar planting on steep hill country. Grasslands Conference. Forthcoming.
Rhodes T, Willis B, & Smith W (2000), Impediments to optimising the Economic and Environmental performance of Agriculture. Vol 1 A study of issues affecting North Island Hill Country Farmers. MAF Technical Paper 2000/17, September 2000.
Rose-Ackerman, S (1996), "Economics, Public Policy and the Law," Victoria University Law Review V26, ppl-15.
Sinner J (1991), Making water quality decisions: when costs and benefits don't fit our assumptions. Aust. Agr. Econ. Soc. NZ Branch Conference, Lincoln.
Tauer, Loren W. and Harry M. Kaiser (1988), "Negative Milk Supply Response Under Constrained Profit Maximizing Behavior." Northeastern Journal of Agricultural and Resource Economics 17(1988) 111-117 .
..... (0) .I:>
Quality of the environment: What the public thinks
Cook, A.', Hughey, K.F.D., Kerr, G.N. & Cullen, R. Lincoln University
SUMMARY
This paper uses selected data from a survey of New Zealanders' perceptions of the environment and quality of environmental management (N=849). The aim of the paper is to determine the basis for the perception of the environment as being clean and green. When New Zealanders made comparisons between their environment and that of other countries it was found that the New Zealand environment was perceived very favourably. Examination of perceptions of the natural environment within New Zealand nevertheless reveals that many were concerned for the state of the environment. Investigating these perceptions through perceptions of wetlands and marine fisheries found concern was related to perceptions of the quality of the management of these resources as well as their perceived quality, availability and calls for more government funding of these resources.
Keywords: Environment; environmental management; perceptions
INTRODUCTION
New Zealanders are often assumed to perceive their environment as being clean and green whereas the physical evidence indicates these perceptions are poorly founded. This paper draws upon selected data from a survey of New Zealanders' concerns about the environment and their views of its management. In this paper the question of whether the New Zealand environment is perceived as clean and green is addressed. New Zealanders' views of their environment compared to other developed countries are examined. These views are also compared to assessments of the quality of the natural environment. Two aspects, of public concern, marine fisheries and wetlands are then examined in detail, through assessments of condition, quality of management, preferences for government spending and preferences for who should be responsible for their management. The results reveal that New Zealanders hold their natural environment in high regard compared to other countties. The New Zealand public, however, remains concerned for the environment.
The survey
The survey was designed to gather public perceptions, attitudes and views of the environment and its management. The survey was conducted between January and March 2000 with 2000 questionnaires posted to householders randomly selected from the New Zealand electoral roll. The survey received an effective response rate of 48 per cent (N = 894). The sample had a margin of error at the 95% confidence interval of approximately three per cent.
'Corresponding author. Tel.: (3)-3253813; fax: (3)-3253814; e-mail: [email protected]
The survey measured responses using question sets. The measures used in this paper were derived from question sets assessing; perceptions of the state of environment in terms of current state, availability and change over time, perceptions of the response by management, preferences for institutional arrangements for the management of the environment, and preferred allocation of government expenditure on environmental management and government services.
State of the environment was measured using the three sets of questions addressing respectively quality, availability and change of state over the previous five years. The first set was preceded by the instruction: Please indicate what you think the state of each of the following is. Followed by: The quality or condition of New Zealand's ... Eleven aspects, including marine fisheries and wetlands, were then presented with a five-point scale provided for measurement of each, anchored by very good and very bad.
A second set measured perceptions of the amount or availability of nine natural resources including marine fisheries and wetlands. These were measured by asking: We would like your opinion on the availability or amount of some of our natural resources. The set of nine natural resources was then preceded by: In New Zealand the ... The set was presented with five-point scales provided for measurement anchored by very high and very low.
The third measurement was of perceptions of change in the state of the environment over the last five years. These were taken with the invitation: Now that you have told us what you think about the state of New Zealand's environment, we would like you to tell us how you think the environment has changed over the last 5 years. The set of aspects was preceded by: Compared to five years ago ... followed by thirteen aspects of the New Zealand environment including marine fisheries and wetlands. These aspects were presented with a five-point measurement scale, anchored by much better and much worse.
A set of management questions designed to measure CUlTent management of aspects of the environment was then presented. Thirteen items including marine fisheries and wetlands were preceded by: Currently in New Zealand how well or poorly managed is ... These items were presented with a five-point scale provided for measurement of each, anchored by very well managed and extremely poorly managed.
A further set of management questions was design to establish whether management had improved or had become worse over the previous five years. The question presented the same set of items as the prior set with the instruction: Compared to five years ago, management of New Zealand's ... These items were presented with a fivepoint scale provided for measurement, anchored by much better and much worse.
Preferences for who to should manage resources were measured with the invitation: There are many ways to manage resources. Please indicate your preferences by ticking one box for each line. Fourteen resource areas including marine fisheries and wetlands were presented with five possible management arrangements for respondents to select.
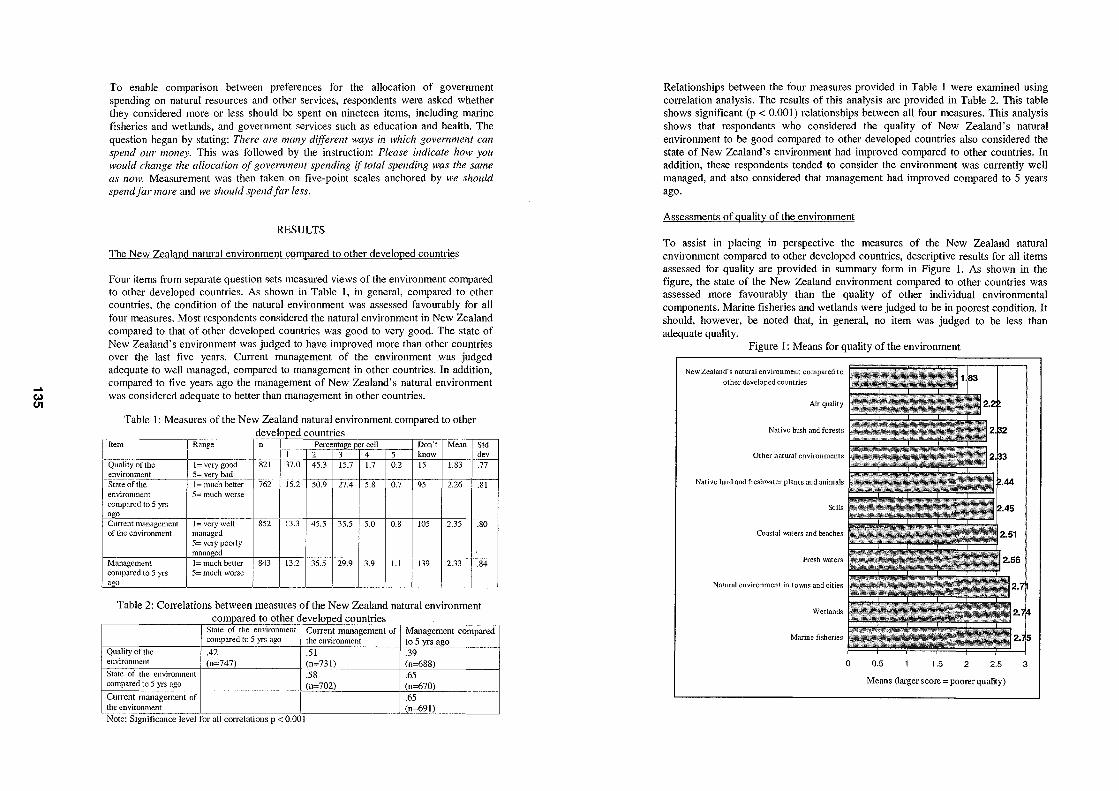
.... Co) CJ1
To enable comparison between preferences for the allocation of government spending on natural resources and other services, respondents were asked whether they considered more or less should be spent on nineteen items, including marine fisheries and wetlands, and government services such as education and health. The question began by stating: There are many different ways in which government can spend ollr money. This was followed by the instruction: Please indicate how you would change the allocation of government spending if total spending was the same as now. Measurement was then taken on five-point scales anchored by we should spend far more and we should spend far less.
RESULTS
The New Zealand natural environment compared to other developed countries
Four items from separate question sets measured views of the environment compared to other developed countries. As shown in Table I, in general, compared to other countries, the condition of the natural environment was assessed favourably for all four measures. Most respondents considered the natural environment in New Zealand compared to that of other developed countries was good to very good. The state of New Zealand's environment was judged to have improved more than other countries over the last five years. Current management of the environment .was judged adequate to well managed, compared to management in other countries. In addition, compared to five years ago the management of New Zealand's natural environment was considered adequate to better than management in other countries.
Table I: Measures of the New Zealand natural environment compared to other develooed -- _ .. _----
Item Range n PercentaO"e er cell Don't Mean Std I 2 3 4 5 know dev
Quality of the 1= very good 821 37.0 45.3 15.7 1.7 0.2 15 1.83 .77 enVirOlUllellt 5= very bad State ofthe 1= much better 762 15.2 50.9 27.4 5.8 0.7 95 2.26 .81 environment 5= much worse compared to 5 yrs ~o
Current management 1- very well 852 13.3 45.5 35.5 5.0 0.8 105 2.35 .80 of the environment managed
5= very poorly manao-ed
Management 1- much better 843 13.2 35.5 29.9 3.9 1.1 139 2.33 .84 compared to 5 yrs 5= much worse ago
~
Table 2: Con'elations between measures of the New Zealand natural environment ~~A~A __ d to other d -- ---
State of the environment CUlTen! management of Management compared compared to 5 yrs ago the environment to 5 yrs ago
Quality of the .42 .51 .39 enviromnent (n=747) (n=73I) (n=688) State of the environment .58 .65 compared to 5 yrs ago (n=702) (n=670) Current management of .65 the environment (n=691) Note: Significance level for all colTelations p < 0.00 I
Relationships between the four measures provided in Table I were examined using correlation analysis. The results of this analysis are provided in Table 2. This table shows significant (p < 0.001) relationships between all four measures. This analysis shows that respondents who considered the quality of New Zealand's natural environment to be good compared to other developed countries also considered the state of New Zealand's environment had improved compared to other countries. In addition, these respondents tended to consider the environment was currently well managed, and also considered that management had improved compared to 5 years ago.
Assessments of quality of the environment
To assist in placing in perspective the measures of the New Zealand natural environment compared to other developed countries, descriptive results for all items assessed for quality are provided in summary form in Figure 1. As shown in the figure, the state of the New Zealand environment compared to other countries was assessed more favourably than the quality of other individual environmental components. Marine fisheries and wetlands were judged to be in poorest condition. It should, however, be noted that, in general, no item was judged to be less than adequate quality.
Figure 1: Means for quality of the environment
New Zealand's natural environment compared to
other developed countries
Air quality
Native bush and forests
Other natural environments
Native land and freshwater plants and animals
Soils
Coastal waters and beaches
Fresh wat ers
Natural environment in to\MlS and cities
Wetlands
Marine fhheries
o 0.5 1.5 2 2.5
Means (larger score = poorer quality)
3

... (0) en
Assessments of marine fisheries and its management
The quality of marine fisheries was of most concern to respondents. To explain this concern examination is undertaken of assessments of condition, quality of management, preferences for government spending and preferences for who should be responsible for management.
Table 4 shows the survey items that assessed marine fisheries. The table shows that in keeping with the assessment of quality, the quantity of marine fisheries was seen to be adequate to good. The state of marine fisheries was, however, judged in general to be worse than five years ago. Management was deemed to be adequate to poor and little or no improvement in management was seen to have occurred in the last five years. There was also an indication that more of the budget should be spent on marine fisheries and, as shown in Table 5, the resource was seen to be most appropriately handled by a broad array of people including individuals, communities, iwi, local and central government.
ble4: A - ----- .. - ---- f - - -fish . lenes and therr mana ement
lItem Range n Percentage per cell Don·t Mean Std I 2 3 4 5 know dey
Quality of fi,herie, 1- very good 765 7.1 34.5 37.6 17.6 3.1 19 2.75 .93 5= very bad
Quantity of fisheries I=very high 719 4.5 29.6 45.1 19.1 1.8 127 2.84 .84 5=verv low
State of fisheries 1- much better 653 2.1 13.8 37.5 41.8 4.7 197 3.33 .85 compared to 5 yrs 5= much worse aoo IC"'""'"-
1= very well
H= 17.0 42.9 31.6 5.6 190 3.20 .89
of fisheries managed 5= very poorly manaaed
Management of I = much better 644 2.6 15.9 35.7 19.0 3.2 199 3.06 .87 fi:;;heries compared to 5= much worse 5 yrs aao I Change in spending J=spcnd far 1853 14.7 29.1 61.0 4.3 0.9 NA 2.68 .68 allocation for more fisheries 5=spend far Jess
ble 5 - ~. ~
N Individuals and Individuals, Individuals, Local and ~entral
Ifms firms, iwi and !communities, central !government communities iwi and government
Igovernment Frequency 835 29 53 254 245 254 Percentage 100% 3.5 6.3 30.4 29.3 30.4
Correlation analysis, provided in Table 6, found significant relationships (p < 0.05 or better) between most items related to marine fisheries. Interpretation of the relationships in this table reveals that only three of the five measures of fisheries were related to preferences for the reallocation of government spending. The analysis also shows these relationships were weak, though they do provide some indication that perceptions of the quality of the resource and its management are influencing preferences for funding. The table also shows relationships between assessments of quality, availability, change over time and management quality. Tests (ANDV A, sig of F) for relationships between prefelTed management arrangement for marine
I I
fisheries with other measures of marine fisheries shown in Table 4 found no significant relationships. This indicates that the choice of preferred management arrangement was unrelated to assessments of the condition, management or government spending preferences.
Table 6: Correlations between measures of marine fisheries Quantity of State of Current Management Change in fisheries fisheries management of fisheries spending
compared to 5 of fisheries compared to allocation for yrs ago 5 yrs ago fisheries
Quality of fi,herie, .58*** .48*** .55*** .43*** -.14*** (n=683) (n=63 I) (n=634) (n=617) (n=750)
Quantity of fisheries .39*** .43*** .36*** -.04 (n=620) (n=) (n=) (n=700)
State of fisheries .69*** .63*** -.08* compared to 5 yrs ago (n=593) (n=580) (n=643) Current management of .69*** -.13** fisheries (n=61O) (n=65I) Management of -.04 fisheries compared to 5 (n=636) yrs ago Note: Significance levels *p < 0.05, **p < 0.01, ***p < 0.001
Assessments of wetlands and their management
Wetlands was another aspect of the environment that was perceived as being of relatively poor qUality. To explain this perception examination is made of assessments of condition, quality of management, preferences for government spending and preferences for who should be responsible for management.
Table 7: A - f - land - ------ d --------- --------Item Range n Percentage per cell Don't Mean Std
1 2 3 4 5 know dey Quality of wetland, 1= very good 735 7.1 33.3 40.1 15.4 3.1 22 2.74 .91
5- very bad Quantity of wetland, I=very high 672 3.6 21.4 47.0 24.1 3.9 183 3.03 .87
5=verv low State of wetland, 1 = much better 601 2.0 20.1 53.6 22.0 2.3 239 3.02 .77 compared to 5 yr' 5= much worse aoo Current management J= very well 620 2.6 24.7 48.7 21.0 3.1 222 2.97 .83 of wetland, managed
5= very poorly managed
Management of 1- much better 607 2.3 17.4 40.0 Il.l 1.5 234 2.89 .77 wetlando;;compared to 5= much worse 5 VT' ago Change in spending l=spend far 851 6.5 31.8 55.6 5.4 0.7 NA 2.62 .72 allocation for more
wetlands 5=spend far less -
Descriptive results for items that related to wetlands are provided in Table 7 and Table 8. Table 7 shows that, in keeping with the assessment that the quantity of wetlands was adequate to good, respondents generally considered the quantity of the resource to be slightly better than adequate. The state of wetlands was, however, judged to be, in general, approximately the same as five years ago. The resource was
i

.... (0)
'"
seen to be adequately to well managed and, in general, the quality of management was considered to be largely unchanged in the last five years. There was some support for extra funding for the management of wetlands. In addition, the results provided in Table 8 reveal that most respondents considered either a combination of individuals, communities, iwi and government or local and central government should manage wetlands.
laDle <I: t'rererrea mana emem or weuanas
iN ndividuals and Individuals, Individuals, Local and Central
firms firms, iwi and communities. iwi central government communities and government government
Frequency 824 24 57 310 301 132
Percent 100% 2.9 6.9 37.6 36.5 16
----
Results of the correlation analysis for items shown in Table 7 are provided in Table 9. As shown in the table, unlike the correlation analysis of measures of marine fisheries, for wetlands there were significant (p < 0.00 I) relationships between all items. Quality was related to the amount of wetlands and the perceived state of wetlands over five years. These assessments are also related to judgements of current management and the performance of management over time. For wetlands, the analysis reveals that assessments of condition of the resource and the two judgements of the quality of management were related to calls for changes in funding allocation. For example, there was a tendency for respondents who considered wetlands to be in poor condition and were critical of their management to consider that the government should increase funding of this resource when compared with other respondents.
Table 9: Con'elations between measures of wetlands Quantity of State of CUlTent Management Change in wetlands wetlands management of wetlands spending
compared to 5 of wetlands compm'ed to allocation for yrs ago 5 yrs ago wetlands
Quality of wetlands .59 .42 .58 .39 -.23 (n=640) (n=578) (n=596) (n=582) (n=716)
Quantity of wetlands .43 .57 .41 -.25 (n=576) (11=567) (n=556) (n=658)
State of wetlands .57 .61 -.16 compared to 5 yrs ago (n=54 I) (n=540) (n=590) CUlTent management of .62 -.3 wetlands compm'ed to 5 (n=580) (n=607) yrs ago Management of -.15 wetlands compared to 5 (n=596) yrs ago Note: Significance level for all con'elations p < 0.00 I
Tests for relationships between preferences for who best to manage wetlands and perceptions of the condition of wetlands and their management found two significant results. Through comparison of means per management category (ANOY A sig of F, p< 0.0 I) lower means for perceived availability were found for the individuals and firms category (mean = 2.37, sd .76) and the individnals, f!fms, iwi and communities category (mean = 2.91, sd .95) whereas the highest mean was for management by central government (mean = 3.17, sd .83). This indicates that disproportionately more
respondents who considered the area and number of wetlands to be lower than desirable considered that central government should have sole charge of their management. The second significant relationship was found between categories with regard to the state of wetlands compared to five years ago (ANOY A sig of F, P < 0.001). Respondents who preferred management by central government considered management of wetlands had become worse (mean = 3.14, sd .75) whereas those who preferred management by individuals and firms considered wetlands to be in a better state than five years ago (mean = 2.37, sd .76).
DISCUSSION AND CONCLUSION
The results of the analysis of the survey data provide for two responses to the question of whether New Zealanders perceive their environments as clean and green. Respondents in general consistently assessed the New Zealand environment more favourably than other countries. Quality was judged to be better and the condition of the environment was judged to have improved. In addition, management was seen to be performing better both in judgements of CUITent performance and the level of improvement over the last five years. There was also consistency between assessments to all questions on the topic with respondents tending to give all positive or all negative responses. Had the analysis stopped here the judgement would have been New Zealanders hold their environment in high regard. When compared to assessments of the perceived quality of the environment and its management a somewhat contrasting picture has emerged.
While the environment is highly regarded compared to other countries there is a distinct difference between this assessment and views of the quality of the New Zealand environment. Marine fisheries and wetlands were highlighted as aspects perceived as being in the poorest condition. Focusing on these aspects, marine fisheries were found to be, in general, moderately favourably assessed in terms of quality, stock level and change over time, yet their management was assessed moderately unfavourably. Management of this resource was judged to be best handled by arrangements that excluded individuals and firms. More preference was given to management by central government or central government in combination with local government and iwi with individuals. Examination of relationships between items found logical relationships between measures of concern for the environment and measures of management. For example, perceptions of poor quality were related to perceptions of poor management. These assessments were not found to be fully related to preferences for government spending. It is therefore possible that other factors not measured in the survey could be related to spending preferences. In addition, no relationships were found between preferred management arrangement and other items related to fisheries management. Concern over this resource and its management may then either not be related to preferences for management or these concerns may not be strong enough to show a significant effect. While fisheries are recognised as an area of concern, fisheries management was seen as adequate, and while there is a relatively even distribution between three preferred arrangements for management, these differ little from the status quo.
Wetlands are another aspect of the environment about which people were most concerned. Quantity was, however, generally judged to be adequate and little change in condition was perceived to have occurred in the last five years. Current
...... W (II)
management of wetlands received a rating above adequate and there was a general view that management had improved. More government spending was, in general, favoured and calls for more spending were related to concerns for wetlands and their management. As found for fisheries management concerns about this resource and concerns regarding its management were related. Unlike fisheries, some relationships were found between preferred management for wetlands and the availability of wetlands and their state compared to five years ago. Those people who prefelTed management by central government were more concerned about the condition of wetlands.
This study has shown that New Zealanders do consider their environment to be better than other developed nations. Many New Zealanders, however, have concerns over the environment and its management. While it may be tempting to compare these perceptions with the physical evidence, they are nevertheless a reality for the holders of these views. In the case of fisheries it would seem there is concern about the state of this resource, though CUlTent management is considered adequate. However, a negative movement in perceptions of this resource can be expected to impact upon perceptions of management, though such a movement is unlikely to impact upon preferences for arrangements of management. Changes in perceptions of wetland quality, condition and quantity will similarly affect views of management. In addition, unlike marine fisheries, such changes will impact upon preferences for management structure, with increased concern for wetlands resulting in more support for control by central government. In both cases, environmental concerns and views of management are likely to impact upon government policies through support or condemnation of government spending policies in these areas of the environment.
... Co) CD
HEDGING FARM GATE RETURNS
Kevin Wilson, c/- The National Bank of New Zealand Ltd, Wellington
SUMMARY
The relationship between changes in the exchange rate and changes in the farm gate price of a product is not constant. There is no certainty that the exchange rate will move in a certain direction within a specified time interval and there is no certainty that the shift will bring the expected change in the farm gate price.
This paper provides a high level overview followed by a more technical backgrolmd to the concepts, some of the detail, terminology and implications of foreign exchange agreements.
It is concluded that holding a foreign exchange agreement in association with the sale of farm produce can provide a positive outcome compared to having no foreign exchange agreement, but not always.
Key Words: foreign exchange agreements, risk, farm gate price.
INTRODUCTION
Foreign exchange agreements have been suggested as a mechanism for farmers to reduce the exposure of gross farm income to changes in the exchange rate.
There are several issues to be resolved before a farmer should make use of a foreign exchange agreement.
WHICH CURRENCY?
The first issue is to hedge against the con'eel currency.
The currency of denomination is not necessarily the currency that determines the price of a product. For example, international dairy prices are strongly influenced by the Euro/USD exchange rate.
The USD is important but not the only currency used for agricultural trade. While international trade in goods and services is often priced and paid for in USD, goods and services may also be priced in USD but paid for in a second currency (or vice versa).
EXTENT OF EXPOSURE
Farmers and growers have varying degrees of exposure of gross income to alteration in the value of the NZD.
Dairy farmers, pip* and kiwi fruit growers already have part of their gross income insulated from changes in the value of the New Zealand dollar by the marketing boards. The variable results obtained by the three organisations highlights the difficulty of consistently beating the market. Farmer held currency agreements in this situation could exacerbate both positive and negative currency hedges by the marketer.
(* ENZA are not providing blanket FX cover for suppliers as from the 2001/2002 season)
Meat and wool producers are more exposed. Exporters choose to make much lower use of forward contracts for currency or product but it is noted that this situation is slowly changing in the meat industry.
The returns from horticultural products exported direct by growers can be immediately impacted on by shifts in the relative value of the NZD.
THE BEST ALTERNATIVE?
Foreign exchange risk is part of market risk. Simple strategies for reducing market risk to be considered before concentrating on foreign exchange risk include the following:
Having a spread of product to sell e.g. lamb, wool, beef, venison, and velvet. Having a spread in sale dates for a product. Selling and buying replacements on the same market. Supplying top quality product to specification. Using fixed price contracts. Trading with a high turnover. Trading up in good times, trading down when times are tougher.
Obviously, and for a whole host of reasons, not all the above strategies are available or suited to every farmer.
Using financial irtstruments to mana.ge currency risk is not perfect and they have their own risks .
IN-BETWEEN AN INVESTOR & SPECULATOR
Farmers are between an investor and a speculator. Farmers and exporting growers (normally) do not get paid in foreign currency for produce sold. The underlying linkage between exchange rate and farm product prices is strong but other factors can dominate and distort the relationship in the short term. Hedgil1g il1 this situatiol1 is less effective. It can reduce risk but cal1 also leave the farmer worse off.
An investor buys/ sells financial agreements with a simultaneous trade in the underlying asset e.g. wool futures.
Note it is importal1t to simultaneously sell the asset and close out the financial agreement to gain maximum reduction in market risk.
Unfortunately, New Zealand is too small to support a primary product futures market.
A speculator buys/sells financial agreements without a simultaneous trade in the underlying asset. There is no hedge; the speculator stands to make high profits or large losses. The risks are high. Speculators are an important part of trade in financial agreements.
EXCHANGE RATE VOLATILITY
History since 1985 shows there is approximately an equal probability of a rise or fall il1 the exchange rate over a period of time.
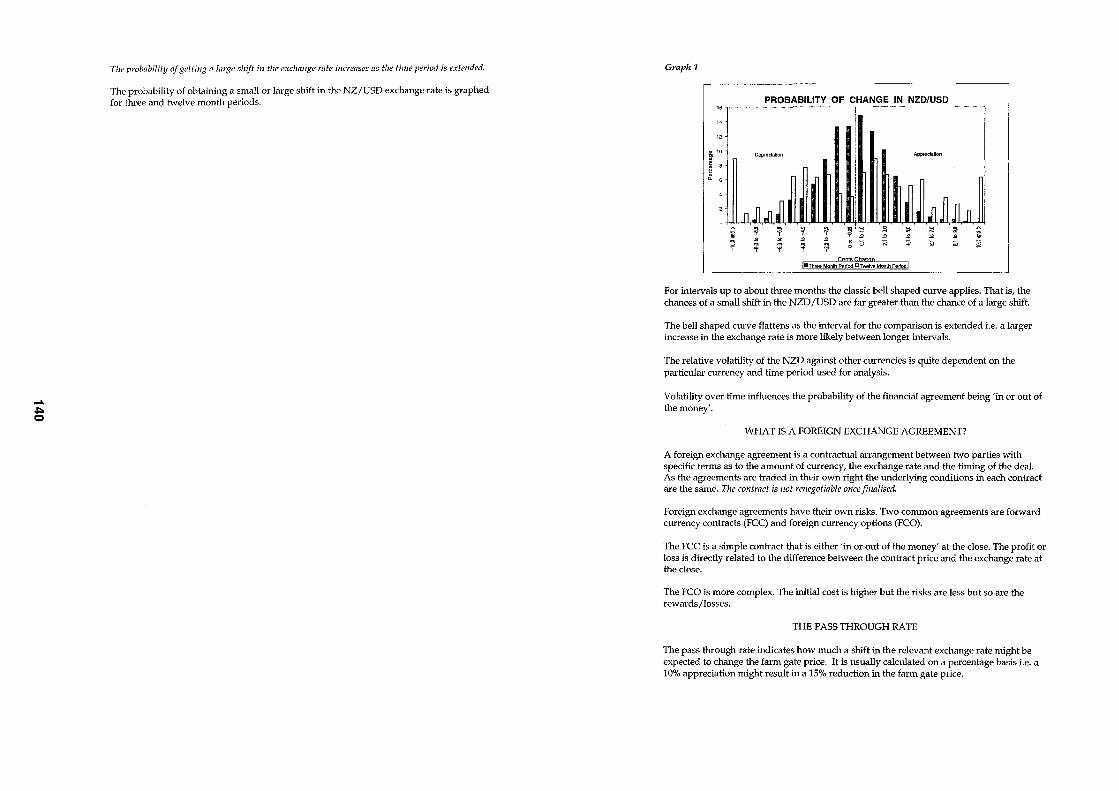
.....
.j:o o
The probability of gel/illg a large shift ill the exchange rate ill creases as the time period is extended.
The probability of obtaining a small or large shift in the NZ/USD exchange rate is graphed for three and twelve month periods.
Graph 1
PROBABILITY OF CHANGE IN NZD/USD ",. ........ _--_ ... _--.--_.-..... ---_._--_ .... _.,--._---_._ ................ _ .... --... --.... --.. _._ .... .
10
1! ::l ..
DepreclaHon
!il f s " ; ~
t :]l
" " :r ~
SIC!.
'i '2 .2 d
C~nt!';Ch:m(J1'I
:ol .e ~
:;j
" '" I-Three Month Period ciT~~-";~ Month Period I
Appreciation
~
" ;;;
~ s ;;;
1! g
For intervals up to about three months the classic bell shaped curve applies. That is, the chances of a small shift in the NZD /USD are far greater than the chance of a large shift.
The bell shaped curve flattens as the interval for the comparison is extended i.e. a larger increase in the exchange rate is more likely between longer intervals.
The relative volatility of the NZD against other currencies is quite dependent on the particuiar currency and time period used for analysis.
Volatility over time influences the probability of the financial agreement being 'in or out of the money' .
WHAT IS A FOREIGN EXCHANGE AGREEMENT?
A foreign exchange agreement is a contractual arrangement between two parties with specific terms as to the amotmt of currency, the exchange rate and the timing of the deal. As the agreements are traded in their own right the underlying conditions in each contract are the same. The contract is not renegotiable once finalised.
Foreign exchange agreements have their own risks. Two common agreements are forward currency contracts (FCC) and foreign currency options (FCO).
The FCC is a simple contract that is either 'in or out of the money' at the close. The profit or loss is directly related to the difference between the contract price and the exchange rate at the close.
The FCO is more complex. The initial cost is higher but the risks are less but so are the rewards flosses.
THE PASS THROUGH RATE
The pass through rate indicates how much a shift in the relevant exchange rate might be expected to change the farm gate price. It is usually calculated on a percentage basis i.e. a 10% appreciation might result in a 15% reduction in the farm gate price.
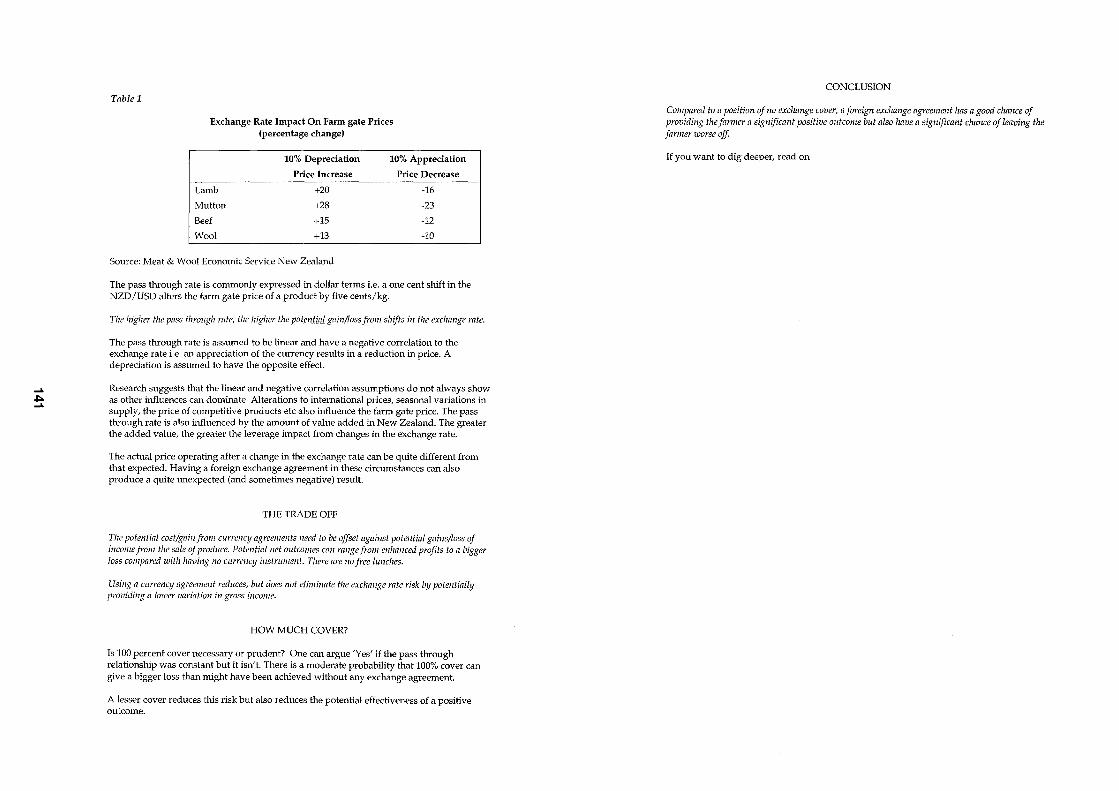
.....
.j:>. .....
Table 1
Exchange Rate Impact On Fann gate Prices (percentage change)
10% Depreciation 10% Appreciation
Price Increase Price Decrease
Lamb +20 -16
Mutton +28 -23
Beef +15 -12
Wool +13 -10
Source: Meat & Wool Economic Service New Zealand
The pass through rate is commonly expressed in dollar terms i.e. a one cent shift in the NZD /USD alters the farm gate price of a product by five cents/kg.
The higher the pass through rate, the higher the I'otential gain/loss from shifts in the exchange rate.
The pass through rate is asstUned to be linear and have a negative correlation to the exchange rate i.e. an appreciation of the currency results in a reduction in price. A depreciation is assumed to have the opposite effect.
Research suggests that the linear and negative correlation assumptions do not always show as other influences can dominate. Alterations to international prices, seasonal variations in supply, the price of competitive products etc also influence the farm gate price. The pass through rate is also influenced by the amount of value added in New Zealand. The greater the added value, the greater the leverage impact from changes in the exchange rate.
The actual price operating after a change in the exchange rate can be quite different from that expected. Having a foreign exchange agreement in these circumstances can also produce a quite lmexpected (and sometimes negative) resuit.
THE TRADE OFF
The potential cost/gain from cUlTency agreements need to be offset against potential gains/loss of income from the sale of produce. PotentiallIet olltcomes can range from enhanced profits to a bigger loss compared with having //0 currency instrummt. There are no free lunches.
Using a currency agreement reduces, but does not eliminate the exchange rate risk by pO/ell/ialiy pmviding a [moer variation in gross income.
HOW MUCH COVER?
Is 100 percent cover necessary or prudent? One can argue 'Yes' if the pass through relationship was constant but it isn't. There is a moderate probability that 100% cover can give a bigger loss than might have been achieved without any exchange agreement.
A lesser cover reduces this risk but also reduces the potential effectiveness of a positive outcome.
CONCLUSION
Compared to a position of no exchange cover, a foreign exchange agreement has a good chance of providing the farmer a significant positive outcome but also have a significant chance of leaving the farmer worse off.
If you want to dig deeper, read on
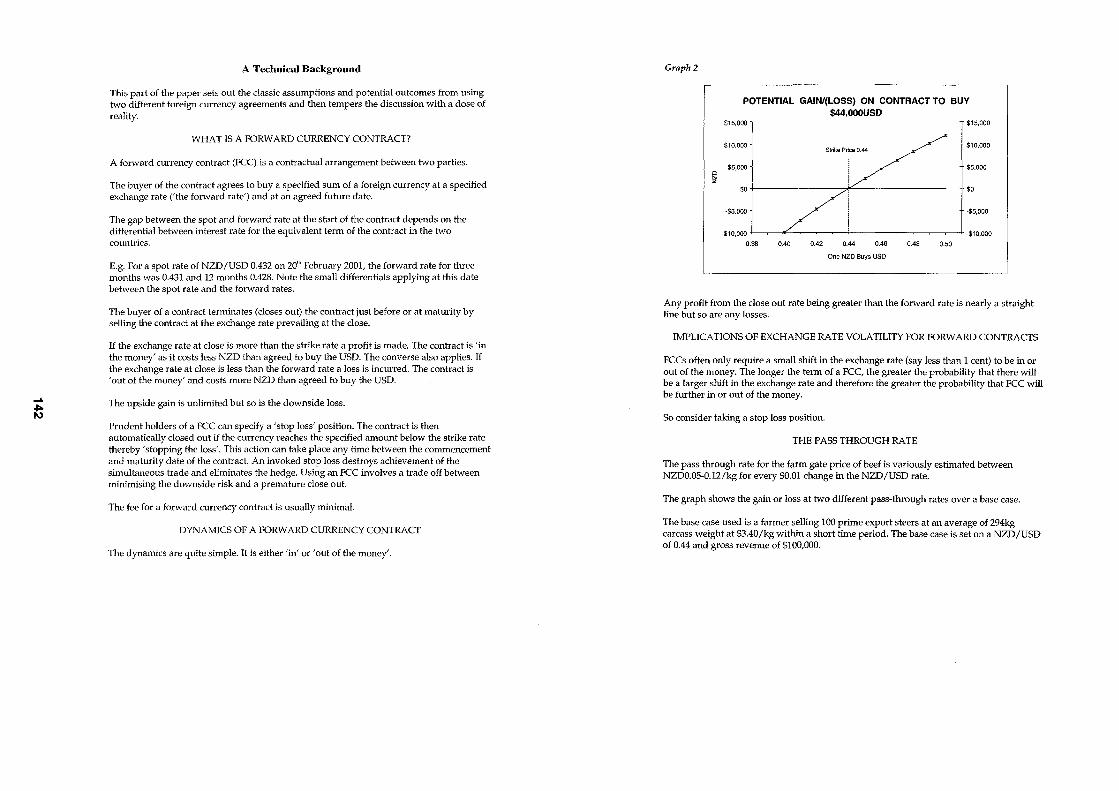
.... ~
A Technical Background
This part of the paper sets out the classic assumptions and potential outcomes from using two different foreign currency agreements and then tempers the discussion with a dose of reality.
WHAT IS A FORWARD CURRENCY CONTRACT?
A forward currency contract (FCC) is a contrachlal arrangement between two parties.
The buyer of the contract agrees to buy a specified Stun of a foreign currency at a specified exchange rate ('the forward rate') and at an agreed fuhlre date.
The gap between the spot and forward rate at the start of the contract depends on the differential between interest rate for the equivalent term of the contract in the two cOlUltries.
E.g. For a spot rate of NZD /USD 0.432 on 20'" February 2001, the forward rate for three months was 0.431 and 12 months 0.428. Note the small differentials applying at this date between the spot rate and the forward rates.
The buyer of a contract terminates (closes out) the contract just before or at maturity by selling the contract at the exchange rate prevailing at the close.
If the exchange rate at close is more than the strike rate a profit is made. The contract is 'in the money' as it costs less NZD than agreed to buy the USD. The converse also applies. If the exchange rate at close is less than the forward rate a loss is incurred. The contract is 'out of the money' and costs more NZD than agreed to buy the USD.
The upside gain is unlimited but so is the downside loss.
Prudent holders of a FCC can specify a 'stop loss' position. The contract is then automatically closed out if the currency reaches the specified amount below the strike rate thereby 'stopping the loss'. This action can take place any time between the commencement and maturity date of the contract. An invoked stop loss destroys achievement of the simultaneous trade and eliminates the hedge. Using an FCC involves a trade off between minimising the downside risk and a premature close out.
The fee for a forward currency contract is usually minimal.
DYNAMICS OF A FORWARD CURRENCY CONTRACT
The dynamics are quite simple. It is either 'in' or 'out of the money'.
Graplt2
c !;i
POTENTIAL GAIN/(LOSS) ON CONTRACT TO BUY $44,OOOUSD
$15,000 $15,000
$10,000 Strike Price 0.44
$10,000
$5,000 $5,000
$0 $0
·$5,000 '$S,OOO
·$10,000 ,.c I .$10,000
0.38 0.40 0.42 0.44 0.46 0.48 0.50
One NZO Buys USD
Any profit from the close out rate being greater than the forward rate is nearly a straight line but so are any losses.
IMPLICATIONS OF EXCHANGE RATE VOLATILITY FOR FORWARD CONTRACTS
FCCs often only require a small shift in the exchange rate (say less than 1 cent) to be in or out of the money. The longer the term of a FCC, the greater the probability that there will be a larger shift in the exchange rate and therefore the greater the probability that FCC will be further in or out of the money .
So consider taking a stop loss position.
THE PASS THROUGH RATE
The pass through rate for the farm gate price of beef is variously estimated between NZDO.05-0.12/kg for every $0.01 change in the NZD /USD rate.
The graph shows the gain or loss at two different pass-through rates over a base case.
The base case used is a farmer selling 100 prime export steers at an average of 294kg carcass weight at $3.40/kg within a short time period. The base case is set on a NZD /USD of 0.44 and gross revenue of $100,000.
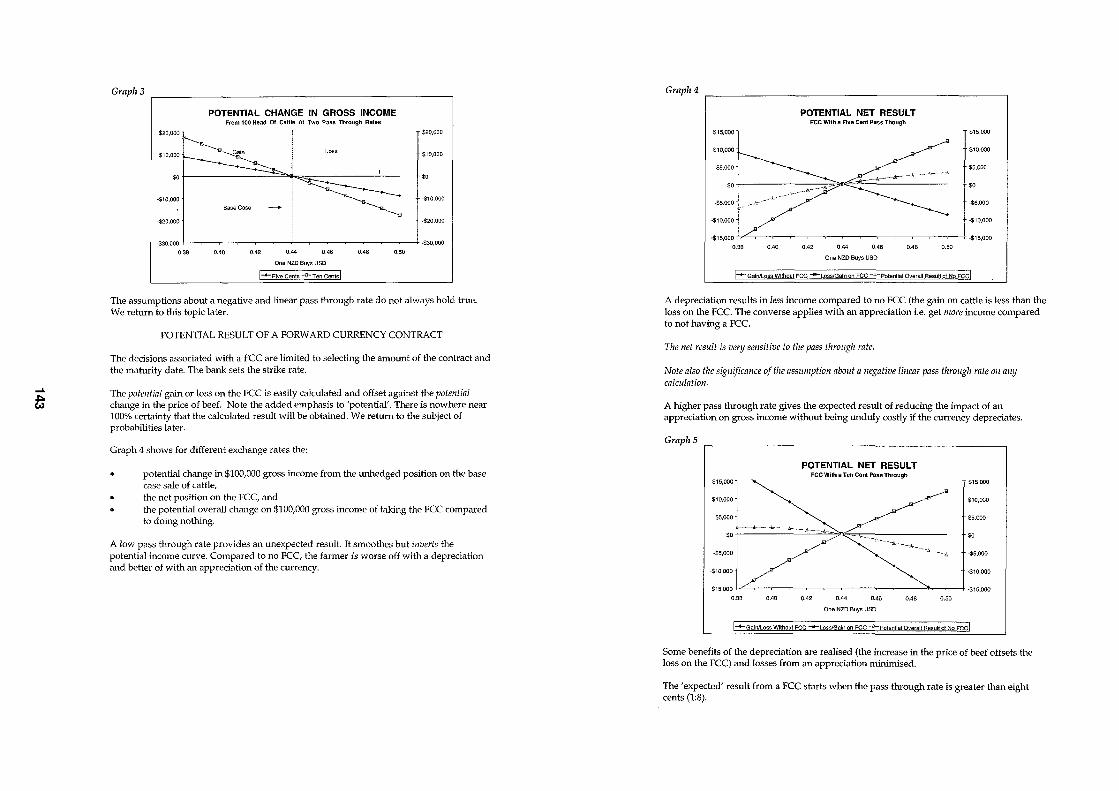
... t;
Graph 3
POTENTIAL CHANGE IN GROSS INCOME From H10 Head Of Cattle At Two Pass Through Rates
$20,000 $20.000
$10,000 Gain Loss $10,000
$0 I =-"'",,~ $0
-$10,000 -$10,000
Base Case
-$20,000 -$20,000
-$30,000 I 1 -$30,000
0.38 0040 0.42 0.44 0.46 0.48 0.50
One NZD Buys USD
[+Five Cents -G-Ten Cents I
The assumptions about a negative and linear pass through rate do not always hold true. We return to this topic later.
POTENTIAL RESULT OF A FORWARD CURRENCY CONTRACT
The decisions associated with a FCC are limited to selecting the amount of the contract and the maturity date. The bank sets the strike rate.
The potential gain or loss on the PCC is easily calculated and offset against the potl?l1tial change in the price of beef. Note the added emphasis to 'potential'. There is nowhere near 100% certainty that the calculated result will be obtained. We return to the subject of probabilities later.
Graph 4 shows for different exchange rates the:
potential change in $100,000 gross income from the unhedged position on the base case sale of cattie, the net position on the FCC, and the potential overall change on $100,000 gross income of taking the FCC compared to doing nothing.
A low pass through rate provides an unexpected result. It smoothes but inverts the potential income curve. Compared to no FCC, the farmer is worse off with a depreciation and better of with an appreciation of the currency.
Grap114
POTENTIAL NET RESULT FCC With a Five Cent Pass Though
$15,000 $15,000
$10,000 $10,000
$5,000
$01 ~ ~;~_4."_""':Q:"'~"'_''!'.''~'h-£'--'''''-'A $5,000
$0
·$5,000 -$5,000
-$10,000 -$10,000
-$15,000 I/'I -$15,000
0.38 OAO 0.42 0.44 0.46 0.48 0.50
One NZO Buys USD
I ........ GalnlLo~-Wlthoul FCC -s-l;;;;;G~~ on FCC ~;". Potential Overall Result cf N~-FCCl
A depreciation results in less income compared to no FCC (the gain on cattle is less than the loss on the FCC. The converse applies with an appreciation i.e. get more income compared to not having a FCC.
The net result is very sellsitive to the pass through rate.
Note also the significance of the assumption about a negative linear pass through rate on any calculation .
A higher pass through rate gives the expected result of reducing the impact of an appreciation on gross income without being unduly costly if the currency depreciates.
Graph 5
POTENTIAL NET RESULT FCC With a Ten Cent Pass TI1rough
$15,000 $15,000
$10,000 $10,000
$5,000 $5,000
$0 r,J,-",,", . "'A_. h"3><~",,"" $0
·$5,000 -$5,000
-$10,000 -$10,000
-$15,000 Ie.... I -$15,000
0.38 0.40 0.42 0.44 0.46 0.48 0.50
One NZD Buys USD
[~GafnILoss Without-F"CC-+LossiGain on FCC -"<l""POlentlal Overall Resultcf No Fccl
Some benefits of the depreciation are realised (the increase in the price of beef offsets the loss on the FCC) and losses from an appreciation minimised.
The' expected' result from a FCC starts when the pass through rate is greater than eight cents (1:8).
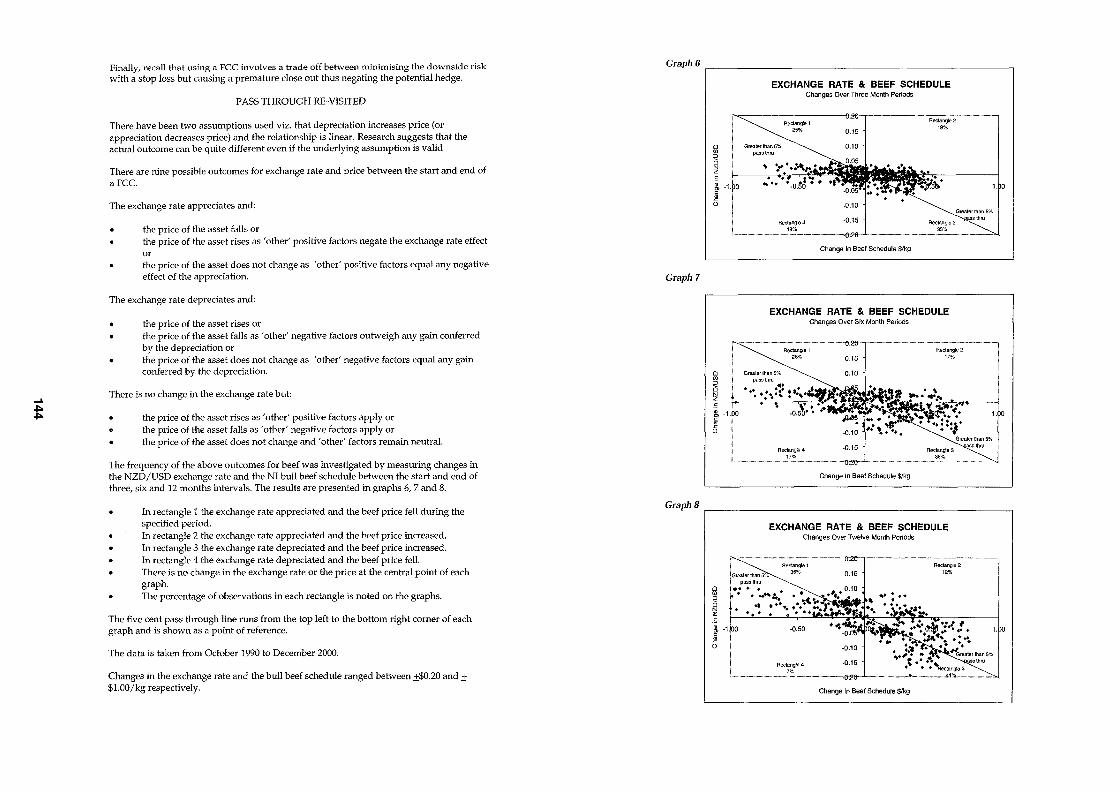
....
.j::o
.j::o
Finally, recall that using a FCC involves a trade off between minimising the downside risk with a stop loss but causing a premature close out thus negating the potential hedge.
PASS THROUGH RE-VISITED
There have been two assumptions used viz. that depreciation increases price (or appreciation decreases price) and the relationship is linear. Research suggests that the actual outcome can be quite different even if the tmderlying assumption is valid
There are nine possible outcomes for exchange rate and price between the start and end of a FCC.
The exchange rate appreciates and:
the price of the asset falls or the price of the asset rises as 'other' positive factors negate the exchange rate effect or the price of the asset does not change as 'other' positive factors equal any negative effect of the appreciation.
The exchange rate depreciates and:
the price of the asset rises or the price of the asset falls as 'other' negative factors outweigh any gain conferred by the depreciation or the price of the asset does not change as 'other' negative factors equal any gain conferred by the depreciation.
There is no change in the exchange rate but:
the price of the asset rises as 'other' positive factors apply or the price of the asset falls as 'other' negative factors apply or the price of the asset does not change and 'other' factors remain neutral.
The frequency of the above outcomes for beef was investigated by measuring changes in the NZD /USD exchange rate and the NI bull beef schedule between the start and end of three, six and 12 months intervals. The results are presented in graphs 6, 7 and 8.
In rectangle 1 the exchange rate appreciated and the beef price fell during the specified period. In rectangle 2 the exchange rate appreciated and the beef price increased. In rectangle 3 the exchange rate depreciated and the beef price increased. In rectangle 4 the exchange rate depreciated and the beef price fell. There is no change in the exchange rate or the price at the central point of each graph. The percentage of observations in each rectangle is noted on the graphs.
The five cent pass through line runs from the top left to the bottom right corner of each graph and is shown as a point of reference.
The data is taken from October 1990 to December 2000.
Changes in the exchange rate and the bull beef schedule ranged between ±$0.20 and ± $l.OO/kg respectively.
GraplJ 6 I----------------------~
Graph 7
GraphS
o Ul
~ N Z c
j U
0 Ul
~ N Z c
j -1.pO
0
EXCHANGE RATE & BEEF SCHEDULE Changes Over Three Month Periods
Grealerthan5% passthru
Rectangle 1 25%
Rectangle 4 19%
0.15
0.10
·0.10
·0.15
Change In Beef Schedule $Ikg
Reclangte2 19%
EXCHANGE RATE & BEEF SCHEDULE Changes Over Six Month Periods
Rectangle 1 Rectangle 2 28% 0.15 17%
Greaterlhan5%~ 0.10
-0.50·· • fiIJ~"" -~:~.~_ ... tii~A_ ,.~. ·0.10
1 .
Rectangle 4 ·0.15 ~erthan5%
ssthru Reclangle3
17% 3S%
Change In Beef Schedule $/kg
EXCHANGE RATE & BEEF SCHEDULE Changes Over Twelve Month Periods
-"'''-''O:2(t-.,·_·''·_''''''·''''''''-''''"-""""-.,, "-""-,,
i . iGrealerthan5% , passlhru
Rectangle 1 36% 0,,15
@ j-:.. . ~ r ... ~:.+ •• .#.+ 0.10
~ t· . +: •• + ......... ::-... ~. . .. . .. ~~".
i'1,60 B
-0.50
·0,,10
Rectlngle4 -0.15 7%
-'''''''-''''''-'''():2(t-''
Change In Beef Schedule $Ikg
Reclangle2 12%
1.
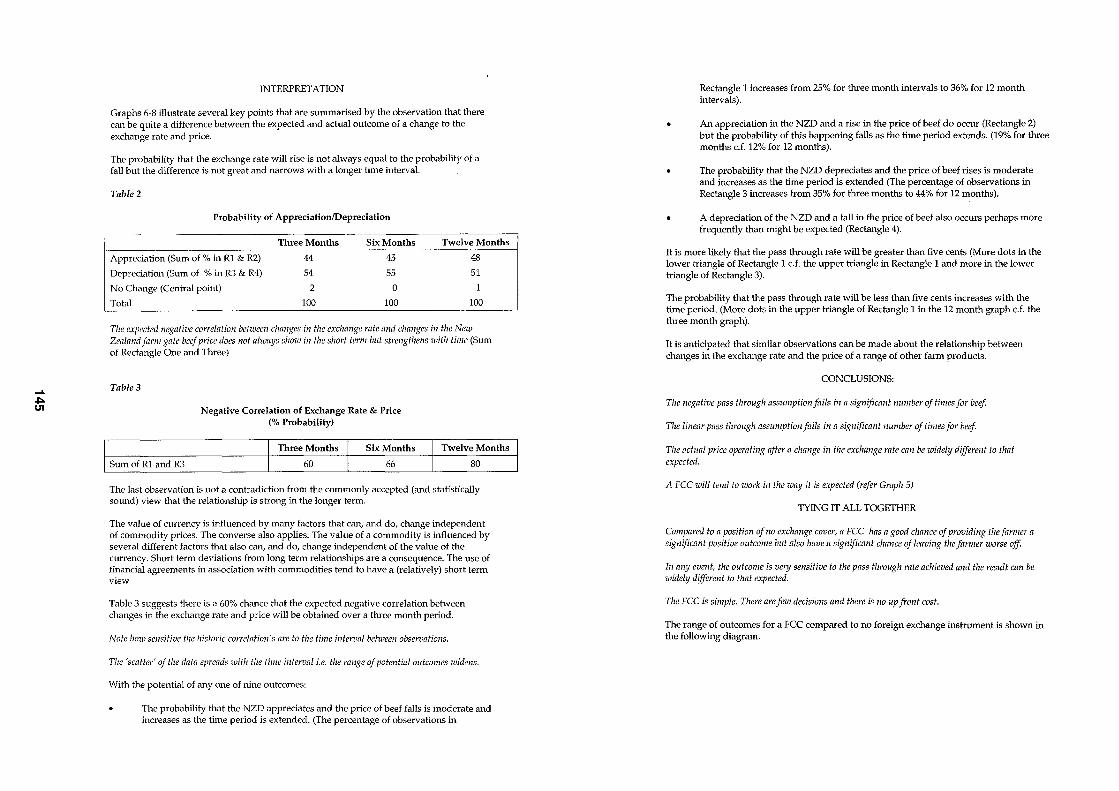
.....
.j::o. UI
INTERPRETATION
Graphs 6-8 illush'ate several key points that are summarised by the observation that there can be quite a difference between the expected and actual outcome of a change to the exchange rate and price.
The probability that the exchange rate will rise is not always equal to the probability of a fan but the difference is not great and narrows with a longer time interval.
Table 2
Probability of Appreciation/Depreciation
Three Months Six Months Twelve Months
Appreciation (Sum of % in R1 & R2) 44 45 48
Depreciation (Sum of % in R3 & R4) 54 55 51
No Change (Cenh'al point) 2 0
Total 100 100 100
The expected negative correlation betweC/l changes in the exchange rate and changes in the New Zealand faml gate beef price does I/Ot always show in the short term but strengthens with tillle (Sum of Rectangle One and Three)
Table 3
Negative Correlation of Exchange Rate & Price (% Probability)
Three Months Six Months Twelve Months
Stun of R1 and R3 60 66 80
The last observation is not a contradiction from the commonly accepted (and statistically sound) view that the relationship is strong in the longer term.
The value of currency is influenced by many factors that can, and do, change independent of commodity prices. The converse also applies. The value of a commodity is influenced by several different factors that also can, and do, change independent of the value of the currency. Short term deviations from long term relationships are a consequence. The use of financial agreements in association with commodities tend to have a (relatively) short term view
Table 3 suggests there is a 60% chance that the expected negative correlation between changes in the exchange rate and price will be obtained over a three month period.
Note how sC11sitive the historic correlation's are to the time interval between observations.
The 'scatter' of the data spreads with tile time interval i.e. Ihe Yange of polelltial outcomes widens.
With the potential of anyone of nine outcomes:
The probability that the NZD appreciates and the price of beef falls is moderate and increases as the time period is extended. (The percentage of observations in
Rectangle 1 increases from 25% for three month intervals to 36% for 12 month intervals).
An appreciation in the NZD and a rise in the price of beef do occur (Rectangle 2) but the probability of this happening falls as the time period extends. (19% for three months c.f. 12% for 12 months).
The probability that the NZD depreciates and the price of beef rises is moderate and increases as the time period is extended (The percentage of observations in Rectangle 3 increases from 35% for three months to 44% for 12 months).
A depreciation of the NZD and a fall in the price of beef also occurs perhaps more frequently than might be expected (Rectangle 4).
It is more likely that the pass through rate will be greater than five cents (More dots in the lower triangle of Rectangle 1 c.f. the upper triangle in Rectangle 1 and more in the lower triangle of Rectangle 3).
The probability that the pass through rate will be less than five cents increases with the time period. (More dots in the upper triangle of Rectangle 1 in the 12 month graph c.f. the three month graph).
It is anticipated that similar observations can be made about the relationship between changes in the exchange rate and the price of a range of other farm products.
CONCLUSIONS:
The negative pass through assumption fails in a significant number of times for beef
The linear pass through assumption fails in a significant number of times for beef.
The actual price operating after a change in the exchange rate can be widely different to that expected.
A FCC will tend to work in the way it is expected (refer Graph 5)
TYING IT ALL TOGETHER
Compared to a position of Ito exchange cover, a FCC has a good chance of providing the farmer a significant positive outcome but also have a significant chance of leaving the farmer worse off.
In any event, the outcome is very sensitive to the pass through rate achieved and the result can be widely different to that expected.
The FCC is simple. There are few decisions and there is no up front cost.
The range of outcomes for a FCC compared to no foreign exchange instrument is shown in the following diagram.
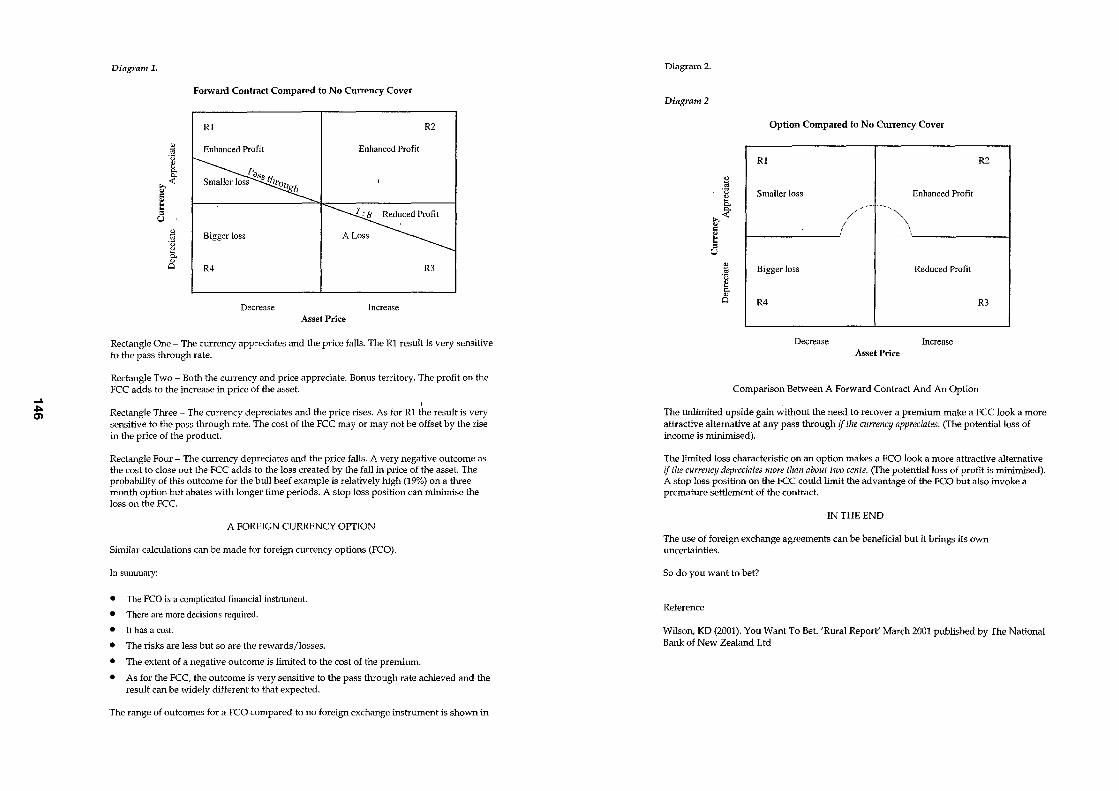
....
.a:en
Diagram 1.
Forward Contract Compared to No Currency Cover
RI R2
~ Enhanced Profit Enhanced Profit '13 [
... ~ " .: !:: .. = U
~ Bigger loss '13 [ " Ci R4 R3
Decrease Increase Asset Price
Rectangle One - The currency appreciates and the price falls. The Rl result is very sensitive to the pass through rate.
Rectangle Two - Both the currency and price appreciate. Bonus territory. The profit on the FCC adds to the increase in price of the asset.
1
Rectangle Three The currency depreciates and the price rises. As for Rl the result is very sensitive to the pass through rate. The cost of the FCC mayor may not be offset by the rise in the price of the product.
Rectangle Four - The currency depreciates and the price falls. A very negative outcome as the cost to close out the FCC adds to the loss created by the fall in price of the asset. The probability of this outcome for the bull beef example is relatively high (19%) on a three month option but abates with longer time periods. A stop loss position can minirnise the loss on the FCC.
A FOREIGN CURRENCY OPTION
Similar calculations can be made for foreign currency options (FCO).
In smrunary:
• The FCO is a complicated financial instrument.
• There are more decisions required.
• It has a cost.
• The risks are less but so are the rewards/losses.
• The extent of a negative outcome is limited to the cost of the premimn.
• As for the FCC, the outcome is very sensitive to the pass through rate acllieved and the result can be widely different to that expected.
The range of outcomes for a FCO compared to no foreign exchange instrument is shown in
Diagram 2.
Diagram 2
Option Compared to No Currency Cover
RI R2
~ '13 "
Smaller loss Enhanced Profit !:L <><
;. . ...: " .: " t:
// ....•.......... , ..............•. '\\
= U
~ '13
Bigger loss Reduced Profit
[ " Ci R4 R3
Decrease Increase Asset Price
Comparison Between A Forward Contract And An Option
The tmlirnited upside gain without the need to recover a premium make a FCC look a more attractive alternative at any pass through if the currency appreciates. (The potential loss of income is minimised).
The limited loss characteristic on an option makes a FCO look a more attractive alternative if the currency depreciates more than about two cents. (The potential loss of profit is minimised). A stop loss position on the FCC could limit the advantage of the FCO but also invoke a premature settlement of the contract.
IN THE END
The use of foreign exchange agreements can be beneficial but it brings its own uncertainties.
So do you want to bet?
Reference
Wilson, KD (2001). You Want To Bet. 'Rural Report' March 2001 published by The National Bank of New Zealand Ltd
.... :!:i
TARIFF-RATE QUOTAS: DIFFICULT TO MODEL OR PLAIN SIMPLE?
Phillip M. Bishop, Charles F. Nicholson, James E. Pratt, and Andrew M. Novakovic
bffiJjationJ;
Bishop is a Senior Economist at the NZ Institute of Economic Research (Inc.), phil. [email protected].
Nicholson and Pratt are Senior Research Associates in the Department of Applied Economics and Management, Cornell University, Ithaca NY 14853-7801.
Novakovic is the E.V. Baker Professor of Agricultural Economics in the Department of Applied Economics and Management, Cornell University, Ithaca NY 14853-7801.
Abstract
The "difficulty" of reliably and accurately incorporating tariff-rate quotas (TRQs) into trade models has received a lot of attention in recent years. As a result of the Uruguay Round of GATT negotiations, TRQs replaced an assortment of tariff and non-tariff instruments in an effort to standardise trade barriers, and facilitate their future liberalisation. Understanding the nuances ofTRQs is now paIticularly crucial for New Zealand because of the preferential access arrangements that New Zealand has for a number of products in highly protected markets such as the European Union, Japan, and the United States.
It has been aI'gued that TRQs aI'e complex instruments and aI'e difficult to model because for any trade flow between two countries, one of three regimes may be applicable:
1. The import quota may not be binding and the within-quota tariff applies;
2. The quota may be binding, the within-quota tariff applies, and a "quota rent" is created; or
3. Trade occurs over and above the quota, in which case an over-quota tariff applies (although, even in this regime, someone is still able to collect the quota rent on within-quota trade).
But even this chaI'acterisation, which many claim is too complex to model, is a major simplification of reality. Bilateral preferences are Ubiquitous, and such preferences are usually included in the determination of multilateral maI'ket access quotas. It is usual, therefore, that the TRQ instrument has several tiers to the quota schedule, plus a number of within- and over-quota taI'iff rates applicable on either a bilateral or a multilateral basis.
Further trade liberalisation creates something of a dilemma for New Zealand. Any decrease in over-quota tariffs and/or increase in quota levels potentially reduces the value of quota rents, many of which accrue to New Zealand due to the bilateral preferences. It is important, therefore, that New Zealand trade negotiators understand how much additional trade is required to offset the loss of New Zealand's quota rents. Modelling trade in the presence ofTRQs is the only way to ascertain this knowledge.
The purpose of this paper is to show that complex TRQs can be modelled very easily and precisely. The only catch is that the model must be formulated as a complementarity
problem rather than the more conventional linear or nonlinear optimisation problem. The concept will be demonstrated using a simple 3-region, single commodity spatial price equilibrium model of trade.
~words
Tariff-rate quota, trade modelling, mathematical programming, complementarity.
INTRODUCTION
The use of tariff-rate quotas (TRQs) is widespread, especially in agricultural and other primaI'y sector trade policy settings. Because a significant share of New Zealand's exports derive from such sectors, nnderstanding the nuances of TRQs as a trade policy instrument is of critical importance. For example, one question of interest at present is how further liberalisation of trade will impact New Zealand when the volume of that trade is constrained by TRQs. Analysing the trade-off between diminished quota rents and increased trade volumes is, potentially, a non-trivial undertaking. What's more, the problem is made even more difficult because the design and operation of most TRQs is not as straightforward as simple textbook illustrations would imply.
FOltunately, many of the extant trade models can be reformulated as mixed complementarity problems (MCPs), They are then capable of being used to analyse even the most complex ofTRQ instruments.
It is the purpose of this paper to demonstrate how complex TRQs can be effortlessly analysed within the context of a model formulated as an MCP. There is little that is original in this paper. Indeed, it draws upon a number of sources, in paIticular the material found in the first 8 or 9 pages of Ferris and Munson (2000), and Rutherford (1995). We hope the contribution of this paper is that some rather demanding material is presented in a format that enables it to be accessed by an audience it would not otherwise reach.
While the primary objective of the paper is to show how TRQs can be analysed, it also has a secondary objective. That is, to explain some of the jargon associated with optimisation models, mathematical prograIruning, and complementarity, and to reveal the role in the economist's analytical toolbox of models that employ such concepts.
The paper is organised as follows. We begin with what we call a 10-minute tour through optimisation theory. This section culminates with a brief discussion of the Kuhn-Tucker conditions, which enables us to then motivate the complementarity problem. We then change tack and present a series of small models. We staIt with a simple transportation problem and work up to a spatial price equilibrium model formulated as a mixed complementarity problem, which is coded using the GAMS software. The next section discusses the tariff-rate quota as a policy instrument. We conclude the paper by bringing it all together, incorporating tariff-rate quotas into a simple 3-region, single commodity trade model.
We make extensive use of snippets of GAMS code to demonstrate the models presented in this paper (Brooke et aI., 1998). The models presented herein are well within the dimension limitations of the free version of the GAMS softwaI'e that can be downloaded from www.gams.com.

.....
.j::o. 0)
Finally, we are aware that readers of this paper might be encountering some of this material for the first time. Hence, we tend to repeat ourselves in order to continually reiterate the key points. We hope that this is helpful rather than annoying.
A 10-MINUTE TOUR OF OPTIMISATION
Fundamental to most economic analysis is the notion of optimisation; consumers make choices so as to maximise utility, firms seek to maximise profits, nations search for ways to maximise GDP growth, and so on. Moreover, such optimisation problems usually have constraints associated with them. For example, consumers maximise utility subject to a budget constraint. In this paper we focus on models that find optimal solutions to economic problems. The key tools employed to do this fall under the rubric of mathematical programming. To be quite clear at the outset, we are not talking about statistical, or econometric, models, and nor are we talking about a set of simple accounting or arithmetic relationships that might be found in a spreadsheet application.
The purpose of this section is to very quickly introduce a few of the key concepts found in mathematical programming.' Later in the paper, we will use examples of simple but realistic models to further scrutinise these concepts. For now we are simply interested in establishing a convenient starting point, and in introducing some of the jargon.
Unconstrained optimisation
The simplest type of optimisation problem is one where we wish to find the extreme value (either a minimum or a maximum) of some function. In actual fact, a problem this simple does not even require the tools of mathematical programming; the classical techniques of differential calculus are all that is required.
Consider the following long-run average cost function:
AC=f(Q)=Q'-5Q+S (1)
Here we have a quadratic function, which when plotted will reveal a U-shaped curve with its lowest point OCCUlTIng when Q = 2.5. In other words, when Q = 2.5, AC will equal 1.75, representing the lowest value that this long-run average cost function can obtain. In this particular problem, we say that AC = f(Q) is the objective function and Q is the choice variable, or decision variable. There are no constraints to this problem, which implies we have an unconstrained optimisation problem. If our interest is in minimising the long-run average cost, then our task is to choose the appropriate level of the decision variable, Q, that is consistent with the objective function yielding its lowest possible value. We would follow the same procedure if there were more than one decision variable or if the problem was one to be maximised.
As an aside, one may restrict the domain of Q to be non-negative as it would make no sense to contemplate producing a negative amount of Q. However, we don't have to think of such a restriction as a constraint.
The standard approach to solving an unconstrained optimisation problem is to use the tools of differential calculus. In the case of our long-run average cost function, it will be recalled from high school calculus that we simply take the first derivative, set it equal to
I There are many good textbooks offering a comprehensive treatment of mathematical programming and its underlying theory. A gentle introduction is: Chiang, A. (1984). Fundamental methods ojmathematical economics (3,d edition), McGraw-Hili. Indeed, much of the material in this section on optimisation theory is drawn directly from Chiang.
zero, and solve for the level of Q. For example, lettingffQ) denote the first derivative of f, we have:'
f'(Q)=2Q-5 (2)
which, when set equal to zero, yields Q = 2.5.
This problem is easy because the function is quadratic, which means that it only has one turning point. A slightly more complicated problem is a cubic function, which has two turning points. For example,
y = f( x)= x3 -12x2 + 36x-S (3)
Taking the first derivative and setting it equal to zero yields two "roots", or levels at whichffx) = 0; namely x = 2 and x = 6. But now we need to determine which of these roots is associated with the maximum point and which is the minimum - we know that a cubic function will have one of each. We do this by taking the second derivatives, i.e. the first derivative of the first derivative. Armed with this information, we can then determine which way the function,f(x), is turning as x approaches 2 and 6. In other words, is the function concave or convex at these points? We will cease this exposition at this point as it can be reviewed in any elementary calculus textbook. Suffice it to say that the theory of unconstrained optimisation generalises to nth-degree polynomial functions.
Before turning to constrained optimisation though, it is worth noting a couple of final points. First, one needs to be careful about refeITing to extreme points as maximum or minimum points of the primitive function. They should more properly be refeITed to as relative (or local) extrema, as a function may have several extreme points, some of which may be maxima while others are minima. Only one of each can be the global (in contrast to the local) maximum or minimum. And some points at which the first derivative equals zero may fall into a third category, points of inflection.
Second, differential calculus has been used to derive a universal set of necessary and sufficient conditions. These conditions, or rules, can easily be applied to any function to determine the status of all stationary points. That is, all points where the first derivative or the slope of the function is zero. The necessary conditions are based on the first derivatives and are therefore refeITed to as the first-order conditions. Likewise, the sufficient conditions are based on the second derivatives, and are refeITed to as secondorder conditions.
Optimisation with equality constraints
It is nearly always the case in economics that some limiting factor(s) impinges upon the choices we are able to make when trying to solve any given optimisation problem. An obvious example is when firms set out to maximise profits; they are constrained by the need to employ the available technology. Hence it is necessary to have a technique available for solving constrained optimisation problems. The standard method is that of Lagrange multipliers. The essence of the Lagrange multiplier method is to convert the constrained optimisation problem into a form where the first-order conditions of the unconstrained problem can still be applied.
By way of example, consider the utility function
2 Whereasj'is termed the derivative function, the original function,J, is sometimes referred to as the primitive function.
......
.j::o. CD
U =XjX2 +2xj
and the budget constraint given by
4xj +2X2 =60
(4)
(5)
The first step in employing the method of Lagrange multipliers is to write down what is termed the Lagrangian function:
Z =x,x2 +2x, +A(60-4x,-2x2 ) (6)
This is nothing more than a modified version of the primitive objective function that incorporates the constraint (or constraints if there is more than one).3 Z is now the objective function value, i.e. the value we are trying to optimise (maximise in this case). The symbol A is called the Lagrange multiplier and represents an as yet undetermined number. Notice how the constraint was rearranged when we wrote out the Lagrangian function. If we can be assured that the constraint will be satisfied, then the expression inside the brackets in our Lagrangian function goes to zero, and the entire last term of equation (6) vanishes, regardless of the value of A. With the constraint thus dispensed with, we could then seek thefree (unconstrained) value ofZ in lieu of the constrained value ofU. The question, then, is how do we make the term in parentheses in equation (6) vanish?
The tactic employed by the method of Lagrange multipliers is to treat A as an additional variable in (6). That is, consider Z to be a function not only of Xj and X2, but also of A, e.g. Z = Z(A, XI, X2). The first-order conditions for the free extremum (i.e. maximum in this case) will now consist of a set of simultaneous equations:
Z, ==dZ/dA = 60-4x, -2X2 = 0
ZI == dZ/dxj = X2 + 2-4A = 0
Z2 ==dZ/dx2 =xl -2A=O
(FOC 1)
So, by taking the first derivative of Z with respect to each of the three variables, and by setting each derivative to be equal to zero, we have generated the first-order conditions. They are nothing more than a set of 3 unknowns and 3 equations. But significantly, the first of the three equations in (FOC I), i.e. Z1-, gives us the assurance that the last term in equation (6) will vanish. It is a simple matter to solve this system and find that A = 4, XI = 8, and X2 = 14.' Putting these values into equations (6) and (4) yields, respectively, Z = 128 and U = 128.
For our present purposes, we need not take this discussion any further; we are now ready to consider problems with inequality constraints. Chapter 12 of Chiang (1984) covers optimisation with equality constraints in much greater detail and is worth reviewing. For example, it covers such topics as the interpretation of the Lagrange multiplier, the n-
J When there is more than one constraint, the Lagrangian function would have a distinct Ie associated with each one.
4 For example, rearrange Z2 to yield Ie = O.5x,. Then substitute this expression for Ie into Z, yielding X2 + 2 - 4(O.5x,) = O. Rearranging this gives X2 = 2x, - 2, which we can then substitute into ZA' Rearranging the result of that gives us x, = 8. If x, = 8, then z" must imply that Ie = 4, and finally, putting Ie = 4 into Z, reveals that X2 = 14.
variable and m-constraint case, second-order conditions, and the significance of testing for concavity and convexity.
Optimisation with inequality constraints
Thus far in our quick tour through optimisation theory we have been able to confine ourselves to using the methods of classical optimisation, i.e. techniques based on differential calculus. In order to tackle problems with inequality constraints, and for some other reasons that will become obvious shortly, we now need to move into the realm of nonclassical methods. Mathematical programming, which includes (among other topics) linear programming, nonlinear programming, and complementarity methods, is the name given to this collection of nonclassical solution techniques. Clearly the introduction of inequality constraints enables more interesting and realistic problems to be contemplated.
The specific models we get to later in the paper deal with problems containing inequality constraints. Hence we will not belabour their presentation at this juncture. What we wish to do in this section is introduce the Kuhn-Tucker conditions, and then provide a brief introduction to the mixed complementarity problem.
The types of problems encountered in classical optimisation have three key characteristics:
• They contain no explicit restrictions on the sign of the choice variables;
• They contain no inequality constraints; and
• The first-order conditions for a relative or local extremum is simply that the first partial derivatives of the Lagrangian function with respect to all choice variables and the Lagrange multipliers be zero. In other words, we are restricted to situations where there are no boundary or corner solutions. Stated differently, we have only interior solutions.
Mathematical programming methods enable us to find solutions to problems where one or all of these characteristics are not present.
The Kuhn-Tucker conditions:
The single most important result in nonlinear programming is the Kuhn-Tucker conditions (Kuhn and Tucker, 1951). These conditions can be thought of as the nonlinear programming equivalent of the classical first-order conditions. As we shall see, the KuhnTucker method generalises the first-order conditions for an equilibrium to a set of boundary conditions for finding an equilibrium. But unlike those classical conditions, the Kuhn-Tucker conditions cannot be accorded the status of necessary conditions, unless a certain proviso is satisfied.' However, in specific circumstances, the Kuhn-Tucker conditions turn out to be sufficient conditions, or even necessary and sufficient conditions as well.
At this point we are going to do little more than present the derivation of the KuhnTucker conditions. Their relevance will become clearer later in the paper. Our primary
5 That proviso is called the constraint qualification. lt imposes a certain restriction on the constraint functions of a nonlinear program so that irregularities on the boundary of the feasible set don't invalidate the Kuhn-Tucker conditions, should the optimal solution occur at that boundary. While the constraint qualification is impOltant to the theory of nonlinear programming, and to the Kuhn-Tucker sufficiency theorem, we are not going to discuss it in this paper. A nonlinear progrmmning text should be consulted for fu,ther information.
.... (J1 o
reason for presenting them at all is because they provide a bridge from the theory of constrained optimisation to the mixed complementarity problem.
Consider the following generic optimisation problem, which incorporates two constraint functions and explicit nonnegativity conditions:
Maximise 7r = f(xl'xo,xJ
subject to gl (Xl' x,, x}):s; Ij
g'(xI'XZ'X}):S; '2
X 1,X2 ,X3 :2:0
(NLP 1)
We can imagine that f and gl, say, are nonlinear functions. Hence we call this problem (NLP 1) for NonLinear Erogram. As before, we can write the Lagrangian function for this problem:
Z = f(x l ,x"X3 )+ A,1(lj - gl(XI'X"xJ)+ A?(r, - g'(xl'x"x,)) (7)
The resulting Kuhn-Tucker conditions can be stated compactly as follows (or more accurately, one version of the Kuhn-Tucker conditions, expressed in terms of the Lagrangian function Z, can be stated this way):
oZ < 0 > 0 d oZ - 0 \-I • -1 ') 3 - _, Xj _, an Xj - v J - ,_, oXj ox;
oZ > 0 Ii! > 0 d Ii! oZ - 0 'd . - I 2 ali! -, -, an ax - 1 - ,
What do these six expressions comprising the Kuhn-Tucker conditions tell us?
(KT 1)
First of all, two of the six expressions are nothing more than a restatement of paliS of the original problem, i.e. Xj ~ 0 simply restates the nonnegativity conditions for the three primal variables. Similarly, OZ!OAi ~ 0 reiterates the constraints, i.e. one such condition for each of the two constraints. But notice that associated with each variable type, i.e. the choice variables (Xj) and the Lagrange multipliers (Ai), there is a corresponding marginal condition that must be satisfied by the optimal solution:
Finally, there is what is known as the complementary slackness conditions, i.e. the last two expressions on each line of (KT I), which simply state that the product of two terms must equate to zero. In other words, each variable is characterised by complementary slackness in relation to a pal1icular partial derivative of the Lagrangian function Z. And what does this mean? It means that for each Xj, we must find in the optimal solution that either:
• The marginal condition holds with a strict equality (as in the classical context); or
• The choice val'iable in question must take on a zero value; or
• Both of the above.
(, In case it is not yet apparent, it is worth noting at this point that the first-order conditions, of both constrained and unconstrained optimisation problems, describe a set of equations that must hold true at the equilibrium or optimal solution. They are sometimes thus refened to as thefi"'t-order equilibrium conditions. So, we have two ways to describe the problem; the underlying optimisation problem, and a set of conditions that characteIise (Le. must hold u'ue) a solution to the 1l1lderIying optimisation problem.
Analogously, for each ,,}, we must find in the optimal solution that either the associated marginal condition holds as an equality - meaning that the r constraint is satisfied exactly - or the Lagrange multiplier vanishes, i.e. becomes zero, or both.
It is by exploiting the complementary slackness conditions that it becomes possible to find corner or boundary solutions. Of significance in the case of models that explicitly incorporate tariff-rate quotas, it is the property that enables endogenous regime switching to occur. In fact, short of exploiting complementary slackness, there exists no other way to explicitly model such behaviour.' We will return to this point later.
Before we turn to the mixed complementarity problem, we would point out that the Kuhn-Tucker conditions give rise to a natural economic interpretation. The Lagrange multipliers can be regarded as shadow prices. Thus, the Kuhn-Tucker conditions tell us that, in an optimal solution, when a constraint holds with a strict inequality, then by complementary slackness, the associated shadow price must be zero. Similarly, if an activity level (e.g. a primal variable) is strictly greater than zero, then the associated marginal condition must hold with a strict equality. We will return to this in some detail shortly.
The Mixed Complementarity Problem (MCP):
Now that we have understood the Kuhn-Tucker conditions, we are ready to examine complementarity. A nonlinear complementarity problem consists of a system of simultaneous (linear or nonlinear) equations that are written as inequalities and are linked to bounded variables in a manner that encapsulates complementary slackness relationships. In a mixed complementarity problem (MCP), the equations may be a mixture of inequalities and strict equalities. For more rigorous details and a mathematical definition, see Rutherford (1995) .
It is possible to rewrite (KT I) in accordance with this definition, and thereby transform (NLP I) into an equivalent MCP. However, the generic nature ofthe problem specified in NLP 1 means that the expression for the equivalent MCP may well be confusing for the novice. To avoid this possibility, we would prefer to derive an MCP using a specific example, and shall do so shortly.
Before leaving this section, however, we would make a few general comments relating to MCPs.
The underlying theory of complementarity, and the closely related variational inequality was developed in the I 960s, e.g. see Cottle et aI., 1992; Lemke and Howson, 1964; Hartman and Stampacchia, 1966. For a thorough review, see Harker and Pang (1990). It was not until much later that commercially available algorithms capable of solving large scale complementarity problems became available, e.g. see Rutherford (1993) and Dirkse and Ferris (1993). The solver we use is called PATH (Dirkse and Ferris, 1993), which is seamlessly linked with the GAMS modelling software (Brooke et aI., 1998).
As noted earlier, the equilibrium conditions that characterise an underlying optimisation problem are an alternative way of expressing that problem. But there are some problems that can be formulated as an MCP for which there is no equivalent underlying optimisation problem. Such problems arise frequently in economics. Hence, the MCP offers the modeller greater choice and flexibility than traditional NLP formulations. A pertinent case in point is the explicit treatment of tariff-rate quotas, which requires a
7 There are, of course, techniques for approximatillg regime switching that don't require complementarity.
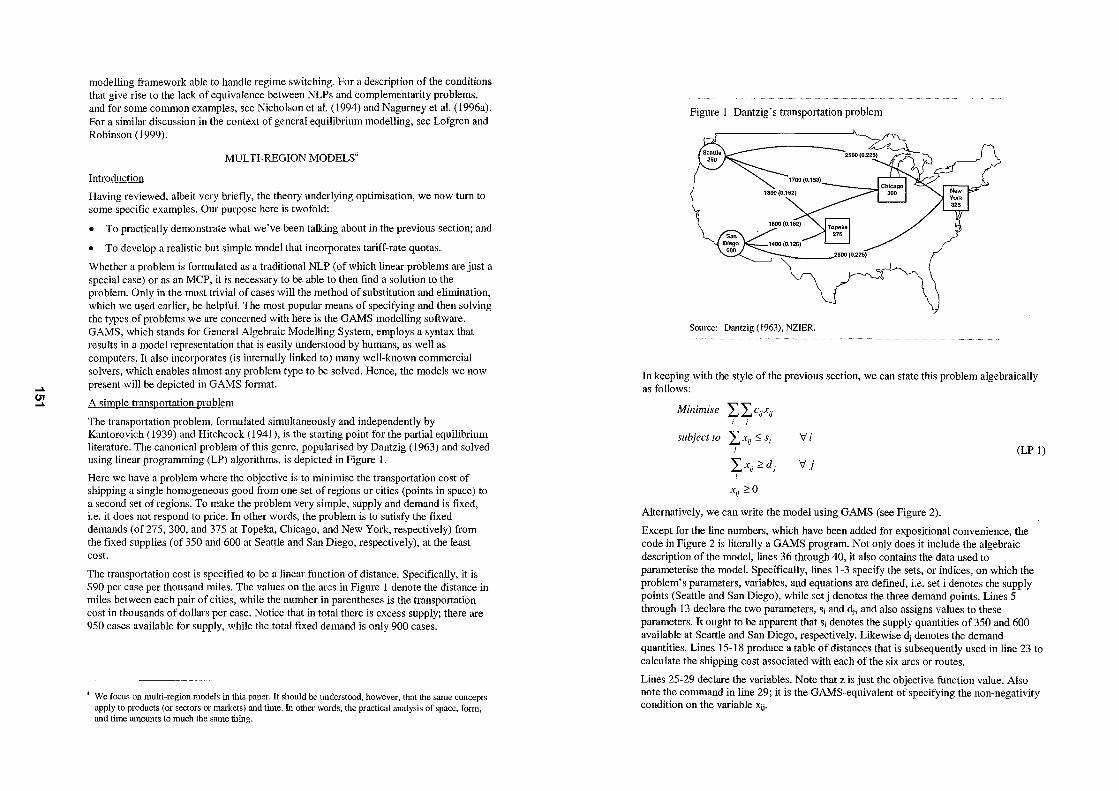
..... U1 .....
modelling framework able to handle regime switching. For a description of the conditions that give rise to the lack of equivalence between NLPs and complementarity problems, and for some common examples, see Nicholson et al. (1994) and Nagurney et al. (1996a). For a similar discussion in the context of general equilibrium modelling, see Lofgren and Robinson (1999).
MULTI-REGION MODELS'
Intro~l!£tion
Having reviewed, albeit very briefly, the theory underlying optimisation, we now turn to some specific examples. Our purpose here is twofold:
• To practically demonstrate what we've been talking about in the previous section; and
• To develop a realistic but simple model that incorporates tariff-rate quotas.
Whether a problem is formulated as a traditional NLP (of which linear problems are just a special case) or as an MCP, it is necessary to be able to then find a solution to the problem. Only in the most trivial of cases will the method of substitution and elimination, which we used earlier, be helpful. The most popular means of specifying and then solving the types of problems we are concerned with here is the GAMS modelling software. GAMS, which stands for General Algebraic Modelling System, employs a syntax that results in a model representation that is easily understood by humans, as well as computers. It also incorporates (is internally linked to) many well-known commercial solvers, which enables almost any problem type to be solved. Hence, the models we now present will be depicted in GAMS format.
A simple transportation problem
The transportation problem, formulated simultaneously and independently by Kantorovich (1939) and Hitchcock (1941), is the starting point for the pattial equilibrium literature. The canonical problem of this genre, popularised by Dantzig (1963) and solved using linear programming (LP) algorithms, is depicted in Figure 1.
Here we have a problem where the objective is to minimise the transportation cost of shipping a single homogeneous good from one set of regions or cities (points in space) to a second set of regions. To make the problem very simple, supply and demand is fixed, i.e. it does not respond to price. In other words, the problem is to satisfy the fixed demands (of275, 300, and 375 at Topeka, Chicago, and New York, respectively) from the fixed supplies (of 350 and 600 at Seattle and San Diego, respectively), at the least cost.
The transpoltation cost is specified to be a lineat· function of distance. Specifically, it is $90 per case per thousand miles. The values on the at·cs in Figure 1 denote the distance in miles between each pair of cities, while the number in parentheses is the transportation cost in thousands of dollars per case. Notice that in total there is excess supply; there are 950 cases available for supply, while the total fixed demand is only 900 cases.
, We focus on multi-region models in this paper. It should be understood, however. that the same concepts apply to products (or sectors or markets) and time. In other words, the practical analysis of space, form. and time amounts to much the same thing.
Figure I Dantzig's transpOltation problem
Source: Dantzig (1963), NZIER.
In keeping with the style of the previous section, we can state this problem algebraically as follows:
Minimise LLcijxij i j
subject to LXij:;:; Sj Vi j (LP I)
LXij ? d j Vj
Xij ? 0
Alternatively, we can write the model using GAMS (see Figure 2).
Except for the line numbers, which have been added for expositional convenience, the code in Figure 2 is literally a GAMS program. Not only does it include the algebraic description of the model, lines 36 through 40, it also contains the data used to parameterise the model. Specifically, lines 1-3 specify the sets, or indices, on which the problem's parameters, variables, and equations are defined, i.e. set i denotes the supply points (Seattle and San Diego), while set j denotes the three demand points. Lines 5 through 13 declare the two parameters, Si and dj, and also assigns values to these parameters. It ought to be apparent that Si denotes the supply quantities of 350 and 600 available at Seattle and San Diego, respectively. Likewise dj denotes the demand quantities. Lines 15-18 produce a table of distances that is subsequently used in line 23 to calculate the shipping cost associated with each of the six arcs or routes.
Lines 25-29 declare the variables. Note that z is just the objective function value. Also note the command in line 29; it is the GAMS-equivalent of specifying the non-negativity condition on the variable Xij.
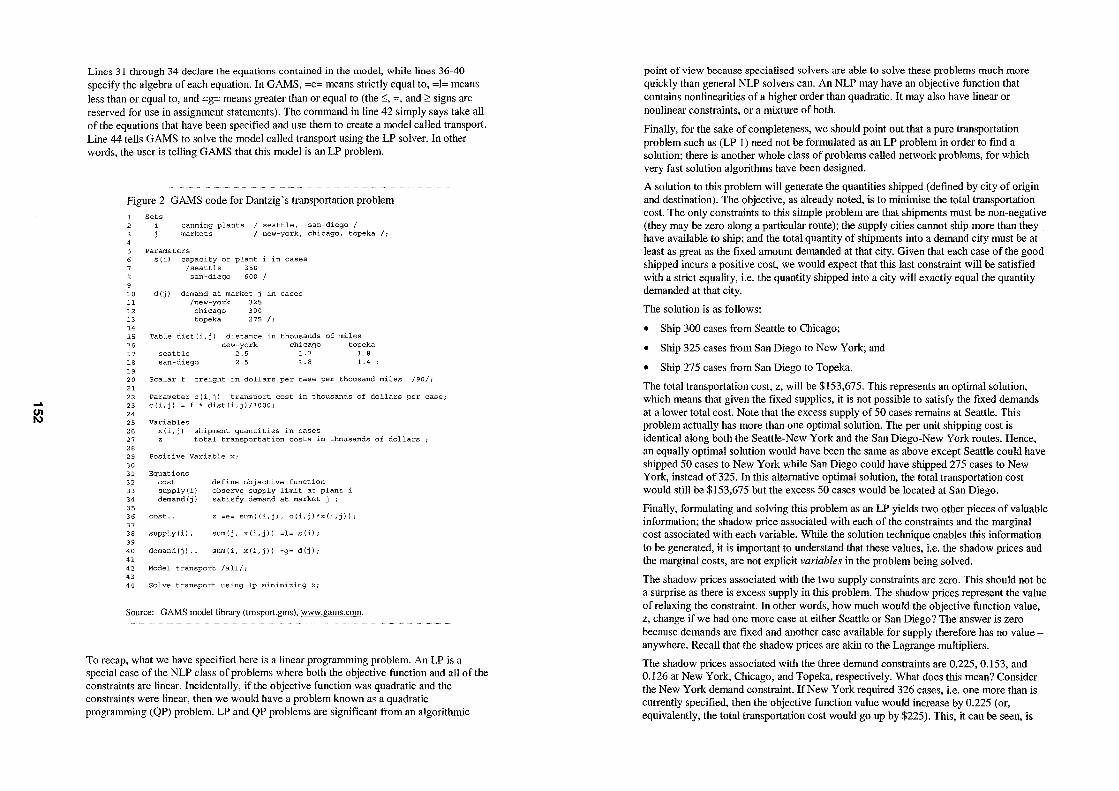
.... en I\)
Lines 31 through 34 declare the equations contained in the model, while lines 36-40 specify the algebra of each equation. In GAMS, =e= means strictly equal to, =1= means less than or equal to, and =g= means greater than or equal to (the :0;, =, and ~ signs are reserved for use in assignment statements). The command in line 42 simply says take all of the equations that have been specified and use them to create a model called transport. Line 44 tells GAMS to solve the model called transport using the LP solver. In other words, the user is telling GAMS that this model is an LP problem.
Figure 2 GAMS code for Dantzig's transportation problem
10 11 12 13 14 lS 16 17
18 19 20 21
22 23 24 2S 26 27 28 29 30 31 32 33 34 35 36 37 38 39 40 41
42 43 44
Sets canning plants seattle, san-diego / markets new-york, chicago, topeka /;
Parameters s (il capacity of plant i in cases
/seattle 350 san-diego 600
dlj) demand at market j in cases /new-york 32S chicago 300 topeka 275 I;
Table dist (i, j) distance in thousands of miles new-york chicago topeka
seattle 2.5 1.7 1.8 san-diego 2.5 1.8 1.4 ;
Scalar f freight in dollars per case per thousand miles /90/ i
Parameter c (i I j) transport cost in thousands of dollars per case; c{i,j} = f * dist(i,j)/lOOOi
Variables x (i I j) shipment quanti ties in cases
total transportation costs in thousands of dollars
Positi ve Variable Xi
Equations cost define objective function supply (il observe supply limit at plant demand(j) satisfy demand at market j ;
cost.. z =e= sum ( (i , j) I c (i , j) *x(i , j)};
supply(i}.. sum(j, x(i/j» =1= s(i) i
demand(j) . . sum (i , X (i, j» =9= d (j) i
Model transport /all!;
Solve transport using lp minimizing Zi
Source: GAMS model library (trnsport.gms), ~~;]ms.com.
To recap, what we have specified here is a linear programming problem. An LP is a special case of the NLP class of problems where both the objective function and all of the constraints are linear. Incidentally, if the objective function was quadratic and the constraints were linear, then we would have a problem known as a quadratic programming (QP) problem. LP and QP problems are significant from an algorithmic
point of view because specialised solvers are able to solve these problems much more quickly than general NLP solvers can. An NLP may have an objective function that contains nonlinearities of a higher order than quadratic. It may also have linear or nonlinear constraints, or a mixture of both.
Finally, for the sake of completeness, we should point out that a pure transportation problem such as (LP I) need not be formulated as an LP problem in order to find a solution; there is another whole class of problems called network problems, for which very fast solution algorithms have been designed.
A solution to this problem will generate the quantities shipped (defined by city of origin and destination). The objective, as already noted, is to minimise the total transportation cost. The only constraints to this simple problem are that shipments must be non-negative (they may be zero along a particular route); the supply cities cannot ship more than they have available to ship; and the total quantity of shipments into a demand city must be at least as great as the fixed amount demanded at that city. Given that each case of the good shipped incurs a positive cost, we would expect that this last constraint will be satisfied with a strict equality, i.e. the quantity shipped into a city will exactly equal the quantity demanded at that city.
The solution is as follows:
• Ship 300 cases from Seattle to Chicago;
• Ship 325 cases from San Diego to New York; and
• Ship 275 cases from San Diego to Topeka.
The total transportation cost, z, will be $153,675. This represents an optimal solution, which means that given the fixed supplies, it is not possible to satisfy the fixed demands at a lower total cost. Note that the excess supply of 50 cases remains at Seattle. This problem actually has more than one optimal solution. The per unit shipping cost is identical along both the Seattle-New York and the San Diego-New York routes. Hence, an equally optimal solution would have been the same as above except Seattle could have shipped 50 cases to New York while San Diego could have shipped 275 cases to New York, instead of 325. In this alternative optimal solution, the total transportation cost would still be $153,675 but the excess 50 cases would be located at San Diego.
Finally, formulating and solving this problem as an LP yields two other pieces of valuable information; the shadow price associated with each of the constraints and the marginal cost associated with each variable. While the solution technique enables this information to be generated, it is important to understand that these values, i.e. the shadow prices and the marginal costs, are not explicit variables in the problem being solved.
The shadow prices associated with the two supply constraints are zero. This should not be a surprise as there is excess supply in this problem. The shadow prices represent the value of relaxing the constraint. In other words, how much would the objective function value, z, change if we had one more case at either Seattle or San Diego? The answer is zero because demands are fixed and another case available for supply therefore has no valueanywhere. Recall that the shadow prices are akin to the Lagrange multipliers.
The shadow prices associated with the three demand constraints are 0.225, 0.153, and 0.126 at New York, Chicago, and Topeka, respectively. What does this mean? Consider the New York demand constraint. If New York required 326 cases, i.e. one more than is currently specified, then the objective function value would increase by 0.225 (or, equivalently, the total transportation cost would go up by $225). This, it can be seen, is
.... C1I Co)
nothing more than the cost of getting another case from Seattle, the point at which there exists excess supply.
The marginal costs associated with the six variables are zero, except for along the SeattleTopeka arc where it is 0.036, and along the San Diego-Chicago arc where the marginal cost is 0.009.' What does this mean? It means that it is optimal to send nothing from Seattle to Topeka and from San Diego to Chicago. But if you insisted on sending just one case along these arcs, it would add $36 and $9, respectively, to the optimal (minimum) total transportation cost.
The transportation problem as a Linear Complementarity Problem (LCpf"
There is no compelling reason why the transportation problem shown above should be formulated and solved as a complementarity problem. Nevertheless, we will do it so as to explicitly relate the complementarity problem back to a simple LP. We will then move on to a model that includes price responsive supply and demand functions.
Consider the simple transpOltation problem as specified in (LP 1). As we've just seen, this problem can be solved as a linear program. But let's go back to the theory we discussed earlier. The derivation of the optimality conditions for this problem begins by associating with each constraint a multiplier, alternatively termed a shadow price or dual variable. These multipliers represent the marginal price on changes to the corresponding constraint. Instead of the AS we used earlier, let's label the prices on the supply constraint p' and those on the demand constraint pd.
Intuitively, for each supply node i we have:
0 <, d >" - Pi an Sj _ £,xij (8)
In other words, supply prices cannot be negative and the quantity available for supply at a particular location must be greater than or equal to the sum of all shipments out of that location.
Consider what happens when Sj > Ljxjj, i.e. supply is strictly greater than the sum of the shipments. In a competitive setting, no rational person would be willing to pay for more supply at location i; it is already oversupplied. Therefore p' at that location would be zero. Alternatively, when Sj = Ljxjj, that is the market clears, one might be willing to pay for some additional supply of the good. Therefore pS"? O. We can write these two conditions succinctly as:
O:o:,Pi'.1s;"?Lxij 'v'i (9)
where the ".1" symbol is understood to mean that at least one of the adjacent inequalities must be satisfied as a strict equality, i.e. either p' = 0 or Sj = Ljxjj. This is nothing more than a formal statement of the complementary slackness result that we saw earlier when presenting the Kuhn-Tucker conditions.
We can go through a similar logic with respect to the demand markets and derive the complementarity relationship:
, Not counting the objective function variable, z, whose marginal cost is zero, there are six variables in this model, i.e. i = 2 times.i = 3 equals 6, and x is defined on i and j.
10 This section draws heavily on Ferris and Munson, 2000.
O:o:,p1.1"2>ij"?d j 'v'j
In other words, if shipments into a demand location were to exceed the quantity demanded, then we'd expect the demand price to be driven down to zero.
(10)
Also, from basic intuition, we know that the supply price at i plus the transportation cost cij from i to j must exceed the market price at j:
Pi' +cij"? p1 (11)
This, as we'll see later in the paper, is just a statement of a simple spatial price equilibrium (SPE) condition. If this condition was not true, then in a competitive market place, another producer could replicate supplier i and thereby increase the supply of the good, which in turn would drive down the market price. This process would continue until the inequality condition (II) was restored. Furthermore, if (II) held with a strict inequality, i.e. the cost of delivery (supply price plus the transp0l1ation cost) exceeded the market price, then nothing would be shipped from i to j because doing so would incur a loss. In such a circumstance, it is clear that xij = O. Therefore,
0:0:, Xo .1 Pi' + cij "? p1 'v'i,j (12)
We can combine (9), (10), and (12) into a single problem:
0:0:, PI' .1s;"? ~>ij 'v'i
O:o:,pf.1LXij"?d j 'v'j (LCP I)
O:o:,Xij.1p;'+cij"?pf'v'i,j
(LCP I) defines a linear complementarity problem that should, by now, be easily recognised as the complementary slackness conditions associated with (LP 1). For linear programs, the complementary slackness conditions are both necessary and sufficient for x (a 6 by I vector) to be an optimal solution to (LP 1)."
Looking a little more carefully at (LCP 1) we can gain further insight into complementarity problems. A solution to (LCP 1) not only tells us how much to send along each route, it also specifies the routes to be used. This property represents the key contribution of a complementarity problem over a system of equations. 12 If we knew a priori which routes to use, we could solve a simple system of equations to find the quantity to ship along each route. However, the key to the modelling power of complementarity is that it chooses which inequalities to satisfy as equalities.
" If the reader is confused at this point, we suggest returning to the section presenting the Kuhn-Tucker conditions. The Kuhn-Tucker conditions and the complementarity problem contain essentially the same information.
" As noted earlier, (LP I), when solved as a linear programming problem, also tells us which routes to use. There is thus no compelling reason to use a complementarity formulation for such a simple problem. But there are many instances when economic problems can't be solved using traditional LP or NLP techniques. In such cases, the available options are to solve a system of equations representing the eqUilibrium conditions for the underlying optimisation problem, or to formulate and solve the problem as a complementarity problem.
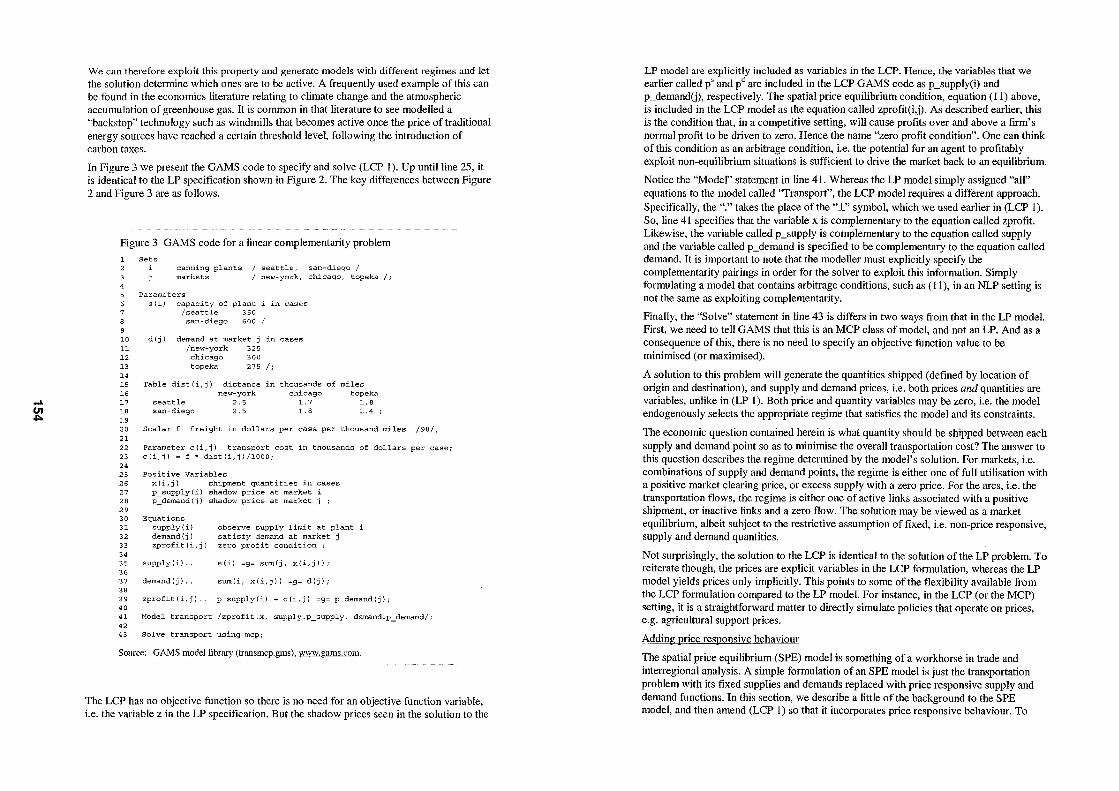
.... U1 ,J:o
We can therefore exploit this propelty and generate models with different regimes and let the solution determine which ones are to be active. A frequently used example of this can be found in the economics literature relating to climate change and the atmospheric accumulation of greenhouse gas. It is common in that literature to see modelled a "backstop" technology such as windmills that becomes active once the price of traditional energy sources have reached a certain threshold level, following the introduction of carbon taxes.
In Figure 3 we present the GAMS code to specify and solve (LCP I). Up until line 25, it is identical to the LP specification shown in Figure 2. The key differences between Figure 2 and Figure 3 are as follows.
Figure 3 GAMS code for a linear complementarity problem
8 9 10 11 12 13 14 15 16 17 18 19 20 21 22 23 24 25 26 27 28 29 30 31 32 33 34 35 36 37 38 39 40 41 42 43
Sets canning plants seattle I san-diego / markets new-york, chicago, topeka /;
Parameters s (i) capacity of plant i in cases
/seattle 350 san-diego 600
d (j) demand at market j in cases /new-york 325 chicago 300 topeka 275 I;
Table dist (i, j ) distance in thousands of miles new-york chicago topeka
seattle 2.5 1.7 1.8 san-diego 2.5 1.8 1.4 ;
Scalar f freight in dollars per case per thousand miles /90/;
Parameter c (i, j) transport cost in thousands of dollars per case; c(i,j) = f * dist(i,j)/1000;
Positive variables x{i,j) shipment quantities in cases p supply (i) shadow price at market i p=demand{j) shadow price at market j :
Equations supply (i) observe supply limit at plant demand{j) satisfy demand at market j zprofit(i,j) zero profit condition;
supply (i) .. s{i) =g= sum(j, x{i,j»:
demand(j).. sum(i, x(i,j» =9= d(j);
zprofit(i,j}. p_supply{i) + c(i,j) =9= p_demand(j):
Model transport /zprofit .x, supply.p_supply, demand.p_demand/;
Sol ve transport using mcp;
Source: GAMS model library (transmcp.gms), www.gams.com.
The LCP has no objective function so there is no need for an objective function variable, i.e. the variable z in the LP specification. But the shadow prices seen in the solution to the
LP model are explicitly included as variables in the LCP. Hence, the variables that we earlier called p' and pd are included in the LCP GAMS code as p_supply(i) and p_demand(j), respectively. The spatial price equilibrium condition, equation (11) above, is included in the LCP model as the equation called zprofit(i,j). As described earlier, this is the condition that, in a competitive setting, will cause profits over and above a firm's normal profit to be driven to zero. Hence the name "zero profit condition". One can think of this condition as an arbitrage condition, i.e. the potential for an agent to profitably exploit non-equilibrium situations is sufficient to drive the market back to an equilibrium.
Notice the "Model" statement in line 41. Whereas the LP model simply assigned "all" equations to the model called ''Transport'', the LCP model requires a different approach. Specifically, the "." takes the place of the .. .i" symbol, which we used earlier in (LCP I). So, line 41 specifies that the variable x is complementary to the equation called zprofit. Likewise, the variable called p_supply is complementary to the equation called supply and the variable called p_demand is specified to be complementary to the equation called demand. It is important to note that the modeller must explicitly specify the complementarity pairings in order for the solver to exploit this information. Simply formulating a model that contains arbitrage conditions, such as (11), in an NLP setting is not the same as exploiting complementarity.
Finally, the "Solve" statement in line 43 is differs in two ways from that in the LP model. First, we need to tell GAMS that this is an MCP class of model, and not an LP. And as a consequence of this, there is no need to specify an objective function value to be minimised (or maximised).
A solution to this problem will generate the quantities shipped (defined by location of origin and destination), and supply and demand prices, i.e. both prices and quantities are variables, unlike in (LP 1). Both price and quantity variables may be zero, i.e. the model endogenously selects the appropriate regime that satisfies the model and its constraints.
The economic question contained herein is what quantity should be shipped between each supply and demand point so as to minimise the overall transportation cost? The answer to this question describes the regime determined by the model's solution. For markets, i.e. combinations of supply and demand points, the regime is either one of full utilisation with a positive market clearing price, or excess supply with a zero price. For the arcs, i.e. the transpOltation flows, the regime is either one of active links associated with a positive shipment, or inactive links and a zero flow. The solution may be viewed as a market equilibrium, albeit subject to the restrictive assumption of fixed, i.e. non-price responsive, supply and demand quantities.
Not surprisingly, the solution to the LCP is identical to the solution of the LP problem. To reiterate though, the prices are explicit variables in the LCP formulation, whereas the LP model yields prices only implicitly. This points to some of the flexibility available from the LCP formulation compared to the LP model. For instance, in the LCP (or the MCP) setting, it is a straightforward matter to directly simulate policies that operate on prices, e.g. agricultural support prices.
Adding price responsive behaviour
The spatial price equilibrium (SPE) model is something of a workhorse in trade and intelTegional analysis. A simple formulation of an SPE model is just the transportation problem with its fixed supplies and demands replaced with price responsive supply and demand functions. In this section, we describe a little of the background to the SPE model, and then amend (LCP I) so that it incorporates price responsive behaviour. To
..... UI UI
keep things uncluttered we will assume that quantity is a simple function of own price, i.e. all conceivable cross-price terms are zero. Once we have explored the specification of the SPE model formulated as a complementarity problem, we will be in a position to then add tariff-rate quotas to the model.
Enke (1951) and Samuelson (1952) were the first to extend the transportation model by introducing price responsive regional supply and demand functions. Samuelson's formulation shows that the problem of maximising "net social payoff' (the sum of consumers' and producers' surpluses in each region less transpOltation costs) subject to regional commodity balance equations generates a set of optimality conditions that define an equilibrium in each regional market." Given the significance of Sa.muelson's contribution, it is wOlth dwelling on this for a moment.
Imagine a three region model where each region both supplies and demands a single good. Fmther imagine that the cost structures and consumer preferences are sufficiently different in each region that they engage in trade in order to maximise welfare. In a graphical sense, it is easy enough to picture the area denoting producer and consumer surplus in each region. The transpOltation cost is simply the quantity traded between each pair of regions multiplied by the appropriate transportation cost.
Samuelson's innovation was that if we simply set out to maximise the sum, over all regions, of the producers' and consumers' surplus, less the total transportation cost, and observed the supply and demand constraints, then the resulting solution to such an optimisation problem would, in fact, be the equilibrium market solution. That is, the solution would yield the quantity that each region would supply and demand, the quantity that would be traded between regions, and the supply and demand prices i~l each region could be gleaned from the solution as the shadow prices associated with the supply and demand constraints.
Takayama and Judge (1964) operationalised Samuelson's approach by showing that if the supply and demand functions were linear, then the resulting optimisation problem was a quadratic programming problem (i.e. quadratic objective function with linear constraints), which could be solved quite readily with available QP solvers." Takayama and Judge also extended the model to mUltiple products incorporating cross-price terms in the supply and demand functions. The work of Samuelson, and subsequently Takayama and Judge, spawned a great deal of empirical modelling, especially in the area of trade. Even today, many trade models are constructed in the tradition of the Samuelson-Takayama-Judge (STJ) genre. A very accessible and graphical exposition of the STJ model can be found in Martin (1981).
Most spatial equilibrium models of the STJ type are formulated in the quantity domain. This means that the supply and demand curves are inverted, the primal variables in the model are quantities, and prices are read from the solution as shadow prices, i.e. as we
I.' We hasten to point out that Samuelson wruned of the problems associated with using his result to make inferences about welfare. Hence his tenn "net social payoff', which explicitly excludes a reference to welfru·e. 111e literature would seem to suggest, however, that Samuelson's cautionru'y note was a~nost immediately ignored. See his 1952 paper for further details.
11. In fact, the objective function in the Takayama and Judge QP formulation embodies the integral functions of the inverse linear demand and supply functions. It calculates the area under the demand curve between the origin and the optimal demruld quantity (a decision variable in the model), less the area under the supply curve between the origin and the optimal supply quantity, less the transportation costs. The result is the sum over all regions of producers' and consumer' smplus.
saw earlier. Alternatively, but less commonly in the case of trade models, the "dual" problem could be formulated and solved, whereby the problem is solved in the price domain. In other words, the variables in the model are prices and the shadow values are the quantities. Either way, LP, QP, and more general NLP solution techniques require that the demand functions be symmetric (see Nicholson et aI., 1994). This shortcoming was overcome with linear complementarity techniques (see the primal-dual formulations in Takayama and Judge, 1971). However, up until the 1990s, when complementarity solvers became commercially available, such primal-dual problems were usually configured such that they could be "forced" into conventional NLP solvers. Hence, the objective function, even if it was vacuous, still had to observe the symmetry condition.15
Finally, it should be noted that a number of policy instruments can be quite readily modelled in a simple SPE model. Indeed, the trade literature is full of examples. For example, the transportation cost component can be modified to include per unit tariffs, taxes, and subsidies; import quotas can be introduced as upper bounds on shipment variables; and even ad valorem tariffs can be modelled, so long as they are nondiscriminatory, by modifying the slope parameters of the demand functions. But there are many policy instruments that the conventional SPE model is unable to accommodate; discriminatory ad valorem tariffs, for instance.
The SPE model as an MCP:
We now turn to the task of amending (LCP I) to create a nonlinear complementarity problem. We will refer to the resulting model as an MCP, even though it does not contain a mixture of equalities and inequalities (see Figure 4, the model contains only inequalities). Nevertheless, unlike the linear complementarity problem in Figure 3, our SPE model is now a nonlinear problem due to the functional form we have chosen for the supply and demand functions, i.e. they are constant elasticity functions.
The GAMS code seen in Figure 4 should by now seem quite familiar. The first 30 lines are identical to the LCP model in Figure 3, except that we have introduced two new parameters; eta and sigma, the elasticities of supply and demand, respectively.
We assume for simplicity that supply prices are unitary (i.e. equal to I). In order to specify the isoelastic functions, we need to compute share parameters based on the base case, or reference data. Hence, lines 33 through 38 declare the parameters to do this. Careful inspection will reveal that the reference demand prices are just the supply prices plus the lowest transport cost to each demand city. Because supply prices are I, line 42 simply sets the supply function share parameter to be equal to the supply quantity. Similarly, line 44 computes the demand share parameters using the reference demand prices, pbar.
Note that two asterisks is the GAMS way of denoting exponentiation (e.g. line 44). Before we take a look at the variables and the equations, we should reiterate that the reference data we have specified here is purely fictional. Nevertheless, the GAMS code in Figure 4 can be used as a template for specifying a realistic model where supply and
l5 Technically speaking, NLP solution techniques require that the Jacobian matrix, the matrix of first partial derivatives, be symmetric. The model is then said to be integrable. We should also point out that complementarity techniques are not the only way out of this "requirement for integrability" dilemma. Fixed-point algorithms, for example, received a lot of attention in thel960s and 1970s. But while theoretically elegant, they have turned out to be rather slow and cumbersome in applied modelling situations. Variational inequalities, closely related to the complementarity problem, may also be used (see Nagumey et ai., 1996b).
..... U1 0)
demand prices and quantities, and transportation costs are all observed, and the elasticities are econometrically estimated. The set-based structure ofGAMS also means that the model is highly scalable to any number of regions (and commodities, for that matter).
Figure 4 GAMS code for a nonlinear complementarity problem
14 15 16 17 18 19 20 21 22 23 24 25 26 27 28 29 30 31 32 33 34 35 36 37 38 39 40 41 42 43 44 45 46 47 48 49 50 51 52 53 54 55 56 57 58 59 60 61 62 63 64 65 66
Lines 1 through 13 the same as in Figure 3.
eta(i) price elasticity of supply I seattle 1.0 san-diego 1.0 /
sigma (j) price elasticity of demand /new-york 1.5 chicago 1.2 topeka 2 . 0 /;
Table dist(i,j) distance in thousands of miles new-york chicago topeka
seattle 2.5 1.7 1.8 san-diego 2.5 1.8 1.4
Scalar f freight in dollars per case per thousand miles /901;
Parameters eli,ji alpha (i)
beta (j)
pbar (j)
transport cost in thousands of dollars per case supply function share coefficient demand function share coefficient reference price at demand city j (suppy price 1)
/new-york 1.225 chicago 1.153 topeka 1.126 / i
c(i,j) f * dist(i,j)/lOOO
alpha (i) s{i);
beta(j) d(j)*pbar(j)**sigma(j);
Positive variables xCi, j) shipment quantities in cases p supply(i) shadow price at supply market p=demand (j) shadow price at demand market
Equations supply(i) supply limit at plant i demand (j) demand constraint at market zprofit(i,j) zero profit conditions
supply (i) .. alpha(i) *p_supply(i) **eta(i) =g= sum(j, x{i,j»i
demand (j) . . sum (i, xCi, j» =9= beta (j) *p_demand (j) ** (-sigma (j» ;
zprofit(i,j) .. p_supply(i) + c(i,j) =g= p_demand{j);
Model transport /zprofit.x, supply.p_supply, demand.p_demand/;
p_demand.l(j) pbar{j);
Solve transport us ing mcp i
Source: Rutherford (1995).
The variables and the equations declared in this model, i.e. lines 46 through 54, are the same as we had before in (LCP I). The difference now is in the specification of those equations. Consider the left-hand side of the supply equation, i.e. line 56. Whereas before we had Sj on the left, i.e. the fixed supply, we now have a function of own-price, p_supply, that will evaluate to yield the supply quantity. Similarly, the right-hand side of the demand equation is the demand function. Notice the negative sign on the elasticity term to give a downward sloping function. The zero profit condition and the complementarity pairings in the model statement remain unchanged from what they were earlier.
Finally, line 64 assigns an initial (strictly positive) value to the demand price variables. If we didn't do this, then the exponentiation in line 58 would yield a numerical error at the start of the solution process. That is, at this point, prior to the model being solved, the level of the variable p_demand is zero, and zero raised to a negative exponent is undefined.
As we noted earlier, there is really no need to formulate this model as a complementarity problem as it is perfectly able to be solved using conventional NLP techniques. But consider the case of discriminatory ad valorem tariffs or taxes. That is, imagine that each of the three demand cities was to charge each of the two supply cities a different ad valorem tariff. Such a problem provides an example of where the formulation of a market equilibrium is not straightforward." No single optimisation problem characterises the equilibrium because integrability has been destroyed, i.e. the supply price is a non-unitary multiple of the marginal cost of supply. But there does exist a unique MCP which precisely characterises the equilibrium.
Consider line 60, the zero profit condition. If we had a parameter called tij, denoting our asymmetric ad valorem tariff or tax rate, then it would be a simple matter to incorporate it into the model by modifying the zero profit condition as follows:
zprofit(i,j) .. (p_supply(i,j) + c(i,j))*(l + t(i,j)) =g= p_demand(j);
There are many other examples in economics where this modelling difficulty arises. Asymmetric demand specifications, regime switching, threshold effects, switching sides of the market (Le. from being an exporter, say, to being an importer)," and tatiff-rate quotas are just a few. Exploiting complementarity is a convenient means of resolving the difficulty. Specific taxes (or tariffs or subsidies) do not cause this problem as they can easily be added to the per unit transport cost coefficients.
TARIFF-RATE QUOTAS
We now return to the topic implied by the title of this paper. Thus far we have developed the intuition underlying the complementarity problem. Moreover, we have shown how the popular spatial price equilibrium model can be formulated as a mixed complementarity problem, and we have even presented the GAMS code, which can be used as a template for building a realistic model." In this section of the paper we discuss some aspects of
!c, An equilibrium to such a problem could be computed by iteratively solving a sequence of NLPs, but this is clumsy and inefficient.
17 See Anania and McCalla (1991) and Bishop et al. (1994).
" As we noted at the outset of this paper, we are unable to claim credit for much of what has been presented here. The GAMS templates are no exception as they are taken, almost as originally presented, from other sources.

.... UI .....
taliff-rate quotas (TRQs) that make them difficult to incorporate into models using conventional optimisation techniques. In the fol\owing and final section, we bring everything together and present an SPE model complete with TRQs.
The basic tariff-rate guota
As the name suggests, a TRQ embodies both a quantitative restriction in the form of a quota, and a price instrument in the form of a tariff (which may be ad valorem or specific)." Figure 5 presents a very simplified depiction of a TRQ.
Figure 5 A simple TRQ
P
Pdl :':-" dbQta rent wto D3
Pw
~b21 "'D "W
I 1
0* 0
Source: NZIER
One can think of this as being a small country supplying a single good to a country that imposes the TRQ. The supply curve is the bold line that begins horizontal at Pw, the world price. It then turns vertical at Q*, the import quota quantity, and beomes horizontal again at Pw + to, where to denotes the over-quota tariff rate. For the moment, imagine the importing country's demand curve is that given by D 1• Whilst the diagram is clearly not to scale, imagine, for the sake of simplicity, that the supply curve belongs to a single supplier while the demand curve represents the sum of all demand from imported and domestically produced sources.
" Throughout this paper we have focused on ad valorem tariffs. We will continue that focus but would point out that the Mep formulation also handles specific tariffs, as well as TRQs that might contain both specific and ad valorem tariffs.
In this simple case, there are two tariff rates associated with this TRQ. The within-quota tariff, tw, applies to all imports up to the quota quantity, Q"'. Above the quota, the overquota (sometimes called the out-of-quota) tariff applies. But significantly, the TRQ places no quantitative restriction on the impOlt volume that might occur above Q*. However, in practice, the over-quota tariff rates in agriculture are typically so high, they prohibit any trade from taking place above the quota.
But it is not just the tariff rates and quota levels that determine the quantity of trade. The nature of demand in the importing country also plays a role. Consider, the demand curve depicted by Dl. In this case, imports are exactly equal to Q* and a quota rent has been created (the shaded rectangle). The domestic price, Pd, is determined in the normal fashion by observing where demand intersects with supply. The government in the importing country collects revenue equal to tw times Q*.
But what ifD2 was the relevant demand curve? Clearly in this case the quota would not be binding and no rent is created. If this situation prevailed, then there is nothing to be gained from trade liberalisation that saw either the quota quantity increased and/or the over-quota tariff reduced. A small increase in trade would be observed if, when D2 was relevant, the within-quota tariff was reduced.
The more interesting situation is when the demand schedule lies somewhere near Dl or Do. When Dl is the relevant demand curve, there is an interesting trade-off to be made, by the supplying country, between the benefits of greater market access, i.e. an increased quota quantity, versus a diminished quota rent. Consider the situation where Q * is increased up until the point where the world price line intersects with Dl.2U Under this scenario, the quota rent would diminish entirely but this would be offset to some extent by increased expOlts. Which scenario should the exporting country prefer? The answer is it depends. One needs a model with endogenous regime switching and an endogenously determined quota rental variable in order to be able to ascertain which situation is preferred. It may turn out that the exporting country's favoured position is a decline in Q*, which would see the quota rental value increase.
Now consider the case when D3 is relevant. In this situation a judicious increase in Q* is likely to be beneficial to the exporting country, i.e. both the quota rent and the volume of trade increase. On the other hand, the merits of a decrease in to may be indeterminate, i.e. the trade volume would increase, but the tariff rental value may decline.
To muddy the waters even further, it is usually the case that in reality, TRQs are more complex than that depicted in Figure 5. For example, there may exist several tiers to the schedule. The tariffs and the quotas may be assigned on a bilateral basis as well as on a multilateral basis. For reasons that have to do with historical trade patterns, New Zealand has a disproportionate share of preferential access arrangements in some markets. These may take the fOlm of favourable tariff rates andlor exclusive quota lights. Tariffs may be defined either on a specific basis or on an ad valorem basis.
All of these factors give rise to an interesting problem when deciding upon a negotiating stance to adopt. The answer as to which regime New Zealand favours is likely to be different from one case to the next. But New Zealand may not be in a position to pick and choose. It is therefore imperative that New Zealand negotiators understand what the outcomes of policy proposals are, as they are proposed and before they are negotiated. In
'" Actually, the relevant line to consider is the line denoted by Pw + two
..... Ul 0)
the next section we discuss a modelling framework that is able to shed some light on these questions.
BRINGING IT ALL TOGETHER
We now present a 3-region SPE model formulated as an MCP, and which incorporates tariff-rate quotas (see Figure 6). The core model specification is changed slightly from the SPE model we saw in Figure 4, with all unnecessary detail stripped away. In fact, we don't even assign data values to the parameter symbols. Rather, we conduct the entire discussion in terms of the symbol names. To keep things uncomplicated we show only bilateral tariff-rate quotas. It is a straightforward modification, hOwever, to integrate multilateral TRQs into the same model. For an example of a trade model formulated as a complementarity problem that embodies a wide range of price- and quantity-based policy instruments, as well as multiple products, see Bishop and Nicholson (2001).
Figure 6 GAMS code for an MCP with TRQs SETS
i regions /r1, r2, r3 / ql quota levels (break points) /qll, q12, q13 / i
ALIAS (i,j}j
PARAMETERS
sO (i)
dO (j) 10 xO(i,j) 11 eta(i) 12 sigma(j) 13 qlvl(i,j,ql) 14 t(i,j/ql) 15
reference supply quantity in region i reference demand quantity in region j reference biltaeral trade quantity price elasticity of supply price elasticity of demand bilateral quota levels bilateral tariff rates
16 ... Read in data here .. 17 18 POSITIVE VARIABLES 19 X(i,j,ql) shipment of product from region i to region j 20 P (il regional price 21 QRCi,j,qll quota rent (price per unit) 22 23 24 25 26 27
EQUATIONS ZPROFIT (i, j , qIl MARKET (i) QUOTA{i,j,ql)
28 market (il ..
zero profit conditions domestic market clearing constraint limits on shipments by tariff class
29 sO(i)*P(i)**eta(i) + sum«j,ql), X(j,i,ql» =e= 30 dO{i}*P(i)**(-sigma(i» + sum({j,ql), X(i,j,ql»; 31 32 zprofit(i,j,ql)$(NOT sameas(i,j» .. 33 P(i)*"(l + QR(i,j,ql) + t(i,j,ql» =g= P(j); 34 35 quota(i,j,ql)$(NOT sameas(i,j» .. qlvlCi,j,ql) =g'" X(i,j,ql); 36 37 MODEL trq /market.p, zprofit.x, quota.qr I; 38 39 p.l(i) 1; 40 41 SOLVE trq using mcp;
Source: NZIER
Immediately noticeable is that the declaration of the sets, lines I through 3, is slightly different than before. We have dropped the U.S. cities and gone with three generic regions, denoted 1'1, 1'2, and 1'3. As we'll see in moment, each region is both a supplier and
a demander of the single good. Hence, this model has three domestic markets that are linked through their ability to trade with one another. Notice the "alias" statement in line 5. It assigns the elements of set i to a set called j (i.e., i and j each have the same elements).
The second set we define, ql, specifies that there are three steps or break points in the quota schedule. This in turn implies that there are three levels in the tariff schedule. To avoid confusion, we will be quite explicit about how this specification is to be interpreted. We could imagine that qll, the first element of set ql has a quota quantity of, say, 1000 tonnes associated with it. All imports up to that point might attract a tariff of 10%. The second element, q12, might relate to a quota quantity of 3000 tonnes, which attracts a tariff of 50%. Finally, the third element, q13, might be infinity, and shipments occurring in this band might attract a tariff rate of250%. (We would point out that the TRQ instrument normally has an infinite quantity associated with the upper tier, although from a modelling point of view, this is not required.) To recap, our imaginary tariff-rate quota schedule with three tiers operates as follows. Imports up to 1000 tonnes attract a 10% tariff. Imports between 1000 and 4000 tonnes, i.e. a 3000 tonne quota at the second tier, attract a 50% tariff. And all imports over 4000 tonnes get charged a tariff of 250%.
In lines 7 through 14 we declare some parameters. All but the last two should be familiar from the models seen earlier. The reference or benchmark quantity of bilateral trade, xO, is not necessary to specify the model, per se, although such data may be used to validate the model's ability to replicate the benchmark set of data. In any event, it is at line 16 that one would ordinarily assign values to all of these parameters. Alternatively, GAMS could be instructed at this point to read the necessary data from an external file, such as a spreadsheet.
The parameters qlvl and t (lines 13 and 14) are new to this model, and their purpose should be self-evident. These two parameters defme the quota levels and tariff rates in the manner we have just explained above. Notice that each of these parameters are defined on sets i and j (i.e. on an origin-destination basis) as well as on ql. This should reiterate the point that these parameters are defined bilaterally.
If one were to also include a multilateral TRQ, it would be accomplished by creating an additional parameter for the multilateral quota levels, say, qlvlm(j,ql), i.e. it would not be defined on i as it would apply to all i. A multilateral tariff schedule can be accommodated by assigning the appropriate values to the bilateral tariff parameter. Alternatively, one could create a specific multilateral tariff parameter, even though it is unnecessary. Obviously, care needs to be exercised in defining a model with both multilateral and bilateral TRQs. It would make no sense, for example, for a multilateral quota quantity in region j to exceed the sum of all bilateral TRQs emanating from j and applying to all other regions. Finally, the addition of a multilateral TRQ would require an additional variable and complementary constraint; i.e. a multilateral quota rent variable and a multilateral quota constraint.
There are only three variables in this model. The shipment variable, x, we have seen before. But notice that it is now defined on ql as well as i and j. One can think of each origin-destination route as being a road divided into 3 lanes, one for each level of the TRQ schedule. However, the price variable, p, is a significant change from earlier. We now have just one price per region, whereas previously we had a supply price and a demand price. This comes about because we have removed all of the intra-regional price wedges, i.e. there are no transportation costs in this model and the quotas and tariffs don't
.... CJI CD
apply on intra-regional shipments. Hence, the equilibrium supply price is identical to the demand price in each region.
The final variable (line 21) is the quota rent variable, qr. It can be interpreted as the price of a unit of quota rent. Notice that it is defined on both i and j because it applies to quota rents on a bilateral basis. Note too that it is defined on set ql. It should already be apparent that there are potentially three "quota rent" rectangles of the kind seen in Figure 5. The value of each quota rental is just the relevant qr variable multiplied by the relevant quota quantity, qlvl. The key point to note about the quota rent variable is that it is endogenous - a solution to the model will yield the level of qr. It is not the case that the modeller must assign a value to the quota rent before using the model to undertake experiments. Clearly, as was discussed in the previous section, the level of the quota rent variable will be determined by the interplay of a number of factors. Moreover, it will be consistent with the equilibrium outcome.
There are three sets of equations in this simple model. The first, called market, specifies the condition that ensures each market clears and that trade flows balance." It says that the quantity supplied plus the sum of all shipments from a region (including intra-regional flows) must be equal to the sum of all shipments into a region (including intra-regional flows) plus the quantity demanded. Careful inspection of the summation of the x variable will reveal that the order of the indexes, i and j, is reversed on the right-hand side of the equation from what it is on the left. The supply and demand functions are specified such that prices are equal to I in the base case. Hence, there is no need to compute and use the share coefficient terms, alpha and beta, as was the case in Figure 4. But we would stress that this is just for convenience; the functions could be calibrated to any consistent price and quantity levels. As before, the supply and demand relationships are isoelastic functions of own price.
The zero profit condition for this model is quite straightforward. In essence, it says the price in region i multiplied by one plus the quota rent variable plus the tariff rate, is greater than or equal to the price in region j. There are two points to note about this condition. First, it is not defined when i equals j (see the statement that says "not samesas (i,j)". Second, a zero profit condition is defined for each level of the quota schedule, i.e. set ql, as well as each (i_j)th route, so long as i is not the same as j. Because the benchmark prices are normalised to one in this model, the quota rent variable appears to enter the zero profit condition as a rate, just like the tariff rate. Once again, this would not be the case if prices were modelled at their observed levels.
The final equation is the quota constraint. It simply says that for each i-j-ql arc, where i is not equal to j, the quota level must be greater than or equal to the shipment quantity.
As before, the model statement specifies the complementarity pairing of variables with equations. Also, we set the initial price level to be one in order to avoid undefined exponentiation. The final statement tells GAMS to solve the model called trq, while making sure to treat it as an MCP fonTIulation.
Concluding remarks
Although it took a while to get there, we have now presented a comprehensive template of an SPE trade model, formulated as an MCP, that can easily be scaled up to realistic
" The term "trade flows" is used rather loosely here. It includes intra- as well as interregional flows.
dimensions. We finish this paper with a few comments on how to use the model to conduct experiments.
A typical experiment would entail decreasing tmiff rates and observing what happens to production, demand, trade volumes, plices, and quota rents. For example, an across the board tmiff cut of 30% could be modelled by adding the statement t (i, j ,ql) = 0.3 *t (i, j ,ql) ; immediately after the solve statement in line 41, followed by a second solve statement. The results ofthe simulation (the second solve) can then be compared with the benchmark case (the first solve). One could get more specific, however, and conduct experiments where only the tariffs on certain routes and/or certain levels of the tariff schedule are modified.
Similarly, one could simulate market access scenarios by increasing quota levels. Finally, a likely policy scenario would involve increased quota levels in conjunction with decreasing tariff rates.
REFERENCES
Anania, G. and A.F. McCalla (1991). "Does arbitraging matter? Spatial trade models and discriminatory trade policies." American Journal of Agricultural Economics 73: 103-17.
Bishop, P.M. and C.F. Nicholson (2001). A mixed complementarity model of world dairy trade. Forthcoming staff paper, Department of Applied Economics and Management, Cornell University, Ithaca NY.
Bishop, P.M., J.E. Pratt, and A.M. Novakovic (1994). Using ajoint-input, multi-product formulation to improve spatial price equilibrium models. Staff paper 94-06, Department of Agricultural, Resource, and Managerial Economics, Cornell University. (Presented at the "New Dimensions in North American-European Agricultural Trade Relations" conference, Calabria, Italy, June 20-23,1993.)
Brooke, A., D. Kendrick, A. Meeraus, and R. Raman (1998). GAMS: a user's guide. GAMS Development Corporation, Washington, D.C.
Chiang, A. (1984). Fundamental methods of mathematical economics (3rd ed.), McGrawHill.
Cottle, R., J.S. Pang, and R.E. Stone (1992). The linear complementarity problem. Academic Press, San Diego.
Dantzig, G.B. (1963). Linear programming and extensions. Princeton University Press, Princeton, NJ.
Dirske, S. and M.e. Ferris (1993). The PATH solver: a non-monotone stabilisation scheme for mixed complementarity problems. Technical report 1179, Computer Science Department, University of Wisconsin, Madison WI.
Enke, S. (1951). "Equilibrium among spatially separated markets: solution by electric analogue." Econometrica 19:40-47.
Ferris, M.e., and T.S. Munson (2000). GAMSIPATH user guide, version 4.3. GAMS Development Corporation, Washington, D.e.
Harker, P. and J.S. Pang (1990). "Finite-dimensional variational inequality and nonlinear complementarity problems; a survey of theory, algorithms and applications" Mathematical Programming B 38:161-190.
Hartman, P. and G. Stampacchia (1966). "On some nonlinear elliptic differential functional equations." Acta Math. 115: 153-188.
Hitchcock, P.L. (1941). ''The distribution of a product from several sources to numerous locations" Journal of Mathematical Physics 20:225-230.
Kantorovich, L. (1939). "Mathematical methods in the organisation and planning of production," Publication house of the Leningrad State University. Translated in Management Science 6:366-422.
Kuhn, H.W. and A.W. Tucker (1951). "Nonlinear programming," in J. Neyman (ed.), Proceedings of the second Berkeley symposium Oil mathematical statistics and probability, University of California Press, Berkeley CA, pp. 481-92.
Lemke, C.E. and J.T. Howson (1964). "Equilibrium points ofbimatrix games." SIAM Review 12:413-23.
Lofgren, H. and S. Robinson (1999). Spatial networks in multi-region computable general equilibrium models. TMD discussion paper no. 35, Trade and Macroeconomics Division, IFPRl, Washington, D.C.
Martin, L.J. (1981). "Quadratic single and multi-commodity models of spatial equilibrium: a simplified exposition." Canadian Joun/al of Agricultural Economics 29(1):21-48.
Nagurney, A., c.P. Nicholson, and P.M. Bishop (l996a). "Massively parallel ..... computation of large-scale spatial price eqUilibrium models with discriminatory g ad valorem tariffs." The Annals of Operations Research 68:281-300, special issue
on computational economics.
____ (1996b). "Spatial price equilibrium models with discriminatory ad valorem tariffs: formulation and comparative computation using variational inequalities" in van den Bergh, J.C.J.M., P. Nijkamp, and P. Rietveld (eds.), Recent advances in spatial equilibrium modelling: methodology and applications. New York: Springer.
Nicholson, c.P., P.M. Bishop, and A. Nagurney (1994). "Using variational inequalities to solve spatial price equilibrium models with ad valorem tariffs and activity analysis." Working paper 94-14, Department of Agricultural, Resource, and Managerial ECOnomics, Cornell University, Ithaca NY.
Rutherford, T.P. (1993). "MILES: a Mixed Inequality and nonLinear Equation ,Solver." Working paper, Department of Economics, University of Colorado, Boulder CO.
____ (1995). "Extensions of GAMS for complementarity problems arising in applied economic analysis." Joun/al of Economic Dynamics and Control 19: 1299-1324.
Samuelson, P. (1952). "Spatial price equilibrium and linear programming." The American Economic Review 42:283-303.
Takayama, T. and G.G. Judge (1964). "Equilibrium among spatially separated markets: a reformulation." Econometrica 32:510-524.
____ (1971). Spatial and temporal price and allocation models. Amsterdam: North-Holland.
.... Ol ....
The future of small dairy farms in New Zealand; comparing methods and results
E.M.HurJey, Senior Policy Analyst, MAF Policy, Palmerston North A.E.Dooley, College of Science, Massey University
C.L.Massey, College of Business, Massey University
SUMMARY
Stakeholders in the New Zealand dairy industry, supported by historical trends, often observe that the small farm component of the dairy production sector will soon disappear. Dairy farmers themselves who have small farms and who were involved in a Massey University research project (consisting of an industry exchange forum, some case studies and a survey) believed that they made a significant contribution to the industry and had the potential to contribute more. They offered good reasons why they should continue to be part of a growing industry.
They identified some factors that would be a significant detraction from their ability to contribute in the future, as well as opportunities for enhancing their viability. This research draws together information derived from all three research components on these barriers and indicates aspects of dairy industry organisation which could be modified should the industry wish to retain its small dairy farm sector.
This study drew on the results of three complementary projects - an exchange forum, a survey and a set of case studies. The combination of qualitative and quantitative methods as a means for exploring the future viability of small dairy farms is discussed.
KEYWORDS
Small dairy farmers, multiple method research
INTRODUCTION
A team of Massey University researchers undertook a project, funded by the New Zealand Public Good Science Fund, to look at the long-term sustainability of the dairy industry. The team members brought complementary skills to the project from farm and business management, quantitative and qualitative analysis. As part of this project, the future of small dairy farms was examined. A small dairy farm (SDF) was defined for the purposes of this study as having fewer than 60 hectares and/or 180 cows. A combination of qualitative (exchange forum, case studies) and quantitative (survey) methods were used in this study. Most research team members were involved in two of the three phases of the study. Except for the initial planning phase no team member was directly involved in all three components of the research project.
METHOD
The exchange forum, to identify issues affecting small dairy farms (SDFs), was held in November 1998. A mail survey was then designed, partly based on the outcomes of the exchange forum. Its purposes included verifying whether some of these issues were perceived to be important to small-dairy farmel's on an industry wide basis, quantifying the relative importance of these issues and determining factors that may have a bearing on their
relative importance. The survey was sent to small dairy farmers in the North Island in June 1999. As the survey was being analysed, case studies of six small dairy farmers (two each in Northland, Waikato and Taranaki) were conducted to explore factors affecting small dairy farmers in more depth. The three approaches are described in more detail below.
Exchange Forum
The forum was attended by twenty-five participants, including twelve small dairy farmers (fewer than 150 cows), nine dairy industry representatives (from dairy companies, the New Zealand Dairy Board, research scientists, dairy consultants, rural fmanciers and policy makers) and four research team facilitators. Seven of the farmers were male and five female, whereas only one of the industry representatives was female. The age of the farmers ranged from 24 to 6 I years, and their education level ranged from two years secondary to University Entrance, with some also having trade qualifications. They had been involved in farming for between seven and 40 years.
The issues addressed at the five exchange forum sessions were:
I. factors that will influence the future viability of dairy farms;
2. criteria for defining success on small dairy farms;
3. factors that would help improve small dairy farm viability;
4. barriers to improving viability on small dairy farm~;
5. strategies that could improve small dairy farm viability.
Participants entered responses in a workbook. This was followed by group sessions, discussing each of the above issues. Summaries of each of the group sessions were entered on wall charts. The results were entered into Microsoft W ord® files, and sorted into themes by the research team. The research team assigned links between themes based on their understanding of the data collected, although the participants were not directly asked to define links. Details of the exchange forum method and results are described in the report (Stantiall et ai, 1999).
Survey
A four page mail survey was sent to 1389 SDF suppliers of New Zealand Dairy Group (NZDG) (n=897), Kiwi Dairy company (n=292), and Northland Dairy Company (n=200). The response rate adjusted for farms that met the criteria was 41 %. Most questions regarding the relative importance or likelihood of a particular issue or event were answered on a I to 5 scale representing strongly agree to strongly disagree or very likely to very unlikely. Data were entered into a Microsoft Excel® spreadsheet and analysed using SAS descriptive statistics (SAS 1993).
The survey questions examined:
I. farm production potential;
2. constraints to change in order to increase dairy farm income;
3. strategies the dairy industry could use to encourage small dairy farms;
4. plans for 2010;
5. sources of household income in the 1998/99 financial year;
6. children, their educational needs and likelihood of taking over the farm;
7. farm size and location impacts;
8. how a 10% higher cash surplus would be used;
.... ~
9. generic background information on the fanner, the farm and herd size, runoff, milksolids (MS) production and other enterprises.
The survey method is described in more detail in Parker et al (2000) and Rauniyar and Parker (2000).
Case Studies
Six case study farms were selected from those survey respondents who indicated they were willing to discuss SOP issues. Many of these survey respondents had also included comments and observations related to farming SOPs on their questionnaires. Their responses to the survey question on "constraints to change in order to increase dairy farm income" were considered and their availability was ascertained.
The objective of the case studies was to determine:
I. background information and current situation in relation to the farm, family and business;
2. perceptions of barriers to business growth and farm financial viability;
3. processes undertaken when selecting bnsiness strategies and management forms;
4. key influences on the selection process of business strategies and management forms;
5. the relative importance of the competencies required in order to select and implement appropriate strategies and management forms.
To obtain this information unstructured interviews were held with those making on-farm decisions (usually a husband and wife team), focussing on the farmers' future plans, the way they approach the adoption of a new technology and the competencies they considered necessary for this to occur. Two researchers conducted the interviews. Together they interviewed two Kiwi suppliers from Taranaki, then one interviewed the two Northland suppliers and the other interviewed the two Waikato-based NZOG suppliers. Responses were interpreted in relation to the research objectives and to the survey data. Case studies are reported separately in Massey and Hurley (2001).
This paper will compare survey responses with those obtained in the exchange forum and the case studies. Survey questions 2 and 3 (constraints to change and strategies to encourage SOFs) will be compared as these issues were studied in all three approaches.
RESULTS
Reasons small dairy farmers felt they could contribute to dairy farming in the future
The SOP farmers at the exchange forum (Stantiall et aI, 1999) and the case study farmers (Massey and Hurley, 2001) all gave reasons for believing that small dairy farmers make a considerable contribution to the industry. These included:
their ability to achieve higher than average per hectare production to meet industry targets e.g. "You need to have owners not staff if you want people to achieve the sort of targets the industry wants". "Scale can make farmers complacent - small farms have to make the production". The implication here was that farmers on larger units and with employed labour are less inclined to pay detailed attention to management practices which will maximise returns per hectare.
an owner/operator may be more motivated e.g. "Need to be able to see rewards for oneself, so owner/operator dairying is appropriate".
resilience and flexibility e.g. "you do your spending when cash is available".
ability to monitor and control the system, e.g. "able to monitor the whole system and its components - mainly with informal methods (pasture, animal health, cash) because that's manageable with a small farm". "Can know animals, so can monitor: pasture growth and feed budgeting; animal health; herd testing; whole farm from a centrally placed cowshed. Less to go wrong so less stress. As farms get larger: cows have to walk further so more likely to go lame; can't keep things in your head; (cash book, budgets, etc); can't afford to buy (need for minimum capital)".
the contribution of small farms toward the community. One respondent thought there was a need to balance the drive towards globalisation against the need to nurture communities in rural areas, and felt farmers On small holdings are doing this On behalf of the whole industry.
labour issues - can manage on own, whereas "getting and keeping staff is a real hassle".
a willingness to try new affordable technology or management techniques (e.g. organics, once a day milking) or alternative investment (e.g. tourism, vineyards). They also felt small dairy farmers could make the most of the opportunity to supply niche markets, as they had a good understanding of their herd and system, and time to implement systems which require specialist technology or input.
One couple was adamant that, in addition to any lifestyle issues, their small dairy farm was profitable relative to other small business opportunities that might be on offer. The variety of tasks, both physical and managerial, which were there to be done made dairying an appealing vocation.
Factors affecting change being made
This issue was addressed in all three studies, with question 2 of the survey being based on the themes identified in question 4 of the exchange forum. The exchange forum addressed barriers in relation to the viability of SOFs, while the survey related these to increasing dairy farm income. Each of the survey questions is discussed separately, in relation to the exchange forum and case studies. The survey responses are summarised in Table 1.
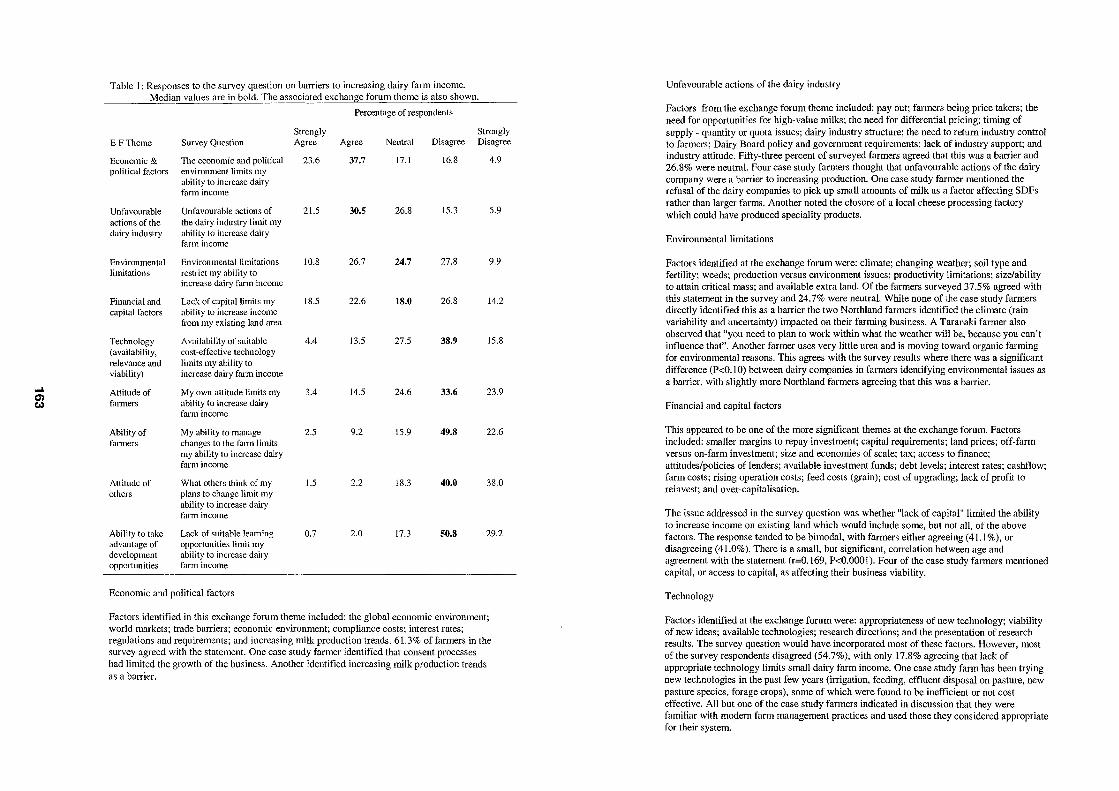
Table I: Responses to the survey question on balTiers to increasing dairy farm income. Median values are in bold. The associated exchange forum theme is also shown.
Percentage of respondents
Strongly Strongly E FTheme Survey Question Agree Agree Neutral Disagree Disagree
Economic & The economic and political 23.6 37.7 17.1 16.8 4.9 political factors environment limits my
ability to increase dairy farm income
Unfavourable Unfavourable actions of 21.S 30.5 26.8 IS.3 S.9 actions of the the dairy industry limit my dairy industry ability to increase dairy
farm income
Environmental Environmental limitations 10.8 26.7 24.7 27.8 9.9 limitations restrict my ability to
increase dairy farm income
Financial and Lack of capital limits my 18.S 22.6 18.0 26.8 14.2 capital factors ability to increase incOlne
fi'om my existing land mea
Technology Availability of suitable 4.4 13.S 27.S 38.9 IS.8 (availability, cost-effective technology relevance and limits my ability to viability) increase dairy farm income ... Attitude of My own attitude limits my 3.4 14.5 24.6 33.6 23.9
0) Co) fanners ability to increase dairy
farm income
Ability of My ability to manage 2.5 9.2 IS.9 49.8 22.6 farmers changes to the farm limits
my ability to increase dairy farm income
Altitude of What others think of my I.S 2.2 18.3 40.0 38.0 others plans to change limit my
ability to increase dairy farm income
Ability to take Lack of suitable learning 0.7 2.0 17.3 50.8 29.2 advantage of opportunities limit my development ability to increase dairy opportunities farm income
Economic and political factors
Factors identified in this exchange forum theme included: the global economic environment; world markets; trade balTiers; economic environment; compliance costs; interest rates; regulations and requirements; and increasing milk production trends. 61.3% of farmers in the survey agreed with the statement. One case study farmer identified that consent processes had limited the growth of the business. Another identified increasing milk production trends as a balTier.
Unfavourable actions of the dairy industry
Factors from the exchange forum theme included: payout; farmers being price takers; the need for opportunities for high-value milks; the need for differential pricing; timing of supply - quantity or quota issues; dairy industry structure; the need to return industry control to farmers; Dairy Board policy and government requirements; lack of industry support; and industry attitude. Fifty-three percent of surveyed farmers agreed that this was a barrier and 26.8% were neutral. Four case study fanners thought that unfavourable actions of the dairy company were a balTier to increasing production. One case study farmer mentioned the refusal of the dairy companies to pick up small amounts of milk as a factor affecting SDFs rather than larger farms. Another noted the closure of a local cheese processing factory which could have produced speciality products.
Environmental limitations
Factors identified at the exchange forum were: climate; changing weather; soil type and fertility; weeds; production versus environment issues; productivity limitations; size/ability to attain critical mass; and available extra land. Of the farmers surveyed 37.5% agreed with this statement in the survey and 24.7% were neutral. While none of the case study farmers directly identified this as a barrier the two Northland farmers identified the climate (rain variability and uncertainty) impacted on their farming business. A Taranaki farmer also observed that "you need to plan to work within what the weather will be, because you can't influence that". Another farmer uses very little urea and is moving toward organic farming for environmental reasons. This agrees with the survey results where there was a significant difference (P<O.1 0) between dairy companies in farmers identifying environmental issues as a barrier, with slightly more Northland farmers agreeing that this was a barrier.
Financial and capital factors
This appeared to be one of the more significant themes at the exchange forum. Factors included: smaller margins to repay investment; capital requirements; land prices; off-farm versus on-farm investment; size and economies of scale; tax; access to finance; attitudes/policies of lenders; available investment funds; debt levels; interest rates; cashflow; farm costs; rising operation costs; feed costs (grain); cost of upgrading; lack of profit to reinvest; and over-capitalisation.
The issue addressed in the survey question was whether "lack of capital" limited the ability to increase income on existing land which would include some, but not all, of the above factors. The response tended to be bimodal, with farmers either agreeing (41.1 %), or disagreeing (41.0%). There is a small, but significant, cOlTelation between age and agreement with the statement (r=0.169, P<O.OOO I). Four of the case study farmers mentioned capital, or access to capital, as affecting their business viability.
Technology
Factors identified at the exchange forum were: appropriateness of new technology; viability of new ideas; available technologies; research directions; and the presentation of research results. The survey question would have incorporated most of these factors. However, most of the survey respondents disagreed (54.7%), with only 17.8% agreeing that lack of appropriate technology limits small dairy farm income. One case study farm has been trying new technologies in the past few years (irrigation, feeding, effluent disposal on pasture, new pasture species, forage crops), some of which were found to be inefficient or not cost effective. All but one of the case study farmers indicated in discussion that they were familiar with modern farm management practices and used those they considered appropriate for their system.
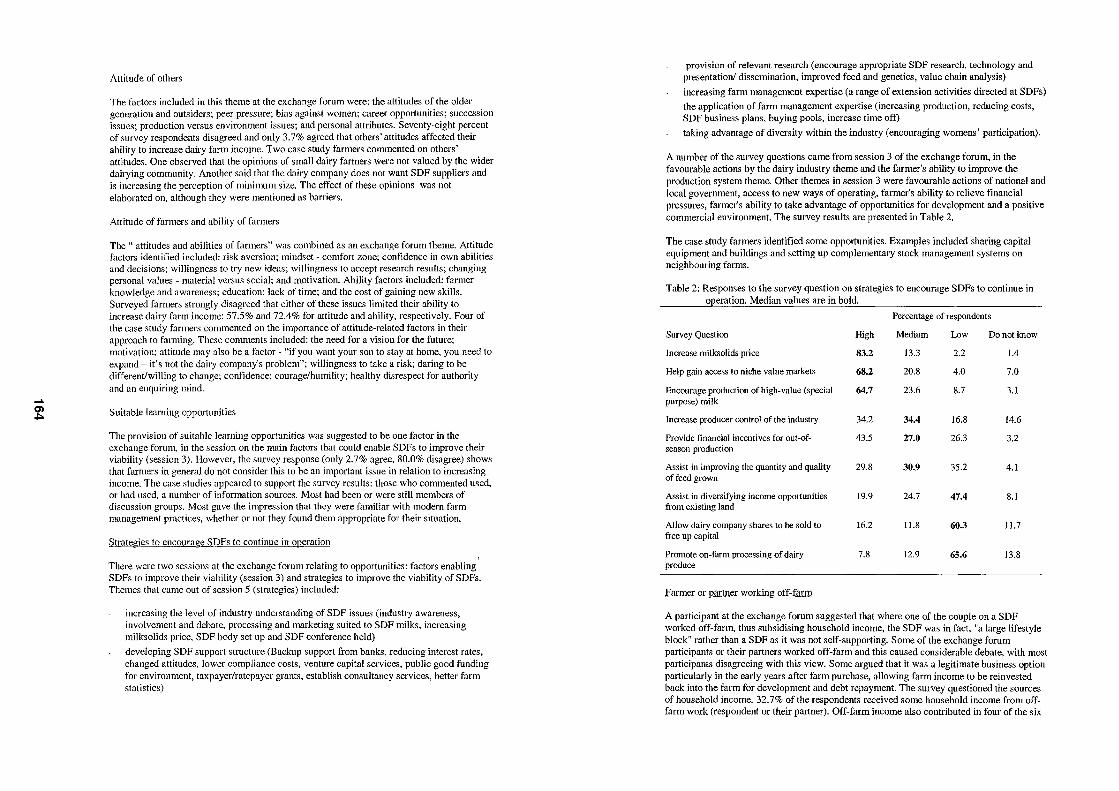
..... 0) ,J::o
Attitude of others
The factors included in this theme at the exchange forum were: the attitudes of the older generation and outsiders; peer pressure; bias against women; career opportunities; succession issues; production versus environment issues; and personal attributes. Seventy-eight percent of survey respondents disagreed and only 3.7% agreed that others' attitudes affected their ability to increase dairy farm income. Two case study farmers commented on others' attitudes. One observed that the opinions of small dairy farmers were not valued by the wider dairying community. Another said that the dairy company does not want SDF suppliers and is increasing the perception of minimum size. The effect of these opinions was not elaborated on, although they were mentioned as baniers.
Attitude of farmers and ability of farmers
The" attitudes and abilities of fanners" was combined as an exchange forum theme. Attitude factors identified included: risk aversion; mindset - comfort zone; confidence in own abilities and decisions; willingness to try new ideas; willingness to accept research results; changing personal values - material versus social; and motivation. Ability factors included: farmer knowledge and awareness; education; lack of time; and the cost of gaining new skills. Surveyed farmers strongly disagreed that either of these issues limited their ability to increase dairy farm income: 57.5% and 72.4% for attitude and ability, respectively. Four of the case study farmers commented on the importance of attitude-related factors in their approach to farming. These conunents included: the need for a vision for the future; motivation; attitude may also be a factor - "if you want your son to stay at home, you need to expand - it" s not the dairy company's problem"; willingness to take a risk; daring to be different/willing to change; confidence; courage/humility; healthy disrespect for authority and an enquiring mind.
Suitable learning opportunities
The provision of suitable learning opportunities was suggested to be one factor in the exchange forum, in the session on the main factors that could enable SDFs to improve their viability (session 3). However, the survey response (only 2.7% agree, 80.0% disagree) shows that farmers in general do not consider this to be an important issue in relation to increasing income. The case studies appeared to support the survey results: those who commented used, or had used, a number of information sources. Most had been or were still members of discussion groups. Most gave the impression that they were familiar with modern farm management practices, whether or not they found them appropriate for their situation.
Strategies to encourage SDFs to continue in operation
There were two sessions at the exchange forum relating to opportunities: factors enabling SDFs to improve their viability (session 3) and strategies to improve the viability of SOFs. Themes that came out of session 5 (strategies) included:
increasing the level of industry understanding of SDF issues (industry awareness, involvement and debate, processing and marketing suited to SDF milks, increasing milksolids price, SDF body set up and SDF conference held)
developing SDF support structure (Backup support from banks, reducing interest rates, changed attitudes, lower compliance costs, venture capital services, public good funding for environment, taxpayer/ratepayer grants, establish consultancy services, better farm statistics)
provision of relevant research (encourage appropriate SDF research, technology and presentation/ dissemination, improved feed and genetics, value chain analysis)
increasing farm management expertise (a range of extension activities directed at SDFs)
the application of farm management expertise (increasing production, reducing costs, SDF business plans, buying pools, increase time off)
taking advantage of diversity within the industry (encouraging womens' participation).
A number of the survey questions came from session 3 of the exchange forum, in the favourable actions by the dairy industry theme and the farmer's ability to improve the production system theme. Other themes in session 3 were favourable actions of national and local government, access to new ways of operating, farmer's ability to relieve financial pressures, farmer's ability to take advantage of opportunities for development and a positive commercial environment. The survey results are presented in Table 2.
The case study farmers identified some opportunities. Examples included sharing capital equipment and buildings and setting up complementary stock management systems on neighbouring farms.
Table 2: Responses to the survey question on strategies to encourage SDFs to continue in operation. Median values are in bold.
Percentage of respondents
Survey Question High Medium Low Do not know
Increase milksolids price 83.2 13.3 2.2 1.4
Help gain access to niche value markets 68.2 20.8 4.0 7.0
Encourage production of high-value (special 64.7 23.6 8.7 3.1 purpose) milk
Increase producer control of the industry 34.2 34.4 16.8 14.6
Provide financial incentives for out-of- 43.5 27.0 26.3 3.2 season production
Assist in improving the quantity and quality 29.8 30.9 35.2 4.1 of feed grown
Assist in diversifying income opportunities 19.9 24.7 47.4 8.1 from existing land
Allow dairy company shares to be sold to 16.2 11.8 60.3 11.7 free up capital
Promote on-farm processing of dairy 7.8 12.9 65.6 13.8 produce
Farmer or partner working off-farm
A participant at the exchange forum suggested that where one of the couple on a SDF worked off-farm, thus subsidising household income, the SDF was in fact, "a large lifestyle block" rather than a SDF as it was not self-supporting. Some of the exchange forum participants or their partners worked off-farm and this caused considerable debate, with most participants disagreeing with this view. Some argued that it was a legitimate business option particularly in the early years after farm purchase, allowing farm income to be reinvested back into the farm for development and debt repayment. The survey questioned the sources of household income. 32.7% of the respondents received some household income from offfarm work (respondent or their partner). Off-farm income also contributed in four of the six
..... en (1J
case study farms. Off-farm income was not an option for one of the other case study farms because of family size. However, family support was an important income source for that family.
DISCUSSION
Differences in medium being used
Three contrasting media were chosen for this study, exchange forum, survey and case studies. Each was used to generate a different perspective on the future viability of small dairy farms. The exchange forum was designed to explore "big picture", wider industry issues as well as on-farm issues. In contrast, case study farmers, interviewed personally, were asked to identify issues that affected them directly (e.g. personal, capital or dairy company related) when identifying barriers. Examples include:
resource consent regulations were identified in the forum and by a case study farmer
only one economic and political factor not directly related to the farmers own business was identified (increasing milk production trends).
international impacts were not identified by the case study farmers.
The survey was positioned between the two other media. It included questions about the impact of wider industry factors but asked them in the context of increasing their dairy income, i.e. an on-farm issue.
Case study interviews were carried out face-to-face, while the forum was deliberately set up so that participants could modify and develop their views as they discussed each topic. The survey was remotely administered and participants knew that their answers would contribute to data which would be statistically analysed. Thus questions in each medium were framed differently. In particular the survey question was couched in terms of the influence and impact of factors on farm income rather than the future viability of SDFs as addressed in the exchange forum. The forum and the case studies identified that future viability of SDFs is likely to be affected by a number of factors in addition to income e.g. costs, capital availability, succession issues, dairy company policies.
Most farmers surveyed agreed that the two exchange forum themes, economic and political factors, and unfavourable actions of the dairy industry affected their ability to increase dairy farm income. These two exchange fmum themes included a number of factors that could directly or indirectly influence milk solids price, and it is therefore not surprising that the surveyed farmers largely agreed with these. Most case study farmers also identified issues relating to unfavourable actions of the dairy industry.
In the survey almost equal numbers agreed and disagreed that environmental limitations, and financial and capital factors affected their ability to increase dairy farm income. The bimodal response to the "financial and capital factors statement" may reflect the stage the business is at i.e. younger farmers with greater debt ancl/or investment needed on-farm compared with older farmer with the farm paid off. However, the two case study farms in the mature stage of the farm business (Massey and Hurley, 2000) both considered lack of capital to be an issue. Both farmers said capital input was needed to make major improvements to, or replace the milking shed if cow numbers were to be increased and this was a limiting factor to increasing production.
The majority of farmers surveyed disagreed that the remaining exchange forum themes affected their ability to increase dairy farm income. Reasons this may have occurred are discussed in relation to particular themes.
The results from three research media are not directly comparable when exploring the question of strategies to encourage SDFs. The exchange forum provided more data than the survey and case studies in response to this question. Survey design limited the number of topics that could be tested and analysed. Surveys offer only limited scope to explore a large number of issues as the size of the survey instrument affects response rate. However, more of the questions arising from the forum could have been incorporated into the survey to facilitate complementarity and enhance the results.
Differences in the nature of questions being asked
Workshops/exchange forums can be used to identify an issue that may have a bearing on the subject being investigated but may not be able to establish its relative importance. Although technology issues were brought up at the exchange forum, they may only have been considered to be important by a few participants. The number of comments made at the forum relating to this issue suggests this may be the situation. Although there was some time spent on discussing this issue, this suggests the discussion of an issue may not reflect its importance. The fact that an exchange forum environment enables discussion of an issue may also mean that participants may reflect further, or possibly even change their views, on an issue and its relative importance as a result. When a participant raises an issue others will find something to contribute, but this may not reflect its relative importance to thell1. In contrast, survey respondents are likely to spend much less time considering the wider view of each question. Respondents are asked to rank concepts/ideas but without discussion - so responses might be superficial and subjective. A forum provides the opportunity for more considered opinions to be developed. Case studie~ are intermediate, in that questions can be more open (asking respondents what the issues are), or closed (asking if something is/is not an issue). Their relative importance mayor may not be indicated (although not necessarily quantified) and may depend on whether respondents are asked directly or not. In the case studies farmers were not directly asked if technology issues were a factor - rather they were asked what the barriers were. Only one of the six case study farmers identified technology issues, having tried a number of different technologies, not all with success. This also suggested that teclmology issues might not be a big factor in limiting SDF viability or income.
Survey-type que~tions and the fact that the que~tion is open to interpretation is very important. It's a matter of both context and the way the que~tion is phrased. In the question on "attitude of others", the farmers surveyed may have interpreted the question differently from the exchange forum participants. This issue was discussed in the exchange forum in relation to barriers to SDF viability, whereas the survey question related the issue to barriers to increasing income. Whereas others' attitudes may affect the viability of the SDF as asked in the exchange forum (e.g. as in succession issues), they would not necessarily impact on a farmer's ability to increase dairy farm income as the survey results suggest. The issues included in the exchange forum theme were also broader than perhaps would have been realised by those answering the survey. Respondents may not consider the extent of the effect of others' opinions (e.g. effect attitude of bank manager on profitability, dairy company to picking up small loads of milk).
It becomes clear that there are at least two components to questions being asked in the research objective. The first is in determining that an issue is a factor in SDF viability. If so, the second is whether or not it has an effect on SDF viability (and if so to what extent). This demonstrate~ the difference~ and potential complementarity of different types of data.
.... Ol Ol
Open ended and 'please comment' questions in a survey often yield interesting information which is not used as part of (he analysis. This may be because the analyst does not have skills in this area, data are not easily or tidily reported, or the data are viewed as a digression from the quantitative analysis. These data may help in the selection of case study participants as happened in this study. Selection of participants may well cause the study to explore in a particular direction.
Factors affectillg change being made
All but a few of the issues identified at the forum may not have been specific to small-dairy fanners, but issues of significance to most dairy farmers. The exceptions are "the industry's attitude to SDFs" and perhaps "access to capital".
Although the proportion of SDFs with outside income contributing to the household is no greater for SOFs than for the industry (Parker et ai, 2000), this source of income appeared to be significant to some of the forum and case study participants. As a SDF can be managed by one person the option of having a partner work off-farm is in fact a manageable and realistic approach to increasing household income, particularly in the early stages of the business where there are higher debt commitments and perhaps development costs.
CONCLUSIONS
Of the themes identified by the exchange forul1J, two were convincingly supported by survey responses and by examples from the case study farmers. The two were that group of factors called "economic and political", largely outside the control of the industry, and "unfavourable actions of the dairy industry". In both of these theme areas the small farmers of the industry survey and the case studies indicated that industry developments, some of which were in response to international pressures, had a negative impact on SOFs. All case study farmers and some who offered comments as part of their survey responses, indicated that there were pressures on them to either become larger or to exit the industry. These together with the significance of off-farm income to SOFs provide the basis of recommendations for further research to validate and quantify any differences that may exist and constitute barriers to viability.
Respondents and participants recognised that there were no easy answers to the economic pressures that have seen average farm size increasing and "small farms" disappearing. Fanners of SOFs see themselves as having managerial skills to enable them to contribute more readily to high-value products, to niche-market processing and to out-of-season processing. However, those farmers perceive this view as being different from the view held by those managing the industry. Further research could be carried out to elaborate on the opportunities to which small-dairy farmers have alluded.
There are reasons why the industry may choose to encourage the "small farm" sector to continue to be merged into larger units, but the industry as a whole needs to consider the implications (Massey and Hurley, 2000). Owner operator and family farms have long been part of the New Zealand dairy farm system, often relying on sharemilking U1Tangements to bridge the capital gap between generations. Current changes to industry structure, whereby access to processing is separated from land ownership by means of share issnes, may facilitate farm succession. However, changes to lower order sharemilking regulations will mean that those gathering resources for farm ownership will face impediments as contract milking and herd management become the preferred mechanisms for obtaining labour on smaller farms.
By way of contrast, the remaining workshop themes were not totally reinforced by survey and case study findings. Not surprisingly, farmers did not agree that technology, their own attitudes and abilities, other's attitudes and being able to take advantage of development opportunities limited the growth of their business or their ability to increase dairy income. There was mixed response to the propositions that "financial and capital factors" and "environmental limitations" are a constraint. The composition of the workshop (a range of industry stakeholders) compared to respondents in the other two phases of the study (farmers of SDFs) is significant, pointing to the need to consider the perspective of farmers of SDFs independently of other influences.
A combination of qualitative and quantitative methods was used in this research (Brannen, 1992). The exchange forum was a medium in which to determine issues that participants considered were relevant, but could not weight their relative importance. The survey and the case studies provided a means of validating or otherwise the findings of the workshop. The design of the research needs to include consideration of the sequencing of processes in relation to the nature of the questions to be asked and the data to be collected. In order to achieve a level of integration of the findings, care must be taken to ensure consistency between data gathered in each phase.
The early view of the research team was that each medium would complement the other. In fact, each phase can be used to build on the findings of the previous phase, enhancing the learning of the researchers.
Dairy industry deregulation may open opportunities for SDFs to supply milk for the development and production of niche products. G1obalCo or a new player in the industry may target specialty markets. The success of Tatua Oairy Company suggests that there could be places in the industry for small-dairy company suppliers of high value products, which may need differentiated milk for their production.
ACKNOWLEOGEMENTS
The study would not have been possible without the many dairy farmer and industry participants. The authors also wish to acknowledge the contributions of other members of the research team - Warren Parker, John Stantiall and Ganesh Rauniyar. The financial contribution of the Foundation for Research, Science and Technology is also acknowledged. The Agricultural & Horticultural Systems and Management Group of the Institute of Natural Resources at Massey University has made time and money available to support this paper. Nicole Patterson of MAF Policy assisted with its preparation.
REFERENCES
Brannen, J. (1992). Mixing Methods: qualitative and quantitative research. A vebury, Aldershot, England.
Massey, C. and Hurley, E. (2001). The strategy context for small dairy farms. Proceedings of the annual educators conference of the New Zealand Strategic Management Society 1 (3):
Parker, W.J., Rauniyar G.P., and Dooley, A.E. (2000). The future for the small dairy farm: plans, priorities and constraints. Proceedings of the New Zealand Animal Production Society 2000. pp 241-246.
SAS (1993). SAS/STAT User's Guide. Gary, North Carolina, SAS Institute. Stantiall, J.D., Massey, C., Hurley, E.M., and Parker, W.J. (1999). Small dairy farms:
strategies for new horizons - Report on a dairy industry exchange forum. Palmerston North, New Zealand: Massey University.
.... ~
Dairy Mergers and the National Interest l
By Robin Johnson'
Summary
In the normal course of events, the merger of the two major dairy cooperative companies and the Dairy Board would require the approval of the Commerce Commission. The Commission, in a preliminary determination in 1999, rejected the case for the merger in terms of the Commerce Act. Subsequently, in December 2000, the cooperatives by-passed the Commerce Commission by presenting their case for the merger and the absorption of the Dairy Board directly to Government. In April (2001), the Government announced that it had accepted the case put forward and, at the time of writing, was still awaiting the results of the required referendum of the dairy farmsuppliers ("the shareholders") for their approval. Legislation is to follow. In this paper, I want to examine the arguments for and against the merger fi'om the national point of view and the proposed regulations that would make the merger more acceptable. We could allow a case that the merger brought some private benefits to dairy farmers if efficiencies can be gained and market returns enhanced above what they would have been. Tins would be all to their good and possibly benefit people in industries downstream from the farms. The question for the government is what action is in the national good? This involves an analysis of all the market inter-actions that would follow the merger and how they would affect the different groups in society as a whole. In its preliminary determination, the Commerce Commission weighed up these negative and positive effects and found the negative case predominated. Hence the subsequent approach to government. At the time of writing, government has agreed to the merger, presumably after due analysis of the arguments for and against. Read on for more details of the case presented and the government's response to it.
The Commerce Commission Approach
The first application for approval of the merger was put to the Commerce Commission. In terms of the Commerce Act 1986 the Commission is required to look at any acquisition in terms of increased market dominance (s 67(3)(a)), and failing that test in terms of whether the public benefits that might follow would justify the acquisition or merger in this case (s 67(3)(b». "The authorisation procedure requires the COimnission to identify and weigh the detriments likely to flow from the acquiring of a dominant position in the relevant markets, and to balance those against the identified and weighed public benefits likely to flow from the proposed merger" (Determination, p.84). This is equivalent to what we would call the national point of view or the
I Paper prepared for Winter Conference of the New Zealand Agricultural and Resource Economics Society, Blenheim, July 6-7,2001. John Pryde has provided helpful comments.
2
national interest. Their analysis gives a good preliminary idea of the scope of such an analysis and the effects which can be documented'.
Their examination is preceded by an interesting discussion of the status quo, i.e. what it is that the future is to be compared with. Two counterfactuals are thus developed and utilised. This bit of discussion is something agricultural economists can get their teeth into. It is followed by a discussion of the particular markets which might be affected.
(I) The status quo counterfactual is not regarded as a standstill in time. Rather, the Commission asks what events would have taken place in the absence of the merger and then puts them in the status quo scenario. Thus the Commission assumes a continuation of the current industry structure (pp.90-91) and of the single desk seller for exports, and that efforts at further structural change within that structure and regulatory framework will continue. Structural changes were thought to include the following: * the unbundling of the payout to suppliers; * improvements to the internal pricing and product allocation mechanism; and * further joint venture developments. Structural change was thought not to include fair value entry and exit, several commercial developments and any further amalgamation (including loss of competition in domestic markets).
(2) There is also a deregulation counteifactual. This envisages the deregulation of the Dairy Board export monopoly, and the emergence of two powerful competing cooperative companies, possibly with overseas links, heavily involved in marketing in competition. In such a process, this counterfactual would include the unbundling of payout to suppliers, improvement to the internal pricing systems, and joint venture developments.
The Commission then proceeded to an examination of the detriments of the proposed merger and the possible benefits against these two counterfactuals. They looked at allocative and productive efficiency changes in the NZ domestic market as a whole. It is worth while spending a minute defining how the Commission saw the different submarkets involved'.
Allocative inefficiency and monopsonistic buying of raw milk: The case concerns the potential detriment arising from the loss of competition between dairy cooperatives in the two geographic markets for the acquisition of raw milk. Using its monopsonistic power, the merged companies could force down the price of milk. This would lead to a restriction of output compared to the competitive outcome. The Commission
'One market not examined is that of the demand for dairy farming land. If bundled payouts disguise the true return to the land factor, then an artificial demand for land suitable for dairy farnring is created. How would we measure a dislocation of resources such as this? 4 The applicants, assisted by NZIER, made submissions on these questions, and may
.... m (X)
3
concluded that, with the information currently available, the fall in the price of raw milk would be in the order of 5-10%.'
Al/oeatiFe inefficiency and the domestic daily products market: About 8% of the raw milk is used by the dairy industry to process products for sale in the domestic market. The merged company would acquire a dominant position in this market except that involving butter. This would give it the power to raise prices and restrict quantity in either counterfactual. There would be a transfer of wealth from consumers to producers as a result. The market size was thought to be about $775m. The Commission concluded that the price rise in the domestic dairy market in which dominance would be acquired was likely to be between 10-20% '.
Productive inefficiency and industlY costs: This conveys the idea that a monopoly producer, in the case of the merged company, may let organizational slack creep into its operation and raise its costs higher than they would otherwise be in a competitive environment. The Commission sawall costs within NZ as exposed to this detriment totalling $1920m a year (collection of milk from farms, manufacturing for export, marketing costs). The degree of exposure was greatest when set against the deregulation counterfactual (competition between the giants would be greater). The Commission concluded (after considerable discussion (pp.103-104», that these costs increases would be of the order of 5-10% of the relevant costs.
Dynamic inefficiency and new technology: Improved new products allow costs of supply to be reduced and also meets buyer's wants more fully. Competition acts as a stimulus to greater rates of adoption of new technology. The NZlER considered that the pressure to satisfy overseas customers' demands with respect to price, quality and timeliness would help maintain dynamic efficiency. The Commission arrives at an estimate of the shift in demand foregone of 1 % of quantity (p.107). To this must be added losses in production systems innovation and in domestic product development and processing. The Commission concludes that foregone efficiency gains could possibly vary between 1-5% of the total costs in each segment.
Box 1 :Summary of Preliminary Estimates of Annual Detriments ($m)
Category Status quo cOllnterfactual Range
Allocative inefficiency 2.4 Productive inefficiency 75.5 Dynamic inefficiency 60.0
Total 137.9
10.0 151.0 300.0 461.0
Deregulation counterfactual Range
2.4 96.0 65.0 163.4
10.0 192.0 325.0 527.0
(Determination, p.109)
The Commission reached the preliminary view, based on the limited information cUlTently before it, that the potential detriments /i'om changes in the allocation of
'This seems to be a transfer /i'om the fmmers as suppliers to fmmers as owners of the cooperative. " They thus discounted the generally accepted hypothesis that the transfer takes place at the average price of export milk (p.lOO).
4
resources would be each likely to be moderate to large, although their actual magnitudes would be clouded in uncertainty (p.1 09). The detriments would fall between $I38m and about $461m against the status quo counterfactual, and between about $163m and about $527m against the deregulation counterfactual (Box I).
Public Benefits
The NZlER identified four groups of public benefits (Determination, p.109-11O): * promotion of industry change
- cessation of pay-out bundling; - integration of marketing and processing stages.
'" promotion of processing and structural efficiencies - reduction of duplication in ancillary activities; - plant production flexibility; - deferral of capital expenditure.
* preservation of single seller marketing '" industry development
- best practices transfers across dairy cooperatives - funding of "industry good" research. - [overseas competitive advantages]'
Promotion of industry change: Gains from the unbundling of returns are rejected by the Commission. A high payout may obscure a low marginal value for milk. It was claimed that there could be an allocative efficiency loss of $20m. The Commission reasoned that its status quo countelfactual allowed for gradual change which would thus include the effects, if any, of unbundling.
The other industry change is integration of marketing and processing. This refers to the transaction costs involved in the present system involving delays in filling orders and negotiating supply contracts with the cooperatives. NZlER estimated savings of $20m for the status quo counterfactual only but the Commission thought the effect over-rated and reduced this to the range $5-15m.
Promotion of processing and structural efficiencies: There are a number of these: * overseas marketing network economies (accepted) * administrative function savings in dairy cooperatives (accepted in part) * administrative function savings in the Dairy Board (accepted in part) * savings in directors' fees (accepted in small part) * savings in insurance (unacceptable) * savings in financing costs (unacceptable) * rationalisation of laboratory testing (unacceptable) * research and development savings (acceptable in part) '" input purchasing savings (acceptable in part though not quantified).
In summary, the savings /i'om a reduction in duplication are estimated to be between $21m and $41m when assessed against the status quo counterfactual and between
, Added by the Commission.
..... CJ) CD
5
$35.5m and $60.5m against the deregulation counterfactual (p.117-l18). In some cases the reasoning was turned down through lack of supporting data.
Plal1t productiollflexibility: These benefits relate to the industly's product mix and the allocation of production between manufacturing plants. NZIER suggested $IOm savings through product mix efficiencies of which the Corrunission accepted half for the deregulation scenario alone. On the allocation efficiencies the Commission was not prepared to allow more than $6m savings against the deregulation scenario given that they were possible without the merger.
Deferral of capital expel1diture: Here the question was whether the merger would allow greater rationalisation of plants and peak flow so that the combined capital expenditure programme could be deferred. Most of the detail on the programme is deleted in the report. NZIER estimated that an annuity worth $l3m would well represent the cost of the programme. The Commission found the general reasoning unacceptable as the savings could be made by other means.
Presel1Jatioll of sillgle seller marketing: TillS relates to premiums that might be obtained in foreign markets by single control of the marketing process (overcoming weak selling or undercutting). It only relates to the deregulation counterfactual as the status quo contelfactual would preserve the Dairy Board expOli monopoly. The Board itself made a strong submission (p.126) on the possibilities of extracting price premiums. The Corrunission thought the strength of the argument presented was diminished by the possibility of new domestic competitors arising in the market place and hence reduced the claimed saving from $40m to $0-20m.
Industry development: NZIER put forward two arguments under this heading: best practice transfers across dairy cooperatives and funding of "industry good" research. The Commission did not see that practice could be improved any more under a merger than it was under present informal methods. Industry good research relates to research on the farm together with TB and purely dairy-related disease control and is partly funded outside the industry through FRST. NZIER argued that in the deregulation counterfactual the merger would prevent a weakening of the industry's funding contribution. The Commission found that there could be a benefit related to the preservation of industry good research but was unclear how it could be quantified.
Overseas competitive advantage: This component related to submissions by the Dairy Bom·d. They considered that the merger "will bring significant benefits to NZ from having a world-leading multinational based here, and would also assist in raising NZ's international profile, and in retaining talented and highly skilled NZers in the country" (p.128). The plan involves entering into alliances with overseas dairy multinationals through joint ventures or exchange of equity. But "neither the applicant nor the dairy Board has attempted to outline to the Commission the public benefits that might flow from these arrangements, nor explain why the proposed merger is required to meet them ..... On the basis of the present very limited information, the Corrunission is not able to attach much weight to the benefits advocated under this heading" (p.129).
6
Box 2: Summary of Preliminary Estimates of Public Benefits per year ($m)
Category Status Quo Deregulation Connterfactual Counterfactual Claimed Accepted Claimed Accepted
Cessation of payout bundling 20.0 0 0 0 Integration of mark'ing &proc 20.0 5-15 0 0 Reduction of duplication 113.6 21-41 123.2 35.5-60.5 Plant flexibility&rationalisation 23.1 0 23.1 \I Deferral of cap expenditure 13.8 0 13.8 0 Single seller effect 0 0 40 0-20 Best practice transfers N/Q 0 N/Q 0 Change in industry good res 0 0 29 0 Overseas trading premiums N/Q 0 N/Q 0
Total 190.5 26-56 229.1 46.5-91.5 N/Q = Not quantified (Determination, p. 130)
Commission's summGlY: The Commission did not think that the savings would be secured in the first year but would be spread over several years. It could not accept on a preliminary basis many of the claimed benefits on several grounds: it was not convinced that they would not be gained in the absence of the proposed merger, insufficient information was provided to substantiate the argument, and there were likely to be pecunimy economies. The benefits obtained were likely to be between $26m and $56m assessed against the status quo counterfactual and $46.5m to $91.5m assessed against the deregulation counterfactual (Box 2). These fall short of the detriments assessed earlier (Box 3).
Box 3: Sununary of Preliminary Estimates of Detriments and Benefits ($m per year)
Category
Benefit Detriment
Author's Assessment
Status Quo counterfactual
26-56 138-461
Deregulation counterfactual
47-92 163-527 (Determination, p. 13 I)
I had to ask myself what would have been the benefits I would have expected from the merger. Economies of scale, reduced transaction costs with the Dairy Board, rationalisation of peak production, better signals from unbundling, and dynamic energy and direction from offshore activities. So I was surprised that the Corrunission rejected the case for payout bundling, deferral of capital expenditure, and overseas competitive advantage. In other categories they took a more conservative line on the size of the savings than those submitted. In the event, the merger protagonists decided not to resubmit to the Commission but to approach Government directly with a different proposal that avoided further attempts at estimation and justification on quantitative grounds.

.....
'" o
7
The quantitative analysis undertaken by the Commission (and the evidence submitted) demonstrated what the main economic arguments were for the merger proposal and where detriments were likely. These detriments, in turn, revealed the market failures where Government might be expected to intervene in terms of the national interest. In late January 2001, Government instructed officials to work with the applicants to resolve those issues which would require continuing regulatory controls, including reference to the Commerce Commission, before final consideration being given by Cabinet.
The Future Role of the Commerce Commission
On 21 December 2000, the Dairy Industry announced a fresh proposal for a merger to create Global Dairy Company (GDC). Key features of the new proposal included:
* avoidance of Commerce Commission scrutiny; * the divesture of Dairy Foods to create competition in the domestic market; * the creation of mechanisms for the establishment of the fair value of the capital
invested by suppliers and the use of capital notes to payout the capital investment of suppliers who wish to switch to other suppliers;
* the creation of a Shareholders' and Suppliers' Council to protect the interests of farmers
* provision after 3 years for the Commerce Commission to review both the domestic wholesale price and the fair value entry and exit price.
The major issue at this point thus concerned the future role of the Commerce Commission. The new proposal may well have met some of the objections raised in the previous Determination and changed the balance of benefits and costs. But more importantly, there was now a principle at stake as to whether the merger regulations embedded in the Commerce Act could be avoided in this case?
Officials commissioned a review of the proposal from outside consultants particularly to assess the possible role of the Commerce Commission (Economics and Law Consulting Limited, II January 2001). The consultants' report, made available on the Internet, observed that the new proposal was more convincing than the arguments presented in 1999. It argued that the Dairy Board was an effective way to maximise the returns from international marketing when there were 400 cooperatives, but that now, this structure was inefficient. Further the costs of splitting the structures between two cooperatives are so high that a merger with the Dairy Board provides the only practical way of achieving vertical integration in the industry. The proposal claims that there are very large benefits from size, full vertical integration and industry wide coordination of manufacturing and marketing strategies.
The proposed changes to the merger plan in terms of the impact on the Commerce Commission's previous conclusions were assessed as follows: * specification, for inclusion in legislation, of a method for fair valuation of capital on
entry and exit to remove barriers to switching [positive] * clearer and more credible specifications of the gains from the merger [positive] * proposed Shareholders' and Suppliers' Council [weak positive] * proposed for 3 year review by the CC [neutral]
8
* allocation of all quota rights to the merged company [negative] * lack of a proposal for tradable shares and payment unbundling [negative]
(Exec Summary p.iii)
The consultants concluded that the new proposal would not have a strong positive or negative impact on the views of the Commission. The proposal did not meet the key concerns of competition policy: the need to create a structure within which viable competition will be present within two years." The proposal does not represent the best deal for New Zealand"! The proposal should be scrutinised by the Commerce Commission for a second time. No doubt this information was available at the end of January when officials reported to Cabinet and were given instructions to negotiate with the protagonists of the proposal on a direct basis with no further reference to the Commerce Commission.
The Regulatory Issues raised by the Proposal
On 26 January the Minister announced that the government accepted the request by the proposed Global Dairy Company (GDC) to avoid the Commerce Commission and stated that a working party would be established to work out ajoint approach to the necessary legislation".
In economic terms, the joint working party was charged with the task of putting forward acceptable rules for the conduct of the different markets which were crucial to the national interest view. In summary these were:
* provision for suppliers to choose their own processor; * provision for entry of possible competitors at the processing level; * restrictions on any monopolistic buying behaviour of the merged company; and * maintenance of an unfettered market at the wholesale point of sale.
It was clearly emerging that freedom of entry and exit to the industry was crucial to official clearance of the merger. Suppliers must be able to change companies without loss so no impediment could be placed in the way of a competitive entrant at the wholesale level obtaining milk supply. The GDC proposal had already proposed mechanisms for the valuation of the capital invested by suppliers and the use of capital notes to make payment under certain conditions. Previously, under the cooperative system, easy access to the capital tied up in the cooperative was constrained by the legislation.
Officials commissioned an outside review of entry and exit conditions in their review of the GDC proposals post 26 January 200 I. On 6 April 200 I, consultants reported back
, This was not without dissent. Treasury reports at the time were discouraging and a number of prominent personalities expressed their views in the papers (e.g. Tony Baldwin). From what I can gather, Treasury objected because (a) it would set a precedent (b) would increase pressure from other industries (c) would increase the risk of bad decisions being made, and (d) ignored the Commerce Commission when it was capable and responsible for calTying out the necessary analysis (E. Post, 21105/01),
... " ...
9
to Government on mechanisms for ensuring fair prices for equity shares by the proposed Global Dairy Company (RepOli of Charles River Associates).
The consultants' view was that GDC had the necessary information to calculate the fair value exit and entry price for its shares. If there were no barriers to entering or exit, then GDC will have the incentives to calculate the fair value price and to implement it. Farmers have to be able to respond to GDC's price signals and GDC has to control entry only through the payout and exit-entry capital requirements that apply to all farmers.
Secondly, the GDC should, in its own interest, endeavour to set a wholesale price for milk that was fair to all suppliers and represented the true value of milk before processing. To set it too high or too low would risk too much milk coming in, on the one hand, or not enough milk as suppliers defected to new wholesalers, on the other. This was a fine judgement that the new company had to make. Once determined on an appropriate basis, the milk price and the fair capital values posted by GDC would provide the basis for the negotiation of contracts between GDC and other firms in the dairy industry.
The Regulatory Package
On the 9th April the Prime Minister and the Minister for Agriculture announced that Cabinet had approved the merger waiver. A comprehensive regulatory package had been developed in consultation with dairy industry officials in order to mitigate any potential negative consequences of the merger. "The dairy industry is unique in its highly regulated structure, marketing and commercial arrangements. Any change will require legislation to give it effect. Exempting the merger from the business acquisition provisions of the Commerce Act would facilitate the early and certain reform of the industry's regulated environment".
The main points of the regulatory package are:
(a) removal of the Dairy Board's sole export rights and repeal of the Dairy Board Act; (b) the application of the Commerce Act is retained after the merger; (c) regulations will provide for entry processes, exit processes, provision for new entrants and provisions for share liquidity; (d) protection for fanners in their role as suppliers; (e) protection for NZ consumers and processors; (f) duration of the regulations'; (g) export rights to designated markets; (h) industry good provisions; (i) other matters.
I will comment on those issues which have been raised in the previous paragraphs above.
,> The regulations restricting GDC's activities would be lifted on an island by island basis where practical, once GDC's market power was reduced. The thresholds in terms of
10
Openness of milk supply market: The issue here is freedom of switching to another processor without value loss or penalties. "The regulations will require that the price for shares, milk and capacity notes for new entrants, and the price for exiters, must be the same, at any time and any given region. This is designed to produce a market based equilibrium between supply and demand for both processing facilities and milk". The merged company must accept all new suppliers who make application subject to capacity constraints as notified. Suppliers may exit by giving notice by the end of February in any year.
The new entrant or exiter will have the option to secure the entry and exit share prices ..... as established by [an independent valuer] the Board. Exiting shareholders will have all their shares, capacity notes and supply redemption rights redeemed in cash or capital notes within 30 working days of the end of the season.
Monopsonistic buying of raw milk: The issue here is that, as the CC surmised, a merged company could payout less than the "true" market price. The regulations will therefore provide for all farmers to be paid the same price for milk in a given catchment area or region. Contracts to supply must be available to all suppliers. A supplier may supply one or more processors. A supplier in a region must be accepted as long as his transport costs are no greater than any other supplier.
Monopsonistic control over supply to the domestic market: The issue here was the merged company could raise charges to domestic users of milk. The NZ Dairy Groups' shareholding in NZ Dairy Foods must be sold". Mainland will be retained. Dairy processors will be protected by a requirement that the merged company sell a certain volume of raw milk each year at a price equal to the price paid to suppliers. It must also supply milk to anyone who seeks it in NZ (up to 110% of the volume of current sales). Provisions will be made for winter milk supply.
These provisions closely follow the Rivers report though it appears they had already been settled somewhat earlier. The key parameters are the exit prices for shares independently valued and the wholesale price of milk. The latter appears to be set at the old farm gate equivalent of each cooperative's area payout. It is not unbundled as the Rivers Report points out. Government has indicated that it would like to see a wholesale market for milk and could regulate to encourage the establishment of such a market.
The Rivers report thought that unbundling was not necessary to maintain efficiency in the industry. There are two cases. The frrst is bundling the return on processing in the payout to farmers. "This need not be predisposed to economic inefficiency because farmers will consider their supply cost of raw milk and their capital requirements as their (marginal) cost of entry. Entry may be too low, too high or just right depending upon a number of factors that include economies of scale. There is no requirement for products to be sold in competitive (commodity) markets for this result to hold. It
" I wonder if this was really necessary given the freedom of switching. Perhaps it was needed to supply a certain critical mass of independence at the early stages of the new market situation. Given that officials forced the industry to allow competitive processing, did the industry really need to offer up Dairy Foods as a pawn?
..... ~
11
remains valid providing that the cooperative is earning a competitive retunl in processing marketing and product differentiation investment and there is open entry and exit." (Report p.4).
The second form of bundling is where the returns from milk in high value markets are bundled together with returns from milk in commodity markets and result in a bundled price to farmers that will predispose inefficient over-production. But the efficient price to farmers is the price in its lowest value use. Any higher returns will be reflected in returns to processing and marketing and therefore reflected in the valuation of these activities. "Cooperative shareholdings are also tied to the milk that farnlers supply, but if the value of any excess returns is reflected ill the capital required of fanners for entry or exit then efficiency can be approximated under the cooperative structure".
Comment
Public opinion (as discussed in the newspapers) appears to accept that the merged company will exploit the local market. "Consumers and food manufacturers want government law changes to limit price rises" (Evening Post April 14). "They say that with 95 % of dairy produce being exported manufacturing and consumers face hikes as the price of milk used domestically keeps pace with offshore markets". "Independent dairy manufacturers ....... have asked Jim Sutton and the GDC Board to require the company to keep local prices about where they are now". This argument appears to be asking for some kind of wedge between export returns and local wholesale prices, an arrangement that has never happened in the past. At some stage, it was even suggested that a "Kiwi share" in the company be created to protect domestic consumers (Evening Post April 24) .
The chairman of Dairy Foods (John Storey) fears market manipulation in the merger (Dominion April 18). Dairy Foods directors' main concern was that Global could advantage Mainland at the expense of Dairy Foods in access to milk, cheese, butter and ingredients and their pricing". "Given the monopoly status of GDC, Dairy Foods will be a taker of plice and terms, making it uncompetitive with Mainland". In an earlier statement Dairy Foods had argued that "GlobalCo has given itself room in its proposal to change the price it offers for milk from area to area, and industry sources fear it will use the provision to up the price of milk and strangle competition" (Dominion April 6).
The wider issue which has not been dealt with concerns the quantification of offshore benefits of the merger. GDC has kept to its own version of the benefits (not unrelated to the original McKinsey propositions). "The business case identifies annual benefits in the order of $3 10m by the end of the third year following the merger comprising the following: '" annual costs savings of around $120m from the elimination of duplicated facilities and activities. These savings are estimated to be achievable immediately but in the first year are offset by one-off rationalisation costs of around $1 OOm; * annual revenue enhancements and productivity improvements of around $70m from the second year of operation. This is due to greater economies of scale and scope
" It is not clear if Dairy Foods is able to buy milk directly from farmers.
12
through the integration of manufacturing activities with marketing and distribution functions; '" the merger also provides the industry with fresh strategic impetus and the ability to exploit new markets, technology and biotech opportunities. From the third year of operation, it is estimated that Global dairy will realise additional benefits in the order of $120m per year"(Merger Summary p.7).
There has not been a lot of material made available to back up these forecasts especially the third one. Unfortunately, the details of the original McKinsey propositions are not available either. We know that these considered overseas amalgamations and the introduction of foreign equity". Of the latter there is no further word but of the former we know discussions have been going on between the Dairy Board and Bonlac in Australia. Perhaps there are a number of others?
I revert to my oliginal position and put forward that it is the dynamic changes in offshore organisation and strategies that will be crucial to the success of the merger. Obviously, officials were thinking somewhat along similar lines and had commissioned another overseas consultants' report on international forces shaping the NZ dairy industry (www.maf.govt.nz/dairymerger). In the second week of May a press release was put out only taken up by Radio NZ (as far as I heard). Promar International (UKbased) was asked to comment on whether GDC would make the NZ dairy industry better placed to compete internationally?
After reviewing major international trends in milk markets, the consultants stressed that the major international companies were undergoing a major period ofre-organisation and concentration. Their focus was on the US and EU markets. There was, therefore, a window of opportunity for NZ to develop market positions in developing dairy markets (Latin America, Asia and the former Soviet Union). The consultants stressed that this opportunity should be taken before it was closed off (by the major internationals). The additional point was made that the old (NZ) structure was too small to operate successfully in these developments. They mentioned the carrying of risks in different markets, resource availability, costs of goods and access to funds. GDC would be able [in all probability] to meet the key bases of competition, and start to achieve the minimum levels of scale required".
" The dairy industy strategy formed in the late 1990s (developed in conjunction with McKinsey and Co) identified three things which must be done: * defend and enhance our competitive advantage as a low cost producer of dairy products; * improve the performance of existing businesses; '" pursue aggressive growth opportunities. With regard to the latter the strategy identified global opportunities that the industry could capture. The key elements were to develop a global ingredients business to dominate global niche markets and to optimise the ingredients network by selling both NZ and non-NZ dairy products. The project team identified the need for the consumer business to be operated independently of the ingredients business with the flexibility to attract external equity in the the future if that became desirable (Merger Summary p.S). "In Cabinet Paper One, it states at para 18 :"On balance, the GDC merger and the associated regulatory package is better than a continuation of the current status quo, a
..... (j
13
Now if McKinsey had isolated these factors we do not know. But having isolated these particular atttibutes of international markets, we are faced with a new counterfactual. What would have happened to the industry s fortunes in the absence of any change ill structures and strategic direction? I think that this counterfactual points downwards" and thus alters the whole benefit/detriment balance pursued by the NZ authorities based on the evidence submitted. Neglecting this component is why the detriments exceeded the benefits in all the presentations for a period lasting over two years! This suggests to me that the proponents did not present their case in the most favourable light or could not quantify what they visualised might emerge.
Conclusions
I. The preservation of and the rules for an unfettered wholesale milk market appears to have been achieved between government and the company representatives. 2. The basis of fair entry and exit values on an independent but market-related basis appears to have been established. 3. Major importance attaches to future strategic directions taken by the marketing arm of the merged company, including the introduction of outside capital. 4. These directions are fundamental to any analysis of the detriments and the benefits of the merger in a national interest analysis . 5. There is not enough detail available to make a final judgement on the basis of the agreement for the company values pre- and post-merger, though the rules for agreement were agreed between the parties and the question resolved. 6.0n the question of dettiments to the national interest, I have the following opinions: a. the sole buyer of milk: the price fall of 5-1 0% implies the company is prepared to cook the books and screw the suppliers; b. the sole wholesaler of milk: the price rise in the domestic market of 10-20% implies the export pmity formula would not be preserved or observed; c: operational slack: the cost increases of 5-10% imply that the present factories under the new management regime would perform less well than they are at present; d: foregone efficiency gains from competition: 'lack of competition would dull the zest for innovation' suggests that the investment programme in new factories would be less , productive than going at innovation separately. In short, I think the detriments case was a pretty weak one and the proper case for the national benefits was never made!
view supported by research commissioned by officials into the dynamics of the global dairy industry". " Officials think so too: "The available evidence indicates that the proposed GDC merger would produce greater net benefits than the current unsustainable industry
14
References
Cabinet Papers (2001)(Unnumbered), Facilitation of the Proposed Dairy Merger: Paper One; Dairy Industry Merger Proposal: Paper Two: Regulatory Package and Tax Provisions.
Charles Rivers Associates (6 April200l), An Approach to Ensuring Efficient Price Setting by Global Dairy Company, Wellington (www.maf.govt.nz/dairymerger).
Commerce Commission (27 August 1999), Draft Determination (Involving a Number of Dairy Companies), ISSN No. 0114-2720, Wellington.
Global Dairy Company (22 March 2001), Merger Summary. Economics and Law Consulting Limited (14 Feb, 2001), Evaluation of the December
2000 Dairy Industry Merger Package from The Perspective Of Competition Policy, Wellington (www.maf.govt.nz/dairymerger).
Johnson, R.W.M. (2000), The Analytics of Dairy Company Amalgamation, This Society.
New Zealand Dairy Group of Companies, Kiwi Co-operative Dairies Limited (undated), The Merger Package.
Promar International (2001), International Forces Shaping the New Zealand Daily IndustlY, United Kingdom (www.maf.govt.nzIdairymerger).
Appendix: The Mechanics of the Merger Process
In my previous paper I set out the analytics of the merger in terms of equal treatment of the shareholder members (Johnson 2000). This had been a sticking point between the respective cooperative companies. The evidence available in the public domain was very limited but hearsay indicated that the NZ Dairy Coop believed it was in a stronger position to bargain and thought that Kiwi suppliers should pay a premium to join the merged company. (This convention had already been utilised when Kiwi took over the Tui company). Later in 2000, the companies agreed on an independent assessment of the merger premiums which might be needed to bring "values" of the respective companies to equality.
I wrote a letter to the Evening Post in Wellington challenging an editorial view that the Kiwi company had effectively taken over the NZ Dairy company (See Box AI). The burden of my argument was that the accounting figures available all pointed in the direction of the NZ Coop having a 25-50 cent per kg !TIS higher "value" than the Kiwi company. To this the Editor replied (or one of her minions): "Figures, in our view, don't tell the whole story. Kiwi's dominance is in politics and philosophy - in other words, commercial imperatives will be of secondary priority". (Evening Post, December 22).
In December, 2000, the two companies published a Merger Package, where, among other things, the procedure for an independent valuation was set out (Merger Agreement, pp.5-6): "(a) Arthur Anderson has been commissioned to determine the respective value ranges of each company expressed as a value range per kilogram of estimated milk solids
... ~
15
Box AI: Letter to Editor of the Evening Post
I refer to the second editorial on December 22nd concerning the merger of the two large dairy companies. You say Kiwi Dairies effectively took over the larger Hamiltonbased NZDG in what dairying politicians say is the deal of the century. How can this be so when in the 1999-00 trading year Kiwi only had earnings before interest and tax (ebit) of$51.8m. compared with NZDG's of$293m.? Even allowing for the fact that Kiwi paid a higher price to its suppliers of 382 cents per kilogram of milk solids compared to NZDG~~ 375 cents, NZDG was operating at lower cost levels than the Kiwi company. In fact the aggregate earnings to shareholders, combining the ebit with the milk supply payment was 396 cents per kg for Kiwi compared with 426 cents for the NZDG company. While there are a number of problems to be solved, as your editorial notes, I do not believe that the Kiwi company is as dominant in the merger as some pundits would have it.
supplied to each company by its supplying share holders in the season ending on 31 May 2001. The valuation will take account of: (i) maintainable annual earnings before finance charges based on historical data provided by each company, and an appropriate P:E multiple determined by reference to a range of companies that are comparable to NZ Dairy and Kiwi, and further adjusted by subtracting the relevant company debt; (li) present values of estimated future cash flows of each company based on cunent information provided by each company and projected forecasts on the basis of common assumptions for the two companies; and will incorporate adjustments for one off items, differences in accounting policies, differences in forecast assumptions and agreed post balance day items. (b) If there is a difference between the respective mid points of those valuation ranges of: (i) 50 cents or more, then the Agreement will terminate ..... (ii) 20 cents or less, then shares will be issued by GDC [equally] ....... on the basis of one share for each kg of ms supplied ....... (iii) between 20 and 50 cents, then the parties shall make such payments ..... so that the difference calculated as "A" in the following formula is eliminated .... :
where A = (B - C) * D
B = ... mid point of the value range ... [between the parties] C = 20 cents D = estimated total no ofkgs ofms supplied ...... by the party with the lower mid point value ...... season ending 31 May 2001."
Readers will recall the mechanics for this were set out in my paper to the Society last year. The Arthur Anderson Report (AA) was released on January 27, 200 I, and they found "Dairy giants' values nicely in sync" (Evening Post, 27 Jan). AA valued Kiwi as being worth between $4.52 and $4.96 a kg of ms supplied, and NZDG as being worth between $4.63 and $4.95 per kg ms. AA "used two methodologies to value the cooperative companies whose annual accounts independent accountants and economists find difficult to analyse because of their complexity and cooperative nature" (Dominion). "The chairmen say that under one methodology, Dairy Group was valued
16
1 cent a share higher than Kiwi, while the other measure put Kiwi 3 cents ahead. When the values were expressed as a value range ...... one methodology put the Dairy Group 5c ahead and the other put Kiwi 4 cents ahead."
In the Evening Post report it was stated" ... AA directors ... said the outcome wasn't surprising given the existing state of the industry under which the export production of both companies was exclusively marketed through the Dairy Board and the two companies accounted for almost all production and had strong incentives to match the other's performance." This appears to refer to the Kiwi case that the Dairy Board payout should be treated as common and the value added by each company should only be taken into account (see Box A2)(see Proceedings pp.54-58).
Box A2: Kiwi View of Comparative Performance
"After presentation of the paper at Blenheim, the Kiwi Cooperative Dairy Company have pointed out that the two measures ofEBIT used in the paper are not comparing like with like. They have suggested that since the NZ Dairy Board Commodity Milk price (CMP) is common to both companies, a suitable comparison ofperfonnance would be the margin earned above the CMP. In terms of the 1998-99 balance sheets, the margin per kg of milk solids turn out to be remarkably similar, viz.:
Margin above CMP pillS Interest less loss on year
Total margin before Interest
Margin above CMP plus Interest less profitlIoss on year
Total margin before Interest
$m 184.3 43.5
(14.0)
213.8
1999-00 $m
317.1 44.9 1.3
363.5
Kiwi NZDG cent/kg $m centslkg 73.8 301.2 78.0 17.4 29.7 7.7 (5.6) (7.9) (2.0)
85.5 323.0 83.7"
1999-00 centslkg $m centslkg
84.0 439.1 77.0 11.9 43.5 8.4 0.3 0.8 0.15
96.2 481.6 85.5
My view was that the EBITs were so different between the companies that it was unlikely that Kiwi had any advantage over NZDC. It now appears that in terms of whatever data that the companies supplied, and the forecasts of earnings therein, over whatever period, and whatever base, that there is little difference in the discounted value of future earnings per kg solids supplied between the companies. Without further access to the data supplied, I can really go no further than state that past EBITs all pointed to an advantage for NZDC. Certainly, if one accepts the Kiwi model based on the Dairy Board payout base, then the prospects for value added may not be so different for the two companies (as my end-note indicated).
.....
...... UI
Regional Variation in Radiata Pine Sawlog Prices in New Zealand
by Mark Bloombergl, Hugh Bigsbi and Richard Sedcole2
I Commerce Division, P.O Box 84, Lincoln University, Canterbury, New Zealand. Email: [email protected]
2 Applied Management and Computing Division, P.O. Box 84, Lincoln University.
Abstract
There is considerable regional variation in market structure and log quality for radiata pine sawlogs in New Zealand, which should be reflected in a corresponding variation in sawlog prices between regions. This paper presents a study of log price variation for three broad categories of domestic sawlogs in four wood supply regions in New Zealand. A survey of log producers was used to gather data on log prices and log quality data. A residual value model was then used to predict log prices that could be compared to actual prices received. The results show that there are significant price differences between some regions, and for some log grades, and that some of these differences can be explained by differences in log quality.
Keywords: sawlogs, radiata pine, prices
BACKGROUND
Estimation of log prices is an important pm'! of forestry valuation. I In New Zealand, the generally accepted method of forest valuation, discounted cash flow analysis, relies on estimates of future log revenues that would be received from harvesting a forest (NZIF, 1999). When evaluating mature or near-mature forests, the estimated log revenue may be the single most influential variable.
There is considerable heterogeneity in the radiata pine log resource throughout New Zealand. Important log characteristics, such as wood density and strength, vary markedly with climate and other site conditions.
In addition, markets for radiata pine logs vary greatly from region to region. The largest and most well-developed regional market for logs is the Central North Island, which still produces over 50 per cent of New Zealand's total annual wood harvest (MAP, 2000). Similarly, Nelson/Marlborough has historically been the most important and well-developed wood supply region in South Island. At the same time, smaller regions, such as Northland, East Coast, and Otago/Southland, are now expanding rapidly as new forests planted in the 1970's come on-stream.
Given regional variation in wood quality and log markets, one might expect this to be reflected by variation in prices paid for logs between different regions. One would also expect that regional variations in log prices would be reflected in forestry valuation reports.
There is evidence that log price variation exists. However, some of this evidence is anecdotal, and regional variation in log prices has never been formally studied in New Zealand. Nor do forest valuation reports in the public domain acknowledge regional log price differences. If regional variation exists, but is not being recognised in the price data used for valuation, this
Forest valuation includes valuation of forests for prospectus promotion, statutory reporting, and sale or purchase.
implies that forests may be incorrectly valued. The purpose of this paper is twofold. The first objective is to examine actual prices paid for radiata pine domestic sawlogs to see if there are statistically significant regional differences. The second objective is to see if regional price differences can be explained by regional differences in log quality.
A HEDONIC MODEL OF SA WLOG PRICES
The hedonic pricing model provides a theoretical basis for the relationship between the price of a good and the attributes embodied in the good (Munn and Rucker, 1994). It has been widely used to model prices of agricultural commodities and factors of production, such as soil (Miranowski and Hammes, 1984), rice (Brorsen et aI., 1984), and forestry stumpage (Puttock et aI., 1990).
The hedonic model can be specified as (Munn and Rucker, 1995):
p=pX+e
where P is the set of observed prices for a good, X is an n x k matrix of attributes relating to the good, P is a k x 1 vector of coefficients reflecting the marginal value placed on an extra unit of each of the k attributes of the good, and e is a random error term.
Typically, a hedonic price is a function of its quality attributes (Lucas, 1975). However, it has also been used to model the effects of contractual or market factors on prices of forestry stumpage, such as regional location, ownership, and sale characteristics (Munn and Rucker, 1995), and market knowledge provided by forestry consultants (Munn and Rucker, 1994) .
Although these contractual and market factors may influence radiata sawlog prices, this paper will concentrate on the relationship between physical attributes of radiata sawlogs, and their observed market prices, as specified in a hedonic price model.
Physical Characteristics Of Sawlogs
Prior to 1980, most domestic sawlogs were sold in New Zealand on a "run of bush" basis with saw-millers taking a random selection of lengths and log qualities, and paying a single price. In the late 70's and early 80's, there was a trend for some sellers to sell logs on a graded basis, and this was formalised by the introduction of a standard log grade classification by the Forest Research Institute in 1985 (Manley and Whiteside, 1987). Table I (next page) shows the standard FRI grade classification for domestic logs. In this classification, sawlogs are grouped into three broad categories- "P", or pruned sawlogs, "S", or framing sawlogs, and "L", or utility sawlogs
Over the last two decades, the selling of logs by grades and by fixed log lengths has become standard practice throughout the whole of the New Zealand industry.
Log size, shape, branching and wood properties, are the main characteristics that define the grade of an industrial log. These characteristics influence the cost of processing the log, the quality of the processed wood that comes from the log, and therefore the market price for the log. Domestic sawlog prices in 1999 varied between $175/m3 for the best P sawlogs, down to $45-60/m3 for L grade sawlogs (Agrifax, 1999).
... " 0)
Table I: "FRI"Grades for Domestic Logs (after Maclaren (2000»
Grade PrunediUnpruned
._-------_ ... _ .. _. PI Pruned only P2 Pruned only
SI Either S2 Either S3 Either LI Either L2 Either L3 Either Pulp Either Maximum permissible sweep Length (m) <3.7 Class 1 SED/8 Class 2 SED "'SED = log small end diameter
Minimum Maximum branch Sweep"'* ~I;:Q'~ (1l1l~~_s..ize (1llll1) ______ ~~~_s ____ . __ ~ 400 0 300 0 400 60 300 60 200 400 300 200 100
3.7~4.8
SED/4 2"'SED
60 140 140 140 No limit
4.9~7.6
SED/3 3"'SED
lor 2
>7.6 SED12
"''''Sweep is the maximum deviation from straightness along the length of the log
----_._--_._-----------_._-----------
The forest industry in New Zealand is currently in a phase where there is considerable expansion in the volumes available for harvesting and marketing. The logs cut from this "new crop" differ significantly from the "old crop" radiata that formed the majority of the log resource in the past (Manley and Whiteside, 1987). The "new crop" includes significant volumes from non~traditional areas such as Otago/Southland, Northland, and theEast Coast of the North Island. The external log and internal wood characteristics of radiata pine vary between regions, and therefore this will contribute to the variation that has already been created by the many different silvicultural regimes used on the new crop .
METHODS
Model Specification
The first aim of this paper is to examine actual prices paid for radiata pine domestic sawlogs to see if there are statistically significant regional differences. The second aim is to see if regional price differences can be explained by regional differences in log quality.
In order to do this, actual sawlog prices and sawlog characteristics were obtained by surveying major forest owners or log traders in four wood supply regions~the Central North Island (CNI), Nelson!Mariborough, Canterbury, and Otago/Southland. The sawlog characteristic data were used to calculate a "residual value" for each sawlog.
Sawlog residual value (RV) is calculated as,
RV = «GV - C) '" CF) + RV
Where GV is the value of green sawn lumber cut from the sawlog, C is the cost of sawing, CF is the sawmill conversion factor from roundwood to sawn volume, and RV is the value of wood residues (non~lumber arisings such as slabwood or chips, and sawdust).
3
The relationship between observed price, residual value and region was specified in a hedonic function of the following form:
Y, = a + b j (XII) + b2 (X,,) + b3(X3,) + b4(X4,) + bs(Xs,) + b6(X6,) + e;
where Y, is the observed log price, Xli is the calculated residual log value for the log sale, X2;,
X3, and X4i are dummy variables for three of the four log supply regions, and Xs;, and X6i are dummy variables for two of the three years covered by the survey (1997, 1998, and 1999). The dummy variables for the years were used to correct for any price variation due to market cycles.
Calculation of Residual Value
Variation in radiata pine sawlog quality has been the subject of considerable research in New Zealand. The links between log quality, log processing, end use and log value, have been expressed in mathematical functions, often within computer models.2 These models can be used to calculate the "residual value" for a sawlog.
For this study, residual values are calculated for Sand L grade logs using SA WMOD, a sawmill simulation model within programme ST ANDPAK (FRI, 1995). For P grade sawlogs, gross log values (sawn lumber plus residue values) were calculated using spreadsheets developed by INTERFACE. 3 Sawmilling cost was then calculated for P grade sawlogs using SA WMOD, and deducted from the gross log value to give a sawlog residual value.
SAWMOD and the INTERFACE model use two sets of input data. The first set specifies sawmill characteristics, including fixed and variable sa wmilling costs, and a price list for lumber and sawmilling residues. The second data set contains log quality and size characteristics. The log characteristics used in the models are those which have proven to be reliable predictors of variable sawmilling costs and lumber outturn for sawlogs.
DATA
Actual sale prices for pruned (P), structural/framing (S), and utility (L) grade sawlogs, were obtained by surveying major forest owners in four wood supply regions. The distribution of participating firms across the four regions, is shown in Table 2.
Table 2: Survey Participants
Central Nelson! Canterbury Otago/ Total North Island Marlborough Southland
No of firms 3 4 3 4 \0
P Grade Log Sales 7 6 3 9 25
S Grade Log Sales 7 9 7 6 29
L grade Log Sales 5 3 3 7 18
2 Much of this research is reported in Elliot (1979), Sutton (1984), Kinimonth (1987), Klitscher et al (1997), Ridoutt (1997) and Cown (1999). INTERFACE, PO Box 7078, Rotorua, New Zealand.
4
....
..... .....
In table 2, the number of firms in the regions does not sum to 10, because some firms sold logs in more than one region. Most survey responses contained some log size and quality data, but typical log specifications did not include all the variables required by the "residual value" models (ie SA WMOD and the INTERFACE model. For example, few of the survey responses mentioned wood density. However, wood density has a marked influence on outturn of machine stress-graded structural lumber, and is a required input for SA WMOD. Where actual sale data were unavailable, log characteristics were estimated from published regional average data (Cown, 1999). Table 3 lists the input variables into the residual value models used in this study.
Table 3: Sawlog Characteristics Used as Inputs to Residual Value Models
Variable P grade S grade L grade
SED (mm) Survey Survey Survey Length (m) Survey 4.9m 4.9m Taper (mm/m) 10** 10 10 Sweep (mm/m) 9** 9 9 Internode Index N/A Regional Average Regional Average
Branch Index N/A Survey Survey Mean Wood Density Regional Average* Regional Average Regional Average
PU Survey N/A N/A
rp/m2 Regional Average N/A N/A
"Note: regional averages were taken from COWll (1999).
~:'".!3:".g~.~".~.i1.~n.E..lIl~f()!_~!'-.~fI::!9.!? .. ().n.1>,-,--_ .. _______ ._ ......... _ ..... _ ...... _ ...................... _ ........... __ ............... ...
For Sand L grade sawlogs, the log small-end diameter (SED) values were the minimum values used in the sale specifications. For the P grade sawlogs, the SED values were average values for the logs within the sale. Similarly, the branch index values for the S grade and L grade logs were calculated from the maximum branch size specification for each of the sales covered by the log price survey. The conversion from the maximum branch specification to branch index used a simple regression function (RL. Knowles pers. comm), as follows:
Maximum Branch Diameter = 1.2523 '" Branch Index
Taper was based on typical taper values for large sawlog aggregations, predicted by a generalised ST ANDPAK run. Taper is not critical to log residual value, and this arbitrary approach was taken, so as to obtain a broadly realistic figure for input into the models.
Sweep was based on the strictest log sweep specification in the survey, which was that sweep was to be less than SED/So For a 4.9 metre sawlog of 350mm SED, sweep would therefore be 9mm/metre or less. For most of the sawlog sales, the maximum sweep specification was twice this value (ie SED/4.)
The survey form requested representative sale price data, preferably from the June or September quarters, over the period 1997-1999. All sawlog prices were set at a uniform price point, which was at mill door. This is the price paid by a sawmil1er for logs delivered to the sawmill. It has the advantage of the reflecting the value of the log in a wider market, rather than a log value that is specific to a particular forest, with its unique combination of distance from sawmills, and harvesting terrain. It is also the log price that is equivalent to the theoretical "log residual value".
For the gross sawlog value calculation carried out by INTERFACE, the assumed sawmill was an "average composite" mill. For the sawlog residual value calculation for S grade and L grade logs, the sawmill characteristics were those used by Whiteside et al. (1989). These sawmill characteristics were also used to calculate sawmilling costs for the P grade logs.
Lumber prices, (used as inputs to the residual value calculation), were based on the March 1999 default price list in programrne STANDPAK. Lumber prices for mid-1997, 1998, and 1999, were calculated by adjusting the March 1999 STANDPAK price list, using the producer's price index (PPI) for framing lumber (Statistics New Zealand, 2000). The adjustment was made, by taking the average of the PPJ's for the June and September quarters.
RESULTS
The prices received for sawlogs were quite variable, even within regions. Table 4 shows the range of prices for the 72 sales covered by the survey.
Table 4: Price Range for Survey Data
Wood Supply Region P Sawlogs ($/m3) S Sawlogs ($/m3) L Sawlogs ($/m3) .................................... ......................................... H ......................
Central North Island 151-190 61-102 65-86
Nelson/Marlborough 125-165 61-109 56-66
Canterbury 135-154 61-82 52-65 . ............................. _-_._------_._-
Otago/Southland 135-175 61-S2 56-76
Two key inputs for calculating residual value for pruned logs, pruned log index (PU) and the density of resin pockets, were generally missing from the data. Of the 25 P sawlog sales covered by the survey data, only three included a pruned log index (PU) value and none included the density of resin pockets. It was not possible to calculate a residual value for the other 22 sales.
Therefore, the analysis of the 25 pruned log sales for regional price differences, excluded residual value as an explanatory variable, using only the dumrny variables for region and year of sale.
In order to carry out some analysis of pruned log residual value, PU data were nsed from five other sales reported in the survey, which were excluded from the analysis of differences between regional log prices. These data were excluded from the main analysis, because they either duplicated sale data from one of the firms participating in the survey, or else they related to sales outside the four wood supply regions, which were the subject of the study. These five sales, plus the three sales in the main data set with PU values, provided eight data for analysis.
Using calculated log residual values from the eight sales, a single variable regression was fitted, using only log residual value as an independent variable. The dummy variables for year were not included as seven out of eight sales were in 1999, and the dummy variables for region were not included due to the small number of data.
.....
...... OG
Table 5 (next page) presents the results of OLS regression of the price data on sawlog residual value, and dummy variables for wood supply region and year of sale. The variables for Otago/Southland and 1999 were omitted from the regression.
Table 5: Hedonic Price Equation Using Residual Value, Region and Year of Sale as Log
Variable Regression Coefficients
P Sawlog- P Sawlog- Regional S Sawlogs LSawlogs
Re~idVal only Variables only
Intercept 6.46NS 147.3** 73.69** 23.6*
ResidVal 0.8074* -0.03 1.01 **
CNI 15.47* 15.55NS 10.9*
Nelson! -0.38NS 24.46* 17.3**
Marlborough
Canterbury 2.48NS 6.55NS 1.25NS
1997 1.80NS -O.296NS 6.73*
1998 0.83NS 8.79NS 4.l7NS
R' 0.637 0.269 0.41 0.901
:j:, "', ** denote that the coefficient is signiticantly different from zero at the 10%,5% or 1% levels ,·f'.<nf'f·hvf>lv
P Sawlogs
The regression of price on residual value provides a reasonably good explanation of the variation in actual log prices for the eight sale data with PLI values. The R' was 0.637 and the coefficient for log residual value was significant at the 5% level. This result is not surprising as the three firms which provided PLI data would most probably not have gone to the expense of obtaining this data unless it were useful for making marketing decisions.
The model using regional dummy variables to explain pruned sawlog price variation had little explanatory value (R-squared = 26.9%). However, the t-statistics for the estimated regression coefficients, indicate that the difference between Central North Island (CNI) and Otago/Southland prices is significant, at the 5% confidence level.
This result reflects the somewhat higher price for P sawlogs from the Central North Island, which on average are approximately $15-$18/m3 higher than P sawlog prices for the other three wood supply regions.
The t-statistics for the coefficients for the date variables, are non-significant. Price levels appeared to be quite stable for P grade logs, between 1997 and 1999.
S Sawlogs
It was possible to calculate a log residual value for all 29 sales of S grade logs, included in the survey data. As can be seen in Table 5, the relationship between actual log prices and
7
calculated residual value was weak for this category of sawlogs. The only significant result was that S grade sawlog prices were significantly different in the CNI and Nelson/Marlborough, than in Otago/Southland. The non-significant results for the year variables shows that price levels were effectively stable for S grade logs between 1997 and 1999.
LSawlogs
As with the S grade price data, it was possible to calculate log residual value on the full set of price data. As can be seen in Table 5, for L grade logs, residual value is a signifcant predictor of actual sales price. When used in conjunction with the dummy variables for wood supply regions, log residual value explains a significant amount of the variability in log prices. The results show that L grade sawlog prices for the CNI and Nelson!Marlborough were significantly different from Otago/Southland.
The results also indicate that there was a statistically significant decline in prices for L grade sawlogs from 1997, coinciding with the Asian crisis. It appears that, unlike P and S grade prices, L grade prices were affected more by the downturn in Asian markets. This may reflect the underlying softness of the export log market, which is the alternative market for large branched sawlogs. S grade sawlog prices, by contrast, may have been supported by strong demand for structural lumber in 1999 (AgriFax, 1999).
DISCUSSION AND CONCLUSIONS
Differences in Sawlog Prices between Regions
Because the regression equation included both log residual value and regional dummy variables, the differences between the coefficients for the regions were due to factors other than differences in physical log attributes .
For P grade logs, CNI price~ were approximately $15-$18 per m3 greater than in the South Island. However, this difference was statistically significant only for the comparison between the CNI and Otago/Southland. This may have been due to the lesser numbers of data for NelsonlMarlborough and Canterbury, as the actual differences between means were similar for all regions.
For S grade logs, prices in the CN! and NelsonlMarlborough were markedly ($10-$ I 7 per m3) higher than in the other two South Island regions.
Significant differences were also found between prices in the CNI and NelsonIMarlborough, compared to prices in Canterbury and Otago/Southland, for L grade logs.
Overall, Central North Island log prices were stronger than other regions for P log grades. This superiority in prices was less marked for Sand L grades, where the NelsonlMarlborough sawlogs fetched the highest prices, after allowing for differences in regional log quality.
Price data were gathered for three years (1997, 1998, and 1999), but the year did not seem to affect price levels for the P sawlogs. There was a noticeable but statistically non-significant dip in S grade prices in 1998, and a continuing decline in L grade prices from 1997 onwards. L grade log prices in 1999 were significantly lower than in 1997.
8
.... ~
Residual Value as an Explanatory Variable for Regional Log Price Differences
As an attempt to explain regional variation in log prices, the calculation of log residual values was only partially successful.
The calculated residual values for P sawlogs were reasonably well correlated with actual log prices (R-squared =64%), but this analysis was only possible for eight sales, involving three companies. Based on the survey responses, it appears that most P sawlog sales by large forest owners, do not have a pruned log index or resin pocket factor as part of the log specification. Therefore it is not possible to calculate a residual value for the log, based on its potential clearwood yield.
The residual value analysis for S grade gave disappointing results. Log residual value had very poor explanatory power in relation to observed log prices.
By contrast with the results for the S grade, the residual value analysis of the L grade sawlogs gave good results. This was possibly because actual log characteristics for logs sold in this grade were closer to the minimum log specifications used to calculate residual value. When log residual value was added as an explanatory variable, to the regression of log price on dummy variables for regions and years, the regression had an R-squared value of 90.1 %. This regression was significant at the I % confidence level, with an F-statistic value of 16.6.
Conclusions
This study has collected evidence of significant variation in prices, between wood supply regions. This evidence shows that in valuing a forest resource, forest managers should account for the region where it is growing, as this will influence the prices received for sawlogs.
Based on valuation documents in the public domain, there is no evidence that regional price differences are being recognised. To validate this conclusion, a more detailed survey of forestry firms and forestry consultants is needed, to determine the sources of data and methods used to compile their in-house log-price data.
The aim of developing models for predicting sawlog prices from their physical attributes was not achieved for P and S grades. Possible explanations for this lack of explanatory power, are that contractual and market attributes of the sawlog sales affected prices ie prices were influenced by differences in market knowledge of firms, differences in sale structure, or lack of competition in the market due to dominance by a few large firm~. The effect of these contractual factors on the survey prices is currently being investigated.
Another explanation for the lack of success in modelling price behaviour lies with the method for calculating residual log values. The inputs to the residual value calculation were either regional average values, or minimum values from the log specifications. These may not have been good estimates of actual average log characteristics. However, they were the best available data. Fore~t owners over the time of the survey, generally recorded neither average log quality characteristics, nor measures of dispersion of these variable~, as part of their log marketing operation.
It is also worth noting that there are no recent published validation studies of SA WMOD, the model used to calculate sawlog residual values for unpruned logs. Although the best available
option for residual value calculation, it is derived from mill studies carried out nearly 20 years ago, and may not reflect current sawmilling technology.
Are firms are now measuring and recording individual log characteristics, and can these measured characteristics be used to predict market values for logs? The major forest owners are moving rapidly towards centralising their log making and distribution, in response to customer demand for increasing differentiation of logs by quality and size (Jayne, 1999a, I 999b ). In tandem with this trend, electronic log-scanning/log measurement technology is now being used by forest owners. This technology allows individual log characteristics to be measured and recorded electronically, during the log making process. Finally, some major forest firms have encountered problems with processing and marketing logs with variable intrinsic characteristics (eg wood density, clearwood percentage), and are now measuring their forests for these characteristics (D.Cown pers comm.).
Given these trends, the accurate prediction of residual log value from log characteristics may soon become possible, using databases of electronically stored log measurements. A first step in this direction, would be to quantify the proportion of log production that is now being produced in centralised locations, with electronic measurement and data capture of log characteristics.
REFERENCES
AgriFax. (1999). Log pricing. N.z. Forest Industries, 30(8): 4.
Brorsen, B. W., Grant, W. R., & Rister, M. E. (1984). A hedonic price model for rough rice bid/acceptance markets. Amer. J. Agr. Econ., 66(2): 156-163.
Cown, D. J. (1999). New Zealand Radiata Pine and Douglas fir: Suitability for Processing. FRI Bulletin no.216. New Zealand Forest Research Institute. Rotorua.
Elliott, D. A. (1976). Mensuration for Management Planning of Exotic Forest Plantations. FRI Symposium No. 20. New Zealand Forest Service. Rotorua.
FRI. (1995). ST ANOPAK Stand Management Decision Support System User Guide. New Zealand Forest Research Institute. Rotorua.
Jayne, V. (1999a). From forest floor to customer door. N.z. Forest Industries, 30(3): 9-11.
Jayne, V. (l999b). Logging in the fast lane. N.z. Forest Industries, 30(3): 7-9.
Kininmonth, J. A. (1987). Proceedings of the Conversion Planning Conference. FRI Bulletin no 128. N.z. Forest Research Institute, Rotorua.
Klitscher, K., Cown D. J., & Donaldson L. (1997). Wood quality workshop 95. FRl Bulletin no. 201. New Zealand Forest Research Institute, Rotorua.
Lucas, R. E. B. (1975). Hedonic price functions. Econ. Inquiry, 13:157-178.
Maclaren, J. P. (2000). How Much Wood has Your Woodlot Got? FRI Bulletin no. 217. New Zealand Forest Research Institute, Rotorua.
MAF. (2000). Estimate of Roundwood Removals from New Zealand Forests Year ended 31 March 2000. SR35/2000. Ministry of Agriculture and Forestry.
.... 00 o
Manley, B. R., & Whiteside, I. D. (1987). Radiata pine resource description by log-grade specification. In Proceedings of the Conversion Planning Conference. FRI Bulletin No. 128, I.A. Kininmonth (ed.), (pp. 27-38). Forest Research Institute, Rotorua.
Miranowski, J. A, & Hammes, B. D. (1984). Implicit prices of soil characteristics for farmland in Iowa. Amer.J. Agr. Econ" 66(4): 745-749.
Munn, I.A, & Rucker, R. R. (1995). An economic analysis of the differences between bid prices on Forest Service and private timber sales. Forest Science, 41(4): 823-840.
Munn, I. A, & Rucker, R. R. (1994). The value of information services in a market for factors of production with mUltiple attributes: the role of consultants in private timber sales. Forest Science, 40(3): 474-496.
NZIF (1999). Forest Valuation Standards. New Zealand Institute of Forestry, Christchurch.
Ridoutt, B. G. (1997). Managing Variability In Wood Quality: Proceedings Of The Second New Zealand Wood Quality Workshop. FRI Bulletin no 202. New Zealand Forest Research Institute, Rotorua.
Statistics New Zealand, (200 I). SNZ 18.504:PPI:Selected Commodity Indexes. Statistics New Zealand, Wellington
Sutton, W. R. J. (1984). Radiata Pine Task Force-objectives, achievements, and implications. In Proceedings of the 1982 New Zealand Forest Products Research Conference. FRJ Bulletin No. 86. New Zealand Forest Service, Rotorua.
Whiteside, 1. D., West, G. G.,& Knowles, R. L. (1989). Use of Standpak for Evaluating Radiata Pine Management at the Stand Level. FRJ Bulletin No 154. New Zealand: Forest Research Institute, Rotorua.
Whiteside, I. D., & McGregor, M. J. (1987). Radiata pine sawlog evaluation using the sawing log-yield model. In Proceedings of the Conversion Planning Conference. FRI Bulletin No. 128, J. A Kinimonth (ed.), pp 124-146. New Zealand: Forest Service
11
.... Q) ....
Land use Change and Forestry Expansion by Smallholders
B. Dhakal, H. Bigsby and R. Cullen Lincoln University
Abstract
Increased investments in plantation forestry by smallholders have occurred during the past decade. This paper investigates the factors that determine whether forestry investments by smallholders occur. Survey data obtained from 349 landholders in four South Island district councils is used to develop answers to the research questions. The extent of land already in use for forestry is compared to the land area assessed by landowners as potentially profitable for plantation forestry. The study indicates that soil quality, property size and availability of off-farm income are important factors in determining whether plantations are established at all. The results also show that there is further potential for expansion of small-scale forestry.
Keywords: forestry investment, land use change, non-industrial forests
Introduction
In New Zealand, the use of smallholders' land for plantation forestry increased noticeably when agroforestry practices became popular in the 1950's and when agricultural products lost their markets in the European Union after 1974. The area of land in plantations again increased after the introduction of the new forestry tax policy in 1991 and a significant increase log prices in 1993. Despite these increase, there are still many landowners with only small or no plantation forests (Agriculture Statistics, 1996; Fairweather, 1993). However, the reasons for differences in landowners' involvement in plantation forestry are not clear.
There have been a number of studies on small-scale or non-industrial land use in forestry that have identified particular factors that are impOJiant decisions about forestry, although the studies are generally not explicitly on the extent of land use plantation forestry. Depending on the objective of the research, these studies look at forestry land use from different perspectives. Some studies adopt a micro view of individual landowner decisions about land allocation. The paIiicular area of interest can be factors like land attributes, or owner and ownership characteristics.
Alig (1986) and Straka et ai (1984) showed positive relationships between household income and investment in forestry in the U.S., and Fairweather (1992) reported the same in New Zealand. Relative profitability of agricultural and forestry output has also been found to be important (Kula and McKillop, 1988; Schirmer et ai, 1999). Nagubadi et al (1996) and Romm et al (1987) found that landowners living on the propelty were more likely to participate or invest in a forestry plantation program, while Alig (1986) reported that land use in forestry was high with landowners based in urban areas. Greene and Blatner (1986) showed that owners of large tracts have
higher areas of forest plantations. The area of interest can also be on investment decisions for multipurpose use (e.g. agroforestry) or changes in existing forests uses (Bell et ai, 1994; Parks and Murray, 1994; Tarp et ai, 1995; Nagubadi et ai, 1996; Thacher et ai, 1997; Geilfus, 1998). A number of studies have also indicated the value of information in the forestry adoption decision (Feder et ai, 1985; Nkonya et aI, 1997; Schirmer et ai, 1999).
Other studies take a macro view and focus on external factors that influence forestry decisions. These factors include government policies towards agriculture and the relative prices of agricultural and forestry output (Kula and McKillop, 1988), and factors that influence the wider market for forest output (Loyland et ai, 1995; Kuuluvainen et ai, 1996; Royer, 1987).
In general, none of these previous studies are specific to smallholders and their decisions about plantation forest establishment and expansion. The purpose of this paper is to present the results of a survey of small landowners that asked questions about current land use, understanding about and intentions for forestry activities, and owner characteristics. The general objective is to understand the causes of land use change in plantation forestry by smallholders, and to identify the key factors that appear to influence the decision of smallholders in forestry plantation expansion.
A Conceptual Model of the Forestry Plantation Decision
A rational landowner's decision problem is the appropriate allocation of land, labour and capital between forestry and non-forestry portfolios in order to attain maximum benefits. In general, landowners are likely to allocate land to forestry if its net benefits are greater than under non-forestry use. However, the decision of whether or not to allocate resources to a forestry plantation portfolio, and if they are allocated, how much to allocate, is a function of a landowner's personal attributes, as well as their investment opportunities.
Investment decisions are likely vary with landowner characteristics such as attitudes, expectations, objectives, experience, age, training, education, access to property, access to information, and property-specific constraints. For example, personal characteristics such as higher income levels and the availability of off-farm earnings are directly related to the level of available investment funds and alternative resource use opportunities. Smallholders potentially have limited investment funds and a capital rationing problem. Moreover, the funds available for investment in forestry compete with current cashflow requirements to support families. Smallholders may be inclined to invest in other projects that quickly produce income rather the deferred income from long-term investments such as forestry. As such, forestry is but one possible investment POJifolio but for most will not be a primary source of income. Land-related factors can also be important, paIiicularly soil quality, as landowners tend to allocate the 'best land' to agriculture and marginal lands to forests. The regulatory environment is also going to have an effect, particulaI'ly land management regulations and taxation, and how an individual perceives their effect on best land use.
..... CO N
Subject to resource, technical, personal and policy constraints, smallholders need to select from alternative investments oppOltunities that fit their circumstances, accounting for both profit and risk. In forestry, investments and returns occur in different time horizons so that income maximisation is an inter-temporal problem. As in other financial markets, smallholders continuously discount the expected costs and returns. Thus an expected net present value is the sum of continuously discounted net profits over time.
Following Shapiro et at (1992) the objective of landowners can be formulated as,
Maximise [(A(PjI j) + (1- A)P2I2)A - C(A,A), G] (I)
where,
A is th~ propOltion of land used for other than forestry and 0 ~ A ~1 Pili is the per area net present value of non-forestry investments Pzh is the per area net present value of forestry investments A is the fixed amount of land available C is a cost factor G is a vector of landowners' attributes and investment opportunities of
specific factors that influence the forestry expansion decision
This research problem is to determine the factors that explain the value of A. If (1-
A*) denotes the optimum solution to Equation I, and is a function of PjI j, PzIz, and G, as well as the joint probability distribution ofPjIj and PzIz, then P~I:' and P;~ can be defined as the expected benefits. Since forestry investment is a long-term consideration, decisions are based on present expectation of profitability in the future. Therefore, the terms P;I:' and P;~ measure perceived relatiye profitability . The model in Equation I can be formulated as,
B=f(R'I\', P,'I~,A,I.G) (2)
where e is (1- A), and L is the second or higher moment of a joint probability distribution function. Equation 2 is the basis of empirical models that include economic, personal, physical and institutional elements of a forestry plantation decision (Parks and Murray, 1994; Shapiro et aI, 1992).
Method
In order to estimate Equation 2 requires an analysis of those who have planted versus those who have not planted. This creates a binary dependent variable (I for those who have planted and 0 for those who have not planted). According to Long (1997), this problem can be formulated ill a logit model as follows:
where,
8 = I = 8* = PXj + ej =0
ifa*>'t ifa*~'t
3
(3)
a is planted forest (a = I if planted forest, otherwise a = 0) 't is the minimum area of forestry (cut off point) X is a vector of explanatory variables (defined in Equation 2)
P is a vector of coefficients. ej is the independently distributed normal random error term
Since 't is a threshold point, if a* ~ 't , then a = O. If a* crosses the threshold 't, then a = 1. In this case no planting means a = o.
Partial changes of the dependent variable measures the change in the probability of planting forestry for a unit change in independent variable (Maddala, 1983). Mathematically this can be written as,
ap = aF(flX ') ax ax f(X'P)P (4)
The partial change is a marginal change of the probability with a unit change of independent variable holding other variables constant.
A change of log of odds is another way of interpreting discrete independent variables. The odds for a binary response equal the number of successes divided by the number of failures (Agresti and Finlay 1997). Mathematically,
olnQ(x) =Pk Oxk
(5)
where In Q(x) = logit (log of odd). In other words, for a unit change in Xk, we expect the logit to change by Ph holding all other variables constant.
All regressions were estimated using Shazam.
Data
Equation 3 requires a number of explanatory variables for forest establishment. Based on the literature review, these variables landowner and land characteristics that would need to come from the landowner. To do this, data for the study was obtained in a postal survey of landowners in early 2000. The questionnaire was divided into four sections covering different areas of interest.
The first section included a range of questions about the property. These included the following,
• size of the property • ownership structure • length of time on the property • type and area of current land uses • perceptions about the relative profitability of forestry on the property
4

..... 0) Co)
• perception about the total area that would be most profitable under forestry • factors that limit establishment or expansion of forestry
The second section covered general questions about the landowner's perceptions of forestry as a land use, including the physical effects of forestry on farming activities, and the relative profitability of forestry. The questions included the following,
• effect of plantation forests on soil erosion, soil fertility and water yield • expectations about log prices relative to farm product prices over the next 20
years • perceptions about the effect of income tax and district council policies on
forestry investment • landowner experience with different agricultural or forestry activities
The third section was only for those who had plantation forests, and asked questions about reasons for plantation ownership, sources of information about forestry, and prior experience with plantation forestry. The questions included the following,
• reasons for planting • date of first forestry activity (planting or purchase) • forestry activity before and after 1993 • sources of information about forest management and marketing • training in forestry • membership in the Farm Forestry Association
The fourth section contained demographic questions such as the respondent's age, occupation, education, income, and place of residence. The questions included the following,
• place of residence • main occupation • average annual taxable income • share of non-farm income • education level • age of principle decision maker
The questionnaire was pre-tested for clarity or misleading questions.
The survey sample was based on landowners in the Hurunui, Clutha, Selwyn and Tasman District Councils in the South Island. Two sources were used to generate the sample population. A key consideration was that to answer questions about the differences between those who have and have not planted, and to look at the differences in the extent of planting by those who have planted, the survey had to include respondents in both categories. First data source consisted of a random sample of 600 landowners (150 in each district) obtained from Quotable Value New Zealand. Since this sample was likely to contain only a few respondents with plantations, a second survey population was developed from members of the Farm Forestry Association in each district.
Out of 840 questionnaires mailed, 405 landowners responded, of which 271 questionnaires were eventually useable.
Results
A wide range of data was collected in the survey, requiring a screening process to identify relevant variables. All variables were initially evaluated using ANOV A for continuous, ratio and interval variables, and the adjusted residuals test for ordinal variables, to eliminate those variables that showed no difference between groups (those who have planted and those who have not planted). The results discussed below cover only those variables that appeared to show a difference in this initial screening.
As was discussed earlier, the planting decision involves a binary dependent variable, making Logit the appropriate estimation method. Based on an initial analysis of the data, the factors that were considered for the estimation (and the variable name) are as follows,
• • •
• •
Landholding size (ha) (LAND) No profit of plantation forestry over other land uses (yes 1, no 0) (PROFIT) Landowner perceives that forestry tax policy encourages forestry (yes 1, no 0) (TAX) Potentially profitable land for plantation forestry (%) (PPLAND) Land tenure type (if the landownership is a partnership 1, otherwise 0) (TENURE)
• Period running the property (years) (PERIOD) • Forestry profitability relative to beef (higher 1, otherwise 0) (BEEFPROF) • Forestry profitability relative to sheep (higher I, otherwise 0) (SHEEPPROF) • Forestry profitability relative to grain (lower 1, otherwise 0) (GRAINPROF) • Share of land in dairy (%) (DAIRY) • Share of land in grain (%) (GRAIN) • Landowner's income level (NZ 70,000 or more, if yes 1, no 0) (INCOME) • Main occupation (if non-farm self-employed I, otherwise 0)
(OCCUPATION) • Expectation of future log price (increase relative to other farm products 1,
otherwise 0) (LOGPRICE) • Perception about the effect forestry on soil fertility (decrease 1, otherwise 0)
(SOIL) • Landowners' experience in grain production (yes I, otherwise 0)
(GRAINEXP)
All ofthese variables were screened for multi-collinearity. The variables that did not pass this test were BEEFPROF with SHEEPPROF, and DAIRYPROF with DAlRYEXP. SHEEPPROF and DAIRYPROF were subsequently dropped Ii'om the regressions.
Based on the choice of variables, the results of two models are shown in Table I. Model II is a nested model within Model I which has the full set of variables. The
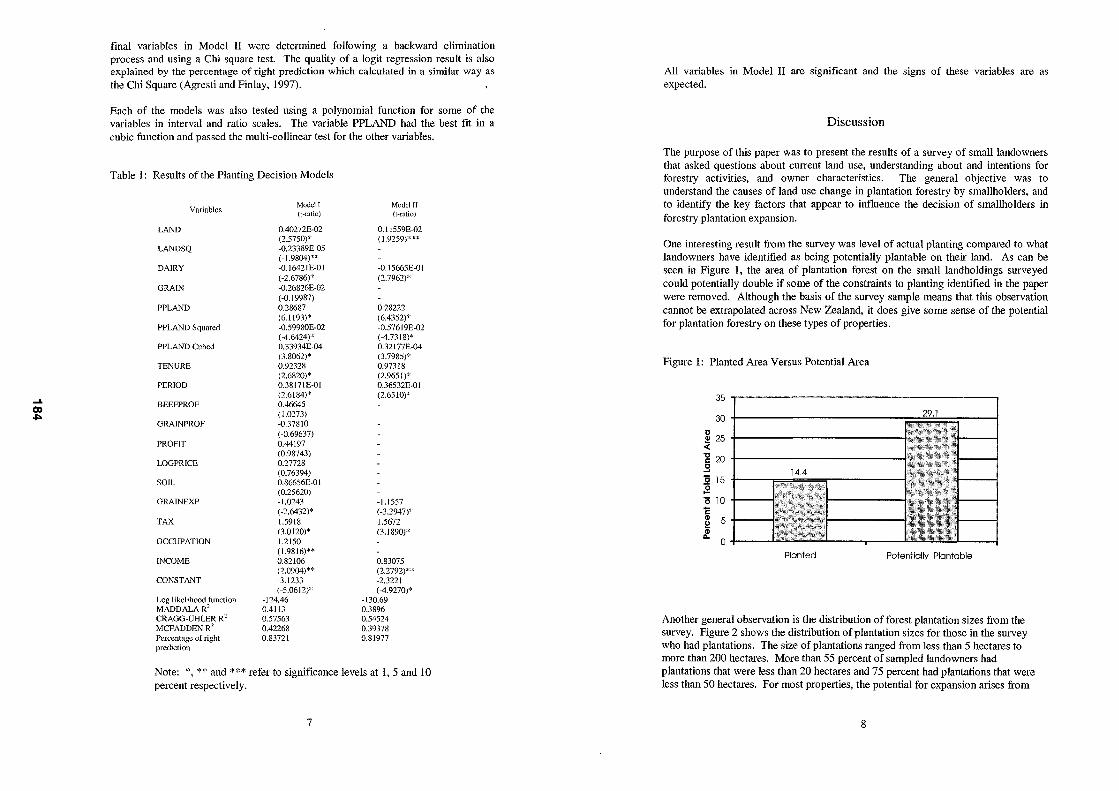
... C» 01:>0
final variables in Model II were determined following a backward elimination process and using a Chi square test. The quality of a logit regression result is also explained by the percentage of right prediction which calculated in a similar way as the Chi Square (Agresti and Finlay, 1997).
Each of the models was also tested using a polynomial function for some of the variables in interval and ratio scales. The variable PPLAND had the best fit in a cubic function and passed the multi-collinear test for the other variables.
Table I: Results of the Planting Decision Models
Variable~
LAND
LANDSQ
DAIRY
GRAIN
PPLAND
PPLAND Squared
PPLAND Cubed
TENURE
PERIOD
BEEFPROF
GRAINPROF
PROFIT
LOGPRICE
SOIL
GRAINEXP
TAX
OCCUPATION
INCOME
CONSTANT
Log likelihood function MADDALAR' CRAGG-UHLER R' MCFADDENR' Percentage of right prediction
Modell (l-fUtio)
0.40272E-02 (2.5750)* -0.23389E-D5 (-1.9804)** -0.1642IE-01 (-2.6786)* -0.26826E-02 (-0.19987) 0.28687 (6.1193)"" -0.59980E-02 (-4.6424)* 0.33934E-04 (3.8062)* 0.92328 (2.6820)* 0.38171 E-O I (2.6184)* 0.46645 (1.0273) -0.37810 (-0.69637) 0.44197 (0.98743) 0.27728 (0.76394) 0.86656E-01 (0.25620) -1.0243 (-2.6432)* 1.5918 (3.0120)* 1.2150 (1.9816)** 0.82106 (2.0904)** -3.1233 (-5.0612)*
-124.46 0.4113 0.57563 0.42268 0.83721
Model II (t-ratio)
0.1I559E-02 (1.9259)***
-0. I 5665E-0 I (2.7962)*
0.28222 (6.4352)* -0.57619E-02 (-4.7318)* 0.32 I 77E-04 (3.7985)* 0.97318 (2.9651)* 0.36532E-01 (2.6510)*
-1.1557 (-3.2947)* 1.5672 (3.1890)*
0.83075 (2.2792)** -2.3221 (-4.9270)*
-130.69 0.3896 0.54524 0.39378 0.81977
Note: *, ** and *** refer to significance levels at 1, 5 and 10 percent respectively.
7
All variables in Model II are significant and the signs of these variables are as expected.
Discussion
The purpose of this paper was to present the results of a survey of small landowners that asked questions about current land use, understanding about and intentions for forestry activities, and owner characteristics. The general objective was to understand the causes of land use change in plantation forestry by smallholders, and to identify the key factors that appear to influence the decision of smallholders in forestry plantation expansion.
One interesting result from the survey was level of actual planting compared to what landowners have identified as being potentially plantable on their land. As can be seen in Figure I, the area of plantation forest on the small landholdings surveyed could potentially double if some of the constraints to planting identified in the paper were removed. Although the basis of the survey sample means that this observation cannot be extrapolated across New Zealand, it does give some sense of the potential for plantation forestry on these types of properties.
Figure 1: Planted Area Versus Potential Area
35
30
~ 25 « 11 20 .9 14.4 :2 15 (:? '0 10 1: Q) 5 !! Q) ...
0
Planted Potentially Plantable
Another general observation is the distribution of forest plantation sizes from the survey. Figure 2 shows the distribution of plantation sizes for those in the survey who had plantations. The size of plantations ranged from less than 5 hectares to more than 200 hectares. More than 55 percent of sampled landowners had plantations that were less than 20 hectares and 75 percent had plantations that were less than 50 hectares. For most properties, the potential for expansion arises from
8
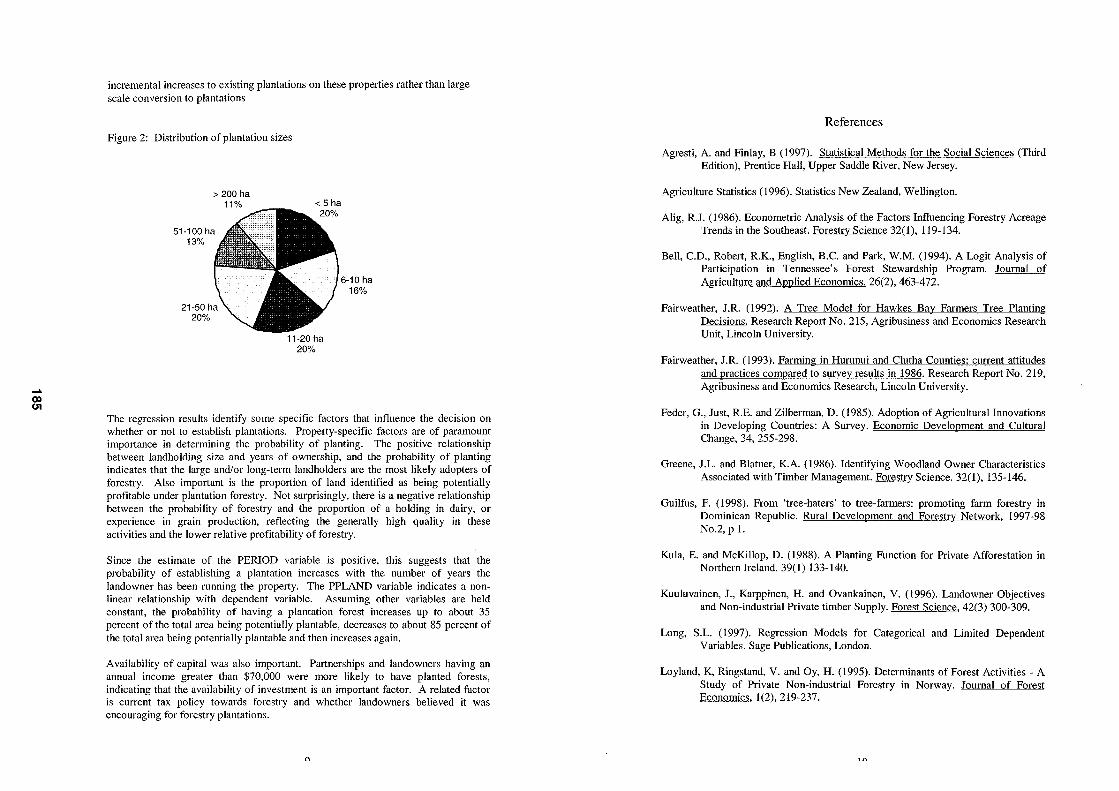
-" (X) (JI
incremental increases to existing plantations on these propelties rather than large scale conversion to plantations
Figure 2: Distribution of plantation sizes
13%
20%
> 200 ha
11-20 ha 20%
6-10 ha 16%
The regression results identify some specific factors that influence the decision on whether or not to establish plantations. Property-specific factors are of paramount impOltance in determining the probability of planting. The positive relationship between landholding size and years of ownership, and the probability of planting indicates that the large and/or long-term landholders are the most likely adopters of forestry. Also important is the proportion of land identified as being potentially profitable under plantation forestry. Not surprisingly, there is a negative relationship between the probability of forestry and the proportion of a holding in dairy, or experience in grain production, reflecting the generally high quality in these activities and the lower relative profitability of forestry.
Since the estimate of the PERIOD variable is positive, this suggests that the probability of establishing a plantation increases with the number of years the landowner has been running the property. The PPLAND variable indicates a nonlinear relationship with dependent variable. Assuming other variables are held constant, the probability of having a plantation forest increases up to about 35 percent of the total area being potentially plant able, decreases to about 85 percent of the total area being potentially plantable and then increases again.
Availability of capital was also important. Partnerships and landowners having an annual income greater than $70,000 were more likely to have planted forests, indicating that the availability of investment is an important factor. A related factor is CUITent tax policy towards forestry and whether landowners believed it was encouraging for forestry plantations.
{\
References
Agresti, A. and Finlay, B (1997). Statistical Methods for the Social Sciences (Third Edition), Prentice Hall, Upper Saddle River, New Jersey.
Agriculture Statistics (1996). Statistics New Zealand, Wellington.
Alig, R.J. (1986). Econometric Analysis of the Factors Influencing Forestry Acreage Trends in the Southeast. Forestry Science 32(1), 119-134.
Bell, C.D., Robert, R.K., English, B.C. and Park, W.M. (1994). A Logit Analysis of Participation in Tennessee's Forest Stewardship Program. Journal of Agriculture and AWlied Economics, 26(2), 463-472.
Fairweather, J.R. (1992). A Tree Model for Hawkes Bay Farmers Tree Planting Decisions. Research Report No. 215, Agribusiness and Economics Research Unit, Lincoln University.
Fairweather, J.R. (1993). Farming in Hurunui and Clutha Counties: current attitudes and practices compared to survey results in 1986. Research Report No. 219, Agribusiness and Economics Research, Lincoln University.
Feder, G., Just, R.E. and Zilberman, D. (1985). Adoption of Agricultural Innovations in Developing Countries: A Survey. Economic Development and Cultural Change, 34, 255-298.
Greene, J.L. and Blatner, K.A. (1986). Identifying Woodland Owner Characteristics Associated with Timber Management. Forestry Science. 32(1),135-146.
Guilfus, F. (1998). From 'tree-haters' to tree-farmers: promoting farm forestry in Dominican Republic. Rural Development and Forestry Network, 1997-98 No.2, pI.
Kula, E. and McKillop, D. (1988). A Planting Function for Private Afforestation in NOlthern Ireland. 39(1) 133-140.
Kuuluvainen, J., Karppinen, H. and Ovankainen, V. (1996). Landowner Objectives and Non-industrial Private timber Supply. Forest Science, 42(3) 300-309.
Long, S.L. (1997). Regression Models for Categorical and Limited Dependent Variables. Sage Publications, London.
Loyland, K, Ringstand, V. and Oy, H. (1995). Determinants of Forest Activities - A Study of Private Non-industrial Forestry in Norway. Journal of Forest Economics, 1(2),219-237.
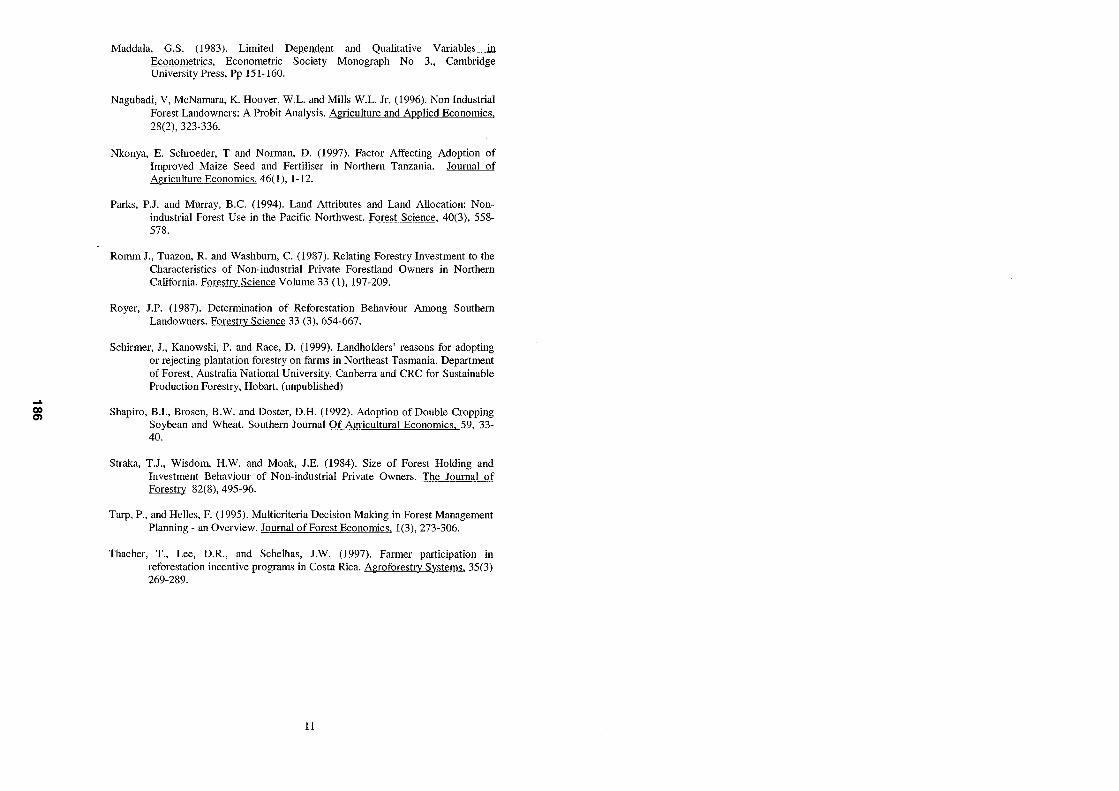
..... Q) 0)
Maddala, O.S. (1983). Limited Dependent and Oualitative Variables in Econometrics, Econometric Society Monograph No 3., Cambridge University Press, Pp 151-160.
Nagubadi, V, McNamara, K. Hoover, W.L. and Mills W.L. Jr. (1996). Non Industrial Forest Landowners: A Pro bit Analysis. Agriculture and Applied Economics. 28(2), 323-336.
Nkonya, E. Schroeder, T and Norman, D. (1997). Factor Affecting Adoption of Improved Maize Seed and Fertiliser in Northern Tanzania. Journal of Agriculture Economics. 46(1),1-12.
Parks, P.J. and Murray, B.C. (1994). Land Attributes and Land Allocation: Nonindustrial Forest Use in the Pacific NOlthwest. Forest Science, 40(3), 558-578.
Romm J., Tuazon, R. and Washburn, C. (1987). Relating Forestry Investment to the Characteristics of Non-industrial Private Forestland Owners in Northern California. Forestry Science Volume 33 (1), 197-209.
Royer, J.P. (1987). Detennination of Reforestation Behaviour Among Southern Landowners. Forestry Science 33 (3), 654-667.
Schirmer, J., Kanowski, P. and Race, D. (1999). Landholders' reasons for adopting or rejecting plantation forestry on farms in Northeast Tasmania. Department of Forest, Australia National University, Canberra and CRC for Sustainable Production Forestry, Hobmt. (unpublished)
Shapiro, B.l., Brosen, B.W. and Doster, D.H. (1992). Adoption of Double Cropping Soybean and Wheat. Southern Journal Of Agricultural Economics. 59, 33-40.
Straka, T.J., Wisdom, H.W. and Moak, J.E. (1984). Size of Forest Holding and Investment Behaviour of Non-industrial Private Owners. The Journal of Forestry 82(8), 495-96.
Tarp, P., and Helles, F. (1995). Multicriteria Decision Making in Forest Management Planning - an Overview. Journal of Forest Economics. 1(3),273-306.
Thacher, T., Lee, D.R., and Schelhas, J.W. (1997). Farmer participation in reforestation incentive programs in Costa Rica. Agroforestry Systems. 35(3) 269-289.
11