Agricultural economics and transition - EconStor
327
econstor Make Your Publications Visible. A Service of zbw Leibniz-Informationszentrum Wirtschaft Leibniz Information Centre for Economics Csáki, Csaba (Ed.); Fogács, Csaba (Ed.) Research Report Agricultural economics and transition: What was expected, what we observed, the lessons learned. Proceedings (Volume I) Studies on the Agricultural and Food Sector in Central and Eastern Europe, No. 44, Part I Provided in Cooperation with: Leibniz Institute of Agricultural Development in Transition Economies (IAMO), Halle (Saale) Suggested Citation: Csáki, Csaba (Ed.); Fogács, Csaba (Ed.) (2008) : Agricultural economics and transition: What was expected, what we observed, the lessons learned. Proceedings (Volume I), Studies on the Agricultural and Food Sector in Central and Eastern Europe, No. 44, Part I, ISBN 978-3-938584-31-6, Leibniz Institute of Agricultural Development in Central and Eastern Europe (IAMO), Halle (Saale), https://nbn-resolving.de/urn:nbn:de:gbv:3:2-18853 This Version is available at: http://hdl.handle.net/10419/45938 Standard-Nutzungsbedingungen: Die Dokumente auf EconStor dürfen zu eigenen wissenschaftlichen Zwecken und zum Privatgebrauch gespeichert und kopiert werden. Sie dürfen die Dokumente nicht für öffentliche oder kommerzielle Zwecke vervielfältigen, öffentlich ausstellen, öffentlich zugänglich machen, vertreiben oder anderweitig nutzen. Sofern die Verfasser die Dokumente unter Open-Content-Lizenzen (insbesondere CC-Lizenzen) zur Verfügung gestellt haben sollten, gelten abweichend von diesen Nutzungsbedingungen die in der dort genannten Lizenz gewährten Nutzungsrechte. Terms of use: Documents in EconStor may be saved and copied for your personal and scholarly purposes. You are not to copy documents for public or commercial purposes, to exhibit the documents publicly, to make them publicly available on the internet, or to distribute or otherwise use the documents in public. If the documents have been made available under an Open Content Licence (especially Creative Commons Licences), you may exercise further usage rights as specified in the indicated licence. www.econstor.eu
-
Upload
khangminh22 -
Category
Documents
-
view
0 -
download
0
Transcript of Agricultural economics and transition - EconStor

econstorMake Your Publications Visible.
A Service of
zbwLeibniz-InformationszentrumWirtschaftLeibniz Information Centrefor Economics
Csáki, Csaba (Ed.); Fogács, Csaba (Ed.)
Research Report
Agricultural economics and transition: What wasexpected, what we observed, the lessons learned.Proceedings (Volume I)
Studies on the Agricultural and Food Sector in Central and Eastern Europe, No. 44, Part I
Provided in Cooperation with:Leibniz Institute of Agricultural Development in Transition Economies (IAMO), Halle (Saale)
Suggested Citation: Csáki, Csaba (Ed.); Fogács, Csaba (Ed.) (2008) : Agricultural economicsand transition: What was expected, what we observed, the lessons learned. Proceedings(Volume I), Studies on the Agricultural and Food Sector in Central and Eastern Europe, No. 44,Part I, ISBN 978-3-938584-31-6, Leibniz Institute of Agricultural Development in Central andEastern Europe (IAMO), Halle (Saale),https://nbn-resolving.de/urn:nbn:de:gbv:3:2-18853
This Version is available at:http://hdl.handle.net/10419/45938
Standard-Nutzungsbedingungen:
Die Dokumente auf EconStor dürfen zu eigenen wissenschaftlichenZwecken und zum Privatgebrauch gespeichert und kopiert werden.
Sie dürfen die Dokumente nicht für öffentliche oder kommerzielleZwecke vervielfältigen, öffentlich ausstellen, öffentlich zugänglichmachen, vertreiben oder anderweitig nutzen.
Sofern die Verfasser die Dokumente unter Open-Content-Lizenzen(insbesondere CC-Lizenzen) zur Verfügung gestellt haben sollten,gelten abweichend von diesen Nutzungsbedingungen die in der dortgenannten Lizenz gewährten Nutzungsrechte.
Terms of use:
Documents in EconStor may be saved and copied for yourpersonal and scholarly purposes.
You are not to copy documents for public or commercialpurposes, to exhibit the documents publicly, to make thempublicly available on the internet, or to distribute or otherwiseuse the documents in public.
If the documents have been made available under an OpenContent Licence (especially Creative Commons Licences), youmay exercise further usage rights as specified in the indicatedlicence.
www.econstor.eu

Agricultural economics and transition:
What was expected, what we observed, the lessons learned
Proceedings (Volume I)
A Joint IAAE- EAAE Seminar
September 6-8, 2007,
Corvinus University of Budapest (CUB)
Budapest, Hungary

Studies on the Agricultural and Food Sector in Central and Eastern Europe
Edited by Leibniz Institute of Agricultural Development
in Central and Eastern Europe IAMO
Volume 44
Agricultural economics and transition:
What was expected, what we observed, the lessons learned
Proceedings
(Volume I)
Edited by Csaba Csáki and Csaba Forgács
IAMO
2008

Bibliografische Information Der Deutschen Bibliothek Die Deutsche Bibliothek verzeichnet diese Publikation in der Deutschen Nationalbibliografie; detaillierte bibliografische Daten sind im Internet über http://dnb.ddb.de abrufbar.
Bibliographic information published by Die Deutsche Bibliothek Die Deutsche Bibliothek lists the publication in the Deutsche Nationalbibliografie; detailed bibliographic data are available in the internet at: http://dnb.ddb.de.
The findings, interpretations, and conclusions expressed in this volume are entirely those of the authors and should not be attributed in any manner to the organisations affiliated with the authors. The editors and IAMO do not guarantee the accuracy of the data included in this publication and accept no responsibility for any consequence of their use.
Diese Veröffentlichung kann kostenfrei im Internet unter <www.iamo.de/dok/sr_vol44.pdf> heruntergeladen werden.
This publication can be downloaded free from the website <www.iamo.de/dok/sr_vol44.pdf>.
© 2008 Leibniz-Institut für Agrarentwicklung in Mittel- und Osteuropa (IAMO) Theodor-Lieser-Straße 2 06120 Halle (Saale) Tel. 49 (345) 2928-0 Fax 49 (345) 2928-199 e-mail: [email protected] http://www.iamo.de ISSN 1436-221X ISBN 978-3-938584-31-6

FOREWORD
Over fifteen years have elapsed since the transition from the centrally planned economic system started in the early 1990’s. During this time agricultural and rural areas of Central and Eastern Europe have undergone profound structural changes with wide variations in the degree of transformation and in the rate of success in creating a competitive market and private ownership based food and agricultural system. By becoming member of the European Union the "transition" in its traditional interpretation has been concluded in ten of the Central East European countries. The transition to market based agriculture, however, is far from completion in Southern and Eastern Europe and especially in the CIS countries. International Association of Agricultural Economists (IAAE) and European Association of Agricultural Economists (EAAE) in collaboration with the Corvinus University of Budapest and with a number of other institutions in Hungary organized an inter-conference seminar on the subject of agricultural transition in Central and Eastern Europe and Central Asia. The major objective of the seminar was to discuss and draw conclusions on the role of agricultural policy in the transition process in the light of actual progress and current situation in Central and East European countries and in formal Soviet States. In addition the contribution of agricultural economics – both from the West and from the East – as a discipline and a profession to the transition process in agriculture were discussed. A specific objective was to identify priorities and means to strengthen the agricultural economics profession in the transition countries and determine research and educational priorities for the future. The seminar was attended by 118 participants representing 26 countries from Europe, North America and Asia. The Seminar was the largest professional meeting organized by the two associations in 2007. Over 110 abstracts were submitted and evaluated by the International Program Committee. In the two days program of the meeting 8 presentations were made during the 3 plenary sessions, 66 papers were presented in the 15 contributed paper sessions in 8 subject categories. In addition there were 15 posters discussed in the poster session and the findings of a World Bank study on distortions of agricultural incentives in the region was the subject of a pre-conference workshop Plenary speakers included Ulrich Koester, Johan Swinnen, Jerzy Wilkin, Zvi Lerman, Eugenia Serova and József Popp-Gábor Udovecz. At the end of the seminar David Colman,
Agricultural economics and transition II
President of IAAE gave a global assessment of the status of agricultural economics discipline and profession, while Csaba Csáki, former President of IAAE made summary comments on major issues discussed during the seminar. This volume includes the plenary and contributed papers presented at the seminar and submitted for publications by the authors as well as the abstracts of the poster papers discussed. The seminar was supported and sponsored by a number of organizations and persons. All of their contributions have to be greatly acknowledged. First the two international organizations IAAE and EAAE have to be mentioned, which provided overall organizational framework and logistical support. The IAAE provided in addition a generous grant to support the participation of young agricultural economists from Central and Eastern Europe on the seminar. On the Hungarian side the Corvinus University of Budapest, the Szent István University of Gödöllő, the Research Institute for Agricultural Economics, the Hungarian Agricultural Economics Association, the Hungarian Association of Agricultural Sciences and the Hungarian Ministry of Agriculture and Rural Development were the major material and organizational supporters. The International Program committee was chaired by David Colman and Csaba Csáki and included Ulrich Koester, Joe Swinnen, Eugenia Serova and Jerzy Wilkin. The local Organizing committee was chaired by Csaba Forgács and István Szűcs and included Zoltán Lakner, András Nábrádi, József Popp, József Tóth, Gábor Udovecz, László Vajda, László Villányi, Krisztina Fodor, Attila Jámbor and Tamás Mizik. Finally IAMO, Halle facilitated the publication of this proceedings.
Budapest, May 7, 2008 Csaba Csáki Csaba Forgács Editors

CONTENTS
Volume I
Foreword ........................................................................................ I Csaba Csáki, Csaba Forgács
1 Introduction: A conference summary
A Joint IAAE-EAAE Seminar summary comments.................................. 3 Csaba Csáki
2 Overall transition development
The profession of (agricultural) economists and the experience of transition ... 23 Ulrich Koester Measuring the success of agricultural transition: An application to Russia...... 44 William M. Liefert Competitiveness in the food industry: A CGE modeling approach to assess foreign direct investment in transition countries ............................. 55 Martin Banse, S. H. Gay, S. Mcdonald, R. M’barek, Johan F. M. Swinnen Policy reform and agricultural productivity in transition countries.............. 66 Hanho Kim, Donghwan An Changes in the structure of agricultural production, farm structure and income in Hungary in the period of 2004-2006........................................ 73 Gábor Szabó Shaping agribusiness and its impact on the competitive environment of agricultural enterprises......................................................................... 82 Věra Bečvářová Transition and foreign trade: The case of the Ukrainian agri-food sector ........ 93 Inna Levkovych, Heinrich Hockmann The development of the hungarian agricultural trade after the EU accession ... 104 Gábor Kőnig

Csaba Csáki, Csaba Forgács IV
3 Country transition experience
Agricultural transition and integration to the world economy: NIS case ...... 117 Eugenia Serova Diversification of rural incomes and non-farm rural employment: Evidence from Russia ........................................................................................ 133 Dmitry Zvyagintsev, Olga Shick, Eugenia Serova, Zvi Lerman Accounting for heterogeneity bias in efficiency models: An application to Polish agriculture............................................................................. 144 Heinrich Hockmann, Agata Pieniadz Transformational crisis, transformational depression in the agriculture. The Hungarian case ............................................................................. 154 Péter Halmai, Viktória Vásáry The main bottlenecks of the rural knowledge transfer in Romania .............. 165 Mária Vincze, Andrea Kölcsey Studying investment patterns in Russian agriculture................................. 175 Raushan Bokusheva, Irina Bezlepkina, Alexander Kupavyc Changes in the Romanian farm structures during transition – Evolution and main determinants ......................................................................... 184 Crina Turtoi, Camelia Toma, Camelia Gavrilescu A time-series analysis of the beef livestock supply in Russia: Implications for agricultural sector development policies .......................... 193 Maria Antonova, Manfred Zeller
4 Land reform
Agricultural recovery in CIS: Lessons of 15 years of land reform and farm restructurin ................................................................................. 205 Zvi Lerman Land market development and agricultural production efficiency in Albania .............................................................................................. 223 Klaus Deininger, Sara Savastano, Gero Carletto, The persistence of the corporate farms: They survived the transition but do they have future under the CAP ........................................................ 233 Laure Latruffe, Sophia Davidova, Gejza Blaas

Contents V
Land use and land reform in some former Central and East European countries ............................................................................................ 243 Katalin Takács-György, Anna Bandlerova, Adam Sadowski Romania: Semi-subsistence farm sector, result of wrong strategic approach?........................................................................................... 253 Lucian Luca
5 Farming efficiency and farming organizations
Farm-level determinants of conversion to sustainable farming practices in the New Members States .................................................................. 265 Adriana Cristoiu, Francisco Cáceres-Clavero, Blanca Lucena-Cobos The economics of farm organization in CEEC and FSU............................ 276 Pavel Ciaian, Jan Pokrivcak, Dusan Drabik The structure of individual (family) farms in Hungary .............................. 286 Anna Burger, Katalin Szép Facing the future: Strategies and investment behaviour of Polish farmers ....... 297 S. Gomez y Paloma, E. Majewski, M. Raggi, D. Viaggi
Volume II
6 Production and value chains
From public to private governance of agri-food supply chains in transition countries: Some theoretical and empirical lesson ....................... 309 Johan F. M. Swinnen, Anneleen Vandeplas Assessing market functioning: The case of the Hungarian milk chain ........... 322 Heinrich Hockmann, Éva Vőneki Modelling dairy farm size distribution in Poland using an instrumental variable generalized cross entropy markov approach ................................ 332 Axel Tonini, Roel Jongeneel Spatial integration on the hungarian milk Market..................................... 342 Lajos Zoltán Bakucs, Imre Fertő Some approaches to the analysis of market structure’s impact in milk commodity chain ......................................................................... 353 Petr Novák

Csaba Csáki, Csaba Forgács VI
A comparative analysis of the meat sector in Hungary and Emilia-Romagna: Performance and efficiency......................................... 361 Cristina Brasili, Roberto Fanfani, Elisa Ricci Maccarini, Irene Monasterolo Bottlenecks and success factors for the introduction of quality assurance schemes in the agri-food secto............................................................... 373 Xavier Gellynck, Bianka Kühne, Adrienn Molnár The impact of trust on co-operative membership performance and satisfaction in the hungarian horticulture ................................................ 382 Lajos Zoltán Bakucs, Imre Fertő, Gábor G. Szabó
Integration of small and medium size farmers by co-operatives in the Hungarian fruit and vegetable sector – A case study................................. 393 Gábor G. Szabó Lessons on vertical collaboration in Ukraine ........................................... 403 Taras Gagalyuk, Jon Hanf
7 Institutions
Promoting sustainable market institutions in the transition economies: The role of international assistance ........................................................ 415 Nancy J. Cochrane Role of research and researchers during transition: Case study of Lithuania............................................................................................ 425 Natalija Kazlauskiene, William H. Meyers Role of state administration in updating land-estate and farm-size conditions .......................................................................................... 435 Maria Fekete-Farkas, József Molnár, István Szűcs The role of professional agricultural economics associations in shaping national agricultural policy: The case of SERiA....................................... 445 Wojciech J. Florkowski Some conceptional thoughts on the impact of social networks on non-farm rural employment .................................................................. 453 Diana Traikova, Judith Möllers, Jana Fritzsch, Gertrud Buchenrieder Repayment performance under joint liability borrowing. Does social capital matter? – Evidence from Armenia ............................................... 465 Milada Kasarjyan, Jana Fritzsch, Gertrud Buchenrieder, Rüdiger Korff

Contents VII
8 Impact of EU enlargement
Agriculture in New Member States – Expectations and lessons learned....... 475 Jerzy Wilkin Hungarian agriculture and EU Accession................................................ 488 Jozsef Popp, Gábor Udovecz Implications of EU enlargement for agricultural markets in the New Member States............................................................................. 509 Myrna van Leeuven, Lubica Bartova, Robert M’barek, Emil Erjavec Structural change and distribution of support in Hungarian agriculture following EU Accession: A preliminary FADN analysis........................... 519 Carmen Hubbard, Szilárd Podruzsik, Lionel Hubbard Consequences of the two record years of cereal intervention in Hungary........ 528 László Rieger, Gyula Szőke Sustainability dimensions and income prospects for farming systems in the New Member States.................................................................... 539 Adriana Cristoiu, Francisco Caceres-Clavero, Blanca Lucena-Cobos Assessing the implications of EU enlargement for CEEC agri-food trade specialization...................................................................................... 550 Dusan Drabik, Lubica Bartova The agricultural export-growth Nexus in the EU-27 an the country risk ...... 560 Maria Sassi The effect of CAP payments on territorial cohesion ................................. 571 Judit Katona-Kovács Factors of efficiency change of assets on the EU-15 and Hungarian farms from 1990s ................................................................................ 581 István Takács, Zsolt Baranyai, Emese Takács The European regional policy in Hungary. An evaluation of the objectives and instruments for the cohesion ............................................ 591 Irene Monasterolo
9 Posters
9.1. Land policy, land use – Structural changes
Land policy and farm efficiency: The lessons of Moldova......................... 603 Dragoş Cimpoieş, Zvi Lerman

Csaba Csáki, Csaba Forgács VIII
Transformation and its impact on structural changes in Polish agriculture ...... 604 Renata Przygodzka, Ryta Iwona Dziemianowicz Change in agricultural holdings structure during the transition period in Slovenia ......................................................................................... 605 Andrej Udovč Large farms in Poland founded on the basis of the prooerty of former state-owned farms (PRGs) ........................................................... 606 Adam Kagan Changes in land utilisation in Hungary since the transition........................ 607 Robert Magda Transformation of agricultural sector of Ukrainian economy: Some social and economic results.......................................................... 607 Elena Borodina, Alexandra Borodina 9.2. Risk analysis and financing
Survival analysis of culling reasons and economic examination of production period in sow cullin ............................................................. 608 Péter Balogh, Imre Ertsey, Sándor Kovács The effect of funding the investments in the Romanian agricultural holdings through the pre-accession programs .......................................... 609 Camelia Toma, Camelia Gavrilescu, Lucian Luca The institutional support of agricultural loans and its role in Czech agriculture.......................................................................................... 610 Lukáš Čechura Technological and economic risk analysis of laying hen breeding applying simulation ............................................................................. 611 Sándor Kovács, Imre Ertsey, Péter Balogh Impact assessment on milk incentive policies in Turkey: Antalya province case .......................................................................... 612 Cengiz Sayin, M. Nisa Mencet, Suleyman Karaman 9.3. Competitveness – Technological development – Consumption
From subsistence to efficiency in the Romanian agriculture during transition............................................................................................ 613 Dinu Gavrilescu, Camelia Gavrilescu Longitudinal study of fruit and vegetable consumption in Hungary ............ 614 Géza Székely, Dénes Pecze

Contents IX
Competitiveness of Polish food sector after the accession to the European Union .................................................................................. 615 Iwona Szczepaniak, Monika Szczególska Agricultural technology adoption and land productivity: Evidence from the rice-prawn gher farming system in Bangladesh................................... 616 Basanta Kumar Barmon, Takumi Kondo, Fumio Osanami


1 INTRODUCTION: A CONFERENCE SUMMARY


A JOINT IAAE-EAAE SEMINAR SUMMARY COMMENTS
CSABA CSÁKI
Professor of Agricultural Economics, Corvinus University Budapest. 8 Fővám tér, Budapest 1093, Hungary. E-mail: [email protected]
Over fifteen years have elapsed since the process of transition from the socialist system started in the early 1990s. During this time, Central and Eastern Europe and Central Asia have undergone profound structural change with wide variation in the amount of transformation in rural areas. In retrospect, it can be seen that the countries that chose to transform their socialized agricul-ture into a private-ownership and market-based system experienced the most positive economic performance. These countries in 2004 became members of the European Union, and left the classical stages of transition behind. Looking at the developments of the past one and a half decade, it is clear, however, that the initial expectations for the transformation in the bulk of the region were overly optimistic and the transition process in agriculture is far more complex than originally envisaged. It is widely recognized, for instance, that the importance of functioning institutions was underestimated at the outset of the transition. Increased social problems and alarming signs of increasing poverty and inequa-lity have also added a new, unexpected, dimension to the transition process. This Seminar provided an excellent opportunity to discuss the process and the status of transition in agriculture as well as to review of the status of agricultural economics profession in the region.
Agricultural economics and transition
4
1 AGRICULTURE IN CENTRAL AND EASTERN EUROPE AFTER ONE AND HALF DECADE OF TRANSFORMATION1
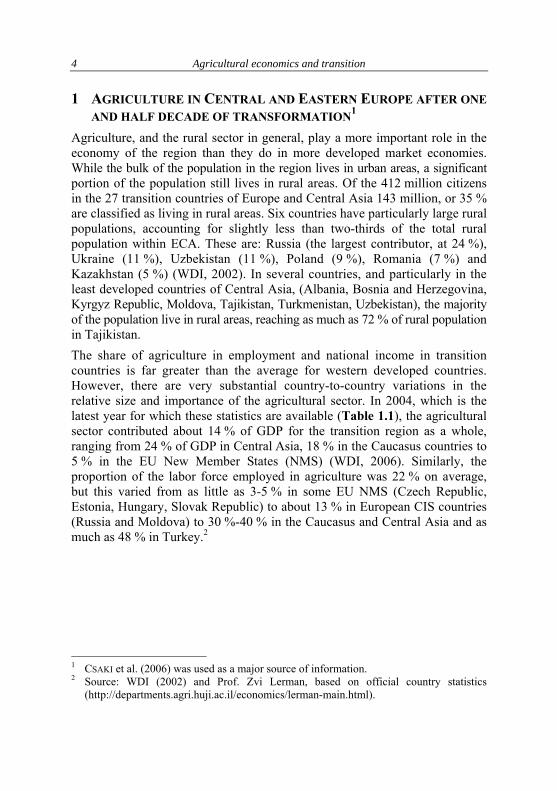
Agriculture, and the rural sector in general, play a more important role in the economy of the region than they do in more developed market economies. While the bulk of the population in the region lives in urban areas, a significant portion of the population still lives in rural areas. Of the 412 million citizens in the 27 transition countries of Europe and Central Asia 143 million, or 35 % are classified as living in rural areas. Six countries have particularly large rural populations, accounting for slightly less than two-thirds of the total rural population within ECA. These are: Russia (the largest contributor, at 24 %), Ukraine (11 %), Uzbekistan (11 %), Poland (9 %), Romania (7 %) and Kazakhstan (5 %) (WDI, 2002). In several countries, and particularly in the least developed countries of Central Asia, (Albania, Bosnia and Herzegovina, Kyrgyz Republic, Moldova, Tajikistan, Turkmenistan, Uzbekistan), the majority of the population live in rural areas, reaching as much as 72 % of rural population in Tajikistan. The share of agriculture in employment and national income in transition countries is far greater than the average for western developed countries. However, there are very substantial country-to-country variations in the relative size and importance of the agricultural sector. In 2004, which is the latest year for which these statistics are available (Table 1.1), the agricultural sector contributed about 14 % of GDP for the transition region as a whole, ranging from 24 % of GDP in Central Asia, 18 % in the Caucasus countries to 5 % in the EU New Member States (NMS) (WDI, 2006). Similarly, the proportion of the labor force employed in agriculture was 22 % on average, but this varied from as little as 3-5 % in some EU NMS (Czech Republic, Estonia, Hungary, Slovak Republic) to about 13 % in European CIS countries (Russia and Moldova) to 30 %-40 % in the Caucasus and Central Asia and as much as 48 % in Turkey.2
1 CSAKI et al. (2006) was used as a major source of information. 2 Source: WDI (2002) and Prof. Zvi Lerman, based on official country statistics
(http://departments.agri.huji.ac.il/economics/lerman-main.html).

Introduction: A conference summary
5
Table 1.1: Share of agriculture in GDP, 1990-2004, in percent3 1990 1995 1998 2000 2003 2004
Total CEE+CIS 20.5 21.1 17.9 16.2 14.4 14.0 Total CEE 13.8 13.2 12.5 10.8 9.9 10.1 Total CIS 27.2 29.0 23.4 21.5 18.9 18.0 New EU Member States (8) 11.3 7.1 5.9 5.1 5.0 4.9 EU Accession Countries (2) 20.5 17.5 17.5 13.5 12.5 12.5 Other CEE (5) 9.5 15.0 14.0 13.8 12.3 13.0 Euro CIS (4) 25.8 18.0 16.5 16.5 12.3 12.3 Caucasus (3) 24.0 40.3 27.0 21.7 19.3 17.7 Central Asia (5) 31.8 28.8 26.6 26.4 25.2 24.0 OECD 3.0 2.5 2.5 2.4 2.3 2.2
Source: WDI (2006).
Table 1.2: Percentages of arable land and world population (2003) % of World Arable Land % of World Population
Total ECA 19.9 8.0 Total CEE 3.4 2.1 Total CIS 15.0 4.2
Source: WDI (2004).
In relation to the region’s share of world’s agricultural resources, the role of the transition region appears to be relatively significant. The ECA countries comprises 13 % of the world’s area suitable for agricultural production and 20 % of the world’s arable land (Table 1.2). The region makes a substantial, yet less than proportional, contribution to world output in practically all of the main agricultural products. On average, this contribution is over 10 %. However, their contribution to global wheat, meat and milk production is closed to 20 %. The importance of ECA countries in world agricultural production decreased in the early 1990s as a result of the transition. Recently some crop and livestock production has regained its pre-transition share of world production (Figure 1.1).
3 "EU NMS" are Czech Republic, Hungary, Estonia, Latvia, Lithuania, Poland, Romania,
Slovakia and Slovenia. "EU Accession Countries" are Bulgaria and Romania. "Other CEE" are Albania, Bosnia-Herzegovina, Croatia, FYR Macedonia and Serbia and Montenegro. "European CIS" are Belarus, Moldova, Russia and Ukraine. "Caucasus" are Armenia, Azerbaijan and Georgia. "Central Asia" are Kazakhstan, Kyrgyz Republic, Turkmenistan, Tajikistan and Uzbekistan.
Agricultural economics and transition
6
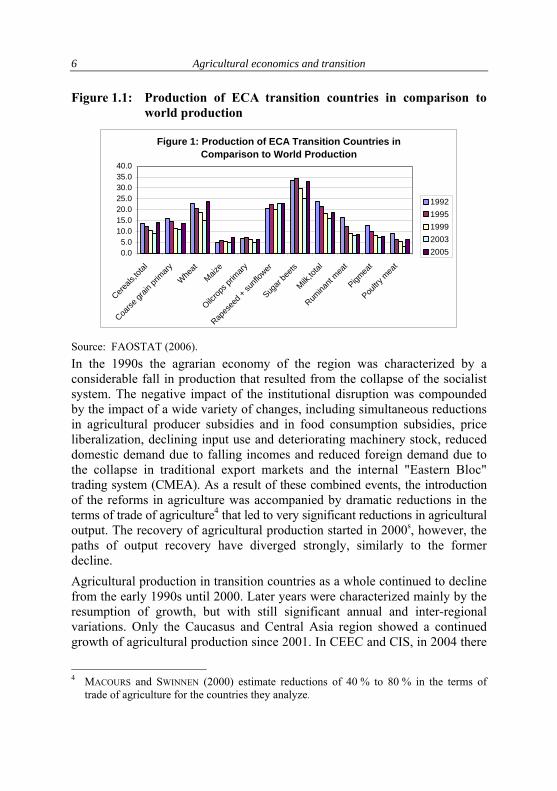
Figure 1.1: Production of ECA transition countries in comparison to world production
Figure 1: Production of ECA Transition Countries in Comparison to World Production
0.05.0
10.015.020.025.030.035.040.0
Cereals
,total
Coarse
grain
prim
ary
Whe
atMaiz
e
Oilcrop
s prim
ary
Rapes
eed +
sunfl
ower
Sugar
beets
Milk,tot
al
Rumina
nt mea
t
Pigmea
t
Poultry
mea
t
19921995199920032005
Source: FAOSTAT (2006). In the 1990s the agrarian economy of the region was characterized by a considerable fall in production that resulted from the collapse of the socialist system. The negative impact of the institutional disruption was compounded by the impact of a wide variety of changes, including simultaneous reductions in agricultural producer subsidies and in food consumption subsidies, price liberalization, declining input use and deteriorating machinery stock, reduced domestic demand due to falling incomes and reduced foreign demand due to the collapse in traditional export markets and the internal "Eastern Bloc" trading system (CMEA). As a result of these combined events, the introduction of the reforms in agriculture was accompanied by dramatic reductions in the terms of trade of agriculture4 that led to very significant reductions in agricultural output. The recovery of agricultural production started in 2000s, however, the paths of output recovery have diverged strongly, similarly to the former decline. Agricultural production in transition countries as a whole continued to decline from the early 1990s until 2000. Later years were characterized mainly by the resumption of growth, but with still significant annual and inter-regional variations. Only the Caucasus and Central Asia region showed a continued growth of agricultural production since 2001. In CEEC and CIS, in 2004 there
4 MACOURS and SWINNEN (2000) estimate reductions of 40 % to 80 % in the terms of
trade of agriculture for the countries they analyze.

Introduction: A conference summary
7
was a significant output growth, while in other years of 2000s the growth was rather modest or even negative. Overall growth patterns have been different in the major sub-sectors. Recovery in the crop sector has been very strong since 2000. Especially the cereal sector accounted for this growth. On the other side, the decline in the livestock sector has continued, though in a much slower space than in the 1990s.
Figure 1.2: Comparison of Cereal Yields, in tons per ha, average for 2000-2005
Source: FAOSTAT (2006). Serious improvements in performance and efficiency still have to take place in these countries. The gap between global agricultural development and regional performance remains very large, particularly with respect to the levels of efficiency in OECD countries, as indicated by an international comparison of cereal yields (Figure 1.2). This gap is particularly large when considering CIS countries, but also applies to some of the CEE countries, as indicated by the levels of yield well below world averages and considerably lower than in the EU. Agricultural productivity in CEE countries has started to grow since the mid 1990s and is expected to increase further with EU accession both because of the economic conditions that will have to be fulfilled and because of the improved access to capital, technology and know-how as a result of the enlargement. Nevertheless there is no consensus about the speed and extent to which these increase in productivity will materialize. Agricultural technology levels did not improve much in recent years and can not be considered as adequate yet. In general, the decline in the terms of trade and the reduction in agricultural output prices led to dramatic reductions in input use in agriculture. For the region as a whole, the use of fertilizer inputs

Agricultural economics and transition
8
has remained more or less unchanged at only about 20 % of pre-reform levels. An upward trend can only be observed in the EU NMS and some large farms in Ukraine and Russia. A wide and growing divergence between CIS and CEE countries can also be observed in the availability of agricultural machinery. On the whole, the region’s agrarian trade is becoming steadily integrated into the agrarian trade of the world and the European region. This process is, however, not problem-free; outside of the EU, the internal trade is often distorted by protectionism and policy induced non-tariff barriers. In the great majority of the countries concerned, a liberal agrarian trade policy is also assisting in the integration of the countries of the region into world agrarian markets. Many of the CIS countries are members of the WTO, or their admission is pending. The obligations accompanying the impending EU membership and partnerships for many CEE and European CIS countries are also having a great influence on their trade policies in the last years.
2 OVERALL LESSONS OF THE REFORM PROCESS The relative inefficiency of agriculture is one of the most important challenges facing the countries of the former Soviet Union and Central and Eastern Europe. During the socialist era, agriculture and food production were determined by government planning, without regard to efficiencies or comparative advantage. Input provision was often dominated by a few state-owned firms, in a monopolistic position. Similarly, a few inefficient state buyers with strong monopsonistic power dominated marketing channels. The large-scale livestock and crop cooperatives were unsuited to market-based private agriculture. Creating viable private farming based on private ownership of land, and allowing market signals to determine levels and types of production have been some of the most difficult tasks of the transition period. In 1990-91 the region set out on the path of creating market economies based on private property. The members of agricultural economics profession both from the West and from the East were very active to provide advice and assist the countries to design and implement the measures required by the transition. In all countries the most important basic elements of the reform process have been:
• the liberalization of prices and markets, the creation of a market-compatible system of conditions in the macro agrarian economy;
• the privatization of land and transformation of the inherited economic structure;

Introduction: A conference summary
9
• the de-monopolization and privatization of food processing and trade in agricultural products and capital goods;
• the creation of a functioning rural bank system; and
• the establishment of the institutional structure and system of state administration required by market economies.
There has been little difference between one country and another in terms of what needs to be done. The initial advice on the required transition measures was definitely appropriate. However, there are quite big differences among countries when it comes to the pace of realization and the manner of implementation. The progress achieved by individual countries in the path of creating a market based agriculture is quite diverse. A World Bank analysis identifies four groups of countries in the region based on a 1 to 10 scoring system reflecting progress from a centrally planned system to full scale market economy (CSAKI et al., 2006). Obviously the highest scores were achieved by the 8 new EU member countries prior to their accession to the European Union in 2004 .These countries successfully completed all the major tasks of transition by the time of accession. According to the 2006 year analysis, countries belonging to the advanced reformer group (total reform score above 7.0) continued their progress in reforming their agricultural policies. It is not surprising that this group is led by the two recent EU member countries, Bulgaria and Romania. It has to be mentioned, however, that – according to the World Bank indicators – their level of preparedness is less than the level reached by the EU-8 countries prior to accession. In this group we also find Albania, Armenia and Kyrgyz Republic, which implemented significant reforms in the late-90s but since then have not progresses further. Progress in Serbia and Montenegro is quite remarkable, but not surprising taking into account the history of this country. The performance of the moderate reformer group (total reform score below 7.0 and above 5.0) is less homogeneous regarding the direction of change. Bosnia-Herzegovina, the Russian Federation, Ukraine and Moldova made measurable progress in their agricultural reforms in 2005. Azerbaijan and Georgia reversed significantly, indicating the slowdown of reform progress for the last year. The slow reformer group (total reform score below 5.0) also includes Tajikistan which has backtracked in many significant reform areas during the last years. Belarus and Turkmenistan has had little change to its agricultural policy framework and basically operate with a rather low degree of market-oriented reforms. At the same time, Uzbekistan has made the measurable progress in rural finance and institutions.

Agricultural economics and transition
10
Regarding the individual country groups, some further observations can be made:
• The possibility of EU membership has accelerated reforms in the EU acceding and candidate countries, notably in Romania, Bulgaria, and Croatia that were lagging somewhat behind the new EU member counties. The agriculture policy agenda in the CEE is characterized by efforts to complete the transition, to cope with increased social problems in rural areas, and to adjust to the evolving CAP. Unfortunately the task of facilitating increased competitiveness has often been stymied by farm lobby demands to provide immediate protection in the agricultural sector and to provide income transfers to farming populations.
• In the CIS countries the reform process has generally proceeded at a much slower pace, although there are positive exceptions. Distortions continue in the production, pricing, and marketing of "strategic" products, and the system of institutions and instruments of the planned economy has not yet been fully dismantled in most countries. Only moderate progress in agricultural reforms has been achieved in the core countries of the CIS (Russia, Ukraine, Kazakhstan), although recently measurable progress has been achieved. Some of the smaller countries in the CIS such as Armenia, Azerbaijan, and Georgia, which had accelerated the reforms in the previous few years, have not taken further steps in 2005. At the lower end of the reform scale, Uzbekistan also made some progress. On the other hand, nearly a decade after the beginning of the transition, Turkmenistan, Tajikistan and Belarus have still remained in the framework of planned economy.
Beyond these broad patterns, a few major qualifications can be made regarding the general experience of the transition process so far, confirmed by the seminar deliberations as well. Overall, the results of the reforms have not yet met initial expectations. The relatively rapid growth of production that characteri-zed the Chinese reforms has not occurred. This has been both because the transformation of the economic structure has proved to be a far more complex than originally envisaged and because in most countries the pace of reforms has been, at best, uncertain. Specifically the following can be stated:
• The transformation of the economic structure has been difficult. This is due, largely, to the incomplete creation of the basic element of farming, the private farm. In the CIS, to a large extent, the inherited large-unit structure has survived the changes.
• The introduction of the legal and institutional framework needed for the smooth operation of markets has also proved to be a highly complex and politically difficult task, and arguably still constitutes one of the largest

Introduction: A conference summary
11
obstacles to the growth of the sector. It is widely recognized that the importance of functioning institutions was underestimated at the outset of the transition. In the year to come, the reform of institutions will determine the sustainability of agricultural development in the ECA region. However, this problem has had implications well beyond the transformation of the agricultural sector.
• Many issues related to land markets remain unresolved, particularly in CIS countries, and this compounds the sluggishness of the process of change in agricultural structures.
• Surprisingly, the biggest progress has been achieved in the price and market liberalization, while there is a substantial lag in solving the financing problems of agriculture, the liberalization of agroprocessing and input supply, and in the area of institutional reforms.
• In all countries the process of agricultural reforms has been strongly influenced by day-to-day politics. Very often, politics have been and still are determining the pace and extent of reforms, at the expense of economic rationality. In general, there is a lack of a carefully considered, long-term strategy, and an objective and realistic evaluation of the economic consequences of the different possible solutions. As a result, the short-term economic costs associated with the process of transition have been greater than necessary, even in the most advanced countries. Generally, the best progress has been achieved in countries that have reformed radically and rapidly rather than gradually, despite the short-term adjustments difficulties. In most cases, the appeals for a gradual approach appear to be a sign of the lack of will; this is especially the case in the CIS countries.
• More generally, the pace of transformation of the agrarian sector and the rural economy is lagging behind the rate of changes in the economy as a whole. As in western countries, the farm lobby has often successfully stymied the task of facilitating increased competitiveness in the agricultural sector, by pressing for the provision of immediate protection to the agricultural sector and for income transfers to farming populations.
In addition, the following lessons can be drawn from the analysis of the experience of the countries leading the transformation:
• The general economic upswing will likely assist governments to undertake agricultural reforms. The greatest progress has been made in transformation of the sector by those countries where the general economic recovery has also begun.

Agricultural economics and transition
12
• Development in the non-agricultural segment of the rural economy is of key importance to the recovery of agriculture. In the great majority of the countries most advanced in reform, it has been the upswing of the rural economy surrounding agriculture that has made possible a substantial reduction in the numbers of people employed in agriculture, and at the same time, an improve-ment in the efficiency and competitiveness of agriculture itself.
• An important factor in the degree of success of the reform process is the consistency in the introduction of the reforms and the combined imple-mentation of parallel steps in areas related to reforms.
• The degree of progress in the reform of the overall economy has strongly affected the agricultural transition, because of the improvements in the stability of the reform process, increase in access to capital, technology and know-how, and stimulating private initiative and the entrepreneurial climate.
3 CRITICAL ISSUES OF TRANSITION AND OF THE CURRENT SITUATION
The presentations made in the course of the seminar confirmed that there are a number of uniform issues, which are characteristic for the whole region though there are continuing differences in the progress of reforms and in the situation in the agriculture sector.
(a) Liberalization of market and trade policies has been implemented to a much greater degree in CEE countries compared to the CIS countries. In most CEE countries, the macro-economic environment for agriculture that is characteristic of market economies has been developed. The prices and the system of regulations are open, more or less, to world market influences. Agricultural policy developments are fully determined by the EU membership, or by the process of accession to EU. State intervention in both price formation and trade policy remains much more direct in the majority of CIS countries. It is noteworthy that in most of these countries, agriculture is still net-taxed and suffers serious losses as a result of the current set of price policy and trade restrictions (especially export controls and taxes), which prevent it from compe-ting in world markets. This is in spite of the frequent proclaims of support for agriculture. It would appear that governments are trying to make agriculture continue to bear the burden of providing cheap food for the urban population. There has been significant progress on movement toward a more liberal agri-cultural policy in Russia. In Ukraine, the interfering of national and regional

Introduction: A conference summary
13
authorities in the functioning of the agricultural sector has been unfortunately increased.
(b) EU accession has made a tremendous impact upon the agriculture sector of the new member countries. Predictions upon impacts were not fully accurate. EU agricultural policies and the geographical proximity of one the largest single market for agricultural products in the world have a continuous impact upon agricultural and trade policies in all the countries of the region. Obviously the greatest degree of EU influence can be observed in those countries which recently become members of the EU or in the process of accession. Prior to the membership of the first large group of CEC countries several forecasts were made upon the impacts of enlargement in agriculture. This was a topic of many seminars and discussions. Predictions were not fully accurate.A number of papers discussed the first experiences with EU membership in the NMS. On the whole consumers and agricultural producers both in EU-15 and NMC benefitted from the enlargement. The tremendous impact of enlarged markets and increased competition were not properly foreseen on prices and supply. The introduction of CAP has increased farmers income and farm profitability in all the NMCs. Impacts in the individual countries however depended upon the quality of the process of preparation for the membership as well as pre-accession agricultural policies. The progress after accession has been less satisfactory in those countries which in the pre accession period focused on price and income support rather than being targeted to improve structural efficiency and competitiveness of the agricultural sector to allow it to take full advantage of the access to the EU market.
(c) Privatization of land and the related reorganization of the large farm units have almost been completed in most Central European countries. It still remains a relevant subject in practically all CIS countries. Currently, however issues beyond privatization are in the focus of attention. Several papers presented at the seminar discussed the outcomes and lessons of land reform and land privatization .In the CEE countries, the privatization of land based on some form of restitution is largely approaching completion. A varied mix of small and large units characterizes the new farm structure. Almost all the agricultural land has been privatized and a significant portion is used by individually managed smaller farms. The existing large scale farming have undergone significant change, became privately owned, and adapted to market economy conditions. In some countries, the legal settlement of land ownership relations is not yet completed, and the establishment of land registries

Agricultural economics and transition
14
and the emergence of a market for land remain priority areas for further reform. In a few countries, a heated debate is ongoing regarding the ownership of land by companies and foreign nationals. Although land ownership in the key CIS countries (Russia, Ukraine) has formally been transferred into private hands, the larger farms still remain intact. An increasing number of large corporate farms, based on leased land have emerged, especially in Russia and Ukraine. In these countries the role of independent private farming remains relatively small, not least because of the deterrent effect of the undeveloped market relations. Often, the policy climate in these countries openly discriminates against individual private farms. Due to the high political and economic sensitivity of land reforms, radical changes have been carried out in only very few countries of the former Soviet Union. This is the case for Armenia, Georgia, and Kyrgyz Republic where independent private farming now dominates. In Uzbekistan and Tajikistan private ownership of land is still prohibited by the constitution and the current leasehold arrange-ments add additional uncertainty.
(d) Though the agriculture of the region has huge potential comparative advantage in many areas, the utilization of these potentials are constrained by limited competitiveness in the farming sector. The region has rather significant potential for agricultural production .This potential is still underutilized. A significant progress can be observed in some of the NMCs which were able to increase both production and exports, while in the CIS the recovery of agricultural production still has to come. There are a number of impediments limiting the competitiveness of the farms in the region which were also discussed on the seminar. In CEE countries the fragmented land ownership and the lack of effective farm consolidation together with restrictions on land ownership and land markets are serious impediments. Many of these countries are suffered by the "small farm-large farm" dilemma. Perspectives for the family farms and the future of corporate farms are not clear either. In the CIS countries the lack of essential public goods, the shortage of financing and capital together with the absence of a transparent support policy framework represent the major bottlenecks.
(e) Privatization and modernization of agroprocessing and input supply has been advanced in most countries with the exception of some of the CIS countries. In the new EU member countries privatization of the agricultural environment was carried out in keeping with the principles of the privatization in general,

Introduction: A conference summary
15
already in the 90s. Some lag can be observed in Romania, Bulgaria and the countries of ex-Yugoslavia. In several of the new EU member countries, significant foreign direct investment (FDI) has flown into modernizing the agroprocessing sector. The share of total FDI directed to the agro-food sector is around 15 % on average, with the vast majority of the agro-food FDI going into agro-industry rather than primary agriculture. Investments have been attracted by the relatively cheap labor costs and the integration in the EU market, but also by the extent of liberalization and transition to a market economy. Together with the privatization of the agroprocessing industry there has been a significant increase in vertical sectoral integration. This process, which has often been the result of the influence of foreign investment, has taken various forms and has brought about improved access to capital, inputs and technology for farms. Agribusiness firms in an effort to ensure a regular flow of high quality raw materials, have introduced a number of arrangements to encourage farmers to greater production and better marketing and to overcome constraints which have hindered economic activity since the onset of the transition. Foreign companies have played a leading role in the development of these arrangements. In most of the CIS countries a less effective solution was adopted for the privatization of the food industry and agricultural input suppliers. In the course of privatization, unlike the other areas of the economy, priority was given to agricultural producers, giving them majority ownership of these branches, on special terms or entirely free of charge. Contrary to expectations, this solution did not result in new, well-capitalized owners and more favorable conditions for agricultural producers. In fact, the technological decline of the food industry accelerated and because of the complicated ownership structure it became extremely difficult to involve foreign capital. In the last few years, however, progress in the privatization and de-monopolization of the agropro-cessing industry has resulted in restructuring and increased efficiency of the food-processing sector. An emerging recovery based on the restructuring of ownership is observed especially in Russia and Ukraine.
(f) There is a rapid restructuring of food and agriculture markets and major restructuring of food retail system. The last decade has brought major changes on markets around agricultural producers in the region. The so called retail revolution is taking place in most of the countries. The move of products from the field to the consumer is being vertically integrated .So called product chains are controlling every elements of these systems .Some of the farms, especially the small ones are having

Agricultural economics and transition
16
major difficulties to link to newly emerging chains and to participate in the restructured markets. The EU enlargement resulted in increased regional speciali-zation in the processing industry and the creation of regional procurement systems by the retail sector. The adjustment to these new circumstances requires cooperation and collective action on the farmers side in marketing and supporting, facilitating policies on the public side. Presentations on the seminar provided several examples of emerging value chains in the region and cases of successful marketing cooperation of farmers on restructured markets.
(g) Lack of agricultural financing continues to be one of the most serious constraints to agricultural growth. This is still a major problem both in many CEE and CIS countries. In the CEE countries, the financing of agriculture has improved considerably since 1994, but still remains relatively weak. The new private financing institutions are require managerial capacity building and are financially vulnerable. In the recent years, however, a significant share of the banking sector became foreign owned – this resulting in improved efficiency and profitability. The creation of an agriculture-oriented rural banking network has been progressing, resulting in the establishment and increasingly active operation of agricultural credit co-operatives and financial institutions specializing in rural areas. In the great majority of CIS countries, however the rural financial system is not yet fully adjusted to the needs of a marked based privatized agriculture similar to that in developed countries. The emerging private banks, however, provide an increasing amount of financing to the agricultural sector. The beginnings of a system of agricultural credit co-operatives have appeared in the countries most advanced in the transformation of agriculture, namely Armenia, Georgia and recently also Moldova, and the number of loans extended by the processing industry is also growing.
(h) Institutional reforms proceed slower than all other reform areas throughout the region. Institutional reforms have accelerated in CEE countries since 1995, stimulated by the challenges of EU accession. Despite these tangible developments, the institutional system of agriculture requires further transformation in these countries. Reforms toward the ability to effectively integrate into the common market and to operate the EU Common Market Organization still remain the most pressing priorities. In addition to technical and human capacity building in public administration, further qualitative development is required in practically

Introduction: A conference summary
17
all areas of the institutional systems for market-oriented agriculture, including consulting, training, and research. In several CIS countries a vaguely restructured institutional system of the former centrally planned economy continues to operate and to hinder the transformation of the sector. In other CIS countries, the state has not taken a different role, but merely withered away . Due to the general economic recession and disruption it has been unable to fulfill some of the key roles for the development of a market economy. As a result there have been fundamental disorders in the operation of the institutional system, including in enforcing the rule of law, in collecting taxes, and establishing the basic conditions for macro-economic stability. Underpaid and unmotivated civil servants often strive to supplement their incomes through corruption. Training and research centers suffer from severe financial problems. In some countries they receive little or no financial support from the government budget. However, the overall stability, accountability and efficacy of the institutions in the region appear to be improving, and significant improvements can be observed in some individual countries.
4 AGRICULTURAL ECONOMICS IN THE REGION The seminar provided an opportunity to assess the status of agricultural economics profession as well as the progress in research and education in the field of agricultural economics in the region. Presentations from made by authors from the region demonstrated the results of recent changes in the profession .The research in agricultural economics is becoming more empiri-cal but on the whole it is still overwhelmingly descriptive and provincial. Quantitative methods of analysis are used more frequently and effectively. Researchers in the region use surveys and sophisticated methods of statistical analysis more often. One can observe the first signs of integration with general and resource economics and increased level of multidisciplinarity. Problems of rural development are traditional subjects of research in Central Europe, while they represent a new area for research in the CIS countries In most of the countries agricultural economists continuously support policy making with analysis and projections. Agricultural economics in the region still in an early phase of integration into the main stream of profession in the OECD countries The young generation of CEE agricultural economists leads this change and becoming visible on international conferences and international projects. The names of authors
Agricultural economics and transition
18
from the region unfortunately can be still rarely found in major international journals and in the program of prominent international meetings. There is however an increased number of participants from the region in Western European agricultural economics PhD programs but only a few can be found at US universities. The EU enlargement opened new opportunities for joint projects and for various forms of trainings in EU 15 countries. IAMO in Halle, Germany plays a major role in the change of profession in the region by conducting research on the problems of region with the participation of CEE scholars and by the training of a significant number of PhD students from transition countries. Future priorities for the agricultural economics in the region are:
• further integration into the main stream of developed agricultural economics,
• increased emphasis on empirical analysis, the use of analytical approaches and advanced methods of policy analysis and projections,
• opening towards the problems of rural development and multidiscip-liniarity,
• quality improvements in the teaching of subjects of agricultural economics including the reform of curricula,
• further upgrading of local PhD programs and facilitating the graduate study abroad of the best of the young generation,
• strenghtening quality requirements and control in the agricultural economics research,
• maintaining traditional relations including exchange of information among the agricultural economists of the region.
REFERENCES BROOKS, K., LERMAN, Z. (1994): Land Reform and Farm Restructuring in Russia. World Bank Discussion Paper No. 233, The World Bank, Washington D.C.
CSAKI, C., LERMAN, Z. (1997): Land Reform and Farm Restructuring in East Central Europe and the CIS in the 1990s: Expectations and Achievements after the First Five Years. European Review of Agricultural Economics, 24(3/4), pp. 431-455.
CSAKI, C., LERMAN, Z. (1997): Land Reform in Ukraine: The first five years. World Bank Discussion Paper No. 371, The World Bank, Washington D.C.

Introduction: A conference summary
19
CSAKI, C., TUCK, L. (2000): Rural Development Strategy: Eastern Europe and Central Asia. World Bank Technical Paper No. 484, ECSSD Series, The World Bank, Washington D.C.
CSAKI, C. et al. (2002): Food and Agriculture in the Slovak Republic: The Challenges of EU Accession. The World Bank, Washington D.C.
CSAKI, C. et al. (2006): The Agrarian Economies of Central- Eastern Europe and the Commonwealth of Independent States. An Update on Status and Progress in 2005. The World Bank. ECSSD Working Paper No. 40.
FAO (2006): The State of Food and Agriculture 2006. Food and Agriculture Organization, Rome, Italy.
LERMAN, Z. et al. (2004): Agriculture in Transition: Land Policies and Evolving Farm Structures in Post-Soviet Countries. Lexington Books.
MACOURS, K., SWINNEN, J. (2000): Causes of Output Decline in Economic Transition: The case of Central and Eastern European Agriculture. Journal of Comparative Economics, 28(1), pp. 172-206.
SWINNEN, J. (1998): The Political Economy of Agrarian Reform in Central and Eastern Europe. Ashgate, Aldershot, U.K.
SWINNEN, J., ROZELLE, S. (2006): From Marx and Mao to the Market. The Economics and Politics of Agricultural Transition. Oxford University Press, Oxford.
SWINNEN, J. (ed.) (2007): Global Supply Chains, Standards and the Poor. CABI.


2 OVERALL TRANSITION DEVELOPMENT


THE PROFESSION OF (AGRICULTURAL) ECONOMISTS AND THE EXPERIENCE OF TRANSITION
ULRICH KOESTER
Institute of Agricultural Economics, University of Kiel Germany. E-mail: [email protected]
1 INTRODUCTION We all had the privilege of observing a unique change in the global economy. A large number of world economies dissolved their economic systems, which were based on a planned economy, and tried to introduce a market economy. Most Western economists celebrated the decline of the socialist systems and considered this as proof of the superiority of the market economic systems. Hence, it was expected that the well-being of people living in these countries would improve fast. Of course, economists knew that the transition from one economic state to another could not be ordered by political order, but needed the design of specific policies that often result in delayed positive effects. Understandably, economists were in high demand. Economic advice was needed for the design and implementation of policies. In general, economists accepted the role of advisers; it was considered a chance to apply the widely accepted economic know-how of the profession. The transition of planned economies was considered a huge experiment to prove the superiority of a market economy. However, it may well be that many economists were not aware that their past experience had been derived from observations in market economies and that their theories had been never tested in economies that had to be transferred from plan to market. There was widespread agreement about how a market economy should look like and what the role of the state should be in such an economy, but there was less agreement how the transition from one state to the other should be orchestrated. Hence, the performance in transition countries provides a unique chance for economists to test and question their basic understanding of policy reform. After more than 15 years, stocktaking seems appropriate. The main purpose of such an exercise is not to prove that some assessments and recommendations were not the best. Instead, the purpose is to learn from the past. Our profession can learn the most from the past if there is a

Agricultural economics and transition
24
consensus about the explanation of the development of transition economies and the identification of policy effects. Fortunately, stock taking is facilitated in one aspect. There seemed to be fairly wide agreement at the beginning of the 1990s what kind of policies should be instituted to speed up on the road from a planned to a market economy. In terms of overall policy recommen-dations, we can rely on the so-called Washington Consensus. In terms of agricultural economics, the state of affairs at the beginning of the 1990s has probably been recorded the best in a WORLD BANK document in which the leading Western economists had the opportunity to present their view on what should be done in transition countries. Concerning stock taking of performance and reconsideration of earlier recommendations, there are some excellent publications focusing on the general economy. One of the publications is a book by the WORLD BANK on "Economic Growth in the 1990s. Learning from a Decade of Reforms" in 2005 (WORLD BANK, 2005) and a review article by RODRIK in 2006. There are numerous studies on the performance of the agricultural sector and the impact of agricultural policies. What seems to be missing is an assessment of the basic assumptions of agricultural economists, the observation of the facts, and a reconsideration of the basic assumptions. The paper tries to contri-bute to a discourse on these issues. Agricultural economics is a special branch of economics, and it can be assumed that the state of affairs in economics is also relevant for agricultural economics. Therefore, the first part of the paper presents the widely shared knowledge among economists and their expectations at the beginning of the 1990s, the factual development, and the reconsideration of some economists. The main questions to answer are: Would general economists give the same kind of advice today as in the early 1990s? In what respect would the advice differ if there were a difference at all? Is there agreement on how to measure the overall economic performance of transition countries? Is it likely that performance would be better if different advice had been given? In the second part of the paper, similar questions as in the first part will be looked at, but the focus is on agriculture and agricultural economists.
2 GENERAL ECONOMISTS AND TRANSITION 2.1 The state of affairs in general economics at the beginning of the
transition It is well-known that two economists hardly agree on specific issues. Hence, it seems unrealistic to look for a widely accepted view. Fortunately, there is a publication available that expresses the main view of the dominant organizations in the field of development and policy advice, namely the

Overall transition development
25
WORLD BANK and the International Monetary Fund, at the beginning of the 1990s. Moreover, what was called the Washington Consensus was shared by many leading economists outside the two organizations. WILLIAMSON stated "that the Washington Consensus is a ‘universal convergence,’" and that it constitutes "the common core of wisdom embraced by all serious economists" (WILLIAMSON, 1993, p. 1334). He codified the approach as a set of 10 axiomatic generalizations that, given certain values, are generally shared by scholars and practitioners concerned with economic growth in developing countries. He also listed the remaining analytical problems on which normal economic science needs to focus. Finally, he dismissed those who challenged the consensus view as "cranks" (p. 1330) (quoted by GORE, 2000, p. 790). Moreover, there is ample evidence that the economic under-standing that led to the Washington Consensus has been the backbone of the main external policy advice given to individual transition countries. Hence, it is well justified to consider the Washington Consensus as the state of affairs in economic policy advice at the beginning of transition. The Washington Consensus of 1990 reflected a summary of the lowest common denominator of policy advice addressed by Washington-based institutions (including the World Bank) (WILLIAMSON, 2000). The consensus was summarized in the following 10 propositions. (1) Fiscal discipline (2) A redirection of public expenditure priorities toward fields offering both
high economic returns and the potential to improve income distribution, such as primary health care, primary education, and infrastructure
(3) Tax reform (to lower marginal rates and broaden the tax base) (4) Interest rate liberalization (5) A competitive exchange rate (6) Trade liberalization (7) Liberalization of inflows of foreign direct investment (8) Privatization (9) Deregulation (to abolish barriers to entry and exit) (10) Secure property rights. Even if stated as "the common core of wisdom embraced by all serious economists" (WILLIAMSON, 1993, p. 1334), the propositions were not accepted by all quarters. Terms used to describe the Washington "Consensus" included "neoliberalism", "market fundamentalism" (WILLIAMSON, 2000), or a summary in the forms "free up trade, practice sound money, and go home early," "liberalize as much as you can, be tough in monetary and fiscal matters," or "policy advice based on free market principles and monetary

Agricultural economics and transition
26
discipline" (WILLIAMSON, 2000) indicate the objections against the advice. Nevertheless, there are clear indications that the World Bank and the IMF followed these recommendations. The Washington Consensus is completely in line with traditional economic thinking. The deductions are based on a collection of hypotheses that are the basis of neoclassical economics. Hence, the conclusions are only acceptable as policy advice if the hypotheses concerning the behavior of political and economic agents reflect the reality in a given country. If these agents had behaved the same all over the planet, the policy advice would have been the same for all transition countries. Given these assumptions, the Washington Consensus was considered a blueprint for policy advice in transition countries. Actually, the recommendations describe a final state of a market economy given the stated assumptions of neoclassical theory. The recommendations seem to be less helpful for giving advice on how to move from here (the plan) to there (the market). Transition requires by definition a change in the coordination of decision making in the society, moving from central to decentralized decision making. Organizations that received orders on how to cooperate have to set up bilateral or multilateral agreements with other organizations. Organizations are groups of individuals, which are bound by some common purpose to achieve objectives. Hence, organizations are comparable to the players in a game. Family farms and collective farms are important organizations, but so are ministries, parties, the central bank, and the Court of Auditor. It is obvious that the specifics of organizations vary widely across countries. Moreover, the rules (institutions) that constrain their behavior vary as well. It should be noted that these rules do not only and mainly reflect the legislation in a country. They also reflect among others how the rules are set up (decision-making procedure), how the rules are enforced, and the so-called embedded institutions, which are mainly based on the culture of a nation. Of course, the behavior of organizations is not only constrained by the institutions that deal with interactions among organizations, but also by rules that determine the internal relationship of a specific organization. The importance of organizations and institutions will be highlighted by the discussion of selected recommendations of the Washington Consensus. To (1) Fiscal discipline: Fiscal discipline is indeed a necessary condition for transition. It is likely easy to convince policymakers of this importance. However, what matters from a political point of view is how to move from here to there. Keep in mind that policymakers in transition countries had little information on potential tax revenue resulting from policy changes and also about the marginal effects of spending. Flows of information among the different government bodies were regularly limited, and thus, it was hardly possible to assess the request for budget allocation of individual departments.

Overall transition development
27
Moreover, there was no clear division of labor between the private and the state sectors at the beginning, e.g., agriculture had to provide for many services in rural areas that are normally undertaken by the government. It is questionable how helpful a recommendation to "adhere to fiscal discipline" really is. To (2) Redirection of public expenditure: Most policymakers had likely agreed that a redirection of public expenditure was needed from the start of transition. However, how could this redirection be implemented? Redirection implies to take from someone and to favor others. Normally, the losers are better organized than the winners, as the loss shows up sooner than the gain. How could a consensus in the society be reached if the basic understanding of economic effects was so poor as at the beginning of transformation? Moreover, it has to be noted that none of these countries had an administrative infra-structure in place that could be used. Corruption must also be taken into consideration. Hence, redirection of public expenditure had to take into account many constraints, not just the expected main effects. Policy advice neglecting these constraints was not very helpful. Moreover, huge public expenditure may have been needed to take care of market failure. However, the countries did not have strong policy units to identify the kind of public goods that were needed the most. To (3) Tax reform: Of course, tax reform was needed as the planned economy was mainly financed by revenue from state-owned enterprises. However, how can tax reform be implemented if the economy is not mainly based on monetary transactions, but on barter? If information on income is rudimental, tax administration weak, and tax evasion pervasive, effective tax reform is difficult. What matters the most are the constraints and not just the advice about in which direction a move is needed. To (4) Interest rate liberalization: Again, it sounds acceptable that interest rates should be liberalized during an early phase of the transition process. However, how important interest rate liberalization actually is depends very much on the economic stage of the economy. Interest rates are of importance if borrowed capital is important in the economy. However, transition countries have even up to now only a small share of private credit as a percentage of their GDP. The economic and social climate is not adequate for the creation of a credit market. To (5) A competitive exchange rate: A liberal trading system with competitive exchange rates generally supports growth in market economies. However, many transition countries had no competitive markets, and they suffered from many non-tariff barriers to trade. The notion of a competitive exchange rate is somewhat vague if markets function so imperfectly, as in most transition countries in the early stages of transition.
Agricultural economics and transition
28
To (6) Trade liberalization: It may sound easy to follow the advice to liberalize trade. However, one should keep in mind that any trade liberali-zation demands internal adjustment and, hence, mobilizes political resistance. Adjustment in these countries needs, of course, time. The problem may be illustrated with the help of one example. The value added of East German agriculture was highly negative even at highly supported EU prices at the time of unification. Had this sector been confronted with EU market prices without any government support, most of the agricultural enterprises would have gone bankrupt within a very short period of time. Keeping in mind the mal-functioning labor and capital markets at that time, unemployment in rural areas would have been a major problem, even more than it actually became. Experience has proved that the agricultural sector in East Germany evolved to one of the most competitive sectors in East Germany within a few years. The message that can be drawn is as follows: Trade liberalization has to take into account the ability of the sectors to adjust and – equally important – the ability and willingness of the population to cope with the changes in the economic environment. Hence, trade liberalization, even if accepted as an efficient instrument for growth of welfare in the medium and long term, may not be a reasonable instrument in the first stages of transition. To (7) Liberalization of inflows of foreign direct investment: There is ample evidence that foreign direct investment can contribute to faster transition and, thus, can soften the hardship of transition. However, two points seem to be in order. First, following the advice to liberalize inflows of foreign investment may not result in noticeable effects. Foreign investors do not mainly take into account the barriers of entry to a country, but the internal economic environment. Second, liberalizing of capital inflows may have to take into account the reservations of the population. The population may be afraid of and may reject foreign investors. Purchase of land by foreigners is a special case in point. Even if the population accepts that foreigners would improve the efficiency of the agricultural sector, the population may reject access to land by foreigners. The attitude may be partly explained by expected negative effects on the labor markets, but also by cultural beliefs. Land is considered not just as a factor of production, but as something special. Allowing foreigners to buy land without any restrictions may have caused political unrest in some transition countries. To (8) Privatization: Without question, a market economy has to be based on private ownership. Hence, privatization of state-owned capital is an absolute necessity. Nevertheless, the political advice "liberalize fast" may delay a sound restructuring of the economy. First, the timing and form of privatization affect not only distribution of wealth and income but also the efficiency of the economy and, even more importantly, the acceptance of

Overall transition development
29
market-oriented policies. If transaction costs did not matter, privatization might be always better than non-privatization. However, it is known that transaction costs are highly important and, hence, affect economic performance. Second, privatization in an economy with non-competitive and not transparent commodity markets and badly-functioning credit and land markets may lead to the enrichment of a few without contributing to the intended efficiency in the economy. Third, privatization can affect a country’s ability to raise taxes and may impair the fulfillment of the government’s function. Take, for example, the case of Russia. Privatization of the oil industry without having the administrative capacity to tax the new private owners limited government revenues and the provision of public goods. Privatization of agriculture is a special case in point. Socialist farms had to provide for many services that are offered by the public sector in market economies. Hence, privatization without having set up the infrastructure for the public sector would have led to socially unacceptable results; poverty of the rural poor would have been increased.. To (9) Deregulation (to abolish barriers to entry and exit): Possibly, all market economies intend to deregulate their economies. Past regulations may have improved the well-being of the population at the time of its setting into operation, but may have proved to be counterproductive after some time. It is well-known that deregulation is a highly sensitive political issue. Countries succeed with deregulation only under exceptional condition, such as in New Zealand in the year 1984 and thereafter. Hence, it is not very helpful to advise transition countries that they have to deregulate; it is more important to develop a strategy, which may lead to success. Such a strategy has to take into account the institutional framework in the country as well as conditions on the political markets. To (10) Secure property rights: It is widely accepted that a market economy can only function efficiently if property rights are secure. However, it is unclear to what extent property rights have to be secured at different stages during the transition phase. The comparison of China and Russia indicates that China, with less secure property rights, was much more attractive for investors than Russia. Consequently, growth in China significantly surpassed that of Russia. The issue of property rights has a different meaning in a planned economy than in a market economy. Hence, the role of the govern-ment differs in these two economies. It is not easy to define the role that the government has to play in the transition process moving from privatization to securing property rights. Moreover, policymakers will not base their decisions on a well-defined social welfare function. Instead, they may pursue their own personal interests. Given the weak monitoring of policy decisions during the first years of transition, policymakers may have quite a lot of leeway in their decisions pursuing their personal interests. Hence, the question

Agricultural economics and transition
30
arises whether property rights can be secured adequately if policymakers are not willing, able, and/or inclined to secure them. This short discussion of the 10 Commandments hint at the shortcomings of corresponding recommendations. First, it was assumed that the policy changes needed were the same for all countries. Country-specific information was not needed. But viable policy changes are always country-specific as the political economy differs from country to country. Second, the role of institutions, defined as rules that constrain human behavior and make it predictable, were widely neglected (see, among others, KOLODKO, 1999, p. 235). As institutions are country-specific, there is no blueprint for policy reform that could be applied to all countries. The new role of the government, political economy aspects, policy and market failure were widely neglected. Third, the recommendations were not based on an analysis of the most binding constraints for prosperity. Hence, there was no built-in priority of measures to be introduced (RODRIK, 2006, p. 985). Privatization may not lead to an enabling environment for investors and may not spur growth if the legal and administrative framework is not in place to secure property rights. Is there a consensus on what would have been better advice and what should be future advice? The WORLD BANK (1995) seems to have changed the past approach. The organization has widely accepted the reasoning of RODRIK (2006) that institutions matter, that it is important to identify the country-specific constraints, to emphasize market failure and the new role of the State, and to design reform based on attacking the main constraints. In contrast, the sister organization in Washington, the IMF, seems to stick to the original commandments, but augments them with a list of essential institutional aspects (KRUEGER, 2004). The focus is still not on identifying the main constraints. Thus, there seems to be no consensus in the profession of economists. There are still many who consider the advice based on the Washington Consensus to be the best approach. Consequently, the disappoin-ting experience is diagnosed as a failure of policymakers to implement policy advice accurately. However, the pendulum seems to have moved to the direction advocated by RODRIK (2006) and the WORLD BANK (2005).
3 AGRICULTURAL ECONOMISTS AND TRANSITION Agricultural economics is a subset of general economics, and one should not expect a huge difference in the main paradigms. However, agricultural economists are generally more applied in their work than most of those

Overall transition development
31
working in the main areas of economics. The famous quotation by Leontief has been quoted many times as proof of the problem-oriented research of agricultural economists (LEONTIEF, 1971, p. 5). The basic understanding of the leading agricultural economists is well documented in a World Bank study (WORLD BANK, 1992). It is obvious that these agricultural economists are well-trained neoclassical economists; hence, they advocated for fast privatization and, similar as their colleagues, did not focus much on market failure, political economy aspects, and the new role of the government. However, they addressed explicitly the need to deal with market failure on the capital market, on the land market, and the market for extension, research, and training. Moreover, they emphasized the importance of governance in the public sector and on farms. The need for restructuring large farms was well highlighted. There also seemed to be a consensus that corporate farms are less efficient than family farms, that large farms are less efficient than small farms, and that there would be a strong incentive to set up family farms. Less emphasis was placed on dealing with market failure and the role of the state to provide the needed public goods. There is a general consensus that expectations were not met. However, there seems to be disagreement concerning the main reasons for the bad perfor-mance. In particular, there seems to be no general agreement on the following points, which will be discussed:
• How to measure performance?
• Is there a strong relationship between land reform and agricultural performance?
• Are there economies of scale in agriculture that put family farms at a disadvantage compared to larger private farms? Are economies of scale really the main determinant of farm size?
• Do family farms perform better than corporate farms?
• How important are institutions for the foundation of family farms and the development of the agricultural sector?
3.1 How to measure agricultural performance? Policymakers tend to focus on the volume of agricultural production. An increase in production is often considered to be a success and a decline a failure. However, from an economic point of view, such a criterion is not very meaningful. A negative change in agricultural production might be needed if the country wants to use its resources efficiently. Moving from a highly protected agricultural sector to a competitive sector is likely accompanied by a decline in production. Of course, transition can be considered as successful

Agricultural economics and transition
32
if the overall GDP exceeds that of the pre-transition period, but this will not necessarily hold for each individual sector. An indicator that is often used by economists is the change in total factor productivity. Again, this seems to be a perfect indicator for the whole economy with undistorted markets. The positive change in total factor productivity implies a more efficient use of resources, which is the ultimate aim of transition. However, this indicator could be highly misleading if the transition has led to high unemployment. Production could be higher, but total factor productivity is lower if all factors were employed. A better indicator would be "total production divided by total available factors of production in the economy whether employed or not." This indicator would yield a lower number than total factor productivity calculated as total production divided by employed resources. The total factor productivity of agriculture is widely used as a measure of performance (see, for example, ROZELLE, SWINNEN, 2004). The problem of this indicator can be illustrated with the experience of the former GDR. Agriculture was not competitive at the time of unification. Actually, value added at EU prices for output and inputs was negative in 1989. Within a few years, agriculture in the New Laender became more profitable than in West Germany. Total factor productivity went up significantly. One would like to certify a high performance status for agriculture of the former GDR. However, there is a significant problem. There was huge labor shedding (83 % within a 4-year period), and there was huge unemployment in rural areas (up to 30 %). Farms did substitute labor for highly subsidized capital. The overall economy would have been better off if the scarce factor capital had been used in other economic sectors and if more labor were employed in agriculture. A better performance indicator would have been the comparison of the value of the marginal product of factors used in agriculture valued at economic shadow prices of factors. More discussion in this field seems to be needed. Another convincing approach has been created by Csaki (CSAKI, NASH, 1997). He developed a methodology that can be used to assess the status of agri-cultural reform. In contrast to earlier World Bank studies, Csaki identifies five areas where reform is needed, including institutional reform, ranks the individual fields on a scale from 1 to 10, and aggregates them. The information used was based on the individual assessment of World Bank staff working in the individual country, and it informs fairly on the status of reform. The assessment allows countries to be grouped with respect to their reform status. This methodology is a huge step away from a blueprint policy. The inclusion of the institutional framework takes into account country-specific criteria.

Overall transition development
33
3.2 Land reform and agricultural performance Agricultural economists emphasize land reform as one of the most important items on the reform agenda. Thus, one would expect that there is a close relationship between land reform and agricultural performance. Lerman investigated this issue several times, and in his 1998 article, he noted that he could not find an evident relationship. This finding was a surprise for many agricultural economists, including me. However, the findings in general economics during the last decade can shed some light on the puzzle. Land reform should lead to testable results if the lack of land reform were the same binding constraint in every country under consideration. This does not seem to be the case. A small step in land reform, as in many CIS countries, may have no impact as farm workers were often not even aware that they had received ownership of their land. But even if they were informed, it did not matter at all or not much; badly functioning product and factor markets, not existent markets for land and rural credit, the missing know-how, and the unwillingness to bear risk did suppress the setup of family farms. In particular, embedded institutions may have suppressed the potential effects of land reform (KOESTER, 2007). Therefore, the effect of land reform can hardly be identified in a cross-country study. Following the present state of affairs as described in the review article by Rodrik, the impact of individual determinants of performance cannot be identified with a cross-country study; performance is constrained by different determinants in individual countries, and the marginal change in any of the determinants has different effects in different countries. Based on this insight, it seems questionable to place priority on land reform in countries where important markets do not exist or are badly functioning and where the public sector has not been set up to provide public goods urgently needed in rural areas for making private investment profitable and for provision of social services hitherto provided by large farms.
3.3 Economies of scale in agriculture There seemed to be a widely held agreement in the profession that the question of economies of scale is important for giving policy advice. The question about economies of scale in production is seen as related to an efficient farm structure, with a focus on small family farms and not on large-scale commercial farms. It seems to be generally agreed that in the absence of substantial economies of scale farm internal transaction costs are crucial for the determination of the optimal farm size (SCHMITT, 1993). ALLEN and LUECK (1998) argue that monitoring costs of workers on family and large farms may become the most important determinant of the optimal farm size due to nonexistent economies of scale. As family farms have likely lower monitoring costs of workers, family farms may be superior to large farms.

Agricultural economics and transition
34
This line of thought completely neglects market transaction costs. It may well be that family farms produce at lower costs than large farms, but lower prices received for products, higher prices paid for inputs, and constrained access to credit may overcompensate the advantage in production costs. Hence, the conclusion that the nonexistence of economies of scale in agriculture leads to the superiority of family farms is logically not well founded. Nevertheless, information on whether there are economies of scale in agriculture is important. If there are economies of scale, the superiority of family farms is less likely than otherwise. It seemed to have been generally agreed among agricultural economists in the early 1990s that economies of scale did not exist or were insignificant in agricultural production and that family farms are the most efficient organizational form of farms. The most influential publication was likely by BINSWANGER et al. (1993). The authors concluded that small farms have a productivity advantage (p. 2718). However, they emphasized that the functioning of markets is important and that the inverse relationship between productivity and farm size holds more likely in countries where wage rates are low and labor intensive agriculture has a comparative advantage. Moreover, the empirical investigation was limited to developing countries. One of the papers that may have been the most influential as it seems to be the first one focusing on a specific transition country was that by VAN ZYL et al. (1996). However, even if often quoted and accepted as proof, the empirical test is not very convincing. First, the data used by the authors represent farms in Poland belonging to the size groups < 5ha, 5-10 ha, 10-15ha, and above 15 ha. The largest farms are 44.65 (quality adjusted) ha in one of the two regions under investigation and 82.44 (quality adjusted) ha in the other region. It is quite obvious that this data set will not allow conclusions about the productivity of farms not belonging to this range of sizes. However, what is considered a small or a large farm varies widely among countries. Therefore, the generality of the findings is highly impaired. Second, the authors calculate total factor productivity, but do not include labor as one of the inputs. Consequently, the total factor productivity of small farms is biased upwards compared to large farms. Third, the researchers employed data only from the year 1993. It should be quite clear that farms had not yet completely adjusted to the market environment, in particular because the most important markets for adjustment, i.e. the credit and land markets, did not yet exist or did not function well. There have been numerous studies on estimating economies of scale in agriculture (see GORTON, DAVIDOVA, 2004). The methods applied differ. Some studies just calculate production costs for farms of different sizes; other researchers estimate total factor productivity or employ the production function approach or use Data Envelopment Analysis (DEA). There is one

Overall transition development
35
particular interesting publication that reports the results for alternative approaches using the same data set. The authors (BOUSSEMART et al., 2006) utilize a Cobb-Douglas production function, a calculation of milk production costs according to the size of farms, a quadratic cost function, and an application of the DEA method to test for the presence of economies of scale in dairy farming in Estonia. They found "that in the cases studied, the extent of economies of scale depended on the methods used. The assumption of constant returns is not to be rejected in view of some results. Other results would show that the best performances are obtained by family run medium sized farms." This result may be a surprise. However, it should not be. There are doubts whether this type of empirical research is adequate to inform on the existence of economies of scale in most transition countries with a specific economic environment. The problem can be highlighted for the case of production function analysis which is used as the basis for cost functions. Of course, the production function only informs on a specific technical relation and no specific assumptions are needed. However, if the data are used from a sample of farms the assumption is needed that the same production function holds for all farms or that the difference can be captured by a dummy variable. An even more significant problem shows up, if the estimated production function serves as the basis for the cost function. It has to be assumed that each individual farm produces at the lowest average cost with given resources, and the envelope of the individual average costs is downward sloping and, thus, informs on economies of scale. The derived cost function, including a set of small, medium, and large farms, will only provide the desired result if some specific assumptions hold: First, all farms have to maximize their profit; second, they have to be faced by the same output and input prices; third, they are not confronted with risk or uncertainty; fourth, they can adjust fixed and variable factors to such a level that allows them to minimize average cost and to maximize profit. These assumptions could possibly be realistic for market economies where economic conditions have not changed much over time and where product and factor prices are the same for all farms; however, the environment is different in transition countries. The production function for large farms is certainly different from that of small farms; farms are not in an optimum situation as the environment has changed significantly over the last years, and adjustment has been constrained by badly functioning markets. Finally, the assumption that product and market prices are the same for all farms could only be true if market transaction costs, including access to credit and to land endowment, were the same for all farms. As these assumptions do not hold, some farms may produce in a shot-run optimum with marginal costs equal to market prices, but marginal costs significantly higher than

Agricultural economics and transition
36
average costs and minimum average costs. Lack of credit and limited access to land may result in a suboptimal farm size. This situation may be more pronounced for small family farms than for large farms. Consequently, the research may lead erroneously to economies of scale. One may wonder whether a comparison of production costs between small and large farms could provide the desired information. The advantage of this approach is that it takes into account varying input prices across farms; thus, the measure could inform on the competitiveness of alternative farm sizes given the actual environment. However, even this information could not be the basis for the sound formulation of policy advice. Averages may not be meaningful if the variance is large. The problem with the use of averages will be shown for the case of farm data in Ukraine. DEMYANENKO and VON CRAMON-TAUBADEL (2004) investigated private farms, corporations, and cooperatives in Ukraine. The data revealed (see Table 2.1) that the variance of all variables is very high. Private farms employed at least 3 workers on at least 6 ha and employed at most up to 438 workers and cultivated up to 3,972 ha. What does a mean of 141 workers on private farms and average acreage of 1467 ha mean? Policymakers may be interested to learn which organizational form may be the most profitable. Looking on averages of profit per ha, policymakers may conclude that private farms are the most profitable and cooperatives the least. However, looking at the highest profit per ha, the data reveal that the best companies and the best cooperatives earn a much higher profit per ha than the best private farms. In contrast, the least profitable private farms make a smaller loss than the most loss-making companies or cooperative. It would be misleading to base policy decisions on averages if the variance is as large as documented for farms in Ukraine. The main determinant of profitability is obviously not the organizational form, but some other determinants. If governments aim at improving efficiency in agriculture, they are advised to improve the effects of those variables that speed up structural change in agriculture. Improved functioning of product and factor markets, and in particular of land and credit markets, would support structural change and transfer land to the more efficient farmers.

Overall transition development
37
Table 2.1: Characteristics and performance of agricultural enterprises in Cherkasy oblast by organisational form in 2001
Source: DEMYANENKO, S., VON CRAMON-TAUBADEL, S. (2004). There seems to be significant empirical evidence that economies of scale are not the main determinant of farm size and farm structure (GORTON, DAVIDOVA, 2004). Market imperfection leading to high transaction costs favor large farms in transition countries, and embedded institutions (preference for working on the farm of ancestors) seem to be more important. Moreover, managerial ability, including entrepreneurship, determines variance in performance across alternative farm sizes to a high extent. Conclusions based on averages may be highly misleading. The problem of differences in input prices can be overcome by a comparison of average production costs of "typical farms". A data set that details average production costs for selected agricultural products on small and large representative farms in a large number of countries are partly available and work is under progress to enlarge the data base (see Figures 2.1 and 2.2 for milk and rapeseed equivalents). It is quite obvious that the larger farms produce at significant lower average costs than the smaller farms.

Agricultural economics and transition
38
Figure 2.1: Cost advantage of large farms in percent of average farms
Figure 2.2: Farm size and operating costs in rapeseed production
Source: AGRI BENCHMARK (2006), p. 23. Note: RE = Rapeseed equivalents.
3.4 Family farms versus corporate farms It is well-known that agriculture in Western market economies is mainly dominated by family farms. However, it should be noted that the term "family farm" has not yet been well-defined. The German government favored the Leitbild (model) family farm for decades and only said the farm has to be managed by a full-time farmer and work has to be mainly provided by the
Cost advantage of large farms in percent of average farms Selection of 21 countries which allow a look at
economies of scale
Farm code Example:
DE= Germany
30 = 30 cows / farm
0%
5%
10%
15%
20%
25%
30%
DE-
30D
E-85
NL-
55N
L-95
FR-3
1FR
-70
ES-3
7ES
-103
IT-1
16IT
-229
UK
-99
UK
-206
IE-5
1IE
-87
DK
-100
DK
-180
SE-5
0SE
-195
FI-2
4FI
-60
IL-6
3IL
-270
CA
-57
CA
-98
US-
80U
S-35
0
AR
-170
AR
-170
0
BR
-45
BR
-80
PE-6
PE-1
5
IN-1
IN-9
PK-1
PK-1
0
BD
-2B
D-1
0
AU
-247
AU
-620
NZ-
282
NZ-
546
Source: IFCN Dairy Report 2006 , Hemme et al.
Farm types per country : 1 Average size farm, 2. Larger farm types
-0,2% -1%

Overall transition development
39
farm family1. According to the USDA, a family earns less than $250,000 gross receipts annually on which day-to-day labor and management is provided by the farmer and/or the farm family that owns the production or owns or leases the productive assets. In Sweden, a family farm is a farm that allows one family to support themselves solely on farm income and full-time work (LINDAHL, 1995). The alternative definitions allow at least identifying those farms that are not family farms. These are part-time or full-time farms that generate an inadequate income for the family, farms with a hired manager, farms with more hired workers than family workers, and farms that are organized as corporations or cooperatives. In spite of these differences in clear definitions of the term "family farm", there was wide agreement that a family farm is rather small and nevertheless competitive. As this type of farm was dominant in Western countries, it was no surprise that the widely held expectation among Western agricultural economists at the onset of the transition was a fast move towards family farms in transition countries. Obviously, that has not happened. Many of us (see SCHMITT, 1993) argued as follows: As the existing farm structure is made up by family farms in most market economies, a structure made up by these farms must be optimal. This questionable conclusion led to the next questionable conclusion: A farm structure composed by family farms would be optimal for transition countries. It seems to be a widely held opinion that the gap between expectations and reality is due to incomplete policy reform, including creating an enabling environment, in particular functioning markets. However, it may well be that the profession misjudged the situation here (in the West) and there (in the East). False expectations were partly due to the inaccurate interpretation of the reality in the West. SCHMITT (1993) and others concluded that the pre-dominance of family farms in the West proves their comparative advantage. However, the existing farm structure in a specific country is not mainly the result of pure economic calculations, but it is path-dependency; past farm structure determines largely present farm structure (BALMAN, 1999). Moreover, embedded institutions (KOESTER, 2007) and sink costs slow down structural change. The agricultural structure at any point in time is likely to be far behind the optimal structure. Hence, it was not plausible to think that a new farm structure in the East would be similar to the suboptimal structures in the West. Even if some studies may show that present private small family farms in a specific transition country are the most efficient given the present environment, 1 The "Leitbild"of the German government has substantially changed after unification.
The term "family farm" as focus of agricultural policy is not used any more.

Agricultural economics and transition
40
it is not at all certain that a farm sector dominated by small family farms would have evolved in a changed environment with functioning markets. Experience shows that the capability of management is a highly important determinant of performance. It is likely that some of the best qualified entrepreneurs have already started farming. Surveys show that the potential of would-be farmers seems to be limited. Many of the would-be farmers, in particular most of the current farm workers, are not willing to change their lifestyle and to bear the risk of being a self-employed entrepreneur.
3.5. The importance of institutions Most agricultural economists use the neoclassical framework in their research. However, it is questionable whether such an approach is the most efficient for research and policy advice in transition countries. Neoclassical economics assumes that people’s behavior is guided by the maximization of utility or profit, taking into account specific given constraints, such as income and prices for individual consumers and factor endowment and input prices for entrepreneurs. Moreover, it is assumed that decision makers have complete information. Consequently, people behave the same in all societies. In contrast, institutional economics emphasizes differences in attitudes of people leading to a huge variance in objectives and behavior. Moreover, constraints for the individual’s behavior are not only materialistic but also depend – or even more specifically – on the social, legal, and economic environment. However, rules that constrain individual behavior differ widely across countries; institutions are country-specific and even person-specific. People in the real world are very much guided by tradition, culture, and beliefs, i.e., by embedded institutions (WILLIAMSON, 2000). Beliefs about how the world and the economy work are important for individual decisions. Some examples will be given to highlight the importance of embedded institutions. It may be that would-be farmers may not like to become farmers because they have not learned to behave as an entrepreneur, they may be risk-averse, or they may not like to change their lifestyle. Transaction costs may be high for getting credit or for investments made to order as trust is lacking. The land market may not evolve because people consider land to be a specific asset that should not be traded. Land may be idled even if it could be used productively by someone. Farm workers may have no bad feelings about shirking and stealing. Policymakers may shrink away from genuine policy reforms as constituents may not support them and strong interest groups oppose them. Policymakers may intervene in markets because they believe that doing so will contribute to food security. Given specific embedded institutions, setting up a functioning and well-accepted market economy in a country is not only a huge economic problem, but possible more so a political one. Policy advice which does not take into account the political market in a country may not be effective. Market

Overall transition development
41
liberalization and land reform was most likely overemphasized in many countries (CSAKI, 2004, p. 272).
4 SUMMARY There seems to be an increasing number of general economists who have changed their understanding of transition, see past advice somewhat critically, and lay stress on some less emphasized issues such as market and policy failure, embedded and other institutions, and a strong role for the government. Growth is not to be considered the main policy objective any more; distribution of income and wealth have gained importance. Agricultural economists may have had better know-how than general economists to deal with transition problems, partly because agricultural economists are generally more applied in their work; many had significant international experience and were used to take the institutional framework into account in conducting their analysis. However, there are still some open questions: What are the adequate indicators of agricultural performance in countries where market failure is pervasive? How to measure comparative advantages of farm sizes and organization form of farms? How important is the political market for policy reform in a specific country? How important are embedded institutions for the design of policy reform and for the impact of policy reform?
ACKNOWLEDGEMENTS Comments by Bernhard Brümmer, Jens-Peter Loy and Tilman Becker on an earlier draft of the paper are highly appreciated.
REFERENCES AGRI BENCHMARK (2006): Cash Crop Report. Benchmarking Farming Systems Worldwide. No location.
ALLEN, D., LUECK, D. (1998): The Nature of the Farm. Journal of Law and Economics, 41, pp. 343-386.
BALMAN, A. (1999): Path Dependence and the Structural Development of Family Farm Dominated Regions. Paper presented at the IX. European Congress of Agricultural Economics: European Agriculture Facing 21st Century in a Global Context. Organized Session Papers. Warsaw.
BINSWANGER, H., DEININGER, K., FEDER, G. (1993): Agricultural Land Relations in the Developing World. American Journal of Agricultural Economics, 75, pp. 1242-1248.
BOUSSEMART, J. P., BUTAULT, J. P., DELAME, N., MATVEJEV, E., ROUSSELLE, J. M. (2006): Economies of scale and optimal farm size in the Estonian dairy sector. Proposition de communication aux XXIII èmes. Journées de microéconomie appliquée. Université de Nante.

Agricultural economics and transition
42
CSAKI, C., NASH, J. (1997): The Agrarian Economies of Central and Eastern Europevand the Commenwealth of Independent States. World Bank Discussion Paper 387, Washington. D.C.
CSAKI, C. (2004): Agricultural Economics and Transition: What Lessons Did We Learn?, In: Vorträge zur Hochschultagung 2004 und zur Verabschiedung von Prof. Dr. Dr. h.c. U. Koester und Prof. Dr. von Alvensleben. Agrar- und Ernährungswissenschaftliche Fakultät der Christian-Albrechs-Universität zu Kiel, No. 102, pp. 257-273.
CSAKI, C., LERMAN, Z. (1997): Land Reform and Farm Restructuring in East Central Europe and CIS in the 1990s: Expectations and Achievements after the First Five Years. European Review of Agricultural Economics, 24, pp.428-452.
DEMYANENKO, S., VON CRAMON-TAUBADEL, S. (2004): The Organisational Forms and Performance of Agricultural Enterprises in Ukraine: What Conclusions can be Drawn? In: VON CRAMON-TAUBADEL, S., DEMYANENKO, S., KUHN, A. (eds.) (2004): Ukrainian Agriculture – Crisis and Recovery. Kiev, pp. 88-95.
FEDER, G. (1985): The Relation Between Farm Size and Productivity: The Role of Family Labor, Supervision and Credit Constraints. Journal of Development Economics, 18, pp. 297-313.
GORTON, M., DAVIDOVA, S. (2004): Farm Productivity and Efficiency in the CEE Applicant Countries: a synthesis of results. Agricultural Economics, 30, pp. 1-16.
GORE, C. (2000): The Rise and Fall of the Washington Consensus as a Paradigm for Developing Countries. World Development, 28(5), pp. 789-804.
KOESTER, U. (2007): Super-large Farms: The Importance of Institutions. Paper presented at the 102nd EAAE Seminar Superlarge Farming Companies: Emergence and Possible Impacts. Moscow, Russia. May 17-18, 2007.
KOLODKO, G. W. (1999): Transition to a Market Economy and Sustained Growth. Implications for the Post-Washington Consensus. Communist and Post-Communist Studies, 32, pp. 233-261.
KRUEGER, A. (2004): Meant Well, Tried Little, Failed Much: Policy Reforms in Emerging Market Economies. Remarks at the Roundtable Lecture at the Economic Honors Society. New York University. March 23, 2004.
LINDAHL, B. (1995): The Family Farm Model in Swedish Agricultural Policy. Paper presented at the 94th EAAE Seminar. Ashford. Kent, UK.
LEONTIEF, W. (1971): Theoretical assumptions and nonobserved facts. American Economic Review, 61, pp. 1-7.
LERMAN, Z. (1998): Does Land Reform Matter? European Review of Agricultural Economics, 25, pp. 307-330.
LERMAN, Z., CSAKI, C., FEDER, G. (2004): Agriculture in Transition. Land Policies and Evolving Farm Structures in Post-Soviet Countries. Lexington Books, Oxford.
OLSON, M. (2000): Power and Prosperity, Outgrowing and Capitalist Dictatorship. Basic Books, New York.
RODRIK, D. (2006): Goodbye Washington Consensus, Hello Washington Confusion? A Review of the World Bank’s Economic Growth in the 1990s. Learning from a Decade of Reform. Journal of Economic Literature, 44, pp. 973-987.

Overall transition development
43
RODRIK, D. (1996): Understanding Economic Policy Reform. Journal of Economic Literature, 34, pp. 9-41.
ROZELLE, S., SWINNEN, J. F. M. (2004): Success and Failure of Reform: Insights from the Transition of Agriculture. Journal of Economic Literature, 42, pp. 404-456.
SCHMITT, G. (1993): Why Collectivization of Agriculture in Socialist Countries Has Failed: A Transaction Costs Approach. In: CSAKI, C., KISLEV, Y. (eds): Agricultural Cooperatives in Transition. Westview Press. Boulder, Colorado.
WILLIAMSON, J. (1990): What Washington Means by Policy Reform. In: WILLIAMSON, J.: Latin American Adjustment: How Much Has Happened. Washington, D.C., pp. 5-20.
WILLIAMSON, J. (1993). Democracy and the `Washington Consensus'. World Development, 21, pp. 1329-1336.
WILLIAMSON, J. (1997): The Washington Consensus Revisited. In: EMMERIJ, L. (ed.): Economic and Social Economic Development into the XXI Century. Washington, D.C., pp. 48-61.
WILLIAMSON, O. (2000): The New Institutional Economics: Taking Stocks Looking Ahead. Journal of Economic Literature, 38, pp. 595-613.
WORLD BANK (1992): Food and Agricultural Policy Reforms in the Former USSR. An Agenda for the Transition Country Department III, Europe and Central Asia Region.
WORLD BANK (1995): Economic Growth in the 1990s: Learning from a Decade of Reform. Washington, D.C.
ZYL, VAN, J., MILLER, B. R., PARKER, A. (1996): Agrarian Structure in Poland. The World Bank. Agriculture and Natural Resources Department. Policy Research Working Paper 1596.

MEASURING THE SUCCESS OF AGRICULTURAL TRANSITION: AN APPLICATION TO RUSSIA
WILLIAM M. LIEFERT
Economic Research Service, U.S. Dept. of Agriculture, 1800 M St, NW, Washington, DC, 20036-5831. E-mail: [email protected]
1 INTRODUCTION The paper begins by presenting a model of the agro-food system in the countries of the former Soviet bloc, which shows how the transition from a planned to a market economy affects the production and consumption of goods and economic welfare. The model is then used to identify two comple-mentary approaches for evaluating the success of agricultural transition. Success is defined as increasing consumer welfare. The first approach is to identify and measure quantitative indicators of economic gain. The second is to identify the policies that would lead to rising welfare, and then measure the extent to which these policies have been implemented. Given that policies are the means to the end of achieving economic gains, the relationship between policies, welfare gains, and quantitative indicators of these gains is examined. We then apply the model and two evaluation approaches to an assessment of the Russian agro-food economy during transition. This has two purposes. The first is to demonstrate use of the evaluation approaches for a particular economy, and the second is to examine the reform progress that Russia specifically has made during its transition. Because of the space limitations for this paper, we can provide only a summary of the assessment of the performance of the Russian agro-food economy during transition that was presented in the original conference paper. Also, the assessment is based completely on previous empirical work. For some of the quantitative success indicators, only limited work has been done. The assessment of Russia’s agricultural reform progress therefore cannot be definitive. These points notwithstanding, the available empirical evidence indicates that Russia’s agricultural reform progress has been modest, in particular that reform has not substantially raised farm efficiency and productivity.

Overall transition development
45
2 A MODEL OF TRANSITION AGRICULTURE Figure 2.3 presents a model as to how the move from a planned to a market economy during transition can affect the production and consumption of goods and consumer welfare. Although the model could be used to analyze transition’s effect on any sector of the economy, our focus is on the agro-food system. The curve concave to the origin is the economy’s production possibilities frontier (PPF) for goods G1 and G2. We extend the concept of economy-wide social indifference maps for consumers to include an indifference map for planners in the planned period (who represent the interests of the political leadership). In our analysis, planners receive utility from goods from the various ways they put them to use within the overall plan for the economy. We assume that in the planned economy, planners and consumers have different preferences for goods, represented by different indifference maps. Up
1, Up2, Uc
1, Uc2, etc. are specific indifference
curves within the indifference maps for planners and consumers. If the planners are utility maximizers, the planned economy’s production and consumption point is C, where the planners’ indifference curve Up
2 is tangent to the PPF. Figure 2.3: Transition’s effect on production, consumption and welfare
T 1 F
H
E
C
T 1
G 2
G 1
UC5
UC4
UC3
UP 2
B
I T 2
T 2
J
U C 2
U C 6
UP1
U C 1
A
Production at point C assumes that the economy is technically efficient, that is, all producers are equally efficient in their use of inputs, and thereby none deviates from the best available domestic production practices. Given that planned economies lacked the cost-minimizing motive of market
Agricultural economics and transition
46
economies, and that technical inefficiency can exist within even market economies, technical inefficiency of some degree was a likely feature of planned economies. Technical inefficiency is represented in Figure 2.3 by production at point B inside the PPF, such that the planners’ welfare is that given by Up
1 rather than Up2.
The analysis also assumes that the planned economy is wholly autarkic and thereby does not engage in any foreign trade. All the planned economies of the former Soviet bloc did trade to some degree. The main purpose of trade, however, was not to reap the gains from trade based on comparative advantage, but rather to import products that were necessary inputs into the production plan but could not be domestically produced in sufficient quantity or quickly enough. Transition can have five main effects on the structure of production and consumption and welfare of consumers. The first effect is negative, in that the disruptions of moving from a planned to a market system, especially in the linkages between input suppliers, farms, and processors, can temporarily reduce production. In Figure 2.3, this disruption is represented by the production point falling from B to A, with consumer welfare dropping from the level given by Uc
2 to that given by Uc1. The reestablishment of these
linkages would increase output, the isolated effect being the jump in produc-tion from A back to B. Transition’s second effect is that it can improve the technical efficiency of production. In Figure 2.3, the elimination of all technical inefficiency would move production from B to C on the PPF (assuming that planners’ preferences still determined production). Consumer welfare would rise from the level given by Uc
2 to that given by Uc3.
Transition’s third effect is that it can improve the allocative efficiency of production and consumption. Complete allocative efficiency would be achieved if the production and consumption point moved from C to E, where the PPF is tangent to the highest possible consumer indifference curve (Uc
4). The improvement in allocative efficiency (from consumers’ point of view) occurs mainly from the shift from planners’ to consumers’ preferences as the driving force in determining what goods are produced and consumed. Allocative efficiency results in consumer welfare rising from the level of Uc
3 to that of Uc4.
In all the transition economies of the former Soviet bloc, agricultural production fell substantially during the early transition years. The livestock sector was hit especially hard, with both output and animal inventories dropping within most countries by 40-60 %. LIEFERT and SWINNEN (2002) argue that the production decline resulted from a severe fall in the high subsidies to agriculture during the planned period, as do many other studies

Overall transition development
47
on transition agriculture. Consistent with this argument, LIEFERT, LOHMAR, and SEROVA (2003) maintain that the drop in the production and consumption of agricultural goods can be viewed as resulting from the switch during transition from planners’ to consumers’ preferences as the driving force in determining what goods would be produced and consumed. This means that during the planned period, the planners (political leadership) desired the production and consumption of high cost livestock products more than consumers. When during transition prices throughout the economy moved to reflect real production cost, demand for livestock products plunged. In Figure 2.3, the shift from planners’ to consumers’ preferences decreases production of G1. G1 therefore could represent agricultural goods. Transition’s fourth effect is to allow foreign trade based on comparative advantage. In Figure 2.3, the slope of line T1T1 gives the world price ratio for G1 and G2. With free trade, the economy’s consumption possibilities frontier switches from the PPF to line T1T1. Maximizing the gains from trade based on comparative advantage would result in moving the production point from E to F (where the PPF and T1T1 are tangent), and then trading along T1T1 to consume at H (where T1T1 is tangent to Uc
5). The economy exports G2 and imports G1. Trade based on comparative advantage raises consumer welfare from the level of Uc
4 to Uc5.
Transition’s fifth effect is to motivate technological change, by exposing domestic producers to superior foreign technology and management practices and providing the systemic incentives to adopt it (profit maximization and competition). Effective technological change would shift the PPF outward. To avoid too messy a figure, Figure 2.3 does not show the new PPF. Assume, however, that the new PPF is tangent to the trade line (T2T2, parallel to T1T1) at I, the new production point. Technological change shifts production from F to I, and consumption from H to J. Consumer welfare rises from the level of Uc
5 to Uc6.
2.1 Quantitative indicators of reform success The preceding analysis allows for a quick summary identification of the main quantitative indicators that can be used to measure how successful agro-food reform has been in the transition economies, where success is defined as increasing consumer welfare. The four main performance indicators are those measuring: (1) technical efficiency, (2) allocative efficiency, (3) trade based on comparative advantage, and (4) technological change.

Agricultural economics and transition
48
For all four general areas of performance, specific and well-defined indicators exist, as well as methods to compute them. Given that the welfare levels associated with specific consumer indifference curves are unmeasurable in absolute terms, none of these empirical performance measures can determine the degree to which welfare has changed in an absolute sense. Yet, as the preceding section shows, all these performance indicators are positively associated with rising consumer welfare. Improvement in both technical efficiency and the technology of production would raise the productivity of input use. Reversing the initial drop in output from the disruption in supply linkages and other temporary dislocations from transition would also increase productivity. Productivity growth is therefore another (and broader) performance indicator, which can cover technical efficiency, technological change, and correcting the short run disruptions from transition.
2.2 Reform policies The second main way to measure the success of agro-food reform for a country is to identify the policies that would lead to increasing welfare, and then measure the degree to which these policies have been implemented. The two approaches for measuring reform success ─ by the degree of policy implementation or the degree to which specific economic gains have been achieved ─ are complementary, in that policy changes are the means to the end of achieving economic gains. We follow LIEFERT and SWINNEN (2002) in arguing that reform of the transition economies’ agro-food sectors has involved four main policies: (1) market liberalization; (2) farm reform and restructuring; (3) reform of upstream and downstream operations and services; and (4) creation of institutional infrastructure for a market economy. Market liberalization involves removing government controls over the allocation of resources and output, thereby allowing the market to become the main means of allocation. Two main subpolicies of market liberalization are domestic price liberalization and trade liberalization. Price liberalization involves the corollary policy of reducing or eliminating state budget subsidies to producers and consumers that were needed during the planned period to support financially the state-set price system (where prices were often set below production costs). Freeing prices and reducing subsidies are therefore key policy changes that result in consumers’ preferences replacing planners’ preferences as the driving force in determining what goods are to be produced and consumed. Price liberalization’s main economic effect would be to increase allocative efficiency. In terms of Figure 2.3, it would drive the move in the production and consumption point from C to E, and correspondingly the increase in consumer welfare from the level of Uc
3 to that of Uc4.

Overall transition development
49
Trade liberalization would end the state’s foreign trade monopoly and allow trade based on comparative advantage. With complete free trade, production would move to point F, consumption to H, and consumer welfare would rise from the level of Uc
4 to that of Uc5.
Successful implementation of the second major reform policy – farm reform and restructuring – would both reduce technical inefficiency and encourage technological change. Technical efficiency would rise because of farms’ requirement to be self-financing combined with competitive pressure, while exposure to superior foreign technology and management practices, combined again with the carrots and sticks of competition, would encourage technological change. As discussed earlier, the elimination of technical inefficiency would shift the production point from B to C and raise consumer welfare from Uc
2 to Uc3, while technological change would
shift the PPF rightward, move the consumption point from H to J, and raise welfare from Uc
5 to Uc6.
Reform of upstream and downstream operations and services extends the analysis of reform’s effects on production, consumption, and welfare from that of primary agriculture to that of the entire agro-food system. It could be grouped with farm restructuring and reform to cover reform of all farm producers and enterprises within the agro-food economy, as well as those providing inputs and services. With respect to Figure 2.3, G1 could now include processed and retail products as well as primary agricultural output, that is, the model depicted in Figure 2.3 could apply to any stage in the agro-food production chain. Building the institutional infrastructure that a market-driven agro-food system needs, such as systems of market information and commercial law that protects property and enforces contracts, allows all the other reform policies to work better. In particular, weak market institutions increase transaction costs. To a large degree these costs are a manifestation of the disruption to the production chain that we identified as transition’s first main effect on the agro-food system. Eliminating transaction costs would raise productivity and thereby output, as represented in Figure 2.3 by the move in the production point from A to B, and increase consumer welfare from Uc
1 to Uc2. We
argued earlier that the benefits of greater technical efficiency and technolo-gical change that would result from effective farm/enterprise reform and restructuring could both be captured by productivity growth. Productivity growth could also capture the gains from stronger market institutions that reduce transaction costs. The four main agro-food reform policies we identify are similar to the taxonomy of reform policies used by the World Bank (CSAKI, NASH, 1998) in it annual evaluation of the agricultural policy reform performance for the transition economies covering 1997-2005. The World Bank reform policies

Agricultural economics and transition
50
are: (1) price and market liberalization; (2) land reform and privatization; (3) privatization and reform of agro-processing and input supply enterprises; (4) rural finance; and (5) institutional reform. The only major difference between our and the Bank’s list of reform policies is the latter’s addition of rural finance. Given that finance can be viewed as a production service (being a means to acquiring capital), within our policy scheme it could be added to the third area of reform, creation of upstream and downstream operations and services. Table 2.2 summarizes the key reform policies and quantitative indicators of reform success, as well as the relationship between the policies and quanti-tative indicators. The table also identifies the welfare gains (with respect to Figure 2.3) that successful policies, as measured by the indicators, could generate. The relationship between policies and indicators as summarized in the table is general rather than precise and absolute. The policies identified could affect more than one indicator, while the economic gains as measured by the indicators could be impacted by more than one policy, or by non-policy factors. For example, failure to maximize allocative efficiency and trade based on comparative advantage might result not only because of market intervention policies, but also because of imperfect market conditions. These could include enterprise market power (perhaps held by food processors or input suppliers) and weak physical and institutional infrastructure. The latter can create high transport and transaction costs, and also impede price arbitrage both within the economy and between border and domestic prices (incomplete price transmission). Table 2.2: Reform policies, success indicators, and welfare gains ____________________________________________________________________
Policy Success indicator Welfare gain _____________________________________________________________________
Farm/enterprise reform Productivity growth technical efficiency U c 2 to U c 3 technological change U c 5 to U c 6
Price liberalization Allocative efficiency U c 3 to U c 4
Trade liberalization Trade based on U c 4 to U c 5 comparative advantage
Building institutional infrastructure Productivity growth U c 1 to U c 2 _____________________________________________________________________

Overall transition development
51
3 MEASURING THE SUCCESS OF AGRICULTURAL TRANSITION IN RUSSIA
We next use the two approaches for measuring the success of agricultural transition to evaluate the performance specifically of Russia. As mentioned in the introduction, because of space limitations for this paper, we can provide only a summary of this part of the original conference paper. Also, of all the published work that empirically examines the performance of the Russian agro-food system during transition, we cite in this paper only the most important and representative studies. We begin by assessing Russia’s success in implementing agro-food reform policies. The World Bank taxonomy of agro-food reform policies mentioned earlier was created for the very purpose of allowing the Bank to grade the agricultural reform progress of the transition economies of the former Soviet bloc. Every year over the period 1997-2005, the Bank graded each country from 1 (the lowest) to 10 (the highest) for each of its five areas of agricultural reform policy (CSAKI et al., 2006 is the last publication in the annual series). In 1997, Russia received an average grade (the unweighted average of the 5 different grades) of 6.0, which roughly means that the country had moved about 60 % toward full implementation of reform policies that would establish a well-operating and market-driven agro-food system. By 2005, Russia had improved its score to only 6.6. Russia’s agro-food system was still far from a high score, and was progressing at a slow rate. Russia’s 2005 score of 6.6 compares to the 2005 average score of 6.4 for all the transition economies covered by the Bank’s evaluation. Russia was doing better than most of the other countries of the Commonwealth of Independent States, but less well than the countries of Central and Eastern Europe.2
We next summarize Russia’s agricultural performance during transition with respect to the quantitative performance indicators identified earlier. Most of the empirical work involving these indicators covers the 1990s rather than the 2000s. However, the slow pace of Russian agricultural reform from 1997 to 2005 as indicated by the Bank’s evaluation suggests that Russia’s agricultural performance has not improved much during the 2000s.
2 In its initial evaluations, the Bank covered all the transition economies of the former
Soviet bloc. By 2005, it had stopped evaluating those countries that had joined the Economic Union (EU), judging that their transition to market economies was largely completed. Thus, reform scores for these countries are not included in the 2005 average score of 6.4 for all the economies evaluated by the Bank. If the EU-acceded countries were included in the average score, Russia’s relative agricultural reform performance would be much worse.

Agricultural economics and transition
52
The numerous studies on technical efficiency show that Russian agriculture suffers from significant technical inefficiency, with the results in the aggregate indicating that farms have been performing at only about two-thirds the possible level of efficiency. Another conclusion is that technical efficiency has apparently worsened rather than improved during transition. The only study we could find that examines technological change in Russian agriculture during transition is VOIGT and UVAROVSKY (2001), which finds that over 1993-98 technological change in Russian agriculture worsened by 20 %. As mentioned earlier, both technical efficiency and technological change (as well as institutional reform that reduces transaction costs) can be captured by the indicator of productivity growth. LERMAN et al. (2003) computes that over 1992-97, total factor productivity in Russian agriculture rose by 7.4 %. This result contrasts with the conclusion of Voigt and Uvarovsky that technological change worsened rather than improved during the 1990s, as well as with the general conclusion from the various technical efficiency studies that performance with respect to this indicator also worsened. Yet, even if Lerman et al.’s productivity growth calculation is the more accurate, the productivity gain is quite modest. The main study of Russian agricultural allocative efficiency during transition is the USDA-funded BASIS project on Russian agriculture, which measures the allocative efficiency of input use. LIEFERT (forthcoming) summarizes the project’s empirical work on this topic. He concludes that the evidence does not indicate that inputs in the aggregate were seriously overused or underused, and that Russia’s performance with respect to the allocative efficiency of input use appears fairly respectable. The only study we could identify that empirically measures Russia’s performance with respect to trade based on comparative advantage is LIEFERT (2002). He finds that Russia’s trade in agricultural output and inputs in the late 1990s was generally consistent with its comparative advantage. The results indicate that Russia had a general comparative disadvantage in agricultural output vis-à-vis inputs, as well as a comparative disadvantage in meat relative to bulk crops (grain and sunflowerseed). Russia at that time was (and currently still is) a large importer of meat, an exporter of sunflowerseed, and a major exporter of fertilizer and energy.
4 CONCLUSION Based on a model of the transition process for the agro-food economy, the paper identifies and examines the relationship between two complementary approaches for measuring the success of agricultural transition in the countries of the former Soviet bloc, where success is defined as increasing economic

Overall transition development
53
welfare. The first approach is to identify and measure quantitative indicators of welfare gain, and the second to identify and measure the policies that would lead to increased welfare. Application of the two methods to Russia’s agricultural transition shows that the country has made only limited reform progress, with much more improvement possible. According to the World Bank’s evaluation of its policy reform record, by 2005 Russia had moved only about two-thirds toward full implementation of reform policies that would establish a well-operating and market-driven agro-food system. Only marginal progress was made from 1997 through 2005. In the areas of allocative efficiency and trade based on comparative advantage, the limited empirical record indicates that Russia’s performance has been respectable, though with further progress possible. In the areas of technical efficiency, technological change, and productivity growth, where success depends largely on farm-level restructuring and reform, the empirical record has been disappointing. Most studies show negative rather than positive change, while for those studies that show improvement, the measured gains have been very modest.
ACKNOWLEDGEMENTS The author thanks Carlos Arnade, Barry Krissoff, Olga Liefert, Mary Anne Normile, and Mathew Shane for comments, and is responsible for any remaining deficiencies. The views expressed are the author’s alone and do not in any way represent official USDA views or policies.
REFERENCES CSAKI, C., NASH, J. (1998): The Agrarian Economies of Central and Eastern Europe and the Commonwealth of Independent States: Situation and Perspectives, 1997. World Bank Discussion Paper No. 387, The World Bank, Washington, D.C.
CSAKI, C., KRAY, H., ZORYA, S. (2006): The Agrarian Economies of Central-Eastern Europe and the Commonwealth of Independent States: An Update on Status and Progress in 2005. ECSSD Environmentally and Socially Sustainable Development, Working Paper No. 46, The World Bank, Washington, D.C.
LERMAN, Z., KISLEV, Y., BITON, D., KRISS, A. (2003): Agricultural Output and Productivity in the Former Soviet Republics. Economic Development and Cultural Change, 51, pp. 999-1018.
LIEFERT, W. (2002): Comparative (Dis?)Advantage in Russian Agriculture. American Journal of Agriclutural Economics, 84, pp. 762-767.
LIEFERT, W., SWINNEN, J. (2002): Changes in Agricultural Markets in Transition Economies. Agricultural Economic Report No. 806, Economic Research Service, USDA, Washington, D.C.

Agricultural economics and transition
54
LIEFERT, W., LOHMAR, B., SEROVA, E. (2003): Transition and Food Consumption. Paper presented at 25th IAAE Conference in Durban, South Africa, August 2003.
LIEFERT, W. (forthcoming): The Allocative Efficiency of Input Use in Russian Corporate Farms. In: LERMAN, Z. (ed.): Russia’s Agriculture in Transition: Factor Markets and Constraints on Growth. Lexington Books, Lanham, MD.
VOIGT, P., UVAROVSKY, V. (2001): Developments in Productivity and Efficiency in Russia’s Agriculture: The Transition Period. Quarterly Journal of International Agriculture, 40, pp. 45-66.

COMPETITIVENESS IN THE FOOD INDUSTRY: A CGE MODELLING APPROACH TO ASSESS FOREIGN
DIRECT INVESTMENT IN TRANSITION COUNTRIES
M. BANSEA, S. H. GAYB, S. MCDONALDC, R. M'BAREK, J. SWINNENE
a LEI, Postbus 29703, 2502 LS Den Haag, The Netherlands. b JRC-IPTS, European Commission, Edificio Expo, C/Inca Garcilaso s/n,
41092 Seville, Spain. c Oxford Brookes University Business School, Wheatley, Oxford, OX33 1HX, UK.
d CEPS, 1 Place du Congre`s, 1000 Brussels, Belgium.
1 INTRODUCTION In 2005, the European Union (EU)3 was the world’s largest producer of all foodstuffs. In particular, the European food industry sector was the largest manufacturing sector; worth over €836 billion in terms of production and accounting for about 14 % of the total manufacturing turnover. For the NMS, the food industry sector plays an important role as an element in the process of integration being a competitive sector that receives substantial foreign direct investments (FDI). A quantitative approach is applied to analyse scenarios of alternative development pathways of the food industry sector, taking into account the impact of inward and outward (foreign direct) investments, translated into different technical change ratios. This paper is based on a project analysing the European food industry sector, which has been carried out under the leadership of Centre for European Policy Studies (CEPS) and coordinated by the Institute for Prospective Technological Studies one of the Joint Research Centres of the European Commission. The paper describes in the first part on foreign direct investments (FDI) in the European food industry with a focus on the NMS. In the subsequent 3 The abbreviation EU is used when referring to the EU in general. EU-15 refers to the
Member States of the EU before 2004. EU10 refers to the Member States joining the EU in 2004 and EU-25 refers to the Member States before 2007. New Member States (NMS) includes those countries which joined either in 2004 or 2007.

Agricultural economics and transition
56
sections the paper introduces the analysis, based on a computable general equilibrium model (GLOBE model), simulating relevant scenarios of potential development paths of the food industry sector, and taking into account in particular FDI as a driving factor. Based on these simulations conclusions are drawn.
2 FDI IN THE FOOD INDUSTRY The food industry and certain sub-sectors in particular are attractive to FDI. The UK, the Netherlands, France, Denmark and Italy are the main sources of food industry FDI in the EU; while France, Germany, Italy and some NMS are the main recipients of FDI. FDI has an upward trend both in EU-15 and the NMS. In fact, inward FDI stocks in the food industry increased by 101 % on average in the EU-25 over the period 1996-2002. Finland, Latvia and Denmark experienced the highest increases. In France, the level of foreign investments slightly decreased during the same period. As compared to the EU-15, the NMS experienced a higher increase in FDI stocks over the same period. The main sectors that attract FDI are those of high-value production and often with a significant share of output being designated for exports (e.g. tobacco, soft drinks, brewing, confectionery, oil refining, and specific dairy products). Most FDI in the NMS have involved the takeover of local firms, with subsequent restructuring including new investments, transfer of new technologies and marketing expertise. In some countries, privatization has also been a route for foreign investment to enter the sector and FDI flows have trended downwards as privatisation has been completed (e.g. Bulgaria). Finally, completely new production facilities have been established by FDI, such as tobacco and pet food plants in Lithuania. In the NMS the food industry is still in the process of transition from inherited structures to the new market environment. The impact on local food companies is mixed. While local food companies face market pressure from multinational investments, they can also benefit by learning from foreign investors. For example, multinationals were in a better position to provide farms with more credible contractual arrangements coupled with the use of assistance programs. However, local processors have benefited by imitating foreign affiliates and using higher-quality inputs from their suppliers. As a result, FDI in the agri-food sector, through the establishment of foreign affiliates in NMS have significant positive backward and forward linkages and spillover effects; these are reflected in product quality improve-ments, growth of small local suppliers through assistance programs, increased competition and productivity. Yet, FDI could lead to elimination of competitors and to oligopolistic situations, which undermine small suppliers.

Overall transition development
57
Where countries have found difficulty in attracting FDI into the food industry, this has often been due to bureaucratic barriers, as well as sudden and unpredictable changes in the legal framework and, particularly, taxation. Overall, FDI has played a crucial role in the integration of the NMS into the European food system, and also more generally in the restructuring of the European food industry. There is plenty of evidence that FDI has contributed to productivity growth of food systems, not just at the processing and retail level, but also at the producer level. Restrictions on FDI either directly through regulatory constraints or indirectly through poor macro-economic policies or weak property rights regimes have hurt economies in general and the competitiveness of food systems more specifically.
3 GLOBE-MODEL The current situation in agri-food trade relations of NMS with the EU-15 Member States is analysed using the GLOBE model (MCDONALD et al., 2007). The GLOBE model is a member of the class of multi-country, computable general equilibrium (CGE) models that are descendants of the approach to CGE modelling described by DERVIS et al., (1982). The GLOBE model is Social Accounting Matrix (SAM) based model, which is calibrated using data derived from the Global Trade Analysis Project’s (GTAP) database (DIMARANAN, 2006), wherein the SAM serves to identify the agents in the economy and provides the database with which the model is calibrated. The SAM also serves an important organisational role since the groups of agents identified in the SAM structure are also used to define sub-matrices of the SAM for which behavioural relationships need to be defined4. The database aggregation used for this study consists of 23 commodities and activities, 5 factors and 18 regions (Table 2.3).
4 As such the modelling approach has been influenced by Pyatt’s "SAM Approach to
Modeling" (PYATT, 1987).

Agricultural economics and transition
58
Table 2.3: Applied GLOBE model accounts Label description Label description
Commodities and Activities Factors
gran Grains land Land scb Sugar cane and beet UnSkLab Unskilled labour ocrp Other crops SkLab Skilled labour pbf Plant based fibres cap Capital lstk Livestock natres Natural resources mlk Raw milk Regions aprd Other animal products deu Germany mins Minerals ita Italy meat Meat aut Austria mprd Meat products gbr United Kingdom vof Vegetable oils and fats fra France dair Dairy products bnl Benelux suga Sugar espt Spain and Portugal ofd Other food products reu Rest of EU-15 btob Beverages and tobacco pol Poland bind Base industries hun Hungary manu Manufactures cze Czech Republic mach Machinery reur Rest of EU-10 util Utilities robu Romania and Bulgaria cns Construction tur Turkey trd Trade and communication roecd Rest of the OECD tran Transport cis Former communist block serv Services merc MERCUSOR row Rest of the World
The results from two policy scenarios are reported and examined. Scenario 1 (Harm scenario) considers the impact of the expansion of the EU and the harmonisation of policies associated with EU memberships, while scenario 2 (HarmTechChg scenario) is concerned with the impact of technical changes consequent upon EU membership and foreign direct investment (FDI). Typically a policy scenario is constituted of changes in a number of different policy instruments, e.g., tax rates, and separate simulations are run for each change in a policy instrument and various combinations of changes, so as to provide an appreciation of the impacts of each component of the scenario and the overall impact. Generally only the results from the final experiment in a scenario are presented in detail while the information from the other experiments is used to assist with the analyses and interpretation. For instance, while an assessment of EU accession and policy harmonisation may be viewed as a single exercise the modelling of such an event will typically involve the running of a number of different simulations so as to provide an understanding of the roles of bilateral trade tax reductions and domestic policy harmonisation.
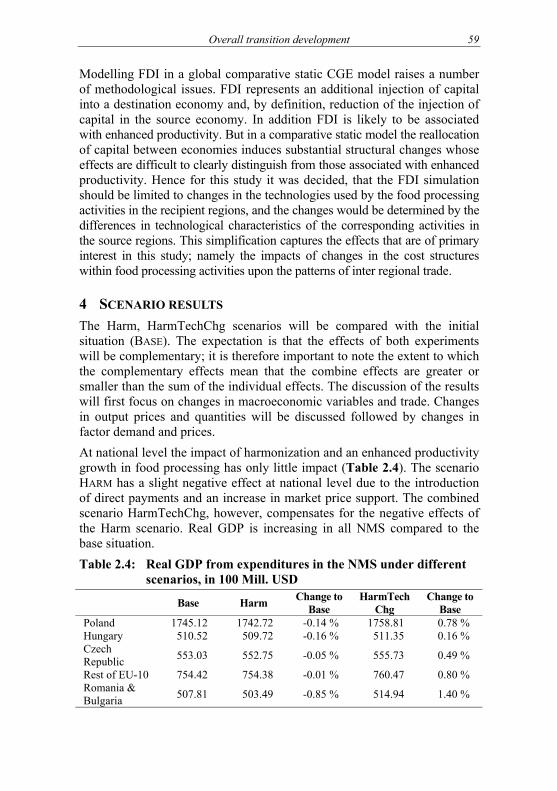
Overall transition development
59
Modelling FDI in a global comparative static CGE model raises a number of methodological issues. FDI represents an additional injection of capital into a destination economy and, by definition, reduction of the injection of capital in the source economy. In addition FDI is likely to be associated with enhanced productivity. But in a comparative static model the reallocation of capital between economies induces substantial structural changes whose effects are difficult to clearly distinguish from those associated with enhanced productivity. Hence for this study it was decided, that the FDI simulation should be limited to changes in the technologies used by the food processing activities in the recipient regions, and the changes would be determined by the differences in technological characteristics of the corresponding activities in the source regions. This simplification captures the effects that are of primary interest in this study; namely the impacts of changes in the cost structures within food processing activities upon the patterns of inter regional trade.
4 SCENARIO RESULTS The Harm, HarmTechChg scenarios will be compared with the initial situation (BASE). The expectation is that the effects of both experiments will be complementary; it is therefore important to note the extent to which the complementary effects mean that the combine effects are greater or smaller than the sum of the individual effects. The discussion of the results will first focus on changes in macroeconomic variables and trade. Changes in output prices and quantities will be discussed followed by changes in factor demand and prices. At national level the impact of harmonization and an enhanced productivity growth in food processing has only little impact (Table 2.4). The scenario HARM has a slight negative effect at national level due to the introduction of direct payments and an increase in market price support. The combined scenario HarmTechChg, however, compensates for the negative effects of the Harm scenario. Real GDP is increasing in all NMS compared to the base situation. Table 2.4: Real GDP from expenditures in the NMS under different
scenarios, in 100 Mill. USD
Base Harm Change to Base
HarmTech Chg
Change to Base
Poland 1745.12 1742.72 -0.14 % 1758.81 0.78 % Hungary 510.52 509.72 -0.16 % 511.35 0.16 % Czech Republic 553.03 552.75 -0.05 % 555.73 0.49 %
Rest of EU-10 754.42 754.38 -0.01 % 760.47 0.80 % Romania & Bulgaria 507.81 503.49 -0.85 % 514.94 1.40 %

Agricultural economics and transition
60
In the NMS import growth is driven by the impact of the single market (scenario HARM). Total import demand grows between 1.5 % in Poland and 2 % in the Czech Republic. Under the HarmTechChg scenario market integration of Romania and Bulgaria increases more strongly and total imports in Romania and Bulgaria increase by 2.4 % (Figure 2.4). Exports in the NMS increase due to both the harmonization and increasing productivity growth. Here the effects are complementary and result in higher growth rates in total exports than growth rates in total imports in all NMS. Figure 2.4: Changes in total import demand and export supply in the
NMS under different combined scenarios, relative to base, %
0.0 0.5 1.0 1.5 2.0 2.5 3.0 3.5 4.0
PO
HU
CZ
Rest of EU-10
RO & BG
Imp. Dem.: Harm Imp. Dem.: Harm&TechChg Exp. Sup: Harm Exp. Sup: Harm&TechChg
In most of the NMS output prices show a strong increase for agricultural pro-ducts, which are almost non-traded, e.g. sugar beets and raw milk (Figure 2.5.).
Figure 2.5: Changes in output prices of primary agricultural products under scenario Harm&TechChg in NMS, relative to base, %
-20.0
-10.0
0.0
10.0
20.0
30.0
40.0
50.0
60.0
PO HU CZ Rest of EU-10 RO & BG
Grains Sugar cane and beet Other crops Livestock Raw milk Other animal products

Overall transition development
61
The strong increase in prices for dairy and refined sugar in Hungary leads also to an increase in sugar beet and raw milk prices. Here higher input prices also influence the market prices of processed output. In the other acceding countries this relationship is not evident due to high productivity growth in food processing industries and smaller increases in prices for intermediate inputs. Due to reduced price support after harmonisation, and a strong increase in production, cereal prices decline in all NMS. Lower border protection for beverages and tobacco also cause declines in prices for these commodities in all NMS. In general grain production increases in all NMS while production of other crops decline in most of the NMS decline after introduction of the CAP; these changes are broadly consistent with the price changes. In Hungary, apart from grains the supplies of all primary agricultural products decline, and also decline in most food processing activities. In Poland, livestock supply increases by more than 5 % in the Harm scenario. For livestock production the increase in prices also follows an increase in output in Poland and the Czech Republic. In the rest of EU-10 increases in raw milk and sugar beet prices have a positive impact on output level. The decline in other animal products (mainly pork and poultry meat) is caused by an increase in feed costs. The impact of enlargement for primary agricultural production in the EU-15 is rather limited. The results indicate a shift of cereal production from the EU-15 to the NMS of Central and Eastern Europe. Figure 2.6 highlights that due to improved technical change in the HarmTechChg scenario the production quantities for processed food increase compared to the HARM scenario. Overall the production of most processed foods in the NMS increases considerably compared to the BASE situation. Figure 2.6: Changes in output quantities for processed food under
scenario harm and HarmTechChg in NMS, relative to base, %
-15.0
-10.0
-5.0
0.0
5.0
10.0
15.0
20.0
25.0
30.0
35.0
PO HU CZ Rest ofEU-10
RO & BG PO HU CZ Rest ofEU-10
RO & BG
Meat Meat products Vegetable oils and fats Dairy products Sugar Beverages and tobacco
HARM HARMTECHCHG

Agricultural economics and transition
62
The results of the Harm scenario show intensified agri-food trade between the EU-15 and the NMS which is due to the single European market. However, most of this increase reflects a redirection of trade flows rather than trade creation. Here, trade relations with the countries of the Former Soviet Union are mostly affected. The differences in changes in export supply across the NMS are also due to the initial protection of the EU-15 and the NMS, as well the degree of integration into international markets before enlargement. Figure 2.7: Changes in industries’ exports under scenario
Harm&TechChg in NMS, relative to base, %
-20.0
-10.0
0.0
10.0
20.0
30.0
40.0
50.0
60.0
70.0
80.0
PO HU CZ Rest of EU-10 RO & BG
Meat products Vegetable oils and fats Dairy products SugarOther food products Beverages and tobacco Industries Services
Under the combined scenario exports of grains and livestock increase for all NMS; these increases are triggered by lower border protection in the EU-15 countries. Other crops’ exports however decline in most NMS, which can be explained by lower excess supply in the NMS. Compared to primary agriculture, processed food exports grow even more strongly after EU membership. The meat, dairy and sugar industries show the greatest increases in exports under the HarmTechChg scenario (Figure 2.7). The results of the HarmTechChg scenario show that the combination of EU membership and an inflow of FDI to the food processing industries, which is modelled in terms of higher rates of technical progress in the agri-food sector, will result in a 10 % increase in the agri-food exports of the NMS. Factor prices do not change significantly in the EU-15; enhanced productivity growth in the NMS food processing industries has only minor impacts on factor prices and demand in the EU-15 countries. On the other hand enhanced productivity growth in food processing will extenuate the increase in land prices in the NMS (Table 2.5): Under HarmTechChg scenario technical

Overall transition development
63
change increases further the (derived) demand for land in the NMS and land prices continue to increase. Because land is only used in agricultural activities, the pronounced increase in demand and the high subsidy rates post accession produce sharp increases in land prices. Table 2.5: Changes in land prices in NMS, relative to base, %
Harm HarmTechChg Poland 103.70 119.94 Hungary 238.66 252.31 Czech Republic 60.81 71.03 Rest of EU-10 105.90 123.78 Romania and Bulgaria 222.34 241.82
The Harm scenario, with the introduction of direct payments, has a strong impact on land demand for grains in all NMS. Land demand for sugar beet and for livestock declines, due to decoupled payments in livestock production. This tendency is even stronger in the combined Harm&TechChg scenario. The combined scenario Harm&TechChg has little impact in most other European countries with the exception of Austria where land use for grain declines and for livestock uses expands. The impact of the Harm&TechChg on labour demand in agricultural sectors is less pronounced compared to the changes in land demand. Compared to Harm scenario, the employment effects are greater under the combined Harm&TechChg scenario. Here the additional production incentive in primary agriculture by enhanced technological change leads to an increase in employ-ment in agri-food industries. The introduction of the CAP has some effect on agri-food production and consequently also on demand for labour. However, the changes in labour demand are relatively small compared to land demand. These different effects are due to the fact that land is a sector-specific factor in agriculture. On the other hand labour is assumed to be flexible and to be able to move into and out of agriculture. Lower land user prices leads to an increase in land use and a decline in labour use in some cropping sectors, e.g. grains. Here changes in relative factor prices lead to increases in labour intensity in grain production in Poland, the Czech Republic and in Bulgaria and Romania. In the food processing industries growing output in dairy and meat processing leads also to an increase in employment.

Agricultural economics and transition
64
Table 2.6: Changes in unskilled labour demand in agri-food industries under Scenario HarmTechChg, relative to base, %
Poland Hungary Czech Republic
Rest EU-10
Bulgaria & Romania
Grains -5.18 10.66 -4.72 2.89 -5.16 Sugar cane and beet 3.12 0.93 5.90 5.90 5.14 Other crops -2.73 -11.69 -1.76 -1.87 1.70 Plant based fibres -0.46 9.56 -0.08 1.23 7.01 Livestock 7.57 5.11 3.76 0.30 3.36 Raw milk 1.57 7.51 1.17 3.44 3.32 Other animal prod. 3.85 -0.77 1.71 0.99 4.85 Meat 8.36 10.56 5.12 7.19 5.61 Meat products 2.40 -2.08 0.68 0.02 1.31 Vegetable oils -2.64 -9.64 -4.53 -2.25 -2.91 Dairy products 8.02 6.46 5.53 20.42 1.12 Sugar 3.27 5.40 3.39 6.85 3.13 Other food prod. 0.72 0.27 -0.11 0.17 3.26 Bever. & tobacco -0.41 -0.15 -1.44 1.05 2.11
5 CONCLUSIONS This study identifies some of the implications of attracting FDI in transition countries: Accelerated economic growth, an improved trade balance and higher employment in the agri-food sectors. FDI serves to generate employ-ment and income to the extent that they do not eject local firms out of business. FDI relaxes capital constraints and result in transfer of technology or spurring innovation. However, FDI could also result in concentration of global market power and repatriation of profits. The qualitative and quantitative analysis shows the impact and importance of EU membership for the agri-food sectors in the NMS. In general, EU membership has a positive impact on production and income in the agri-food sectors in the NMS. The internal trade liberalisation in the Single European Market will help to improve the market integration of the agri-food sectors into the European economy. With the full membership agri-food trade balances improve which indicates an increase in the competitiveness of the NMS agri-food industries. The scenario analyses clearly illustrate the importance of further steps to improve factor productivity in the agri-food sectors. If the NMS attract FDI investments and investments from national sources the positive developments shown would become even more pronounced.

Overall transition development
65
For primary agriculture the most significant result is the increase in land prices after accession. Agricultural incomes increase by more than 50 % after accession which is explained by the introduction of direct payments in the NMS. Primary agriculture is also affected by FDI in the food processing industries, through an increased intermediate demand of the food sector which is partly supplied by local agriculture. As has been argued, the degree of competitiveness of industries is determined especially by the development of sectoral productivity. Therefore, the scenario analyses of this study focus on the impact of enhanced productivity growth in the agri-food sector. The overall competitiveness of the EU agri-food industry improves only a little under the conditions of the enlarged market of 27 Member States. However, for the agri-food industry in the NMS the Single European Market provides an opportunity and a threat. On one hand, it means an extended free trade area for the producers in the NMS with an increase in market potentials. On the other hand, farmers and food processors now face the competition from the EU-15 countries. To exploit these opportunities the food industry has to improve the attraction of FDI into their food processing sectors. The scenario analyses of this study identify the importance of FDI on production, trade and income in the NMS. However, the functioning of factor markets is also a pre-condition for this kind of successful development. Market imperfections such a high labour immobility reduce the benefits significantly. The results show that the overall impact of EU membership can be negative considering high labour immobility, if structural change is not taking place. As shown in the analyses the introduction of the CAP in the NMS leads in many markets to an increase in agricultural producer prices. In those markets the CAP provides an incentive to expand agricultural output and to gain market shares in the Single European Market. With an enhanced attraction of FDI in the food processing industries in the NMS the integration of the agri-food sectors in the NMS into the Single European Market will become even stronger.
REFERENCES DERVIS, K., DE MELO, J., ROBINSON, S. (1982): General Equilibrium Models for Development Policy. World Bank, Washington.
DIMARANAN, B. V. (ed.) (2006): Global Trade, Assistance, and Production: The GTAP 6 Data Base. Center for Global Trade Analysis, Purdue University.
MCDONALD, S., THIERFELDER, K., ROBINSON, S. (2007): GLOBE: A SAM Based Global CGE Model using GTAP Data. Department of Economics Working Paper 14, United States Naval Academy. http://ideas.repec.org/p/usn/usnawp/14.html (Retrieved: October 2007).
PYATT, G. (1987): A SAM Approach to Modeling. Journal of Policy Modeling, 10, pp. 327-352.

POLICY REFORM AND AGRICULTURAL PRODUCTIVITY IN TRANSITION COUNTRIES
HANHO KIMA, DONGHWAN ANB a Professor, Department of Agricultural Economics and Rural Development,
Seoul National University, Seoul, 151-921, Korea. E-mail: [email protected] bAssistant Professor, Department of Agricultural Economics and Rural Development,
Seoul National University, Seoul, 151-921, Korea. E-mail: [email protected]
1 INTRODUCTION Many researchers have shown evidence that the socialist economy system and particularly the agricultural sector in the centrally planned economy is notoriously inefficient (MATHIJS, SWINNEN, 1997; LERMAN et al., 2002; 2003). They suggested that the transition to a market-oriented system would be good strategy to cure these chronic inefficiencies. If this is true, transition countries have been improving their economic performance throughout the transition period. However, literature on the performance of transition economies remains sparse from the perspective of empirical context. In addition, relatively little attention has been paid to the sources and dynamic patterns of productivity changes in these countries. A number of studies have investigated the characteristics and performance of agricultural reform in transition countries, particularly for CEE (Central and Eastern Europe) and CIS (Commonwealth of Independent States) countries (SWINNEN, 1999; LERMAN et al., 2002). Recently, SWINNEN (2006) concluded that agricultural performance in input use, output, and productivity depends on a combination of initial conditions and reform policies. This study examines the performance differentials of the agricultural sector in transition countries. We also investigate the sources affecting the performance and patterns of productivity change. In particular, we try to explore how the reform policies affect the performance of agricultural sectors. We first examine data and empirical models employed in this study, and present estimation results and their implications, followed by our conclusion and some suggestions for future research.

Overall transition development
67
2 DATA AND ANALYTIC FRAMEWORK The data used for this study are obtained from the FAO and the UN, for the period of 1992-2003. We included 28 transition countries from Eastern, Central Europe and Asia to construct a complete balanced panel data set; hence, the total number of observations for this study is 218. As an output measure, we used gross domestic product in agricultural sector (agricultural GDP) at 1990 constant prices. As input measure, we included labor (economi-cally active population in agriculture), land (total agricultural land including arable land, permanently cropped and permanent pasture) and capital stock (tractor equivalent total agricultural machinery). In this study, total 28 transition countries in Europe and Asia are grouped into three categories for comparison; eleven countries are categorized as CEE (Central and Eastern Europe), eleven countries are under CIS (Commonwealth of Independent States, former Soviet republics), and six countries fall under ASIA (Asian) transition countries. In order to measure the performance of the agricultural sector, we employ a non-parametric approach commonly referred to as data envelopment analysis (DEA) developed by Charnes et al. (1978). Specifically, this study uses directional distance function (CHAMBERS et al., 1996) as a variation of Luenberger’s shortage function. Following CHAMBERS et al. (1996), we define Luenberger productivity indicator measuring productivity changes based on the directional distance function. Following CHAMBERS et al. (1996b), the Luenberger productivity indicator can be decomposed into two components; efficiency change (EFFCH) and technical change (TECH).
3 ESTIMATION RESULTS 3.1. Changes in the technical efficiency According to the estimation results, the overall mean of technical inefficiency estimate during the study period is 0.1827. This indicates that on average, the netput of the agricultural sector of transition countries could have been increased by 0.1827 times of observed netput level if frontier technology were available. Among the three country groups, the Asian country group recorded the smallest mean technical inefficiency (0.0527). That is, the agri-cultural sector of Asian transition countries, on average, performed better than their CEE (0.0875) and CIS (0.3489) counterparts. CEE countries performed much better than CIS on average. The estimation results also show the existence of a significant performance gap across countries in their agri-cultural sector.

Agricultural economics and transition
68
3.2 The patterns of productivity changes The decomposition of productivity changes into efficiency and technical changes shows that the patterns of productivity change are quite different among each country group (Table 2.7). CEE countries recorded much higher productivity growth (0.0232) than CIS (-0.0173) and Asian (0.0105) transition countries. The higher productivity growth of CEE countries is mainly attributable to technical progress (0.0192). Although Asian transition countries suffered from efficiency deterioration (-0.0041), they recorded positive productivity growth (0.0105) due to technical progress (0.0146). However, agricultural sector in CIS countries experienced productivity decline (-0.0173) due to high efficiency deterioration (-0.0249). The decomposition results show that there exist significant differentials in the dynamics of the changes in two productivity components across country group. Table 2.7: Decomposition of productivity changes by country group Country Group Efficiency Change
(A) Technical Change
(B) Productivity
Change (A+B)
CEE 0.0039 0.0192 0.0232 CIS -0.0249 0.0076 -0.0173 ASIA -0.0041 0.0146 0.0105
Figure 2.8 depicts the patterns of productivity change for all transition countries through decomposition. Here, the horizontal axis represents efficiency change, and the vertical line represents technical change. For example, the countries in the first quadrant represent those in the position of improvements in both technical and efficiency changes while those in the second quadrant, in the position of improvements in technical change and deterioration in efficiency change. From Figure 2.8, the patterns of productivity change can be categorized into five groups; (1) countries with efficiency improvement and technological progress (Bulgaria, Czech Rep., Romania), (2) frontier countries with technological progress (Albania, Croatia, Estonia, Slovenia, Armenia, Myanmar, Vietnam), (3) frontier countries with technological regress (Russia, Afghanistan, Laos), (4) countries with technical progress and efficiency deterioration (Hungary, Latvia, Lithuania, Poland, Azerbaijan, Belarus, Kazakhstan, Kyrgyzstan, Tajikistan, Turkmenistan, Uzbekistan, Cambodia, Mongolia), and (5) countries with technical regress and efficiency deterioration (Georgia, Ukraine).

Overall transition development
69
Figure 2.8: The patterns of productivity change
Bulgaria
CroatiaM yanm ar
Albania, Estonia
CzechLatvia
Lithuania
Poland
Rom ania
Slovenia
Arm enia
AzerbaijanBelarus
G eorgia
Kazakhstan
Kyrgyzstan
Russia
Tajikistan
Turkm enistan
Uzbekistan
AfghanistanCam bodia Laos
M ongolia
V iet Nam
Hungary
efficiency change
technical change
3.3 Reform, industrial transformation, and productivity We estimate a regression model in order to characterize factors affecting the productivity of agricultural sector in transition countries. In particular, we focus on the effects of reform policy on the productivity. Table 2.8 provides the estimation results of two regression models in which the technical inefficiency measures are dependent variables; (1) including all countries, (2) including CEE and CIS countries only. To account for the truncated nature of the distribution of our productivity measures, we have used a panel Tobit approach. We regressed the productivity measure (technical inefficiency) on various explanatory variables, including the country group dummy (CEE, ASIA), time dummy (Time), farm size (Scale: Farmland per worker in agricultural sector), capital-labor ratio (CapLab: The number of tractors per worker), and the level of industrial transformation (Agratio: The proportion of agricultural GDP to total GDP). We also include an explanatory variable measuring the level of reform in agricultural sector (Reform97) to test the hypothesis on the significance of reform policy in explaining productivity differentials across countries. All coefficient estimates have the expected signs in both models, except for farm size (Scale). Recall that the dependent variable is inefficiency, and hence, a negative (positive) sign of a coefficient represents the positive (nega-tive) effect of that variable on the performance of agricultural sector. First, in the regression model including Asian countries, all coefficient estimates

Agricultural economics and transition
70
are statistically significant. The estimation results show the presence of signi-ficant productivity differentials among country groups. Second, we estimated a regression model including CEE and CIS countries only. This provides a framework to test whether reform policy affects productivity or not. In CEE and CIS transition countries, farm size and capital-labor ratio may not be important factors for the performance of agricultural sector. Estimation results for time dummy and industrial transformation variables are same as the all-country model. The reform policy is found to be positively related to the performance of agricultural sector in transition countries, as shown by previous studies such as SWINNEN (2006). Table 2.8: Estimation results of Tobit Model All countries (N1)=336) CEE and CIS countries (N=154)1
Variables Estimates (t-value) Variables Estimates (t-value)
CEE -0.24154 (-2.47) ** CEE -0.30724 (-2.58) ***
ASIA -0.33003 (-4.12) *** Time 0.00971 (2.35) **
Time 0.00584 (2.25) ** Reform97 -0.05420 (-1.85) * Scale 0.00060 (2.39) ** Scale -0.00136 (-0.85)
CapLab -0.00061 (-2.79) *** CapLab -0.00009 (-0.98)
Agratio -0.76579 (-4.98) *** Agratio -0.59995 (-1.85) *
Constant 0.47881 (6.00) *** Cons 0.69570 (3.16) ***
σu 0.28799 (6.45) *** σu 0.27533 (5.75) ***
σu 0.11269 (17.72) *** σe 0.07140 (12.59) ***
ρ =σ2u /(σ2
u + σ2
u) 0.867222 ρ =σ2
u /(σ2u + σ2
u) 0.93702
Loglikelihood 52.77 Loglikelihood 62.74 Notes: *** Significant at 1 %; ** Significant at 5 %,;* Significant at 10 %; 1N = the
number of observations used for regression; 2 The hypothesis that ρ = 0 is rejected at significance level of 0.1 %.
3.4 Initial condition and productivity Following DE MELO et al. (1997), we grouped 11 initial condition variables into two; (1) indicators for initial levels of development, resources, and growth (income, urbanization, industrialization, natural resources, geo-graphical proximity to thriving market economies, prior economic growth); (2) initial macroeconomic distortions and institutional characteristics (repressed inflation, trade shares in GDP, the black market exchange rate premium, initial institutional characteristics, market memory).

Overall transition development
71
We also rely on the method of principal components to reduce the dimensionality of these variables for our regression. The result of principal component analysis indicates that the first two principal components account for most of the variation (65.4 %). Like DE MELO et al. (1997), the first principal component (COM1) has high positive correlations for economic distortions such as the black market exchange rate premium, market memory, repressed inflation, and trade shares in GDP. Hence, the values in the eigenvector for these variables may represent the degree of macroeco-nomic distortions at the beginning of transition, and a measure of unfamiliarity with the market economy. The second principal component (COM2) has high positive correlation for income and urbanization, and hence COM2 might be interpreted an index of the overall level of development. Table 2.9: The impact of initial condition on the performance Variables Estimates (t-value)
Time 0.0042 (1.56) Scale -0.0015 (-1.67)* CapLab -0.0006 (-2.85) *** Agratio -1.0195 (-5.99) *** COM1 0.1141 (6.64) * COM2 -0.0392 (-1.31) Constant 0.4289 (6.17) * σu 0.2310 (5.65) * σu 0.1099 (16.75) * ρ =σ2
u /(σ2u + σ2
u) 0.8154 Loglikelihood 60.54
Note: (1) *** Significant at 1 %; ** Significant at 5 %; * Significant at 10 %. (2) The number of observations used for regression = 264. (3) The hypothesis that ρ = 0 is rejected at significance level of 0.1 %.
Table 2.9 provides the estimation results of our regression model. Here, the dependent variable is also the technical inefficiency measure. All variables have the expected sign. Estimation results show that the degree of macro-economic distortions at the beginning of transition (COM1) has significant negative impact on the performance of agricultural sector. The overall level of development (COM2) has positive impact on the performance of this sector, but the coefficient is statistically insignificant.
4 SUMMARY AND CONCLUSION This paper examined the performance of the agricultural sector in 28 CEE, CIS, and Asian transition countries focusing on the dynamics of productivity changes and the effects of reform policy.

Agricultural economics and transition
72
First, Asian and CEE transition countries performed better than CIS countries. However, the performance improvement of CEE countries seems to be more prominent compared to that of Asian and CIS countries. Second, the productivity growth is mainly attributable to the technical progress, particularly in CEE countries. CEE countries achieved both effi-ciency and technical improvement while CIS countries suffered from produc-tivity decline due to efficiency decline and sluggish technical progress. Third, reform policy and industrial transformation seems to have positive effects on the performance of agricultural sector and its changes. Finally, the initial conditions do matter. The degree of macroeconomic distortions at the beginning of transition has significant negative impact on the perfor-mance of agricultural sector, while the overall level of development has positive impact on the performance of this sector.
REFERENCES CHAMBERS R. G., CHUNG Y., FÄRE R. (1996): Benefit and Distance Functions. Journal of Economic Theory, 70, pp. 407-419.
CHAMBERS R. G., CHUNG Y., FÄRE R. (1998): Profit, Directional Distance Functions, and Nerlovian Efficiency. Journal of Optimization Theory and Application, 98, pp. 351-364.
CHARNES, A., COOPER, W. W., RHODES, E. (1978): Measuring Efficiency of Decision Making Units. European Journal of Operational Research, 2, pp. 429-444.
DE MELO, M., DENIZER, C., GELB, A., TENEV, S. (1997): Circumstance and Choice – The Role of Initial Conditions and Policies in Transition Economies. Policy Research Working Paper, The World Bank.
LERMAN, Z., CSAKI, C., FEDER, G. (2002): Land Policies and Evolving Farm Structures in Transition Countries. World Bank, Washington, D.C.
LERMAN, Z., KISLEV, Y., BITON, D., KRISS, A. (2003): Agricultural Out and Productivity in the Former Soviet Republics. Economic Development and Cultural Change, 51, pp. 999–1018.
MATHIJS, E., SWINNEN, J. F. M. (1997): The Economics of Agricultural Decollectivization in East Central Europe and The Former Soviet Union. Policy Research Group Working Paper No. 9. Katholieke Universiteit Leuven.
SWINNEN, J. F. M. (1999): The Political Economy of Land Reform Choices in Central and Eastern Europe. Economics of Transition, 7, pp. 637–664.
SWINNEN, J. F. M. (2006): Policy Reform and Agricultural Adjustment in Transition Countries. In: BLANDFORD, D. (ed.): Policy Reform and Adjustment in the Agricultural Sectors of Developed Countries.

CHANGES IN THE STRUCTURE OF AGRICULTURAL PRODUCTION, FARM STRUCTURE AND INCOME IN HUNGARY IN THE
PERIOD OF 2004-2006
GÁBOR SZABÓ
University of Debrecen, H-4032 Debrecen, Böszörményi 138. E-mail: [email protected]
1 INTRODUCTION This study will review the major changes that occurred between 2004 and 2006. It will also diagnose the problems stemming from these changes, but not submit proposals for their solution. As for a database, the study has relied on data and publications from the Hungarian Central Statistical Office (KSH), the Research Institute of Agricultural Economics (AKI), and Eurostat. When developing the analysis, assistance was provided by consultants from the University of Debrecen and elsewhere. Three factors make it difficult to extend the topic’s scope. First, when it came to weather the years 2004-2006 were better than average. Second, currently one can only offer a restricted evaluation of the Common Agricultural Policy’s (CAP) effect on facets of Hungarian agricultural income. Third, the same holds true for its environmental/nature conservation policies. The last few years clearly show that Hungarian society – and especially the rural population – was not ready for the anticipated consequences and challenges posed by EU accession. While large-scale agricultural producers were well-informed, farmers with small and mid-size operations were fearful of the future. Moreover, experts from the Research Institute of Agricultural Economics (MÉSZÁROS, 2002; KARTALI et al., 2004a, 2004b; POPP et al., 2004; POTORI, UDOVECZ, 2004) have published several papers on the possible consequences of EU accession. With the goal of facilitating future decisions, they conducted impact studies and forecasts on crop production and animal husbandry. And these impact studies and forecasts proved most correct.

Agricultural economics and transition
74
However, a highly heterogeneous product range rendered forecasts for horticultural production unreliable.
2 EXPANSION AND STRUCTURAL CHANGE IN HUNGARIAN AGRICULTURE
Table 2.10 shows agricultural production indices. Table 2.10: Agriculture gross output volume indices (1986-1990=100)
Period Agricultural production Crop production Animal
husbandry
1986-1990 100 100 100 1991-1995 73 76 70 1996-2000 70 75 65 2001-2003 74 81 66 2004-2006 81 100 58
Source: KSH (2007a). Even if the average of the 2004-2006 figures are considered, Table 2.10 still shows that the total output figure did not equal that preceding the regime change. In the second half of the 1990s crop production reached rock bottom, but later recovered and shot straight up. However, animal husbandry appears in an unstoppable downward spiral. In the 1970s and 1980s there tended to be a 50-50 % output distribution between the main sectors, but subsequently this radically shifted toward crop production. Therefore, domestic demand for forage plants plummeted and caused severe sales problems. In 2004-2006 Hungarian farmers were aided by superb weather conditions and, weather-wise, 2006 was also a pretty good year. It is thus expected that between 2004 and 2006 cereal production will be shown to have greatly surpassed the previous years’ average (KSH, 2007a). These abundant cereal harvests had a decisive impact on the crop producing sector Thanks to post-EU accession intervention procurement policies, those farmers producing cereals, oil, and protein crops (GOFR products) had a much bigger and guaranteed income. However, most of the 2004 area-based subsidies were delayed until 2005, creating severe liquidity problems for the majority of farmers. Storage problems have largely been solved, but selling accumulated stock still poses great difficulties. On September 28, 2006 Hungary’s intervention cereals stock was 5,616 million tons, most of which was maize (the latter constituting 80 % of the entire stock of the EU-25 countries) (FVM, 2006b).

Overall transition development
75
While the positive effects of EU market regulations and good weather combined to benefit crop production, in the animal husbandry sector the enduring fifteen-year crisis worsened. Compared to the year prior to Hungarian EU accession, major stock species (excluding sheep) were smaller at the end of 2006. It was mainly private farmers that cut their stock numbers. Between 2003 and 2006, the overall number of company farms raising cattle increased slightly, but 40 % of private farms gave up raising cattle. The number of company farms and co-operatives raising pigs increased by 14 %, whereas that of private farms decreased by 27 %. The number of company farms maintaining hen stocks remained largely stable, but 26 % of private entrepreneurs liquidated their stock. In post-accession Hungary only sheep stock somewhat increased. However, 7 % of private producers also gave up sheep farming. Concurrent with EU accession, the Hungarian dairy sector underwent reforms which resulted in a steep fall in domestic dairy prices and prompted the bankruptcy of a number of producers – mainly private entrepreneurs. Hungarian dairy producers’ market position was eroded by imports of so-called "ersatz milk" and by imported cheap milk and dairy products from some of the new member states. As expected, it was only those involved in sheep and beef husbandry whose positions were perceptibly improved by the CAP. The CAP only provides moderate subsidies for horticultural products. Furthermore, these plants are extremely weather sensitive and booming import competition badly damaged the sector’s market position.
3 CHANGES IN FOREIGN FOOD TRADE For decades Hungary enjoyed a positive foreign food trade balance, and this trend also held true for the EU-15. In 2004 and 2005, the sector was stunned when food imports increased much faster than food exports, especially in relation to Poland, the Czech Republic, and Slovakia. The competitiveness of Hungarian foods has definitely decreased, especially with regard to animal products. In 2003, milk and dairy exports surpassed imports by 173,000 tons. In 2005, however, Hungary imported 95,000 tons more than it exported. Within two years Hungary’s 81,000 tons pork export surplus became a 44,000 tons import surplus. As for poultry, the positive export-import balance decreased by more than 30 % (AKI 2006a, 2006b).

Agricultural economics and transition
76
Table 2.11: Foreign food trade balance at current price in billions of HUF
Year Balance 2002 308.9 2003 303.1 2004 223.1 2005 181.1 2006 215.0
Source: KSH (2007a). Table 2.11 shows that in the year Hungary joined the EU the balance fell by about HUF 80 billions, meaning approximately 26 %. In 2005 he decrease continued at a slightly slower rate. 2006 data indicate some improvement. The declining competitiveness of Hungarian food products within the European Union is mainly caused by logistical shortcomings and poor marketing, and this is especially true in relation to the "Visegrád Countries." (However, on a national economic basis Hungary’s post-accession foreign trade balance has constantly improved.) Hungarian food exports (67.8 %) and food imports (90.2 %) are highly EU-centered. (KSH, 2007a) For many years Hungary’s export surplus with the EU-15 had been declining, and then almost disappeared. Hungary’s consi-derable export surplus with new member states has been replaced by an import surplus. The greater part of the national export surplus is with non-EU countries.
4 AGRICULTURE’S DETERIORATING CAPACITY TO SUSTAIN AND RETAIN THE RURAL POPULATION
During the past 15 years Hungarian agricultural economic literature has given prevalence to the issue of competitiveness, allowing it to overshadow agriculture’s role in sustaining and retaining the rural population. Official labour statistics do not reflect agriculture’s real role in sustaining the rural population. Agriculture still has an important employment role. This is especially true in two in Hungary’s seven regions: Specifically certain areas in the Northern and Southern Great Plain regions. For the foreseeable future this situation is not expected to change. To quote Gyula Varga, "…although agriculture is not and will not be able to provide more people with work and subsistence, this role has not been taken by anything else in most rural areas. This is the main reason for the lack of jobs in the country (VARGA, n. d.)."

Overall transition development
77
After EU accession, horticulture and major animal-husbandry sectors were pushed into the background, and employment opportunities in agriculture plummeted. However, income sources for part-time agricultural employees dropped even further. It is important to mention that in Hungary, paid work is only 22 % of agricultural labour input as measured in AWU. (Annual Working Unit – 1,800 working hours per year) (KSH, 2007b). EU rural development subsidies have not provided adequate compensation for those displaced from agricultural production. Under the Agricultural and Rural Development Operative Programme (ARDOP), only relatively few people might be able to save their jobs or create new ones (FVM, 2006a)." In the older 15 EU member states agricultural production is firmly dominated by family farms. In Hungary, agricultural enterprises (companies and co-operatives) also have a major role. KSH’s 2005 data show that 55 % of gross agricultural output and 39 % of GDP were created by agricultural enterprises. The remainder was created by private systems working on a full or part-time basis (KSH, 2007a), and in terms of GDP this entailed the bigger portion. If one considers the totality of agricultural procurement, then because of the latter’s higher personal consumption quota, enterprises certainly dominate. But most horticultural products, for example, come from private farms. Besides approximately 8,000 agricultural enterprises, KSH’s 2005 Farm Structure Survey (KSH, 2006d) listed the data from more than 700,000 private farms. However, only 15 % of these private farms should be regarded as actual commodity producers. Around half of them produce exclusively for their own consumption, and one-third occasionally take their produce to market. There is a major difference between the two sectors’ production tendencies. Nearly three-quarters of agricultural enterprises operate exclusively in crop production. The percentage of those ventures raising livestock only comes to 9 %. In comparison, 47 % of private farms only produce crops with a strong emphasis on horticultural products. Only a fifth of these farms are involved exclusively in raising farm animals. Crop production has roughly the same revenue share in the two sectors. As for animal husbandry and horticulture, the figures are markedly different. KSH’s data suggest that 80 % of vegetable, fruit, and vine output is produced on private farms. In terms of area size, Hungarian agriculture is bipolar in nature. Farm companies and co-operatives have on average 374 hectares of cultivated land. This is more than 100 times the typical size of private farms (3 hectares) (KSH, 2006d).

Agricultural economics and transition
78
Agricultural enterprises involved in large-scale crop production wish to minimize labour costs. For this reason a given region’s employment picture is a matter of indifference to them. Clearly small and mid-size private farms practicing intensive horticulture and some animal husbandry provide better employment conditions than big enterprises focusing on GOFR crops. In any country calculating agricultural labour input poses problems. In Hungary, one uses a number of methodologies. The data of Hungarian Central Statistical Office (KSH, 2007a, 2007c) indicate that the number of full time agricultural employees decreased by 11.3 % during the first three years after Hungarian EU accession. This outpaces the 2001-2003 rate (this statistic only includes those full-time private farmers with entrepreneurial permits). In the EU actual agricultural income trends are usually measured with the so-called "A" index, meaning the real income change for factors per AWU. Eurostat data (EUROSTAT, 2007) reveal that, compared with the 2000 data-base, substantial changes occurred in each of the mentioned countries in the post-accession period. Using the 2006 data allows these countries to be divided into two groups:
• Poland and the Baltic countries have doubled real agricultural incomes per AWU;
• Hungary, Slovenia, the Czech Republic, and Slovakia, on the other hand, have done much worse (+23-60 %).
We can observe very big differences in the indices of net value added as well as labour inputs. Subsidies compose a very important part of value added in all EU-countries, especially in the new member states, bur there are big differences among ratios (EUROSTAT, 2007). Better than average weather conditions and an expanding subsidy system contributed to the increase in calculated agricultural earnings. Clearly most of this surplus was achieved by large-scale cereal-producing enterprises enjoying generous CAP support. Other sectors and smaller farms (especially private ones) did not achieve such rosy financial results. FADN data show the following pattern for per hectare pre-tax income regarding agricultural area: The mean figures for the 2001-2003 and 2004-2006 periods reveal that farms boasted a 2.6 times increase. This includes a twofold growth for private farms and a six fold rise for agricultural enterprises. Here several factors must be taken into account. One factor was expanding subsidies, but the base figures were also rather small and in recent years some of the poorly performing farms have ceased operation. Weakness in sustaining and retaining agricultural capacity is also revealed by full-time agricultural employees’ net earnings which have not yet caught

Overall transition development
79
up to those of workers in other sectors. Data published from the first half of the current year suggest that their income lags behind the national average by about 30 % (KSH, 2007a). Lastly it is pertinent to mention that the volume of agricultural investment falling within the CAP framework has perceptibly decreased since 2004. This has had a detrimental effect on agricultural employment by hindering essential sectoral improvements (KESZTHELYI, 2007; KSH, 2007a). For all FADN farms the average net investments per hectare of agricultural area during 2004 and 2006 reached only 3 % (!) of the previous three years’ average. Although agricultural enterprises only suffered a 35 % decline, the negative private farm figures suggest that the erosion of assets started in 2004-2007 (KESZTHELYI, 2007). As for 2007, one need only read the following AKI forecast: "As an overall assessment, it can be stated that the restrictive measures effectively siphon off the 2007 increment of subsidies originating from the Union … collective enterprises will be forced to bear the brunt of excess burden (AKI, 2006a)."
5 CONCLUSIONS (1) Despite the previous three years of good performance, Hungarian
agriculture’s output level (as reflected in the 2004-2006 average) still lagged behind the 1996-2000 period.
(2) In the pre-accession period, agricultural policies did not properly deal with the sector’s competitiveness issues or with its role in sustaining and retaining capacity.
(3) Despite overall income growth across the entire sector, the net invest-ment performance, as well as agriculture’s sustaining and retaining capacity deteriorated during the post-accession period.
(4) An obvious future need is the creation of a comprehensive national agricultural and rural development strategy. This should not be replaced by the so-called National Rural Development Strategy that serves the sole purpose of drawing upon EU financial resources.
ACKNOWLEDGEMENT In compiling this study I owe a debt of gratitude to my university colleagues, Professors Dr. István Gonda, Dr. Sándor Mihók, Dr. Zsolt Nemessályi, and Dr. Péter Pepó for their professional assistance.

Agricultural economics and transition
80
Of the experts from the Research Institute of Agricultural Economics, I received help first and foremost from Department Heads Mr. Imre Bognár and Mr. János Kartali. This study was carried out under grant number 4-014-04/2004 from the National Research and Development Programme.
REFERENCES AKI (2006a): Aktuális adatok az élelmiszer-gazdaságról [Current data on the food economy] 4(3.14).
AKI (2006b): Élelmiszer-külkereskedelemmel kapcsolatos számítások [Data relating to foreign food trade]. AKI Agrárpiaci Kutatások Osztálya. Mimeo.
EUROSTAT (2007): Agriculture (Main statistics 2005-2006) Pocketbooks, 2007 edition. European Communities.
FVM (2006a): Az Agrár- és Vidékfejlesztési Program (AVOP) részterületeinek (mid term) értékelése [Mid-term review on the measures of the Agricultural and Rural Development Programme]. http://www.fvm.hu/main.php?folderID=1586/.
FVM (2006b): A Betakarítási Koordinációs Bizottság 2006. október 4-i ülése [Session of the Coordination Committee for Harvesting on October 4, 2006].
http://www.fvm.hu/main.php?folderID=2008/.
KARTALI J. (szerk.) (2004a): A főbb mezőgazdasági termékek piacra jutásának feltételei az EU-csatlakozás küszöbén (I. kötet: Növényi termékek) [Market conditions for the main agricultural products at the threshold of EU accession – Tom 1 Plant production]. Agrárgazdasági tanulmányok, No. 1. Agrárgazdasági Kutató Intézet, Budapest.
KARTALI, J. (szerk.) (2004b): A főbb mezőgazdasági termékek piacra jutásának feltételei az EU-csatlakozás küszöbén (II. kötet: Állati termékek). [Market conditions for the main agricultural products at the threshold of EU accession – Tom 2 Animal husbandry]. Agrárgazdasági tanulmányok. No. 2. Agrárgazdasági Kutató Intézet, Budapest.
KESZTHELYI, SZ. (2007): A tesztüzemek 2006. évi gazdálkodásának eredményei [Results of the farms belonging to FADN in 2006]. Agrárgazdasági Információk, No. 5. Agrárgazdasági Kutató Intézet, Budapest.
KSH (2007a): Magyar Statisztikai Évkönyv, 2006. [Hungarian Statistical Yearbook, 2006]. Budapest.
KSH (2007b): Mezőgazdasági Számlarendszer, 2006 [Economic Accounts for Agriculture, 2006]. Budapest.
KSH (2006c): Mezőgazdasági termelés, 2005 [Agricultural production, 2005]. http://portal.ksh.hu/pls/ksh/docs/hun/xftp/idoszaki/mgterm/mgterm05.pdf/.
KSH (2006d): Magyarország mezőgazdasága, 2005 (Gazdaságszerkezeti összeírás – Előzetes adatok) [Agriculture of Hungary, 2005].
http://portal.ksh.hu/pls/ksh/docs/hun/xftp/idoszaki/gszo/gszo05.pdf
MESZAROS, S. (2002): A magyar csatlakozás agrárgazdasági hatásainak összehasonlítása az EU modellszámításaival [Effects of EU accession on Hungarian agriculture – Hungarian

Overall transition development
81
and EU model calculations]. Agrárgazdasági tanulmányok, No. 3. Agrárgazdasági Kutató Intézet, Budapest.
POPP, J., POTORI, N., UDOVECZ, G. (2004): A Közös Agrárpolitika alkalmazása Magyarországon [Adaptation of Common Agricultural Policy in Hungary]. Agrárgazdasági tanulmányok, No. 5. Agrárgazdasági Kutató Intézet, Budapest.
POTORI N., UDOVECZ G. (2004): Az EU-csatlakozás várható hatásai a magyar mezőgazdaságban 2006-ig [Expected effects of EU accession on the Hungarian agriculture]. Agrárgazdasági tanulmányok, No. 7. Agrárgazdasági Kutató Intézet, Budapest.
VARGA, GY. (n. d.): Az üzemi és a vállalati struktúra és a termelés koncentrációja az EU-tagság tükrében [Farm structure and concentration of production in the reflection of EU membership]. In: Nemzeti Fejlesztési Hivatal (é.n.): EU-tanulmányok VI., pp. 161-198.

SHAPING AGRIBUSINESS AND ITS IMPACT ON THE COMPETITIVE ENVIRONMENT OF AGRICULTURAL ENTERPRISES5
VĚRA BEČVÁŘOVÁ
Professor, CSc, Mendel University of Agriculture and Forestry Brno, Zemědělská 1, 613 00 Brno, Czech Republic, E-mail: [email protected]
1 INTRODUCTION The stage when the Czech Republic as well as other Central and Eastern European countries entered the EU was marked by the fact it brought the largest historic expansion of the EU, but also by the fact that Europe faced the problem of determining its own way ahead, a way allowing for the potential of high competitiveness and economic efficiency in the global world and, at the same time, keeping social cohesion within the EU welfare system. This fact also fully concerns the shaping of a new agriculture structure and all its sectors, which are more-or-less related to the food production economy. Nowadays, we have the opportunity to see the positives as well as negatives of the common market and its regulation in practice and know that options for choosing adequate tools and methods of solutions are available even within the centrally prescribed EU limits. We can see that significant regional and structural differences are still hidden behind aggregated data about average economic performance of the economic system of the EU and those different approaches and priorities for solutions to individual issues can be chosen, provided that the issues have been identified and assessed in an objective manner. Moreover, the economic development in both old and new member countries is ever more significantly influenced by processes related to changes in the world economy that affect all economic sectors including agriculture. In agribusiness development processes the influence of finalizing segments (processing and distribution) during the shaping of demand for raw products 5 This article has been elaborated within the topical concept of the 04 Research project
PEF MZLU MSM 6215648904 "The Czech economy in the processes of integration and globalization and development of the agrarian sector and services under new conditions of the EU integrated market".

Overall transition development
83
grows, from the perspective of structural and economic characteristics, and affects the allocation and the level of utilization of production factors, which fact is also reflected in the potential development of individual regions with much broader economic, social and political consequences. These processes are of such importance that they give a new shape to agrarian markets in entire foodstuff chains, change criteria in the selection of economic tools accepting new conditions of development, and require the acceleration of reform processes and a new concept of agrarian policies in this context. Our own experience with the implementation of the common agricultural policy of the EU (hereinafter "the CAP") confirms that the changing environment excludes the solely passive role of recipients of existing subsidies, historically designed market rules and regulatory measures. In practice, the acceptance of the consumer concept in the policy and the shift of focus to the finalizing segments of the processing and distribution of foodstuffs ever more significantly form a new and harder competitive environment of both food processing companies and agricultural companies. Ever more often, a limiting condition for the level and choice of the structure of agricultural production in the particular region is success in the sales of source agricultural products in the form of demanded final/food products on end consumer markets.
2 MATERIAL AND METHODOLOGY The aim of the contribution which presents certain research as a part of the solution of a research task by the Mendel University of Agriculture and Forestry in Brno is to characterize crucial signs of changes caused by the aforementioned processes in the agrarian sector and their consequences for achieving competitiveness of enterprises. To examine the influence of agri-business and its market structure on the position of agricultural companies and directly related segments in the field of the processing of agricultural products in this context from the perspective of achieving competitive advantages and the actual economic benefit in the conditions of the particular region. The contribution deals with the problem of competitiveness of agricultural enterprises in current agribusiness, the influence of the market structure on the prosperity of enterprises at the level of primary production and processing segments in the commodity verticals and the chance to participate in the creation of added value in final products.

Agricultural economics and transition
84
3 DISCUSSION AND POLICY IMPLICATIONS 3.1 The principle of the latter-day competitiveness Contemporary agriculture is far from being an enclosed autonomous system; not only due to the acceptance of its role in the sustainable development of society, but exactly due to the changes in the position of agricultural production within the foodstuff economy. It is this "production" function where the specialization of primary agricultural production into sectors is quickly overcome. The process of expanding the agrarian market without significant barriers generally brings about many changes that positively influence the development of the particular segment of economy. Expansion to bigger markets supports the differentiation of products and causes regional transfers of production capacities and the growth of produc-tion with the most efficient entities and thereby accelerates specialization and the related possibilities to achieve savings from large-scale production; at the same time, the potential and recoverability of utilized innovations increase. Increased competition on larger markets should support and accelerate better allocation of production factors towards (the most) efficient activities and entities; this fact also creates better starting points for the increase of competitive strength on the world market. If we define the competitiveness of a certain economic system as the ability to achieve results corresponding to the aims of the system and the dynamics thereof in a competitive environment, it is clear that a prerequisite for achieving unbiased aims, including the selection of criteria for the evaluation of the extent to which they were achieved, is the knowledge of the range of factors determining their fulfilment. To assess the competitiveness of agricultural enterprises, we may choose at least two approaches related to the definition of the level of the economic system, the qualities (i.e. competitiveness) and behaviour of which should be assessed, which fact is related to the choice of the level of differentiation and examination criteria. From the perspective of method and methodology, we may choose an approach based on either (1) inter-company comparison at the horizontal level of the particular stage of production or processing of the final product or (2) prerequisites for participation in the creation of added value in the final product, i.e. from the perspective of successful participation of a company in the appropriate stage of the foodstuff vertical. To define the range of crucial factors influencing conditions for fulfilling the aims of the particular economic system and the position of an agricultural enterprise from the perspective of its "production" function in the current conditions of agribusiness, it is also necessary to examine the competitiveness

Overall transition development
85
of the agricultural enterprise from the perspective of the acceptability of the structure and achieved economic parameters of production on the part of the market in a broader context, especially from the perspective of real vertical participation in the appropriate foodstuff production system. Within this approach, it is necessary to consider the fact that the relevant market is constantly expanding with the majority of agricultural commodities. The relativity of assessment and the predictability of changes in the definition of regional markets (they currently often exceed national frontiers) is also related to this issue. A condition for achieving unbiased knowledge while using this approach is also assessment of the influence of the tools of agrarian policy that significantly distort conditions and possibilities to implement competitive advantages of enterprises on the agrarian markets. As a result, this approach to the assessment of the competitiveness of agricultural enterprises ever more often includes the analysis of the influence of a group of factors shaped by sector and national specifics or different conditions under which the agrarian sector achieved certain results. In relation to methodological issues of the analysis of the competitiveness of agriculture, it is necessary to consider at least two other aspects:
• the possibility and the level of the production utilization of differentiated natural resources, where agricultural production should be allocated in production conditions enabling a price offer accepted by the market; currently ever more often determined by the conditions of the world market (and the tools of the agrarian policy) rather than by national or regional markets;
• the influence of the macroeconomic environment shaped by the overall level of the economic system, which influences agriculture in many economic respects as well as the legal framework defining the possibility to implement the market power of suppliers and related processing and distribution segments on the markets of agricultural products and foodstuffs.
The research into the economic efficiency of the agricultural and food economy from the agribusiness philosophy is based on the dynamic concept of compe-titive advantages of the entire system. The advantages are measured not only by the result of a relatively independent entity on a specific agrarian market that corresponds to the particular stage of the increase in value of the original raw product within commodity foodstuff chains, but also by the benefit resulting from the connection and mutual relationships of entities participating within the entire process along the whole commodity chains. Within a specific region, bonds and especially the efficiency of directly related segments that process their production, i.e. usually food processing companies, are of importance for agricultural enterprises; the competitiveness of a food processing company, especially its successful participation in the

Agricultural economics and transition
86
appropriate foodstuff vertical and selection of the supplier of the source raw product, determines the actual demand on the market of agricultural products. The success of this interaction (optimizing the transaction costs within the chain) is one of the crucial factors influencing the structure and extent of agricultural production in the particular region, regardless of whether the processing company is located there or not. While regional affiliation of primary agricultural enterprises usually depends on the location of cultivated land, regional aspects are less important in the relationship to related segments of the commodity vertical (also in the case of the relationship with primary processing enterprises) – economic conditions and bonds between producers and processing companies within a broader context of the relevant market are crucial.
3.2 The impact of agribusiness market structure At the same time, market structure changes with respect to the position of entities at individual stages; this is also true with so far separately functio-ning markets of appropriate commodity verticals. They lead to a narrower collaboration of related segments, including the search for the most beneficial forms of connections, in order to increase the competitiveness of the entire chain (in practice, this is often done intuitively). The pressures on cost savings, on the one hand, and the efforts to control more stages of the foodstuff chain, on the other hand, are crucial motives causing consolidation at horizontal and vertical levels; in agribusiness, this especially applies to finalizing segments. Mergers, acquisitions, joint ventures and strategic agreements up to vertical integration take place; many inefficient segments are excluded from the market and disappear. The shaping of agribusiness, whether fully accepted in the structural and economic policies of individual countries or international groups or not, brings about new views of traditional approaches and the assessment of technical and economic efficiency of agricultural enterprises and the application of agricultural management systems. The existing knowledge of economists dealing with the development of agribusiness in American, Australian and European conditions (e.g. CRAMER, JENSEN, 1994; MUNDLAK, LARSON, 1997; BOEHJE et al. 1999, 2002; SONKA, 1999; DOBSON, 1999; GRIEVINK, 2003) as well as the results of our research into the conditions of transitive economic systems such as the Czech Republic (BEČVÁŘOVÁ, 2004; 2006) show that in current conditions, there are at least two crucial changes affecting the business environment of agricultural enterprises caused by this development. The shift in focus on pre-production stages and finalizing processing and trade segments in commodity foodstuff chains face a more complex reality in practice. They change prerequisites and create new conditions for the success of the participation of other segments of commodity chains and the overall func-tioning of the chain itself. We perceive especially the growing influence of the

Overall transition development
87
market structure of agribusiness on the shaping of agrarian markets and the expansion of control systems by finalizing segments and the enforcement of various forms of out-of-market coordination of activities within commodity foodstuff chains. Concentration and coordination in join links of agribusiness create incentives to exercise the resulting market power. In surveying our analyses (BEČVÁŘOVÁ, 2002; 2006; BEČVÁŘOVÁ, VINOHRADSKÝ, 2004), four domains of problems are necessary for study as the follows:
• influence on market prices to ensure lower costs to the buyer on the contractual side of the market;
• direct depression of producer prices increasing spread between the farm gate price and the wholesale or retail price of the product;
• discriminatory contracting practices that avoid the open market;
• imposing inequitable burdens on the producers. An interface in the framework of the whole agribusiness sector move production agricultural firms from one of perfect competition to one of imperfect competition to participate in some of advantage earning extra profit, for example:
• by adopting technology mediated the better competitive position among a large number of producers or groups of them,
• by contractual arrangements available to only a limited number of producers eliminates equal access to information and offers an advantage to those who possess and control it, as well as unequal access to market infor-mation and market opportunities information,
• by interface with value added processing firms that eliminates the characteristic of homogenous products; farmers involved in processing their commodities are no longer limited to selling that in a open market filled with ready substitutes.
The traditional market structure of agriculture as the relatively independent sector which is often used in economic literature as an example of perfect competition is repaced by a new structure due to the participation of other segments of agribusiness in the system. Market structure with signs of imperfect competition is typical of current agribusiness. The signs are present not only in sectors preceding or following primary agricultural production, but they also influence the business environment and the markets on which primary agricultural producers operate. Research results in this context show that the influence of monopsony of the processing industry indirectly influenced by the relationship between

Agricultural economics and transition
88
the foodstuff industry and the trade industry usually exists in relation to primary agricultural production companies, i.e. on markets of agricultural products. A limited monopoly or bilateral oligopoly is typical of the relation-ship between foodstuff companies and the trade industry, i.e. the foodstuff market. Imperfect competition is also typical of markets with inputs where the influence and market power of the monopoly/oligopoly of supplier sectors can be identified. From the perspective of end customers, even the existing market structure of final segments of agribusiness shows as a positive element in the short-term period. Besides the influence of savings from large-scale production discussed below, Schumpeter’s hypothesis on the positive contribution of monopoly and oligopoly on the development of innovations and technological progress is confirmed on the markets of transitive economic systems such as the Czech Republic. Contrary to the criticism of imperfect competition that is usually based on arguments about the inefficient allocation of resources and that is supported with analysis of the surplus of producers and consumers in the conditions of perfect competition and monopoly, the positives of such market structure are stated as well. Approach as above does not consider savings from large-scale production that enables the efficient use of technological innovations and better allocation of resources, a sign typical of concentrated production. The approach assumes that identical cost curves exist in both instances. However, in sectors participating in agribusiness, similarly as in other sectors of the economic system, implemented savings from large-scale production are based on mass, serial production and new technologies and cannot be fully implemented in the conditions of perfect competition. Another positive feature is the higher productivity of work based on the modernization of production facilities and faster application of the results of research and development in big enterprises with strong capital that rationalize the produc-tion process and other operational activities. Under these conditions, the surplus of consumers and producers in perfect competition is lower than in the case of monopoly. The result is that in an imperfectly competitive environment, theoretically speaking, consumers could achieve higher gains from consumption than on a perfectly competitive market. Interpretation is a much more complex problem, though from the perspective of agricultural producers as suppliers of raw products, the influence of market structure on the market of agricultural products in the environment of a limited monopoly or a bilateral monopoly/oligopoly is crucial. In this case, the market power of big food companies manifests itself through deformed conditions of demand for agricultural products, including negative influences on the formation of prices paid to farmers. To increase the competitiveness of agricultural products within the given market structure of agribusiness, one of the crucial options is the optimisation

Overall transition development
89
of production areas and numbers of livestock, including (technologically well-handled and economically justified) concentration6, which enables advantages to be utilized from large-scale production, innovations and state-of-the-art technologies as prerequisites for fulfilling qualitative, quantitative and price parameters of the demand for agricultural products on both short-term and long-term horizons. A current alternative perceived as a suitable solution (in a clear and economically elaborated concept) is the association of farmers into various forms of sales cooperatives that strengthen their bargaining position with processing companies and companies in the food and trade industries on commodity markets. The market structure of companies engaged in agribusiness enables market power to be used in various forms in demand-supply relationships during price formation in related markets; it also influences the imperfect transfer of price changes/shocks in a sequence of connected markets of commodity verticals. The market power in sequence within agribusiness enables the increase (to accelerate the decrease) in the market price of agricultural products to be limited and thereby achieve a certain share of agricultural enterprises in the final price of products, despite rather strong regulations and the application of systems and tools of direct support to prices of agricultural products in agrarian policies of crucial world competitors. As demand becomes the crucial relationship influencing conditions in a range of connected agrarian markets, the influence of the market structure of agribusiness rises. During permanently excessive supply, which is typical of the majority of agricultural products in Europe, the market structure increases the risk and enables the market power of customers to be misused. At the same time, however, it often decelerates the coordination processes of activities related to the reduction of transaction costs in the commodity chain and becomes another factor in the imperfect transfer of demand in the sequence of agrarian markets from consumers to agricultural producers. Under current conditions, the required strengthening of position and competitiveness on the world agrarian and foodstuff market concerns entire foodstuff production chains (all segments of the appropriate commodity vertical). The requirement arises from the need for quick response and adaptation to changing external and internal conditions, including rising demands for the coordination of activities within them. If the competitiveness of a certain economic system is generally understood as its ability to achieve results corresponding to the aims of the system and dynamics thereof in a competitive environment, then under current conditions
6 Common agricultural and structural policy of the EU follows this aim, among other
things, especially with respect to the member countries with a low share of production-oriented and market-oriented agricultural enterprises.
Agricultural economics and transition
90
the crucial criterion for production farms is competitiveness from the perspective of the acceptability of an offered product by the market, i.e., in the broader context of agribusiness. The examination of the economic efficiency of foodstuff economy within agribusiness as a whole will be ever more significantly based on the dynamic concept of competitive advantages in the entire complex. The advantages are conditioned and should be measured not only by the result of a relatively independent entity on a market that corresponds to the particular stage of the increase in value of the original raw product within commodity foodstuff chains, but especially by the result of entire commodity chains that include not only activities, but also conditions and mutual relationships of entities participating in the development, production, processing and distribution of foodstuffs within the entire process of production, processing and sales of final products. A similar approach should be exerted to the identification and assessment of manifestations of market power within the entire vertical.
4 CONCLUSION It is obvious that despite regulatory interventions and different levels of legislative environment, in general, the development in agribusiness will further increase the dependency of agricultural enterprises on related segments of foodstuff chains, including the transfer of risks and the enforcement of market power in a broad range of mutually connected markets. We can also expect the expansion of relevant markets accompanied by the overcoming of regional limits in interactions between primary production, purchase and first-level processing of agricultural products. Although this development in Europe is mostly said to be the result of the concentration of trade companies, consolidation processes are currently in progress, especially in various fields of the foodstuff industry. In order to strengthen their influence and preserve their competitive advantages on markets of food products, promising companies in this segment of the vertical seek and prefer suppliers of agricultural products that offer permanent supplies of relatively big batches of agricultural products with even quality and at reasonable prices. To respond to these changes in agriculture means to adapt to the new environment, seek connections with these segments of commodity/foodstuff verticals and nets and coordinate production specialization especially with respect to permanent sales of most commodities, which often exceed the existing boundaries of the particular region. The key to how to withstand the competition and the excess of supply on the European market of agricultural products during the continuing liberalization of the market is especially the decrease in unit costs of production, i.e. concentrated production enabling a

Overall transition development
91
positive response to price conditions and a guarantee of a decrease in transaction costs through participation in commodity chains. The problem faced by the whole Europe and thus also by the Czech Republic, i.e. how to compete successfully on an increasingly globalised food market, can be resolved essentially in two ways. It is either possible (1) to preserve the historic production structure based above all on different qualities of natural conditions, especially agricultural land, using this fact to justify the uneven outcome of agricultural production in various regions and also the entitlement of various regions to additional financial means in the form of subsidies, thus enabling traditional agricultural production to continue for as long as possible and "protecting" traditional European producers against increasing competition of cheaper products and food from other parts of the world, or (2) to look for a positive solution, often requiring significant structural changes in production orientation and other economic activities of individual companies in accordance with the principles of a knowledge-based economy capable not only of showing the deeper connections and behavioural principles of the current food markets, but also motivating individual subjects to adopt the necessary restructuring measures reacting actively to the development and conditions of demand on the relevant markets. Although at the current stage of development, agricultural enterprises are significantly limited by regulatory mechanisms of the common agricultural policy of the EU, which is undergoing gradual reformation, they should not be merely passive recipients of incoming changes. In relation to a certain level of decentralization in the selection and allocation of economic tools within the concept of direct payments and individual axes of the Structural Development Fund, producers (and processing companies) should be supported by such tools that enable them to utilize unique knowledge and available opportunities for the creation of long-term competitive advantages anticipating changes in the business environment.
REFERENCES BEČVÁŘOVÁ, V. (2002): The changes of the agribusiness impact on the competitive environment of agricultural enterprises. Agricultural Economics 48(10), pp. 449-455.
BEČVÁŘOVÁ, V. (2004): Integration in Agribusiness and Policy Implications. European Integration: Local and Global Consequences. MUAF Brno, Conference Proceedings, Ondisc database.
BEČVÁŘOVÁ, V., VINOHRADSKÝ, K. (2004): Příčinné souvislosti diferenciace ekonomického vývoje zemědělských podniků v regionu NUTS 2 Jihovýchod. Universitas Bohemiae Meridionalis Budovicensis, 28.

Agricultural economics and transition
92
BEČVÁŘOVÁ, V. (2006): Agribusiness has changed the criteria for success of agricultural enterprises. Annals of the Polish Association of Agricultural and Agribusiness Economists. 8(6), pp. 11-15.
BOEHLJE, M. D., HOFING, S. L., SCHROEDER, CH. (1999): Farming in the 21st Century. Staff Paper DAE, Purdue University, 39 pp.
BOEHLJE, M. D., AKRIDGE, J. T., KALAITZANDONAKES, N. G (2002). Preparing for Success in the Agribusiness Marketplace. Journal of Agribusiness, 20(1).
CRAMER G. L., JENSEN C. W. (1994): Agricultural Economics and Agribusiness, 6th ed. JW & Sons, USA, 534 pp.
DOBSON, C. (1999): Buyer Power and its Impact on Competition in the Food Retail Distribution Sector of the European Union. Nottingham, Conference Paper, 15 pp.
GRIEWINK, J. W. (2003): The Changing Face of the Global Food Industry. In: Changing Dimensions of the Food Economy. The Hague, Conference Paper, 15 pp.
MUNDLAK, Y., LARSON, D. (1999): The Determinants of Agricultural Production: a Cross-Country Analysis. Working Paper No 1827, World Bank, Washington D.C.
SAXOVSKY, D. M., DUNCAN, M. R (1998): Understanding Agriculture’s Transition to the 21st Century. Agricultural Economic Report, No. 181. North Dakota State University.

TRANSITION AND FOREIGN TRADE: THE CASE OF THE UKRAINIAN AGRI-FOOD SECTOR
INNA LEVKOVYCHA, HEINRICH HOCKMANNB a Dr. Cand., Leibniz Institute of Agricultural Development in Central and Eastern
Europe (IAMO), Theodor-Lieser-Straße 2, 06120 Halle (Saale), Germany. E-mail: [email protected]
b Professor, Leibniz Institute of Agricultural Development in Central and Eastern Europe (IAMO), Theodor-Lieser-Straße 2, 06120 Halle (Saale), Germany.
E-mail: [email protected]
1 INTRODUCTION Since the beginning of the 1990s, Central and Eastern European countries (CEECs) have been in a process of transformation characterised by reforms in the administrative, political and economic spheres. An integral part of the transformation process is trade liberalisation. On the one hand trade liberalisation, particularly foreign trade, assists and guides the economic reforms of a country. On the other hand it reflects the deficiencies of the reforms. The new conditions created an environment for competition on the factor and product markets. To be successful in a challenging environment, enterprises and their branches need to define their competencies and need to develop strategies to reach to sustainability. This includes a certain degree of specialisation in spheres where comparative advantages exist. Thus, it can be concluded that the transformation process might be thought of as a success-ful one, if enterprises (branches) can integrate themselves into national and international inputs markets, as well as in product markets, can keep and even to enhance positions in the international market under these new circumstances. In this paper we focus on the Ukrainian agri-food sector. The progress of the transformation process as revealed by trade data is assessed and necessary policy measures for further economic integration into world markets are discussed. The development of Ukraine’s foreign trade serves as an indicator of success of economic reforms. The alterations in the trade structure of the Ukrainian agricultural and food sector, during the transfor-mation period 1996-2005, as well as different trade indicators are examined.

Agricultural economics and transition
94
Statements of traditional and new trade theories are verified through empirical analysis. In the discussion of the results, the trade-political regulations, as well as the opportunities for further international integration are addressed.
2 THEORETICAL AND METHODOLOGICAL FRAMEWORK Development of the international trade in the past 30 years show that the great part of the world trade took place between countries with similar factors endowment and with "similar" goods. This type of trade flows is defined as the intra-industry trade (IIT) or two-way trade. IIT is simul-taneously exports and imports of goods that belong to the same industry. From this reason in this paper we examine both traditional (inter-industrial) and intra-industrial trade flows. According to the Heckscher-Ohlin theorem the inter-industrial trade is result of comparative cost advantages, which are governed by the differences in the factors endowment. Heckscher-Ohlin theorem states that a capital-abundant country exports the capital-intensive good while the labour-abundant country exports the labour-intensive good. The intra-industrial trade can be explained by the new trade theory. There are different models of new trade theory with different assumption, concerning market form, product differentiation and consume preferences, and results (look for example EATON, KIERZKOWSKI, 1984; SHAKED, SUTTON, 1984). However, a common feature of those studies is that they considered scale and market power effects and drop the assumption of product homogeneity. Based on theoretical approaches several indicators for measuring of inter- and the intra-industry trade relations have been developed. In this paper we calculate relative trade advantage index (RTA), the Grubel Lloyd Index, and the Brülhart A-Index. These indicators are complementary to each other insofar as they measure different aspects of trade relations. Inter-industry trade. VOLLRATH (1991) build on the work of BALASSA (1963) and developed an indicator of inter-industry trade, the relative trade advantage (RTA). This index considers exports as well as imports, and thus shows the net trade advantages. The RTA is defined as the difference between Relative Export Advantage (RXA) and the Relative Import Penetration Index (RMP): ijijij RMPRXARTA −= , where (1)
⎥⎥⎦
⎤
⎢⎢⎣
⎡
⎥⎥⎦
⎤
⎢⎢⎣
⎡
=
∑ ∑ ∑
∑
≠ ≠ ≠
≠
ikk ilkk jlklkj
jllijij
ij
xx
xx
RXA
, ,
,
/
/
and ⎥⎦
⎤⎢⎣
⎡
⎥⎦
⎤⎢⎣
⎡
=
∑ ∑ ∑
∑
≠ ≠ ≠
≠
ikk ilkk jlklkj
jllijij
ij
mm
mmRMP
, ,
,
/
/ (2)

Overall transition development
95
An RTA larger than 0 denotes competitive advantages, while values less than 0 indicate disadvantages. The RTA is mainly suitable for comparing competitiveness among sectors in one country and can be regarded as an indicator of international competitiveness in the interpretation of VANEK (1968) and LEAMER (1980). A further problem results from the fact that the Balassa Index is affected by trade and other policy measures and thus provides a biased view of international competitiveness. The RTA is not only more comprehensive than the original Balassa Index, it also has higher consistency with trade theories (FROHBERG, HARTMANN, 1997). In addition, the adjustments made in the summation account for the scale effect, thus reducing bias induced by country size. Intra-industry trade. The most popular indicator of intra-industry trade is the Grubel-Lloyd Index (GL) (GRUBEL, LLOYD, 1975) defined as:
( )( )imix
imiximixniGL
+
−−+=)( or ( )imix
imixniGL
+
−−= 1)( . (3)
The GL relates the difference between total trade (x and m) and net trade to total trade for sectors differentiated at the n digit level. Thus, the GL measures the overall importance of intra-industry trade in total trade. The values of the GL are between zero and one, where GL = 0 indicates that there is no intra-industry trade. The GL index is static in the sense that only one year is considered in its construction. It is generally argued that industries with high level of IIT undergo less structural change- less adjustment costs – in response to trade liberalisation than industries with low levels of IIT (KANDOGAN, 2003). The adjustment process should be analysed using indicators based on marginal trade flows, because adjustment is a strictly dynamic process. Some simple and now widely-used measures of MIIT were developed by BRÜLHART (1994). The Brülhart A index is a transposition of the GL index to trade changes:
( ) ( ),1
nttntt
nttntt
MMXXMMXX
AMIIT−−
−−
−+−−−−
−== (4)
where n stands for the number of years constituting the relevant adjustment period. The A index, like the GL index, varies between 0 and 1, where 0 indicates marginal trade in the given industry to be completely of the inter-industry type, and 1 represents marginal trade to be entirely of the intra-industry type. The A index shares most of the statistical properties of the GL index, a comprehensive description of which is provided in GREENAWAY and MILNER (1983).
Agricultural economics and transition
96
3 ROLE OF AGRICULTURE IN THE NATIONAL ECONOMY AND AGRI-FOOD TRADE
Importance of agriculture for Ukrainian economy. Agricultural is an important sector of the Ukrainian economy. This sector makes up a significant proportion of the GDP (in 2005 was 11 % of the GDP) and is a major employer. According to official statistics, almost 20 % of the economically active population is employed in agriculture (SSCU, 2005). During transition, it also served an important social role by absorbing surplus labour in subsistence farming. The agri-food sector plays an important role in determi-ning the trade balance and the current account. From 1994-2005, the share of agri-food in total merchandise exports was 13.6 %, behind only metal, chemical and machinery exports. The share of agri-food imports equalled 7 % for this period. The economic transition process has been difficult for the agricultural sector; between 1990 and 1999, output declined by 51 %. The share of the GDP produced in agriculture also decreased from 18.6 % at the beginning of transformation to 13.6 % in 1999; indeed, it declined faster than the overall economy. The years 2000-2002 saw the output slightly recover. The Ukrainian agricultural sector output grew by 10 % per year for two years in row. With the agricultural output recovering, its share of GDP increased to 15.3 % in 2002. Before discussion of Ukrainian foreign trade with agri-food products point out, that agriculture occupies 69 % (41.9 mln. ha) of country’s land resources. 55 % of Ukraine’s agricultural land is arable, 1/3 of which is black chernozem soils. The land endowment accounts for 0.66 ha arable land per person. Among the most important agricultural exporters of the world, Ukraine has one of the highest amount of land resources. From this follows that Ukraine should export agricultural goods which utilise much agricultural land. This concerns crops in plant production and milk in livestock production. Trade structure. Ukraine is a consistent net exporter of agricultural and food products. Ukrainian agri-food exports are characterised by the high degree of concentration on three major commodity groups accounting for almost 60 % of the total agri-food exports in 2005 (Figure 2.9). Cereals occupy the leading position, accounting for 31 %, followed by fats, animal and vegetable oils at 13 %, and dairy products at 12 % of the total export of agricultural and food products. Because crop production is strongly dependent on climatic conditions, considerable yield fluctuations are observed. These variations are, accordingly, reflected in exports. Overall, 70 % of the exported goods are primary or agricultural goods and 30 % are foodstuffs. In this context, one of the challenges for improving the Ukrainian food industry’s international competitive position can be found.

Overall transition development
97
The largest export markets for Ukrainian agro-food products are countries that belong to the Commonwealth of Independent States (CIS); they accounted for 44 % of total exports in 2005. Russia is a main trade partner, possessing an export share of 32 % and an import share of 16.5 % (2005). Before the January 2006 import ban, Russia was a key market for milk and meat products. Such regional concentration makes exporters extremely dependent on changes in the economic and political conditions in the particular country (such as Russian trade policy on the sugar market). The financial crisis in Russia (1998-1999) has had a considerable influence on the bilateral trade between the two countries, and on the volume of Ukrainian trade as a whole. Figure 2.9: Export structure of agro-food products
0
1000
2000
3000
4000
5000
1996 2001 2005
Year
Bill
ion
USD
Cereals, oil seeds
Animal or vegetable fats and oilsand their cleavage productsDairy, bird egg, honey, edibleanimal productsCacao and cacao preparations
Beverages, spirits and vinegar
Meat and edible meat offal
Sugars and sugar confectionery
Others
Source: Own calculations based on COMTRADE database.
The second largest market for Ukrainian agro-food exports is the EU-257 (22 %) and the third largest are Asian countries (21 %). Indeed, Asian countries, whose importance has increased in the last five years, absorb half of Ukrainian cereal exports, with Saudi Arabia being a major importer of barley. The EU countries, Spain in particular, represent an important wheat market. Other products exported to the EU include vegetable oil and sunflower seeds. Export of livestock products to the EU is negligible, as only a few food processors comply with the EU food safety and packaging standards (OECD, 2007). An important feature of this trade is that 90 % of the exports in the EU-countries are agricultural goods, while processed goods make up the remaining 10 %. Scrutinising this ratio, it can be stated that goods from the Ukrainian processing industry are not competitive on the European market. In addition to high taxes, strict non-tariff regulations hinder Ukrainian export. It is for this reason that Ukrainian standards and
7 In further analyse we separate EU-25 into three groups: EU-15, CEE countries and
Baltic countries.

Agricultural economics and transition
98
norms have to be adapted to EU standards, and product quality has to be increased. During the 1990s on average import of agri-food commodities decreased at lower rates than export. The devaluation of Ukrainian currency, together with several restrictions on the purchase of foreign currency (which, for instance, made the prepayment of imports almost impossible) were the causes of reduced imports. There are two main features of Ukrainian agri-food import. First, foodstuffs account for 46 % of total agri-food imports. Second, compared to exports, import of agricultural and food commodities are more diversified. In 2005, tobacco accounted for 13 % of the total agri-food imports, miscellaneous edible preparations (including coffee extracts, essences, concentrates and preparations) made up 11 %, and cacao and cacao preparations accounted for 8 % (Figure 2.10). The EU-25 is the main supplier of agri-food products to the Ukrainian market, accounting for 36 % of the total in 2005, followed by the CIS countries at 24 %. Though EU countries imported Ukrainian agri-food commodities at a relatively stable rate, the share in CIS countries in recent years rose from 9.9 % in 1999 to miscellaneous edible preparations, tobacco, meat and meat by-products. From CIS countries, Ukraine imports meat, fish, dairy products, alcohol and non-alcohol drinks, and confectionery. Further, OECD countries have lost their positions on the Ukrainian market; their share has almost halved from 1996-2005. Figure 2.10: Import structure of agro-food products
0
500
1000
1500
2000
2500
3000
1996 2001 2005
Year
Bill
ion
USD
Tobacco
Miscellaneous edible preparations
Fish, crustacean, mollusk,invertebrat
Cacao and cacao preparations
Sugars and sugar confectionery
Meat and edible meat offal
Others
Source: Own calculations based on COMTRADE database.
4 ANALYSIS OF TRADE INDICATORS Export and import statistics from the COMTRADE databank were used for analysing Ukrainian trade with agricultural commodities and foodstuffs. In
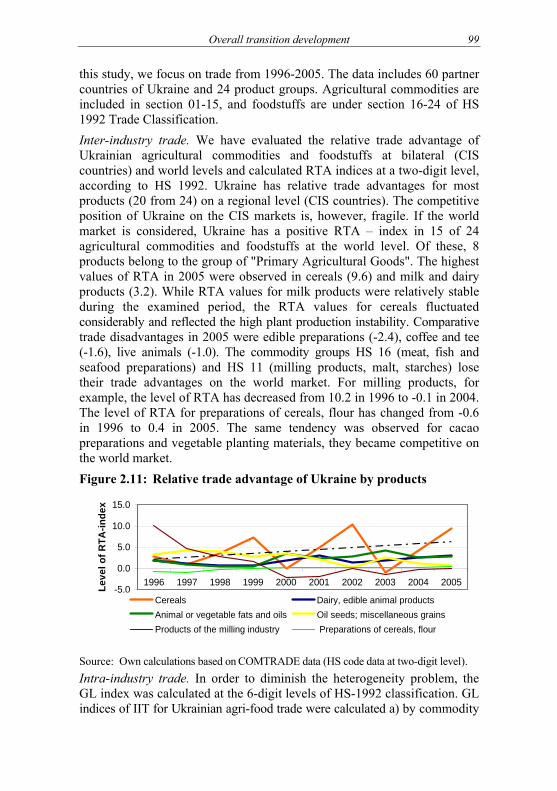
Overall transition development
99
this study, we focus on trade from 1996-2005. The data includes 60 partner countries of Ukraine and 24 product groups. Agricultural commodities are included in section 01-15, and foodstuffs are under section 16-24 of HS 1992 Trade Classification. Inter-industry trade. We have evaluated the relative trade advantage of Ukrainian agricultural commodities and foodstuffs at bilateral (CIS countries) and world levels and calculated RTA indices at a two-digit level, according to HS 1992. Ukraine has relative trade advantages for most products (20 from 24) on a regional level (CIS countries). The competitive position of Ukraine on the CIS markets is, however, fragile. If the world market is considered, Ukraine has a positive RTA – index in 15 of 24 agricultural commodities and foodstuffs at the world level. Of these, 8 products belong to the group of "Primary Agricultural Goods". The highest values of RTA in 2005 were observed in cereals (9.6) and milk and dairy products (3.2). While RTA values for milk products were relatively stable during the examined period, the RTA values for cereals fluctuated considerably and reflected the high plant production instability. Comparative trade disadvantages in 2005 were edible preparations (-2.4), coffee and tee (-1.6), live animals (-1.0). The commodity groups HS 16 (meat, fish and seafood preparations) and HS 11 (milling products, malt, starches) lose their trade advantages on the world market. For milling products, for example, the level of RTA has decreased from 10.2 in 1996 to -0.1 in 2004. The level of RTA for preparations of cereals, flour has changed from -0.6 in 1996 to 0.4 in 2005. The same tendency was observed for cacao preparations and vegetable planting materials, they became competitive on the world market. Figure 2.11: Relative trade advantage of Ukraine by products
-5.0
0.0
5.0
10.0
15.0
1996 1997 1998 1999 2000 2001 2002 2003 2004 2005Leve
l of R
TA-in
dex
Cereals Dairy, edible animal productsAnimal or vegetable fats and oils Oil seeds; miscellaneous grainsProducts of the milling industry Preparations of cereals, flour
Source: Own calculations based on COMTRADE data (HS code data at two-digit level). Intra-industry trade. In order to diminish the heterogeneity problem, the GL index was calculated at the 6-digit levels of HS-1992 classification. GL indices of IIT for Ukrainian agri-food trade were calculated a) by commodity

Agricultural economics and transition
100
groups, b) by all trading partners (the world). The level of intra-industry trade varies considerably between product groups and countries, and exhibits great temporal fluctuations. From 1996-2005, the level of IIT, on average, amounted to only 13.7 % of total agri-food trade. These results show that inter-industry trade, induced by comparative advantages, prevails. An increase in intensity is observed in the case of processing goods (foodstuffs). On average, foodstuff trade had a higher intensity of IIT, for period 2000-2005 – 24.2 %, in comparison to the agricultural goods trade – 7.6 % (Table 2.12). This corresponds to the developments in world agricultural trade and supports the theoretical statement that IIT is more representative of the sectors with higher product differentiation. Table 2.12: Level of IIT by commodity group, Ukraine-World, %
Commodity groups ∅ 1996-99 ∅ 2000-05 Total agricultural products 01-15 9.3 7.6 Total food products 16-24 22.3 24.2 Total agro-food products 01-24 14.4 13.9
Source: Own calculations based on COMTRADE Data (HS code data at six-digit level). Looking at the agri-food trade from 1996 to 2005 by trading partners, the highest level of IIT is observed for CIS and CEE countries. On average, intensity of IIT for these countries amounts for 8.6 and 12.4 % respectively, though it shows various trends: While the IIT index with CIS countries goes up during the analysed period, the index goes down for CEE countries (Hungary, Bulgaria). Considering the CIS countries, a high level of IIT for Moldova and Russia is observed. The cause of the increase of IIT between the CIS countries is their concomitant free trade zone; while communication problems and orientation of CEE countries on European markets provides another explanation for the deterioration of this trade ("one-sided trade"). Moreover, in accordance with the theory, a high IIT level is rooted in factors specific to individual countries, such as: Geographical closeness, shared border, same level of development, similar preferences, language, culture, institutional conditions and construction of transportation routes. This is particularly applicable in the case of trade with Russia and Moldova, where the level of IIT in 1996-2005 was 8.9 % and 11.6 %, respectively. Trade with OECD and EU countries takes inter-industry specialisation as a basis and reflects considerable differences in the economic structure between Ukraine and these countries. Furthermore, we can assume that the IIT between Ukraine and the EU is vertical, with Ukraine delivering goods of lower quality in exchange for similar goods of higher quality. Furthermore, the liberalisation process in agri-food has not been as strong as in other sectors (high import duties, as well as non-tariff obstructions).

Overall transition development
101
Table 2.13: Grubel-Lloyd indices of Ukrainian agri-food trade by trade partners
Year Country groups
1996 1998 1999 2000 2002 2005 CIS countries 0.240 0.070 0.057 0.118 0.148 0.112 Baltic countries 0.262 0.298 0.036 0.032 0.036 0.015 CEEC 0.112 0.090 0.129 0.084 0.051 0.053 EU-15 0.055 0.047 0.051 0.072 0.033 0.012 OECD countries 0.022 0.016 0.013 0.024 0.023 0.023 World total 0.153 0.148 0.122 0.149 0.101 0.149
Source: Own calculations based on COMTRADE Data (HS code data at six-digit level). Marginal intra-industry trade. The analysis has so far been based on indices which measure the extent of IIT as a proportion of total trade at a given point in time. But changes in the GL index may not capture potential adjustment costs, and measures of marginal intra-industry trade (MIIT) can, therefore, be used to complement traditional IIT analysis. Table 2.14: Marginal intra-industry trade of Ukrainian agri-food trade
by trade partners, (A indices) Countries’ group 1996-2000 2000-2005 CIS countries 0,019 0,186 Baltic countries 0.138 0,013 CEEC 0,069 0,024 EU-15 0,036 0,013 OECD countries 0,015 0,008 ROW 0,000 0,000 World total 0,066 0,105
Source: Own calculations based on COMTRADE Data (HS code data at six-digit level). We have calculated BRÜLHART’s (1994) A indices for agro-food products from HS 6-digit trade figures from 1996-2000 and 2000-2005 based on multilateral trade flows at the specified groups’ level (Table 2.14). The highest share of marginal IIT for CIS countries occurred from 2000-2005. For other trade partners the level of marginal IIT was less relevant over both periods (except CEE countries from 1996-2000). The generally low level of A indices (close to zero) indicates that most of the changes, which occurred in trade flows, have been inter-industry by nature and, therefore, have very likely induced high adjustment costs.

Agricultural economics and transition
102
5 CONCLUSIONS In this paper we have analysed the international trade of agricultural products and food stuffs of Ukraine to assess the transformation process in the agri-food sector. We discussed the changes in export and import structure of agro-food products and calculated indicators of inter- and intra-industrial trade (RTA, Grubel-Lloyd Index and Brülhart A Index). The results show, that factor endowment (arable land) appoints the Ukrainian agri-food trade. Ukraine strongly specializes in cereals, oilseeds and milk products and strengths its comparative advantage. In some sub-sectors, however, Ukraine use its comparative advantage not complete (milling products, meet sector). The positive tendency shows increasing intra-industry trade by foodstuff products from 1996-2005. The low level of Brülhart A Index indicates that most of the changes occurring in the trade flows in 1996-2005 have an inter-industrial character. The transition process of the Ukrainian agri-food sector is slow and cumbersome. It is first of all caused by improper and consistent agricultural and trade policy. Some positive tendencies were asserted only in the second period of transition from 2000-2005. Further trade liberalisation associated with Ukrainian WTO access introduces enhanced competition and in this context demands more transparent, precise and consistence sectoral as well as macroeconomic regulations from governance. In order to increase the competitiveness of the Ukrainian agri-food sector and integration into the world economy it is important to increase quality, stability and efficiency of agricultural production. Modernisation of the processing industry, improvement of the investment climate, governmental programs to support innovative projects, development of an information network and access to market information and political stability are further factors for successful integration into the world economy.
REFERENCES BALASSA, B. (1963): An Empirical Demonstration of Classical Comparative Cost Theory. Review of Economics and statistics, 4(August), pp. 231-238.
BRÜLHART, M. (1994): Marginal Intra-Industry trade: Measurement and the relevance for the pattern of industrial adjustment. Weltwirtschaftliches Archiv, 130(3), pp. 600-613.
COMTRADE: United Nations Commodity Trade Statistics Database.
FALVEY, R., KIERZKOWSKI, H. (1984): Product quality, Intra-Industry Trade and (Im)perfect Competition. Discussion Paper, Graduate Institute of International Trade, Geneva.
FROHBERG, K., HARTMANN, M. (1997): Comparing Measures of competitiveness. Discussion Paper Nr. 2, Institute of Agricultural Development in Central und Eastern Europe (IAMO), Halle/Saale.

Overall transition development
103
GRUBEL, H. G., LLOYD, P. J. (1975): Intra-Industry Trade: The Theory and Measurement of International Trade in Differentiated Products. Wiley, London and New York.
KANDOGAN, Y. (2003): Reconsidering the adjustment Costs of the Europe Agreements. Applied Economics Letters, 10(2), pp. 63-68.
LEAMER, E. E., BOWEN, H. P. (1981): Cross-section tests of the Heckscher-Ohlin Theorem: Comment. American Economic Review, 71, pp. 1040-1043.
OECD REPORT (2007): Agricultural Policies in Non-OECD Countries. Monitoring and Evaluation.
SHAKED, A., SUTTON J. (1984): Natural Oligopolistic and International Trade. In: KIERZKOWSKI, H. (Hrsg): Monopolistic Competition and International trade. Clarendon Press, Oxford, pp. 34-50.
SSCU (2005): Statistical Yearbook of Ukraine. State Statistics Committee of Ukraine, Kyiv.
VANEK, J. (1968): The factor proportions theory: The N-factor case. Kyklos, 21, pp. 749-759.
VOLLRATH, T. L. (1991): A theoretical evaluation of alternative Trade Intensity Measures of revealed Comparative Advantage. Weltwirtschaftliches Archiv, 127, pp. 265-280.

THE DEVELOPMENT OF THE HUNGARIAN AGRICULTURAL TRADE AFTER THE EU ACCESSION
GÁBOR KŐNIG
Research Institute for Agricultural Economics (AKI), Directorate of Agricultural Policy, Department of Marketing Studies. 1093, Zsil utca 3-5. Budapest, Hungary.
E-mail: [email protected]
The analysis of Hungary’s agricultural trade with the EU and its export opportunities are especially timely since the accession of Hungary to the EU in 2004 revealed basic differences in competitiveness between Hungarian agricultural products and importers’ products. The main basis of the analysis was the databases of the AKI, and the CESTAT. After 2004 the long term examination of the trade became more difficult since the need of the complicated harmonisation of the trade data to the period before the accession, in consequence of the introduction of the INTRASTAT (because of the intra-trade) and the coming of the euro to the front after 2004.
1 CHANGING ROLE OF THE EU IN THE AGRI-TRADE The share of Hungarian agriculture in the national economy decreased significantly from the transition in 1989 till the accession to the EU in 2004. The share of agriculture decreased in the GDP from 13 to 4 %, in the labour from 17 to 6 % and in the total export from 26 to 7 %. Although the share of the Hungarian agriculture in the total trade and in the trade with the EU decreased significantly (the share of the EU in the total agricultural trade was 23 % in 1991, it has slumped to 5 %), the agricultural trade balance remained positive (more in KARTALI, 1998). Thus, it contributed decreasingly but steadily to the national trade balance and the trade balance with the EU. About 90 % of the Hungarian agricultural export goes to European markets (Table 2.15). The EU accession caused the pseudo-reorientation of the export: The share of 50 % of the EU in increased to 60 % by the entering of the new countries in 2004, and to 70 % after the next enlargement in 2007.

Overall transition development
105
Table 2.15: Distribution of the Hungarian agricultural export by main markets between 1991 and 2003, %
Year* EU -12/-15/-24
EFTA 7/4
Eastern Europe
CEFTA, CIS also/
East-Europe without new
members
CEFTA -6/-7/-3 not joined/
4 joined CIS
others
1991 44.4/52.9/62.2 11.5/2.8 33.0/23.0 10.7/12.9/4.2/8.8 16.5 11.3
1992 42.0/50.0/59.0 11.3/3.0 40.3/31.3 12.4/15.3/6.8/8.5 15.1 6.7
1993 44.4/53.5/62.5 12.5/3.4 33.7/34.7 11.5/14.3/5.8/8.5 19.5 8.3
1994 43.4/51.8/62.3 11.3/2.7 37.9/26.4 12.3/15.2/5.7/9.5 22.0 7.6
1995* 43.3/55.3 2.2 41.4/29.4 14.8/18.2/7.5/10.7 25.0 13.1
1996 47.4/62.6 2.0 44.0/28.8 14.6/18.3/5.4/12.9 20.0 6.6
1997 40.6/56.5 2.0 49.1/33.1 17.6/21.5/7.2/14.2 23.1 8.3
1998 43.7/58.2 2.1 44.7/30.2 19.5/22.7/10.0/12.7 16.1 9.5
1999 49.6/66.8 2.0 40.1/22.9 20.5/23.6/8.5/15.1 8.9 8.3
2000 46.5/62.6 2.0 42.5/26.4 21.0/24.1/9.8/14.3 10.4 9.0
2001 48.0/61.6 2.6 40.3/26.7 21.3/23.7/11.7/12.0 8.3 9.1
2002 50.0/63.7 2.6 39.2/25.5 18.0/21.8/9.5/12.3 8.3 8.2
2003 51.0/63.9 2.9 39.3/26.4 19.6/22.9/11.3/11.5 8.6 6.8
Source: Own calculation on the databases of the Central Statistical Office (KSH), AKI 2006. Note: Remark: In 1995 the EU was enlarged by Austria, Finland and Sweden.

Agricultural economics and transition
106
The Hungarian agricultural export is concentrated not only on markets but products as well. The group of live animal, meat and edible meat offal and vegetables and fruit and its preparations gives the some 50 % of the total export and the export to the EU. The cereals are important also in total export as the oil seeds and oleaginous fruits, straw and fodder are in the export to the EU. Cereals, meat and edible meat offal and preparations of vegetables and fruit comprise 40 % of the export to the CEFTA (see more in KISS, 2002). The analyses of the position of Hungary in the trade between the EU and the CEFTA show (in Figure 2.12) the good competitive position of Hungary in the region. After 2004 the relative Hungarian position has worsened. New member states improved their balance better not only with the EU, but with Hungary as well (mainly because of Poland). Figure 2.12: Trade balance of the CEFTA with the EU-15
Source: Own calculation based on the database of CESTAT, 2005. Total import has grown by 76 % from 2003 to 2006. The import of live animals increased by 6.3 times, meat and slaughter products 3.4 times (mainly because of pig meat mainly from Germany), dairy products 2.9 times (mainly because of cheese mainly from Germany, Poland and Slovak), drink and tobacco together 2.6 times. The share of the import of live animals and meat from the total import increased over 10 % in 2006. Main import partner is Germany with 22 % share from the total in 2006; the second is Poland and Netherlands with 13-13 %. The share of Germany and Poland was increased by 7-7 percentage points from 2003 to 2006. The balance turned to negative with Poland, Czech Republic and Slovak (the 2 last turned to 0 and positive in) (more in KARTALI, WAGNER, 2007).
BulgariaPoland
Czech Republic
Hungary
-750
-500
-250
0
250
500
750
1000
19 93 19 94 19 95 19 96 19 97 19 98 19 99 20 00 20 01 20 02 20 03
mill
ion
USD
..
Hungary Czech Republic Poland Croatia
Rom ania Bulgaria Slovakia Slovenia

Overall transition development
107
Figure 2.13: The development of the Hungarian agricultural trade with the EU-15, 2000-2006, EUR 1000
0
400 000
800 000
1 200 000
1 600 000
2 000 000
2000 2001 2002 2003 2004 2005 2006ths € Export Import Balance
Source: Own calculation based on the database of HSCO, 2007.
Figures 2.13 and 2.14 show the changes of Hungarian trade. The export growth is mainly due to cereals, its export increased almost by 2 times to 600 million euro (almost to 20 % from the total) to 2006, animal fodder by 20 %, vegetable and fruit preparations by 14 %, oily seeds by 13 %, dairy products 11 %. The export of the first product is meat and slaughter decreased by 3.5 % to 520 million euro in 2006, thus its share decreased by 35 %. The balance of dairy products turned to negative. Table 2.16 shows that the trade with non-EU markets was the most advantageous for Hungary. Germany gives 15 % of the export, Austria and Italy 9-9 %, Romania, Russia and Netherlands 5-5-5 % (more in KÜRTI et al., 2007). Figure 2.14: The development of the Hungarian agricultural trade with the
EU-9, 2000-2006, EUR 1000
-200 000
0
200 000
400 000
600 000
800 000
2000 2001 2002 2003 2004 2005 2006
ths € Export Import Balance
Source: Own calculation based on the database of HSCO, 2007.

Agricultural economics and transition
108
Table 2.16: Hungarian agricultural trade with main markets, 2003-2006 Change Export, % Import, % Balance, million €
EU-15 +27 +81 -350 EU-9 +67 +179 -193 Other +12 -14 -176
Source: Own calculation based on the database of HSCO, 2007.
2 MAIN FACTORS THAT EFFECTED THE HUNGARIAN AGRICULTURAL TRADE
The export was affected by the decline of the production and of the consumption (that’s degree surpassed the decrease of the production), the deterioration of profitability, of competitiveness the weakening effectiveness, the saturation of the markets, the lack of integration and the disorganised structures of production, processing and trade system. The import was affected by the extinction of the monopoly of specialised foreign trade companies that resulted that the big number of the new organisations erased the well centralised system of information and capital. Moreover the week protection of the inner market, the great import needs of international firms and the price and quality advantage of import results the import increase. Trade agreements with the EU in 1991, in 2000 and in 2002 prepared our agricultural trade to the participation in the free inner market of the EU. The development of our import overcame the growth of our export since import is more flexible, it has a more competitive background and the remained restriction of 15 % disappeared only after the accession. We have to face that the natural power of the markets is pervasive, than the regulations (aimed to have equal conditions for trade partners) of the EU, or the WTO. It is reasonable that the liberalisation issued from the accession will not increase our export possibilities but results increased danger from the side of import (KŐNIG, 2005b). That is backed up by the predicted effects of the change of customs and export subsidies. The change of the system of export subsidies and tariffs after the accession results changes in our import and export. Table 2.17 shows that the abolition of the Hungarian refunds to the EU and to the third countries hinders our export possibilities, for this reason its direct change on the development of our export is negative. The abolishment of the Hungarian tariffs applied to the EU and the accession countries reduces the protection of our import; consequently the effect is negative. The effect of the abolition of the export refunds applied by the EU on our import is positive. The effect of the abolition of the tariffs applied by the EU and

Overall transition development
109
the accession countries on our export is positive. The abolishment of Hungarian export refunds and the introduction of the EU ones after 2004 – as the subsidized products and the structure of refunds differ greatly from that of the Hungarian – influence slightly the development of our export to the third countries. The manoeuvring room of appliance of tools of promotion of export and of support of our competitiveness will be tightening to Hungarian main markets (to the EU). The positive effect of the changing system of refunds on our export to the third countries is diminished by some factors. Table 2.17: The direct effect of the change of the system of export subsidies
and tariffs on the development of the Hungarian agricultural trade
Partner countries Hungarian export Hungarian import EU-15 negative 0 joining countries in 2004 negative 0 -EXPORT
REFUNDS third countries (0) changing (1) 0 EU-15 0 negative joining countries in 2004 0 negative
Hungarian/ including the EU ones from 2004 that also covers Hungary/
-TARIFFS
third countries 0 negative (2) EU-15 0 positive joining countries in 2004 0 positive (?) -EXPORT
REFUNDS third countries 0 (1) positive, 0, ? EU-15 positive 0 joining countries in 2004 positive 0
foreign
-TARIFFS
third countries negative 0 (2) negative: decrease negative: increase Complement: In the export "negative" means
the decrease of the export, "positive" indicates the increase of the export. In the import just the opposite: "negative" means the increase of the import, "positive" the decrease of the import.
positive: increase positive: decrease
Source: KŐNIG (2005a). Note: The method could apply for the examination of several factors, e.g. by interchanging,
substituting refunds and tariffs by factors of the demand and supply. The degree of the subsidies will decrease in consequence of the very determined emergence of the strict policy of retrenchment regarding the budget of the CAP that was also backed up by the WTO-commitment of the EU in 2004 and by the events of the summer of 2005 after the rejection of the EU constitution. On the other hand

Agricultural economics and transition
110
from 2004 there are 25 countries for the subsidies of the EU in comparison with the former period when there was only 15. Several export products and export markets of Hungary, which had been subsidized so far, could not receive subsidies any more from the accession, not even in that case if those touch our export to the third countries. Though the Hungarian nomenclature corresponds to that of the EU, certain products in detailed figures differs from the EU ones. The continual change of group of products of the export refunds of the EU and the perpetual variation of sum of the subsidies result incertitude that worsen the effectiveness of the business planning. Figure 2.15: The development of GDP, income and food consumption, 1991=100
real income.
real GDP
index: 1991=10060
80
100
120
140
160
1991 1992 1993 1994 1995 1996 1997 1998 1999 2000 2001 2002 2003 2004index of real income per capita index of real GDP per capitaindex of consumption of pork /cap index of consumption of poultry /capindex of consumption of dairy products /cap index of consumption of flour /cap
Source: Own calculation based on the database of HSCO, 2006. Studying the domestic market we can state that although the increase of import after the accession endangers the inner market, we can not appreciate it as a disadvantageous phenomenon if it results the improvement of the level, of the structure and of the quality of the domestic consumption, thus the convergence to the level of that of the developed countries. The main problem of producers and processors with import products beyond their very competitive price and quality is that their substituting character diverts from the consumer’s intention in purchasing domestic product. Although we count on increasing real GDP after the accession, its advantageous effect on the improvement of income and thus on the increase of consumption is doubtful for products with price and income elasticity as well, since consumer purchases however cheaper the product (because of higher income, or cheaper price) he or she does not destine the relieved disbursable amount of money to purchase more agricul-tural products (Figure 2.15). It is possible to counter-effect of that by continuous innovation and enlargement of product structure. Continuous innovation in food industry and investment, which enables innovation otherwise, may restrain the restrictive effect of import products, of domestic industrial products and of services on the development of consumption of domestic agricultural products.

Overall transition development
111
3 NEW METHODS IN THE EXA MINATION OF TRADE For further researches of the trade there are two methods that are worth taking into account, that relates much of classical trade indexes as e.g. Balassa (see more in FERTŐ, 2003). The openness of a country is measured by the share of the export or (and) import in the GDP (excluding the foreign trade from the GDP). The openness of agriculture refers to the importance of the agriculture in the economy, and to the degree of its integration into international trade. The openness of Hungarian agriculture (agricultural export + agricultural import/agricultural GDP) legs behind the openness of the whole economy. It was 111 % in 2002 while that of the agriculture was 86 %. According to Kartali (KARTALI et al., 2003), the index of relative importance shows how important is the trade of a country for another country. E.g. while the share of Germany in the Hungarian agricultural export is 17 %, the share of Hungary in the German agricultural import is 1.2 %, so the index is 14. The relation with Slovakia is more advantageous for Hungary as the index shows 0.35. Therefore the index shows also the competitive position. Therefore e.g. the index shows 14 (17/1.2) as for Germany, and 0.35 at Slovakia. If we take the trade’s role in improvement the national balance, than the first case is more advantageous, since Hungary got a better position in a way that is not disadvantageous for the partner country either.
Hungarian export to the partner country/Hungarian total export × 100 Hungarian import to the partner country/Total import of the partner country × 100
By developing the former index I got the index of dependence. It shows the dependency of a country on another one, since it reveals which trading partner depends more on the other, who is in a more defencelessness position: That country is in such a position that gives the bigger part of its total sale to the buyer country. Hungary mostly depends on Germany from this aspect, since while the share of Germany in the Hungarian agricultural export is 17 %, the share of Hungary in the German agricultural export is only 1.1 %. Therefore e.g. the index shows 15.5 (17/1.1) as for Germany. Hungary is more dependent, since Germany buys bigger part of the total sale of Hungary, than Hungary does in the opposite case. This index indicates our follower position as well; therefore it can be useful during the setting up of a strategy, when we map our positions and trade relations. That index gives a clearer view on our position when we identify our main markets: Where the index is bigger than 1, there is certainly an important and perspective partner, where we may dare to be engaged better due to the expectation of bigger gains. It is probable, that a country with a high index is a solvent partner, and it is advisable to decrease the degree of triangular trade.

Agricultural economics and transition
112
Hungarian export to the partner country/Hungarian total export × 100 Export of the partner country to Hungary/Total export of the partner country × 100
4 CONCLUSION Besides our relations with the EU it is important to develop our relations with the Eastern markets as well, since our commercial traditions give a steady background for that. As the relatively small quantity of the Hungarian products cannot affect sensibly the market of the EU, our follower market requires the utilization of special strategy. According to that (in consequence of our saturated markets, of relatively small quantity of products, of deficiency of economic and market competitiveness), we have to differentiate between main markets and main products. To the three ex-CEFTA candidate countries there will be possibilities for improvement of export – mostly to Romania –, and our import will strengthen mostly from the EU-15 – mostly form Germany (that is also backed up by the tendencies). We can state that Hungarian export possibilities, however predominant animal products are, concentrates mostly on plant products – oilseeds and vegetable oil, fruits and vegetables and cereals –, while import expansion concentrates, above all on animal products – pig –.
REFERENCES FERTŐ I. (2003): A komparatív előnyök mérése. Statisztikai Szemle, 81(4), pp. 309-327.
KARTALI, J. (1998): Magyarország és az EU közötti agrár-külkereskedelem a kilencvenes években. Agrárgazdasági Tanulmányok, 19.
KARTALI, J., WAGNER, H. (2007): Az élelmiszergazdasági külkereskedelem hazai és nemzetközi adatforrásainak eltérései és azok okai. Agrárgazdasági Információk, AKII, Budapest.
KARTALI J., JUHÁSZ, A., KŐNIG, G., KÜRTI A., WAGNER, H. (2003): A magyar agrárexport a fő piacok felvevőképességének tükrében. Agrárgazdasági Információk, AKII, Budapest.
KISS, J. (2002): A kelet- és közép-európai országok agrárkereskedelmi kilátásai. Gazdálkodás, 2(4).
KŐNIG, G., KARTALI, J. (2005): Hungarian-Russian agricultural trade and chances of the Hungarian agricultural export. Studies in Agricultural Economics, AKII, Budapest.
KŐNIG, G. (2005a): Opportunities of trade development between Hungary and the European Union (in Hungarian). PhD thesis, University of Kaposvár, Hungary.
KŐNIG, G. (2005b): Les perspectives de l’agriculture hongroise à la lumière de l’adhésion á l’Union Européenne. Kollokvium a Magyar Gazdasági Év keretében, a Nagykövetség-Párizsi Magyar Intézet szervezésében, 2005. június 2. Párizs.

Overall transition development
113
KÜRTI A., STAUDER M., WAGNER, H., KÜRTHY GY. (2007): A magyar élelmiszergazdasági import dinamikus növekedésének okai. Agrárgazdasági Tanulmányok, AKII, Budapest.
ORBÁNNÉ, M. N. (ed.), JUHÁSZ, A., KARTALI, J., KŐNIG, G., STAUDER, M. (2006): Restructural of the food industry (in Hungarian). Studies in Agricultural Economics, AKI, Budapest.


3 COUNTRY TRANSITION EXPERIENCE


AGRICULTURAL TRANSITION AND INTEGRATION TO THE WORLD ECONOMY: NIS CASE
EUGENIA SEROVA
Doctor of Economics, Professor President of the Analytical Centre AFE, Moscow. E-mail: Eugenia. [email protected]
1 Introduction Agri-food trade within the Soviet block of the countries like trade in general between these countries was conducted under the special regulations in the CMEA (Council for Mutual Economic Assistance) with artificial prices that could signify-cantly differ from the world market prices. In a such situation prices were not the right signals for producers; and specialization among economies had to be set by planificator center. It led to extreme concentration of production of certain commo-dities in particular economies or regions and therefore their heavy intra-dependency. This was even more strongly pronounced for the FSU where agri-food sectors of the constituent republics were specialized on certain agricultural products on processing with severe monocrop consequences for some territories. Thus, one of the outstanding examples of the Soviet period was an over intensive irrigated cotton production in the Central Asia that led to the death of Aral Sea. Kazakhstan was huge area for feeding animals while slaughterhouses and processing were located mainly in Russia. Sugar refineries were concentrated in Ukraine that supplied almost all other republics with white sugar. Liberalization of economies in the late 1980s-early 1990s and break-up firstly of CMEA, later of the USSR made former trade links irrational. From one hand libe-ralization had to re-establish trade links with the real comparative advantages of the economies. It was expected that trade with non-traditional partners would increase, while intra-regional trade should be diminished. But on the other hand intra-depen-dence of the new economies, created in the Soviet period, has to have inertia that forces these economies to keep on trading with each other. In this paper we shall try to answer the major question: Which trend dominate in agri-food integration in the transitional economies – centrifugal or centripetal, or in other words what tendency dominates – integration into global trade or intra-regional integration. This issue will be studied at example of the NIS countries, which were presumably more integrated in the Soviet period than total Soviet block of the countries

Agricultural economics and transition 118
After short description of the trade development in the NIS countries we shall measure dependency and openness of agri-food sectors of the NIS countries in the last decade and intra-industry trade (IIT) of these countries. The major tested hypothesis is that global integration for these countries is more important tendency than intra-regional one.
2 Integration in the communist time In overall Soviet agriculture five republics – Russia, Ukraine, Byelorussia, Kazakhstan, and Uzbekistan – provided more than 85 % of gross agricultural output of the country. For some of the republics agriculture was the major sector of economy: in the Central Asian republics it made up to 30 %, for others it was the least important sector: in Russia, Baltics, Ukraine, and Byelorussia it made around 10 %. A share of rural population differed also dramatically across republics: from 27 % in Russia to around 70 % in Turkmenistan. The republics differed by endowment with factors of agricultural production. Agricultural lands in Russia made only 13 % of its total territory while in Kazakhstan it made more than 80 %, in Moldova – 75 %. Kazakhstan and Turkmenistan had the vast agricultural lands with relatively low density of population (between 8 and 12 hectares per capita) while other republics had less then 2 hectares per capita. Agriculture in Central Asia was based on the massive irrigation while in Byelorussia and in many non-black soil areas of Russia farming requested drainage. This diversity of conditions for agriculture determined specialization of the republics. But this natural specialization was also aggravated by planificator policy. Speciali-zation of the republics called forth agri-food exchange between them. And in this respect it was very important that in the framework of the USSR, Russia was the major recipient of agri-food exports from the rest of the republics (Figure 3.1). Furthermore the figure proves that agri-food deliveries from other republics did not cover the needs of Russia, therefore external imports (from outside of the USSR) were mostly directed to Russia. So let us note here that Russia was the major consumer of agri-food production from the rest of the USSR. The collapse of the Soviet Union caused also a break-up of trade relations. However, the first years of post-Soviet era there were several inter-governmental treaties, which maintained deliveries of agri-food products from some NIS to Russia. For example, under such treaties Russia got Uzbekistan’s cotton for rather long period. Also a number of multi-national free trade agreements of different level of integrity and between various combinations of the NIS countries were concluded in the 90s. Trade regimes between the NIS up to now are a subject of special regulation, normally the NIS imports are excluded from import duties and TRQs. Russia and Byelorussia have a Customs union and shipments of goods over Russia-Byelorussian boarder is not registered as import-export. For a while there were strong political intentions to sign a treaty on a common agricultural market

Country transition experience 119
of the NIS, which were not crowned with success. The real outcome of all these efforts will be considered in the next division of this paper.
3 Integration inside the group In the last years Russia has toughen trade regime for agri-food products originated from other NIS. Thus, there were restrictions for livestock products from Ukraine, Moldavian and Georgian wines and Georgian mineral water were prohibited for import to Russia, Byelorussian sugar imports was done a subject of more serious border control and so forth.
3.1 Trade integration: Flows The region as a whole has become fewer dependants on agri-food importation from outside though still remains a notable net importer (Figure 3.1 and Figure 3.2). As a base for comparison we take 1992 because inter-republican trade flows had very poor statistical records in the Soviet period, and 1992 is the first year for more or less reliable information trade between the former Soviet republics. However, this is not a good base for dynamic comparison because it was the first year of collapse of the Soviet Union, and tremendous inflow of humanitarian food aid was directed to all the countries of the region. Therefore trade statistics of this year is not enough representative. Figure 3.1: Agri-food trade in NIS countries, 1992, US$ million1
-15000
-10000
-5000
0
5000
10000
15000
20000
NIS
tota
l
Rus
sia
Bye
loru
ssia
Ukr
aine
Kyr
gyzi
a
Kaz
akhs
tan
Arm
enia
Geo
rgia
Aze
rbaj
an
Tajik
ista
n
Turk
men
ista
n
Mol
davi
a
Uzb
ekis
tan
export
import
balance
Source: ROSSTAT.
1 Whenever it is not indicated differently, agri-food trade is trade with commodities SITC 1-24.

Agricultural economics and transition 120
Figure 3.2: Balance of agri-food trade in NIS countries, US$ million
-12000
-10000
-8000
-6000
-4000
-2000
0
2000
Arm
enia
Azer
baija
n
Belru
s
Geo
rgia
Kaza
khst
an
Kyrg
ysta
n
Mol
dova
Rus
sia
Tajik
ista
n
Turk
men
ista
n
Ukr
aine
Uzb
ekis
tan
NIS
1992
1995
2000
2005
Source: Derived from UNCTAD data and data of the AFE. Nevertheless, the figures depict that 3 countries had steadily positive trade balance and Kazakhstan has volatile positive balance2. Table 3.1: Share of trade with NIS region in total agri-food trade in NIS
countries, %
Source: Derived from "15 Years of the NIS (1991-2005), Statistical Abstract. Moscow, 2006: BORODIN (2005).
Notes: * 1997, ** 2002.
2 Volatile trade balance in Kazakhstan is for SITC1-24, if to include wool and animal skins
into calculations then trade balance is steadily positive in this country as well.
Export Import 1995 2000 2005 1995 2000 2005 Azerbajan 80.9 58.0 67.1 16.9 52.5 56.3 Armenia 92.7 87.7 89.7 11.3 8.7 46.5 Byelrussia 77.9 83.7 90.6 45.0 49.0 49.0 Georgia 91.5 67.6 68.1 7.8 19.3 45.6 Kazakhstan 95.0 77.5 71.4 88.5 56.4 50.9 Kyrgystan 94.1 81.3 77.0 24.8 50.7 69.9 Moldova 67.1 75.2 72.5 39.0 13.0 38.2 Russia 29.9 38.7 49.1 26.2 28.1 22.4 Tajikistan 100.0 94.7 76.2** 70.7 83.0 84.6**Turkmenistan 51.7* 43.4 51.5** 70.6* 66.3 66.3**Uzbekistan 71.8 63.8 67.7 20.4* 49.5 34.6**Ukraine 39.2* 30.9 32.3 57.7* 57.6 13.3 Simple average 74.3 66.9 67.8 39.9 44.5 48.1

Country transition experience 121
Table 3.1 indicates that NIS countries remain heavily depending on the NIS internal market for their exports of agri-food commodities while in imports the share of the NIS is notably less important. In general the average share of trade within NIS is declining with a time during the last decade, but there is no a single trend for all countries of the region (Table 3.1). Thus, for Caucasian countries as well as for Kyrgyzstan and Tajikistan (except Azerbaijan these are the countries with political and military conflicts during the period in consideration) dependence on imports from the NIS countries is growing. For Ukraine and Kazakhstan this dependence is diminishing (ibid.). In overwhelming number of cases inter-NIS imports are represented by re-exporting of high value added food commodities from non-NIS countries via Russia. Russia (due to its geographical and infra-structure state) has become a distribution center for other NIS countries, especially those that had no boarder with the EU or access to the seaports. This fact is also reflected with the growth of Russia’s exports to the NIS countries (ibid.). Russia remains the major recipient of NIS’s deliveries of agri-food commodities while it has wider trade contacts with non-NIS countries. Russian export to the non-NIS countries is represented by raw agricultural commodities while its import from non-NIS countries consists of high value added food commodities. In agri-food trade with NIS countries this ratio is opposite: Raw dominates imports and value added commodities dominate exports (Figure 3.3.). Figure 3.3: Russia: Structure of export (upper) and import (down) of selected
agri-food commodities by NIS and non NIS countries, 2004, %
0% 10% 20% 30% 40% 50% 60% 70% 80% 90% 100%
oilseeds
fruits
meat
cereals
vegetable oil
beverages and spirits
flour, groats
sugar and sugar cont. products
processed meat and fish
processed fruits and vegatbles
bakery
cacao and cacao cont. products
coffee, tea
dairy
NIS non NIS

Agricultural economics and transition 122
0% 10% 20% 30% 40% 50% 60% 70% 80% 90% 100%
sugar and sugar cont. products
vegetable oil
processed fruits and vegatbles
bakery
processed meat and fish
fruits
cacao and cacao cont. products
vegetables
dairy
beverages and spirits
cereals
Source: Computed from RF Customs Committee’s data. 3.2 Trade integration: Trade regime From the very beginning of the establishing of the NIS the constituent countries make efforts to establish also a Common Agricultural Market of these countries. The target of this Common market is declared as a free movement of agri-food com-modities and services in agri-food sector among member countries (KRYLATYKH, 1998). This assumes not only free trade regime between countries but also consolidated trade regime in regards the third countries. Common market request also unification or at least convergence of the domestic support policies. In the NIS countries one can observe neither free trade regime nor unified domestic support. In Table 3.2 the import duties in AVE for selected agri-food commodities are presented in every NIC country. One can see that both level and measures of boarder protection varies significantly from country to country. Table 3.2: Trade measures in NIS: Import duties for selected commodities, %
Carcasses and halfcarcasses
Reference years Butter Poultry
frozen Cane sugarBeef Pork
Other wheat
Armenia 2006 10 10 10 10 10 0 Azerbaijan 2005 15 15 15 15 15 0 Belarus 2002 20 30 1 15 15 5 Georgia 2004 10 12 6 12 12 12 Kazakhstan 2004 0 5 0 5 5 5 Kyrgystan 2003 10 10 0 10 10 0 Moldova 2006 20 30 30 20 20 10
Russia 2005 15 25+
quota chang.duty TRQ
(15/40)* TRQ
(15/80)* 5 Tajikistan 2002 10 15 5 15 15 5 Turkmenistan 2002 0 0 0 0 0 50Ukraine 2005 1.5 €/kg 10 50 10 10 0 Uzbekistan 2001 0 0 0 0 0 0 Source: Derived from UNCTAD data and data of the AFE. Note: In brackets: Duty within/beyond TRQ.

Country transition experience 123
Level of the domestic support is difficult to estimate in one measure: The conventional indicator PSE officially is calculated by the OECD only for Russia and for Ukraine. We have done our own calculations of PSE for two years for Kazakhstan. These indicator shows the same trends and moreover, the level in the domestic support of agriculture at lest in these three economies. However, more detail analysis of the domestic measures shows very big discrepancy in this respect (for instance, SEROVA, 2000).
3.3 Specialization and cooperation Common agricultural market is very problematic in the NIS also because there are many contradictions between these countries both on the external and internal agri-food markets. Thus, Ukraine, Russia and Kazakhstan are emerging world grain exporters. In 2002-2005, these three countries have exported on average 15-20 million tonnes of wheat a year (Figure 3.4). However, they face with the severe contradictions between them. Firstly, they are competing at the same markets. Secondly, Ukraine has available the major former Soviet ports on the Black sea and charges Russian exporters fees for an access to these ports. In its turn, Russia imposes higher transportation fees for Kazakhstan grain transit through Russian territory. In result, Kazakhstan has to ship major grain exports to Russia, and Ukraine has advantages in front of Russia on the EU markets. As a consequence of that, all three countries lose from this irrational contest and lack of suggesting cooperation in grain trade. Figure 3.4: Grain production and export of selected NIS, million tonnes
05000
100001500020000250003000035000400004500050000
1992 1995 2000 2002 2005 1992 1995 2000 2002 2005 1992 1995 2000 2002 2005
Kazakhstan Russia Ukraine
production
export
Source: Derived from FAO database. Another example of contradictions between the same three countries occurs in sugar production. In the Soviet time Ukraine was a major white sugar producer and shipped it to Russia and other republics. Russia received half of consumed sugar from Ukraine. Since break-up of the USSR, newly independent states had started to produce themselves white sugar (usually from imported raw sugar),

Agricultural economics and transition 124
what caused a severe fall in sugar production in Ukraine (Figure 3.5), and growth in sugar refinery industry in other NIS. This also caused the trade conflicts between some NIS and imposing of trade technical barriers. Figure 3.5: Sugar trade among selected NIS countries. million tonnes
0
1000
2000
3000
4000
5000
6000
7000
1990 2003 1990 2003 1990 2003
Russia Kazakhstan Ukraine
import from Ukraine
production
Source: AFE.
In the last years Russia has toughen trade regime for agri-food products originated from other CIS. Thus, there were restrictions for livestock products from Ukraine. Moldavian and Georgian wines and Georgian mineral water were prohibited for import to Russia. Byelorussian sugar imports was done a subject of more serious border control and so forth. Trade contradictions come out due to non-simultaneous accession to the WTO. New WTO members – CIS countries introduce additional requirements for the accessing neighbors. It was a case, for instance, between Kazakhstan and Kyrgystan, Russia and Georgia.
4 Integration to the world economy The NIS’s share in the world agricultural trade is marginal: Overall trade makes about 3-4 % of the world one and agricultural export – 0.2 % of world one. The openness of the agri-food sectors varies by countries of the region (Figure 3.6). However, it lack of access to data on gross agricultural output for the countries in consideration we had to calculated the index of openness with value added in agriculture. Therefore these indices measure also the difference in structure of agri-culture: Countries with higher intermediate consumption in agriculture ceteris paribus will have smaller value added and as a result higher index of openness, calculated as ratio of volume of trade and value added. Nevertheless these indices provide a rough picture of countries divergence in terms of participation in world agri-food trade. Also Figure 3.6. depicts the fact that there are no similar trends in development of trade openness in the region.

Country transition experience 125
Figure 3.6: Openness of agri-food sectors in the NIS countries, %*
0
50
100
150
200
250
300
Arm
enia
Azer
baija
n
Bela
rus
Geo
rgia
Kaz
akhs
tan
Kyr
gyst
an
Mol
dova
Rus
sia
Tajik
ista
n
Turk
men
ista
n
Ukr
aine
Uzb
ekis
tan
1995
2000
2004
2005
Source: Derived from 15 years of the Commonwealth of independent states (1991-2005)
Statistical abstracts, UNCTAD database. Note: * Calculated as ratio of agri-food export+import to value added in agriculture. Dependency of agri-food sectors of the NIS countries was estimated with the same indicator of value added, created in agriculture (Figure 3.7) With the same limitations like for indicator of openness this index shows us how different countries of the region depend on deliveries from or supplies to the external markets. Thus, we see that Moldova is heavily depending on export. Taking into consideration that almost ¾ of its export goes to the NIS countries (see Table 3.2. and most of all to Russia, one can imagine how sensitive Moldavian agri-food sector is to any restrictions on trade imposed by Russia. Majority of the NIS countries depends on imports from the external markets but in the last years the level of this dependency is less than 20 %. In terms of gross agricultural output this dependency is even less. Figure 3.7: Dependency of agri-food sectors of the NIS countries, %*
-40
-20
0
20
40
60
80
100
Arm
enia
Azer
baija
n
Bela
rus
Geo
rgia
Kaza
khst
an
Kyr
gyst
an
Mol
dova
Rus
sia
Tajik
ista
n
Turk
men
ista
n
Ukr
aine
Uzb
ekis
tan
1995
2000
2004
2005
Source: Derived from 15 years of the Commonwealth of independent states (1991-2005)
Statistical abstracts, UNCTAD database. Note: * Calculated as ratio of agri-food export-import to value added in agriculture.

Agricultural economics and transition 126
NIS countries export mostly within the region, to Asia and to Europe. In the last years exports inside the region are slightly increased at expense of Asia and Europe. Geographical structure of export is for sure determined by location of the region – between Europe and Asia. However, it reflects either the structure of agri-food production by the NIS countries: Law quality and low compliance with international standards of average level agri-food products produced in the region result in exportation to the developed countries only low value added raw agricultural commodities. High value products are dedicated mostly for the intra-regional trade. Integration to the world markets is closely linked with accession to the WTO. In this respect situation differs significantly across the region: Different countries applied for accession in different time (Turkmenistan refrains to apply by now), therefore they are at different level of accession process (Table 3.3). Table 3.3: WTO accession process of the NIS countries
Working Party meetings Country Application
received First Latest Status
Armenia XI.1993 I.1996 – Membership since 5 February 2003
Azerbaijan VII.1997 VI.2002 III. 2006 Bilateral market access negotiations are ongoing
Belarus IX.1993 VI. 1997 V.2005 Working Party continues the examination of Belarus' foreign trade regime
Georgia VII.1996 III.1998 – Membership since 14 June 2000 Kazakhstan I.1996 III.1997 XII. 2006 Bilateral market access
negotiations are underway on the basis of revised offers in goods and services circulated in 2004
Kyrgystan II.1996 III.1997 – Membership since 20 December 1998
Moldova XI.1993 VI. 1997 – Membership since 26 July 2001 Russia VI.1993 VII.1995 III. 2006 Market access negotiations on
goods and services are ongoing Tajikistan V.2001 III. 2004 X. 2006 Working Party continues the
examination of foreign trade regime
Turkmenistan Has not applied Ukraine XI. 1993 II.1995 VI. 2006 Bilateral market access
negotiations are ongoing Uzbekistan XII. 1994 VII.
2002 X. 2005 Bilateral market access
negotiations are ongoing Source: WTO database.

Country transition experience 127
Some of the countries are already the members of the WTO (Moldova, Armenia, Georgia, and Kyrgystan) and have very tough commitments. The accessed countries are small economies and there accession had not change significantly the status quo in the WTO. The negotiation with such big economies like Russia. Ukraine and Kazakhstan could not be an easy process. Also it is worth to note that accessed countries committed rather high level of openness of the internal markets: After accession in all four countries the agri-food imports notably increased (Figure 3.8). Figure 3.8: Impact of accession to WTO on import in selected NIS countries*
0
50000
100000
150000
200000
250000
300000
350000
400000
450000
500000
1995
1996
1997
1998
1999
2000
2001
2002
2003
2004
2005
ArmeniaGeorgiaKyrgystanMoldova
Source: Derived from UNCTAD database. Note: Enlarged mark on each country’s line indicates the year of accession. For Kyrgyzstan
it is indicated 1998 because the official date of accession was late December of 1997.
5 Intra-industry trade The modern trade theory point out that increase of trade can be determined by the growth in product variety. Helpman in 1987 had found empirical evidence that growth in products variety increases intra-industry trade (ITT). Transitional countries and especially NIS countries have an evident technological gap, which does not allow them to differentiate agri-food products in order to increase their export to developed countries at expanse of this factor. The export to the developed countries can grow but it can be a result of extensive margin: When expansion of export is because of larger volume of larger set of products is exported on the contrary with intensive margin when expansion of export is because of growth in quality and prices (KANDOGAN, 2003; HUMMELS, KLENOW, 2002). In the majority of empirical studies for ITT measurement is used GLi index, proposed by GRUBEL and LLOYD (1975):
Agricultural economics and transition 128
100*)1(100*)[(
ii
ii
ii
iiiii MX
MXMX
MXMXGL
+−
−=+
−−+= ;
where Xi – export of product i, Mi – import of product i. Thus, the GL index measures the exchange of the commodities of the same group: Exchange Russian sausages to Kazakhstan sausages, exchange Russian cereals to Ukrainian cereals. The more varieties of the same product are produced inside the country the more options for international trade with this product is case of satisfied quality of all varieties. We computed GL indices for all NIS countries for the agri-food commodities (SITC 1-24). In 1995-2005 for 12 countries this index varies from 4.6 to 88 %. It was natural to reveal the factors, which determine this changeability of GL index. Level of the IIT presumably depends most of all on level of the economy develop-ment: More industrialized economies has more technological possibilities for increase in product varieties while less developed economy. In a given accessibility of statistic data we picked up two proxies for estimation of country development level: A share of agriculture in GDP indicating the level of industrialization of the economy; and GDP per capita estimating living standards in the country. It is clear that level of industrialization affect GL index more significantly those living standards in the NIS countries. However, correlation coefficient in both cases is statistically insignificant. But we considered all agri-food commodities as a single aggregate. At the same time it is clear that agricultural raw products are least subject for differentiation than food commodities. Therefore we split agri-food aggregate into two groups of commodities – raw (SITC 2–22–27–28) and food (SITC 0+1+22+4). And built two regressions where GL for corresponding group of commodities was a depending parameter and share of agriculture in GDP and GDP per capita were the variables. The parameters of the regression are presented in the Table 3.4 and Note: R-square = 0.59. Regression analysis showed that level of industrialization of the economy is a rather strong factor affecting intra-industry trade with agricultural raw commodities in the NIS countries. For food commodities level of industrialization does not influence very much. Living standards of the country do not determine GL in a big extent in both cases.

Country transition experience 129
Table 3.4: Parameters for regression function of GL index for agricultural raw commodities with variables "Share of agriculture in GDP" and "GDP per capita", NIS countries, 1995-2005
Coefficients Std. error t-stat P-value Lower 95 %
Upper 95 %
Y-intersection 162.66 30.51 5.33 0.00 93.65 231.67 Share -3.84 1.08 -3.57 0.01 -6.27 -1.41 GDP -0.02 0.01 -2.65 0.03 -0.04 0.00
Note: R-square = 0.59. Table 3.5: Parameters for regression function of GL index for food
commodities with variables "Share of agriculture in GDP" and "GDP per capita", NIS countries, 1995-2005
Coefficients Std. error t-stat P-value Lower
95% Upper 95 %
Y-intersection 109.43 33.31 3.29 0.01 34.09 184.77 Share -1.78 1.17 -1.51 0.16 -4.43 0.88 GDP -0.01 0.01 -1.24 0.25 -0.03 0.01
Note: R-sqare = 0.20. So, our analysis does not allow answering what determines intra-industry food trade in the NIS countries. But what we revealed is the following: The more industrialized countries have more differentiated agricultural raw production, while less developed countries have more monocrop structure of farming and presumably inclined to self-sufficiency in raw. The last issue we studied was the difference in intra-industry trade within NIS and beyond NIS (Figure 3.9). Intra-agrifood sector trade in the region is quite high in comparison with general IIT for this countries: GL indices for NIS countries computed by Kandogan for 1995-1999 is below 56 % while for major groups of agricultural products is above that level (for three considered countries). Russia is seemingly differs from the rest of NIS countries (at least two other big economies of the region): For Russia intra-agri-food sector trade is much more developed with NIS countries than with the rest of the world. It can be explained with already stated position of Russia as distribution point for deliveries of agri-food commodities from non-NIS countries to the NIS countries. It can be direct re-export or Russian companies can add value to those commodities and export them further to other countries of the region. Other NIS countries have less intra-agri-food sector trade with NIS countries possibly due to the continuing speciali-zation in certain products which remained from the Soviet time. Technological underdevelopment does not allow increasing product variety.

Agricultural economics and transition 130
Figure 3.9: Intra-industry Trade (GL index) for selected agri-food commodities in trade with NIS and with non-NIS countries, 2004, %
Russia
0,020,0
40,060,080,0
100,0120,0
140,0160,0
Cer
eals
Suga
r and
suga
r con
tpr
oduc
ts
Bake
ry
Frui
ts
Cac
ao a
ndca
cao
cont
prod
ucts
Proc
esse
dm
eat a
ndfis
h
Proc
esse
dfru
its a
bdve
geta
bles
Vege
tabl
eoi
l Dai
ry
Non NIS
NIS
Ukraine
0102030405060708090
100
Whe
at
Sug
ar
Bee
f
Milk
and
crea
m
But
ter
Flou
r
Sun
flow
eroi
l
NISNon-NIS
Kazakhstan
020406080
100120140160180200
mea
t and
mea
tpr
oduc
ts
dairy
vege
tabl
es
cere
als
flour
and
cere
alpr
oduc
ts
oils
eeds
and
veg.
oil
proc
esse
dm
eat a
ndfis
h
suga
r and
suga
r con
t.pr
oduc
ts
caca
o an
dca
cao
cont
.pr
oduc
ts
NISnon-NIS
Source: Derived from AFE database.

Country transition experience 131
6 Conclusions Answering the question raised in the beginning of this paper after conducting this study we incline to state that international integration is more attractive for the NIS countries and will deepened further along with positive development trend. Nevertheless the technological gap and inherited from the Soviet period speciali-zation of agri-food sectors (sometimes with reductio ad absurdum monocrop farming) push this countries to inter-regional agri-food trade despite of trade barriers and failure of establishing common agricultural market of the NIS. This trend will be supported by uneven development of the NIS countries. The countries, more advanced in modernization economy as a whole and agri-food sector in particular, will get more investment inflows and hi-tech for their agri-food sectors. This will cause product variety expansion and growth in trade with the rest of world. It can be also a way for trade with intensive margin. The countries, which will lag behind this development progress, can remain in the status of suppliers of the primary agricultural raw and the markets for deliveries of high value added products. The last trend can be stipulated by low living standards of population.
References BORODIN, K. (2005): Integration of agrifood markets (EU, NIS, RF). TEIS, Moscow (In Russian).
CERNOSA, S. (2002): Intra-industry trade and geographical size differences between Slovenia and Czech Republic. Finance a Uver, 52(6), pp. 355-370.
HELPMAN, E. (1987): Imperfect competition and international trade: Evidence from fourteen industrialized countries. Journal of the Japanese and International Economiesm, 1(1), pp. 62-81.
HUMMELS, D., KLENOW, P. (2002): The Variety and Quality of Nation’s Trade. NBER Working Paper, No. 8712.
GREEMWAY, D., MILNER, C. (1986): The Economic of Intra-industry Trade. Basil Blackwell, Oxford.
GRUBEL, H., LLOYD. P. J. (1975): Intra-industry Trade. MacMillan, London.
KANDOGAN, Y. (2003): Does Product Differentiation Explain the Increase in Exports of Transitional Countries? William Davidson Institute Working Paper. No. 559.
KRYLATYKH, E. (1998): Formation of the Common Agricultural Market of the NIS: Opportunities and obstacles. Issues of the forecasting. No. 1 (In Russian).
SEROVA, E. (2000): Agriculture in Transition: The Common Objectives and Diversity of Trajectories. In: Proceedings of the mini-symposium on "Institution Sequencing and Timing in Transition Economies". XXIV Conference of IAAE, Berlin, August 13-19, 2000.
Sources Statistic Agency for NIS: 15 Years of the NIS (1991-2005). Statistical Abstract. Moscow, 2006.
Russian Statistic Agency: Various publications.

Agricultural economics and transition 132
RF Customs Committee database.
Narodnoye Khozyajstvo SSSR [Yearbook of the USSR]. Goskomstat, Moscow, 1990.
FAO database.
International Trade Centre of the UNCTAD/WTO database.
WTO International Trade Statistics, 2005.
OECD database.
Centre AFE database.
DIVERSIFICATION OF RURAL INCOMES AND NON-FARM RURAL EMPLOYMENT: EVIDENCE FROM RUSSIA
DMITRY ZVYAGINTSEVA, OLGA SHICKB, EUGENIA SEROVAC, ZVI LERMAND
aHigher School of Economics, Moscow bAnalytical Centre AFE, Moscow cAnalytical Centre AFE, Moscow
dThe Hebrew University of Jerusalem, Israel
1 INTRODUCTION The traditional conception of rural development viewed strong agriculture as a prerequisite for a strong rural economy. Today, however, non-farm rural employ-ment (NFRE) is the key concept for both researchers and policy makers in promoting and implementing rural development strategies (LANJOUW, SHARIFF, 2001; DAVIS, 2001). NFRE can help reduce poverty by generating alternative income sources; NFRE can stimulate agricultural growth, because reduction of agricultural labor increases productivity and thus indirectly family incomes. Policies stimulating NFRE can also diminish rural-to-urban migration, which is a serious problem in many transition economies (NEFEDOVA, 2003; KNERR, WINNICKI, 2003). NFRE is a major issue for the future development of rural Russia, because redundant agricultural labor is generally regarded as the main obstacle to productivity growth in Russian agriculture. It is argued that excess agricultural labor characterizes both employment in farm enterprises and informal buffer employment on the individual house plot – the "family farm" (SEROVA, ZVYAGINTSEV, 2006). Since the local farm enterprise, rather than the family farm, is the primary employer for many rural residents, NFRE in the Russian context should be approached as employment "outside the farm enterprise" rather than employment "outside the family farm" (which is the usual approach in the Western context; see LANJOUW, FEDER, 2001; CHAPLIN, DAVIDOVA, GORTON, 2003; BUCHENRIEDER, 2003). Our article focuses on diversification of rural incomes, on factors that determine diversification, and specifically on NFRE activities and their relation to social

Agricultural economics and transition 134
and demographic features of rural families. The article is based on a survey of some 800 families conducted by the Analytical Centre of Agri-Food Economics in the fall of 2006 in two Russian regions (Perm and Ivanovo Oblast).
2 RURAL EMPLOYMENT: THE NATIONAL PICTURE Any analysis of rural employment in Russia inevitably unfolds against the backdrop of harsh demographic reality: The rural population in Russia (and other countries in the European CIS) is getting older over time. During the two decades from 1980 to 2000 the share of rural population described as being "above working age" increased from 20 % to 23 % in Russia, from 24 % to 28 % in Ukraine, from 25 % to 33 % in Belarus, and from 15 % to 18 % in Moldova. It is only the Central Asian countries in CIS that avoided a similar fate, as their exceptionally high population growth rates kept the age structure relatively young (CIS, 2006). In addition to the aging of the rural population, national statistics also point to marked changes in the structure of rural employment. During 1999-2003, when rural employment remained fairly constant at around 16 million people, the share of agriculture decreased from 46 % to 36 % of rural employed and the labor shed by agriculture was absorbed by other sectors of the rural economy – manufacturing, trade and consumer services, social services (Table 3.6). Table 3.6: Rural employment by sectors of the economy, 1999-2003
1999 2000 2001 2002 2003 2003 in percent of 1999
Total rural employed, millions 15.89 16.16 15.25 15.9 15.57 98.0 Total rural employed, % 100.0 100.0 100.0 100.0 100.0 Agriculture, % 45.8 44.5 39.9 38.0 36.5 78.3 Industrial sectors, % 19.9 19.7 21.2 21.9 22.2 109.1 Trade and consumer services, % 8.0 8.5 11.5 12.6 13.0 159.1 Social services, % 26.3 27.2 27.3 27.5 28.3 105.3 Source: BOGDANOVSKII (2008). The structure of employment in agriculture proper has changed dramatically. In 1990, farm enterprises (i.e., traditional collective and state farms) were the dominant agricultural employer, accounting for 86 % of employed in agriculture (8.3 million workers out of total 9.7 million). Between 1990 and 2002 farm enterprises (or more precisely the corporate farms that succeeded the former kolkhozes and sovkhozes) lost 4.5 million workers, or 55 % of their 1990 work-force. More than half the workers leaving the corporate farms (2.5 million out of 4.5 million) shifted to the individual sector – household plots and peasant farms

Country transition experience 135
combined, and in 2002 individual agricultural employment practically matched that in corporate farms, with each sector employing 3.8-3.9 million people (Figure 3.10). Despite its robust growth, the individual sector did not absorb the entire slack created by the exit of labor from farm enterprises: 2 million people appear to have left agriculture altogether. They may have moved to other non-agricultural occupa-tions or become inactive. Another possibility is that at least some of them simply dropped out from official statistics because they had moved to the blind area of individual employment where people are not covered by labor surveys (i.e., people whose sole occupation is the subsistence-oriented household plot). Figure 3.10: Agricultural employment by farm type, 1990-2002
Source: BOGDANOVSKII (2008).
3 STRUCTURE OF RURAL FAMILY INCOME Additional insights into patterns of rural employment in Russia are provided by the 2006 survey of rural households in two oblasts (Ivanovo and Perm). Two sets of survey instruments were used: The "family" questionnaire filled by heads of some 800 households; and the "individual" questionnaire filled by 1,200 members of the same households who indicated that they had salaried jobs. The micro-level information from this survey supplements and extends the national-level data obtained from official statistics. Consistently with the employment picture from national statistics, according to which only one-third of the rural population is employed in agriculture (Table 3.6), the survey shows that agriculture is definitely not the main source of income for rural families. Agriculture-related income comprises only 34 % of the total family income in the families surveyed (Table 3.7). This consists of 17 % in the form of agricultural salaries earned from the local corporate farm and another 17 % in the form of farm income from the household plot (a self-employment activity that includes revenue from sales of farm products and value of own farm products consumed by the household). Fully 41 % of family income is derived from non-
1990 1992 1994 1996 1998 2000 20020
2
4
6
8
10
12millions
Large farmsHousehold plotsPeasant farms

Agricultural economics and transition 136
agricultural salaries, and another 7 % is earned from self-employment activities off the family farm (mainly picking and selling of wild mushrooms and berries, but also some fishing, hunting, commerce, and provision of services). Pensions and other social transfers make up the remaining 18 % of family income and are reported by two-thirds of families surveyed, the high frequency of recipients reflecting the high proportion of seniors among the rural population. Although farm and off-farm sales contribute relatively little to total family income, a relatively large number of families engage in these self-employment activities. "Other income", a totally marginal source including lease payments for land and farm assets, is reported by as many as 42 % of families, because large segments of the rural population in Russia continue to lease their land and asset shares for a pittance to the local corporate farm or other agricultural producers. Table 3.7: Structure of family income in the 2006 survey
Income sources Share of total family income, %
Frequency in the sample, % of families
Salaries 58 90 from agricultural employment 17 from non-agricultural employment 41 Farm income from household plot 17 91 sale of farm products 5 26 value of products consumed by family 12 91 Income from off-farm self-employment 2 18 Transfers 18 66 Other income 5 42 Total family income, rubles per year 104,135 Per capita income, rubles per year 40,603
Source: 2006 AFE survey.
4 INCOME DIVERSIFICATION OF RURAL HOUSEHOLDS We approach diversification from two positions: Number of income sources and sector of primary employment. For most households, family income is quite diversified. "Non-diversifiers", i.e. the families with only one source of income, comprise less than 2 % of all rural families. The main employment activity for diversification is self-employment of family members on the household plot. Besides self-employment on the household plot – a farming activity, non-salaried diversification is present in the incomes of many rural households. In spite of small share of these income activities in family income (only 7 %), fully 20 % of households have this type of income. This includes sale of wild berries and mushrooms, fish and hunting, sale of services, etc.

Country transition experience 137
Table 3.8: Main family income sources Income sources % of families reporting this source Salary 90 Self-employment in agriculture – household plot 91 including sale of farm products 26 Non-farm self-employment 18 Transfers 66 Other 42
Source: 2006 AFE survey. About 90 % of rural families have both salaried income and farm income. Only 18 % of families receive income from non-farm self-employment activities. Transfers are very important, as 66 % of rural families receive pensions, unemploy-ment benefits, and other social benefits (Table 3.8). The data on income structure reveals that a typical rural family in Perm or Ivanovo receives income from 3-4 different sources and types of activities (including transfers). Diversification is positively correlated with family income: When a family is engaged in more activities, its income increases (Figure 3.11). Figure 3.11: Effect of diversification on mean family income
1
Source: 2006 AFE survey.
To assess the incidence of salary diversification, i.e. diversification by the sector of primary employment, we classified the respondents into five categories: Agricultural families (with both members employed in agriculture); public sector families (with both members employed in public sector); non-farm families (both members are employed in non-farm jobs outside the public sector); mixed agricultural families (one member works in agriculture and the other in non-farm or public sector); mixed non-farm families (one member works in the public sector and the other works in non-farm sector).
1 2 3 4 5 6number of income sources
0
50
100
150
200'000 rubles per year
income

Agricultural economics and transition 138
Table 3.9: Classification of rural families by sector’s salaried primary employment
Share of families (n = 700) Annual average salary, rubles
Agriculture 23 58,000 Public sector 21 61,300 Non-farm sector 26 63,500 Mixed, agriculture 15 85,600* Mixed, non-farm sector 14 97,700*
Source: 2006 AFE survey. Note: * Average pay in two mixed categories is statistically significantly higher than in pure
categories at p = 0,05. In the pure categories (where family members are employed in the same sector) the difference between salaries received is not statistically significant. The salary in all three cases is about 60,000 rubles per year (Table 3.9). But mixture of employment sectors gives to families much higher income. In two mixed family types we find salary about 90,000 rubles per year. Families that diversify their sector of employment earn more. This is similar to what was observed earlier: As diversification increases, family income grows (Figure 3.11).
5 NON-FARM SELF-EMPLOYMENT ACTIVITIES Less than 20 % of families receive non-farm income not related to salaried employment (142 out of 791 rural household surveyed). The main share of non-farm self-employment income is generated from the sale of wild berries and mushrooms. It is 60 % of all non-farm self-employment income. From the standpoint of the sector of salaried employment of members of these households, about 50 % of households have one or more members employed in agriculture and the rest 50 % do not have any employed in agriculture. For families with non-farm self-employment income, family income is a bit higher than for families without it (107,400 rubles and 103,400 rubles respectively, but the difference is not statistically significant). The main difference between these two types of families can be found when we compare the share of salary in family income. Salaries received for families with non-farm self-employment income are only 49,400 rubles per year. For contrast, salaries received for families without non-farm self-employment income are 65,600 rubles. Looking at this difference it would seem that rural families search for non-farm self-employment to compen-sate for smaller salaries. If that is the case, non-farm self-employment income should be considered not as a discretionary source of additional income, but as a necessary source to cover family needs not covered by salaries. In this sense, we possibly observe distress-push behavior among rural people in Russia (BUCHENRIEDER, 2003).

Country transition experience 139
Further analysis of income structure for families with non-farm self-employment income reveals another fact. These families receive farm income (both sales and consumption of farm products produced on the household plot) that is higher by 10,000 rubles than families without non-farm self-employment income. Non-farm self-employment itself brings an additional 12,000 rubles per year. Again, we suggest that the financial deficit in the rural family budget resulting from smaller salaries is covered by income both from non-farm self-employment activities and from greater farm production on the household plot (Table 3.10). For families with non-farm self-employment income (Table 3.10), two-thirds of this income comes from sale of wild berries and mushrooms. To a lesser extent this is sale of fish and income from hunting. The remainder is equally divided between income from sale of services to local rural residents and other non-farm activities, such as transportation or wood working. In other words, non-farm self-employment income can be divided into two components: "Natural", comprising income from sale of wild berries and mushrooms, wood products, fishing and hunting (about 7 % of family income); and "entrepreneurial", comprising income from sale of services and individual business (4 % of family income). Table 3.10: Family income structure for families with and without income
from non-farm self-employment activities Rubles per year Percent
Families without non-farm income
Families with non-farm income
Families without non-farm income
Families with non-farm income
Salary 65,457* 49,408* 63 46 Farm income (household plot) 18,238* 28,277* 18 26 Sale of farm products 5,780* 10,600* 6 10 Own consumption 12,458* 17,677* 12 16 Non-farm non-salaried income 0* 12,122* 0 11 Wild berries and mushrooms 0 8,001 0 7 Services and business 0 4,121 0 4 Transfers 16,030 13,126 15 12 Other income (from property) 3,689 4,469 4 4 Family income 103,414 107,402 100 100 Source: 2006 AFE survey. Note: * Differences are statistically significant at p = 0.05. To further our analysis let us hypothesize that the possibility to earn non-farm self-employment income is a function of the structure and quality of the family’s human capital. For example, it is recognized that better education is related to non-farm employment of family members, i.e., family members with higher education tend to be employed in the non-farm sector (CHAPLIN et al., 2003). In addition,
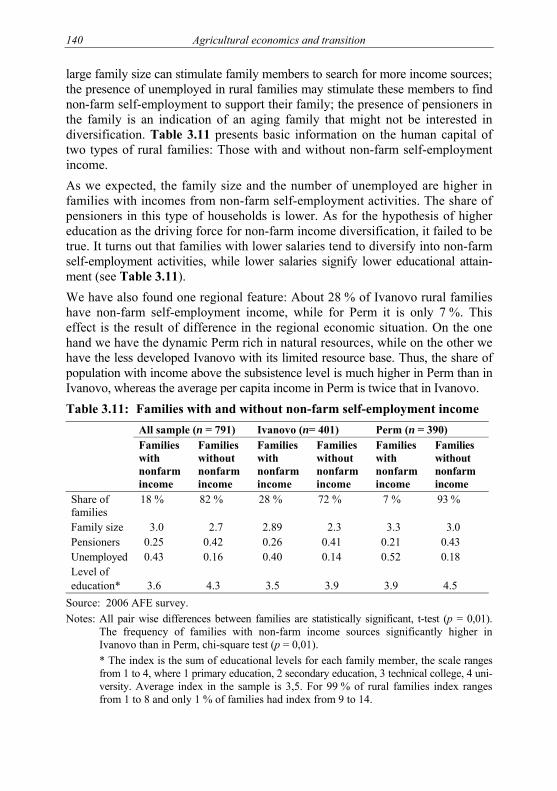
Agricultural economics and transition 140
large family size can stimulate family members to search for more income sources; the presence of unemployed in rural families may stimulate these members to find non-farm self-employment to support their family; the presence of pensioners in the family is an indication of an aging family that might not be interested in diversification. Table 3.11 presents basic information on the human capital of two types of rural families: Those with and without non-farm self-employment income. As we expected, the family size and the number of unemployed are higher in families with incomes from non-farm self-employment activities. The share of pensioners in this type of households is lower. As for the hypothesis of higher education as the driving force for non-farm income diversification, it failed to be true. It turns out that families with lower salaries tend to diversify into non-farm self-employment activities, while lower salaries signify lower educational attain-ment (see Table 3.11). We have also found one regional feature: About 28 % of Ivanovo rural families have non-farm self-employment income, while for Perm it is only 7 %. This effect is the result of difference in the regional economic situation. On the one hand we have the dynamic Perm rich in natural resources, while on the other we have the less developed Ivanovo with its limited resource base. Thus, the share of population with income above the subsistence level is much higher in Perm than in Ivanovo, whereas the average per capita income in Perm is twice that in Ivanovo. Table 3.11: Families with and without non-farm self-employment income
All sample (n = 791) Ivanovo (n= 401) Perm (n = 390) Families with nonfarm income
Families without nonfarm income
Families with nonfarm income
Families without nonfarm income
Families with nonfarm income
Families without nonfarm income
Share of families
18 % 82 % 28 % 72 % 7 % 93 %
Family size 3.0 2.7 2.89 2.3 3.3 3.0 Pensioners 0.25 0.42 0.26 0.41 0.21 0.43 Unemployed 0.43 0.16 0.40 0.14 0.52 0.18 Level of education*
3.6
4.3
3.5
3.9
3.9
4.5
Source: 2006 AFE survey. Notes: All pair wise differences between families are statistically significant, t-test (p = 0,01).
The frequency of families with non-farm income sources significantly higher in Ivanovo than in Perm, chi-square test (p = 0,01). * The index is the sum of educational levels for each family member, the scale ranges from 1 to 4, where 1 primary education, 2 secondary education, 3 technical college, 4 uni-versity. Average index in the sample is 3,5. For 99 % of rural families index ranges from 1 to 8 and only 1 % of families had index from 9 to 14.

Country transition experience 141
In order to advance our analysis, we made an attempt to model the motivation of rural households to engage in non-farm self-employment activities. The probability of involvement in non-farm self-employment activities was regressed on the human capital variables from Table 3.11 (logistic regression was used because of the binary yes/no nature of the dependent variable). Given that we are facing some regional differences, we added a regional dummy to the model (Ivanovo-Perm). The logistic regression results are presented in Table 3.12. What factors influence the decision of rural households to get involved in non-farm self-employment activities? Family size: As the family becomes bigger, there is a higher probability that some of family members will be earning some income from non-farm self-employment activities. Number of pensioners: The more pensioners in the family, the lower the probability that family will be earning non-farm self-employment income, because pensioners are economically less active and in some cases their pension is higher than alternative income options. Number of unemployed: The presence of unemployed in the family increases the probability of earning some non-farm self-employment income, because unemployed members will be actively looking for additional income and non-farm self-employment activity provides the best option for short-term. Educational attainment has a negative effect on the likelihood to engage in non-farm activities in our sample: Better educated people will tend to follow the demand-pull process (BUCHENRIEDER, 2003) and look for more remunerative occupations than the menial opportunities of non-farm self-employment in rural Russia. Region: We have already noted that non-farm self-employment is more widespread in Ivanovo than in Perm; this effect is confirmed by the positive coefficient of the region dummy variable (Ivanovo vs. Perm) in the logistic regression model. Table 3.12: The presence of non-farm self-employment income as function of
human capital and regional characteristics (logistic regression)
Coefficients Odds ratio* Significance level, p
Family size +0.357 1.429 0.000 Number of pensioners −0.407 0.666 0.072 Number of unemployed +0.523 1.688 0.014 Level of education −0.183 0.833 0.007 Region (Ivanovo-Perm) +0.903 6.084 0.000 Intercept −2.066
Source: 2006 AFE survey. Notes: * Odds ratio is estimated as exp(coefficient). This is the factor by which the odds of
engaging in non-farm self-employment activity change when the corresponding independent (explanatory) variable is increased by 1. Odds ratio greater than 1 implies that the probability of engaging in non-farm self-employment activity increases when the independent variable is increased, while odds ratio less than 1 implies that the probability decreases.

Agricultural economics and transition 142
7 CONCLUSION Agriculture is no longer the main source of income for rural families in Russia Non-farm activities develop through both salaried employment outside agriculture and non-farm self-employment activities. The rural population is risk-averse: They prefer working as salaried employees; do not think of changing their job; and yet fear losing the current position. This factor and the volatility of non-farm self-employment activities, which primarily depend on weather conditions, put high priority on policies that support non-farm activities. In order to increase family income, rural households follow two strategies. First, they increase the number of income sources, primarily from self-employment activities. Second, family members can increase family income if they work in different sectors of the rural economy. Self-employment is mainly represented by work on the household plot, but about 20 % of households are engaged in non-farm self-employment activities, such as picking and sale of wild berries and mushrooms. The development of the non-farm rural sector in Russia is taking place under distress-push conditions (BUCHENRIEDER, 2003). These conditions push family members to find additional income sources, which are not regarded as a potential for future primary employment but rather as a stopgap.
REFERENCES BOGDANOVSKII, V. (2008): Rural and Agricultural Labor Markets. Chapter 7 in: LERMAN, Z. (ed.): Russia’s Agriculture in Transition: Factor Markets and Constraints on Growth. Lexington Books, Lanham, MD.
BUCHENRIEDER, G. (2003): Overview of Poverty Impacts of and Policy Options for Non-Farm Rural Employment. In: Proceedings of the Mini-Symposium at the 25th International Conference of Agricultural Economists, Durban. South Africa. University of Hohenheim, Stuttgart, pp. 1-23.
CHAPLIN, H., DAVIDOVA, S., GORTON, M. (2003): Agricultural Adjustment and the Diversification of Farm Households in Central Europe. Paper presented at the 25th International Conference of Agricultural Economists, Durban, South Africa.
CIS (2006): Official Statistics of the Countries of the Commonwealth of Independent States. CD-ROM 2006-11. Interstate Statistical Committee of the CIS, Moscow.
DAVIS, J. (2001): Conceptual Issues in Analyzing the Rural Non-Farm Economy in Transition Economies. Natural Resources Institute Report, No. 2635.
KNERR, B., WINNICKI, T. (2003): Keeping Alive through Non-Farm Income: Facts and Concepts in the Region of Warminsko-Mazurski, Poland. In: Proceedings of the Mini-Symposium at the 25th International Conference of Agricultural Economists, Durban, South Africa. University of Hohenheim, Stuttgart, pp. 80-98.
LANJOUW, P., SHARIFF, A. (2001): Rural Non-Farm Employment in India: Access, Incomes and Poverty Impact. Paper presented at a workshop Rural Transformation in India: The Role of the Non-Farm Sector. Institute of Human Development, New Delhi.

Country transition experience 143
LANJOUW, P., FEDER, G. (2001): Rural Non-Farm Activities and Rural Development: From Experience towards Strategy. Rural Development Strategy Background Paper No. 4, World Bank, Washington D.C.
NEFEDOVA, T. (2003): Rural Russia at Crossroads. Geographical Essays. Novoe Izdatel’stvo, Moscow.
SEROVA, E., ZVYAGINTSEV, D. (2006): Alternative Rural Employment in Russia. Mir Rossii, State University Higher School of Economics, Moscow.

ACCOUNTING FOR HETEROGENEITY BIAS IN EFFICIENCY MODELS: AN APPLICATION TO POLISH AGRICULTURE
HEINRICH HOCKMANN, AGATA PIENIADZ
Leibniz Institute of Agricultural Development in Central and Eastern Europe, Theodor-Lieser-Str. 2, 06120 Halle, Germany.
E-mail: [email protected], [email protected]
1 INTRODUCTION There are numerous technical and economic efficiency analyses of agriculture in central and eastern European countries (CEECs). Further, nonparametric but deterministic approaches (DEA), as well as stochastic but parametric approaches (SFA) have been widely applied (see for instance BACKUS et al., 2006; BRÜMMER et al., 2002; MUNROE, 2001; LATRUFFE et al., 2004). One of the basic assumptions of DEA and SFA is that inputs and outputs are homogeneous among farms. This implies that the farms’ inputs can be changed to a common level or structure and all farms will have identical output. However, in principle, the productivity of the individual farm inputs differs with regard to the specialisation of farms, climate conditions and factor qualities such as soil fertility, human capital, including management skills, as well as capital structures and vintages. These factors cause that the input aggregates provided in the statistics are not homoge-neous but heterogeneous, which in turn limit the comparability of input use among farms. Unfortunately, the available statistical information does not allow correcting for this heterogeneity bias. The consequences of not accounting for the farms heterogeneity are following: (1) the efficiency is overestimated since the whole variation in inputs is transferred
into the inefficiency scores, (2) the efficiency scores are biased, which implies that no consistent policy
recommendation can be provided, and (3) the calculated production elasticities misrepresent the production structures
and their ability to adjust to changing policy and price conditions. In this paper, we present an econometric approach, which accounts for the hetero-geneity bias. We follow the approach discussed in ÁLVAREZ et al. (2003; 2004), who developed a random coefficient specification of production technology. The

Country transition experience 145
empirical application deals which the Polish agriculture. Due to the length restriction of this paper we restrict the discussion of results to problem (1) and (2).
2 THEORETICAL BACKGROUND The theoretical framework is developed within a panel data methodology, with i = 1,…,N firms and t = 1,..,T observations per firm. We follow the input augmentation approach and assume a production technology in which effective outputs (ye
it) are produced with observable inputs (xeit). The effective inputs and
outputs are given by:
iyiyt mtitit
e ee μτyy = and ixixt mtitit
e ee μτxx = . (1)
Here, yit and xit represent observable inputs and outputs, t accounts for productivity change over time, and mi represents a non-observable firm specific factor. We specify the technology as a translog output distance function (Do(ye
it, xe
it)):
( )
eit
eit
eit
eit
eit
eit
eit
eitit
eit
eoD
yAx
xAxyAy
yαxαyx
xy
xxyy
yx
ln'ln
ln'ln21ln'ln
21
ln'ln',ln 0
+
++
++=α
(2’)
Rearranging terms provides:
( ) ( )
( )
( )itit
itititimt
itititimt
ttitmtimmimite
ite
o
mt
mt
ttmmmD
yAx
yAyyααα
xAxxααα
yx
xy
yyyyy
xxxxx
ln'ln
ln'ln21ln'
ln'ln21ln'
21
21,ln 22
0
+
++++
++++
+++++= αααααα
The various parameters associated with t and mi are functions of the parameters xyyyxxyx AAAαα ,,,, as well as the productivity coefficients itt xyx μττ ,, and
iyμ . Technical efficiency can be introduced by assuming that actual mi is not necessarily at its optimal level, mi
*. Accordingly, we can write the distance function in two different forms. By making use of the requirement that the output distance function is linearly homogeneous of degree one in outputs we get:
( ) *|~,ln*ln
ii mmite
ite
oit Dy ==− yx (3’)

Agricultural economics and transition 146
( ) itmmite
ite
oit TEDyii
ln~,lnln *| −=− =yx , (3’’)
where itey~ represents normalized outputs, TEit is technical efficiency, and yit*
denotes the optimal level of the output. From (3) it follows that:
ititit TEyy lnln*ln −=− . (4)
Using (2) and collecting terms provides:
( )
*)(''*)('
*)(
*21*)(
with,ln'ln'ln22
0
0
iim
iim
iitmt
iimmiim
itittit
mmmm
mm
mmmm
tTE
−=−=
−=
−+−=
+++=
yy
xx
yx
αγαγ
yγxγ
αγ
ααγ
γγ
. (5)
According to (5) technical efficiency consists of four components. The first represents a time-invariant firm-specific effect, whereas the other terms reflect the interaction of m with time, inputs and outputs, respectively. An interesting term in expression (5) is γt, since it provides information about the change of inefficiency over time, and thus, whether there are catching up or falling behind processes. Equation (3’’) and (5) constitute a system that cannot be estimated directly, since neither m nor m* are known. However, ÁLVAREZ et al. (2003; 2004) developed an estimable model using:
( ) ititmmite
ite
oit vuDyii
+−−= = *|~,lnln yx . (6)
Equation (6) can be estimated by maximum simulated likelihood by making the conventional assumption regarding vit and uit. Thus, vit represents a random error term with ( )vit Nv σ,0~ , and uit is the technical inefficiency with
( )uit Nu σ,0~ + . Moreover, ( )1,0~ •im , where the symbol • indicates that mi might possess any distribution with zero mean and unit variance. Comparing (3) and (6) provides:
itit TEu ln=− .
The values of m*i can be simulated by (ÁLVAREZ et al., 2004):
[ ]( )
( )∑
∑
=
−
=
−
− = R
ri
kiri
ki
R
ri
kiri
kiri
ik
ikii
mtfR
mtfmRmE
1
*,
1
*,
*,
*
,,,,|1
,,,,|1
,,,|ˆδXYy
δXYyδXYy
)
)
, (7)

Country transition experience 147
where m*i,r is a draw from the population of mi, R is the number of draw, and f)
denotes the portion of the likelihood function for firm i, evaluated at the parameter estimates and the current value of m*i,r. The vector δ represent all parameters to be estimated. The capital letter in case of inputs and outputs indicate that the likelihood function is evaluated for all observations of firm i. Given the estimated level of m*i efficiency scores can be computed by (JONDROW et al., 1982 and ÁLVAREZ et al., 2004):
[ ]( )
⎥⎥⎥⎥⎥
⎦
⎤
⎢⎢⎢⎢⎢
⎣
⎡
−
⎟⎟⎠
⎞⎜⎜⎝
⎛−Φ
⎟⎟⎠
⎞⎜⎜⎝
⎛−
+==−
σελ
σε
λ
σελφ
λσλε
*
*
*
2* |
|
|
1,|ln iit
iiit
iit
iititijm
m
m
muETE (8)
with v
u σσλ = , 222
vu σσσ += and ititit uv −=ε .
3 EMPIRICAL IMPLEMENTATION AND ESTIMATION RESULTS We utilized a balanced data set consisting of eight years of observations, from 1994 to 2001, on 430 Polish agricultural farms; the total number of observations was 3,440. The respective accountancy information was provided by the Polish Institute of Agricultural and Food Economics – National Research Institute (IERiGZ-PIB). We distinguished between two outputs (crop and animal production) and four inputs (land, labour, capital and intermediate inputs). Output figures represent gross crop and animal productions. These indicators are more comprehen-sive measures of output than sales, since they include sales, home consumption and stock changes. Since the individual figures for crop and animal production were in current values, the variables were deflated by the corresponding price indices provided by the Statistical Office in Poland (GUS var. issues, a, b). Land input was approximated by the sum of arable land and grassland in use. Unused land was excluded in order to have a more accurate indicator of land used in production. Labour was measured by the hours of work allocated to agriculture by family and hired labour. As an indicator of capital input, the total amount of farm assets (buildings, machinery, equipment) was chosen. Since the aggregate was delivered in current values, we deflated the values by the price index of agricultural investment. However, even if this gives a comprehensive indicator of total capital input it is not necessarily connected to the services provided in each year. Thus, in addition we make the simplifying assumption that capital service flows are proportional to the capital stock for each farm and in each year. Intermediate inputs were approximated by total variable costs minus depreciation. The correction was conducted in order to avoid double counting. Depreciation is

Agricultural economics and transition 148
an imputed measure for capital, which was already accounted for with the variable total farm assets. Again, since the data set contains only current cost values we deflated the series by the price index of purchased goods and services in agriculture. The definition of variables, including some descriptive statistics are provided in Table 3.13. Table 3.13: Variable definitions and descriptive statistics
Variable Description Sym-bol Mean Standard
deviation Mini-mum
Maxi-mum
Crop production
Gross crop production, deflated O 127.4 149.2 1.7 2384.8
Animal production
Gross animal production, deflated Y 170.2 175.3 0.1 2895.6
Labour Total hours of work allocated to agriculture by family members and hired labour
A 3823.2 1734.1 247.0 16790.0
Land Sum of arable land and grassland in use L 15.9 15.2 1.2 191.3
Capital
Total farm assets (buildings, machinery, equipment), deflated by price index of agricultural investment
K 928.7 589.4 34.1 5181.8
Interme-diate inputs
Total variable costs minus depreciation, deflated by price index of purchased goods and services in agriculture
V 154.3 136.2 9.0 1748.7
Source: IERiGZ-PIB, own estimates. For estimation, all variables were divided by their geometric mean. Moreover, the homogeneity restriction was imposed with regard to crop production. We conducted several estimations of (6) with various assumptions regarding the error components and m*. First, we estimated without the aggregator function m*. This provides a pooled estimation without accounting for the panel structure of the data (model A). The panel data structure was considered in the next two estimations, which are the random effect model (model B) and the fixed effect model (C). The random effect model results from (6) assuming that the efficiency term uit varies only over firms but not over time. Additionally, it neglects the possible impact of m*. The fixed effect estimator results from (6) by considering the impact of m*i on the constant only. The fourth approach (D) is the model developed in (6). The last estimation is an extension insofar as it accounts for possible correlation between the unobservable component (m*i) and the level of inputs and outputs. In order to avoid this problem ÁLVAREZ et al. (2004) proposed to proceed like in CHAMBERLAIN (1984) and specify m*i as a function of inputs:
ik
iyixti tm ωψ +++= −yψxψ ln'ln'* , (9)

Country transition experience 149
where a bar indicates group means of the variables and ω ~ N(0,1). Table 3.14: Overall statistical indicators
Pooled Random effect
Fixed effect RPM RPM with
means Model # A B C D E
Assumptions in (6) mi* = 0 mi
* = 0, uit = ui
am ≠ 0, amk = 0, k=m,
t, y, a, l, k, vnone D with (9)
LogL 1114.25 1809.62 1690.32 1914.49 2023.63 # of parameters 30 30 459 38 44 Variance and asymmetry parameter
σ 0.2203*** 0.2763*** 0.3258*** 0.1553*** 0.1560*** λ 1.2059*** 2.2671*** 2.4165*** 1.3639*** 1.4467*** σv
0.1407 0.1219 0.1246 0.0908 0.0886 σu
0.1696 0.2763 0.3011 0.1256 0.1275 Source: Own estimates. Note: *** Denote significance at α = 0.01. Instead providing a detailed discussion, we will outline some general indicators, which assist in choosing the most suitable approach (Table 3.14). Since all estimates of σ and λ are significant, Table 3.14 provides evidence that technical inefficiency is an important aspect in Polish agriculture. However, since all estimated models yield reasonable and comparable results regarding overall statistical indicators, a selection regarding the best representation of the production possibilities is not possible at this stage. Further information about the model results are provided in Figure 3.12. The different plots show the distribution of inefficiencies estimated by the different approaches. The majority of the models provide similar results; the only exception is the random effect model, where the inefficiencies appear not to be consistent with the assumption of a well-behaved half normal distribution. Comparing the other models one can observe that the variance of the inefficiency reduces from the pooled estimator, over the fixed effect estimator to the models, which take account of the unobservable effects. This sequence of approaches has been expected, since the more sophisticated models considering unobservable factor allow for more variability of the production function.

Agricultural economics and transition 150
Figure 3.12: Kernel density functions of inefficiency scores
5
1 0
.0 0 .2 0 .4 0 .6 0 .8 0 1 .00
S tan d ard F ix ed effect R an d o m effect R an d o m C o m p on en t
Source: Own estimates. However, as the Log Likelihood of models (D) and (E) are the highest, these models appear to be the most suitable representation of the production technology. Thus, detailed information about the parameter estimates will be provided only for these two approaches (Table 3.15). First, both models suggest that technical change is a relevant phenomenon in Polish agriculture. However, the estimates reveal that the initial years of the analysed period were characterized by technical regression (αT < 0), while positive effects of innovations occurred in recent years only (αTT > 0). Moreover, crop production benefited more from technical change than animal production (αYT < 0). In addition, we estimated factor using (efficiency enhancing) technological change for all inputs. Theoretical consistency requires, inter alia, that the distance function be convex in all outputs and quasi-convex in all inputs. Although, we did not test the corresponding conditions directly, we checked whether the second order derivatives of outputs and inputs have the correct signs, i. e., αhh + αh
2- αh ≥ 0, for h = Y, A, L, K, V. The conducted calculations reveal that the condition is fulfilled for all inputs and outputs. Additionally, the estimates for the means of the random parameter estimates show that the monotonicity requirements are met. The estimated distance function is non-decreasing in outputs (αY ≥ 0) and non-increasing in inputs (αh ≤ 0, for h = A, L, K, V).

Country transition experience 151
Table 3.15: Parameter estimates for the random coefficient model with unobservable input
RPM RPM with means RPM RPM with means
(D) (E) (D) (E)
Random parameter estimates Means for random parameters
Second order effects
α0 –0.1394*** –0.1540*** 0.0019** 0.0029*** αTT
αT –0.0241*** –0.0239*** –0.0074*** –0.0058*** αYT
αY 0.5325*** 0.5239*** 0.0926*** 0.0928*** αYY
αA –0.1604*** –0.1894*** –0.0071*** –0.0079*** αAT
αL –0.1932*** –0.2492*** –0.0080*** –0.0113*** αLT
αK –0.0763*** –0.0829*** –0.0034 –0.0020 αKT
αV –0.6586*** –0.5582*** 0.0084*** 0.0117*** αVT
Coefficients of unobservable factor –0.0946*** –0.0818*** αAA
α0M 0.1736*** 0.1306*** 0.0110 0.0037 αLL
αMM 0.0336*** 0.0135*** –0.0232 0.0099 αKK
αTM 0.0091*** 0.0063*** 0.0014 –0.0155 αVV
αYM –0.0360*** –0.0224*** 0.1007*** 0.0812*** αAL
αAM –0.0268*** –0.0234*** –0.0718*** –0.0703*** αAK
αLM –0.0324*** –0.0103* 0.0600*** 0.0680*** αAV
αKM 0.0305*** 0.0169*** 0.0083 –0.0184 αLK
αVM 0.0293*** 0.0154 –0.0826*** –0.0462** αLV
Mean coefficients 0.0324*** 0.0345** αKV
ψT_bar –0.0926 0.0480*** 0.0515*** αYA
ψY_bar 0.1844*** –0.0017 –0.0250*** αYL
ψA_bar 0.6841*** 0.0151** 0.0140** αYK
ψL_bar 1.7102*** –0.0358*** 0.0316*** αYV
ψK_bar 0.3445***
ψV_bar –2.8563***
Source: Own estimates. Notes: *, **, *** Denote significance at 0.1, 0.05 and 0.01 level, respectively. No. of observations:
3,440. Moreover, the means of the random parameter estimates are consistent with empirical observations. Animal production contributed slightly more to total agricultural output than crop production. Variable costs accounted for about 60 % of total production costs. Summarising the values of αh, with h = A, L, K, V, states that the scale elasticity is approximately -1.09, i.e., indicating slightly increasing economies of scale. The value is comparable to other analysis of Polish agricultural production (LATRUFFE et al., 2005). The coefficient estimates of the unobservable factor mi have the same structure in both approaches. In addition, the estimated coefficients are also rather similar. Consistent with theory, both models state that the higher the factor is, the higher is the output, i.e., technical efficiency (α0M > 0, αMM > 0). The results indicate

Agricultural economics and transition 152
that technological change has improved productivity of the unobserved factor (αTM > 0). In addition, the unobserved component leads to a decrease of production elasticities and partial factor productivities of land and labour (αAM < 0, αLM < 0), while it has a positive impact on capital and intermediate inputs. The coefficients related to m provide information regarding the impact of the various inputs on efficiency (see Eq. (5)). Since (m – m*) > 0 . Thus, efficiency decreases with an increase of capital and intermediate inputs. On the contrary, labour and land inputs as well as the share of animal production have a positive impact on efficiency. In addition, there is indication that the variation of efficiency increased over time (αTM > 0) suggesting that falling apart instead of catching up processes are typical in Polish agriculture. Considering the possibility of a correlation between the observed and unobserved inputs does not result in structurally different parameter estimates. The parameter estimates of ψ are highly significant and suggest that the unobserved component is positively correlated with farm size: mi becomes higher as the input of land, labour and capital increases. Only variable costs have a negative impact on the unobserved component. Moreover, since mi is an artificial variable, without a direct impact on input levels, the possible correlation of observable and unobservable inputs can be regarded as a minor problem.
4 CONCLUSIONS In this paper, we applied the approach of ÁLVAREZ et al. (2003; 2004) in order to account for farm heterogeneity while exploring the farms’ (in)efficiency. The approach utilizes a translog function and treats an unobserved farm-specific component as a random variable. The resulting econometric model is estimated as a stochastic production frontier with random coefficients (RPM). The applied approach provides new insights into efficiency analysis in general, and efficiency problems faced by the Polish farms in particular. Our analysis has some important implications. As expected, the unobserved component model provides lower efficiency scores than the alternative approaches, such as the random or the fixed-effect model. Since the statistical properties of the RPM favour this model, our assertion that standard SFA overestimates efficiency is confirmed. At the same time, the results indicate the existence of a fifth significant, unobser-vable production factor besides land, capital, labour and intermediate inputs. ÁLVAREZ et al. (2004) consider this input to be managerial ability, which influences technical efficiency directly (as a farm-specific input), and indirectly (as a function) since it influences the use of other observable inputs.

Country transition experience 153
REFERENCES ÁLVAREZ, A., ARIAS, C., GREENE, W. (2003): Fixed management and time invariant technical efficiency in a random coefficient model. Working Paper, Department of Economics, Stern School of Business, New York University.
ÁLVAREZ, A., ARIAS, C., GREENE, W. (2004): Accounting for unobservables in production models: Management and inefficiency. Economic Working Papers at Centro de Estudios Andaluces E2004/72, Centro de Estudios Andaluces.
BAKUCS, L. Z., LATRUFFE, L., FERTŐ, I., FOGARASI, J. (2006): Technical Efficiency of Hungarian farms before and after accession. Paper prepared for presentation at "Transition in Agriculture – Agricultural Economics in Transition III" conference, Budapest, November 10-11, 2006.
BRÜMMER, B., GLAUBEN, T., THIJSSEN, G. (2002): Decompositiion of Productivity Growth using Distance Function: The Case of Dairy Farms in Three European Countries. American Journal of Agricultural Economics, 84(3), pp. 628-644.
CHAMBERLAIN, G. (1984): Panel Data. In: GRILICHAS, Z., INTRILIGATOR, M. (eds): Handbook of Econometrics. North Holland, Amsterdam.
GUS (var. issues a): Statistical Yearbook of the Republic of Poland. Central Statistical Office of Poland, Warszawa.
GUS (var. issues b): Statistical Yearbook of the Polish Agriculture. Central Statistical Office of Poland, Warszawa.
JONDROW, J., LOVELL, K. C. A., MATEROV, I., SCHMIDT, P. (1982): On the Estimation of Technical Inefficiency in the Stochastic Frontier Production Function Model. Journal of Econometrics, 19(2/3), pp. 233-238.
LATRUFFE, L., BALCOMBE, K., DAVIDOVA, S., ZAWALINSKA, K. (2004): Determinants of technical efficiency of crop and livestock farms in Poland. Applied Economics, 36, pp. 1255-1263.
LATRUFFE, L., BALCOMBE, K., DAVIDOVA, S., ZAWALINSKA, K. (2005): Technical and scale efficiency of crop and livestock farms in Poland: Does specialization matter? Agricultural Economics, 32, pp. 281-296.
MUNROE, D. (2001): Economic Efficiency in Polish Peasant Farming: An International Perspective. Regional Studies, 35(5), pp. 461-471.
TRANSFORMATIONAL CRISIS, TRANSFORMATIONAL DEPRESSION IN THE AGRICULTURE – THE HUNGARIAN CASE
PÉTER HALMAI, VIKTÓRIA VÁSÁRY
Institute of European Studies, Szent István University, 1143 Budapest, Ida utca 2.
INTRODUCTION The development of national economy and agricultural performance has been characterized similarly in the Central-Eastern European region in the past one and half decades. The social-economic transition in each of the post-socialist countries caused the decline of economic performance. At the beginning of the 1990s the efficiency and structural problems accumulated came to the surface. Economic relations within countries and among countries were disarranged. Decreasing real income, increasing unemployment and the fall in consumption, the cessation of COMECON had a negative impact on economic situations. The gap between the level of development in Eastern Europe and that in Western Europe became deeper. The overall transformational crisis covered more or less all the sectors of the national economies. Following the economic stability, however, the situation changed. While industry and services sectors have been increasingly growing following the drastic decrease in output, employment and investment, agriculture has permanently remained in depressive stage. Economic transformation regarding the agriculture has resulted in drastic changes in all of the CEE countries.
MATERIAL AND METHODS Our research focused on the past one and half decades. We made a review on the comprehensive experiences of the countries in transition by means of statistical methods. The basis is the examination of the development of the Hungarian agriculture. Besides the quantitative analysis of the main aspects of the national economy and the important sectors some qualitative and structural analysises were carried out as well. The analysis of documents and the literature helps us to open up the results of the transition of agriculture and to describe the processes of the EU-adaptation to be expected.

Country transition experience
155
1 ECONOMICS OF THE TRANSFORMATIONAL RECESSION In the field of economics the process of the transformational recession was analyzed and specified by János Kornai. According to him the transformational recession can be characterized by certain common features: (1) All post-socialist countries suffered grave economic recession during
transformation despite different economic policies – be it either orthodox planned economic or reform economic policy.
(2) There are general factors inducing the recession: – Switch from sellers’ market toward buyers’ market. (Using Kornai’s words:
Switch from supply constraint to demand constraint) – Liberalization of the price-system and the external trade involved the drastic
transformation of the real prices and the real structure of the economy. The share of the agriculture and the industry in the output and even their absolute volume fell significantly. Simultaneously with the change in the structure of the products and the sectoral structure the ownership-relations and the share of large- and small-scale companies changed as well.
– Disruption in coordination. Bureaucratic coordination was replaced gradually by market coordination. But by the time the mechanism of the old coordination had fallen apart the new coordination was not able to work yet. According to Kornai the lack of coordination, the anarchy and the collapse hindered the development of the economic activity.
– The backwardness of the financial sector caused excessive friction and thus bad efficiency. Transformation resulted in contraction of macro-demand (investment, consumption, government spending, and exports). The contrac-tion of macro-demand was even greater due to the succession of government mistakes.
(3) The stabilization of economies in transformation was followed by creation of a transition path.
(4) The transformational recession was an overall process in the national economies, but its interpretation was possible at sector level as well.
By the middle of the 1990s most of the countries had overcome the most difficult years of the crisis. The market economy operated more or less. The structure of production was rearranged. The importance of producing sectors decreased. The service sector, however, started to grow rapidly. From 2001 to 2005 the economies developed in a balanced way in the CEECs. All of the post-socialist counties increased their performance. The growth rate was higher than that in the EU-15.

Agricultural economics and transition
156
The GDP per capita (based on PPP) in 2005 was closer to the average of the EU-15 than in the preceding one and half decades (Table 3.16). Table 3.16: Volumenindex of GDP and GDP per capita
1990 1995 2000 2005 GDP volume index, 1990 = 100,0 %
Bulgaria 100.0 84.5 81.1 103.1 Czech Republic 100.0 95.3 102.4 122.4 Estonia 100.0 69.5 93.6 139.2 1990 1995 2000 2005 GDP volume index, 1990 = 100.0 % Poland 100.0 111.5 145.0 167.7 Latvia 100.0 53.3 70.2 103.5 Romania 100.0 89.8 84.1 111.0 Slovakia 100.0 96.2 116.1 145.3 GDP per capita, EUR (based on purchase power parity) Bulgaria 5,500 4,700 5,300 7,500 Czech Republic 9,700 10,600 13,000 17,100 Estonia 6400* 5,200 8,500 14,100 Poland 4,600 6,300 9,400 11,700 Latvia 7,400 4,500 7,100 11,100 Romania 5,700 5,700 5,000 8,100 Slovakia 7,700 6,800 9,500 12,900
Source: EUROPEAN COMMISSION. Notes: * Data from 1991.
2 TRANSFORMATIONAL RECESSION, TRANSFORMATIONAL DEPRESSION IN THE AGRICULTURE
As a result of the change in the production structure agriculture became the biggest looser. The process – the loss of share of agriculture in GDP – lasted several decades in Western-Europe, but only 2-3 years in the CEECs (Table 3.17)

Country transition experience
157
Table 3.17: The share of agriculture in GDP and employment (%) In GDP In employment
1991 1995 2005 1990 1995 2005
Bulgaria . 15.3 9.3 28.5 24.4
9.2
Czech Republic . 5.0 3.0 11.8
6.6 4.0
Estonia 10.3 8.0 4.0 21.0 10.3 5.1
Poland . 8.0 4.8 25.2 22.6 17.0
Latvia 16.0 9.0 3.8 20.0 18.5 12.5
Lithuania 13.8 11.4 5.7 25.7 23.8 14.7
Romania . 16.0 14.3 .
38.0 32.7
Slovakia 6.1 5.9 3.8 13.5
9.2 4.9 Source: EUROPEAN COMMISSION. The common features characterizing the transformational recession in the agriculture could be listed in the following way:
• The liberalization and the deregulation resulted in significant loss of markets, and declining inter-sectoral terms of trade.
• Decollectivisation and Privatization took place, but the agricultural structure remained unstable and the farm structure polarized. (partly large-scale farms and partly semi-subsistence farms functioned – MATHIJS, NOEV, 2002)
• Serious institutional problems (confusions of coordination) regarding first of all resource-markets and commercial relations in the agribusiness hampered the institutional adjustment. Besides the bargaining power of farmers was very unfavorable.
• The fall in agricultural performance (output, investments, absolute volume) was drastic.
• The extensive transformation caused the fall in the share of animal husbandry. All these processes led to a smaller contribution of agriculture to the national output. According to MARCOURS and SWINNEN (2002) the recession was caused by the institutional problems and the increase in the supports. Investments fell considerably (CSÁKI, 1994). The rate of agricultural production still differs in the old and new member states. In the CEECs the decline in the rate of agricultural production was caused not only by the rapid increase in the share of other sectors, but the decrease in the volume of agricultural production, too. In the agriculture the transformational
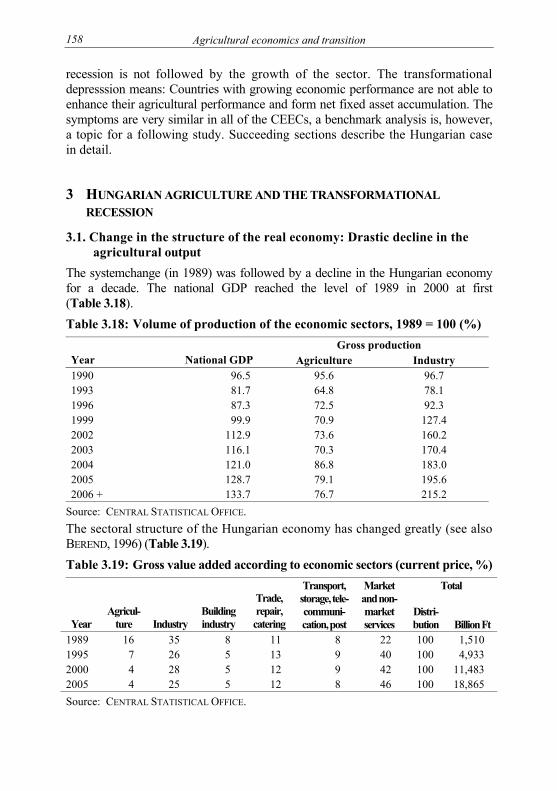
Agricultural economics and transition
158
recession is not followed by the growth of the sector. The transformational depresssion means: Countries with growing economic performance are not able to enhance their agricultural performance and form net fixed asset accumulation. The symptoms are very similar in all of the CEECs, a benchmark analysis is, however, a topic for a following study. Succeeding sections describe the Hungarian case in detail.
3 HUNGARIAN AGRICULTURE AND THE TRANSFORMATIONAL RECESSION
3.1. Change in the structure of the real economy: Drastic decline in the agricultural output
The systemchange (in 1989) was followed by a decline in the Hungarian economy for a decade. The national GDP reached the level of 1989 in 2000 at first (Table 3.18). Table 3.18: Volume of production of the economic sectors, 1989 = 100 (%)
Gross production Year National GDP Agriculture Industry 1990 96.5 95.6 96.7 1993 81.7 64.8 78.1 1996 87.3 72.5 92.3 1999 99.9 70.9 127.4 2002 112.9 73.6 160.2 2003 116.1 70.3 170.4 2004 121.0 86.8 183.0 2005 128.7 79.1 195.6 2006 + 133.7 76.7 215.2
Source: CENTRAL STATISTICAL OFFICE. The sectoral structure of the Hungarian economy has changed greatly (see also BEREND, 1996) (Table 3.19). Table 3.19: Gross value added according to economic sectors (current price, %)
Total
Year Agricul-
ture Industry Building industry
Trade, repair,
catering
Transport, storage, tele-communi-cation, post
Market and non-market services
Distri-bution Billion Ft
1989 16 35 8 11 8 22 100 1,510 1995 7 26 5 13 9 40 100 4,933 2000 4 28 5 12 9 42 100 11,483 2005 4 25 5 12 8 46 100 18,865 Source: CENTRAL STATISTICAL OFFICE.

Country transition experience
159
The decrease in the national agricultural output caused a long-lasting crisis. Actually the latent crisis of the Hungarian agriculture has already started in the early 80’s. The share of agriculture regarding the GDP production had fallen under the one third of the previous level. It is remarkable how low the contribution of the agriculture is to the employment, the export and the investments (see Table 3.20). Table 3.20: Share of agriculture
Share of agriculture (%) in GDP-
production¹ consumption¹´² export investment¹´³ employment
Balance of trade (billion
Ft) 1990 12.5 37.0 24.9 8.7 17.0 104.1 1993 5.8 28.7 22.4 3.1 9.3 109.4 1996 5.8 27.3 21.0 3.4 8.3 276.8 1999 4.2 26.2 9.2 3.3 7.1 313.9 2002 3.5 29.9 7.8 3.9 6.2 352.4 2003 4.0 … 7.5 … 5.5 346.4 2004 4.1 … 6.9 3.9 5.3 239.4 Source: CENTRAL STATISTICAL OFFICE, KSH. Notes: 1 At current prices, 2 Included food-products, 3 Investments of agricultural organizations
until 2002. As of 2003 data of the agricultural system of accounts.
3.2 Extensive change in the production structure The spectacular change in the production structure was caused by significant decrease (almost 10 percentage point) in the share of animal husbandry. The development of the two main sectors rather differed (even after year 2000) (Tables 3.21–3.22). Table 3.21: Volume index of the main sectors, 1989 = 100, (%)
Year Plant production
Animal husbandry Year Plant
production Animal
husbandry 1990 91.0 100.0 1998 73.5 66.3 1993 62.6 66.3 2001 84.9 66.8 1996 77.1 66.8 2004 109.6 58.0
2006 + 91.0 58.0 Source: CENTRAL STATISTICAL OFFICE. Table 3.22: Distortion of the production structure – Switch towards extensive
farming 1998 1999 2000 2001 2002 2003 2004 Plant production 51.4 55.8 51.4 49.9 50.7 56.1 64.0 Animal husbandry 48.6 44.2 48.6 50.1 49.3 43.9 36.0 Agricultural products in total 100.0 100.0 100.0 100.0 100.0 100.0 100.0
Source: CENTRAL STATISTICAL OFFICE.

Agricultural economics and transition
160
3.3 Institutional problems There are crucial institutional problems – confusions of coordination (resource-markets, commercial relations in the agribusiness), the institutional criteria of the adaptation are not fulfilled, market power of the farmers is weak. The landownership came apart, partly people not living on agriculture got land. (The change in the structure was often driven by political aspects and restitution as a historical adjustment.) Long-lasting uncertainty developed regarding property- and land-structure (e.g. the matters of the shares of co-operatives or the undivided common landed property were still unsettled in the early 2000s). Transition to market economy was characterized by lack of the necessary institutions for a long time that resulted in long-lived market failures, both surpluses and not used market capacities being present. The institutional problems caused unfavorable agricultural income situation, also the decreasing output could have been maintained by using up a considerable part of the capital. The land-structure is polarized. In the number of enterprises dominate the small-scale farms, but in the land-use there are more large-scale farms. The modern fixed instruments of production were missing on the small-scale farms and as a result of isolated production and distribution these reacted sensitively to the market-effects. The transitional processes were not transparent, some shade-mechanisms were to discover and the real transition was followed only partly by the agricultural informational systems.
3.4 Strengthening demand constraint During the first years of the transformation real incomes fall. The ratio of food consumption moderated as well. The per capita food consumption in Hungary was in 2000 by 10 % less than a decade ago. The collapse of the former COMECON – among former export-markets – resulted in great loss of certain possibilities. The volume of the export fell significantly during the first years of the transformation (in 1994 to the 76 % of the volume of 1989). The volume of the import grew at the same time (by 1994 by 47 % compared to the volume of 1989). Later – from 1997 – the volume of the export reached and even exceeded the former level. But in the meantime the volume of the import almost tripled. That is: Very strict demand constraint came into being and competition intensified for the Hungarian agriculture both at the inner and the external markets.
3.5 Considerable worsening of the sectoral terms of trade During the first years of the transition the ratio of prices shaped particularly unfavorable. The gap between prices of agricultural and industrial products became larger until 2006. In relation to the worsening sectoral terms of trade the agricul-tural income disparities grew and the investments fell.

Country transition experience
161
4 TRANSFORMATIONAL DEPRESSION IN THE HUNGARIAN AGRICULTURE
Following the transformational depression, the comprehensive stabilization of the macro-economy (1995-1996) the Hungarian economy was again on growth path. Until the beginning of 2000s the GDP growth was over 4 % per year accompanied by improving indicators of equilibrium. After 2000 the important features of this path changed (we cannot go into details in this study), the Hungarian economy has, however, stayed on the growth path. Although the Hungarian economy has been growing since 1996 the transformational crisis and the long-lasting depression has remained in the agriculture. At the beginning of the 1990s the agricultural decline was part of the overall crisis of the economy. From the second half of the 1990s the depression is specific only for the agriculture, specific in a strengthening economic environment. The agricultural policy was not able to reach a genuine solution regarding the transformational crisis and depression, and the structural problems of the agriculture. The structural changes taking an unfavorable direction, the polarization proceeded as some kind of "drift". A comprehensive concept dealing with important questions hasn’t been carried out, yet. The agricultural policy has been able neither to manage the transformational crisis, the structural problems emerging in the agriculture nor to take stock of the economic and social political connections of the agriculture in a wider sense and to build these connections into its goal- and tool-system. Main features of the transformational depression are in Hungary: Low agricultural productivity. The annual working unit (520 thousands AWU in 2005) producing the characteristically and essentially stagnating output approaches the values of Germany. The German agricultural output is, though, more than six times higher than the Hungarian value. In spite of the fact that the number of the Hungarian AWU might be overestimated the low productivity counts as a central problem of the transition. It is based on the already mentioned fundamental structural distortions. Investments keep declining. In spite of the increasing amount of support in the process of adaptation and the registered income growth, after accession the level of investments has dropped. The net accumulation in agriculture has been negative again since 2004. The more than 25 years of consuming our capital reserves has been continuing even after the country’s accession to the EU (Tables 3.23-3.24).

Agricultural economics and transition
162
Table 3.23: Gross and net fixed asset accumulation (at current price, billion HUF) – Disinvestment continues
Gross fixed asset accumulation
Depreciation Net fixed asset accumulation
1998 122.8 92.9 -1.8 1999 132.9 101.4 -1.3 2000 148.3 146.3 -29.0 2001 200.0 155.3 +3.2 2002 209.9 162.2 +18.0 2003 226.9 166.2 +33.7 2004 163.9 182.6 -47.7 2005 188.0 188.0 -28.6
Source: CENTRAL STATISTICAL OFFICE.
Table 3.24: Net fixed assets accumulation and capital transfer Billion HUF 1998 1999 2000 2001 2002 2003 2004 2005 Net fixed assets accumulation
-1.8 -1.3 -29.0 3,2 18.0 34.0 -48.0 -29.0
Capital-transfer 34.0 24.0 28.0 62.0 121.0 78.0 42.0 61.0 Source: CENTRAL STATISTICAL OFFICE (2002a) and own calculations. Unfavorable competitiveness. In relation to the above mentioned problems – especially to the institutional constraints of the adaptation – the competitiveness of the Hungarian agriculture has become unfavorable. On the one hand (also due to the declining external protection) the growing competitive import in the inner market limits the national production. On the other hand the competitiveness of the export products is low. The net export is declining (Table 3.25). Table 3.25: Hungarian agricultural balance of trade (billion HUF) 2003 2004 2005 2006 EU-15 147 79 30 0 EU-9 28 4 -24 -18 EU-24 175 83 6 -18
Source: Own calculation. A particularly big challenge is caused by the real appreciation connected also with the Balassa-Samuelson effect that strongly brings to the surface the competitiveness problems of sectors with low productivity.

Country transition experience
163
Table 3.26: Shares of agricultural export Percentage share of
the total exports Per hectare of
utilized arable land (1000EUR/ha)
Per agricultural work-unit (1000
EUR/AWU) Belgium 8.2 14.5 310 Denmark 18.5 4.3 154 France 10.0 1.2 10 Ireland 8.4 1.6 64 Netherlands 13.6 20.2 242 Hungary 5.7 0.4 4
Source: Own calculation. Unexploited possibilities. Parallel to the structural problems, the low competiti-veness significant potential resources and potential market possibilities stay unused. Data of Table 3.26 show that either the share of agriculture in the total export or the export performance per hectare of utilized arable land or per agricultural work-unit are far less than the values in the EU-15. Long-lasting depression. The stagnation that followed the transformational decline has been lasting for more than a decade. As the structural efficiency problems (serving as a basis for the stagnation) still exist – and it is a complex task to overcome them – the situation might last. Depression and EU-adaptation. The EU-adaptation opens up basically new possibilities for the new Member States. It might offer chances to overcome the transformational depression. But the realization of this possibility is not automatic. Basic parts of the reality at the moment are the challenge of growing competitive-ness, the continuous capital deterioration, lack of net fixed assets accumulation – against the introduction of direct payments, the declining net export, the farming getting more and more extensive.
5 CONCLUSION Using the expression "transformational recession" invented by János Kornai and used for the whole national economy the paper defined the common characteristics of this transformational crisis evolved in the countries concerned and interpreted this expression in sector approach just as developed it further in consideration of agriculture. All the internal structural problems of the Hungarian agriculture and the unsolved questions of the transformation crisis and depression have been brought to the surface by the EU-accession. The handling of the problems is a task not only for the sector’s policy but the whole economy and the social policy as well. The long-term national agricultural programme and the national support schemes should help the promotion of a competitive, sustainable system. Among others it is to mention that: The institutional conditions for the adaptation could be

Agricultural economics and transition
164
improved. The national interests need to be protected in an efficient and professio-nally well-founded way in the institutions of the EU. Furthermore, one should handle the followings as a challenge for the agricultural and rural policy due to the fact that the adaptation hasn’t been able to solve the problems of the depression automatically: (1) Up till now the agricultural policy was only capable of a surface treatment. (2) There is definitely no chance to reach the former production level (level of the 80s). (3) There is, however, need for structural transformation. Competitiveness has to be enhanced. Change in productivity is required. (4) The agricultural policy has to focus on the structural transformation (5) Besides the net fixed asset accumulation could be regarded as an important prerequisite in order to overcome the depression.
REFERENCES BEREND, I. (1996): Transformation and structural change: Central and Eastern Europe's post-Communist adjustment in historical perspective, pp. 1-27. src-h.slav.hokudai.ac.jp/sympo/ 96summer/berend.pdf/. COLMAN, D., FRANKS, J. (1999): Agriculture. In: ATKINSON et al. (1999). CSÁKI, CS. (1994): Investment Priorities in Central and Eastern European Agriculture. In: SILVIS (ed.) (1994), pp. 64-78. ELEKES, A. (2004): Agricultural and Rural Development in the Light of EU Support Schemes – Opportunities and Threats. Development and Finance, No. 2, pp. 32-41. EUROPEAN COMMISSION (2006): Agriculture in the European Union – Statistical and Economic Information 2005. Brussels. HALMAI, P. (2006): Integration of the Hungarian Agro-economy into the EU. Development and Finance, No. 2, pp. 32-41. HALMAI, P. (2007): Common agricultural policy, common budget? Public Finance Quarterly. 52(1), pp. 92-105. HALMAI, P. (2004): A reform ökonómiája. KJK-Kerszöv, Budapest. KOVÁCS, K., SWAIN, N.: Agricultural Politics and the ‘Peasant Revolt’ in Hungary, University of Liverpool, Centre for Central and Eastern European Studies, Working Paper No 46, Rural Transition Series. MATHIJS, E., NOEV, N. (2002): Commercialization and Subsistence in Transition Agriculture: Empirical Evidence from Albania, Bulgaria, Hungary and Romania. EAAE-Congress, Zaragoza. SIPOS, A., HALMAI, P. (1993): Contemporary agricultural problems [Jelenkori agrárproblémák]. In: Hungarian Science [Magyar Tudomány], 38(2), pp. 121-135. SIPOS, A., HALMAI, P. (1991): Alternatives and dilemmas regarding the goals of the agriculturural policy. In: Reality [Valóság], No. 9. SWINNEN, J. F. M. (ed.) (1997): Political Economy of Agrarian Reform in Central and Eastern Europe. Ashgate. TANGERMANN, S., BANSE, M. (eds) (2000): Central and Eastern European Agriculture in an Expanding European Union. CAB International, New York, Wellingford. VÁSÁRY, V. (2006): Institutional adaptation of the Common Agricultural Policy – The case of the Paying Agency. Development and Finance, No. 1.

THE MAIN BOTTLENECKS OF THE RURAL KNOWLEDGE TRANSFER IN ROMANIA3
MARIA VINCZEA, ANDREA KÖLCSEYB a professor, PhD, Babeş-Bolyai University, Faculty of Economics and Business
Administration, Cluj-Napoca, Romania. Mailing adress: str. Teodor Mihali, nr. 58-60, 400591 Cluj-Napoca, code 4005 Romania. E-mail: [email protected]
b PhD student, Babeş-Bolyai University, Faculty of Economics and Business Administration, Cluj-Napoca, Romania. Mailing adress: str. Teodor Mihali, nr. 58-60, 400591 Cluj-Napoca,
code 4005 Romania. E-mail: [email protected]
1 INTRODUCTION Romania as New Member State prepared his national rural development strategy for 2007-2013 on the basis of the community strategic guidelines, proposing the allocation of the financial means of the EAFRD as following: • improving the competitiveness of the agricultural and forestry sectors (45 %); • improving the environment and countryside (25 %); • improving the quality of life in rural areas and encouraging diversification
(30 %); • building local capacity for employment and diversification (2.5 %). The new rural development policy provides a unique opportunity to support growth, jobs and sustainability in rural areas and it is important to use efficiently this possibility. In our study we will attempt to have an ex ante evaluation of know-ledge transfer in the Romanian rural areas formulated in the National Strategy Plan for Rural Development 2007-2013 (MAPDR, 2007) of the measures "Training, information and diffusion of knowledge" and "Provision of farm advisory and extension services in agriculture". We try to verify quantified targets for outputs and results in relation to the baseline situation, making a qualitative assessment in general terms, emphasising the main bottlenecks of knowledge-based rural
3 Acknowledgement: This paper contains part of the deliverables from the project No.
513705 "CEEC AGRI POLICY", which has been awarded financial support by the European Commission under the 6th Framework Programme. More detailed information on the project can be found at www.agripolicy.net.

Agricultural economics and transition
166
society and economy in Romania. The main problem for Romania is how to reach the target situation from the present starting point (SWAIN, VINCZE, 2001).
2 GENERAL ASPECTS OF ROMANIAN RURAL ECONOMY The Romanian rural areas, defined by the national legislation as areas belonging to communes and to the periurban areas of towns and cities, cover 87.1 % of the area, and 45.1 % of the population, about 9.7 million inhabitants live here. For the comparison of the Romanian and EU-average rural situation we used the OECD definition of rural areas. The figures of the next two tables put in evidence some similarity, but in the same time significant differences too. Table 3.27: The characteristics of the rural areas, by EU-average and
Romania, 2004 EU-27 (EU-15) Romania The share of rural territory* 92.7 % (84.4 %) 99 % The share of rural population* – predominantly – significantly
20.5 % (9.7 %)
37.8 % (37.4 %)
47.0 % 43.6 %
Gross value added generated in rural areas*
45 % 80.9 %
The share of rural employment* 53.3 % 90.3 % Age structure Farmers <35/>55 years old
Ageing 0.16 (0.12)
Ageing 0.14
Gender "Masculinisation" Out-migration of younger women
"Masculinisation" Out-migration of younger
women Employment rate 60.1 %
Lower as urban 53.0 %**
Higher as urban Unemployment rate – youth (15-24 years old)
10 % Higher as urban
17.6 %
5.2 %** Lower as urban
13.9 %** Hidden unemployment High Very high Source: COM(2006)857 final, Brussels, Employment in rural areas: Closing the jobs gap.
Labour Force in Romania: Employment and Unemployment, 2006, NIS, Bucharest. Notes: * OECD definition of rural areas; ** Romanian definition of rural areas in 2005, The common trends and differences of demographic change in EU-25 and Romania can be described as follows: • "urbanisation" trend: Drawing younger and skilled population and economic
activity out of more remote rural areas into urban and accessible rural areas (EU-25, Ro)
• "counter-urbanisation" trend: Flow out of urban areas into rural areas

Country transition experience
167
– in accessible rural areas, with ICT infrastructure (EU-25, Ro) – in remote rural areas too, with lower life cost (Ro)
• "circulatory migration": In the last decades the trans-border seasonal ("come-and-go") commuters of the younger labour force from the rural areas to abroad (to the western European countries) created a new social and economic problem. The circulatory migration for work abroad of rural inhabitants is considered to have a favourable impact on the living standard in rural areas but only on short term, because most of these persons invest their earnings in household durables. Very few invest their earnings to set up a business. The financial resource transfers to the country, the changes in mentality and the increases of interest for the technical progresses are positive impacts, but there are a lot of negative impacts for the medium- and long run, mainly for the youngest generation (DUMITRU et al., 2004).
Table 3.28: The main differences in the structure of the economy in the rural areas of the EU and Romania, 2004
EU-27 (EU-15) Romania Employment in primary/ secondary/ tertiary sector, %
6.8 / 26.4 / 66.8 (3.9 / 25.3 / 70.8)
64.2 / 18.7 / 17.1
The sectors as % of total GVA
2.2 / 26.7 / 71.1
(2.1 / 26.4 / 71.5)
14.1 / 34.3 / 51.6
Source: Rural Development in the European Union – Statistical and Economic Information – EC Report 2006, Brussels; Planul Naţional Strategic de Dezvoltare Rurală 2007-2013, July 2007, MAPDR, Bucharest.
The structure of the economy in the rural areas is characteristically different in Romania compared to the EU-average. Romania’s rural economy is dominated by agriculture with low productivity. The predominant feature of the Romanian agriculture is the high share of subsistence farms, mainly producing for their own consumption and only marginally for the market (GENERAL AGRICULTURAL CENSUS, 2002). Because of the domination of this form of agriculture the rural economy remains poorly integrated into the market economy. Subsistence farms hardly have other income sources and as a consequence the well being of rural population depends mainly on the farming profitability. The fact that on the one hand Romania’s rural economy is characterised by agriculture which predominant feature is the high share of subsistence farms (about 94 % of holdings are smaller than 5 ha), and on the other hand about 47 % of the UAA are in farms over 100 ha managed by specialists, imposes a complex approach of the Romanian rural knowledge transfer, and mainly of the training problem.
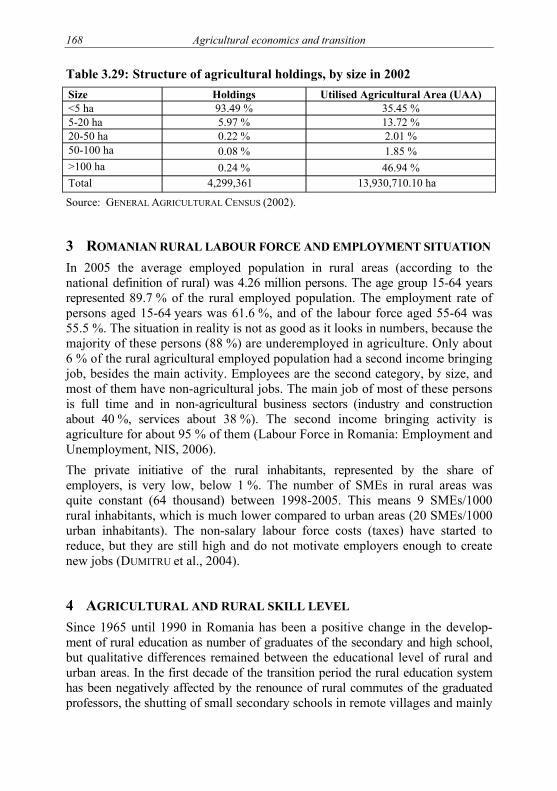
Agricultural economics and transition
168
Table 3.29: Structure of agricultural holdings, by size in 2002 Size Holdings Utilised Agricultural Area (UAA) <5 ha 93.49 % 35.45 % 5-20 ha 5.97 % 13.72 % 20-50 ha 0.22 % 2.01 % 50-100 ha 0.08 % 1.85 % >100 ha 0.24 % 46.94 % Total 4,299,361 13,930,710.10 ha
Source: GENERAL AGRICULTURAL CENSUS (2002).
3 ROMANIAN RURAL LABOUR FORCE AND EMPLOYMENT SITUATION In 2005 the average employed population in rural areas (according to the national definition of rural) was 4.26 million persons. The age group 15-64 years represented 89.7 % of the rural employed population. The employment rate of persons aged 15-64 years was 61.6 %, and of the labour force aged 55-64 was 55.5 %. The situation in reality is not as good as it looks in numbers, because the majority of these persons (88 %) are underemployed in agriculture. Only about 6 % of the rural agricultural employed population had a second income bringing job, besides the main activity. Employees are the second category, by size, and most of them have non-agricultural jobs. The main job of most of these persons is full time and in non-agricultural business sectors (industry and construction about 40 %, services about 38 %). The second income bringing activity is agriculture for about 95 % of them (Labour Force in Romania: Employment and Unemployment, NIS, 2006). The private initiative of the rural inhabitants, represented by the share of employers, is very low, below 1 %. The number of SMEs in rural areas was quite constant (64 thousand) between 1998-2005. This means 9 SMEs/1000 rural inhabitants, which is much lower compared to urban areas (20 SMEs/1000 urban inhabitants). The non-salary labour force costs (taxes) have started to reduce, but they are still high and do not motivate employers enough to create new jobs (DUMITRU et al., 2004).
4 AGRICULTURAL AND RURAL SKILL LEVEL Since 1965 until 1990 in Romania has been a positive change in the develop-ment of rural education as number of graduates of the secondary and high school, but qualitative differences remained between the educational level of rural and urban areas. In the first decade of the transition period the rural education system has been negatively affected by the renounce of rural commutes of the graduated professors, the shutting of small secondary schools in remote villages and mainly

Country transition experience
169
by the lack of interest for learning of the rural children and their families. The relatively young age group do not see the future in farming on only a few hectares, thus they try to find a job in towns or abroad. In the last years the interest for vocational education increased again, because this is an advantage for finding a job abroad. As in most communes and villages only primary and secondary education is available, and the cost of qualification in urban areas became relatively high, a bigger share of the young people (15-24 years) are lower educated than their parents (ROMANIAN STATISTICAL YEARBOOK, 2004). The majority of the people involved in agricultural production, on small farm level, have no training and education in this field, and they lack of managerial and business skills. The education system can not face yet the challenges requested in order to diversify the rural economy (DUMITRU, M. et al., 2004). As a consequence regarding vocational, apprenticeship, post high school and foremen education approximately one third of the young school aged population living in rural areas has no access to it, which represents a risk for the human capital development in rural areas for the future. Nevertheless there is an increasing trend in the number of students enrolled in universities, both in the urban and rural areas instead of vocational and post high schools. Having the above mentioned under consideration we can conclude that knowledge improvement has to be linked with real changes in the Romanian rural areas. This way the actions necessary to bring changes in the labour force in the Romanian rural areas have to be targeted on reduction of employment in agriculture and increase of employment in the tertiary sector. Growth of labour productivity in agriculture is also an issue of main importance which has to be made by modernisation of farms by restructuring physical potential, promoting innovation and knowledge, and improving human potential (GIURCA, 2004). This implies putting accent on developing new skills for those who plan to work temporarily abroad (especially foreign languages) and for those who plan to enter a new occupation in their home village or neighbouring communes or towns. There have to be assured accessible opportunities for vocational training and lifelong learning for adults, as well as professional training for persons working in agricul-ture and/or forestry. The rural development measures of knowledge transfer have to complement the necessary changes in educational and training level in rural areas.

Agricultural economics and transition
170
5 MEASURES FOR KNOWLEDGE TRANSFER IN THE ROMANIAN RURAL DEVELOPMENT STRATEGY FOR 2007-2013
The Romanian rural development measures for professional training for 2007-2013 include (MAPDR, 2007):
• Vocational training activities – aim to increase competitiveness and diversify-cation of agricultural and forestry activities and products, as well as to achieve the objectives regarding sustainable land management and environment protec-tion by using technologies which are friendly to the environment and renewable energies.
• Agricultural and forestry advisory services – the support granted by this measure will increase the level of knowledge, information and education of people engaged in agricultural, forestry and food sectors.
As the knowledge supply capacity has to be very complex the activities of vocational training, information and diffusion of knowledge shall further target (MAPDR, 2007):
• he improvement of general and specific economic knowledge in the fields of agriculture and forestry;
• the general training for farm management and administration;
• observing the cross-compliance conditions and of Common Agricultural Policy Standards, diversification or restructuring of farm production (bringing new products and processing systems);
• promotion and observance of quality standards and environment conditions;
• education and awareness of forest holders targeting the sustainable management of forests alongside the efficient use of forest resources.
The adjustments assured by the rural development measures will increase the level of knowledge and information only for people engaged in agricultural, forestry and food sectors. The Romanian rural areas have to target the creation of new employment opportunities on the farm (e.g. first-processing sector), combination of part time farm employment with off-farm employment, job creation and diversification into non-agricultural activities. The comparison between the real needs of the Romanian rural areas and the supply of the rural development measures put in evidence that rural training measures meet only partially the real requirements of rural areas. The knowledge transfer needed by the rural population is underdeve-loped and hard to be accessed. The territorial labour force offices fund some training for non-agricultural activities, but information related to them get hardly to the young people living in rural areas, while in other cases costs have a decisive

Country transition experience
171
role too. So is necessary to complement the rural development measures of knowledge transfer with other human development measures to satisfy the real needs of rural areas. The present knowledge transfer measures of the Romanian Rural Development Programme 2007-2013 can be evaluated not only by fitness for needs, but by feasibility and by administrative dimension of the absorption capacity. Between 1998-2005 the National Agricultural Consultancy Agency (NACA) organized trainings for 35,538 people and the Training and Innovation Centre for Development in the Carpathians for 2,288 people. Measure no. 111 "Training, information and diffusion of knowledge" has in view the training of 99183 persons working in agriculture and forestry. The question is whether there is real possibility to triple the number of trainings? For this measure was proposed 119,019,347 euro, for 99,183 participants, this means about 120 euro/day/participant. The real problem is who will benefit from this money? This sum of money may be sufficient for the planned number of participants but depends on how the suppliers of knowledge will use this money? The efficiency of the measure depends by the quality and conformity with the real needs of trainings and by the appropriateness for the attendees. The leaders and executives of bigger business units generally have proper profes-sional and agro-technological knowledge, but lack of economic view. They are mainly interested in up to date information referring to the local and foreign markets. In their case time is what represents an impediment in participating on trainings. They need special not common knowledge in function of their specialisa-tion in agricultural production. In the case of people working in forestry the main problems rise connected to the inadequate organization of work (primarily they are expected to prevent robberies) and not to the level of their graduation or knowledge. The majority who own forest property are old people, while the small number of young people does not look at the forest as a resource for sustainable development, but as a tool for short term enrichment. The above short and brief enumeration shows the need for a good organization regarding the needs of rural population for the transfer of knowledge. Another important aspect is connected to measure no. 141 "Support for semi-subsistence agricultural holdings". The bottlenecks could be the administrative capacity of public and private firms to assure consultancy in the elaboration of the business plans for the 95 thousands small semi-subsistence farms. We appreciate the public money to be sufficient (about 600 million euro), but to assure real specific business plans, describing the specific needs of each farm in part will be difficult, as the elaboration of such plans needs basics, fundamental knowledge about the farms (GIURCA, 2004).

Agricultural economics and transition
172
In conclusion the main bottlenecks of the rural technology transfer in the case of Romania will be on the demand part the lack of interest of young people for agricultural knowledge and on the other part the lack of administrative capacity of trainings and consultancy services. The demand and the supply side are not in appropriate concordance.
6 SWOT ANALYSIS OF THE ROMANIAN TRAINING PROVISION AND EXTENSION AND ADVISORY SERVICES
We draw up a brief SWOT analysis for training provision and for extension and advisory services for the present situation, on the basis of the analysis made by the National Agricultural Consultancy Agency for the last period, completing with our experience in this field (NACA, 2006). Table 3.30: SWOT analysis – Training provision
Strengths Weaknesses – there is an increasing tendency in demand for
continuous professional training activity in agriculture
– diversification of agricultural fields where training is provided
– the increasing consciousness of beneficiaries intensifies the implication and participation of all training providers
– lack of continuous training programmes for adults in agriculture and rural development
– lack of specific material, logistics and of a well prepared human capital of trainers
– difficult access to external financial resources for agricultural and rural development training programmes
– lack of infrastructure in the rural areas led to increased difficulties for beneficiaries in accessing different training programmes
Opportunities Threats – accessing EU funds for improving professional
education level in agriculture and rural deve-lopment
– increasing the number of beneficiaries by organising trainings in the more remote areas as well
– increasing the involvement of universities in organising trainings in collaboration with NACA
– using the experience’s collected as a result of the cooperation with international institutions
– lack of proper infrastructure of the remote areas in order to provide trainings in communes, villages
– risk of lacking the new techniques and equipment necessary for the implementation of the practical issues of the training courses
Source: Raport – Agenţia Naţională de Consultanţă Agricolă [Report – National Agricultural Consultancy Agency-NACA], 2006.
The different EU programmes will bring future possibilities regarding the develop-ment of training process through the different trans-border collaborations, the implementation and use of the experiences of the EU to stimulate innovation. These possibilities are awaited to contribute to spread of best practices in profess-sional training. The controversial issue here would be the administrative absorption capacity, as the ability of domestic public authorities to manage the process of transferring the financial resources from EU to the final beneficiaries can be considered being low.

Country transition experience
173
Table 3.31: SWOT analysis – Extension and advisory services Strengths Weaknesses
The public sector: – Although at present it is not fully exploited, the
NACA network has the capacity to identify the needs at local level
– High demand for professional qualification of farmers
– The extension and advisory services are offered and directed according to the specific groups of beneficiaries (professional associations, farmers organisations)
The private sector: – Market oriented supply of extension and advisory
services – The dissemination of information regarding
products and technologies is made jointly with the supplier of inputs
– The personnel is specialised in elaborating studies and projects
The public sector: – Difficult and rigid communication between
consultant and beneficiary – Insufficient number of personnel specialised in
some fields, mainly in farm management and marketing
– Difficult access to informational sources (media, internet, etc.) which leads to difficulties in reaching and disseminating new technologies or practices
– No feedback to the central institutions re-sponsible for developing the agricultural policies
– Legal constraints to stimulate local consultants (at level of communes)
– Lack of a solid strategy to attract additional funds
The private sector: – So far, there are only a few private firms – Access of beneficiaries to these services is
limited, because of their limited financial resources and that the private firms are situated in highly productive areas
Opportunities Threats The public sector: – Possibilities of attracting external funds with the
reorganisation of NACA according to GO 22/27.01.2005
– The Accession to the EU creates additional possibilities and chances to Romanian farmers – access to technologies already existing in the EU
– The appearance of bigger private farms will create better possibilities for those who offer extension and advisory services, including NACA
– Formation of more powerful farmers organisat-ions, with the advantage of putting accent on offering extension and advisory services to groups
The private sector: – Growing potential of private sector and of NGOs
to take over extension and advisory services – Appearance of bigger farms will create growing
possibilities to consultancy services suppliers – Changing the education and mentality of farmers
and increasing their interest towards new techno-logies
– Accessing funds based on a project creates opportunities for the development of the sector
The public sector: – Low financial resources coming from the State
budget will continue to weaken the capacity of consultancy, especially if extension and advisory services will continue to be offered free of charge
– Lack of motivation of local advisors might determine their migration into the private sector
The private sector: – Limited financial resources at level of small and
medium sized farms – Lack of a "common language" concerning the
mentality and understanding of farmers
Source: Research study on the impact of extension and advisory services in zoo technology and agro-food industry, 2005.
Agricultural economics and transition
174
At the moment the cooperation between institutions of the educational system and private business companies is very weak. There is a gap between the types of skills of what business entities demand and the courses and programs of the educational institutions. Lack of financial funds in the public sector (travel costs to communes, publishing brochures, making up to date experiments) limits the supply of consultancy services. In Romania the private sector of extension and advisory services is predominantly linked to input supply activities that offer agricultural producers new technologies when selling their products without perceiving any additional costs. Beneficiaries of private sector consultancy services are predominantly commercial companies and agricultural associations and to a lesser extent individual farmers. Regarding the supply side the solution requires a completion of university curriculum with subjects in the field of extension. Accent should be put on a more efficient diffusion of knowledge in economic and legal fields, which should avoid the general scheme of the American books and courses; moreover it should take into consideration the Romanian reality. In the present study we put in evidence only some general aspects about the bottlenecks of knowledge transmission to rural areas in Romania and we are aware that these are very complex aspects and need more research to find optimal solution for the growth of knowledge level of the rural population.
REFERENCES DUMITRU, M., DIMINESCU, D., LAZEA, V. (2004): Rural Development and the Reform of Romanian Agriculture, European Institute of Romania, Working Paper Series, 10-11, Bucharest.
GIURCĂ, D. (2004): Adoption of the Common Agricultural Policy-pre-and post-accession impact. Agricultural Economics and Rural Development. Romanian Academy-National Institute of Economic Research-Institute of Agricultural Economics, 1(3-4), pp. 151-165.
MAPDR (2006): Planul Naţional Strategic de Dezvoltare Rurală 2007-2013 [National Strategic Plan for Rural Development 2007-2013]. Ministerul Agriculturii, Pădurilor şi Dezvoltlării Rurale, Bucureşti.
SWAIN, N., VINCZE, M. (2001): Agricultural Restructuring in Transylvania in the Post-Communist Period. In: LIGHT, D., PHINNEMORE, D. (eds): Post-Communist Romania. Coming to Terms with Transition. Palgrave Publishers.

STUDYING INVESTMENT PATTERNS IN RUSSIAN AGRICULTURE
RAUSHAN BOKUSHEVAA, IRINA BEZLEPKINAB, ALEXANDER KUPAVYCHC a Leibniz Institute of Agricultural Development in Central and Eastern Europe (IAMO),
Halle (Saale), Germany. E-mail: [email protected] b Business Economics, Wageningen University, The Netherlands.
E-mail: [email protected] c Lomonosov Moscow State University, Russia. E-mail: [email protected]
1 INTRODUCTION Empirical evidence from transition countries shows that farms’ investment activity seriously receded during the initial reform period. The decline in investments at the beginning of the transition process was caused primarily by radical changes in agricultural product and factor markets. Price liberalization and the related dete-rioration of the terms of trade led to the decline of farms’ output and consequently reduced demand for machinery and other production inputs. Initial production cuts, and thus, reduced demand for investment, were inevitable for the economic recovery of transition countries, and are in line with the Schumpeterian concept of creative destruction (SCHUMPETER, 1952). The absence of well-developed markets at the beginning of transformation caused high uncertainties concerning demand for and prices of agricultural products, which seriously affected farms’ investment. These uncertainties caused a high discount rate on their investment. Reductions in investment levels during the early transition period have inevitably caused the depletion of farms’ capital stock. Therefore, it is obvious that farms’ investment rates will exceed actual capital depreciation rates if they restart investment after a long period of under investment. Capital widening will be also necessary to incorporate technological change. Based on these facts we can conclude that there exist distinct transition-specific factors that have determined the investment behavior of firms during transition compared with those general investment models describing firms’ investment behavior in the established market economies. At the same time, as will be shown in the paper, empirical studies on farm investment behavior in transition countries extensively apply general model specifications without adjusting them to the transitional context, thereby a priori neglecting the effect of transition on firms’ investment pattern. In this paper, we discuss an alternative model specifi-cation regarding its suitability for modeling the investment behavior of farms in transition. Our empirical analysis employs the survey data from Samara and Orel

Agricultural economics and transition
176
provinces in Russia over the period 1999-2005. In analyzing evolution of invest-ment behavior in Russian agriculture during the period of economic stabilization that followed the financial crisis of 1998, we test whether the investment behavior of Russian farms may be explained by an error-correction formulation of a dynamic investment model. The paper is organized as follows. We start Section 2 by providing an overview of existing formulations of investment equation, and then reviewing the empirical studies of firm investment behavior in transition countries. The section concludes with motivating the choice of empirical model specifications. The data and estimation techniques are presented in Section 3. Section 4 presents the research findings, and conclusions can be found in Section 5.
2 MODELING INVESTMENT BEHAVIOR 2.1 Error-correction formulation of investment model When investigating firm investment behavior, empirical studies usually apply various formulations of the investment equation. In this section we omit presenting empirical specifications of most widely used specifications (accelerator model, adjustment costs model) and refer interested readers to the theoretical model descriptions in the literature (ABEL, BLANCHARD, 1986; FAZZARI et al., 1988; BOND, MEGHIR, 1994). Recently BOND et al., (1997) introduced an error-correction formulation of the investment model. The error correction model is based on the assumption that sales and capital are proportional in the long run, while in the short run, the dynamics of the relationship between these two variables may diverge from the optimal path. In this formulation of the investment equation, the relationship between desired and actual capital stock is described as an autoregressive-distributed lag of length two:
itittitiittitiit vdssskkk ++++++++= −−−− αϕϕϕγγϕ 2312122110 ,,,, , (1) where kit is the logarithm of the fixed capital value Kit for the firm i at the end of the year t, sit is the logarithm of sales Sit for the firm i in the year t. To obtain an error-corrected specification, the authors subtract ki,t-1 from both sides of the equation (1) and rewrite it as follows:
ititti
tititiittiit
vdssksskk
+++−+++++
−−++Δ++Δ+Δ−+=Δ
−
−−−−
αγγϕϕϕ
γγϕϕϕγϕ
222321
22221211110
111
,
,,,,
)())(()()( (2)
In this form of the equation, the growth rate of capital stock is a function of both growth rates and levels of information. The first three terms of the equation (2) capture the short run dynamics. The coefficients’ estimates for the last two terms

Country transition experience
177
can be used for testing error-correcting behavior and constant returns to scale in the long run, respectively. It is expected that the coefficient of the error-correcting term
122 −+= γγp shall be negative, indicating that investment is higher when capital stock is lower than its optimal level, and conversely, that investment is lower when capital is over its optimal level. The scale coefficient
)1( 22321 −++++=+= γγϕϕϕβλ p (where 321 ϕϕϕϕ ++= ) is expected to be not significantly different from zero, which implies that the long-run elasticity of capital to sales is unity. To capture effects which are associated with financial constraints of the firm, which is essential when modeling investments in transition economies, equation (2) is augmented with the current and lagged ratios of profits to the fixed capital
value 1, −ti
it
KP , where Pit is profit of the firm i in the year t. Finally, the investment
ratio1, −ti
it
KI is employed to proxy the net growth in capital itkΔ . The equation to
estimate has the following form:
ititti
ti
ti
ti
ti
itti
tititiitti
ti
ti
it
vdKP
KP
KP
s
skssKI
KI
++++++−+++++
−−++Δ++Δ+−+=
−
−
−
−
−−
−−−−
−
−
αϕϕϕγγϕϕϕ
γγϕϕϕγϕ
3
26
2
15
14222321
222212112
110
1
1
11
,
,
,
,
,,
,,,,
,
,
)(
))(()()( (3).
In this formulation, the sum of the coefficients on profits (ϕ4+ϕ5+ϕ6) is expected to be not significant if the profits variable captures only the transitory effects of financial constraints on firm investment. In the empirical work of BOND et al. (1997) cash flow variable is used as a proxy for profit. BLOOM et al. (2005) adjust the error-correction model to analyze the effect of demand shocks and uncertainty on firm investment. They argue that higher levels of uncertainty increase the real options values associated with investment and dis-investment, and thus make firms more cautious in responding to changes in their market environment. The presence of irreversibility and uncertainty causes non-linear dynamics in firms’ investment behavior with an increasing marginal investment response to larger demand shocks (BLOOM et al., 2005, p. 2). 2.2. Investment modeling in the transitional context There have been many studies which analyze industrial firms’ investment behavior in different transition economies with few of those studying farm investment (LATRUFFE, 2005; ZINYCH, ODENING, 2007). The rationale of most studies goes back to the neo-institutional theory, which explains limited access to credit primarily by the presence of information asymmetries. Supposing that financial market imperfections should be even more distinctive in a transition economy, empirical studies on firm investment behavior primarily look for evidence

Agricultural economics and transition
178
of limited access to external finance as an indicator for high transaction costs on the country’s financial markets. The earlier studies focus primarily on the impact of soft budget constraints (SBCs) by explaining differences in the investment behavior of producers (BUDINA et al., 2000; KONINGS et al., 2003). The paradox of SBCs, i.e., routine loan forgiveness (KORNAI, 2001), leads to the situation when, despite mounting debts and blocked bank accounts of indebted firms, producers continue acquiring supplies and even credits. The SBCs phenomenon is one of the socialist system’s specific attributes (KORNAI, 2001). Recent literature overview on the investment sensitivity to various financial factors and to SBCs in particular is available in RIZOV (2007). This first wave of studies on investment behavior in transition extensively employ the basic accelerator model. According to the theoretical model of investment behavior, low cash-flow-investment sensitivity in the accelerator investment equation is assumed to indicate proper access to external finance sources, but in most studies for transition countries, low cash-flow-investment sensitivity is primarily explained by the presence of soft-budget constraints in a particular category of firms. However, most authors do not proceed in dividing among what are likely different categories of unconstrained firms: Those with and without SBCs. Undermining the firms’ heterogeneity however, can induce some aggregation biases. RIZOV (2004) is the first who examines this issue by distinguishing between (a) constrained firms, (b) unconstrained firms and (c) firms with SBCs. A solid portion of the literature on investment behavior in transition countries analyzes the effect of market imperfection across different categories of firms. The literature primarily distinguishes between groups of firms by ownership type, firm size and age (GROSFELD, NIVET, 1997; LIZAL, SVEJNAR, 2002; LATRUFFE, 2004). In addition, some authors consider characteristics such as membership in financial or industrial groups (PEROTTI, GELFER, 1998) and firms’ efficiency measured by total factor productivity and technical efficiency (MAUREL, 2001). The main propositions of these studies are quite sound and suggest that in the initial period of transition state-owned firms experienced SBCs; private firms invested more and were more financially-constrained than state-owned firms; and foreign and financially-controlled firms were less constrained than other firms. However, the effect of firm size and age is not straightforward across individual studies. While LIZAL and SVEJNAR (2002) emphasize that small firms were indeed credit-rationed in the Czech Republic during from 1992 to 1998, LENSINK and STERKEN (1998) who also employed Czech manufacturing firms’ data from 1992 to 1996, found that smaller firms face relatively less cash flow restrictions. Moreover, using firm data from Hungary, Poland and the Czech Republic, BRATKOWSKI et al. (2000) revealed that growth of de novo private firms were not restricted by capital market imperfections, though according to HUTCHINSON and XAVIER (2006) de novo firms in Slovenia and Belgium are the most reliant on internal cash-flow.

Country transition experience
179
In recent years, many studies have employed a dynamic formulation of invest-ment model. LIZAL and SVEJNAR (2002), RIZOV (2004), and LATRUFFE (2004) apply the adjustment costs model. The main advantage of this model is that it facilitates the evaluation of whether the behavior of firms in transition is consistent with the profit maximization hypothesis inherent in this model. While the mentioned analyses find that in terms of investment, firms in transition countries started behaving consistently with profit maximization in the presence of user-costs of capital (LIZAL, SVEJNAR, 2002; RIZOV, 2004), the model estimates for agricultural enterprises diverge from that which is theoretically expected (LATRUFFE, 2004; ZINYCH, ODENING, 2007). LATRUFFE (2004) suggests that a relatively low level of adjustment costs in agricultural production may make the adjustment-costs model inappropriate for investigating the investment behavior of farms, which, compared to industrial firms, might invest in smaller amounts of capital. Several current studies on investment analysis in transition countries reveal that explanations for the sign of the sales ratio to capital are ambiguous. It remains an open question whether a positive sign on this term signals the presence of imperfect competition in the product market, decreasing returns to scale as BOND and MEGHIR (1994) believe, or firms’ decisions to postpone investments during periods when capital productivity is high (BENJAMIN, PHIMISTER, 1997; LATRUFFE, 2004). 2.3 Motivation of dynamic investment modeling in the Russian context Our motivation for modeling farm investment behavior in the transitional context is explained primarily by two facts: i) thus far there has been no study which analyses Russian farm investment patterns in dynamic settings4; ii) authors of earlier studies (LATRUFFE, 2004; ZINYCH, ODENING, 2007) state that their results diverge from the theoretically expected. Empirical studies into firm investment behavior primarily use two investment model specifications: The accelerator model and the adjustment costs model. Though the accelerator model does not introduce any explicit assumptions, it implicitly assumes that the ratio of the output price to the costs of capital is constant over time and that the actual output approximates the desired output. In an adjustment costs modeling framework it is assumed that (1) firms demonstrate profit-maximizing behavior, (2) product and factor prices are constant across periods and firms, and (3) firms’ discount factor is constant, which makes firms indifferent between investing today and transferring investment to tomorrow. Assumption (1) with respect to farm behavior during transition is not necessarily violated. In fact, several empirical studies could not reject profit-maximizing behavior of farms in Russia (ARNADE, TRUEBLOOD, 2002; BEZLEPKINA et al., 2005). However, assumptions (2) and (3) seriously affect the applicability of the adjustment costs model to study the behavior of firms during transition.
4 Though BOKUSHEVA et al. (2007) investigate the investment behaviour of Russian farms,
the authors do not use dynamic investment models.

Agricultural economics and transition
180
Employing a modeling framework that facilitates the consideration of the structural changes effect on investment behavior endogenously would address these issues. Thus in this study we employ error correction formulation of investment model which accounts for firms’ responses to structural shocks in the output markets.
3 DATA AND ESTIMATION METHODOLOGY Statistical sources provide limited data about the level of investment in Russian regions. The data at the farm level can only be obtained by means of surveys (or census), which partly explains why there have not been studies on investments in Russian agriculture, with the exception of BOKUSHEVA et al. (2007). In our empirical analysis we employ farm level data from 1999 to 2005, which was collected through a survey of 60 farms in the Oreol and Samara regions. Summary statistics on the financial variables employed in the analysis are presented in Table . Table 3.32: Summary statistics 1999-2005 (57 farms, 278 observations)
Investment/
Capital Cash Flow/
Capital Sales/
Capital Sales, first difference
Log (Capital)
Log (Sales)
I/K (CF/K) (S/K) ds k s Mean 0.109 0.087 0.500 –0.028 8.956 8.867 S.D. 0.176 0.149 0.478 0.135 2.240 2.194 Min 0.000 –0.300 0.000 –0.124 7.372 7.316 Max 1.305 0.742 2.857 0.068 10.539 10.419
Source: Authors’ own calculations. Notes: Statistics for 3 last variables (ds, k and s) are calculated for the 2000-2005 period. We apply the error-correcting formulation of the investment equation as defined in (3). This investment-equation is estimated by using the GMM-SYS estimation method (ARELLANO, BOVER, 1995; BLUNDELL, BOND, 1998) which allows us to combine transformed (in first differences) and level equations. Accordingly, two types of instruments are employed in this estimation: The level instruments for the differenced equation and the lagged differences for the levels equation. Combining the two sets of instruments provides estimation results which can be more efficient than those obtained by employing the GMM-method in first differences (ARELLANO, BOVER, 1995; BLUNDELL, BOND, 1998). This is a crucial advantage for the application of error-correction specification (which introduces long-run variables into investment equation) to a relatively short panel data.
4 ESTIMATION RESULTS AND CONCLUDING REMARKS The estimation results of the error-correction investment equation (Table 3.33) show that the analyzed farms exhibit an error-correcting investment behavior: The coefficient on the error-correction term (ki,t-2-si,t-2) is negative (-0.12) and

Country transition experience
181
significant. The value of the coefficient is equal to -0.12, i.e., a given output-capital gap is being closed by investing at a rate of 12 % per annum. According to our estimates, temporary shocks on sales do not seriously affect farm investment – the coefficients on both sales growth terms are not significant. However, the study farms seem to adjust their investment behavior to permanent (or long-run) shocks in sales. This is seen from a significantly negative coefficient on the sales level. Whereas no significant effect of cash flow on the investment rate is found in the pooled estimation of the adjustment-cost model, the cash-flow variable affects investment with a lag when investments are modeled within the error-correction investment equation. The coefficient of approximately 0.28 indicates that a 1 % change in the cash-flow rate increases the investment rate for the next year by 0.28 %. This result indicates that the farms’ investment is sensitive to internal fund availability. Additionally, we cannot reject the hypothesis regarding the absence of the long-term effect of cash flow on the farms’ investment at the 5 % level of significance. Table 3.33: Estimates of the error-correction investment equation
Dependent variable It/Kt Coefficient P-value It–1/Kt–1 –0.25 0.00 Δst 0.04 0.56 Δst–1 0.06 0.36 st–2 –0.02 0.02 kt–2 – st–2 –0.11 0.03 CFt/Kt –0.28 0.30 CFt–1/Kt–1 0.28 0.04 CFt–2/Kt–2 –0.29 0.34 Wald test (278 observations) 33.89 0.00 Sargan test 33.28 0.99 AR(1) test –2.75 0.01 AR(2) test 0.72 0.47
Source: Authors’ own estimations. Notes: The model is estimated by means of the GMM-SYS method. Cash Flow variable replaces
the variable Profit from equation (3). While accelerator and adjustment costs models are primarily used in the literature to describe farms’ investment behavior in the context of transition countries, our study reveals that error-correction formulation of the investment equation might be a more appropriate specification for describing investment behavior of Russian farms. This is obviously related to the fact that the error-correction formulation of the investment model allows us to distinguish between long and short run dynamics in firm investment behavior, thereby considering temporal deviations from optimal rates of capital accumulation. This is not possible in the accelerator and adjustment costs models.

Agricultural economics and transition
182
The empirical analysis performed on the farm data from two Russian regions shows that in the long-term, Russian farms’ investment behavior is consistent with that defined in the dynamic model of a profit-maximizing firm. At the same time, based on the results of our empirical analysis we argue that uncertainty about future output demand and high transaction costs in financial markets may temporarily cause deviations in investment rates at the micro level. Indeed, our empirical findings show that deviations from the optimal investment rate are caused by permanent sales shocks, as well as by the availability of internal funds. Accordingly, we argue that governmental efforts aimed at improving farmers’ access to credit should be supplemented by facilitating a proper access of farms to output markets and reducing uncertainty related to farms’ output demand.
REFERENCES ABEL, A., BLANDCHARD, O. J. (1986): The present value of profits and cyclical movements in investment. Econometrica, 54, pp. 249-273.
ARNADE, C., TRUEBLOOD, M. (2002): Estimating a profit function in the presence of inefficiency: An application to Russian agriculture. Journal of Agricultural and Resource Economics, 27(1), pp. 94-113.
BLUNDELL, R. W., BOND, S. R. (1998): Initial conditions and moment restrictions in dynamic panel data models. Journal of Econometrics, 87, pp. 115-143.
BOKUSHEVA, R., VALENTINOV, V., ANPILOGOVA, V. (2007): The Investment behavior of Russian farms. Post-Communist Economies, 19(1), pp. 53-71.
BOND, S., MEGHIR, C. (1994): Dynamic investment models and the firm’s financial policy. The Review of Economic Studies, 61(2): 97-222.
BEZLEPKINA, I. V., OUDE LANSINK, A. G. J. M. – OSKAM, A. J. A. (2005): Effects of subsidies in Russian dairy farming. Agricultural Economics, 33(3), pp. 277-288.
BOND, S., ELSTON, J., MAIRESSE, J., MULKAY, B. (1997): Financial factors and investment in Belgium, France, Germany and UK: A comparison using company panel data. Working paper No. 5900, National Bureau of Economic Research, Cambridge.
BRATKOWSKI, A., GROSFELD, I., ROSTOWSKI, J. (2000): Investment and finance in de novo private firms: Empirical results from the Czech Republic, Hungary and Poland. Economics of Transition, 8(1), pp. 101-116.
BUDINA, N., GARRETSEN, H., JONG, E. D. (2000): Liquidity constraints and investment in transition economies. Economics of Transition, 8(2), pp. 453-475.
GROSFELD, I., NIVET, J. F. (1997): Wage and investment behavior in transition: Evidence from a polish panel data set. Delta working paper no. 9717, Paris Jourdan Sciences Economiques (PSE) and University of Amiens – Economics.
HUTCHINSON, J., XAVIER, A. (2006): Comparing the impact of credit constraints on the growth of SMEs in a transition country with an established market economy. Small business economics, 27(2), pp. 169-179.

Country transition experience
183
KONINGS, J., RIZOV, M., VANDENBUSSCHE, H. (2003): Investment and financial constraints in transition economies: Micro evidence from Poland, the Czech Republic, Bulgaria and Romania. Economics Letters, 78(2), pp. 253-258.
KORNAI, J. (2001): Hardening the budget constraint: The experience of the post-socialist countries. European economics review, 45(9), pp. 1573-1599.
LATRUFFE, L. (2005): The impact of credit market imperfections on farm investment in Poland. Post-Communist Economies, 17(3), pp. 349-362.
LATRUFFE, L. (2004): Farm technical efficiency, credit and investment in a transition country: A microeconomic analysis in Poland. PhD-theses, Université Paris X-NANTE RRE, Paris.
LENSINK, R., STERKEN, E. (1998): Capital market imperfections, uncertainty and corporate investment in the Czech Republic. Research report No. 99E51, Research Institute SOM (Systems, Organisations and Management), University of Groningen.
LIZAL, L., SVEJNAR. J. (2002): Investment, credit rationing and the soft budget constraint: Evidence from Czech panel data. Review of Economics and Statistics, 84(2), pp. 353-370.
RIZOV, M. (2004): Firm Investment in Transition: Evidence from Romanian Manufacturing’. Economics of Transition, 12(4), pp. 721-746.
RIZOV, M. (2007): Corporate Capital Structure and how soft budget constraints may affect it. Economics Discussion Paper no.120. Middlesex University Business School, London.
SCHUMPETER, J. (1952): Capitalism, Socialism, and Democracy. Allen and Unwin, London.
ZINYCH, N., ODENING, M. (2007): Financial constraints and investment in Ukrainian agriculture. Paper presented at the Green Week Scientific Conference 2007 "Managing Economic, Social and Biological Transformations", January 17-18, Berlin.

CHANGES IN THE ROMANIAN FARM STRUCTURES DURING TRANSITION – EVOLUTION AND MAIN DETERMINANTS
CRINA TURTOI, CAMELIA TOMA, CAMELIA GAVRILESCU
Institute of Agricultural Economics, Calea 13 Septembrie, no.13, sector 5, 050711 Bucharest, Romania. E-mail: [email protected]; [email protected], [email protected]
1 INTRODUCTION In Romania, privatization and land restitution process were accompanied by important changes in the structure and utilization of arable land. As 86 % of area cultivated with cereals is concentrated in the private sector, with a major amount farmed in small and very small farms, the low productivity, reflected also in the yields/ha, determined a decrease in the marketable production. Agricultural policy was mainly oriented towards providing support to legal agricultural holdings, excluding almost entirely the family farms from the development and financial support programs. This lack of confidence in the potential development of the family farms, led to the maintenance of low competitivity levels of the Romanian family farms compared with the European Union standards, where a family farm represents not only a way of life in rural space, but mainly a viable production entity, whose production results are aimed mostly to marketing.
2 FARM STRUCTURES The changes crossed by the Romanian agriculture after 1990 were significantly reflected in the restructuring of the utilization of the agricultural land. Compared to the common agricultural policy that was mainly envisaging agricultural land concentration in larger holdings, more viable from the economic point of view, the Romanian land reform was accompanied by an excessive agricultural land fragmentation. According to the results of the 2002 General Census of Agriculture, at country level there were registered 4,485 thousands agricultural holdings, with an average size of the Utilized Agricultural Area (UAA) of 3.11 ha/holding. Out of these, 94.9 % were family holdings.

Country transition experience
185
Table 3.34: Agricultural holdings from Romania and UAA, at 2002 census Type of holding by legal status Number of
holdings UAA
(hectares) Average UAA/holding
(hectares) Family holdings (physical persons) 4,462,221 7,708,757.6 1.73 Legal entities 22,672 6,221,952.5 274.43 Total 4,484,893 13,930,710.1 3.11
Source: General Census of Agriculture, 2002. vol. 1, National Institute of Statistics, Bucharest, 2004. The distribution of the agricultural holdings after UAA, by size classes (Table 3.35), indicates a lesser share of the large holdings. The greatest percentage belongs to the holdings sized 2-5 hectares and 1-2 hectares, while larger holdings, more than 20 hectares, represents less than 1 % of the total number of holdings. Table 3.35: Agricultural holdings and the UAA, by size classes, at 2002 census UAA size classes Holdings with UAA UAA Number % Number % Under 1 ha 2,169,257 50.46 758,815.08 5.45 1-2 ha 897,891 20.88 1,272,610.64 9.14 2-5 ha 952,395 22.15 2,907,957.69 20.87 5-10 ha 218,880 5.09 1,440,944.55 10.34 10-20 ha 37,408 0.87 471,097.55 3.38 20-30 ha 5,527 0.13 131,583.66 0.94 30-50 ha 3,950 0.09 149,588.43 1.07 50-100 ha 3,850 0.09 258,042.66 1.85 Over 100 ha 10,203 0.24 6,540,069.84 46.95 Total 4,229,361 100.00 13,930,710.10 100.00 Source: General Census of Agriculture, 2002. vol. 1, National Institute of Statistics, Bucharest, 2004. The severe land fragmentation, accompanied by a depleted living standard, deter-mined a high share of self consumption. More than 76 % of the total holdings (utilizing 38.2 % of the agricultural area) are using the agricultural products for self consumption and only 2.3 % of the total holdings (utilizing 31.2 % of the agricultural area) are marketing oriented (Table 3.36). Table 3.36: Agricultural holdings and UAA, by the destination of the
agricultural products, at 2002 census Destination of agricultural products Type of holdings, by legal status
Only for self consumption
Surplus is aimed to
marketing
Mainly for marketing
Agricultural holdings (number) Family holdings (physical persons) 3,422,089 947,484 92,648 Legal entities 7,377 4,461 10,834 Total 3429,466 951945 103,482 UAA (hectares) Family holdings (physical persons) 4,009,397.36 3,127,020.99 572,339.26 Legal entities 1,316,761.63 1,131,257.19 3,773,933.67 Total 5,326,158.63 4,258,278.18 4,346,272.93
Source: General Census of Agriculture, 2002. vol. 1, National Institute of Statistics, Bucharest, 2004.

Agricultural economics and transition
186
While arable land represents 63 % of the UAA, a restrictive production factor in developing a competitive agriculture resides in the fact that 61.7 % of total arable land is utilized in excessively fragmented family farms – 14,303 thousands plots. This is seriously hampering family farms’ productivity, if we take into account that they are producing an estimated 74 % of the total crop output of the sector level (Table 3.37). Table 3.37: Agricultural holdings, by level of fragmentation, as registered at
2002 census
Number of holdings UAA ha Level of fragmentation UM
units hectares Family farms (FF) thou 4,277 7,708.8 Total plots thou 14,303.0 1 plot % in total FF 30 6.5 2-3 plots % in total FF 36 26.3 4-5 plots % in total FF 18 26.4 6 plots and over % in total FF 16 40.8 Average size of a FF ha 1.7 Average number of plots/FF number 3 Legal entities (LE) thou 22 6,221.9 Total plots thou 218.0 1 plot % in total LE 25 3.9 2-3 plots % in total LE 26 6.9 4-5 plots % in total LE 14 8.2 6 plots and over % in total LE 35 81.0 Average size of an LE ha 27,443.0 Average number of plots/LE number 10
Source: General Census of Agriculture, 2002. vol. 1, National Institute of Statistics, Bucharest, 2004.
The shrinkage occurred in the marketing orientation was also caused by the reduced financial potential of the small family holdings indicated by the inadequacy of production factors, as irrigation and fertilizers. The results of the 2002 General Census of Agriculture revealed that only 5.6 % of the holdings had an irrigation system, out of which only 31.8 % utilized it. Only 10.8 % of the UAA had an irrigation system, out of which only 26.5 % was effectively irrigated.

Country transition experience
187
Table 3.38: Agricultural holdings, with an irrigation system available and the ones that effectively irrigated, and the corresponding UAA, as registered at 2002 census
Number of holdings with an irrigation system available
of which, holdings that effectively
irrigated
UAA with an irrigation system
available
of which, UAA effectively irrigated
Type of hol-dings, by legal status
Number % in total
holdings Number
% in total
holdings with an
irrigation system
ha % in total UAA
ha
% in total UAA
with an irrigation system
available Family holdings
248,489 5.6 78584 31.6 531,758 6.9 87,700 16.5
Legal entities
2,562 11.3 1238 48.3 979,062 15.7 312,818 32.0
Total 251,051 5.6 79822 31.8 151,081,9 10.8 400,518 26.5Source: General Census of Agriculture, 2002. vol. 1, National Institute of Statistics, Bucharest,
2004. With regard to the use of fertilizers, out of the census results it may be observed the decline of the fertilizers consumption according to historical trend. Only about half of the total holdings applied fertilizers, out of which the greatest share belongs to chemical fertilizers (Table 3.39). Table 3.39: Agricultural holdings that applied fertilizers in 2002
Number of holdings that applied fertilizers
Of which:
Type of holdings, by legal status
Number % in total holdings
Chemical fertilizers
Organic fertilizers
Organic and
inorganic fertilizers
Family holdings 1,989,731 44.6 838,041 625,209 526,481Legal entities 10,201 45.0 7,436 859 1,906Total 1,999,932 44.6 845,477 626,068 528,387Source: General Census of Agriculture, 2002. vol. 1, National Institute of Statistics, Bucharest,
2004. The management of the holding was high influenced by the educational level of the head of the holding. Out of the head of the holdings with legal status, less than half had specialized high studies in the field of agriculture. The 2005 Farm Structure Survey confirmed the same land fragmentation in very small holdings, while the total number of holdings slightly decreased by 4.1 %, compared to 2002 agricultural census results (Table 3.40).

Agricultural economics and transition
188
Table 3.40: The trend of the number of holdings, by UAA size classes, in 2002 and 2005
Number of holdings, by UAA size classes 2002 % in
2002 2005 % in 2005
2005-2002 (+/-)
2005/2002 %
Total holdings with UAA 4,299,361 100 4,121,247 100 –178,114 –4,10-5 ha 4,019,543 93.5 3,735,818 90.6 –283,725 –7.15-10 ha 218,880 5.1 289,575 7.0 70,695 32.310–50 ha 46,885 1.1 82,024 2.0 35,139 74.950-100 ha 3,850 0.1 4,939 0.1 1,089 28.3over 100 ha 10,203 0.2 8,891 0.2 –1,312 –12.9
Source: General Census of Agriculture, 2002. vol.1, NIS, 2004 and FSS 2005, vol.1, NIS, 2006.
According to the results of the Farm Structure Survey 2005, there was registered a concentration in the total number of legal entities. Compared to 2002 their total number decreased by 19.1 %. By system of land operation, the holdings with legal status operating land under property increased by 7 % in 2005, as compared to 2002, while the ones operating land taken on lease increased by 9 % in 2005, as compared with 2002 (Table 3.41). Table 3.41: The trend of the number of holdings with legal status, by UAA size
classes, in 2002 and 2005
Total Operating land held
property Operating land taken on lease
Number of legal entities with UAA 2002 2005 Δ+/–
% of total 2002
and in size class
% of total 2005 and
in size class
% of total 2002 and
in size class
% of total 2005
and in size class
Total holdings 22,046 17,843 -4,203 70 % 77 % 10 % 19 % 0-5 ha 7,414 5,317 -2,097 98 % 95 % 0 % 1 % 5-10 ha 3,166 2,588 -578 93 % 96 % 1 % 3 % 10-50 ha 2,401 2,242 -159 67 % 81 % 12 % 17 % 50-100 ha 1,091 1,020 -71 31 % 57 % 31 % 45 % over 100 ha 7,974 6,676 -1,298 41 % 58 % 18 % 37 %
Source: General Census of Agriculture, 2002, Vol.1, NIS, 2004 and FSS 2005, vol.1, NIS, 2006.
The concentration registered at the above mentioned holdings may be explained also by the decrease with 1,417,200 hectares of the total UAA, if compared with 2002 (Table 3.42).
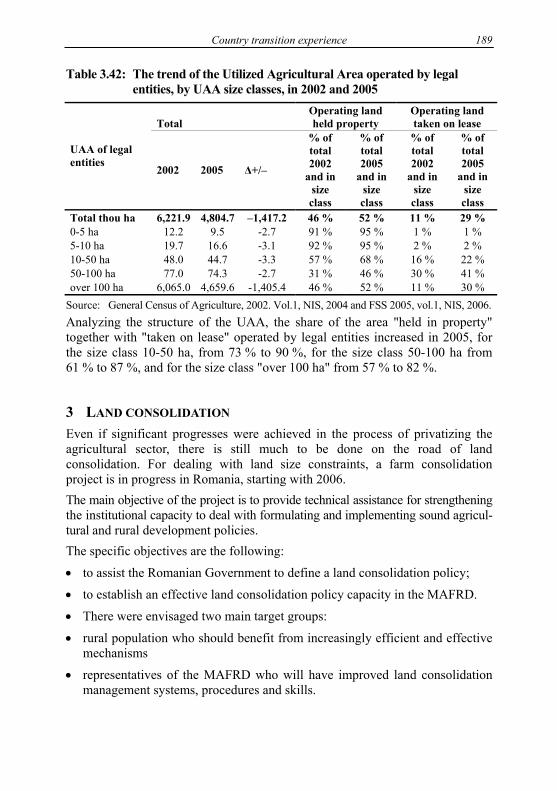
Country transition experience
189
Table 3.42: The trend of the Utilized Agricultural Area operated by legal entities, by UAA size classes, in 2002 and 2005
Total Operating land held property
Operating land taken on lease
UAA of legal entities
2002 2005 Δ+/–
% of total 2002
and in size class
% of total 2005
and in size class
% of total 2002
and in size class
% of total 2005
and in size class
Total thou ha 6,221.9 4,804.7 –1,417.2 46 % 52 % 11 % 29 % 0-5 ha 12.2 9.5 -2.7 91 % 95 % 1 % 1 % 5-10 ha 19.7 16.6 -3.1 92 % 95 % 2 % 2 % 10-50 ha 48.0 44.7 -3.3 57 % 68 % 16 % 22 % 50-100 ha 77.0 74.3 -2.7 31 % 46 % 30 % 41 % over 100 ha 6,065.0 4,659.6 -1,405.4 46 % 52 % 11 % 30 %
Source: General Census of Agriculture, 2002. Vol.1, NIS, 2004 and FSS 2005, vol.1, NIS, 2006. Analyzing the structure of the UAA, the share of the area "held in property" together with "taken on lease" operated by legal entities increased in 2005, for the size class 10-50 ha, from 73 % to 90 %, for the size class 50-100 ha from 61 % to 87 %, and for the size class "over 100 ha" from 57 % to 82 %.
3 LAND CONSOLIDATION Even if significant progresses were achieved in the process of privatizing the agricultural sector, there is still much to be done on the road of land consolidation. For dealing with land size constraints, a farm consolidation project is in progress in Romania, starting with 2006. The main objective of the project is to provide technical assistance for strengthening the institutional capacity to deal with formulating and implementing sound agricul-tural and rural development policies. The specific objectives are the following:
• to assist the Romanian Government to define a land consolidation policy;
• to establish an effective land consolidation policy capacity in the MAFRD.
• There were envisaged two main target groups:
• rural population who should benefit from increasingly efficient and effective mechanisms
• representatives of the MAFRD who will have improved land consolidation management systems, procedures and skills.

Agricultural economics and transition
190
The main constraints in accomplishing these objectives resides in developing an effective and reliable land administration system, based on an accurate and updated general cadastre for defining the boundaries of real estate parcels in order to allow a simple, safe and cost and time effective procedure for land transaction to be set up and maintained ongoing.
4 MARKETING OF THE AGRICULTURAL COMMODITIES For helping the great segment of small agricultural producers, commercial agricul-ture is to be supported and encouraged, regardless of the size of the farm or type of management. The road crossed by the agricultural product "from farm to fork" is too shattered. The marketing channels, not structured enough for integrating in strategic alliances farmers, processors and retailers, have a negative impact on agri-food markets. As a consequence, out of the results of the General Census of Agriculture it could be observed a decrease level of vertical diversification of the activities within the farms, other than agricultural. From the total number of holdings surveyed, only a minor number are developing processing and/or trading activities for the agricultural products obtained within the farm. Out of these, the greatest part opted for the downstream commodity channel, respectively agri-food trade (2.7 % of total farms). A greater percentage of the holdings developing other downstream activities were registered for legal entities (10.5 % of the total number of legal entities are integrating agri-food trade activities). Table 3.43: Agricultural holdings developing agricultural products processing
and/or trading, at 2002 census Type of activity Number of
family farms Number of
legal entities Total
Meat processing 27,227 572 27,799 Milk processing 63,139 353 63,492 Fruit and vegetables processing 33,138 221 33,359 Grapes processing 60,932 222 61,154 Milling 4,635 442 5,077 Trade 118,380 2,383 120,673
Source: General Census of Agriculture, 2002. vol. 1, National Institute of Statistics, Bucharest, 2004.
With regard to the delivery channels, according to NIS data, 2004, in Romania there are three main channels for agri-food products distribution: (1) agri-food markets/on street (2) fairs, (3) farm gate, (4) processors, (5) retailers, wholesalers. Because of the limited holdings able to ensure significant quantities of agricultural products at the requested standards, an important share of the commercialization is done on peasant markets or even at farm gate or on street markets. This type of trade is predominant for fruits, vegetables, potatoes and, in a lesser measure, products of animal origin and cereals.

Country transition experience
191
Table 3.44: Share of ari-food products marketed, according to distribution channel
Share of traded products, through Groupe of products
Agri-food markets and fairs
Processors, retailers and large holdings
Cereals 10 90 Fruits 80 20 Vegetables 90 10 Potatoes 88 12 Bovine alive 40 60 Pigs alive 6 94 Sheep and goats alive 38 62 Poultry alive 5 95 Milk 8 92 Eggs 39 61
Source: General Census of Agriculture, 2002. vol. 1, National Institute of Statistics, Bucharest, 2004.
The problems agri-food market is confronting with, resides both in the excessive degree of land fragmentation, but also in the great number of subsistence farm, with a depleted infrastructure and management, unable to support a competitive sector based on good agricultural practices. Among the main causes that aggravated this situation it may be depicted: Capital fragmentation and low capitalization capacity, low development in production infrastructure, low level of agricultural education of farm managers, aging of rural population, external migration of agri-cultural labor, persistence of a constant disequilibrium in the competitive environ-ment for the agricultural producers, but also lack of adequate policy for development of non-agricultural activities in rural area, as an efficient economic buffer, able to support a reliable capital infusion.
5 STRUCTURAL ADJUSTMENTS FOR ACHIEVING COMPETITIVE STANDARDS OF THE FARMS
The preponderance of the small holdings (50 % have less than 1 hectare) is an ongoing issue that is be resolved, both by adequate social measures (early retirement, etc), and by an efficient economic approach, that resides in: • measures envisaging the increase of human potential (improvement of
professsional information and education for personnel working in agricultural sector, support for young farmers for settle down in rural area and setting up new farms or maintaining the existing ones, consultancy services for farmers, etc);
• restructuring measures (farms modernization, increase value added of the agricultural products, infrastructure development, adequate legislation for land consolidation and land market development, policy support for developing

Agricultural economics and transition
192
non-agricultural activities in rural area, as a sustainable alternative for non-farm income, upgrade agricultural potential in areas affected by calamities or poor management, etc)
• measures for improving agri-food products quality (support for reaching marke-ting standards for quality, according to EU legislation, support for producers groups for promoting their products according to quality standards, etc)
• measures for supporting the restructuring of semi-subsistence farms for market orientation and setting up groups of producers.
REFERENCES FARM STRUCTURE SURVEY IN AGRICULTURE, National Institute of Statistics, 2006.
GENERAL CENSUS OF AGRICULTURE (2002): National Institute of Statistics, Bucharest, 2004.
TOMA, C. (2006): Activitatea de comercializare a produselor agricole in exploatatiile familiale. In: Economia agroalimentara si a mediului. Reforma si integrare europeana, Editura ASE, Bucureşti.
TURTOI, C., TOMA, C., GAVRILESCU, C. (2006): Agricultura durabilă în contextul globalizării –standarde egale într-o lume inegală, in Probleme actuale ale economiei globale. Volumul I. Editura Universitaria, Craiova.

A TIME SERIES ANALYSIS OF THE BEEF LIVESTOCK SUPPLY IN RUSSIA: IMPLICATIONS FOR AGRICULTURAL SECTOR DEVELOPMENT
POLICIES
MARIA ANTONOVAA, MANFRED ZELLERb a PhD student at the Institute of Agricultural Economics, Department of Market Analysis,
Christian-Albrechts-University in Kiel, Olshausenstraße 40, 24118 Kiel. E-mail: [email protected]
b Professor in Rural Development Theory and Policy (490a), University of Hohenheim, Schloss, Osthof-Sued, 70599 Stuttgart. E-mail: [email protected]
1 INTRODUCTION During the past twenty years, the number of livestock in Russia declined to about one third of the level achieved in 1986. This decline could be explained by a range of factors, which are supported in our paper through a review of past research results as well as time series data related to the livestock sector. First, the liberalization of agricultural prices, coupled with the dismantlement or reduction of state subsidies to agriculture for fertilizer, feed, technology and credit during the transformation period, led to an increasing disparity between prices for agricultural inputs, capital, and the prices for beef and other agricultural outputs. Second, prices for poultry meat, a major competitor product, although higher in the earlier years of the transformation period, did not decline as much in real terms compared to the beef prices. Third, the malfunctioning credit system, coupled with insecure property rights of agricultural companies, triggered a major decline in the provision of agricultural credit. The dismantlement of state subsidies to agriculture, and the abovementioned adverse price changes for agricultural producers, led to the increasing indebtedness of agricultural firms and rising numbers of bankruptcy cases. Hence, the Russian agricultural sector, including large-scale enterprises, has now suffered for many years from severe credit constraints that undermine the investment needed to replace outdated technology, such as tractors and buildings, and to establish a modern integrated food chain system. Apart from these domestic internal factors, Russia faced international competition from other countries (EU, USA, Brazil, etc.), that began to export beef to Russia. Some countries, namely those belonging to the EU, subsidized their beef exports

Agricultural economics and transition
194
to Russia in order to solve their own problems of domestic surplus. Low prices for domestic beef determined consumer prices in Russia. High transaction costs for domestic production contributed to the further depression of prices on the farm-gate level.
2 MODEL SPECIFICATION A suitable econometric model for the analysis of agricultural supply response based on time series data has been developed by MARC NERLOVE (1956). According to MCKAY et al. (1999), the Nerlove Supply Response (NSR) model enables the interpretation of dynamic optimization behavior of farmers, i.e. their decisions and their reactions to moving targets. The NSR model includes an output adjustment component (Yt–1), and a price expectations component (Pt–1): Yt = πo + π1 Pt–1 + π2 Yt–1 + βε t, (1) where πo turns out to be equal to αoβ, π1 equals α1β, and π2 equals 1–β (for more detailed model specifications see NERLOVE, 1956). Yt here represents livestock population, Pt the farm-gate price per kilo. Several other factors were hypothesised to create certain economic conditions, which directly or indirectly contributed to the dramatic decline in the Russian beef sector. They are included in the Z vector, and are tested for their importance in the Nerlovian model (see equation (2)). A more detailed discussion of the mentioned factors will be provided in the next chapter. Yt = αoβ + α1β Pt–1 + α2β Zt–1 + (1–β) Y t–1 + βε t, (2)
3 LIMITATIONS IN CHOICE OF VARIABLES AND DATA SOURCES In Table 3.45, we show data on the number of livestock in Russia, as an indicator for beef production. The number of livestock declined by two thirds from a pre-reform level in the late 1980s of about 60 million animals to the most recent level in 2005 of about 21 million animals.

Country transition experience
195
Table 3.45: Time series data concerning Russia’s livestock sector
Price of feed
(Euro per
kilo)
Price of beef
(Euro per
kilo)
Price of poultry (Euro
per kilo)
Number of people
working in agriculture(in millions)
Technology: Number of Tractors
(in million)
Livestock imports:
Number of animals
(in millions)
Livestock population Number of
animals (in millions)
1986 0.91 7.61 4.83 10.31 1.43 3.28 59.60 1987 1.23 6.71 4.28 10.00 1.39 2.5 60.50 1988 2.27 7.83 4.43 10.31 1.39 1.95 59.80 1989 2.85 8.62 5.11 9.64 1.35 2.3 59.30 1990 1.82 6.30 3.66 9.20 1.34 3.6 57.04 1991 1.02 2.27 1.95 8.72 1.33 4.17 54.68 1992 0.08 0.09 0.12 8.41 1.29 4.73 52.23 1993 0.13 0.46 0.57 8.17 1.24 5.06 48.91 1994 0.09 0.50 0.77 7.60 1.15 4.76 43.30 1995 0.10 0.41 0.67 6.70 1.05 5.92 39.70 1996 0.14 0.51 0.87 6.20 0.97 5.06 35.10 1997 0.11 0.61 1.08 5.70 0.89 6.96 31.52 1998 0.07 0.45 0.80 5.30 0.86 5.15 28.48 1999 0.08 0.45 0.63 5.10 0.79 5.33 28.03 2000 0.10 0.55 0.79 4.70 0.75 2.76 27.29 2001 0.13 0.76 1.03 4.20 0.70 4.3 27.11 2002 0.10 0.88 0.87 3.80 0.65 4.38 26.52 2003 0.08 0.64 0.82 3.30 0.59 4.97 24.94 2004 0.10 0.74 1.02 2.90 0.53 4.78 22.99 2005 0.08 0.94 1.16 2.90 0.51 3.63 21.40 Source: Prices are from the OECD for the years 1986-1990, and for all later years are based
on information from the State Statistical Committee of the Russian Federation. Data for agricultural workers and livestock population were obtained from the State Statistical Committee of the Russian Federation. Number of tractors and data for beef import were obtained from the FAO database.
Note: Domestic prices for poultry, beef and feed are expressed in Euro, using the official exchange rate between Ruble and Euro.
Price of feed. The cost of the price of feed represents the major variable input for beef production, and the sign of the estimated coefficient is expected to be negative. The price of maize, one of the main feed components, was taken as a proxy for the price of feed. However, the specifics of livestock feeding practices should be stressed here. Grass from the pasture is usually substituted for expensive pro-cesssed animal feed in Russia. Thus, the technical ability to store hay is a key component of the feeding process for the Russian livestock sector. In this sense, the number of combines and tractors working for hay harvesting and storage could be used as an indicator of the availability of feed in the winter.

Agricultural economics and transition
196
Technical equipment. In addition to the availability of feed, the technical equipment variable represents the capital stock employed in the beef sector. During the transition period in Russian agriculture, major changes occurred in agricultural output and input prices. The main characteristic of this change was a growing "price disparity" for agricultural inputs, in relation to outputs (SEROVA et al.; BRAZHEVSKAJA, 2005; KRYLOV et al., 2001). Prices for agricultural inputs rose by a much greater percentage than the prices for agricultural outputs (LIEFERT, SWINNEN, 2002), reducing the comparative advantage of the agricultural sector as compared to other sectors in the Russian economy. As a result, the debts of agricultural producers grew (KRYLOV, 2001). At the same time the sluggish transformation of the parastatal agricultural credit system led to severe credit rationing and increases in interest rates for loans to the agricultural sector, compared to the socialistic period. Hence, the lack of capital was likely to have driven the reduction of investments in replacement technology, an example of which can be seen in the decline of the number of tractors during the past 20 years (Table 3.45). Agricultural labour. Finally, the Nerlovian adjustment process (i.e. the level of beef production and the speed of adjustment) is heavily dependent on available labor. The agricultural labor force in Russia has declined over the past twenty years (see Table 3.45), without compensation by significant increases in capital intensity since, as KRYLOV (2001) suggests, the farm operations suffer from a lack of financial capital. Thus, the decline of agricultural labour is hypothesized to have had a negative impact on the livestock dynamics in Russia. Beef Import. A number of Russian studies (ANANIEV, 1998; BRAZHEVSKAJA, 2005) argue that cheap beef imports, mainly from the EU countries, depressed Russian domestic beef production. The large agricultural imports of the Soviet period led to the creation of a relatively well-functioning and inexpensive system for moving goods from entry-ports to high-consuming urban areas, such as Moscow and St. Petersburg (LIEFERT, SWINNEN, 2002). Domestic producers, on the other side, were struggling due to high transaction costs, i.e. marketing and transportation costs. Thus, the increase in imported beef consumed domestically has been determined by the high transaction costs for domestic production. Since the analyzed prices are the farm-gate prices, we use the quantity of imported beef as a measure, which stands for transaction costs between domestic farm-gate and consumer prices. Prices of beef and poultry. Micro-economic and economic theories suggest that native product price and the price of competing goods are the main determinants of the supply of a particular product. Against beef in Russia, poultry meat is the major competing product. Consequently, the occurrence of a negative poultry coefficient in the model was expected and hypothesised. Thus, all the variables, chosen according to literature review and data availability, can be summarized as follows: LP = f (Pf, Pb, Pp, AW, TE, Imp) (3)

Country transition experience
197
Where LP represents livestock population, Pf price of feed for animals, Pb producer price of beef, Pp producer price of poultry, AW labor force involved in agriculture, TE technology (proxied by number of tractors), and Imp imported amount of beef livestock.
4 PRESENTATION AND DISCUSSION OF RESULTS We examined two functional forms in the study: Linear and log-log functions. The linear function led to theoretically inconsistent signs of regression coefficients, as well as collinearity problems. The log-log regression produced correct signs of the coefficients and statistically more reliable results (see Table 3.46). In regression 3 all variables are significant at the minimum 5 % level. Only the import variable is significant at the 10 % level, although it is still more significant than in the linear function. The variables price of feed (Pf_log) and agricultural workers (AW_log) were omitted from regression 3, because they were not statistically significant and had a high degree of collinearity. Table 3.46: Regression results (log-log estimates) Regression
1 Regression
2 Regression
3 Regression
4 Constant 2.029
(1.740) 1.539*** (2.765)
1.633**** (3.130)
0.816**** (3.039)
Pf_log –0.016 (–0.685)
–0.140 (–0.610)
Om Om
Pb_log 0.144** (2.407)
0.137** (2.441)
0.125** (2.439)
0.108* (2.135)
Pp_log –0.141** (–2.229)
–0.137** (–2.258)
–0.134** (–2.266)
–0.118* (–1.993)
AW_log –0.170 (–0.483)
Om Om 0.224** (2.516)
TE_log 0.615 (1.145)
0.365** (2.699)
0.370*** (2.810)
Om
Imp_log –0.081* (–1.999)
–0.070* (–2.140)
–0.067* (–2.116)
–0.055 (–1.618)
LAG_log 0.543** (3.020)
0.587**** (3.932)
0.566**** (3.995)
0.670**** (5.608)
Adj. R-square 0.994 0.994 0.995 0.994 DW test 1.920 1.871 1.761 1.763 DW h test 0.281 0.372 0.663 0.601 DF 11 12 13 13
Notes: Om – omitted variable. t-value is given in parentheses. ****: Significant at the 1 % level of error probability; ***: Significant at the 2 %
level of error probability; **: Significant at the 5 % level of error probability; *: Significant at the 10 % level of error probability.
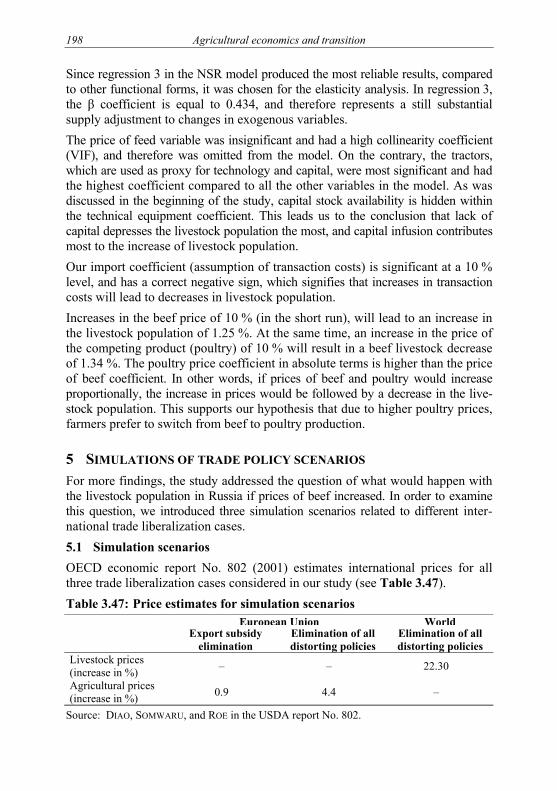
Agricultural economics and transition
198
Since regression 3 in the NSR model produced the most reliable results, compared to other functional forms, it was chosen for the elasticity analysis. In regression 3, the β coefficient is equal to 0.434, and therefore represents a still substantial supply adjustment to changes in exogenous variables. The price of feed variable was insignificant and had a high collinearity coefficient (VIF), and therefore was omitted from the model. On the contrary, the tractors, which are used as proxy for technology and capital, were most significant and had the highest coefficient compared to all the other variables in the model. As was discussed in the beginning of the study, capital stock availability is hidden within the technical equipment coefficient. This leads us to the conclusion that lack of capital depresses the livestock population the most, and capital infusion contributes most to the increase of livestock population. Our import coefficient (assumption of transaction costs) is significant at a 10 % level, and has a correct negative sign, which signifies that increases in transaction costs will lead to decreases in livestock population. Increases in the beef price of 10 % (in the short run), will lead to an increase in the livestock population of 1.25 %. At the same time, an increase in the price of the competing product (poultry) of 10 % will result in a beef livestock decrease of 1.34 %. The poultry price coefficient in absolute terms is higher than the price of beef coefficient. In other words, if prices of beef and poultry would increase proportionally, the increase in prices would be followed by a decrease in the live-stock population. This supports our hypothesis that due to higher poultry prices, farmers prefer to switch from beef to poultry production.
5 SIMULATIONS OF TRADE POLICY SCENARIOS For more findings, the study addressed the question of what would happen with the livestock population in Russia if prices of beef increased. In order to examine this question, we introduced three simulation scenarios related to different inter-national trade liberalization cases. 5.1 Simulation scenarios OECD economic report No. 802 (2001) estimates international prices for all three trade liberalization cases considered in our study (see Table 3.47). Table 3.47: Price estimates for simulation scenarios
European Union World Export subsidy
elimination Elimination of all distorting policies
Elimination of all distorting policies
Livestock prices (increase in %) – – 22.30
Agricultural prices (increase in %) 0.9 4.4 –
Source: DIAO, SOMWARU, and ROE in the USDA report No. 802.

Country transition experience
199
SEROVA et al. (undated source) show that the world market price has a direct relationship with the Russian domestic price. However, as we lack exact data on price transmission elasticity, we have used here a simplified and admittedly imprecise functional relationship between the world market and the domestic price for beef in Russia. Poultry and Import Changes Estimated in the Study. The OECD report gives a percentage of the price increase during trade liberalization only for the price of beef. The estimations were that an increase in the beef price of 1 % will lead to the increase of the poultry price by 0.717 %, and that an increase in the beef price of 1 % will lead to a decrease in beef imports of 0.175 %. The exact calculation of these changes can be provided to any interested readers.
5.2 Simulations results According to the OECD report, if the EU export subsidies are eliminated, world market beef prices will rise by 0.9 %. Following the assumption that Russian domestic prices for beef will rise proportionally with world market prices, after implementation of this policy measure it is predicted that the price of Russian domestic beef will also rise by 0.9 %. At the same time, the poultry price in Russia will rise by 0.65 %, and beef imports will decrease by 0.16 %. In the case of the elimination of all distorting EU policies, the price of beef will rise by 4.4 %, the price of poultry by 3.16, and imports will decrease by 0.77 %. In the scenario of full global liberalization of policy, the price of beef is expected to rise by 22.3 %, the price of poultry by 15.99 %, and imports will decrease by 3.9 %. The run of the NSR Model under the "EU export subsidy elimination" scenario shows a decrease in livestock population (see Table 3.48). An increase in beef price prompts producers to increase livestock production, but the corresponding increase in poultry price, in a multi-market context, has a greater negative effect than the direct internal price effect. In the second scenario, "EU, elimination of all distorting policies", the world market price for beef is expected to increase by 4.4 %. In this case, the livestock population in Russia does not change. This occurs because the high elasticity of beef price compensates for the low beef price coefficient. In the third scenario "Global full policy liberalization", the price of beef is predicted to rise by 22.3 %, which leads to an increase in livestock population (see Table 3.48). Thus, we come to the conclusion that under the present circumstances, the change in livestock population will be very small with respect to the price changes caused by the three trade policy scenarios. In other words, the observed decline in Russia’s livestock sector is largely due to domestic structural problems.
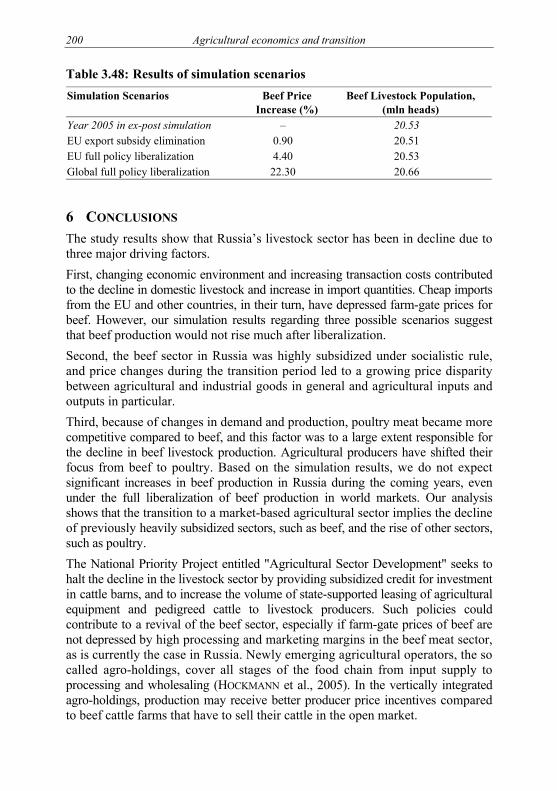
Agricultural economics and transition
200
Table 3.48: Results of simulation scenarios Simulation Scenarios Beef Price
Increase (%) Beef Livestock Population,
(mln heads) Year 2005 in ex-post simulation – 20.53 EU export subsidy elimination 0.90 20.51 EU full policy liberalization 4.40 20.53 Global full policy liberalization 22.30 20.66
6 CONCLUSIONS The study results show that Russia’s livestock sector has been in decline due to three major driving factors. First, changing economic environment and increasing transaction costs contributed to the decline in domestic livestock and increase in import quantities. Cheap imports from the EU and other countries, in their turn, have depressed farm-gate prices for beef. However, our simulation results regarding three possible scenarios suggest that beef production would not rise much after liberalization. Second, the beef sector in Russia was highly subsidized under socialistic rule, and price changes during the transition period led to a growing price disparity between agricultural and industrial goods in general and agricultural inputs and outputs in particular. Third, because of changes in demand and production, poultry meat became more competitive compared to beef, and this factor was to a large extent responsible for the decline in beef livestock production. Agricultural producers have shifted their focus from beef to poultry. Based on the simulation results, we do not expect significant increases in beef production in Russia during the coming years, even under the full liberalization of beef production in world markets. Our analysis shows that the transition to a market-based agricultural sector implies the decline of previously heavily subsidized sectors, such as beef, and the rise of other sectors, such as poultry. The National Priority Project entitled "Agricultural Sector Development" seeks to halt the decline in the livestock sector by providing subsidized credit for investment in cattle barns, and to increase the volume of state-supported leasing of agricultural equipment and pedigreed cattle to livestock producers. Such policies could contribute to a revival of the beef sector, especially if farm-gate prices of beef are not depressed by high processing and marketing margins in the beef meat sector, as is currently the case in Russia. Newly emerging agricultural operators, the so called agro-holdings, cover all stages of the food chain from input supply to processing and wholesaling (HOCKMANN et al., 2005). In the vertically integrated agro-holdings, production may receive better producer price incentives compared to beef cattle farms that have to sell their cattle in the open market.

Country transition experience
201
However, product specific policies and programs always entail the risk of setting up production structures that prove to be inefficient in the long run. This risk needs therefore to be carefully evaluated before embarking on a large sector specific subsidy program. The state may consider investing in public goods that do not necessarily benefit specific agricultural products, but rather provide impetus for private investment and production increases in the agricultural sector and rural development overall. Such investments would concentrate on reductions in trans-action costs, for example improvement and expansion of rural infrastructure (roads, communication), property rights, and market information systems. Such measures are likely to induce a sustained agricultural supply response while leaving to the private sector the choice of which agricultural enterprise (be it poultry, beef, or certain crops) is most efficient. Our results should be interpreted with caution, however. We pointed out the limi-tations in data, and our assumption about the price transmission elasticities as well as the domestic cross-price elasticities should be further explored by future studies. The use of multi-market models for the meat sector in Russia would be a promising research task to validate and possibly extend the results shown in this paper.
REFERENCES ANANIEV, M. (1998): Formation of Investment Mechanism in Agricultural Sector (Example of Mordovia Republic). Saransk, Mordovian State University.
Agriculture in USSR (1988): Goskomstat USSR, Moscow.
BRAZHEVSKAJA, M. (2005): Organizational and Economical Problems of Functioning and Developing of Russian Meat Market. Moscow Agricultural Academy, Moscow.
DIAO, X., SOMWARU, A., ROE, T. (2001): A Global Analysis of Agricultural Reform in WTO Member Countries, in USDA, Agricultural Policy Reform in the WTO – The Road Ahead. Economic Report No. 802.
FAOSTAT Home Page, Agricultural machinery statistics. Accessed on 20 May 2006.
HOCKMANN, H., WANDEL, Ju., NEDOBOROVSKYY, A. (2005): Agro-holdings in Russia: Breaking the Vicious Circle, paper presented at the 94th EAAE Seminar "From households to firms with independent legal status: The spectrum of institutional units in the development of European agriculture". Ashford (UK), 9-10 April, 2005.
KRYLOV, V., REZNIKOVA, S., AGRIBOV, Ju., BESPAHOTNYI, G., BORHUNOV, N. (2001): Analytical Paper of Accounts Chamber of the Russian Federation, http://www.budgetrf.ru/Publications/Schpalata/2001/bulletin/schpal6422001bull6-11.htm/.
LIEFERT, W., SWINNEN, J. (2002): Changes in Agricultural Markets in Transition Economies. Agricultural Economic Report, No. 806.
MCKay, A., Morrissey, O., Vaillant, Ch. (1998): Trade Liberalization and Agricultural Supply Response: Issues and Some Lessons. European Journal of Development, Research, 9(2).

Agricultural economics and transition
202
NERLOVE, M. (1956): Estimates of the Elasticities of Supply Selected Agricultural Commodities, Journal of Farm Economics, 38, pp. 496-506.
OECD DATABASE (2006): Total Support Estimate.
http://www.oecd.org/document/58/0,2340,en_2649_37401_32264698_1_1_1_37401,00.html#NME/.
STATE STATISTICAL COMMITTEE OF THE RUSSIAN FEDERATION (2005): Russian Year Statistical Bulletin 2005. Goskomstat, Moscow.
http://www.gks.ru/free_doc/2005/b05_13/04-02.htm/.
SEROVA, E., PROKOPIEV, M., TIHONOVA, T., IVANOVA, I. (Date unknown): Short-Term Prognoses of Basic Goods Consumption in Russia. Institute of Transition Economy, Moscow.

4 LAND REFORM


AGRICULTURAL RECOVERY IN CIS: LESSONS OF 15 YEARS OF LAND REFORM AND FARM RESTRUCTURING1
ZVI LERMAN
The Hebrew University of Jerusalem, Israel
1 LAND REFORM AND CHANGING FARM STRUCTURE IN CIS The 12 former Soviet republics that form the Commonwealth of Independent States (CIS) span three geographical regions – the European part of the former Soviet Union, Transcaucasia, and Central Asia (Table 4.1). The CIS countries are regarded as highly agrarian, especially compared to Western Europe and North America. The rural or agrarian character of a country can be assessed by three indicators: The share of rural population (in percent of total population), the share of agricultural employment (in percent of total employment), and the share of agricultural Gross Value Added (GVA) in the country’s GDP. These components of a country’s agrarian profile are given in Table 4.1, which also calculates an ad hoc "agrarian index" of each country as the arithmetic average of the three components (the agrarian index is thus expressed in percent). This is an aggregate characteristic of a country’s agrarian nature. The least agrarian countries – Russia, Belarus, Ukraine, and Kazakhstan – enjoy the highest per capita income in CIS (WORLD BANK, 2005). The country with the highest agrarian index – Tajikistan – is the poorest. Overall, there is a strong negative correlation between the agrarian index and income per capita. This inverse relation-ship between the country’s agrarian profile and per capita income is a standard empirical fact in development economics (CHENERY, SYRQUIN, 1975).
1 This is a condensed version of the article written for the Joint IAAE–EAAE Seminar in
Budapest. For the full version see http://ageconsearch.umn.edu (AgEcon Search > European Association of Agricultural Economists > 104th Seminar, September 5-8, 2007, Budapest > Lerman). The analysis in this paper was developed during the months of July-October 2006 when the author was Visiting Expert at FAO’s Regional Office for Europe and Central Asia in Rome. Close collaboration with David Sedik, Head of the Regional Office’s Policy Assistance Branch (REUP), greatly contributed to this study. The author wishes to acknowledge the insightful comments of John Nash and Paloma Anos of the World Bank on an earlier draft.

Agricultural economics and transition
206
Table 4.1: The agrarian profile of CIS countries (2004 or latest available data)
Country Region Share of
rural population
Share of agriculture in employment
Share of agriculture
in GDP
Agrarian index
Russia European CIS 27.0 11.0 5.1 14.4 Ukraine European CIS 32.6 24.6 10.8 22.7 Belarus European CIS 28.0 10.7 8.9 15.9 Moldova European CIS 59.0 40.4 18.2 39.2 Armenia Transcaucasia 35.9 45.8 22.7 34.8 Georgia Transcaucasia 47.8 58.6 16.0 40.8 Azerbaijan Transcaucasia 48.5 40.0 11.3 33.2 Kazakhstan Central Asia 42.9 33.2 7.9 28.0 Kyrgyzstan Central Asia 65.1 51.8 32.9 49.9 Tajikistan Central Asia 73.6 67.6 24.2 55.1 Turkmenistan Central Asia 56.4 no data 20.2 38.3 Uzbekistan Central Asia 62.6 no data 28.3 45.4
Source: CIS (2005). The CIS countries embarked on a transition from plan to market in the early 1990s, as the former Soviet Union was breaking up. Land reform is one of the main com-ponents of the transition program. It is particularly pertinent for the CIS countries because of their prominent agrarian nature, which by definition leads to a high dependence of the rural population on agriculture and land. The agenda for land reform in CIS included privatization of land (which had been state-owned throughout the Soviet era) and restructuring of large-scale collective farms – the hallmark of Soviet agriculture – into family farms or other market-oriented organi-zational forms. This approach to land reform emphasizes individualization of agriculture – and not just privatization of land in the formal sense of ownership transfer from the state to private owners or the establishment of sophisticated land titling and registration systems. Despite the generally common agenda for transition, different countries followed different implementation paths, which resulted in a substantial divergence of outcomes. Table 4.2 summarizes the different forms of property rights and land tenure that have emerged in CIS as a result of differences in the implementation of land reform (for more details see LERMAN et al., 2004). Land privatization in the strictly legal sense of "destatization" of land ownership has been implemented by most CIS countries. Only three countries – Belarus, Uzbekistan, and Tajikistan – retain exclusive state ownership of land, while Turkmenistan allows a curious form of private land ownership that rules out transferability and is thus stripped of the main characteristics of private property. Individualization of land tenure shows much greater diversity across the CIS countries. Armenia and Georgia resolutely individualized their agriculture back in 1992 by distributing all land traditionally held by large collectives to rural households. Azerbaijan followed in 1996. In these three countries, virtually all agricultural land today is in individual tenure and family farms produce almost

Land reform
207
the entire agricultural output. At the other extreme we find Russia and Belarus, where family farms now exist in much greater numbers than before 1991, but 80 %-90 % of agricultural land is still controlled by large former collectives. In the middle there are Moldova and Ukraine, which initially followed the Russian model of distributing land to the rural population in the form of paper certificates of entitlement ("land shares") but ultimately began to convert the paper shares into physical land plots given to rural households (Moldova in 1998, Ukraine in 2000). In Central Asia, Turkmenistan and Uzbekistan follow their own peculiar strategy of farm individualization, which is based on leasehold arrangements entrusting the cultivation of farm land to rural families through lease contracts linked to binding production quotas. In Kazakhstan individual farms predominantly rely on land leased from the state, although private land ownership was formally recognized in the June 2003 Land Code. The other two Central Asian countries – Tajikistan and Kyrgyzstan – have a different story to tell. Tajik farmers indivi-dualized their holdings, mainly after 1999, by converting land shares to plots of state-owned land in use rights (and their use rights are furthermore transferable). Kyrgyzstan made important progress toward full recognition of private land ownership in 1999-2000, and this policy change was followed by significant distribution of land to individuals or families. Table 4.2: Differences in the implementation of land reform in CIS
Potential private land ownership
Allocation strategy
Transfer-ability Farm organization
Watershed
date for indivi- duali- zation
Arm All Plots Buy/sell, lease Individual 1992 Geo All Plots Buy/sell, lease Individual 1992 Az All Plots Buy/sell, lease Individual 1996 Mol All Shares to plots Buy/sell, lease Individual + corporate 1998 Ukr All Shares to plots Buy/sell, lease Individual + corporate 2000 Kyr All Shares to plots Buy/sell, lease Individual + corporate 1998 Kaz All Shares to plots* Buy/sell, lease Individual + corporate 2003 Rus All Shares Buy/sell, lease Corporate + individual ** Taj None Shares to plots Use rights Individual + corporate 1999 Tur All Leasehold None Individual leaseholds 1998 Uzb None Leasehold None Individual leaseholds 2004 Bel Household
plots only None None Corporate + individual **
Notes: * The June 2003 Land Code practically annulled the permanent rights associated with land shares and forced the share-holders either to acquire a land plot from the state (by outright purchase or by leasing) or to invest the land share in the equity capital of a corporate farm.
** In Russia and Belarus individual farms began to be created in 1992, but the process of individualization has not taken off as in other countries.

Agricultural economics and transition
208
The qualitative patterns of land reform in Table 4.2 can be quantified by the so-called ECA Land Reform Index, which essentially measures how far land tenure and farm structure have advanced from the socialist model of predominantly large-scale collective agriculture to the market model with predominance of relatively small family-operated units.2 Table 4.3 gives for each country the ECA Land Reform Index for 2004 – the last year when such estimates were published by the World Bank. Alongside with the Land Reform Index, Table 4.3 also reports the broader ECA Agricultural Policy Index, which in addition to the evaluation of land reform includes four other dimensions relevant for the transition in agriculture: Liberalization of agricultural markets, privatization and demonopolization of agricultural services (both upstream and downstream), establishment of an institu-tional framework for market agriculture, and development of rural finance. The ECA reform indexes are constructed on a scale from 1 to 10, where 1 corresponds to a command economy and 10 to an economy with completed market reforms. Countries with reform index below 6 are characterized as slow reformers, whereas countries with reform index of 6 and higher are moderate (6-7) or advanced (above 7) reformers. Table 4.3: Regional classification of CIS countries by progress in land reform
Country Region ECA Land
Reform Index (2004)
ECA Agricultural Policy Index (2004)
Status of land reform
Armenia Transcaucasia 9 7.8 "Advanced" Georgia Transcaucasia 7 6.0 "Advanced" Azerbaijan Transcaucasia 9 6.6 "Advanced" Moldova European CIS 7 6.0 "Advanced" Ukraine European CIS 6 6.2 "Advanced" Russia European CIS 5 6.2 "Slow" Belarus European CIS 2 2.6 "Slow Kyrgyzstan Central Asia 8 7.4 "Advanced" Tajikistan Central Asia 6 5.2 "Advanced" Kazakhstan Central Asia 5 6.2 "Slow" Uzbekistan Central Asia 5 4.0 "Slow" Turkmenistan Central Asia 2 1.8 "Slow" Source: ECA indexes from CSAKI, KRAY (2005). Table 4.3 linking the qualitative land reform patterns of Table 4.2 with the ECA Land Reform Index reveals a concrete regional differentiation of the 12 CIS countries on the scale of reforms. The Transcaucasia region (Armenia, Georgia, Azerbaijan) has achieved the greatest progress in land reform among the CIS countries, and it accordingly has the highest Land Reform Index, averaging 8.3 out of 10. In each of the other two regions – European CIS and Central Asia – 2 ECA is an acronym for "Europe and Central Asia," referring to the post-socialist transition
countries in this region. The ECA Land Reform Index was introduced in 1997 (CSAKI, NASH 1998) and subsequently updated on an annual basis. For latest updates see CSAKI, KRAY (2005).
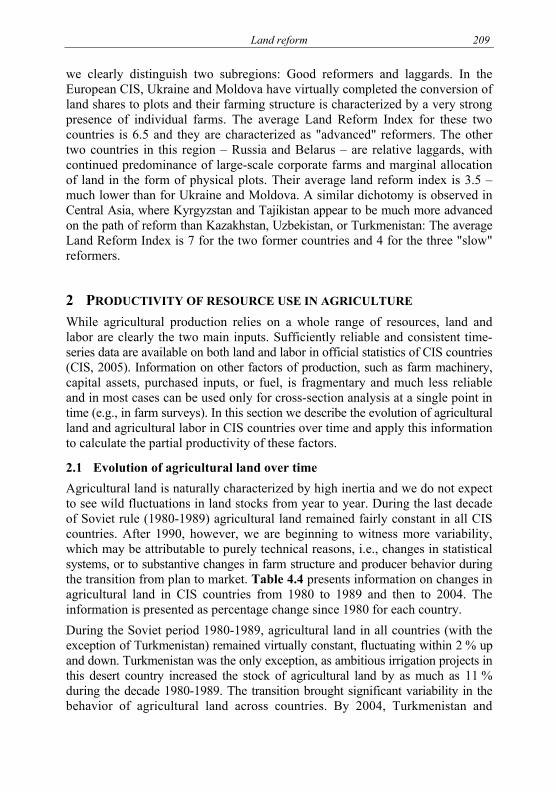
Land reform
209
we clearly distinguish two subregions: Good reformers and laggards. In the European CIS, Ukraine and Moldova have virtually completed the conversion of land shares to plots and their farming structure is characterized by a very strong presence of individual farms. The average Land Reform Index for these two countries is 6.5 and they are characterized as "advanced" reformers. The other two countries in this region – Russia and Belarus – are relative laggards, with continued predominance of large-scale corporate farms and marginal allocation of land in the form of physical plots. Their average land reform index is 3.5 – much lower than for Ukraine and Moldova. A similar dichotomy is observed in Central Asia, where Kyrgyzstan and Tajikistan appear to be much more advanced on the path of reform than Kazakhstan, Uzbekistan, or Turkmenistan: The average Land Reform Index is 7 for the two former countries and 4 for the three "slow" reformers.
2 PRODUCTIVITY OF RESOURCE USE IN AGRICULTURE While agricultural production relies on a whole range of resources, land and labor are clearly the two main inputs. Sufficiently reliable and consistent time-series data are available on both land and labor in official statistics of CIS countries (CIS, 2005). Information on other factors of production, such as farm machinery, capital assets, purchased inputs, or fuel, is fragmentary and much less reliable and in most cases can be used only for cross-section analysis at a single point in time (e.g., in farm surveys). In this section we describe the evolution of agricultural land and agricultural labor in CIS countries over time and apply this information to calculate the partial productivity of these factors.
2.1 Evolution of agricultural land over time Agricultural land is naturally characterized by high inertia and we do not expect to see wild fluctuations in land stocks from year to year. During the last decade of Soviet rule (1980-1989) agricultural land remained fairly constant in all CIS countries. After 1990, however, we are beginning to witness more variability, which may be attributable to purely technical reasons, i.e., changes in statistical systems, or to substantive changes in farm structure and producer behavior during the transition from plan to market. Table 4.4 presents information on changes in agricultural land in CIS countries from 1980 to 1989 and then to 2004. The information is presented as percentage change since 1980 for each country. During the Soviet period 1980-1989, agricultural land in all countries (with the exception of Turkmenistan) remained virtually constant, fluctuating within 2 % up and down. Turkmenistan was the only exception, as ambitious irrigation projects in this desert country increased the stock of agricultural land by as much as 11 % during the decade 1980-1989. The transition brought significant variability in the behavior of agricultural land across countries. By 2004, Turkmenistan and

Agricultural economics and transition
210
Azerbaijan had much more agricultural land than in 1980 (due to extensive irrigation projects). Uzbekistan and especially Kyrgyzstan and Kazakhstan had gone through a period of serious land abandonment. Russia and Ukraine registered moderate declines in agricultural land, also mainly through abandonment, while the remaining countries – Armenia, Tajikistan, Moldova, Georgia, and Belarus – maintained their agricultural land largely unchanged, although with a slight tendency to decline. Table 4.4: Change of agricultural land in CIS 1980-1989 and 1980-2004
(1980 = 100) 1980-1989 1980-2004
Country Percent of 1980
Characterization Percent of 1980
Characterization
Turkmenistan 111 Increase (irrigation) 134 Increase (irrigation) Azerbaijan 102 No significant change 113 Increase (irrigation) Armenia 101 No significant change 104 No significant change Tajikistan 102 No significant change 98 No significant change Moldova 98 No significant change 95 No significant change Georgia 101 No significant change 94 No significant change Belarus 97 No significant change 92 No significant change Ukraine 99 No significant change 89 Moderate decline Russia 98 No significant change 88 Moderate decline Uzbekistan 101 No significant change 76 Significant decline Kyrgyzstan 100 No significant change 45 Significant decline Kazakhstan 102 No significant change 40 Significant decline
There is no clear relationship between the changes in land during the transition and the Land Reform (or Policy Reform) Index in Table 4.3. Among the countries that did not experience a significant change in agricultural land, Armenia, Tajikistan, Moldova, and Georgia are all "advanced" reformers, but Belarus is a "slow" reformer. Two other "advanced" reformers – Ukraine and Kyrgyzstan – experienced a decline in agricultural land. This is especially so for Kyrgyzstan, where the huge scale of land abandonment has been comparable with that in Kazakhstan, one of the "slow" reformers. The last "advanced" reformer – Azerbaijan – records a significant increase in agricultural land due to expansion of irrigation, but so does Turkmenistan, a notorious "slow" reformer. Changes in agricultural land on their own are apparently driven more by regional and environmental factors than by land reform policies in the CIS countries.
2.2 Evolution of agricultural labor over time The share of agriculture in employment (expressed in percent of the total number of employed in the economy) increased over time in all CIS countries, with the exception of Belarus (Table 4.5). The countries that showed the strongest increase in the share of agricultural employment were Tajikistan, Kyrgyzstan, Armenia,

Land reform
211
and Moldova – four of the six "advanced" reformers where agriculture had been resolutely individualized. The additional labor force came into agricultural through layoffs in manufacturing industries, as the share of industrial employment decreased in all CIS countries between 1980-1989 and 1990-2004. The share of employment in other sectors (services, construction, extractive industries) shows a variable pattern: In some countries – Kazakhstan, Georgia, Azerbaijan, Russia, Ukraine, Uzbekistan – these sectors absorbed part of the slack from the shrinking industries, while in other countries – Armenia, Tajikistan, Kyrgyzstan, Moldova, and Turkmenistan – these sectors also shed labor and contributed to the increase in agricultural employment. Table 4.5: Changes in the share of employment in agriculture and industry
between 1980 and 2004 (percent of all employed in the economy) Agriculture Manufacturing industry Country 1980-1989 1990-2004 1980-1989 1990-2004
Tajikistan 42 58 14 10 Turkmenistan 40 45 11 11 Uzbekistan 38 40 15 13 Moldova 37 44 21 14 Kyrgyzstan 32 45 20 12 Azerbaijan 33 35 18 9 Georgia 27 30 19 15 Kazakhstan 23 26 21 16 Armenia 20 37 30 19 Ukraine 21 22 31 25 Russia 14 15 32 24 Belarus 23 17 30 28 Average CIS 29 34 22 16 Source: CIS (2005). We now proceed to examine the changes in the absolute number of employed in agriculture since 1980. The statistics include not only those who work for hire, but also the large contingent of self-employed, which are in fact the bulk of the agricultural labor in CIS. Because of huge differences in scale (ranging from about 10 million agriculturally employed in Russia to less than half a million in Armenia or Kyrgyzstan), the actual number of agricultural workers in each country is normalized to an index number with 1980=100. Changes in agricultural labor over time are thus expressed in percent of the number of employed in the base year of 1980. Figure 4.1 collapses the 12 country time series into three aggregate curves based on geographical location: One for the three Transcaucasian countries (Armenia, Georgia, Azerbaijan), one for the five Central Asian countries (Kyrgyzstan, Tajikistan, Turkmenistan, Uzbekistan, and Kazakhstan), and one for the four "European" countries (Russia, Ukraine, Belarus, and Moldova).
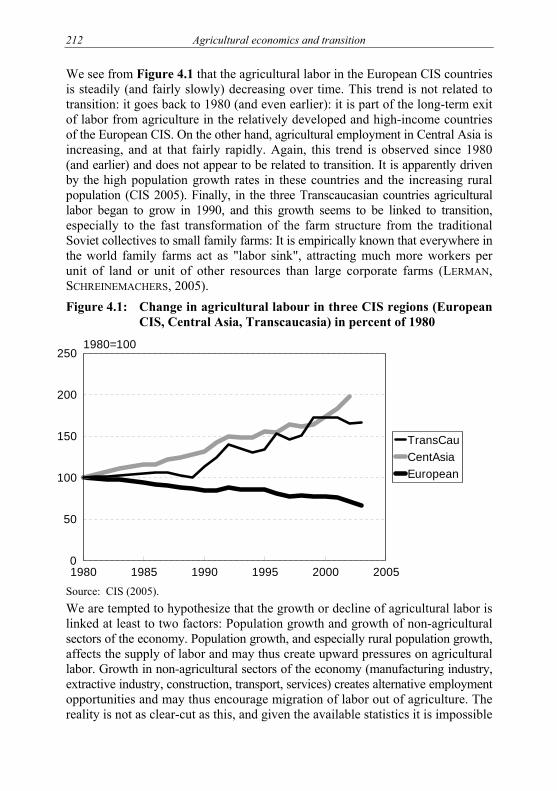
Agricultural economics and transition
212
We see from Figure 4.1 that the agricultural labor in the European CIS countries is steadily (and fairly slowly) decreasing over time. This trend is not related to transition: it goes back to 1980 (and even earlier): it is part of the long-term exit of labor from agriculture in the relatively developed and high-income countries of the European CIS. On the other hand, agricultural employment in Central Asia is increasing, and at that fairly rapidly. Again, this trend is observed since 1980 (and earlier) and does not appear to be related to transition. It is apparently driven by the high population growth rates in these countries and the increasing rural population (CIS 2005). Finally, in the three Transcaucasian countries agricultural labor began to grow in 1990, and this growth seems to be linked to transition, especially to the fast transformation of the farm structure from the traditional Soviet collectives to small family farms: It is empirically known that everywhere in the world family farms act as "labor sink", attracting much more workers per unit of land or unit of other resources than large corporate farms (LERMAN, SCHREINEMACHERS, 2005). Figure 4.1: Change in agricultural labour in three CIS regions (European
CIS, Central Asia, Transcaucasia) in percent of 1980
Source: CIS (2005). We are tempted to hypothesize that the growth or decline of agricultural labor is linked at least to two factors: Population growth and growth of non-agricultural sectors of the economy. Population growth, and especially rural population growth, affects the supply of labor and may thus create upward pressures on agricultural labor. Growth in non-agricultural sectors of the economy (manufacturing industry, extractive industry, construction, transport, services) creates alternative employment opportunities and may thus encourage migration of labor out of agriculture. The reality is not as clear-cut as this, and given the available statistics it is impossible
1980 1985 1990 1995 2000 20050
50
100
150
200
2501980=100
TransCauCentAsiaEuropean

Land reform
213
to identify rigorously the drivers of agricultural employment. Thus, the share of agriculture in GDP (unlike the share of agricultural employment!) is decreasing in all CIS countries: On average across all of CIS it dropped from 25 % of GDP in 1993-1998 to 17 % in 1999-2004, and this downward change is a reflection of persistent declines in each and every country in CIS (CIS 2005). The share of non-agricultural sectors in GDP correspondingly increases in all CIS countries, and we cannot use this crude percentage statistic to explain the highly variable changes in agricultural labor. The population growth statistics are better for our purposes, as the variability in annual population growth rates is quite high. For the 12 CIS countries we observe a positive relationship between the annual rates of change in agricultural labour and in rural population from 1990 to 2003. The coefficient of correlation is positive and significantly different from zero, but it is fairly low (0.5; the coefficient of correlation with total population growth is less than 0.3). Dichotomizing the 12 countries into those with growing rural population and those with declining rural population (6 countries in each group), we observe that in countries with growing rural population agricultural labor increases fairly fast (at an annual rate of nearly 3 % between 1990 and 2003), whereas in countries with declining rural population agricultural labor declines (at an annual rate of 0.5 % between 1990 and 2003). This provides some support for the hypothesis that population pressures are a driver for agricultural employment. Table 4.6: Growth of population and agricultural labor 1990-2003 (annual
rates of change in percent, unweighted averages)
Region Population Rural population
Agricultural labor
Countries with increasing rural population (6) 1.22 1.74 2.97 Countries with decreasing rural population (6) -0.83 -0.77 -0.51 Central Asia (5) 1.29 1.63 2.79 Transcaucasia (3) -0.50 0.15 3.16 European CIS (4) -0.66 -0.70 -2.16 Source: CIS (2005). Table 4.6 shows the average rates of change in rural population and in agricultural labor for the three regions presented in Figure 4.1. The decrease in agricultural labor in the European CIS is associated with decreasing population in general and decreasing rural population in particular. The increase in agricultural labor in Central Asia and Transcaucasia is associated with increasing rural population. It is interesting to note the difference in changes in total population and rural popu-lation in Transcaucasia. Total population growth in the three Transcaucasian countries is negative, and yet the rural population is increasing (albeit slightly). This is probably the result of civil unrest and outright war that plagued Transcaucasia in the early 1990s, resulting in massive refugee flows and urban-to-rural migration.
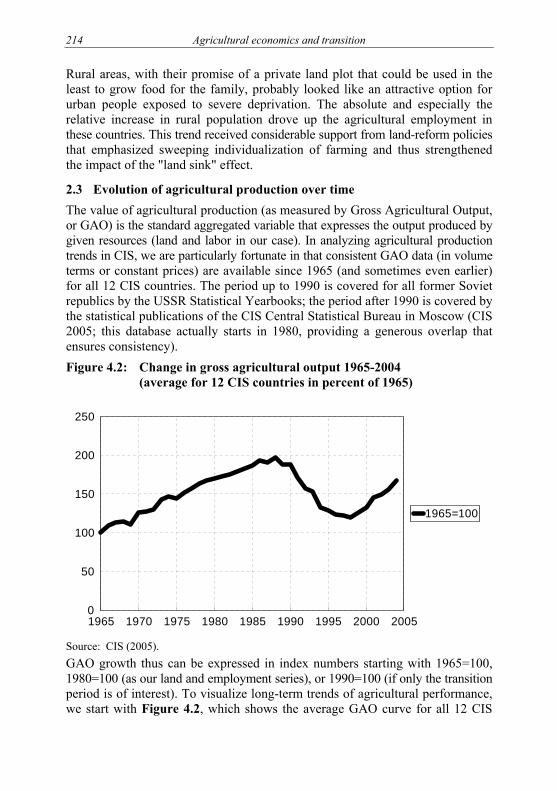
Agricultural economics and transition
214
Rural areas, with their promise of a private land plot that could be used in the least to grow food for the family, probably looked like an attractive option for urban people exposed to severe deprivation. The absolute and especially the relative increase in rural population drove up the agricultural employment in these countries. This trend received considerable support from land-reform policies that emphasized sweeping individualization of farming and thus strengthened the impact of the "land sink" effect.
2.3 Evolution of agricultural production over time The value of agricultural production (as measured by Gross Agricultural Output, or GAO) is the standard aggregated variable that expresses the output produced by given resources (land and labor in our case). In analyzing agricultural production trends in CIS, we are particularly fortunate in that consistent GAO data (in volume terms or constant prices) are available since 1965 (and sometimes even earlier) for all 12 CIS countries. The period up to 1990 is covered for all former Soviet republics by the USSR Statistical Yearbooks; the period after 1990 is covered by the statistical publications of the CIS Central Statistical Bureau in Moscow (CIS 2005; this database actually starts in 1980, providing a generous overlap that ensures consistency). Figure 4.2: Change in gross agricultural output 1965-2004
(average for 12 CIS countries in percent of 1965)
Source: CIS (2005). GAO growth thus can be expressed in index numbers starting with 1965=100, 1980=100 (as our land and employment series), or 1990=100 (if only the transition period is of interest). To visualize long-term trends of agricultural performance, we start with Figure 4.2, which shows the average GAO curve for all 12 CIS
1965 1970 1975 1980 1985 1990 1995 2000 20050
50
100
150
200
250
1965=100

Land reform
215
countries in percent of 1965. The GAO index numbers used to construct these curves were calculated as the simple (unweighted) arithmetic average of the 12 index numbers for all CIS countries. The GAO curve clearly shows that the agricultural history of CIS during the last 40 years can be divided into four consecutive phases: (a) Rapid and continuous agricultural growth between 1965 and 1985 (the Soviet
period before Gorbachev). (b) Stagnation going into slight decline between 1985 and 1990 (the last five years
of the Soviet regime under Gorbachev). (c) Steep decline during the first years of transition (1990-1997). (d) General recovery manifested in resumption of agricultural growth after 1997-1998. The four phases are clearly related to the policy environment. The stable supportive environment characterizing the traditional Soviet attitude toward agriculture was responsible for the growth in 1965-1985 (growth in production volumes, not necessarily in profitability or productivity). The weakening of the Soviet system under Gorbachev and the increasing policy uncertainty produced the stagnation phase in 1985-1990. The dismantling of the command economy in 1990 with the ensuing disruption of all supply and marketing channels was responsible for the transition decline in the first half of the 1990s. Finally, the implementation of substantive reforms after 1997 – in particular the shift to individual or family agriculture in a significant number of countries – triggered the recovery and resumption of agricultural growth. Figure 4.3: Change in gross agricultural output 1965-2004 (average for three
CIS regions in percent of 1965).
Source: CIS (2005).
1965 1970 1975 1980 1985 1990 1995 2000 20050
50
100
150
200
2501965=100
TransCauCentAsiaEuropean

Agricultural economics and transition
216
Figure 4.3 decomposes the single CIS curve of Figure 4.2 into three regional curves: Transcaucasia, Central Asia, and the European CIS (as in Figure 4.1 for labor). The four phases – growth, stagnation, collapse, and recovery – are clearly visible in each regional curve. The interesting difference is the shift of the point where recovery starts. In Transcaucasia recovery started as early as 1991-1992, because two of the three Transcaucasian countries – Armenia and Georgia – made resolute efforts to dismantle collective agriculture and distribute land to individual farms at the very beginning of transition. The rate of recovery subsequently accele-rated in 1998, when Azerbaijan adopted a farm individualization policy. In the European CIS, recovery started around 1998, as two of the four countries – Ukraine and Moldova – began moving in earnest toward distribution of land plots to holders of paper land shares. The extent of the recovery in this group is moderate, because two other countries – Russia and Belarus – have not done much by way of actual land reform. Finally, the recovery in Central Asia started in 1996-1997, when all countries began implementing various reform measures in various ways. It is particularly important to note that, alongside with conventional individualization of land tenure in Kyrgyzstan and Tajikistan, both Turkmenistan and Uzbekistan contributed to this recovery despite their image as "slow" reformers. In fact, these two countries allowed farm structure to shift from collective form of organization to family leaseholding. This is basically a form of individual farming (with many restrictions), although land in family leasehold is not counted as individual tenure in official statistics and is not reflected as an advance in land reform in the formal indexes. The traceable link between the beginning of recovery and the imple- mentation of significant farm structure reforms provides further evidence of the importance of policy decisions on agricultural performance.
2.4 Partial productivity of agricultural labor and land Productivity is usually calculated as the value of output per unit of input: Output per worker is the partial productivity of labor, and output per hectare is the partial productivity of land. Up to 1990, the value of output was published by statistical organs in constant rubles for all former Soviet republics, and productivity could be computed in these constant rubles per worker or per hectare. After 1991 the CIS countries abandoned the ruble and switched to different national currencies, so that productivity measures calculated using the value of output became non-comparable across countries. An alternative approach in this setting is to calculate the productivity index as the ratio of the GAO index to the index of the correspon-ding input (labor or land), making sure that both indexes are expressed to the same base year (for a justification of this technique see LERMAN et al., 2004, p. 173). We used the time series of index numbers for GAO, agricultural labor, and agri-cultural land to calculate for each country the two partial productivity indexes for the years 1980-2004 that include the different agricultural development phases discussed in the previous section.

Land reform
217
The two curves in Figure 4.4 show the partial productivity measures aggregated over all 12 CIS countries (simple average of the productivity index numbers). The productivity of both land and labor increased during the Soviet growth phase (up to about 1987) and then began to decline during the stagnation phase (1987-1990). The decline accelerated during the transition period and agricultural labor produc-tivity began to recover only in the late 1990s, when cumulative GAO growth had overtaken the general increase of agricultural labor. The productivity of land began to increase much earlier, in 1996, due to the huge abandonment of land (especially pastures) that Kazakhstan and Kyrgyzstan initiated at that time (see Table 4.4). Figure 4.4: Partial productivity of land and labor in CIS countries 1980-2004.
Labor productivity estimated excluding Belarus
Source: CIS (2005). The patterns of regional productivity change inevitably show some differences across CIS (Table 4.7). The Transcaucasian countries were characterized by relatively constant productivity (of both land and labor) until about 1987, when productivity began to decline. Productivity of land bounced back already in 1993-1994, probably due to the sweeping land reform that transferred land to individual farms and thus "activated" the incentives of private initiative and personal account-ability. Productivity of labor generally stagnated, also probably as a result of the transition to predominantly individual farming, which acts as a "labor sink" (LERMAN, SCHREINEMACHERS, 2005). In Central Asia, the productivity of both land and labor remained fairly constant until 1990, after which time the productivity of labor declined due to the growing population pressures. The productivity of land took off into the stratosphere in 1996, primarily due to the sweeping land abandon-ment programs in Kazakhstan and Kyrgyzstan. Nevertheless, the shift toward individualized farm structure in Tajikistan, Turkmenistan, and Uzbekistan on its own made a significant contribution to the improvement of land productivity. In
1980 1985 1990 1995 2000 20050
20
40
60
80
100
120
140
LandLabor

Agricultural economics and transition
218
the European CIS the productivity of land and labor followed identical paths: Increase up to 1989, decline between 1989 and 1997, modest recovery after 1997. Although the recovery in productivity in this region was modest, it is important to stress that the farm restructuring efforts in Moldova and Ukraine were sufficient to produce an upward shift in productivity after 1998-1999. Table 4.7: Changes in partial productivity of land and labor by region
1980-2004 (in percent of 1980) Transcaucasia Central Asia European CIS Index Year Index Year Index Year Productivity of land Transition decline begins 110 1987 110 1990 110 1989 Recovery begins 60 1993 90 1996 75 1997 Index in 2004 90 2004 240 2004 90 2004 Productivity of labor Pre-transition peak 110 1987 90 1990 120 1989 Recovery begins 40 2000 50 1997 75 1997 Index in 2004 55 2004 55 2004 90 2004
3 THE LINK BETWEEN PERFORMANCE AND POLICY We have demonstrated that the long-term pattern of agricultural development in the former Soviet Union and today’s CIS countries is driven by the political environment (Figure 4.2). We have also demonstrated that the cumulative effect of reforms eventually produced a significant recovery in agriculture. This did not happen immediately, as it took a better part of 10 years of sustained reforms for their impact to begin showing in agriculture, but eventually the predictions of Western scholars and experts materialized and agricultural growth resumed in the CIS countries. It is also quite clear that the exact timing of recovery is associated with the depth and decisiveness of agrarian reforms, specifically with the transition to individual farming. This link is demonstrated in Figure 4.3. Table 4.8: Hierarchical clustering of CIS countries by agricultural growth
and share of land in individual use Cluster Land in
individual use (2000)
Cumulative GAO growth
1996-2004
ECA ag policy reform index*
ECA land reform index*
1 Az, Arm, Kyr, Taj 27.5 160.7 6.8 8.0 2 Bel, Rus, Kaz 16.7 116.0 5.0 4.0 3 Geo, Mol, Ukr 30.7 102.3 6.1 6.7 4 Tur, Uzb 3.15 134.2 2.9 3.5
Note: * On a scale of 1 to 10, where 1 = command economy, 10 = economy with completed market reforms. Source: Averages calculated from CSAKI, KRAY (2005).

Land reform
219
Following the cue of Figure 4.3, we have tried to explore more rigorously the link between agricultural performance and the most obvious manifestation of policy reform in agriculture – the share of land in individual use. We have accordingly run hierarchical clustering of the CIS countries by the change in GAO from 1996 to 2004 as a performance measure and percent of agricultural land in individual use in 2000 as a reform measure. Cluster analysis has produced four sharply differen-tiated clusters of countries, which are shown in Table 4.8. In addition to the two basic variables used for clustering – agricultural growth as a performance measure and land in individual use as a reform measure – Table 4.8 shows two alternative reform measures: The ECA Agricultural Policy Reform Index and the Land Reform component of this policy index for the four clusters (for more details of these indexes see Table 4.3 and the discussion around it). For clusters 1 and 2, higher agricultural growth goes with more land in individual use: Cluster 1 lies to the "northeast" of cluster 2 in the appropriate plane. The two policy indexes move in the same direction: They are higher for cluster 1 than for cluster 2. All in all, cluster 1 (Azerbaijan, Armenia, Kyrgyzstan, and Tajikistan) has more land in individual use and is more advanced on the reform scale, and these factors are reflected in higher growth since 1996. Clusters 3 and 4 are outliers. Cluster 4 (Turkmenistan and Uzbekistan) should not surprise us: These countries do not have much land in individual use according to conventional statistics, their policy reforms are negligible, and yet they report exceptionally robust agricultural growth. Skeptics may attribute this to the vagaries of state controlled statistics, but we are convinced that the robust agricultural growth in Turkmenistan and Uzbekistan is associated with the special form of individualization through family leasehold practiced in these countries. Leaseholds are not counted as individual tenure in official statistics, but in fact leasehold farming is family farming for all intents and purposes. Cluster 3 – Georgia, Moldova, Ukraine – is a real surprise, however. These three countries have a lot of land in individual use and yet they display very sluggish growth performance. The ECA Agricultural Policy Index (complementing the Land Reform Index) may shed some light on this curious behavior: In these countries, the progress of reform is much below the level attained in cluster 1, where the countries have a comparable level of land individualization (Table 4.8). Less progress with reform than in cluster 1 translates into less growth despite the relatively high share of land in individual tenure. While cluster analysis reveals a positive relationship between GAO growth and policy reform measures, we have been unable to detect a statistically significant correlation between various performance measures and policy reform indices using raw country data without clustering. Further evidence of the link between agricultural performance and policy reform at the country level is provided by LERMAN et al. (2003), who estimate the growth in Total Factor Productivity (TFP) in agriculture for the CIS countries between 1992 and 1997. TFP growth

Agricultural economics and transition
220
is calculated by standard Solow growth calculus taking the ratio of the change in output to the change in the aggregated basket of inputs.3 TFP growth aggregating changes in productivity of land, labor, and other farm inputs constitutes a much more appropriate measure of performance improvement than GAO growth. Unfortunately, TFP growth is much more difficult to estimate than GAO growth, which explains why it is only seldom used in analysis. The agricultural TFP growth for 1992-1997 and the ECA Agricultural Policy Reform Index for 1997 are presented for the 12 CIS countries in Table 4.9. We clearly see a strong positive correlation between TFP growth and the policy reform index. The coefficient of correlation is 0.7, and only three countries – Kyrgyzstan, Kazakhstan, and Belarus – deviate from the nearly monotonic relationship between TFP growth and the policy index. These findings, like the clustering results, suggest that implemented policies affected recovery in agriculture. Table 4.9: Change in Total Factor Productivity (TFP) in agriculture and the
ECA Policy Reform Index for CIS ECA policy index 1997 TFP growth 1992-1997
Armenia 7.4 22.9 Georgia 6.2 32.9 Russia 6.0 7.4 Kyrgyzstan 5.8 −1.7 Kazakhstan 5.8 −5.2 Moldova 5.8 2.4 Ukraine 5.4 2.5 Azerbaijan 5.0 −3.9 Tajikistan 3.8 −11.5 Uzbekistan 2.2 −10.7 Turkmenistan 1.8 −29.4 Belarus 1.6 2.9
Source: LERMAN et al. (2003). Our final attempt to link agricultural performance with policy reform is based on a totally non-agricultural measure of reform. This is the so-called Sachs-Warner Openness Indicator, which dichotomizes countries into "open" and "closed" by a trade-based measure incorporating three dimensions: Tariffs, non-tariff barriers, and black-market premium on foreign exchange.4 Prior to 1994, all CIS countries were classified as closed. In 1994 only two CIS countries were classified as open: Moldova and Kyrgyzstan. Four more countries "opened up" between 1994 and 1996: Armenia, Georgia, Azerbaijan, Tajikistan.
3 The aggregated basket of inputs is calculated by weighting five conventional inputs – arable
land, agricultural labor, farm machinery, fertilizer use, and livestock – by the coefficients of the meta-production function estimated for the CIS countries.
4 The openness indicator was introduced by SACHS, WARNER (1995); some fascinating update work was done by WACZIARG, WELCH (2003).
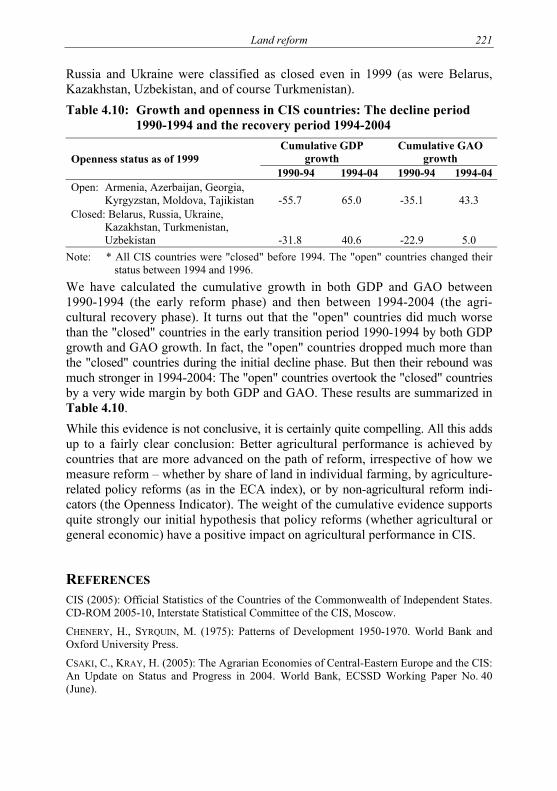
Land reform
221
Russia and Ukraine were classified as closed even in 1999 (as were Belarus, Kazakhstan, Uzbekistan, and of course Turkmenistan). Table 4.10: Growth and openness in CIS countries: The decline period
1990-1994 and the recovery period 1994-2004 Cumulative GDP
growth Cumulative GAO
growth Openness status as of 1999 1990-94 1994-04 1990-94 1994-04
Open: Armenia, Azerbaijan, Georgia, Kyrgyzstan, Moldova, Tajikistan -55.7 65.0 -35.1 43.3
Closed: Belarus, Russia, Ukraine, Kazakhstan, Turkmenistan, Uzbekistan -31.8 40.6 -22.9 5.0
Note: * All CIS countries were "closed" before 1994. The "open" countries changed their status between 1994 and 1996.
We have calculated the cumulative growth in both GDP and GAO between 1990-1994 (the early reform phase) and then between 1994-2004 (the agri-cultural recovery phase). It turns out that the "open" countries did much worse than the "closed" countries in the early transition period 1990-1994 by both GDP growth and GAO growth. In fact, the "open" countries dropped much more than the "closed" countries during the initial decline phase. But then their rebound was much stronger in 1994-2004: The "open" countries overtook the "closed" countries by a very wide margin by both GDP and GAO. These results are summarized in Table 4.10. While this evidence is not conclusive, it is certainly quite compelling. All this adds up to a fairly clear conclusion: Better agricultural performance is achieved by countries that are more advanced on the path of reform, irrespective of how we measure reform – whether by share of land in individual farming, by agriculture-related policy reforms (as in the ECA index), or by non-agricultural reform indi-cators (the Openness Indicator). The weight of the cumulative evidence supports quite strongly our initial hypothesis that policy reforms (whether agricultural or general economic) have a positive impact on agricultural performance in CIS.
REFERENCES CIS (2005): Official Statistics of the Countries of the Commonwealth of Independent States. CD-ROM 2005-10, Interstate Statistical Committee of the CIS, Moscow.
CHENERY, H., SYRQUIN, M. (1975): Patterns of Development 1950-1970. World Bank and Oxford University Press.
CSAKI, C., KRAY, H. (2005): The Agrarian Economies of Central-Eastern Europe and the CIS: An Update on Status and Progress in 2004. World Bank, ECSSD Working Paper No. 40 (June).

Agricultural economics and transition
222
CSAKI, C., NASH, J. (1998): The Agrarian Economies of Central and Eastern Europe and the CIS: Situation and Perspectives 1997. World Bank Discussion Paper 387.
LERMAN, Z., CSAKI, C., FEDER, G. (2004): Agriculture in Transition: Land Policies and Evolving Farm Structures in Post-Soviet Countries. Lexington Books, Lanham, MD.
LERMAN, Z., SCHREINEMACHERS, P. (2005): Individual Farming as a Labor Sink: Evidence from Poland and Russia. Comparative Economic Studies, 47(4), pp. 675-695.
LERMAN, Z., KISLEV, Y., KRISS, A., BITON, D. (2003): Agricultural Output and Productivity in the Former Soviet Republics. Economic Development and Cultural Change, 51(4), pp. 999-1018 (July).
SACHS, J., WARNER, A. (1995): Economic Reform and the Process of Global Integration. Brookings Papers on Economic Activity, 1, pp. 1-118.
WACZIARG, R., WELCH, K. (2003): Trade Liberalization and Growth: New Evidence, National Bureau of Economic Research. Working Paper 10152 (December). http://www.nber.org/papers/w10152/.
WORLD BANK (2005): World Development Indicators. http://go.worldbank.org/3JU2HA60D0/.

LAND MARKET DEVELOPMENT AND AGRICULTURAL PRODUCTION EFFICIENCY IN ALBANIA
KLAUS DEININGER, SARA SAVASTANO, GERO CARLETTO5
The World Bank, and University of Rome "Tor Vergata"
INTRODUCTION After nearly 15 years since the radical land reform started, and despite impressive achievements in terms of GDP rate of growth, and macroeconomic stability, Albania remains one of the poorest countries in Eastern Europe with a per capita income estimated at 2439 USD in 2004 (WDI, 2006). Contrary to most of the Eastern European countries, Albania followed a peculiar form of privatization of land, namely physical distribution of land among rural population and to workers of agriculture production cooperatives and state farms. This has resulted into a highly fragmented land market, with the fear that the presence of high transaction costs would not allow household to attain their optimal and efficient farm size. There may be still extensive opportunities in the sector of agriculture and that their utilization would help to stabilize or increase the growth rate of this sector. Whether agriculture can offer a future to the residents of Albania and the extent to which land markets can help overcome large differences between the ownership and the operational distribution of agricultural land are two issues of considerable interest In most of the transition countries, despite a clear evidence of land markets activity, the level of land sale and rental market is lower than one could expect after the transition We make use of data from the 2005 Albania Living Standard Measurement Survey in order to understand what are the factors affecting agriculture production and land market development, we will analyze stochastic frontier estimate to compute a measure of producers’ ability to assess the productivity-impact of land rental 5 The authors would like to thank The Governor of the Bank of Albania, Dr. Ardian Fullani,
and Prof. Adrian Civici – from the Agricultural University of Tirana –, for helpful advices and references, as well as to Andrew Dabalen and Carlo Azzarri for insightful comments and suggestions. The findings, interpretations, and conclusions expressed are entirely those of the authors, and they do not necessarily represent the views of the World Bank and its member countries, and of the Italian Ministry of Economic Development.

Agricultural economics and transition 224
and sale market. We will complement the study with the analysis of rental and sale market participation to assess whether land market can help to increase efficiency and overall equity. To do so we undertake two different empirical estimation procedures: A multinomial logit, and an ordered probit to verify that results are not dependent on arbitrary information. The structure of paper is as follows: The next section briefly reviews the history of land Reform in Albania. Section two and three review the relevant literature and derives the conceptual framework underpinning the empirical work in the paper. This is followed by descriptions of the data and the statistics for rural household involved in agriculture activities and specific information on rental and sale market. A subsequent section outlines the empirical analysis for technical efficiency and land market participation. The last section provides conclusions and implications.
1 LAND REFORM IN ALBANIA During the past decade the countries of Central and Eastern Europe (CEE) and the Commonwealth of Independent States (CIS) of the former Soviet Union have faced important land policy reforms. Since the privatization of land in Albania of 1991, a subsequent number of laws on the functioning of land markets have been introduced. The latest, in 2004, implements simplified procedures for compensation/restitution of land to former owners prior the first agrarian reform of 1945. The privatization process took two different forms: On the one hand Distribution of Tapi, ownership certificates to workers of ex APC and user rights later transformed into tapi to workers of SF. On the other hand, restitution/compensation to former owners (prior 1945), when the process of land confiscation started. Land privatization has resulted into fragmentation of land into a large number of plots of very small size. Small family farms dominate the agriculture sector in Albania. Because of existing conflict related to formal land registration, title security, conflicts over village borders and on compensation/restitution procedures, land market are still at an embryonic stage of the development.
2 CONCEPTUAL FRAMEWORK To assess the functioning of land rental markets and explore efficiency- and equity impacts of land rental restrictions, we use a model of producers who differ in endowments and skills and who face imperfect labor markets and transaction costs – further increased by policy-induced restrictions – in the land market (DEININGER et al., 2007).

Land reform
225
Let household i be endowed with fixed amounts of labor ( iL ) and land ( iA ), and a given level of agricultural ability ( iα ). We assume that there is no permanent farm labor market and that households can allocate their labor endowment between farming their land and off-farm employment at an exogenous wage ( iw ). Renting incurs transaction costs (T) proportional to the amount of land transferred. With this, household i will choose la*, lo*as well as A* by solving the maximization problem:
))(())((),(,
TrAAITrAAIwlAlfpaAl
Maxi
outii
inoii
aiia −−++−++ (1)
where p is the price of agricultural goods, lo is the amount of time allocated to off-farm labor (= a
ii lL − ), inI is an indicator for renting-in (=1 for rent-in, 0 otherwise), outI is an indicator for renting-out (=1 for rent-out, 0 otherwise), and all other variables are as defined above. Derivation and solution of the first order conditions allows us to derive three propositions, which form the basis for the empirical tests.
Proposition 1. The amount of land rented in is increasing in ability, α, decreasing in land endowment A , and if there is no market for farm machinery are non-tradable, in endowments with machinery. Therefore rental markets will transfer land to "poor but efficient" producers unless there are other imperfections. Proposition 2. Transaction costs drive a wedge between those renting in and those renting out with any increase in T decreasing αl and increasing αu, thereby expanding the range of producers who remain in autarky, reducing the number of households who participate in rental markets, as well as the amount of land transacted through rental markets. Proposition 3. Increases of the wage for off-farm employment will increase the amount of land transacted in rental markets and overall welfare. This will be asso-ciated with a decrease in the equilibrium rental rate and, in a risk-free environment, will make everybody better off.
3 EMPIRICAL IMPLEMENTATION 3.1 Stochastic frontier and technical efficiency In this paper we estimate technical efficiency using a stochastic frontier approach production function using a Cobb-Douglas on a sample of N farms in which an additional random error iv is added to the non-negative random variable,
iu , to provide:
iiii uvxy −+= )ln()ln( β Ni ,...2,1= (2)
where )ln( iy is the logarithm of the output for the i-th farm.

Agricultural economics and transition
226
ix is a (K+1)-row vector, whose first element is "1" and the remaining elements are the logarithms of the K-input quantities (or values) used by the i-th farm;
)',...,,( 10 Kββββ = is a (K+1)-column vector of unknown parameters to be estimated,
iv is two-sided error term representing the statistical noise and is assumed to be
normally distributed with mean 0 and variance 2
vσ and iu is a non-negative random variable, one-sided error term representing technical efficiency or agriculture ability (- iu is the technical inefficiency) in production of farms. We assume, along with the typical literature on stochastic frontier approach, that u follows a half-normal distribution with unknown mean and variance
]),[~( 2uimNu σ .
Once agriculture ability is estimated using a stochastic frontier approach, we can use this variable as a covariate in a probabilistic model trying to investigate the participation in land market (both rental and sale market).
3.2 Land market participation To verify the factor affecting the probability of participating in land markets, and to verify the effects of transaction costs on land market we use a modified ordered probit model that include specific variables explaining transaction cost. In this model, the cut-off point are not constant but depend on specific factors constraints. Equation (1) indicate that producers’ decision to enter land rental markets depends on their marginal productivity in autarky, MP( A ) as compared to the rental rate to be paid rin(T) or received rout(T) which is a function of transaction costs (TC). Formally, the three regimes are characterized by
⎪⎭
⎪⎬
⎫
>+<<+<=
<+>
)r(TC ε) AMP()r(TC ) A MP() r(TC
)r(TC ε) AMP(
ini
ini
out
outi
:)Aregime(Ain -Rent III.:)A(A regimeAutarky II.
:)A(A regimeout -Rent I.
i*i
i*i
i*i
(3)
A producer’s marginal product MP( A ), will depend on his or her ability (α), endowment with land ( A ), family labor ( L ), assets (K), and the opportunity cost of labor which will be affected by the level of education (E) and the presence of opportunities in the local off-farm labor market (O). Defining a well-behaved net earning function g(α, A , L ,K,E,O) with first derivative g’(.),we can write a linear version of the latter as MP( A )=g’(α, A , L ,K,E,O)= β0 + β1α + β2 A + β3 L + β4K + β5E + β6O. Transaction costs are expected to depend on legal title over land, household characteristics Z, credit variables, and community characteristics. Defining an index variable yi such that yi = 1 if A*< A ; yi = 2 if A*= A ; yi = 3 if A*> A , we can rewrite (10) as an ordered probit model that can be estimated using maximum likelihood methods.

Land reform
227
Variables we expect to affect marginal productivity are agricultural ability (α), the derivation of which will be done by means of the stochastic frontier estimate and will be discussed below, household characteristics, and wealth proxies.
4 DATA SOURCES AND DESCRIPTIVE STATISTICS Table 4.11 reports descriptive statistics based on the 2005 Albanian LSMS, and according to households that are renting in, renting out or in autarchy. Only 10 % of the rural households are involved in the rental market, and another 10 % in the sale market. The share of households that are renting in is, in average, 6.22 % and a remaining 3.62 % are renting out. On the sale side, the demand for land is only 6.65 % compared to 1.57 % of households that are selling land. Therefore, there is an excess of demand for land that can somehow explain low land price and high land rent. Land is farmed and owned by small family farms. Only 25 % of the household in the survey own more than 1.25 ha of land. The remaining 75 % of households own less than 1 ha of land. There is a discrepancy between ownership of land and land titling especially among very small holders. Only 47 % of the small farmers, have a legal title over the land they own. Few transactions occurs in land markets, and they are mostly informal, nonetheless, compared to 5 years ago (SARRIS, 2004), Albania has almost double the amount of land transacted in rental market and is reaching levels of others countries that have recently join EU such as Bulgaria, Romania, and Hungary. Land market is highly fragmented. Rural households own in average 3 plots of land of very small size. The average amount of land owned per household is 0.86 ha, whereas tenants cultivate 1.24 ha of land. Households that are renting in belong to larger households (with more than 5 members), with younger household head, relatively more educated (although education seem to be the same among house-holds). They rely on family labor, and have twice the value of profit per hectare of the average households. Remittances play an important role accounting for more than 28 % of total household income, and wages in off farm activities cover the remaining 20 %. However, the share of income from remittance of the tenants is less than half the share of the landlords. As a consequence, landlord prefer to use income from remittances to embark in riskier but more profitable and less labor intensive off-farm activities.
5 ECONOMETRIC RESULTS Tables 4.12 and 4.13 report the results of the stochastic frontier estimate and the determinants of agriculture efficiency. To diversify between factors affecting technical efficiency we have a set factors of production as predictor of the gross value of agriculture production and add some household characteristics as well as land titling and community variables to explain efficiency. The results indicate that most of the coefficients of the factors of production are positive and strongly

Agricultural economics and transition
228
significant, which means that agriculture income increases with the increasing use of each factor. The coefficient of land endowment and area of land irrigated, family labor, and input use are significant. Agriculture capital represented by water pump and number of machinery although not significant, they have the sign expected. One should note the extreme importance of irrigation for farming in Albania. Only 12 % of households have a water pump. Increasing access to irrigated system can increase agriculture income. The empirical evidence shows that productivity is low because most farms are inefficiently utilized, 46 % of all the observed variation in the output of farmers is attributed to the differences in technical efficiency. According to the estimated regression an additional plot of land for each household would change technical efficiency by 20 %, irrespective of the initial level of efficiency. Land consolidation by increasing the functioning of land market (rental and sale markets) and removing fragmentation could help to increase agriculture efficiency. Larger household, relying on family labor, not necessarily with more years of education of the head but receiving soil advices and having participated to irrigation program, who do not benefit from a large share of income from remittances, are more efficient. Having land through inheritance increase efficiency. Property rights have been distributed but registration of title matter although the survey does not contain information on this issue. The results from the analysis of the determinants of technical efficiency show that a joint effort which would reduce isolation (reduce the distance to banks) and provide credit (through private banks or government) would reduce inefficiency. Table 4.14 summarizes the determinants of land market participation and the transaction costs associated to it. Rental markets help to transfer land from less to more efficient producers, from smaller to larger family (labor abundant farmers both family and hired labor), to younger household head with more years of education. However, contrary to our expectations not from land abundant to land scarce producers. Remittances is an important determinant of land rental decisions suggesting that the larger the share of income from remittances the larger will be the probability of renting out and start off farm activities Results of the lower and upper bound regressions of the ordered probit can give an estimate of the transaction cost in rental market. A positive sign of the coefficient the in lower regression increase the probability of renting out increasing the range of household willing to rent out. The main factors that seem to affect transactions cost in rental market are credit constraints (represented by the distance from the community to the nearest bank), and land titling, namely having received a deed from land reform from 1991.
6 CONCLUSIONS AND POLICY IMPLICATIONS To improve rural incomes and, therefore, living standards, it will be crucial to raise agricultural productivity. The latter can be increased by removing the barrier

Land reform
229
to the functioning of rental market that allow transferring land to more productive producers. The results of our analysis point toward a failure of the purpose of land reform to distributed small plot in order to ensure equity among the farmers, encourage crop diversification, and lower the risk of production failure There are several constraints that Albanian farmers face in agriculture activity: Insecure property rights, labor constraints, inputs use constraints, credit constraints. Increasing tenure security, by facilitating formal land registration, and creating an efficient system of land administration, especially in rural areas, will increase the willingness to rent out or selling land. As a secondary result, land administration generates pro-poor growth by removing obstacles in the credit market, ensuring the use of land documents as a collateral for loans. Although Albania has a strong system of irrigation, as a result of the former state owned cooperative system, irrigation is not accessible for all plot and cause a major constraint in increasing agriculture productivity. Increasing access or implementing irrigation based investment as well as in infrastructure will help farmers to increase agriculture productivity. Table 4.11: Albania LSMS 2005 – Summary of main statistics GDP per capita in US$, (in 2004) 1463 All Rent in Rent out Per capita consumption US$ 1113 1093 1460 Per capita income US$ 959 803 1204 Income sources (share to total income)
wages % 21.4 19.2 20.4 non-agr business % 6.5 5.6 12.9 transfers % 28.5 22.3 50.9 own-farm production of crop % 15.2 17.9 5.5 own-farm production of livestock % 25.2 30.7 7.2 farm and non farm real estate assets % 3.2 4.3 3.1
HH size Nb. 4.6 5.1 3.5 Age of head years 52 47 56 Education. of head years 7.9 8.5 8.2 Land owned Ha 0.86 1.2 1.06 Land irrigated Ha 0.29 0.8 0.06 Nb. of plots Nb. 2.9 3.8 3.2 Total gross values Ag output/ha US$/Ha 1802 2157 276
% from crop % 14% 17% 18% % from tree crop % 6% 5% 18% % from livestock % 80% 77% 64%
Total profit/Ha (excluding hh labor) US$/Ha 1243 1308 162 Share with negative profits % 24.0 20.9 41.8 Source: Computed by authors.

Agricultural economics and transition
230
Table 4.12: Stochastic Frontier Estimate on gross value total agriculture production
Log Total Value of Ag. Production Log ha of land owned 0.440*** (3.41) Log area of land irrigated 0.019** (2.02) Log value of hired labor 0.050 (1.57) Log number of family members working on farm
0.330*** (4.53) Log cost of total inputs except hired labor)
0.491*** (18.58) # machine .096 (1.83) Dummy has water pump 0.050 (0.44) Constant 4.866*** (21.52) Observations 1796 Sigma v 46%
Source: Computed by authors. Notes: Dummies for districts estimated but not reported; absolute value of z statistics in
parentheses. * Significant at 10 %; ** Significant at 5 %; *** Significant at 1 %. Table 4.13: Determinant of Technical Inefficiency of total agricultural
production using village fixed effects (A negative sign of the coefficient increases farmer’s efficiency
Coef. Std. Err. z P>|z|
Nb. of plots -0.206 0.023 -9.010 0.000 Highest years of education in hh 0.042 0.012 3.620 0.000 Age of the head -0.008 0.003 -3.040 0.002 Household size -0.041 0.019 -2.080 0.037 Dummy has participated to an irrigation program -0.445 0.249 -1.790 0.073 Dummy has received soil advices -0.650 0.166 -3.900 0.000 Share transfer from total income 1.001 0.125 8.010 0.000 Nb. of years since land was acquired 0.004 0.004 0.870 0.386 Dummy has deed from land since 1991 -0.130 0.098 -1.330 0.184 Dummy land is inherited -0.427 0.088 -4.840 0.000 Community level variables Interaction between distance to bank and access to credit from govt and private bank -0.017 0.005 -3.670 0.000 Interest rate for getting a loan to start a small business at the community level 0.003 0.006 0.560 0.574 Dummy source of credit within the community 0.120 0.088 1.360 0.173 Constant 2.905 0.233 12.460 0.000
Source: Computed by authors.

Land reform
231
Table 4.14: Ordered probit on land market participation Participation to rental market Participation to
sale market Total land owned 0.174*** -0.240*** (2.70) (3.82)Technical Efficiency 1.070*** -0.132 (5.90) (0.64)Number of family member working on farm
0.233***
-0.088* (6.86) (1.85)Age head of hh -0.016*** -0.003 (4.40) (0.72)Years of education head of hh -0.012 -0.001 (0.86) (0.07)Wealth index -0.097 -0.088 (1.22) (1.19)Average share of hh in community who migrated
-0.017**
-0.009
(2.31) (1.20)infrastructure index -0.036 -0.105* (0.71) (1.89)Dummy conflict over land in community 0.060 -0.011 (0.59) (0.11)Dummy for Central Regions -0.231 -0.930*** (0.80) (2.71)Dummy for Mountain Regions 1.264*** -0.489 (3.38) (1.24)Constant 4.612*** 0.769 (8.50) (0.75)
Lower bound regression Dummy has deed from land since 1991 1.046*** (3.40) Share of land with deed 1991 in the community
-2.439**
(2.10)Dummy land is inherited -0.117 -0.310 (0.55) (1.20)KM from community to nearest bank -0.012 -0.016** (1.38) (2.05)Community: Access to credit from bank (gvt. or private)
0.003
0.091
(0.02) (0.44)Upper bound regression
Share of land with deed 1991 in the community
-0.743
-0.530
(0.83) (0.71)KM from community to nearest bank 0.009* 0.019* (1.84) (1.81)Community: Access to credit from bank (gvt. or private)
-0.125
-0.166
(1.00) (1.32)Observations 1795 1795
Notes: Dummies for districts estimated but not reported; robust z statistics in parentheses. * Significant at 10 %; ** Significant at 5 %; *** Significant at 1 %

Agricultural economics and transition
232
REFERENCES CIVICI, A. (1997): "L’Albanie – une Agriculture en Transition". Série Options Méditerranéennes, Nr. 15. publication du CIHEAM-IAM.M, Montpellier, p. 159.
CIVICI, A. (2001): Evolution des Politiques Foncières et Dynamiques des Espaces Ruraux en Albanie. In: Terres Méditerranéennes – Le morcellement, Richesse ou Dangers ? Editions: Karthala – CIHEAM.
COELLI, T. J. (1995): Recent Developments in Frontier Modelling and Efficiency Measurement. Australian Journal of Agricultural Economics, 39(3), pp. 219-245.
CUNGU, A., SWINNEN, J. (1999): Albania’s Radical Agrarian Reform. Economic Development and Cultural Change, 47(3), pp. 605-619.
DEININGER, K., JIN, S., NAGARAJAN, H. K. (2007): Efficiency and Equity Impacts of Rural Land Rental Restrictions: Evidence from India. World Bank Policy Research Working Paper. World Bank, Washington, D.C.
DEININGER, K., SARRIS, A., SAVASTANO, S. (2004): Rural Land Markets in Transition: Evidence from six Eastern European Countries. Quarterly Journal of International Agriculture, 43(4), pp. 361-390.
GURI, F., JOUVE, A. M. (2004): Exploitation ou Famille: La transmission de la Propriétés Foncière dans les Exploitations Agricoles du Littoral Albanais (cas de Spillej). Unpublished.
LERMAN, Z., CSAKI, C., FEDER, G. (2002): Land Policies and Evolving Farm Structures in Transition Countries. Policy Research Working Paper 2794. The World Bank, Washington D.C.
SARRIS, A., SAVASTANO, S., CHRISTIAENSEN, L. (2006): Agriculture and Poverty in Commodity Dependent African Contries. FAO Commodities and Trade Technical Paper n. 9.
SARRIS, A., SAVASTANO, S., TRITTEN, C. (2004): Factor Market Imperfections and Polarization of Agrarian Structures in Central and Eastern Europe. Paper presented at the IAMO Forum, 4-6 November, 2004.
SVINNEN, J., VRANKEN, L., STANLEY, V. (2005): Emerging Challenges of Land Rental Markets a Review of Available Evidence for the Europe and Central Asia Region. Europe and Central Asia Working Paper. The World Bank, Washington D.C.

THE PERSISTENCE OF THE CORPORATE FARMS: THEY SURVIVED THE TRANSITION BUT DO THEY HAVE FUTURE UNDER THE CAP
LAURE LATRUFFEA, SOPHIA DAVIDOVAB, GEJZA BLAASC a INRA, Rennes (France). E-mail: [email protected]
b Kent Business School, the University of Kent, Imperial College Wye Campus, Wye Ashford Kent TN25 5AH, UK. E-mail: [email protected]
c Research Institute of Agricultural and Food Economics (Slovakia). E-mail: [email protected]
1 INTRODUCTION On the basis of theoretical arguments concerning the superior efficiency of family farming, many predicted the disappearance of cooperatives and other large corporate farms, as variations in productivity would lead to a wholesale transfer to individual farming (for a summary of the debate, see GORTON, DAVIDOVA, 2004). Empirical evidence on changing farm structures in Central and Eastern European countries (CEECs) indicates that during the period of transition the corporate sector role in agriculture has shrunk, but in many CEECs the sector has survived and proved to be competitive under market conditions. The uncertainty is to what extent the corporate farms would be resilient to the new policy environment after the accession to the European Union (EU) and the introduction of the Common Agricultural Policy (CAP) decoupled Single Area Payment (SAP). The land-owners who have left their land within the corporate farms could now cash the SAP themselves, providing they keep their land in good agricultural and environmental conditions (GAEC). They, therefore, have more incentives to withdraw their land from the corporate farms putting the future of those farms, who rent almost 100 % of their land, at stake. This paper attempts to provide some insights into the future of corporate farming under the CAP payments. The case study country is Slovakia as there the extent of land used by corporate farms is still the highest among the New Member States (NMS). In 2005, the share of corporate farms in the total utilised agricultural area (UAA) was 85 % (GREEN REPORT, 2006). Several reasons have been identified as responsible for the persistence of corporate farms in Slovakia during the period of transition. They include low profitability and low level of incomes in agriculture, a decline in domestic demand and a loss of export market share, deteriorating internal terms of trade, a lack of input market
Agricultural economics and transition 234
infrastructure and output marketing channels for individual producers (BLAAS, 2002). Other reasons were the protracted identification of land titles (still currently about 500,000 ha of land lack clear ownership titles), fragmentation of land owner-ship and the very slow land consolidation process. MATHIJS and SWINNEN (1998) elaborated a series of propositions to explain the decisions of individuals to exit from the corporate farms and start an individual venture. They asserted the assumption that the corporate farms’ insiders would be the agents who would undermine the corporate farms and establish a new pattern of family farm structures. According to empirical evidence accumulated during tow decades of transition, more significant actors who established new individual entities were the absentee landowners – the persons who received land in the process of restitution. Among the insiders, only those with skills, e.g. the former cooperative managers, tended towards individual farming. Farm surveys indicated that other "insiders", cooperative farm members, did not possess the proper pre-conditions for starting an individual business (BLAAS, 1995). Only less than one-third of the cooperative members owned land or were expecting to inherit land and only a small share of them owned a land area sufficient for a full-time farming. The majority of those cooperative members who were landowners (57 %) had only five or less hectares.
2 WHAT COULD CHANGE UNDER CAP SAP? As mentioned in the previous section, several factors influenced the landowners’ decision to leave the land within the corporate farms during the period of transition. However, this situation might change as the landowners can now cash the SAP themselves, providing they keep their land in GAEC. The main conflict that could undermine the long-term existence of corporate farms under the CAP SAP concerns the distributional issues that may arise in relation to the way profit (including the CAP payments) will be distributed between rentals, dividends, wages and investment. As noted by BREM and KIM (2000), a corporate farm can be considered as an economic organisation consisting of different interest groups (the various stakeholders) who bargain on the objectives of this organisation: Landowners, capital holders, workers and managers. The separation of ownership and control might induce managers to fulfil objectives that are not the other stakeholders’ objectives, such as increasing the farm’s size (JENSEN, MECKLING, 1976; WILLIAMSON, 1983). In the corporate farms, landowners have three options available concerning the returns on their land. The first option is "no change", which means to keep the land in the farm for the same rent. The second option is to ask for a rent increase and the third one is to withdraw the land from the corporate farms. Landowners will choose option two if they are not happy with the current level of the rent and option three if the rent renegotiations with the farm managers are unsuccessful.

Land reform
235
Three propositions are put forward about the frequency with which these options may occur. As the negotiations between corporate farm managers and landowners about the level of rent are at the core of the issue, game theory has been employed as a framework to aid in generating prior expectations. In order to ease the understanding of how the propositions have been generated, a simple game is used (for more details, see LATRUFFE, DAVIDOVA, 2007). The game includes two representative players, the manager and a landowner, and is a non-cooperative static one. The negotiation process is one-shot; the manager and the landowner meet together once to decide about the level of the rent and make simultaneous offers. It is assumed that only two offers are possible, a low rent, that is the rent usually paid to the landowners, and a high rent, that includes an increase following the renegotiation. If both players choose the same action, they reach an agreement and the landowner rents the land out to the farm for the specific rent level agreed upon. If the rent is low, the outcome is thus "no change", while if the rent is high, the outcome is "rent increase". If the farm’s manager proposes a high rent while the landowner asks for a low rent, it is straightforward to assume that there is an agreement on renting the land at a high rent and the outcome is "rent increase". Finally, if the farm’s manager offers a low rent but the landowner asks for a high rent, there is no agreement and the rental contract is ended; the outcome is "land withdrawal". The landowner’s choice of action depends on whether they have a better oppor-tunity elsewhere. For this reason two types of landowners have been introduced. Type 1 is a landowner who has a better opportunity for the land outside the corporate farm and who represents a credible threat of withdrawal, while type 2 does not. There is asymmetric information about the landowners’ type. Although managers have information about the plots’ characteristics, they are not fully informed about their landowners’ values and situation, as most of them are absentee landowners living in cities. So far, however, the whole game has been based on the assumption that the corporate farm is able to offer the two levels of rent. If the farm is financially constrained and cannot afford a rent increase, in the case of a type 2 landowner (no credible threat) the solution will still be to rent the land for low rent, but in the case of a type 1 (credible threat) the solution will be withdrawal. In summary, the frequency of each of the three outcomes depends on the type of landowner and of the farm financial constraints. Proposition 1: Before the implementation of the CAP, the outcome "no change" was more frequent than the outcomes "rent increase" and "land withdrawal". The outcome "no change" prevailed as many farms were financially constrained due to the low profitability or loss-making (by the same token most landowners had no better alternatives to receive higher returns on their land outside the corporate farm).

Agricultural economics and transition
236
Proposition 2: After the implementation of the CAP, the frequency of the outcome "no change" will decrease. Proposition 3: After the implementation of the CAP, the outcome "withdraw land" will be more frequent than before but not to the extent to undermine the existence of the corporate farms. It is expected that the frequency of the outcome "no change" might decrease following the CAP implementation, as more landowners might be able to make a credible threat of withdrawal due to an increased demand for land. Also, the SAP delivered without attached requirements to produce might give incentives to landowners to manage their land themselves if the profit from it (taking into consideration the cross-compliance costs) were to exceed the rent they receive in the corporate farms. Hence, it can be expected that more landowners will want to change their situation and renegotiate their rent. However, despite an increase in rent renegotiations, withdrawals are not expected to be massive for two reasons. First, the introduction of the SAP will relax farm financial constraints and thus more farms will be able to offer a higher rent. Second, the overall number of landowners with credible threat of withdrawals will not rise considerably in the next few years. This will be due in part to the typical small scale land ownership in Slovakia and the relatively low direct payments per hectare due to the phasing-in. The other reason is that the landowners, most of whom are absentee, might still prefer to have their land managed by somebody else and often the corporate farm is the obvious choice.
3 DATA A survey of corporate farms in Slovakia was carried out within the EU FP6 IDEMA project. The questionnaire accounted for the specificity of corporate farms with their complex organisation involving several stakeholders. Face-to-face interviews of 152 corporate farms, including 101 cooperatives and 51 companies, were carried out. In order to have a better understanding of the structural farm characteristics, the surveyed farms were matched with their Farm Accountancy Data Network (FADN) entries averaged for 2001/2002. The farms surveyed have hundreds of private landowners who own on average 68 % of the total land rented by the farm. Another 24 % of the land is rented from the State and the remaining 8 % from the Church and municipalities. The average rent indicated by both FADN records and respondents is consistent, about 14 Euro per ha (the cooperatives pay a lower rent than the companies).

Land reform
237
4 ANALYSIS OF THE SURVEY RESPONSES 4.1 Relation with the landowners In the past, about one third of the farms had received requests for a rent increase, but by only 8 % of their landowners (Table 4.15). Among these farms, 39 % increased the rent; the remaining refused, justifying their refusal by financial constraints. On average 3 % of the sample farms’ UAA was withdrawn accounting for about 2 ha per landowner. The large majority of the individuals who withdrew land wanted to start their own farm. The fact that only few landowners asked for a rent increase or withdrew land, as stated by the corporate farms’ respondents, supports Proposition 1 concerning the prevalence of the status quo in the past. Comparing the legal forms, the main difference is that more companies (63 %) than cooperatives (25 %) accepted the requests for a rent increase. This might be explained by the larger returns generated by companies which made them more flexible. Table 4.15: Past pressures on privately rented land (% in brackets) All farms
(152 farms) Cooperatives (101 farms)
Companies (51 farms)
Requests for a rent increase Farms that had requests for a rent increase
51 (34) 32 (32) 19 (37)
Landowners who requested a rent increase
48 (8) 48 (5) 49(12)
Reason given by landowners for the request
Able to get higher rent elsewhere; heard that other landowner had an increase
Farms that accepted to increase the rent *
20 (39) 8 (25) 12 (63)
Land withdrawals Farms who experienced withdrawals
89 (59) 62 (61) 27 (53)
Landowners who withdrew 27 (3.5) 27 (3.6) 25 (3.4) Total UAA withdrawn from the farm; ha (% of UAA)
52 (3) 56 (3.5) 42 (1.9)
Note: * In brackets: As a percentage of farms having had requests for a rent increase. Corporate farms’ respondents were then asked to give their opinion on the possible future pressures. Three quarters of the respondents expect some request for a rent increase, but few of them believe that land withdrawals will take place (Table 4.16). This also supports Propositions 2 and 3 that the "no change" option will be less frequent in future but those withdrawals of land from the corporate farms will not be massive. However, if this is true on average, financially constrained farms may quickly loose their capacity to compete for land in the conditions of increased demand which has started being observed in the NMS after the EU

Agricultural economics and transition
238
accession. Therefore, a substantial structural change might be expected within the corporate farm sector with a better allocation of land to the more efficient users. Table 4.16: Sample farms’ expectations about their landowners’ future
behaviour (%) All farms
(152 farms) Cooperatives (101 farms)
Companies (51 farms)
Share of farms that expect SAP to induce more requests for a rent increase
76 75 77
Share of farms that expect SAP to induce more land withdrawals
20 20 20
Farms whose respondents do not think that the SAP will change their landowners’ behaviour have already had a larger share of rentals in their cost of production structure (2.6 % against 1.9 % for the remaining sample farms). Farms whose respondents believe that the SAP will give incentives to their landowners to with-draw rather than ask for a rent increase are more often located in unfavourable areas, have already experienced more withdrawals and have a larger share of indi-vidual landowners in their land portfolio. However, landowners are only one of the stakeholders in the corporate farms. The overall profit allocation provides a broader picture as it involves the interests of other stakeholders as well.
4.2. Past and intended future farm profit allocation In the past the profit was used, first, to finance the current expenses, and second, for investment (Table 4.17). The increase of rental payments was the least used option. This confirms the above findings that few farms accepted their landowners’ requests for a rent increase on the grounds that they could not afford it. This is also consistent with the theoretical argument that when the control and ownership are separated, managers may have an agenda of their own, often different from the one of the factor owners. The respondents were also asked to rank the same options from the least probable to the most probable in future, taking in consideration the SAP. It appears that there is a strong past dependency; the preferences for the future appear to be similar to the past. The most favoured option is to finance the farm current operations, followed by investment. The increasing of the land rent is still the least preferred option.

Land reform
239
Table 4.17: Past and future use of profit by the sample farms All farms
(152 farms) Cooperatives (101 farms)
Companies (51 farms)
Profit used for: (% of respondents who answered yes to an option)
Farm current operations 63 64 61 Investment 50 46 59 Dividends 20 18 24 Land rent increase 5 6 2 Other 18 19 18
Profit will be used for: (% of respondents who ranked an option as most probable)
Farm current operations 71 71 69 Investment 24 26 22 Land rent increase 1 6 0 Other 4 3 6
ANOVA was carried out to disentangle the farm characteristics that may explain the variations in the farms’ decisions regarding the distribution of their profit. The results show that those farms which in the past did not allocate any profit to investment have a higher share of livestock production in their output mix and they are farms that did not benefit much from the investment subsidies. This tends to suggest that some of the variations were induced by policies which might have stimulated investments in certain types of production. These farms are also smaller measured by the land area and pay a lower rent to their landowners. The only significant difference between the cohorts of farms that used part of their profit to increase the land rent and the farms that did not allocate any profit to rent increases, lies in the type of owners (credible threat of land withdrawal) and the managers’ information about the type of landowners. Forty three percent of farms that used some profit for rent increases knew that some of their landowners had been offered a higher rent outside the corporate farms (this percentage is only 18 amongst the farms that did not increase the rents). Regarding the intended future use of farm profit, farms that are less likely to reinvest profits have received a smaller amount of investment subsidies in the past (7.1 against 25.4 thousand Euro). Farms that in future intend to allocate some of their profit to rent increases have received in the past more other (i.e. not investment) subsidies per ha, which suggests that they might be less financially constrained. An interesting policy insight is provided by the study of the relation between the farm intentions for a future use of profit and their trust in the irreversibility of decoupling. It is proposed that farm intentions concerning their future use of profit depend on whether farm managers/directors believe that the decoupling is a sustainable policy or they expect another policy switch, either towards coupled payments or a full removal of farm support. First, the farms have been clustered
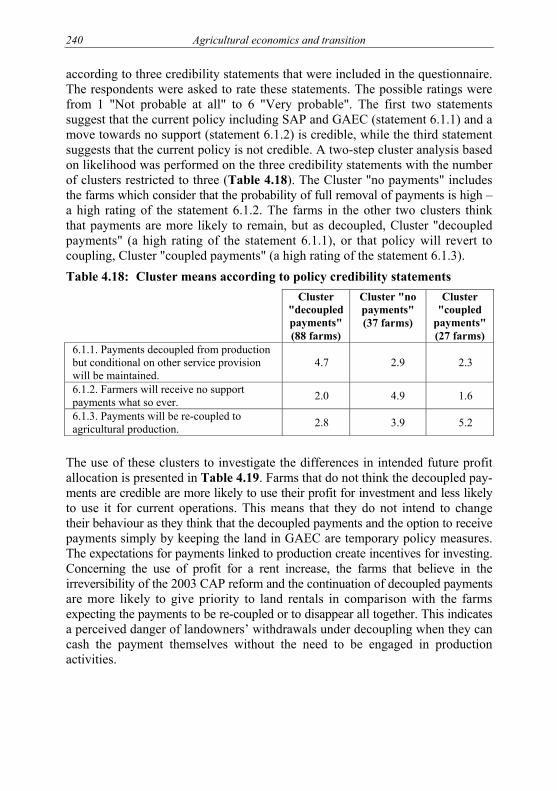
Agricultural economics and transition
240
according to three credibility statements that were included in the questionnaire. The respondents were asked to rate these statements. The possible ratings were from 1 "Not probable at all" to 6 "Very probable". The first two statements suggest that the current policy including SAP and GAEC (statement 6.1.1) and a move towards no support (statement 6.1.2) is credible, while the third statement suggests that the current policy is not credible. A two-step cluster analysis based on likelihood was performed on the three credibility statements with the number of clusters restricted to three (Table 4.18). The Cluster "no payments" includes the farms which consider that the probability of full removal of payments is high – a high rating of the statement 6.1.2. The farms in the other two clusters think that payments are more likely to remain, but as decoupled, Cluster "decoupled payments" (a high rating of the statement 6.1.1), or that policy will revert to coupling, Cluster "coupled payments" (a high rating of the statement 6.1.3). Table 4.18: Cluster means according to policy credibility statements
Cluster "decoupled payments" (88 farms)
Cluster "no payments" (37 farms)
Cluster "coupled
payments" (27 farms)
6.1.1. Payments decoupled from production but conditional on other service provision will be maintained.
4.7 2.9 2.3
6.1.2. Farmers will receive no support payments what so ever. 2.0 4.9 1.6
6.1.3. Payments will be re-coupled to agricultural production. 2.8 3.9 5.2
The use of these clusters to investigate the differences in intended future profit allocation is presented in Table 4.19. Farms that do not think the decoupled pay-ments are credible are more likely to use their profit for investment and less likely to use it for current operations. This means that they do not intend to change their behaviour as they think that the decoupled payments and the option to receive payments simply by keeping the land in GAEC are temporary policy measures. The expectations for payments linked to production create incentives for investing. Concerning the use of profit for a rent increase, the farms that believe in the irreversibility of the 2003 CAP reform and the continuation of decoupled payments are more likely to give priority to land rentals in comparison with the farms expecting the payments to be re-coupled or to disappear all together. This indicates a perceived danger of landowners’ withdrawals under decoupling when they can cash the payment themselves without the need to be engaged in production activities.

Land reform
241
Table 4.19: Intended future use of profit by the sample farms according to their perception about policy credibility
Cluster "decoupled payments" (88 farms)
Cluster "no payments" (37 farms)
Cluster "coupled
payments" (27 farms)
Share of farms giving priority to (%)* investment current operations rent increase
21 74 13
22 73
3
41 59
0 Note: * Farms are classified as giving priority to a particular option if they ranked the option
as the most probable (rank 1) for investment and current operations, and the most or relatively probable (ranks 1 and 2) for a rent increase.
5 CONCLUSIONS AND IMPLICATIONS The widespread existence of corporate farms in the NMS has raised doubts about their viability under the CAP SAP. The preference of the newly emergent landowners in the 1990s to leave their land in the corporate farms was linked to the low level of farm profitability and the high risk in the general economic environment. This was coupled with the fact that many city dwellers received land during the post-communist land reforms but did not have skills and experience in farm production and management. The accession to the EU and the introduction of the CAP support, and in particular the SAP, have improved the market condi-tions in the NMS and increased farm incomes. The main question analysed in this paper is whether under these circumstances the landowners would still prefer to leave their land in the corporate farms or whether a quick disintegration of these organisations will be witnessed. There are variations in the corporate farms’ attitude toward rent increases. Overall, the corporate farm management rarely puts the land rent increase as a future priority. However, larger farms which are more dependent on numerous land-owners give a higher priority to the use of future profits to reward landowners than the smaller farms do. Also, farms that trust the policy drive to decoupling and perceive the 2003 CAP reform as irreversible are keen to use the profit for rent increases. They realise that the decoupled payments that do not require production are easier to be captured by the individual landowners and that they have to share with the factor owners the increase in the value of land resulting from the capitalisation of support. This indicates a perceived danger of landowners’ withdrawals under decoupling. Farms that do not think the decoupled payments are credible are more likely to use their profit for investment. They do not intend to change their behaviour as they think that the decoupled payments and GAEC are temporary policy instruments. The expectations for payments linked to production create incentives for investing.

Agricultural economics and transition
242
Overall, the main policy conclusion is that the SAP will induce more landowners to review their situation within the corporate farms and try to capture the capitali-sation of the SAP through higher rents. However, it is unlikely that they will massively withdraw their land from the corporate farms. Therefore, the expected behaviour of landowners does not put the very existence of the corporate farms under question, at least within the short- to mid-term horizon. However, if this is true on average, financially constrained farms may quickly loose their capacity to compete for land in the conditions of an increased land demand which has started being observed in Slovakia and the other NMS after the EU accession. Therefore, a substantial structural change might be expected within the corporate farm sector with a better allocation of land to the more efficient users.
ACKNOWLEDGEMENTS The authors are grateful to Marian Bozik who contributed to the survey’s design and implementation, and helped with useful comments and clarifications. This paper has benefited from the financial support of EU FP6 IDEMA project SSPE-CT-2003-502171. The views expressed are those of the authors.
REFERENCES BLAAS, G. (1995): Agriculture in Slovakia – A forced re-structuring? Sociologia (Slovak Sociological Review) 27(7-8), pp. 134-141.
BLAAS, G. (2002): Is the completion of agricultural reforms in Central and Eastern Countries conditional on move to family farming? In: IEDA, O. (ed.): Transformation and Diversification of Rural Societies in Eastern Europe and Russia. Slavic Research Centre Hokkaido University, Sapporo, pp. 159-179.
BREM, M., KIM, J.-M. (2000): A status of agricultural producer cooperatives in East European Countries. Korean Journal of International Agriculture, 12(3), pp. 238-256.
GORTON, M., DAVIDOVA, S. (2004): Farm productivity and efficiency in the CEE applicant countries: A synthesis of results. Agricultural Economics, 30, pp. 1-16.
GREEN REPORT (Report on State of Agriculture and Food Sector) (2006): Ministry of Agriculture of SR, Bratislava.
JENSEN, M., MECKLING, W. (1976): Theory of the firm: Managerial behavior, agency costs and ownership structure. Journal of Financial Economics, 3, pp. 305-359.
LATRUFFE, L., DAVIDOVA, S. (2007): CAP direct payments and distributional conflicts over rented land within corporate farms in the New Member States. Land Use Policy, 24, pp. 451-457.
MATHIJS, E., SWINNEN, J. (1998): The economics of agricultural decollectivization in east Central Europe and the former Soviet Union. Economic Development and Cultural Change, 47(1), pp. 1-26.
WILLIAMSON, O. (1983): Organization form, residual claimants, and corporate control. Journal of Law and Economics, 26, pp. 351-366.

LAND USE AND LAND REFORM IN SOME FORMER CENTRAL AND EAST EUROPEAN COUNTRIES
KATALIN TAKÁCS-GYÖRGYA, ANNA BANDLEROVAB, ADAM SADOWSKIC a Szent István University, Department of Farm Management and Economics, Hungary. H-2103 Gödöllő, Páter K. u. 1. Hungary. E-mail: [email protected]
b Agricultural University of Nitra, Slovak Republic, E-mail: [email protected] c University of Bialystok, Faculty of Economics and Management Poland,
E-mail: [email protected]
1 INTRODUCTION The role and importance of agriculture has decreased within the national economy in Central and Eastern European countries. Although the agriculture was different before the social-economic transition in Hungary, Slovak Republic, Poland, following the integration into the European Union, similarities can be found in the role of agriculture in these countries. The property structure and land use can be characterized by dichotomy that is the large and middle-scale farms, which provide the major portion of commercial agricultural production, operate simultaneously with small-size farms which produce primarily for self-consump-tion. The importance of farm land leases is increasing and the rate of tenancy is growing. Agricultural land prices were gradually increasing in the examined countries during the past decade, but in general they remain below the level of farm land prices in the EU-15 countries. Prior to the EU accession it was expected that agricultural land would be cultivated mostly by owners. However, these expectations have not been met and a large number of agricultural land owners are interested in land sale or lease, and they are withdrawing completely from farming. The increased interest in land sales or lease will influence the leasing conditions, including the annual rent. Moreover, changes in leasing conditions will change the profitability of agriculture. We compare the main characteristics of land tenure and land use in selected countries according to the observed trends in other European countries. Before the social-economic transition, agriculture had important role in the national economy in the new EU member states (Table 4.20).

Agricultural economics and transition 244
Table 4.20: The proportion of agriculture in national economy in current prices
The proportion of agriculture
in GDP production
in consumption
in export
in investment
in employment Year
%
Foreign trade
balance, million EUR
Hungary 1990 12.5 37.0 24.9 8.7 17.0 416.4 2000 3.7 29.2 8.0 2.7 6.9 1401.6 2004 3.3 25.8 6.0 4.3 5.2 892.4 2005 n.a. n.a. 6.1 4.6 5.0 946.0 Slovakia (1990: Czechoslovakia) 1990 11.65 34.87 5.596 11.216 12.016 -22.954
2000 4.93 31.8 3.32 2.63 5.502 -42.43
2005 4.70 28.60 4.40 2.99 4.57 -761
Poland 1995 7.0 9.4 11.0 3.3 27.1 -107.28
2000 4.4 5.7 8.3 1.9 27.4 -316.68 2004 4.5 4.9 8.9 2.0 16.5 1176.18 2005 4.2 4.5 9.9 2.2 16.2 2108.38 Notes: n.a. = not available. 1 in agriculture (green report 2006) = –21,436 billion. SKK; 2 (green report 2001 page.3);
3 in agriculture (green report 2001) page 39 = –16,845 billion. SKK; 4 in agriculture (Statistic yearbook 1991 only for CSFR) = –1,119 billion Kcs; 5 11,6 % in current prises, 9.62 % in constant prices; 6 Statistic yearbook 1991 only for CSFR; 7 it was devided into 4 income categories (higher, lower) 20,5; 22; 18,9; 34,8; 8 – in mln USD Source: Own calculation from data of Central Statistical Office (KSH) and the Agricultural Economics Research Institute (AKI); The Hungarian Agriculture and Food Industry in Figures. 2004. Ministry of Agriculture and Rural Development. Statistical Yearbook of the Republic of Poland 2006. Central Statistical Office, Year LXVI Warsaw.
In those countries where large-scale farming, based on state and co-operative ownership was dominant prior to the transition, there was a strong expectation of privatization or reprivatization of land. The tendency is that most of the individual owners do not farm, therefore other tenants, both farmers and farming companies, operate on rented land. Leasing resulted higher production costs. In the new EU member states not only the price of land increases, approaching land price in the EU-15, but the rate of long-term tenancy has been growing and concentration has began in land use. At the same time, rate of private ownership is different in evaluated countries (62.0-95.8 %), and there are great differences between land prices (Table 4.21).

Land reform
245
Table 4.21: Shares of private ownership of land, estimated land prices in selected countries (2005)
Total land area
Rate of agricultural land
Rate of private ownership
Land prices in 2004 Country
1000 hectare % % EUR/ha Hungary 9 303 65.0 85.2 ~ 1600 Slovakia 4 903 48.5 76.5 ~ 1100 Poland 31 269 58.2 96.0 ~ 1580
Source: Based on data gathered from national statistical offices of respective countries. The examination of available data on land use and property structure suggests that the legislation of individual countries has different elements in land ownership and there is a strong tendency of land concentration. The role of land rent has been more and more significant during the last 15 years. In some countries there are legal regulations to stabilize the long term tenancy of agricultural land and national land funds have been created. Despite the fact that the number of offers and the rate of offered land is low, they could help the land concentration process. Land market is also affected by EU accession, that means land prices and rents are increasing, although they are still much lower, than in former EU-15. For example rental fee is 40-50 EUR/ha in Slovakia, 45 EUR in Hungary, and 379 EUR in the Netherlands.
2 MATERIAL On the basis of statistical data, we tried to explain and compare the present situation of land property structure, land prices and rental fees in some former Central and Eastern European countries, and answer the question, what happened in the last fifteen years and whether the processes met the expectations or not. First, we examine the countries separately – regarding the main differences – then summarize the main features of the transition period. The data of Hungarian Statistical Year-books covered years from 1950 to 2006.
3 RESULTS
3.1 Hungary Territory of Hungary is 9,303,040 ha, out of this agricultural land represents 5,817,200 ha (62.52 %), forest land represents 1,776,700 ha (19.01 %), water areas are on 34200 ha (0.004 %), built-up areas and other areas represent together 1,614,200 ha (17.4 %). On the basis of specified acreage and growth of population, 0.58 ha of agricultural land and 0.47 ha of arable land falls for one citizen (CSO, 2004).

Agricultural economics and transition
246
From the point of view of property structure and land use, the consequences of transition were most visible in the change of ownership rights In Hungary. After the transition, the majority of agricultural land went into private hands. In Hungary, in 1994 there were 3,500,000 registered land owners, while the number of inhabitants reached 10.1 million. In total, 1,500,000 persons were involved in different kinds of agricultural production. The result of privatisation was the move of 95 % of land into private ownership. Moreover, a new category of agricultural enterprises, the so-called family farms, emerged. A family farmer is a person who works on his own or on rented land of an acreage smaller than 300 ha, and the agricultural activity is his main source of income. He usually has certain kind of agricultural education or has been carried out agricultural activities for more than 5 years. The estimated number of family farmers is 30,000. In Hungary, legal persons and foreigners cannot acquire ownership rights to land. The ownership of natural persons is limited to maximum 300 ha. Due to the above mentioned transformation processes, the land use went through a great change, over 93 % of the land users cultivated only 11.5 % of arable land in 2003, while 0.8 % of farmers cultivated 67.5 % of the land. 3,460 thousand hectares belonged to companies, agricultural enterprises and co-operatives, and 3,953 thousand hectares to private farmers. That means that the rate of rented land is very high which causes several problems in profitability. Nowadays, rental fee is included in the subsidy. 20 % of the agricultural farms cultivate more than 300 ha which is 88 % of the land. 72 % of the individual farms cultivate less than 1 ha, which means that the majority (60 %) produce for self consumption and not for the market. The proportion of the individual farmers using larger than 50 ha area was slightly higher than 1 %, but the area cultivated by them was nearly 40 % of the total land belonging to individual farmers. In Hungary, the land prices are much lower than in EU-15. The price is determined in Golden Crown (GC) and depends on the quality of the soil. The average soil quality in Hungary is about 19-22 GC/ha. 11.04 % of agricultural land (5.53 % of arable land) belongs to the worst category and 6.51 % of agricultural land (8.66 % arable land) to the best category. These lands are mainly covered by vineyard orchards and other plantations. The land price depends on the regional situation of the land. There are great differences between the regions. The lowest is in South-Great Plain (36 EUR/GC), the highest in Central-Hungary (70 EUR/GC) (HAMZA, MISKÓ, 2005; KAPRONCZAI, 2006). These differences result, that the price of land is 1000-8000 EUR/ha in real transactions. At the same time it was explored by a survey, that the demand price of land was between 1340-2014 EUR/ha in 2003-2005, depending on the regional situation. On the basis of Naárné’s results, it can be stated that about 70 % of the contracts were arranged on the offered price. The remaining land disposers agreed to decrease the price only by 10-15 % (NAÁRNÉ TÓTH, 2006). Another survey found that the price of

Land reform
247
agricultural land varied from 320 to 18,000(!) EUR/ha in 2006, in Heves county, where there are many vineyards (MARSELEK et al., 2007). According to FADN data, a slow increase could be seen in rate of land lease in EU-15 (it was 42.6 % in 1989, and 52.5 % in 2003. The highest rate is in Belgium (874.9 %), France (82.4 %) and the lowest is in Ireland (20.0 %), and Spain (32.6 %). According to the Hungarian FADN data, the rate of rented land was 69 % in 2003: 89 % in large-scale farms, 53 % in middle size farms, and 40 % in small farms it was. The tendency in Hungary is similar to European tendencies, increasing concerned especially the middle size farm category, where the rate grew up by 14 %-point between 2002-2004 (KAPRONCZAI, 2006).
3.2 Slovakia Territory of the Slovak Republic occupies 4,903,423 ha, out of this agricultural land represents 2,380,000 ha (48.54 %), forest land represents 2,002,774 ha (40.84 %), water areas are on 92,845 ha (1.89 %), built-up areas and other areas represent together 427,804 ha (8.73 %). On the basis of specified acreage and growth of population, 0.44 ha of agricultural land and 0.26 ha of arable land fall per 1 citizen (STATISTICAL YEARBOOK, 2004). In Slovakia, the structure of ownership relations of agricultural lands is different from the structure of user relations. 75 % of land is in private ownership. Approxi-mately 5 % of land is in state ownership, and 20 % f the agricultural land belong to unknown owners (land which is not documented). (Source: SPF, 2002; VÚEPP, 2002). Private ownership relates 65 % that was in private ownership during the whole period of socialism, when the owners of agricultural land could not use their own land because they were moved to cooperative farms or state farms for common cultivation (CSÁKI et al., 2002). They were the so-called "naked owners", because their land was used without any compensation. Following the 1990s, new legal regulations were implemented in Slovakia, according to which, land owners could claim back their land which was taken away during socialism. The restitution of land was a primary task, because real development of agricultural land market could be expected only when the ownership relations of land are identified. The restitution process has not been finished yet, it has been continued up to now. In accordance with the first restitution Act No. 229/1991 Coll., 321,000 ha was returned back (to original owners – 204,000 ha to physical persons, and approximately 117,000 ha of land to land associations), which was demanded by 43,965 authorized persons. In Slovakia, both physical and legal persons may become owners of agricultural land (what is not acceptable for example in Hungary where only physical persons may become the owner of agricultural land). From May 2007, it is allowed to buy the agricultural land in Slovakia by citizens of the European Union under the condition, that they are renting the land for 3 years. Regarding other foreigners, it is not allowed for them to purchase the agriculture land according to the

Agricultural economics and transition
248
present legal regulations. If a foreigner, however, decides to carry out business on the territory of Slovakia and is registered in business register as an entrepreneur, he or she may acquire the ownership to agricultural land. As for making leasing contracts, hiring the land is not prohibited for foreigners, so they conclude primarily the leasing contracts, and purchase contracts are made only in very rarely. In Slovakia, the aim of legal regulations regulating agricultural land plots leasing is to stabilize the long-term leasing of land and provide protection to landholders. We can state that it is aimed primarily at lessee’s protection and less at owner’s protection. The largest part of agricultural land is leased and only very small percentage of owners uses the agricultural land, just like in whole Europe (TATÍK, 2003). At present the agricultural land in Slovakia is leased generally for 5 years – this is the minimum time of leasing – and in some cases for 10 years. It is assumed, that as a result of continuous internal transformation of agricultural branch, the leasing duration will be extended to 10 or more years, which will probably increase the internal stability of subjects. The reality remains that expecta-tions of government were not met and agricultural land owners have no interest in farming the land, but instead they are interested in land sale or advantageous leasing. Long-time expected agricultural land market is being developed slowly in Slovakia. The land lease market is not without complications, either, because the ownership of land is very fragmented. In Slovakia, similarly to Hungary, the Hungarian act was valid, under which the regulations ensure inheritance to each of survivors which resulted great fragmentation of land ownership. At present, app. 9.6 million parcels of land are registered in Slovakia. The average area of parcel is 0.45 ha and it is in the ownership of 12-15 people. Though the repeated fragmentation of ownership structure has happened, this fact did not result in fragmentation of agricultural activities (just the contrary, the agricultural large-scale production in Slovakia is one of the largest among the Middle and Eastern Europe countries). Agricultural cooperatives cultivated more than 44 % of agri-cultural land in Slovakia, out of them companies make up to 38.2 % and small holders-farmers are farming on 16 % of agricultural land. The average area operated by one cooperatives is 1643 ha (GREEN REPORT, 2003). For the time being, the agricultural land attracted buyers only in cases if there was a possibility to reach the profit by using the land for non-agricultural purposes. As regards prices of agricultural land leasing, the legal regulations say, that the price must be at least 1 % of the land price according to site quality-ecologic units. Price for leasing the agricultural land which is administrated under Slovak Land Fund according the internal instruction of general director of the Slovak Land Fund, is 1.5 % from land price according to site quality-ecologic units. The informal surveys performed in selected regions explore that the agricultural farming under better natural conditions rarely agree to the rent amount irrespective of amount of average agricultural land price in the respective cadastral area.

Land reform
249
This rent amount generally exceeds the limit of 2.5 % from average land price. The higher rent is usually agreed in case of leasing of land of larger acreage from one owner as the lessee tries to motivate such lessor to leave him his land in lease. This fact is confirmed also by data from the research of Department of Law at SAU (2004). The growing rent price would soon affect the economic results of the Slovak agricultural companies. At present, the determination of agricultural land prices is very complicated and chaotic. There are several legal regulations depending on purpose for which the land value is determined. For purchase and sale between the physical and legal persons the price agreed mutually by contracting parties is valid. This agreed price is not subject to any other legal restrictions and is not dependent on agricultural land plot value calculated according to the expert opinion or according to other valid legal regulations. The market prices of agricultural land irrespective of purpose of its next utilization are higher mainly in agricultural productive districts and districts with developed tourism. (BUDAY, 2005) The best quality of land costs approximately 3700 EUR/ha. The high-quality land in region of Nitra was sold for agricultural purpose at 2600 EUR/ha. The difference between administrative and market price was triple in 2003. The experts expect increasing market prices of land in the future. The growing land prices will reflect also in growing pressure of land owners on cooperatives and commercial companies that are farming this land in order to pay them higher rent. Summarizing the land situation in Slovakia, we can state that up to now restitution process is uncompleted, ownership is fragmented, there is existing land tax (nor in Hungary de facto), high rate of non-identified land is characteristic. For develop-ment of land market as well as agricultural land lease market and for the purpose of protection and cultivation of land fund it will be necessary to complete the restitutions process as soon as possible, to make the situation in the area of ownership structure and land use more transparent by creating of comprehensive information system recording financial operations regarding agricultural land and to accelerate the process of land arrangements, to establish the system that make situation in determination of agricultural land price more transparent when at present it is valid "that there is valid the different legal regulations for different purpose of land utilization, amended several times.
3.3 Poland The territory of Poland occupies 31,269 thousand ha, out of this agricultural land represents 18,208,403 ha (58.2 %), forest land represents 9,200,447 ha (29.4 %), built-up areas, water areas and other areas represent together 3,861 ha (12.4 %) in 2005. On average, 0.48 ha of agricultural land and 0.36 ha of arable land falls per 1 citizen. In 1990, in the eve of agricultural reforms in Poland the private sector (individual farmers) possessed 78.6 % area of arable land. During the transformation, the
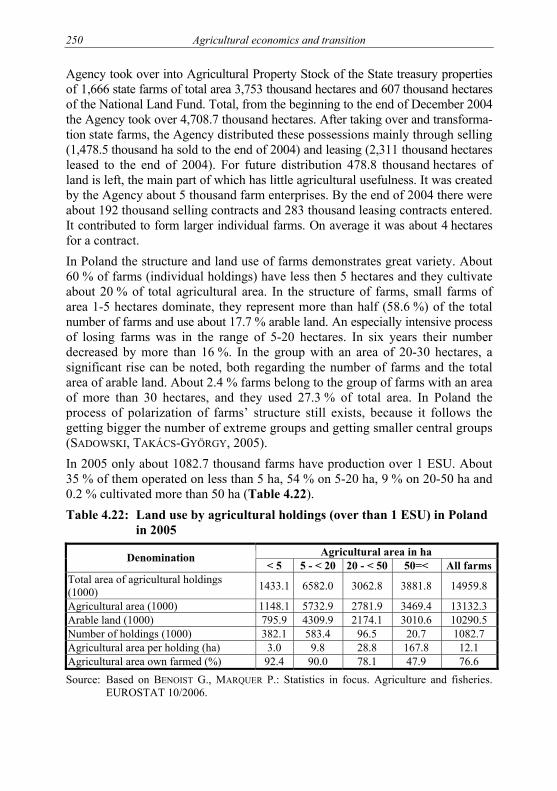
Agricultural economics and transition
250
Agency took over into Agricultural Property Stock of the State treasury properties of 1,666 state farms of total area 3,753 thousand hectares and 607 thousand hectares of the National Land Fund. Total, from the beginning to the end of December 2004 the Agency took over 4,708.7 thousand hectares. After taking over and transforma-tion state farms, the Agency distributed these possessions mainly through selling (1,478.5 thousand ha sold to the end of 2004) and leasing (2,311 thousand hectares leased to the end of 2004). For future distribution 478.8 thousand hectares of land is left, the main part of which has little agricultural usefulness. It was created by the Agency about 5 thousand farm enterprises. By the end of 2004 there were about 192 thousand selling contracts and 283 thousand leasing contracts entered. It contributed to form larger individual farms. On average it was about 4 hectares for a contract. In Poland the structure and land use of farms demonstrates great variety. About 60 % of farms (individual holdings) have less then 5 hectares and they cultivate about 20 % of total agricultural area. In the structure of farms, small farms of area 1-5 hectares dominate, they represent more than half (58.6 %) of the total number of farms and use about 17.7 % arable land. An especially intensive process of losing farms was in the range of 5-20 hectares. In six years their number decreased by more than 16 %. In the group with an area of 20-30 hectares, a significant rise can be noted, both regarding the number of farms and the total area of arable land. About 2.4 % farms belong to the group of farms with an area of more than 30 hectares, and they used 27.3 % of total area. In Poland the process of polarization of farms’ structure still exists, because it follows the getting bigger the number of extreme groups and getting smaller central groups (SADOWSKI, TAKÁCS-GYÖRGY, 2005). In 2005 only about 1082.7 thousand farms have production over 1 ESU. About 35 % of them operated on less than 5 ha, 54 % on 5-20 ha, 9 % on 20-50 ha and 0.2 % cultivated more than 50 ha (Table 4.22). Table 4.22: Land use by agricultural holdings (over than 1 ESU) in Poland
in 2005 Agricultural area in ha Denomination
< 5 5 - < 20 20 - < 50 50=< All farmsTotal area of agricultural holdings (1000) 1433.1 6582.0 3062.8 3881.8 14959.8
Agricultural area (1000) 1148.1 5732.9 2781.9 3469.4 13132.3 Arable land (1000) 795.9 4309.9 2174.1 3010.6 10290.5 Number of holdings (1000) 382.1 583.4 96.5 20.7 1082.7 Agricultural area per holding (ha) 3.0 9.8 28.8 167.8 12.1 Agricultural area own farmed (%) 92.4 90.0 78.1 47.9 76.6 Source: Based on BENOIST G., MARQUER P.: Statistics in focus. Agriculture and fisheries.
EUROSTAT 10/2006.

Land reform
251
In Poland the land prices in private transactions were higher then state lands. It can be stated that in Poland where the traditional family farm structure was not destroyed, land prices are higher than in other countries. Now we can observe the fast increase of the land prices and probably the fastest increase will take place after the seven-year transitional period. Because the land starts to become treated as a place of a long term capital investment (Table 4.23). Table 4.23: Average prices for arable land in Poland, EUR/ha
Average price Denomination Prevailing price range in 2003 2001 2003 2004
Private lands 735-1775 1240 1370 1580State lands 730-1830 802 904 1124Source: Own calculation based on Rynek ziemi rolniczej. Stan i perspektywy. Analizy rynkowe,
IERiGŻ-PIB, 2005. The level of interests for state land expresses by the average price which was paid during realization transaction but it does not show high demand and high interests. In the beginning, the price of land increased by about 20 % a year, reached its top in the years 1999-2000 on the level of about 1000 euro per hectare. The rise of land prices appeared in 2003 and still remains and it is connected to the inte-gration processes, and first of all to the system of the farm support (Table 4.24). Table 4.24: Prices of state lands in 1992-2004
1992-1993 1995 2000 2001 2002 2003 2004EUR/ha 264 356 897 802 825 904 1124
% 100.0 134.8 251.9 89.4 102.9 109.5 124.3 Source: Documents of the AWRSP (Agency of Farm Property of the Ministry of Treasury).
4 CONCLUSIONS In the evaluated Central and Eastern European countries, the large or middle-sized farms, giving the major part of agricultural production, operate parallel with small-sized farms which produce basically for self-consumption. It is natural, that individual farms also include those which started to grow and further increase is expected in their size and output. Beside the size polarization of the farms, accor-ding to the size economy requirements, the land use concentration has started, the primary form of which was land leasing in spite of land ownership. According to the land use, more than 60 % of the agricultural area is used in the form of leasing which results larger average farming sizes. The land prices in post socialist countries up to the date of integration were increasing, but it can be stated that it was not a rapid rise. From the time of inte-gration, the prices of the land suddenly started to increase. This increase will influence the fees of leasing and at the same time it will change the profitability of agriculture, too. But we must state that we can still observe the large land prices

Agricultural economics and transition
252
differentiation. In post socialist countries the agricultural lands cost even 20-30 times less then in the "old fifteen".
REFERENCES BENOIST, G., MARQUER, P. (2006): Statistics in focus. Agriculture and fisheries. Eurostat 10/2006, 12/2006, 14/2006, 16/2006.
BUDAY, Š. (2005): Rozvoj trhu s poľnohospodárskou pôdou. Záverečná správa z výskumného projektu. APVT-27-004402. VÚEPP, Bratislava.
CSÁKI, C., NUCIFORA, A., LERMAN, Z., HERZFELD, T. (2002): Potravinárstvo a poľnohospodárstvo v Slovenskej republike. Výzvy vstupu do EU. World Bank-Svetová Banka, Bratislava.
HAMZA, E., MISKÓ, K. (2005): A földpiac sajátosságai Magyarországon az uniós csatlakozás idején. Gazdálkodás, 49(5), pp. 1-7.
The Hungarian Agriculture and Food Industry in Figures (2004): Ministry of Agriculture and Rural Development, 26 p.
KAPRONCZAI, I. (2006): A földtulajdon, földhasználat vizsgálatának tanulságai. Gazdálkodás, 50(1), pp. 47-65.
MARSELEK, S., DEME, P., SZABÓ, F., HÁGEN, I. (2007): A földbérleti díj és a föld árának alakulása. Gazdálkodás, 51(2), pp. 17-24.
NAÁRNÉ TÓTH, ZS. (2006): A termőföld közgazdasági értéke és piaci ára. PhD értekezés. Gödöllő, 179 p.
SADOWSKI, A., TAKÁCS-GYÖRGY, K. (2005): Results of agricultural reforms: land use and land reform in Poland and Hungary. Studies in Agricultural Economics, Nr. 103. Budapest, pp. 53-71.
TATÍK, J., KNIEBUGEL, P. (2003): Porovnanie trhových cien pôdy a výšky nájomného vo vybraných krajinách Európskej únie. Publikované na internetovej stránke MP SR. http://www.mpsr.sk/slovak/spf/spfceny.htm/.

ROMANIA: SEMI-SUBSISTENCE FARM SECTOR, RESULT OF WRONG STRATEGIC APPROACH?
LUCIAN LUCA
Institute of Agricultural Economics, Bucuresti, Calea 13 Septembrie nr.13, cod 050117
1 INTRODUCTION The restitution of agricultural land in private ownership started in 1991 and was conducted in successive waves as the legal framework was changing over the time. The process involved about 5 million people, having as result the private ownership of 14.1 millions hectares of the country’s 14.7 millions hectares of agriculture land. The process is still ongoing as there are many litigations and disputes over loca-tions and boundaries but a large percentage of owners received their land and property titles. Currently, the main issues in Romanian Agriculture are: A very large sector of subsistence and semi-subsistence agriculture (made up of small individual holdings), poorly equipped, with a relatively low yield, making an incomplete use of the owners’ work and using most of the production of their own consumption. This situation is counterweighted by the large commercial holdings (legal persons), made up of concessioned or rented plots, which are relatively well equipped. The intermediate sector, that of commercial family holdings (larger individual farm) is not very much developed, as compared to the situation in other EU member states. The average areas of the two types of holdings, individual and legal persons, shows the distance between the two agricultural models in Romania. The average agricultural area used by an individual holding increased in 2005 against 2002 from 1.73 ha to 2.15 ha. Over the same period, the average areas used by legal persons dropped by more than 10 ha, from 274.4 ha to 263.1 ha.
2 STRATEGIC APPROACHES AND EMPIRICAL DATA ON STRUCTURAL CHANGES
First and very influent strategic approach of Romanian transition was a 1990 one, Outline strategy of implementing the market economy in Romania, produced with a large participation of over 500 experts. In that document, the main issue in

Agricultural economics and transition 254
agriculture field was the private property rights on agricultural land, followed by price liberalisation of agricultural products and foreign trade liberalisation. Unfortunately, mentioned strategy proposed a limited privatization/restitution of land and a delay in price liberalisation. If the land restitution in 1991 it was better than initial proposal, as result of political and economical pressures, it was still incomplete, and suffered two major improvements in 2000 and 2005. Agricultural price liberalisation and agricultural and food foreign trade liberalisation were achieved only in 1997, when started a first policy of supporting family farm (with limited effects). After a break in period 2001-2004, this policy was relaunched in 2005 with ambition to became the main point on political agenda of agriculture sector. The agricultural structure of Romania is currently different from both the average one of the old member states (EU-15) and from the one of the NMS, through the majority number of farms, the reduced physical and economical size (Table 4.25). Table 4.25: Size of farms in Romania, EU-15 and NMS-10
States Physical average size of farms (ha)
Economic average size of farms (ESU)
Romania 3.1 1.1 EU-15 20.2 20.7 NMS-10 8.3 3.5
Source: Rural Development in The European Union. Statistical and Economic Information. Report 2006, EU, DG Agri 2006.
The data collected through the 2002 Agricultural Census brought certain general classification with reference to the number of farms, the economic size or the type of activity (production orientation). A classification of the Romanian farms as function of the production orientation and economic size, produced by EUROSTAT on the basis of 2002 Census data evidences the following situation:
• the big commercial farms with reference to the economic size, over 40 ESU, are mainly specialized in cereals cultures, oilseed plants and protein plants;
• the small subsistence farms (households), less than 1 ESU, are "specialized" in animals eating grains (pigs, poultry) and in combinations of animals and field cultures;
• semi-subsistence farms, between 1 and 40 ESU, are specialized in growing pigs and/or poultry, sometimes in combination with different cultures (at the lower layer of the interval) and specialized on fruits, cows, field cultures, sometimes vegetables (at the upper layer).
The farm typology presented above is the first one with reference to Romania and evidences a certain predictable characteristic of the small size farms: A combination of the vegetal culture activities and animal farming, the so called "traditional multi-culture", typical for the rural household.

Land reform
255
3 THE DOMINANCE OF SUBSISTENCE AND SEMI-SUBSISTENCE FARMING IN INDIVIDUAL FARM SUB-SECTOR
Though, at the first sight the most interesting novelty of the Agricultural Census 2002 was the unexpected share (45 %) of the surface owned by the big farms (public administration units and commercial companies) from the perspective of characterizing the Romanian agricultural structure, more important can be the information on the integration on the market of the agriculture practiced in the individual farms, as there is the potential of the development of the rural zone. Figure 4.5 combines the information from more answers of the 2002 Census and proposes a picture showing the magnitude (in term of land possession) of the individual farms, from the market relation perspective. Figure 4.5: Weight of agricultural areas worked by the various type of
individual farms
"pluriactive" farm1%
"partial time" farm13%
"autarkic" peasant household
40%
"commercial" family farm7%
"semi-subsistence" peasant household
39%
Source: Data processed based on the General Agricultural Census 2002. General data, INS 2004. The sheer size of the problem of peasant agriculture that needs to be tackled is impressive. A typology of the 4.4 million of the individual farms (occupying 8.4 million ha, which means more than half of the arable area) shows that traditio-nal peasant households (autarchic and semi-subsistence) represent the vast majority among these individual units and in terms of area, allowing little room for around 92 thousands farms producing for the market. The two different categories must be treated differently by using different strategies: The first ones with "autarchic" characteristics might benefit from a life annuities approach or early retirement, and the semi subsistence types might benefit from a strategy of funds allocation in order to support the investments and the change of the technologies.

Agricultural economics and transition
256
The peasantry character of the semi subsistence farms is an important issue for the intervention measures on this type of exploitation in the effort to integrate them on the markets and the state action should focus both on the assistance for investments and on the regulation of the agricultural markets (outputs and inputs) in order to assure s normal functioning and a stable frame in order to encourage the decision to invest in the potentially viable farms. The extent of the semi-subsistence at global level nowadays is given by the less developed economies of the third world. Nonetheless, it is present, more or less marginally, in the developed countries as well (even in the EU-15, e.g. in Greece, Italy, Portugal and NMS-10 e.g. Poland, Latvia). The number of holding under 1 ESU in Romania is 3.02 million (71 % of the total farms), compared with 1.39 million in Poland (56 % of total farms). Focusing on holdings of at least 1 ESU, there are some differences, especially on tractor use and ownership (Table 4.26). Table 4.26: Main characteristics of farm structure in Romania and in Poland,
2005 Characteristics of agricultural holdings >1 ESU Romania Poland
Number of holdings (million) 1.24 1.08 AWU (million persons) 1.36 1.7 Agricultural area (million ha) 10.3 13.1 Average area per holding (ha) 8.4 12.1 Production for own consumption (% of holdings) 69 21 Holdings using a tractor (%) 69.9 95.2 Holdings with their own tractor (%) 8.9 79.9 Holding with another activity than agriculture (%) 32.3 5.9 Average size of dairy cows herde (haed/holding) 1.6 4.4
Source: Farm structure in Romania 2005, Statistics in Focus. Agriculture and Fisheries, 60/2007, Farm structure in Poland 2005, Statistics in Focus. Agriculture and Fisheries, 10/2006.
4 RESTRUCTURING OF SEMI-SUBSISTENCE FARMS 4.1 SAPARD and agricultural investment policy The main objective of the current government’s agricultural policy (after 2004) is to "stimulate the transformation of peasant households into commercial family farms". The means by wich it will be implemented are: The encouraging of land consolidation through exchanges and free market transactions, support for invest-ment in livestock farms, and the introduction of life annuity for old peasants who give up their land. The centralized data on the 15th of September 2006 concerning the measure "investments in agricultural farms" of SAPARD, that has a direct and important impact on the agricultural structures, proved that the number of projects was less

Land reform
257
than expected by ex-ante evaluation of the SAPARD, indicating the tendency to big investments in large farms. The Romanian agricultural farms that have been the potential beneficiaries of the SAPARD program were those farms which had a certain financial standing that allowed the assurance of the financing of the investments projects (the co-finance part for the beneficiary and the pre-finance part from the public funds- European or national). "Farmer" programme, a national program which promote and support investments in agriculture and in processing sector, adopted in 2005, has represented an important crediting instrument for investments in agriculture and implicitly rural area (with an advantageous interest rate of 5 %.). The purpose of this program was to initiate a new activity in the rural area by attracting funds for investments, from loans for investments and co-financing for SAPARD program. In general, for most of medium and small sized farms as well as for the medium and small sized processing enterprises, the reduced capacity to co-finance was the main limiting factor, which slowed down the absorption of the SAPARD funds, especially in the first period of the programme implementation. Some results of the rural EuroBarometer, produced in Romania in 2002 and 2005 on representative samples at national level for the rural zone, evidence certain concerning attitudes of the rural population (the current farmers) in connection with the entrepreneurship spirit and with the intention of passing from the traditional agriculture, of semi-subsistence, to modern, commercial one. If the delayed development of the rural area is generalized and within a slightly improvement (only 11 % of the respondents had a someone in the family who had a business in 2005, close to the 7 % in 2002), the intention of developing a business in the next five years was only 11 % in 2005, almost the same as that of 9 % in 2002. More concerning seems to be the attitude towards the changing of the status of the agricultural household (rural) into commercial family farm, only 10 % of the respondents express a different intention for the next five years in the 2005 research, a situation comparable with that of 2002 (9 %). The positive side is represented by the fact that 10 % of about 4 millions house-holds stand for more: 400,000 future farms. The problem would be that changing from intention to practice seems difficult as long as in the three years passed between the two surveys the farms that already consider themselves commercial increased only from 1 % in 2002 to 2 % in 2005. 4.2. Scenarios for semi-subsistence farm restructuring in Romania The assistance for the semi-subsistence farms within the new member states was introduced as a specific measure through article 33b of Regulation C (EC) 1257/1999, included as a consequence of the negotiations and signing of the Adhesion Treaty. The two main objectives were: The facilitation of the issues

Agricultural economics and transition
258
related to the competitive pressures of the single market and the encouragement of farms restructuring that was not economically viable. The new Regulation (EC) 1698/2005, regarding the assistance for rural deve-lopment offered by EAFRD, kept the transitory assistance measure. The general frame of providing assistance is mainly the same, with the increasing of the annual ceiling up to 1500Euro/farm, but without explicitly requiring the details of the business plan of the necessary investments. The difference could be important, as it offers freedom to the small farms to improve the technologies only by the purchasing of technology – bearing inputs (seeds, manure, fertilizer, pesticides, and artificial insemination), without transferring important financial resources in comparison with their turnover. Furthermore, it is suggested that the volume and the duration of the assistance can be lower than the maximum levels (1500/Euro/year for 5 years), offering to the decision makers the flexibility of interventions adapted for each member state. If one could consider that the semi-subsistence farms are the ones comprised in the range 1 to 40 ESU, Romania should pay attention to the setting of the lower level of the range rather then to the upper one (Table 4.27). Table 4.27: Romanian farms classification by legal personality and economic
size Economic size (ESU) <1 1-<2 2-<4 4-<8 8-<16 16-<40 40-<100 >=100
Total farms (1000)
3273.1 865.5 268.5 51.6 12.6 6.7 3.9 3.0
Natural persons (%)
99.7 99.7 99.5 97.9 89.1 60.3 29.4 8.7
Legal persons (%)
1.2 0.3 0.5 2.1 10.9 39.7 70.6 91.3
Source: Structure of agricultural holdings Romania 2002, Statistics in Focus. Agriculture and Fisheries, XX/2005.
It is very important to establish if the over 800 thousand farms between 1 and 2 ESU will be excluded or not. On the other side, only the farms with sizes between 2 and 4 ESU are so many (over 250 thousand) that it should be taken into account the limit of 2 ESU. The establishment of an upper limit will generate other frustrations, and the farmers will be tempted to adjust their economic and financial situations in order to be included in the interval. Notwithstanding, taking into account that this situation is targeted towards the natural persons, one could consider that for the size classes of over 8 ESU the agricultural activity is mainly orientated towards trading, as long as there are farms organized as legal persons. When generating the scenarios concerning the assistance for the semi-subsistence farming, the definition of the farm is the key element as in the case of Romania the great number of the existing agricultural farms makes that every choice suppose the management of a process of high sizes. The scenarios drafted within Table 4.28

Land reform
259
estimate the global number of the potential beneficiaries and propose some appropriate eligibility conditions. Table 4.28: Scenarios regarding the support for the semi-subsistence farms
Scenarios Potential beneficiaries Eligibility
S1 Supporting small farms
Farms of 1-4 ESU Approx. 1.1 mil. farms
Natural persons Brief business plan Focus on new technologies
S2 Supporting medium farms
Farms of 4-40 ESU Approx. 70 thou. farms
Natural persons Detailed business plan Focus on farm specialisation
S3 Supporting all individual farms
Farms of 1-40 ESU Approx. 1.2 mil. farms
Natural persons Standard business plan Focus on financial indicators
S4 Supporting medium-small farms
Farms of 2-8 ESU Approx. 320 thou. farms
Natural persons Detailed business plan Focus on the relation with the market
In the case of the scenario directed towards the small farms (S1), the conditions of eligibility will have to be adapted to the available poor means, and the big number of potential beneficiaries should lead to the decrease of the annual value of the support, probably to 1,000 Euro/exploitation, or even lower. This would be a decision that would reduce the potential frustrations of the more than 4 ESU owners. In addition, there should not be imposed to this farms that within the business plan to introduce the investments. The measure would have a strong social impact and would not be wrong due to the poor condition of the Romanian rural households. In order to achieve the objectives, there would be essential the prove of the capacity of integration on the markets, reduced to the limit to the capacity of selling the farm-produced products. This condition is valid for the other scenarios and the evaluation after the three years from receiving the assistance should refer to this aspect through delivery documents; the agricultural producers should be proud of their sold production. Such approach would cover a significant part of the Axis 1’s budget, fact that would not be in the favour of other measures, even if for this type of assistance would apply only 1/3 of the potential beneficiaries. If the medium farms (S2) were encouraged, then the annual assistance could be allocated to its maximum value of 1500 Euro/exploitation. Within the farms having an average size of 9 hectares of the group of 4-8 ESU size, the 30.9 hectares of the 8-16 ESU group and the 141 hectares of the 16-40 ESU could emerge a certain good competition and the funds could be crucial to some investments acting as an impulse to the introducing of innovation into production. Anyway, the requirement of selling a more and larger part of the production should become an eligibility condition (long-term contracts, production groups). Furthermore, the specialization of the production should be included in the business plan. The

Agricultural economics and transition
260
requirement regarding the evaluation after the three-year period could lead to the growth of the economic size of the farm. The scenario S3, that proposes competitiveness among all the farms having sizes between 1 and 40 ESU, could produce a rapid restructuring of the semi-subsistence sector by imprinting an impulse to the creativity of the farmers from the different size classes. The high competitiveness with regard to the limited funds could lead to an effervesce of the transform and the assistance would be regarded as a prize. There should be a certain standard business plan in order to assure the correctness in choosing the beneficiaries and that proposes the transform of the agricultural activity into a business. The weak point is the difficulty of evaluating proposals with a large range of results. The assistance for the medium small farms (S4), having a size between 2 and 8 ESU, has the advantage of managing a relatively homogenous segment of the farms (4.9 hectares for the 2-4 ESU and 9.4 hectares for the 4-8 ESU group) and with a reasonably number of potential beneficiaries: About 320 thousand farms. This scenario could be considered the most realistic, as the number of assistance proposals is expected to be more than 1/3 of the number of potential beneficiaries. It is similar to the approaches of other member states applied after 2004. Typical for Romania, where the relation market-farm is less developed, should be the emphasis that the business plan will put on the selling of the production and not on the investments. Therefore, becoming a member of a producer group is very important for these farms and could give an impulse to the producers groups, especially within the context of a more stable context on the agricultural integrated markets.
5 CONCLUSION Romanian tradition (with its agricultural and social routines) has a strong influence on the agricultural relations after the restitution of the property, especially because after the beginning of the transition the resources allocated to the development of the rural area, in general, and to the development of the agricultural sector in parti-cular, were reduced, except for the last years, when the Sapard program had an important contribution, along with some national measures of smaller proportion. The results of these efforts seem not have achieved the critical mass in order to change the perception and the condition of the delayed Romanian agricultural structures. The Romanian agriculture urgently needs to modernize the farms and the Axis 1 measures of EAFRD can sustain these requirements. If within the EU-15 member states the transition from peasant like agriculture to the modern one was long, Romania, more than the other NMS must adapt more rapidly to the competitiveness requirements and quality standards of production imposed by the farmers of Europe. The key transformation is represented by the passing to a specialized and
Land reform
261
intensive production system generally focused on animal farming in parallel with the adapting to the European rules and the integration of the agricultural worth within the industrial society. Therefore, Romania needs a program that provides a national pattern to selected measures of EAFDR. Besides the administrative and measures’ management issues from an institutional point of view, the success of the measure "assistance to the semi subsistence farms" is cyemands’ prerequisites like the long-term contracts or adhesion to the producers groups (that implies the observation of the sanitary, veterinary and environmental norms) can be taken into account. Briefly, it is important to encourage the tendency towards rationing the agricultural practices in order to assure integration on the agricultural markets.
REFERENCES CSAKI, C., KRAY, H. (2005): Sectorul agroalimentar din Romania intr-o perspectiva europeana. ECSSD WP nr.39, Bucuresti.
DAVIDOVICI, I. (2005): Romania’s agriculture from subsistence to performance. Agricultural Economics and Rural Development, 2(6), pp. 5-19.
ELLIS, F. (1988): Peasant economics. Farm households and agrarian development. Cambridge University Press.
GAVRILESCU, D. (1996): Economia agroalimentara – Delimitari, premise, anticipari. Editura Expert, Bucuresti.
MENDRAS, H. (1970): La fin de paysans. Librairie Armand Colin, Paris.
POSTOLACHE, T. (coordinator) (1991): Economia Romaniei. Secolul XX. Editura Academiei Romane, Bucuresti.

5 FARMING EFFICIENCY AND FARMING ORGANIZATIONS


FARM-LEVEL DETERMINANTS OF CONVERSION TO SUSTAINABLE FARMING PRACTICES IN THE NEW MEMBER STATES
ADRIANA CRISTOIUA, FRANCISCO CACERES-CLAVEROB, BLANCA LUCENA-COBOSb
a European Commission, Institute for Prospective Technological Studies. c/Inca Garcilaso s/n 41092 Seville, Spain. E-mail: [email protected].
b Empresa Pública para el Desarrollo Agrario y Pesquero de Andalucía S.A. Oficina Provincial de Córdoba, Area de Estudios y Prospectiva, Apartado de Correos 3016 Córdoba, Spain.
E-mails: [email protected] and [email protected]
1 INTRODUCTION Organic farming, one of the set of sustainable farming practices (PRETTY, 1995; RIGBY, CÁCERES, 2001; HELANDER, DELIN, 2004), is of interest for policymakers and stakeholders given the increasing demand for organic produce, the ascending curve of conversion to organic farming in the EU-15 since 1992, availability of public subsidies for organic farming, and environment-related public concerns that call on farmers to re-consider the effects of their production systems in shaping the environment. A comprehensive framework for the organic production of crops and livestock now exists in the EU, including regulations to ensure the authenticity of organic production methods, for labelling, processing and marketing of organic products. However, the observed rate of conversion to organic farming to date remains low. In the new Member States (EU-N10), at the end of 2003 the highest values were reported for Hungary (70,514 ha of and 1,495 organic farms) and the Czech Republic (195,216 ha and 1,095 farms) (EUROSTAT, 2007). This paper builds on the results of a larger study concerned with identification, characterisation and analysis of sustainable farming practices in selected EU-N10. The underlying assumption used to identify the determinants of adoption was that the structures of organic and non-organic farms within a given farming system are different. Moreover, it was assumed that the main (structural) characteristics of each farming system would not always favour the conversion to organic farming. The question to answer is "what are the determinants of adopting sustainable farming practices in the NMSs context?", and considers the particular case of organic farming. The remaining of the paper is organised as follows. Section 2 briefly looks at the situation of organic farming and associated policy context in the Czech Republic and Lithuania. Section 3 outlines of the methodological

Agricultural economics and transition
266
approach and data sources. The results of analysis are reported in section 4, and section 5 concludes.
2 CURRENT SITUATION OF THE ORGANIC FARMING IN THE CZECH REPUBLIC AND LITHUANIA
The main Czech law on organic farming is the Parliamentary Act No. 242/29 July 2000, and the amendment of the Act No. 368/1992 (on administrative fees). The law is implemented via two decrees of the Ministry of Agriculture (No. 53/2001 and No. 263/2003). From 2004, "Action Plan for the Development of Organic Farming by 2010" sets the main objectives and priorities for the Czech organic farming. The first financial funds to support the establishment of organic farms were released at the end of 1990; by 1992 there were 15,000 ha under organic farming. State support to organic farming ceased over the 1993-997 period and restarted in 1998 (Government Regulation Agricultural Act 252/1997). After the EU accession, organic farming payments increased noticeably (in some cases, by almost 300 %), as from 2004, the support for organic farming is co-financed via the common agricultural policy budget (Table 5.1). Table 5.1: Evolution and structure of organic farming payments
(CZ, 1998-2005)
Year Arable crops
Permanent crops(a)
Vegetables on arable
landMeadows/pastures
Herbs on arable land
1998 (ECU/ha)* 62.82 62.82 62.82 62.82 62.821999 (€/ha)* 59.78 89.68 59.78 29.89 59.782000 (€/ha)* 61.56 92.33 61.56 30.78 61.562001 (€/ha)* 62.54 109.44 109.44 31.27 62.542002 (€/ha)* 63.29 110.76 110.76 31.65 63.292003 (€/ha)* 61.71 107.99 107.99 30.85 61.712004 (€/ha)* 22.81 79.27 71.60 7.13 71.602005 (€/ha)* 23.55 81.87 73.94 7.36 73.942004 (EU) (€/ha)** 91.23 317.09 286.38 28.51 286.38
2005 (EU) (€/ha)** 94.21 327.47 295.75 29.44 295.75
2004 Total (€/ha)*** 114.03 396.37 357.98 35.64 357.98
2005 Total (€/ha)*** 117.77 409.33 369.69 36.80 369.69
Source: CZECH MINISTRY OF AGRICULTURE, 2005. Notes: * National support; ** = Amount of support from the EU budget; *** = Total amount of
payments received including national support. (a) = (e.g. orchards, vineyards, hops…). The annual exchange rates applied have been gathered from the Czech National Bank official data.

Farming efficiency and farming organizations
267
Lithuanian organic farming is regulated by the Law on agricultural and rural development and the Organic Agriculture Rules (harmonised with EU Regulations 2092/91 1804/99, 331/2000). The Rules were reviewed in 2000 (Order No. 375 of the Ministry of Agriculture). Since 2004 four programmes under the Rural Development Plan "Agri-Environment" measure offer support also for organic farming. Since 1993, the number of organic farms increased constantly. In 2004 there were 1,178 certified organic farms, of which 55 % were crops orientated and 41.3 % mixed orientated. During 2004 the area of certified agricultural farming land increased by 20,000 ha reaching to a total of 42,961 ha (about 1.5 % of all farming land in the country); on average, a certified organic farm managed 36.47 ha. The payments for organic farming are higher during the conversion period (i.e. the first three years of farming organically the farmer receives the total amount of payments available for that year, while afterwards payments are halved). Eligibility to organic support scheme requires applicants to have a minimum five years in farming own or rented land (Table 5.2). Table 5.2: Evolution and structure of organic farming payments
(LT, 1997-2006)
Years Cereals Grassland Vegetables, potatoes
Berry plantations Orchards Fallows Herbs
1997(€/ha)* n.a. 43.00 102.00 202.00 202.00 n.a. n.a.1998(€/ha)* 43.00 43.00 102.00 202.00 202.00 n.a. n.a.1999(€/ha)* 43.00 29.00 102.00 202.00 202.00 n.a. n.a.2000(€/ha)* 25.78 23.06 61.05 120.75 120.75 n.a. n.a.2001(€/ha)* 33.55 23.76 75.48 125.80 125.80 22.36 n.a.2002(€/ha)* 57.87 24.59 124.42 144.67 202.54 23.15 n.a.2003(€/ha)* 86.90 26.07 144.83 173.79 202.76 86.90 n.a.2004-2006(€/ha)* 83.20 23.60 110.20 146.80 150.4 n.a. 91.20
EU 2004-2006(€/ha)** 332.80 94.40 440.80 587.20 601.6 n.a 364.80
Source: "Ekoagros" data; Lithuanian Rural Development Plan 2004-2006. Notes: * = National support; ** = EU co-financing rate; *** = Total payment amount received,
including national support. N.a. = not available.
3 METHODOLOGY The investigation of the determinants of converting to organic farming is based here on two complementary approaches, namely (a) analysis of expressed attitude towards converting to organic farming, and (b) a binomial logit model that allows investigating the statistical significance of determinants identified. The expressed attitude is collected via face-to-face interviews with those farmers that converted to organic farming.

Agricultural economics and transition
268
A farm typology is first defined upon a set of criteria that include: (a) farming system; (b) technology (i.e. organic and non-organic production)1; (c) legal form (family farms and agricultural companies); (d) main production enterprises in each farming system. The farm typology is associated to farming systems defined at homogeneous regional level (Local Administrative Unit, LAU1) based on available statistical information and applying a set of criteria (i.e. land use, agro-climatic aptitude, livestock, property and holding size, population characteristics) (for more details see CÁCERES et al., 2007). The determinants are selected based on an extensive literature review, supplemented with input from the national experts to grasp the local context specificities. They refer at characteristics of (a) organic farming practice (b) farm (c) farmer (d) farming milieu, and (e) economic aspects. The determinants are then integrated in statements (e.g. "Organic farming produces higher quality food"), and interviewees are required to indicate on a closed five-point Likert scale the importance they attached to such statements at the time of deciding to convert to organic farming (i.e. A=very important; B=rather important; C=rather unimportant; D=not important at all, E=do not know/answer). The significance of the determinants identified via the field survey is explored through statistical methods under the assumption of a utility-maximising farmer that ponders whether to convert to organic farming or to continue farming with its current production technology (hence, as a non-organic farmer). The utility-maximising choice of the ith farmer is assumed to depend on a set of physical and socio-economic factors (Xi) i.e. tiiiit eXdU += where Ui is the indirect utility the farmer derives from continuing with its current farming practice or converting to the new one, t is the technology (taking value of 0 for the on-going technology, and 1 for the new one), di is a vectors of coefficients corresponding to the associated physical and socio-economic factors (Xi), and ei is the additive error term. The farmer will adopt organic farming if Ui1>Ui0, or will continue with as a non-organic farm if Ui0>Ui1. The logit model is specified as
∑=− iixx XBPp )]1/ln[ , where Px = the probability of adoption of organic farming by the ith farmer occurs for an observed set of variables Xi; Bi are the coefficients to be estimated, and Xi is the set of explanatory variables. In line with the theory of adoption, the model includes variables related to farmer’s own belief in the benefits of farming organically, access to information, technology-specific know-ledge, farm characteristics, and availability of labour. The selection of variables to be included in the model relied on both analyses of the results of the field survey as well as on the exploration of various alternative model specifications. For an easier interpretation, dummy variables are defined for the attitudinal variables (i.e. those which implied a ranked preference and referring at farmers’ expressed attitude towards organic farming). For example, for the "environmental or food concerns" determinant, which implied four alternative answers, A, B, C or D,
1 Both partial-organic farms and farms in conversion were considered here as organic farms.
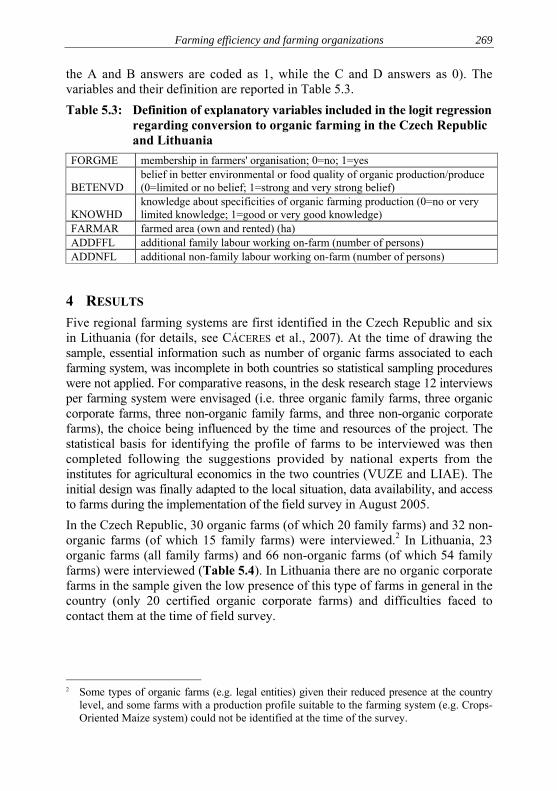
Farming efficiency and farming organizations
269
the A and B answers are coded as 1, while the C and D answers as 0). The variables and their definition are reported in Table 5.3. Table 5.3: Definition of explanatory variables included in the logit regression
regarding conversion to organic farming in the Czech Republic and Lithuania
FORGME membership in farmers' organisation; 0=no; 1=yes
BETENVD belief in better environmental or food quality of organic production/produce (0=limited or no belief; 1=strong and very strong belief)
KNOWHD knowledge about specificities of organic farming production (0=no or very limited knowledge; 1=good or very good knowledge)
FARMAR farmed area (own and rented) (ha) ADDFFL additional family labour working on-farm (number of persons) ADDNFL additional non-family labour working on-farm (number of persons)
4 RESULTS Five regional farming systems are first identified in the Czech Republic and six in Lithuania (for details, see CÁCERES et al., 2007). At the time of drawing the sample, essential information such as number of organic farms associated to each farming system, was incomplete in both countries so statistical sampling procedures were not applied. For comparative reasons, in the desk research stage 12 interviews per farming system were envisaged (i.e. three organic family farms, three organic corporate farms, three non-organic family farms, and three non-organic corporate farms), the choice being influenced by the time and resources of the project. The statistical basis for identifying the profile of farms to be interviewed was then completed following the suggestions provided by national experts from the institutes for agricultural economics in the two countries (VUZE and LIAE). The initial design was finally adapted to the local situation, data availability, and access to farms during the implementation of the field survey in August 2005. In the Czech Republic, 30 organic farms (of which 20 family farms) and 32 non-organic farms (of which 15 family farms) were interviewed.2 In Lithuania, 23 organic farms (all family farms) and 66 non-organic farms (of which 54 family farms) were interviewed (Table 5.4). In Lithuania there are no organic corporate farms in the sample given the low presence of this type of farms in general in the country (only 20 certified organic corporate farms) and difficulties faced to contact them at the time of field survey.
2 Some types of organic farms (e.g. legal entities) given their reduced presence at the country
level, and some farms with a production profile suitable to the farming system (e.g. Crops-Oriented Maize system) could not be identified at the time of the survey.

Agricultural economics and transition
270
Table 5.4: Characteristics of the organic family farms interviewed by farming system
Czech Republic Farm type
Crops-Oriented
Sugar Beet
Crops-Oriented
Maize
Mixed-Oriented
Grassland
Livestock-Oriented
Mixed-Oriented Potatoes
organic 6 5 7 6 6 No. of farms non-organic 6 6 7 7 6
organic 2,365.0 515.9 4,479.0 333.9 597.5 Total farmed land (ha) non-organic 7,040.0 7,955.1 5,637.8 7,808.0 3,363.0
organic 394.2 103.2 639.9 55.7 99.6 Average size (ha) non-organic 1,173.3 1,325.9 805.4 1,115.4 560.5
Lithuania Farm type Crops-Oriented
Crops-Marginal
Livestock-Marginal
Urban-Oriented
Interme-diate
organic 6 8 3 3 3 No. of farms non-organic 10 8 9 12 10
organic 146.7 622.0 274.3 15.4 265.9 Total farm land (ha) non-organic 6,487.5 267.2 641.4 4,222.6 994.1
organic 24.5 77.7 91.4 5.1 88.6 Average size (ha) non-organic 648.8 33.4 71.3 351.9 99.4
Source: Compiled by the authors based on field surveys carried out in August 2005. Note: No records for the organic farms in the Livestock-Oriented system (Lithuania).
The average size of the Czech organic farms interviewed varies from 55.7 ha (Livestock-Oriented system) to 639.9 ha (Mixed-Oriented Grassland system). In terms of land use, pastures and meadows are important in Crops-Oriented Sugar beet system (81.4 %), Mixed-Oriented Grassland system (81.1 %), and Mixed-Oriented Potatoes system (69.0 %). Arable land has a higher share only in Crops-Oriented Maize system (97.4 %). In livestock production, organic beef cattle prevails (873.5 Livestock Units (LU) in Mixed-Oriented Grassland system to 59.5 LU in Livestock-Oriented system). In Lithuania, the average size of organic farms interviewed varies from 91.43 ha (Livestock-Marginal system) to 5.12 ha (Urban-Oriented system). In terms of land use in organic farms, pastures and meadows are more important in Crops-Marginal system (59.7 %) and Livestock-Marginal system (57.2 %), while the share of arable land is higher in Intermediate system (66 %), Urban-Oriented system (64.7 %), and Crops-Oriented system (55 %). In livestock production, as in the Czech Republic, beef cattle is the most important species, the LU values ranging from 40.8 LU (Crops-Marginal system) to less than one in Urban-oriented system.
4.1 Key determinants of converting to organic farming In the Czech Republic, the results extracted from the 30 organic farms interviewed indicate that the most important determinants of converting to organic relate to farmers’ environmental and food concerns and to farm characteristics. Concerning the environmental and food concerns determinant, the main reason is farmers’

Farming efficiency and farming organizations
271
own belief that organic produce are of higher quality than non-organic produce, and that organic farming is more respectful with the environment than non-organic farming. This determinant is closely followed by farm characteristics, 90 % of the farmers interviewed pointing on the importance of the fact that the production structure and size of the farm already fitted to the organic farming certification requirements at the time of deciding to convert. The existence of an accessible market for organic products did not emerge as important given that organic farmers were selling their produce to an already established network of clients. The existence of advisory organisations or access to information about organic farming, and the access to suited machinery and technology were evaluated as rather unimportant or not important at all (66.7 % of answers), mainly because farmers considered having sufficient information about organic farming requirements as well as suitable machinery at the time when decided to covert. Figure 5.1: Main determinants of converting to organic (family farms)
Source: Compiled by the authors based on field surveys carried out in August 2005. Table 5.5. reports the percentage of Czech organic farmers indicating as very or rather important determinants of adopting organic farming by farming system (A+B answers). The farm characteristics determinant is pointed out as having the highest importance in the case of Crops-Oriented Sugar Beet and Crops-Oriented Maize systems.

Agricultural economics and transition
272
Table 5.5: Determinants of conversion to organic farming by farming systems (% of answers)
Czech Republic*
Crops-Oriented
Sugar Beet
Crops-Oriented
Maize
Mixed-Oriented
Grassland
Livestock-Oriented
Mixed-Oriented Potatoes
1. Profitability 16.7 40 0.0 0.0 0.0 2. Env./food concerns 83.3 80 71.4 83.3 100 3. Farm characteristics 100 100 85.7 66.7 66.7 4. Accessible market 33.3 100 28.6 33.3 16.7 5. Advising or information 33.3 60 28.6 16.7 33.3
6. Suited machinery 16.7 40 28.6 50 33.3 7. Other reasons 0.0 0.0 28.6 16.7 0.0 Number of organic farms 6 5 7 6 6
Lithuania* Crops-Oriented
Crops-Marginal
Livestock-Marginal
Urban-Oriented
Interme- diate
1. Profitability 33.3 37.5 100 33.3 0.0 2. Env./food concerns 100 75 0.0 66.7 100 3. Farm characteristics 66.7 75 33.3 66.7 100 4. Accessible market 83.3 50 66.7 33.3 66.7 5. Advising or information 50 62.5 33.3 66.7 0.0
6. Suited machinery 16.7 37.5 0.0 33.3 66.7 7. Other reasons 0.0 0.0 0.0 0.0 0.0 Number of organic farms 6 8 3 3 3
Source: Compiled by the authors based on field surveys carried out in August 2005. Note: * Figures reported here include the A (very important) and B (rather important) answers. In Lithuania, farmers´ environmental and food concerns emerge as main deter-minants for conversion. Farmers indicated their own belief that organic farming produces higher quality products and solves environmental problems determined their decision to convert. Another important determinant is farm characteristics (farm size and structure of enterprises), indicated as very or rather important (69.6 % of answers) as the conversion did not require many changes of on-going farming practice. Market access was indicated as being rather important (A+B=60.9 % of answers) at country level, farmers indicated that the presence of middlemen buying their organic produce was a reason for not re-converting to non-organic production. The logit model relies on information only from family farms (owing to the inadequate data for legal entities). From own 2005 field survey database, informa-tion from 112 organic and non-organic family farms was extracted. Three farms have been eliminated as outliers, and three for missing data so that the final sample

Farming efficiency and farming organizations
273
utilised was of 106 records. Both fully organic and phasing-in farms are included in the "organic" farm category. The dependent variable takes value of one if farm is organic, and nil if non-organic. Estimations are carried out using SYSTAT 11.0 statistical package. Table 5.6: Estimated coefficients of the logit regression associated to
adoption of organic farming among the Czech and Lithuanian family farms
Parameter Estimate (b) Standard error t-ratio p-value odds-ratio
CONSTANT -5.076 1.271 -3.994*** 0.000 60.58 BETENVD 4.104 0.857 4.789*** 0.000 22.801 KNOWHD 3.127 0.989 3.162*** 0.002 1.955 ADDFFL 0.670 0.293 2.285** 0.022 2.691 ADDNFL 0.990 0.418 2.370*** 0.018 0.992 FARMAR -0.008 0.004 -1.996** 0.046 9.117 FORGME 2.210 1.129 1.957** 0.050 60.58Log Likelihood of constants only model = LL(0) = –69.7312*[LL(N)-LL(0)] = 82.948 with 6 df Chi-sq p-value = 0.000McFadden's Rho-Squared = 0.595 Level of significance: 0.01***; 0.05**; 0.1*; n = 106
Two tests for the goodness of fit of the model are performed. First, the test of significance of the coefficients of the logit model which relies on a chi-squared distribution, when the Maximum Likelihood (ML) estimation procedure is used (Table 5.6). The likelihood ratio (of the likelihood function) when all the parameters except the intercept are set equal to zero, follows a chi-square distribution and indicates whether the amount of variation explained by the model is significantly different from zero. Second, the correct classification power of the cases in various groups is checked. The procedure uses the explanatory variables for each farmer in the model estimated and predicts the probability that a farmer will convert to organic farming. A probability above 0.5 indicates a farmer that converted to organic farming. The coefficients reported in Table 5.6 indicate the direction of the effect of associated explanatory variable on the probability of conversion. The last column reports the magnitude of the effect associated to a particular explanatory variable. The results confirm that the decision to adopt organic farming is strongly influenced by farmer’s own belief in the environmental and/or food quality benefits organic farming brings. The effect of own belief on the adoption of organic farming is positive and significant (4.104; odds-ratio=22.801). The positive odds-ratio indicates that those farmers who believe in the environmental and/or better food quality benefits of organic farming are 22.8 times more likely to adopt such farming practice. Membership to farmers’ association increases substantially the odds of adoption, most probably because farmers gain additional information on the charac-teristics and requirements of organic farming. The sign of the estimated coefficients

Agricultural economics and transition
274
for labour availability are also positive, indicating that the odds of adopting organic farming increase where additional (family and non-family) labour is available. Such outcome is in line with the characteristics of organic farming technology that is more labour-intensive. The only inverse relationship related to adoption of organic farming is observed for the farm size variable. The sign of the coefficient is negative, and the odds ratio indicates that when the farm is large, there is a 9.11 times lower chance that adoption of organic farming occurs, probably owing to the labour-intensive specificity of the organic production technology.
5 CONCLUSIONS The results for both countries indicate differences among the farming systems in terms of the main determinants of conversion. Farmer’s own belief about environ-mental benefits and better quality of organic produce, characteristics of the farm in terms of enterprises structure and institutional aspects related to criteria applied during the organic certification procedure, the availability and accessibility to marketing channels for organic produce, and profitability emerge as prevailing factors influencing the decision to convert to organic. The diversity of factors identified reflects the particular challenges faced at the farming system level, an insight that is blurred when the analysis is carried out at aggregated country level. As organic production is more labour-intensive, where labour availability is not a constraint, the propensity to decide to convert to organic is potentially high. Most often such change will be observed among family farms that rely on own family labour than among large corporate companies that would face increase in labour search and supervision costs. Further research is needed into whether the benefits of organic farming will exceed the associated costs of converting from a capital-intensive technology to a labour-intensive one as well as on the relation-ship between the support organic farming receives and its rate of adoption.
DISCLAIMER This paper reports the results of a larger study commissioned from the Empresa Pública Desarrollo Agrario y Pesquero S.A. (Spain) by the Institute for Prospective Technological Studies (IPTS), and does not represent the official position of the European Commission. Usual disclaimers apply.
REFERENCES CÁCERES CLAVERO, F., CRUZ GÓMEZ, J. C., GARCÍA COLLADO, R., SERRANO JAÉN, E., AGUILAR MONTILLA, S., AUGAITYTĖ, S., LUCENA COBOS, B., MÉNDEZ RODRÍGUEZ, M. A., MANRIQUE GORDILLO, T., PARRA HERAS, T., CRISTOIU, A. (2007): Sustainable Farming Systems in the New Member States. Summary Report. Institute for Prospective Technological Studies, Seville, Spain. (forthcoming).

Farming efficiency and farming organizations
275
EUROSTAT (2007): Agriculture and fisheries Series Statistics. On-line database. http://epp.eurostat.ec.europa.eu/portal/page?_pageid=0,1136206,0_45570467&_dad=portal&_schema=PORTAL
HELANDER, C. A., DELIN, K. (2004): Evaluation of farming systems according to valuation indices developed within a European network on integrated and ecological arable farming systems. European Journal of Agronomy, 21, pp. 53-67.
PRETTY, J. (1995): Regenerating Agriculture. Policies and Practice for Sustainability and Self-Reliance. Earthscan, London.
RIGBY, D., CÁCERES, D. (2001): Organic farming and sustainability of agricultural systems, Agricultural Systems, 68(1).

THE ECONOMICS OF FARM ORGANIZATION IN CEEC AND FSU
PAVEL CIAIANA, JAN POKRIVCAKB, DUSAN DRABIKC a Katholieke Universiteit Leuven, Belgium; and Slovak Agricultural University in Nitra,
Slovakia, Faculty of Economics and Management, Tr. A. Hlinku 2, 949 76, Slovakia. E-mail: [email protected]
b Slovak Agricultural University in Nitra, Slovakia. E-mail: [email protected] c Slovak Agricultural University in Nitra, Slovakia. E-mail: [email protected]
1 INTRODUCTION In developed countries agricultural sector is dominated by relatively small family farms, while in Central and Eastern European Countries (CEEC) and Former Soviet Union (FSU) there are large corporate farms (CF) and relatively small family farms (FF). Literature from the 1990s predicted that the large socialist cooperatives in CEEC and FSU would transform into Western-style FF because FF are more efficient than CF (SCHMITT, 1991; CSAKI, LERMAN, 1996; HAGEDORN, 1994). This transformation has not occurred, however. The paper by CIAIAN and SWINNEN (2006) provides a theoretical model that explains why CF persist. Large CF continue to exist because emerging FF face significant transaction costs to obtain land from the established CF. Transactions costs include bargaining with the farm management, obtaining information on land and tenure regulations, implementing delineation of the land and dealing with inheritance and co-owners (SWAIN, 1999; PROSTERMAN, ROLFES, 1999; CIAIAN, SWINNEN, 2006). Large transaction costs help CF to keep a large share of land at the expense of FF. If some CEEC and FSU are stuck with CF, an important question arises: Do profit maximizing CF produce the same commodities as profit maximizing FF? Or, does farm organization have an impact on production structure? We consider the choice of farm organization as given because of initial conditions (existence of large cooperatives at the end of communist era) and high transaction cost of the change of organization form; and investigate how farm organization affects the production structure. ALLEN and LUECK (2002), on the other hand, investigate

Farming efficiency and farming organizations
277
how product characteristics affect the choice of farm organization. Their approach does not consider transaction costs of changing of farm organization. Whether farm organization affects production structure is an important question for policy makers because transaction costs of the change of farm organization can be affected by political decisions and it is important to know how farm organization affects production structure of agricultural sector and how it is related to the loss of efficiency. The paper provides insights into the impact of transaction costs on production structure and development of production structure in transition countries. The paper is organized as follows. The next section is devoted to capital intensity and monitoring of labor in agriculture, which is followed by a section on empirical evidence of farm specialization. The last section summarizes and draws conclusions.
2 CAPITAL INTENSITY AND MONITORING OF LABOR IN AGRICULTURE
There are several studies that evaluate advantages of FF relative to CF. According to these studies FF do not suffer from moral hazard problem as farmer is residual claimant. On the other hand, FF are hindered by lack of labor specialization, which reduces the marginal product of labor. Furthermore, FF face higher costs for capital compared to partnerships, or corporations, and therefore use less capital, implying a smaller farm with less equipment compared to partnerships and factory-corporate farms (POLLAK, 1985; ALLEN and LUECK, 2002). ALLEN and LUECK (2002) explained how the choice of farm organization changes with the type of product. The comparative advantage of large CF is in capital intensive product types for which monitoring of labor is relatively low and in which specialization of labor is possible. On the other hand, small FF have comparative advantage in products in which labor monitoring is important, measurement of labor effort is difficult and capital intensity is unimportant. ALLEN and LUECK (2002) do not consider transaction costs to change farm organi-zation from CF to FF. The literature on transition countries (e.g. CIAIAN and SWINNEN, 2006), however, asserts that these transaction costs are significant; hindering the growth of family farms. Therefore, in transition countries like CEEC and FSU the crucial choice is not between farm organization, that is between FF and CF, but rather what production structure is chosen by CF and FF, respectively. High transaction costs protect the existence of CF, but CF have still to choose the production structure to strengthen their competitiveness on the land market relative to growing FF; and on the output market relative to FF at home as well as with respect to international competitors.

Agricultural economics and transition
278
Next, we empirically evaluate agricultural commodities taking into account moni-toring requirements and capital intensity. Based on this, we identify in which products FF and CF have comparative advantage. Data for measuring labor monitoring requirements and capital intensity explicitly for each commodity is not available. Therefore labor per hectare for a farm type specialized by commodity serves as a proxy for labor monitoring requirement per commodity. Amount of labor per hectare for a farm type specialized by commodity was obtained from FADN (Farm Accountancy Data Network) data of the European Commission. Number of labor per hectare is measured as annual work unit (AWU)3 per hectare. Capital intensity was also computed for each farm type specialized by commodity as a ratio of capital costs4 to labor costs5. We considered the following six farm types: (1) Farm specialized in cereals, oilseed and protein crops; (2) Farm specialized in field crops (root crops, combined cereals and root crops, field vegetables, or other field crops (tobacco, cotton, etc.); (3) Farm specialized in permanent crops (horticulture, vineyards, olives, fruits); (4) Farm specialized in livestock (dairy, cattle, sheep); (5) Farm specialized in granivores (pig and poultry); and (6) Mixed farms (mixed crop farms, mixed livestock farms, mixed livestock and crop farms). FADN data were not available for FSU countries. Data were available only for 8 transition countries from Central and Eastern Europe (the Czech Republic, Estonia, Hungary, Latvia, Lithuania, Poland, Slovakia, and Slovenia). To check the robustness of results we performed the same analysis for EU-15 member states. We used ordinary least squares (OLS) estimation with White heteroskedasticity-consistent standard errors to address heteroskedasticity problem. In our regressions dependent variables were AWU per hectare for year 2004 in the case of 8 CEEC; and AWU per hectare averaged over five years, 2000-2004, for EU-15. Explanatory variables were farm types and country dummies (not reported). Country dummies were included to take account of the country specific effects. The results are shown in Tables 5.7 and 5.8.6 To estimate the capital intensity, dependent variable was capital costs divided by labor costs for each farm type for 2004 in the case of 8 CEEC and capital costs divided by labor costs averaged over five years, 2000-2004, in the case of EU-15. Similarly, explanatory variables were farm types and country dummies. Results are shown in Tables 5.9 and 5.10. There is a high level of consistency between CEEC and EU-15 results presented in Tables 5.7 and 5.8, respectively. A positive value (e.g. 0.32 for row 3 denoting
3 AWU measures the total labor input of holding expressed in annual work units (equal to full-
time person equivalents). 4 Capital costs include depreciation, energy costs, machinery and building current consumption. 5 Labor costs include wage costs. 6 All tables are in the Appendix at the end of the study.

Farming efficiency and farming organizations
279
permanent crops and column 1 denoting cereals, oilseeds and protein crops) implies that the respective type of farm in row 3 (farm specialized in permanent crops) has labor requirement per hectare higher (by 0.32) than a farm in column 1 (farm specialized in cereals, oilseed and protein crops). The opposite holds if the estimated parameter is negative. From Tables 5.7 and 5.8 it can be concluded that the highest labor per hectare is required for permanent crops, followed by granivores, livestock, field crops and cereals and oilseeds. The interpretation of the results in Tables 5.9 and 5.10 is the same as in Tables 5.7 and 5.8. Similar to labor monitoring estimates, there is relatively high consistency between CEEC and EU-15 results but for the EU-15 statistical significance of the estimations is stronger. The results reported in Tables 3 and 4 show that livestock production is the most capital intensive followed by cereals, oilseeds, permanent crops and field crops. Table 5.11 summarizes the importance of labor monitoring and capital intensity by farm types. Based on the results obtained from the estimations, we constructed ranking of labor monitoring requirement and capital intensity for each farm type. The farm type that requires most labor per hectare or the farm type that is the most capital intensive received 5 stars, while the farm type that is the least capital intensive or requires the least labor per hectare received 1 star. Mixed farms were excluded from analysis because labor monitoring requirement and capital intensity cannot be associated with a specific product type unambiguously. From Table 5.11 we can conclude that CF have comparative advantage in cereals and oilseed production, while FF have comparative advantage in permanent crops. Cereals and oilseed production have low labor requirement and are capital intensive. The evidence is mixed for animal sector and field crops.
3 FARM SPECIALIZATION – EMPIRICAL EVIDENCE Consistent data on FF and CF production structure was not available. Therefore we could not conduct a direct test for product specialization of FF and CF. We followed two indirect approaches to test our hypothesis instead. First, we tested how product structure changes with farm size and we note that CF are generally large and FF are small. Second, we tested how production structure at a country level changes with the share of FF on land use. If our hypothesis holds, then in a country where FF dominate, production structure will be biased toward products in which FF have comparative advantage. In other transition countries where CF prevail, the production structure will be biased towards products in which CF have comparative advantage. We used Eurostat data to conduct the first test. We collected data for 10 CEEC: Bulgaria, the Czech Republic, Estonia, Hungary, Latvia, Lithuania, Poland, Slovenia, Slovakia, and Romania. For each country land use data for 8 farm size

Agricultural economics and transition
280
intervals were collected for two available years: 2003 and 2005. The exception is Bulgaria and Romania for which data were available only for 2003 year. The following six land use categories were considered: (1) Cereals and oilseeds, (2) Industrial plants; (3) Forage plants; (4) Potatoes and Sugar beet; (5) Fresh vegetables, melons, strawberries; and (6) Permanent crops. For estimation we used OLS with White heteroskedasticity-consistent standard errors to address heteroskedasticity problem. Dependent variables were the six land categories expressed as shares of utilized agricultural area (UAA) and averaged over the two available years: 2003 and 2005, except for Bulgaria and Romania in which case only data for 2003 were used. Explanatory variables were logarithm of farm size and country dummies (not reported) to take account of the country specific effects. For farm size, average of the lower and upper value of each of the 8 intervals was calculated and this value was used for estimation. Results are shown in Table 5.12. To check the robustness of our results, we conducted similar estimations for EU-15. The results are shown in Table 5.13. Consistent with our predictions in previous sections, large farms tend to specialize in cereals and oilseeds while small farms specialize in permanent crops. Since small farms tend to be FF while large farms are mostly CF in transition countries we can conclude that CF specialize in cereals and oilseeds while FF specialize in permanent crops. Results are similar for CEEC and EU-15. Furthermore, FF also specialize in fresh vegetables, melons and strawberries which have similar product characteristics to permanent crops. Inconclusive evidence was obtained for field crops (potatoes and sugar beet). In CEEC small farms specialize in potatoes and sugar beet while in EU-15 this is the opposite. It is because CEEC use more labor intensive technology to produce potatoes and sugar beet, while EU-15 countries use capital intensive production. Forage plants increase with the farm size in both CEEC and EU-15. This is an indication that livestock production is concentrated on larger farms. Production of industrial crops also increases with farm size in both EU-15 and CEEC. The second test was performed at a country level. We conducted 4 OLS regressions with the following dependent variables, respectively (1) Cereals and oilseeds area as a share on arable and permanent crops area, (2) Labor intensive crop area7
as a share on arable and permanent crops area, (3) Livestock units per hectare, and (4) Number of pig per hectare. These data was collected from FAOSTAT for 23 transition countries. For each country we used average value for five years, 1999-2003. The explanatory variables were share of FF on land use, cereal yield as a proxy for land quality, amount of arable land per capita, and GDP per capita as a proxy for technology. Cereals yield, arable land and population were collected from Faostat, while GDP per capita came from the United Nations database. In total, we obtained data for each country for one year. All variables in the model
7 The crop included in this category: fruit, vegetables, sugar beets and potatoes.

Farming efficiency and farming organizations
281
are in logarithm form. The results are reported in Table 5.14. OLS estimation with White heteroskedasticity test was performed. As shown in Table 5.14, no heteroskedasticity was found in all estimated models. In countries where the share of FF on land use is higher, a smaller area tends to be allocated to cereals and oilseeds and more to labor intensive crops. Furthermore, in countries where the share of FF on land use is higher, number of livestock and pigs per hectare is higher than in countries with lower share of FF on land. This is in contradiction with the prediction that forage increases with farm size as reported in Tables 5.12 and 5.13. This could be due to the fact that CF may produce forage for the market and not for farm consumption by own animals. SEROVA (2002) also observes that in Russia households are more involved in livestock breeding and producing high value products like fruits and vegetables, while corporate farms are specialized in cereal crops, oilseeds, and feed crops.
4 CONCLUSIONS AND DISCUSSION In transition countries land markets are characterized by high transaction costs which help CF to keep their dominant positions. However, CF compete with FF for land resources and in domestic and international output markets. Both CF and FF specialize in commodities in which they have comparative advantage. This paper shows that CF specialize in capital intensive products and in products with low labor monitoring. FF specialize in products with higher labor monitoring requirement. The implication of this paper is that farm structure determines in which products the country will be competitive on international markets. This is especially important for transition countries where high transaction costs hinder the change of farm organization. For this reason in transition countries suffering from high transaction costs the choice of product structure is more important than the choice of farm organization. With zero transaction costs farm organization would adjust as predicted by ALLEN and LUECK (2002).
REFERENCES ALLEN, D. W., LUECK, D. (2002): The nature of the Farm, Contracts, Risk, and Organization in Agriculture. Cambridge, Massachusetts: MIT Press.
CIAIAN, P., SWINNEN, J. F. M. (2006): Land Market Imperfections and Agricultural Policy Impacts in the New EU Member States: A Partial Equilibrium Analysis. American Journal of Agricultural Economics, 88, pp. 799-815.
CSAKI, C., LERMAN, Z. (1996): Agricultural Transformation in Central and Eastern Europe and the Former USSR: Issues of Land Reform and Farm Restructuring. Paper Presented at the VIIIth Congress of the European Association of Agricultural Economists, Edinburgh.

Agricultural economics and transition
282
HAGEDORN, K. (1994): Changing Organisation of Agriculture as a Result of the Transformation Process. Paper Presented at the Workshop "The Impact of CEE Agricultural Reform on Domestic and International Markets", Leuven, 10-11 June.
POLLAK, R. A. (1985): A transaction costs approach to families and households. Journal of Economic Literature, 23(June), pp. 581-608.
PROSTERMAN, R. L., ROLFES, L. (Jr.). (1999): Review of the Legal Basis for Agricultural Land Markets in Lithuania, Poland and Romania. Paper presented at the Second World Bank/FAO Workshop, Warsaw, 27−29 June.
SCHMITT, G. (1991): Why is the Agriculture of Advanced Western Countries still Organised by Family Farms? Will this continue to be so in the Future? European Review of Agricultural Economics, 18, pp. 443-458.
SEROVA, E. (2002): Evolution of the Farm Structure in Russia's Agriculture: Background and Perspectives. Paper presented at the Conference on "Pre-accession Strategy of Czech Agriculture towards EU", held on occasion of the 90th anniversary of Czech Institute of Agricultural Economics (VUZE), Prague, 27-28 September.
SWAIN, N. (1999): Agricultural Restitution and Co-operative Transformation in the Czech Republic, Hungary and Slovakia. Europe-Asia Studies, 51, pp. 1199−1219.
APPENDIX Table 5.7: Labor per hectare in CEEC Cereals,
oilseed and
protein crops
Field crop Permanent crop
Livestock Grani-vores
Mixed farms
Cereals, oilseed and protein crops
─ -0.02 -0.32*** -0.02 -0.19*** -0.04**
Field crop 0.02 ─ -0.30*** 0.01 -0.16** -0.02
Permanent crop 0.32*** 0.30*** ─ 0.30*** 0.13 0.28***
Livestock 0.02 -0.01 -0.30*** ─ -0.17** -0.02
Granivores 0.19*** 0.16** -0.13 0.17** ─ 0.15**
Mixed farms 0.04** 0.02 -0.28*** 0.02 -0.15** ─
Source: Own calculations. Notes: */**/*** Significant at 10/5/1 %.

Farming efficiency and farming organizations
283
Table 5.8: Labor per hectare in EU-15 Cereals,
oilseed and protein crops
Field crop Permanent crop Livestock Granivores Mixed
farms
Cereals, oilseed and protein crops
─ -0.01 -0.33*** -0.02 -0.09*** -0.03**
Field crop 0.01 ─ -0.31*** -0.01 -0.08*** -0.02
Permanent crop 0.33*** 0.31*** ─ 0.30*** 0.24*** 0.29***
Livestock 0.02 0.01 -0.30*** ─ -0.07** -0.01
Granivores 0.09*** 0.08*** -0.24*** 0.07** ─ 0.06**
Mixed farms 0.03** 0.02 -0.29*** 0.01 -0.06** ─
Source: Own calculations. Notes: */**/*** Significant at 10/5/1 %. Table 5.9: Relative capital costs to labor costs in CEEC Cereals,
oilseed and
protein crops
Field crop Permanent crop
Livestock Grani-vores
Mixed farms
Cereals, oilseed and protein crops
─ 2.1 9.2* -9.4* 3.5 -1.0
Field crop -2.1 ─ 7.1 -11.6** 1.4 -3.1
Permanent crop -9.2* -7.1 ─ -18.6** -5.6 -10.1
Livestock 9.4* 11.6** 18.6** ─ 13.0** 8.5
Granivores -3.5 -1.4 5.6 -13.0** ─ - 4.5
Mixed farms 1.0 3.1 10.1 -8.5 4.5 ─
Source: Own calculations. Notes: */**/*** Significant at 10/5/1 %.

Agricultural economics and transition
284
Table 5.10: Relative capital costs to labor costs in EU-15 Cereals,
oilseed and protein crops
Field crop Permanent crop
Livestock Grani-vores
Mixed farms
Cereals, oilseed and protein crops
─ 9.4*** 11.5*** -2.2 3.4 5.1*
Field crop -9.4*** ─ 2.1 -11.6*** -6.0** -4.3**
Permanent crop -11.5*** -2.1 ─ -13.7*** -8.1*** -6.4***
Livestock 2.2 11.6*** 13.7*** ─ 5.6** 7.2*** Grani-vores -3.4 6.0** 8.1*** -5.6** ─ 1.7
Mixed farms -5.1* 4.3** 6.4*** -7.2*** -1.7 ─
Source: Own calculations. Notes: */**/*** Significant at 10/5/1 %. Table 5.11: Importance of labor monitoring requirements and capital
intensity by farm type and farm comparative advantage Cereals, oilseed and
protein crops Field crop Permanent
crop Livestock Granivores
Labor monitoring * * * * * * * * * * * * * * *
Capital intensity * * * * * * * * * * * * * * *
Comparative advantage CF ? FF ? ?
Source: Own calculations. Notes: ? & unambiguous decision. Table 5.12: Land use specialization and farm size in CEEC
Cereals
and oilseeds
Industrial plants
Forage plants
Potatoes and Sugar
beet
Fresh vegetables,
melons, strawber-
ries
Permanent crops
C 9.14*** 1.53* 2.29* 5.50*** 1.81*** 7.06*** Farm size 6.12*** 2.33*** 0.91*** –1.31*** -0.41*** -1.60*** (0.000) (0.000) (0.007) (0.000) (0.000) (0.000) R-squared 0.88 0.87 0.78 0.63 0.65 0.64
Source: Own calculations. Notes: */**/*** Significant at 10/5/1 %; p-value in parentheses; Dependent variable is measured
in percent of Utilized Agricultural Area (UAA)

Farming efficiency and farming organizations
285
Table 5.13: Land use specialization and farm size in EU-15
Cereals and
oilseeds
Industrial plants
Forage plants
Potatoes and Sugar
beet
Fresh vegetables,
melons, strawber-
ries
Permanent crops
C -
10.32*** -1.76*** 14.92*** -0.91 2.66*** 17.92***
Farm size 5.53*** 0.66*** 0.88* 0.62*** -0.73*** -6.41***
(0.000) (0.000) (0.067) (0.001) (0.002) (0.000)
R-squared 0.77 0.65 0.73 0.64 0.35 0.74
Source: Own calculations. Notes: */**/*** Significant at 10/5/1 %; p-value in parentheses. Dependent variable is measured
in percent of Utilized Agricultural Area (UAA).
Table 5.14: Regressions results
Cereals and
oilseeds Labor
intensive Livestock units per
Pig per hectare
-2.058 -5.98* -6.928* -31.571*** Constant (0.395) (0.053) (0.085) (0.009) -0.114** 0.137* 0.199* 0.853*** FF (0.045) (0.077) (0.052) (0.006)
0.136 0.476 0.428 2.150 Cereal yield (0.611) (0.176) (0.348) (0.104) -0.007 -0.442*** -0.724*** 0.454 Arable land per capita (0.947) (0.006) (0.001) (0.394) 0.041 -0.275 -0.016 0.668 GDP per capita (2003)
(0.529) (0.024) (0.914) (0.126) R-squared 0.19 0.65 0.66 0.73 White Heteroskedasticity Test – no cross terms (Prob. Chi-Square) 0.38 0.41 0.76 0.31
Source: Own calculations. Notes: */**/*** Significant at 10/5/1 %; p-value in parentheses.

THE STRUCTURE OF INDIVIDUAL (FAMILY) FARMS IN HUNGARY
ANNA BURGERA, KATALIN SZÉPB a Institute of Economics of the Hungarian Academy of Sciences Budapest, 1112 Budaőrsi-út 45.
E-mail: [email protected] b Hungarian Statistical Office, Department of Research and Methodology Budapest, 1024
Fényes E.-u. 14-18. E-mail: [email protected]
1 INTRODUCTION In 2003 a research study looked at the position of smallholders; the representative survey was carried out using questionnaires and interviews (BURGER, SZÉP, 2006). The farms included in the survey were situated in 3 counties in the Southern Great Plain of Hungary and in 3 counties of the Western part of the country (Transdanubia) (see Figure 5.2). The specific counties were, in the Southern Plain Bács-Kiskun, Békés and Csongrád; in the western part of Hungary the counties included Győr-Moson-Sopron, Vas and Zala. We received replies to the questionnaires, which could be usefully used in the survey from 613 family farms (see Table 5.15). In this paper the tables, figures, and statements refer to the farms of the survey except in cases where an other source is referred to. Table 5.15: Number and area of farms in the two regions
Southern Great Plain Western Transdanubia Farmers
Number Area ha Average area ha Number Area ha Average
area ha Entrepreneurs* 49 3,072.40 62.70 46 2,381.56 51.77 Smallholders** 180 2,262.10 12.57 195 2,286.00 11.72 Family farmers*** 74 3,230.00 43.65 69 3,836.30 55.57 All 303 8,564.50 28.27 310 8,503.86 27.43 Notes: * Farms which are obliged to provide data for statistics regularly and to pay taxes.
** Farms which are not obliged to provide data for statistics regularly and to pay taxes till a certain income limit.
*** Farms which are also not obliged to provide data for statistics regularly and to pay taxes till a certain income limit but one family member is a full-time farmer and the other family members are helping on the farm. This legal form was created by the 1998-2002 center-right government in the interest of preferential support.

Farming efficiency and farming organizations
287
One of the aims of the study was to acquire a general picture of the state of family farms. A second aim was to compare the situation in the Southern Plain (a region which is far from the growth centre of the capital and the Western border of the country) with that in the 3 counties of the western part of Transdanubia. The Western border of the country is near to Austria, it is more industrialized, it is supplied with more foreign investment, has better transport roads, more services, more tourists and the per capita GDP and employment is higher than in the South Plain. However, in the Southern Plain the agricultural sector has a more dominant role. Figure 5.2: Map of the Hungarian counties
Pest
Békés
Fejér
Zala
Vas
SomogyBács-KiskunTolna
Heves
Baranya
Hajdú-Bihar
Csongrád
Veszprém
Nógrád
Borsod-Abaúj-Zemplén
Jász-Nagykun-Szolnok
Szabolcs-Szatmár-Bereg
Gyõr-Moson-Sopron
Komárom-Esztergom
Budapest
SCHULTZ (1953), when developing further the theory of PERROUX (1950) about the economic advantages of market proximity, stressed that in the industrial and urban areas, where the trade of produce and means of production are significant, agriculture develops faster than in the areas further from centers of growth. We wanted to investigate whether this theory could be proved in our survey. We surveyed and analyzed the following features of the respective farms: Farm structure; land tenure; labor force; production; yields; trade; capital stock; credits; subsidies; profitability; intentions for development; and prospects for the future. We were also interested to find out what sort of differences had taken place in the situation of individual farms since the questionnaire survey we carried out in 1998 with respect to individual and corporate farms in 11 Hungarian counties (BURGER et al. 1999; BURGER, 2001). In this paper we deal with the results of the survey concerning land tenure and land use.

Agricultural economics and transition
288
2 METHODS The survey was carried out with interviews using questionnaires. Most of the questions asked referred specifically to the year 2003. The selection of the units was random but it did not comply with the classic conditions for random sampling. Furthermore, we did not carry out corrections with regard to under- or over-represen-tation. Thus we had no intention of drawing conclusions from our results which could be taken as valid on either the regional or national levels. In the course of making comparisons between official national or international statistics, the aim was not to look for identical data but for similar tendencies. The survey focused on the cultivated farm area. The processing of data was carried out according to farm sizes, age-groups of the holders, and their level of education. 2 mentioned regions were distinguished. There were some instances when the counties were treated individually. The size categories of the holdings were, respectively (in hectares): 1-5, 5-10, 10-20, 20-50, 50-100, and those above 100. Units below 1 hectare were not examined. The age-groups were the following: Under-40, between the ages of 40 and 50, and those above 50. The levels of educa-tion were: Elementary (primary) school, secondary school, and higher education. In dealing with the wide range of elements concerning the efficiency and profitabi-lity of the farms, mathematical-statistical methods were employed. On the one hand, the model used regression analysis; on the other hand, in order to classify the main characteristics of the farms, cluster analysis was applied. Here we demonstrate the results of the cluster analysis.
3 THE CONCEPT OF FAMILY FARM CHAYANOV (1966) regarded as a major feature of family farms the fact that they do not aim to maximize their profit, as does a capitalist farm, but to maximize the consumption of the family members. In family farms the output optimum will be reached at a level when the marginal sacrifice of labor of the working family members will equal the marginal utility of each consumer in the family. RAUP (1986) characterizes the family farms as organizations in which the family controls the means of production, the land and the labor force. GASSON and ERRINGTON (1993) describe family farms as entities in which the ownership is identical with the management and this is inherited through generations and secured by kinship or marriage. DJURFELDT (1996) stresses the unity of production, consumption (household) and kinship in family farms and the importance of the work of the family. We regarded those small farms as family farms (BURGER, 1994) which are managed and largely worked by the members of a family and farmed on own and/or rented land.

Farming efficiency and farming organizations
289
4 LAND TENURE Examining the sizes and number of farms involved in the survey, an inverse tendency can be noticed: The larger the area of the holdings, the smaller their number (see Table 5.16). This indicates a concentration of the agricultural area (although we did not examine the dynamics of this process). The tendency towards concentration reinforced the conclusions we had made in our survey of 1998; it could also be supported with dynamic data on the national level and from other sources (AGRICULTURE IN HUNGARY 1996; 2002; 2004; TAKÁCS, 2005; CZIMBALMAS, FEHÉR, 2004). According to the national statistics the number of individual farms under 1 ha decreased from 81.4 % to 71.9 % of the total number between 1994 and 2000 and their area decreased from 16.8 % to 6.8 %. During the same time the area of individual farms larger than 50 hectares grew from 15.5 % to 30.8 % and by 2003 to 39 %. However, the average individual farm size was still 3 ha in 2003. Table 5.16: Number and area of farms according to farm sizes
Percentage Farm sizes Number Area ha Average area haNumber Area ha
1-5 ha 197 589.40 2.99 32.14 3.45 5-10 ha 107 802.00 7.50 17.46 4.69 10-20 ha 114 1664.50 14.60 18.60 9.73 20-50 ha 113 3541.06 31.34 18.43 20.71 50-100 ha 49 3429.70 69.99 7.99 20.06 Over 100 ha 33 7041.70 213.38 5.38 41.18 All 613 7098.36 27.89 100.00 100.00 The concentration had primarily taken place due to renting. The larger the holdings are, the more land they rent. While in the lowest farm size category rented units represent 6 %, in the largest category the equivalent figure is 42 %. (see Table 5.17). It is not only those with the larger farms who are renting more land; it was also recognized that more people in the youngest age group are involved in renting (see Figure 5.3). According to the survey, farms above the size of 100 hectares show a significantly higher proportion of rented land in Western Transdanubia than is the case in the Southern Plain. With respect to the latter point, it is possible that the renting of land for agricultural purposes by foreigners plays a role in this process.

Agricultural economics and transition
290
Table 5.17: The share of cultivated own and rented farmland
Farm sizes ha Own land area Rented land area Other cultivated land area All cultivated area
1-5 94.1 4.8 1.2 100.0 5-10 96.2 3.8 0.0 100.0 10-20 85.7 11.9 2.4 100.0 20-50 76.1 21.0 2.9 100.0 50-100 71.8 23.7 4.5 100.0 Over 100 58.3 37.6 4.0 100.0 All 70.4 26.1 3.4 100.0
Figure 5.3: Rented farm areas according to age groups of farmers
0
10
20
30
40%
Under 40 41-50 Over 50 years old
4.1 Land market The market for the purchase and sale of agricultural land is weak. The reasons for this are the following: • The demand for land is low. This is partly due to various restrictions with
respect to purchase and partly due to the fact that the income from farming is low. In 1994 a law was passed which forbids the purchase and ownership of agri-cultural land (and other real estate) by cooperative and corporate farms, and by foreigners. During the course of the negotiations leading up to Hungary’s acces-sion to the European Union (EU), Hungary – like other transition countries – requested and received a 7-year derogation from EU rules concerning the freedom of any natural and legal individual citizen of an EU member-state to purchase agricultural land (GROVER 2003). The reasoning of the negotiators was that with land prices being so low in Hungary it would make it possible for foreigners to buy large areas of land at cheap prices, thus causing the problem of land scarcity for domestic farmers.
Farming efficiency and farming organizations
291
• The size of ownership and use of land by an individual are also limited (to 300 hectares) by law.
• Due to problems related to the registration and assignation of some parcels of land, as well as the long duration of legal processes concerning the ownership of some properties, the actual ownership situation of large areas of land remains uncertain. Owing to the lack of consolidation, many scattered parcels cannot be sold. There is still approximately 1.5 million hectares of land which is undivided in corporate farms, being under the ownership of individuals who worked on the farm when it had a cooperative status, or in the hands of descendants of the corporate farms. Owing to the scattered nature and position of these parcels within the area of much larger fields it is impossible to sell them.
• The supply of agricultural land is also meager. During the course of the privatization of land a significant proportion of agricultural land was returned to the descendants of its former owners or to other people not associated with that land. Most of the latter had no connection with agriculture and were living in towns. A large number of those owning land (and including many pensioners) but having no intention of using it do not feel it is worth selling the land at the moment and are prepared to wait until they can get a higher price.
Even with the poor supply of agricultural land for sale, problems with registration and the lack of land consolidation, foreigners still would not have much chance of buying a larger proportion of agricultural land at today’s depressed prices. A more significant rise in the value of land can only be expected when more movement begins on the market. However, that cannot occur unless the factors obstructing greater movement are removed. It is true that the Hungarian land prices and land rents are much lower than the Western European prices and rents. However they are gradually growing, mainly near to the Austrian border (ERB, 2004). The supports of the EU, especially in form of direct payments contributed to the rise of land prices. The foreign demand for land will not grow very much either at whatever prices after the restrictions are lifted since the demand for agricultural produce is low in Europe and the country lies on the periphery of the continent, far from the trade centers. The average land prices and land rents are very different even in the old EU countries. They depend on the total agricultural population/land ratio, on the supply of and demand for land, and on the GDP/capita of the country, etc. An average EU price, which should be reached according to the negotiators for accession, as the criteria of lifting the restrictions with respect to the selling of land to foreigners, does not exist. Hungarian land prices will probably never reach the highest European level because the man/land ratio is relatively low and decreasing in Hungary, i. e. there is no land scarcity and very likely it will not be scarcity in the future (BURGER, 2006).

Agricultural economics and transition
292
4.2. Land prices observed The highest average market price for agricultural land (according to results from the respondents) was in Győr-Moson-Sopron; this was followed by Bács-Kiskun and the other lowland counties (see Table 5.18). The highest price for arable land was in Győr-Moson-Sopron, followed by Békés and then Vas County. The high market value of land in Győr-Moson-Sopron county was not so much related to the superior quality of the agricultural land but for the most part, due to the greater level of industrialization and the livelier nature of the economy in general in that county.
5 LAND USE The structure of the agricultural land used indicates that an overwhelming part is devoted to arable farming (approximately 80 %) and it is cereals that represent the dominant crop. Vineyards and orchards account for a very small proportion of the land (about 2.5 %) (see Figure 5.4). In the Southern Plain, Bács-Kiskun County followed by Csongrád County have figures which are slightly above the average for the latter types of land use. The average for the land given over to pasture is 12 %, but in the counties of Vas and Zala – which, geographically, are in fact foothills of the Alps – the equivalent figures are 22 % and 28 % respectively. The average for the woodland area of individual farms is around 5 %. The equivalent figure for Zala County is approximately 9 %. Table 5.18: Market prices of agricultural land in the counties surveyed Counties Average market
prices of agricultural land
(thousand HUF/ha)
Average market prices of agricultural land (approximately
in EUR/ha)
Average market prices of arable land (thousand HUF/ha)
Average market prices of arable
land (approximately in
EUR/ha) Bács Kiskun
220 880 207 828
Békés 190 760 172 688 Csongrád 180 720 148 592 Győr-Moson-Sopron
236 944 252 1008
Vas 82 328 163 652 Zala 127 508 114 456 All 212 848 198 792

Farming efficiency and farming organizations
293
Figure 5.4::
The production of cereals has continued to be large in Hungary despite regular overproduction. There are several reasons for this: Old habits seem to be hard to give up; farmers are comparatively well equipped for cereal production; it is labor extensive; costs are relatively low; many farmers lack information about the market; and the marketing of other crops is weak. After the privatization, for those absentee owners who acquired land in this process the simplest and cheapest option for culti-vating it was the production of cereals by hiring machinery services. Accession to the EU has added to the incentives for cereal production, given that the EU provides significant subsidies for the land itself and for cereal crops. The result of all the above was an even greater level of overproduction. We think that greater diversifi-cation of crop production should be stimulated, propping it up with more thorough market information. Products of organic farming account for only a small proportion of produce on farms surveyed: Not more than 2.5 % in average.
6 CLUSTER ANALYSIS Based on the characteristics of labor, land use, animal husbandry and supply of machinery we can identify different clusters of farms. We characterized the farms by a set of their main features. Then different clusters were formed in accordance with the similarities of these features. Finally we compared the different clusters. The main features which characterized the farms were the followings: Labor: Ages, educational levels (1 – elementary school, 2 – secondary school, 3 – high school), number of workers on the farm, number of workers per ha. Land: The total cultivated area (ha), the share of own land in the total area (%), the share of wheat area (%); Livestock: Heads of cattle and pigs, number of cattle and pigs per 100 ha;
Percentage shares of agricultural sectors in the South Plain
0,713,8
1,081,24
8,97
84,21
Arable land Vine Fruit Grass Forest Other
Percentage shares of agricultural sectors in Western Transdanubia
14,09
0,582,3
6,680,15
76,2
Arable land Vine Fruit Grass Forest Other

Agricultural economics and transition
294
Machinery: Number of machinery per 100 ha, i. e. number of tractors, combine harvesters, and lorries. Each farm was characterized by a vector and the elements of this were the standar-dized values of the above characteristics. They were standardized in order to avoid the influence of the magnitude of the different measures. The similarity of the farms/vectors was measured by Euclidean distance. 5 groups of the 573 farms were formed using an iteration procedure (SPSS K-means cluster i. e. quick cluster). One single farm with a huge pig stock formed group 2. Therefore we omitted cluster 2. The characteristics of the resulting clusters are presented in Table 5.19. The characteristics of the "Traditional" cluster 1 with 72 farms are the following: Aged farmers with low educational levels, small land areas, highest number of workers, 1-2 machines, and no specialization. The "Medium productivity" cluster 5 is the largest group. It is characterized by larger, but still small farms with younger but still relatively old but more educated farmers, a small number of workers, and low mechanization level. 103 farms form the "Efficient" cluster 4. They have large areas, young educated farmers, and highest number of machines. The number of workers and machinery per area are small; they are engaged in efficient crop farming. The cluster 3, 56 farms of "Cattle breeders" has one common characteristic: Cattle hus-bandry. The cattle stock is the highest in this cluster in absolute and relative measures. Table 5.19: Clustering characteristics of the formed clusters
Cluster 1 Traditionalfarms
Cluster 3 Cattle breeder farms
Cluster 4 Efficient farms
Cluster 5 Farms of medium
productivity
Clustering characteristics
N=72 N=56 N=103 N=341 Total number of adolescents working on the farms
4.3 3.1 3.4 2.5
Number of workers per ha 1.8 0.3 0.1 0.4 Ages of managers (year) 53.9 49.8 48.2 52.6 Educational levels of managers (1-elementary, 2-secondary, 3-high)
1.7 1.8 2.0 2.0
Total cultivated area (ha) 3.2 28.3 88.5 13.9 Shares of wheat area (%) 11.3 29.8 29.9 24.5 Cattle (heads) 0.1 19.5 2.0 0.4 Cattle per 100 ha 3.0 112.0 4.2 4.4 Pigs (head) 8.2 10.8 18.0 6.0 Pigs per 100 ha 326.7 77.2 53.0 70.0 Tractors, combine harvesters, lorries (pieces) 1.2 1.8 3.1 0.7
Pieces of tractors, combine harvesters, lorries per 100 ha
43.9 12.1 7.3 6.7

Farming efficiency and farming organizations
295
7 CONCLUSIONS Our survey showed that there is a firm tendency of concentration among individual Hungarian farms. Although their average size is about 3 ha, the number and area of farms over 50 ha in size are rapidly growing and now account for a significant part of the total individual agricultural area. The number of small farms is great but their total farming area is relatively small. Farms of over 50 and 100 hectares are the most efficient and they have the highest yields. The dominance of arable production and within that cereal production, especially on the larger individual farms, points to a prevalence of extensive farming. The present support and subsidy system fortifies this tendency. When comparing the Southern Plain with Western Transdanubia, it can be said that agricultural production is greater in the former region and more people are involved in agriculture. Nevertheless, Western Transdanubia’s proximity to industrial and service centers and, furthermore, its closeness to Austria tend to suppress agricultural activities. The survey also showed that farmers under 50 years of age and having a higher level of education than a primary one achieved better results than those over 50 and with a lower level of education.
ACKNOWLEDGEMENTS My thanks go to all those people who contributed to the research on which this paper was based and to the OTKA Hungarian Research Foundation for supporting the research.
REFERENCES AGRICULTURE IN HUNGARY (1996; 2002; 2004): Farm Structure Surveys. Hungarian Statistical Office, Budapest.
BURGER, A. (1994): The Agriculture of the World. Ashgate, p. 306.
BURGER GIMES, A., TÓTH, K., KOVÁCS, CS. (1999): The Economic Situation of the Hungarian farms [A mezőgazdasági üzemek gazdasági helyzete]. Agricultural Economic Studies [Agrárgazdasági Tanulmányok] AKII, No. 13, p. 55.
BURGER, A. (2001): Agricultural development and land concentration in a Central European country: A case study of Hungary. Land Use Policy, 18, pp. 259-268.
BURGER, A.., SZÉP, K. (2006): The Economic Situation of Individual (Family) Farms [Az egyéni (családi) mezőgazdasági üzemek gazdasági helyzete napjainkban]. Agroinform, p. 110.
BURGER, A. (2006): Why the Issue of Land Ownership is still a major concern in East Central European (ECE) Transitional Countries and particularly in Hungary? Land Use Policy 23(4), pp. 571-579 and Internet doi: 10.1016/1 landusepol.2005.01.003.
CHAYANOV, A. V. (1966): On the Theory of Peasant Economy. Richard D. Irwin Inc., Homewood, Illionis.

Agricultural economics and transition
296
CZIMBALMAS, R., FEHÉR, A. (2004): Concentration of Small and Medium-Size Farms in County Jász-Nagykun-Szolnok [Kis-és közepes gazdaságok területi koncentrációja Jász-Nagykun-Szolnok megyében]. Gazdálkodás, 48(6), pp. 2-10.
DJURFELDT, G. (1996): Defining and Operationalizing Family Farm from Sociological Perspective. Sociologia Ruralis, 36(3), pp. 340-355.
ERB, K. H. (2004): Actual Land Demand of Austria. Land Use Policy, 21(3), pp. 247-259.
GASSON, R., ERRINGTON, A. (1993): The Farm Family Business. Wallingford: CAB International.
GROVER, R. (2003): Land Tenure and European Union Accession. FAO Paper, p. 22.
PERROUX, F. (1950): Economic Space: Theory and Applications. Quarterly Journal of Economics, 64.
RAUP, P. M. (1986): Family Farming: Rhetoric and Reality. Staff Paper Department of Agricultural Economics and Applied Economics, University Minnesota, St. Paul, pp. 86-56.
SCHULTZ, TH. W. (1953): The Economic Organization of Agriculture. Mc.Graw-Hill, New York.
TAKÁCS, J. (2005): Major Features of the Hungarian Agriculture according to the 2003 Farm Structure Survey. Volume I. [A magyar mezőgazdaság főbb jellemzői a 2003. évi gazdaságszerkezeti összeírás alapján (I.).] Statisztikai Szemle, 83(8), pp. 705-723.

FACING THE FUTURE: STRATEGIES AND INVESTMENT BEHAVIOUR OF POLISH FARMERS
S. GOMEZ Y PALOMAA, E. MAJEWSKIB, M. RAGGIC, D. VIAGGID
a EC-JRC Institute for Prospective Technological Studies (IPTS), Seville, Spain, E-mail: [email protected]
b Warsaw University of Life Sciences, Warsaw, Poland, E-mail: [email protected]
c Department of Statistics, University of Bologna, Italy, E-mail: [email protected] d Department of Agricultural Economics and Engineering, University of Bologna, Italy,
E-mail: [email protected]
1 INTRODUCTION AND OBJECTIVES The EU Common Agricultural Policy (CAP) plays an important role in determi-ning farming viability and development trajectories in rural areas. Among policy analysis exercises carried out up to now, the issue of policy effects on investment behaviour looks to a large extent insufficiently studied, particularly compared to its likely importance in the long term (BAUM ET AL., 2004; EUROPEAN COMMISSION, 2003; OECD, 2005). At the same time, literature emphasises the complexity of this issue, in relation to structural adjustment, labour and capital markets, uncer-tainty and household life cycle (HAPPE, 2004; LAGERKVIST, 2005; LATRUFFE, 2004; SCKOKAI, MORO, 2006). This paper analyses the farm strategies and investment behaviour of Polish farmers facing present markets and policy challenges, with a particular focus on the effects of the CAP. The study is based on a survey of farm households located in five different regions of Poland. The paper is structured as follows. Section 2 describes the background situation of Polish agriculture. Section 3 describes the methodology adopted. Section 4 describes the case studies to which the methodology is applied. Section 5 discusses the results. Section 6 presents the policy implications and conclusions.

Agricultural economics and transition
298
2 BACKGROUND: SCENARIOS AND CHALLENGES OF AGRICULTURE IN POLAND
Polish agriculture with its about 16 million hectares of agricultural land belongs to the largest agricultural sectors in the enlarged EU-27. Among many of the specific features of the agricultural sector in Poland the following few key characteristics should be mentioned: Weakening role in the national economy, fragmented pattern of land ownership and farm structures. Although the share of private ownership was in Polish agriculture always very high (75 %) compared with other former socialist countries, before 1989 still 25 % of agricultural land was operated by state and co-operative farms. The transition to market economy initiated in 1989 resulted in almost complete privatization and transformation of the majority of former state farms into commercial companies. As a consequence, however, the distribution of land ownership is highly skewed. Generally, farms in the North and North-West of Poland are much larger than in the South. The total number of farms in Poland (about 1.8 million) indicates the magnitude of the structural problem that Polish agriculture is facing. Yet, it should be emphasized that about 60 % of all Polish farm holdings are smaller than 5 hectares (agricultural land), they are mainly (semi)subsistence farms, often with no sales to the market. At the opposite extreme of the farms pyramid there are about 20 % of farms (often commercial farms) operating more than 20 hectares each, and all together more than 60 % of the total agricultural area. Polish agriculture shows lower productivity of land and labour compared to the EU-15, resulting from relatively worse natural conditions (mainly soil quality), structural problems, and also from the technological gap. Polish agriculture is extremely varied, including many different farm types which reflect a huge variety of natural conditions as well as of traditional and advanced forms of technology. The EU accession in the year 2004 has significantly changed the economic conditions for farming, and has exposed Polish farmers to a free market environ-ment. Although Polish agriculture has been included in the CAP since 2004, adjustment processes have been initiated since mid 1990s due to policy changes in the pre-accession period. The dynamic changes in Polish agriculture brought about many threats, but also created opportunities for farmers. There is a significant number of farms which implemented growth strategies, resulting in the on-going farm size increase and concentration of land in clusters of larger farms as well as concentration in the livestock sector, leading to a movement of animals from small scale activities to specialised large scale farming. These changes require investments in all types of fixed assets, including replacements of machinery and transportation means that are run down in a high number of farms.
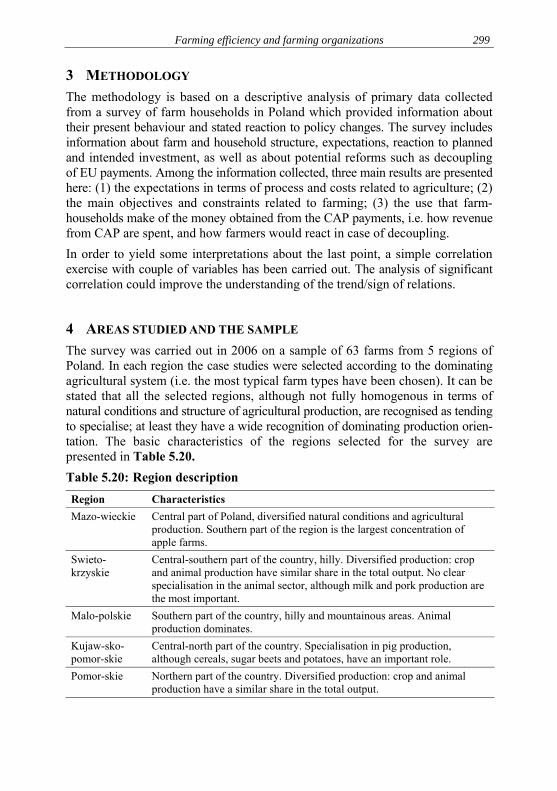
Farming efficiency and farming organizations
299
3 METHODOLOGY The methodology is based on a descriptive analysis of primary data collected from a survey of farm households in Poland which provided information about their present behaviour and stated reaction to policy changes. The survey includes information about farm and household structure, expectations, reaction to planned and intended investment, as well as about potential reforms such as decoupling of EU payments. Among the information collected, three main results are presented here: (1) the expectations in terms of process and costs related to agriculture; (2) the main objectives and constraints related to farming; (3) the use that farm-households make of the money obtained from the CAP payments, i.e. how revenue from CAP are spent, and how farmers would react in case of decoupling. In order to yield some interpretations about the last point, a simple correlation exercise with couple of variables has been carried out. The analysis of significant correlation could improve the understanding of the trend/sign of relations.
4 AREAS STUDIED AND THE SAMPLE The survey was carried out in 2006 on a sample of 63 farms from 5 regions of Poland. In each region the case studies were selected according to the dominating agricultural system (i.e. the most typical farm types have been chosen). It can be stated that all the selected regions, although not fully homogenous in terms of natural conditions and structure of agricultural production, are recognised as tending to specialise; at least they have a wide recognition of dominating production orien-tation. The basic characteristics of the regions selected for the survey are presented in Table 5.20. Table 5.20: Region description Region Characteristics Mazo-wieckie Central part of Poland, diversified natural conditions and agricultural
production. Southern part of the region is the largest concentration of apple farms.
Swieto-krzyskie
Central-southern part of the country, hilly. Diversified production: crop and animal production have similar share in the total output. No clear specialisation in the animal sector, although milk and pork production are the most important.
Malo-polskie Southern part of the country, hilly and mountainous areas. Animal production dominates.
Kujaw-sko-pomor-skie
Central-north part of the country. Specialisation in pig production, although cereals, sugar beets and potatoes, have an important role.
Pomor-skie Northern part of the country. Diversified production: crop and animal production have a similar share in the total output.

Agricultural economics and transition
300
Farmers from those regions where sampled in order to fit in the intersection of the following categories: Different altitudes (plain, mountain); different specialisation (arable crops, livestock, trees), different technology (conventional, organic). Sample descriptives are summarised in Table 5.21. Table 5.21: Sample descriptives Min Max Mean Std.
Deviation % of farms
with positive value
Family farms – – 100% – – Age of farm head (years) 21 62 46 9 100% Succesor (% of yes) – – 67% – – Household head labour on farm (h/year) 301 2200 2015 452 100% Household head labour off farm (h/year) 0 1000 31 176 3% Household labour on farm (h/year) 642 10000 4972 2164 100% Household labour off farm (h/year) 0 4400 346 961 14% Total external labour purchased (h/year) 0 17600 2113 3161 70% Land rented in (% of total farm area) – – 22% – – Total land (ha) 3.6 204 34 40 100% Share of organic products (%) 0 100 18% 37% 24% Debt/asset ratio 0 50 6% 10% 56% Payment amount in 2005 (euro/farm) 0 25805 3371 4740 98% Payment amount in 2006 (euro/farm) 0 25805 3449 4856 97% All sampled farms were family farms, often with a relatively young head. Two third declared to have a successor. Labour availability was rather varied, reflecting different household structures and farm specialisations. The same applies to available land that counted between 3.6 and 204 hectares, with an average share of rented-in land around 22 %. Average payments were around 3,400 euro/farm, though with high variability.
5 RESULTS Farmers showed a wide and varied range of expectations about prices of agricul-tural products, that can either increase, decrease or stay stable (slight majority) (Table 5.22).

Farming efficiency and farming organizations
301
Table 5.22: Expected changes of key context parameters Expected direction of change Size of change
Decrease Increase Stable No reply Mean Std.
Deviation Product prices 27.0% 33.3% 36.5% 3.2% 0.99 0.17 Agricultural labour cost 1.6% 65.1% 17.5% 15.8% 1.06 0.08 Cost of agricultural capital goods 7.9% 76.2% 6.4% 9.5% 1.12 0.19 Cost of other production means 4.8% 84.1% 4.8% 6.3% 1.10 0.12 Decoupled payments 44.4% 6.4% 33.3% 15.9% 0.91 0.27 Rural development payments 22.2% 23.8% 36.5% 17.5% 0.98 0.28
Payments for organic production 17.5% 34.9% 33% 14.3% 1.09 0.44
Coupled payments 22% 22.2% 25.4% 30.2% 1.16 0.73 Expectations are more concentrated in the case of production factors (between 65 and 84% believe their cost will increase). On the contrary, expectations regarding policy parameters (rural development, organic payments) are rather evenly spread between optional answers, with an exception of decoupled payments which, as the majority believes, will decrease. The range of expected changes show in fact that basically there is no relevant expec-tation of change for product prices and rural development payments, while increase in production costs, decrease in decoupled payments, and increase in organic payments appear of some relevance (normally + or – 10 %). Reduction of income uncertainty is the main focus of household objectives and may be likely read both as the need to maintain or increase income as well as to stabilise it (Table 5.23). Table 5.23: Importance of different household objectives (number of answers
per ranking position) Rank 1 2 3 4 5 6 Income certainty 48 13 1 1 Household worth 6 22 21 5 5 Household consumption 2 8 8 14 7 6 Household debt/asset ratio 2 6 4 15 8 14 Leisure time 4 10 14 8 6 10 Diversification in household activities 4 7 6 16 6

Agricultural economics and transition
302
The farming activity is mainly limited by two constraining factors: Market share of key products and unavailability of land from neighbouring farms (Table 7.24). Table 7.24: Importance of different constraints to expanding farming activity
(number of answers per ranking position) Rank 1 2 3 Market share/contract of key products 26 9 6 Unavailability of land from neighbouring 21 13 3 Liquidity availability 7 11 4 Total household labour availability 4 4 5 Household labour availability in key periods 4 9 10 External labour availability in key periods 4 5 5 Short term credit availability 1 3 6 Long term credit availability 2 2 1 Others 1 2 2 Total external labour availability 2 2 This shows substantially a two sided difficulty for the farmers interviewed, i.e. on the one hand they are related to the markets for their products, on the other hand they are concern about the possibility to find land resources allowing for their expansion strategy. The role of the CAP payments in these farms is to a large extent determined by its absolute value, which is often rather limited, with the exception of plain crops and livestock (Table 5.25). Table 5.25: Amount of CAP payments received (euro/farm)
Technology Area Crop Livestock Orchard/vineyard/forest
Mountain 960 1,895 421 CONVENTIONAL Plain 11,145 5,573 901
Mountain – 1,231 – EMERGING Plain 1,131 4,581 –
As a reference hint about the role that CAP plays in the farm-household economy, farmers were asked about their use of revenues from CAP payments. Stated use of CAP payments showed a clear choice for current on farm expenditures Table 5.26). Only livestock farms showed a marked attitude to use payments for investment. Off farm use is mostly negligible. The choice to use Payments for on-farm investment

Farming efficiency and farming organizations
303
is positively correlated with the absolute and relative amount of payments as well as to farm size (Table 5.27). Table 5.26: Stated use of payments
Stated use of SFP
Tec
hnol
ogy
Are
a
Spec
ialis
atio
n
On
farm
cu
rren
t ex
pend
iture
On
farm
in
vest
men
t
Off
farm
pr
oduc
tive
curr
ent
expe
nditu
re
Off
farm
pr
oduc
tive
inve
stm
ent
Off
farm
non
-pr
oduc
tive
inte
rmed
iate
ti
Off
farm
non
-pr
oduc
tive
dura
ble
d
Crop 100% – – – – – Livestock 57% 26% 3% 7% 4% 3%
Mountain
Fruit tree 100% – – – – – Crop 90% 6% – – 1% 3% Livestock 51% 32% – 1% 13% 3%
Con
vent
iona
l
Plain
Fruit tree 94% 6% – – – –
Crop – – – – – – Livestock 15% 85% – – – –
Mountain
Fruit tree – – – – – – Crop 100% – – – – – Livestock 70% 30% – – – –
Emer
ging
Plain
Fruit tree – – – – – – Table 5.27: Correlation between use of CAP payments and potential
explanatory variables
Variable
On farm current
expenditure
On farm investment
Off farm productive
current expenditure
Off farm productive investment
Off farm non-
productive intermediate
consump- tion
Off farm non-
productive durable goods
Payment amount in 2005 + + + Total external labour purchased + – Household head labour on farm – Payment/ revenue + + + Land rented in % of total farm area + + Total land + + +

Agricultural economics and transition
304
However, the use of revenues does not give any direct information about changes that would be produced in case of decoupling. For this reason, householders were asked directly about their reaction to the hypothesis of decoupling. The stated reaction shows effects in three main directions. As expected, "no reaction" was the most frequent answer in orchard and vineyard farms. Livestock farms and conventional mountain crop farms stated mostly the hypothetical increase of on farm investments. Only farms in plain areas, using organic technologies stated mostly the change in crop mix (Table 5.28). Table 5.28: Reaction to decoupling
Reaction to SFP
Increase investment
Decrease investment
None
Tec
hnol
ogy
Are
a
Spec
ialis
ati
on
On
farm
Off
farm
pr
oduc
tive
On
farm
Off
farm
pr
oduc
tive
Cha
nges
in c
rop
mix
Mountain Crop 100% – – – – – Livestock 43% 7% – – 14% 36% Orchard/vineyard/forest 13% – – – – 88% Plain Crop 40% 20% – – – 40% Livestock 88% – – – – 12%
Con
vent
iona
l
Orchard/vineyard/forest 13%
– – – – 88%
Mountain Crop – – – – – – Livestock 100% – – – – – Orchard/vineyard/forest – – – – – – Plain Crop – – – – 100% – Livestock 50% – – – 33% 17%
Emer
ging
Orchard/vineyard/forest – – – – – – It should be noted, however, that decoupling is a pure hypothesis at present in Poland and often farmers showed to have not clear perception about what it could consists of. The choice to increase investment on farm is again positively correlated with the amount of payments and farm size, but negatively correlated with the presence of a successor and total external labour purchase (Table 5.29). In fact, this is consistent with the perception that households that are more labour-self-sufficient and with a perspective for staying in agriculture pursue strategies that are less dependent from policy changes.

Farming efficiency and farming organizations
305
Table 5.29: Correlation between reaction to decoupling and potential explanatory variables8
Increase
investment
Variable On farm Off farm
productive
Off farm non-
productive
Changes in crop
mix
Changes in other activities
None
Payment amount in 2005 + Total external labour purchased – Household head labour on farm – – Household head labour off farm + Succesor – + Number of partial workers – + Land rented in % of total farm area + – Household labour on farm – Total land +
6 DISCUSSION This paper focuses on getting empirical evidence and insights about farmers’ expectation, strategies and reaction to CAP in Poland. The sample, though biased towards most dynamic and collaborative farmers, showed a positive attitude towards pursuing and expanding farming activities. Farmers also showed multifaceted expec tations about the future, mostly revealing the feeling that (1) the gap between gross revenue and costs will continue to decrease (and consequently the profit margin will decrease) and (2) the role of the policy will be most likely reduced and more focused. A main outcome of the study is that in most cases CAP payments are used on-farm and concentrated on covering current costs and invest-ment expenditures. However, reactions to decoupling are highly differentiated both across different systems and across farms in the same system. Accordingly, differences in reaction are better explained by different individual household/farm characteristics (structure, resource endowments and human capital), rather than by association with a specific agricultural system. Overall, in the more efficient and expansion-oriented farms, decoupling is perceived as an opportunity for investment, while in small, poorer performing farms the SFP introduction is viewed rather as an opportunity for extensification. Altogether, the hypothetical post-decoupling CAP looks very much, from the point of view of the Polish farmers interviewed, like a policy which may take different roles depending on the context in which it is cast. As a result, the study hints at the fact that a number 8 No significant correlation was found with the statement that investments were reduced.

Agricultural economics and transition
306
of wider issues should be addressed more directly in order to understand farm household behaviour with respect to policies. In particular, demographic trends, labour and land use opportunities, technological options and personal strategies seem to be increasingly major drivers of farm reaction to CAP.
ACKNOWLEDGEMENTS The authors of this study would like to acknowledge Daniel Deybe (European Commission DG-RTD) and Wolfgang Munch (European Commission DG-REGIO) for having taken part in intensive and frequent discussions on the study. However, the views expressed in this paper are entirely those of the authors, and do not necessarily reflect those of the institutions for which they work.
REFERENCES BAUM, S., FROHBERG, K., HARTMANN, M., MATTHEWS, A., WEINGARTEN, P. (2004): The future of rural areas in the CEE New Member States. IAMO, Halle.
EUROPEAN COMMISSION (2003): Mid-term review of the common agricultural policy – July 2002 proposals – Impact analyses. Bruxelles.
OECD (2005): The impact on investment and production of different agricultural policy instruments – Principal findings. AGR/CA/APM(2005)12/FINAL, Paris.
HAPPE, K. (2004): Agricultural policies and farm structures. Agent-based modelling and application to EU policy reform, IAMO Studies on Agriculture and Food Sector in Central and Eastern Europe, Vol. 30.
LAGERKVIST, C. J. (2005): Agricultural policy uncertainty and farm level adjustments-the case of direct payments and incentives for farmland investments. European Review of Agricultural Economics, 32(1), pp. 1-23.
LATRUFFE, L. (2004): Investment and financial constraints of Polish farmers. INRA Working paper 04-01.
SCKOKAI, P., MORO, D. (2006): Modelling the reforms of the Common Agricultural Policy for arable crops under uncertainty. American Journal of Agricultural Economics, 88(1), pp. 43-56.

Studies on the Agricultural and Food Sector in Central and Eastern Europe edited by Leibniz Institute of Agricultural Development in Central and Eastern Europe (IAMO) ISSN 1436-221X Vol. 1 The importance of institutions for the transition in Central and
Eastern Europe with emphasis on agricultural and food industry ed. by Klaus Frohberg and Witold-Roger Poganietz 1998, 137 pages, ISBN 3-8175-0258-3
Vol. 2 The significance of politics and institutions for the design and formation of agricultural Policies ed. by Klaus Frohberg and Peter Weingarten 1999, 254 pages, ISBN 3-8175-0289-3
Vol. 3 Food processing and distribution in transition countries. Problems and perspectives ed. by Monika Hartmann and Jürgen Wandel 1999, 349 pages, ISBN 3-8175-0293-1
Vol. 4 Die private Nachfrage nach Nahrungsmitteln im Transformations-prozeß Tschechiens und Polens Stephan Brosig (PhD) 2000, 171 Seiten, ISBN 3-8175-0319-9
Vol. 5 Integrating Estonia into the EU: Quantitative analysis of the agricultural and food sector Achim Fock (PhD) 2000, 286 pages, ISBN 3-8175-0320-2
Vol. 6 Competitiveness of agricultural enterprises and farm activities in transition countries ed. by Peter Tillack and Frauke Pirscher 2000, 216 pages, ISBN 3-8175-0322-9
Vol. 7 Конкурентоспособность сельскохозяйственных предприятий и фермерской деятельности в странах переходного периода под редакцией Петера Тиллака и Фрауке Пиршер 2000, 253 страницы, ISBN 3-8175-0324-5
Vol. 8 Perspectives on agriculture in transition: Analytical issues, modelling approaches, and case study results ed. by Witold-Roger Poganietz, Alberto Zezza, Klaus Frohberg and Kostas G. Stamoulis 2000, 433 pages, ISBN 3-8175-0323-7

Vol. 9 Land ownership, land markets and their influence on the efficiency of agricultural production in Central and Eastern Europe ed. by Peter Tillack and Eberhard Schulze 2000, 485 pages, ISBN 3-8175-0325-3
Vol. 10 Landwirtschaft und Industrie in Russland – Der Transformations-prozeß in der Ernährungsindustrie Jürgen Wandel (PhD) 2000, 361 Seiten, ISBN 3-8175-0334-2
Vol. 11 Food consumption in Russia. An econometric analysis based on household data Karin Elsner (PhD) 2001, 256 pages, ISBN 3-8175-0335-0
Vol. 12 Alexander Wasiljewitsch Tschajanow – Die Tragödie eines großen Agrarökonomen hrsg. u. übers. von Eberhard Schulze 2001, 192 Seiten, ISBN 3-8175-0342-3
Vol. 13 Analysis of food consumption in Central and Eastern Europe: Relevance and empirical methods ed. by Stephan Brosig and Monika Hartmann 2001, 253 pages, ISBN 3-8175-0349-0
Vol. 14 Wettbewerbsprozesse und Firmenwachstum in der Transformation am Beispiel der polnischen Fleischindustrie Agata Pieniadz (PhD) 2002, 291 Seiten, ISBN 3-8175-0360-1
Vol. 15 Agricultural enterprises in transition: Parallels and divergences in Eastern Germany, Poland and Hungary ed. by Ludger Hinners-Tobrägel and Jürgen Heinrich 2002, 455 pages, ISBN 3-8175-0366-0
Vol. 16 Agricultural technology and economic development of Central and Eastern Europe. Results of the workshop in Halle, 2nd-3rd July 2001 ed. by Peter Tillack and Ulrich Fiege 2002, 160 pages, ISBN 3-86037-199-1
Vol. 17 Региональные аспекты аграрных преобразований: Политика, реструктуризация, рыночная адаптация под редакцией Петера Тиллака и Виталия Зиновчука 2003, 236 страницы, ISBN 3-928466-55-0

Vol. 18 Alexander Vasilievich Chayanov – The tragedy of an outstanding agricultural economist ed. by Eberhard Schulze 2003, 188 pages, ISBN 3-86037-201-7
Vol. 19 Development of agricultural market and trade policies in the CEE Candidate Countries by the Network of Independent Agricultural Experts in the CEE Candidate Countries 2003, 72 pages, ISBN 3-86037-212-2
Vol. 20 Large farm management ed. by Alfons Balmann and Alexej Lissitsa 2003, 396 pages, ISBN 3-86037-213-0
Vol. 21 Success and failures of transition – The Russian agriculture between fall and resurrection ed. by Eberhard Schulze, Elke Knappe, Eugenia Serova, Peter Wehrheim 2003, 521 pages, ISBN 3-9809270-1-6
Vol. 22 Subsistence agriculture in Central and Eastern Europe: How to break the vicious circle? ed. by Steffen Abele and Klaus Frohberg 2003, 233 pages, ISBN 3-9809270-2-4
Vol. 23 Pfadabhängigkeiten und Effizienz der Betriebsstrukturen in der ukrainischen Landwirtschaft – Eine theoretische und empirische Analyse Andriy Nedoborovskyy (PhD) 2004, 197 Seiten, ISBN 3-86037-216-5
Vol. 24 Nichtmonetäre Transaktionen in der ukrainischen Landwirtschaft: Determinanten, Spezifika und Folgen Olena Dolud (PhD) 2004, 190 Seiten, ISBN 3-9809270-3-2
Vol. 25 The role of agriculture in Central and Eastern European rural development: Engine of change or social buffer? ed. by Martin Petrick and Peter Weingarten 2004, 426 pages, ISBN 3-9809270-4-0
Vol. 26 Credit rationing of Polish farm households – A theoretical and empirical analysis Martin Petrick (PhD) 2004, 254 pages, ISBN 3-9809270-6-7

Vol. 27 Drei Jahrhunderte Agrarwissenschaft in Russland: Von 1700 bis zur Gegenwart Alexander Alexandrowitsch Nikonow und Eberhard Schulze 2004, 232 Seiten, ISBN 3-9809270-8-3
Vol. 28 Russlands Weg vom Plan zum Markt: Sektorale Trends und regionale Spezifika Peter Voigt (PhD) 2004, 270 Seiten, ISBN 3-9809270-9-1
Vol. 29 Auswirkungen des Transformationsprozesses auf die sozio-ökonomischen Funktionen ukrainischer Landwirtschaftsunternehmen Helga Biesold (PhD) 2004 182 Seiten, ISBN 3-938584-00-9
Vol. 30 Agricultural policies and farm structures – Agent-based modelling and application to EU-policy reform Kathrin Happe (PhD) 2004, 291 pages, ISBN 3-938584-01-7
Vol. 31 How effective is the invisible hand? Agricultural and food markets in Central and Eastern Europe ed. by Stephan Brosig and Heinrich Hockmann 2005, 361 pages, ISBN 3-938584-03-3
Vol. 32 Erfolgsfaktoren von landwirtschaftlichen Unternehmen mit Marktfruchtanbau in Sachsen-Anhalt Kirsti Dautzenberg (PhD) 2005, 161 Seiten, ISBN 3-938584-06-8
Vol. 33 Agriculture in the face of changing markets, institutions and policies: Challenges and strategies ed. by Jarmila Curtiss, Alfons Balmann, Kirsti Dautzenberg, Kathrin Happe 2006, 544 pages, ISBN 3-938584-10-6
Vol. 34 Making rural households’ livelihoods more resilient – The importance of social capital and the underlying social networks ed. by Gertrud Buchenrieder and Thomas Dufhues 2006, 106 pages, ISBN 3-938584-13-0
Vol. 35 Außerlandwirtschaftliche Diversifikation im Transformationsprozess. Diversifikationsentscheidungen und -strategien ländlicher Haushalte in Slowenien und Mazedonien Judith Möllers (PhD) 2006, 323 Seiten, ISBN 3-938584-14-9

Vol. 36 Accessing rural finance – The rural financial market in Northern Vietnam Thomas Dufhues (PhD) 2007, 166 Seiten, ISBN 3-938584-16-5
Vol. 37 Страхование посевов в Казахстане: Анализ возможностей эффективного управления рисками Раушан Бокушева, Олаф Хайдельбах, Талгат Кусайынов 2007, 82 Seiten, ISBN 3-938584-17-3
Vol. 38 Rethinking agricultural reform in Ukraine Zvi Lerman, David Sedik, Nikolai Pugachov, Aleksandr Goncharuk 2007, 167 Seiten, ISBN 3-938584-18-1
Vol. 39 Sustainable rural development: What is the role of the agri-food sector? ed. by Martin Petrick, Gertrud Buchenrieder 2007, 293 pages, ISBN 3-938584-22-X
Vol. 40 Efficiency of selected risk management instruments – An empirical analysis of risk reduction in Kazakhstani crop production Olaf Heidelbach (PhD) 2007, 223 Seiten, ISBN 3-938584-19-X
Vol. 41 Marktstruktur und Preisbildung auf dem ukrainischen Markt für Rohmilch Oleksandr Perekhozhuk (PhD) 2007, 274 Seiten, ISBN 978-3-938584-24-8
Vol. 42 Labor market behavior of Chinese rural households during transition Xiaobing Wang (PhD) 2007, 140 Seiten, ISBN 978-3-938584-25-5
Vol. 43 Continuity and change: Land and water use reforms in rural Uzbekistan. Socio-economic and legal analyses for the region Khorezm ed. by Peter Wehrheim, Anja Schoeller-Schletter, Christopher Martius 2008, 211 Seiten, ISBN 978-3-938584-27-9
Vol. 44 Agricultural economics and transition: What was expected, what we observed, the lessons learned (Vol I and II) ed. by Csaba Csáki, Csaba Forgács 2008, 634 Seiten, ISBN 978-3-938584-31-6