Socio-economic status and HIV/AIDS dynamics: a modeling approach
15
ISSN 1 746-7233, England, UK World Journal of Modelling and Simulation Vol. 7 (2011) No. 4, pp. 243-257 Socio-economic status and HIV/AIDS dynamics: a modeling approach * S. Mushayabasa 1† , C. P. Bhunu 2 , E. J. Schwartz 3 , G. Magombedze 4 , J. M. Tchuenche 5 1 Department of Applied Mathematics, Modelling Biomedical Systems Research Group, P. O. Box 939 Ascot, Bulawayo, Zimbabwe 2 National University of Science and Technology, Bulawayo P. O. Box 939 Ascot, Zimbabwe 3 Department of Mathematics and School of Biological Sciences, Washington State University, PO Box 641227, Pullman, WA, USA 4 Department of Mathematics and Statistics, University of Guelph, Guelph ON N1G 2W1, Canada 5 Institute of Infectious Diseases and Molecular medicine, Computational Biology Group, Bioinformatics, University of Cape Town, South Africa (Received May 14 2010, Accepted March 1 2011) Abstract. HIV/AIDS is one of the most challenging public health burdens worldwide, with more than 34 million people living with the disease at the end of 2010. The epidemic continues to erase decades of health, economic and social progress, reducing life expectancy and deepening poverty in the hardest hit communities. We formulate a deterministic model to investigate the effects of socioeconomic status on the transmission dynamics of HIV/AIDS. The qualitative features of its equilibria are analyzed and conditions under which they are stable are provided. Sensitivity analysis of the reproductive number is carried out to determine the relative importance of model parameters to initial disease transmission. Results suggest that if individuals referred to as poor in this study indulge in risky sexual behavior for any reason whatsoever, then HIV/AIDS will persist in the community as long as the transients/infectives abound. Keywords: HIV/AIDS model, poverty, reproductive number, risky sexual behavior, stability 1 Introduction Sub-Saharan Africa remains the region most heavily affected by HIV. In 2008, sub-Saharan Africa ac- counted for 67% of HIV infections worldwide, 68% of new HIV infections among adults and 91% of new HIV infections among children. The region also accounted for 72% of the world AIDS-related deaths in 2008. The epidemic continues to have an enormous impact on households, communities, businesses, public services and national economies in the region [38] . Poverty is associated with weak endowments of human and financial resources, such as low levels of education with associated low levels of literacy and few marketable skills, generally poor health status and low labour productivity as a result [13] . Poor households typically have few if any financial or other assets and are often socially marginalised. These conditions of social exclusion in- crease the problems of reaching these populations through programmes aimed at changing sexual and other behaviors. Hence, it is not at surprising in these circumstances that the poor adopt behaviors which expose them to HIV infection [13, 16] , particularly among women who may engage in transactional sex to procure food for themselves and their children [18] . Moreover, poor people are more likely to be food insecure and malnour- ished. Malnutrition is known to weaken the immune system, which in turn may lead to a greater risk of HIV transmission in any unprotected sexual encounter [5, 7, 18, 27, 30, 32] . A significant number of statistical studies have measured the association between socioeconomic status and HIV transmission [2, 7, 9, 13, 18, 22, 23, 31, 33, 41] . However, these studies have mixed results: only a few have * The authors are grateful to the anonymous referee and the handling editor for their valuable comments and suggestions. † Corresponding author. E-mail address: [email protected], [email protected]. Published by World Academic Press, World Academic Union
Transcript of Socio-economic status and HIV/AIDS dynamics: a modeling approach
ISSN 1 746-7233, England, UKWorld Journal of Modelling and Simulation
Vol. 7 (2011) No. 4, pp. 243-257
Socio-economic status and HIV/AIDS dynamics: a modeling approach∗
S. Mushayabasa1†, C. P. Bhunu2, E. J. Schwartz3, G. Magombedze4, J. M. Tchuenche5
1 Department of Applied Mathematics, Modelling Biomedical Systems Research Group, P. O. Box 939 Ascot,Bulawayo, Zimbabwe
2 National University of Science and Technology, Bulawayo P. O. Box 939 Ascot, Zimbabwe3 Department of Mathematics and School of Biological Sciences, Washington State University, PO Box 641227,
Pullman, WA, USA4 Department of Mathematics and Statistics, University of Guelph, Guelph ON N1G 2W1, Canada
5 Institute of Infectious Diseases and Molecular medicine, Computational Biology Group, Bioinformatics, University ofCape Town, South Africa
(Received May 14 2010, Accepted March 1 2011)
Abstract. HIV/AIDS is one of the most challenging public health burdens worldwide, with more than 34million people living with the disease at the end of 2010. The epidemic continues to erase decades of health,economic and social progress, reducing life expectancy and deepening poverty in the hardest hit communities.We formulate a deterministic model to investigate the effects of socioeconomic status on the transmissiondynamics of HIV/AIDS. The qualitative features of its equilibria are analyzed and conditions under whichthey are stable are provided. Sensitivity analysis of the reproductive number is carried out to determine therelative importance of model parameters to initial disease transmission. Results suggest that if individualsreferred to as poor in this study indulge in risky sexual behavior for any reason whatsoever, then HIV/AIDSwill persist in the community as long as the transients/infectives abound.
Keywords: HIV/AIDS model, poverty, reproductive number, risky sexual behavior, stability
1 Introduction
Sub-Saharan Africa remains the region most heavily affected by HIV. In 2008, sub-Saharan Africa ac-counted for 67% of HIV infections worldwide, 68% of new HIV infections among adults and 91% of newHIV infections among children. The region also accounted for 72% of the world AIDS-related deaths in 2008.The epidemic continues to have an enormous impact on households, communities, businesses, public servicesand national economies in the region[38]. Poverty is associated with weak endowments of human and financialresources, such as low levels of education with associated low levels of literacy and few marketable skills,generally poor health status and low labour productivity as a result[13]. Poor households typically have fewif any financial or other assets and are often socially marginalised. These conditions of social exclusion in-crease the problems of reaching these populations through programmes aimed at changing sexual and otherbehaviors. Hence, it is not at surprising in these circumstances that the poor adopt behaviors which exposethem to HIV infection[13, 16], particularly among women who may engage in transactional sex to procure foodfor themselves and their children[18]. Moreover, poor people are more likely to be food insecure and malnour-ished. Malnutrition is known to weaken the immune system, which in turn may lead to a greater risk of HIVtransmission in any unprotected sexual encounter[5, 7, 18, 27, 30, 32].
A significant number of statistical studies have measured the association between socioeconomic statusand HIV transmission[2, 7, 9, 13, 18, 22, 23, 31, 33, 41]. However, these studies have mixed results: only a few have∗ The authors are grateful to the anonymous referee and the handling editor for their valuable comments and suggestions.† Corresponding author. E-mail address: [email protected], [email protected].
Published by World Academic Press, World Academic Union

244 S. Mushayabasa & C. Bhunu et al.: Socio-economic status and HIV/AIDS dynamics
found a negative or no association, whereas most have found a positive association[2, 7, 13, 22, 23, 28, 31]. Theaim is to gain insights into the association between socioeconomic status and HIV infection in a populationsub-divided into two categories, namely the poor and the rich. A recent study considered such dynamics withadditional transmission from clinical settings[34], and this study therefore complements it. The poor class con-stitutes individuals with low levels of financial resources, maybe due to low levels of education with usuallylow incomes or low wages as a result of the economics associated with the area where these individualslive. For instance, the respondents of an ethnographic study in the southern province of Zambia[10] identifiedfrequent droughts and limited wage labor opportunities, after the post-economic liberalization closure of com-panies, as the factors behind the increasing resort of women to transactional sex. Due to low financial resourcesthese individuals (in the poor class) are associated with generally poor health status. Moreover, it is not simplythat information, education and communication activities are unlikely to reach the poor (which may be the casein some instances) but that such messages are often irrelevant and inoperable to a fraction of these individualsgiven the reality of their lives. For example, in a qualitative study in Malawi[8] certain social groups werefound to continue to engage in high-risk behaviors despite knowing the risks. They did so, the authors con-tend, to affirm their social identity and to deny that anything they do makes a difference to what they perceiveas a life of powerlessness and despair? Thus, in this study we shall consider the poor to access antiretroviraltherapy through government or non-governmental organization assistance. The rich class constitutes individ-uals with average or better financial resources, generally associated with better health than the poor and canafford the cost of antiretroviral therapy. There is ample evidence that wealthier populations do better on mostmeasures of health status, including nutrition, morbidity and mortality, and of healthcare utilization[1, 26, 29].Recent studies have shown that safer sexual practices are now considered important in all socio-economicclasses, although a high proportion of these individuals are from the rich class[14, 17, 19, 21, 22, 24, 37–39].
Drawing insight from the background described above, a mathematical model to investigate the associ-ation between socioeconomic status and HIV transmission is formulated and analyzed. Particularly, we wishto quantify the role of risky sexual behavior, malnutrition and antiretroviral therapy. The paper is structuredas follows: Section 2 is the model framework. Stability analysis of the equilibria is carried out in Section 3.Section 4 contains the numerical illustrations and the last Section concludes the paper.
2 Model formulation
The total population is sub-divided into eight classes according to disease status, namely: rich suscep-tibles Sr; rich HIV infectives not on antiretroviral therapy Ir; rich HIV infectives who are on antiretroviraltherapy Ir1 ; AIDS cases in rich class Ar; poor susceptibles Sp; poor HIV infectives not on antiretroviral ther-apy Ip; poor HIV infectives receiving antiretroviral therapy Ip1 ; AIDS cases in poor class Ap. Thus, the totalpopulation denoted by N is given by N = Sr + Sp + Ir + Ir1 + Ip + Ip1 + Ar + Ap. Let Λ denote aconstant recruitment rate into the susceptible population through birth. Quantifying the proportion of childrenborn from each class would require an extensive sensitivity analysis with parameter values estimated fromreal demographic data. However, studies focusing on family planning programmes have shown that couplesfrom poor families have the highest fertility, the lowest contraceptive use and the highest unmet need forcontraception[20, 36]. Thus, it is assumed that a proportion π0 (0 < π0 < 1) of these children is from therich class while the complementary proportion (1 − π0) = π1 is from the poor class, with π0 < π1. Thesusceptible sub-populations can be infected following effective contacts with any of the four infected classes(Ir, Ir1 , Ip, Ip1), since the model assumes that individuals in the AIDS class are no longer sexual active, be-cause of their ill health. Due to risky sexual behavior, individuals in Sp have a higher chance, relative to Sr,of acquiring new infections following contacts with the respective infected class by a factor σ ≥ 1. The forcesof infection denoted by λr and λp for Sr and Sp, respectively, are given by
λr =β[Ir + Ip + α(κrIr1 + κpIp1)]
H,λp = σλr =
σβ[Ir + Ip + α(κrIr1 + κpIp1)]H
. (1)
The parameter β is the product of the effective contact rate for HIV infection and the transmission probabilityof HIV per contact. The relative infectiousness of individuals who are on antiretroviral therapy and are sexually
WJMS email for contribution: [email protected]

World Journal of Modelling and Simulation, Vol. 7 (2011) No. 4, pp. 243-257 245
active is measured by α (0 < α < 1), since it has been estimated by an analysis of longitudinal cohort data thatantiretroviral therapy reduces per-partnership infection by as much as 60% (so that α ≈ 0.4)[6, 40]. A fractionκi for i= r,p of infectives who are on antiretroviral therapy are still sexually active (with κr < κp, denotingrich and poor respectively), while the complementary proportion (1−κi), for i= r,p have abstained from riskysexual behavior, so that the total sexually active population is given by H = N−[(Ar+Ap)+(1−κr)Ir1+(1−κp)Ip1 ]. Infectives are treated at a rates φr and φp for rich and poor respectively, with φp < φr, due to the factthat rich infectives can afford the antiretroviral cost, while poor infectives usually depend upon governmentsupport or non-governmental organisations. Infectives on treatment and those not on treatment progress toAIDS at rates ω, ηω,(for rich and poor respectively) γ, ηγ (for rich and poor respectively), respectively. Itis known that malnutrition weakens the immune system, which in turn may lead to a greater risk of HIVtransmission in any unprotected sexual encounter[7, 18]. Thus, the modification parameter η ≥ 1, captures therelative malnutritional effect of the individuals from the poor class. The natural mortality rate µ is assumed tobe constant in all classes, with individuals in the AIDS class suffering additional mortality due to the diseaseat rates ν, ην. The model flow diagram is depicted in Fig. 1 below. From the descriptions and assumptions on
Fig. 1. Small structure of the model
the dynamics of the epidemic made above, the following are the model equations.
Resource-rich
S′r = π0Λ− (λr + µ)Sr,
I ′r = λrSr − (γ + φr + µ)Ir,
I ′r1= φrIr − (ω + µ)Ir1 ,
A′r = γIr + ωIr1 − (µ + ν)Ar
(2)
Resource-constrained (poor)
S′p = π1Λ− (λp + µ)Sp,
I ′p = λpSp − (ηγ + φp + µ)Ip,
I ′p1= φrIp − (ηω + µ)Ip1 ,
A′r = η(γIp + ωIp1)− (µ + ην)Ap.
WJMS email for subscription: [email protected]
246 S. Mushayabasa & C. Bhunu et al.: Socio-economic status and HIV/AIDS dynamics
2.1 Model basic properties
The model Eq. (2) basic properties which are essential in the proofs of stability are provided below.
Lemma 1. The equations preserve positivity of solutions.
Proof. The vector field given by the right hand side of Eq. (2) points inward on the boundary of R8+ \ {0}.
For example, if Ir1 = 0 then I ′r1= φIr ≥ 0. All the other components are similar.
Lemma 2. Each non-negative solution is bounded in L1-norm by max {N(0), Λ/µ}.
Proof. The L1 norm of each non-negative solution is N and it satisfies the inequality N ′ ≤ Λ−µN . Solutionsto the arbitrary equation M ′ = Λ−µM are monotone increasing and bounded by Λ/µ if M(0) < Λ/µ. Theyare monotone decreasing and bounded above if M(0) ≥ Λ/µ. Since N ′ ≤ M ′ the claim follows.
Corollary 1. The region
Φ ={
(Sr, Sp, Ir, Ir1 , Ip, Ip1 , Ar, Ap) ∈ R8+ : N ≤ Λ
µ
}, (3)
is invariant and attracting for system Eq. (2).
Theorem 1. For every non-zero, non-negative initial value, solutions of model system Eq. (2) exist ∀t ≥ 0.
Proof. Local existence of solutions follows from standard arguments since the right-hand side of Eq. (2) islocally Lipschitz. Global existence follows from the (a priori) bounds.
The model has a number of invariant sets that correspond to epidemiologically limiting cases of theproblem. The effect of poverty on the spread of HIV/AIDS is modeled through the risky sexual behavior andmalnutrition, with corresponding parameters σ and η, and the recruitment of individuals into the two classesis determined by π0, π1. If we set σ = 1, η = 1, φr = φp, κr = κp, the we can simply add the respectivecompartments S = Sr + Sp and so on, and we obtain a standard SIR-model. If, on the other hand, we allowonly one group to enter the system, then we obtain invariant sets.
Lemma 3. If π0 = 0 then the set {Sr = Ir = Ir1 = Ar = 0} is invariant and attracting for system Eq. (2). Ifπ1 = 0 then the set {Sp = Ip = Ip1 = Ap = 0} is invariant and attracting.
3 Equilibrium states, reproductive number and stability
The disease-free equilibrium (DFE) and endemic equilibrium (EE) of model system Eq. (2) are derivedand their stability investigated via the reproductive number. Model system Eq. (2) has an evident DFE givenby
E0 =(S0
r , S0p , I0
r , I0p , I0
r1, I0
p1, A0
r , A0p
)=(π0Λ
µ,π1Λ
µ, 0, 0, 0, 0, 0, 0
).
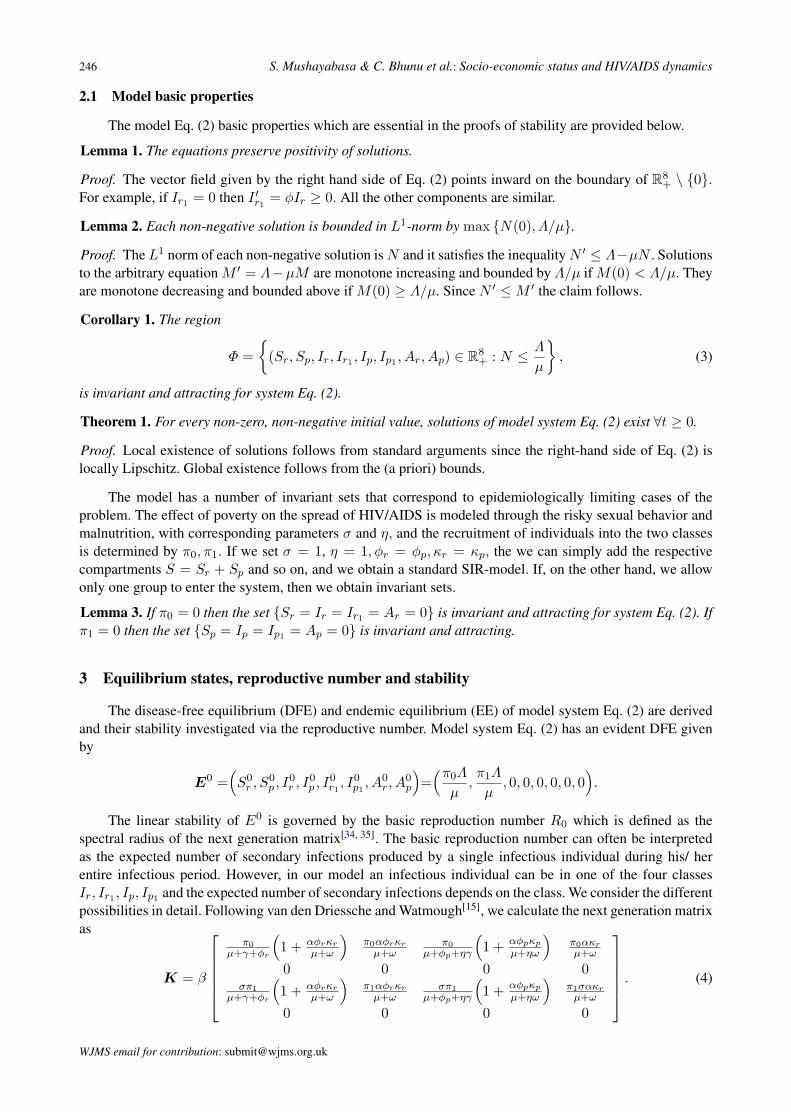
The linear stability of E0 is governed by the basic reproduction number R0 which is defined as thespectral radius of the next generation matrix[34, 35]. The basic reproduction number can often be interpretedas the expected number of secondary infections produced by a single infectious individual during his/ herentire infectious period. However, in our model an infectious individual can be in one of the four classesIr, Ir1 , Ip, Ip1 and the expected number of secondary infections depends on the class. We consider the differentpossibilities in detail. Following van den Driessche and Watmough[15], we calculate the next generation matrixas
K = β
π0
µ+γ+φr
(1 + αφrκr
µ+ω
)π0αφrκr
µ+ωπ0
µ+φp+ηγ
(1 + αφpκp
µ+ηω
)π0ακrµ+ω
0 0 0 0σπ1
µ+γ+φr
(1 + αφrκr
µ+ω
)π1αφrκr
µ+ωσπ1
µ+φp+ηγ
(1 + αφpκp
µ+ηω
)π1σακr
µ+ω
0 0 0 0
. (4)
WJMS email for contribution: [email protected]
World Journal of Modelling and Simulation, Vol. 7 (2011) No. 4, pp. 243-257 247
The rows and columns refer to Ir, Ir1 , Ip, Ip1 , in that order. Since individuals in class Ar and Ap do notcontribute to new infections, we can ignore them for K. The (i, j)-entry of this matrix is the expected numberof secondary infections in class i resulting from a single primary infective in class j. We consider two specialcases first.
Case 1. The entire population in the community consists of rich individuals only.
We set π1 = 0. Then the matrix K has rank one and the spectral radius is given by
Rr =β
µ + γ + φr
(1 +
αφrκr
µ + ω
), (5)
This reproductive number is sometimes referred to as the back of the napkin[3, 35]. It is defined as the numberof secondary HIV cases produced by a single infected individual during his/her entire infectious period in atotally naive (susceptible) population in the presence of antiretroviral therapy. An associated epidemiologicalthreshold, R0r , obtained using the same technique of the next generation operator[34], by considering modelsystem Eq. (2) in the absence of HIV intervention strategies, is given by
R0r =β
µ + γ. (6)
The basic reproductive number R0r is simply the ratio of the per capita rate of infection and the averagelifetime of an individual in class Ir.
Case 2. The entire population in the community consists of poor individuals only.
In this case, we have π0 = 0. Again, the matrix K has rank one, and the spectral radius in the absence andpresence of treatment is given by, respectively,
R0p =βσ
µ + ηγ, Rp =
βσ
µ + φp + ηγ
(1 +
αφpκp
µ + ηω
). (7)
Case 3. The general case.
When π0, π1 > 0, the matrix K has rank two and its spectral radius in the absence and presence of treatment,respectively, can be calculated explicitly as
R0rp =β[π0(µ + ηγ) + σπ1(µ + γ)]
(µ + γ)(µ + ηγ)= R0r + R0p . (8)
Rrp = β[ π0
µ + γ + φr
(1 +
αφrκr
µ + ω
)+
σπ1
µ + φp + ηγ
(1 +
αφpκp
µ + ηω
)]= Rr + Rp.
The next result follows from Theorem 2 in [34].
Theorem 2. The disease-free equilibrium E0 of model Eq. (2) is locally asymptotically stable if Rrp < 1, andunstable otherwise.
Using a theorem from Castillo-Chavez et al.[12], we can even show global stability of the DFE in the case thatthe reproduction number is less than unity.
Theorem 3. The DFE E0 of our model system Eq. (2) is globally asymptotically stable provided Rrp < 1.
Proof. Following Castillo-Chavez et al.[11], we write system Eq. (2) in the form
X ′(t) = F (X, Y ), Y ′(t) = G(X, Y ), G(X, 0) = 0, (9)
where X = (Sr, Sp) and Y = (Ir, Ir1 , Ar, Ip, Ip1 , Ap). Here X ∈ R2+ denotes (its components) the number
of uninfected individuals and Y ∈ R6+ denoting (its components) the number of infected individuals. The
WJMS email for subscription: [email protected]
248 S. Mushayabasa & C. Bhunu et al.: Socio-economic status and HIV/AIDS dynamics
disease-free equilibrium is now denoted by E0 = (X0, 0) where X0 =(
π0Λ
µ,π1Λ
µ
). We have to prove that
the two conditions
(H1) For X ′(t) = F (X, 0), X is a globally asymptotically stable,(H2) G(X, Y ) = UY − G(X, Y ), G(X, Y ) ≥ 0 for (X, Y ) ∈ Φ1,
(10)
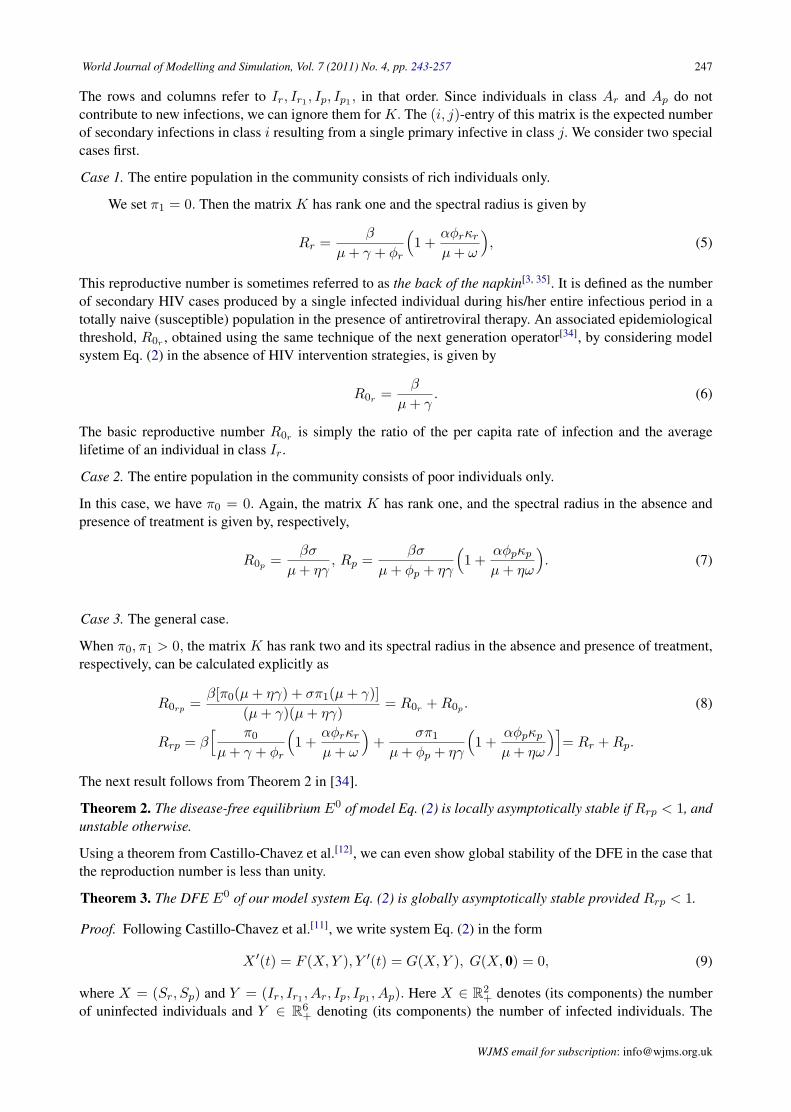
are satisfied where Φ1 is a positively invariant attracting domain.Consider
F (X, 0) =[
π0Λ− µSr
π1Λ− µSp
],
G(X, Y ) =
G1(X, Y )G2(X, Y )G3(X, Y )G4(X, Y )G5(X, Y )G6(X, Y )
=
β[Ir + Ip + α(κrIr1 + κpIp1)](π0 − Sr
H
)00
βσ[Ir + Ip + α(κrIr1 + κpIp1)](π1 − Sp
H
)00
.
Therefore, G(X, Y ) ≥ 0 whenever π0 ≥Sr
Hand π1 ≥
Sp
H, implying that E0 is globally asymptotically stable
for Rrp < 1 in
Φ1 ={
(Sr, Sp) ∈ R2+ : Sr ≤
π0Λ
µ, Sp ≤
π1Λ
µ
}⊂ Φ,
which is also positively invariant and attracting.
Theorem 3 has obvious public health importance since it tells us that the disease can be eradicated completelyfrom the community in the long run, whenever Rrp < 1.
3.1 Endemic equilibria and stability analysis
Model system Eq. (2) has three possible endemic equilibria: the poverty free endemic equilibrium witha population of rich individuals only, the endemic equilibrium when the whole population is made up of poorindividuals and the equilibrium where rich and poor co-exist, herein referred to as the interior equilibriumpoint.
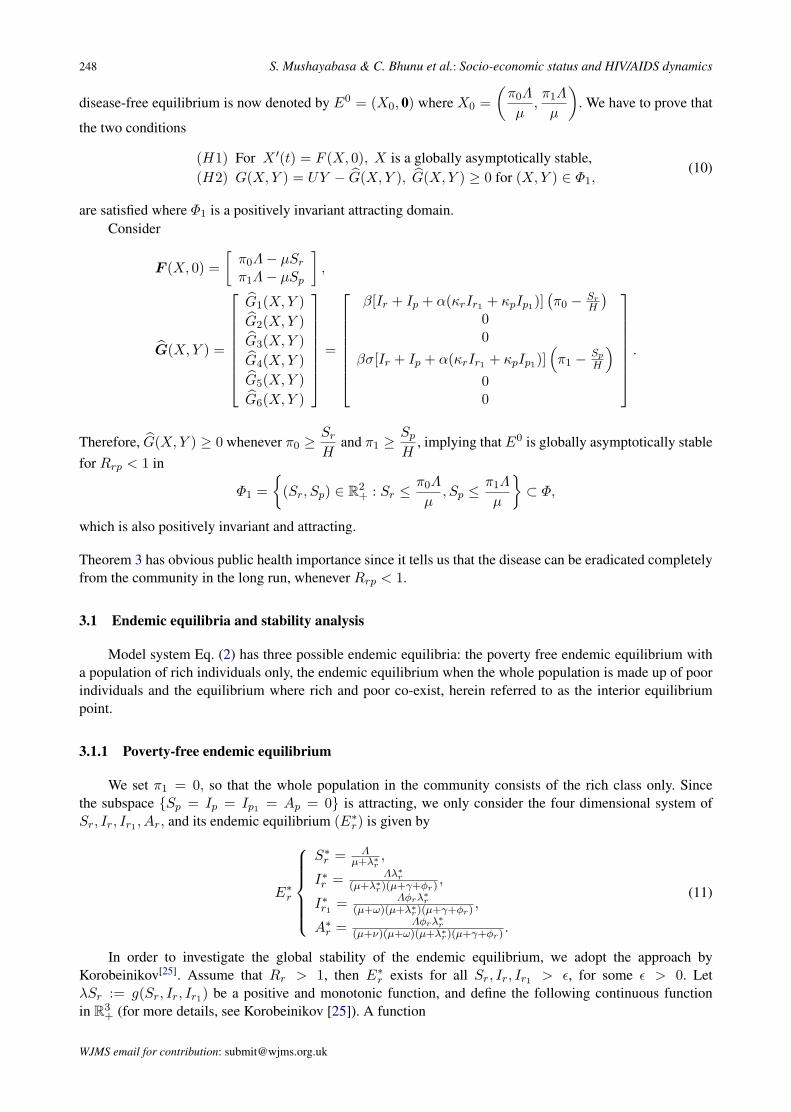
3.1.1 Poverty-free endemic equilibrium
We set π1 = 0, so that the whole population in the community consists of the rich class only. Sincethe subspace {Sp = Ip = Ip1 = Ap = 0} is attracting, we only consider the four dimensional system ofSr, Ir, Ir1 , Ar, and its endemic equilibrium (E∗
r) is given by
E∗r
S∗r = Λ
µ+λ∗r,
I∗r = Λλ∗r(µ+λ∗r)(µ+γ+φr) ,
I∗r1= Λφrλ∗r
(µ+ω)(µ+λ∗r)(µ+γ+φr) ,
A∗r = Λφrλ∗r
(µ+ν)(µ+ω)(µ+λ∗r)(µ+γ+φr) .
(11)
In order to investigate the global stability of the endemic equilibrium, we adopt the approach byKorobeinikov[25]. Assume that Rr > 1, then E∗
r exists for all Sr, Ir, Ir1 > ε, for some ε > 0. LetλSr := g(Sr, Ir, Ir1) be a positive and monotonic function, and define the following continuous functionin R3
+ (for more details, see Korobeinikov [25]). A function
WJMS email for contribution: [email protected]

World Journal of Modelling and Simulation, Vol. 7 (2011) No. 4, pp. 243-257 249
V (Sr, Ir, Ir1) = Sr−∫ Sr
ε
g(S∗r , I∗r , I∗r1)
g(τ, I∗r , I∗r1)
dτ + Ir −∫ Ir
ε
g(S∗r , I∗r , I∗r1)
g(S∗r , τ, I∗r1)
dτ + Ir1 −∫ Ir1
ε
g(S∗r , I∗r , I∗r1)
g(S∗r , I∗r , τ)dτ. (12)
If g(Sr, Ir, Ir1) is monotonic with respect to its variables, then the endemic state E∗r is the only extremum and
the global minimum of this function. Indeed since
∂V
∂Sr= 1−
g(S∗r , I∗r , I∗r1)
g(Sr, I∗r , I∗r1),
∂V
∂Ir= 1−
g(S∗r , I∗r , I∗r1)
g(S∗r , Ir, I∗r1),
∂V
∂Ir1
= 1−g(S∗r , I∗r , I∗r1
)g(S∗r , I∗r , Ir1)
, (13)
grow monotonically, then the function g(Sr, Ir, Ir1) has only one stationary point. Furthermore, since
∂2V
∂S2r
=g(S∗r , I∗r , I∗r1
)[g(Sr, I∗r , I∗r1
]2·∂g(Sr, I
∗r , I∗r1
)∂Sr
, (14)
∂2V
∂I2r
=g(S∗r , I∗r , I∗r1
)[g(S∗r , Ir, I∗r1
)]2·∂g(S∗r , Ir, I
∗r1
)∂Ir
, (15)
∂2V
∂I2r1
=g(S∗r , I∗r , I∗r1
)[g(S∗r , I∗r , Ir1)]2
· ∂g(S∗r , I∗r , Ir1)∂Ir1
, (16)
are non-negative, then the point E∗r is a minimum. That is, V (Sr, Ir, Ir1) ≥ V (S∗r , I∗r , I∗r1
) and hence, V is aLyapunov function.
The Lyapunov function Eq. (12) satisfies
dV
dtS′r − S′r
(g(S∗r , I∗r , Ir1
∗)g(Sr, I∗r , I∗r1
)
)+ I ′r − I ′r
(g(S∗r , I∗r , I∗r1
)g(S∗r , Ir, I∗r1
)
)+ I ′r1
− I ′r1
(g(S∗r , I∗r , I∗r1
)g(S∗r , I∗r , Ir1)
)(17)
= Λ− g(Sr, Ir, Ir1)− µSr − Λg(S∗r , I∗r , I∗r1
)g(Sr, I∗r , I∗r1
)+ g(Sr, Ir, Ir1)
g(S∗r , I∗r , I∗r1)
g(Sr, I∗r , I∗r1)
+ µSrg(S∗r , I∗r , I∗r1
)g(Sr, I∗r , I∗r1
)+ g(Sr, Ir, Ir1)− (µ + γ + φr)Ir − g(Sr, Ir, Ir1)
g(S∗r , I∗r , I∗r1)
g(S∗r , Ir, I∗r1)
+ (µ + γ + φr)Irg(S∗r , I∗r , I∗r1
)g(S∗r , Ir, I∗r1
)+ φrIr − (µ + ω)Ir1 − φrIr
g(S∗r , I∗r , I∗r1)
g(S∗r , I∗r , Ir1)+ (µ + ω)Ir1
g(S∗r , I∗r , I∗r1)
g(S∗r , I∗r , Ir1).
Recall that
Λ = g(S∗r , I∗r , I∗r1) + µS∗r , (µ + γ + φr)I∗r = g(S∗r , I∗r , I∗r1
), φrI∗r = (µ + ω)I∗r1
. (18)
Thus,
dV
dt= µS∗
r
(1− Sr
S∗r
)(1−
g(S∗r , I∗r , I∗r1
)g(Sr, I∗r , I∗r1
)
)+ g(S∗
r , I∗r , I∗r1)(
1−g(S∗
r , I∗r , I∗r1)
g(Sr, I∗r , I∗r1)− g(Sr, Ir, Ir1)
g(Sr, I∗r , I∗r1)
)(19)
+ g(S∗r , I∗r , I∗r1
)(− Ir
I∗r+
Ir
I∗r
g(S∗r , I∗r , I∗r1
)g(S∗
r , Ir, I∗r1)− g(Sr, Ir, Ir1)
g(S∗r , Ir, I∗r1
)
)+ (µ + ω)I∗r1
(Ir
I∗r− Ir1
I∗r1
)(1−
g(S∗r , I∗r , I∗r1
)g(S∗
r , I∗r , Ir1
)= µS∗
r
(1− Sr
S∗r
)(1− g(S∗
r , I∗r , Ir1)g(Sr, I∗r , I∗r1
)
)+ g(S∗
r , I∗r , I∗r1)(
1−g(S∗
r , I∗r , I∗r1)
g(Sr, I∗r , I∗r1)
)(1− g(Sr, Ir, Ir1)
g(S∗r , Ir, I∗r1
)
)+ g(S∗
r , I∗r , I∗r1)(
Ir
I∗r− g(Sr, Ir, Ir1)
g(Sr, I∗r , I∗r1)
)(g(S∗
r , I∗r , I∗r1)
g(S∗r , Ir, I∗r1
)− 1)
+ (µ + ω)I∗r1
(Ir
I∗r− Ir1
I∗r1
)(1−
g(S∗r , I∗r , I∗r1
)g(S∗
r , I∗r , Ir1)
).
Since E∗r > 0, the function g(Sr, Ir, Ir1) is concave with respect to Ir, Ir1 , and
∂2g(Sr, Ir, Ir1)∂I2
r
≤ 0, · · · ,∂2g(Sr, Ir, Ir1)
∂I2r1
≤ 0,
thendV
dt≤ 0 for all Sr, Ir, Ir1 > 0. Also, the monotonicity of g(Sr, Ir, Ir1) with respect to Sr ensures that
WJMS email for subscription: [email protected]
250 S. Mushayabasa & C. Bhunu et al.: Socio-economic status and HIV/AIDS dynamics(1− Sr
S∗r
)(1−
g(S∗r , I∗r , I∗r1)
g(Sr, I∗r , I∗r1)
)≤ 0, (20)(
1−g(S∗r , I∗r , I∗r1
)g(Sr, I∗r , I∗r1
)
)(1− g(Sr, Ir, Ir1
g(S∗r , Ir, I∗r1)
)≤ 0, (21)
holds for all Sr, Ir, Ir1 > 0. Since g(Sr, Ir, Ir1) is a monotonic function g(S∗r , Ir, I∗r1
) ≥ g(S∗r , I∗r , I∗r1) it
implies that Ir ≥ I∗r and vice-versa then(Ir
I∗r− g(Sr, Ir, Ir1)
g(Sr, I∗r , I∗r1)
)(g(S∗r , I∗r , I∗r1
)g(S∗r , Ir, I∗r1
)− 1)≤ 0, (22)
if
g(Sr, Ir, Ir1)g(Sr, I∗r , I∗r1
)≥ Ir
I∗rwhen g(S∗r , Ir, I
∗r1
) ≤ g(S∗r , I∗r , I∗r1), (∀Ir ≤ I∗r ) and
g(Sr, Ir, Ir1)g(Sr, I∗r , I∗r1
)≤ Ir
I∗rwhen g(S∗, Ir, I
∗r1
) ≥ g(S∗r , I∗r , I∗r1) (∀Ir ≥ I∗r ). (23)
Also, (Ir
I∗r− Ir1
I∗r1
)(1−
g(S∗r , I∗r , I∗r1)
g(S∗r , I∗r , Ir1)
)≤ 0 (24)
if
Ir1
I∗r1
≥ Ir
I∗rwhen g(S∗r , I∗r , Ir1) ≥ g(S∗r , I∗r , I∗r1
) and
Ir1
I∗r1
≤ Ir
I∗rwhen g(S∗r , I∗r , Ir1) ≤ g(S∗r , I∗r , I∗r1
). (25)
holds for all Sr, Ir, Ir1 > 0. Since g(Sr, Ir, Ir1) is a monotonic function g(S∗r , I∗r , Ir1) ≥ g(S∗r , I∗r , I∗r1),
it implies that Ir1 ≥ I∗r1and vice versa. In Eqs. (23) and (25) will hold for any concave function and are
sufficient to ensure that dVdt ≤ 0. Thus, we have established the following result:
Theorem 4. The endemic equilibrium E∗r is globally asymptotically stable whenever conditions Eqs. (20) ∼
(25) are satisfied.
3.1.2 Poverty-free only endemic equilibrium
This occurs when we set π0 = 0. The endemic equilibrium (E∗p) is given by
E∗p
S∗p = Λµ+λ∗p
,
I∗p = Λλ∗p(µ+λ∗p)(µ+γ+φp) ,
I∗p1= Λφpλ∗p
(µ+ω)(µ+λ∗p)(µ+γ+φp) ,
A∗p = Λφpλ∗p
(µ+ην)(µ+ηω)(µ+λ∗p)(µ+γ+φp) .
(26)
Based on the results of the previous discussion on Section 3.1.1, we claim the following result.
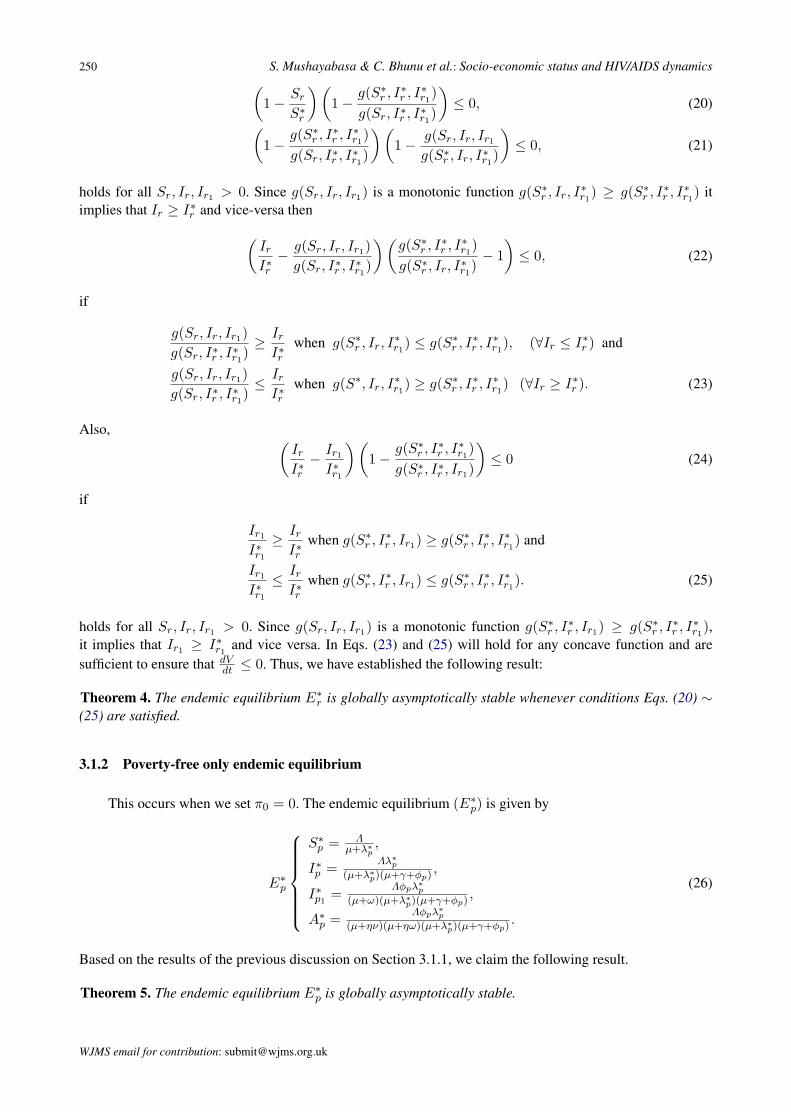
Theorem 5. The endemic equilibrium E∗p is globally asymptotically stable.
WJMS email for contribution: [email protected]
World Journal of Modelling and Simulation, Vol. 7 (2011) No. 4, pp. 243-257 251
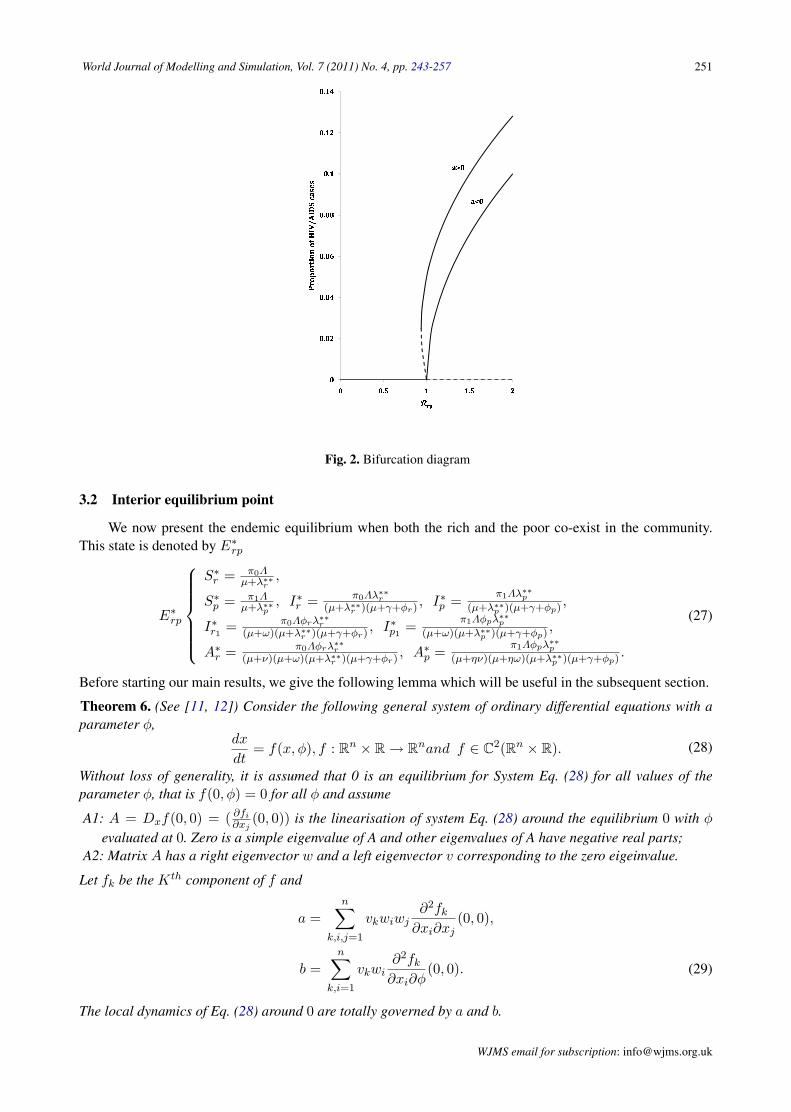
Fig. 2. Bifurcation diagram
3.2 Interior equilibrium point
We now present the endemic equilibrium when both the rich and the poor co-exist in the community.This state is denoted by E∗
rp
E∗rp
S∗r = π0Λµ+λ∗∗r
,
S∗p = π1Λµ+λ∗∗p
, I∗r = π0Λλ∗∗r(µ+λ∗∗r )(µ+γ+φr) , I∗p = π1Λλ∗∗p
(µ+λ∗∗p )(µ+γ+φp) ,
I∗r1= π0Λφrλ∗∗r
(µ+ω)(µ+λ∗∗r )(µ+γ+φr) , I∗p1= π1Λφpλ∗∗p
(µ+ω)(µ+λ∗∗p )(µ+γ+φp) ,
A∗r = π0Λφrλ∗∗r
(µ+ν)(µ+ω)(µ+λ∗∗r )(µ+γ+φr) , A∗p = π1Λφpλ∗∗p
(µ+ην)(µ+ηω)(µ+λ∗∗p )(µ+γ+φp) .
(27)
Before starting our main results, we give the following lemma which will be useful in the subsequent section.
Theorem 6. (See [11, 12]) Consider the following general system of ordinary differential equations with aparameter φ,
dx
dt= f(x, φ), f : Rn × R → Rnand f ∈ C2(Rn × R). (28)
Without loss of generality, it is assumed that 0 is an equilibrium for System Eq. (28) for all values of theparameter φ, that is f(0, φ) = 0 for all φ and assume
A1: A = Dxf(0, 0) = ( ∂fi
∂xj(0, 0)) is the linearisation of system Eq. (28) around the equilibrium 0 with φ
evaluated at 0. Zero is a simple eigenvalue of A and other eigenvalues of A have negative real parts;A2: Matrix A has a right eigenvector w and a left eigenvector v corresponding to the zero eigeinvalue.
Let fk be the Kth component of f and
a =n∑
k,i,j=1
vkwiwj∂2fk
∂xi∂xj(0, 0),
b =n∑
k,i=1
vkwi∂2fk
∂xi∂φ(0, 0). (29)
The local dynamics of Eq. (28) around 0 are totally governed by a and b.
WJMS email for subscription: [email protected]

252 S. Mushayabasa & C. Bhunu et al.: Socio-economic status and HIV/AIDS dynamics
i. a > 0, b > 0. When φ < 0 with |φ| << 1, 0 is locally asymptotically stable, and there exists a positive un-stable equilibrium; when 0 < φ << 1, 0 is unstable and there exists a negative and locally asymptoticallystable equilibrium;
ii. a < 0, b < 0. When φ < 0 with |φ| << 1, 0 is unstable; when 0 < φ << 1, 0 is asymptotically stable,and there exists a positive unstable equilibrium;
iii. a > 0, b < 0. When φ < 0 with |φ| << 1, 0 is unstable, and there exists a locally asymptotically stablenegative equilibrium; when 0 < φ << 1, 0 is stable, and a positive unstable equilibrium appears;
iv. a < 0, b > 0. When φ changes from negative to positive, 0 changes its stability from stable to unstable.Correspondingly, a negative equilibrium becomes positive and locally asymptotically stable.
In order to apply the Center Manifold Theory, we make the following change of variables. Set Sr = x1,Ir = x2, Ir1 = x3, Ar = x4, Sp = x5, Ip = x6, Ip1 = x7, and Ap = x8, so that
λr =β[x2 + x6 + α(κrx3 + κpx7)]
x1 + x2 + (1− κr)x3 + x5 + x6 + (1− κp)x7.
and λp = σλr. Further, by using vector notation x = (x1, x2, x3, x4, x5, x6, x7, x8)T , model system Eq. (2)can be written in the form dx
dt = F (x), with F = (f1, f2, f3, f4, f5, f6, f7, f8)T , that is:
x′1 = f1 = π0Λ− (λr + µ)x1, x′2 = f2 = λrx1 − (γ + φr + µ)x2, (30)
x′3 = f3 = φrx2 − (ω + µ)x3, x′4 = f4 = γrx2 + ωx3 − (µ + ν)x4,
x′5 = f5 = π1Λ− (λp + µ)x5, x′6 = f6 = λp, x5 − (ηγ + φp + µ)x6,
x′7 = f7 = φp, x6 − (ηω + µ)x7, x′8 = f8 = η(γx6 + ωx7)− (µ + τν)x8.
The method entails evaluating the Jacobian of the system Eq. (30) at the disease-free equilibrium (E0)denoted by J(E0), with
J(E0)=
−µ −βπ0 −αβκrπ0 0 0 −βπ0 −βπ0κp 00 βπ0 − k1 αβκrπ0 0 0 βπ0 βπ0κp 00 φr −(µ + ω) 0 0 0 0 00 γ ω −(µ + ν) 0 0 0 00 −σβπ1 −ασβπ1κr 0 −µ −σβπ1 −σβπ1κp 00 σβπ1 ασβπ1κr 0 0 σβπ1 − k2 σβπ1κp 00 0 0 0 0 φp −(ηω + µ) 00 0 0 0 0 ηγ ω −(µ + τν)
(31)
where k1 = γ + µ + φr, k2 = ηγ + φp + µ. From Eq. (31), it can be shown that
Rrp = β[ π0
µ + γ + φr
(1 +
αφrκr
µ + ω
)+
σπ1
µ + φp + ηγ
(1 +
αφpκp
µ + ηω
)]. (32)
Suppose β, is chosen as a bifurcation parameter. Solving Eq. (32) for Rrp = 1, one gets
β = β∗ =1[
π0µ+γ+φr
(1 + αφrκr
µ+ω
)+ σπ1
µ+φp+ηγ
(1 + αφpκp
µ+ηω
)] . (33)
Eigenvectors of J(E0) It can be shown that the Jacobian J(E0) of system Eq. (31) at β = β∗ has a righteigenvector (corresponding to the zero eigenvalue) given by w = (w1, w2, w3, w4, w5, w6, w7, w8)T , where
w =
w1 = −β∗π0
µ
[w2
(1 + αφrκr
µ+ω
)+ w6
(1 + αφpκp
µ+ηω
)], w2 > 0, w3 = φrw2
µ+ω ,
w4 = [µγ+(γ+φr)]w2
(µ+ν)(µ+ω) , w5 = −σβ∗π1
µ
[w2
(1 + αφrκr
µ+ω
)+ w6
(1 + αφpκp
µ+ηω
)],
w6 > 0, w7 = φpw6
(µ+ηω) , w8 = η[γµ+ω(φp+ηγ)]w6
(µ+ηω)(µ+τν) .
(34)
WJMS email for contribution: [email protected]

World Journal of Modelling and Simulation, Vol. 7 (2011) No. 4, pp. 243-257 253
Further, the Jacobian J(E0) has a left eigenvector (associated with the zero eigenvalue) given by v =(v1, v2, v3, v4, v5, v6, v7, v8)T , where
v =
{v1 = v4 = v5 = v8 = 0, v2 > 0, v6 > 0,
v3 = αβ∗κr(π0v2+σπ1v6)µ+ω , v7 = αβ∗κp(π0v2+σπ1v6)
µ+ηω .(35)
Computations of a and b. It can be shown, after some algebraic manipulations (involving the associated non-zero partial derivatives of F (at the DFE) to be used in the expression for a and b in Theorem 6), that
a = ξ1 + ξ2 + ξ3, where
ξ1 = −2β∗w26(π0v2 + σπ1v6)
Λ
(1 +
φp(1 + κp(α− 1) + ακp(1− κp))µ + ηω
,
)ξ2 = −2β∗2π0π1(v2 + σ2v6)
Λ
[w2
(1 +
αφrκr
µ + ω
)+ w6
(1 +
αφpκp
µ + ηω
)],
ξ3 = −2β∗µφr(π0v2 + σπ1v6)Λ(µ + ω)
(κr(1− κr)φr
µ + ωw2 +
φp[(1 + κr(α− 1)) + (κr(1− κp) + κp(1−κr))]µ+ηω
w6
),
and, b = (π0v2 + π2v6)[w2
(1 +
αφrκr
µ + ω
)+ w6
(1 +
αφpκp
µ + ω
)]> 0. (36)
Since a < 0, b < 0, it follows from Theorem 6 item (iv), that
Theorem 7. The endemic equilibrium E∗rp is locally asymptotically stable for Rrp > 1 but close to one.
Table 1. Model parameters and their interpretation.
Parameter Symbol Value SourceRecruitment rate for humans Λ 0.029yr−1 [4, 11]Natural mortality rate for humans µ 0.02yr−1 [4, 11]Disease-induced mortality rate ν 0.33yr−1 [4, 11]Natural rate of progression to AIDS γ, ω (0.125,0.1)yr−1 [4, 11]Modification parameter α 0.4 [6, 40]Modification parameter η, σ 1.25,1.35 AssumedEffective contact rate β 0.35(0.011-0.95) [4, 11]Proportion of children born from rich families π0 0.35 AssumedTreatment rate φr, φp variable AssumedA fraction of individuals who are on antiretroviral therapyand still indulging in risky sexual behavior κr, κp 0.1,0.15 Assumed.
The results for Theorem 7 are illustrated in Fig. 2.
3.3 Effects of risky sexual behavior
The reproductive number Rrp is analyzed to determine whether there is an association betweenHIV/AIDS and socioeconomic status. We shall investigate the relative importance of the different factorsresponsible for initial disease transmission, which is directly related to the magnitude of Rrp. The effect ofrisky sexual behavior on the spread of HIV/AIDS is investigated by partially differentiating Rrp with respectto κp, κr, and σ
(a)∂Rrp
∂κp=
βεσπ1φp
(µ + ηω)(µ + ηγ + φp)> 0,
(b)∂Rrp
∂κr=
βεπ0φr
(µ + ω)(µ + γ + φr)> 0,
(c)∂Rrp
∂σ=
βπ1(µ + ηω + εκpφp)(µ + ηω)(µ + ηγ + φp)
> 0. (37)
WJMS email for subscription: [email protected]
254 S. Mushayabasa & C. Bhunu et al.: Socio-economic status and HIV/AIDS dynamics
The first and second expressions in Eq. (37) measure the impact of risky sexual behavior associated withindividuals on antiretroviral therapy from the poor and rich classes, respectively. These expressions (a) and(b) suggest that if individuals who are on antiretroviral therapy do not change their sexual behavior either dueto low financial resources, to affirm their social identity, or to deny that ‘anything they do makes a differenceto what they perceive as a life of powerlessness and despair’[8, 10], then HIV/AIDS will continue to spreadinto the community, irregardless of their socioeconomic status. However, the literature above has shown thatκr < κp, implying that a high proportion of these individuals are from the poor class. Then socioeconomicstatus will have an impact on the transmission dynamics, since the poor will be fueling the epidemic. Itis also worth noting that, from the expression of Rrp (Rrp = Rr + Rp), an increase in either the rich-induced reproductive ratio Rr, or the poverty-induced reproductive ratio Rp, may lead to an increase inHIV/AIDS in the community. Thus, if individuals from the poor class continue to live risky sexual livesdue to poor living standards[8, 10], then HIV/AIDS will continue to spread in the community affecting all.Furthermore, malnutrition is known to weaken the immune system, which in turn may lead to a greater riskof HIV transmission in any unprotected sexual encounter[7, 18], which is a factor usually associated with thepoor. From the expression of Rrp, an increase of Rp will lead to an increase in Rrp, which may result in anincrease in HIV/AIDS in the community.
4 Numerical simulations
To illustrate the results of the foregoing analysis, numerical simulations of the model system Eq. (2) arecarried out, using parameter values given in Tab. 1.
0 20 40 60 80 100 120 140 160 180 2000
1000
2000
3000
4000
5000
6000
Time (years)
Cum
ulat
ive
new
HIV
cas
es
κ=0κ=0.1κ=0.2κ=0.3κ=0.4
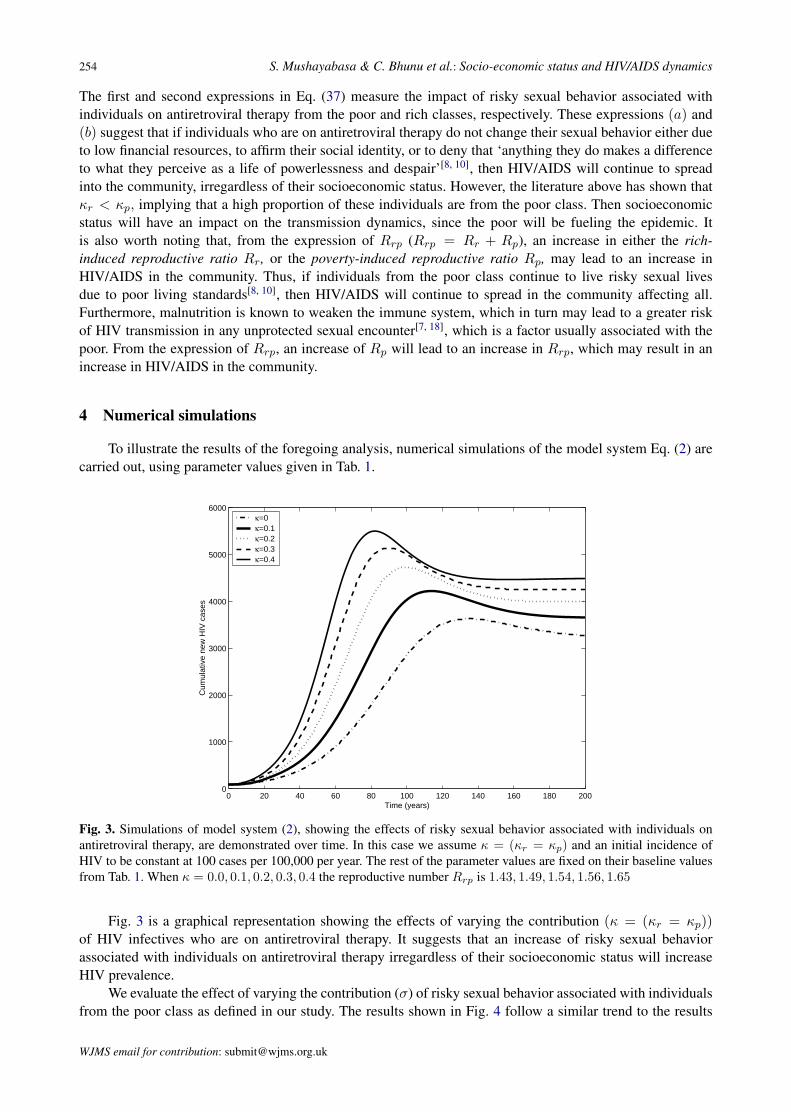
Fig. 3. Simulations of model system (2), showing the effects of risky sexual behavior associated with individuals onantiretroviral therapy, are demonstrated over time. In this case we assume κ = (κr = κp) and an initial incidence ofHIV to be constant at 100 cases per 100,000 per year. The rest of the parameter values are fixed on their baseline valuesfrom Tab. 1. When κ = 0.0, 0.1, 0.2, 0.3, 0.4 the reproductive number Rrp is 1.43, 1.49, 1.54, 1.56, 1.65
Fig. 3 is a graphical representation showing the effects of varying the contribution (κ = (κr = κp))of HIV infectives who are on antiretroviral therapy. It suggests that an increase of risky sexual behaviorassociated with individuals on antiretroviral therapy irregardless of their socioeconomic status will increaseHIV prevalence.
We evaluate the effect of varying the contribution (σ) of risky sexual behavior associated with individualsfrom the poor class as defined in our study. The results shown in Fig. 4 follow a similar trend to the results
WJMS email for contribution: [email protected]

World Journal of Modelling and Simulation, Vol. 7 (2011) No. 4, pp. 243-257 255
0 20 40 60 80 100 120 140 160 180 2000
5000
10000
15000
Time (years)
Cum
ulat
ive
new
HIV
cas
es
σ=1.0σ=1.25σ=1.50σ=1.75σ=2.0
Fig. 4. Simulations of model system Eq. (2) showing the effects of risky sexual behavior associated with individualsfrom the poor class is demonstrated over time. We vary the modification parameter σ from 1.0 to 2.0 in the steps of 0.25,other parameter values are fixed on their baseline values from Tab. 1. When σ is 1.0, 1.25, 1.5, 1.75, 2.0 the reproductivenumber Rrp is 1.22, 1.42, 1.62, 1.82, 2.02
in Fig. 3 and they also support the analytical results illustrated in Eq. (37)(c), that risky sexual behaviorincreases HIV prevalence. The simulations (Fig. 4) also suggest that an increase in risky sexual behavior byindividuals from the poor class due to poor living standards, or any other reason aforementioned in this study,will increase the epidemic prevalence. In addition, results from Fig. 4 further suggest that in the absence ofeffective programmes aimed at changing sexual and other behaviors for the poor, then HIV/AIDS will continueto be a health burden, since the poor may persist with behaviors which expose them to HIV infection.
5 Conclusion
A mathematical model for the transmission dynamics of HIV/AIDS in the context of socioeconomicstatus (with two sub-populations: the rich and the poor) is formulated and its mathematical properties areinvestigated in order to assess the effect of socioeconomic status on the transmission dynamics of HIV/AIDS.The disease-free equilibrium is shown to be globally stable when the corresponding reproductive number isless than unity. The poor class is defined herein as those individuals with few if any financial or other assets andare often socially marginalised. Due to low financial resources, we assume that these individuals are involvedin risky sexual behavior, as to procure food for themselves and their children. Results from the study suggestthat risky sexual behavior of individuals who are on antiretroviral therapy will increase HIV prevalence in thecommunity. If poor individuals indulge in risky sexual behavior due to social marginalisation or to procurefood for themselves and their children, then HIV/AIDS will remain a public health burden.
References
[1] N. Adler, K. Newman. Socioeconomic disparities in health: pathways and policies. Health Aff (Millwood), 2002,21: 60–76.
[2] M. Ainsworth, I. Semali. Who is most likely to die of aids? Socioeconomic correlates of adult deaths in Kageraregion, Tanzania. Confronting AIDS: evidence for developing world, 1998. Edited by Ainsworth M, Fransen L,Over M. Brussels: European Commission.
[3] J. Arino, F. Brauer, et al. A model for influenza with vaccination and antiviral treatment. Journal of Theory Biology,2008, 253: 118–130.
WJMS email for subscription: [email protected]

256 S. Mushayabasa & C. Bhunu et al.: Socio-economic status and HIV/AIDS dynamics
[4] C. Bhunu, S. Mushayabasa, et al. Mathematical analysis of an HIV/AIDS model: Impact of educational programsand abstinence in Sub-Saharan Africa. Journal of Mathematical Modelling and Algorithms, 2011, 10: 31–55.
[5] C. Bhunu, J. Tchuenche, et al. Modelling the effects of schistosomiasis on the transmission dynamics of HIV/AIDS.Journal of Biological Systems, 2010, 18(2): 277–297. DOI No.: 10.1142/S0218339010003196.
[6] S. Blower, E. Bodine, et al. The antiretriovial roll out and drug resistant HIV in Africa: insights from empiricaldata and theoretical models. AIDS, 2005, 19(1): 1–14.
[7] F. Booysen. Hiv/aids and poverty: Evidence from a household impact study conducted in the free state province,South Africa. DPRU Conference, 2002. Johannesburg.
[8] D. Bryceson, J. Fonseca. An enduring or dying peasantry: interactive impact of famine and HIV/AIDS in rural.[9] A. Buve, E. Lagarde, et al. Study group on heterogeneity of hiv epidemics in African cities. interpreting sexual
behavior data: validity issues in the multicentre study on factors determining the differential spread of hiv in fourAfrican cities. AIDS, 2001, 15(4): 117–126.
[10] E. Byron, S. Gillespie, P. Hamazakaza. Local perceptions of risk and HIV prevention in Aouthern Zambia. RE-NEWAL working paper, 2007. www.ifpri.org/renewal.
[11] C. Castillo-Chavez, Z. Feng, W. Huang. On the computation of r0 and its role on global stability. 2002.Math.la.asu.edu/chavez/2002/JB276.pdf.
[12] C. Castillo-Chavez, B. Song. Dynamical models of tuberculosis and their applications. Mathematical Biosciencesand Engineering, 2004, 1(2): 361–404.
[13] D. Cohen. Poverty and HIV/AIDS in sub-Saharan Africa, undp HIV and development programme. 2009, 27. Http: //www:undp:org=hiv=publications=issues=english=issue27e:html, retrieved August 04.
[14] I. Cremin, C. Naymukapa, et al. Patterns of self-reported behaviour change associated with receiving voluntarycounselling and testing in a longtudinal study from manicaland, Zimbabwe. AIDS Behav, 2010, 14(708-715).
[15] V. Driessche, J. Watmough. Reproduction numbers and sub-threshold endemic equilibria for compartmental mod-els of disease transmission. Math. Biosci., 2002, 29–48.
[16] L. Fenton. Preventing HIV/AIDS through poverty reduction: the only sustainable solution? Lancet, 2004, 364:1186–1187.
[17] J. Fotso, B. Kuate-Defo. Socioeconomic inequalities in early childhood malnutrition and morbidity: modificationof the household-level effects by the community ses. Health Place, 2005, 11: 205–225.
[18] S. Gillespie, S. Kadiyala, R. Greener. Is poverty or wealth driving HIV transmission? AIDS, 2007, 21. 21 (suppl7): S5S16.
[19] J. Glynn, M. Carael, et al. Does increased general schooling protect against HIV infection? a study in four Africancities. Tropical Medicine & International Health, 2004, 9: 4–14.
[20] J. Glynn, M. Carael, et al. Does increased general schooling protect against HIV infection? a study in four Africancities. Tropical Medicine & International Health, 2004, 9: 4–14.
[21] S. Gregreson, E. Gonese, et al. Hiv decline in Zimbabwe due to reductions in risky sex? Evidence from a compre-hensive epidemiological review. International Journal of Epidemiology, 2010.
[22] S. Gregson, G. Garnett, et al. HIV decline associated with behaviour change in Eastern Zimbabwe. Science, 2006,311: 664–666.
[23] S. Gregson, H. Waddell, S. Chandiwana. School education and HIV control in sub-Saharan Africa: from discordto harmony? Journal of International Development, 2001, 13: 467–485.
[24] J. Hargreaves, J. Glynn. Educational attainment and hiv-1 infection in developing countries: a systematic review.Tropical Medicine & International Health, 2002, 7: 489–498.
[25] A. Korobeinikov. Lyapunov functions and global stability for sir and sirs epidemiological models with non-lineartransmission. Bulletin of Mathematical Biology, 2006, 30: 615–626.
[26] B. Kuate-Defo. Effects of socioeconomic disadvantage and women status on women health in Cameroon. SocialScience & Medicine, 1997.
[27] J. Lasalle. The stability of dynamical systems SIAM, Philadelphia, PA. 1976.[28] B. Lopman, J. Lewis, et al. Hiv incidence and poverty in manicaland, Zimbabwe: is HIV becoming a disease of
the poor? AIDS, 2007, 21(7): 57–66.[29] Malawi. Aids, poverty and hunger: challenges and responses. 2006, 44: 1023–1042. Edited by Gillespie SR.
Washington DC: IFPRI.[30] C. Mccluskey. Lyapunov functions for tuberculosis models with fast and slow progression. MBE, 2006, 3: 603–614.[31] A. Mishra, V. Bignami-Van, et al. HIV infection does not disproportionately affect the poorer in sub-Saharan
Africa. AIDS, 2007, 21(7): 17–28.[32] S. Mushayabasa, J. Tchuenche, et al. Modeling gonorrhea and HIV co-interaction. BioSystems, 2011, 103(1):
27–37.[33] M. Nyindo. Complementary factors contributing to the rapid spread of HIV-1 in sub-Saharan Africa: a review. East
African Medical Journal, 2005, 82: 40–46.
WJMS email for contribution: [email protected]

World Journal of Modelling and Simulation, Vol. 7 (2011) No. 4, pp. 243-257 257
[34] S. Pedro, J. Tchuenche. HIV/AIDS dynamics: Impact of economic classes with transmission from poor clinicalsettings. Journal of Theory Biology, 2010, 267(4): 471–485.
[35] T. Porco, J. Martin, et al. Decline in hiv infectivity following the introduction of highly active antiretroviral therapy.AIDS, 2004, 18: 81–88.
[36] N. Prata. Making family planning accessible in resource-poor settings. Philosophical Transactions of the RoyalSociety B, 2009, 364: 3093–3099.
[37] UNAIDS. Sub-Saharan Africa AIDS epidemic update regional summary. 2008. Jointed United NAtions Pro-gramme on HIV/AIDS (UNAIDS) and World Health Organisation,(WHO), Geneva, Switerland.
[38] UNAIDS. Sub-Saharan Africa AIDS epidemic update regional summary. 2009. Jointed United NAtions Pro-gramme on HIV/AIDS (UNAIDS) and World Health Organisation,(WHO), Geneva, Switer-land.
[39] D. Walque, J. Nakiyingi-Miiro, et al. Changing association between schooling levels and HIV-1 infection over11 years in a rural population cohort in Southwest Uganda. Tropical Medicine & International Health, 2005, 10:993–1001.
[40] D. Walque, J. Nakiyingi-Miiro, et al. Changing association between schooling levels and HIV-1 infection over11 years in a rural population cohort in Southwest Uganda. Tropical Medicine & International Health, 2005, 10:993–1001.
[41] J. Wojciki. Socioeconomic status as a risk factor for HIV infection in women in east, central and Southern Africa:a systematic review. Journal of Biosoc Science, 2005, 37: 1–36.
WJMS email for subscription: [email protected]