A nonlinear HIV/AIDS model with contact tracing
17
A nonlinear HIV/AIDS model with contact tracing Ram Naresh a , Agraj Tripathi b,⇑ , Dileep Sharma a a Department of Mathematics, Harcourt Butler Technological Institute, Kanpur 208002, India b Department of Mathematics, Bhabha Institute of Technology, Kanpur D. 209204, India article info Keywords: HIV/AIDS Screening Contact tracing Reproduction number Stability analysis Numerical simulation abstract A nonlinear mathematical model is proposed and analyzed to study the effect of contact tracing on reducing the spread of HIV/AIDS in a homogeneous population with constant immigration of susceptibles. In modeling the dynamics, the population is divided into four subclasses of HIV negatives but susceptibles, HIV positives or infectives that do not know they are infected, HIV positives that know they are infected and that of AIDS patients. Susceptibles are assumed to become infected via sexual contacts with (both types of) infectives and all infectives move with constant rates to develop AIDS. The model is analyzed using the stability theory of differential equations and numerical sim- ulation. The model analysis shows that contact tracing may be of immense help in reduc- ing the spread of AIDS epidemic in a population. It is also found that the endemicity of infection is reduced when infectives after becoming aware of their infection do not take part in sexual interaction. Ó 2011 Elsevier Inc. All rights reserved. 1. Introduction India is facing one of the biggest public health challenges in its history. Still, India has the second highest number of peo- ple living with HIV/AIDS in the world after South Africa, though the current HIV prevalence in India is declining. The first HIV infection case in India was detected in Chennai in 1986 [18]. This signaled the start of AIDS epidemic in the country, and since then, HIV infection has been reported in all states and union territories. India responded to the AIDS epidemic imme- diately after the first ever HIV/AIDS case was reported in the country. Recognizing the seriousness of the situation, the gov- ernment constituted a high-power committee in 1986 under Ministry of Health and Family Welfare. Subsequently, a National AIDS Control Programme was launched in India. The main objectives of NACO are to reduce the spread of HIV infec- tion and to strengthen India’s capacity to respond to HIV/AIDS on a long term basis. The total number of people living with HIV/AIDS in India is estimated at 24 lakhs in 2009. Children (<15 years) account for 3.5% of all infections, while 83% are the in age-group 15–49 years. Of all HIV infections, 39% (9.3 lakhs) are among women. The four high prevalence states of India (Andhra Pradesh – 5 lakhs, Maharashtra – 4.2 lakhs, Karnataka – 2.5 lakhs, Tamil Nadu – 1.5 lakhs) account for 55% of all HIV infections in the country. In India the heterosexual contact is the predominant mode of transmission of HIV [18]. In Indian society there may be many people at risk of HIV infection but do not know that they are infected. Mathematical models of transmission dynamics of HIV play an important role in better understanding of epidemiological patterns for disease control as they provide short and long term prediction of HIV and AIDS incidence. In recent decades or so various modeling studies have been conducted to describe the transmission dynamics of HIV [1–3,6–9,11–15,17,22,23]. In 0096-3003/$ - see front matter Ó 2011 Elsevier Inc. All rights reserved. doi:10.1016/j.amc.2011.04.033 ⇑ Corresponding author. E-mail addresses: [email protected], [email protected] (A. Tripathi). Applied Mathematics and Computation 217 (2011) 9575–9591 Contents lists available at ScienceDirect Applied Mathematics and Computation journal homepage: www.elsevier.com/locate/amc
-
Upload
independent -
Category
Documents
-
view
1 -
download
0
Transcript of A nonlinear HIV/AIDS model with contact tracing

Applied Mathematics and Computation 217 (2011) 9575–9591
Contents lists available at ScienceDirect
Applied Mathematics and Computation
journal homepage: www.elsevier .com/ locate/amc
A nonlinear HIV/AIDS model with contact tracing
Ram Naresh a, Agraj Tripathi b,⇑, Dileep Sharma a
a Department of Mathematics, Harcourt Butler Technological Institute, Kanpur 208002, Indiab Department of Mathematics, Bhabha Institute of Technology, Kanpur D. 209204, India
a r t i c l e i n f o
Keywords:HIV/AIDSScreeningContact tracingReproduction numberStability analysisNumerical simulation
0096-3003/$ - see front matter � 2011 Elsevier Incdoi:10.1016/j.amc.2011.04.033
⇑ Corresponding author.E-mail addresses: [email protected], agrajtr
a b s t r a c t
A nonlinear mathematical model is proposed and analyzed to study the effect of contacttracing on reducing the spread of HIV/AIDS in a homogeneous population with constantimmigration of susceptibles. In modeling the dynamics, the population is divided intofour subclasses of HIV negatives but susceptibles, HIV positives or infectives that donot know they are infected, HIV positives that know they are infected and that of AIDSpatients. Susceptibles are assumed to become infected via sexual contacts with (bothtypes of) infectives and all infectives move with constant rates to develop AIDS. Themodel is analyzed using the stability theory of differential equations and numerical sim-ulation. The model analysis shows that contact tracing may be of immense help in reduc-ing the spread of AIDS epidemic in a population. It is also found that the endemicity ofinfection is reduced when infectives after becoming aware of their infection do not takepart in sexual interaction.
� 2011 Elsevier Inc. All rights reserved.
1. Introduction
India is facing one of the biggest public health challenges in its history. Still, India has the second highest number of peo-ple living with HIV/AIDS in the world after South Africa, though the current HIV prevalence in India is declining. The first HIVinfection case in India was detected in Chennai in 1986 [18]. This signaled the start of AIDS epidemic in the country, andsince then, HIV infection has been reported in all states and union territories. India responded to the AIDS epidemic imme-diately after the first ever HIV/AIDS case was reported in the country. Recognizing the seriousness of the situation, the gov-ernment constituted a high-power committee in 1986 under Ministry of Health and Family Welfare. Subsequently, aNational AIDS Control Programme was launched in India. The main objectives of NACO are to reduce the spread of HIV infec-tion and to strengthen India’s capacity to respond to HIV/AIDS on a long term basis.
The total number of people living with HIV/AIDS in India is estimated at 24 lakhs in 2009. Children (<15 years) account for3.5% of all infections, while 83% are the in age-group 15–49 years. Of all HIV infections, 39% (9.3 lakhs) are among women.The four high prevalence states of India (Andhra Pradesh – 5 lakhs, Maharashtra – 4.2 lakhs, Karnataka – 2.5 lakhs, TamilNadu – 1.5 lakhs) account for 55% of all HIV infections in the country. In India the heterosexual contact is the predominantmode of transmission of HIV [18]. In Indian society there may be many people at risk of HIV infection but do not know thatthey are infected.
Mathematical models of transmission dynamics of HIV play an important role in better understanding of epidemiologicalpatterns for disease control as they provide short and long term prediction of HIV and AIDS incidence. In recent decades or sovarious modeling studies have been conducted to describe the transmission dynamics of HIV [1–3,6–9,11–15,17,22,23]. In
. All rights reserved.
[email protected] (A. Tripathi).
9576 R. Naresh et al. / Applied Mathematics and Computation 217 (2011) 9575–9591
particular, May and Anderson [13] presented simple HIV transmission model to help clarify the effects of various factors onthe overall pattern of AIDS epidemic. Hyman et al. [9] studied the impact of variations in infectiousness by taking into ac-count different levels of virus between individuals during the chronic phase of infection and the increase in the average timefrom infection to AIDS that goes along with a decreased viral load. Greenhalgh et al. [5] studied the impact of condom use onthe sexual transmission of HIV and AIDS amongst a homogeneously mixing male homosexual population. Hsieh and Chen [7]developed a model for a community which has the structure of two classes of commercial sex workers and two classes ofsexually active male customers with different levels of sexual activity. Naresh and Tripathi [16] presented a model forHIV-TB co-infection in a variable size population. A general framework for modeling of AIDS epidemic is presented by Gielen[4] and Rao [22].
It is pointed out that the screening of infectives has substantial effect on the spread of AIDS. In India, there may be manypersons who are infected but are not even aware of their infection due to illiteracy and other factors. Moreover, those whoare aware of their infection may not always take necessary precautions while having sexual interactions. It is, therefore,desirable to promote the voluntary or random screening of infectives who do not know that they are infected by targetingespecially the high risk groups. On being detected, such people may be motivated to change their behavior and to take pre-ventive measures like condom use so that the risk of spreading the infection is reduced. It is pointed out here that screeningof infectives can be of immense help in reducing the spread of infection by way of detecting the infectives that are not awareof their infection, such individuals can then be motivated to change their behavior and to use preventive measures. A verylittle attention has been paid to model and study this aspect which may be helpful in reducing the spread of the disease[1,10,19,21,23]. Piqueira et al. [20] presented a model for HIV transmission in homosexual populations by taking into ac-count different attitudes, blood screening and effects of social networks. Rutherford and Woo [21] presented a model ofHIV transmission allowing for contact tracing to help evaluate the effect of this method to reduce the HIV infection. Tripathiet al. [23] presented a model to study the spread of HIV infection incorporating the role of screening of unaware infectivesand applied this to Indian HIV data.
It is pointed out here that only screening may not be sufficient to reduce the spread of HIV infection from the communitybecause it is possible that screened individuals had multiple sexual contacts in the past infecting many others. Therefore,infected people can be detected by tracing the sexual contacts of screened HIV positives. When infected people have beenidentified by a screening program, they may be asked to identify their partners for the past years. But the tracing of contactsis much effective when there are core groups of individuals, commercial sex workers (CSWs) remaining in the high risk pop-ulation for long periods of time that are transmitting the majority of infections. There may be high variations, like some per-sons have very few sexual contacts and are easy to locate, others have a large number of sexual partners and are difficult tolocate. In some cases, it may be even impossible to locate the contacts as in the case of ‘casual’ contacts where people maynot have enough information to locate them. Some contacts, even if they are found, refused to be tested for HIV. Thus, theidea of contact tracing may be more effective in small population countries but it may not be much useful in very large pop-ulations where majority of infected people may be unaware of their infection. In the present study, we try to model thedetection of infectives by screening as well as by contact tracing.
In this paper, our objective is to model the detection of HIV infected persons through contact tracing, to obtain someinformation that could be useful to the Health System in India in evaluating the way the programme is working. Thus,we propose a nonlinear mathematical model to study the impact of contact tracing on the infectives (those who are notaware that they are HIV infecteds) in a population with variable size structure with demographic and epidemiological con-siderations. Both the analytical and numerical studies of the model are conducted to obtain necessary information towardsreducing the spreading of disease.
2. Mathematical model
The model monitors four populations; susceptibles or HIV negatives S(t), HIV positives or infectives that do not know theyare infected I1(t), HIV positives that know they are infected I2(t) and that of AIDS patients A(t). The aware infected populationcomprises of individuals that have contracted the virus and are known to be infected after being detected by random screen-ing (i.e. by way of medical screening or otherwise) and by contact tracing. The total population sizeN(t) = S(t) + I1(t) + I2(t) + A(t).
2.1. Susceptible individuals, S(t)
The susceptibles are composed of individuals that have not contracted the infection but may get infected through the sex-ual contacts with infectives. All individuals recruited into the population at a rate Q0 per year are considered to be suscep-tibles and they die of natural causes at a rate l per year. Susceptibles are lost from this class following contacts withmembers of infectives I1 and I2 at a rate b1 and b2, the per capita contact rates for susceptibles with unaware infectivesand with aware infectives, respectively.
dSdt¼ Q0 �
b1SI1 þ b2SI2
N
� �� lS: ð1Þ

R. Naresh et al. / Applied Mathematics and Computation 217 (2011) 9575–9591 9577
2.2. Unaware HIV-infected individuals, I1(t)
The unaware infected population composed of individuals that have contracted the infection but are not aware of theirinfection as they have not developed disease symptoms. This population is generated by the HIV infection of susceptibles. Itis diminished by natural death at a rate l and by developing clinical AIDS at a rate d1. The unaware infectives of this class areassumed to become aware after screening at a rate h. The infected people can also be detected by tracing the sexual contactsof screened HIV positives through nonlinear term h(I1, I2). The term h(I1, I2) is used to model contact tracing and this processgoes on for a long time [1]. It is also assumed that the model is especially for HIV infection as we consider that anti-HIV treat-ment is not available within the community. This suggests
dI1
dt¼ b1SI1
Nþ ð1� eÞb2SI2
N� ðhþ d1 þ lÞI1 � hðI1; I2Þ: ð2Þ
2.3. Aware HIV-infected individuals, I2(t)
This population is generated by the screening of unaware infectives (at a rate h) and by contact tracing. Since the mem-bers of this class also interact with susceptibles at a rate b2, a fraction (1 � e) of infected individuals after interaction mayremain unaware and join the unaware infectives class I1 at a rate (1 � e)b2 and some of the infected individuals becomesaware after the interaction and directly join this class at rate eb2. This population is further diminished by natural deathsat a rate l and by the development of clinical AIDS at a rate d2. It is important to note that 1
h can be viewed as the mean timefrom infection to detection for the persons found not through contact tracing. This gives,
dI2
dt¼ eb2SI2
Nþ hI1 � ðd2 þ lÞI2 þ hðI1; I2Þ: ð3Þ
2.4. Individuals with clinical AIDS, A(t)
The population of individuals with clinical AIDS is generated when members of the infective population I1(t) and I2(t) pro-gress to develop clinical AIDS symptoms at a rate d1 and d2, respectively. This population is reduced by natural mortality ratel and by AIDS induced deaths at a rate a. Thus,
dAdt¼ d1I1 þ d2I2 � ðaþ lÞA: ð4Þ
The transfer diagram of the disease progression is given in Fig. 1.We study the general model to analyze the impact of screening and contact tracing on the AIDS epidemic progression. The
screening enables detection of the infected individuals in the group, making them aware of their condition. We also assumethat the aware infectives, who know about their infection, interact in the community and spread the infection but this con-tact rate is very less in comparison to the contact rate of unaware infectives when they interact with susceptibles (i.e.b2� b1). For analytical computation we assume h(I1, I2) = kI1I2 where k is the rate at which unaware HIV infected personsare detected by the system through contact tracing.
Taking into account the above consideration and using N(t) = S(t) + I1(t) + I2(t) + A(t), the model system (1–4) is written asfollows,
dNdt¼ Q 0 � lN � aA; ð5Þ
dI1
dt¼ b1ðN � I1 � I2 � AÞI1
Nþ ð1� eÞb2ðN � I1 � I2 � AÞI2
N� ðhþ d1 þ lÞI1 � kI1I2; ð6Þ
Fig. 1. Transfer diagram of model.
9578 R. Naresh et al. / Applied Mathematics and Computation 217 (2011) 9575–9591
dI2
dt¼ eb2ðN � I1 � I2 � AÞI2
Nþ hI1 � ðd2 þ lÞI2 þ kI1I2; ð7Þ
dAdt¼ d1I1 þ d2I2 � ðaþ lÞA; ð8Þ
Nð0Þ ¼ N0 > 0; I1ð0Þ ¼ I10 P 0; I2ð0Þ ¼ I20 P 0; Að0Þ ¼ A0 P 0:
Continuity of right hand side of system (5–8) and its derivative imply that the model is well posed for N > 0. Also S, I1, I2
and A tend to zero as N tends to zero. Hence each of these terms tends to zero as N does. It is, therefore, natural to interpretthese terms as zero at N = 0. It is further assumed that all the dependent variables and parameters of the model are non-negative.
2.5. Positivity of solutions
In this section, we prove that all solutions of the system (5–8) with positive initial data will remain positive for all timest > 0.
Lemma 1. Let the initial data be N(0) = S0 > 0, I1(0) = I10 P 0, I2(0) = I20 P 0, A(0) = A0 P 0 for all t. Then, the solution (S(t), I1(t),I2(t), A(t)) of the model remain positive for all time t > 0.
Proof. From Eq. (6), we have
dI1
dt¼ b1ðN � I1 � I2 � AÞI1
Nþ ð1� eÞb2ðN � I1 � I2 � AÞI2
N� ðhþ d1 þ lÞI1 � kI1I2;
dI1
dtP �ðhþ d1 þ lÞI1:
From which we get,
I1ðtÞP k1 expf�ðhþ d1 þ lÞtg > 0;
where k1 is a constant of integration. A similar reasoning on the remaining equations shows that they are always positive fort > 0. h
3. Equilibrium and stability analysis
In the following, we present the existence of model equilibria and their local and global stability analysis.
3.1. Equilibria of the model
The model (5)–(8) has two non-negative equilibria namely,
(i) E0 = (Q0/l,0,0,0), the disease-free equilibrium,(ii) E� ¼ N�; I�1; I
�2;A
�� �, the endemic equilibrium.
Here N�; I�1; I�2 and A⁄ are positive solutions of the model system (5–8), obtained by equating the right hand side to zero.We get,
N ¼ 1l
Q 0 � ad1I1 þ d2I2
aþ l
� �� �; ð9Þ
A ¼ d1I1 þ d2I2
ðlþ aÞ ð10Þ
and the two implicit equations between I1 and I2
ðahd1ÞI21 þ f1I1I2 þ f2I2
2 � ðad1kÞI21I2 � ðad2kÞI1I2
2 � Q 0ðaþ lÞhI1 � Q0ðaþ lÞ½eb2 � ðd2 þ lÞ�I2 ¼ 0; ð11Þ
g1I21 þ g2I1I2 þ ½ð1� eÞb2fdðaþ d2 þ lÞ þ ad2g�I2
2 � ðad1kÞI21I2 � ðad2kÞI1I2
2 � Q 0ðaþ lÞ½b1 � ðhþ d1 þ lÞ�I1
� Q 0ðaþ lÞð1� eÞb2I2 ¼ 0: ð12Þ

R. Naresh et al. / Applied Mathematics and Computation 217 (2011) 9575–9591 9579
Here
f1 ¼ ½ahd2 þ eb2ðaþ d1 þ lÞlþ ad1feb2 � ðd2 þ lÞg � Q 0ðaþ lÞk�;f2 ¼ ½eb2ðaþ d2 þ lÞlþ ad2feb2 � ðd2 þ lÞg�;g1 ¼ ½b1ðaþ d1 þ lÞlþ ad1fb1 � ðhþ d1 þ lÞg�;g2 ¼ ½ð1� eÞb2ðaþ d1 þ lÞlþ b1ðaþ d2 þ lÞlþ ad1ð1� eÞb2 þ ad2fb1 � ðhþ d1 þ lÞg þ Q 0ðaþ lÞk�:
It may be noted that f2 > 0 if eb2 > (d2 + l) and g1 > 0, g2 > 0 if b1 > (h + d1 + l).We note from Eq. (11),
(i) when I1 ? 0 then I2 ? 0 and/or I2 ! Q0ðaþlÞ½eb2�ðd2þlÞ�f2
> 0 if eb2 > (d2 + l),
(ii) slope at (0,0), dI2dI1
� ð0;0Þ¼ � Q0hðaþlÞ
Q0ðaþlÞ½eb2�ðdþlÞ��f1< 0 if eb2 > (d2 + l) and f1 < 0,
(iii) slope at ð0; I2Þ; dI2dI1
� ð0;I2Þ¼ f1 I2�Q0hðaþlÞ�ðad2kÞI2
2�Q0ðaþlÞ½eb2�ðdþlÞ��f1
> 0 if f1 < 0 and from Eq. (12),
(iv) when I2 ? 0 then I1 ? 0 and/or I1 ! Q0ðaþlÞ½b1�ðhþd1þlÞ�g1
> 0 if b1 > (h + d1 + l),
(v) slope at (0,0), dI2dI1
� ð0;0Þ¼ � ½b1�ðhþd1þlÞ�
ð1�eÞb2< 0 if b1 > (h + d1 + l),
(vi) slope at (I1,0),
dI2
dI1
� �ðI1 ;0Þ¼ ½b1 � ðhþ d1 þ lÞ�ð1� eÞb2 þ b1�ðhþd1þlÞ
g1
h iQ0ðaþ lÞðad1kÞ b1�ðhþd1þlÞ
g1
� þ g2
h i ;dI2
dI1
� �ðI1 ;0Þ
> 0 if b1 > ðhþ d1 þ lÞ:
We can get the positive values, (sayI�1 and I�2respectively) on solving Eqs. (11) and (12) analytically by isoclines method (seeFig. 2), if the conditions b1 > (h + d1 + l), eb2 > (d2 + l) and f1 < 0 are satisfied. Using I�1 and I�2, the values of N⁄ and A⁄ can befound from Eqs. (9) and (10), respectively. The endemic equilibrium is non-negative if Q 0 > a d1 I1þd2 I2
aþl
� .
3.2. Local stability of the equilibria
To determine the local stability of E0, the variational matrix M0 corresponding to equilibrium E0 is given by,
M0 ¼
�l 0 0 �a0 ½b1 � ðhþ dþ lÞ� ð1� eÞb2 00 h ½eb2 � ðdþ lÞ� 00 d1 d2 �ðaþ lÞ
2666437775:
The characteristic equation corresponding to equilibrium E0 is,
f ðkÞ ¼ ðkþ lÞðkþ aþ lÞðk2 þ tkþ cÞ ¼ 0; ð13Þ
where t = [{(d2 + l) � eb2} + {(h + l + d1) � b1}] and c = [{(h + l + d1) � b1}{(d2 + l) � eb2} � (1 � e)b2h].
Fig. 2. Analytical existence of non negative equilibrium point.

9580 R. Naresh et al. / Applied Mathematics and Computation 217 (2011) 9575–9591
Thus, E0 is locally asymptotically stable as t > 0 and c > 0. Therefore, the following condition Eq. (14) is sufficient to satisfyboth the conditions t > 0 and c > 0.
½b1ðd2 þ lÞ þ b2hþ eb2ðd1 þ lÞ� < eb1b2 þ ðd2 þ lÞðhþ lþ d1Þ: ð14Þ
From the above matrix M0, it is clear that E0 is locally asymptotically stable under the condition Eq. (14). Therefore, thedisease dies out i.e. infection does not persist in the population and under this condition the endemic equilibrium E⁄ does notexist.
We define the basic reproduction number as,
R01 ¼b1ðd2 þ lÞ þ b2½hþ eðd1 þ lÞ�eb1b2 þ ðd2 þ lÞðhþ lþ d1Þ
: ð15Þ
Thus, we get the following condition for the stability of E0.
Lemma 2. If R01 < 1, the disease free equilibrium E0 is locally asymptotically stable and unstable for R01 > 1 and disease alwayspersists in the population.
The variational matrix corresponding to E⁄ is given by,
M� ¼
�l 0 0 �am21 �m22 m23 �m24
m31 m32 �m33 �m34
0 d1 d2 �ðaþ lÞ
2666437775;
where, m21 ¼ ½b1 � ðhþ lþ dÞ� I�1N� þ
ð1�eÞb2I�2N� � kI�1I�2
N� ,We can show m21 > 0. From Eq. (6) we note that,
b1 N� � I�1 � I�2 � A�� �
I�1N�
þð1� eÞb2 N � �I�1 � I�2 � A�
� �I�2
N�� ðhþ d1 þ lÞI�1 � kI�1I�2 > 0;
b1I�1 þ ð1� eÞb2I�2 � ðhþ d1 þ lÞI�1 � kI�1I�2 > 0;
½b1 � ðhþ d1 þ lÞ�I�1 þ ð1� eÞb2I�2 � kI�1I�2 > 0;
½b1 � ðhþ d1 þ lÞ� I�1N�þ ð1� eÞb2I�2
N�� kI�1I�2
N�> 0; Thus; m21 > 0
m22 ¼ ðpþ qÞ; with p ¼ b1I�1N�þ ð1� eÞb2I�2
N�; q ¼
ð1� eÞb2 N� � I�1 � I�2 � A�� �
I�2N�I�1
;
m23 ¼qI�1I�2� kI�1 þ p� �
; m24 ¼ p; m31 ¼eb2 I�1 þ I�2 þ A�� �
I�2N�2
;
m32 ¼ ðr � sÞ; with r ¼ hþ kI�2; s ¼ eb2I�2N�
; m33 ¼ sþ hI�1I�2
� �and m34 ¼ s:
The characteristic equation corresponding to M⁄ is given by
f ðkÞ ¼ k4 þ a1k3 þ a2k
2 þ a3kþ a4 ¼ 0; ð16Þ
where �� �
a1 ¼ aþ 2lþ pþ qþ sþ hI1I�2
a2 ¼ lðaþ lÞ þ ðaþ 2lÞ pþ qþ sþ hI�1I�2
� �þ ðpþ qÞ sþ hI�1
I�2
� �þ sd2 þ pd1 þ ðs� rÞ qI�1
I�2� ðpþ kI�1Þ
� �
a3 ¼ lðaþ lÞ pþ qþ sþ hI�1I�2
� �þ ðaþ 2lÞ ðpþ qÞ sþ hI�1
I�2
� �� ðs� rÞ qI�1
I�2� ðpþ kI�1Þ
� �� �þ a½d1m21 þ d2m31�
þ p ðr � sÞd2 þ d1 dþ sþ hI�1I�2
� �� �þ sd1
qI�1I�2� ðpþ kI�1Þ
� �þ sd2½pþ qþ l�
a4 ¼ lðaþ lÞðpþ qÞ sþ hI�1I�2
� �þ sd2lðpþ qÞ þ sd1l
qI�1I�2� pþ kI�1� �� �
þ pld2ðr � sÞ þ pld1ðr � sÞ sþ hI�1I�2
� �þm21ad1 r � hI�1
I�2
� �þ ad1m31
qI�1I�2� pþ kI�1� �� �
þ ad2m31ðpþ qÞ:

R. Naresh et al. / Applied Mathematics and Computation 217 (2011) 9575–9591 9581
It can be seen easily that ai > 0 (i = 1,2,3,4) and a1a2 � a3 > 0. Thus, E⁄ is locally asymptotically stable if a3ða1a2 � a3Þ�a2
1a4 > 0 is satisfied.
3.3. Global stability of the endemic equilibrium
To study the global stability behavior of E⁄, we need the bounds of the dependent variables involved. For this we find theregion of attraction given in the form of following lemma.
Lemma 3. The set
X1 ¼ ðN; I1; I2;AÞ : 0 < NðtÞ 6 N; 0 6 I1ðtÞ þ I2ðtÞ 6 I; 0 6 AðtÞ 6 An o
ð17Þ
is a region of attraction for the system (5)–(8) starting in the region [0 6 I1, I2, A and N P I1 + I2+A].
where
N ¼ Q 0
l; I ¼ Q 0
lb� ðd0 þ lÞ
b0
�; A ¼ dI
ðaþ lÞ ; b ¼ maxðb1;b2Þ; b0 ¼minðb1; b2Þ;
d ¼maxðd1; d2Þ and d0 ¼minðd1; d2Þ:
Proof. Since
dNdt¼ Q 0 � lN � aA 6 Q 0 � lN:
Thus limt!1 sup NðtÞ 6 Q0l ¼ N.
Now,
dI1
dtþ dI2
dt¼ b1ðN � I1 � I2 � AÞI1
Nþ b2ðN � I1 � I2 � AÞI2
N� ðlþ d0ÞðI1 þ I2Þ
ddtðI1 þ I2Þ ¼ b1I1 þ b2I2 � ðlþ d0ÞðI1 þ I2Þ � ðb1I1 þ b2I2Þ
I1 þ I2 þ AN
� �6 ½b� ðlþ d0Þ�ðI1 þ I2Þ �
b0ðI1 þ I2ÞðI1 þ I2ÞN
� b0ðI1 þ I2ÞAN
6 ½b� ðlþ d0Þ�ðI1 þ I2Þ �b0ðI1 þ I2Þ2
N
6 ½b� ðlþ d0Þ� ðI1 þ I2Þ �ðI1 þ I2Þ2
Q0l
b�ðd0þlÞb0
h i24 35
Thus, limt!1 sup½I1ðtÞ þ I2ðtÞ� 6 I where I ¼ Q0l
b�ðd0þlÞb0
n o.
Similarly dAdt ¼ d1I1 þ d2I2 � ðlþ aÞA 6 dI � ðlþ aÞA.
Thus limt!1 sup AðtÞ 6 A where A ¼ dIðaþlÞ, proving the lemma. h
Theorem 1. The endemic equilibrium E⁄, if it exists, is globally asymptotically stable provided the following inequalities are sat-isfied in X1,
n2eb2
N�
� �2
I�2 þ I� 2
<4lp
9; ð18Þ
n2 hþ kI � eb2I�2N�
� �þ n1 ð1� eÞb2I þ kþ b1
N�
� �� ð1� eÞb2I�2
N�I�1
�� �<
4n1n2p9
b1
N�þ ð1� eÞb2I�2
N�I�1
� �; ð19Þ
where p ¼ eb2I�1N� þ ðd2 þ lÞ � kI�1 �
eb2NN�
h i
9a2d24lðaþ lÞp < n1 <4lp
9 b1 þð1�eÞb2 I�2
N� I�1
h i and n2 <4lp
9eb2I�2 b1 þð1�eÞb2 I�2
N�I�1
h i :
Proof. We consider the positive definite function about E⁄,V ¼ 12ðN � N�Þ2 þ 1
2n1 I1 � I�1 � I�1 ln
I1
I�1
� �þ 1
2n2 I2 � I�2� �2 þ 1
2n3 A� A�ð Þ2; ð20Þ
where the coefficients n1, n2 and n3 are defined in the proof of the theorem.
9582 R. Naresh et al. / Applied Mathematics and Computation 217 (2011) 9575–9591
The derivative of V is given by, after using Eqs. (5)–(8).
dVdt¼ ðN � N�ÞðQ0 � lN � aAÞ þ n1 I1 � I�1
� � b1ðN � I1 � I2 � AÞN
þ ð1� eÞb2ðN � I1 � I2 � AÞI2
NI1� ðhþ d1 þ lÞ � kI2
� �þ n2 I2 � I�2
� � eb2ðN � I1 � I2 � AÞI2
Nþ hI1 þ kI1I2 � ðd2 þ lÞI2
� �þ n3ðA� A�Þ½d1I1 þ d2I2 � ðaþ lÞA�;
which can further be written as,
dVdt¼� lðN � N�Þ2 � aðN � N�ÞðA� A�Þ þ n1 b1 þ
ð1� eÞb2I�2N�I�1
� �ðI1 þ I2 þ AÞ
NðN � N�Þ I1 � I�1
� �þ n2
eb2
N�I�2 �
N � I1 � I2 � AN
� �I2
� �ðN � N�Þ I2 � I�2
� �� n1
b1
N�þ ð1� eÞ b2I�2
I�1N�þ ð1� eÞb2I2ðN � I1 � I2 � AÞ
N
� �I1 � I�1� �2
� n2eb2I�1
N�þ ðd2 þ lÞ � kI�1 �
eb2ðN � I1 � I2 � AÞN�
� �I2 � I�2� �2
þ n2 hþ kI2 �eb2I�2
N�
� �þ n1 kþ b1
N�
� �þ ð1� eÞb2I�2
N�I�1� ð1� eÞb2I1
N � I1 � I2 � AN
� � �� �I1 � I�1� �
I2 � I�2� �
þ n3d1 � n1b1
N�þ ð1� eÞb2I�2
N�I�1
� �� �I1 � I�1� �
ðA� A�Þ þ n3d2 �n2eb2I�2
N�
� �I2 � I�2� �
ðA� A�Þ � n3 lþ að ÞðA� A�Þ2:
Now for dV/dt to be negative definite, the following conditions must be satisfied,
n1 b1 þð1� eÞb2I�2
N�I�1
� �2 I1 þ I2 þ AN
� �2
<4l9
b1
N�þ ð1� eÞ b2I�2
I�1N�þ ð1� eÞb2I2ðN � I1 � I2 � AÞ
N
� �; ð21Þ
n2eb2
N�
� �2
I�2 �N � I1 � I2 � A
N
� �I2
� �2
<4l9
eb2I�1N�þ ðd2 þ lÞ � kI�1 �
eb2ðN � I1 � I2 � AÞN�
� �; ð22Þ
a2 < n34dðaþ lÞ
9; ð23Þ
n2 hþ kI2 �eb2I�2
N�
� �� n1 kþ b1
N�
� �þ ð1� eÞb2I�2
N�I�1� ð1� eÞb2I1
N � I1 � I2 � AN
� � �� �2
<4n1n2
9b1
N�þ ð1� eÞ b2I�2
I�1N�þ ð1� eÞ b2I2ðN � I1 � I2 � AÞ
N
� �eb2I�1
N�þ ðd2 þ lÞ � kI�1 �
eb2ðN � I1 � I2 � AÞN�
� �; ð24Þ
n3d1 � n1b1
N�þ ð1� eÞb2I�2
N�I�1
� �� �2
<4n1n3ðaþ lÞ
9b1
N�þ ð1� eÞ b2I�2
I�1N�þ ð1� eÞb2I2ðN � I1 � I2 � AÞ
N
� �; ð25Þ
n3d2 �n2eb2I�2
N�
� �2
<4n2n3ðaþ lÞ
9eb2I�1
N�þ ðd2 þ lÞ � kI�1 �
eb2ðN � I1 � I2 � AÞN�
� �: ð26Þ
After maximizing the LHS and minimizing the RHS of above, the stability conditions can be obtained as follows,
n2eb2
N�
� �2
I�2 þ I� 2
<4lp
9;
n2 hþ kI � eb2I�2N�
� �þ n1 ð1� eÞb2I þ kþ b1
N�
� �� ð1� eÞb2I�2
N�I�1
�� �<
4n1n2p9
b1
N�þ ð1� eÞb2I�2
N�I�1
� �;
where p ¼ eb2I�1N� þ ðd2 þ lÞ � kI�1 �
eb2NN�
h i
9a2d24lðaþ lÞp < n1 <4lp
9 b1 þð1�eÞb2 I�2
N�I�1
h i and n2 <4lp
9eb2I�2 b1 þð1�eÞb2 I�2
N� I�1
h i :
Thus, under conditions (18) and (19), dV/dt will be negative definite showing that V is a Lyapunov function with respect to E⁄whose domain contains X1. h

R. Naresh et al. / Applied Mathematics and Computation 217 (2011) 9575–9591 9583
This theorem implies under certain conditions the disease would persist and remain endemic and the number of infec-tives increases as the rate of interaction increases.
Remark 1
1. If aware HIV infectives do not take part in the interaction i.e. b2 = 0 then condition Eq. (18) is automatically satisfied. Thus,the interaction of aware infectives has destabilizing effect on the system.
2. If the screening rate tends to zero i.e. h = 0 then contact tracing rate k also tends to zero and if b2 = 0 then the conditions(18) and (19) are automatically satisfied.
In the following section, we consider the particular case of the model (5)–(8) under different epidemiological situation tostudy the model dynamics.
4. Model with contact tracing when aware HIV infectives do not spread the infection (i.e. b2 = 0)
In this case, we consider the situation where aware HIV infectives take preventive measures and change their behavior sothat they do not spread the infection by sexual interaction in the community i.e. b2 = 0. Thus, the infection is spread only bythose infectives who are not aware of their infection. Then the model is well posed for b1 > (d1 + h + d).
In this case we also get two non-negative equilibria,
(i) P0 = (Q0/l,0,0,0), the disease-free equilibrium(ii) bP ¼ ðbN;bI1;bI2;AÞ, the endemic equilibrium
where bN;bI1;bI2 and bA are the positive solutions of the model system, obtained after equating the right hand side to zero.We get,
N ¼ 1d
Q0 �aðd1I1 þ d2I2Þðaþ lÞ
� �; ð27Þ
A ¼ ðd1I1 þ d2I2Þlðaþ lÞ ; ð28Þ
I1 ¼ðd2 þ lÞI2
ðhþ kI2Þor I2 ¼
hI1
ðd2 þ l� kI1Þ; ð29Þ
with
m1I22 þm2I2I1 �m3I1 �m4I2 þm5 ¼ 0; ð30Þ
where
m1 ¼ad2k
lðaþ lÞ ; m2 ¼ad1k
lðaþ lÞ ; m3 ¼b1lðaþ d1 þ lÞ þ ad1½b1 � ðhþ d1 þ lÞ�
lðaþ lÞ ;
m4 ¼b1lðaþ d2 þ lÞ þ ad1½b1 � ðhþ d2 þ lÞ�
lðaþ lÞ ; m5 ¼Q 0fb1 � ðd1 þ hþ lÞg
l:
From Eq. (29), we have
(i) when I2 = 0, I1 = 0,(ii) I2 ?1 when I1 ! ðd2þlÞ
k > 0,(iii) the slope at (0,0): dI2
dI1¼ hðlþd2Þ
> 0.
From Eq. (30), we get,
(i) when I1 ¼ 0; m1I22 �m4I2 þm5 ¼ 0 at least one root of this quadratic equation will be positive, say bI2
(ii) I1 ?1 when I2 ! m3m2> 0
� � ( )
ðiiiÞ dI2dI1 ð0;bI2Þ¼ m3 �m2
bI2
2m1bI2 �m4
> 0 ifm4
2m1< bI2 <
m3
m2: ð31Þ
In view of the above condition, plotting (29) and (30) in Fig. 3, we will get a positive intersecting point ðbI1;bI2Þ under the con-dition (31) i.e. when
m4
2m1< bI2 <
m3
m2:

Fig. 3. Existence of non-negative equilibrium point.
9584 R. Naresh et al. / Applied Mathematics and Computation 217 (2011) 9575–9591
The equilibrium point bP will exist only if b1 < (h + d1 + l) and ðd2 þ lÞ > kbI .To determine the local stability ofP0, we compute the variational matrix corresponding to P0. It is found that P0 is locally
asymptotically stable if b1 < (h + d1 + l) and under this condition the equilibrium bP does not exist. If b1 > (h + d1 + l), then P0
is unstable and there exists a unique endemic equilibrium bP and the infection is maintained in the population.We define the basic reproduction number in this case as,
R02 ¼b1
ðhþ d1 þ lÞ ð32Þ
and note that if R02 < 1, the infection dies out and for R02 > 1 it always persists in the population.It is observed that when the aware infectives do not take part in spreading the infection, the basic reproduction number is
significantly reduced. Note that R01 ? R02 as b2 ? 0. Thus, the endemicity of the infection is reduced when aware infectivespresent a positive attitude towards preventive procedures and do not take part in spreading the disease.
The variational matrix corresponding to bP is given by
bM ¼�l 0 0 �a
g � b1bI1bN � b1
bI1bN þ kbI1
� �� b1bI1bN
0 hþ kbI2 �ðd2 þ l� kbI1Þ 00 d1 d2 �ðaþ lÞ
26666664
37777775;
where g ¼ ½b1 � ðhþ lþ dþ kbI2Þ� I�1N�.
Using Eq. (6), when b2 = 0, we can show that g > 0 as follows,
b1ðbN �bI1 �bI2 � bAÞbI1
N�� ðhþ d1 þ lÞbI1 � kbI1
bI2 > 0;
b1bI1 � ðhþ d1 þ lÞbI1 � kbI1
bI2 > 0;
½b1 � ðhþ d1 þ lþ kbI2Þ�bI1 > 0;
½b1 � ðhþ d1 þ lþ kbI2Þ�bI1bN > 0; Thus; g > 0:
The characteristic equation corresponding to the variational matrix bM with respect to bP is given by
f ðkÞ ¼ k4 þ b1k3 þ b2k
2 þ b3kþ b4 ¼ 0; ð33Þ
where
b1 ¼ aþ 2lþ b1bI1bN þ d2 þ l� kbI1
" #;
b2 ¼ ðaþ lÞlþ ðaþ 2lÞ b1bI1bN þ d2 þ l� kbI1
!þ b1
bI1bN !
ðd2 þ l� kbI1Þ þb1bI1bN
!d1 þ
bbI1
Nþ kbI1
!ðhþ kbI2Þ;

R. Naresh et al. / Applied Mathematics and Computation 217 (2011) 9575–9591 9585
b3 ¼lðaþ lÞ b1bI1bN þ d2 þ l� kbI1
!þ b1
bI1bN ðd2 þ l� kbI1Þðaþ 2lÞ þ b1bI1bN þ kbI2
!ðaþ 2lÞðhþ kbI2Þ
þ b1bI1bN fðhþ kbI2Þd2 þ ðd2 þ 2l� kbI1Þd1g þ ad1g
bI1bN ;
b4 ¼fðhþ kbI2Þd2 þ ðd2 þ 2l� kbI1Þd1g agþ b1lbI1bN
" #þ dðaþ dÞðhþ kbI2Þ
b1bI1bN þ kbI1
!
þ lðaþ lÞ b1bI1bN
!ðd2 þ 2l� kbI1Þ:
Here again bi > 0 (i = 1,2,3,4) if ðd2 þ lÞ > kbI and b1b2-b3 > 0 hold. Thus, the endemic equilibrium bP is locally asymptoticallystable if remaining condition of Routh–Hurwitz criteria i.e. b3ðb1b2 � b3Þ � b2
1b4 > 0 is satisfied.The region of attraction is given as,
X2 ¼ ðN; I1; I2;AÞ : 0 < NðtÞ 6 eN; 0 6 I1ðtÞ 6 eI1; 0 6 I2ðtÞ 6 eI2; 0 6 AðtÞ 6 eAn o
where eN ¼ Q0l ;eI1 ¼ Q0
l 1� ðd1þlþhÞb
n o; eI2 ¼ heI1
ðlþdÞ�reI1
; eA ¼ d1eI1þd2
eI2ðaþlÞ .
The endemic equilibrium bP is found to be globally asymptotically stable if the following inequality holds in X2,
q2ðhþ keI2Þ þ q1 kþ b1bN� �
<4q1q2
9b1bN ðd2 þ lÞ � kbI1
h i: ð34Þ
Note: This condition can be found directly by putting b2 = 0 in Eqs. (18) and (19).It can also be proved easily using the following Lyapunov function,
V ¼ 12ðN � bNÞ2 þ 1
2q1 I1 �bI1 �bI1 ln
I1bI1
!þ 1
2q2ðI2 �bI2Þ2 þ
12
q3ðA� bAÞ2; ð35Þ
where 9a2d1bN
4lðaþlÞb1< q1 <
4l
9b1bN ; q2 >
81a2d22
16lðaþlÞ2ðd2þl�kbI1Þand q3 ¼ q1b1
d1bN .
Remark 2. By analyzing both the epidemiological situations as discussed above, it may be concluded that if aware HIVinfectives take the preventive measures and do not spread the infection, the disease tends to the endemic state if thescreening rate is small. If the annual screening rate is very high (say 100% of the initial population) the disease may tend todisease-free equilibrium point. However, if aware HIV infectives also contribute to spreading the disease then even if thescreening rate is very high, the disease is set up among the population as the system continues towards asymptotically stableendemic equilibrium point.
Fig. 4. Variation of unaware infective population against susceptible population.
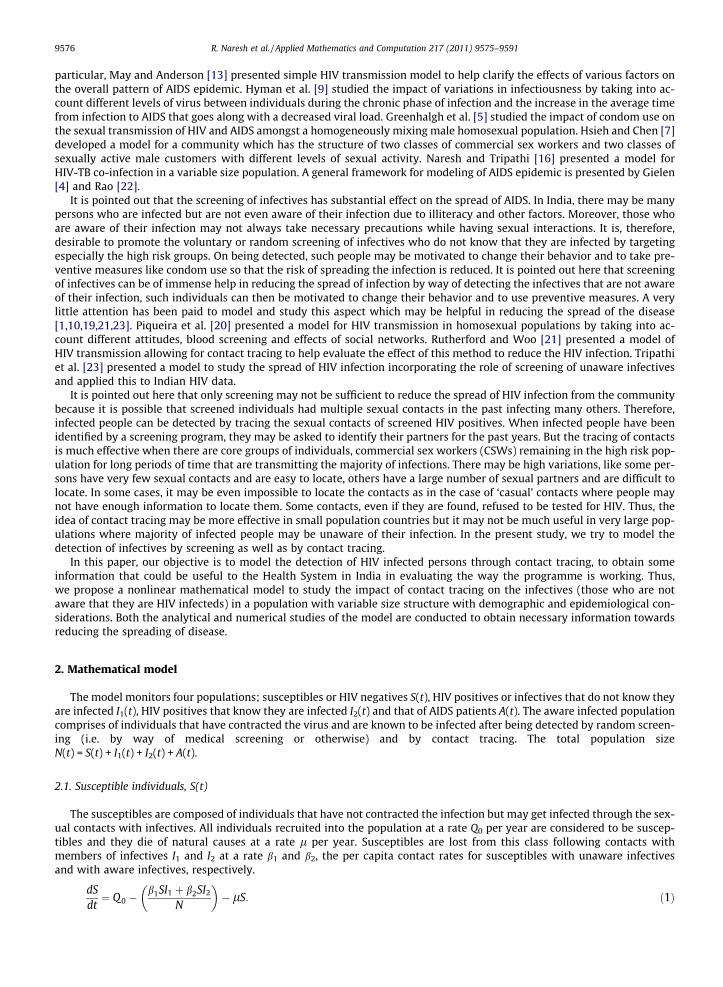
Fig. 5. Variation of aware infective population against susceptible population.
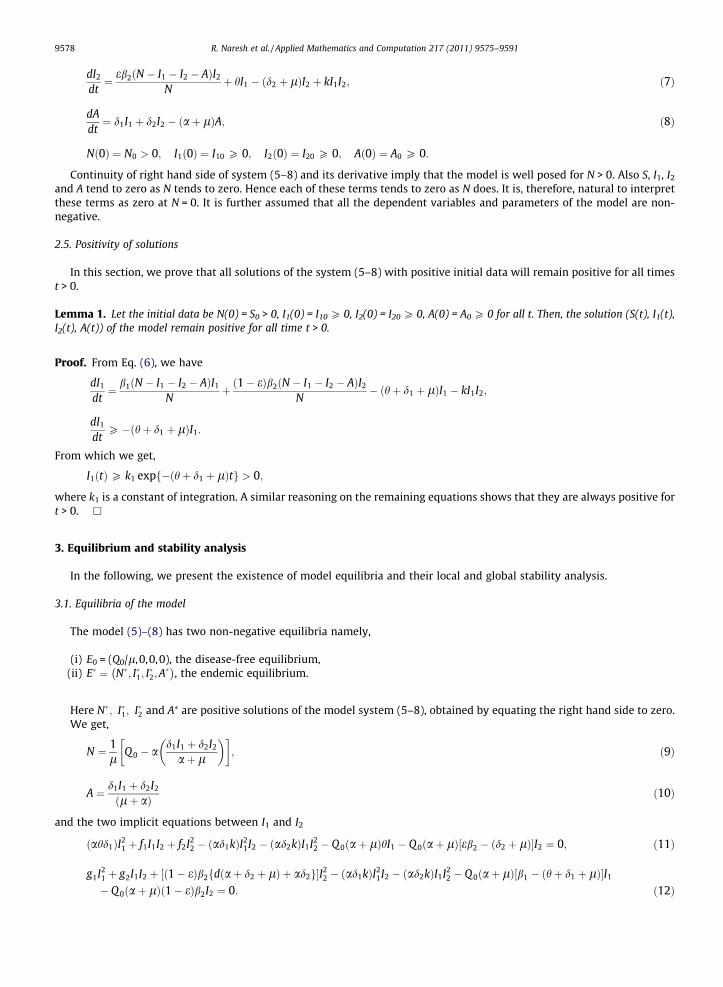
Fig. 6. Variation of population in different classes without immigration.
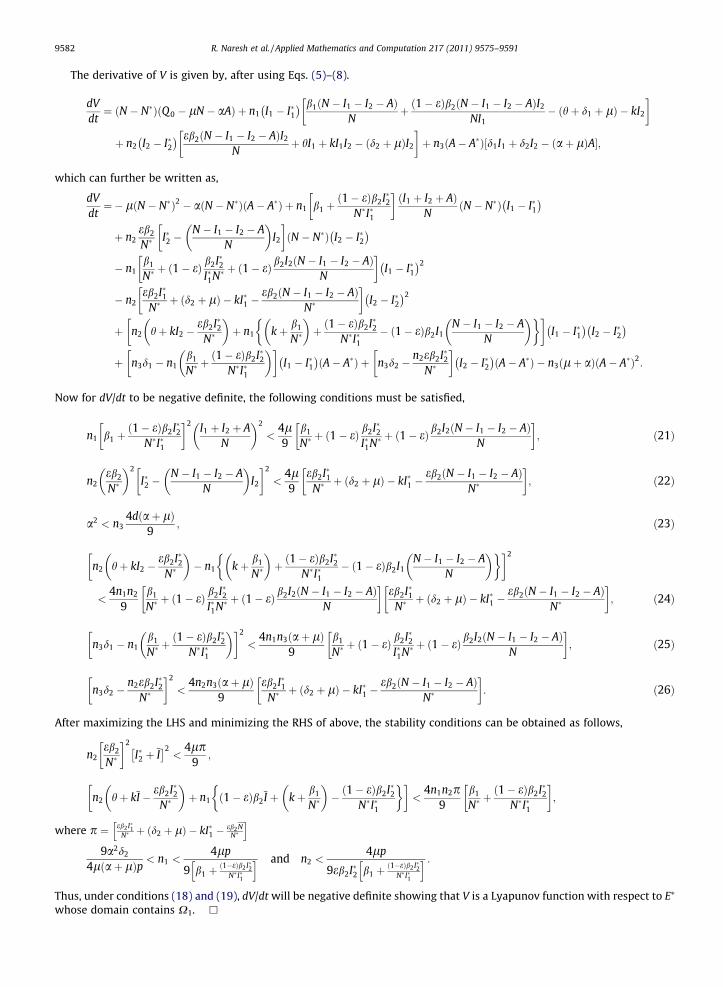
Fig. 7. Variation of population in different classes with immigration.
9586 R. Naresh et al. / Applied Mathematics and Computation 217 (2011) 9575–9591

R. Naresh et al. / Applied Mathematics and Computation 217 (2011) 9575–9591 9587
5. Numerical simulation and discussion
It is noted here that our aim is to study, through a nonlinear model and its qualitative analysis, the effect of screening andcontact tracing on the spread of HIV infection. It is, therefore desirable, that we must show the existence of equilibrium val-ues of variables of the model as well as the feasibility of stability conditions numerically for a set of parameters.
To see the dynamical behavior of the model, the system (5–8) is integrated numerically by fourth order Runge–Kuttamethod. Most of the parameter values used in simulation are empirical and adopted from previously published articles,while others are estimated intuitively [13,18,22,23]. The unit of parameters is in per year:
Q 0 ¼ 2000; l ¼ 0:02; b1 ¼ 1:5; b2 ¼ 0:5; a ¼ 1; d1 ¼ 0:2;d2 ¼ 0:1; e ¼ 0:01; h ¼ 0:015; k ¼ 0:00001:
With an average life expectancy of 65 years in India, and 17 years being the average age of first sexual intercourse globally[19], we consider l = 0.02, corresponding to an average of 45 years of sexual activity. Similarly a, the yearly disease-inducedmortality rate can be computed from the number of deaths related to AIDS. The contact rate bi (i = 1,2) actually depend on
Fig. 8. Variation of unaware infective population for different values of k and h.
Fig. 9. Variation of aware infective population for different values of k and h.

Fig. 11. Variation of AIDS population for different values of b2.
Fig. 10. Variation of AIDS population for different values of k and h.
9588 R. Naresh et al. / Applied Mathematics and Computation 217 (2011) 9575–9591
the number of sex acts in a given time and the transmission probabilities associated with each of the acts. The movementrates di (i = 1,2) can be determined from the incubation period estimated from the number of persons whose probable dateof infection has been determined for an observation period. The other data values are taken from the published literature.The initial values taken in simulation are
Nð0Þ ¼ 10000; I1ð0Þ ¼ 5000; I2ð0Þ ¼ 1000 and Að0Þ ¼ 200:
The equilibrium values are computed as,
N� ¼ 13950; I�1 ¼ 7503; I�2 ¼ 2547 and A� ¼ 1721:
The computer simulations are performed for different initial starts in the following four cases and displayed graphically inFigs. 4 and 5.
1. N(0) = 10000, I1(0) = 5000, I2(0) = 1000 and A(0) = 200,2. N(0) = 20000, I1(0) = 10000, I2(0) = 4000 and A(0) = 1000,

R. Naresh et al. / Applied Mathematics and Computation 217 (2011) 9575–9591 9589
3. N(0) = 14000, I1(0) = 10000, I2(0) = 4000 and A(0) = 800,4. N(0) = 16000, I1(0) = 3000, I2(0) = 3500 and A(0) = 500.
In first two figures, the infective population (unaware and aware respectively) is plotted against the susceptible popula-tion. We see from these figures that for any initial start, the solution curves tend to the equilibrium E⁄. Hence, we infer thatthe system (5)–(8) is globally stable about this endemic equilibrium point E⁄ for the above set of parameters. In Fig. 6, thedistribution of population with time is shown in different classes without immigration. It is seen that in the absence of immi-gration into the community, the susceptible population decreases continuously as the population is closed which results inan increase in infective population first and then it decreases as all infectives will develop AIDS and will die out by disease-induced deaths. Thus the total population will be eradicating after some time. Fig. 7 shows the variation of population in allthe classes with immigration. It is found that susceptible population first increases with time and then reaches its equilib-rium position. Since due to immigration, susceptible population increases continuously, therefore, infection becomes more
Fig. 12. Variation of AIDS population for different values of a.
Fig. 13. Variation of AIDS population for different values of Q0.

9590 R. Naresh et al. / Applied Mathematics and Computation 217 (2011) 9575–9591
endemic and always persists in the population (see also Fig. 13). In Figs. 8–10, the variation of HIV infected population andthat of AIDS patients for different detection rate is shown. It is seen that as infected persons detect by a rate h i.e. the unawareHIV infectives become aware about their infection, thus we may trace out the other infectives which have the sexual contactsin past by contact tracing by a rate k, which results in the decrease of the number of unaware infectives and leads to increasethe number of aware HIV infectives (see Fig. 9). It is seen that as the screening rate becomes zero i.e. the infectives who donot know that they are infected will continue maintaining sexual relationships in the community which will ultimately in-crease the AIDS patients population (see Fig. 10). In Fig. 11 the variation of AIDS patients for different values of b2 is shown. Itis observed that when unaware infectives do not take part in sexual contacts the number of AIDS patients decreases signif-icantly. Thus, on changing the behavior and increasing the awareness about the HIV infection in the population the infectioncan be slowed down and may be kept under control. In Fig. 12 the effect of disease induced death rate a is shown and it isobserved that as a increases, the population of AIDS patients decreases. From the figures, it can also be seen that the respec-tive populations are tending to the equilibrium level. This has also been observed for different initial values of the variables.Hence, the equilibrium E⁄ is globally asymptotically stable for this set of parameters.
6. Conclusion
In this paper, a nonlinear mathematical model is proposed to investigate the impact of contact tracing on the spread ofHIV/AIDS in a population with variable size structure. The model is analyzed using stability theory of differential equationsand numerical simulation. The endemic equilibrium is found to be locally asymptotically stable and it becomes globallyasymptotically stable under certain conditions. It is observed that if the aware HIV infectives, detected by screening and con-tact tracing, do not take part in spreading the disease, HIV infection reduces significantly. It is also found that the diseasebecomes more endemic due to immigration and the endemicity of the disease decreases when the infectives become awareof their infection after screening and contact tracing and do not take part in sexual interaction whereas it increases in theabsence of contact tracing. Thus, contact tracing plays a vital role in containing the disease prevalence especially in countrieslike India where screening is not a routine work. In the absence of screening and contact tracing, the infected people continueto spread the disease without taking any precaution due to unawareness of their infection and AIDS population increasesrapidly. However, on being detected to be HIV positive, people become aware of their infection and consequently AIDS pop-ulation decreases as the people may present a positive attitude toward the safe sexual interaction by changing theirbehavior.
Finally from the analysis, it may be speculated that the most effective way to reduce the infection rate and prevalencelevel is to educate the people about the AIDS and make them aware of the consequences of practicing non-safe sex orany other kind of risky behavior. If the population presents a positive attitude toward preventive procedures, the diseasemay tend to vanish, even for relatively small random screening rates.
Acknowledgements
Authors are thankful to the reviewers whose suggestions and constructive comments helped us in finalizing the paper.One of the authors (DS) is thankful to the University Grants Commission, New Delhi for financial support in the form ofJRF received through grant F. No. 10-2(5)2003(I)-EU.II.
References
[1] H.D. Arazoza, R. Lounes, A non-linear model for a sexually transmitted disease with contact tracing, IMA J. Math. Appl. Med. Biol. 19 (2002) 221–234.[2] K. Busenberg, K. Cooke, H. Ying-Hen, A model for HIV in Asia, Math. Biosci. 128 (1995) 185–210.[3] M. Doyle, D. Greenhalgh, Asymmetry and multiple endemic equilibria in a model for HIV transmission in a heterosexual population, Math. Comput.
Model. 29 (1999) 43–61.[4] J.L.W. Gielen, A framework for epidemic models, J. Biol. Syst. 11 (2003) 377–405.[5] D. Greenhalgh, M. doyle, F. Lewis, A mathematical treatment of AIDS and condom use, IMA J. Math. Appl. Med. Biol. 18 (2001) 225–262.[6] H.W. Hethcote, P.V. driessche, Some epidemiological models with nonlinear incidence, J. Math. Biol. 29 (1991) 271–287.[7] Y.H. Hsieh, C.H. Chen, Modelling the social dynamics of a sex industry: its implications for spread of HIV/AIDS, Bull. Math. Biol. 66 (2004) 143–166.[8] Y.H. Hsieh, S.P. Sheu, The effect of density-dependent treatment and behavior change on the dynamics of HIV transmission, J. Math. Biol. 43 (2001) 69–
80.[9] J.M. Hyman, J. Li, E.A. Stanley, The differential infectivity and staged progression models for the transmission of HIV, Math. Biosci. 55 (1999) 77–109.
[10] J.M. Hyman, J. Li, E.A. Stanley, Modeling the impact of random screening and contact tracing in reducing the spread of HIV, Math. Biosci. 181 (2003) 17–54.
[11] Z. Ma, J. Liu, J. Li, Stability analysis for differential infectivity epidemic models, Nonlinear Anal.: Real World Appl. 4 (2003) 841–856.[12] P. Manfredi, E. Salinelli, Population induced oscillation in blended SI-SEI epidemiological models, IMA J. Math. Appl. Med. Biol. 19 (2002) 95–112.[13] R.M. May, R.M. Anderson, Transmission dynamics of HIV infection, Nature 3426 (1987) 137–142.[14] S.M. Moghadas, A.B. Gumel, Global stability of a two-stage epidemic model with generalized nonlinear incidence, Math. Comput. Simul. 60 (2002)
107–118.[15] R. Naresh, S. Omar, A. Tripathi, Modelling and analysis of HIV/AIDS in a variable size population, Far East J. Appl. Math. 18 (2005) 345–360.[16] R. Naresh, A. Tripathi, Modeling and analysis of HIV-TB co-infection in a variable size population, Math. Model. Anal. 10 (2005) 275–286.[17] R. Naresh, A. Tripathi, S. Omar, Modelling the spread of AIDS epidemic with vertical transmission, Appl. Math. Comput. 178 (2006) 262–272.[18] National AIDS Control Organization: Country Scenario AIDS, Published by NACO, Ministry of Health, Govt. of India, New Delhi. 2009–10.[19] F. Nyabadza, Z. Mukandavire, S.D. Hove-Musekwa, Modelling the HIV/AIDS epidemic trends in South Africa: Insights from a simple mathematical
model, Nonlinear Analysis:RWA, doi:doi:10.1016/j.nonrwa.2010.12.024.

R. Naresh et al. / Applied Mathematics and Computation 217 (2011) 9575–9591 9591
[20] J.R.C. Piqueira, M.C. Castano, L.H.A. Monteiro, Modeling the spreading of HIV in homosexual populations with heterogeneous preventive attitude, J.Biol. Syst. 12 (2004) 439–456.
[21] G. Rutherford, J. Woo, Contact tracing and the control of human immunodeficiency virus, J. Amer. Med. Assoc. 259 (1988) 3609–3610.[22] A.S.R. Srinivasa Rao, Mathematical modeling of AIDS epidemic in India, Current Sci. 84 (2003) 1192–1197.[23] A. Tripathi, R. Naresh, D. Sharma, Modelling the effect of screening of unaware infectives on the spread of HIV infection, Appl. Math. Comput. 184
(2007) 1053–1068.