Social Valuation of Genebank Activities: Assessing Public ... - MDPI
19
sustainability Article Social Valuation of Genebank Activities: Assessing Public Demand for Genetic Resource Conservation in the Czech Republic Nicholas Tyack 1,2, * and Milan Šˇ casný 3,4 1 Graduate Institute of International and Development Studies, 1202 Geneva, Switzerland 2 Institute of Economic Studies, Faculty of Social Sciences, Charles University, 110 00 Prague, Czech Republic 3 Charles University Environment Centre, 162 00 Prague, Czech Republic; [email protected] 4 Faculty of Finance and Accounting, University of Economics, 130 67 Prague, Czech Republic * Correspondence: [email protected] Received: 7 June 2018; Accepted: 30 October 2018; Published: 1 November 2018 Abstract: The use of diverse genetic resources to breed improved crop varieties has been a key driver of agricultural productivity improvements in the past century. At the same time, the adoption of modern varieties has contributed to substantial loss of traditional varieties. In this analysis, we estimate the social value provided by several proposed crop diversity conservation programs to be carried out by the Czech genebank system. We use a double-bounded dichotomous choice model to estimate the willingness-to-pay (WTP) for conserving additional crop varieties in the genebank for ten years using data collected through an online contingent valuation survey administered to a sample representative of the general Czech population (1037 respondents) and a smaller sub-sample representative of the agricultural region of South Moravia (500 respondents). Mean WTP was found to be about $9 for both the Czech and S. Moravian sub-samples, corresponding to country-wide benefits of ~$68 million. These benefits increase by 6–7% for every ten varieties conserved, implying total welfare benefits of ~$84 million for a program conserving the maximum number of 35 additional crop varieties offered in the experiment. The study illustrates an empirical approach of potential value for policymakers responsible for determining funding levels for genetic resource conservation. Keywords: crop diversity; plant genetic resources for food and agriculture (PGRFA); public goods; contingent valuation; double-bounded dichotomous choice; willingness to pay 1. Introduction Plant genetic resources for food and agriculture (PGRFA) comprise both the diversity of crop varieties, as well as the wild relatives of crops. A primary value of these resources is the use of PGRFA to breed new crop varieties that are more productive and resilient. For example, the use of rice and wheat varieties from diverse backgrounds to breed high-yielding, semi-dwarf cultivars and the dissemination of these varieties in the developing world helped to launch the Green Revolution, along with the increased use of fertilizers and pesticides [1], and led to substantial increases in crop yield and production, a reduction in child malnourishment, and reduced crop prices in developing countries [2]. The use of genetic resources in plant breeding has been shown to have a high rate of return on investment, with Marasas et al. (2004) finding that efforts to breed wheat cultivars resistant to leaf rust had an internal rate of return of 41% [3], and Brennan and Malabayasas (2011) reporting that an investment in rice improvement efforts of about US$4.8 billion (2009 values) produced just over US$100 billion in benefits [4]. Thus, the availability of diverse plant genetic resources has been shown to be essential for breakthroughs in plant breeding that in turn have led to substantial increases in agricultural productivity. Sustainability 2018, 10, 3997; doi:10.3390/su10113997 www.mdpi.com/journal/sustainability
-
Upload
khangminh22 -
Category
Documents
-
view
0 -
download
0
Transcript of Social Valuation of Genebank Activities: Assessing Public ... - MDPI
sustainability
Article
Social Valuation of Genebank Activities: AssessingPublic Demand for Genetic Resource Conservationin the Czech Republic
Nicholas Tyack 1,2,* and Milan Šcasný 3,4
1 Graduate Institute of International and Development Studies, 1202 Geneva, Switzerland2 Institute of Economic Studies, Faculty of Social Sciences, Charles University, 110 00 Prague, Czech Republic3 Charles University Environment Centre, 162 00 Prague, Czech Republic; [email protected] Faculty of Finance and Accounting, University of Economics, 130 67 Prague, Czech Republic* Correspondence: [email protected]
Received: 7 June 2018; Accepted: 30 October 2018; Published: 1 November 2018�����������������
Abstract: The use of diverse genetic resources to breed improved crop varieties has been a keydriver of agricultural productivity improvements in the past century. At the same time, the adoptionof modern varieties has contributed to substantial loss of traditional varieties. In this analysis,we estimate the social value provided by several proposed crop diversity conservation programs tobe carried out by the Czech genebank system. We use a double-bounded dichotomous choice modelto estimate the willingness-to-pay (WTP) for conserving additional crop varieties in the genebankfor ten years using data collected through an online contingent valuation survey administered to asample representative of the general Czech population (1037 respondents) and a smaller sub-samplerepresentative of the agricultural region of South Moravia (500 respondents). Mean WTP was found tobe about $9 for both the Czech and S. Moravian sub-samples, corresponding to country-wide benefitsof ~$68 million. These benefits increase by 6–7% for every ten varieties conserved, implying totalwelfare benefits of ~$84 million for a program conserving the maximum number of 35 additionalcrop varieties offered in the experiment. The study illustrates an empirical approach of potentialvalue for policymakers responsible for determining funding levels for genetic resource conservation.
Keywords: crop diversity; plant genetic resources for food and agriculture (PGRFA); public goods;contingent valuation; double-bounded dichotomous choice; willingness to pay
1. Introduction
Plant genetic resources for food and agriculture (PGRFA) comprise both the diversity of cropvarieties, as well as the wild relatives of crops. A primary value of these resources is the use ofPGRFA to breed new crop varieties that are more productive and resilient. For example, the use ofrice and wheat varieties from diverse backgrounds to breed high-yielding, semi-dwarf cultivars andthe dissemination of these varieties in the developing world helped to launch the Green Revolution,along with the increased use of fertilizers and pesticides [1], and led to substantial increases in cropyield and production, a reduction in child malnourishment, and reduced crop prices in developingcountries [2]. The use of genetic resources in plant breeding has been shown to have a high rate ofreturn on investment, with Marasas et al. (2004) finding that efforts to breed wheat cultivars resistantto leaf rust had an internal rate of return of 41% [3], and Brennan and Malabayasas (2011) reportingthat an investment in rice improvement efforts of about US$4.8 billion (2009 values) produced justover US$100 billion in benefits [4]. Thus, the availability of diverse plant genetic resources has beenshown to be essential for breakthroughs in plant breeding that in turn have led to substantial increasesin agricultural productivity.
Sustainability 2018, 10, 3997; doi:10.3390/su10113997 www.mdpi.com/journal/sustainability
Sustainability 2018, 10, 3997 2 of 19
However, in spite of the looming challenges of climate change and a rapidly growing worldpopulation, recent years have seen a slowdown in the growth of the yields of rice, wheat, maize andsoybeans, as well as spending on agricultural research and development in the U.S. [5], with fundingfor international agricultural research slowing after 1990 as well [6]. At the same time, the developmentof improved crop varieties, along with pressures such as land clearing, development, urbanization andthe spread of pests and diseases, has led to the loss of traditional, less profitable crop varieties [7].
Such genetic erosion has led to the increased homogenization of agricultural production, and hasundermined the resilience of the overall agricultural system by limiting the genetic resourcesavailable for breeding more productive and resistant crop varieties in the future. Claims thatnegative externalities in the private valuation of genetic diversity are likely to lead to systematicunderinvestment in this area [8] suggest that robust economic studies of genetic resources are neededto ensure that more socially optimal investments are made in their conservation and use in the21st century.
Farmers are incentivized to adopt modern, high-yielding crop varieties in order to maximizetheir profits, often leading to the abandonment of old, traditional crop varieties. At the same time,breeding firms are likely to only conserve crop varieties they believe will allow them to generate profitsthrough the breeding and release of new varieties. Thus, genebank managers in the public sector needto be relied upon to conserve the socially optimal amount of crop diversity. However, whether theyare able to do so is dependent on both their funding, determined by governments, and the ability toroughly estimate the total economic benefits of crop diversity conservation—a task complicated by thedifficulty of quantifying the non-use values of plant genetic resources, including existence, bequest andoption values [9,10].
In this analysis, we apply a systems thinking approach to the valuation of genetic resources byusing stated preference techniques to derive the social value of crop diversity conservation activitiesin the Czech Republic. By focusing on the Czech public as a whole instead of a given interestgroup (related to a specific crop or farmers as a group) or a specific use of genetic resources (witha demonstrated economic return), we aim to capture not just a measure of the past or potential usevalue of crop diversity in a narrow sense, but an approximation of the social value provided by geneticresource conservation, thus providing a rough hypothetical estimate of the total economic valueprovided to the agri-food system on a national level. This broader measure of value includes othertypes of value—including insurance, option, bequest and existence values—that are left out by morenarrow analyses.
Methodologically, we use the double-bounded dichotomous choice stated preference methodto estimate how much Czechs are willing to pay (WTP) to fund the collection and conservation ofadditional crop varieties over a ten-year period. Preferences are elicited through an online statedpreference survey conducted in the Czech Republic (n = 1037) and its primary agricultural region,South Moravia (n = 500). Survey participants were sampled from a properly managed online panel,using quotas for region, age, gender, education, and the size of the place of residence of the respondentto ensure that both samples were representative of the Czech Republic and South Moravia, respectively.
This research focuses on the value that the Czech public places on conserving crop diversity,providing an approximation of the aggregate social benefits of plant genetic resource conservation inthe Czech Republic. In contrast, most past work has instead dealt with farmer preferences. Since mostcountries have public conservation programs for crop diversity on the national level, the value placedby the general public on the conservation of crop varieties is also of interest.
Importantly, estimating the mean willingness-to-pay of a country’s residents allows the estimationof the aggregate WTP for crop conservation on a country-wide level. In addition, using statedpreference methods to focus on the general public makes it possible to capture the “passive use values”of crop diversity, of importance for the public, as well as for farmers. These include bequest andexistence values, the option/insurance value of genetic resources (associated with the potential useof crop diversity to help respond to future shocks and needs), as well as the cultural value of crop
Sustainability 2018, 10, 3997 3 of 19
varieties, as embodied by heritage fruit trees and their associated uses in the making of jams, preservesand brandies, for example. Furthermore, to obtain an appropriate level of financial support, it is alsonecessary to obtain rigorous estimates of the diverse economic values of crop diversity in order tojustify expenditures on the conservation of these genetic resources. This analysis represents a firstsubstantive step towards that goal in the context of the Czech Republic.
2. Literature Review
A number of studies have used the contingent valuation approach to elicit preferences related tothe conservation of crop genetic resources or potential usage of traditional varieties. The main goalof these studies was to derive the monetary values and hence social benefits associated with theseconservation activities or optional uses that are not directly dependent on their past use in breedingnew, improved crop varieties. Past studies have addressed either preferences of agents on the supplyside, or on the demand side of the economy (consumers). The former studies aimed to determinethe decisions/preferences of farmers or cultivators related to specific technologies or techniques,including their interest in using traditional or environmentally friendly, but less productive varieties.The latter group of studies instead focused on the preferences of individuals behaving as consumers.These include studies that elicited preferences for rare or traditional products, such as apples or salami,while the others examined the acceptability of specific public conservation programs.
Starting with the former body of research, Poudel and Johnsen (2009) used an open-endedelicitation format to estimate the willingness of Nepalese farmers to pay for the conservation ofrice landraces, finding a mean willingness to pay of US$4.18 for in situ and US$2.20 for ex situconservation per landrace per year [11]. However, more recent studies have used close-endedquestions that provide a discrete bid and ask the respondent if they accept or do not accept theoffer, as (the open-ended elicitation approach, which asks respondents directly how much they arewilling to pay, has been criticized for not providing a realistic, market-like situation [12] and fornot being incentive compatible [13]). For instance, Krishna et al. (2013) use the double-boundeddichotomous choice approach to estimate the minimum amount farm households in India wouldbe willing-to-accept (WTA) to conserve rare, but less productive, varieties of different minor milletspecies [14]. They find that the mean farmer WTA values for cultivating one of the minor milletvarieties on 0.10 acres of land under monocropping ranges from 148.85 to 982.21 Rupees per year,depending on the millet variety (corresponding to about $3 and $21, respectively). Another groupof studies have used discrete choice experiments to analyze farmer/cultivator preferences for cropdiversity as part of a wider conservation program or for their own use [15–17].
The latter group of papers aiming at consumer preferences for specific products includeRocchi et al. (2016), who use a single-bounded dichotomous choice model to elicit use and non-usevalues for an old Italian tomato variety, “Pomodoro di Mercatello.” The paper focuses on the populationof the city where the tomato is grown and sold, and derives an estimate for WTP to “adopt” a tomatoplant of the variety for conservation of 14.49 euros (a proxy for non-use value) [18]. Botelho et al. (2018)investigate whether consumers are WTP a large enough premium for traditional varieties of applesin Portugal to make it sufficiently rewarding for farmers to cultivate [19], while Balogh et al. (2016)find that consumers in Hungary have a high demand for traditional food products such as Hungarianmangalitza salami [20]. And finally, the discrete choice experiment method has even been used to elicitpreferences and willingness-to-pay of the public for the presence of crop diversity within agriculturallandscapes [21].
Most of these past studies have focused on the value of crop diversity on-farm [14–17], while fewhave used stated preference techniques to investigate the value of crop diversity held ex situ in fieldcollections, cold storage, and cryopreservation facilities [11]. Almost all of these studies also elicit thepreferences of farmers or cultivators for the conservation of crop diversity, and not those of the generalpublic (except for the case of consumer demand for direct use—not conservation—of traditional foodproducts and varieties). Since most countries have public conservation programs for crop diversity
Sustainability 2018, 10, 3997 4 of 19
on the national level, however, the value placed by the general public on the conservation of cropvarieties is also of interest. While members of the general population may have on average a differentWTP than that of an average farmer (who directly uses crop diversity to make a living), estimating thesocial benefits by relying on farmers’ WTP may bias the estimate. Having a WTP estimate derivedfrom public preferences is in particular important for regions where farmers represent only a verysmall fraction of population, as is the case for most developed countries. In addition, using statedpreference methods to elicit the WTP of the general public makes it possible to capture the “passiveuse values” of crop diversity—such as the option, bequest and existence values of conserving cropdiversity—which are of significance for the public, as well as for farmers.
3. Materials and Methods
This study uses stated preference methods to analyze the preferences of the Czech public forconserving crop diversity and to value the conservation services provided by the Czech genebanksystem, which conserves crop varieties using a variety of methods, including cold storage (for wheatand other grains), in vitro (e.g., for potatoes), and in field collections (e.g., for fruit trees and winevarieties). The analysis focuses on estimating the willingness-to-pay (WTP) of the Czech populationfor the collection and conservation for ten years of additional traditional Czech varieties of unspecifiedcrop types currently conserved by the Czech National Programme for the Conservation of AgriculturalBiodiversity, including oil crops such as canola and sunflower, legumes such as lentils and chickpeas,vegetables, potatoes, and cereals such as barley and wheat.
3.1. Survey Method and Data
A nationally representative sample of individuals aged 18–69 in the Czech Republic was surveyedin July 2016 (n = 1037; n = 965 excluding speeders). In addition, a smaller and separate sub-sampleof individuals from the agricultural region of South Moravia in the Czech Republic (n = 500; n = 463excluding speeders) was also surveyed during the same time period. The representativeness of thesamples was controlled through quota selection depending on region, age, gender, education, andsize of the place of residence of the respondent (the sample proportions are not statistically differentfrom the proportions set for each quota at the 5% level; see Table A3 in the Appendix A). The quotaswere satisfied for each of the sub-samples independently. The questionnaire was tested and developedthrough a qualitative pre-survey, and was also further tested on a representative sample of the Czechadult population (ages 18–69) in a three-day pilot (n = 175). The main wave of the survey wasadministered over a 5-day period in July 2016.
Data were collected with the Computer-Assisted Self Interviewing (CASI) method, using anonline survey instrument to allow for more flexible experimental designs and randomizations.The survey instrument was programmed and maintained by the Charles University EnvironmentCentre, as were the output data matrices making up the database of results. A professional marketresearch firm (STEM/MARK) was hired to incentivize respondents to answer the survey, to managethe quotas, and to carry out the data collection in line with the standards of the international researchassociation ESOMAR.
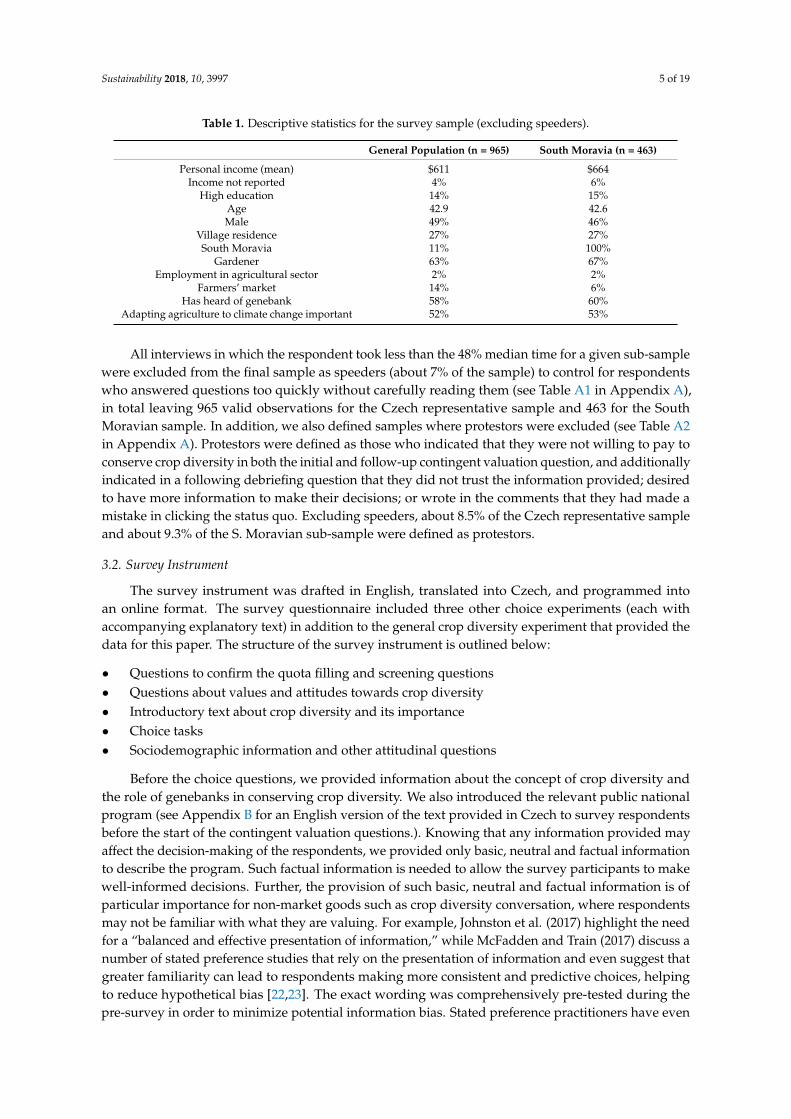
Respondents were sampled from an internet panel, properly managed by Ceský Národní Panel.Table 1 lists descriptive statistics for the sample for a selection of the socioeconomic and attitudinalvariables used as covariates in the analysis, including residence in a village, whether the respondentpersonally cultivates edible plants for own consumption, has an agricultural job, regularly visitsfarmers’ markets, had heard of genebanks, or believed that adapting the Czech agriculture sector toclimate change was important.
Sustainability 2018, 10, 3997 5 of 19
Table 1. Descriptive statistics for the survey sample (excluding speeders).
General Population (n = 965) South Moravia (n = 463)
Personal income (mean) $611 $664Income not reported 4% 6%
High education 14% 15%Age 42.9 42.6Male 49% 46%
Village residence 27% 27%South Moravia 11% 100%
Gardener 63% 67%Employment in agricultural sector 2% 2%
Farmers’ market 14% 6%Has heard of genebank 58% 60%
Adapting agriculture to climate change important 52% 53%
All interviews in which the respondent took less than the 48% median time for a given sub-samplewere excluded from the final sample as speeders (about 7% of the sample) to control for respondentswho answered questions too quickly without carefully reading them (see Table A1 in Appendix A),in total leaving 965 valid observations for the Czech representative sample and 463 for the SouthMoravian sample. In addition, we also defined samples where protestors were excluded (see Table A2in Appendix A). Protestors were defined as those who indicated that they were not willing to pay toconserve crop diversity in both the initial and follow-up contingent valuation question, and additionallyindicated in a following debriefing question that they did not trust the information provided; desiredto have more information to make their decisions; or wrote in the comments that they had made amistake in clicking the status quo. Excluding speeders, about 8.5% of the Czech representative sampleand about 9.3% of the S. Moravian sub-sample were defined as protestors.
3.2. Survey Instrument
The survey instrument was drafted in English, translated into Czech, and programmed intoan online format. The survey questionnaire included three other choice experiments (each withaccompanying explanatory text) in addition to the general crop diversity experiment that provided thedata for this paper. The structure of the survey instrument is outlined below:
• Questions to confirm the quota filling and screening questions• Questions about values and attitudes towards crop diversity• Introductory text about crop diversity and its importance• Choice tasks• Sociodemographic information and other attitudinal questions
Before the choice questions, we provided information about the concept of crop diversity andthe role of genebanks in conserving crop diversity. We also introduced the relevant public nationalprogram (see Appendix B for an English version of the text provided in Czech to survey respondentsbefore the start of the contingent valuation questions.). Knowing that any information provided mayaffect the decision-making of the respondents, we provided only basic, neutral and factual informationto describe the program. Such factual information is needed to allow the survey participants to makewell-informed decisions. Further, the provision of such basic, neutral and factual information is ofparticular importance for non-market goods such as crop diversity conversation, where respondentsmay not be familiar with what they are valuing. For example, Johnston et al. (2017) highlight the needfor a “balanced and effective presentation of information,” while McFadden and Train (2017) discuss anumber of stated preference studies that rely on the presentation of information and even suggest thatgreater familiarity can lead to respondents making more consistent and predictive choices, helpingto reduce hypothetical bias [22,23]. The exact wording was comprehensively pre-tested during thepre-survey in order to minimize potential information bias. Stated preference practitioners have even
Sustainability 2018, 10, 3997 6 of 19
gone so far as to hold a “valuation workshop” in the case of other unfamiliar goods (such as coldwatercorals), in which participants observed a 30-min Powerpoint presentation and had an opportunity toask questions [24]. An alternative to our approach would have been to use an information treatmentprovided to a sub-sample; however, given the many existing studies that have already investigatedthe question of the effect of providing information on respondent WTP [25–28], we opted to followthe standard practice of providing the same basic information set to all respondents, as guided byJohnston et al. (2017).
In addition, we asked respondents whether or not they had heard of genebanks before in order todetermine past familiarity with crop diversity conservation before the survey took place. About 57.5%of respondents (and 60.2% in the South Moravia region) had heard of genebanks. This analysis andquestion was used to determine how past familiarity with genebanks affected respondents’ WTP forthe crop diversity conservation program.
After this introductory text, respondents were then asked whether they would be willing tocontribute a certain amount of money to a public fund for the collection and conservation of a specificnumber of varieties of unspecified Czech crops for a 10-year period that had not been conservedelsewhere, and in a scenario where if the respondent does not contribute, the varieties run the risk ofbeing irretrievably lost. The potentially conserved crops included fruit trees, hops, wheat, grapevine,oilseed (e.g., canola and sunflower), legumes (e.g., lentils), potatoes, and the diversity of other cropsthat are currently stored by the Czech National Programme.
Two attributes were used in this experiment, which was analyzed using a double-boundeddichotomous choice model: The one-time paid cost with values of 50, 100, 200, 300, and 500 Kc(corresponding to about $2, $4, $8, $12.5, and $21), and the number of currently unconserved,“unspecified” crop varieties in the Czech Republic to be conserved for 10 years by the hypotheticalprogram, with the levels of 5, 10, 15, 25, and 35 varieties conserved. The bid values and the number ofvarieties were attributed to each respondent at random and independently.
Given that there were only two attributes included in this experiment, each with five levels(yielding 25 total combinations of cost and number of varieties conserved), it was possible to use a fullfactorial design. While the number of varieties remained the same in the second following discretechoice question, the bid was doubled or divided by two, depending on the preceding choice question.
3.3. Econometric Approach
We use the double-bounded dichotomous choice elicitation format, which first asks the respondentwhether he or she is willing to pay a given amount for the conservation of a given number ofunconserved crop varieties, and then asks a follow-up question with a higher bid (if the initial responsewas “yes”) or a lower bid (if the initial response was “no”). This approach falls under the generalcategory of binary choice models, which are designed to model the “choice” between two discretealternatives (pay or not pay for the option), and models the data as utility-maximizing responseswithin a random utility framework [29,30]. This approach has been shown to offer asymptoticallygreater statistical efficiency than the simpler single-bounded dichotomous choice method, as shownby Hanemann et al. (1991) [31]. This approach also has the advantage that it can be analyzed bothwith the double-bounded responses and by using the single-bounded dichotomous choice model (bysimply ignoring the answers to the second question).
The data from the experiment were analyzed using the maximum likelihood estimator associatedwith the double-bounded dichotomous choice approach. We can describe this estimator as follows(using the same framework as employed by Hanemann et al. (1991)).
In the double-bounded dichotomous choice (DBDC) approach, we start with a first bid Bi. If therespondent responds “yes” to this first bid, the second bid (Bi
u) is larger than the first bid (Bi < Biu).
If the respondent responds “no” to the first bid, however, the second bid (Bid) is some number lowerthan the first bid (Bid < Bi). The four outcomes of the DBDC experiment are thus “yes-yes,” “yes-no,”“no-yes,” and “no-no.” We can denote the probabilities of these outcomes as πyy, πyn, πny, and πnn,
Sustainability 2018, 10, 3997 7 of 19
respectively. Using these probabilities, and assuming that the respondents are utility-maximizing, wecan express the formulas for the likelihoods.
First, for πyy, the probability that the respondent responds “yes-yes:”
πyy (Bi, Biu) = Pr{Bi ≤max WTP and Bi
u ≤max WTP}, (1)
=Pr{Bi ≤max WTP|Biu ≤max WTP} Pr{Bi
u ≤max WTP}, (2)
=Pr{Biu ≤max WTP} = 1 − G(Bi
u; θ), (3)
this follows from the fact that if Bi < Biu, Pr{Bi ≤max WTP|Bi
u ≤max WTP} ≡ 1.In the case of “no-no,” we can similarly use the information that Bid < Bi to conclude that Pr{Bid≤
max WTP|Bi ≤max WTP} ≡ 1, and express the probability that the respondent responds “no-no” as:
πnn (Bi, Bid) = Pr{Bi > max WTP and Bid > max WTP} = G(Bid; θ), (4)
for “yes-no,” it holds true that Bi < Biu, giving us:
πyn (Bi, Biu) = Pr{Bi ≤max WTP ≤ Bi
u} = G(Biu; θ) − G(Bi; θ), (5)
and finally, for “no-yes,” it holds true that Bi < Biu, giving us:
πny (Bi, Bid) = Pr{Bi ≥max WTP ≥ Bid} = G(Bi; θ) − G(Bid; θ). (6)
The second bid in the last two examples (πnn and πny) allows the placement of an upper andlower bound on the respondent’s unobserved true WTP, while the second bid in the first two examples(πyy and πnn) allows us to improve the single bound by raising the lower bound or lowering theupper bound.
Given a sample of N respondents and bids of Bi, Biu, and Bid (used for the ith respondent), we
obtain the following log-likelihood function, with dyyi , dnn
i , dyni , and dny
i being binary-valued indicatorvariables equal to one for the positive response and to zero otherwise:
ln LD(θ) = ∑Ni=1{d
yyi lnπyy(Bi, Bu
i )+dnni lnπnn
(Bi, Bd
i
)+ dyn
i lnπyn(Bi, Bui ) + dny
i lnπny(
Bi, Bdi
)} (7)
The Maximum Likelihood estimator for the double-bounded model (θD) and the interval data isused to maximize the log-likelihood. In this case, the asymptotic variance-covariance matrix for θD isgiven by:
VD(θD) =
[−E
∂2lnLD(θD)
∂θ ∂θ′
]−1
≡ ID(θD)−1
. (8)
The data were analyzed with this model framework using SAS/STAT software.
4. Results
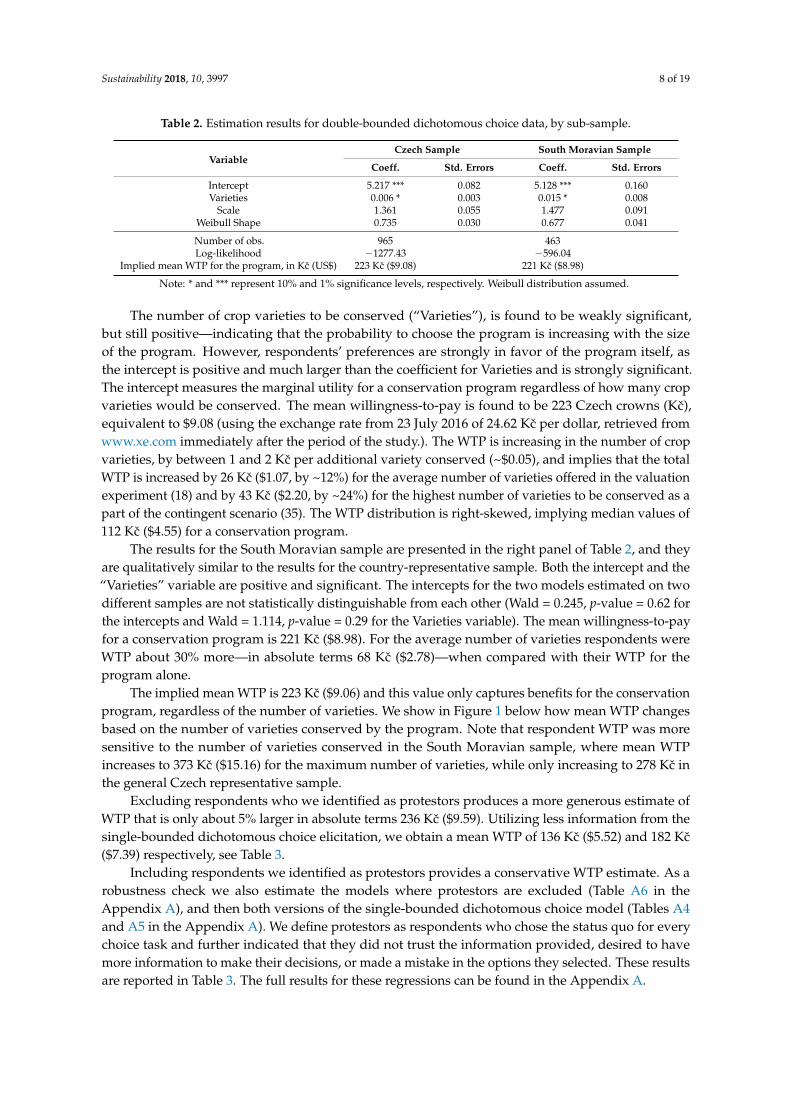
The primary objective of this work was to determine the value placed on the conservation ofCzech crop diversity by the Czech public. As the main result, we provide the regression results forthe double-bounded dichotomous choice analysis below for the Czech general population sample(excluding speeders) in Table 2 (left panel). We assume the disturbances follow the Weibull distribution,as it minimizes the information criteria and maximizes the log-likelihood for our data across allstandard distributional forms.
Sustainability 2018, 10, 3997 8 of 19
Table 2. Estimation results for double-bounded dichotomous choice data, by sub-sample.
VariableCzech Sample South Moravian Sample
Coeff. Std. Errors Coeff. Std. Errors
Intercept 5.217 *** 0.082 5.128 *** 0.160Varieties 0.006 * 0.003 0.015 * 0.008
Scale 1.361 0.055 1.477 0.091Weibull Shape 0.735 0.030 0.677 0.041
Number of obs.Log-likelihood
965−1277.43
463−596.04
Implied mean WTP for the program, in Kc (US$) 223 Kc ($9.08) 221 Kc ($8.98)
Note: * and *** represent 10% and 1% significance levels, respectively. Weibull distribution assumed.
The number of crop varieties to be conserved (“Varieties”), is found to be weakly significant,but still positive—indicating that the probability to choose the program is increasing with the sizeof the program. However, respondents’ preferences are strongly in favor of the program itself, asthe intercept is positive and much larger than the coefficient for Varieties and is strongly significant.The intercept measures the marginal utility for a conservation program regardless of how many cropvarieties would be conserved. The mean willingness-to-pay is found to be 223 Czech crowns (Kc),equivalent to $9.08 (using the exchange rate from 23 July 2016 of 24.62 Kc per dollar, retrieved fromwww.xe.com immediately after the period of the study.). The WTP is increasing in the number of cropvarieties, by between 1 and 2 Kc per additional variety conserved (~$0.05), and implies that the totalWTP is increased by 26 Kc ($1.07, by ~12%) for the average number of varieties offered in the valuationexperiment (18) and by 43 Kc ($2.20, by ~24%) for the highest number of varieties to be conserved as apart of the contingent scenario (35). The WTP distribution is right-skewed, implying median values of112 Kc ($4.55) for a conservation program.
The results for the South Moravian sample are presented in the right panel of Table 2, and theyare qualitatively similar to the results for the country-representative sample. Both the intercept and the“Varieties” variable are positive and significant. The intercepts for the two models estimated on twodifferent samples are not statistically distinguishable from each other (Wald = 0.245, p-value = 0.62 forthe intercepts and Wald = 1.114, p-value = 0.29 for the Varieties variable). The mean willingness-to-payfor a conservation program is 221 Kc ($8.98). For the average number of varieties respondents wereWTP about 30% more—in absolute terms 68 Kc ($2.78)—when compared with their WTP for theprogram alone.
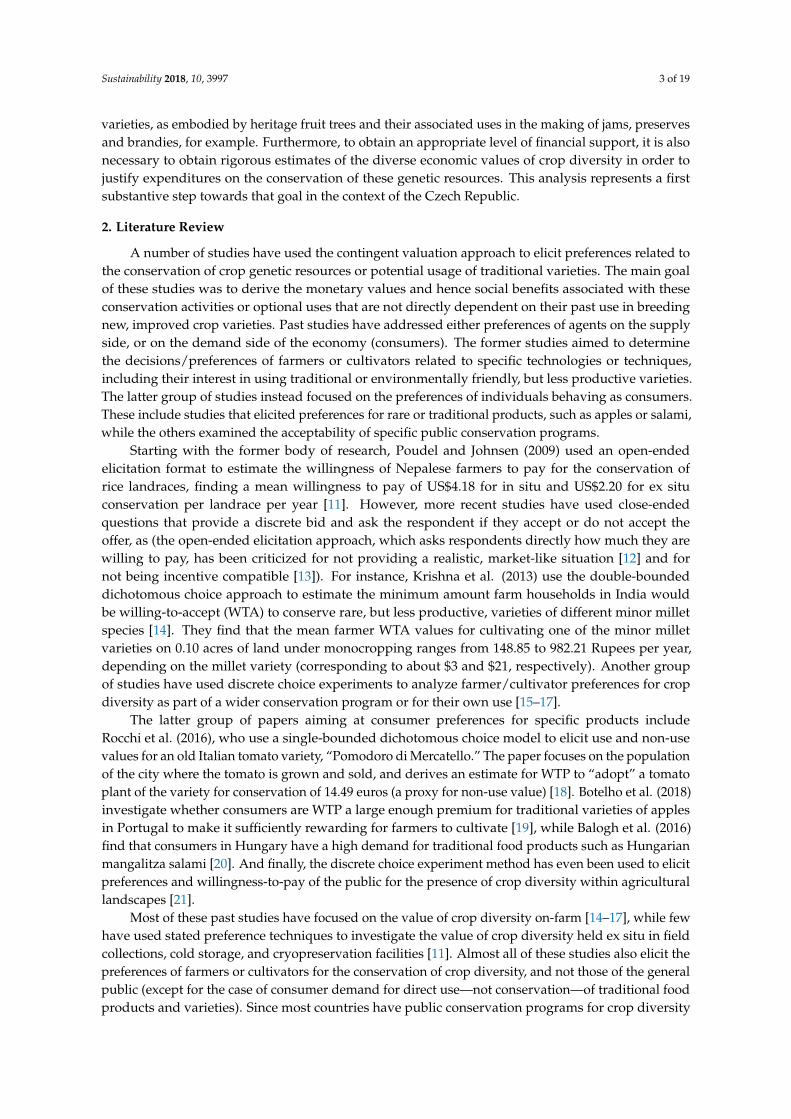
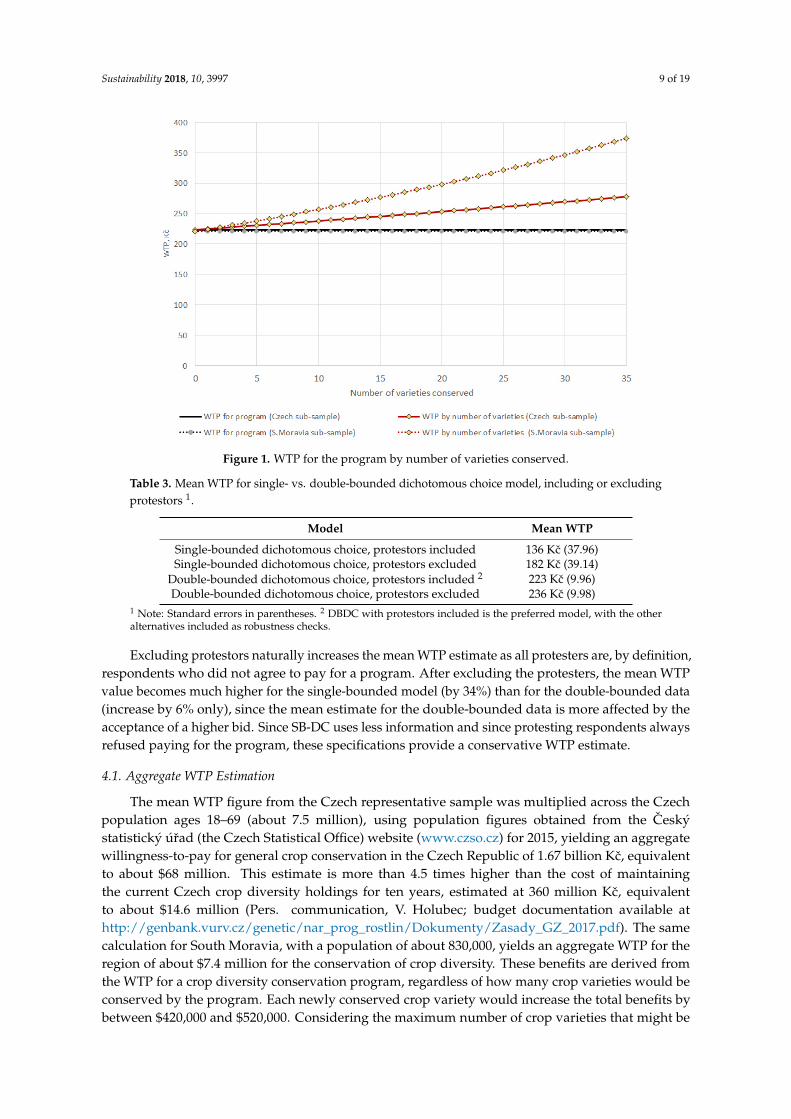
The implied mean WTP is 223 Kc ($9.06) and this value only captures benefits for the conservationprogram, regardless of the number of varieties. We show in Figure 1 below how mean WTP changesbased on the number of varieties conserved by the program. Note that respondent WTP was moresensitive to the number of varieties conserved in the South Moravian sample, where mean WTPincreases to 373 Kc ($15.16) for the maximum number of varieties, while only increasing to 278 Kc inthe general Czech representative sample.
Excluding respondents who we identified as protestors produces a more generous estimate ofWTP that is only about 5% larger in absolute terms 236 Kc ($9.59). Utilizing less information from thesingle-bounded dichotomous choice elicitation, we obtain a mean WTP of 136 Kc ($5.52) and 182 Kc($7.39) respectively, see Table 3.
Including respondents we identified as protestors provides a conservative WTP estimate. As arobustness check we also estimate the models where protestors are excluded (Table A6 in theAppendix A), and then both versions of the single-bounded dichotomous choice model (Tables A4and A5 in the Appendix A). We define protestors as respondents who chose the status quo for everychoice task and further indicated that they did not trust the information provided, desired to havemore information to make their decisions, or made a mistake in the options they selected. These resultsare reported in Table 3. The full results for these regressions can be found in the Appendix A.
Sustainability 2018, 10, 3997 9 of 19
Sustainability 2018, 10, x FOR PEER REVIEW 8 of 19
The number of crop varieties to be conserved (“Varieties”), is found to be weakly significant, but still positive—indicating that the probability to choose the program is increasing with the size of the program. However, respondents’ preferences are strongly in favor of the program itself, as the intercept is positive and much larger than the coefficient for Varieties and is strongly significant. The intercept measures the marginal utility for a conservation program regardless of how many crop varieties would be conserved. The mean willingness-to-pay is found to be 223 Czech crowns (Kč), equivalent to $9.08 (using the exchange rate from 23 July 2016 of 24.62 Kč per dollar, retrieved from www.xe.com immediately after the period of the study.). The WTP is increasing in the number of crop varieties, by between 1 and 2 Kč per additional variety conserved (~$0.05), and implies that the total WTP is increased by 26 Kč ($1.07, by ~12%) for the average number of varieties offered in the valuation experiment (18) and by 43 Kč ($2.20, by ~24%) for the highest number of varieties to be conserved as a part of the contingent scenario (35). The WTP distribution is right-skewed, implying median values of 112 Kč ($4.55) for a conservation program.
The results for the South Moravian sample are presented in the right panel of Table 2, and they are qualitatively similar to the results for the country-representative sample. Both the intercept and the “Varieties” variable are positive and significant. The intercepts for the two models estimated on two different samples are not statistically distinguishable from each other (Wald = 0.245, p-value = 0.62 for the intercepts and Wald = 1.114, p-value = 0.29 for the Varieties variable). The mean willingness-to-pay for a conservation program is 221 Kč ($8.98). For the average number of varieties respondents were WTP about 30% more—in absolute terms 68 Kč ($2.78)—when compared with their WTP for the program alone.
The implied mean WTP is 223 Kč ($9.06) and this value only captures benefits for the conservation program, regardless of the number of varieties. We show in Figure 1 below how mean WTP changes based on the number of varieties conserved by the program. Note that respondent WTP was more sensitive to the number of varieties conserved in the South Moravian sample, where mean WTP increases to 373 Kč ($15.16) for the maximum number of varieties, while only increasing to 278 Kč in the general Czech representative sample.
Figure 1. WTP for the program by number of varieties conserved.
Excluding respondents who we identified as protestors produces a more generous estimate of WTP that is only about 5% larger in absolute terms 236 Kč ($9.59). Utilizing less information from the single-bounded dichotomous choice elicitation, we obtain a mean WTP of 136 Kč ($5.52) and 182 Kč ($7.39) respectively, see Table 3.
Figure 1. WTP for the program by number of varieties conserved.
Table 3. Mean WTP for single- vs. double-bounded dichotomous choice model, including or excludingprotestors 1.
Model Mean WTP
Single-bounded dichotomous choice, protestors included 136 Kc (37.96)Single-bounded dichotomous choice, protestors excluded 182 Kc (39.14)
Double-bounded dichotomous choice, protestors included 2 223 Kc (9.96)Double-bounded dichotomous choice, protestors excluded 236 Kc (9.98)
1 Note: Standard errors in parentheses. 2 DBDC with protestors included is the preferred model, with the otheralternatives included as robustness checks.
Excluding protestors naturally increases the mean WTP estimate as all protesters are, by definition,respondents who did not agree to pay for a program. After excluding the protesters, the mean WTPvalue becomes much higher for the single-bounded model (by 34%) than for the double-bounded data(increase by 6% only), since the mean estimate for the double-bounded data is more affected by theacceptance of a higher bid. Since SB-DC uses less information and since protesting respondents alwaysrefused paying for the program, these specifications provide a conservative WTP estimate.
4.1. Aggregate WTP Estimation
The mean WTP figure from the Czech representative sample was multiplied across the Czechpopulation ages 18–69 (about 7.5 million), using population figures obtained from the Ceskýstatistický úrad (the Czech Statistical Office) website (www.czso.cz) for 2015, yielding an aggregatewillingness-to-pay for general crop conservation in the Czech Republic of 1.67 billion Kc, equivalentto about $68 million. This estimate is more than 4.5 times higher than the cost of maintainingthe current Czech crop diversity holdings for ten years, estimated at 360 million Kc, equivalentto about $14.6 million (Pers. communication, V. Holubec; budget documentation available athttp://genbank.vurv.cz/genetic/nar_prog_rostlin/Dokumenty/Zasady_GZ_2017.pdf). The samecalculation for South Moravia, with a population of about 830,000, yields an aggregate WTP for theregion of about $7.4 million for the conservation of crop diversity. These benefits are derived fromthe WTP for a crop diversity conservation program, regardless of how many crop varieties would beconserved by the program. Each newly conserved crop variety would increase the total benefits bybetween $420,000 and $520,000. Considering the maximum number of crop varieties that might be
Sustainability 2018, 10, 3997 10 of 19
newly conserved in our experiment (35), our estimate of the total welfare benefits would increase by$16.4 million to a total of $84 million.
4.2. Augmented Model
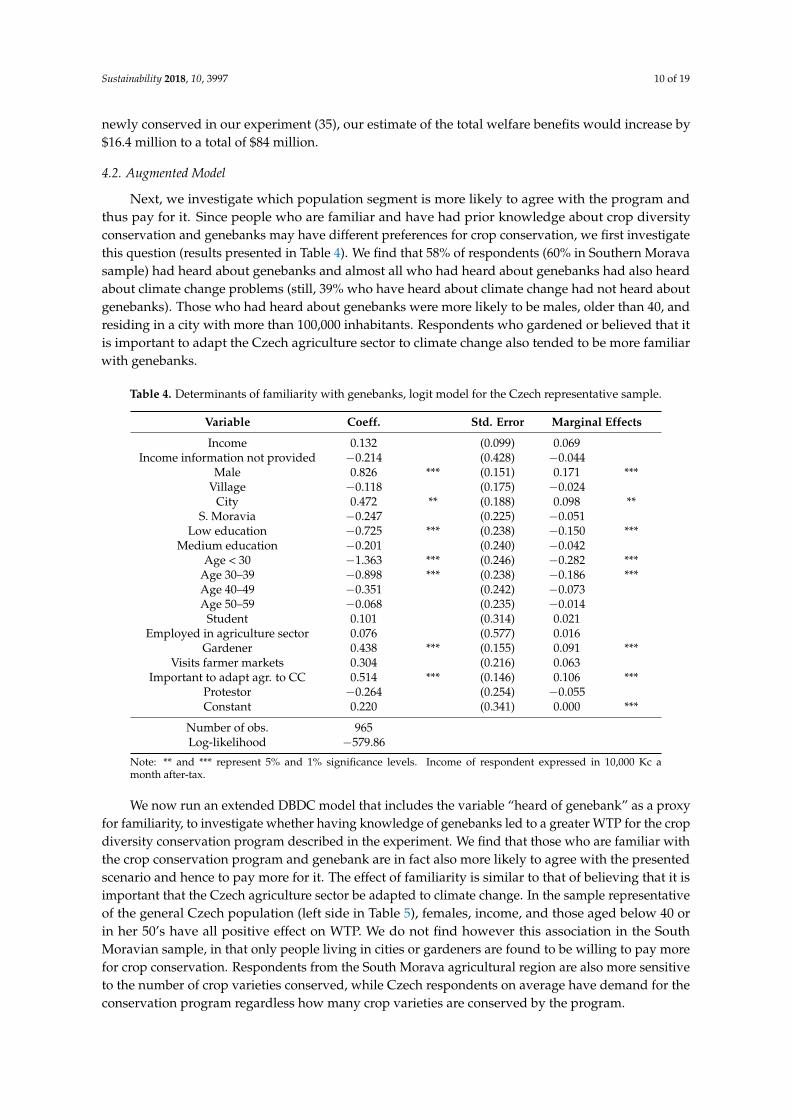
Next, we investigate which population segment is more likely to agree with the program andthus pay for it. Since people who are familiar and have had prior knowledge about crop diversityconservation and genebanks may have different preferences for crop conservation, we first investigatethis question (results presented in Table 4). We find that 58% of respondents (60% in Southern Moravasample) had heard about genebanks and almost all who had heard about genebanks had also heardabout climate change problems (still, 39% who have heard about climate change had not heard aboutgenebanks). Those who had heard about genebanks were more likely to be males, older than 40, andresiding in a city with more than 100,000 inhabitants. Respondents who gardened or believed that itis important to adapt the Czech agriculture sector to climate change also tended to be more familiarwith genebanks.
Table 4. Determinants of familiarity with genebanks, logit model for the Czech representative sample.
Variable Coeff. Std. Error Marginal Effects
Income 0.132 (0.099) 0.069Income information not provided −0.214 (0.428) −0.044
Male 0.826 *** (0.151) 0.171 ***Village −0.118 (0.175) −0.024
City 0.472 ** (0.188) 0.098 **S. Moravia −0.247 (0.225) −0.051
Low education −0.725 *** (0.238) −0.150 ***Medium education −0.201 (0.240) −0.042
Age < 30 −1.363 *** (0.246) −0.282 ***Age 30–39 −0.898 *** (0.238) −0.186 ***Age 40–49 −0.351 (0.242) −0.073Age 50–59 −0.068 (0.235) −0.014
Student 0.101 (0.314) 0.021Employed in agriculture sector 0.076 (0.577) 0.016
Gardener 0.438 *** (0.155) 0.091 ***Visits farmer markets 0.304 (0.216) 0.063
Important to adapt agr. to CC 0.514 *** (0.146) 0.106 ***Protestor −0.264 (0.254) −0.055Constant 0.220 (0.341) 0.000 ***
Number of obs. 965Log-likelihood −579.86
Note: ** and *** represent 5% and 1% significance levels. Income of respondent expressed in 10,000 Kc amonth after-tax.
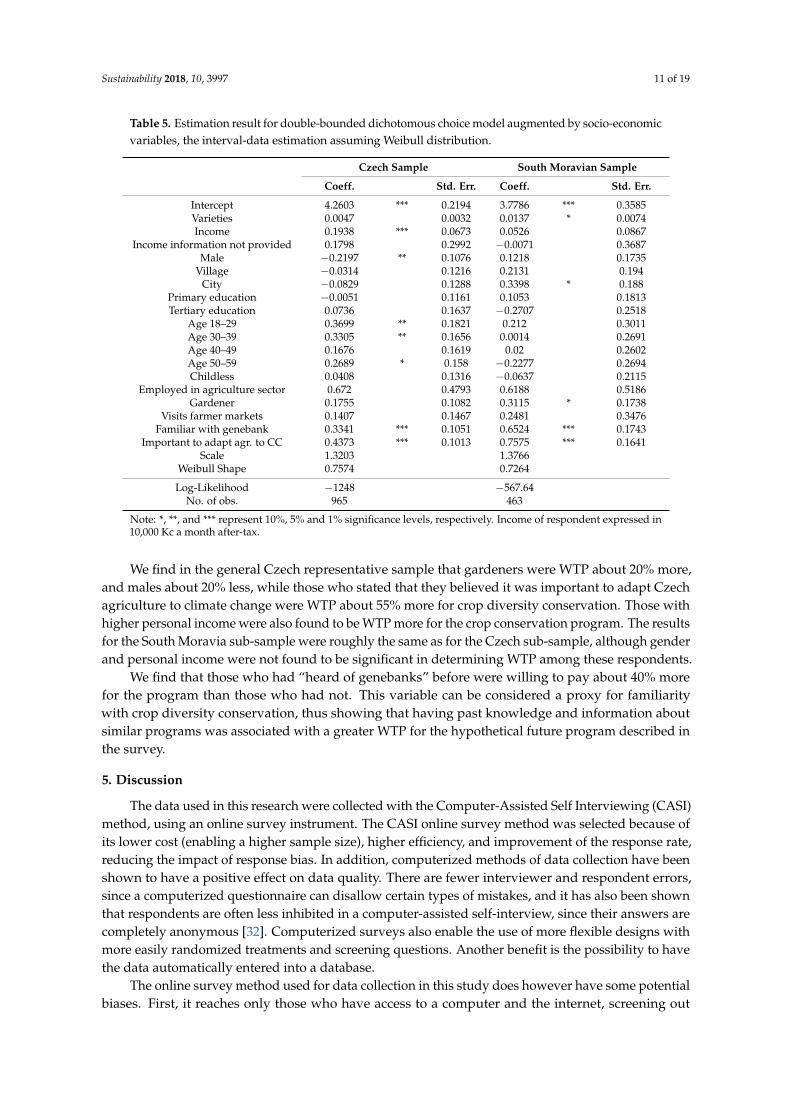
We now run an extended DBDC model that includes the variable “heard of genebank” as a proxyfor familiarity, to investigate whether having knowledge of genebanks led to a greater WTP for the cropdiversity conservation program described in the experiment. We find that those who are familiar withthe crop conservation program and genebank are in fact also more likely to agree with the presentedscenario and hence to pay more for it. The effect of familiarity is similar to that of believing that it isimportant that the Czech agriculture sector be adapted to climate change. In the sample representativeof the general Czech population (left side in Table 5), females, income, and those aged below 40 orin her 50’s have all positive effect on WTP. We do not find however this association in the SouthMoravian sample, in that only people living in cities or gardeners are found to be willing to pay morefor crop conservation. Respondents from the South Morava agricultural region are also more sensitiveto the number of crop varieties conserved, while Czech respondents on average have demand for theconservation program regardless how many crop varieties are conserved by the program.
Sustainability 2018, 10, 3997 11 of 19
Table 5. Estimation result for double-bounded dichotomous choice model augmented by socio-economicvariables, the interval-data estimation assuming Weibull distribution.
Czech Sample South Moravian Sample
Coeff. Std. Err. Coeff. Std. Err.
Intercept 4.2603 *** 0.2194 3.7786 *** 0.3585Varieties 0.0047 0.0032 0.0137 * 0.0074Income 0.1938 *** 0.0673 0.0526 0.0867
Income information not provided 0.1798 0.2992 −0.0071 0.3687Male −0.2197 ** 0.1076 0.1218 0.1735
Village −0.0314 0.1216 0.2131 0.194City −0.0829 0.1288 0.3398 * 0.188
Primary education −0.0051 0.1161 0.1053 0.1813Tertiary education 0.0736 0.1637 −0.2707 0.2518
Age 18–29 0.3699 ** 0.1821 0.212 0.3011Age 30–39 0.3305 ** 0.1656 0.0014 0.2691Age 40–49 0.1676 0.1619 0.02 0.2602Age 50–59 0.2689 * 0.158 −0.2277 0.2694Childless 0.0408 0.1316 −0.0637 0.2115
Employed in agriculture sector 0.672 0.4793 0.6188 0.5186Gardener 0.1755 0.1082 0.3115 * 0.1738
Visits farmer markets 0.1407 0.1467 0.2481 0.3476Familiar with genebank 0.3341 *** 0.1051 0.6524 *** 0.1743
Important to adapt agr. to CC 0.4373 *** 0.1013 0.7575 *** 0.1641Scale 1.3203 1.3766
Weibull Shape 0.7574 0.7264
Log-Likelihood −1248 −567.64No. of obs. 965 463
Note: *, **, and *** represent 10%, 5% and 1% significance levels, respectively. Income of respondent expressed in10,000 Kc a month after-tax.
We find in the general Czech representative sample that gardeners were WTP about 20% more,and males about 20% less, while those who stated that they believed it was important to adapt Czechagriculture to climate change were WTP about 55% more for crop diversity conservation. Those withhigher personal income were also found to be WTP more for the crop conservation program. The resultsfor the South Moravia sub-sample were roughly the same as for the Czech sub-sample, although genderand personal income were not found to be significant in determining WTP among these respondents.
We find that those who had “heard of genebanks” before were willing to pay about 40% morefor the program than those who had not. This variable can be considered a proxy for familiaritywith crop diversity conservation, thus showing that having past knowledge and information aboutsimilar programs was associated with a greater WTP for the hypothetical future program described inthe survey.
5. Discussion
The data used in this research were collected with the Computer-Assisted Self Interviewing (CASI)method, using an online survey instrument. The CASI online survey method was selected because ofits lower cost (enabling a higher sample size), higher efficiency, and improvement of the response rate,reducing the impact of response bias. In addition, computerized methods of data collection have beenshown to have a positive effect on data quality. There are fewer interviewer and respondent errors,since a computerized questionnaire can disallow certain types of mistakes, and it has also been shownthat respondents are often less inhibited in a computer-assisted self-interview, since their answers arecompletely anonymous [32]. Computerized surveys also enable the use of more flexible designs withmore easily randomized treatments and screening questions. Another benefit is the possibility to havethe data automatically entered into a database.
The online survey method used for data collection in this study does however have some potentialbiases. First, it reaches only those who have access to a computer and the internet, screening out
Sustainability 2018, 10, 3997 12 of 19
a group of potential respondents. This is not likely to have had a large biasing effect in the case ofthis study, however, as internet access has been rapidly increasing in the Czech Republic in recentyears, with more than 82% of households having internet access in 2016 [33]. Second, it also selectsfor individuals who elect to participate in the online survey panels used by the market research firmselected for this study. In spite of these potential biases, CASI was deemed to be the best approach fordata collection for this study.
Several other biases may have arisen from the use of stated preference methods, such as strategicbias, information bias, or hypothetical bias [34]. However, steps were taken to mitigate these potentialbiases. For example, information was provided to try to lessen the impact of information bias byeducating the respondents about crop diversity during the survey—although we did find that thosewho had heard of a genebank before were willing to pay significantly more than the portion of thesample that had not, and the results of stated preference studies are likely to be at least somewhatsensitive to how background information is presented to the respondents. Strategic bias may also haveaffected the results; however, a review of comments revealed that many of the respondents took thesurvey seriously and accounted for their budget constraint when making the decision. Last, whilehypothetical bias may have had an effect, most Czechs have at least some experience with the cropvarieties included in the survey, and thus are not likely to have been overly affected by this sourceof bias.
While stated preference methods have been criticized by some economists [35], a NOAA panelconvened by the U.S. government and co-chaired by Nobel Laureates Kenneth Arrow and RobertSolow concluded that the general approach is appropriate for estimating the value of environmentalgoods and services, and that “CVM studies can produce estimates reliable enough to be the startingpoint of a judicial or administrative determination of natural resource damages, including lostpassive values” [36,37], supporting the validity of the methodological approach taken in this study.More recently, Johnston et al. (2017) also affirm that stated preference methods may be used as thebasis for decision-making by governmental and nongovernmental organizations if best practices arefollowed [25].
5.1. The Impact on WTP of the Information Provided
The results of the double-bounded dichotomous choice regression with socio-economic variablesincluded in Table 5 show that those more familiar with crop diversity conservation (i.e., had heard ofgenebanks) were willing to pay about 40% more for a hypothetical conservation program, indicatingthat the provision of information (having the result of increasing familiarity with the program) mayhave had the effect of biasing WTP upwards. This finding has been echoed in other similar researchthat has found that those who are more aware of the good/service to be valued are more likely to havea higher WTP [38]. On the other hand, other research on WTP for climate change has found no impactof providing additional information [39].
The higher WTP of these individuals (who had previous knowledge of genebanks) may have alsobeen a result of other correlated factors, however, given that the heterogeneity in the general Czechpopulation in terms of willingness-to-pay for additional conservation of crop varieties had more to dowith specialized knowledge, beliefs and habits (whether or not the respondents thought adaptation inthe agriculture sector was important, or gardened, for example) than general socioeconomic variables.We provide a logit analysis of the determinants of familiarity with genebanks in Table 4, and find thatrespondents that were gardeners, male, older, from cities, and more highly educated (among otherfactors) were more likely to have heard of genebanks.
It is important to highlight as well that providing basic information that is both neutral andfactual is considered standard practice in stated preference research. In addition, the objective ofthis analysis was to determine how much the public would be WTP for the conservation of cropdiversity conditional upon respondents possessing some basic information about such a programand its importance. The policymaker would like to know the preferences of a minimally informed
Sustainability 2018, 10, 3997 13 of 19
public, not those of an ignorant one. Furthermore, basic information about crop diversity and itsconservation similar to that included in the survey could be easily provided to the Czech public throughan informational program sponsored by the government at very low cost, raising the population’sawareness of the issue to the level of the surveyed population.
Furthermore, it is important to note that unfamiliarity with the good or service to be valued canalso bias the results of an analysis, as shown by Lusk and Norwood (2009), who find that respondentsunderstated their preferences for relatively unfamiliar goods when compared to their actual behaviorin the field [40]. Thus, even providing no contextual information can have a biasing effect. One way toaddress this tradeoff is the so-called “inferred valuation” approach, as Lusk and Norwood suggest [41].Another would be to utilise a split-sample design to investigate whether the provision of basicinformation about the value of crop diversity increased respondent WTP when compared withrespondents who were provided with no context. Both of these approaches represent interestingavenues for further research.
5.2. Policy Implications
The main finding of this research is that Czechs, if provided with basic information about cropdiversity and its importance, would be willing to pay in aggregate about $68 million dollars for generalcrop conservation over the next 10 years—about 4.5 times more than the current conservation costs ofthe Czech genebank system. We use the mean WTP figures for general crop conservation resultingfrom the double-bounded dichotomous choice model analysis as our primary result because this modelhas been shown to use more information and be more statistically efficient than the single-boundedapproach (Hanemann et al., 1991). In addition, we include protestors in order to provide a moreconservative estimate.
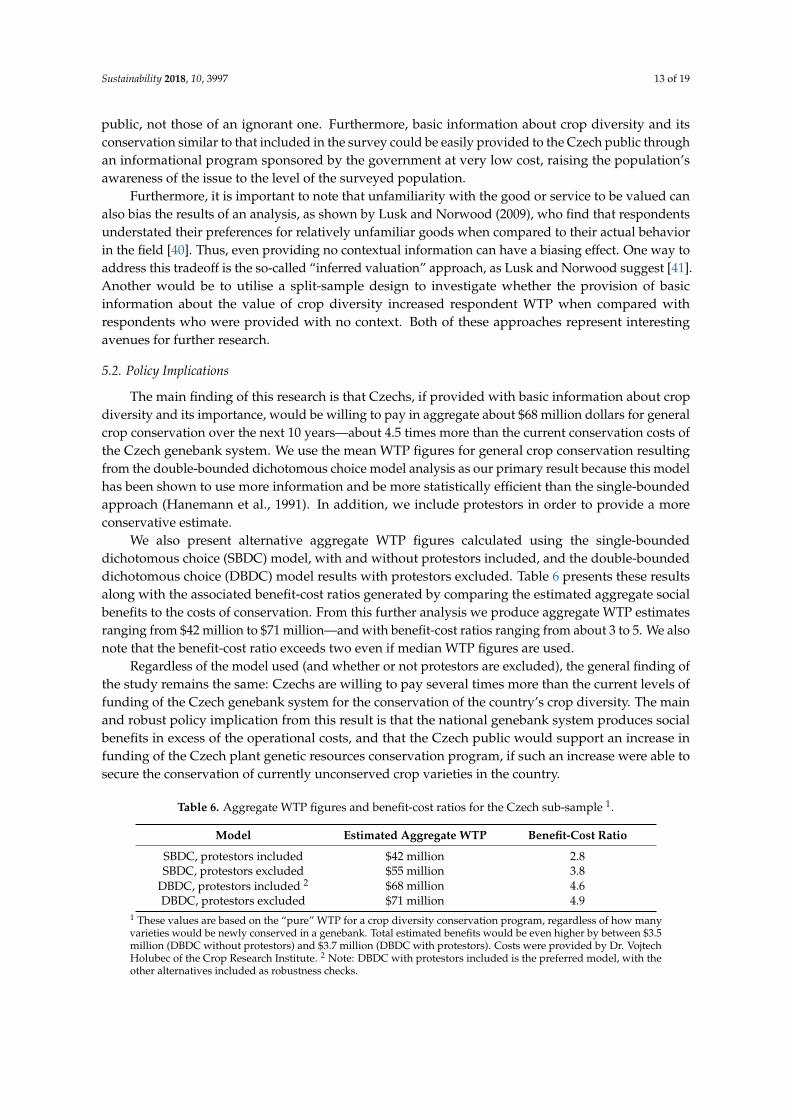
We also present alternative aggregate WTP figures calculated using the single-boundeddichotomous choice (SBDC) model, with and without protestors included, and the double-boundeddichotomous choice (DBDC) model results with protestors excluded. Table 6 presents these resultsalong with the associated benefit-cost ratios generated by comparing the estimated aggregate socialbenefits to the costs of conservation. From this further analysis we produce aggregate WTP estimatesranging from $42 million to $71 million—and with benefit-cost ratios ranging from about 3 to 5. We alsonote that the benefit-cost ratio exceeds two even if median WTP figures are used.
Regardless of the model used (and whether or not protestors are excluded), the general finding ofthe study remains the same: Czechs are willing to pay several times more than the current levels offunding of the Czech genebank system for the conservation of the country’s crop diversity. The mainand robust policy implication from this result is that the national genebank system produces socialbenefits in excess of the operational costs, and that the Czech public would support an increase infunding of the Czech plant genetic resources conservation program, if such an increase were able tosecure the conservation of currently unconserved crop varieties in the country.
Table 6. Aggregate WTP figures and benefit-cost ratios for the Czech sub-sample 1.
Model Estimated Aggregate WTP Benefit-Cost Ratio
SBDC, protestors included $42 million 2.8SBDC, protestors excluded $55 million 3.8
DBDC, protestors included 2 $68 million 4.6DBDC, protestors excluded $71 million 4.9
1 These values are based on the “pure” WTP for a crop diversity conservation program, regardless of how manyvarieties would be newly conserved in a genebank. Total estimated benefits would be even higher by between $3.5million (DBDC without protestors) and $3.7 million (DBDC with protestors). Costs were provided by Dr. VojtechHolubec of the Crop Research Institute. 2 Note: DBDC with protestors included is the preferred model, with theother alternatives included as robustness checks.
Sustainability 2018, 10, 3997 14 of 19
6. Conclusions
By taking a systems approach to valuation (and focusing on the Czech public), this experimentprovides a broader welfare measure of the value of crop diversity conservation in the Czech Republicthan an approach focused strictly on farmers or plant breeders. It also captures the non-use valuesassociated with genetic resources, such as insurance and option values, existence value, and bequestvalue. On average, Czechs were willing to pay $9 to collect and conserve additional crop diversityover a ten-year period, corresponding to an aggregate WTP in the Czech Republic of at least $68million—about 4.5 times more than the costs of running the entire Czech genebank system for tenyears. This result indicates that Czechs (if provided with basic information about crop diversity and itsbenefits) would be willing to pay more to expand the country’s crop diversity conservation programthrough the collection and conservation of additional crop varieties, and highlights the social valueof the Czech Republic’s agricultural heritage, a resource important for future efforts to adapt thecountry’s agricultural sector to climate change.
It must be noted that the public value for a crop diversity conservation program estimated in thisanalysis does not represent the preferences of the Czech public per se, but rather a representative sub-setof the Czech population after being exposed to a short and factual set of information regarding cropdiversity conservation and its benefits. (Information—as provided in our contingent scenario—couldrelatively easily be provided to the public through an informational campaign run by the governmentor an NGO). This information—which could relatively easily be provided to the public through aninformational campaign run by the government or an NGO—was included in our study because someparticipants were not familiar with ongoing public agrobiodiversity conservation efforts in the CzechRepublic, to provide context, and to limit the impacts of unfamiliarity on the surveyed population.However, an interesting question for future research would be to identify the impacts of providing suchinformation on respondents’ WTP, through a split-sample design where only a sub-set of respondentsare provided with background information and the others are not provided with any information orcontext. A further approach that could be used to reduce this source of bias is the “inferred valuation”approach of Lusk and Norwood (2009) [41].
This straightforward and relatively simple approach to estimating the social value of geneticresources could be used in other countries as well to determine how well the current investmentsinto the collection and conservation of crop diversity match the willingness of the public to payfor them. This information could be particularly useful in some European countries like Hungary,where uncollected crop varieties are likely still present in diverse home gardens [15], or in developingcountries in Africa, Asia and Latin America. In such cases, applying a systems thinking approachto estimating the social benefits associated with crop diversity conservation as derived here from astated preference study may be compared with the current conservation costs of the given country’sgenebank system to determine if the public would support such a program and be willing to pay forthe collection and conservation of additional crop varieties. If such public support exists, the socialplanner could use this as justification for directing further resources towards the national crop diversityconservation program budget.
Author Contributions: Conceptualization, N.T. and M.S.; Methodology, N.T. and M.S.; Software, M.S.; Validation,N.T. and M.S.; Formal Analysis, N.T. and M.S.; Investigation, N.T. and M.S.; Resources, M.S.; Data Curation, M.S.;Writing—Original Draft Preparation, N.T.; Writing—Review & Editing, N.T. and M.S.; Supervision, M.S.; ProjectAdministration, M.S.; Funding Acquisition, N.T. and M.S.
Funding: The Charles University Grant Agency (GA UK) no. 796216 (N.T.), Charles University’s PRIMUS/17/HUM/16 (N.T. data analysis), Czech Science Foundation (GACR) no. GA15-23815S (M.S.), and the EuropeanUnion Horizon 2020 H2020-MSCA-RISE mobility project GEMCLIME-2020 under GA no 681228 (the secondmentof M.S.).
Acknowledgments: The financial support provided (and listed above) is gratefully acknowledged. We wouldalso like to thank those who helped with testing the survey instrument and with translation into the Czechlanguage, as well as Vojtech Holubec and Ludmila Papoušková from the Crop Research Institute in Prague fortheir assistance with the research. Responsibility for any errors remains with the authors.
Sustainability 2018, 10, 3997 15 of 19
Conflicts of Interest: The authors declare no conflict of interest.
Appendix A. Additional Tables
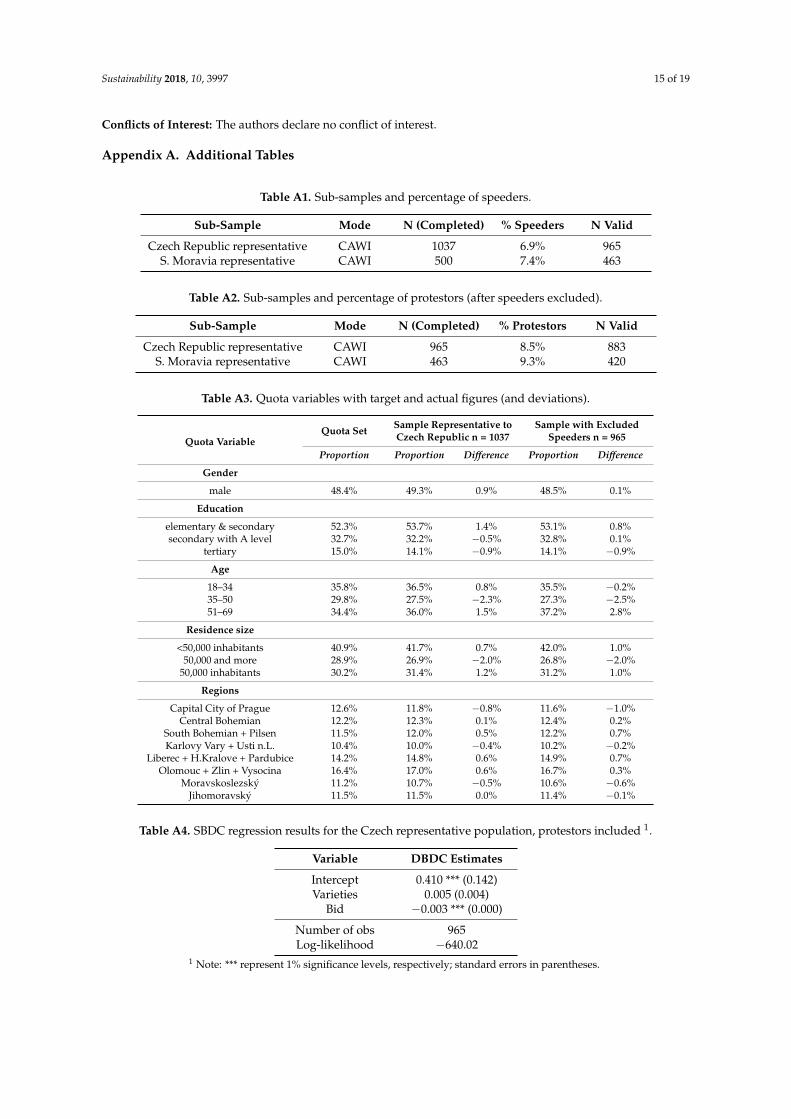
Table A1. Sub-samples and percentage of speeders.
Sub-Sample Mode N (Completed) % Speeders N Valid
Czech Republic representative CAWI 1037 6.9% 965S. Moravia representative CAWI 500 7.4% 463
Table A2. Sub-samples and percentage of protestors (after speeders excluded).
Sub-Sample Mode N (Completed) % Protestors N Valid
Czech Republic representative CAWI 965 8.5% 883S. Moravia representative CAWI 463 9.3% 420
Table A3. Quota variables with target and actual figures (and deviations).
Quota VariableQuota Set Sample Representative to
Czech Republic n = 1037Sample with Excluded
Speeders n = 965
Proportion Proportion Difference Proportion Difference
Gender
male 48.4% 49.3% 0.9% 48.5% 0.1%
Education
elementary & secondary 52.3% 53.7% 1.4% 53.1% 0.8%secondary with A level 32.7% 32.2% −0.5% 32.8% 0.1%
tertiary 15.0% 14.1% −0.9% 14.1% −0.9%
Age
18–34 35.8% 36.5% 0.8% 35.5% −0.2%35–50 29.8% 27.5% −2.3% 27.3% −2.5%51–69 34.4% 36.0% 1.5% 37.2% 2.8%
Residence size
<50,000 inhabitants 40.9% 41.7% 0.7% 42.0% 1.0%50,000 and more 28.9% 26.9% −2.0% 26.8% −2.0%
50,000 inhabitants 30.2% 31.4% 1.2% 31.2% 1.0%
Regions
Capital City of Prague 12.6% 11.8% −0.8% 11.6% −1.0%Central Bohemian 12.2% 12.3% 0.1% 12.4% 0.2%
South Bohemian + Pilsen 11.5% 12.0% 0.5% 12.2% 0.7%Karlovy Vary + Usti n.L. 10.4% 10.0% −0.4% 10.2% −0.2%
Liberec + H.Kralove + Pardubice 14.2% 14.8% 0.6% 14.9% 0.7%Olomouc + Zlin + Vysocina 16.4% 17.0% 0.6% 16.7% 0.3%
Moravskoslezský 11.2% 10.7% −0.5% 10.6% −0.6%Jihomoravský 11.5% 11.5% 0.0% 11.4% −0.1%
Table A4. SBDC regression results for the Czech representative population, protestors included 1.
Variable DBDC Estimates
Intercept 0.410 *** (0.142)Varieties 0.005 (0.004)
Bid −0.003 *** (0.000)
Number of obs 965Log-likelihood −640.02
1 Note: *** represent 1% significance levels, respectively; standard errors in parentheses.
Sustainability 2018, 10, 3997 16 of 19
Table A5. SBDC regression results for the Czech representative population, protestors excluded 1.
Variable DBDC Estimates
Intercept 0.532 *** (0.150)Varieties 0.006 (0.005)
Bid −0.003 *** (0.000)
Number of obs 883Log-likelihood −598.07
1 Note: *** represent 1% significance levels, respectively; standard errors in parentheses.
Table A6. DBDC regression results for the Czech representative population, protestors excluded 1.
Variable DBDC Estimates
Intercept 5.334 *** (0.080)Varieties 0.007 ** (0.003)
Scale 1.256 (0.050)Weibull Shape 0.796 (0.032)
Number of obs. 883Log-likelihood −1224.09
1 Note: ** and *** represent 5% and 1% significance levels, respectively; standard errors in parentheses.
Appendix B. Introductory Text on the Value of Crop Diversity
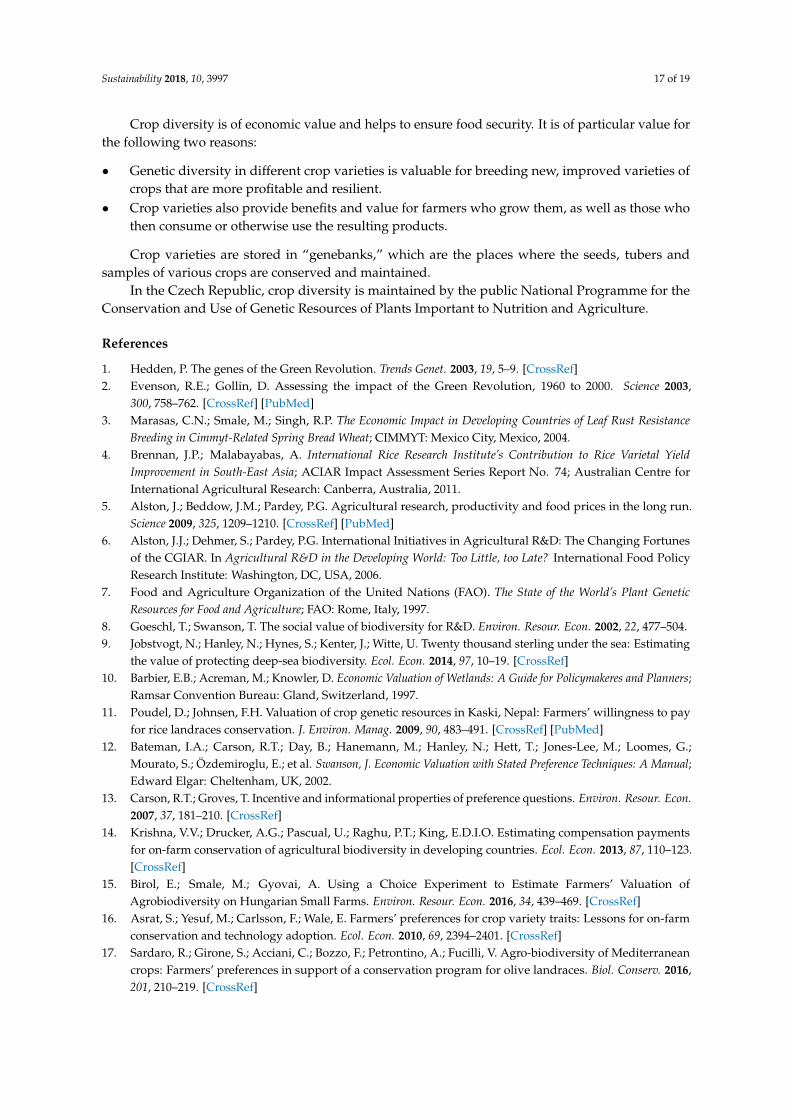
What is the meaning of crop diversity and why is it important?The concept of crop diversity can be easily explained by the fact that a given crop is not uniform,
but is made up of many different varieties that vary significantly and may have unique characteristics.For example, the image below shows one bean variety (source: Global Crop Diversity Trust Flickr).
Sustainability 2018, 10, x FOR PEER REVIEW 16 of 19
Table A4. SBDC regression results for the Czech representative population, protestors included 1.
Variable DBDC Estimates Intercept 0.410 *** (0.142) Varieties 0.005 (0.004)
Bid −0.003 *** (0.000) Number of obs 965 Log-likelihood −640.02
1 Note: *** represent 1% significance levels, respectively; standard errors in parentheses.
Table A5. SBDC regression results for the Czech representative population, protestors excluded 1.
Variable DBDC Estimates Intercept 0.532 *** (0.150) Varieties 0.006 (0.005)
Bid −0.003 *** (0.000) Number of obs 883 Log-likelihood −598.07
1 Note: *** represent 1% significance levels, respectively; standard errors in parentheses.
Table A6. DBDC regression results for the Czech representative population, protestors excluded 1.
Variable DBDC Estimates Intercept 5.334 *** (0.080) Varieties 0.007 ** (0.003)
Scale 1.256 (0.050) Weibull Shape 0.796 (0.032) Number of obs. 883 Log-likelihood −1224.09
1 Note: ** and *** represent 5% and 1% significance levels, respectively; standard errors in parentheses.
Appendix B. Introductory Text on the Value of Crop Diversity
What is the meaning of crop diversity and why is it important? The concept of crop diversity can be easily explained by the fact that a given crop is not
uniform, but is made up of many different varieties that vary significantly and may have unique characteristics.
For example, the image below shows one bean variety (source: Global Crop Diversity Trust Flickr).
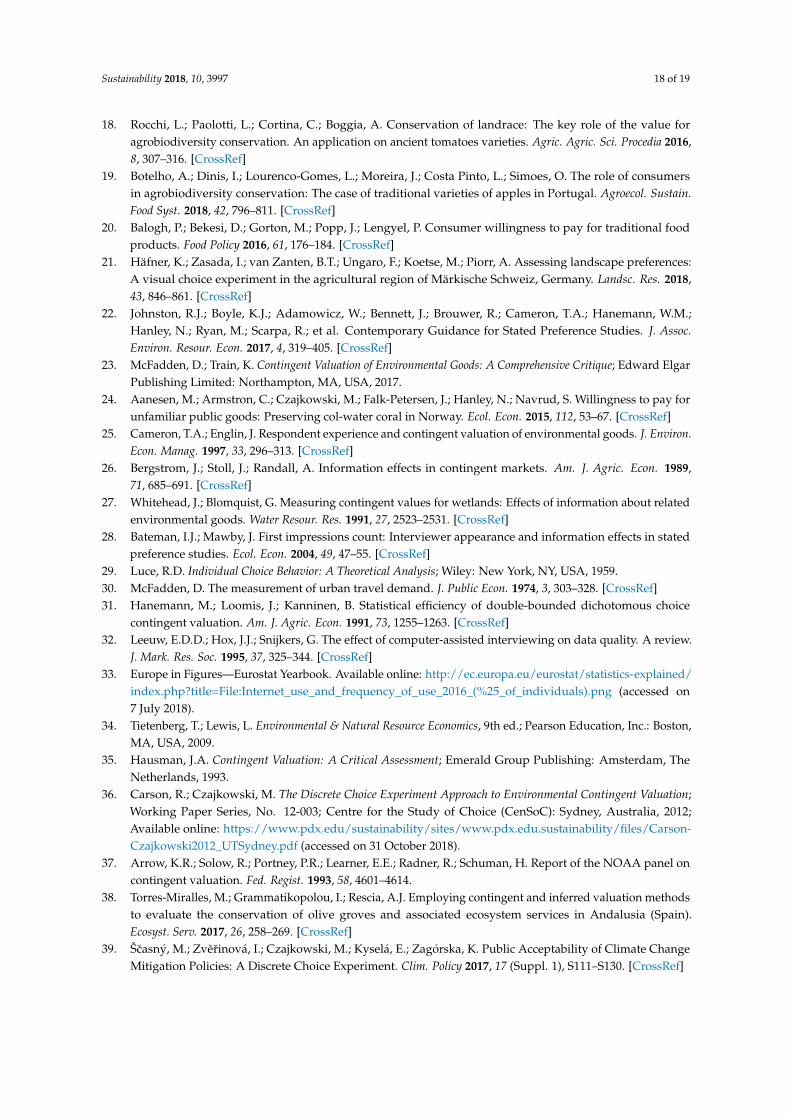
In contrast, the following picture shows many different varieties of beans. In contrast, the following picture shows many different varieties of beans.Sustainability 2018, 10, x FOR PEER REVIEW 17 of 19
Crop diversity is of economic value and helps to ensure food security. It is of particular value for the following two reasons:
• Genetic diversity in different crop varieties is valuable for breeding new, improved varieties of crops that are more profitable and resilient.
• Crop varieties also provide benefits and value for farmers who grow them, as well as those who then consume or otherwise use the resulting products.
Crop varieties are stored in “genebanks,” which are the places where the seeds, tubers and samples of various crops are conserved and maintained.
In the Czech Republic, crop diversity is maintained by the public National Programme for the Conservation and Use of Genetic Resources of Plants Important to Nutrition and Agriculture.
References
1. Hedden, P. The genes of the Green Revolution. Trends Genet. 2003, 19, 5–9. 2. Evenson, R.E.; Gollin, D. Assessing the impact of the Green Revolution, 1960 to 2000. Science 2003, 300,
758–762. 3. Marasas, C.N.; Smale, M.; Singh, R.P. The Economic Impact in Developing Countries of Leaf Rust Resistance
Breeding in Cimmyt-Related Spring Bread Wheat; CIMMYT: Mexico City, Mexico, 2004. 4. Brennan, J.P.; Malabayabas, A. International Rice Research Institute’s Contribution to Rice Varietal Yield
Improvement in South-East Asia; ACIAR Impact Assessment Series Report No. 74; Australian Centre for International Agricultural Research: Canberra, Australia, 2011.
5. Alston, J.; Beddow, J.M.; Pardey, P.G. Agricultural research, productivity and food prices in the long run. Science 2009, 325, 1209–1210.
6. Alston, J.J.; Dehmer, S.; Pardey, P.G. International Initiatives in Agricultural R&D: The Changing Fortunes of the CGIAR. In Agricultural R&D in the Developing World: Too Little, too Late? International Food Policy Research Institute: Washington, DC, USA, 2006.
7. Food and Agriculture Organization of the United Nations (FAO). The State of the World’s Plant Genetic Resources for Food and Agriculture; FAO: Rome, Italy, 1997.
8. Goeschl, T.; Swanson, T. The social value of biodiversity for R&D. Environ. Resour. Econ. 2002, 22, 477–504. 9. Jobstvogt, N.; Hanley, N. Hynes, S. Kenter, J.; Witte, U. Twenty thousand sterling under the sea:
Estimating the value of protecting deep-sea biodiversity. Ecol. Econ. 2014, 97, 10–19. 10. Barbier, E.B.; Acreman, M.; Knowler, D. Economic Valuation of Wetlands: A Guide for Policymakeres and
Planners; Ramsar Convention Bureau: Gland, Switzerland, 1997. 11. Poudel, D.; Johnsen, F.H. Valuation of crop genetic resources in Kaski, Nepal: Farmers’ willingness to pay
for rice landraces conservation. J. Environ. Manag. 2009, 90, 483–491. 12. Bateman, I.A.; Carson, R.T.; Day, B.; Hanemann, M.; Hanley, N.; Hett, T.; Jones-Lee, M.; Loomes, G.;
Mourato, S.; Özdemiroglu, E.; et al. Swanson, J. Economic Valuation with Stated Preference Techniques: A Manual; Edward Elgar: Cheltenham, UK, 2002.
13. Carson, R.T.; Groves, T. Incentive and informational properties of preference questions. Environ. Resour. Econ. 2007, 37, 181–210.
14. Krishna, V.V.; Drucker, A.G.; Pascual, U.; Raghu, P.T.; King, E.D.I.O. Estimating compensation payments for on-farm conservation of agricultural biodiversity in developing countries. Ecol. Econ. 2013, 87, 110–123.
Sustainability 2018, 10, 3997 17 of 19
Crop diversity is of economic value and helps to ensure food security. It is of particular value forthe following two reasons:
• Genetic diversity in different crop varieties is valuable for breeding new, improved varieties ofcrops that are more profitable and resilient.
• Crop varieties also provide benefits and value for farmers who grow them, as well as those whothen consume or otherwise use the resulting products.
Crop varieties are stored in “genebanks,” which are the places where the seeds, tubers andsamples of various crops are conserved and maintained.
In the Czech Republic, crop diversity is maintained by the public National Programme for theConservation and Use of Genetic Resources of Plants Important to Nutrition and Agriculture.
References
1. Hedden, P. The genes of the Green Revolution. Trends Genet. 2003, 19, 5–9. [CrossRef]2. Evenson, R.E.; Gollin, D. Assessing the impact of the Green Revolution, 1960 to 2000. Science 2003,
300, 758–762. [CrossRef] [PubMed]3. Marasas, C.N.; Smale, M.; Singh, R.P. The Economic Impact in Developing Countries of Leaf Rust Resistance
Breeding in Cimmyt-Related Spring Bread Wheat; CIMMYT: Mexico City, Mexico, 2004.4. Brennan, J.P.; Malabayabas, A. International Rice Research Institute’s Contribution to Rice Varietal Yield
Improvement in South-East Asia; ACIAR Impact Assessment Series Report No. 74; Australian Centre forInternational Agricultural Research: Canberra, Australia, 2011.
5. Alston, J.; Beddow, J.M.; Pardey, P.G. Agricultural research, productivity and food prices in the long run.Science 2009, 325, 1209–1210. [CrossRef] [PubMed]
6. Alston, J.J.; Dehmer, S.; Pardey, P.G. International Initiatives in Agricultural R&D: The Changing Fortunesof the CGIAR. In Agricultural R&D in the Developing World: Too Little, too Late? International Food PolicyResearch Institute: Washington, DC, USA, 2006.
7. Food and Agriculture Organization of the United Nations (FAO). The State of the World’s Plant GeneticResources for Food and Agriculture; FAO: Rome, Italy, 1997.
8. Goeschl, T.; Swanson, T. The social value of biodiversity for R&D. Environ. Resour. Econ. 2002, 22, 477–504.9. Jobstvogt, N.; Hanley, N.; Hynes, S.; Kenter, J.; Witte, U. Twenty thousand sterling under the sea: Estimating
the value of protecting deep-sea biodiversity. Ecol. Econ. 2014, 97, 10–19. [CrossRef]10. Barbier, E.B.; Acreman, M.; Knowler, D. Economic Valuation of Wetlands: A Guide for Policymakeres and Planners;
Ramsar Convention Bureau: Gland, Switzerland, 1997.11. Poudel, D.; Johnsen, F.H. Valuation of crop genetic resources in Kaski, Nepal: Farmers’ willingness to pay
for rice landraces conservation. J. Environ. Manag. 2009, 90, 483–491. [CrossRef] [PubMed]12. Bateman, I.A.; Carson, R.T.; Day, B.; Hanemann, M.; Hanley, N.; Hett, T.; Jones-Lee, M.; Loomes, G.;
Mourato, S.; Özdemiroglu, E.; et al. Swanson, J. Economic Valuation with Stated Preference Techniques: A Manual;Edward Elgar: Cheltenham, UK, 2002.
13. Carson, R.T.; Groves, T. Incentive and informational properties of preference questions. Environ. Resour. Econ.2007, 37, 181–210. [CrossRef]
14. Krishna, V.V.; Drucker, A.G.; Pascual, U.; Raghu, P.T.; King, E.D.I.O. Estimating compensation paymentsfor on-farm conservation of agricultural biodiversity in developing countries. Ecol. Econ. 2013, 87, 110–123.[CrossRef]
15. Birol, E.; Smale, M.; Gyovai, A. Using a Choice Experiment to Estimate Farmers’ Valuation ofAgrobiodiversity on Hungarian Small Farms. Environ. Resour. Econ. 2016, 34, 439–469. [CrossRef]
16. Asrat, S.; Yesuf, M.; Carlsson, F.; Wale, E. Farmers’ preferences for crop variety traits: Lessons for on-farmconservation and technology adoption. Ecol. Econ. 2010, 69, 2394–2401. [CrossRef]
17. Sardaro, R.; Girone, S.; Acciani, C.; Bozzo, F.; Petrontino, A.; Fucilli, V. Agro-biodiversity of Mediterraneancrops: Farmers’ preferences in support of a conservation program for olive landraces. Biol. Conserv. 2016,201, 210–219. [CrossRef]
Sustainability 2018, 10, 3997 18 of 19
18. Rocchi, L.; Paolotti, L.; Cortina, C.; Boggia, A. Conservation of landrace: The key role of the value foragrobiodiversity conservation. An application on ancient tomatoes varieties. Agric. Agric. Sci. Procedia 2016,8, 307–316. [CrossRef]
19. Botelho, A.; Dinis, I.; Lourenco-Gomes, L.; Moreira, J.; Costa Pinto, L.; Simoes, O. The role of consumersin agrobiodiversity conservation: The case of traditional varieties of apples in Portugal. Agroecol. Sustain.Food Syst. 2018, 42, 796–811. [CrossRef]
20. Balogh, P.; Bekesi, D.; Gorton, M.; Popp, J.; Lengyel, P. Consumer willingness to pay for traditional foodproducts. Food Policy 2016, 61, 176–184. [CrossRef]
21. Häfner, K.; Zasada, I.; van Zanten, B.T.; Ungaro, F.; Koetse, M.; Piorr, A. Assessing landscape preferences:A visual choice experiment in the agricultural region of Märkische Schweiz, Germany. Landsc. Res. 2018,43, 846–861. [CrossRef]
22. Johnston, R.J.; Boyle, K.J.; Adamowicz, W.; Bennett, J.; Brouwer, R.; Cameron, T.A.; Hanemann, W.M.;Hanley, N.; Ryan, M.; Scarpa, R.; et al. Contemporary Guidance for Stated Preference Studies. J. Assoc.Environ. Resour. Econ. 2017, 4, 319–405. [CrossRef]
23. McFadden, D.; Train, K. Contingent Valuation of Environmental Goods: A Comprehensive Critique; Edward ElgarPublishing Limited: Northampton, MA, USA, 2017.
24. Aanesen, M.; Armstron, C.; Czajkowski, M.; Falk-Petersen, J.; Hanley, N.; Navrud, S. Willingness to pay forunfamiliar public goods: Preserving col-water coral in Norway. Ecol. Econ. 2015, 112, 53–67. [CrossRef]
25. Cameron, T.A.; Englin, J. Respondent experience and contingent valuation of environmental goods. J. Environ.Econ. Manag. 1997, 33, 296–313. [CrossRef]
26. Bergstrom, J.; Stoll, J.; Randall, A. Information effects in contingent markets. Am. J. Agric. Econ. 1989,71, 685–691. [CrossRef]
27. Whitehead, J.; Blomquist, G. Measuring contingent values for wetlands: Effects of information about relatedenvironmental goods. Water Resour. Res. 1991, 27, 2523–2531. [CrossRef]
28. Bateman, I.J.; Mawby, J. First impressions count: Interviewer appearance and information effects in statedpreference studies. Ecol. Econ. 2004, 49, 47–55. [CrossRef]
29. Luce, R.D. Individual Choice Behavior: A Theoretical Analysis; Wiley: New York, NY, USA, 1959.30. McFadden, D. The measurement of urban travel demand. J. Public Econ. 1974, 3, 303–328. [CrossRef]31. Hanemann, M.; Loomis, J.; Kanninen, B. Statistical efficiency of double-bounded dichotomous choice
contingent valuation. Am. J. Agric. Econ. 1991, 73, 1255–1263. [CrossRef]32. Leeuw, E.D.D.; Hox, J.J.; Snijkers, G. The effect of computer-assisted interviewing on data quality. A review.
J. Mark. Res. Soc. 1995, 37, 325–344. [CrossRef]33. Europe in Figures—Eurostat Yearbook. Available online: http://ec.europa.eu/eurostat/statistics-explained/
index.php?title=File:Internet_use_and_frequency_of_use_2016_(%25_of_individuals).png (accessed on7 July 2018).
34. Tietenberg, T.; Lewis, L. Environmental & Natural Resource Economics, 9th ed.; Pearson Education, Inc.: Boston,MA, USA, 2009.
35. Hausman, J.A. Contingent Valuation: A Critical Assessment; Emerald Group Publishing: Amsterdam, TheNetherlands, 1993.
36. Carson, R.; Czajkowski, M. The Discrete Choice Experiment Approach to Environmental Contingent Valuation;Working Paper Series, No. 12-003; Centre for the Study of Choice (CenSoC): Sydney, Australia, 2012;Available online: https://www.pdx.edu/sustainability/sites/www.pdx.edu.sustainability/files/Carson-Czajkowski2012_UTSydney.pdf (accessed on 31 October 2018).
37. Arrow, K.R.; Solow, R.; Portney, P.R.; Learner, E.E.; Radner, R.; Schuman, H. Report of the NOAA panel oncontingent valuation. Fed. Regist. 1993, 58, 4601–4614.
38. Torres-Miralles, M.; Grammatikopolou, I.; Rescia, A.J. Employing contingent and inferred valuation methodsto evaluate the conservation of olive groves and associated ecosystem services in Andalusia (Spain).Ecosyst. Serv. 2017, 26, 258–269. [CrossRef]
39. Šcasný, M.; Zverinová, I.; Czajkowski, M.; Kyselá, E.; Zagórska, K. Public Acceptability of Climate ChangeMitigation Policies: A Discrete Choice Experiment. Clim. Policy 2017, 17 (Suppl. 1), S111–S130. [CrossRef]

Sustainability 2018, 10, 3997 19 of 19
40. Lusk, J.L.; Norwood, F.B. Bridging the gap between laboratory experiments and naturally occurring markets:An inferred valuation method. J. Environ. Econ. Manag. 2009, 58, 236–250. [CrossRef]
41. Lusk, J.L.; Norwood, F.B. An Inferred Valuation Method. Land Econ. 2009, 85, 500–514. [CrossRef]
© 2018 by the authors. Licensee MDPI, Basel, Switzerland. This article is an open accessarticle distributed under the terms and conditions of the Creative Commons Attribution(CC BY) license (http://creativecommons.org/licenses/by/4.0/).